Zip Codes with the Highest Percentage of Population Employed in Food Preparation & Serving in Laramie, WY
RELATED REPORTS & OPTIONS
Food Preparation & Serving
Laramie
Compare Zip Codes
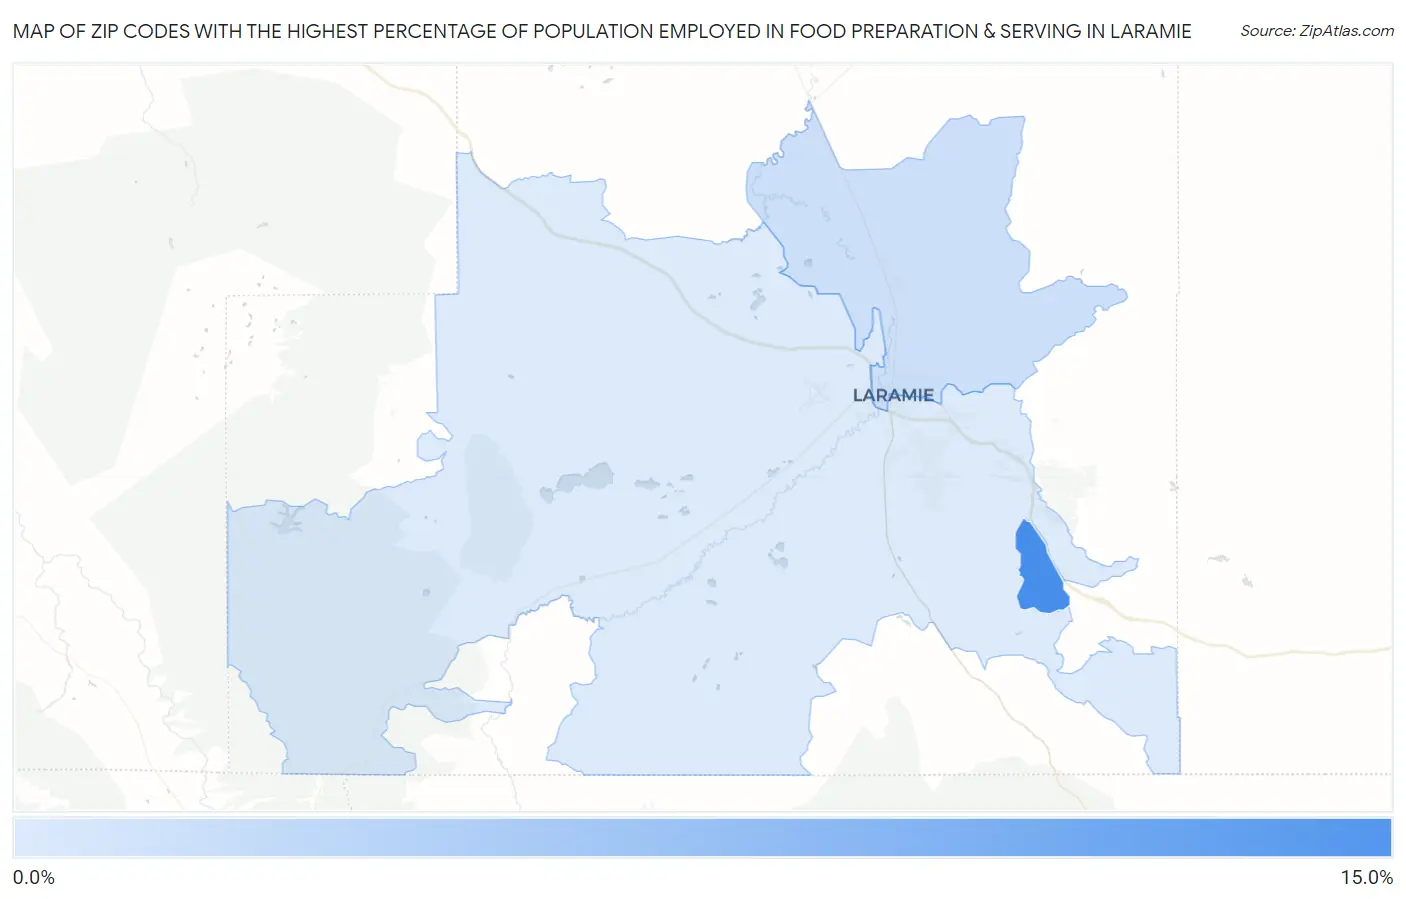
Map of Zip Codes with the Highest Percentage of Population Employed in Food Preparation & Serving in Laramie
4.9%
12.8%
Zip Codes with the Highest Percentage of Population Employed in Food Preparation & Serving in Laramie, WY
| Zip Code | % Employed | vs State | vs National | |
| 1. | 82073 | 12.8% | 5.9%(+6.96)#14 | 5.3%(+7.53)#1,438 |
| 2. | 82072 | 5.7% | 5.9%(-0.198)#50 | 5.3%(+0.374)#10,490 |
| 3. | 82070 | 4.9% | 5.9%(-0.972)#64 | 5.3%(-0.401)#13,419 |
1
Common Questions
What are the Top Zip Codes with the Highest Percentage of Population Employed in Food Preparation & Serving in Laramie, WY?
Top Zip Codes with the Highest Percentage of Population Employed in Food Preparation & Serving in Laramie, WY are:
What zip code has the Highest Percentage of Population Employed in Food Preparation & Serving in Laramie, WY?
82073 has the Highest Percentage of Population Employed in Food Preparation & Serving in Laramie, WY with 12.8%.
What is the Percentage of Population Employed in Food Preparation & Serving in Laramie, WY?
Percentage of Population Employed in Food Preparation & Serving in Laramie is 5.7%.
What is the Percentage of Population Employed in Food Preparation & Serving in Wyoming?
Percentage of Population Employed in Food Preparation & Serving in Wyoming is 5.9%.
What is the Percentage of Population Employed in Food Preparation & Serving in the United States?
Percentage of Population Employed in Food Preparation & Serving in the United States is 5.3%.