Woodruff, WI Map & Demographics
Woodruff Map
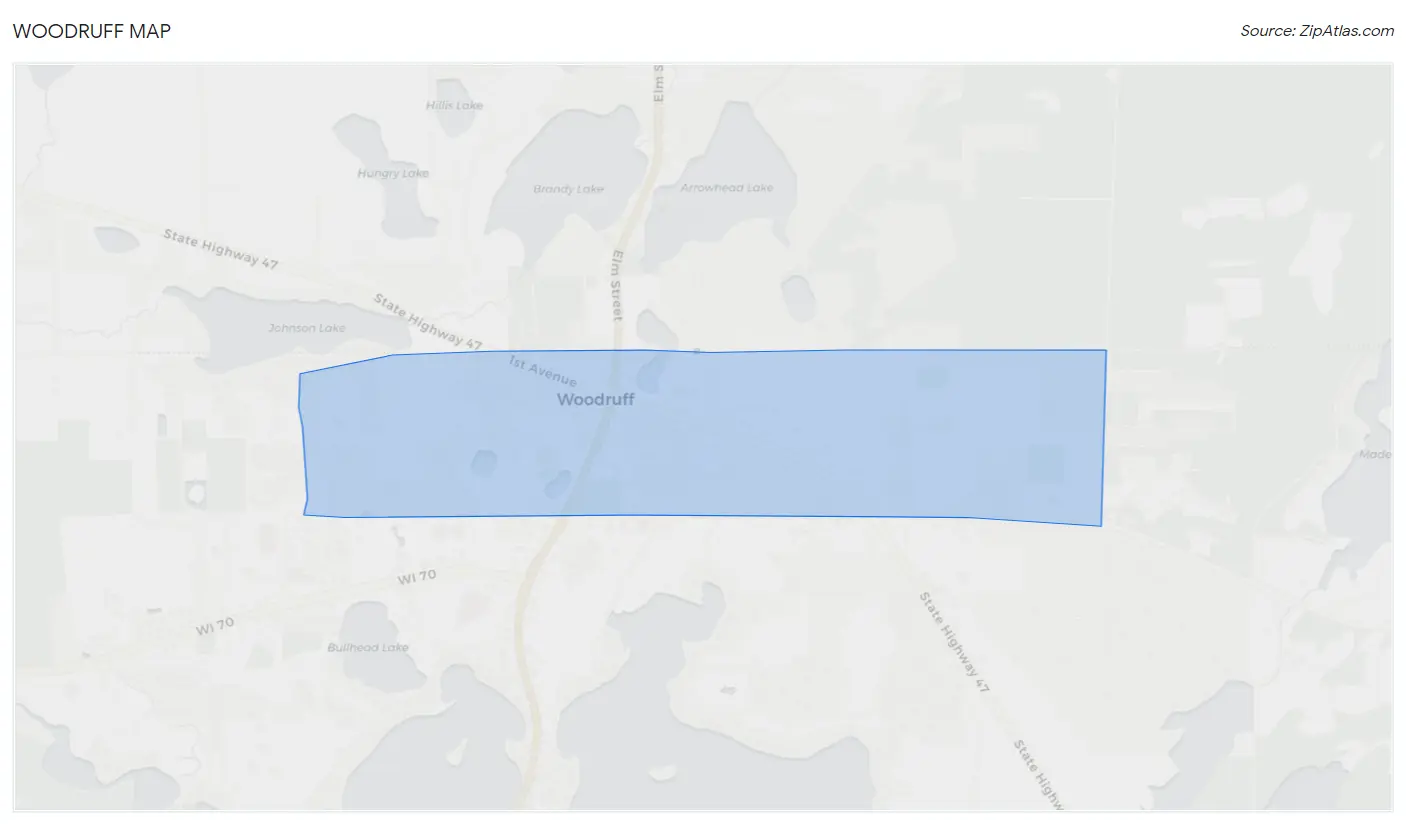
Woodruff Overview
$45,386
PER CAPITA INCOME
$137,871
AVG FAMILY INCOME
$63,894
AVG HOUSEHOLD INCOME
0.1%
WAGE / INCOME GAP [ % ]
99.9¢/ $1
WAGE / INCOME GAP [ $ ]
0.42
INEQUALITY / GINI INDEX
628
TOTAL POPULATION
237
MALE POPULATION
391
FEMALE POPULATION
60.61
MALES / 100 FEMALES
164.98
FEMALES / 100 MALES
57.5
MEDIAN AGE
2.4
AVG FAMILY SIZE
1.7
AVG HOUSEHOLD SIZE
335
LABOR FORCE [ PEOPLE ]
58.2%
PERCENT IN LABOR FORCE
Woodruff Zip Codes
Income in Woodruff
Income Overview in Woodruff
Per Capita Income in Woodruff is $45,386, while median incomes of families and households are $137,871 and $63,894 respectively.
| Characteristic | Number | Measure |
| Per Capita Income | 628 | $45,386 |
| Median Family Income | 163 | $137,871 |
| Mean Family Income | 163 | $122,382 |
| Median Household Income | 371 | $63,894 |
| Mean Household Income | 371 | $84,376 |
| Income Deficit | 163 | $0 |
| Wage / Income Gap (%) | 628 | 0.07% |
| Wage / Income Gap ($) | 628 | 99.93¢ per $1 |
| Gini / Inequality Index | 628 | 0.42 |
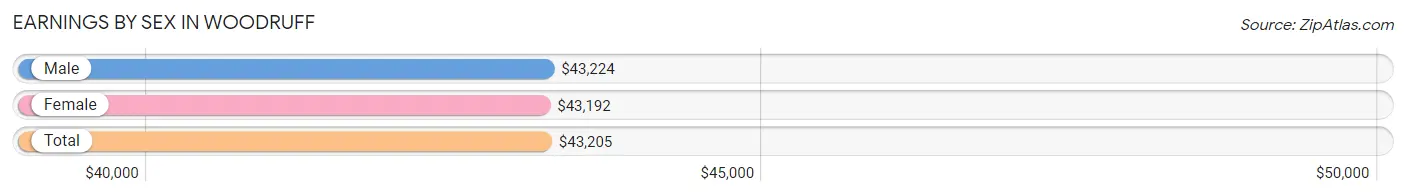
Earnings by Sex in Woodruff
Average Earnings in Woodruff are $43,205, $43,224 for men and $43,192 for women, a difference of 0.1%.
| Sex | Number | Average Earnings |
| Male | 140 (39.7%) | $43,224 |
| Female | 213 (60.3%) | $43,192 |
| Total | 353 (100.0%) | $43,205 |
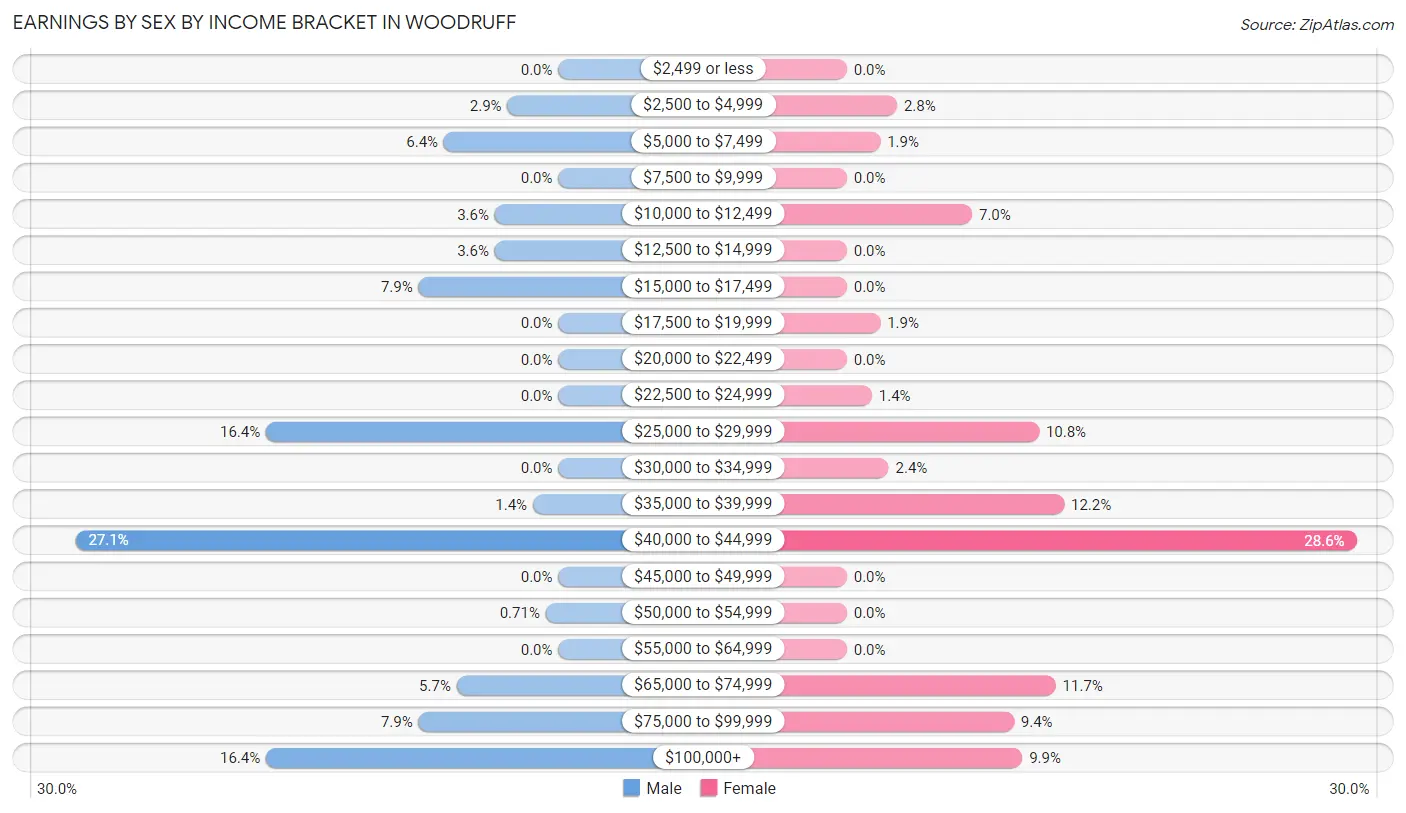
Earnings by Sex by Income Bracket in Woodruff
The most common earnings brackets in Woodruff are $40,000 to $44,999 for men (38 | 27.1%) and $40,000 to $44,999 for women (61 | 28.6%).
| Income | Male | Female |
| $2,499 or less | 0 (0.0%) | 0 (0.0%) |
| $2,500 to $4,999 | 4 (2.9%) | 6 (2.8%) |
| $5,000 to $7,499 | 9 (6.4%) | 4 (1.9%) |
| $7,500 to $9,999 | 0 (0.0%) | 0 (0.0%) |
| $10,000 to $12,499 | 5 (3.6%) | 15 (7.0%) |
| $12,500 to $14,999 | 5 (3.6%) | 0 (0.0%) |
| $15,000 to $17,499 | 11 (7.9%) | 0 (0.0%) |
| $17,500 to $19,999 | 0 (0.0%) | 4 (1.9%) |
| $20,000 to $22,499 | 0 (0.0%) | 0 (0.0%) |
| $22,500 to $24,999 | 0 (0.0%) | 3 (1.4%) |
| $25,000 to $29,999 | 23 (16.4%) | 23 (10.8%) |
| $30,000 to $34,999 | 0 (0.0%) | 5 (2.4%) |
| $35,000 to $39,999 | 2 (1.4%) | 26 (12.2%) |
| $40,000 to $44,999 | 38 (27.1%) | 61 (28.6%) |
| $45,000 to $49,999 | 0 (0.0%) | 0 (0.0%) |
| $50,000 to $54,999 | 1 (0.7%) | 0 (0.0%) |
| $55,000 to $64,999 | 0 (0.0%) | 0 (0.0%) |
| $65,000 to $74,999 | 8 (5.7%) | 25 (11.7%) |
| $75,000 to $99,999 | 11 (7.9%) | 20 (9.4%) |
| $100,000+ | 23 (16.4%) | 21 (9.9%) |
| Total | 140 (100.0%) | 213 (100.0%) |
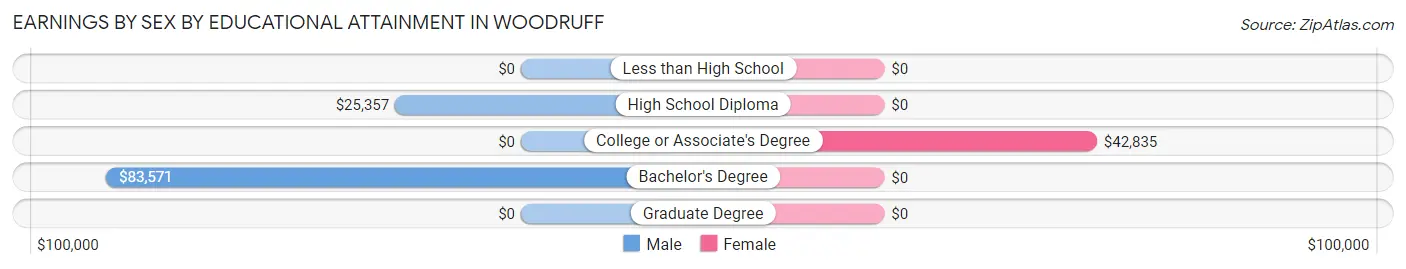
Earnings by Sex by Educational Attainment in Woodruff
| Educational Attainment | Male Income | Female Income |
| Less than High School | - | - |
| High School Diploma | $25,357 | $0 |
| College or Associate's Degree | - | - |
| Bachelor's Degree | $83,571 | $0 |
| Graduate Degree | - | - |
| Total | - | - |
Family Income in Woodruff
Family Income Brackets in Woodruff
According to the Woodruff family income data, there are 84 families falling into the $100,000 to $149,999 income range, which is the most common income bracket and makes up 51.5% of all families.
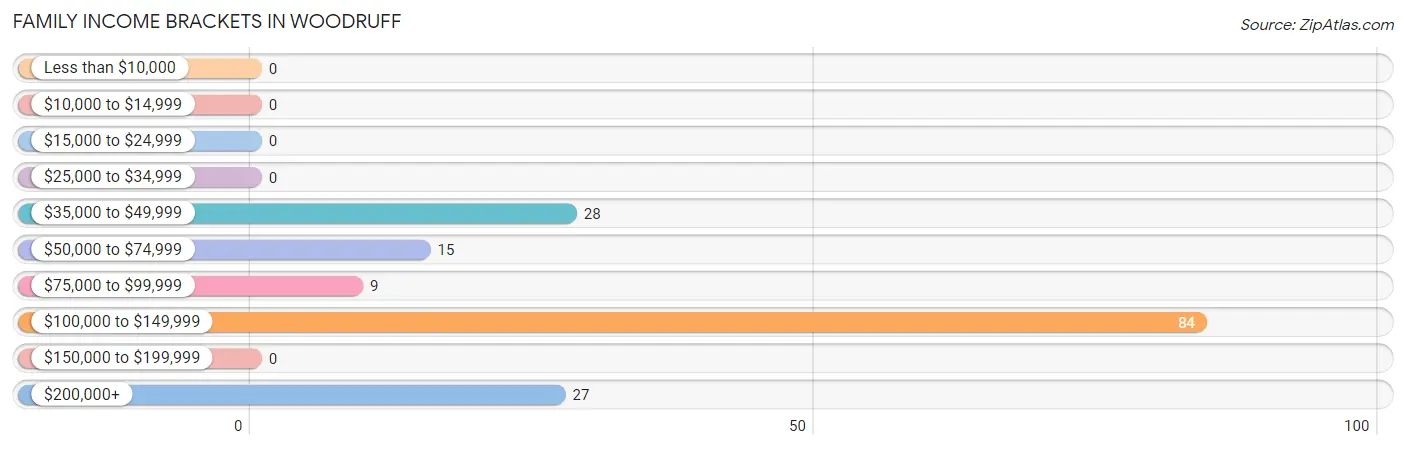
| Income Bracket | # Families | % Families |
| Less than $10,000 | 0 | 0.0% |
| $10,000 to $14,999 | 0 | 0.0% |
| $15,000 to $24,999 | 0 | 0.0% |
| $25,000 to $34,999 | 0 | 0.0% |
| $35,000 to $49,999 | 28 | 17.2% |
| $50,000 to $74,999 | 15 | 9.2% |
| $75,000 to $99,999 | 9 | 5.5% |
| $100,000 to $149,999 | 84 | 51.5% |
| $150,000 to $199,999 | 0 | 0.0% |
| $200,000+ | 27 | 16.6% |
Family Income by Famaliy Size in Woodruff
3-person families (64 | 39.3%) account for the highest median family income in Woodruff with $138,571 per family, while 2-person families (81 | 49.7%) have the highest median income of $50,729 per family member.
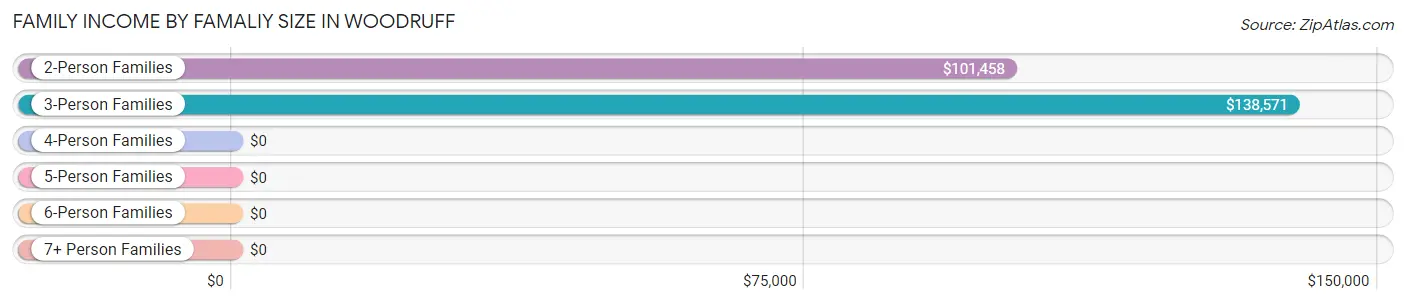
| Income Bracket | # Families | Median Income |
| 2-Person Families | 81 (49.7%) | $101,458 |
| 3-Person Families | 64 (39.3%) | $138,571 |
| 4-Person Families | 5 (3.1%) | $0 |
| 5-Person Families | 11 (6.8%) | $0 |
| 6-Person Families | 0 (0.0%) | $0 |
| 7+ Person Families | 2 (1.2%) | $0 |
| Total | 163 (100.0%) | $137,871 |
Family Income by Number of Earners in Woodruff
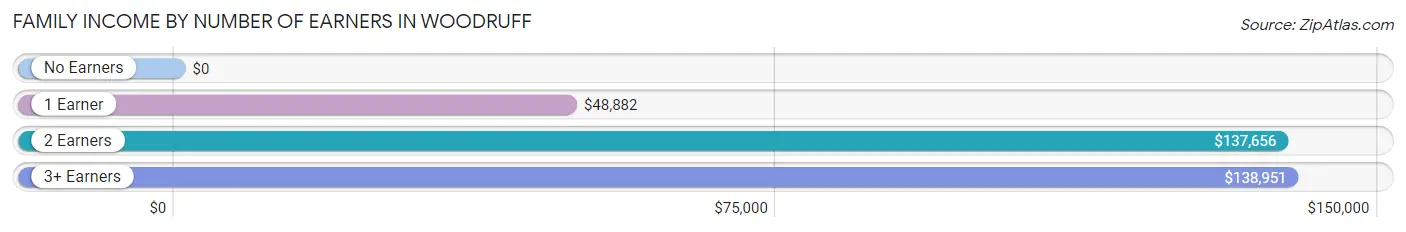
| Number of Earners | # Families | Median Income |
| No Earners | 18 (11.0%) | $0 |
| 1 Earner | 29 (17.8%) | $48,882 |
| 2 Earners | 47 (28.8%) | $137,656 |
| 3+ Earners | 69 (42.3%) | $138,951 |
| Total | 163 (100.0%) | $137,871 |
Household Income in Woodruff
Household Income Brackets in Woodruff
With 88 households falling in the category, the $100,000 to $149,999 income range is the most frequent in Woodruff, accounting for 23.7% of all households. In contrast, only 12 households (3.2%) fall into the $10,000 to $14,999 income bracket, making it the least populous group.
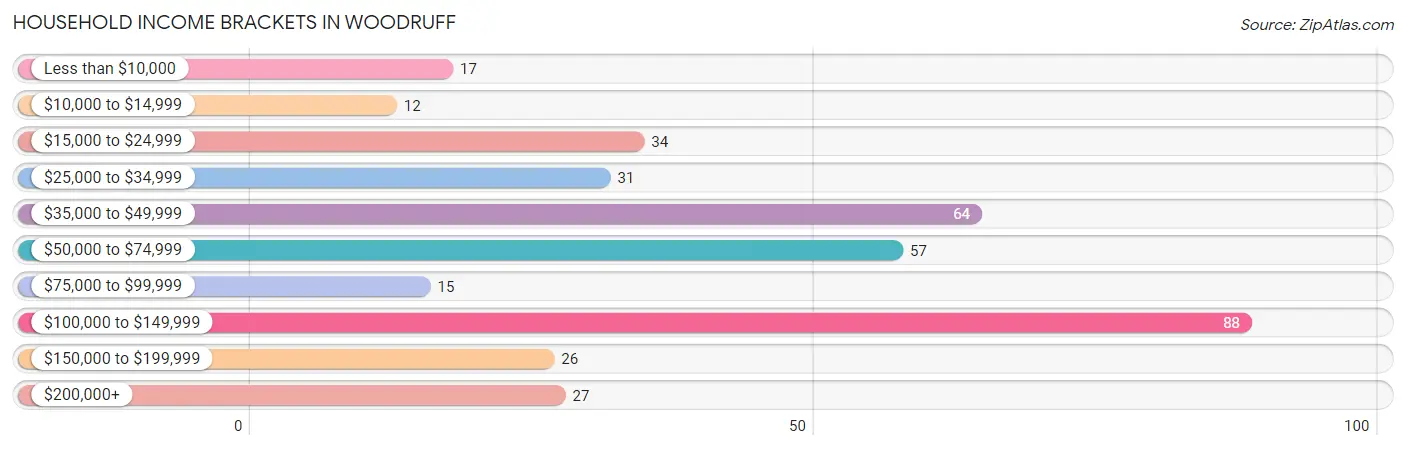
| Income Bracket | # Households | % Households |
| Less than $10,000 | 17 | 4.6% |
| $10,000 to $14,999 | 12 | 3.2% |
| $15,000 to $24,999 | 34 | 9.2% |
| $25,000 to $34,999 | 31 | 8.4% |
| $35,000 to $49,999 | 64 | 17.3% |
| $50,000 to $74,999 | 57 | 15.4% |
| $75,000 to $99,999 | 15 | 4.0% |
| $100,000 to $149,999 | 88 | 23.7% |
| $150,000 to $199,999 | 26 | 7.0% |
| $200,000+ | 27 | 7.3% |
Household Income by Householder Age in Woodruff
The median household income in Woodruff is $63,894, with the highest median household income of $65,391 found in the 25 to 44 years age bracket for the primary householder. A total of 67 households (18.1%) fall into this category.
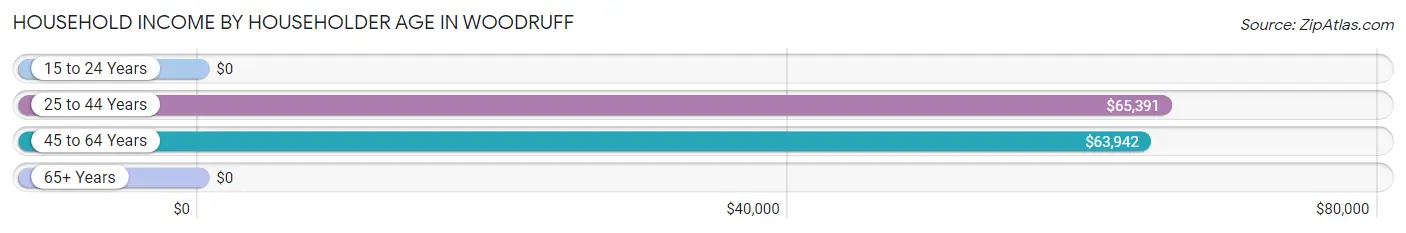
| Income Bracket | # Households | Median Income |
| 15 to 24 Years | 0 (0.0%) | $0 |
| 25 to 44 Years | 67 (18.1%) | $65,391 |
| 45 to 64 Years | 126 (34.0%) | $63,942 |
| 65+ Years | 178 (48.0%) | $0 |
| Total | 371 (100.0%) | $63,894 |
Poverty in Woodruff
Income Below Poverty by Sex and Age in Woodruff
With 8.9% poverty level for males and 7.5% for females among the residents of Woodruff, 25 to 34 year old males and 65 to 74 year old females are the most vulnerable to poverty, with 15 males (39.5%) and 18 females (18.4%) in their respective age groups living below the poverty level.
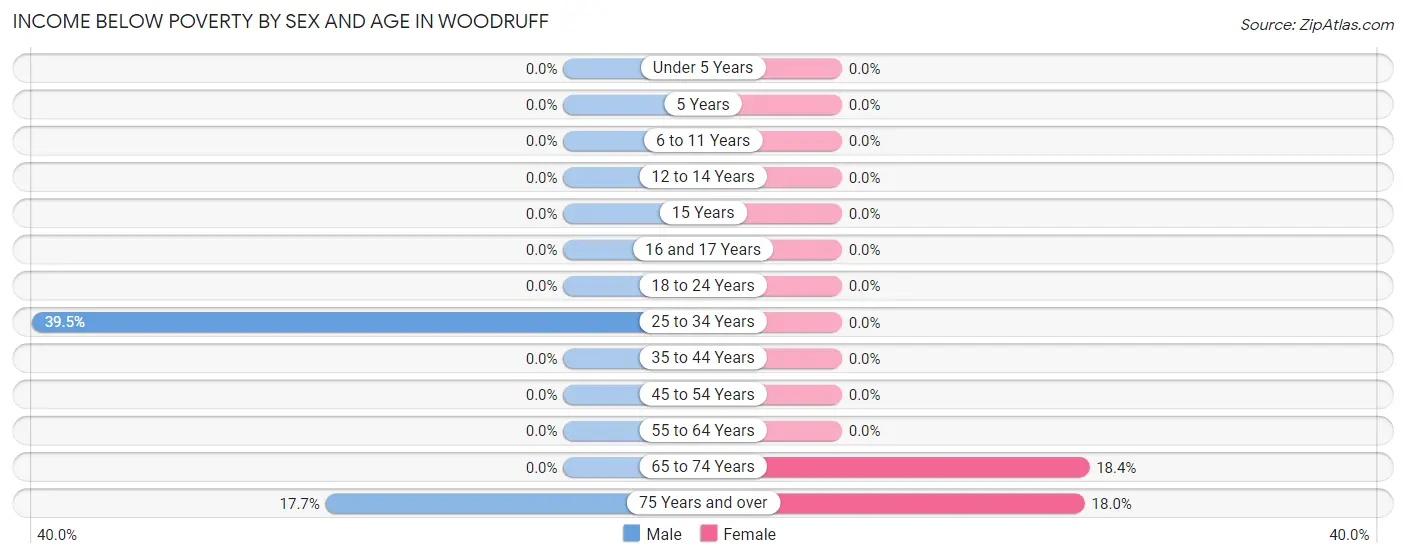
| Age Bracket | Male | Female |
| Under 5 Years | 0 (0.0%) | 0 (0.0%) |
| 5 Years | 0 (0.0%) | 0 (0.0%) |
| 6 to 11 Years | 0 (0.0%) | 0 (0.0%) |
| 12 to 14 Years | 0 (0.0%) | 0 (0.0%) |
| 15 Years | 0 (0.0%) | 0 (0.0%) |
| 16 and 17 Years | 0 (0.0%) | 0 (0.0%) |
| 18 to 24 Years | 0 (0.0%) | 0 (0.0%) |
| 25 to 34 Years | 15 (39.5%) | 0 (0.0%) |
| 35 to 44 Years | 0 (0.0%) | 0 (0.0%) |
| 45 to 54 Years | 0 (0.0%) | 0 (0.0%) |
| 55 to 64 Years | 0 (0.0%) | 0 (0.0%) |
| 65 to 74 Years | 0 (0.0%) | 18 (18.4%) |
| 75 Years and over | 6 (17.6%) | 11 (18.0%) |
| Total | 21 (8.9%) | 29 (7.5%) |
Income Above Poverty by Sex and Age in Woodruff
According to the poverty statistics in Woodruff, males aged 6 to 11 years and females aged 6 to 11 years are the age groups that are most secure financially, with 100.0% of males and 100.0% of females in these age groups living above the poverty line.
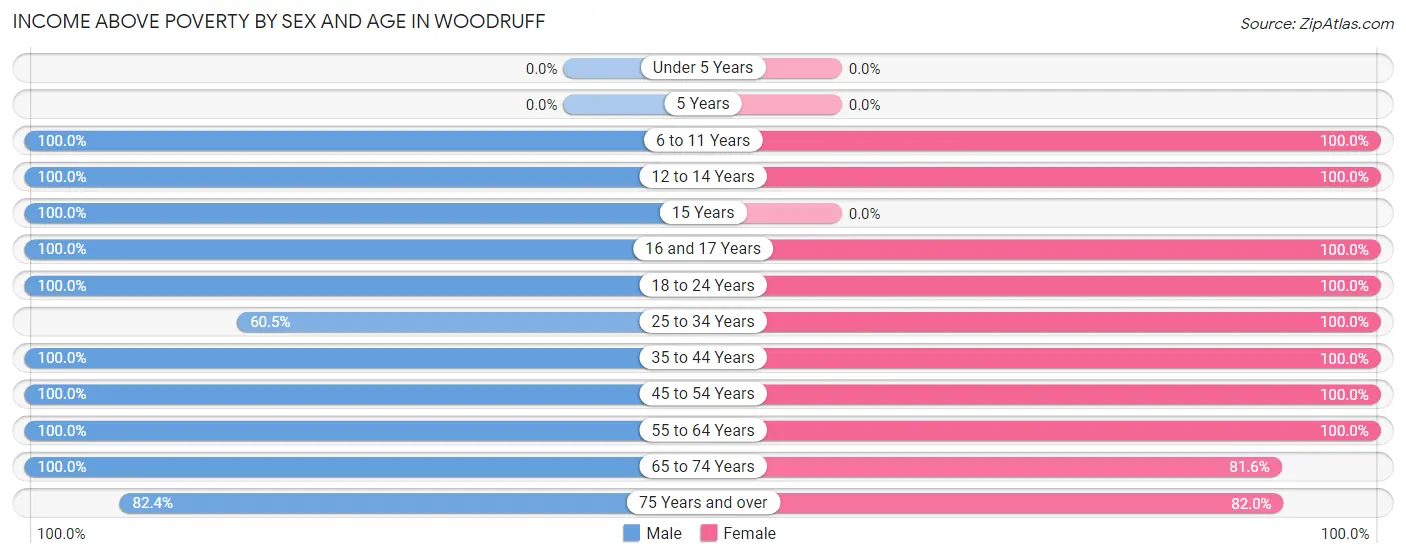
| Age Bracket | Male | Female |
| Under 5 Years | 0 (0.0%) | 0 (0.0%) |
| 5 Years | 0 (0.0%) | 0 (0.0%) |
| 6 to 11 Years | 8 (100.0%) | 4 (100.0%) |
| 12 to 14 Years | 12 (100.0%) | 23 (100.0%) |
| 15 Years | 5 (100.0%) | 0 (0.0%) |
| 16 and 17 Years | 3 (100.0%) | 6 (100.0%) |
| 18 to 24 Years | 44 (100.0%) | 4 (100.0%) |
| 25 to 34 Years | 23 (60.5%) | 35 (100.0%) |
| 35 to 44 Years | 18 (100.0%) | 30 (100.0%) |
| 45 to 54 Years | 17 (100.0%) | 50 (100.0%) |
| 55 to 64 Years | 31 (100.0%) | 73 (100.0%) |
| 65 to 74 Years | 25 (100.0%) | 80 (81.6%) |
| 75 Years and over | 28 (82.4%) | 50 (82.0%) |
| Total | 214 (91.1%) | 355 (92.4%) |
Income Below Poverty Among Married-Couple Families in Woodruff
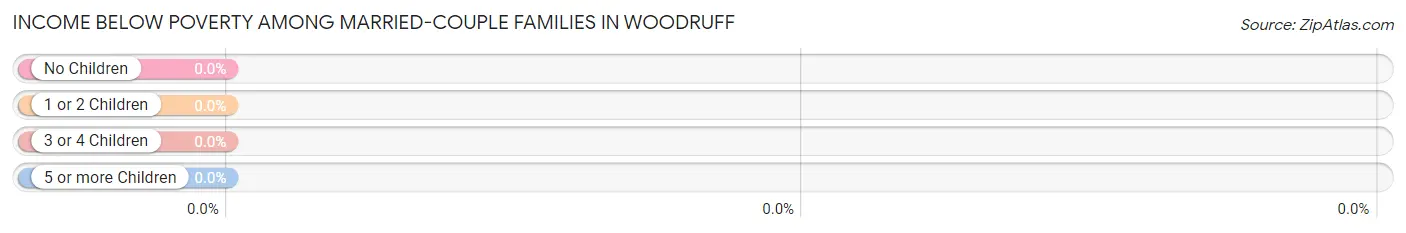
| Children | Above Poverty | Below Poverty |
| No Children | 130 (100.0%) | 0 (0.0%) |
| 1 or 2 Children | 12 (100.0%) | 0 (0.0%) |
| 3 or 4 Children | 4 (100.0%) | 0 (0.0%) |
| 5 or more Children | 2 (100.0%) | 0 (0.0%) |
| Total | 148 (100.0%) | 0 (0.0%) |
Income Below Poverty Among Single-Parent Households in Woodruff
| Children | Single Father | Single Mother |
| No Children | 0 (0.0%) | 0 (0.0%) |
| 1 or 2 Children | 0 (0.0%) | 0 (0.0%) |
| 3 or 4 Children | 0 (0.0%) | 0 (0.0%) |
| 5 or more Children | 0 (0.0%) | 0 (0.0%) |
| Total | 0 (0.0%) | 0 (0.0%) |
Income Below Poverty Among Married-Couple vs Single-Parent Households in Woodruff
| Children | Married-Couple Families | Single-Parent Households |
| No Children | 0 (0.0%) | 0 (0.0%) |
| 1 or 2 Children | 0 (0.0%) | 0 (0.0%) |
| 3 or 4 Children | 0 (0.0%) | 0 (0.0%) |
| 5 or more Children | 0 (0.0%) | 0 (0.0%) |
| Total | 0 (0.0%) | 0 (0.0%) |
Race in Woodruff
The most populous races in Woodruff are White / Caucasian (597 | 95.1%), Native / Alaskan (14 | 2.2%), and Hispanic or Latino (12 | 1.9%).
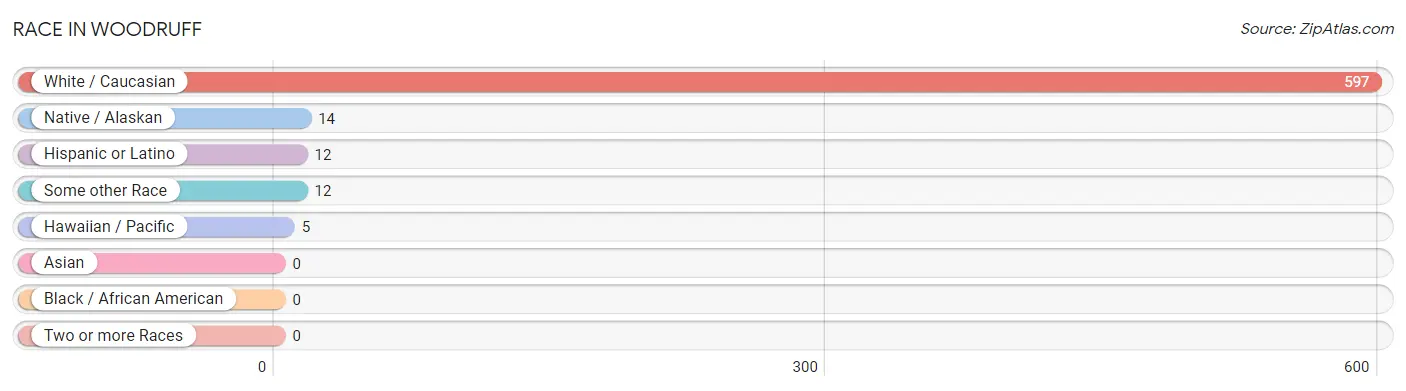
| Race | # Population | % Population |
| Asian | 0 | 0.0% |
| Black / African American | 0 | 0.0% |
| Hawaiian / Pacific | 5 | 0.8% |
| Hispanic or Latino | 12 | 1.9% |
| Native / Alaskan | 14 | 2.2% |
| White / Caucasian | 597 | 95.1% |
| Two or more Races | 0 | 0.0% |
| Some other Race | 12 | 1.9% |
| Total | 628 | 100.0% |
Ancestry in Woodruff
The most populous ancestries reported in Woodruff are German (366 | 58.3%), Irish (160 | 25.5%), Norwegian (105 | 16.7%), English (65 | 10.3%), and Polish (61 | 9.7%), together accounting for 120.5% of all Woodruff residents.
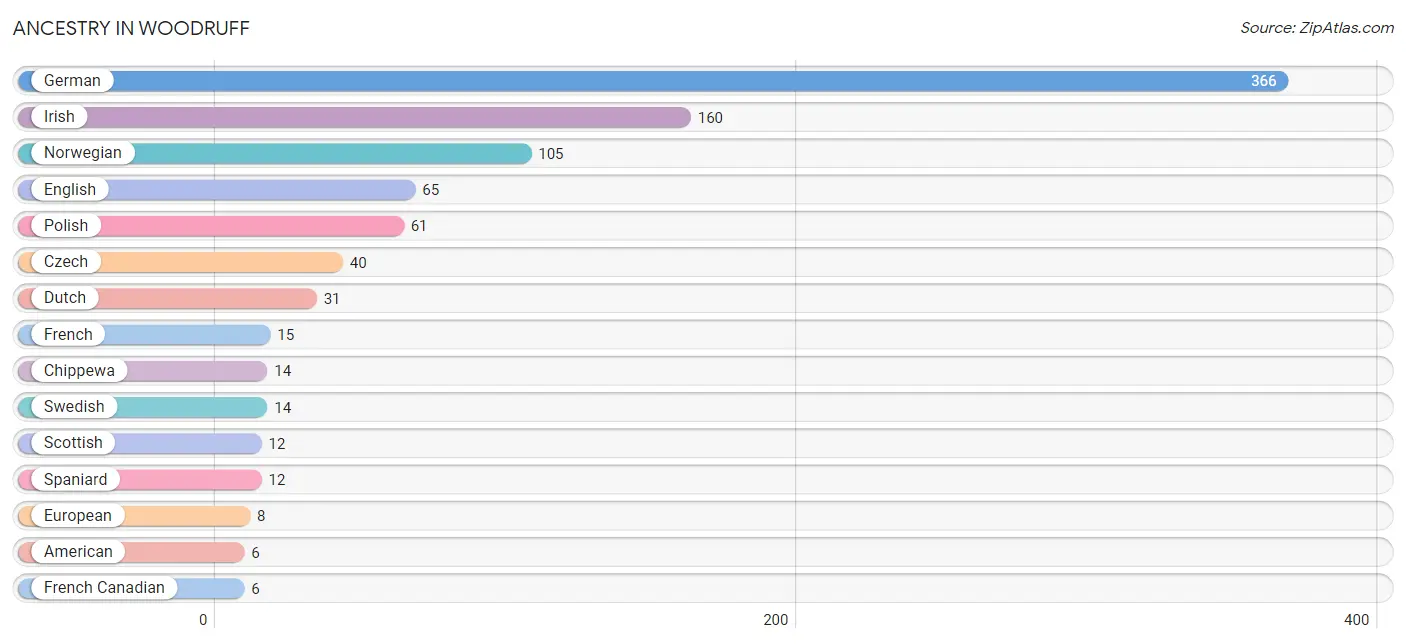
| Ancestry | # Population | % Population |
| American | 6 | 1.0% |
| Belgian | 2 | 0.3% |
| Chippewa | 14 | 2.2% |
| Czech | 40 | 6.4% |
| Czechoslovakian | 5 | 0.8% |
| Dutch | 31 | 4.9% |
| English | 65 | 10.3% |
| European | 8 | 1.3% |
| French | 15 | 2.4% |
| French Canadian | 6 | 1.0% |
| German | 366 | 58.3% |
| Irish | 160 | 25.5% |
| Norwegian | 105 | 16.7% |
| Polish | 61 | 9.7% |
| Samoan | 5 | 0.8% |
| Scotch-Irish | 6 | 1.0% |
| Scottish | 12 | 1.9% |
| Serbian | 5 | 0.8% |
| Spaniard | 12 | 1.9% |
| Swedish | 14 | 2.2% | View All 20 Rows |
Immigrants in Woodruff

| Immigration Origin | # Population | % Population | View All 0 Rows |
Sex and Age in Woodruff
Sex and Age in Woodruff
The most populous age groups in Woodruff are 20 to 24 Years (38 | 16.0%) for men and 65 to 69 Years (67 | 17.1%) for women.
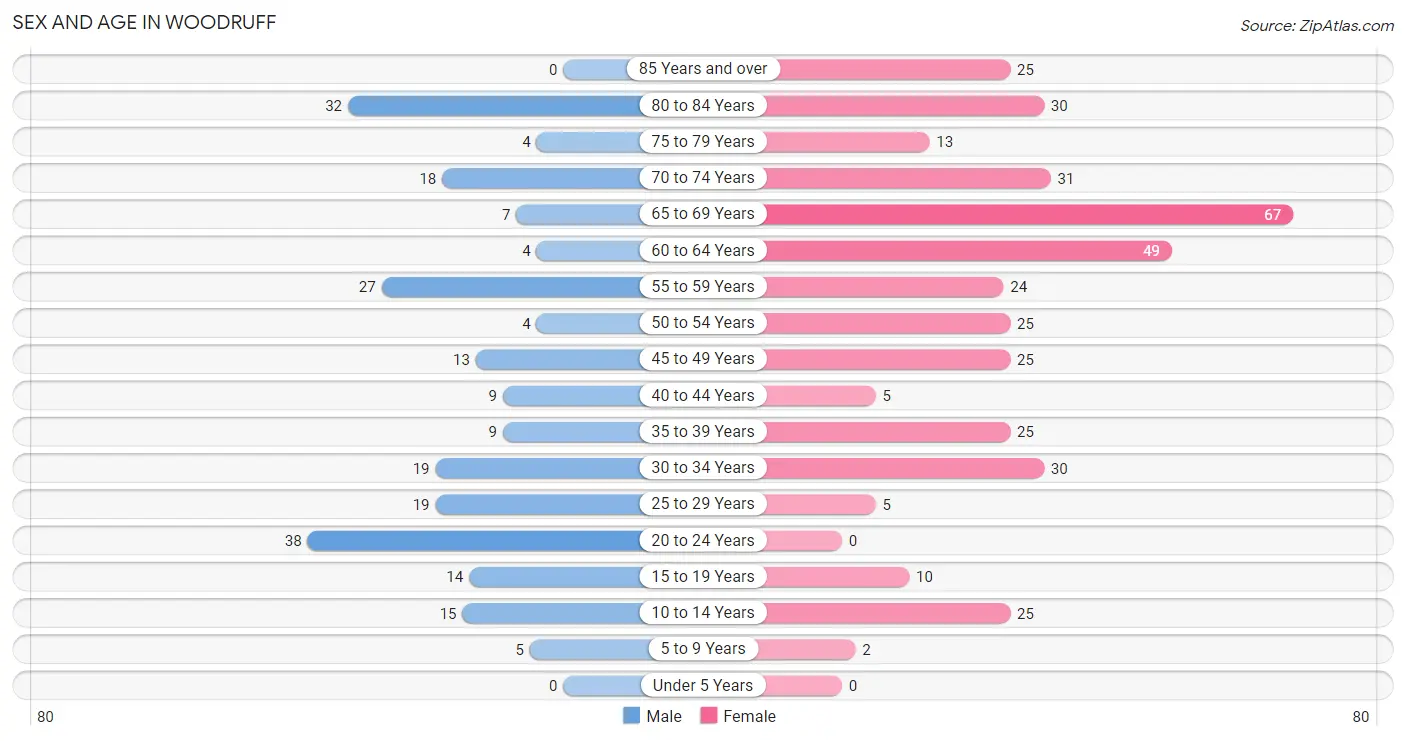
| Age Bracket | Male | Female |
| Under 5 Years | 0 (0.0%) | 0 (0.0%) |
| 5 to 9 Years | 5 (2.1%) | 2 (0.5%) |
| 10 to 14 Years | 15 (6.3%) | 25 (6.4%) |
| 15 to 19 Years | 14 (5.9%) | 10 (2.6%) |
| 20 to 24 Years | 38 (16.0%) | 0 (0.0%) |
| 25 to 29 Years | 19 (8.0%) | 5 (1.3%) |
| 30 to 34 Years | 19 (8.0%) | 30 (7.7%) |
| 35 to 39 Years | 9 (3.8%) | 25 (6.4%) |
| 40 to 44 Years | 9 (3.8%) | 5 (1.3%) |
| 45 to 49 Years | 13 (5.5%) | 25 (6.4%) |
| 50 to 54 Years | 4 (1.7%) | 25 (6.4%) |
| 55 to 59 Years | 27 (11.4%) | 24 (6.1%) |
| 60 to 64 Years | 4 (1.7%) | 49 (12.5%) |
| 65 to 69 Years | 7 (2.9%) | 67 (17.1%) |
| 70 to 74 Years | 18 (7.6%) | 31 (7.9%) |
| 75 to 79 Years | 4 (1.7%) | 13 (3.3%) |
| 80 to 84 Years | 32 (13.5%) | 30 (7.7%) |
| 85 Years and over | 0 (0.0%) | 25 (6.4%) |
| Total | 237 (100.0%) | 391 (100.0%) |
Families and Households in Woodruff
Median Family Size in Woodruff
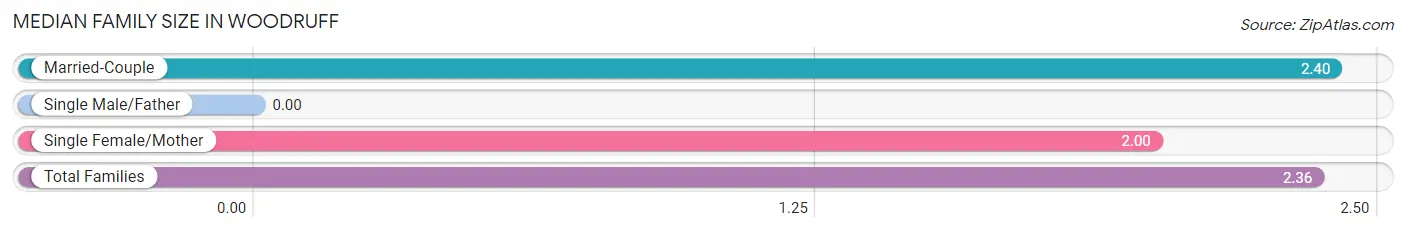
| Family Type | # Families | Family Size |
| Married-Couple | 148 (90.8%) | 2.40 |
| Single Male/Father | 0 (0.0%) | - |
| Single Female/Mother | 15 (9.2%) | 2.00 |
| Total Families | 163 (100.0%) | 2.36 |
Median Household Size in Woodruff
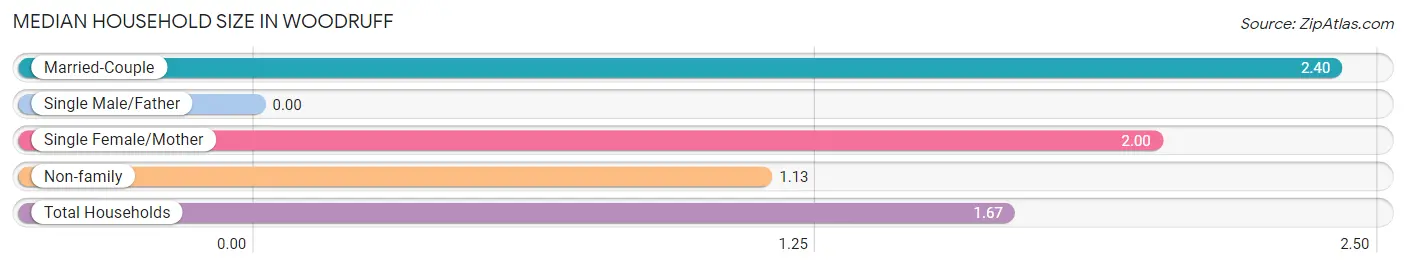
| Household Type | # Households | Household Size |
| Married-Couple | 148 (39.9%) | 2.40 |
| Single Male/Father | 0 (0.0%) | - |
| Single Female/Mother | 15 (4.0%) | 2.00 |
| Non-family | 208 (56.1%) | 1.13 |
| Total Households | 371 (100.0%) | 1.67 |
Household Size by Marriage Status in Woodruff
Out of a total of 371 households in Woodruff, 163 (43.9%) are family households, while 208 (56.1%) are nonfamily households. The most numerous type of family households are 2-person households, comprising 81, and the most common type of nonfamily households are 1-person households, comprising 182.
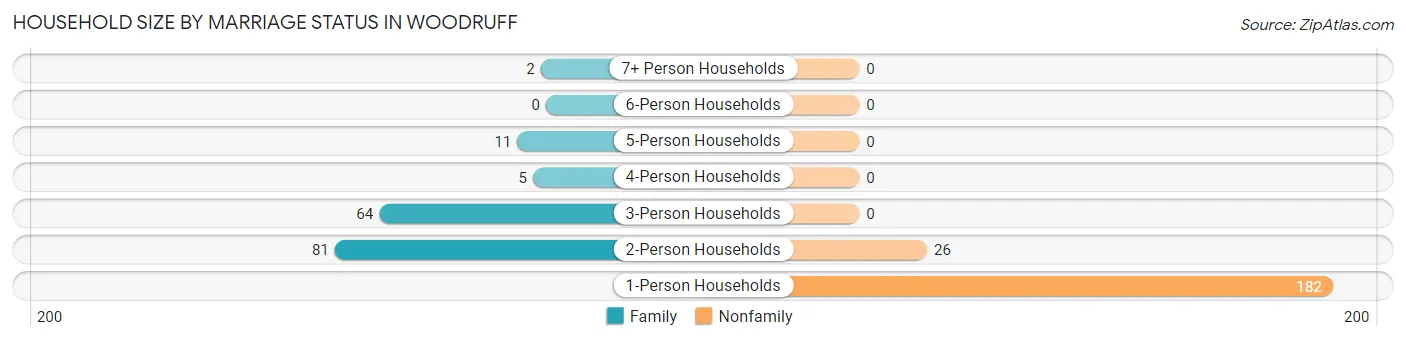
| Household Size | Family Households | Nonfamily Households |
| 1-Person Households | - | 182 (49.1%) |
| 2-Person Households | 81 (21.8%) | 26 (7.0%) |
| 3-Person Households | 64 (17.2%) | 0 (0.0%) |
| 4-Person Households | 5 (1.3%) | 0 (0.0%) |
| 5-Person Households | 11 (3.0%) | 0 (0.0%) |
| 6-Person Households | 0 (0.0%) | 0 (0.0%) |
| 7+ Person Households | 2 (0.5%) | 0 (0.0%) |
| Total | 163 (43.9%) | 208 (56.1%) |
Female Fertility in Woodruff
Fertility by Age in Woodruff
| Age Bracket | Women with Births | Births / 1,000 Women |
| 15 to 19 years | 0 (0.0%) | 0.0 |
| 20 to 34 years | 0 (0.0%) | 0.0 |
| 35 to 50 years | 0 (0.0%) | 0.0 |
| Total | 0 (0.0%) | 0.0 |
Fertility by Age by Marriage Status in Woodruff
| Age Bracket | Married | Unmarried |
| 15 to 19 years | 0 (0.0%) | 0 (0.0%) |
| 20 to 34 years | 0 (0.0%) | 0 (0.0%) |
| 35 to 50 years | 0 (0.0%) | 0 (0.0%) |
| Total | 0 (0.0%) | 0 (0.0%) |
Fertility by Education in Woodruff
| Educational Attainment | Women with Births | Births / 1,000 Women |
| Less than High School | 0 (0.0%) | 0.0 |
| High School Diploma | 0 (0.0%) | 0.0 |
| College or Associate's Degree | 0 (0.0%) | 0.0 |
| Bachelor's Degree | 0 (0.0%) | 0.0 |
| Graduate Degree | 0 (0.0%) | 0.0 |
| Total | 0 (0.0%) | 0.0 |
Fertility by Education by Marriage Status in Woodruff
| Educational Attainment | Married | Unmarried |
| Less than High School | 0 (0.0%) | 0 (0.0%) |
| High School Diploma | 0 (0.0%) | 0 (0.0%) |
| College or Associate's Degree | 0 (0.0%) | 0 (0.0%) |
| Bachelor's Degree | 0 (0.0%) | 0 (0.0%) |
| Graduate Degree | 0 (0.0%) | 0 (0.0%) |
| Total | 0 (0.0%) | 0 (0.0%) |
Employment Characteristics in Woodruff
Employment by Class of Employer in Woodruff
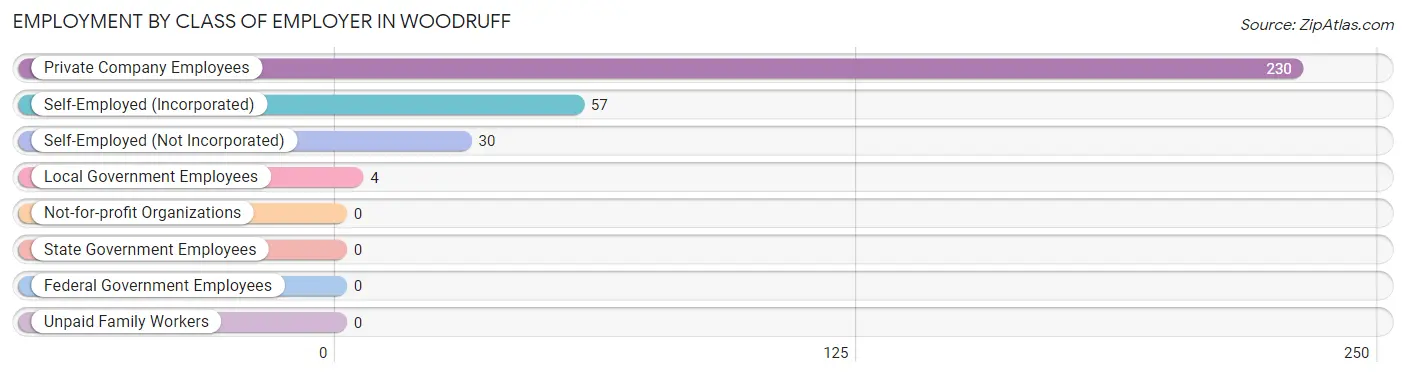
Among the 321 employed individuals in Woodruff, private company employees (230 | 71.7%), self-employed (incorporated) (57 | 17.8%), and self-employed (not incorporated) (30 | 9.3%) make up the most common classes of employment.
| Employer Class | # Employees | % Employees |
| Private Company Employees | 230 | 71.7% |
| Self-Employed (Incorporated) | 57 | 17.8% |
| Self-Employed (Not Incorporated) | 30 | 9.3% |
| Not-for-profit Organizations | 0 | 0.0% |
| Local Government Employees | 4 | 1.3% |
| State Government Employees | 0 | 0.0% |
| Federal Government Employees | 0 | 0.0% |
| Unpaid Family Workers | 0 | 0.0% |
| Total | 321 | 100.0% |
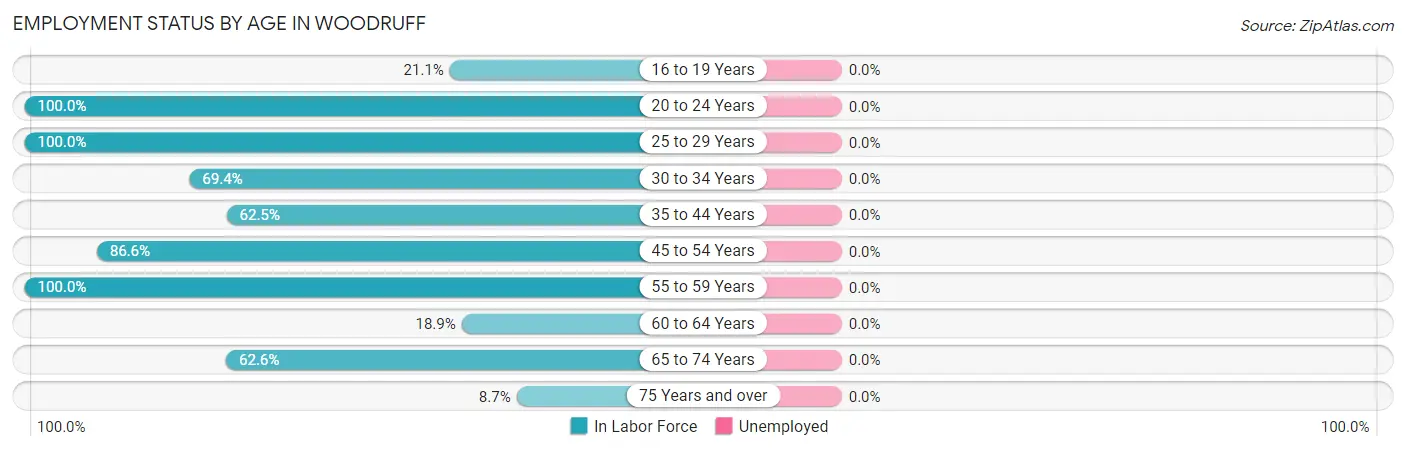
Employment Status by Age in Woodruff
| Age Bracket | In Labor Force | Unemployed |
| 16 to 19 Years | 4 (21.1%) | 0 (0.0%) |
| 20 to 24 Years | 38 (100.0%) | 0 (0.0%) |
| 25 to 29 Years | 24 (100.0%) | 0 (0.0%) |
| 30 to 34 Years | 34 (69.4%) | 0 (0.0%) |
| 35 to 44 Years | 30 (62.5%) | 0 (0.0%) |
| 45 to 54 Years | 58 (86.6%) | 0 (0.0%) |
| 55 to 59 Years | 51 (100.0%) | 0 (0.0%) |
| 60 to 64 Years | 10 (18.9%) | 0 (0.0%) |
| 65 to 74 Years | 77 (62.6%) | 0 (0.0%) |
| 75 Years and over | 9 (8.7%) | 0 (0.0%) |
| Total | 335 (58.2%) | 0 (0.0%) |
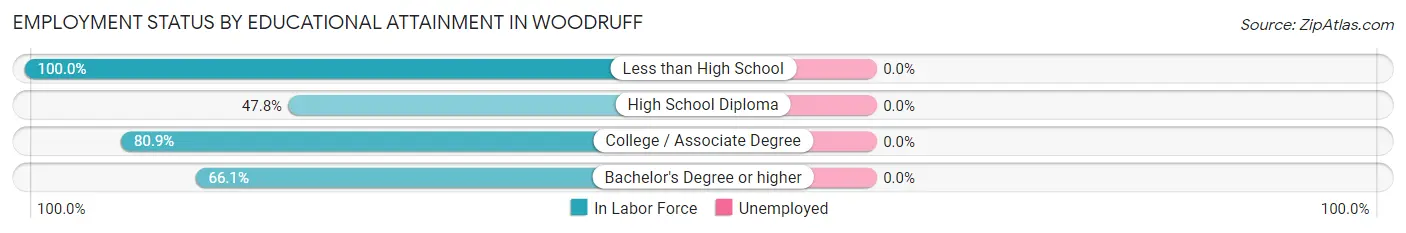
Employment Status by Educational Attainment in Woodruff
| Educational Attainment | In Labor Force | Unemployed |
| Less than High School | 16 (100.0%) | 0 (0.0%) |
| High School Diploma | 22 (47.8%) | 0 (0.0%) |
| College / Associate Degree | 93 (80.9%) | 0 (0.0%) |
| Bachelor's Degree or higher | 76 (66.1%) | 0 (0.0%) |
| Total | 207 (70.9%) | 0 (0.0%) |
Employment Occupations by Sex in Woodruff
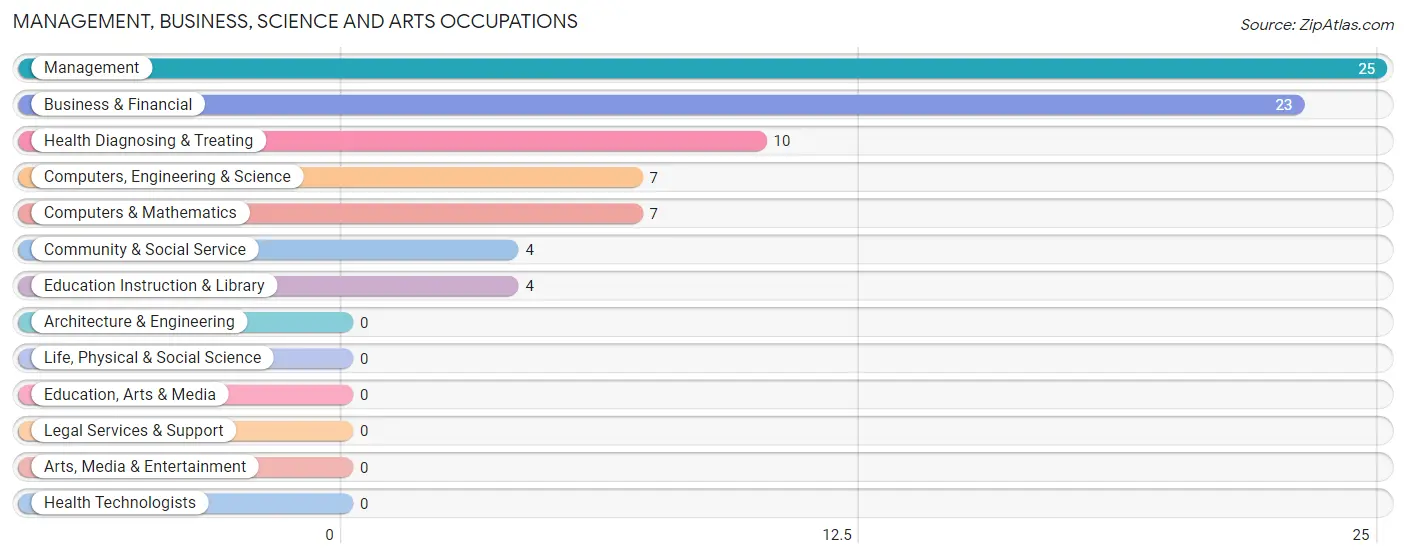
Management, Business, Science and Arts Occupations
The most common Management, Business, Science and Arts occupations in Woodruff are Management (25 | 7.5%), Business & Financial (23 | 6.9%), Health Diagnosing & Treating (10 | 3.0%), Computers, Engineering & Science (7 | 2.1%), and Computers & Mathematics (7 | 2.1%).
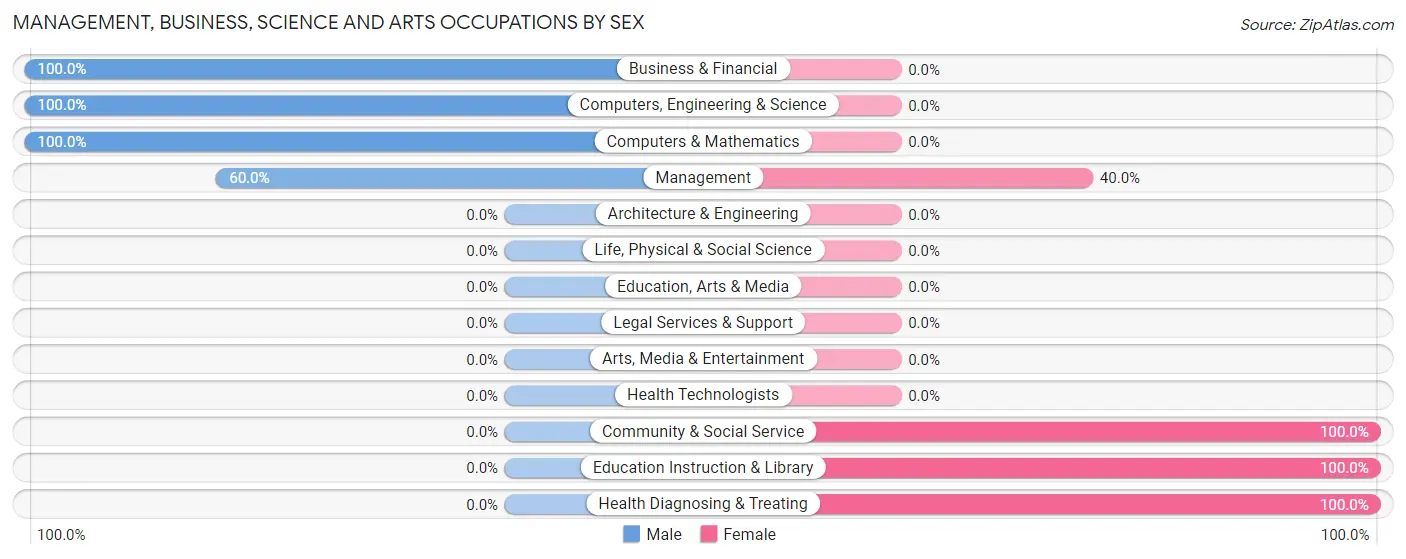
Management, Business, Science and Arts Occupations by Sex
Within the Management, Business, Science and Arts occupations in Woodruff, the most male-oriented occupations are Business & Financial (100.0%), Computers, Engineering & Science (100.0%), and Computers & Mathematics (100.0%), while the most female-oriented occupations are Community & Social Service (100.0%), Education Instruction & Library (100.0%), and Health Diagnosing & Treating (100.0%).
| Occupation | Male | Female |
| Management | 15 (60.0%) | 10 (40.0%) |
| Business & Financial | 23 (100.0%) | 0 (0.0%) |
| Computers, Engineering & Science | 7 (100.0%) | 0 (0.0%) |
| Computers & Mathematics | 7 (100.0%) | 0 (0.0%) |
| Architecture & Engineering | 0 (0.0%) | 0 (0.0%) |
| Life, Physical & Social Science | 0 (0.0%) | 0 (0.0%) |
| Community & Social Service | 0 (0.0%) | 4 (100.0%) |
| Education, Arts & Media | 0 (0.0%) | 0 (0.0%) |
| Legal Services & Support | 0 (0.0%) | 0 (0.0%) |
| Education Instruction & Library | 0 (0.0%) | 4 (100.0%) |
| Arts, Media & Entertainment | 0 (0.0%) | 0 (0.0%) |
| Health Diagnosing & Treating | 0 (0.0%) | 10 (100.0%) |
| Health Technologists | 0 (0.0%) | 0 (0.0%) |
| Total (Category) | 45 (65.2%) | 24 (34.8%) |
| Total (Overall) | 131 (39.1%) | 204 (60.9%) |
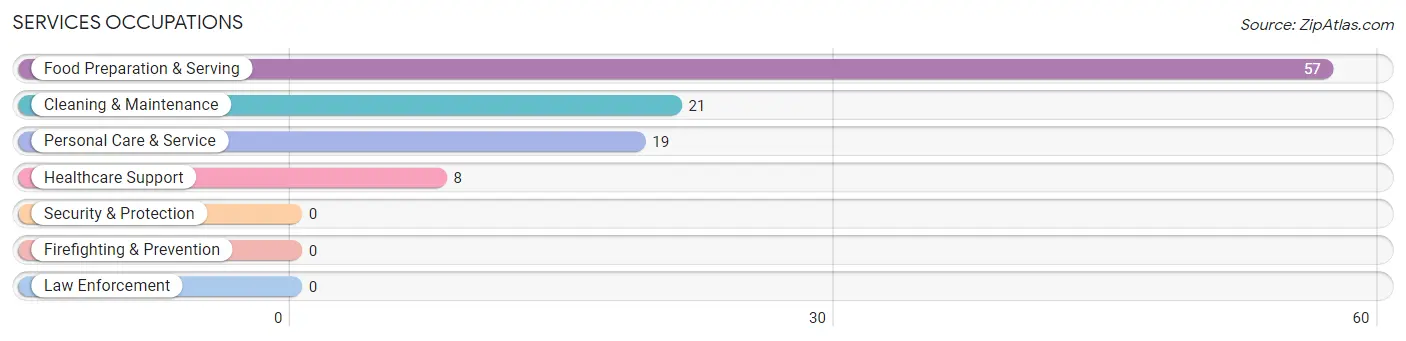
Services Occupations
The most common Services occupations in Woodruff are Food Preparation & Serving (57 | 17.0%), Cleaning & Maintenance (21 | 6.3%), Personal Care & Service (19 | 5.7%), and Healthcare Support (8 | 2.4%).
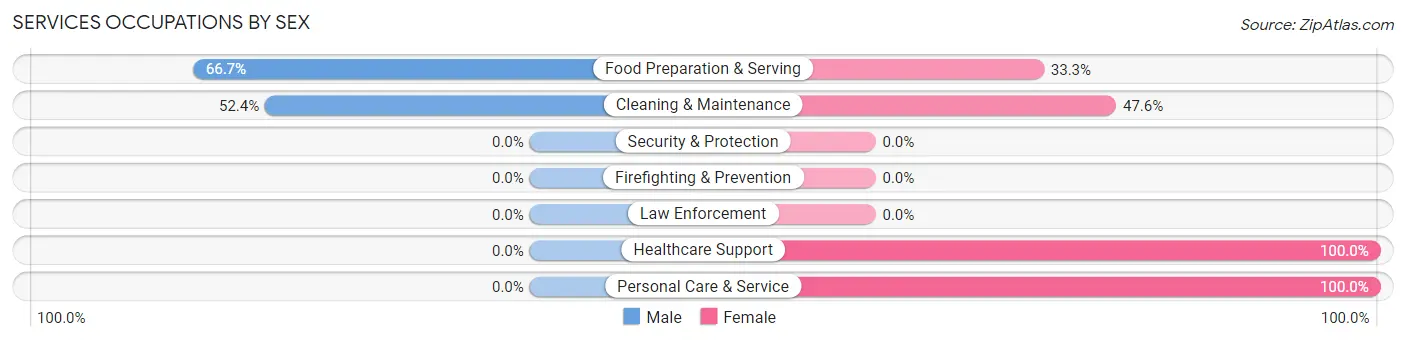
Services Occupations by Sex
Within the Services occupations in Woodruff, the most male-oriented occupations are Food Preparation & Serving (66.7%), and Cleaning & Maintenance (52.4%), while the most female-oriented occupations are Healthcare Support (100.0%), Personal Care & Service (100.0%), and Cleaning & Maintenance (47.6%).
| Occupation | Male | Female |
| Healthcare Support | 0 (0.0%) | 8 (100.0%) |
| Security & Protection | 0 (0.0%) | 0 (0.0%) |
| Firefighting & Prevention | 0 (0.0%) | 0 (0.0%) |
| Law Enforcement | 0 (0.0%) | 0 (0.0%) |
| Food Preparation & Serving | 38 (66.7%) | 19 (33.3%) |
| Cleaning & Maintenance | 11 (52.4%) | 10 (47.6%) |
| Personal Care & Service | 0 (0.0%) | 19 (100.0%) |
| Total (Category) | 49 (46.7%) | 56 (53.3%) |
| Total (Overall) | 131 (39.1%) | 204 (60.9%) |
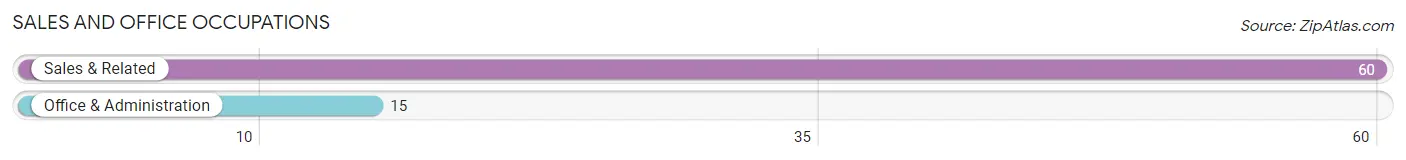
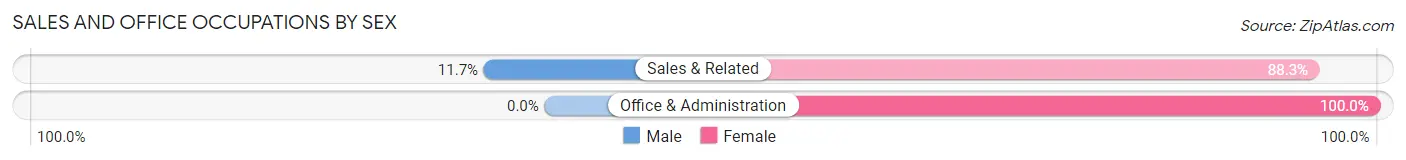
Sales and Office Occupations
The most common Sales and Office occupations in Woodruff are Sales & Related (60 | 17.9%), and Office & Administration (15 | 4.5%).
Sales and Office Occupations by Sex
| Occupation | Male | Female |
| Sales & Related | 7 (11.7%) | 53 (88.3%) |
| Office & Administration | 0 (0.0%) | 15 (100.0%) |
| Total (Category) | 7 (9.3%) | 68 (90.7%) |
| Total (Overall) | 131 (39.1%) | 204 (60.9%) |
Natural Resources, Construction and Maintenance Occupations
Natural Resources, Construction and Maintenance Occupations by Sex
| Occupation | Male | Female |
| Farming, Fishing & Forestry | 0 (0.0%) | 0 (0.0%) |
| Construction & Extraction | 0 (0.0%) | 0 (0.0%) |
| Installation, Maintenance & Repair | 0 (0.0%) | 0 (0.0%) |
| Total (Category) | 0 (0.0%) | 0 (0.0%) |
| Total (Overall) | 131 (39.1%) | 204 (60.9%) |
Production, Transportation and Moving Occupations
The most common Production, Transportation and Moving occupations in Woodruff are Production (61 | 18.2%), Transportation (16 | 4.8%), and Material Moving (9 | 2.7%).
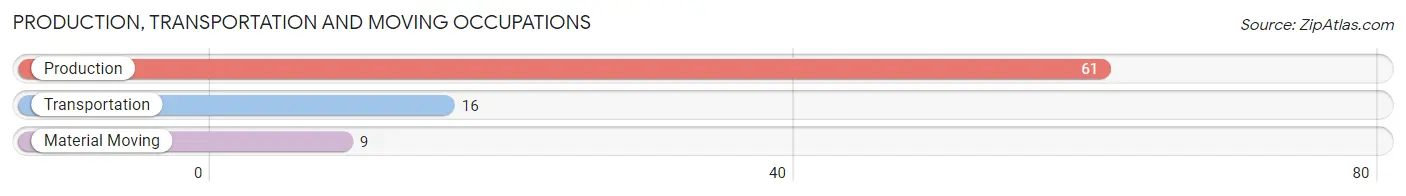
Production, Transportation and Moving Occupations by Sex
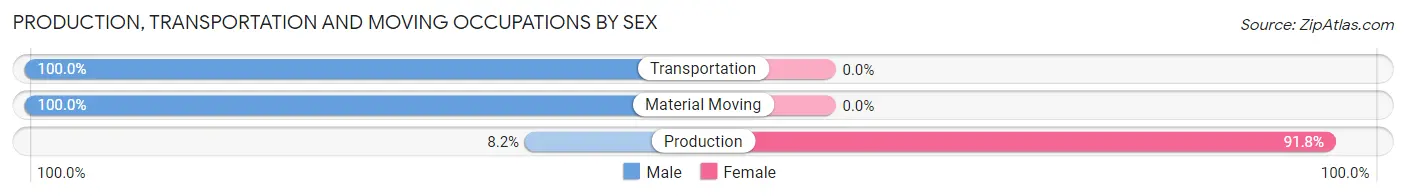
| Occupation | Male | Female |
| Production | 5 (8.2%) | 56 (91.8%) |
| Transportation | 16 (100.0%) | 0 (0.0%) |
| Material Moving | 9 (100.0%) | 0 (0.0%) |
| Total (Category) | 30 (34.9%) | 56 (65.1%) |
| Total (Overall) | 131 (39.1%) | 204 (60.9%) |
Employment Industries by Sex in Woodruff
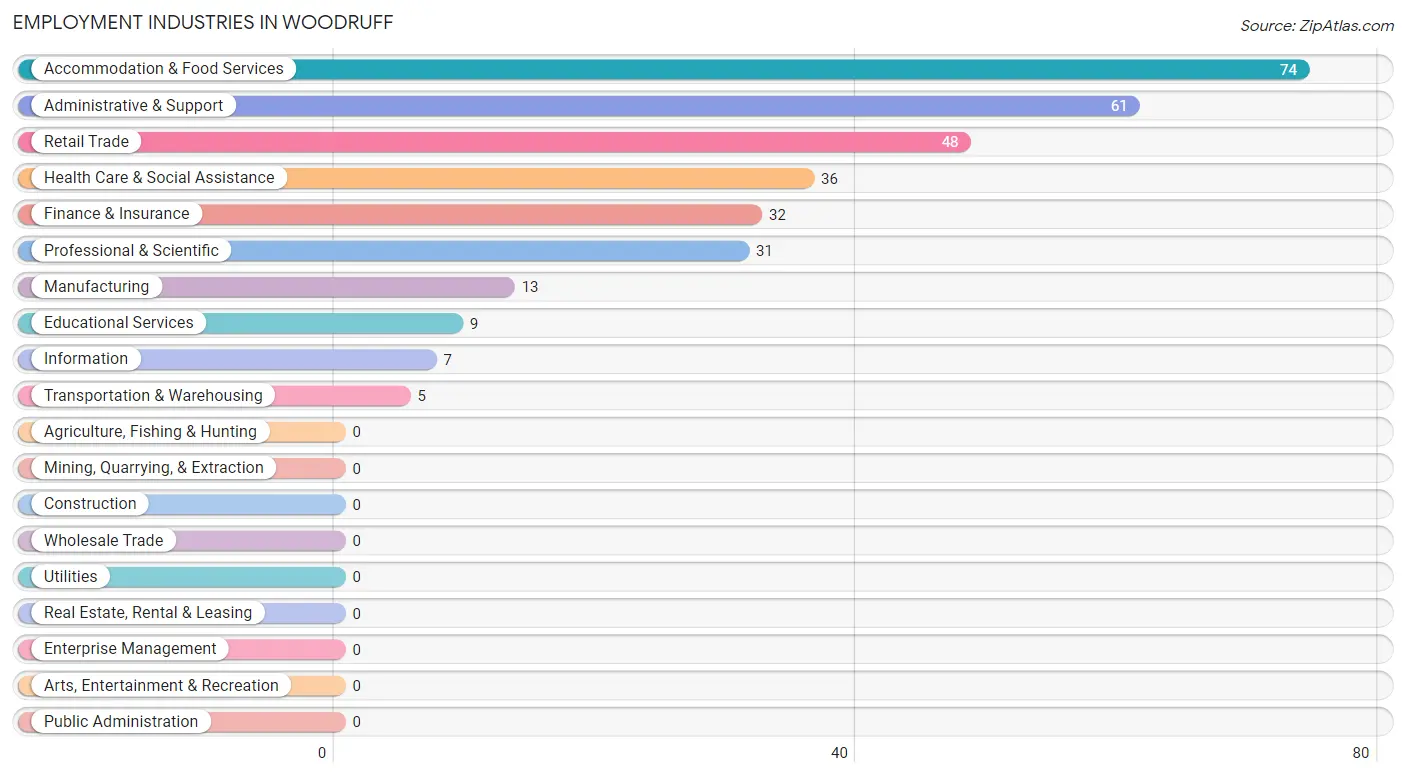
Employment Industries in Woodruff
The major employment industries in Woodruff include Accommodation & Food Services (74 | 22.1%), Administrative & Support (61 | 18.2%), Retail Trade (48 | 14.3%), Health Care & Social Assistance (36 | 10.7%), and Finance & Insurance (32 | 9.6%).
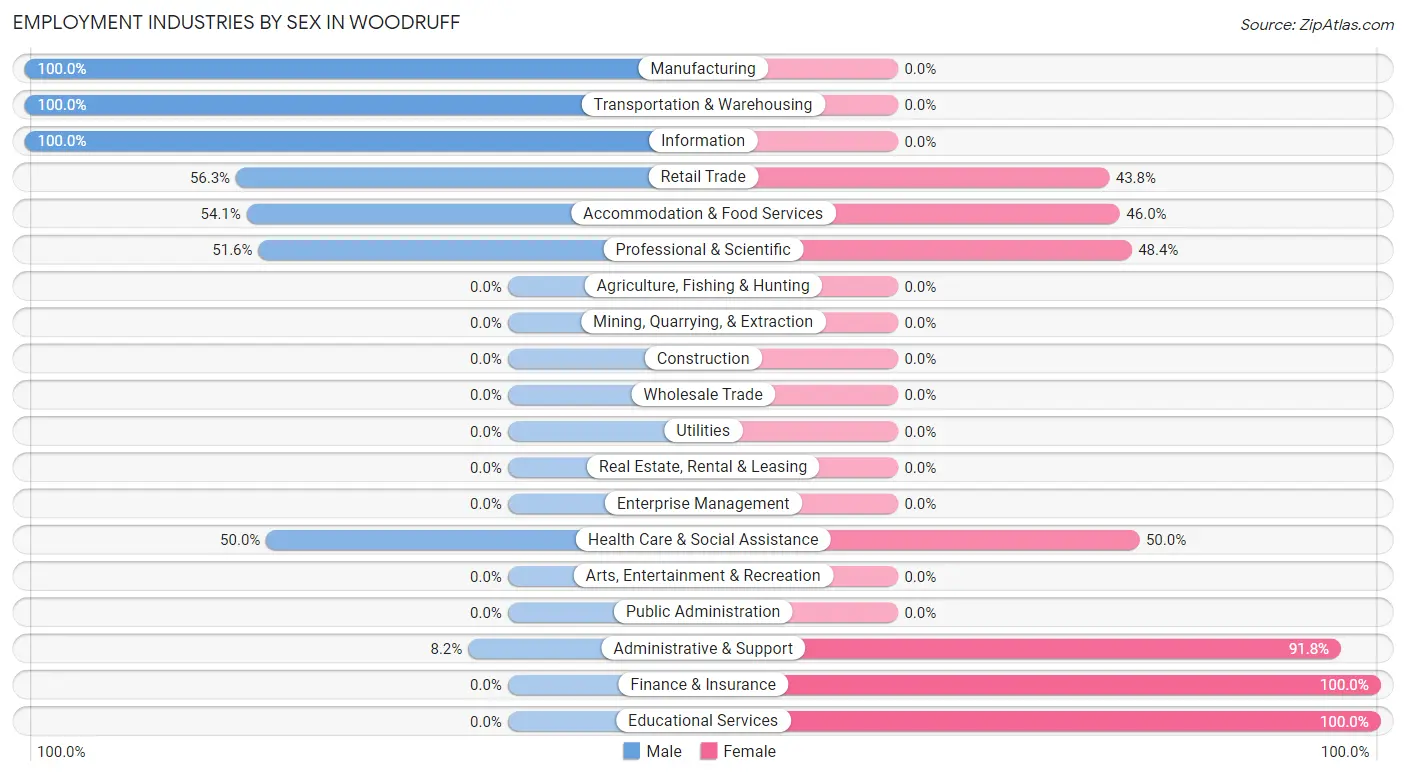
Employment Industries by Sex in Woodruff
The Woodruff industries that see more men than women are Manufacturing (100.0%), Transportation & Warehousing (100.0%), and Information (100.0%), whereas the industries that tend to have a higher number of women are Finance & Insurance (100.0%), Educational Services (100.0%), and Administrative & Support (91.8%).
| Industry | Male | Female |
| Agriculture, Fishing & Hunting | 0 (0.0%) | 0 (0.0%) |
| Mining, Quarrying, & Extraction | 0 (0.0%) | 0 (0.0%) |
| Construction | 0 (0.0%) | 0 (0.0%) |
| Manufacturing | 13 (100.0%) | 0 (0.0%) |
| Wholesale Trade | 0 (0.0%) | 0 (0.0%) |
| Retail Trade | 27 (56.2%) | 21 (43.8%) |
| Transportation & Warehousing | 5 (100.0%) | 0 (0.0%) |
| Utilities | 0 (0.0%) | 0 (0.0%) |
| Information | 7 (100.0%) | 0 (0.0%) |
| Finance & Insurance | 0 (0.0%) | 32 (100.0%) |
| Real Estate, Rental & Leasing | 0 (0.0%) | 0 (0.0%) |
| Professional & Scientific | 16 (51.6%) | 15 (48.4%) |
| Enterprise Management | 0 (0.0%) | 0 (0.0%) |
| Administrative & Support | 5 (8.2%) | 56 (91.8%) |
| Educational Services | 0 (0.0%) | 9 (100.0%) |
| Health Care & Social Assistance | 18 (50.0%) | 18 (50.0%) |
| Arts, Entertainment & Recreation | 0 (0.0%) | 0 (0.0%) |
| Accommodation & Food Services | 40 (54.0%) | 34 (46.0%) |
| Public Administration | 0 (0.0%) | 0 (0.0%) |
| Total | 131 (39.1%) | 204 (60.9%) |
Education in Woodruff
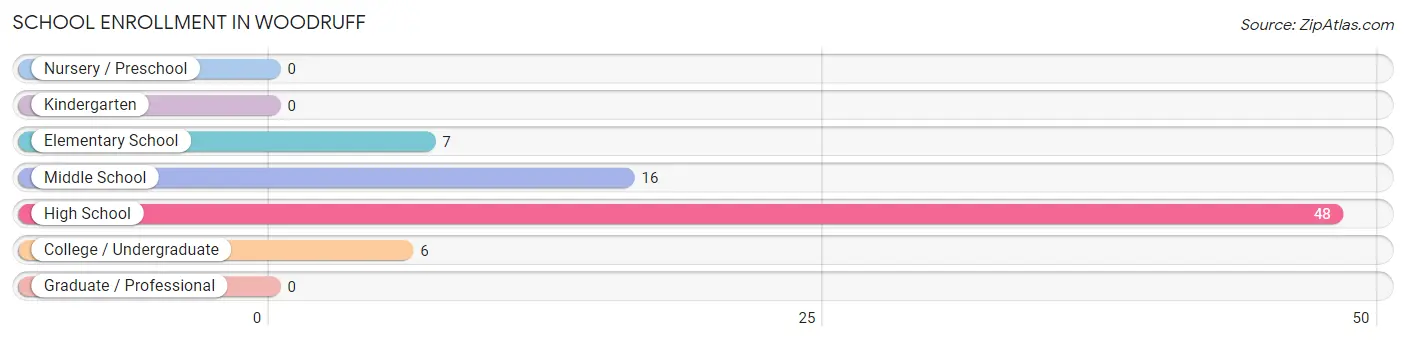
School Enrollment in Woodruff
The most common levels of schooling among the 77 students in Woodruff are high school (48 | 62.3%), middle school (16 | 20.8%), and elementary school (7 | 9.1%).
| School Level | # Students | % Students |
| Nursery / Preschool | 0 | 0.0% |
| Kindergarten | 0 | 0.0% |
| Elementary School | 7 | 9.1% |
| Middle School | 16 | 20.8% |
| High School | 48 | 62.3% |
| College / Undergraduate | 6 | 7.8% |
| Graduate / Professional | 0 | 0.0% |
| Total | 77 | 100.0% |
School Enrollment by Age by Funding Source in Woodruff
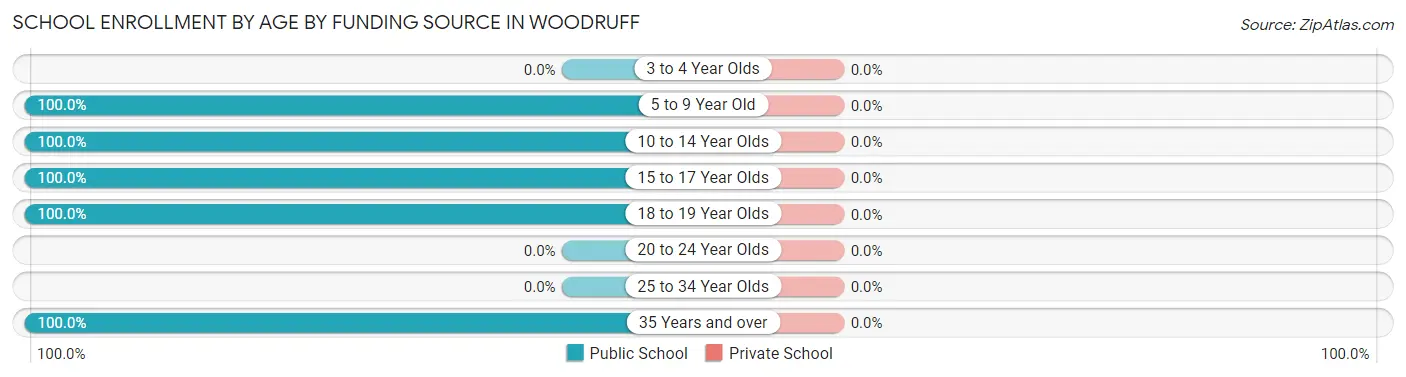
| Age Bracket | Public School | Private School |
| 3 to 4 Year Olds | 0 (0.0%) | 0 (0.0%) |
| 5 to 9 Year Old | 7 (100.0%) | 0 (0.0%) |
| 10 to 14 Year Olds | 40 (100.0%) | 0 (0.0%) |
| 15 to 17 Year Olds | 14 (100.0%) | 0 (0.0%) |
| 18 to 19 Year Olds | 10 (100.0%) | 0 (0.0%) |
| 20 to 24 Year Olds | 0 (0.0%) | 0 (0.0%) |
| 25 to 34 Year Olds | 0 (0.0%) | 0 (0.0%) |
| 35 Years and over | 6 (100.0%) | 0 (0.0%) |
| Total | 77 (100.0%) | 0 (0.0%) |
Educational Attainment by Field of Study in Woodruff
Education (45 | 25.4%), business (44 | 24.9%), visual & performing arts (24 | 13.6%), communications (22 | 12.4%), and bio, nature & agricultural (16 | 9.0%) are the most common fields of study among 177 individuals in Woodruff who have obtained a bachelor's degree or higher.
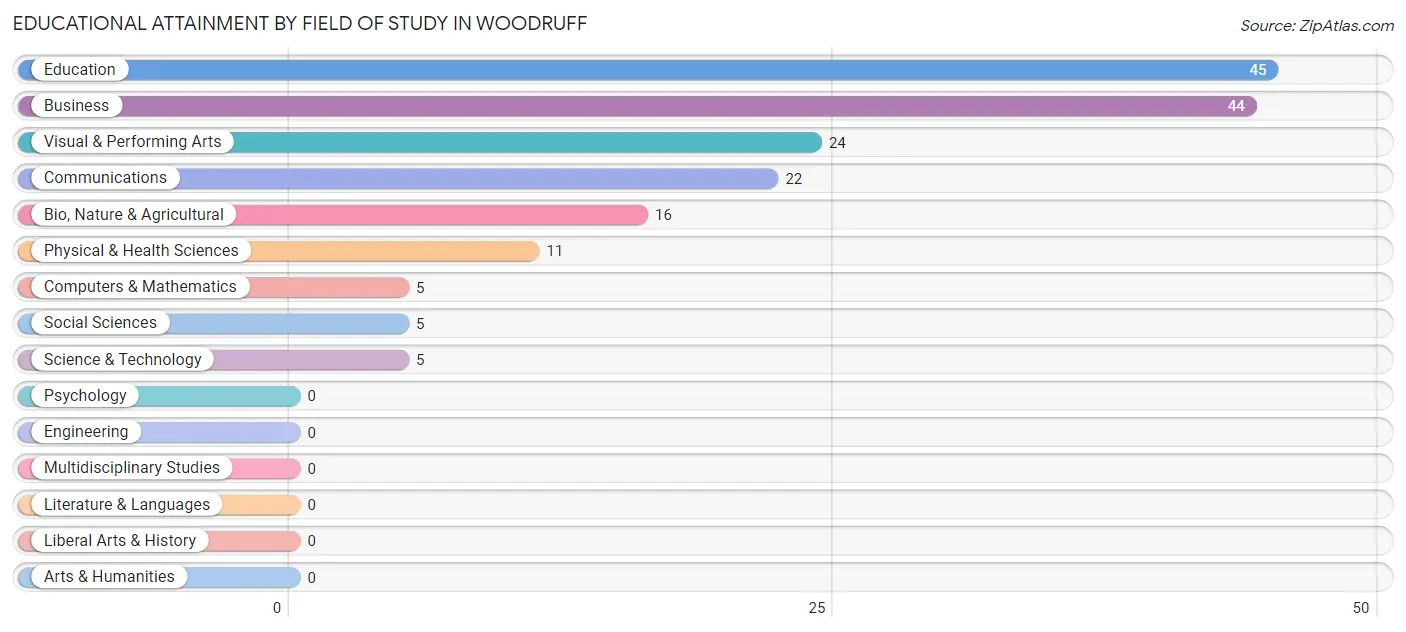
| Field of Study | # Graduates | % Graduates |
| Computers & Mathematics | 5 | 2.8% |
| Bio, Nature & Agricultural | 16 | 9.0% |
| Physical & Health Sciences | 11 | 6.2% |
| Psychology | 0 | 0.0% |
| Social Sciences | 5 | 2.8% |
| Engineering | 0 | 0.0% |
| Multidisciplinary Studies | 0 | 0.0% |
| Science & Technology | 5 | 2.8% |
| Business | 44 | 24.9% |
| Education | 45 | 25.4% |
| Literature & Languages | 0 | 0.0% |
| Liberal Arts & History | 0 | 0.0% |
| Visual & Performing Arts | 24 | 13.6% |
| Communications | 22 | 12.4% |
| Arts & Humanities | 0 | 0.0% |
| Total | 177 | 100.0% |
Transportation & Commute in Woodruff
Vehicle Availability by Sex in Woodruff
The most prevalent vehicle ownership categories in Woodruff are males with 2 vehicles (80, accounting for 61.1%) and females with 2 vehicles (85, making up 42.1%).
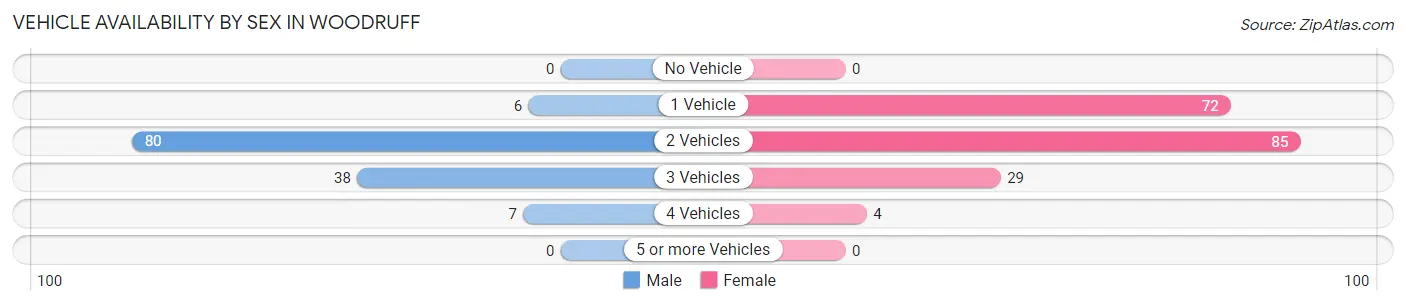
| Vehicles Available | Male | Female |
| No Vehicle | 0 (0.0%) | 0 (0.0%) |
| 1 Vehicle | 6 (4.6%) | 72 (37.9%) |
| 2 Vehicles | 80 (61.1%) | 85 (44.7%) |
| 3 Vehicles | 38 (29.0%) | 29 (15.3%) |
| 4 Vehicles | 7 (5.3%) | 4 (2.1%) |
| 5 or more Vehicles | 0 (0.0%) | 0 (0.0%) |
| Total | 131 (100.0%) | 190 (100.0%) |
Commute Time in Woodruff
The most frequently occuring commute durations in Woodruff are 5 to 9 minutes (96 commuters, 30.7%), 10 to 14 minutes (72 commuters, 23.0%), and less than 5 minutes (62 commuters, 19.8%).
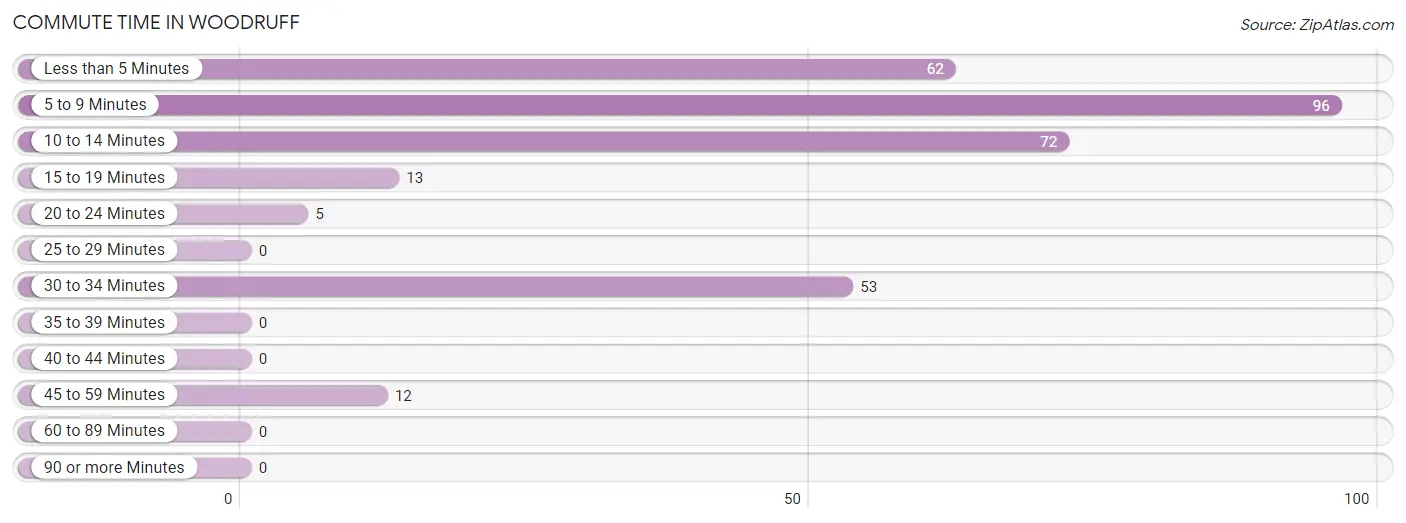
| Commute Time | # Commuters | % Commuters |
| Less than 5 Minutes | 62 | 19.8% |
| 5 to 9 Minutes | 96 | 30.7% |
| 10 to 14 Minutes | 72 | 23.0% |
| 15 to 19 Minutes | 13 | 4.2% |
| 20 to 24 Minutes | 5 | 1.6% |
| 25 to 29 Minutes | 0 | 0.0% |
| 30 to 34 Minutes | 53 | 16.9% |
| 35 to 39 Minutes | 0 | 0.0% |
| 40 to 44 Minutes | 0 | 0.0% |
| 45 to 59 Minutes | 12 | 3.8% |
| 60 to 89 Minutes | 0 | 0.0% |
| 90 or more Minutes | 0 | 0.0% |
Commute Time by Sex in Woodruff
The most common commute times in Woodruff are 5 to 9 minutes (62 commuters, 50.4%) for males and less than 5 minutes (56 commuters, 29.5%) for females.
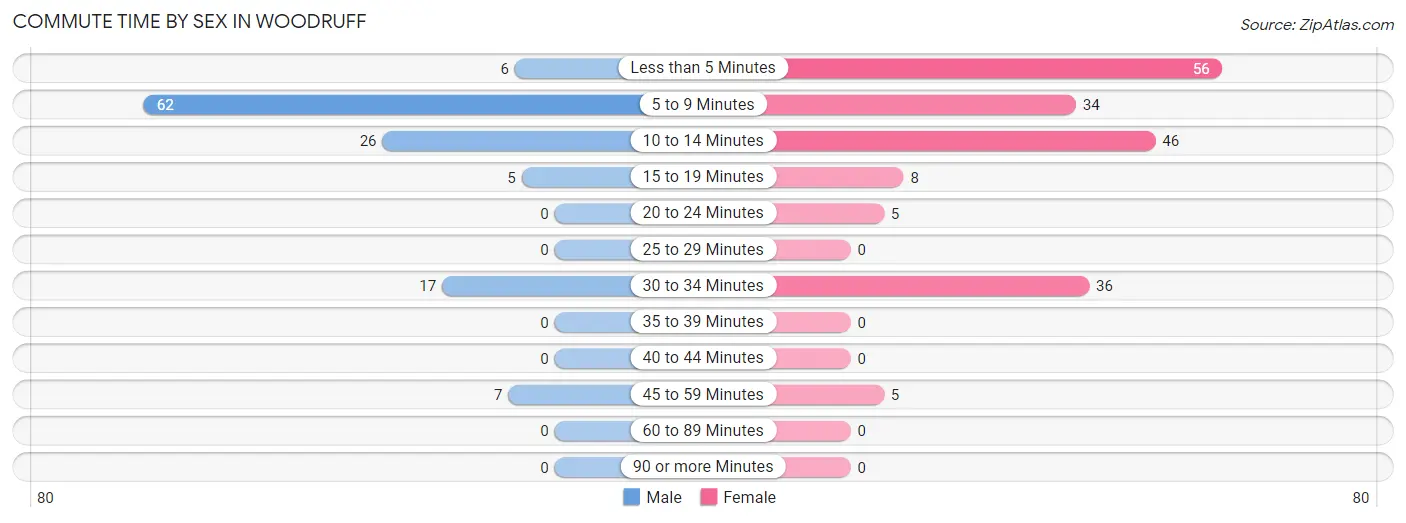
| Commute Time | Male | Female |
| Less than 5 Minutes | 6 (4.9%) | 56 (29.5%) |
| 5 to 9 Minutes | 62 (50.4%) | 34 (17.9%) |
| 10 to 14 Minutes | 26 (21.1%) | 46 (24.2%) |
| 15 to 19 Minutes | 5 (4.1%) | 8 (4.2%) |
| 20 to 24 Minutes | 0 (0.0%) | 5 (2.6%) |
| 25 to 29 Minutes | 0 (0.0%) | 0 (0.0%) |
| 30 to 34 Minutes | 17 (13.8%) | 36 (19.0%) |
| 35 to 39 Minutes | 0 (0.0%) | 0 (0.0%) |
| 40 to 44 Minutes | 0 (0.0%) | 0 (0.0%) |
| 45 to 59 Minutes | 7 (5.7%) | 5 (2.6%) |
| 60 to 89 Minutes | 0 (0.0%) | 0 (0.0%) |
| 90 or more Minutes | 0 (0.0%) | 0 (0.0%) |
Time of Departure to Work by Sex in Woodruff
The most frequent times of departure to work in Woodruff are 10:00 AM to 10:59 AM (38, 30.9%) for males and 11:00 AM to 11:59 AM (56, 29.5%) for females.
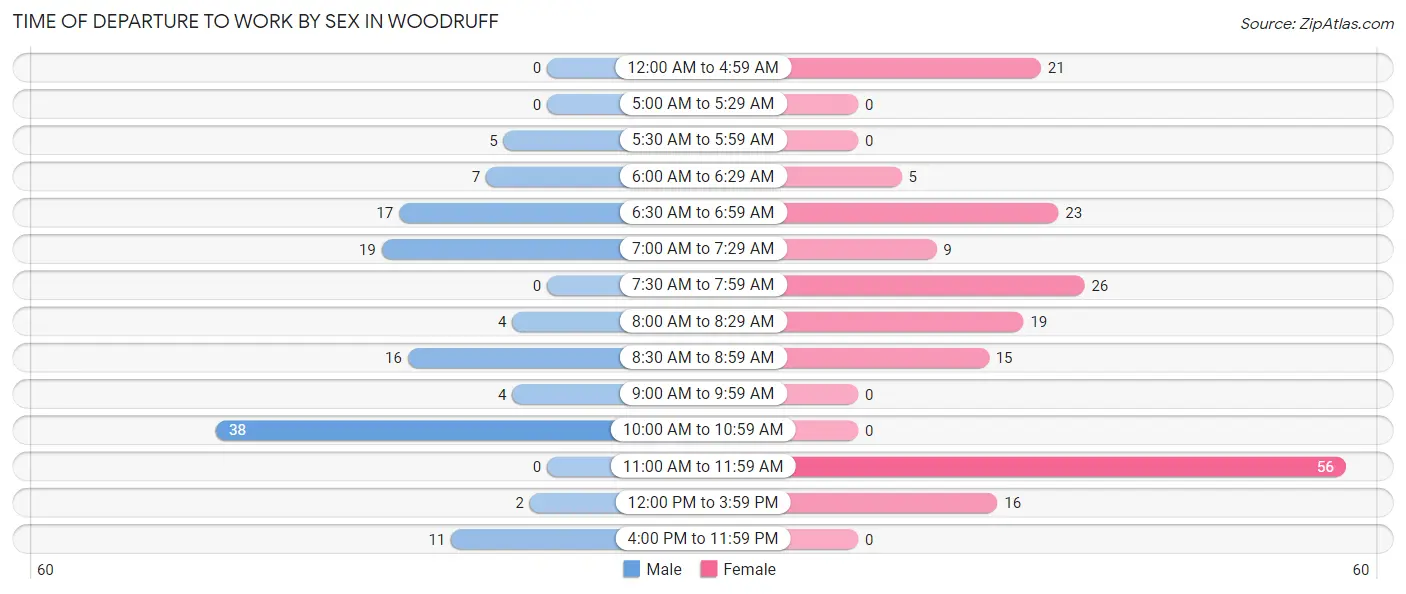
| Time of Departure | Male | Female |
| 12:00 AM to 4:59 AM | 0 (0.0%) | 21 (11.1%) |
| 5:00 AM to 5:29 AM | 0 (0.0%) | 0 (0.0%) |
| 5:30 AM to 5:59 AM | 5 (4.1%) | 0 (0.0%) |
| 6:00 AM to 6:29 AM | 7 (5.7%) | 5 (2.6%) |
| 6:30 AM to 6:59 AM | 17 (13.8%) | 23 (12.1%) |
| 7:00 AM to 7:29 AM | 19 (15.4%) | 9 (4.7%) |
| 7:30 AM to 7:59 AM | 0 (0.0%) | 26 (13.7%) |
| 8:00 AM to 8:29 AM | 4 (3.3%) | 19 (10.0%) |
| 8:30 AM to 8:59 AM | 16 (13.0%) | 15 (7.9%) |
| 9:00 AM to 9:59 AM | 4 (3.3%) | 0 (0.0%) |
| 10:00 AM to 10:59 AM | 38 (30.9%) | 0 (0.0%) |
| 11:00 AM to 11:59 AM | 0 (0.0%) | 56 (29.5%) |
| 12:00 PM to 3:59 PM | 2 (1.6%) | 16 (8.4%) |
| 4:00 PM to 11:59 PM | 11 (8.9%) | 0 (0.0%) |
| Total | 123 (100.0%) | 190 (100.0%) |
Housing Occupancy in Woodruff
Occupancy by Ownership in Woodruff
Of the total 371 dwellings in Woodruff, owner-occupied units account for 229 (61.7%), while renter-occupied units make up 142 (38.3%).
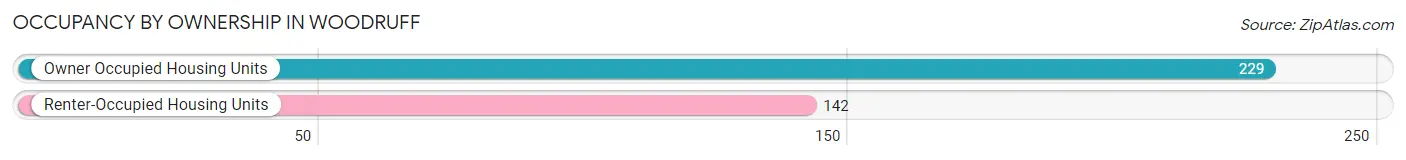
| Occupancy | # Housing Units | % Housing Units |
| Owner Occupied Housing Units | 229 | 61.7% |
| Renter-Occupied Housing Units | 142 | 38.3% |
| Total Occupied Housing Units | 371 | 100.0% |
Occupancy by Household Size in Woodruff
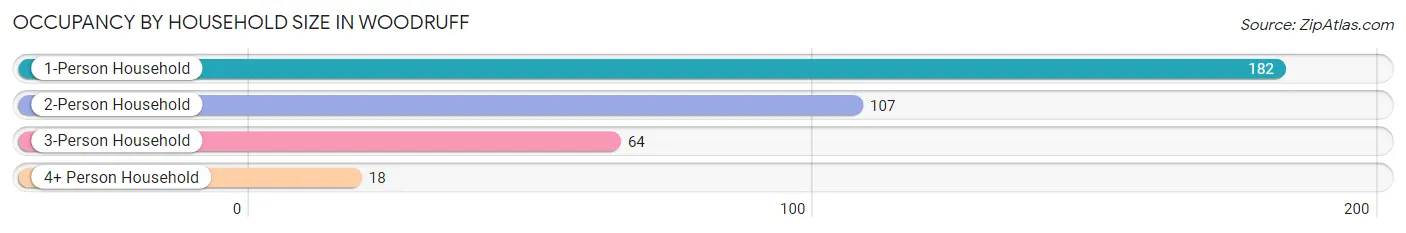
| Household Size | # Housing Units | % Housing Units |
| 1-Person Household | 182 | 49.1% |
| 2-Person Household | 107 | 28.8% |
| 3-Person Household | 64 | 17.2% |
| 4+ Person Household | 18 | 4.9% |
| Total Housing Units | 371 | 100.0% |
Occupancy by Ownership by Household Size in Woodruff
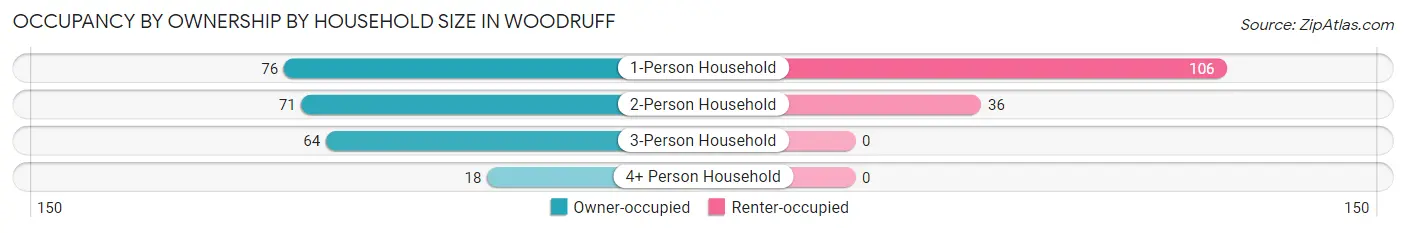
| Household Size | Owner-occupied | Renter-occupied |
| 1-Person Household | 76 (41.8%) | 106 (58.2%) |
| 2-Person Household | 71 (66.4%) | 36 (33.6%) |
| 3-Person Household | 64 (100.0%) | 0 (0.0%) |
| 4+ Person Household | 18 (100.0%) | 0 (0.0%) |
| Total Housing Units | 229 (61.7%) | 142 (38.3%) |
Occupancy by Educational Attainment in Woodruff
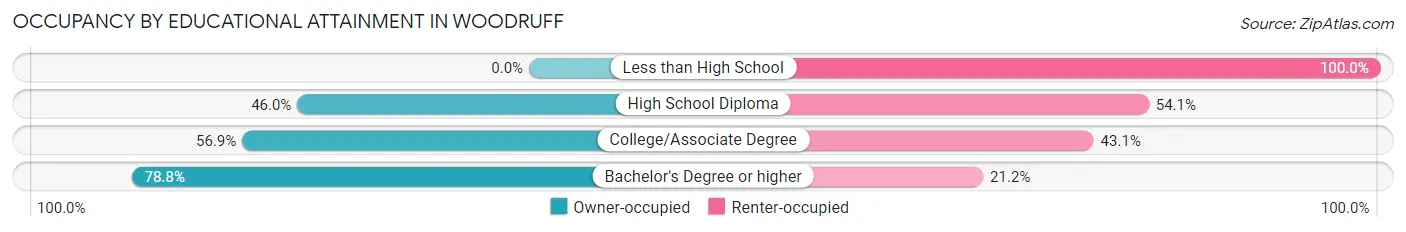
| Household Size | Owner-occupied | Renter-occupied |
| Less than High School | 0 (0.0%) | 5 (100.0%) |
| High School Diploma | 34 (46.0%) | 40 (54.0%) |
| College/Associate Degree | 91 (56.9%) | 69 (43.1%) |
| Bachelor's Degree or higher | 104 (78.8%) | 28 (21.2%) |
Occupancy by Age of Householder in Woodruff
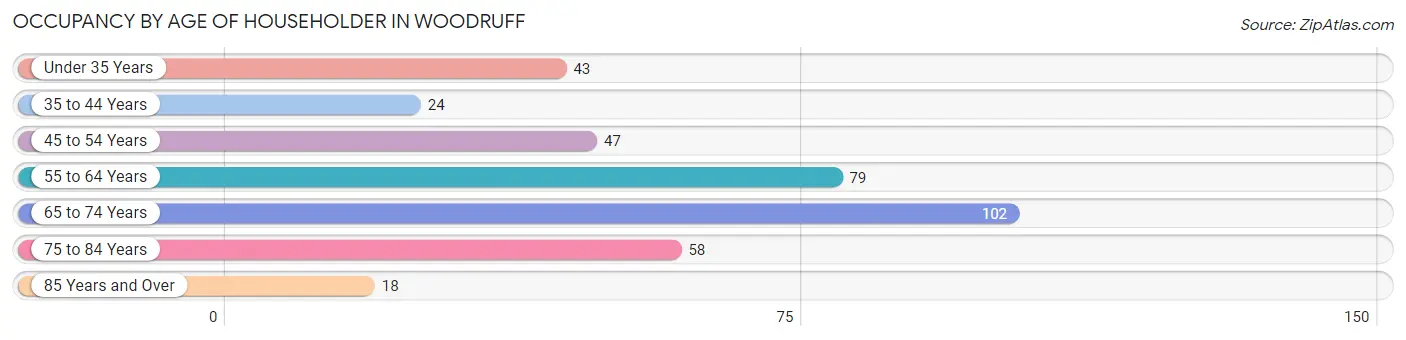
| Age Bracket | # Households | % Households |
| Under 35 Years | 43 | 11.6% |
| 35 to 44 Years | 24 | 6.5% |
| 45 to 54 Years | 47 | 12.7% |
| 55 to 64 Years | 79 | 21.3% |
| 65 to 74 Years | 102 | 27.5% |
| 75 to 84 Years | 58 | 15.6% |
| 85 Years and Over | 18 | 4.9% |
| Total | 371 | 100.0% |
Housing Finances in Woodruff
Median Income by Occupancy in Woodruff
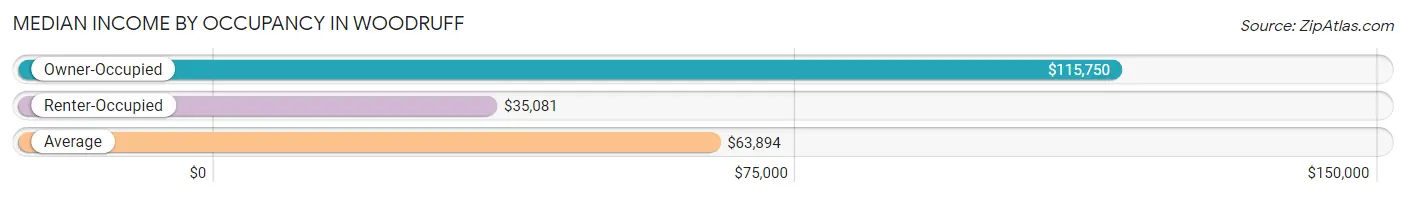
| Occupancy Type | # Households | Median Income |
| Owner-Occupied | 229 (61.7%) | $115,750 |
| Renter-Occupied | 142 (38.3%) | $35,081 |
| Average | 371 (100.0%) | $63,894 |
Occupancy by Householder Income Bracket in Woodruff
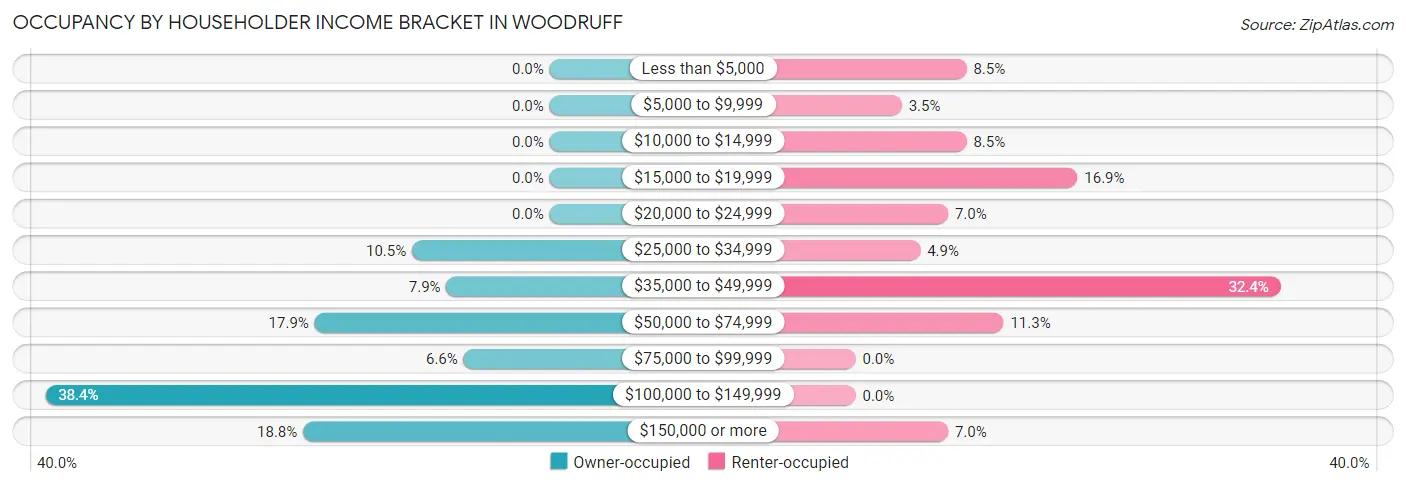
| Income Bracket | Owner-occupied | Renter-occupied |
| Less than $5,000 | 0 (0.0%) | 12 (8.5%) |
| $5,000 to $9,999 | 0 (0.0%) | 5 (3.5%) |
| $10,000 to $14,999 | 0 (0.0%) | 12 (8.5%) |
| $15,000 to $19,999 | 0 (0.0%) | 24 (16.9%) |
| $20,000 to $24,999 | 0 (0.0%) | 10 (7.0%) |
| $25,000 to $34,999 | 24 (10.5%) | 7 (4.9%) |
| $35,000 to $49,999 | 18 (7.9%) | 46 (32.4%) |
| $50,000 to $74,999 | 41 (17.9%) | 16 (11.3%) |
| $75,000 to $99,999 | 15 (6.6%) | 0 (0.0%) |
| $100,000 to $149,999 | 88 (38.4%) | 0 (0.0%) |
| $150,000 or more | 43 (18.8%) | 10 (7.0%) |
| Total | 229 (100.0%) | 142 (100.0%) |
Monthly Housing Cost Tiers in Woodruff
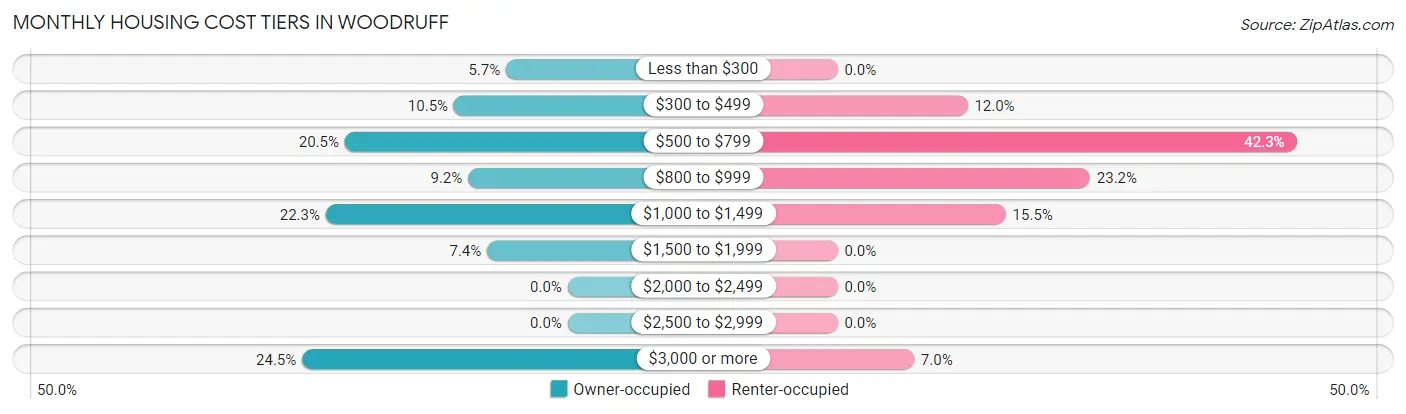
| Monthly Cost | Owner-occupied | Renter-occupied |
| Less than $300 | 13 (5.7%) | 0 (0.0%) |
| $300 to $499 | 24 (10.5%) | 17 (12.0%) |
| $500 to $799 | 47 (20.5%) | 60 (42.2%) |
| $800 to $999 | 21 (9.2%) | 33 (23.2%) |
| $1,000 to $1,499 | 51 (22.3%) | 22 (15.5%) |
| $1,500 to $1,999 | 17 (7.4%) | 0 (0.0%) |
| $2,000 to $2,499 | 0 (0.0%) | 0 (0.0%) |
| $2,500 to $2,999 | 0 (0.0%) | 0 (0.0%) |
| $3,000 or more | 56 (24.4%) | 10 (7.0%) |
| Total | 229 (100.0%) | 142 (100.0%) |
Physical Housing Characteristics in Woodruff
Housing Structures in Woodruff
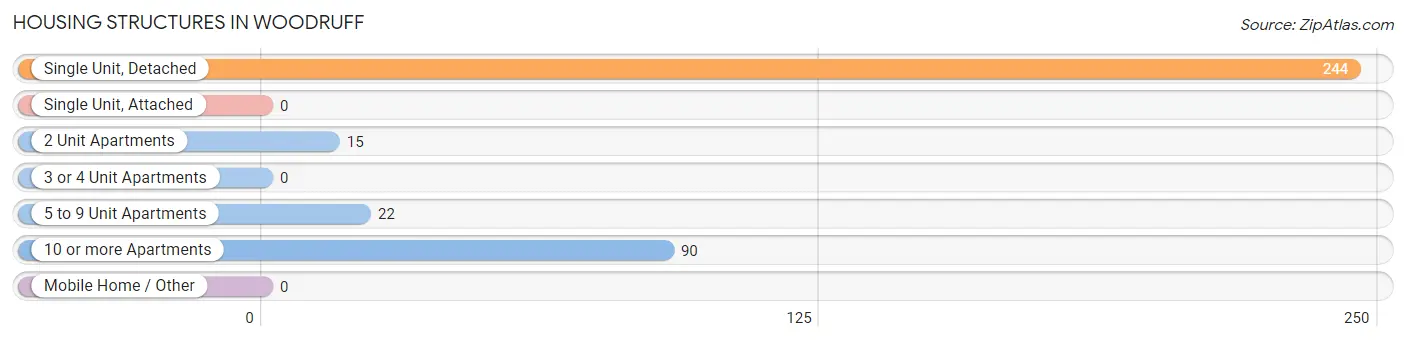
| Structure Type | # Housing Units | % Housing Units |
| Single Unit, Detached | 244 | 65.8% |
| Single Unit, Attached | 0 | 0.0% |
| 2 Unit Apartments | 15 | 4.0% |
| 3 or 4 Unit Apartments | 0 | 0.0% |
| 5 to 9 Unit Apartments | 22 | 5.9% |
| 10 or more Apartments | 90 | 24.3% |
| Mobile Home / Other | 0 | 0.0% |
| Total | 371 | 100.0% |
Housing Structures by Occupancy in Woodruff
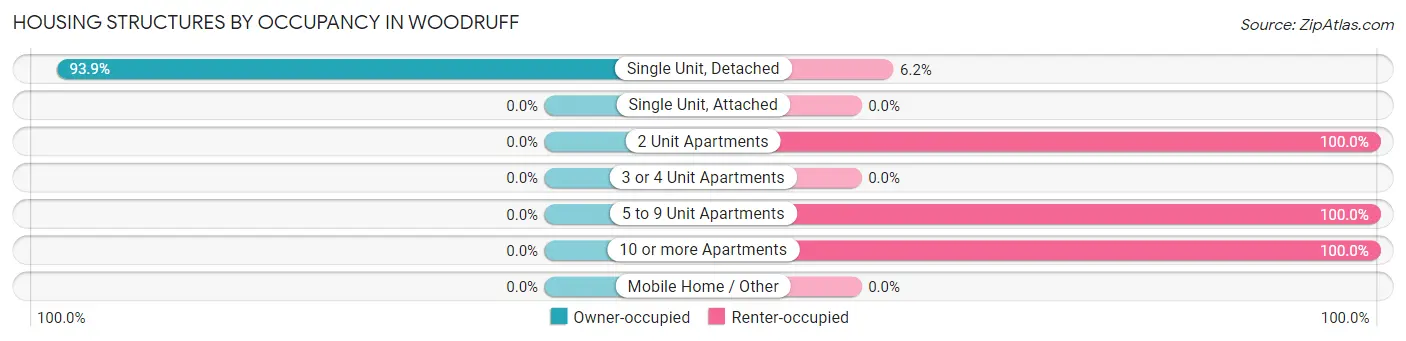
| Structure Type | Owner-occupied | Renter-occupied |
| Single Unit, Detached | 229 (93.9%) | 15 (6.1%) |
| Single Unit, Attached | 0 (0.0%) | 0 (0.0%) |
| 2 Unit Apartments | 0 (0.0%) | 15 (100.0%) |
| 3 or 4 Unit Apartments | 0 (0.0%) | 0 (0.0%) |
| 5 to 9 Unit Apartments | 0 (0.0%) | 22 (100.0%) |
| 10 or more Apartments | 0 (0.0%) | 90 (100.0%) |
| Mobile Home / Other | 0 (0.0%) | 0 (0.0%) |
| Total | 229 (61.7%) | 142 (38.3%) |
Housing Structures by Number of Rooms in Woodruff
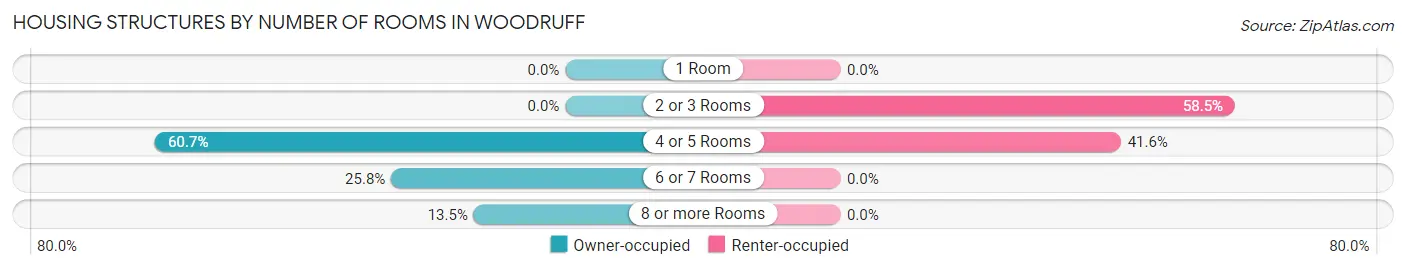
| Number of Rooms | Owner-occupied | Renter-occupied |
| 1 Room | 0 (0.0%) | 0 (0.0%) |
| 2 or 3 Rooms | 0 (0.0%) | 83 (58.5%) |
| 4 or 5 Rooms | 139 (60.7%) | 59 (41.5%) |
| 6 or 7 Rooms | 59 (25.8%) | 0 (0.0%) |
| 8 or more Rooms | 31 (13.5%) | 0 (0.0%) |
| Total | 229 (100.0%) | 142 (100.0%) |
Housing Structure by Heating Type in Woodruff
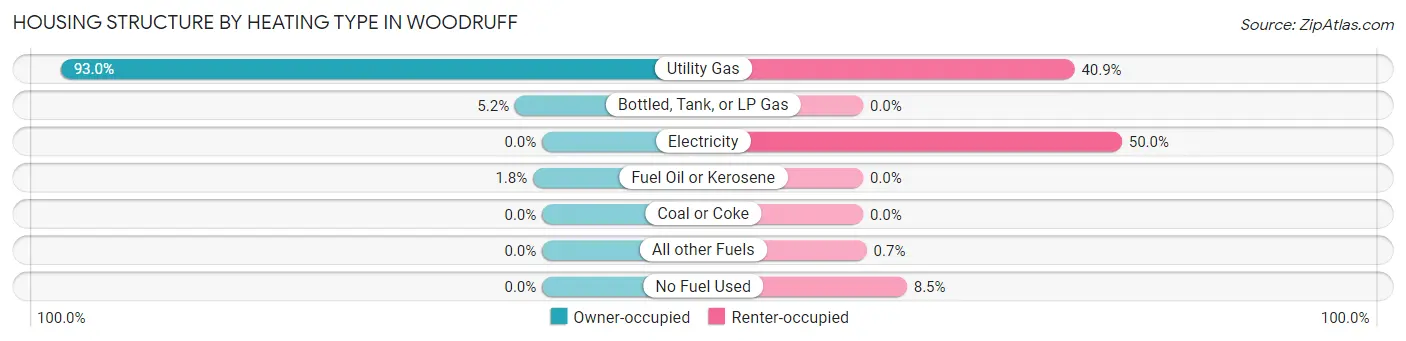
| Heating Type | Owner-occupied | Renter-occupied |
| Utility Gas | 213 (93.0%) | 58 (40.8%) |
| Bottled, Tank, or LP Gas | 12 (5.2%) | 0 (0.0%) |
| Electricity | 0 (0.0%) | 71 (50.0%) |
| Fuel Oil or Kerosene | 4 (1.8%) | 0 (0.0%) |
| Coal or Coke | 0 (0.0%) | 0 (0.0%) |
| All other Fuels | 0 (0.0%) | 1 (0.7%) |
| No Fuel Used | 0 (0.0%) | 12 (8.5%) |
| Total | 229 (100.0%) | 142 (100.0%) |
Household Vehicle Usage in Woodruff
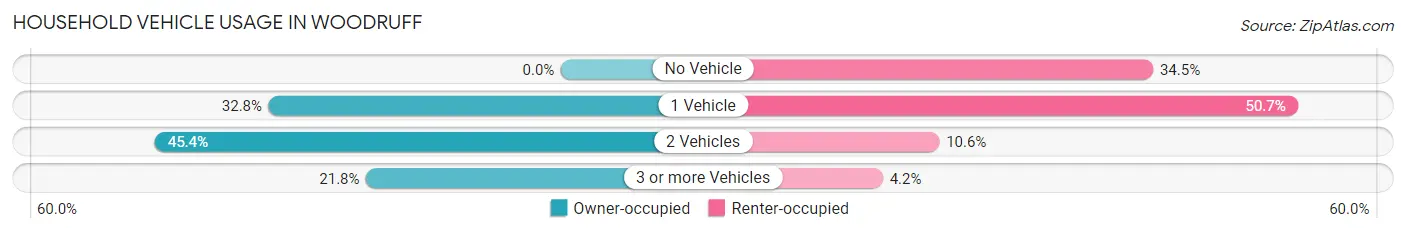
| Vehicles per Household | Owner-occupied | Renter-occupied |
| No Vehicle | 0 (0.0%) | 49 (34.5%) |
| 1 Vehicle | 75 (32.8%) | 72 (50.7%) |
| 2 Vehicles | 104 (45.4%) | 15 (10.6%) |
| 3 or more Vehicles | 50 (21.8%) | 6 (4.2%) |
| Total | 229 (100.0%) | 142 (100.0%) |
Real Estate & Mortgages in Woodruff
Real Estate and Mortgage Overview in Woodruff
| Characteristic | Without Mortgage | With Mortgage |
| Housing Units | 58 | 171 |
| Median Property Value | $227,600 | $202,800 |
| Median Household Income | - | - |
| Monthly Housing Costs | $390 | $56 |
| Real Estate Taxes | $1,548 | $0 |
Property Value by Mortgage Status in Woodruff
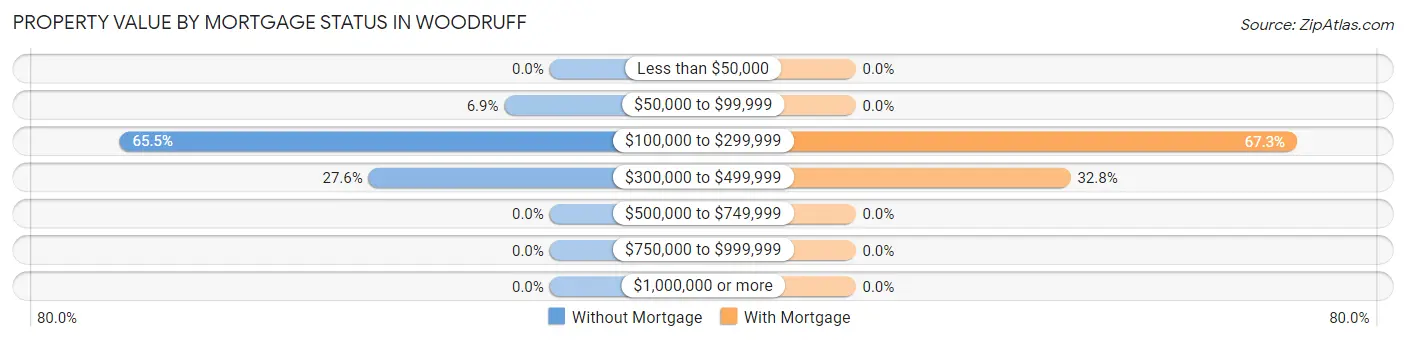
| Property Value | Without Mortgage | With Mortgage |
| Less than $50,000 | 0 (0.0%) | 0 (0.0%) |
| $50,000 to $99,999 | 4 (6.9%) | 0 (0.0%) |
| $100,000 to $299,999 | 38 (65.5%) | 115 (67.2%) |
| $300,000 to $499,999 | 16 (27.6%) | 56 (32.8%) |
| $500,000 to $749,999 | 0 (0.0%) | 0 (0.0%) |
| $750,000 to $999,999 | 0 (0.0%) | 0 (0.0%) |
| $1,000,000 or more | 0 (0.0%) | 0 (0.0%) |
| Total | 58 (100.0%) | 171 (100.0%) |
Household Income by Mortgage Status in Woodruff
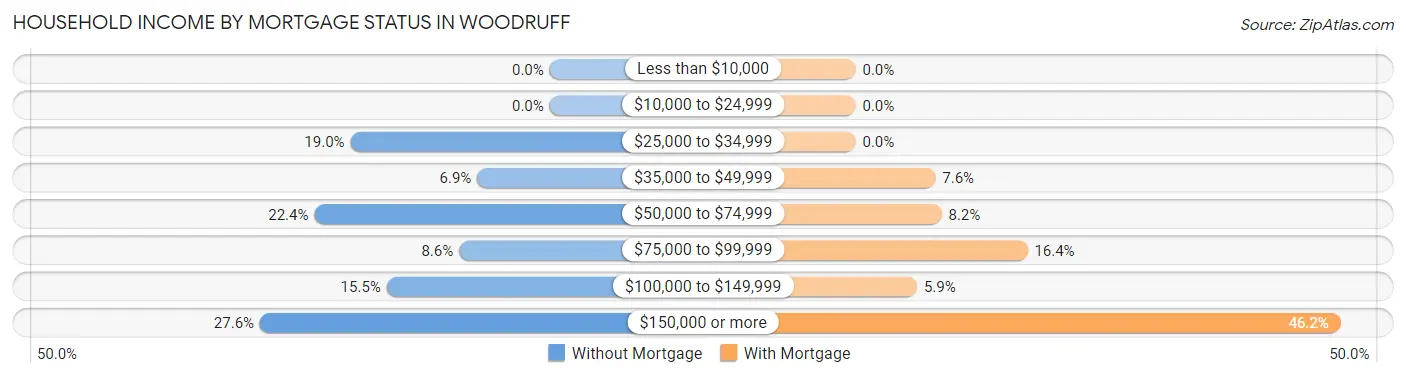
| Household Income | Without Mortgage | With Mortgage |
| Less than $10,000 | 0 (0.0%) | 0 (0.0%) |
| $10,000 to $24,999 | 0 (0.0%) | 0 (0.0%) |
| $25,000 to $34,999 | 11 (19.0%) | 0 (0.0%) |
| $35,000 to $49,999 | 4 (6.9%) | 13 (7.6%) |
| $50,000 to $74,999 | 13 (22.4%) | 14 (8.2%) |
| $75,000 to $99,999 | 5 (8.6%) | 28 (16.4%) |
| $100,000 to $149,999 | 9 (15.5%) | 10 (5.9%) |
| $150,000 or more | 16 (27.6%) | 79 (46.2%) |
| Total | 58 (100.0%) | 171 (100.0%) |
Property Value to Household Income Ratio in Woodruff
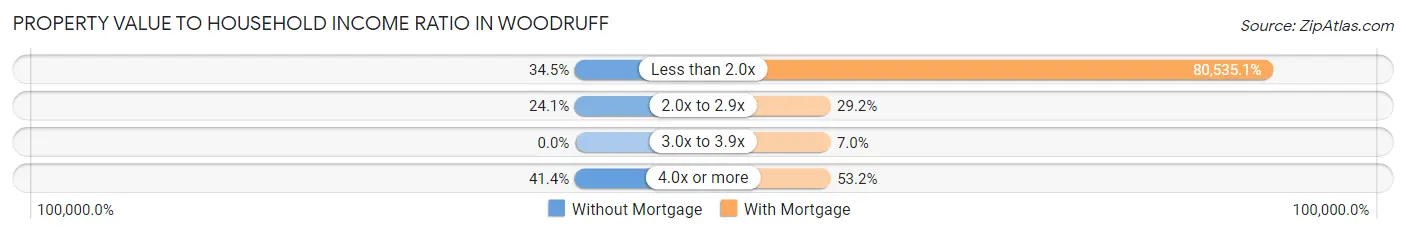
| Value-to-Income Ratio | Without Mortgage | With Mortgage |
| Less than 2.0x | 20 (34.5%) | 137,715 (80,535.1%) |
| 2.0x to 2.9x | 14 (24.1%) | 50 (29.2%) |
| 3.0x to 3.9x | 0 (0.0%) | 12 (7.0%) |
| 4.0x or more | 24 (41.4%) | 91 (53.2%) |
| Total | 58 (100.0%) | 171 (100.0%) |
Real Estate Taxes by Mortgage Status in Woodruff
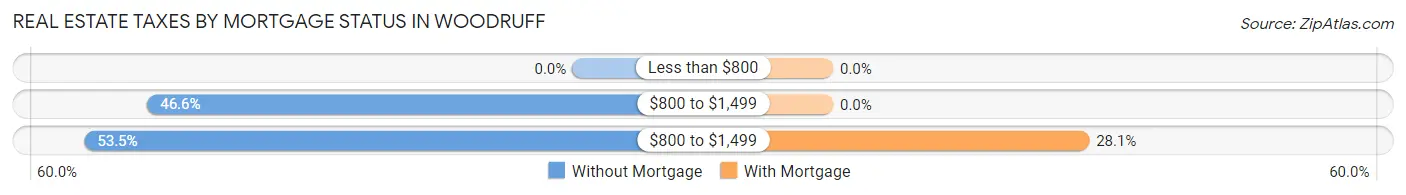
| Property Taxes | Without Mortgage | With Mortgage |
| Less than $800 | 0 (0.0%) | 0 (0.0%) |
| $800 to $1,499 | 27 (46.6%) | 0 (0.0%) |
| $800 to $1,499 | 31 (53.4%) | 48 (28.1%) |
| Total | 58 (100.0%) | 171 (100.0%) |
Health & Disability in Woodruff
Health Insurance Coverage by Age in Woodruff
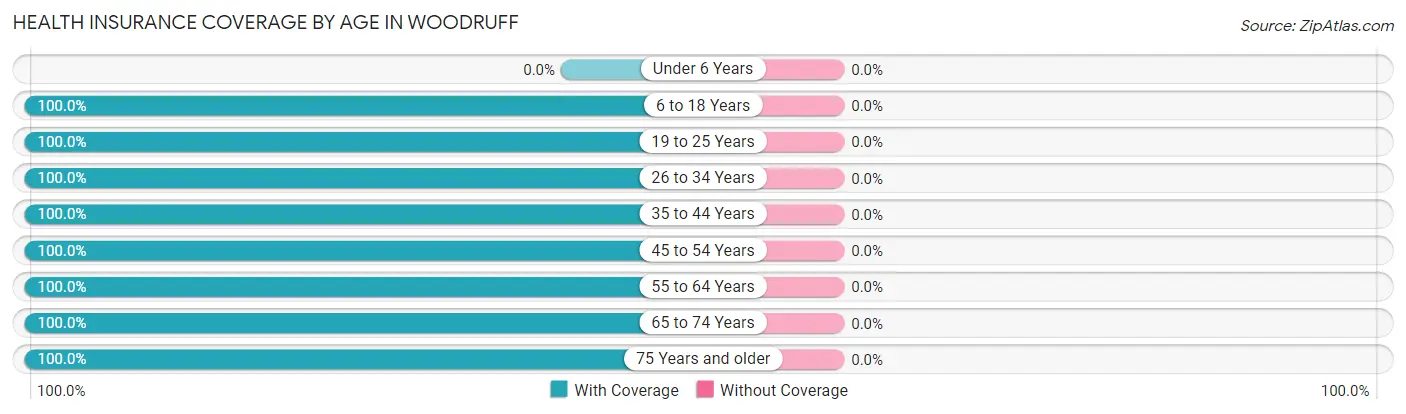
| Age Bracket | With Coverage | Without Coverage |
| Under 6 Years | 0 (0.0%) | 0 (0.0%) |
| 6 to 18 Years | 71 (100.0%) | 0 (0.0%) |
| 19 to 25 Years | 38 (100.0%) | 0 (0.0%) |
| 26 to 34 Years | 73 (100.0%) | 0 (0.0%) |
| 35 to 44 Years | 48 (100.0%) | 0 (0.0%) |
| 45 to 54 Years | 67 (100.0%) | 0 (0.0%) |
| 55 to 64 Years | 104 (100.0%) | 0 (0.0%) |
| 65 to 74 Years | 123 (100.0%) | 0 (0.0%) |
| 75 Years and older | 95 (100.0%) | 0 (0.0%) |
| Total | 619 (100.0%) | 0 (0.0%) |
Health Insurance Coverage by Citizenship Status in Woodruff
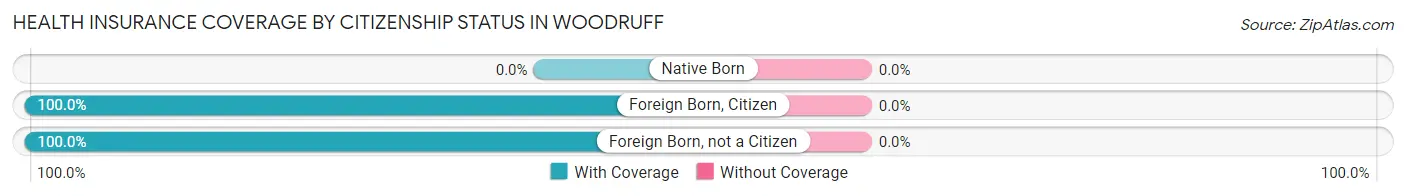
| Citizenship Status | With Coverage | Without Coverage |
| Native Born | 0 (0.0%) | 0 (0.0%) |
| Foreign Born, Citizen | 71 (100.0%) | 0 (0.0%) |
| Foreign Born, not a Citizen | 38 (100.0%) | 0 (0.0%) |
Health Insurance Coverage by Household Income in Woodruff
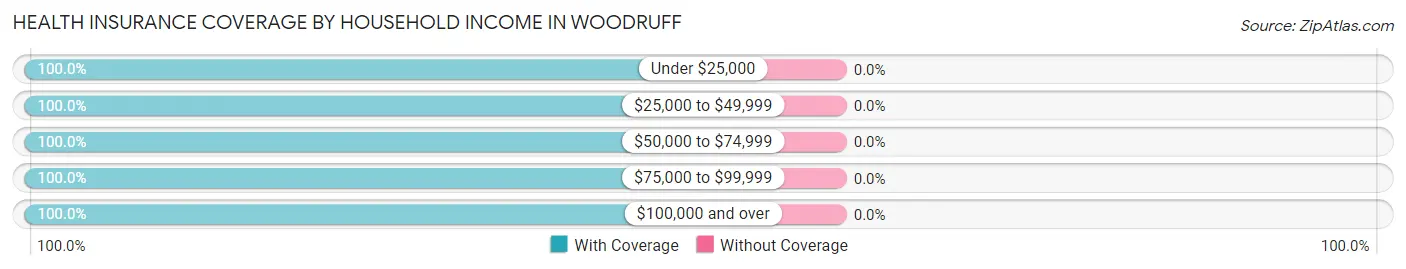
| Household Income | With Coverage | Without Coverage |
| Under $25,000 | 68 (100.0%) | 0 (0.0%) |
| $25,000 to $49,999 | 159 (100.0%) | 0 (0.0%) |
| $50,000 to $74,999 | 89 (100.0%) | 0 (0.0%) |
| $75,000 to $99,999 | 37 (100.0%) | 0 (0.0%) |
| $100,000 and over | 266 (100.0%) | 0 (0.0%) |
Public vs Private Health Insurance Coverage by Age in Woodruff
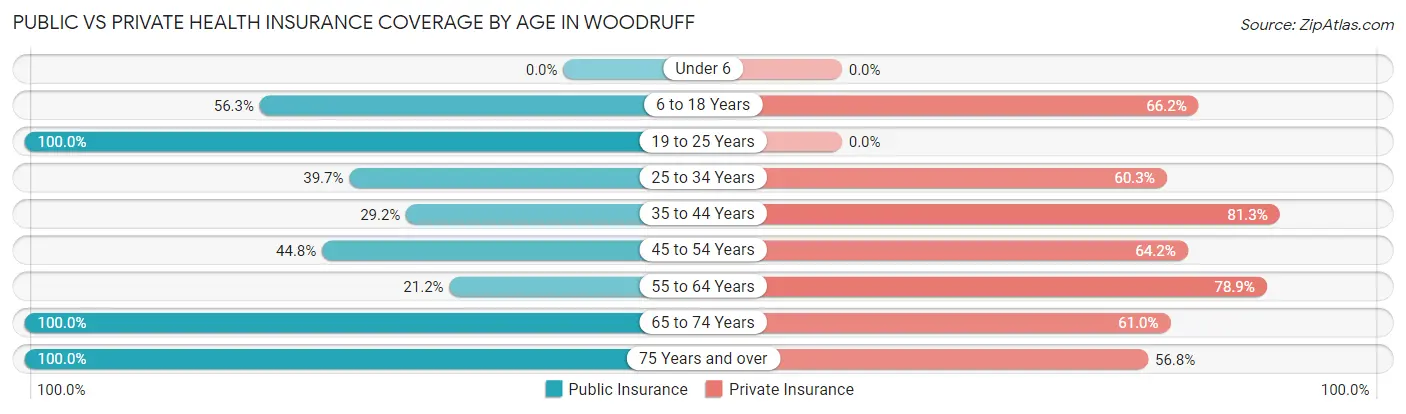
| Age Bracket | Public Insurance | Private Insurance |
| Under 6 | 0 (0.0%) | 0 (0.0%) |
| 6 to 18 Years | 40 (56.3%) | 47 (66.2%) |
| 19 to 25 Years | 38 (100.0%) | 0 (0.0%) |
| 25 to 34 Years | 29 (39.7%) | 44 (60.3%) |
| 35 to 44 Years | 14 (29.2%) | 39 (81.2%) |
| 45 to 54 Years | 30 (44.8%) | 43 (64.2%) |
| 55 to 64 Years | 22 (21.1%) | 82 (78.8%) |
| 65 to 74 Years | 123 (100.0%) | 75 (61.0%) |
| 75 Years and over | 95 (100.0%) | 54 (56.8%) |
| Total | 391 (63.2%) | 384 (62.0%) |
Disability Status by Sex by Age in Woodruff
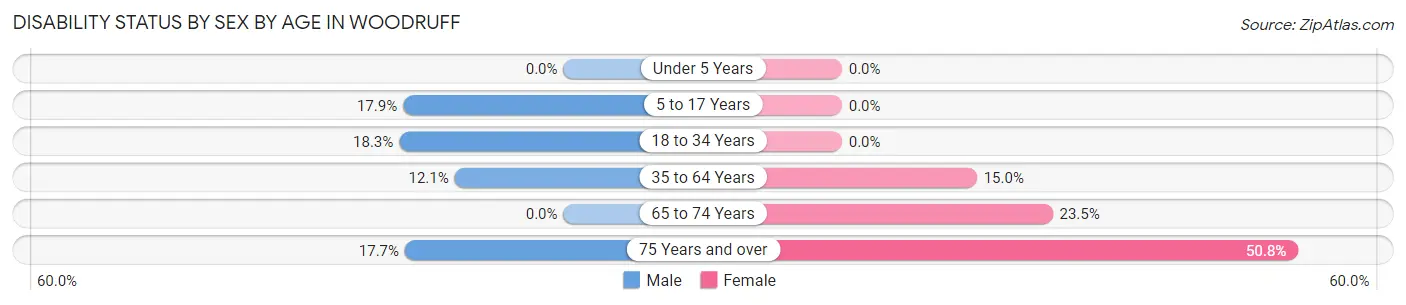
| Age Bracket | Male | Female |
| Under 5 Years | 0 (0.0%) | 0 (0.0%) |
| 5 to 17 Years | 5 (17.9%) | 0 (0.0%) |
| 18 to 34 Years | 15 (18.3%) | 0 (0.0%) |
| 35 to 64 Years | 8 (12.1%) | 23 (15.0%) |
| 65 to 74 Years | 0 (0.0%) | 23 (23.5%) |
| 75 Years and over | 6 (17.6%) | 31 (50.8%) |
Disability Class by Sex by Age in Woodruff
Disability Class: Hearing Difficulty
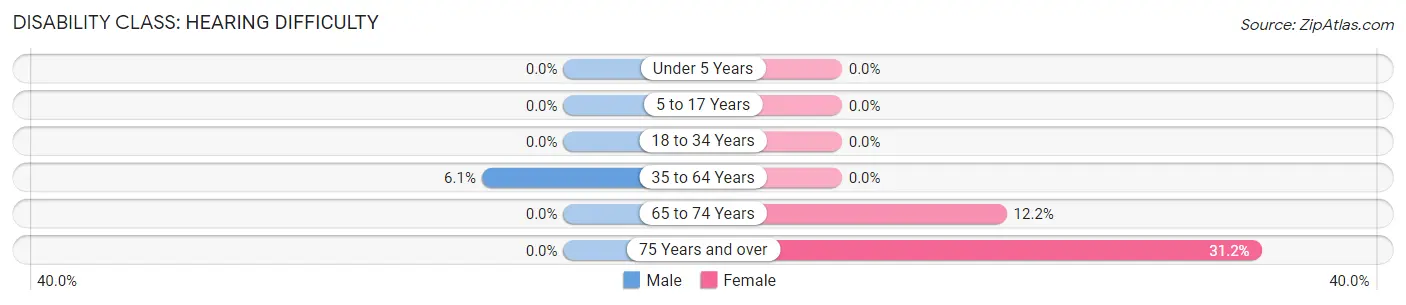
| Age Bracket | Male | Female |
| Under 5 Years | 0 (0.0%) | 0 (0.0%) |
| 5 to 17 Years | 0 (0.0%) | 0 (0.0%) |
| 18 to 34 Years | 0 (0.0%) | 0 (0.0%) |
| 35 to 64 Years | 4 (6.1%) | 0 (0.0%) |
| 65 to 74 Years | 0 (0.0%) | 12 (12.2%) |
| 75 Years and over | 0 (0.0%) | 19 (31.1%) |
Disability Class: Vision Difficulty
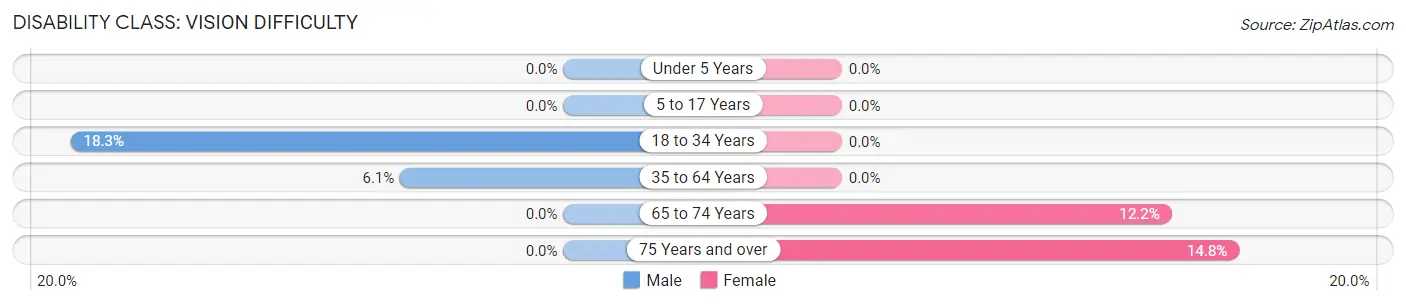
| Age Bracket | Male | Female |
| Under 5 Years | 0 (0.0%) | 0 (0.0%) |
| 5 to 17 Years | 0 (0.0%) | 0 (0.0%) |
| 18 to 34 Years | 15 (18.3%) | 0 (0.0%) |
| 35 to 64 Years | 4 (6.1%) | 0 (0.0%) |
| 65 to 74 Years | 0 (0.0%) | 12 (12.2%) |
| 75 Years and over | 0 (0.0%) | 9 (14.7%) |
Disability Class: Cognitive Difficulty
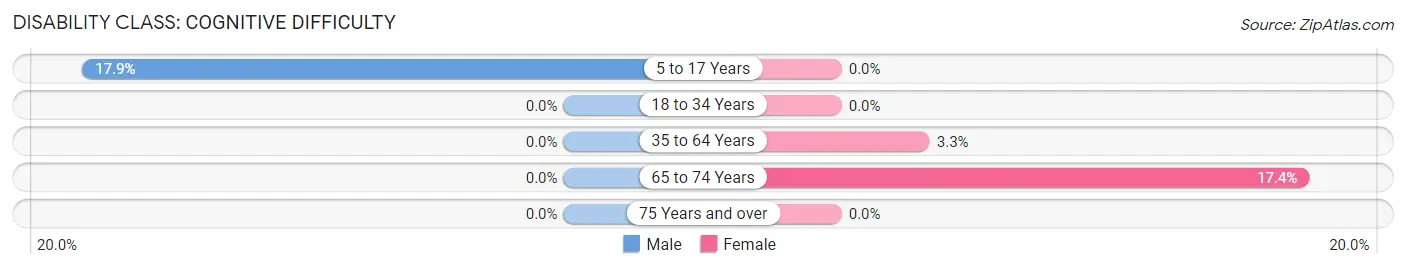
| Age Bracket | Male | Female |
| 5 to 17 Years | 5 (17.9%) | 0 (0.0%) |
| 18 to 34 Years | 0 (0.0%) | 0 (0.0%) |
| 35 to 64 Years | 0 (0.0%) | 5 (3.3%) |
| 65 to 74 Years | 0 (0.0%) | 17 (17.3%) |
| 75 Years and over | 0 (0.0%) | 0 (0.0%) |
Disability Class: Ambulatory Difficulty
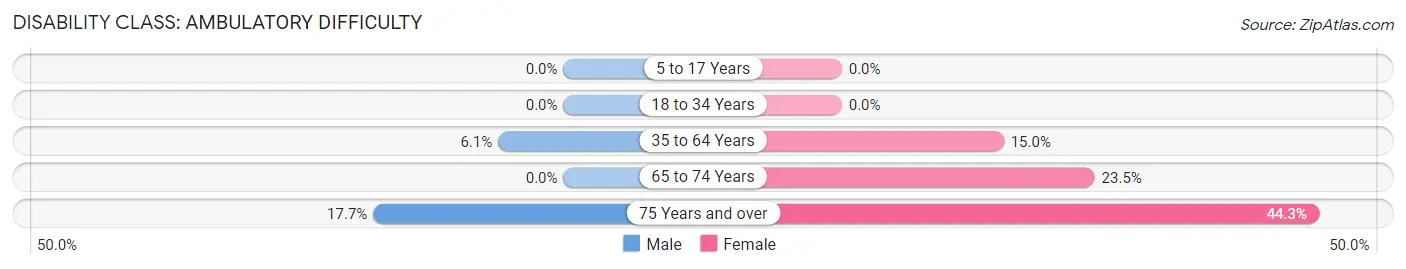
| Age Bracket | Male | Female |
| 5 to 17 Years | 0 (0.0%) | 0 (0.0%) |
| 18 to 34 Years | 0 (0.0%) | 0 (0.0%) |
| 35 to 64 Years | 4 (6.1%) | 23 (15.0%) |
| 65 to 74 Years | 0 (0.0%) | 23 (23.5%) |
| 75 Years and over | 6 (17.6%) | 27 (44.3%) |
Disability Class: Self-Care Difficulty
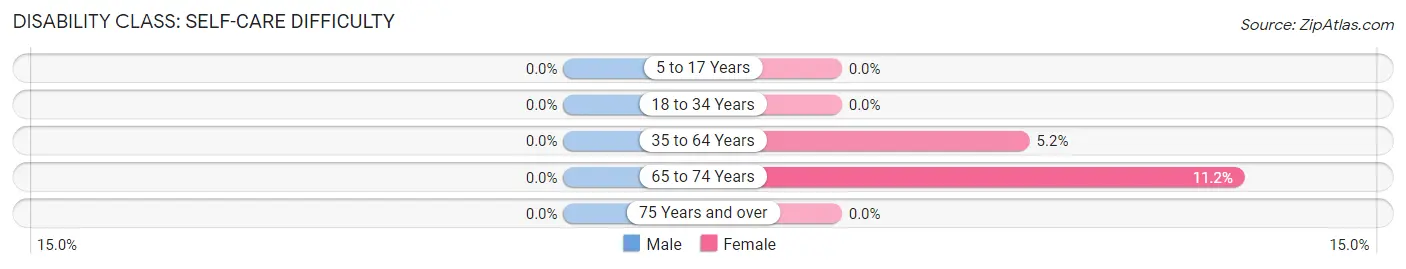
| Age Bracket | Male | Female |
| 5 to 17 Years | 0 (0.0%) | 0 (0.0%) |
| 18 to 34 Years | 0 (0.0%) | 0 (0.0%) |
| 35 to 64 Years | 0 (0.0%) | 8 (5.2%) |
| 65 to 74 Years | 0 (0.0%) | 11 (11.2%) |
| 75 Years and over | 0 (0.0%) | 0 (0.0%) |
Technology Access in Woodruff
Computing Device Access in Woodruff
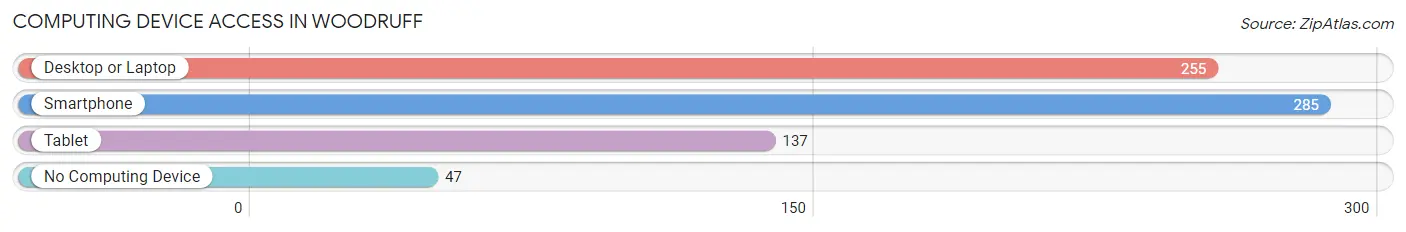
| Device Type | # Households | % Households |
| Desktop or Laptop | 255 | 68.7% |
| Smartphone | 285 | 76.8% |
| Tablet | 137 | 36.9% |
| No Computing Device | 47 | 12.7% |
| Total | 371 | 100.0% |
Internet Access in Woodruff
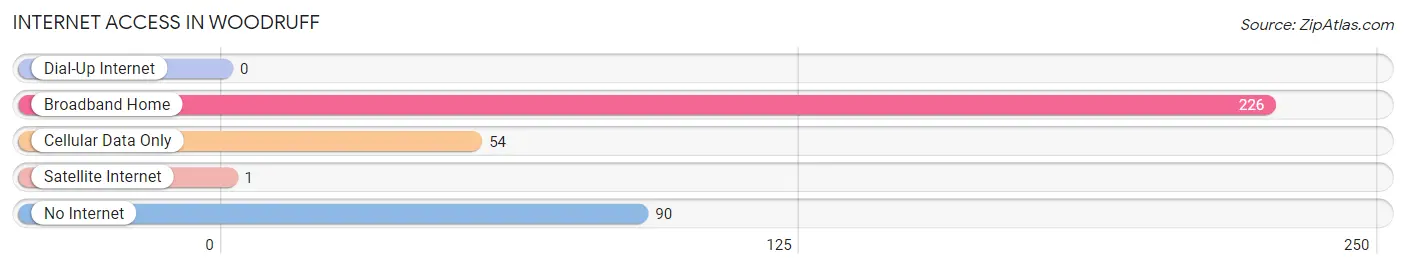
| Internet Type | # Households | % Households |
| Dial-Up Internet | 0 | 0.0% |
| Broadband Home | 226 | 60.9% |
| Cellular Data Only | 54 | 14.6% |
| Satellite Internet | 1 | 0.3% |
| No Internet | 90 | 24.3% |
| Total | 371 | 100.0% |
Woodruff Summary
History
The area now known as Woodruff, Wisconsin was first inhabited by the Ojibwe people, who were part of the Algonquin nation. The Ojibwe were a nomadic people who moved around the area, hunting and fishing. They were eventually pushed out of the area by European settlers in the late 1800s.
The first permanent settlers in the area were German immigrants who arrived in the late 1800s. They established farms and businesses, and the area began to grow. In 1891, the town of Woodruff was officially incorporated.
The town was named after William Woodruff, a prominent local businessman and landowner. He was also the first mayor of the town.
The town grew steadily over the next few decades, and by the mid-1900s, it had become a popular tourist destination. The town was known for its beautiful lakes and forests, and it was a popular spot for fishing, camping, and other outdoor activities.
In the late 1900s, the town began to experience a population boom. This was due to the influx of retirees and other people looking for a quiet place to live. The population of Woodruff has continued to grow since then, and it is now home to over 4,000 people.
Geography
Woodruff is located in northern Wisconsin, in the heart of the Northwoods. It is situated on the shores of Lake Minocqua, which is part of the Wisconsin River system. The town is surrounded by forests and lakes, and it is a popular spot for outdoor activities such as fishing, camping, and hiking.
The town is located about 30 miles north of the city of Minocqua, and it is about 90 miles northwest of the state capital of Madison. The nearest major airport is in Rhinelander, which is about 40 miles away.
Economy
The economy of Woodruff is largely based on tourism and outdoor recreation. The town is a popular destination for fishing, camping, and other outdoor activities. There are also several resorts and lodges in the area that cater to tourists.
In addition to tourism, the town is also home to several small businesses, including restaurants, shops, and other services. The town is also home to a few manufacturing companies, which provide jobs for local residents.
Demographics
As of the 2010 census, the population of Woodruff was 4,093. The racial makeup of the town was 97.3% White, 0.3% African American, 0.3% Native American, 0.4% Asian, 0.1% Pacific Islander, 0.7% from other races, and 0.9% from two or more races. Hispanic or Latino of any race were 1.7% of the population.
The median household income in Woodruff was $41,944, and the median family income was $50,917. The per capita income was $21,945. About 8.3% of families and 11.2% of the population were below the poverty line, including 15.2% of those under age 18 and 6.2% of those age 65 or over.
Common Questions
What is Per Capita Income in Woodruff?
Per Capita income in Woodruff is $45,386.
What is the Median Family Income in Woodruff?
Median Family Income in Woodruff is $137,871.
What is the Median Household income in Woodruff?
Median Household Income in Woodruff is $63,894.
What is Income or Wage Gap in Woodruff?
Income or Wage Gap in Woodruff is 0.1%.
Women in Woodruff earn 99.9 cents for every dollar earned by a man.
What is Inequality or Gini Index in Woodruff?
Inequality or Gini Index in Woodruff is 0.42.
What is the Total Population of Woodruff?
Total Population of Woodruff is 628.
What is the Total Male Population of Woodruff?
Total Male Population of Woodruff is 237.
What is the Total Female Population of Woodruff?
Total Female Population of Woodruff is 391.
What is the Ratio of Males per 100 Females in Woodruff?
There are 60.61 Males per 100 Females in Woodruff.
What is the Ratio of Females per 100 Males in Woodruff?
There are 164.98 Females per 100 Males in Woodruff.
What is the Median Population Age in Woodruff?
Median Population Age in Woodruff is 57.5 Years.
What is the Average Family Size in Woodruff
Average Family Size in Woodruff is 2.4 People.
What is the Average Household Size in Woodruff
Average Household Size in Woodruff is 1.7 People.
How Large is the Labor Force in Woodruff?
There are 335 People in the Labor Forcein in Woodruff.
What is the Percentage of People in the Labor Force in Woodruff?
58.2% of People are in the Labor Force in Woodruff.