Wilson, WI Map & Demographics
Wilson Map
Wilson Overview
$35,758
PER CAPITA INCOME
$86,250
AVG FAMILY INCOME
$75,000
AVG HOUSEHOLD INCOME
29.6%
WAGE / INCOME GAP [ % ]
70.4¢/ $1
WAGE / INCOME GAP [ $ ]
0.38
INEQUALITY / GINI INDEX
224
TOTAL POPULATION
113
MALE POPULATION
111
FEMALE POPULATION
101.80
MALES / 100 FEMALES
98.23
FEMALES / 100 MALES
39.3
MEDIAN AGE
3.2
AVG FAMILY SIZE
2.6
AVG HOUSEHOLD SIZE
139
LABOR FORCE [ PEOPLE ]
73.2%
PERCENT IN LABOR FORCE
10.8%
UNEMPLOYMENT RATE
Wilson Zip Codes
Wilson Area Codes
Income in Wilson
Income Overview in Wilson
Per Capita Income in Wilson is $35,758, while median incomes of families and households are $86,250 and $75,000 respectively.
| Characteristic | Number | Measure |
| Per Capita Income | 224 | $35,758 |
| Median Family Income | 58 | $86,250 |
| Mean Family Income | 58 | $106,157 |
| Median Household Income | 86 | $75,000 |
| Mean Household Income | 86 | $90,008 |
| Income Deficit | 58 | $0 |
| Wage / Income Gap (%) | 224 | 29.65% |
| Wage / Income Gap ($) | 224 | 70.35¢ per $1 |
| Gini / Inequality Index | 224 | 0.38 |
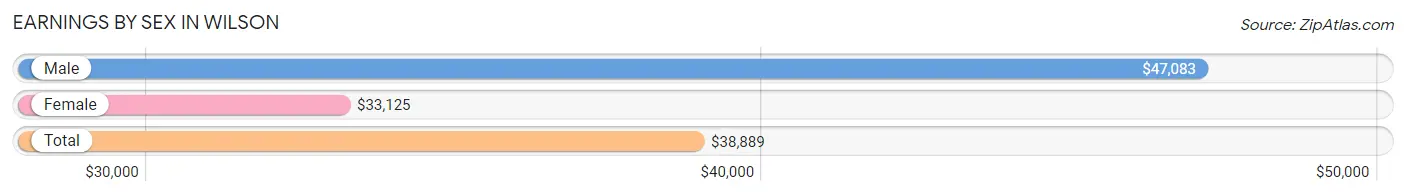
Earnings by Sex in Wilson
Average Earnings in Wilson are $38,889, $47,083 for men and $33,125 for women, a difference of 29.6%.
| Sex | Number | Average Earnings |
| Male | 76 (54.3%) | $47,083 |
| Female | 64 (45.7%) | $33,125 |
| Total | 140 (100.0%) | $38,889 |
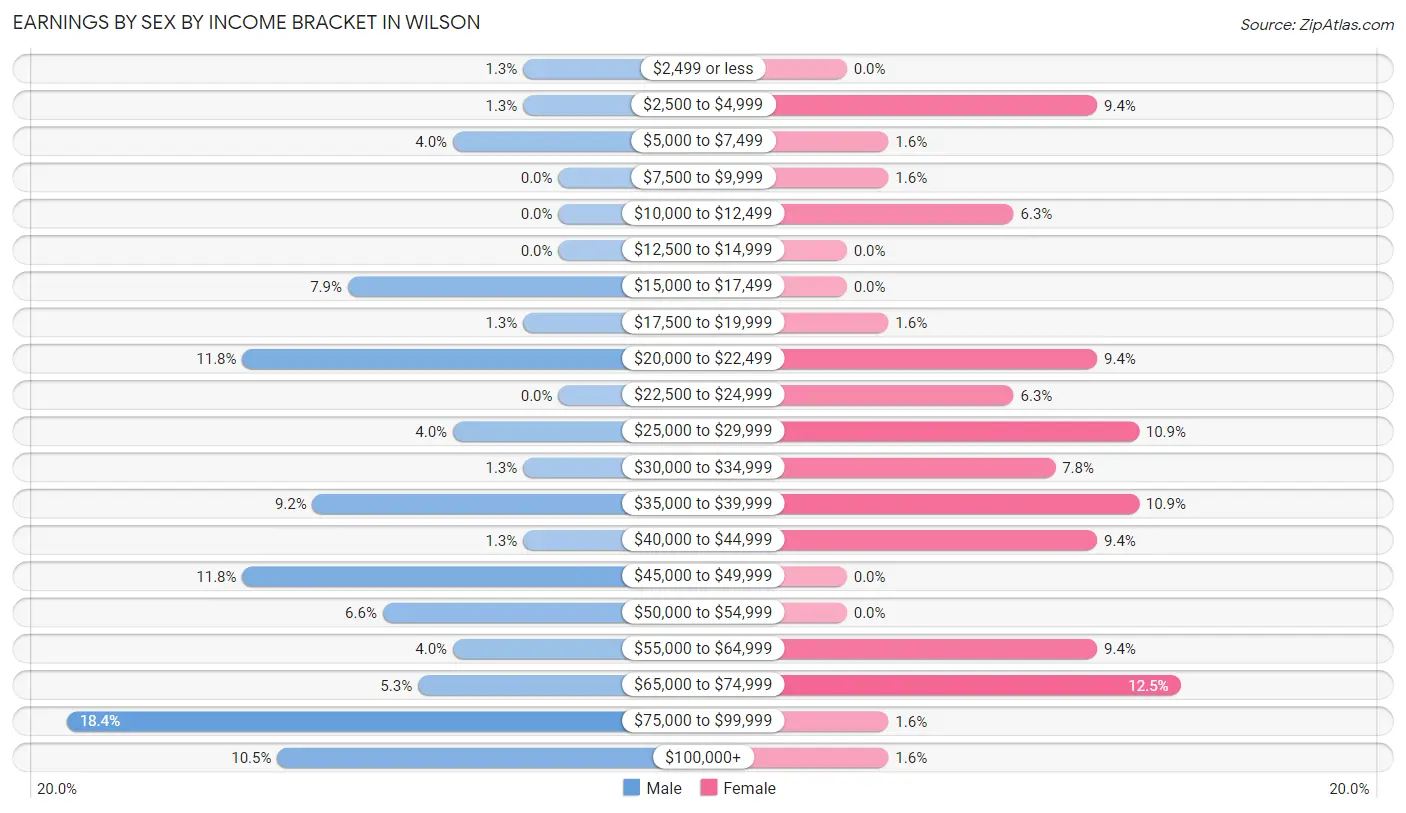
Earnings by Sex by Income Bracket in Wilson
The most common earnings brackets in Wilson are $75,000 to $99,999 for men (14 | 18.4%) and $65,000 to $74,999 for women (8 | 12.5%).
| Income | Male | Female |
| $2,499 or less | 1 (1.3%) | 0 (0.0%) |
| $2,500 to $4,999 | 1 (1.3%) | 6 (9.4%) |
| $5,000 to $7,499 | 3 (4.0%) | 1 (1.6%) |
| $7,500 to $9,999 | 0 (0.0%) | 1 (1.6%) |
| $10,000 to $12,499 | 0 (0.0%) | 4 (6.2%) |
| $12,500 to $14,999 | 0 (0.0%) | 0 (0.0%) |
| $15,000 to $17,499 | 6 (7.9%) | 0 (0.0%) |
| $17,500 to $19,999 | 1 (1.3%) | 1 (1.6%) |
| $20,000 to $22,499 | 9 (11.8%) | 6 (9.4%) |
| $22,500 to $24,999 | 0 (0.0%) | 4 (6.2%) |
| $25,000 to $29,999 | 3 (4.0%) | 7 (10.9%) |
| $30,000 to $34,999 | 1 (1.3%) | 5 (7.8%) |
| $35,000 to $39,999 | 7 (9.2%) | 7 (10.9%) |
| $40,000 to $44,999 | 1 (1.3%) | 6 (9.4%) |
| $45,000 to $49,999 | 9 (11.8%) | 0 (0.0%) |
| $50,000 to $54,999 | 5 (6.6%) | 0 (0.0%) |
| $55,000 to $64,999 | 3 (4.0%) | 6 (9.4%) |
| $65,000 to $74,999 | 4 (5.3%) | 8 (12.5%) |
| $75,000 to $99,999 | 14 (18.4%) | 1 (1.6%) |
| $100,000+ | 8 (10.5%) | 1 (1.6%) |
| Total | 76 (100.0%) | 64 (100.0%) |
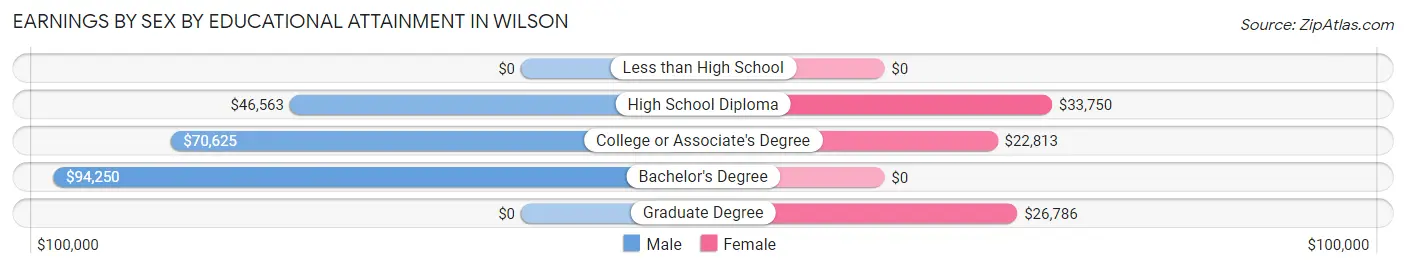
Earnings by Sex by Educational Attainment in Wilson
Average earnings in Wilson are $51,250 for men and $33,125 for women, a difference of 35.4%. Men with an educational attainment of bachelor's degree enjoy the highest average annual earnings of $94,250, while those with high school diploma education earn the least with $46,563. Women with an educational attainment of high school diploma earn the most with the average annual earnings of $33,750, while those with college or associate's degree education have the smallest earnings of $22,813.
| Educational Attainment | Male Income | Female Income |
| Less than High School | - | - |
| High School Diploma | $46,563 | $33,750 |
| College or Associate's Degree | $70,625 | $22,813 |
| Bachelor's Degree | $94,250 | $0 |
| Graduate Degree | - | - |
| Total | $51,250 | $33,125 |
Family Income in Wilson
Family Income Brackets in Wilson
According to the Wilson family income data, there are 15 families falling into the $35,000 to $49,999 income range, which is the most common income bracket and makes up 25.9% of all families.
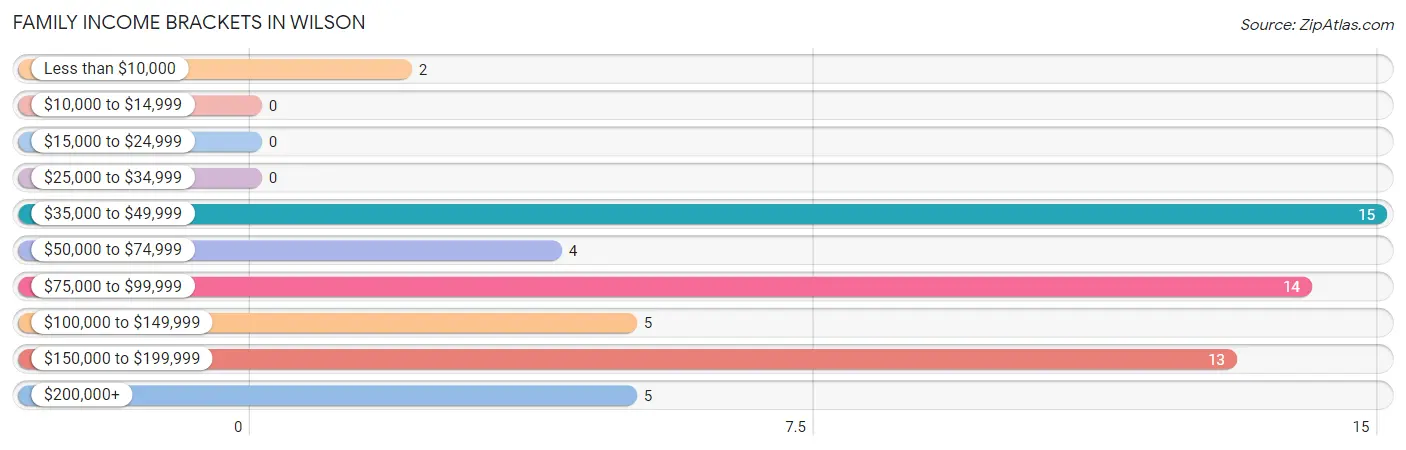
| Income Bracket | # Families | % Families |
| Less than $10,000 | 2 | 3.4% |
| $10,000 to $14,999 | 0 | 0.0% |
| $15,000 to $24,999 | 0 | 0.0% |
| $25,000 to $34,999 | 0 | 0.0% |
| $35,000 to $49,999 | 15 | 25.9% |
| $50,000 to $74,999 | 4 | 6.9% |
| $75,000 to $99,999 | 14 | 24.1% |
| $100,000 to $149,999 | 5 | 8.6% |
| $150,000 to $199,999 | 13 | 22.4% |
| $200,000+ | 5 | 8.6% |
Family Income by Famaliy Size in Wilson
2-person families (33 | 56.9%) account for the highest median family income in Wilson with $78,438 per family, while 2-person families (33 | 56.9%) have the highest median income of $39,219 per family member.
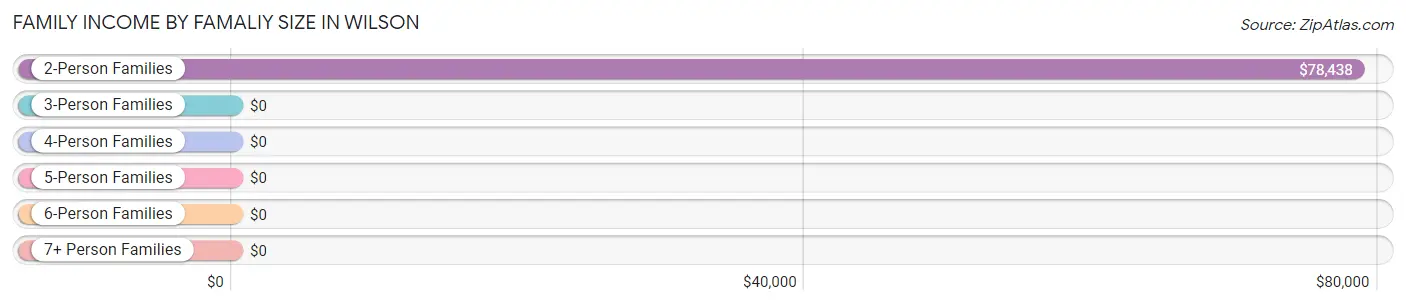
| Income Bracket | # Families | Median Income |
| 2-Person Families | 33 (56.9%) | $78,438 |
| 3-Person Families | 6 (10.3%) | $0 |
| 4-Person Families | 10 (17.2%) | $0 |
| 5-Person Families | 6 (10.3%) | $0 |
| 6-Person Families | 2 (3.5%) | $0 |
| 7+ Person Families | 1 (1.7%) | $0 |
| Total | 58 (100.0%) | $86,250 |
Family Income by Number of Earners in Wilson
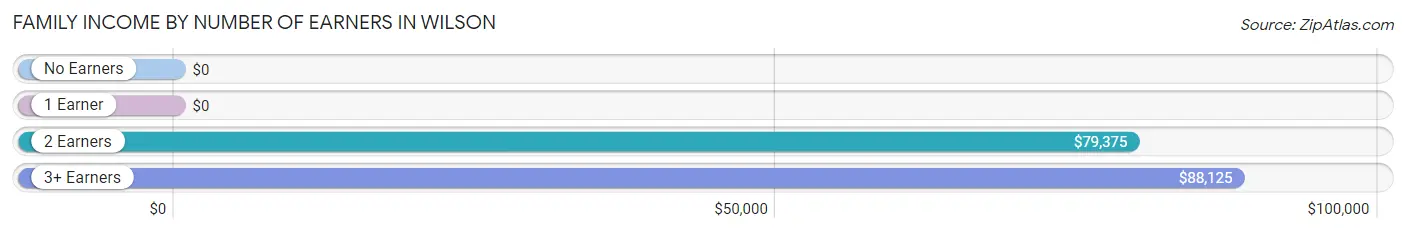
| Number of Earners | # Families | Median Income |
| No Earners | 2 (3.5%) | $0 |
| 1 Earner | 10 (17.2%) | $0 |
| 2 Earners | 39 (67.2%) | $79,375 |
| 3+ Earners | 7 (12.1%) | $88,125 |
| Total | 58 (100.0%) | $86,250 |
Household Income in Wilson
Household Income Brackets in Wilson
With 23 households falling in the category, the $35,000 to $49,999 income range is the most frequent in Wilson, accounting for 26.7% of all households. In contrast, only 2 households (2.3%) fall into the $25,000 to $34,999 income bracket, making it the least populous group.
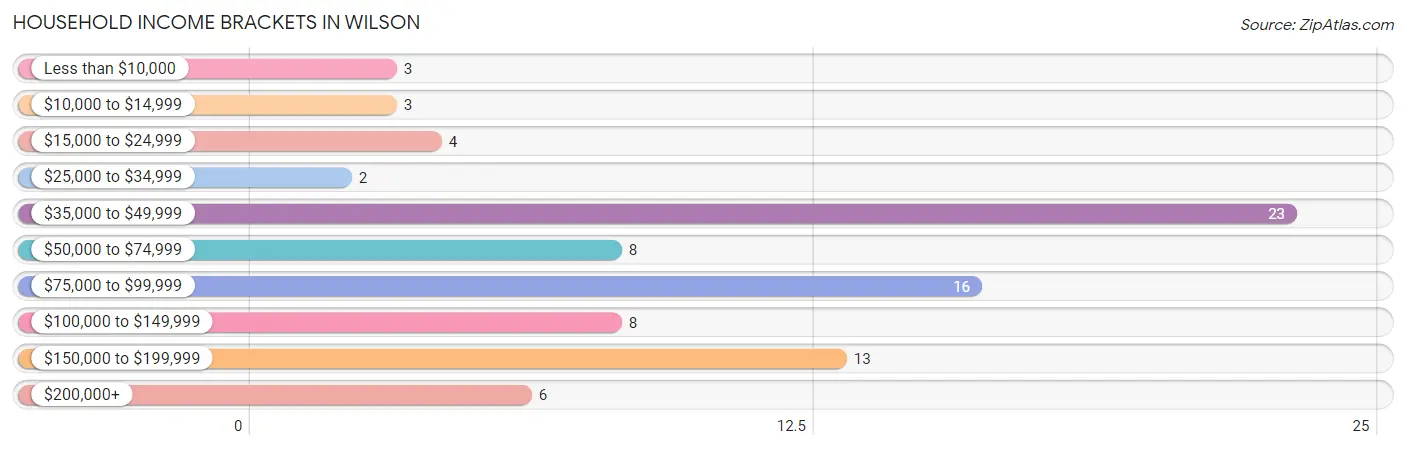
| Income Bracket | # Households | % Households |
| Less than $10,000 | 3 | 3.5% |
| $10,000 to $14,999 | 3 | 3.5% |
| $15,000 to $24,999 | 4 | 4.7% |
| $25,000 to $34,999 | 2 | 2.3% |
| $35,000 to $49,999 | 23 | 26.7% |
| $50,000 to $74,999 | 8 | 9.3% |
| $75,000 to $99,999 | 16 | 18.6% |
| $100,000 to $149,999 | 8 | 9.3% |
| $150,000 to $199,999 | 13 | 15.1% |
| $200,000+ | 6 | 7.0% |
Household Income by Householder Age in Wilson
The median household income in Wilson is $75,000, with the highest median household income of $99,375 found in the 25 to 44 years age bracket for the primary householder. A total of 29 households (33.7%) fall into this category. Meanwhile, the 15 to 24 years age bracket for the primary householder has the lowest median household income of $0, with 2 households (2.3%) in this group.
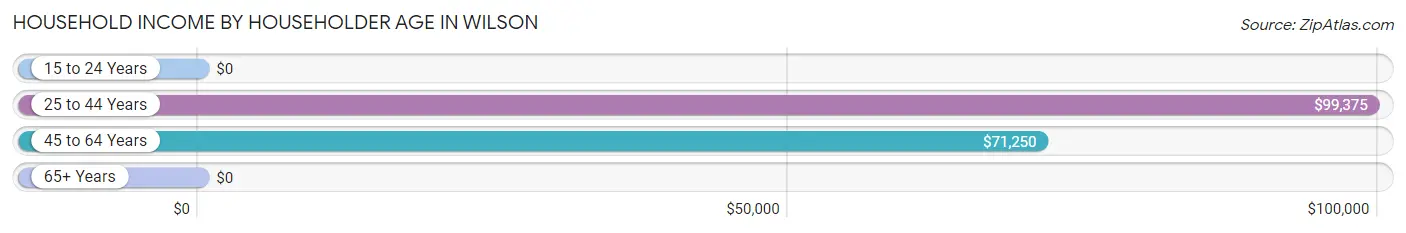
| Income Bracket | # Households | Median Income |
| 15 to 24 Years | 2 (2.3%) | $0 |
| 25 to 44 Years | 29 (33.7%) | $99,375 |
| 45 to 64 Years | 41 (47.7%) | $71,250 |
| 65+ Years | 14 (16.3%) | $0 |
| Total | 86 (100.0%) | $75,000 |
Poverty in Wilson
Income Below Poverty by Sex and Age in Wilson
With 8.9% poverty level for males and 1.8% for females among the residents of Wilson, 65 to 74 year old males and 35 to 44 year old females are the most vulnerable to poverty, with 3 males (75.0%) and 1 females (8.3%) in their respective age groups living below the poverty level.
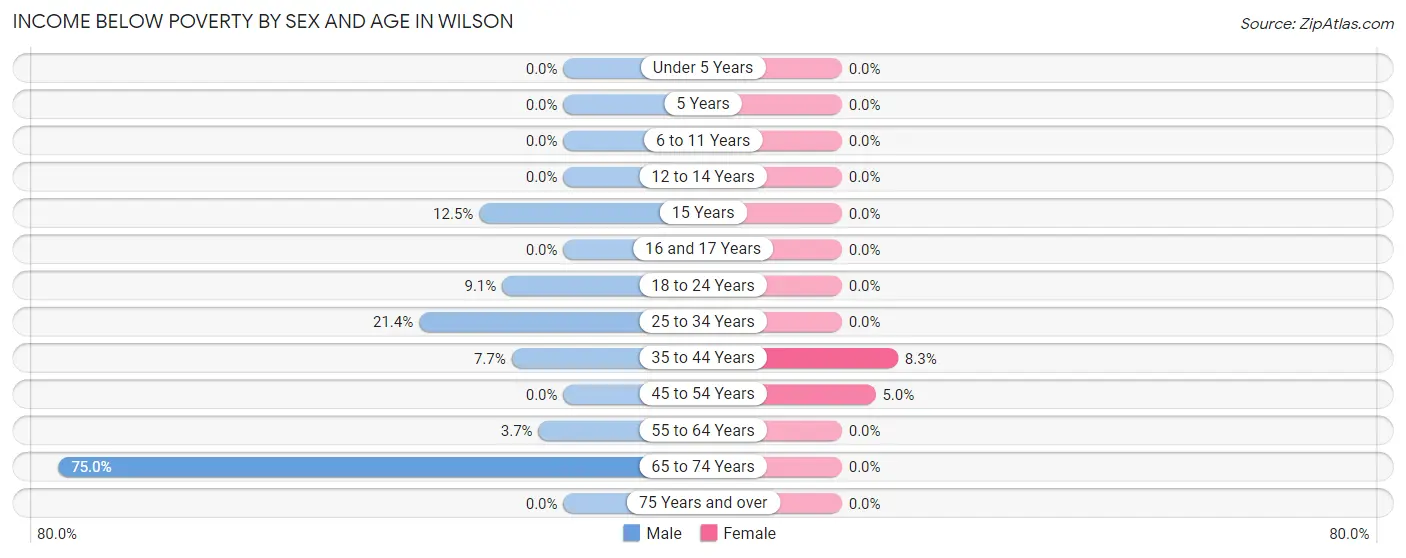
| Age Bracket | Male | Female |
| Under 5 Years | 0 (0.0%) | 0 (0.0%) |
| 5 Years | 0 (0.0%) | 0 (0.0%) |
| 6 to 11 Years | 0 (0.0%) | 0 (0.0%) |
| 12 to 14 Years | 0 (0.0%) | 0 (0.0%) |
| 15 Years | 1 (12.5%) | 0 (0.0%) |
| 16 and 17 Years | 0 (0.0%) | 0 (0.0%) |
| 18 to 24 Years | 1 (9.1%) | 0 (0.0%) |
| 25 to 34 Years | 3 (21.4%) | 0 (0.0%) |
| 35 to 44 Years | 1 (7.7%) | 1 (8.3%) |
| 45 to 54 Years | 0 (0.0%) | 1 (5.0%) |
| 55 to 64 Years | 1 (3.7%) | 0 (0.0%) |
| 65 to 74 Years | 3 (75.0%) | 0 (0.0%) |
| 75 Years and over | 0 (0.0%) | 0 (0.0%) |
| Total | 10 (8.9%) | 2 (1.8%) |
Income Above Poverty by Sex and Age in Wilson
According to the poverty statistics in Wilson, males aged under 5 years and females aged under 5 years are the age groups that are most secure financially, with 100.0% of males and 100.0% of females in these age groups living above the poverty line.
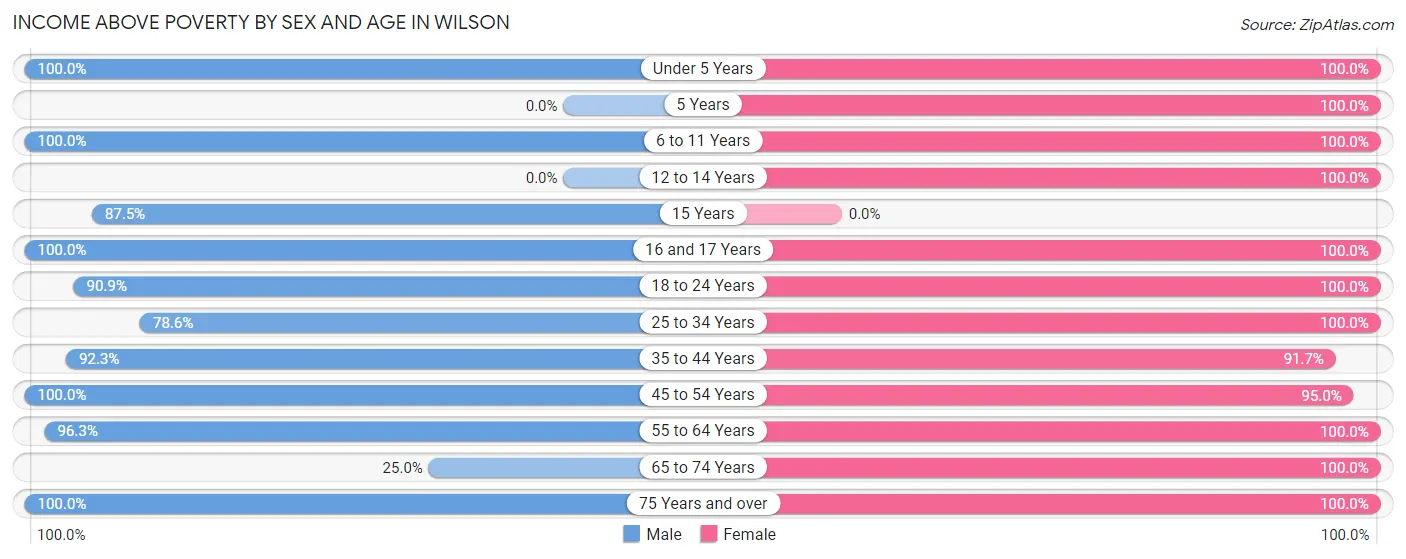
| Age Bracket | Male | Female |
| Under 5 Years | 2 (100.0%) | 7 (100.0%) |
| 5 Years | 0 (0.0%) | 5 (100.0%) |
| 6 to 11 Years | 7 (100.0%) | 1 (100.0%) |
| 12 to 14 Years | 0 (0.0%) | 2 (100.0%) |
| 15 Years | 7 (87.5%) | 0 (0.0%) |
| 16 and 17 Years | 3 (100.0%) | 6 (100.0%) |
| 18 to 24 Years | 10 (90.9%) | 10 (100.0%) |
| 25 to 34 Years | 11 (78.6%) | 20 (100.0%) |
| 35 to 44 Years | 12 (92.3%) | 11 (91.7%) |
| 45 to 54 Years | 18 (100.0%) | 19 (95.0%) |
| 55 to 64 Years | 26 (96.3%) | 14 (100.0%) |
| 65 to 74 Years | 1 (25.0%) | 8 (100.0%) |
| 75 Years and over | 5 (100.0%) | 5 (100.0%) |
| Total | 102 (91.1%) | 108 (98.2%) |
Income Below Poverty Among Married-Couple Families in Wilson
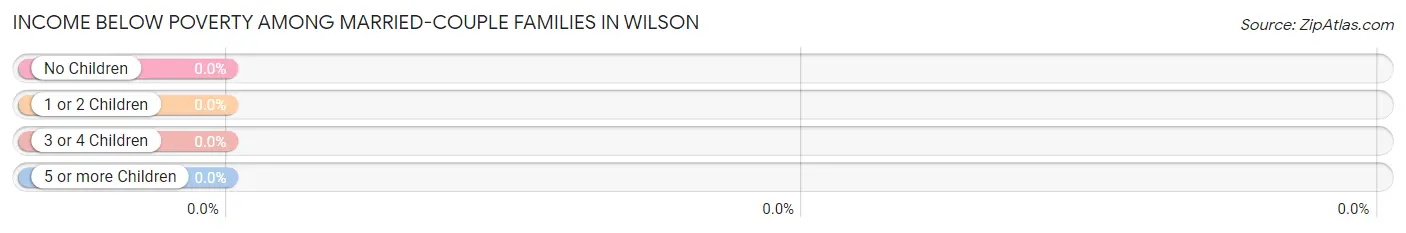
| Children | Above Poverty | Below Poverty |
| No Children | 30 (100.0%) | 0 (0.0%) |
| 1 or 2 Children | 17 (100.0%) | 0 (0.0%) |
| 3 or 4 Children | 3 (100.0%) | 0 (0.0%) |
| 5 or more Children | 1 (100.0%) | 0 (0.0%) |
| Total | 51 (100.0%) | 0 (0.0%) |
Income Below Poverty Among Single-Parent Households in Wilson
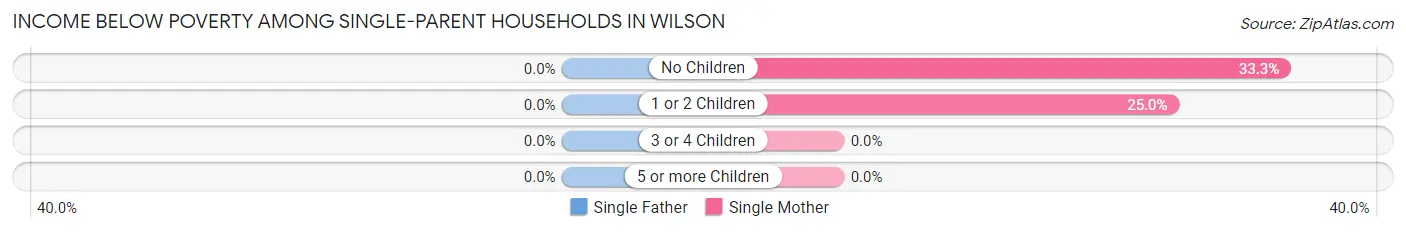
| Children | Single Father | Single Mother |
| No Children | 0 (0.0%) | 1 (33.3%) |
| 1 or 2 Children | 0 (0.0%) | 1 (25.0%) |
| 3 or 4 Children | 0 (0.0%) | 0 (0.0%) |
| 5 or more Children | 0 (0.0%) | 0 (0.0%) |
| Total | 0 (0.0%) | 2 (28.6%) |
Income Below Poverty Among Married-Couple vs Single-Parent Households in Wilson
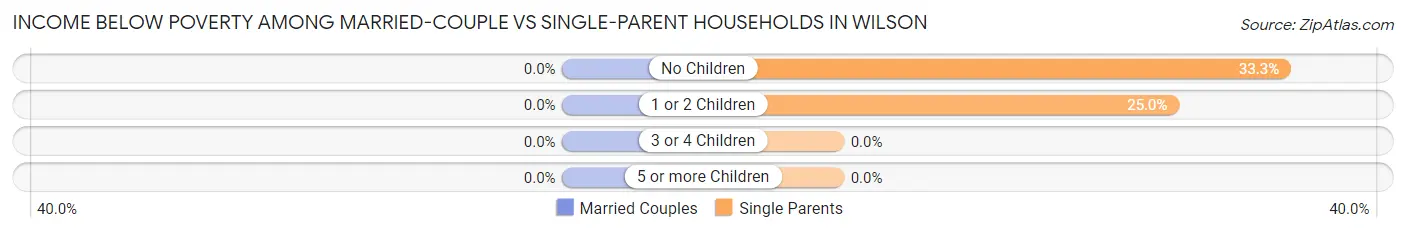
| Children | Married-Couple Families | Single-Parent Households |
| No Children | 0 (0.0%) | 1 (33.3%) |
| 1 or 2 Children | 0 (0.0%) | 1 (25.0%) |
| 3 or 4 Children | 0 (0.0%) | 0 (0.0%) |
| 5 or more Children | 0 (0.0%) | 0 (0.0%) |
| Total | 0 (0.0%) | 2 (28.6%) |
Race in Wilson
The most populous races in Wilson are White / Caucasian (218 | 97.3%), Two or more Races (5 | 2.2%), and Native / Alaskan (1 | 0.4%).
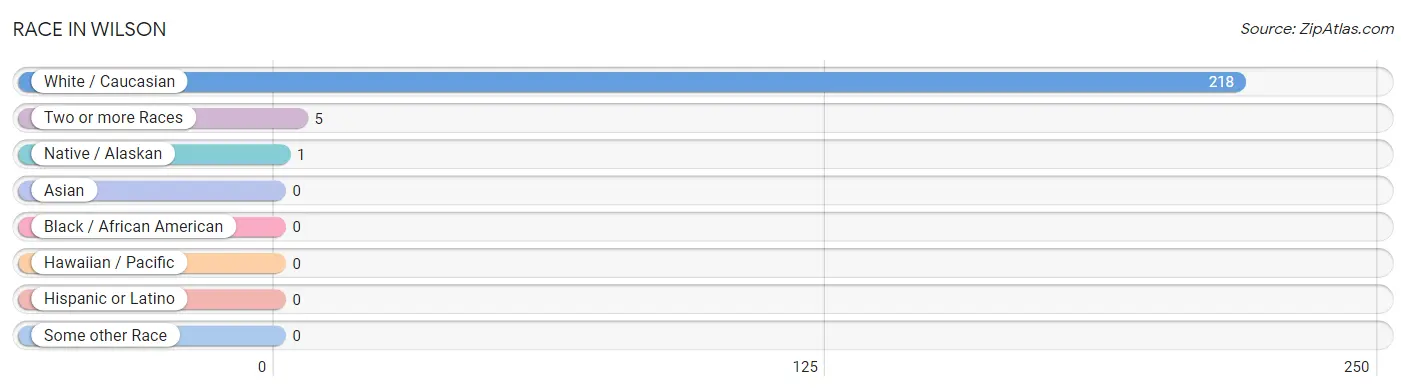
| Race | # Population | % Population |
| Asian | 0 | 0.0% |
| Black / African American | 0 | 0.0% |
| Hawaiian / Pacific | 0 | 0.0% |
| Hispanic or Latino | 0 | 0.0% |
| Native / Alaskan | 1 | 0.4% |
| White / Caucasian | 218 | 97.3% |
| Two or more Races | 5 | 2.2% |
| Some other Race | 0 | 0.0% |
| Total | 224 | 100.0% |
Ancestry in Wilson
The most populous ancestries reported in Wilson are German (104 | 46.4%), Norwegian (52 | 23.2%), American (30 | 13.4%), Irish (23 | 10.3%), and Swedish (14 | 6.2%), together accounting for 99.6% of all Wilson residents.
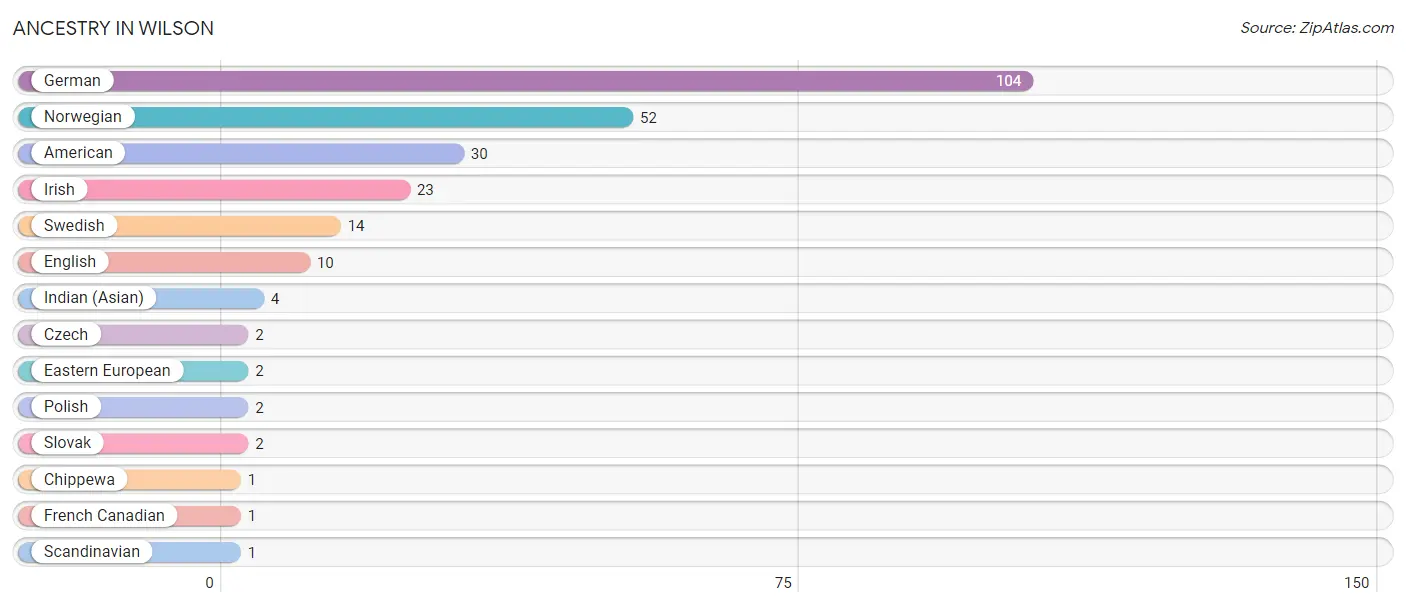
| Ancestry | # Population | % Population |
| American | 30 | 13.4% |
| Chippewa | 1 | 0.4% |
| Czech | 2 | 0.9% |
| Eastern European | 2 | 0.9% |
| English | 10 | 4.5% |
| French Canadian | 1 | 0.4% |
| German | 104 | 46.4% |
| Indian (Asian) | 4 | 1.8% |
| Irish | 23 | 10.3% |
| Norwegian | 52 | 23.2% |
| Polish | 2 | 0.9% |
| Scandinavian | 1 | 0.4% |
| Slovak | 2 | 0.9% |
| Swedish | 14 | 6.2% | View All 14 Rows |
Immigrants in Wilson

| Immigration Origin | # Population | % Population | View All 0 Rows |
Sex and Age in Wilson
Sex and Age in Wilson
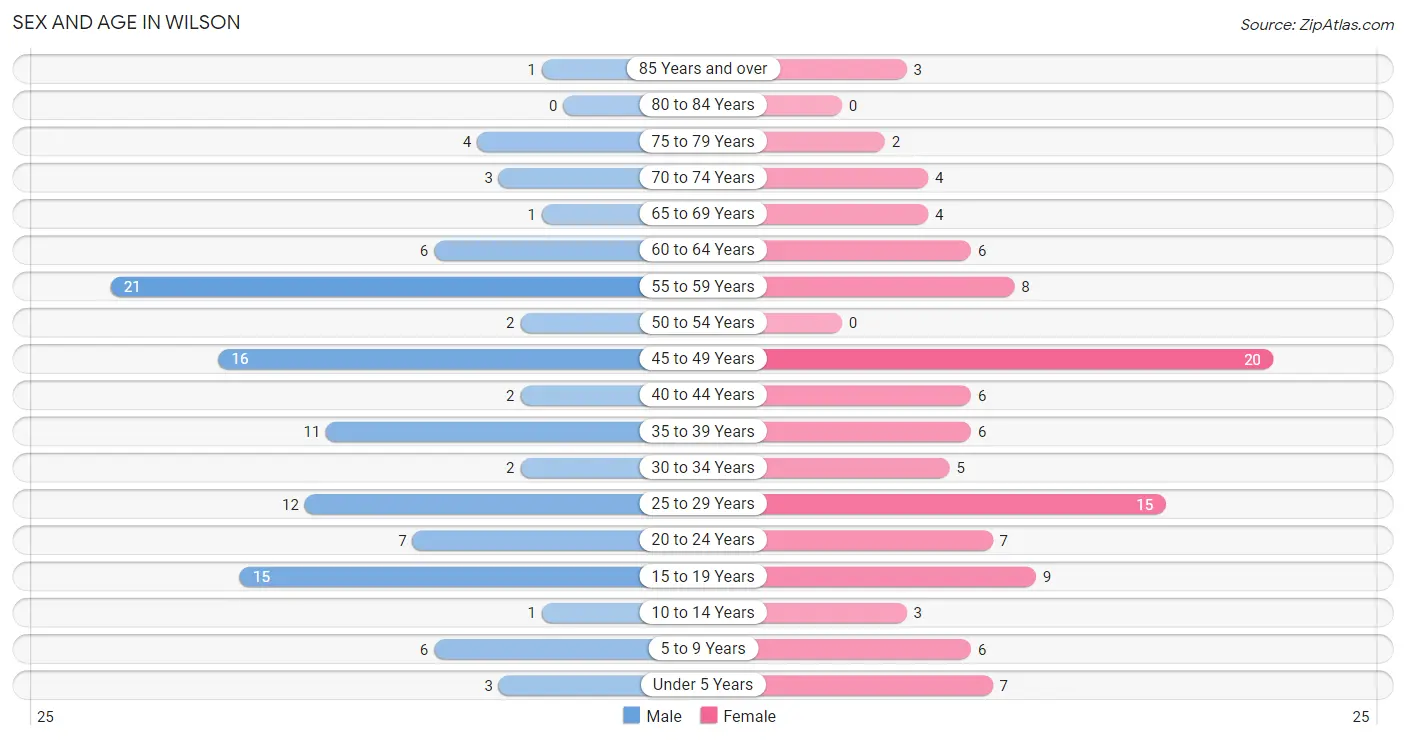
The most populous age groups in Wilson are 55 to 59 Years (21 | 18.6%) for men and 45 to 49 Years (20 | 18.0%) for women.
| Age Bracket | Male | Female |
| Under 5 Years | 3 (2.6%) | 7 (6.3%) |
| 5 to 9 Years | 6 (5.3%) | 6 (5.4%) |
| 10 to 14 Years | 1 (0.9%) | 3 (2.7%) |
| 15 to 19 Years | 15 (13.3%) | 9 (8.1%) |
| 20 to 24 Years | 7 (6.2%) | 7 (6.3%) |
| 25 to 29 Years | 12 (10.6%) | 15 (13.5%) |
| 30 to 34 Years | 2 (1.8%) | 5 (4.5%) |
| 35 to 39 Years | 11 (9.7%) | 6 (5.4%) |
| 40 to 44 Years | 2 (1.8%) | 6 (5.4%) |
| 45 to 49 Years | 16 (14.2%) | 20 (18.0%) |
| 50 to 54 Years | 2 (1.8%) | 0 (0.0%) |
| 55 to 59 Years | 21 (18.6%) | 8 (7.2%) |
| 60 to 64 Years | 6 (5.3%) | 6 (5.4%) |
| 65 to 69 Years | 1 (0.9%) | 4 (3.6%) |
| 70 to 74 Years | 3 (2.6%) | 4 (3.6%) |
| 75 to 79 Years | 4 (3.5%) | 2 (1.8%) |
| 80 to 84 Years | 0 (0.0%) | 0 (0.0%) |
| 85 Years and over | 1 (0.9%) | 3 (2.7%) |
| Total | 113 (100.0%) | 111 (100.0%) |
Families and Households in Wilson
Median Family Size in Wilson
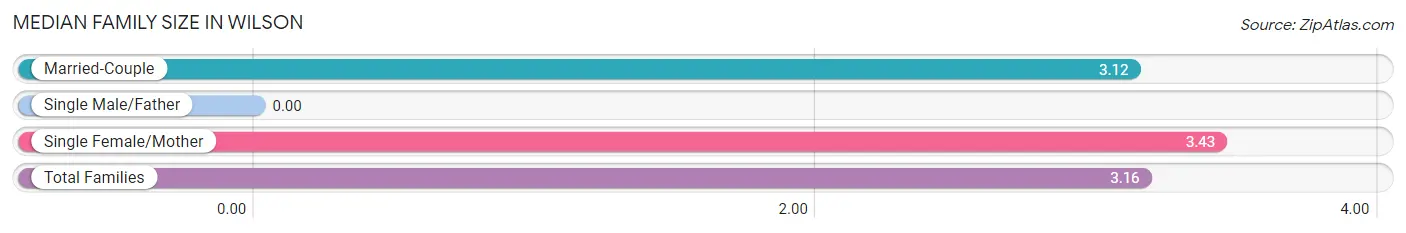
| Family Type | # Families | Family Size |
| Married-Couple | 51 (87.9%) | 3.12 |
| Single Male/Father | 0 (0.0%) | - |
| Single Female/Mother | 7 (12.1%) | 3.43 |
| Total Families | 58 (100.0%) | 3.16 |
Median Household Size in Wilson
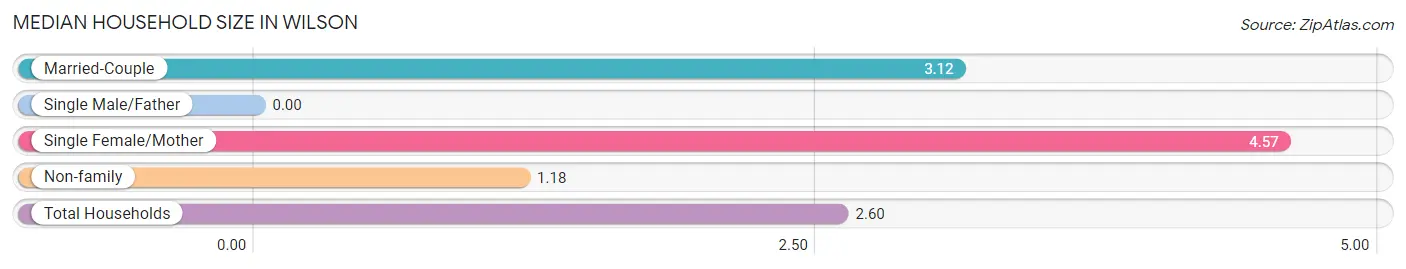
| Household Type | # Households | Household Size |
| Married-Couple | 51 (59.3%) | 3.12 |
| Single Male/Father | 0 (0.0%) | - |
| Single Female/Mother | 7 (8.1%) | 4.57 |
| Non-family | 28 (32.6%) | 1.18 |
| Total Households | 86 (100.0%) | 2.60 |
Household Size by Marriage Status in Wilson
Out of a total of 86 households in Wilson, 58 (67.4%) are family households, while 28 (32.6%) are nonfamily households. The most numerous type of family households are 2-person households, comprising 32, and the most common type of nonfamily households are 1-person households, comprising 24.
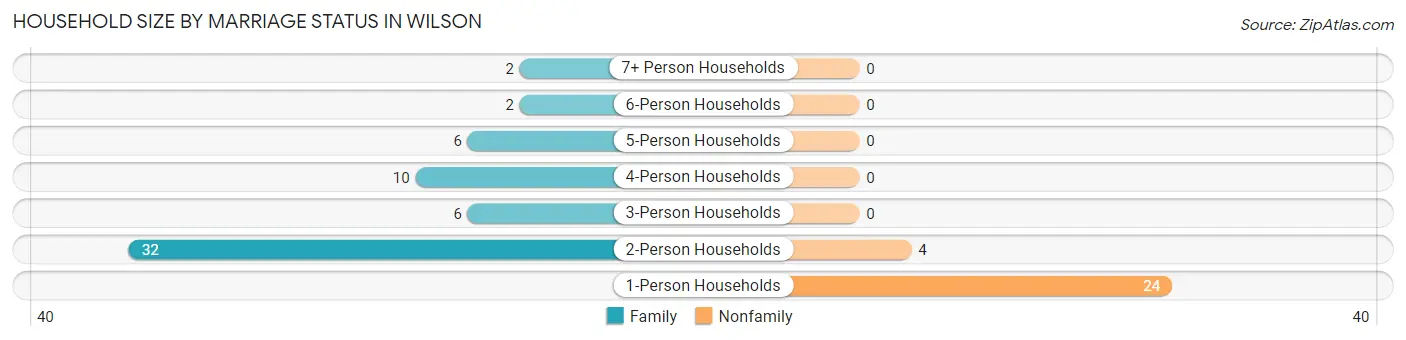
| Household Size | Family Households | Nonfamily Households |
| 1-Person Households | - | 24 (27.9%) |
| 2-Person Households | 32 (37.2%) | 4 (4.6%) |
| 3-Person Households | 6 (7.0%) | 0 (0.0%) |
| 4-Person Households | 10 (11.6%) | 0 (0.0%) |
| 5-Person Households | 6 (7.0%) | 0 (0.0%) |
| 6-Person Households | 2 (2.3%) | 0 (0.0%) |
| 7+ Person Households | 2 (2.3%) | 0 (0.0%) |
| Total | 58 (67.4%) | 28 (32.6%) |
Female Fertility in Wilson
Fertility by Age in Wilson
Average fertility rate in Wilson is 29.0 births per 1,000 women. Women in the age bracket of 20 to 34 years have the highest fertility rate with 74.0 births per 1,000 women. Women in the age bracket of 20 to 34 years acount for 100.0% of all women with births.
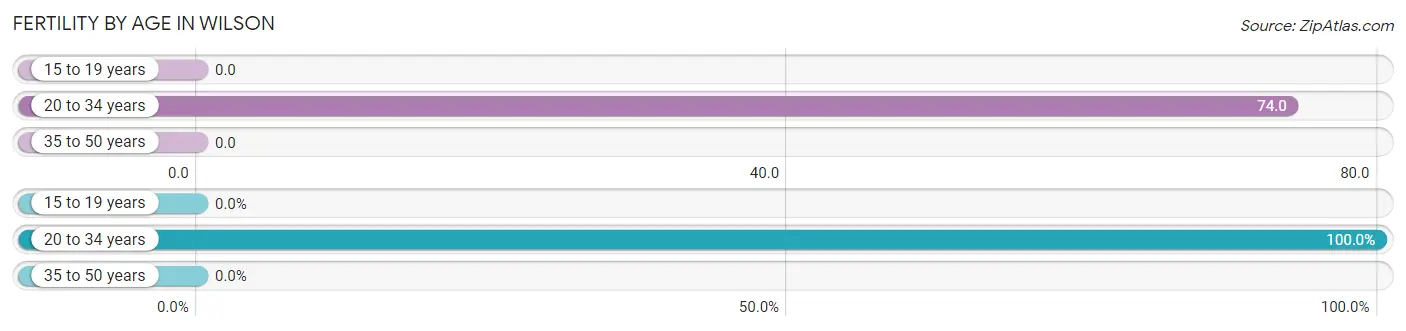
| Age Bracket | Women with Births | Births / 1,000 Women |
| 15 to 19 years | 0 (0.0%) | 0.0 |
| 20 to 34 years | 2 (100.0%) | 74.0 |
| 35 to 50 years | 0 (0.0%) | 0.0 |
| Total | 2 (100.0%) | 29.0 |
Fertility by Age by Marriage Status in Wilson
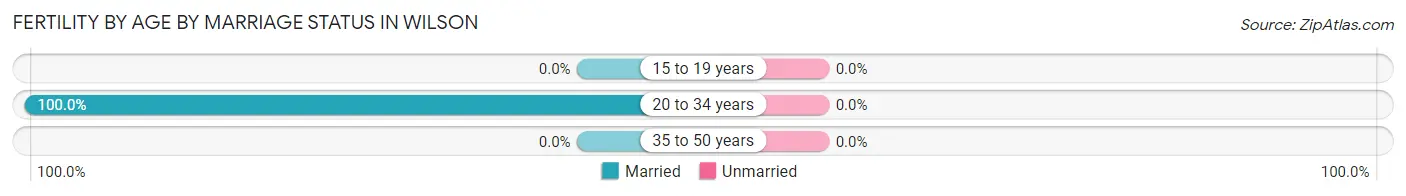
| Age Bracket | Married | Unmarried |
| 15 to 19 years | 0 (0.0%) | 0 (0.0%) |
| 20 to 34 years | 2 (100.0%) | 0 (0.0%) |
| 35 to 50 years | 0 (0.0%) | 0 (0.0%) |
| Total | 2 (100.0%) | 0 (0.0%) |
Fertility by Education in Wilson
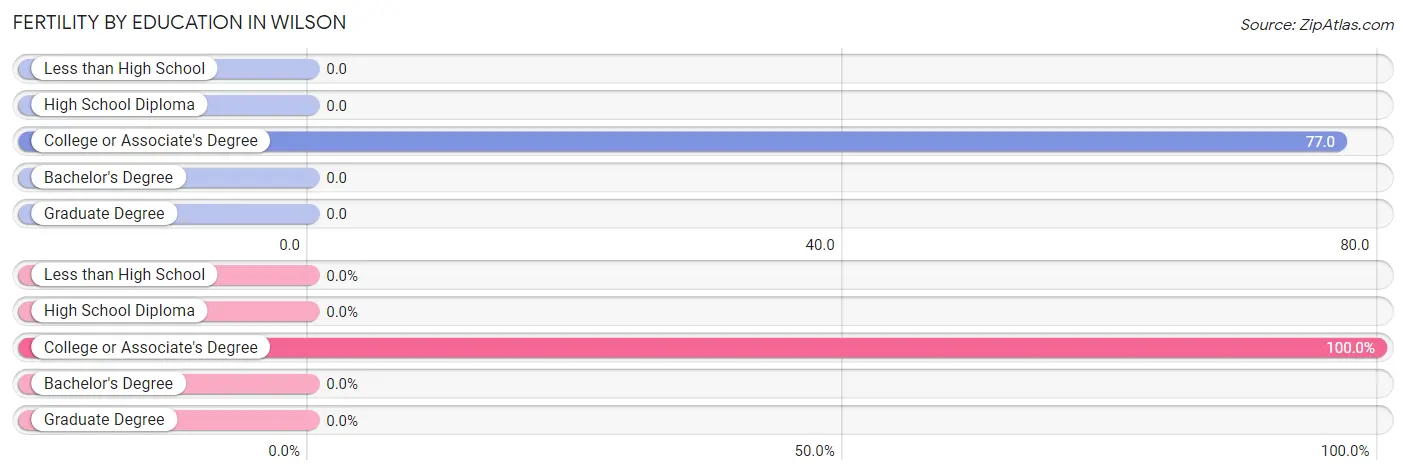
| Educational Attainment | Women with Births | Births / 1,000 Women |
| Less than High School | 0 (0.0%) | 0.0 |
| High School Diploma | 0 (0.0%) | 0.0 |
| College or Associate's Degree | 2 (100.0%) | 77.0 |
| Bachelor's Degree | 0 (0.0%) | 0.0 |
| Graduate Degree | 0 (0.0%) | 0.0 |
| Total | 2 (100.0%) | 29.0 |
Fertility by Education by Marriage Status in Wilson
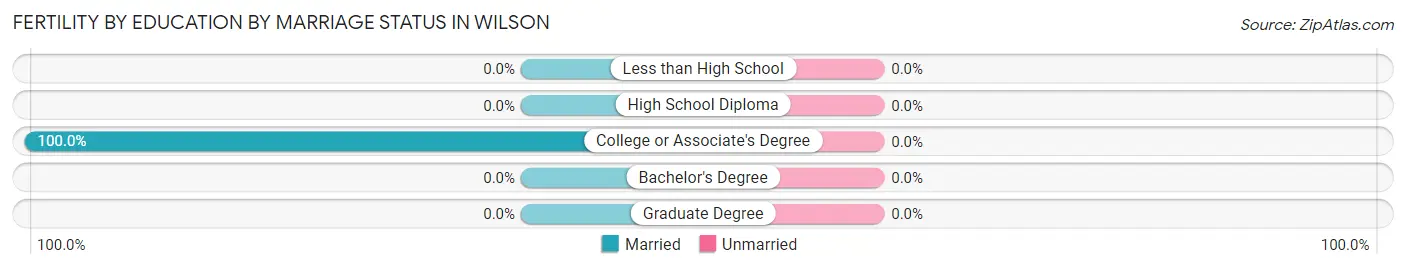
| Educational Attainment | Married | Unmarried |
| Less than High School | 0 (0.0%) | 0 (0.0%) |
| High School Diploma | 0 (0.0%) | 0 (0.0%) |
| College or Associate's Degree | 2 (100.0%) | 0 (0.0%) |
| Bachelor's Degree | 0 (0.0%) | 0 (0.0%) |
| Graduate Degree | 0 (0.0%) | 0 (0.0%) |
| Total | 2 (100.0%) | 0 (0.0%) |
Employment Characteristics in Wilson
Employment by Class of Employer in Wilson
Among the 121 employed individuals in Wilson, private company employees (96 | 79.3%), not-for-profit organizations (10 | 8.3%), and self-employed (not incorporated) (7 | 5.8%) make up the most common classes of employment.
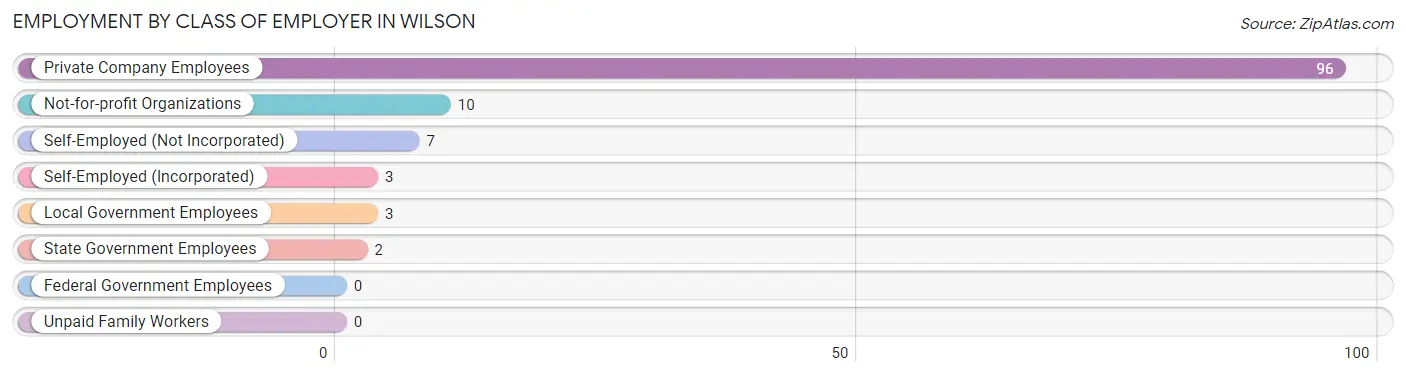
| Employer Class | # Employees | % Employees |
| Private Company Employees | 96 | 79.3% |
| Self-Employed (Incorporated) | 3 | 2.5% |
| Self-Employed (Not Incorporated) | 7 | 5.8% |
| Not-for-profit Organizations | 10 | 8.3% |
| Local Government Employees | 3 | 2.5% |
| State Government Employees | 2 | 1.7% |
| Federal Government Employees | 0 | 0.0% |
| Unpaid Family Workers | 0 | 0.0% |
| Total | 121 | 100.0% |
Employment Status by Age in Wilson
According to the labor force statistics for Wilson, out of the total population over 16 years of age (190), 73.2% or 139 individuals are in the labor force, with 10.8% or 15 of them unemployed. The age group with the highest labor force participation rate is 45 to 54 years, with 94.7% or 36 individuals in the labor force. Within the labor force, the 55 to 59 years age range has the highest percentage of unemployed individuals, with 42.3% or 11 of them being unemployed.
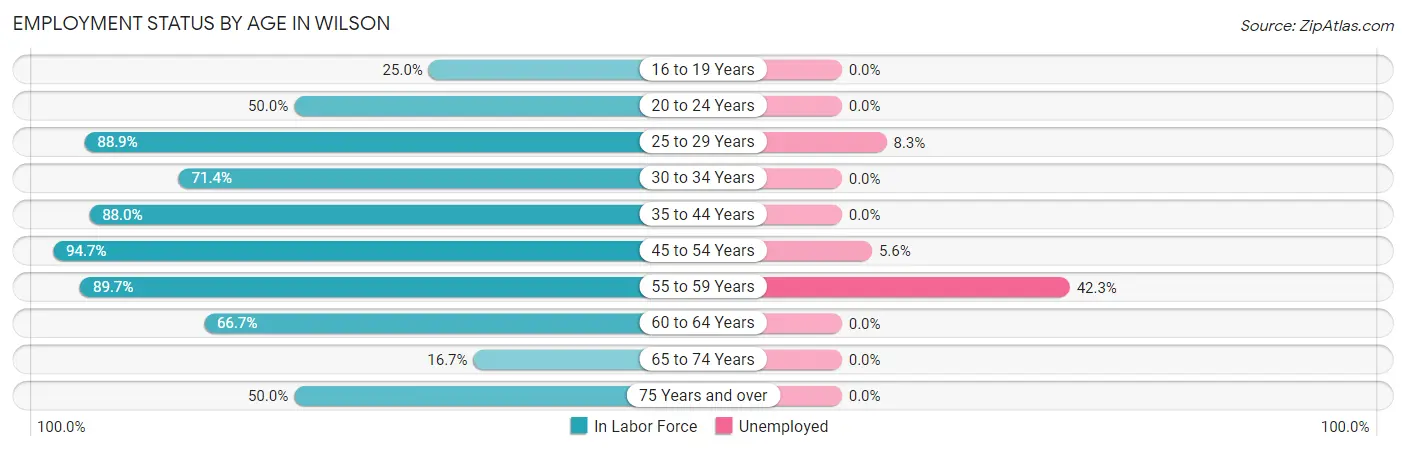
| Age Bracket | In Labor Force | Unemployed |
| 16 to 19 Years | 4 (25.0%) | 0 (0.0%) |
| 20 to 24 Years | 7 (50.0%) | 0 (0.0%) |
| 25 to 29 Years | 24 (88.9%) | 2 (8.3%) |
| 30 to 34 Years | 5 (71.4%) | 0 (0.0%) |
| 35 to 44 Years | 22 (88.0%) | 0 (0.0%) |
| 45 to 54 Years | 36 (94.7%) | 2 (5.6%) |
| 55 to 59 Years | 26 (89.7%) | 11 (42.3%) |
| 60 to 64 Years | 8 (66.7%) | 0 (0.0%) |
| 65 to 74 Years | 2 (16.7%) | 0 (0.0%) |
| 75 Years and over | 5 (50.0%) | 0 (0.0%) |
| Total | 139 (73.2%) | 15 (10.8%) |
Employment Status by Educational Attainment in Wilson
According to labor force statistics for Wilson, 87.7% of individuals (121) out of the total population between 25 and 64 years of age (138) are in the labor force, with 12.4% or 15 of them being unemployed. The group with the highest labor force participation rate are those with the educational attainment of high school diploma, with 97.5% or 39 individuals in the labor force. Within the labor force, individuals with less than high school education have the highest percentage of unemployment, with 81.8% or 9 of them being unemployed.
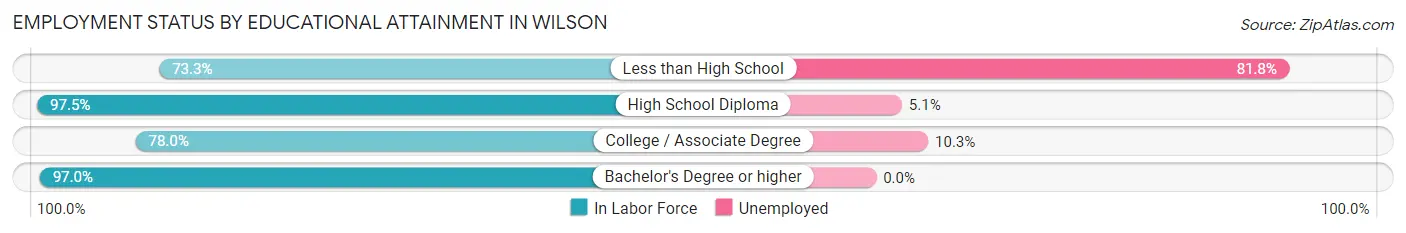
| Educational Attainment | In Labor Force | Unemployed |
| Less than High School | 11 (73.3%) | 12 (81.8%) |
| High School Diploma | 39 (97.5%) | 2 (5.1%) |
| College / Associate Degree | 39 (78.0%) | 5 (10.3%) |
| Bachelor's Degree or higher | 32 (97.0%) | 0 (0.0%) |
| Total | 121 (87.7%) | 17 (12.4%) |
Employment Occupations by Sex in Wilson
Management, Business, Science and Arts Occupations
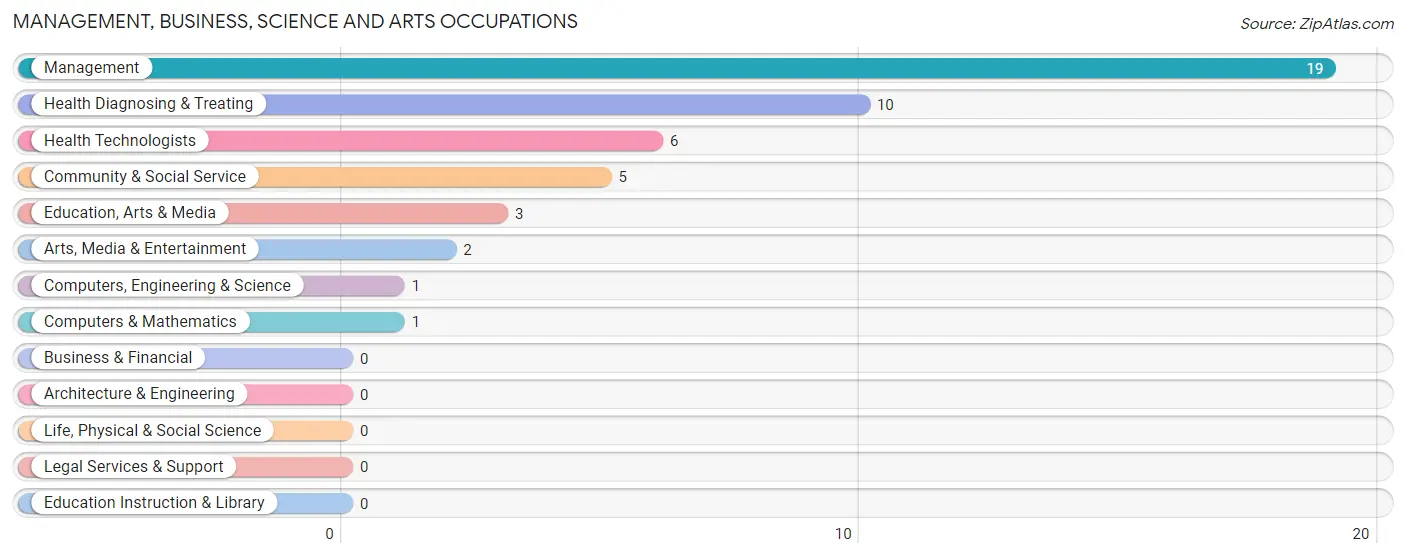
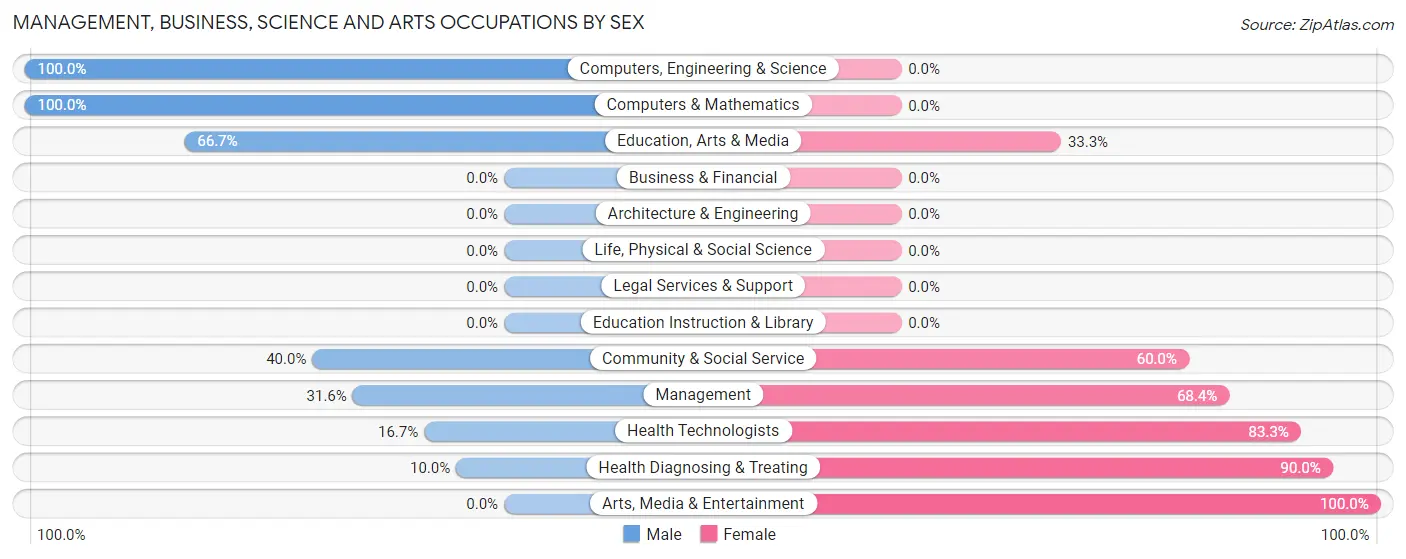
The most common Management, Business, Science and Arts occupations in Wilson are Management (19 | 15.3%), Health Diagnosing & Treating (10 | 8.1%), Health Technologists (6 | 4.8%), Community & Social Service (5 | 4.0%), and Education, Arts & Media (3 | 2.4%).
Management, Business, Science and Arts Occupations by Sex
Within the Management, Business, Science and Arts occupations in Wilson, the most male-oriented occupations are Computers, Engineering & Science (100.0%), Computers & Mathematics (100.0%), and Education, Arts & Media (66.7%), while the most female-oriented occupations are Arts, Media & Entertainment (100.0%), Health Diagnosing & Treating (90.0%), and Health Technologists (83.3%).
| Occupation | Male | Female |
| Management | 6 (31.6%) | 13 (68.4%) |
| Business & Financial | 0 (0.0%) | 0 (0.0%) |
| Computers, Engineering & Science | 1 (100.0%) | 0 (0.0%) |
| Computers & Mathematics | 1 (100.0%) | 0 (0.0%) |
| Architecture & Engineering | 0 (0.0%) | 0 (0.0%) |
| Life, Physical & Social Science | 0 (0.0%) | 0 (0.0%) |
| Community & Social Service | 2 (40.0%) | 3 (60.0%) |
| Education, Arts & Media | 2 (66.7%) | 1 (33.3%) |
| Legal Services & Support | 0 (0.0%) | 0 (0.0%) |
| Education Instruction & Library | 0 (0.0%) | 0 (0.0%) |
| Arts, Media & Entertainment | 0 (0.0%) | 2 (100.0%) |
| Health Diagnosing & Treating | 1 (10.0%) | 9 (90.0%) |
| Health Technologists | 1 (16.7%) | 5 (83.3%) |
| Total (Category) | 10 (28.6%) | 25 (71.4%) |
| Total (Overall) | 62 (50.0%) | 62 (50.0%) |
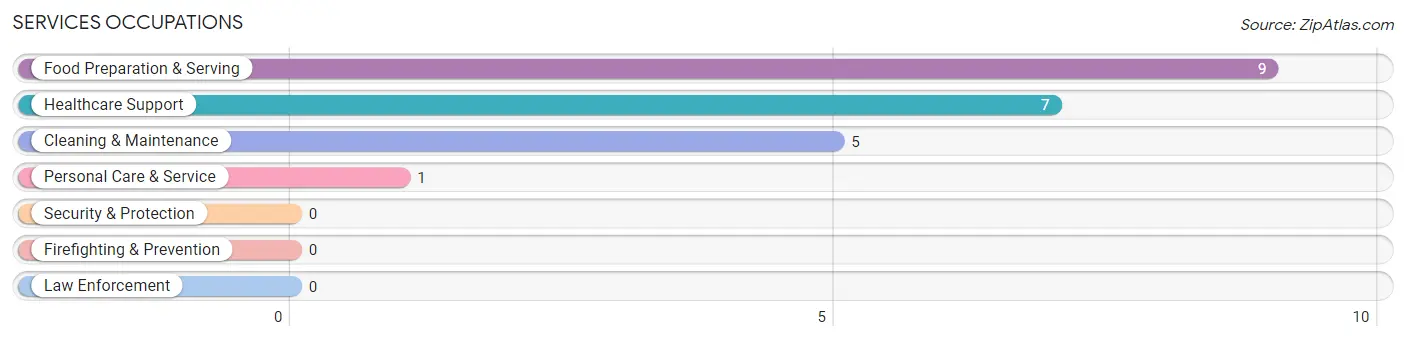
Services Occupations
The most common Services occupations in Wilson are Food Preparation & Serving (9 | 7.3%), Healthcare Support (7 | 5.7%), Cleaning & Maintenance (5 | 4.0%), and Personal Care & Service (1 | 0.8%).
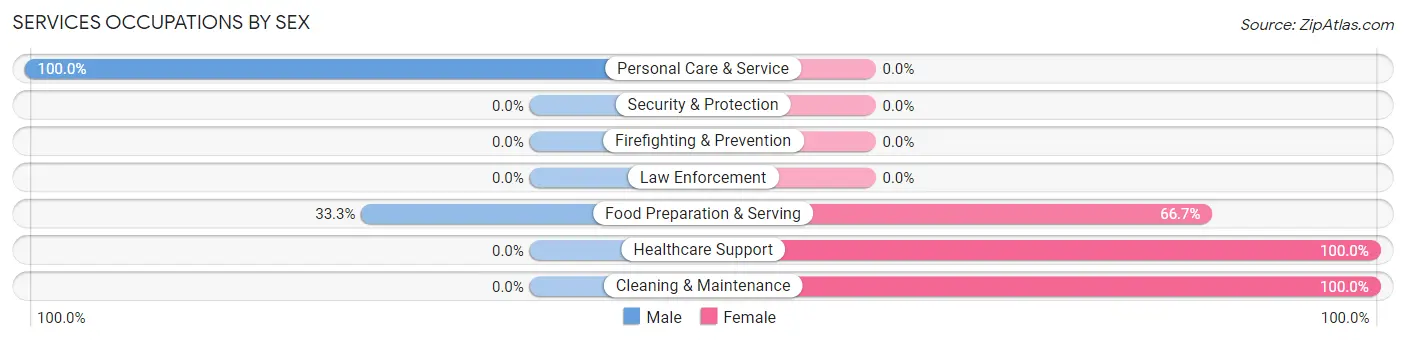
Services Occupations by Sex
Within the Services occupations in Wilson, the most male-oriented occupations are Personal Care & Service (100.0%), and Food Preparation & Serving (33.3%), while the most female-oriented occupations are Healthcare Support (100.0%), Cleaning & Maintenance (100.0%), and Food Preparation & Serving (66.7%).
| Occupation | Male | Female |
| Healthcare Support | 0 (0.0%) | 7 (100.0%) |
| Security & Protection | 0 (0.0%) | 0 (0.0%) |
| Firefighting & Prevention | 0 (0.0%) | 0 (0.0%) |
| Law Enforcement | 0 (0.0%) | 0 (0.0%) |
| Food Preparation & Serving | 3 (33.3%) | 6 (66.7%) |
| Cleaning & Maintenance | 0 (0.0%) | 5 (100.0%) |
| Personal Care & Service | 1 (100.0%) | 0 (0.0%) |
| Total (Category) | 4 (18.2%) | 18 (81.8%) |
| Total (Overall) | 62 (50.0%) | 62 (50.0%) |
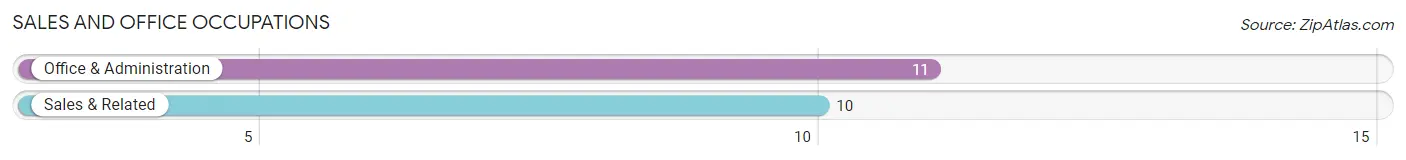
Sales and Office Occupations
The most common Sales and Office occupations in Wilson are Office & Administration (11 | 8.9%), and Sales & Related (10 | 8.1%).
Sales and Office Occupations by Sex
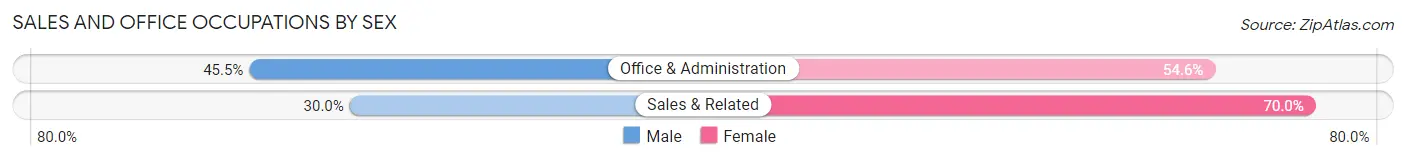
| Occupation | Male | Female |
| Sales & Related | 3 (30.0%) | 7 (70.0%) |
| Office & Administration | 5 (45.5%) | 6 (54.5%) |
| Total (Category) | 8 (38.1%) | 13 (61.9%) |
| Total (Overall) | 62 (50.0%) | 62 (50.0%) |
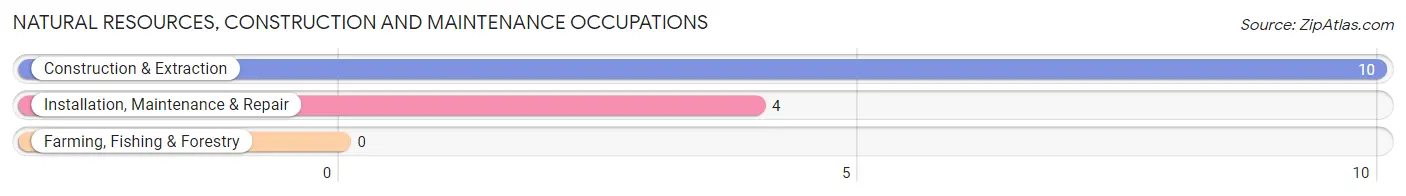
Natural Resources, Construction and Maintenance Occupations
The most common Natural Resources, Construction and Maintenance occupations in Wilson are Construction & Extraction (10 | 8.1%), and Installation, Maintenance & Repair (4 | 3.2%).
Natural Resources, Construction and Maintenance Occupations by Sex
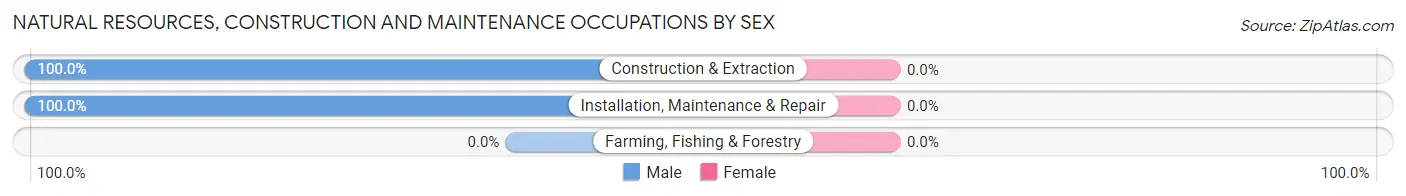
| Occupation | Male | Female |
| Farming, Fishing & Forestry | 0 (0.0%) | 0 (0.0%) |
| Construction & Extraction | 10 (100.0%) | 0 (0.0%) |
| Installation, Maintenance & Repair | 4 (100.0%) | 0 (0.0%) |
| Total (Category) | 14 (100.0%) | 0 (0.0%) |
| Total (Overall) | 62 (50.0%) | 62 (50.0%) |
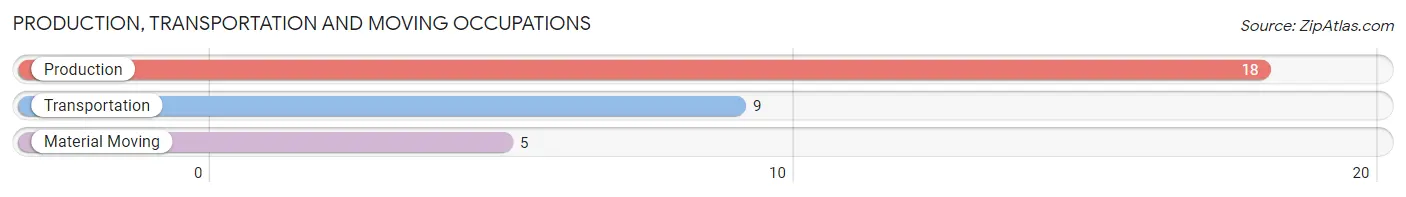
Production, Transportation and Moving Occupations
The most common Production, Transportation and Moving occupations in Wilson are Production (18 | 14.5%), Transportation (9 | 7.3%), and Material Moving (5 | 4.0%).
Production, Transportation and Moving Occupations by Sex
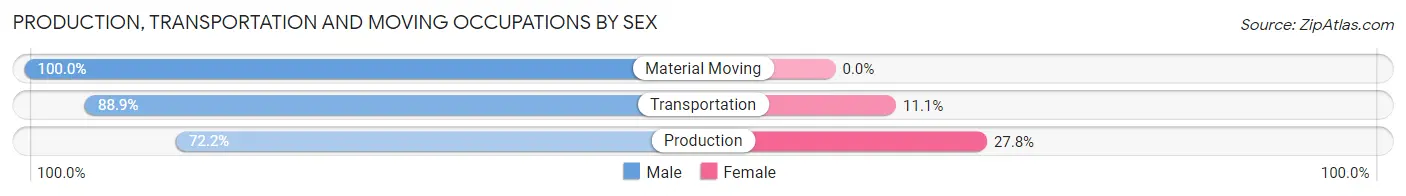
| Occupation | Male | Female |
| Production | 13 (72.2%) | 5 (27.8%) |
| Transportation | 8 (88.9%) | 1 (11.1%) |
| Material Moving | 5 (100.0%) | 0 (0.0%) |
| Total (Category) | 26 (81.2%) | 6 (18.8%) |
| Total (Overall) | 62 (50.0%) | 62 (50.0%) |
Employment Industries by Sex in Wilson
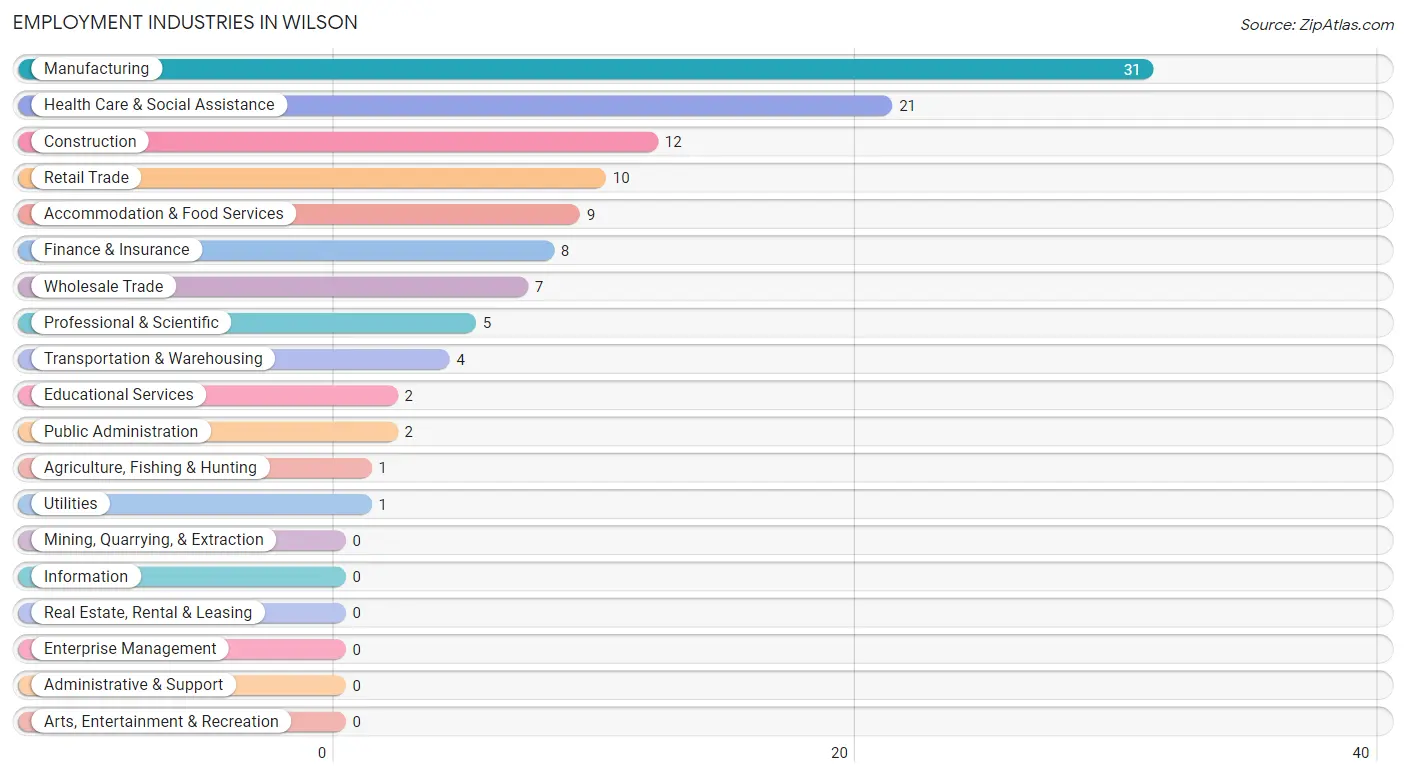
Employment Industries in Wilson
The major employment industries in Wilson include Manufacturing (31 | 25.0%), Health Care & Social Assistance (21 | 16.9%), Construction (12 | 9.7%), Retail Trade (10 | 8.1%), and Accommodation & Food Services (9 | 7.3%).
Employment Industries by Sex in Wilson
The Wilson industries that see more men than women are Wholesale Trade (100.0%), Transportation & Warehousing (100.0%), and Utilities (100.0%), whereas the industries that tend to have a higher number of women are Agriculture, Fishing & Hunting (100.0%), Public Administration (100.0%), and Health Care & Social Assistance (90.5%).
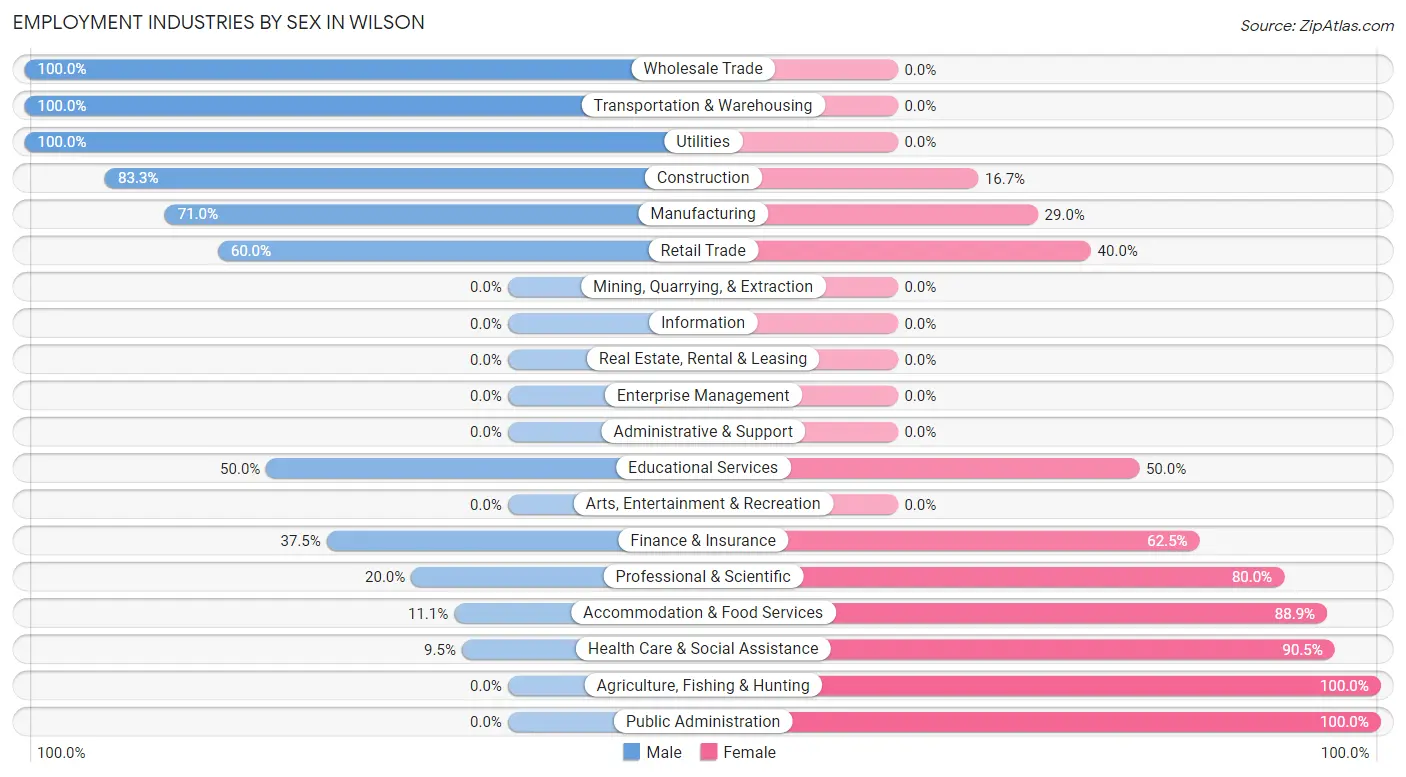
| Industry | Male | Female |
| Agriculture, Fishing & Hunting | 0 (0.0%) | 1 (100.0%) |
| Mining, Quarrying, & Extraction | 0 (0.0%) | 0 (0.0%) |
| Construction | 10 (83.3%) | 2 (16.7%) |
| Manufacturing | 22 (71.0%) | 9 (29.0%) |
| Wholesale Trade | 7 (100.0%) | 0 (0.0%) |
| Retail Trade | 6 (60.0%) | 4 (40.0%) |
| Transportation & Warehousing | 4 (100.0%) | 0 (0.0%) |
| Utilities | 1 (100.0%) | 0 (0.0%) |
| Information | 0 (0.0%) | 0 (0.0%) |
| Finance & Insurance | 3 (37.5%) | 5 (62.5%) |
| Real Estate, Rental & Leasing | 0 (0.0%) | 0 (0.0%) |
| Professional & Scientific | 1 (20.0%) | 4 (80.0%) |
| Enterprise Management | 0 (0.0%) | 0 (0.0%) |
| Administrative & Support | 0 (0.0%) | 0 (0.0%) |
| Educational Services | 1 (50.0%) | 1 (50.0%) |
| Health Care & Social Assistance | 2 (9.5%) | 19 (90.5%) |
| Arts, Entertainment & Recreation | 0 (0.0%) | 0 (0.0%) |
| Accommodation & Food Services | 1 (11.1%) | 8 (88.9%) |
| Public Administration | 0 (0.0%) | 2 (100.0%) |
| Total | 62 (50.0%) | 62 (50.0%) |
Education in Wilson
School Enrollment in Wilson
The most common levels of schooling among the 42 students in Wilson are high school (18 | 42.9%), kindergarten (8 | 19.1%), and graduate / professional (5 | 11.9%).
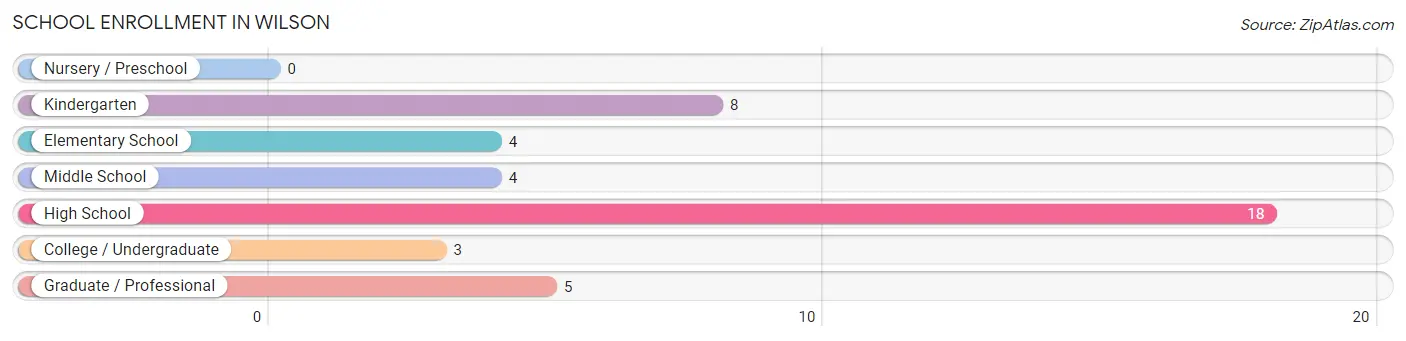
| School Level | # Students | % Students |
| Nursery / Preschool | 0 | 0.0% |
| Kindergarten | 8 | 19.1% |
| Elementary School | 4 | 9.5% |
| Middle School | 4 | 9.5% |
| High School | 18 | 42.9% |
| College / Undergraduate | 3 | 7.1% |
| Graduate / Professional | 5 | 11.9% |
| Total | 42 | 100.0% |
School Enrollment by Age by Funding Source in Wilson
Out of a total of 42 students who are enrolled in schools in Wilson, 6 (14.3%) attend a private institution, while the remaining 36 (85.7%) are enrolled in public schools. The age group of 15 to 17 year olds has the highest likelihood of being enrolled in private schools, with 6 (35.3% in the age bracket) enrolled. Conversely, the age group of 5 to 9 year old has the lowest likelihood of being enrolled in a private school, with 12 (100.0% in the age bracket) attending a public institution.
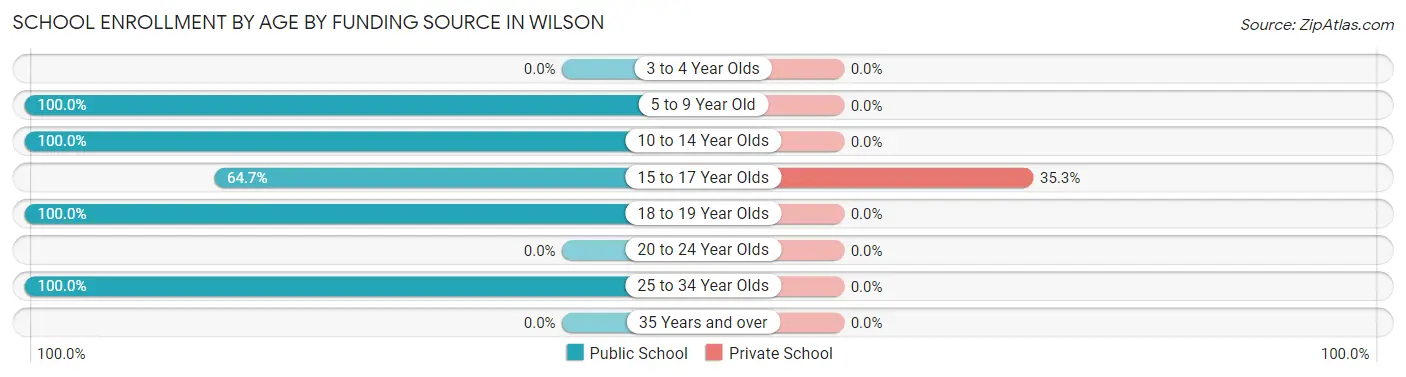
| Age Bracket | Public School | Private School |
| 3 to 4 Year Olds | 0 (0.0%) | 0 (0.0%) |
| 5 to 9 Year Old | 12 (100.0%) | 0 (0.0%) |
| 10 to 14 Year Olds | 4 (100.0%) | 0 (0.0%) |
| 15 to 17 Year Olds | 11 (64.7%) | 6 (35.3%) |
| 18 to 19 Year Olds | 4 (100.0%) | 0 (0.0%) |
| 20 to 24 Year Olds | 0 (0.0%) | 0 (0.0%) |
| 25 to 34 Year Olds | 5 (100.0%) | 0 (0.0%) |
| 35 Years and over | 0 (0.0%) | 0 (0.0%) |
| Total | 36 (85.7%) | 6 (14.3%) |
Educational Attainment by Field of Study in Wilson
Business (16 | 45.7%), science & technology (5 | 14.3%), communications (5 | 14.3%), bio, nature & agricultural (2 | 5.7%), and social sciences (2 | 5.7%) are the most common fields of study among 35 individuals in Wilson who have obtained a bachelor's degree or higher.
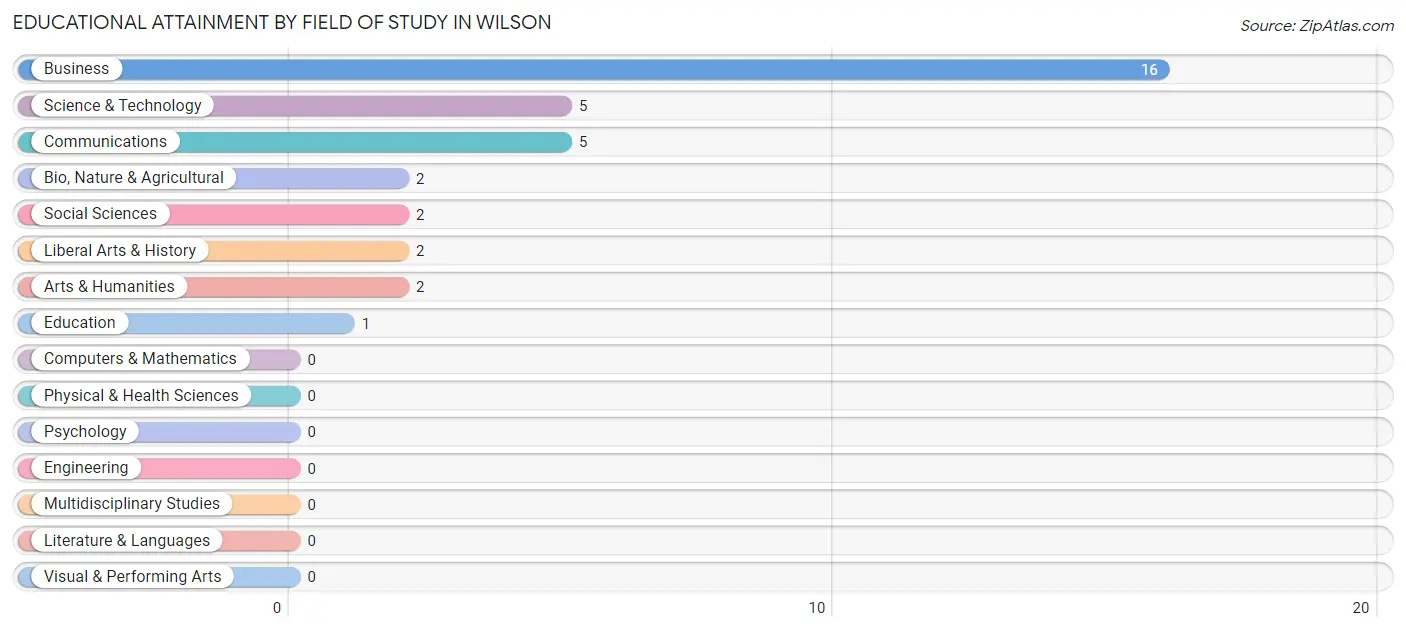
| Field of Study | # Graduates | % Graduates |
| Computers & Mathematics | 0 | 0.0% |
| Bio, Nature & Agricultural | 2 | 5.7% |
| Physical & Health Sciences | 0 | 0.0% |
| Psychology | 0 | 0.0% |
| Social Sciences | 2 | 5.7% |
| Engineering | 0 | 0.0% |
| Multidisciplinary Studies | 0 | 0.0% |
| Science & Technology | 5 | 14.3% |
| Business | 16 | 45.7% |
| Education | 1 | 2.9% |
| Literature & Languages | 0 | 0.0% |
| Liberal Arts & History | 2 | 5.7% |
| Visual & Performing Arts | 0 | 0.0% |
| Communications | 5 | 14.3% |
| Arts & Humanities | 2 | 5.7% |
| Total | 35 | 100.0% |
Transportation & Commute in Wilson
Vehicle Availability by Sex in Wilson
The most prevalent vehicle ownership categories in Wilson are males with 2 vehicles (28, accounting for 45.2%) and females with 2 vehicles (20, making up 47.5%).
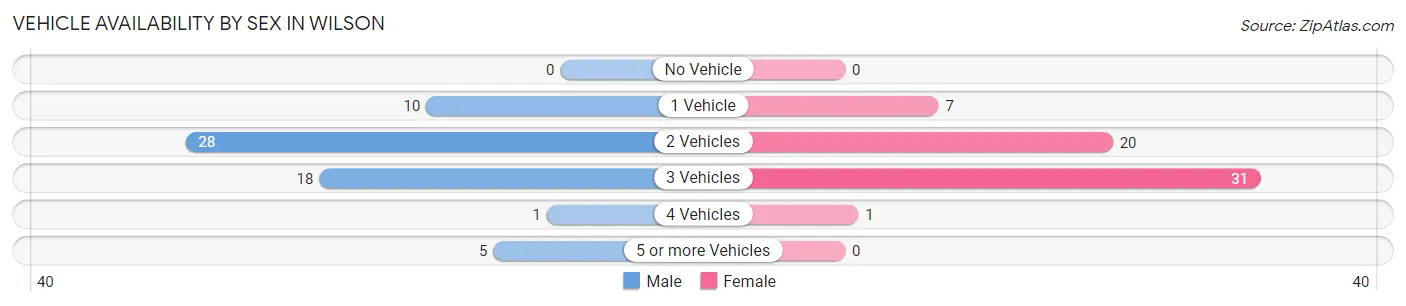
| Vehicles Available | Male | Female |
| No Vehicle | 0 (0.0%) | 0 (0.0%) |
| 1 Vehicle | 10 (16.1%) | 7 (11.9%) |
| 2 Vehicles | 28 (45.2%) | 20 (33.9%) |
| 3 Vehicles | 18 (29.0%) | 31 (52.5%) |
| 4 Vehicles | 1 (1.6%) | 1 (1.7%) |
| 5 or more Vehicles | 5 (8.1%) | 0 (0.0%) |
| Total | 62 (100.0%) | 59 (100.0%) |
Commute Time in Wilson
The most frequently occuring commute durations in Wilson are 15 to 19 minutes (25 commuters, 22.5%), 20 to 24 minutes (24 commuters, 21.6%), and 30 to 34 minutes (11 commuters, 9.9%).
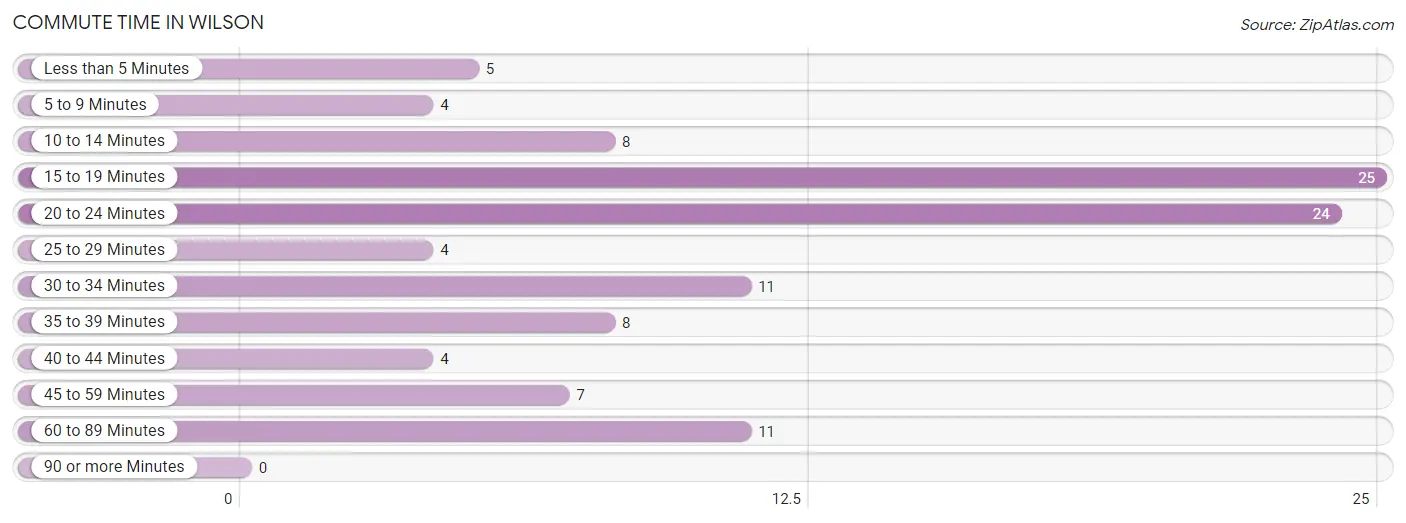
| Commute Time | # Commuters | % Commuters |
| Less than 5 Minutes | 5 | 4.5% |
| 5 to 9 Minutes | 4 | 3.6% |
| 10 to 14 Minutes | 8 | 7.2% |
| 15 to 19 Minutes | 25 | 22.5% |
| 20 to 24 Minutes | 24 | 21.6% |
| 25 to 29 Minutes | 4 | 3.6% |
| 30 to 34 Minutes | 11 | 9.9% |
| 35 to 39 Minutes | 8 | 7.2% |
| 40 to 44 Minutes | 4 | 3.6% |
| 45 to 59 Minutes | 7 | 6.3% |
| 60 to 89 Minutes | 11 | 9.9% |
| 90 or more Minutes | 0 | 0.0% |
Commute Time by Sex in Wilson
The most common commute times in Wilson are 30 to 34 minutes (11 commuters, 18.3%) for males and 15 to 19 minutes (20 commuters, 39.2%) for females.
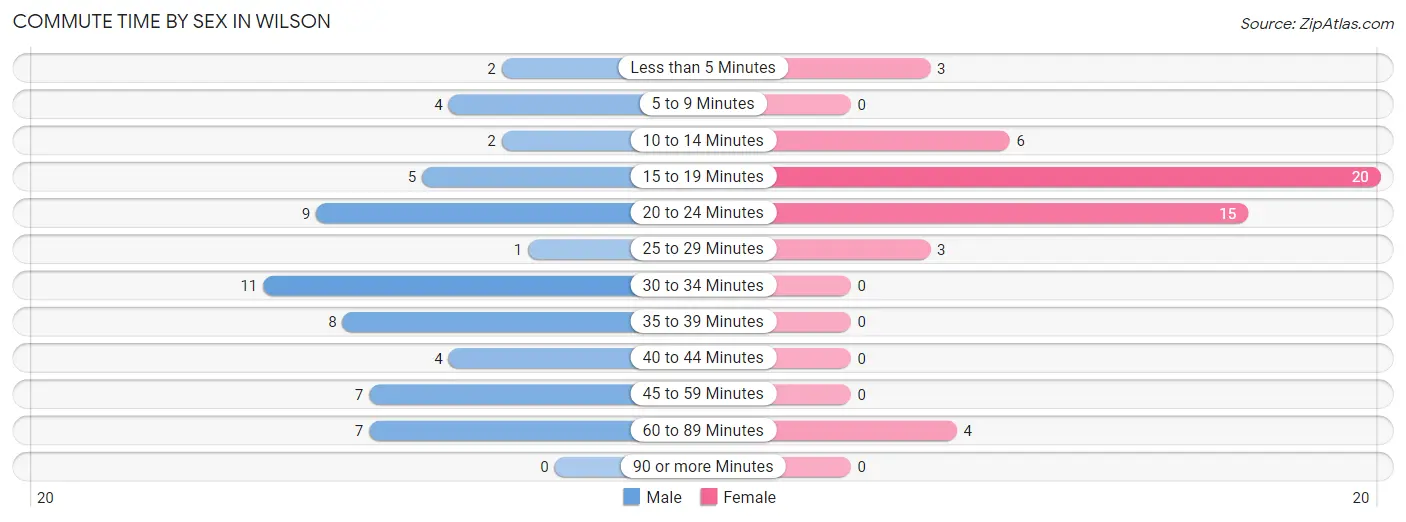
| Commute Time | Male | Female |
| Less than 5 Minutes | 2 (3.3%) | 3 (5.9%) |
| 5 to 9 Minutes | 4 (6.7%) | 0 (0.0%) |
| 10 to 14 Minutes | 2 (3.3%) | 6 (11.8%) |
| 15 to 19 Minutes | 5 (8.3%) | 20 (39.2%) |
| 20 to 24 Minutes | 9 (15.0%) | 15 (29.4%) |
| 25 to 29 Minutes | 1 (1.7%) | 3 (5.9%) |
| 30 to 34 Minutes | 11 (18.3%) | 0 (0.0%) |
| 35 to 39 Minutes | 8 (13.3%) | 0 (0.0%) |
| 40 to 44 Minutes | 4 (6.7%) | 0 (0.0%) |
| 45 to 59 Minutes | 7 (11.7%) | 0 (0.0%) |
| 60 to 89 Minutes | 7 (11.7%) | 4 (7.8%) |
| 90 or more Minutes | 0 (0.0%) | 0 (0.0%) |
Time of Departure to Work by Sex in Wilson
The most frequent times of departure to work in Wilson are 7:00 AM to 7:29 AM (16, 26.7%) for males and 8:30 AM to 8:59 AM (13, 25.5%) for females.
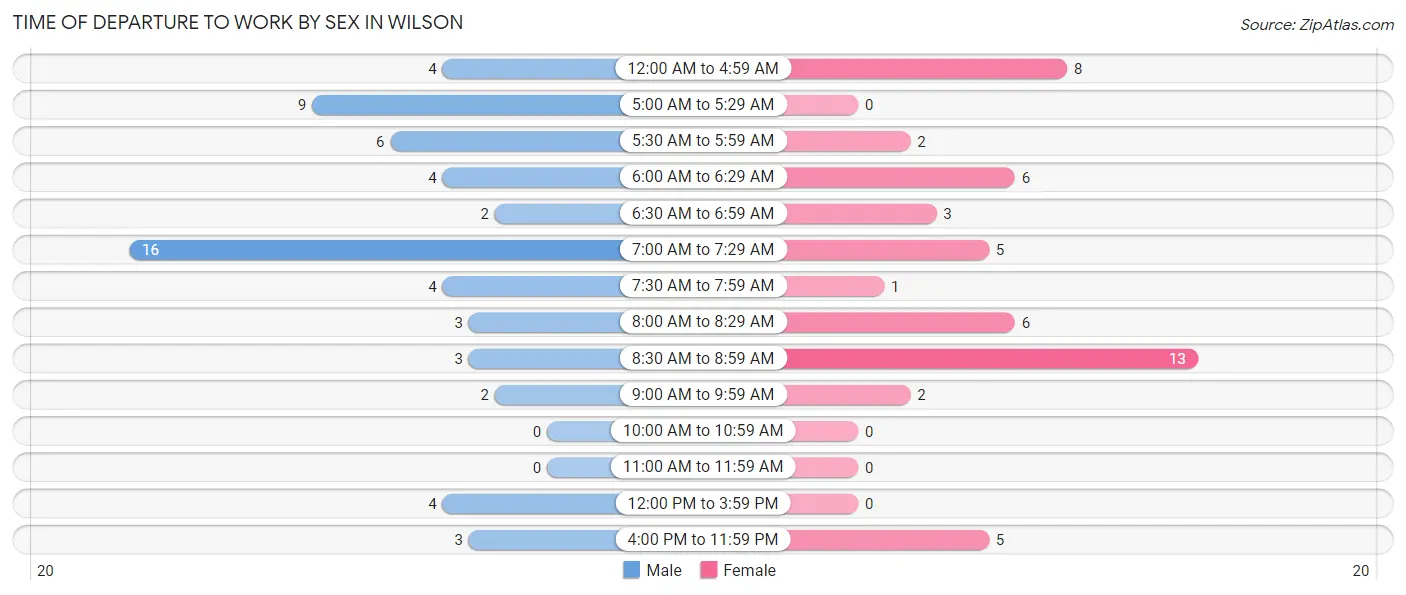
| Time of Departure | Male | Female |
| 12:00 AM to 4:59 AM | 4 (6.7%) | 8 (15.7%) |
| 5:00 AM to 5:29 AM | 9 (15.0%) | 0 (0.0%) |
| 5:30 AM to 5:59 AM | 6 (10.0%) | 2 (3.9%) |
| 6:00 AM to 6:29 AM | 4 (6.7%) | 6 (11.8%) |
| 6:30 AM to 6:59 AM | 2 (3.3%) | 3 (5.9%) |
| 7:00 AM to 7:29 AM | 16 (26.7%) | 5 (9.8%) |
| 7:30 AM to 7:59 AM | 4 (6.7%) | 1 (2.0%) |
| 8:00 AM to 8:29 AM | 3 (5.0%) | 6 (11.8%) |
| 8:30 AM to 8:59 AM | 3 (5.0%) | 13 (25.5%) |
| 9:00 AM to 9:59 AM | 2 (3.3%) | 2 (3.9%) |
| 10:00 AM to 10:59 AM | 0 (0.0%) | 0 (0.0%) |
| 11:00 AM to 11:59 AM | 0 (0.0%) | 0 (0.0%) |
| 12:00 PM to 3:59 PM | 4 (6.7%) | 0 (0.0%) |
| 4:00 PM to 11:59 PM | 3 (5.0%) | 5 (9.8%) |
| Total | 60 (100.0%) | 51 (100.0%) |
Housing Occupancy in Wilson
Occupancy by Ownership in Wilson
Of the total 86 dwellings in Wilson, owner-occupied units account for 81 (94.2%), while renter-occupied units make up 5 (5.8%).
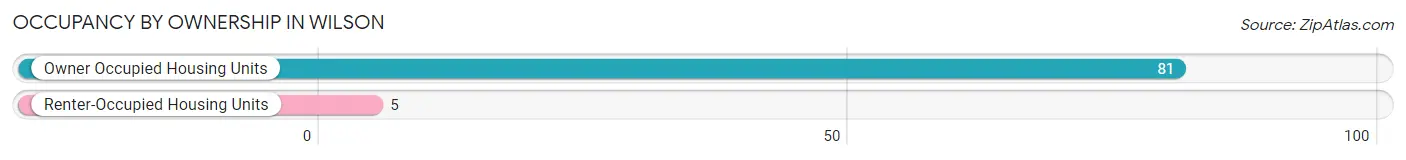
| Occupancy | # Housing Units | % Housing Units |
| Owner Occupied Housing Units | 81 | 94.2% |
| Renter-Occupied Housing Units | 5 | 5.8% |
| Total Occupied Housing Units | 86 | 100.0% |
Occupancy by Household Size in Wilson
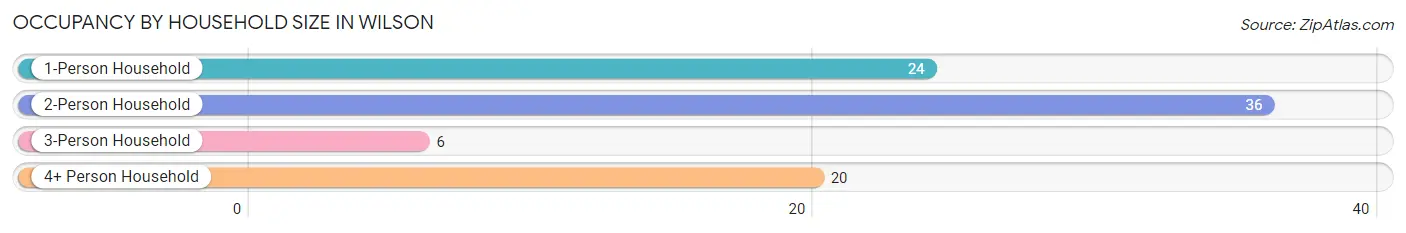
| Household Size | # Housing Units | % Housing Units |
| 1-Person Household | 24 | 27.9% |
| 2-Person Household | 36 | 41.9% |
| 3-Person Household | 6 | 7.0% |
| 4+ Person Household | 20 | 23.3% |
| Total Housing Units | 86 | 100.0% |
Occupancy by Ownership by Household Size in Wilson
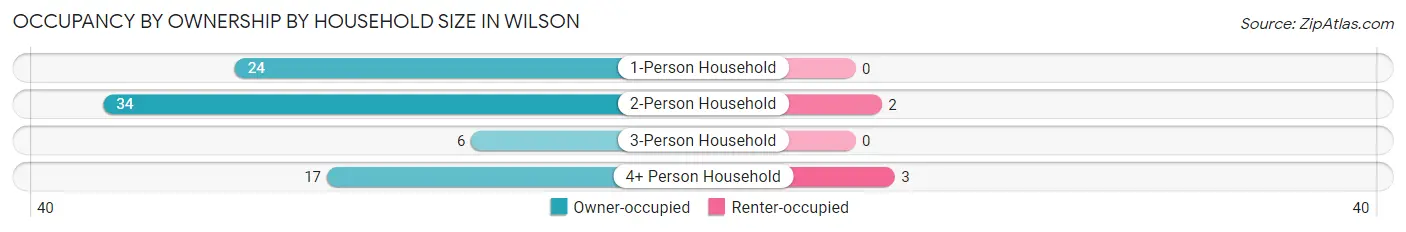
| Household Size | Owner-occupied | Renter-occupied |
| 1-Person Household | 24 (100.0%) | 0 (0.0%) |
| 2-Person Household | 34 (94.4%) | 2 (5.6%) |
| 3-Person Household | 6 (100.0%) | 0 (0.0%) |
| 4+ Person Household | 17 (85.0%) | 3 (15.0%) |
| Total Housing Units | 81 (94.2%) | 5 (5.8%) |
Occupancy by Educational Attainment in Wilson
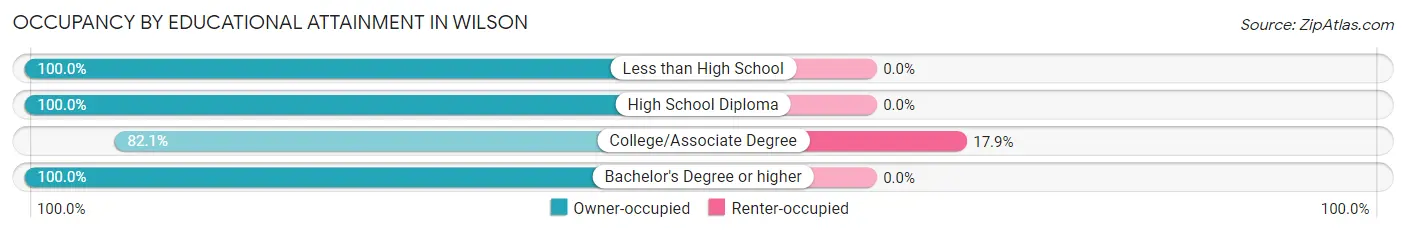
| Household Size | Owner-occupied | Renter-occupied |
| Less than High School | 12 (100.0%) | 0 (0.0%) |
| High School Diploma | 28 (100.0%) | 0 (0.0%) |
| College/Associate Degree | 23 (82.1%) | 5 (17.9%) |
| Bachelor's Degree or higher | 18 (100.0%) | 0 (0.0%) |
Occupancy by Age of Householder in Wilson
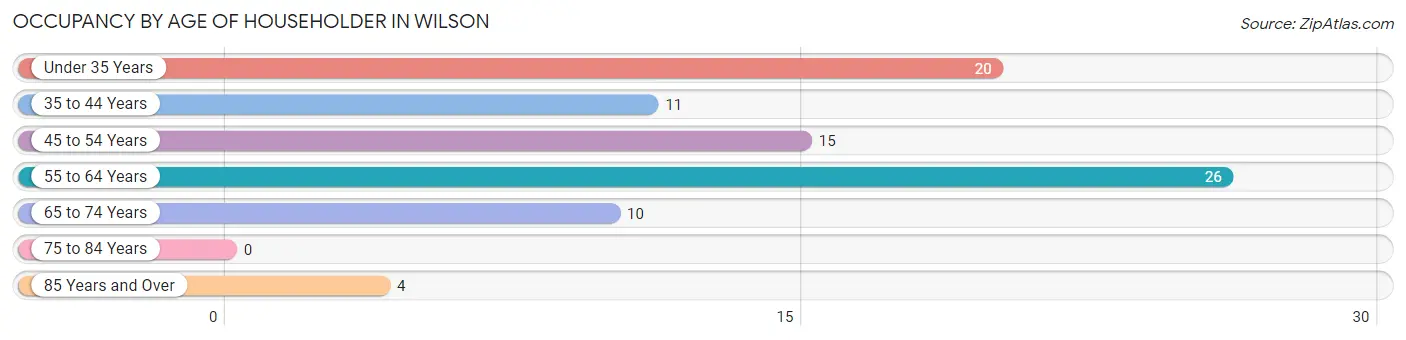
| Age Bracket | # Households | % Households |
| Under 35 Years | 20 | 23.3% |
| 35 to 44 Years | 11 | 12.8% |
| 45 to 54 Years | 15 | 17.4% |
| 55 to 64 Years | 26 | 30.2% |
| 65 to 74 Years | 10 | 11.6% |
| 75 to 84 Years | 0 | 0.0% |
| 85 Years and Over | 4 | 4.6% |
| Total | 86 | 100.0% |
Housing Finances in Wilson
Median Income by Occupancy in Wilson
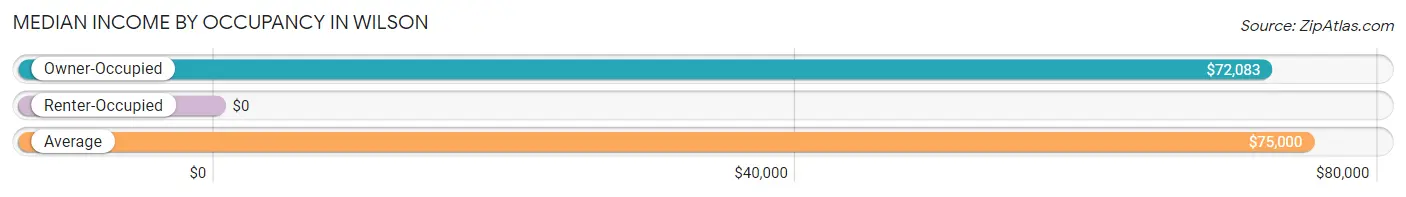
| Occupancy Type | # Households | Median Income |
| Owner-Occupied | 81 (94.2%) | $72,083 |
| Renter-Occupied | 5 (5.8%) | $0 |
| Average | 86 (100.0%) | $75,000 |
Occupancy by Householder Income Bracket in Wilson
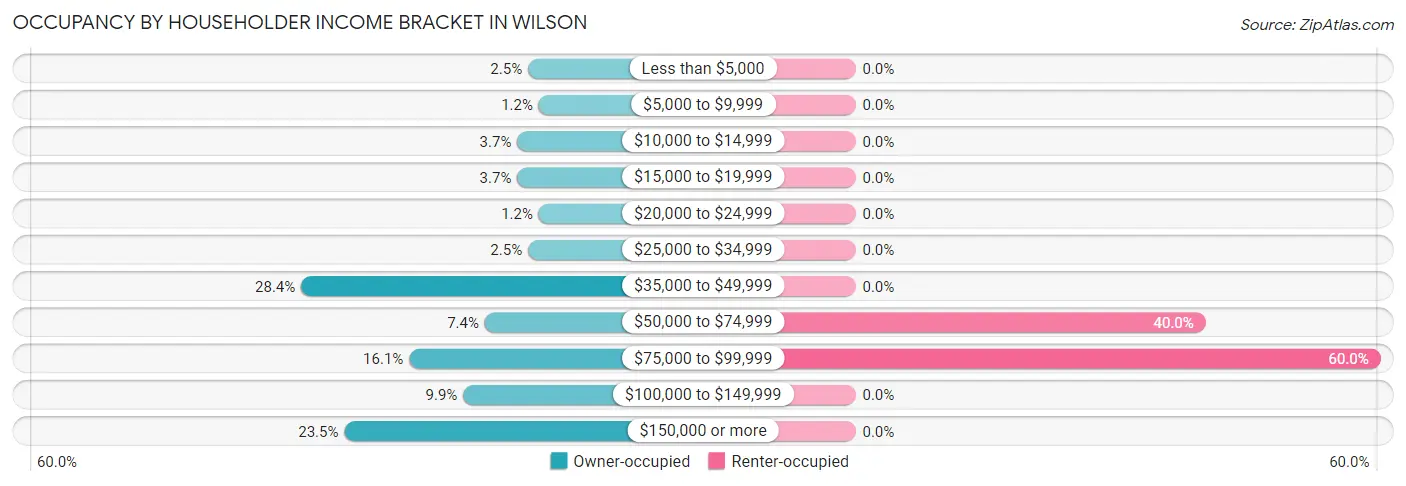
| Income Bracket | Owner-occupied | Renter-occupied |
| Less than $5,000 | 2 (2.5%) | 0 (0.0%) |
| $5,000 to $9,999 | 1 (1.2%) | 0 (0.0%) |
| $10,000 to $14,999 | 3 (3.7%) | 0 (0.0%) |
| $15,000 to $19,999 | 3 (3.7%) | 0 (0.0%) |
| $20,000 to $24,999 | 1 (1.2%) | 0 (0.0%) |
| $25,000 to $34,999 | 2 (2.5%) | 0 (0.0%) |
| $35,000 to $49,999 | 23 (28.4%) | 0 (0.0%) |
| $50,000 to $74,999 | 6 (7.4%) | 2 (40.0%) |
| $75,000 to $99,999 | 13 (16.1%) | 3 (60.0%) |
| $100,000 to $149,999 | 8 (9.9%) | 0 (0.0%) |
| $150,000 or more | 19 (23.5%) | 0 (0.0%) |
| Total | 81 (100.0%) | 5 (100.0%) |
Monthly Housing Cost Tiers in Wilson
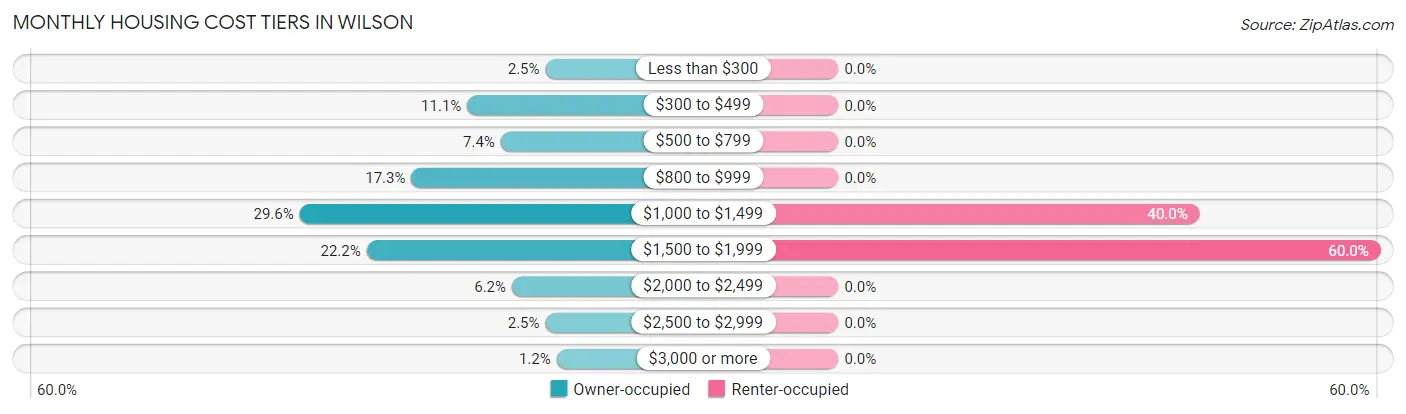
| Monthly Cost | Owner-occupied | Renter-occupied |
| Less than $300 | 2 (2.5%) | 0 (0.0%) |
| $300 to $499 | 9 (11.1%) | 0 (0.0%) |
| $500 to $799 | 6 (7.4%) | 0 (0.0%) |
| $800 to $999 | 14 (17.3%) | 0 (0.0%) |
| $1,000 to $1,499 | 24 (29.6%) | 2 (40.0%) |
| $1,500 to $1,999 | 18 (22.2%) | 3 (60.0%) |
| $2,000 to $2,499 | 5 (6.2%) | 0 (0.0%) |
| $2,500 to $2,999 | 2 (2.5%) | 0 (0.0%) |
| $3,000 or more | 1 (1.2%) | 0 (0.0%) |
| Total | 81 (100.0%) | 5 (100.0%) |
Physical Housing Characteristics in Wilson
Housing Structures in Wilson
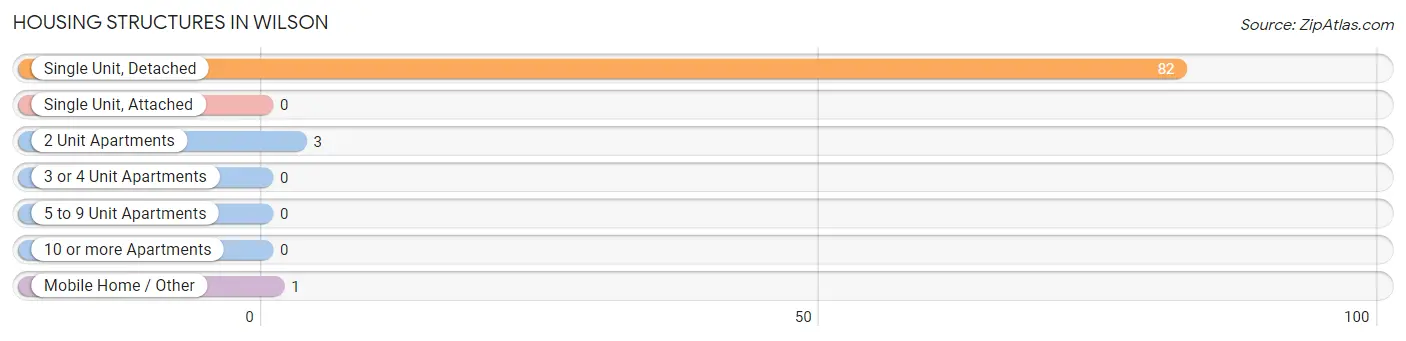
| Structure Type | # Housing Units | % Housing Units |
| Single Unit, Detached | 82 | 95.4% |
| Single Unit, Attached | 0 | 0.0% |
| 2 Unit Apartments | 3 | 3.5% |
| 3 or 4 Unit Apartments | 0 | 0.0% |
| 5 to 9 Unit Apartments | 0 | 0.0% |
| 10 or more Apartments | 0 | 0.0% |
| Mobile Home / Other | 1 | 1.2% |
| Total | 86 | 100.0% |
Housing Structures by Occupancy in Wilson
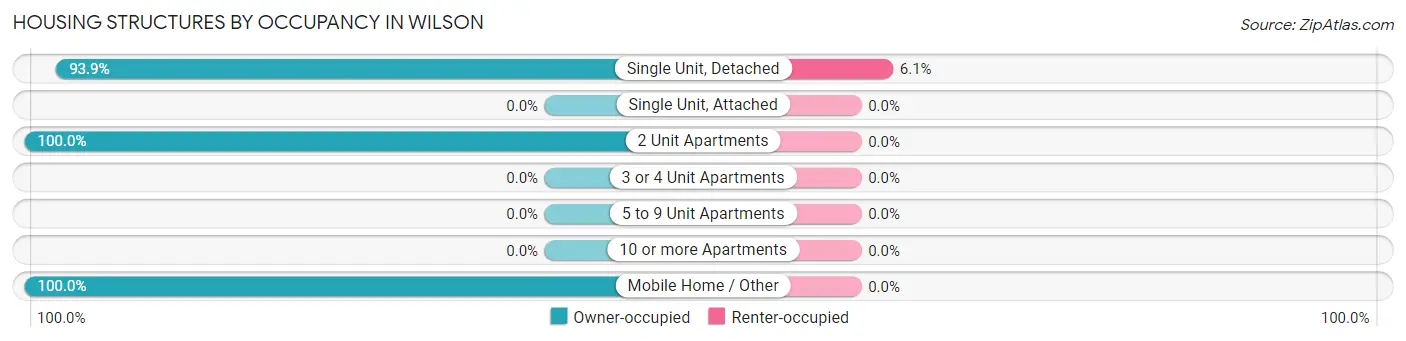
| Structure Type | Owner-occupied | Renter-occupied |
| Single Unit, Detached | 77 (93.9%) | 5 (6.1%) |
| Single Unit, Attached | 0 (0.0%) | 0 (0.0%) |
| 2 Unit Apartments | 3 (100.0%) | 0 (0.0%) |
| 3 or 4 Unit Apartments | 0 (0.0%) | 0 (0.0%) |
| 5 to 9 Unit Apartments | 0 (0.0%) | 0 (0.0%) |
| 10 or more Apartments | 0 (0.0%) | 0 (0.0%) |
| Mobile Home / Other | 1 (100.0%) | 0 (0.0%) |
| Total | 81 (94.2%) | 5 (5.8%) |
Housing Structures by Number of Rooms in Wilson
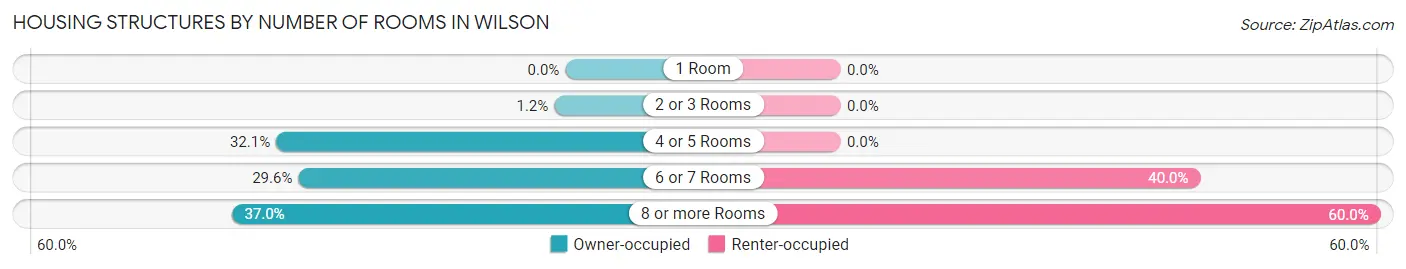
| Number of Rooms | Owner-occupied | Renter-occupied |
| 1 Room | 0 (0.0%) | 0 (0.0%) |
| 2 or 3 Rooms | 1 (1.2%) | 0 (0.0%) |
| 4 or 5 Rooms | 26 (32.1%) | 0 (0.0%) |
| 6 or 7 Rooms | 24 (29.6%) | 2 (40.0%) |
| 8 or more Rooms | 30 (37.0%) | 3 (60.0%) |
| Total | 81 (100.0%) | 5 (100.0%) |
Housing Structure by Heating Type in Wilson
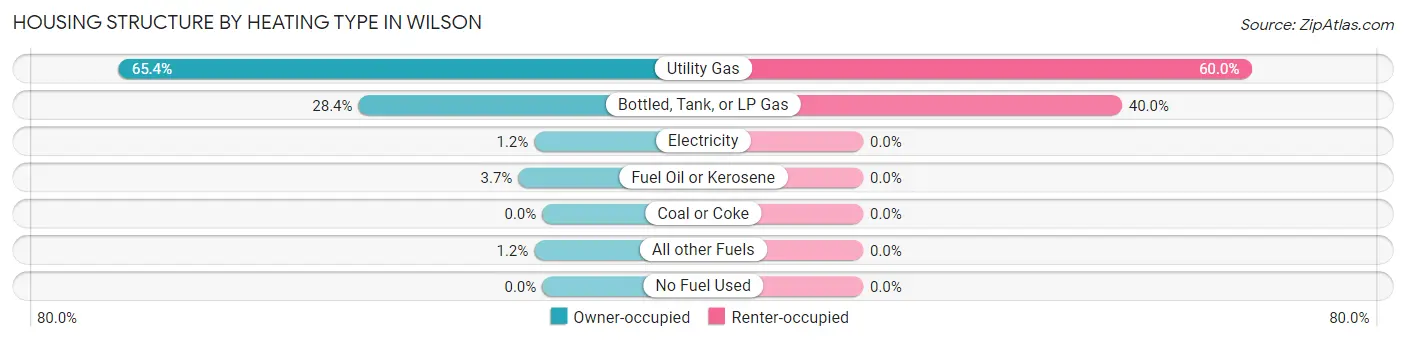
| Heating Type | Owner-occupied | Renter-occupied |
| Utility Gas | 53 (65.4%) | 3 (60.0%) |
| Bottled, Tank, or LP Gas | 23 (28.4%) | 2 (40.0%) |
| Electricity | 1 (1.2%) | 0 (0.0%) |
| Fuel Oil or Kerosene | 3 (3.7%) | 0 (0.0%) |
| Coal or Coke | 0 (0.0%) | 0 (0.0%) |
| All other Fuels | 1 (1.2%) | 0 (0.0%) |
| No Fuel Used | 0 (0.0%) | 0 (0.0%) |
| Total | 81 (100.0%) | 5 (100.0%) |
Household Vehicle Usage in Wilson
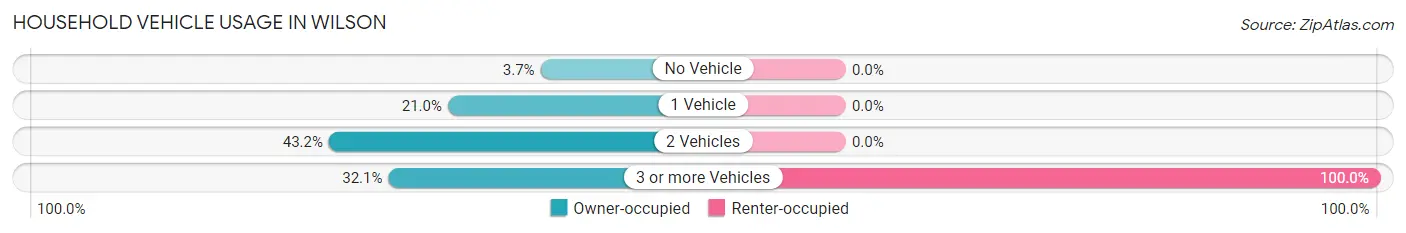
| Vehicles per Household | Owner-occupied | Renter-occupied |
| No Vehicle | 3 (3.7%) | 0 (0.0%) |
| 1 Vehicle | 17 (21.0%) | 0 (0.0%) |
| 2 Vehicles | 35 (43.2%) | 0 (0.0%) |
| 3 or more Vehicles | 26 (32.1%) | 5 (100.0%) |
| Total | 81 (100.0%) | 5 (100.0%) |
Real Estate & Mortgages in Wilson
Real Estate and Mortgage Overview in Wilson
| Characteristic | Without Mortgage | With Mortgage |
| Housing Units | 17 | 64 |
| Median Property Value | $237,500 | $177,800 |
| Median Household Income | $88,125 | $18 |
| Monthly Housing Costs | $417 | $1 |
| Real Estate Taxes | $2,625 | $1 |
Property Value by Mortgage Status in Wilson
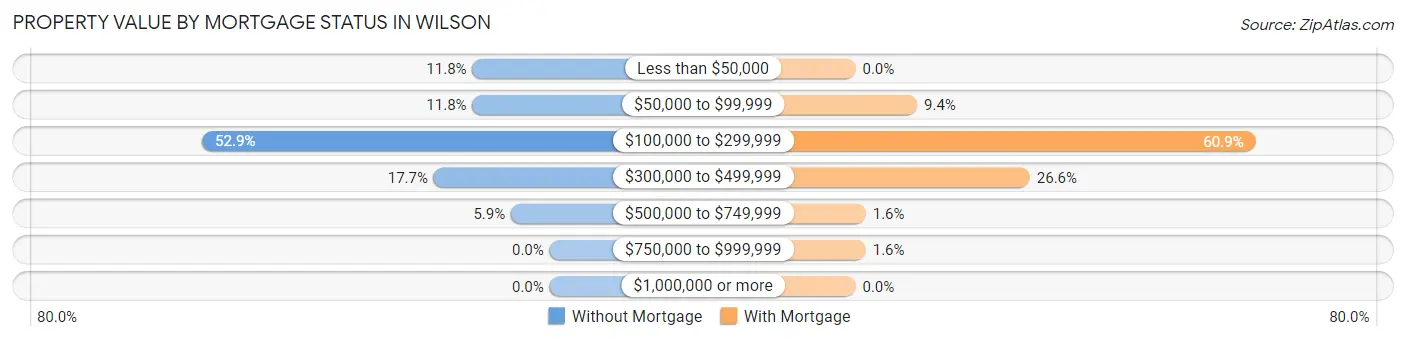
| Property Value | Without Mortgage | With Mortgage |
| Less than $50,000 | 2 (11.8%) | 0 (0.0%) |
| $50,000 to $99,999 | 2 (11.8%) | 6 (9.4%) |
| $100,000 to $299,999 | 9 (52.9%) | 39 (60.9%) |
| $300,000 to $499,999 | 3 (17.6%) | 17 (26.6%) |
| $500,000 to $749,999 | 1 (5.9%) | 1 (1.6%) |
| $750,000 to $999,999 | 0 (0.0%) | 1 (1.6%) |
| $1,000,000 or more | 0 (0.0%) | 0 (0.0%) |
| Total | 17 (100.0%) | 64 (100.0%) |
Household Income by Mortgage Status in Wilson
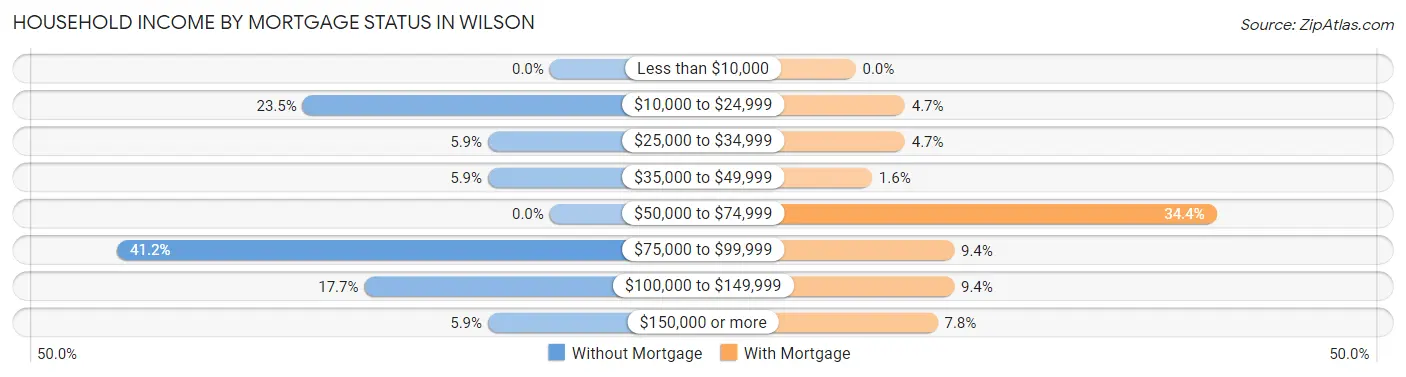
| Household Income | Without Mortgage | With Mortgage |
| Less than $10,000 | 0 (0.0%) | 0 (0.0%) |
| $10,000 to $24,999 | 4 (23.5%) | 3 (4.7%) |
| $25,000 to $34,999 | 1 (5.9%) | 3 (4.7%) |
| $35,000 to $49,999 | 1 (5.9%) | 1 (1.6%) |
| $50,000 to $74,999 | 0 (0.0%) | 22 (34.4%) |
| $75,000 to $99,999 | 7 (41.2%) | 6 (9.4%) |
| $100,000 to $149,999 | 3 (17.6%) | 6 (9.4%) |
| $150,000 or more | 1 (5.9%) | 5 (7.8%) |
| Total | 17 (100.0%) | 64 (100.0%) |
Property Value to Household Income Ratio in Wilson
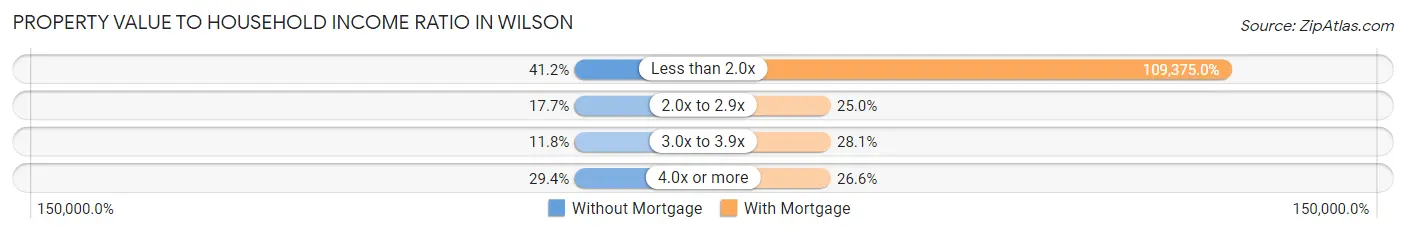
| Value-to-Income Ratio | Without Mortgage | With Mortgage |
| Less than 2.0x | 7 (41.2%) | 70,000 (109,375.0%) |
| 2.0x to 2.9x | 3 (17.6%) | 16 (25.0%) |
| 3.0x to 3.9x | 2 (11.8%) | 18 (28.1%) |
| 4.0x or more | 5 (29.4%) | 17 (26.6%) |
| Total | 17 (100.0%) | 64 (100.0%) |
Real Estate Taxes by Mortgage Status in Wilson
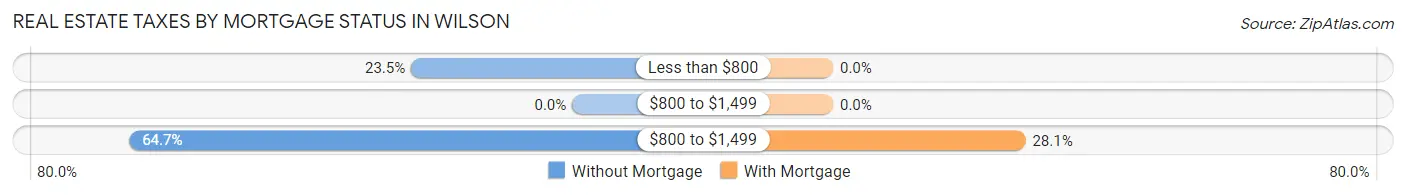
| Property Taxes | Without Mortgage | With Mortgage |
| Less than $800 | 4 (23.5%) | 0 (0.0%) |
| $800 to $1,499 | 0 (0.0%) | 0 (0.0%) |
| $800 to $1,499 | 11 (64.7%) | 18 (28.1%) |
| Total | 17 (100.0%) | 64 (100.0%) |
Health & Disability in Wilson
Health Insurance Coverage by Age in Wilson
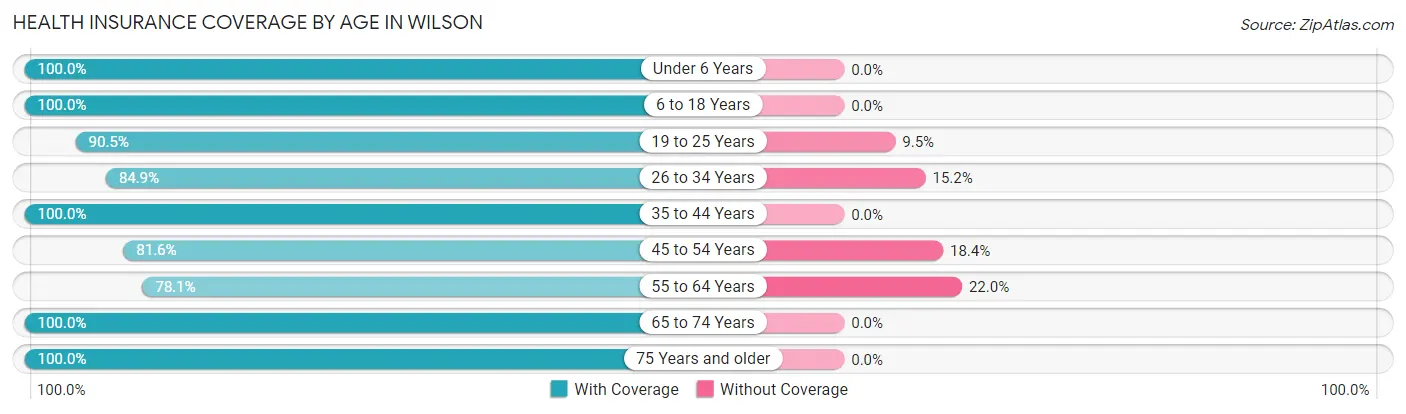
| Age Bracket | With Coverage | Without Coverage |
| Under 6 Years | 15 (100.0%) | 0 (0.0%) |
| 6 to 18 Years | 29 (100.0%) | 0 (0.0%) |
| 19 to 25 Years | 19 (90.5%) | 2 (9.5%) |
| 26 to 34 Years | 28 (84.9%) | 5 (15.1%) |
| 35 to 44 Years | 25 (100.0%) | 0 (0.0%) |
| 45 to 54 Years | 31 (81.6%) | 7 (18.4%) |
| 55 to 64 Years | 32 (78.0%) | 9 (22.0%) |
| 65 to 74 Years | 12 (100.0%) | 0 (0.0%) |
| 75 Years and older | 10 (100.0%) | 0 (0.0%) |
| Total | 201 (89.7%) | 23 (10.3%) |
Health Insurance Coverage by Citizenship Status in Wilson
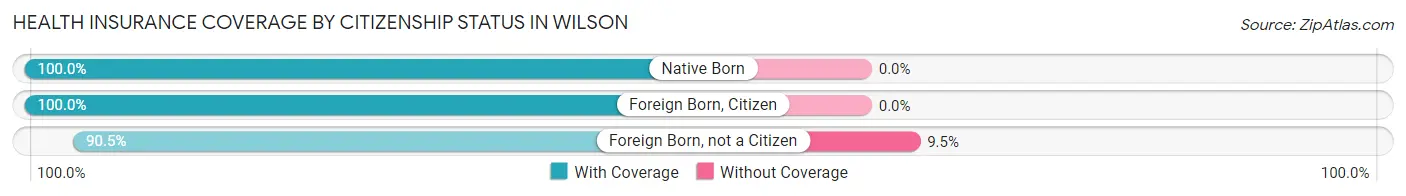
| Citizenship Status | With Coverage | Without Coverage |
| Native Born | 15 (100.0%) | 0 (0.0%) |
| Foreign Born, Citizen | 29 (100.0%) | 0 (0.0%) |
| Foreign Born, not a Citizen | 19 (90.5%) | 2 (9.5%) |
Health Insurance Coverage by Household Income in Wilson
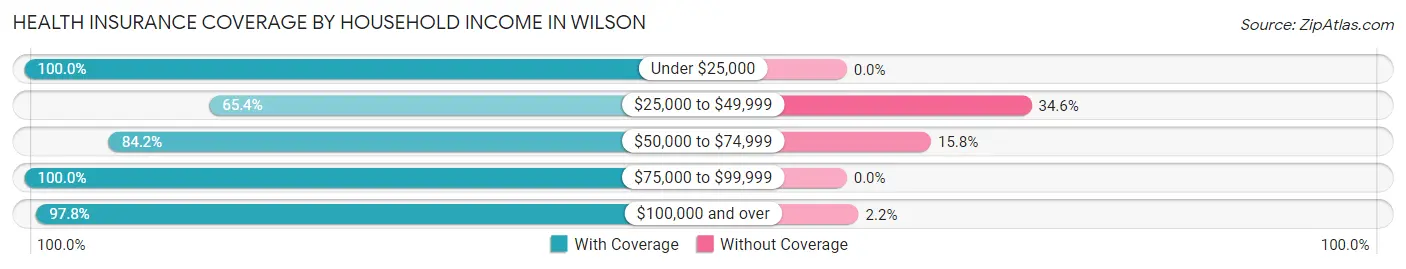
| Household Income | With Coverage | Without Coverage |
| Under $25,000 | 11 (100.0%) | 0 (0.0%) |
| $25,000 to $49,999 | 34 (65.4%) | 18 (34.6%) |
| $50,000 to $74,999 | 16 (84.2%) | 3 (15.8%) |
| $75,000 to $99,999 | 52 (100.0%) | 0 (0.0%) |
| $100,000 and over | 88 (97.8%) | 2 (2.2%) |
Public vs Private Health Insurance Coverage by Age in Wilson
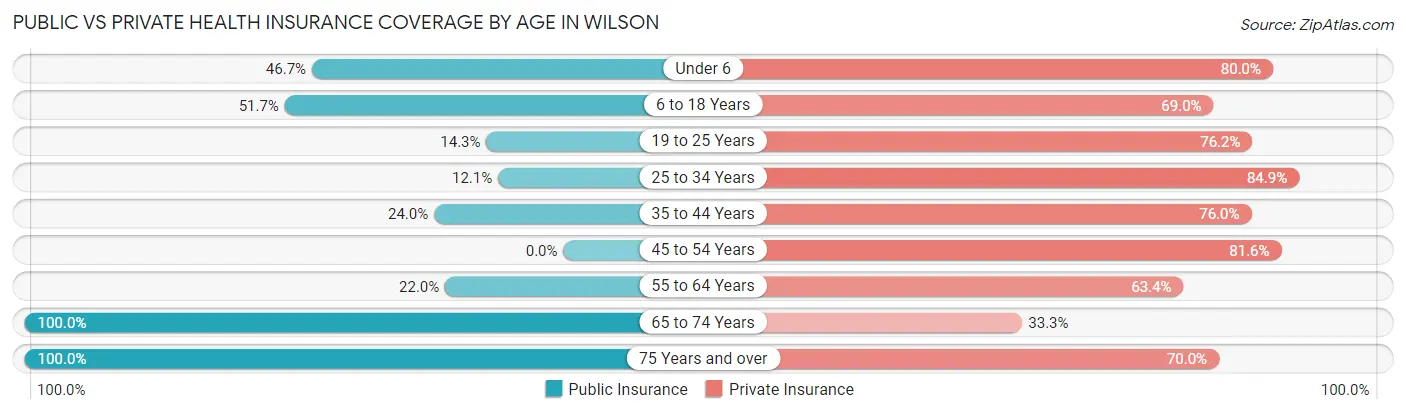
| Age Bracket | Public Insurance | Private Insurance |
| Under 6 | 7 (46.7%) | 12 (80.0%) |
| 6 to 18 Years | 15 (51.7%) | 20 (69.0%) |
| 19 to 25 Years | 3 (14.3%) | 16 (76.2%) |
| 25 to 34 Years | 4 (12.1%) | 28 (84.9%) |
| 35 to 44 Years | 6 (24.0%) | 19 (76.0%) |
| 45 to 54 Years | 0 (0.0%) | 31 (81.6%) |
| 55 to 64 Years | 9 (22.0%) | 26 (63.4%) |
| 65 to 74 Years | 12 (100.0%) | 4 (33.3%) |
| 75 Years and over | 10 (100.0%) | 7 (70.0%) |
| Total | 66 (29.5%) | 163 (72.8%) |
Disability Status by Sex by Age in Wilson
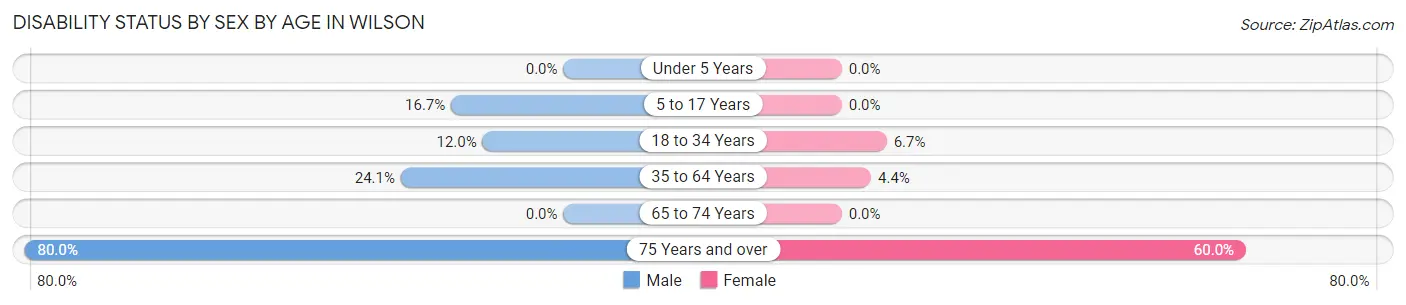
| Age Bracket | Male | Female |
| Under 5 Years | 0 (0.0%) | 0 (0.0%) |
| 5 to 17 Years | 3 (16.7%) | 0 (0.0%) |
| 18 to 34 Years | 3 (12.0%) | 2 (6.7%) |
| 35 to 64 Years | 14 (24.1%) | 2 (4.3%) |
| 65 to 74 Years | 0 (0.0%) | 0 (0.0%) |
| 75 Years and over | 4 (80.0%) | 3 (60.0%) |
Disability Class by Sex by Age in Wilson
Disability Class: Hearing Difficulty
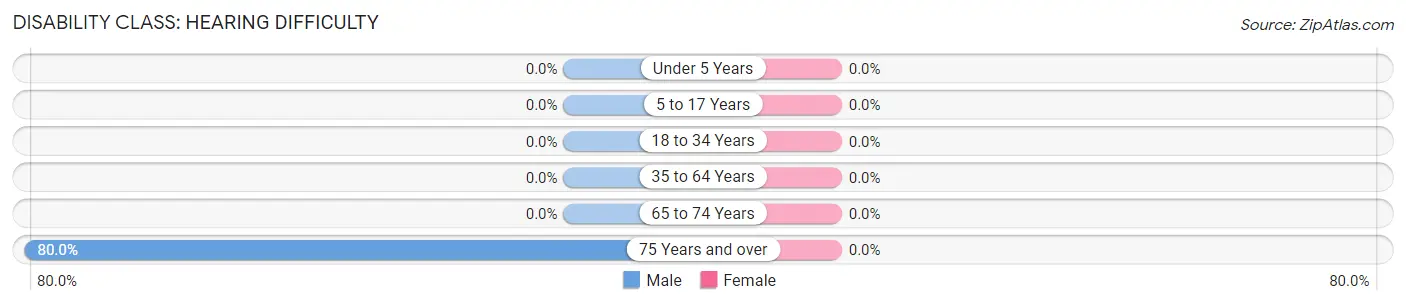
| Age Bracket | Male | Female |
| Under 5 Years | 0 (0.0%) | 0 (0.0%) |
| 5 to 17 Years | 0 (0.0%) | 0 (0.0%) |
| 18 to 34 Years | 0 (0.0%) | 0 (0.0%) |
| 35 to 64 Years | 0 (0.0%) | 0 (0.0%) |
| 65 to 74 Years | 0 (0.0%) | 0 (0.0%) |
| 75 Years and over | 4 (80.0%) | 0 (0.0%) |
Disability Class: Vision Difficulty
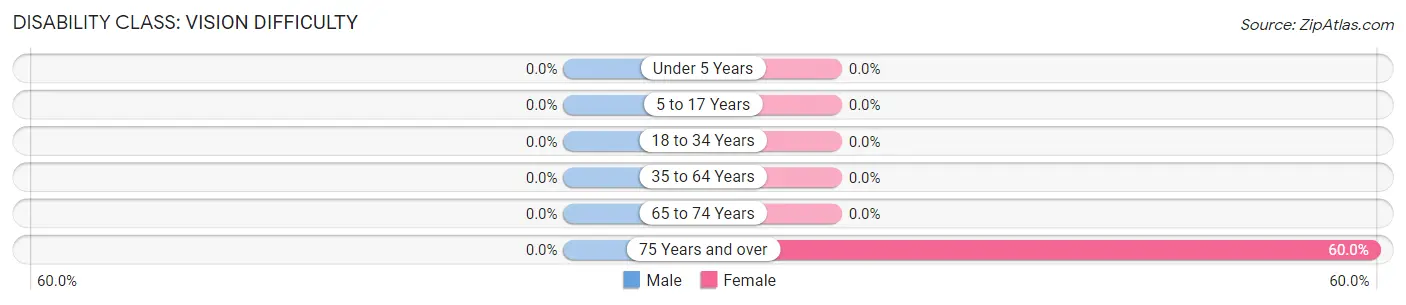
| Age Bracket | Male | Female |
| Under 5 Years | 0 (0.0%) | 0 (0.0%) |
| 5 to 17 Years | 0 (0.0%) | 0 (0.0%) |
| 18 to 34 Years | 0 (0.0%) | 0 (0.0%) |
| 35 to 64 Years | 0 (0.0%) | 0 (0.0%) |
| 65 to 74 Years | 0 (0.0%) | 0 (0.0%) |
| 75 Years and over | 0 (0.0%) | 3 (60.0%) |
Disability Class: Cognitive Difficulty
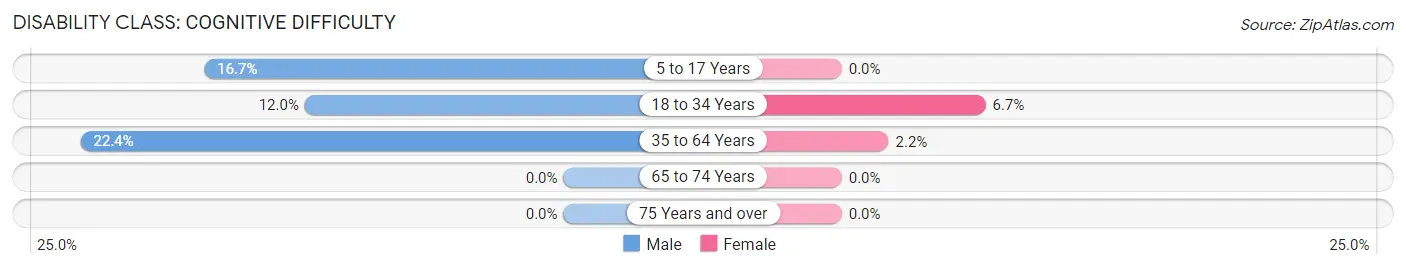
| Age Bracket | Male | Female |
| 5 to 17 Years | 3 (16.7%) | 0 (0.0%) |
| 18 to 34 Years | 3 (12.0%) | 2 (6.7%) |
| 35 to 64 Years | 13 (22.4%) | 1 (2.2%) |
| 65 to 74 Years | 0 (0.0%) | 0 (0.0%) |
| 75 Years and over | 0 (0.0%) | 0 (0.0%) |
Disability Class: Ambulatory Difficulty
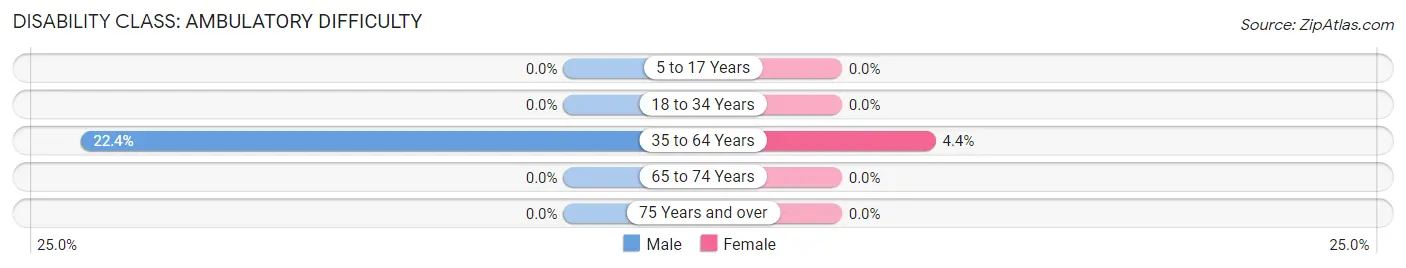
| Age Bracket | Male | Female |
| 5 to 17 Years | 0 (0.0%) | 0 (0.0%) |
| 18 to 34 Years | 0 (0.0%) | 0 (0.0%) |
| 35 to 64 Years | 13 (22.4%) | 2 (4.3%) |
| 65 to 74 Years | 0 (0.0%) | 0 (0.0%) |
| 75 Years and over | 0 (0.0%) | 0 (0.0%) |
Disability Class: Self-Care Difficulty
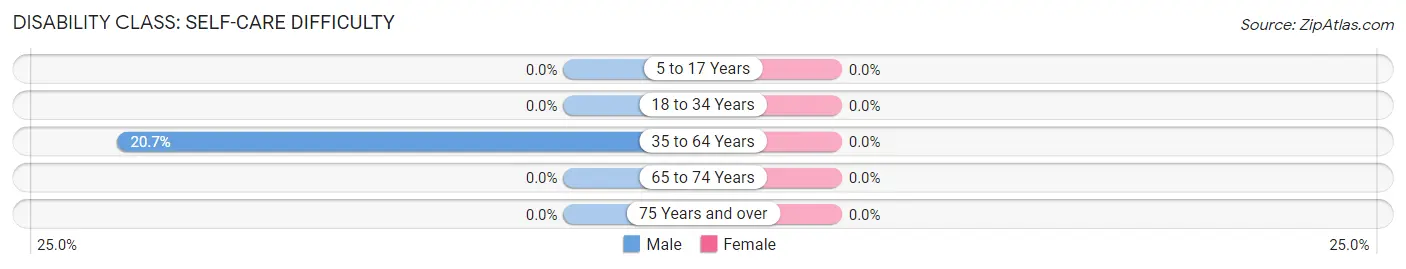
| Age Bracket | Male | Female |
| 5 to 17 Years | 0 (0.0%) | 0 (0.0%) |
| 18 to 34 Years | 0 (0.0%) | 0 (0.0%) |
| 35 to 64 Years | 12 (20.7%) | 0 (0.0%) |
| 65 to 74 Years | 0 (0.0%) | 0 (0.0%) |
| 75 Years and over | 0 (0.0%) | 0 (0.0%) |
Technology Access in Wilson
Computing Device Access in Wilson
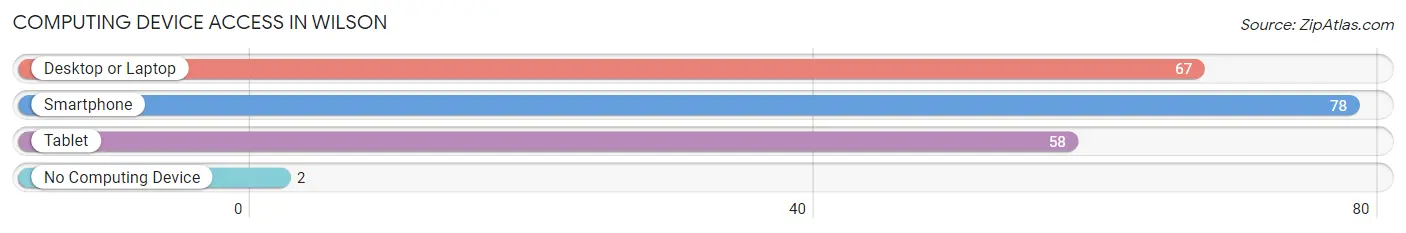
| Device Type | # Households | % Households |
| Desktop or Laptop | 67 | 77.9% |
| Smartphone | 78 | 90.7% |
| Tablet | 58 | 67.4% |
| No Computing Device | 2 | 2.3% |
| Total | 86 | 100.0% |
Internet Access in Wilson
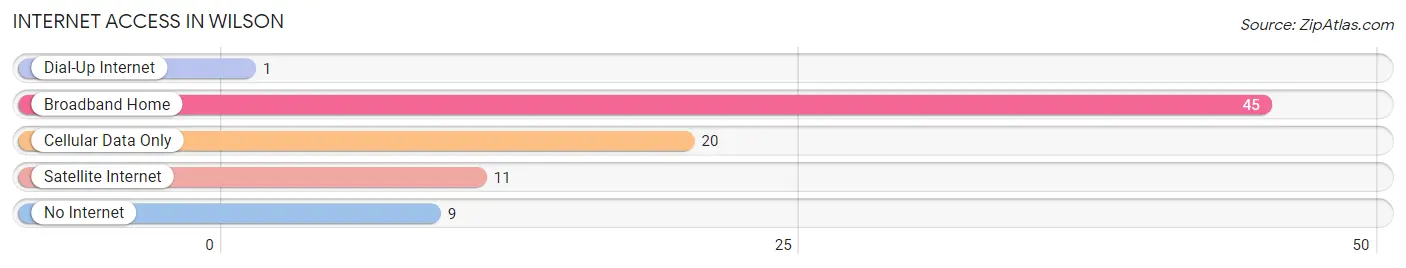
| Internet Type | # Households | % Households |
| Dial-Up Internet | 1 | 1.2% |
| Broadband Home | 45 | 52.3% |
| Cellular Data Only | 20 | 23.3% |
| Satellite Internet | 11 | 12.8% |
| No Internet | 9 | 10.5% |
| Total | 86 | 100.0% |
Wilson Summary
Wilson, Wisconsin is a small village located in the southeastern corner of the state, in the county of Ozaukee. It is situated on the western shore of Lake Michigan, and is part of the Milwaukee metropolitan area. The village has a population of approximately 1,500 people, and is known for its small-town charm and rural atmosphere.
History
The area that is now Wilson was first settled in the early 1800s by German immigrants. The village was originally known as “New Berlin”, and was incorporated in 1848. The name was changed to Wilson in 1854, in honor of the first postmaster, William Wilson.
In the late 1800s, Wilson was a thriving agricultural community, with a variety of crops being grown in the area. The village was also home to several small businesses, including a sawmill, a grist mill, and a cheese factory.
In the early 1900s, Wilson began to experience a period of growth and development. The village was connected to the Milwaukee and Northern Railroad in 1906, and the first paved road was built in 1910. The village also saw the construction of several new buildings, including a school, a library, and a post office.
Geography
Wilson is located in the southeastern corner of Wisconsin, in Ozaukee County. It is situated on the western shore of Lake Michigan, and is part of the Milwaukee metropolitan area. The village is bordered by the towns of Grafton to the north, Cedarburg to the east, and Port Washington to the south.
The village is located on a flat plain, with an elevation of approximately 700 feet above sea level. The area is characterized by rolling hills, wooded areas, and small lakes. The climate is generally mild, with cold winters and warm summers.
Economy
Wilson’s economy is largely based on agriculture and tourism. The village is home to several small businesses, including a grocery store, a hardware store, and a restaurant. The village also has a small industrial park, which is home to several light manufacturing companies.
Tourism is an important part of the local economy, with visitors coming to the area to enjoy the rural atmosphere and small-town charm. The village is home to several parks and recreational areas, including a public beach on Lake Michigan.
Demographics
As of the 2010 census, the population of Wilson was 1,500 people. The racial makeup of the village was 97.3% White, 0.7% African American, 0.3% Native American, 0.3% Asian, and 1.3% from other races. The median household income was $50,000, and the median age was 43.
Wilson is a small, rural village with a strong sense of community. The village is home to a variety of churches, schools, and other organizations, and is known for its friendly atmosphere and welcoming attitude.
Common Questions
What is Per Capita Income in Wilson?
Per Capita income in Wilson is $35,758.
What is the Median Family Income in Wilson?
Median Family Income in Wilson is $86,250.
What is the Median Household income in Wilson?
Median Household Income in Wilson is $75,000.
What is Income or Wage Gap in Wilson?
Income or Wage Gap in Wilson is 29.6%.
Women in Wilson earn 70.4 cents for every dollar earned by a man.
What is Inequality or Gini Index in Wilson?
Inequality or Gini Index in Wilson is 0.38.
What is the Total Population of Wilson?
Total Population of Wilson is 224.
What is the Total Male Population of Wilson?
Total Male Population of Wilson is 113.
What is the Total Female Population of Wilson?
Total Female Population of Wilson is 111.
What is the Ratio of Males per 100 Females in Wilson?
There are 101.80 Males per 100 Females in Wilson.
What is the Ratio of Females per 100 Males in Wilson?
There are 98.23 Females per 100 Males in Wilson.
What is the Median Population Age in Wilson?
Median Population Age in Wilson is 39.3 Years.
What is the Average Family Size in Wilson
Average Family Size in Wilson is 3.2 People.
What is the Average Household Size in Wilson
Average Household Size in Wilson is 2.6 People.
How Large is the Labor Force in Wilson?
There are 139 People in the Labor Forcein in Wilson.
What is the Percentage of People in the Labor Force in Wilson?
73.2% of People are in the Labor Force in Wilson.
What is the Unemployment Rate in Wilson?
Unemployment Rate in Wilson is 10.8%.