Williams Bay, WI Map & Demographics
Williams Bay Map
Williams Bay Overview
$50,238
PER CAPITA INCOME
$119,199
AVG FAMILY INCOME
$71,250
AVG HOUSEHOLD INCOME
42.1%
WAGE / INCOME GAP [ % ]
57.9¢/ $1
WAGE / INCOME GAP [ $ ]
0.53
INEQUALITY / GINI INDEX
2,947
TOTAL POPULATION
1,394
MALE POPULATION
1,553
FEMALE POPULATION
89.76
MALES / 100 FEMALES
111.41
FEMALES / 100 MALES
48.2
MEDIAN AGE
3.2
AVG FAMILY SIZE
2.4
AVG HOUSEHOLD SIZE
1,288
LABOR FORCE [ PEOPLE ]
55.1%
PERCENT IN LABOR FORCE
4.1%
UNEMPLOYMENT RATE
Williams Bay Zip Codes
Williams Bay Area Codes
Income in Williams Bay
Income Overview in Williams Bay
Per Capita Income in Williams Bay is $50,238, while median incomes of families and households are $119,199 and $71,250 respectively.
| Characteristic | Number | Measure |
| Per Capita Income | 2,947 | $50,238 |
| Median Family Income | 723 | $119,199 |
| Mean Family Income | 723 | $163,556 |
| Median Household Income | 1,212 | $71,250 |
| Mean Household Income | 1,212 | $116,948 |
| Income Deficit | 723 | $0 |
| Wage / Income Gap (%) | 2,947 | 42.14% |
| Wage / Income Gap ($) | 2,947 | 57.86¢ per $1 |
| Gini / Inequality Index | 2,947 | 0.53 |
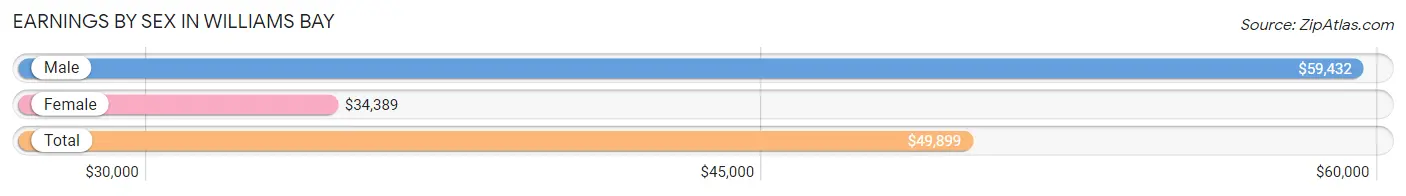
Earnings by Sex in Williams Bay
Average Earnings in Williams Bay are $49,899, $59,432 for men and $34,389 for women, a difference of 42.1%.
| Sex | Number | Average Earnings |
| Male | 781 (56.2%) | $59,432 |
| Female | 608 (43.8%) | $34,389 |
| Total | 1,389 (100.0%) | $49,899 |
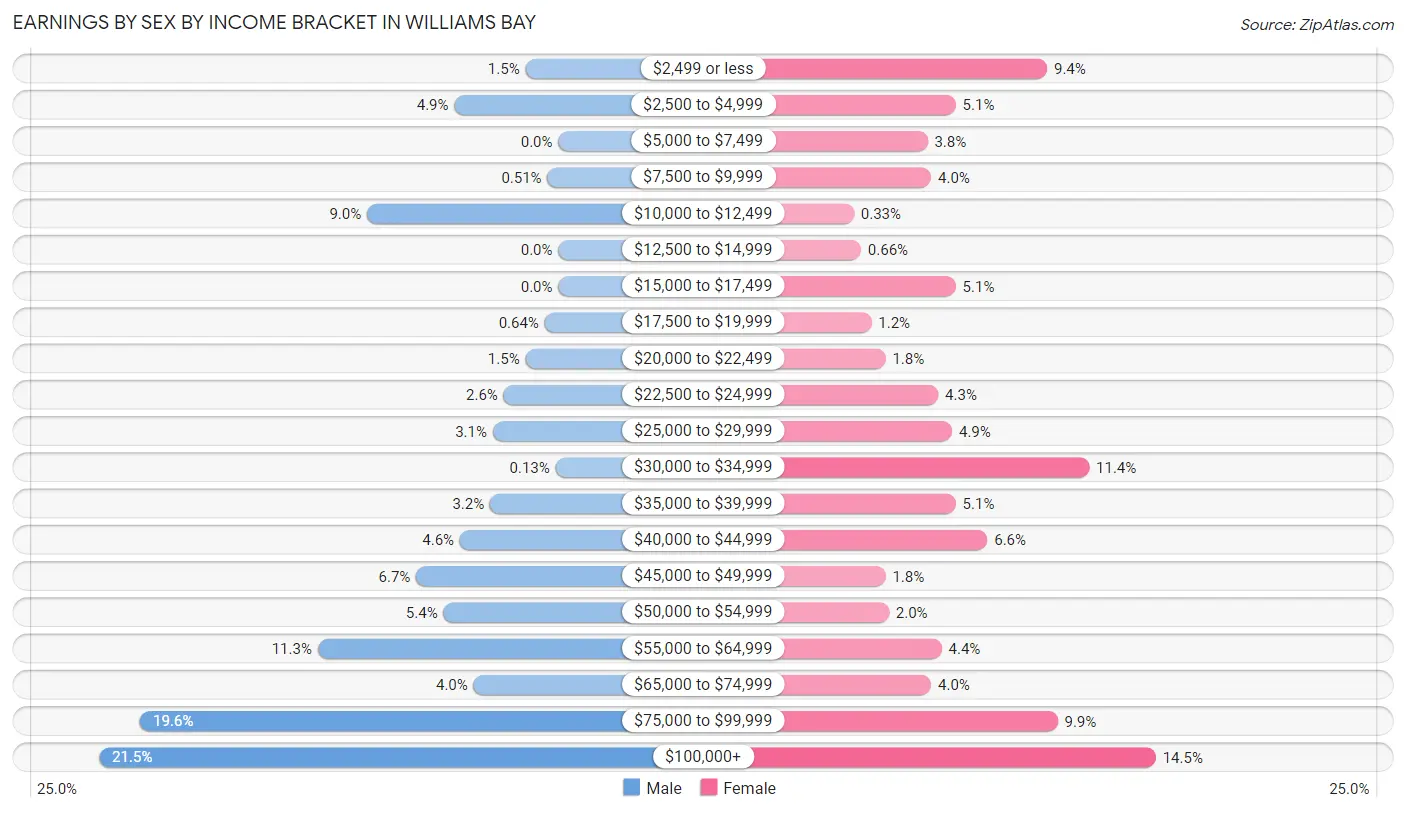
Earnings by Sex by Income Bracket in Williams Bay
The most common earnings brackets in Williams Bay are $100,000+ for men (168 | 21.5%) and $100,000+ for women (88 | 14.5%).
| Income | Male | Female |
| $2,499 or less | 12 (1.5%) | 57 (9.4%) |
| $2,500 to $4,999 | 38 (4.9%) | 31 (5.1%) |
| $5,000 to $7,499 | 0 (0.0%) | 23 (3.8%) |
| $7,500 to $9,999 | 4 (0.5%) | 24 (4.0%) |
| $10,000 to $12,499 | 70 (9.0%) | 2 (0.3%) |
| $12,500 to $14,999 | 0 (0.0%) | 4 (0.7%) |
| $15,000 to $17,499 | 0 (0.0%) | 31 (5.1%) |
| $17,500 to $19,999 | 5 (0.6%) | 7 (1.1%) |
| $20,000 to $22,499 | 12 (1.5%) | 11 (1.8%) |
| $22,500 to $24,999 | 20 (2.6%) | 26 (4.3%) |
| $25,000 to $29,999 | 24 (3.1%) | 30 (4.9%) |
| $30,000 to $34,999 | 1 (0.1%) | 69 (11.4%) |
| $35,000 to $39,999 | 25 (3.2%) | 31 (5.1%) |
| $40,000 to $44,999 | 36 (4.6%) | 40 (6.6%) |
| $45,000 to $49,999 | 52 (6.7%) | 11 (1.8%) |
| $50,000 to $54,999 | 42 (5.4%) | 12 (2.0%) |
| $55,000 to $64,999 | 88 (11.3%) | 27 (4.4%) |
| $65,000 to $74,999 | 31 (4.0%) | 24 (4.0%) |
| $75,000 to $99,999 | 153 (19.6%) | 60 (9.9%) |
| $100,000+ | 168 (21.5%) | 88 (14.5%) |
| Total | 781 (100.0%) | 608 (100.0%) |
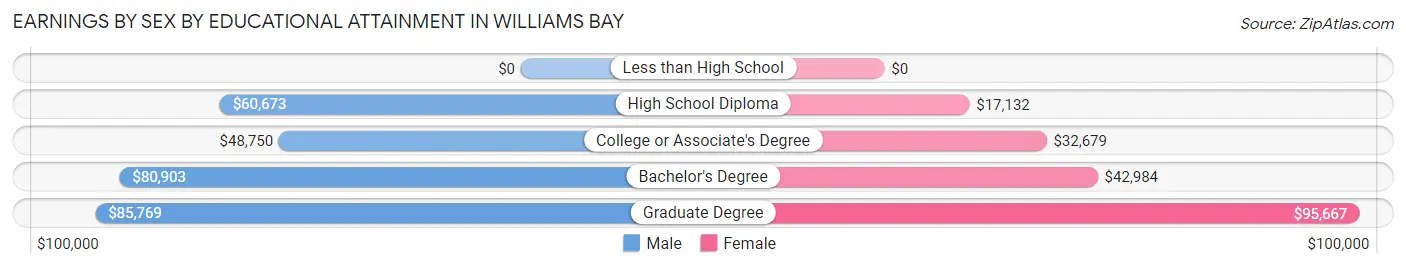
Earnings by Sex by Educational Attainment in Williams Bay
Average earnings in Williams Bay are $63,533 for men and $39,444 for women, a difference of 37.9%. Men with an educational attainment of graduate degree enjoy the highest average annual earnings of $85,769, while those with college or associate's degree education earn the least with $48,750. Women with an educational attainment of graduate degree earn the most with the average annual earnings of $95,667, while those with high school diploma education have the smallest earnings of $17,132.
| Educational Attainment | Male Income | Female Income |
| Less than High School | - | - |
| High School Diploma | $60,673 | $17,132 |
| College or Associate's Degree | $48,750 | $32,679 |
| Bachelor's Degree | $80,903 | $42,984 |
| Graduate Degree | $85,769 | $95,667 |
| Total | $63,533 | $39,444 |
Family Income in Williams Bay
Family Income Brackets in Williams Bay
According to the Williams Bay family income data, there are 175 families falling into the $100,000 to $149,999 income range, which is the most common income bracket and makes up 24.2% of all families.
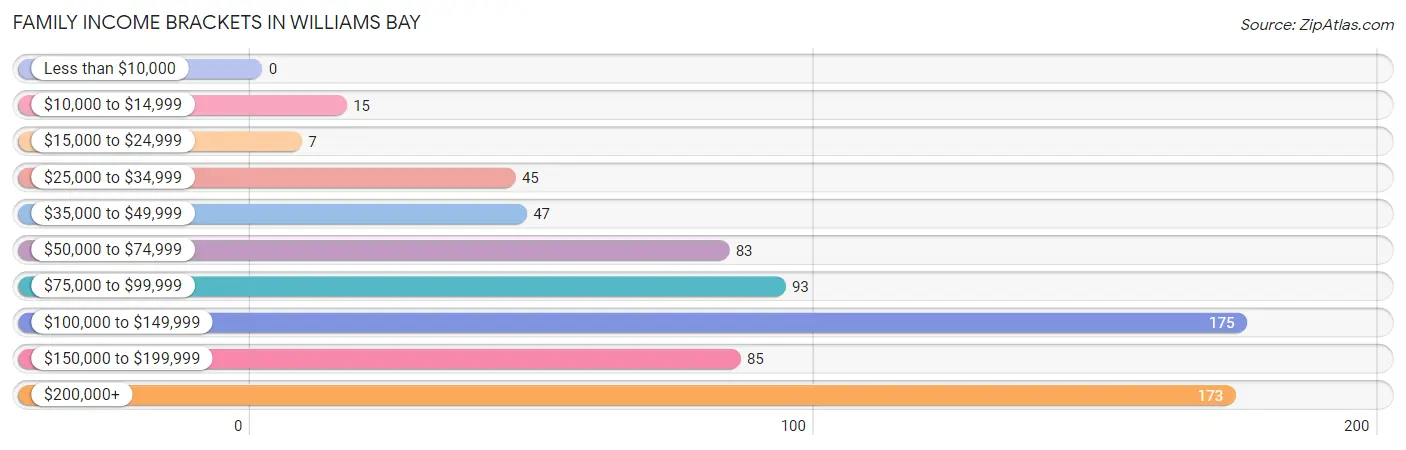
| Income Bracket | # Families | % Families |
| Less than $10,000 | 0 | 0.0% |
| $10,000 to $14,999 | 15 | 2.1% |
| $15,000 to $24,999 | 7 | 1.0% |
| $25,000 to $34,999 | 45 | 6.2% |
| $35,000 to $49,999 | 47 | 6.5% |
| $50,000 to $74,999 | 83 | 11.5% |
| $75,000 to $99,999 | 93 | 12.9% |
| $100,000 to $149,999 | 175 | 24.2% |
| $150,000 to $199,999 | 85 | 11.8% |
| $200,000+ | 173 | 23.9% |
Family Income by Famaliy Size in Williams Bay
6-person families (30 | 4.2%) account for the highest median family income in Williams Bay with $250,001 per family, while 2-person families (355 | 49.1%) have the highest median income of $48,906 per family member.
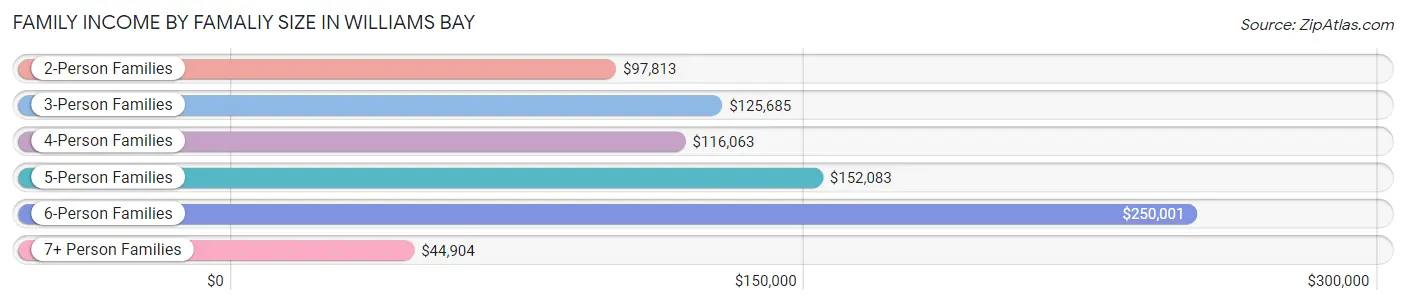
| Income Bracket | # Families | Median Income |
| 2-Person Families | 355 (49.1%) | $97,813 |
| 3-Person Families | 177 (24.5%) | $125,685 |
| 4-Person Families | 101 (14.0%) | $116,063 |
| 5-Person Families | 35 (4.8%) | $152,083 |
| 6-Person Families | 30 (4.2%) | $250,001 |
| 7+ Person Families | 25 (3.5%) | $44,904 |
| Total | 723 (100.0%) | $119,199 |
Family Income by Number of Earners in Williams Bay
The median family income in Williams Bay is $119,199, with families comprising 2 earners (320) having the highest median family income of $150,000, while families with no earners (119) have the lowest median family income of $77,031, accounting for 44.3% and 16.5% of families, respectively.
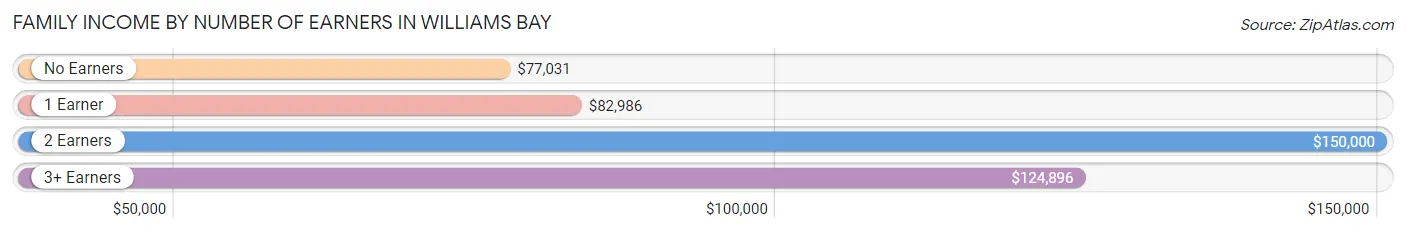
| Number of Earners | # Families | Median Income |
| No Earners | 119 (16.5%) | $77,031 |
| 1 Earner | 239 (33.1%) | $82,986 |
| 2 Earners | 320 (44.3%) | $150,000 |
| 3+ Earners | 45 (6.2%) | $124,896 |
| Total | 723 (100.0%) | $119,199 |
Household Income in Williams Bay
Household Income Brackets in Williams Bay
With 218 households falling in the category, the $100,000 to $149,999 income range is the most frequent in Williams Bay, accounting for 18.0% of all households. In contrast, only 22 households (1.8%) fall into the less than $10,000 income bracket, making it the least populous group.
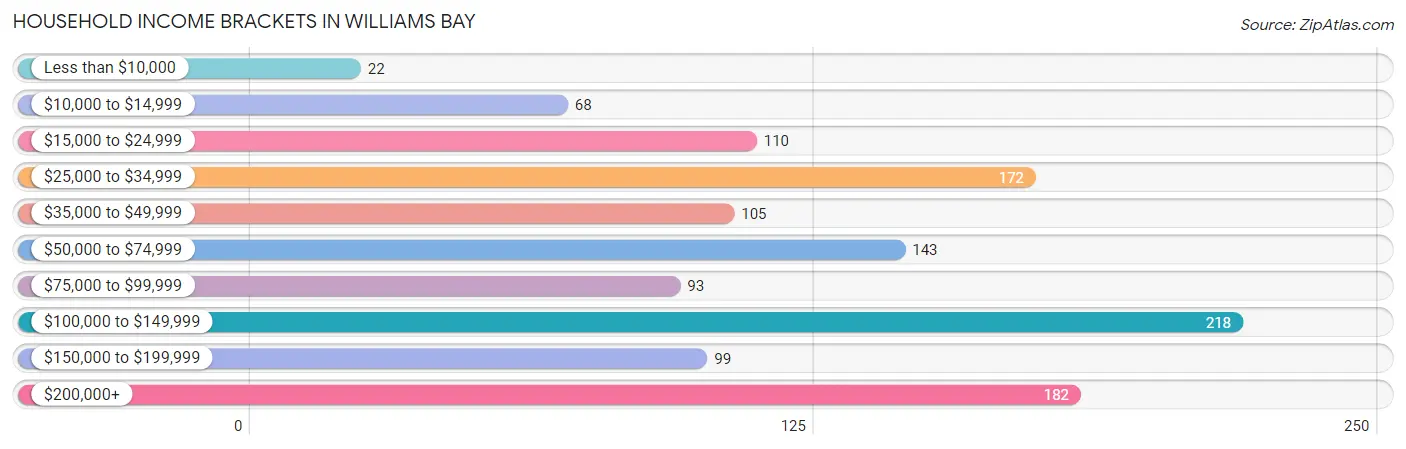
| Income Bracket | # Households | % Households |
| Less than $10,000 | 22 | 1.8% |
| $10,000 to $14,999 | 68 | 5.6% |
| $15,000 to $24,999 | 110 | 9.1% |
| $25,000 to $34,999 | 172 | 14.2% |
| $35,000 to $49,999 | 105 | 8.7% |
| $50,000 to $74,999 | 143 | 11.8% |
| $75,000 to $99,999 | 93 | 7.7% |
| $100,000 to $149,999 | 218 | 18.0% |
| $150,000 to $199,999 | 99 | 8.2% |
| $200,000+ | 182 | 15.0% |
Household Income by Householder Age in Williams Bay
The median household income in Williams Bay is $71,250, with the highest median household income of $116,625 found in the 45 to 64 years age bracket for the primary householder. A total of 468 households (38.6%) fall into this category. Meanwhile, the 15 to 24 years age bracket for the primary householder has the lowest median household income of $0, with 31 households (2.6%) in this group.
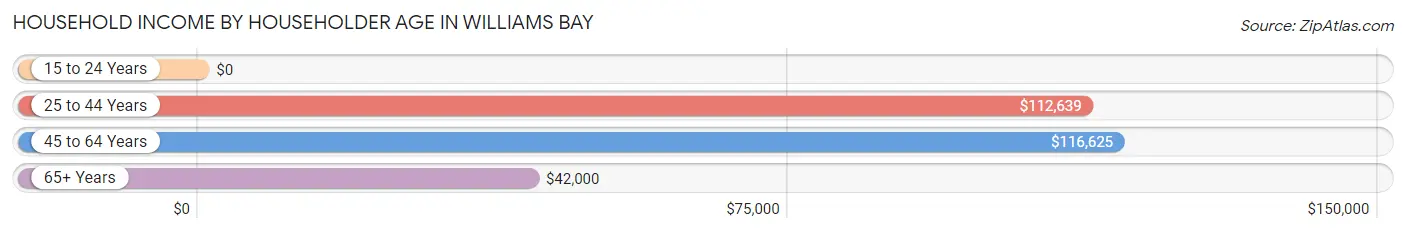
| Income Bracket | # Households | Median Income |
| 15 to 24 Years | 31 (2.6%) | $0 |
| 25 to 44 Years | 247 (20.4%) | $112,639 |
| 45 to 64 Years | 468 (38.6%) | $116,625 |
| 65+ Years | 466 (38.5%) | $42,000 |
| Total | 1,212 (100.0%) | $71,250 |
Poverty in Williams Bay
Income Below Poverty by Sex and Age in Williams Bay
With 12.0% poverty level for males and 7.4% for females among the residents of Williams Bay, 16 and 17 year old males and 12 to 14 year old females are the most vulnerable to poverty, with 51 males (65.4%) and 23 females (34.8%) in their respective age groups living below the poverty level.
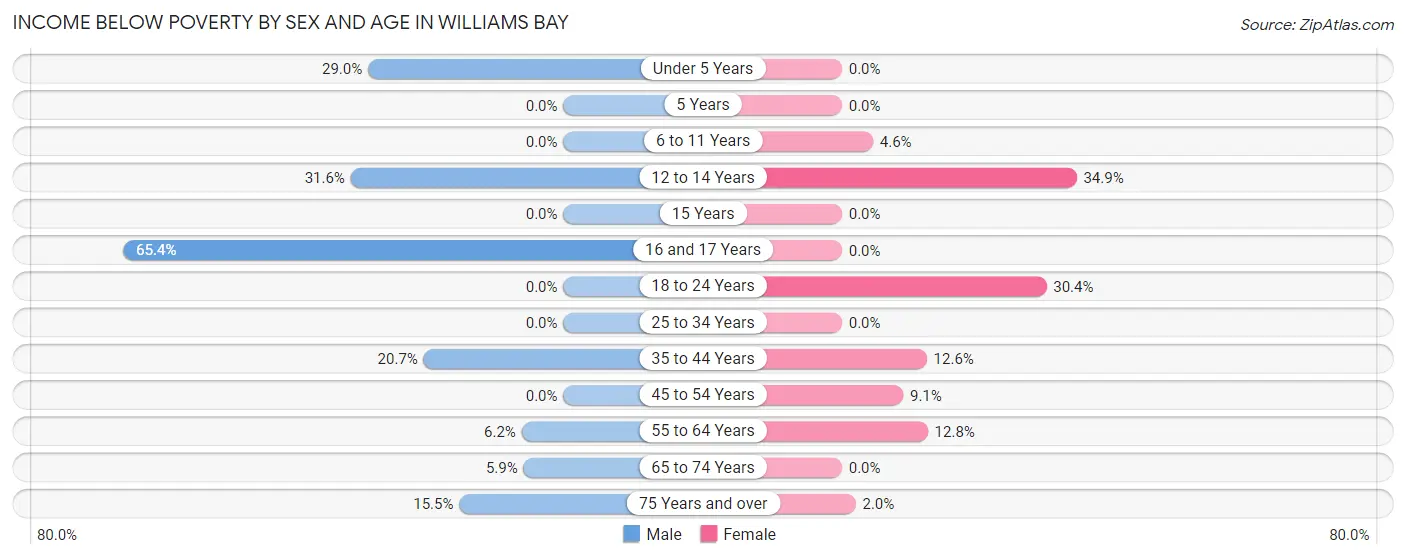
| Age Bracket | Male | Female |
| Under 5 Years | 29 (29.0%) | 0 (0.0%) |
| 5 Years | 0 (0.0%) | 0 (0.0%) |
| 6 to 11 Years | 0 (0.0%) | 7 (4.6%) |
| 12 to 14 Years | 12 (31.6%) | 23 (34.8%) |
| 15 Years | 0 (0.0%) | 0 (0.0%) |
| 16 and 17 Years | 51 (65.4%) | 0 (0.0%) |
| 18 to 24 Years | 0 (0.0%) | 17 (30.4%) |
| 25 to 34 Years | 0 (0.0%) | 0 (0.0%) |
| 35 to 44 Years | 28 (20.7%) | 16 (12.6%) |
| 45 to 54 Years | 0 (0.0%) | 18 (9.1%) |
| 55 to 64 Years | 13 (6.2%) | 26 (12.8%) |
| 65 to 74 Years | 15 (5.9%) | 0 (0.0%) |
| 75 Years and over | 17 (15.4%) | 5 (2.0%) |
| Total | 165 (12.0%) | 112 (7.4%) |
Income Above Poverty by Sex and Age in Williams Bay
According to the poverty statistics in Williams Bay, males aged 5 years and females aged under 5 years are the age groups that are most secure financially, with 100.0% of males and 100.0% of females in these age groups living above the poverty line.
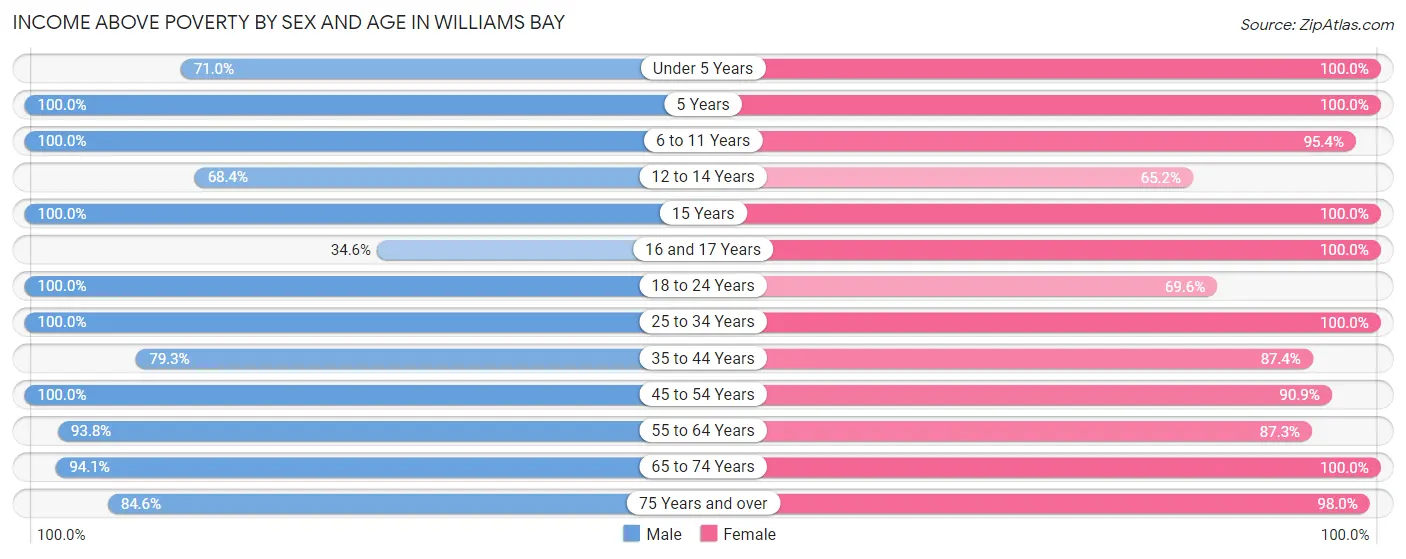
| Age Bracket | Male | Female |
| Under 5 Years | 71 (71.0%) | 125 (100.0%) |
| 5 Years | 19 (100.0%) | 17 (100.0%) |
| 6 to 11 Years | 73 (100.0%) | 145 (95.4%) |
| 12 to 14 Years | 26 (68.4%) | 43 (65.1%) |
| 15 Years | 7 (100.0%) | 12 (100.0%) |
| 16 and 17 Years | 27 (34.6%) | 12 (100.0%) |
| 18 to 24 Years | 64 (100.0%) | 39 (69.6%) |
| 25 to 34 Years | 97 (100.0%) | 136 (100.0%) |
| 35 to 44 Years | 107 (79.3%) | 111 (87.4%) |
| 45 to 54 Years | 192 (100.0%) | 180 (90.9%) |
| 55 to 64 Years | 197 (93.8%) | 178 (87.3%) |
| 65 to 74 Years | 239 (94.1%) | 159 (100.0%) |
| 75 Years and over | 93 (84.6%) | 240 (98.0%) |
| Total | 1,212 (88.0%) | 1,397 (92.6%) |
Income Below Poverty Among Married-Couple Families in Williams Bay
The poverty statistics for married-couple families in Williams Bay show that 2.2% or 13 of the total 591 families live below the poverty line. Families with 5 or more children have the highest poverty rate of 52.0%, comprising of 13 families. On the other hand, families with no children have the lowest poverty rate of 0.0%, which includes 0 families.
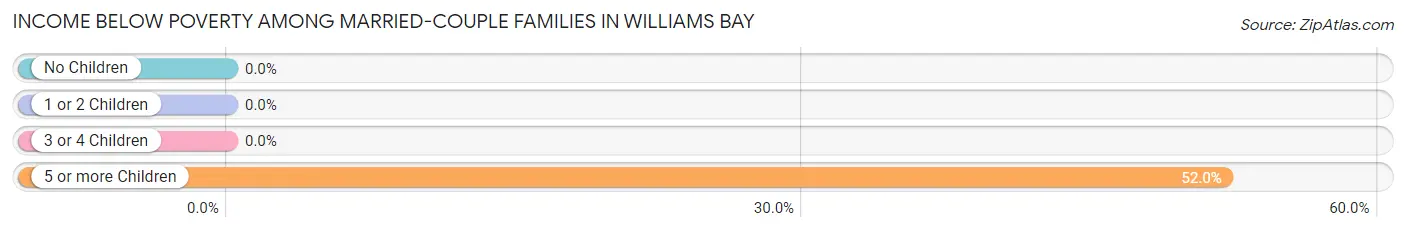
| Children | Above Poverty | Below Poverty |
| No Children | 346 (100.0%) | 0 (0.0%) |
| 1 or 2 Children | 170 (100.0%) | 0 (0.0%) |
| 3 or 4 Children | 50 (100.0%) | 0 (0.0%) |
| 5 or more Children | 12 (48.0%) | 13 (52.0%) |
| Total | 578 (97.8%) | 13 (2.2%) |
Income Below Poverty Among Single-Parent Households in Williams Bay
According to the poverty data in Williams Bay, 25.4% or 15 single-father households and 9.6% or 7 single-mother households are living below the poverty line. Among single-father households, those with no children have the highest poverty rate, with 15 households (26.8%) experiencing poverty. Likewise, among single-mother households, those with 3 or 4 children have the highest poverty rate, with 7 households (100.0%) falling below the poverty line.
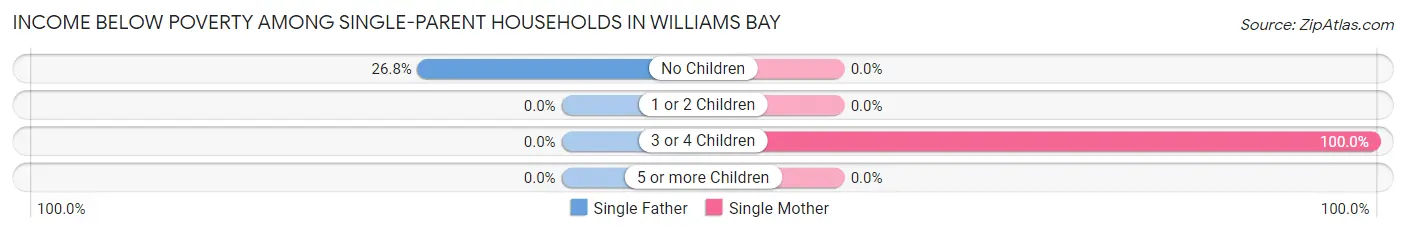
| Children | Single Father | Single Mother |
| No Children | 15 (26.8%) | 0 (0.0%) |
| 1 or 2 Children | 0 (0.0%) | 0 (0.0%) |
| 3 or 4 Children | 0 (0.0%) | 7 (100.0%) |
| 5 or more Children | 0 (0.0%) | 0 (0.0%) |
| Total | 15 (25.4%) | 7 (9.6%) |
Income Below Poverty Among Married-Couple vs Single-Parent Households in Williams Bay
The poverty data for Williams Bay shows that 13 of the married-couple family households (2.2%) and 22 of the single-parent households (16.7%) are living below the poverty level. Within the married-couple family households, those with 5 or more children have the highest poverty rate, with 13 households (52.0%) falling below the poverty line. Among the single-parent households, those with 3 or 4 children have the highest poverty rate, with 7 household (100.0%) living below poverty.
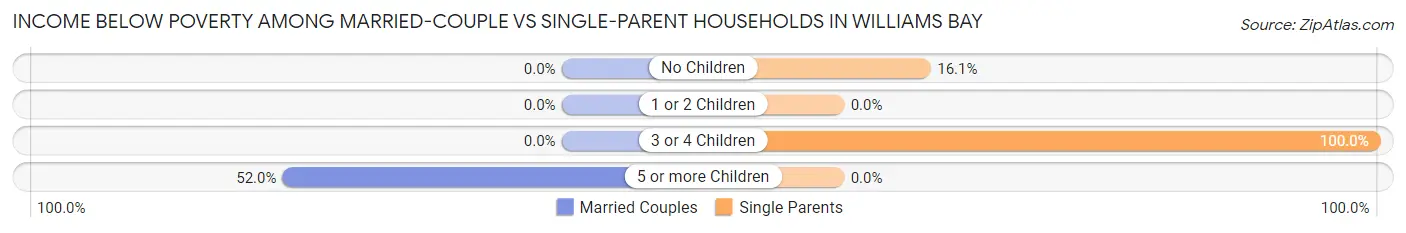
| Children | Married-Couple Families | Single-Parent Households |
| No Children | 0 (0.0%) | 15 (16.1%) |
| 1 or 2 Children | 0 (0.0%) | 0 (0.0%) |
| 3 or 4 Children | 0 (0.0%) | 7 (100.0%) |
| 5 or more Children | 13 (52.0%) | 0 (0.0%) |
| Total | 13 (2.2%) | 22 (16.7%) |
Race in Williams Bay
The most populous races in Williams Bay are White / Caucasian (2,751 | 93.3%), Hispanic or Latino (250 | 8.5%), and Some other Race (158 | 5.4%).
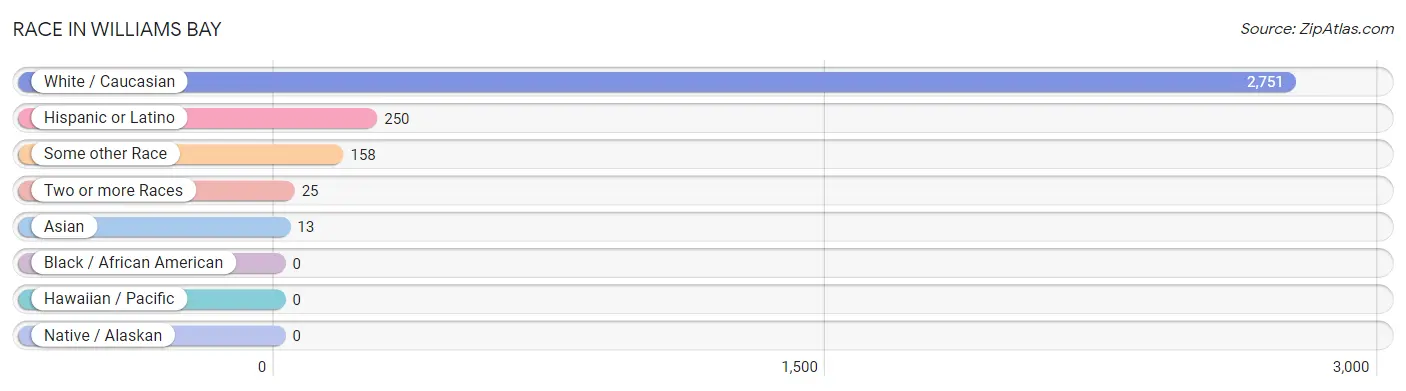
| Race | # Population | % Population |
| Asian | 13 | 0.4% |
| Black / African American | 0 | 0.0% |
| Hawaiian / Pacific | 0 | 0.0% |
| Hispanic or Latino | 250 | 8.5% |
| Native / Alaskan | 0 | 0.0% |
| White / Caucasian | 2,751 | 93.3% |
| Two or more Races | 25 | 0.9% |
| Some other Race | 158 | 5.4% |
| Total | 2,947 | 100.0% |
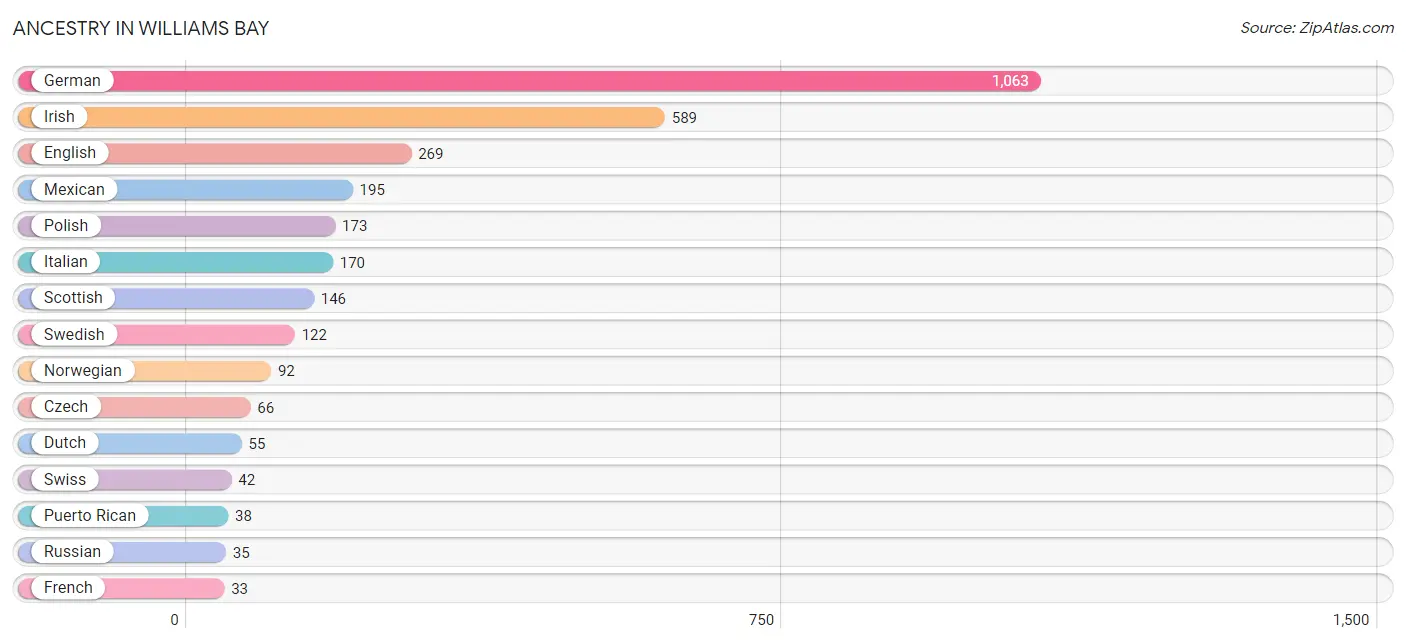
Ancestry in Williams Bay
The most populous ancestries reported in Williams Bay are German (1,063 | 36.1%), Irish (589 | 20.0%), English (269 | 9.1%), Mexican (195 | 6.6%), and Polish (173 | 5.9%), together accounting for 77.7% of all Williams Bay residents.
| Ancestry | # Population | % Population |
| American | 28 | 0.9% |
| Austrian | 8 | 0.3% |
| Belgian | 12 | 0.4% |
| Bulgarian | 5 | 0.2% |
| Central American | 7 | 0.2% |
| Croatian | 5 | 0.2% |
| Czech | 66 | 2.2% |
| Czechoslovakian | 31 | 1.1% |
| Danish | 13 | 0.4% |
| Dominican | 10 | 0.3% |
| Dutch | 55 | 1.9% |
| Eastern European | 8 | 0.3% |
| English | 269 | 9.1% |
| European | 19 | 0.6% |
| Finnish | 11 | 0.4% |
| French | 33 | 1.1% |
| German | 1,063 | 36.1% |
| Guatemalan | 7 | 0.2% |
| Hungarian | 26 | 0.9% |
| Indian (Asian) | 4 | 0.1% |
| Indonesian | 9 | 0.3% |
| Irish | 589 | 20.0% |
| Italian | 170 | 5.8% |
| Latvian | 4 | 0.1% |
| Lithuanian | 24 | 0.8% |
| Mexican | 195 | 6.6% |
| Norwegian | 92 | 3.1% |
| Polish | 173 | 5.9% |
| Portuguese | 12 | 0.4% |
| Puerto Rican | 38 | 1.3% |
| Romanian | 5 | 0.2% |
| Russian | 35 | 1.2% |
| Scotch-Irish | 5 | 0.2% |
| Scottish | 146 | 5.0% |
| Serbian | 7 | 0.2% |
| Swedish | 122 | 4.1% |
| Swiss | 42 | 1.4% |
| Ukrainian | 30 | 1.0% |
| Welsh | 4 | 0.1% |
| Yugoslavian | 6 | 0.2% | View All 40 Rows |
Immigrants in Williams Bay
The most numerous immigrant groups reported in Williams Bay came from Central America (30 | 1.0%), Latin America (30 | 1.0%), Mexico (23 | 0.8%), Europe (18 | 0.6%), and Asia (13 | 0.4%), together accounting for 3.9% of all Williams Bay residents.
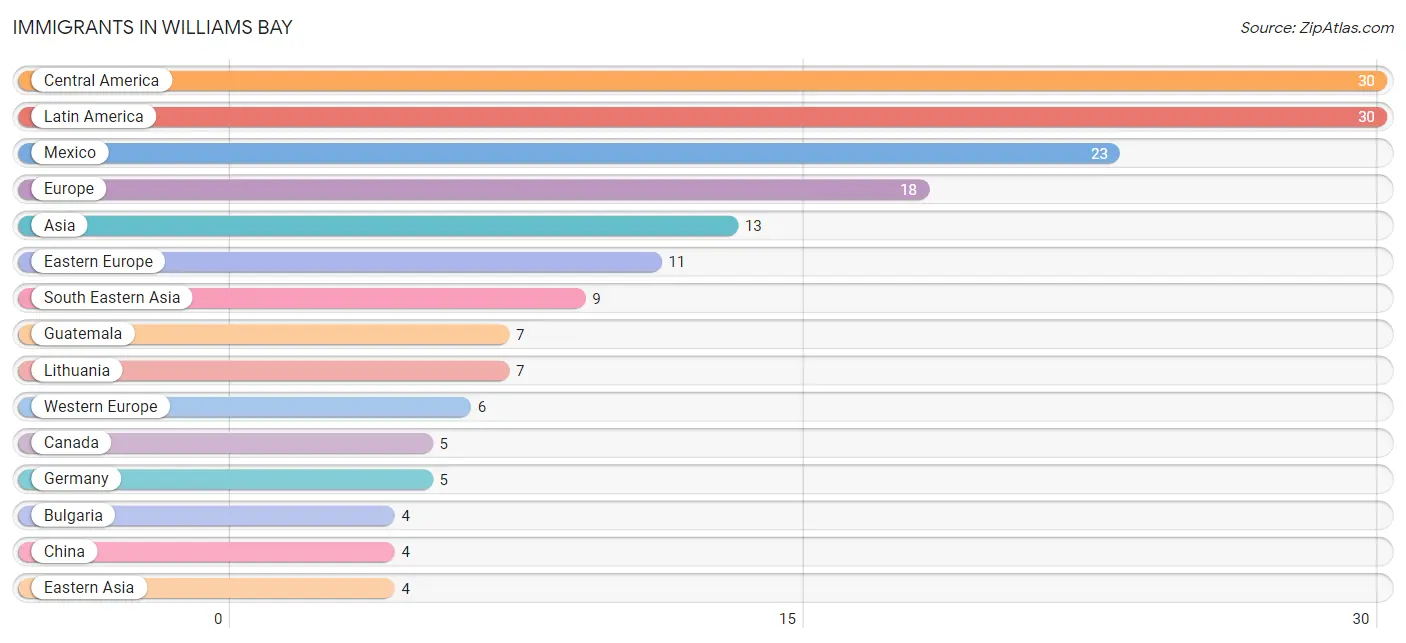
| Immigration Origin | # Population | % Population |
| Asia | 13 | 0.4% |
| Bulgaria | 4 | 0.1% |
| Canada | 5 | 0.2% |
| Central America | 30 | 1.0% |
| China | 4 | 0.1% |
| Denmark | 1 | 0.0% |
| Eastern Asia | 4 | 0.1% |
| Eastern Europe | 11 | 0.4% |
| Europe | 18 | 0.6% |
| Germany | 5 | 0.2% |
| Guatemala | 7 | 0.2% |
| Latin America | 30 | 1.0% |
| Lithuania | 7 | 0.2% |
| Mexico | 23 | 0.8% |
| Netherlands | 1 | 0.0% |
| Northern Europe | 1 | 0.0% |
| South Eastern Asia | 9 | 0.3% |
| Western Europe | 6 | 0.2% | View All 18 Rows |
Sex and Age in Williams Bay
Sex and Age in Williams Bay
The most populous age groups in Williams Bay are 65 to 69 Years (156 | 11.2%) for men and 5 to 9 Years (143 | 9.2%) for women.
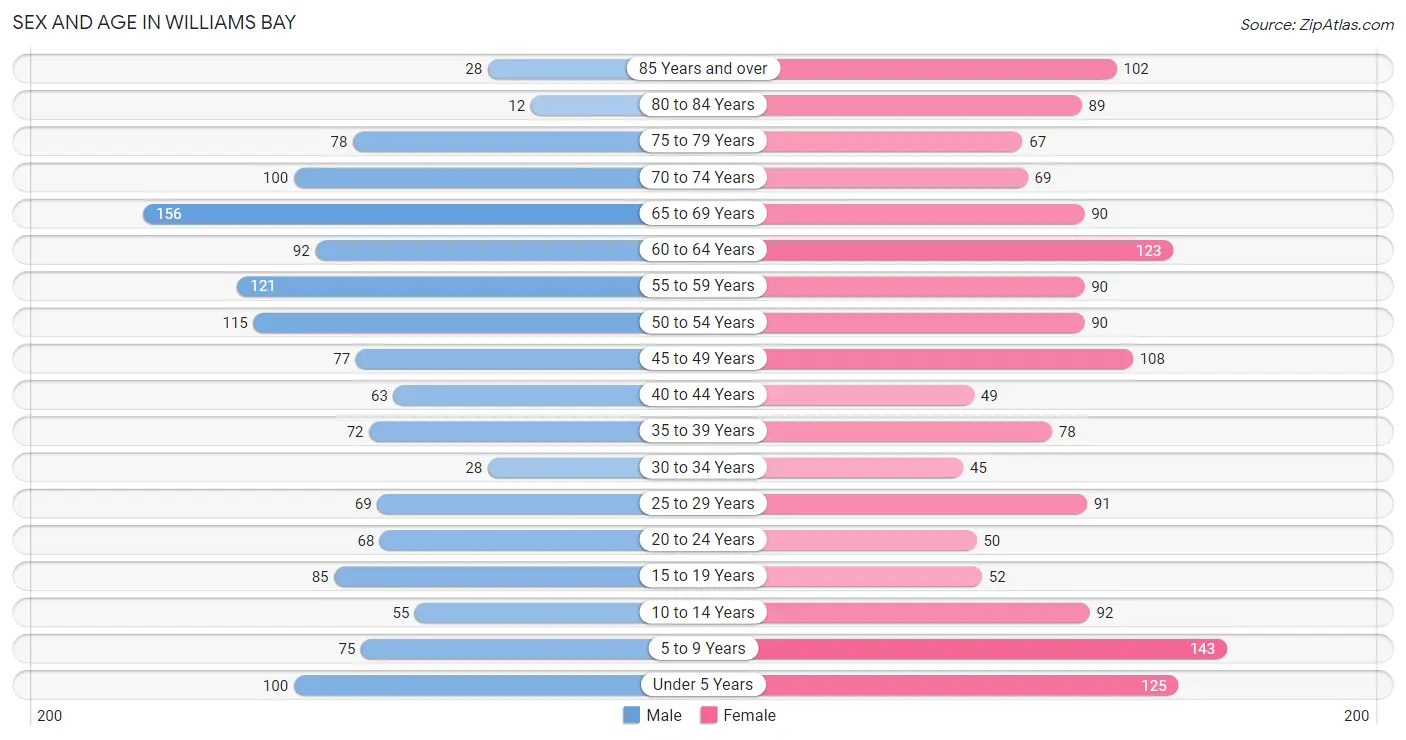
| Age Bracket | Male | Female |
| Under 5 Years | 100 (7.2%) | 125 (8.1%) |
| 5 to 9 Years | 75 (5.4%) | 143 (9.2%) |
| 10 to 14 Years | 55 (4.0%) | 92 (5.9%) |
| 15 to 19 Years | 85 (6.1%) | 52 (3.4%) |
| 20 to 24 Years | 68 (4.9%) | 50 (3.2%) |
| 25 to 29 Years | 69 (5.0%) | 91 (5.9%) |
| 30 to 34 Years | 28 (2.0%) | 45 (2.9%) |
| 35 to 39 Years | 72 (5.2%) | 78 (5.0%) |
| 40 to 44 Years | 63 (4.5%) | 49 (3.2%) |
| 45 to 49 Years | 77 (5.5%) | 108 (7.0%) |
| 50 to 54 Years | 115 (8.3%) | 90 (5.8%) |
| 55 to 59 Years | 121 (8.7%) | 90 (5.8%) |
| 60 to 64 Years | 92 (6.6%) | 123 (7.9%) |
| 65 to 69 Years | 156 (11.2%) | 90 (5.8%) |
| 70 to 74 Years | 100 (7.2%) | 69 (4.4%) |
| 75 to 79 Years | 78 (5.6%) | 67 (4.3%) |
| 80 to 84 Years | 12 (0.9%) | 89 (5.7%) |
| 85 Years and over | 28 (2.0%) | 102 (6.6%) |
| Total | 1,394 (100.0%) | 1,553 (100.0%) |
Families and Households in Williams Bay
Median Family Size in Williams Bay
The median family size in Williams Bay is 3.21 persons per family, with married-couple families (591 | 81.7%) accounting for the largest median family size of 3.32 persons per family. On the other hand, single male/father families (59 | 8.2%) represent the smallest median family size with 2.32 persons per family.
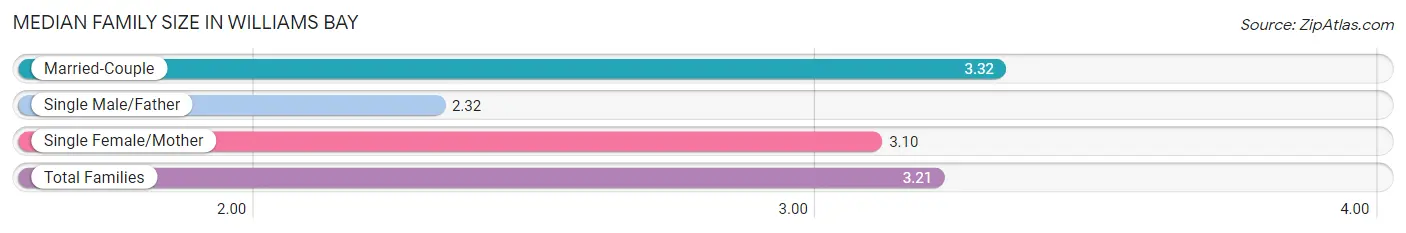
| Family Type | # Families | Family Size |
| Married-Couple | 591 (81.7%) | 3.32 |
| Single Male/Father | 59 (8.2%) | 2.32 |
| Single Female/Mother | 73 (10.1%) | 3.10 |
| Total Families | 723 (100.0%) | 3.21 |
Median Household Size in Williams Bay
The median household size in Williams Bay is 2.38 persons per household, with single female/mother households (73 | 6.0%) accounting for the largest median household size of 3.36 persons per household. non-family households (489 | 40.4%) represent the smallest median household size with 1.09 persons per household.
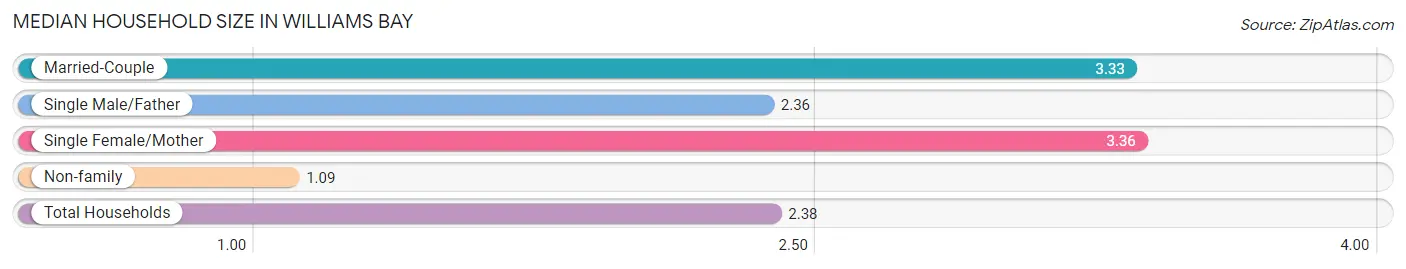
| Household Type | # Households | Household Size |
| Married-Couple | 591 (48.8%) | 3.33 |
| Single Male/Father | 59 (4.9%) | 2.36 |
| Single Female/Mother | 73 (6.0%) | 3.36 |
| Non-family | 489 (40.4%) | 1.09 |
| Total Households | 1,212 (100.0%) | 2.38 |
Household Size by Marriage Status in Williams Bay
Out of a total of 1,212 households in Williams Bay, 723 (59.7%) are family households, while 489 (40.4%) are nonfamily households. The most numerous type of family households are 2-person households, comprising 352, and the most common type of nonfamily households are 1-person households, comprising 454.
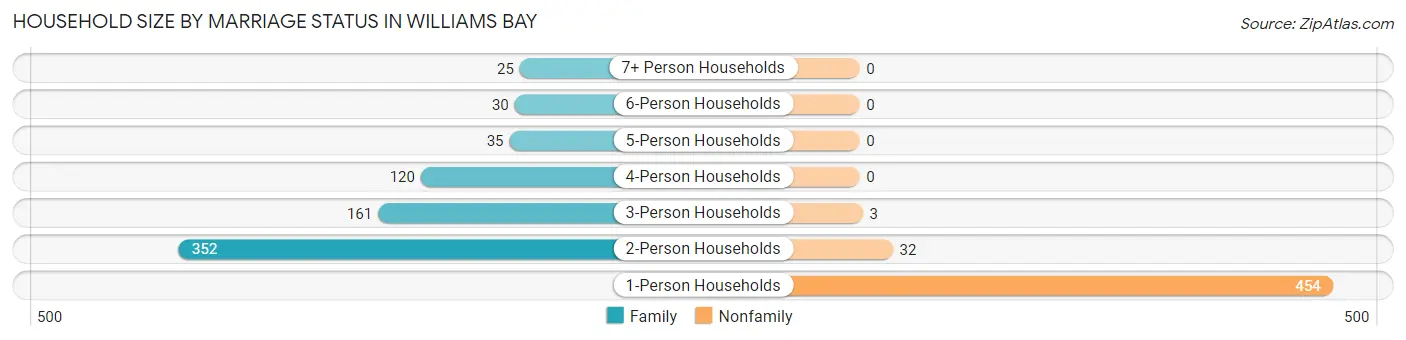
| Household Size | Family Households | Nonfamily Households |
| 1-Person Households | - | 454 (37.5%) |
| 2-Person Households | 352 (29.0%) | 32 (2.6%) |
| 3-Person Households | 161 (13.3%) | 3 (0.3%) |
| 4-Person Households | 120 (9.9%) | 0 (0.0%) |
| 5-Person Households | 35 (2.9%) | 0 (0.0%) |
| 6-Person Households | 30 (2.5%) | 0 (0.0%) |
| 7+ Person Households | 25 (2.1%) | 0 (0.0%) |
| Total | 723 (59.7%) | 489 (40.4%) |
Female Fertility in Williams Bay
Fertility by Age in Williams Bay
Average fertility rate in Williams Bay is 69.0 births per 1,000 women. Women in the age bracket of 20 to 34 years have the highest fertility rate with 86.0 births per 1,000 women. Women in the age bracket of 35 to 50 years acount for 51.5% of all women with births.
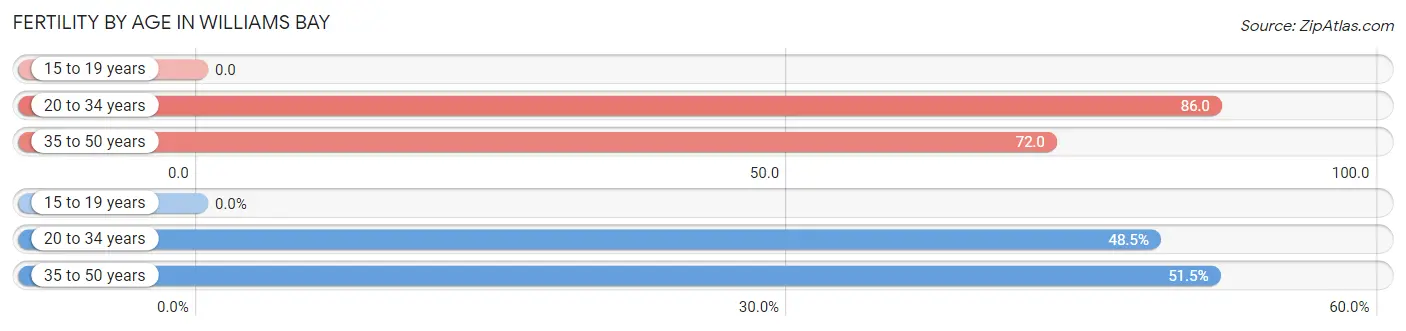
| Age Bracket | Women with Births | Births / 1,000 Women |
| 15 to 19 years | 0 (0.0%) | 0.0 |
| 20 to 34 years | 16 (48.5%) | 86.0 |
| 35 to 50 years | 17 (51.5%) | 72.0 |
| Total | 33 (100.0%) | 69.0 |
Fertility by Age by Marriage Status in Williams Bay
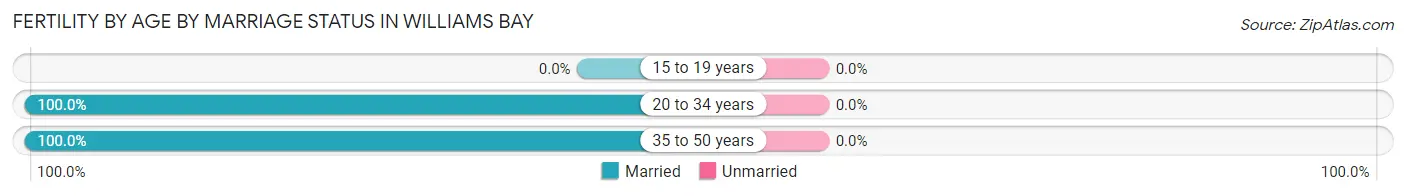
| Age Bracket | Married | Unmarried |
| 15 to 19 years | 0 (0.0%) | 0 (0.0%) |
| 20 to 34 years | 16 (100.0%) | 0 (0.0%) |
| 35 to 50 years | 17 (100.0%) | 0 (0.0%) |
| Total | 33 (100.0%) | 0 (0.0%) |
Fertility by Education in Williams Bay
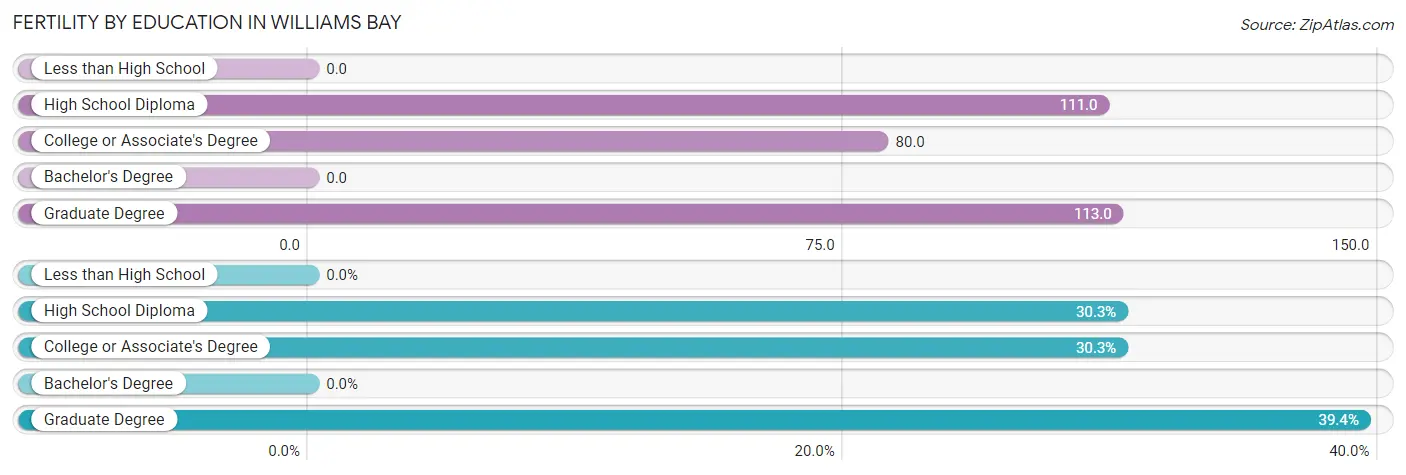
| Educational Attainment | Women with Births | Births / 1,000 Women |
| Less than High School | 0 (0.0%) | 0.0 |
| High School Diploma | 10 (30.3%) | 111.0 |
| College or Associate's Degree | 10 (30.3%) | 80.0 |
| Bachelor's Degree | 0 (0.0%) | 0.0 |
| Graduate Degree | 13 (39.4%) | 113.0 |
| Total | 33 (100.0%) | 69.0 |
Fertility by Education by Marriage Status in Williams Bay
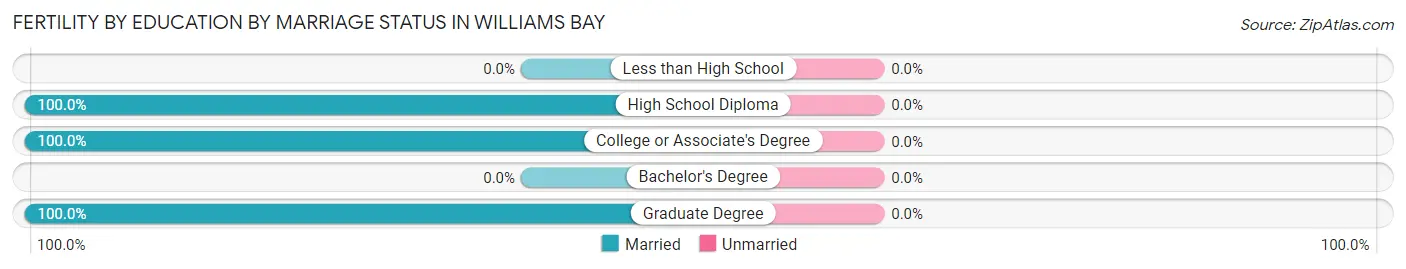
| Educational Attainment | Married | Unmarried |
| Less than High School | 0 (0.0%) | 0 (0.0%) |
| High School Diploma | 10 (100.0%) | 0 (0.0%) |
| College or Associate's Degree | 10 (100.0%) | 0 (0.0%) |
| Bachelor's Degree | 0 (0.0%) | 0 (0.0%) |
| Graduate Degree | 13 (100.0%) | 0 (0.0%) |
| Total | 33 (100.0%) | 0 (0.0%) |
Employment Characteristics in Williams Bay
Employment by Class of Employer in Williams Bay
Among the 1,176 employed individuals in Williams Bay, private company employees (756 | 64.3%), not-for-profit organizations (128 | 10.9%), and self-employed (incorporated) (98 | 8.3%) make up the most common classes of employment.
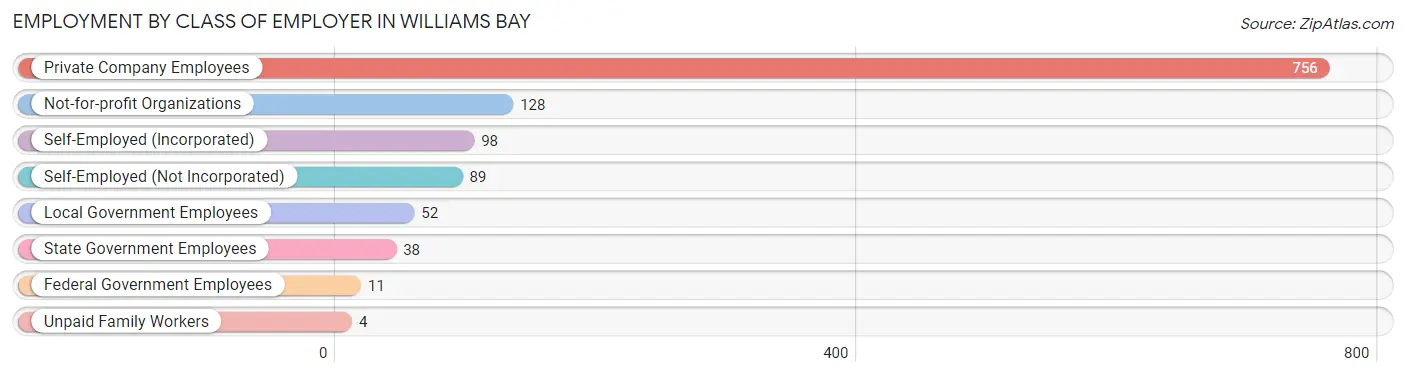
| Employer Class | # Employees | % Employees |
| Private Company Employees | 756 | 64.3% |
| Self-Employed (Incorporated) | 98 | 8.3% |
| Self-Employed (Not Incorporated) | 89 | 7.6% |
| Not-for-profit Organizations | 128 | 10.9% |
| Local Government Employees | 52 | 4.4% |
| State Government Employees | 38 | 3.2% |
| Federal Government Employees | 11 | 0.9% |
| Unpaid Family Workers | 4 | 0.3% |
| Total | 1,176 | 100.0% |
Employment Status by Age in Williams Bay
According to the labor force statistics for Williams Bay, out of the total population over 16 years of age (2,338), 55.1% or 1,288 individuals are in the labor force, with 4.1% or 53 of them unemployed. The age group with the highest labor force participation rate is 25 to 29 years, with 90.6% or 145 individuals in the labor force. Within the labor force, the 16 to 19 years age range has the highest percentage of unemployed individuals, with 43.5% or 10 of them being unemployed.
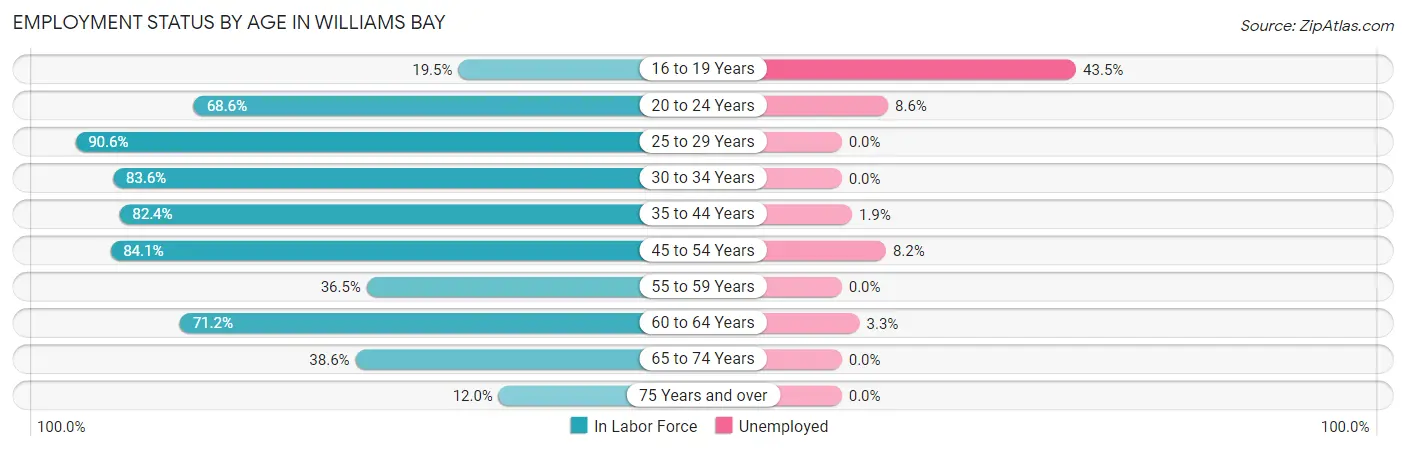
| Age Bracket | In Labor Force | Unemployed |
| 16 to 19 Years | 23 (19.5%) | 10 (43.5%) |
| 20 to 24 Years | 81 (68.6%) | 7 (8.6%) |
| 25 to 29 Years | 145 (90.6%) | 0 (0.0%) |
| 30 to 34 Years | 61 (83.6%) | 0 (0.0%) |
| 35 to 44 Years | 216 (82.4%) | 4 (1.9%) |
| 45 to 54 Years | 328 (84.1%) | 27 (8.2%) |
| 55 to 59 Years | 77 (36.5%) | 0 (0.0%) |
| 60 to 64 Years | 153 (71.2%) | 5 (3.3%) |
| 65 to 74 Years | 160 (38.6%) | 0 (0.0%) |
| 75 Years and over | 45 (12.0%) | 0 (0.0%) |
| Total | 1,288 (55.1%) | 53 (4.1%) |
Employment Status by Educational Attainment in Williams Bay
According to labor force statistics for Williams Bay, 74.8% of individuals (981) out of the total population between 25 and 64 years of age (1,311) are in the labor force, with 3.7% or 36 of them being unemployed. The group with the highest labor force participation rate are those with the educational attainment of less than high school, with 100.0% or 24 individuals in the labor force. Within the labor force, individuals with high school diploma education have the highest percentage of unemployment, with 9.5% or 13 of them being unemployed.
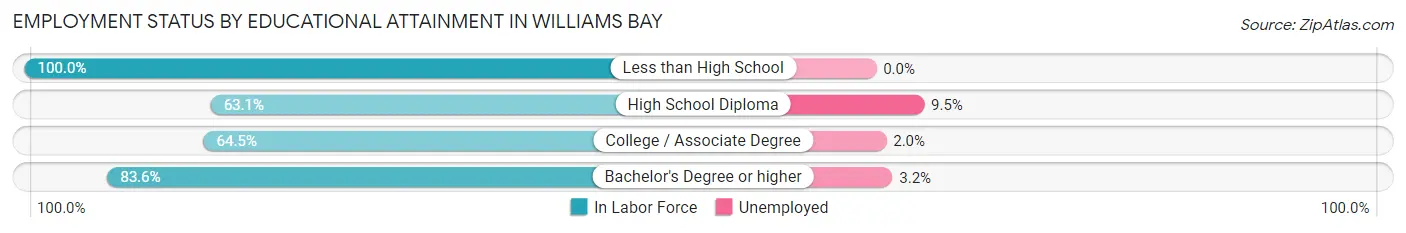
| Educational Attainment | In Labor Force | Unemployed |
| Less than High School | 24 (100.0%) | 0 (0.0%) |
| High School Diploma | 137 (63.1%) | 21 (9.5%) |
| College / Associate Degree | 254 (64.5%) | 8 (2.0%) |
| Bachelor's Degree or higher | 565 (83.6%) | 22 (3.2%) |
| Total | 981 (74.8%) | 49 (3.7%) |
Employment Occupations by Sex in Williams Bay
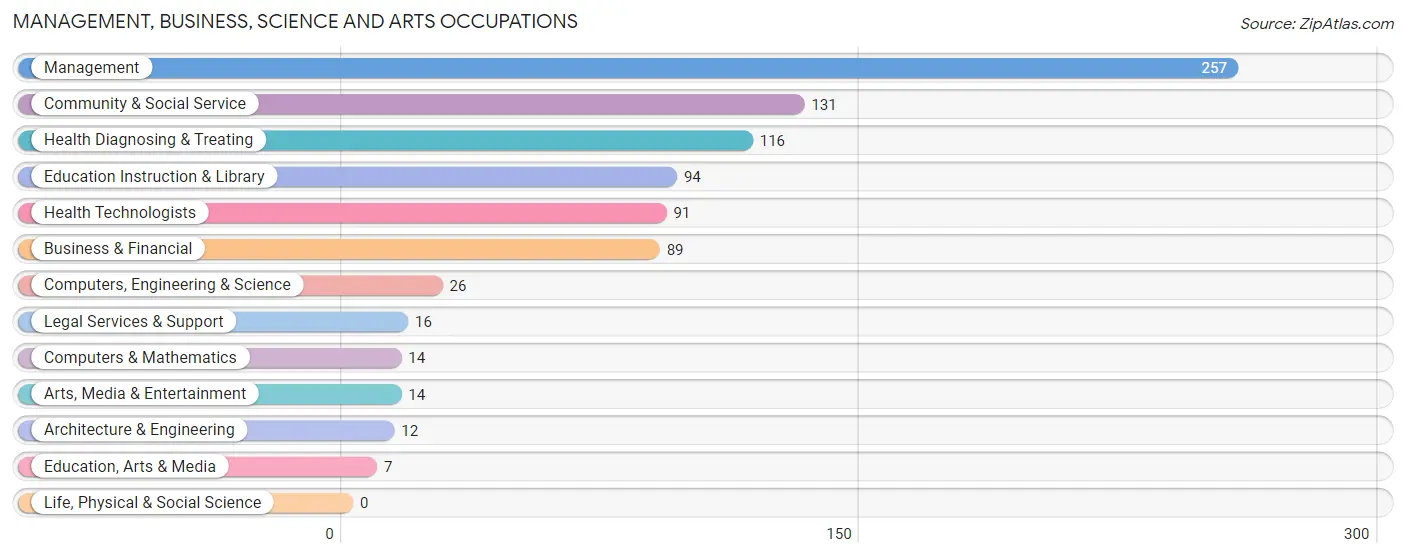
Management, Business, Science and Arts Occupations
The most common Management, Business, Science and Arts occupations in Williams Bay are Management (257 | 20.8%), Community & Social Service (131 | 10.6%), Health Diagnosing & Treating (116 | 9.4%), Education Instruction & Library (94 | 7.6%), and Health Technologists (91 | 7.4%).
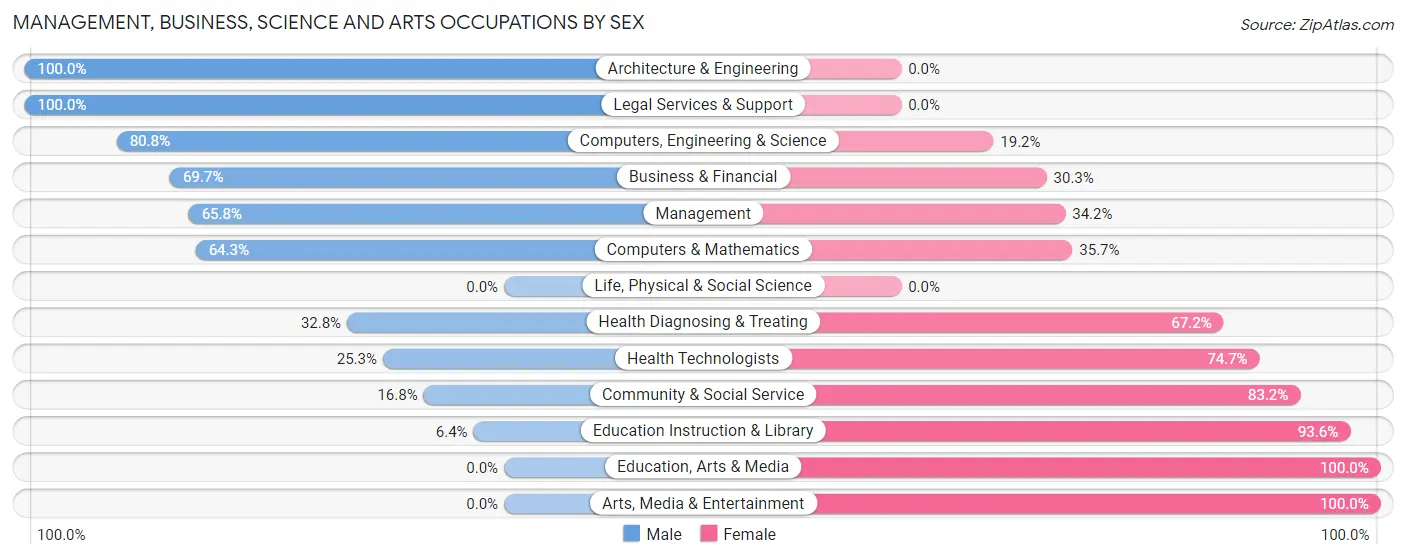
Management, Business, Science and Arts Occupations by Sex
Within the Management, Business, Science and Arts occupations in Williams Bay, the most male-oriented occupations are Architecture & Engineering (100.0%), Legal Services & Support (100.0%), and Computers, Engineering & Science (80.8%), while the most female-oriented occupations are Education, Arts & Media (100.0%), Arts, Media & Entertainment (100.0%), and Education Instruction & Library (93.6%).
| Occupation | Male | Female |
| Management | 169 (65.8%) | 88 (34.2%) |
| Business & Financial | 62 (69.7%) | 27 (30.3%) |
| Computers, Engineering & Science | 21 (80.8%) | 5 (19.2%) |
| Computers & Mathematics | 9 (64.3%) | 5 (35.7%) |
| Architecture & Engineering | 12 (100.0%) | 0 (0.0%) |
| Life, Physical & Social Science | 0 (0.0%) | 0 (0.0%) |
| Community & Social Service | 22 (16.8%) | 109 (83.2%) |
| Education, Arts & Media | 0 (0.0%) | 7 (100.0%) |
| Legal Services & Support | 16 (100.0%) | 0 (0.0%) |
| Education Instruction & Library | 6 (6.4%) | 88 (93.6%) |
| Arts, Media & Entertainment | 0 (0.0%) | 14 (100.0%) |
| Health Diagnosing & Treating | 38 (32.8%) | 78 (67.2%) |
| Health Technologists | 23 (25.3%) | 68 (74.7%) |
| Total (Category) | 312 (50.4%) | 307 (49.6%) |
| Total (Overall) | 697 (56.4%) | 539 (43.6%) |
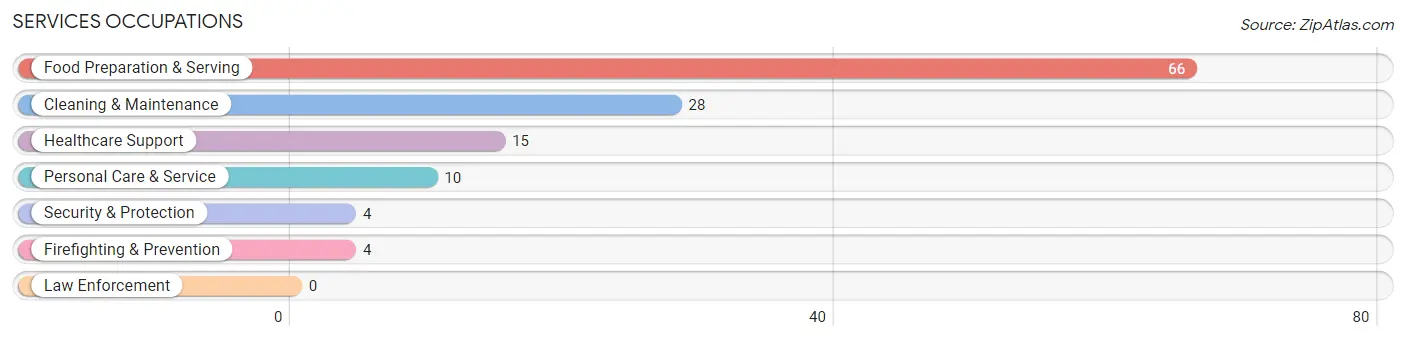
Services Occupations
The most common Services occupations in Williams Bay are Food Preparation & Serving (66 | 5.3%), Cleaning & Maintenance (28 | 2.3%), Healthcare Support (15 | 1.2%), Personal Care & Service (10 | 0.8%), and Security & Protection (4 | 0.3%).
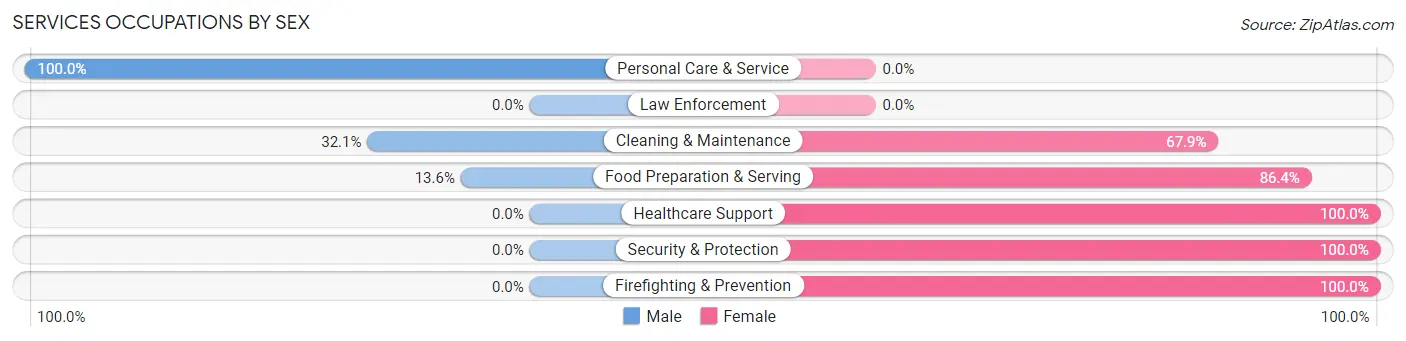
Services Occupations by Sex
Within the Services occupations in Williams Bay, the most male-oriented occupations are Personal Care & Service (100.0%), Cleaning & Maintenance (32.1%), and Food Preparation & Serving (13.6%), while the most female-oriented occupations are Healthcare Support (100.0%), Security & Protection (100.0%), and Firefighting & Prevention (100.0%).
| Occupation | Male | Female |
| Healthcare Support | 0 (0.0%) | 15 (100.0%) |
| Security & Protection | 0 (0.0%) | 4 (100.0%) |
| Firefighting & Prevention | 0 (0.0%) | 4 (100.0%) |
| Law Enforcement | 0 (0.0%) | 0 (0.0%) |
| Food Preparation & Serving | 9 (13.6%) | 57 (86.4%) |
| Cleaning & Maintenance | 9 (32.1%) | 19 (67.9%) |
| Personal Care & Service | 10 (100.0%) | 0 (0.0%) |
| Total (Category) | 28 (22.8%) | 95 (77.2%) |
| Total (Overall) | 697 (56.4%) | 539 (43.6%) |
Sales and Office Occupations
The most common Sales and Office occupations in Williams Bay are Sales & Related (242 | 19.6%), and Office & Administration (94 | 7.6%).
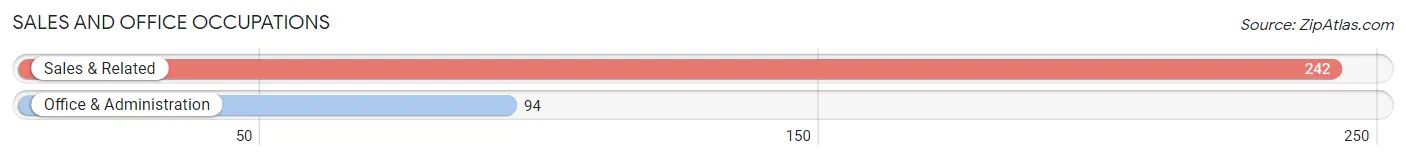
Sales and Office Occupations by Sex
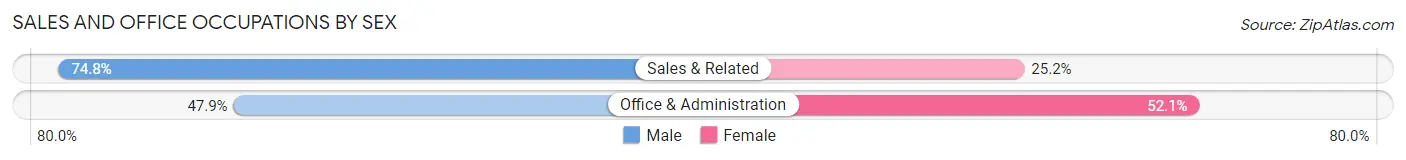
| Occupation | Male | Female |
| Sales & Related | 181 (74.8%) | 61 (25.2%) |
| Office & Administration | 45 (47.9%) | 49 (52.1%) |
| Total (Category) | 226 (67.3%) | 110 (32.7%) |
| Total (Overall) | 697 (56.4%) | 539 (43.6%) |
Natural Resources, Construction and Maintenance Occupations
The most common Natural Resources, Construction and Maintenance occupations in Williams Bay are Construction & Extraction (64 | 5.2%), and Installation, Maintenance & Repair (7 | 0.6%).
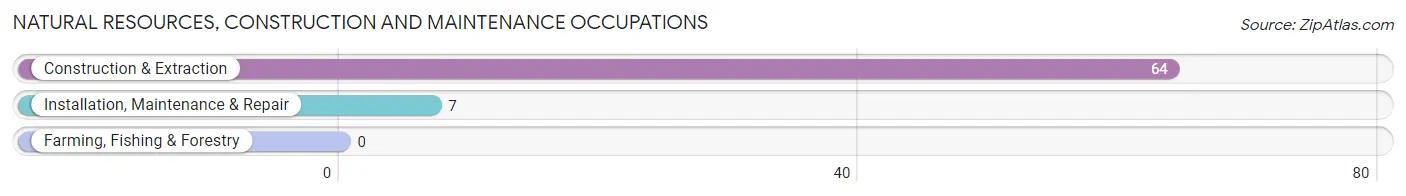
Natural Resources, Construction and Maintenance Occupations by Sex
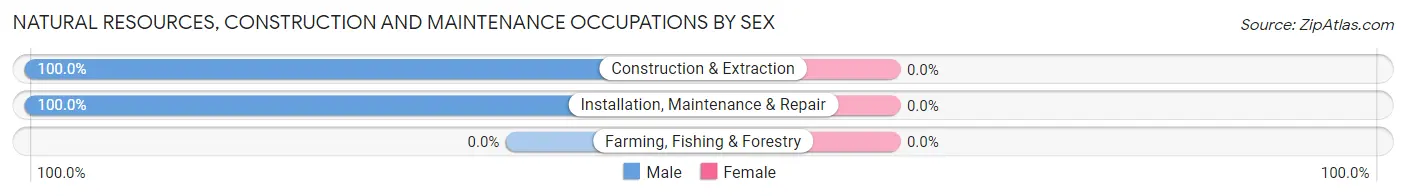
| Occupation | Male | Female |
| Farming, Fishing & Forestry | 0 (0.0%) | 0 (0.0%) |
| Construction & Extraction | 64 (100.0%) | 0 (0.0%) |
| Installation, Maintenance & Repair | 7 (100.0%) | 0 (0.0%) |
| Total (Category) | 71 (100.0%) | 0 (0.0%) |
| Total (Overall) | 697 (56.4%) | 539 (43.6%) |
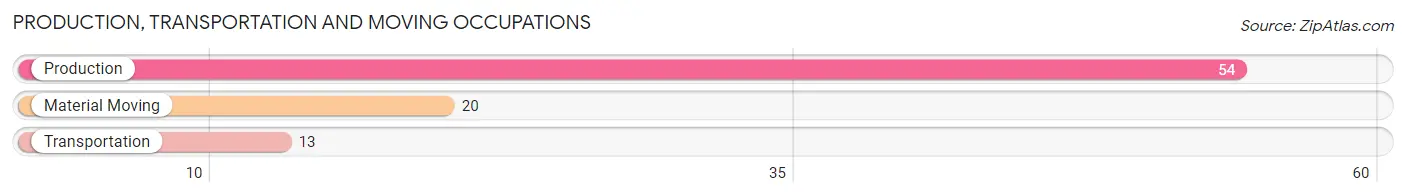
Production, Transportation and Moving Occupations
The most common Production, Transportation and Moving occupations in Williams Bay are Production (54 | 4.4%), Material Moving (20 | 1.6%), and Transportation (13 | 1.1%).
Production, Transportation and Moving Occupations by Sex
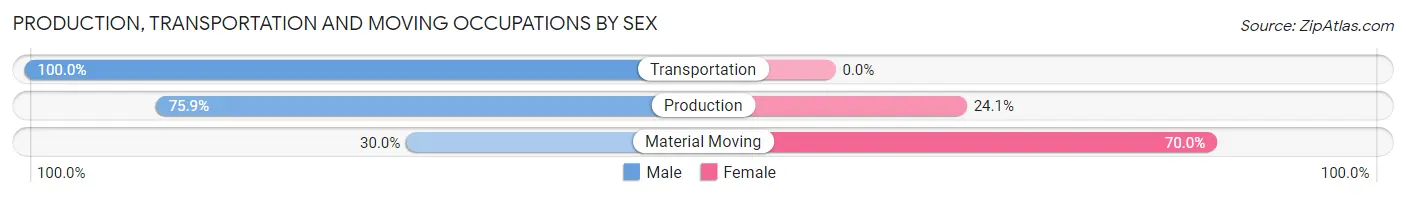
| Occupation | Male | Female |
| Production | 41 (75.9%) | 13 (24.1%) |
| Transportation | 13 (100.0%) | 0 (0.0%) |
| Material Moving | 6 (30.0%) | 14 (70.0%) |
| Total (Category) | 60 (69.0%) | 27 (31.0%) |
| Total (Overall) | 697 (56.4%) | 539 (43.6%) |
Employment Industries by Sex in Williams Bay
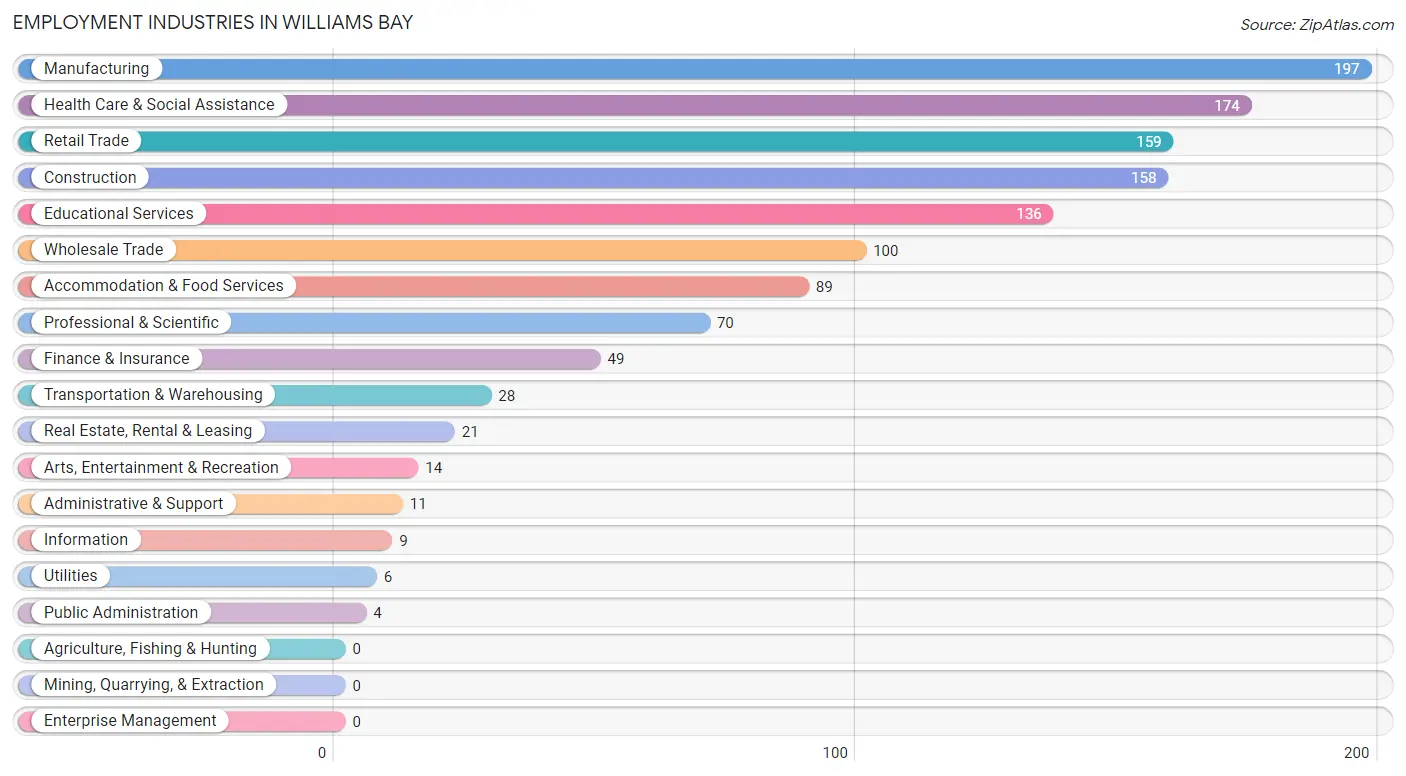
Employment Industries in Williams Bay
The major employment industries in Williams Bay include Manufacturing (197 | 15.9%), Health Care & Social Assistance (174 | 14.1%), Retail Trade (159 | 12.9%), Construction (158 | 12.8%), and Educational Services (136 | 11.0%).
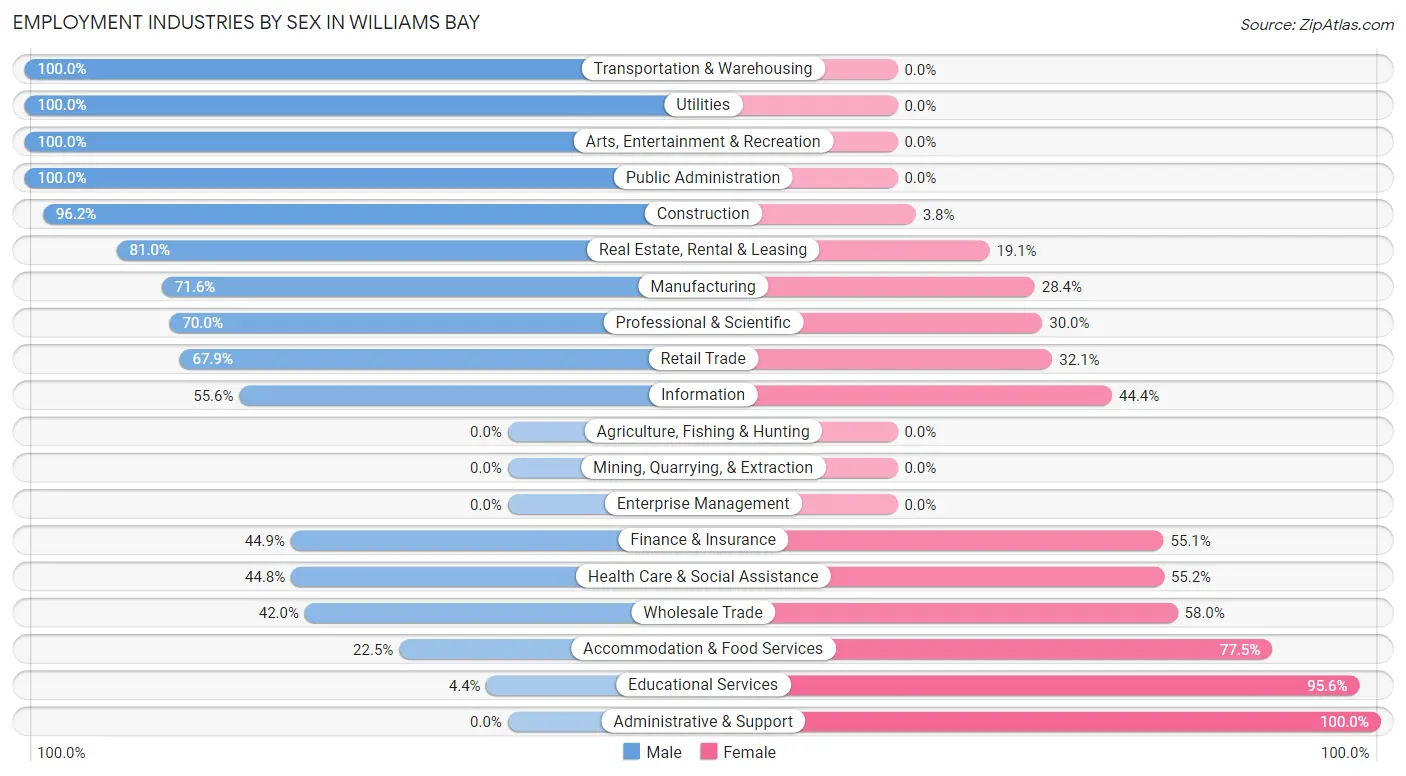
Employment Industries by Sex in Williams Bay
The Williams Bay industries that see more men than women are Transportation & Warehousing (100.0%), Utilities (100.0%), and Arts, Entertainment & Recreation (100.0%), whereas the industries that tend to have a higher number of women are Administrative & Support (100.0%), Educational Services (95.6%), and Accommodation & Food Services (77.5%).
| Industry | Male | Female |
| Agriculture, Fishing & Hunting | 0 (0.0%) | 0 (0.0%) |
| Mining, Quarrying, & Extraction | 0 (0.0%) | 0 (0.0%) |
| Construction | 152 (96.2%) | 6 (3.8%) |
| Manufacturing | 141 (71.6%) | 56 (28.4%) |
| Wholesale Trade | 42 (42.0%) | 58 (58.0%) |
| Retail Trade | 108 (67.9%) | 51 (32.1%) |
| Transportation & Warehousing | 28 (100.0%) | 0 (0.0%) |
| Utilities | 6 (100.0%) | 0 (0.0%) |
| Information | 5 (55.6%) | 4 (44.4%) |
| Finance & Insurance | 22 (44.9%) | 27 (55.1%) |
| Real Estate, Rental & Leasing | 17 (80.9%) | 4 (19.1%) |
| Professional & Scientific | 49 (70.0%) | 21 (30.0%) |
| Enterprise Management | 0 (0.0%) | 0 (0.0%) |
| Administrative & Support | 0 (0.0%) | 11 (100.0%) |
| Educational Services | 6 (4.4%) | 130 (95.6%) |
| Health Care & Social Assistance | 78 (44.8%) | 96 (55.2%) |
| Arts, Entertainment & Recreation | 14 (100.0%) | 0 (0.0%) |
| Accommodation & Food Services | 20 (22.5%) | 69 (77.5%) |
| Public Administration | 4 (100.0%) | 0 (0.0%) |
| Total | 697 (56.4%) | 539 (43.6%) |
Education in Williams Bay
School Enrollment in Williams Bay
The most common levels of schooling among the 612 students in Williams Bay are elementary school (159 | 26.0%), high school (144 | 23.5%), and college / undergraduate (89 | 14.5%).
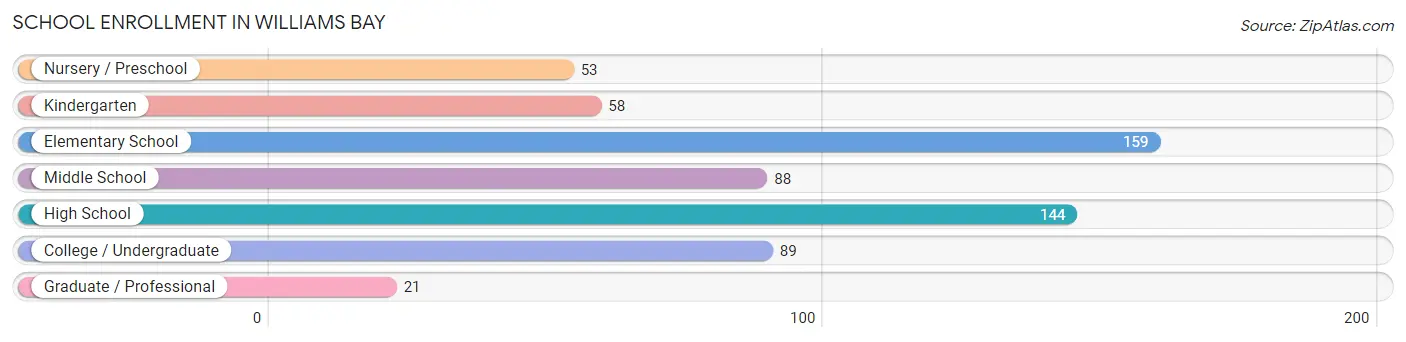
| School Level | # Students | % Students |
| Nursery / Preschool | 53 | 8.7% |
| Kindergarten | 58 | 9.5% |
| Elementary School | 159 | 26.0% |
| Middle School | 88 | 14.4% |
| High School | 144 | 23.5% |
| College / Undergraduate | 89 | 14.5% |
| Graduate / Professional | 21 | 3.4% |
| Total | 612 | 100.0% |
School Enrollment by Age by Funding Source in Williams Bay
Out of a total of 612 students who are enrolled in schools in Williams Bay, 52 (8.5%) attend a private institution, while the remaining 560 (91.5%) are enrolled in public schools. The age group of 20 to 24 year olds has the highest likelihood of being enrolled in private schools, with 19 (44.2% in the age bracket) enrolled. Conversely, the age group of 15 to 17 year olds has the lowest likelihood of being enrolled in a private school, with 109 (100.0% in the age bracket) attending a public institution.
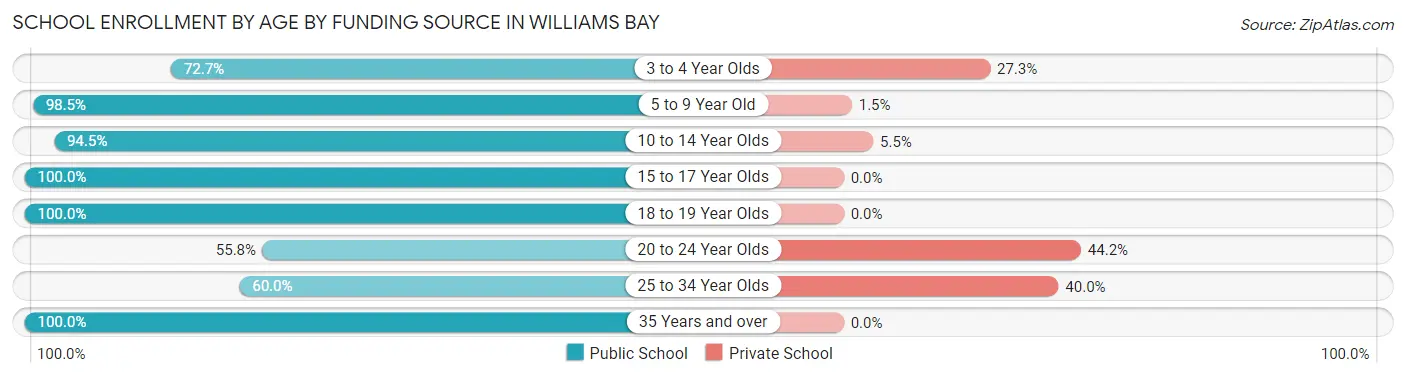
| Age Bracket | Public School | Private School |
| 3 to 4 Year Olds | 32 (72.7%) | 12 (27.3%) |
| 5 to 9 Year Old | 196 (98.5%) | 3 (1.5%) |
| 10 to 14 Year Olds | 138 (94.5%) | 8 (5.5%) |
| 15 to 17 Year Olds | 109 (100.0%) | 0 (0.0%) |
| 18 to 19 Year Olds | 18 (100.0%) | 0 (0.0%) |
| 20 to 24 Year Olds | 24 (55.8%) | 19 (44.2%) |
| 25 to 34 Year Olds | 15 (60.0%) | 10 (40.0%) |
| 35 Years and over | 28 (100.0%) | 0 (0.0%) |
| Total | 560 (91.5%) | 52 (8.5%) |
Educational Attainment by Field of Study in Williams Bay
Education (238 | 20.9%), business (199 | 17.5%), science & technology (111 | 9.8%), communications (85 | 7.5%), and arts & humanities (85 | 7.5%) are the most common fields of study among 1,137 individuals in Williams Bay who have obtained a bachelor's degree or higher.
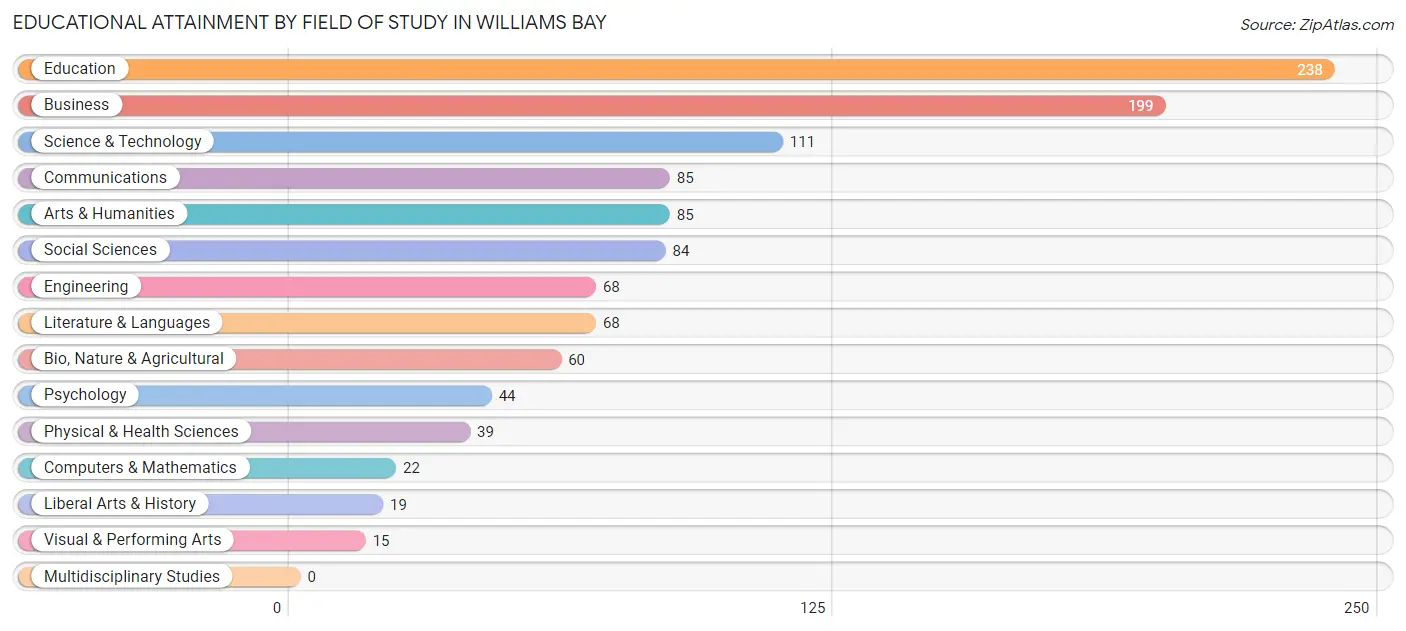
| Field of Study | # Graduates | % Graduates |
| Computers & Mathematics | 22 | 1.9% |
| Bio, Nature & Agricultural | 60 | 5.3% |
| Physical & Health Sciences | 39 | 3.4% |
| Psychology | 44 | 3.9% |
| Social Sciences | 84 | 7.4% |
| Engineering | 68 | 6.0% |
| Multidisciplinary Studies | 0 | 0.0% |
| Science & Technology | 111 | 9.8% |
| Business | 199 | 17.5% |
| Education | 238 | 20.9% |
| Literature & Languages | 68 | 6.0% |
| Liberal Arts & History | 19 | 1.7% |
| Visual & Performing Arts | 15 | 1.3% |
| Communications | 85 | 7.5% |
| Arts & Humanities | 85 | 7.5% |
| Total | 1,137 | 100.0% |
Transportation & Commute in Williams Bay
Vehicle Availability by Sex in Williams Bay
The most prevalent vehicle ownership categories in Williams Bay are males with 2 vehicles (432, accounting for 62.9%) and females with 2 vehicles (282, making up 89.8%).
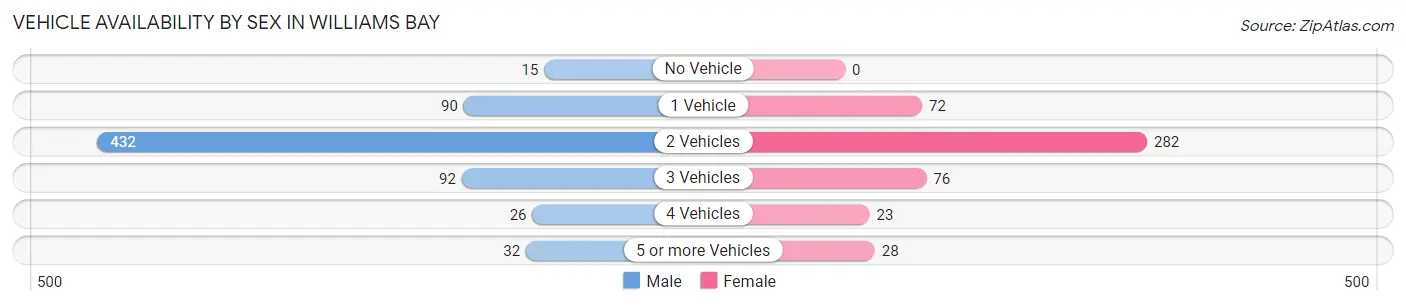
| Vehicles Available | Male | Female |
| No Vehicle | 15 (2.2%) | 0 (0.0%) |
| 1 Vehicle | 90 (13.1%) | 72 (15.0%) |
| 2 Vehicles | 432 (62.9%) | 282 (58.6%) |
| 3 Vehicles | 92 (13.4%) | 76 (15.8%) |
| 4 Vehicles | 26 (3.8%) | 23 (4.8%) |
| 5 or more Vehicles | 32 (4.7%) | 28 (5.8%) |
| Total | 687 (100.0%) | 481 (100.0%) |
Commute Time in Williams Bay
The most frequently occuring commute durations in Williams Bay are 15 to 19 minutes (179 commuters, 18.4%), 30 to 34 minutes (125 commuters, 12.8%), and 5 to 9 minutes (113 commuters, 11.6%).
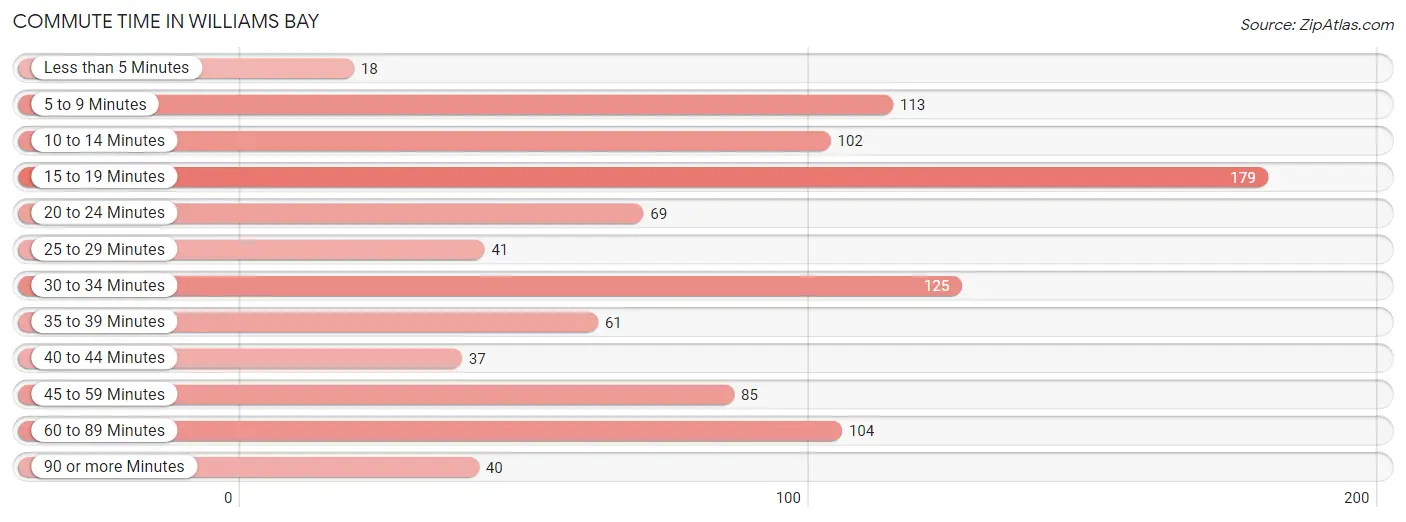
| Commute Time | # Commuters | % Commuters |
| Less than 5 Minutes | 18 | 1.8% |
| 5 to 9 Minutes | 113 | 11.6% |
| 10 to 14 Minutes | 102 | 10.5% |
| 15 to 19 Minutes | 179 | 18.4% |
| 20 to 24 Minutes | 69 | 7.1% |
| 25 to 29 Minutes | 41 | 4.2% |
| 30 to 34 Minutes | 125 | 12.8% |
| 35 to 39 Minutes | 61 | 6.3% |
| 40 to 44 Minutes | 37 | 3.8% |
| 45 to 59 Minutes | 85 | 8.7% |
| 60 to 89 Minutes | 104 | 10.7% |
| 90 or more Minutes | 40 | 4.1% |
Commute Time by Sex in Williams Bay
The most common commute times in Williams Bay are 15 to 19 minutes (104 commuters, 18.2%) for males and 15 to 19 minutes (75 commuters, 18.7%) for females.
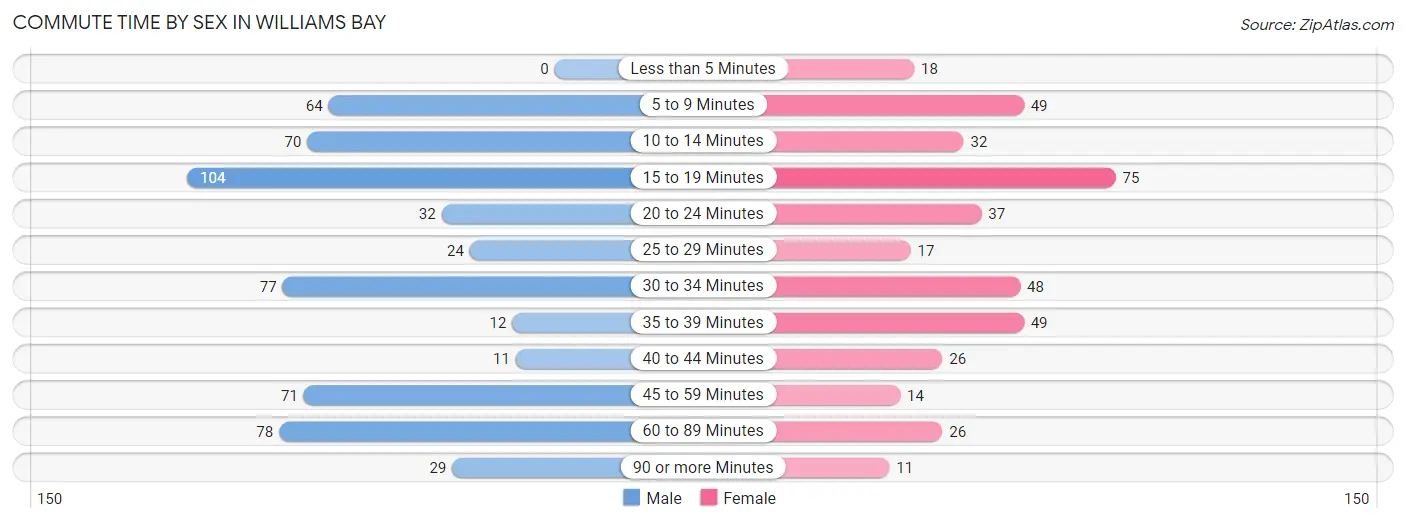
| Commute Time | Male | Female |
| Less than 5 Minutes | 0 (0.0%) | 18 (4.5%) |
| 5 to 9 Minutes | 64 (11.2%) | 49 (12.2%) |
| 10 to 14 Minutes | 70 (12.2%) | 32 (8.0%) |
| 15 to 19 Minutes | 104 (18.2%) | 75 (18.7%) |
| 20 to 24 Minutes | 32 (5.6%) | 37 (9.2%) |
| 25 to 29 Minutes | 24 (4.2%) | 17 (4.2%) |
| 30 to 34 Minutes | 77 (13.5%) | 48 (11.9%) |
| 35 to 39 Minutes | 12 (2.1%) | 49 (12.2%) |
| 40 to 44 Minutes | 11 (1.9%) | 26 (6.5%) |
| 45 to 59 Minutes | 71 (12.4%) | 14 (3.5%) |
| 60 to 89 Minutes | 78 (13.6%) | 26 (6.5%) |
| 90 or more Minutes | 29 (5.1%) | 11 (2.7%) |
Time of Departure to Work by Sex in Williams Bay
The most frequent times of departure to work in Williams Bay are 7:30 AM to 7:59 AM (117, 20.4%) for males and 7:30 AM to 7:59 AM (98, 24.4%) for females.
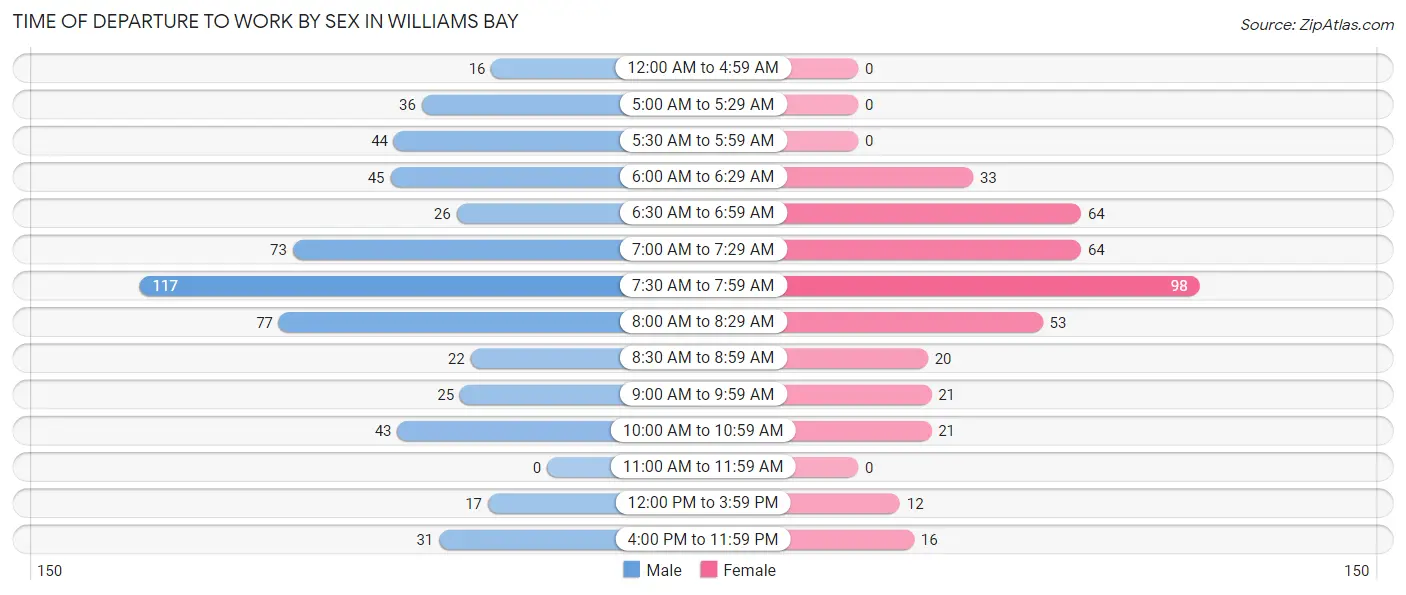
| Time of Departure | Male | Female |
| 12:00 AM to 4:59 AM | 16 (2.8%) | 0 (0.0%) |
| 5:00 AM to 5:29 AM | 36 (6.3%) | 0 (0.0%) |
| 5:30 AM to 5:59 AM | 44 (7.7%) | 0 (0.0%) |
| 6:00 AM to 6:29 AM | 45 (7.9%) | 33 (8.2%) |
| 6:30 AM to 6:59 AM | 26 (4.5%) | 64 (15.9%) |
| 7:00 AM to 7:29 AM | 73 (12.8%) | 64 (15.9%) |
| 7:30 AM to 7:59 AM | 117 (20.4%) | 98 (24.4%) |
| 8:00 AM to 8:29 AM | 77 (13.5%) | 53 (13.2%) |
| 8:30 AM to 8:59 AM | 22 (3.8%) | 20 (5.0%) |
| 9:00 AM to 9:59 AM | 25 (4.4%) | 21 (5.2%) |
| 10:00 AM to 10:59 AM | 43 (7.5%) | 21 (5.2%) |
| 11:00 AM to 11:59 AM | 0 (0.0%) | 0 (0.0%) |
| 12:00 PM to 3:59 PM | 17 (3.0%) | 12 (3.0%) |
| 4:00 PM to 11:59 PM | 31 (5.4%) | 16 (4.0%) |
| Total | 572 (100.0%) | 402 (100.0%) |
Housing Occupancy in Williams Bay
Occupancy by Ownership in Williams Bay
Of the total 1,212 dwellings in Williams Bay, owner-occupied units account for 908 (74.9%), while renter-occupied units make up 304 (25.1%).
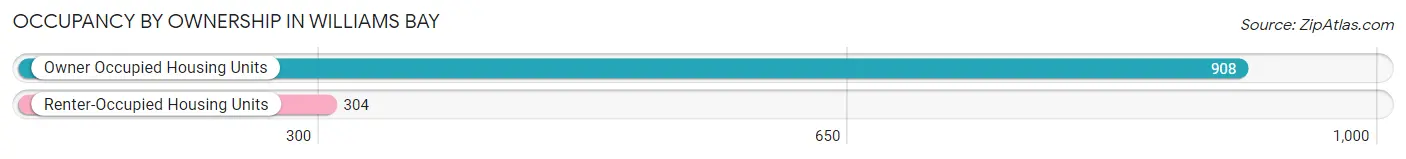
| Occupancy | # Housing Units | % Housing Units |
| Owner Occupied Housing Units | 908 | 74.9% |
| Renter-Occupied Housing Units | 304 | 25.1% |
| Total Occupied Housing Units | 1,212 | 100.0% |
Occupancy by Household Size in Williams Bay
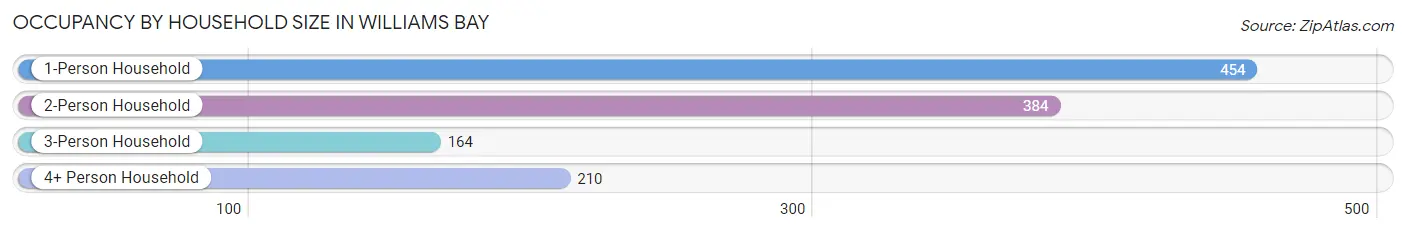
| Household Size | # Housing Units | % Housing Units |
| 1-Person Household | 454 | 37.5% |
| 2-Person Household | 384 | 31.7% |
| 3-Person Household | 164 | 13.5% |
| 4+ Person Household | 210 | 17.3% |
| Total Housing Units | 1,212 | 100.0% |
Occupancy by Ownership by Household Size in Williams Bay
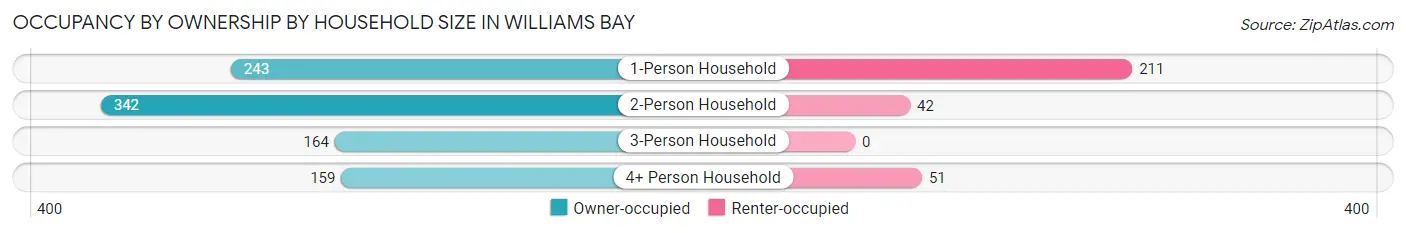
| Household Size | Owner-occupied | Renter-occupied |
| 1-Person Household | 243 (53.5%) | 211 (46.5%) |
| 2-Person Household | 342 (89.1%) | 42 (10.9%) |
| 3-Person Household | 164 (100.0%) | 0 (0.0%) |
| 4+ Person Household | 159 (75.7%) | 51 (24.3%) |
| Total Housing Units | 908 (74.9%) | 304 (25.1%) |
Occupancy by Educational Attainment in Williams Bay
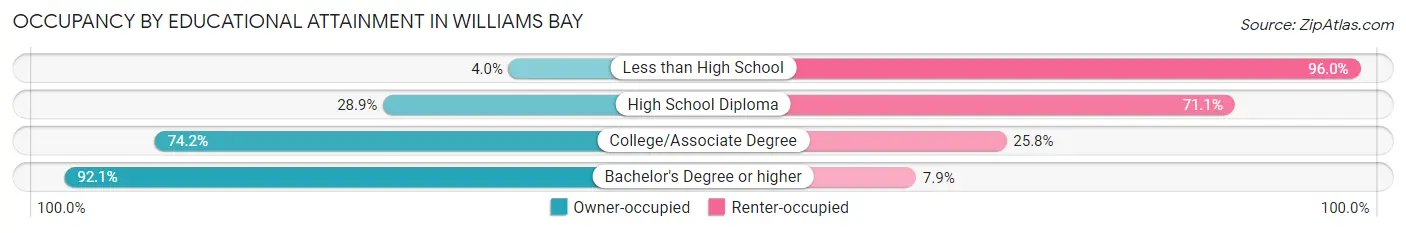
| Household Size | Owner-occupied | Renter-occupied |
| Less than High School | 1 (4.0%) | 24 (96.0%) |
| High School Diploma | 50 (28.9%) | 123 (71.1%) |
| College/Associate Degree | 319 (74.2%) | 111 (25.8%) |
| Bachelor's Degree or higher | 538 (92.1%) | 46 (7.9%) |
Occupancy by Age of Householder in Williams Bay

| Age Bracket | # Households | % Households |
| Under 35 Years | 111 | 9.2% |
| 35 to 44 Years | 167 | 13.8% |
| 45 to 54 Years | 201 | 16.6% |
| 55 to 64 Years | 267 | 22.0% |
| 65 to 74 Years | 219 | 18.1% |
| 75 to 84 Years | 151 | 12.5% |
| 85 Years and Over | 96 | 7.9% |
| Total | 1,212 | 100.0% |
Housing Finances in Williams Bay
Median Income by Occupancy in Williams Bay
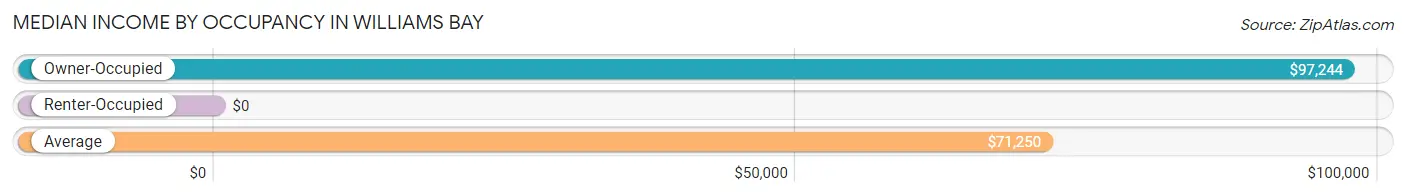
| Occupancy Type | # Households | Median Income |
| Owner-Occupied | 908 (74.9%) | $97,244 |
| Renter-Occupied | 304 (25.1%) | $0 |
| Average | 1,212 (100.0%) | $71,250 |
Occupancy by Householder Income Bracket in Williams Bay
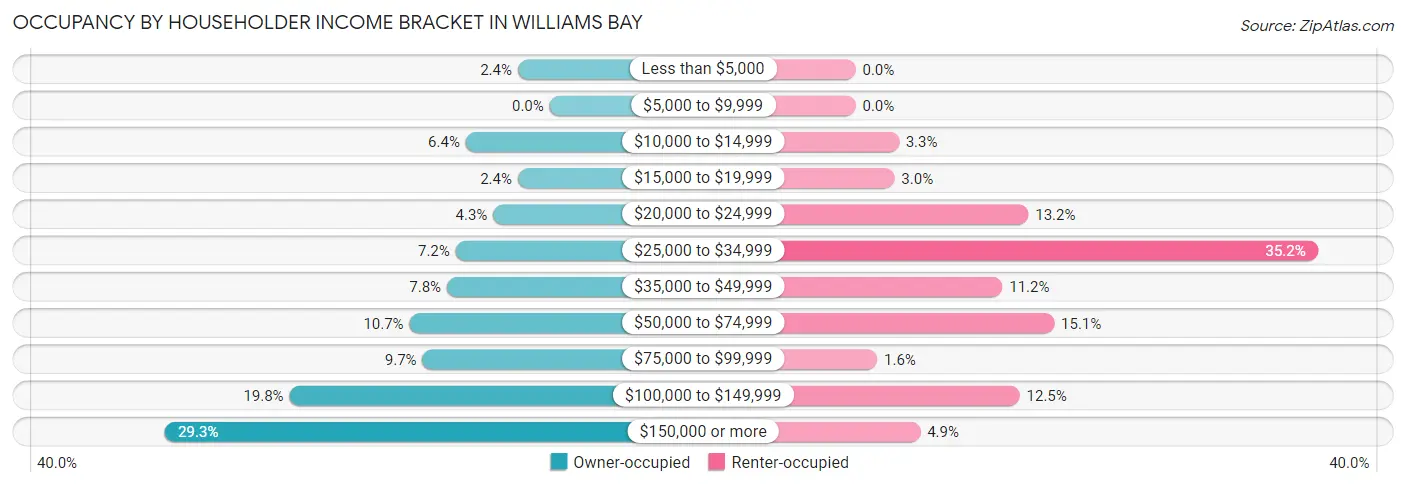
| Income Bracket | Owner-occupied | Renter-occupied |
| Less than $5,000 | 22 (2.4%) | 0 (0.0%) |
| $5,000 to $9,999 | 0 (0.0%) | 0 (0.0%) |
| $10,000 to $14,999 | 58 (6.4%) | 10 (3.3%) |
| $15,000 to $19,999 | 22 (2.4%) | 9 (3.0%) |
| $20,000 to $24,999 | 39 (4.3%) | 40 (13.2%) |
| $25,000 to $34,999 | 65 (7.2%) | 107 (35.2%) |
| $35,000 to $49,999 | 71 (7.8%) | 34 (11.2%) |
| $50,000 to $74,999 | 97 (10.7%) | 46 (15.1%) |
| $75,000 to $99,999 | 88 (9.7%) | 5 (1.6%) |
| $100,000 to $149,999 | 180 (19.8%) | 38 (12.5%) |
| $150,000 or more | 266 (29.3%) | 15 (4.9%) |
| Total | 908 (100.0%) | 304 (100.0%) |
Monthly Housing Cost Tiers in Williams Bay
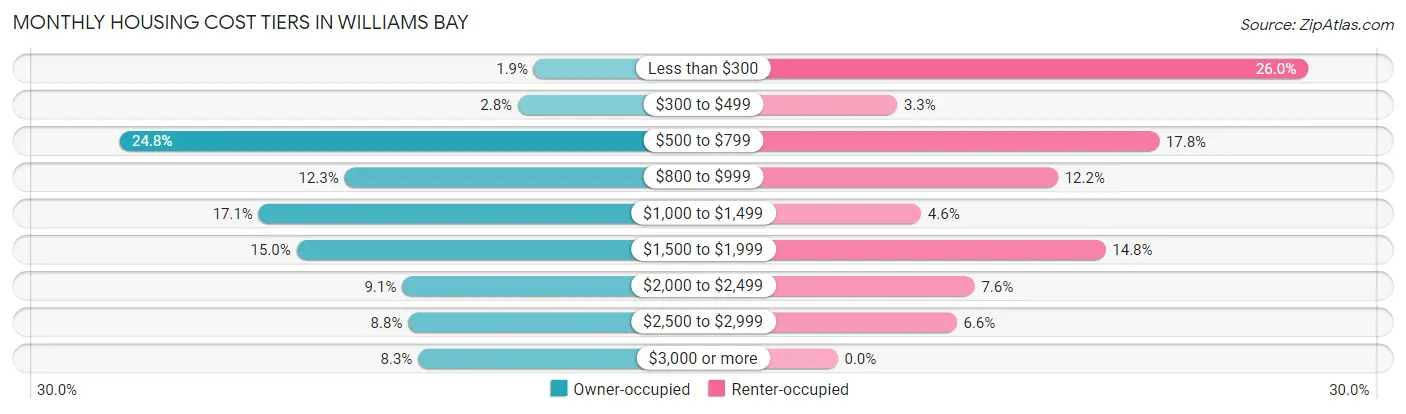
| Monthly Cost | Owner-occupied | Renter-occupied |
| Less than $300 | 17 (1.9%) | 79 (26.0%) |
| $300 to $499 | 25 (2.8%) | 10 (3.3%) |
| $500 to $799 | 225 (24.8%) | 54 (17.8%) |
| $800 to $999 | 112 (12.3%) | 37 (12.2%) |
| $1,000 to $1,499 | 155 (17.1%) | 14 (4.6%) |
| $1,500 to $1,999 | 136 (15.0%) | 45 (14.8%) |
| $2,000 to $2,499 | 83 (9.1%) | 23 (7.6%) |
| $2,500 to $2,999 | 80 (8.8%) | 20 (6.6%) |
| $3,000 or more | 75 (8.3%) | 0 (0.0%) |
| Total | 908 (100.0%) | 304 (100.0%) |
Physical Housing Characteristics in Williams Bay
Housing Structures in Williams Bay
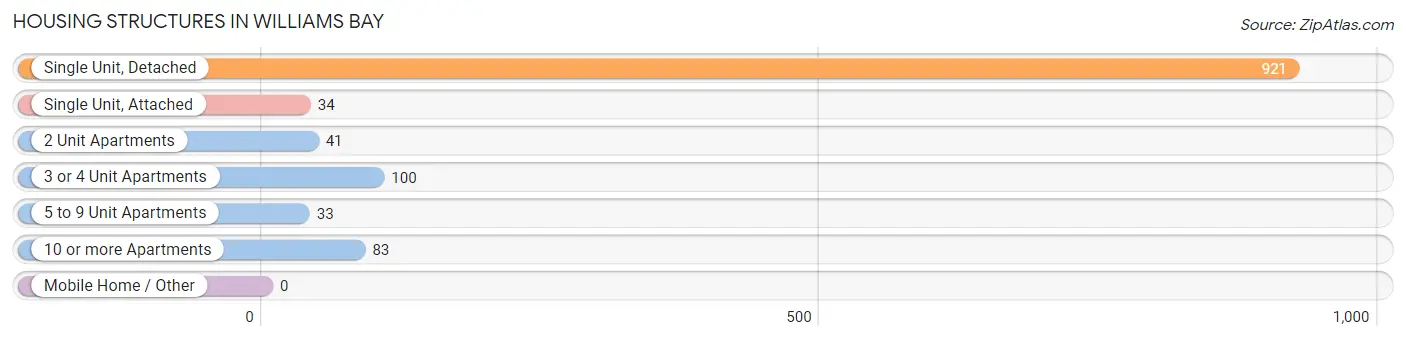
| Structure Type | # Housing Units | % Housing Units |
| Single Unit, Detached | 921 | 76.0% |
| Single Unit, Attached | 34 | 2.8% |
| 2 Unit Apartments | 41 | 3.4% |
| 3 or 4 Unit Apartments | 100 | 8.3% |
| 5 to 9 Unit Apartments | 33 | 2.7% |
| 10 or more Apartments | 83 | 6.9% |
| Mobile Home / Other | 0 | 0.0% |
| Total | 1,212 | 100.0% |
Housing Structures by Occupancy in Williams Bay
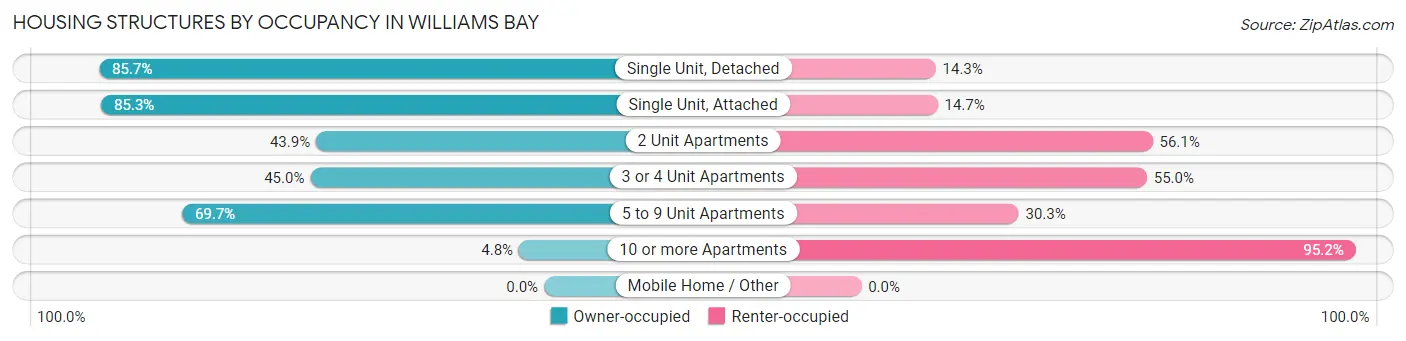
| Structure Type | Owner-occupied | Renter-occupied |
| Single Unit, Detached | 789 (85.7%) | 132 (14.3%) |
| Single Unit, Attached | 29 (85.3%) | 5 (14.7%) |
| 2 Unit Apartments | 18 (43.9%) | 23 (56.1%) |
| 3 or 4 Unit Apartments | 45 (45.0%) | 55 (55.0%) |
| 5 to 9 Unit Apartments | 23 (69.7%) | 10 (30.3%) |
| 10 or more Apartments | 4 (4.8%) | 79 (95.2%) |
| Mobile Home / Other | 0 (0.0%) | 0 (0.0%) |
| Total | 908 (74.9%) | 304 (25.1%) |
Housing Structures by Number of Rooms in Williams Bay
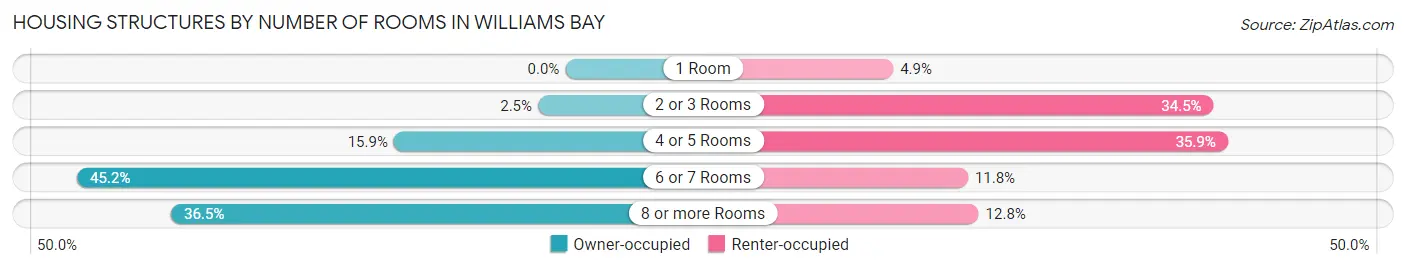
| Number of Rooms | Owner-occupied | Renter-occupied |
| 1 Room | 0 (0.0%) | 15 (4.9%) |
| 2 or 3 Rooms | 23 (2.5%) | 105 (34.5%) |
| 4 or 5 Rooms | 144 (15.9%) | 109 (35.9%) |
| 6 or 7 Rooms | 410 (45.2%) | 36 (11.8%) |
| 8 or more Rooms | 331 (36.4%) | 39 (12.8%) |
| Total | 908 (100.0%) | 304 (100.0%) |
Housing Structure by Heating Type in Williams Bay
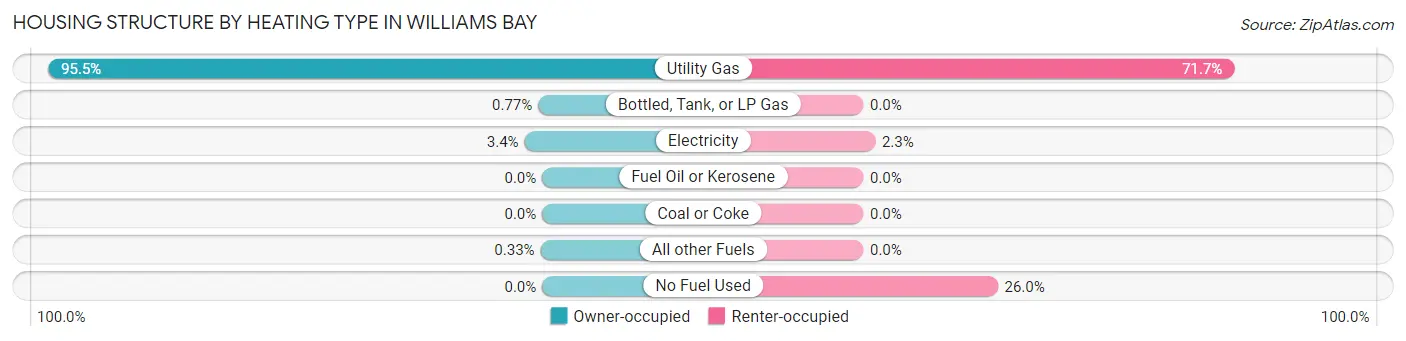
| Heating Type | Owner-occupied | Renter-occupied |
| Utility Gas | 867 (95.5%) | 218 (71.7%) |
| Bottled, Tank, or LP Gas | 7 (0.8%) | 0 (0.0%) |
| Electricity | 31 (3.4%) | 7 (2.3%) |
| Fuel Oil or Kerosene | 0 (0.0%) | 0 (0.0%) |
| Coal or Coke | 0 (0.0%) | 0 (0.0%) |
| All other Fuels | 3 (0.3%) | 0 (0.0%) |
| No Fuel Used | 0 (0.0%) | 79 (26.0%) |
| Total | 908 (100.0%) | 304 (100.0%) |
Household Vehicle Usage in Williams Bay
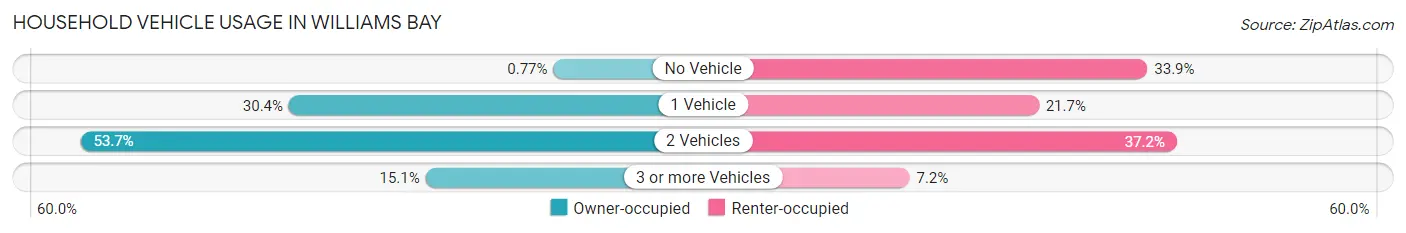
| Vehicles per Household | Owner-occupied | Renter-occupied |
| No Vehicle | 7 (0.8%) | 103 (33.9%) |
| 1 Vehicle | 276 (30.4%) | 66 (21.7%) |
| 2 Vehicles | 488 (53.7%) | 113 (37.2%) |
| 3 or more Vehicles | 137 (15.1%) | 22 (7.2%) |
| Total | 908 (100.0%) | 304 (100.0%) |
Real Estate & Mortgages in Williams Bay
Real Estate and Mortgage Overview in Williams Bay
| Characteristic | Without Mortgage | With Mortgage |
| Housing Units | 417 | 491 |
| Median Property Value | $310,000 | $373,800 |
| Median Household Income | $52,411 | $188 |
| Monthly Housing Costs | $697 | $65 |
| Real Estate Taxes | $3,887 | $2 |
Property Value by Mortgage Status in Williams Bay
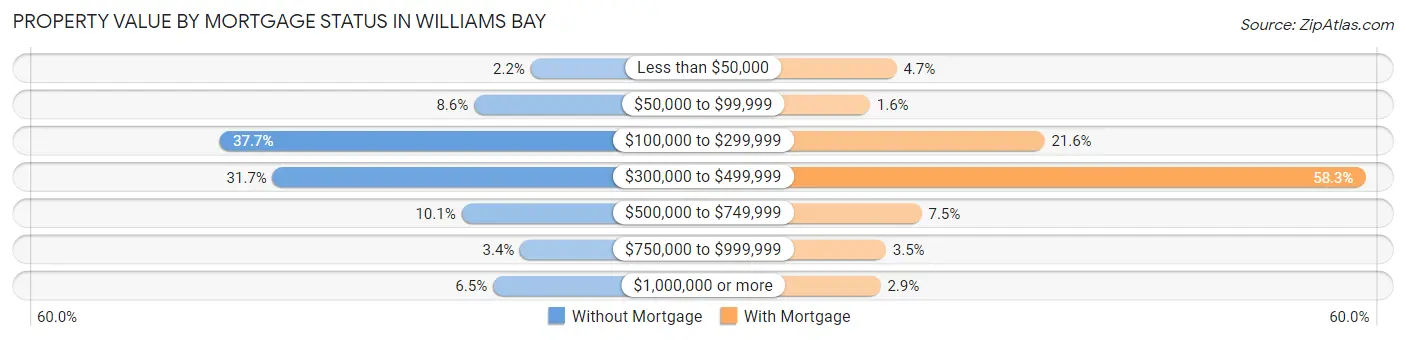
| Property Value | Without Mortgage | With Mortgage |
| Less than $50,000 | 9 (2.2%) | 23 (4.7%) |
| $50,000 to $99,999 | 36 (8.6%) | 8 (1.6%) |
| $100,000 to $299,999 | 157 (37.7%) | 106 (21.6%) |
| $300,000 to $499,999 | 132 (31.7%) | 286 (58.3%) |
| $500,000 to $749,999 | 42 (10.1%) | 37 (7.5%) |
| $750,000 to $999,999 | 14 (3.4%) | 17 (3.5%) |
| $1,000,000 or more | 27 (6.5%) | 14 (2.9%) |
| Total | 417 (100.0%) | 491 (100.0%) |
Household Income by Mortgage Status in Williams Bay
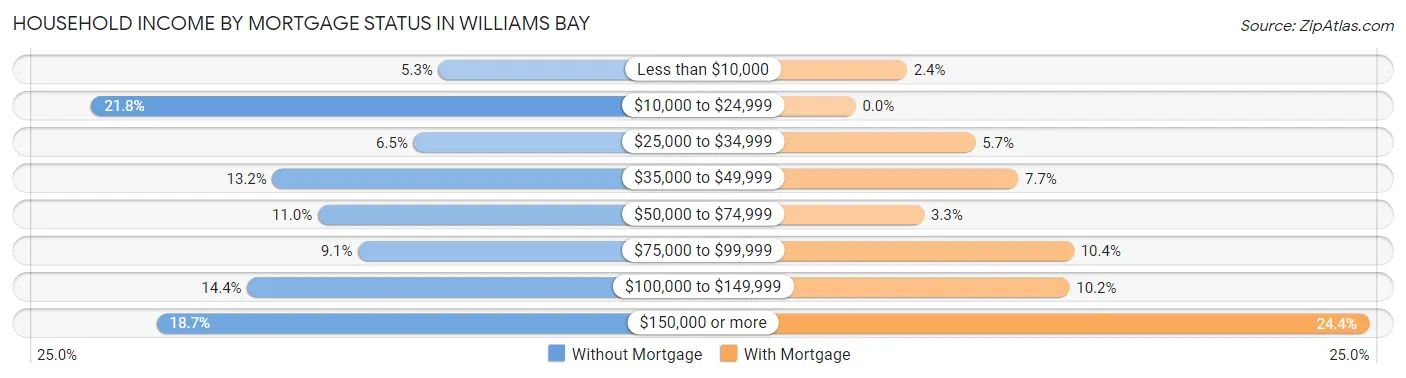
| Household Income | Without Mortgage | With Mortgage |
| Less than $10,000 | 22 (5.3%) | 12 (2.4%) |
| $10,000 to $24,999 | 91 (21.8%) | 0 (0.0%) |
| $25,000 to $34,999 | 27 (6.5%) | 28 (5.7%) |
| $35,000 to $49,999 | 55 (13.2%) | 38 (7.7%) |
| $50,000 to $74,999 | 46 (11.0%) | 16 (3.3%) |
| $75,000 to $99,999 | 38 (9.1%) | 51 (10.4%) |
| $100,000 to $149,999 | 60 (14.4%) | 50 (10.2%) |
| $150,000 or more | 78 (18.7%) | 120 (24.4%) |
| Total | 417 (100.0%) | 491 (100.0%) |
Property Value to Household Income Ratio in Williams Bay
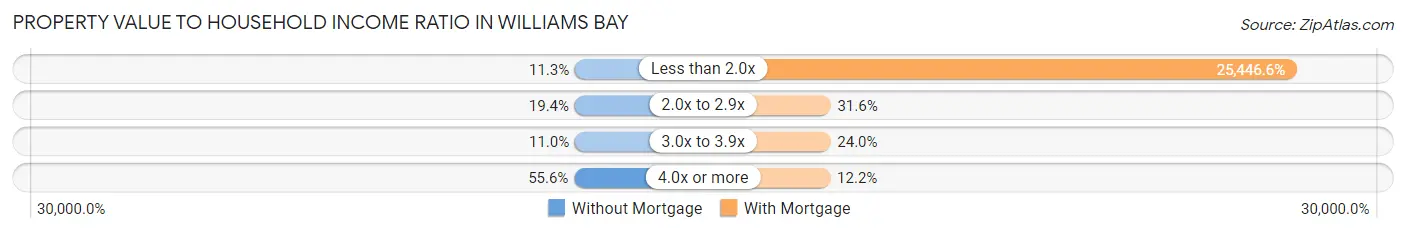
| Value-to-Income Ratio | Without Mortgage | With Mortgage |
| Less than 2.0x | 47 (11.3%) | 124,943 (25,446.6%) |
| 2.0x to 2.9x | 81 (19.4%) | 155 (31.6%) |
| 3.0x to 3.9x | 46 (11.0%) | 118 (24.0%) |
| 4.0x or more | 232 (55.6%) | 60 (12.2%) |
| Total | 417 (100.0%) | 491 (100.0%) |
Real Estate Taxes by Mortgage Status in Williams Bay
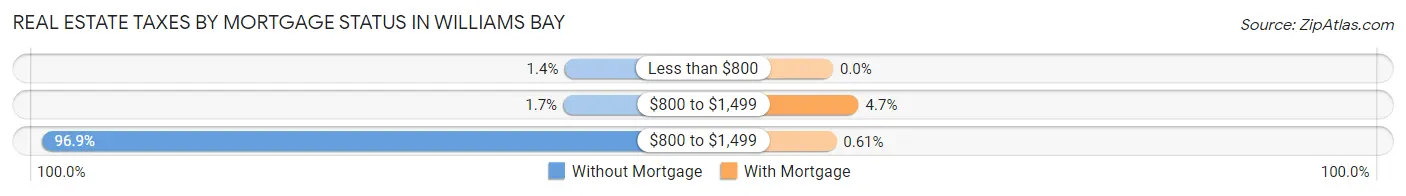
| Property Taxes | Without Mortgage | With Mortgage |
| Less than $800 | 6 (1.4%) | 0 (0.0%) |
| $800 to $1,499 | 7 (1.7%) | 23 (4.7%) |
| $800 to $1,499 | 404 (96.9%) | 3 (0.6%) |
| Total | 417 (100.0%) | 491 (100.0%) |
Health & Disability in Williams Bay
Health Insurance Coverage by Age in Williams Bay
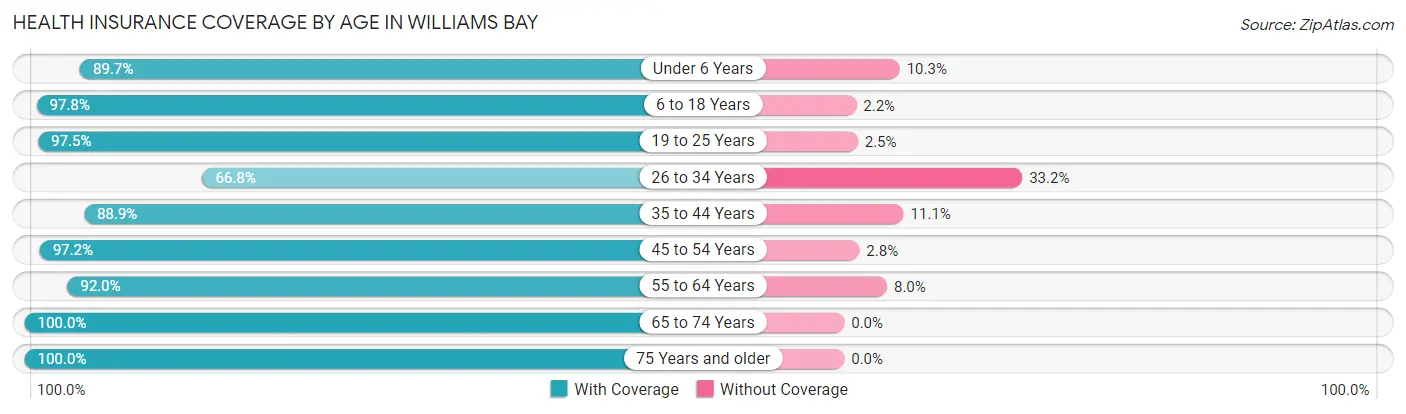
| Age Bracket | With Coverage | Without Coverage |
| Under 6 Years | 234 (89.7%) | 27 (10.3%) |
| 6 to 18 Years | 437 (97.8%) | 10 (2.2%) |
| 19 to 25 Years | 155 (97.5%) | 4 (2.5%) |
| 26 to 34 Years | 141 (66.8%) | 70 (33.2%) |
| 35 to 44 Years | 233 (88.9%) | 29 (11.1%) |
| 45 to 54 Years | 379 (97.2%) | 11 (2.8%) |
| 55 to 64 Years | 381 (92.0%) | 33 (8.0%) |
| 65 to 74 Years | 413 (100.0%) | 0 (0.0%) |
| 75 Years and older | 355 (100.0%) | 0 (0.0%) |
| Total | 2,728 (93.7%) | 184 (6.3%) |
Health Insurance Coverage by Citizenship Status in Williams Bay
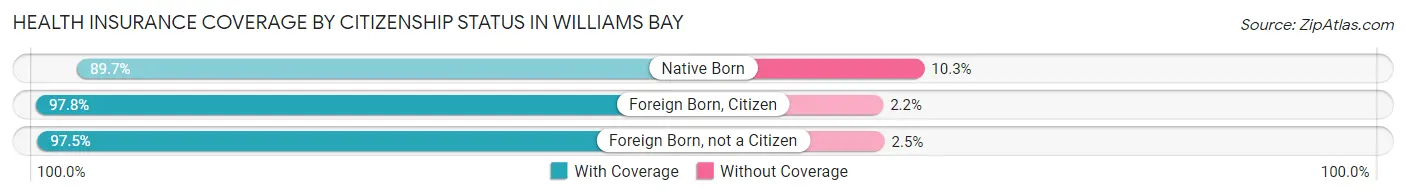
| Citizenship Status | With Coverage | Without Coverage |
| Native Born | 234 (89.7%) | 27 (10.3%) |
| Foreign Born, Citizen | 437 (97.8%) | 10 (2.2%) |
| Foreign Born, not a Citizen | 155 (97.5%) | 4 (2.5%) |
Health Insurance Coverage by Household Income in Williams Bay
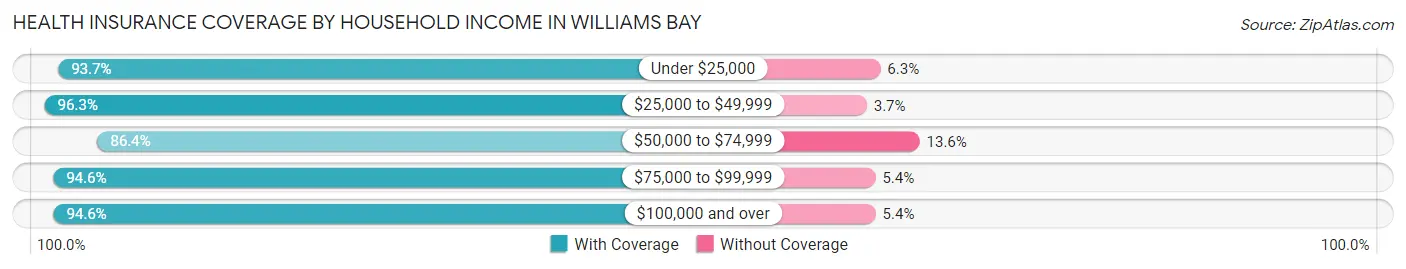
| Household Income | With Coverage | Without Coverage |
| Under $25,000 | 223 (93.7%) | 15 (6.3%) |
| $25,000 to $49,999 | 515 (96.3%) | 20 (3.7%) |
| $50,000 to $74,999 | 323 (86.4%) | 51 (13.6%) |
| $75,000 to $99,999 | 194 (94.6%) | 11 (5.4%) |
| $100,000 and over | 1,451 (94.6%) | 83 (5.4%) |
Public vs Private Health Insurance Coverage by Age in Williams Bay
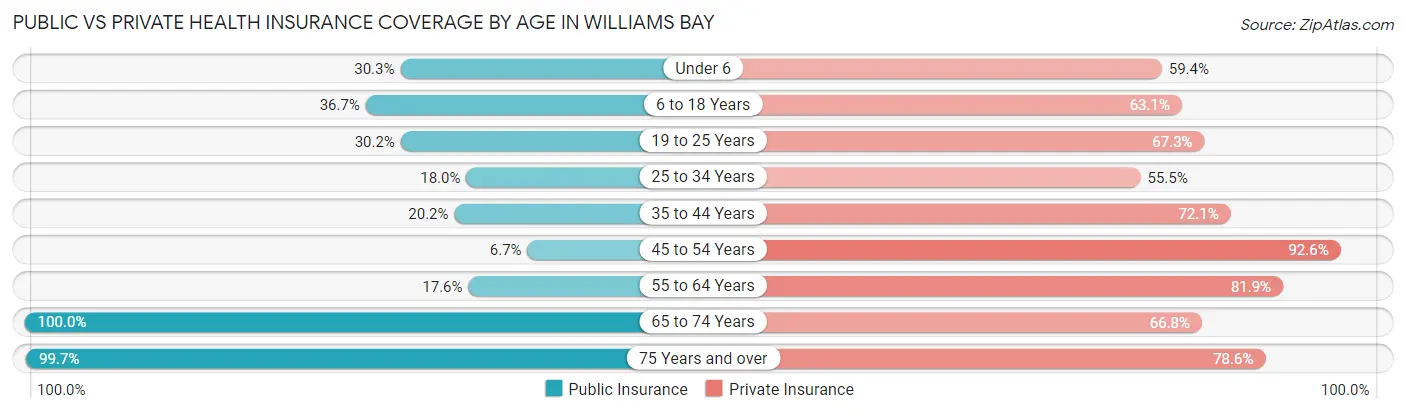
| Age Bracket | Public Insurance | Private Insurance |
| Under 6 | 79 (30.3%) | 155 (59.4%) |
| 6 to 18 Years | 164 (36.7%) | 282 (63.1%) |
| 19 to 25 Years | 48 (30.2%) | 107 (67.3%) |
| 25 to 34 Years | 38 (18.0%) | 117 (55.4%) |
| 35 to 44 Years | 53 (20.2%) | 189 (72.1%) |
| 45 to 54 Years | 26 (6.7%) | 361 (92.6%) |
| 55 to 64 Years | 73 (17.6%) | 339 (81.9%) |
| 65 to 74 Years | 413 (100.0%) | 276 (66.8%) |
| 75 Years and over | 354 (99.7%) | 279 (78.6%) |
| Total | 1,248 (42.9%) | 2,105 (72.3%) |
Disability Status by Sex by Age in Williams Bay
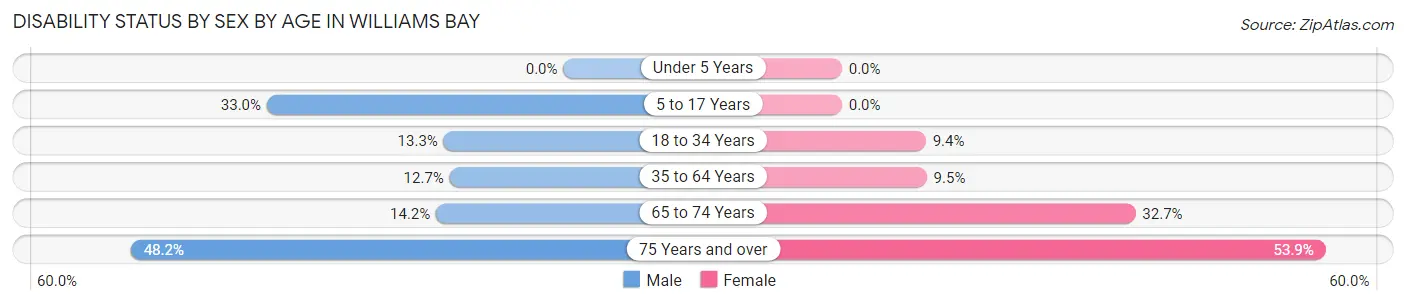
| Age Bracket | Male | Female |
| Under 5 Years | 0 (0.0%) | 0 (0.0%) |
| 5 to 17 Years | 71 (33.0%) | 0 (0.0%) |
| 18 to 34 Years | 22 (13.3%) | 20 (9.3%) |
| 35 to 64 Years | 68 (12.7%) | 50 (9.5%) |
| 65 to 74 Years | 36 (14.2%) | 52 (32.7%) |
| 75 Years and over | 53 (48.2%) | 132 (53.9%) |
Disability Class by Sex by Age in Williams Bay
Disability Class: Hearing Difficulty
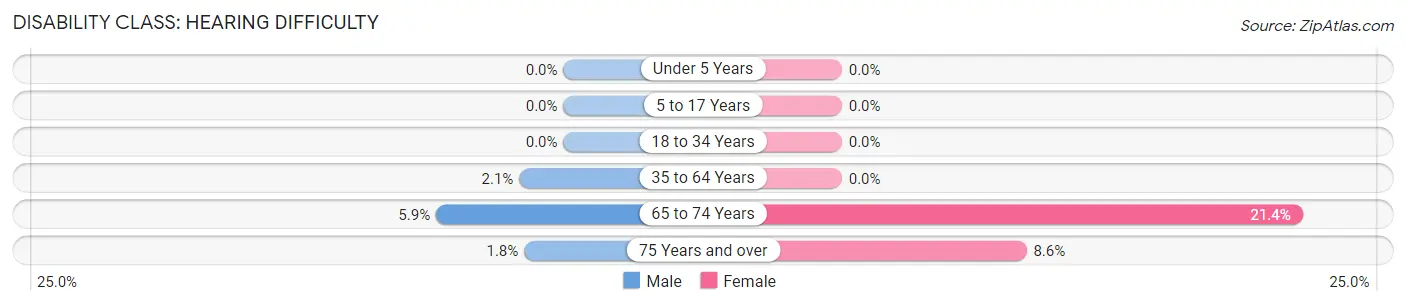
| Age Bracket | Male | Female |
| Under 5 Years | 0 (0.0%) | 0 (0.0%) |
| 5 to 17 Years | 0 (0.0%) | 0 (0.0%) |
| 18 to 34 Years | 0 (0.0%) | 0 (0.0%) |
| 35 to 64 Years | 11 (2.1%) | 0 (0.0%) |
| 65 to 74 Years | 15 (5.9%) | 34 (21.4%) |
| 75 Years and over | 2 (1.8%) | 21 (8.6%) |
Disability Class: Vision Difficulty
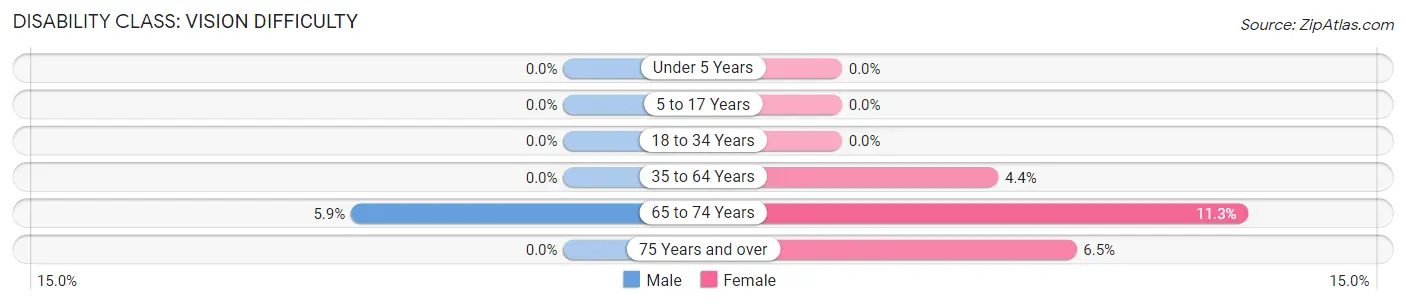
| Age Bracket | Male | Female |
| Under 5 Years | 0 (0.0%) | 0 (0.0%) |
| 5 to 17 Years | 0 (0.0%) | 0 (0.0%) |
| 18 to 34 Years | 0 (0.0%) | 0 (0.0%) |
| 35 to 64 Years | 0 (0.0%) | 23 (4.3%) |
| 65 to 74 Years | 15 (5.9%) | 18 (11.3%) |
| 75 Years and over | 0 (0.0%) | 16 (6.5%) |
Disability Class: Cognitive Difficulty
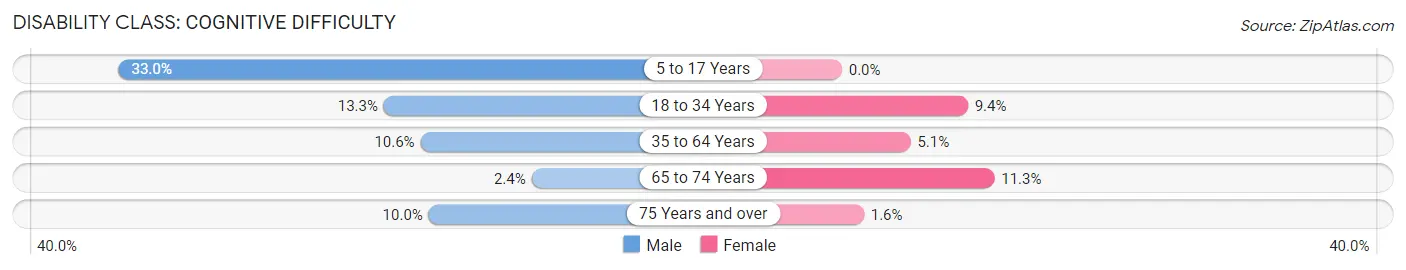
| Age Bracket | Male | Female |
| 5 to 17 Years | 71 (33.0%) | 0 (0.0%) |
| 18 to 34 Years | 22 (13.3%) | 20 (9.3%) |
| 35 to 64 Years | 57 (10.6%) | 27 (5.1%) |
| 65 to 74 Years | 6 (2.4%) | 18 (11.3%) |
| 75 Years and over | 11 (10.0%) | 4 (1.6%) |
Disability Class: Ambulatory Difficulty
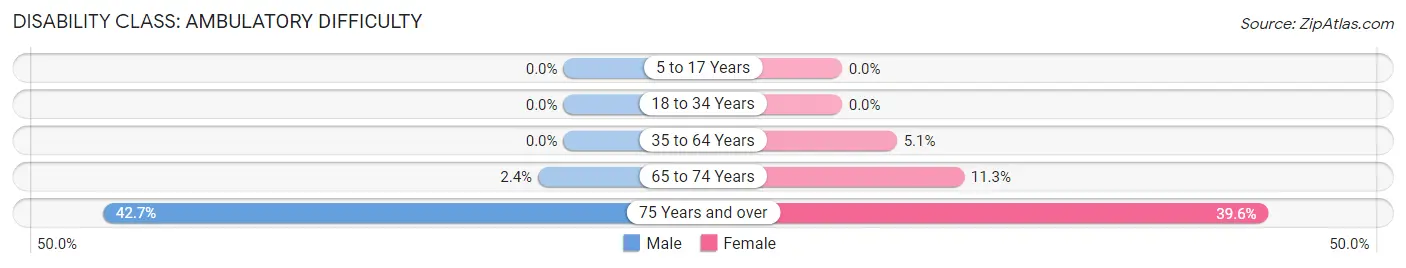
| Age Bracket | Male | Female |
| 5 to 17 Years | 0 (0.0%) | 0 (0.0%) |
| 18 to 34 Years | 0 (0.0%) | 0 (0.0%) |
| 35 to 64 Years | 0 (0.0%) | 27 (5.1%) |
| 65 to 74 Years | 6 (2.4%) | 18 (11.3%) |
| 75 Years and over | 47 (42.7%) | 97 (39.6%) |
Disability Class: Self-Care Difficulty
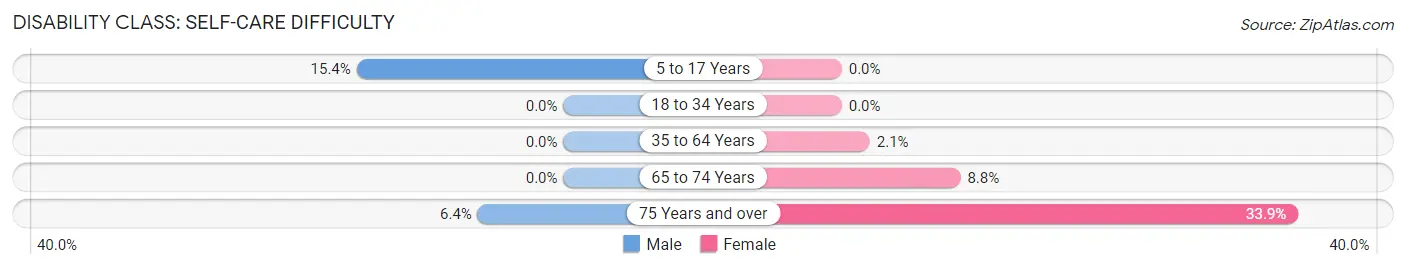
| Age Bracket | Male | Female |
| 5 to 17 Years | 33 (15.3%) | 0 (0.0%) |
| 18 to 34 Years | 0 (0.0%) | 0 (0.0%) |
| 35 to 64 Years | 0 (0.0%) | 11 (2.1%) |
| 65 to 74 Years | 0 (0.0%) | 14 (8.8%) |
| 75 Years and over | 7 (6.4%) | 83 (33.9%) |
Technology Access in Williams Bay
Computing Device Access in Williams Bay
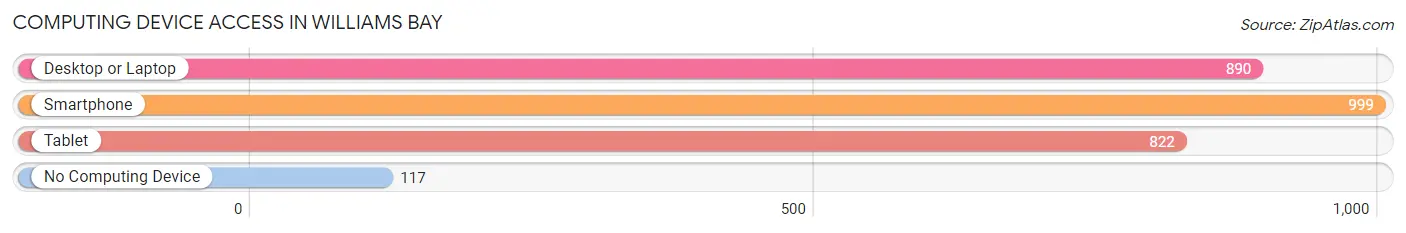
| Device Type | # Households | % Households |
| Desktop or Laptop | 890 | 73.4% |
| Smartphone | 999 | 82.4% |
| Tablet | 822 | 67.8% |
| No Computing Device | 117 | 9.7% |
| Total | 1,212 | 100.0% |
Internet Access in Williams Bay
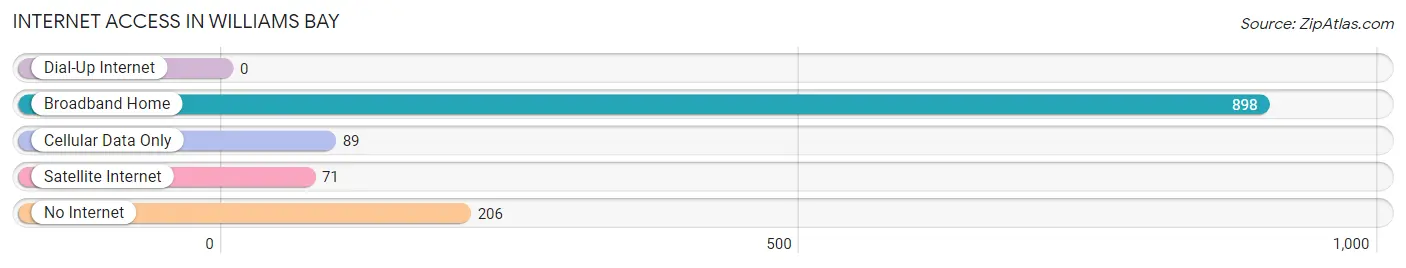
| Internet Type | # Households | % Households |
| Dial-Up Internet | 0 | 0.0% |
| Broadband Home | 898 | 74.1% |
| Cellular Data Only | 89 | 7.3% |
| Satellite Internet | 71 | 5.9% |
| No Internet | 206 | 17.0% |
| Total | 1,212 | 100.0% |
Williams Bay Summary
History
Williams Bay is a village located in Walworth County, Wisconsin, United States. The village is situated on the western shore of Geneva Lake, and is part of the Lake Geneva Micropolitan Statistical Area. The village was founded in 1836 by William S. Williams, who was a surveyor and land speculator. He purchased the land from the federal government and named it after himself. The village was incorporated in 1891.
The village of Williams Bay has a rich history that dates back to the early 1800s. The area was originally inhabited by the Potawatomi Native American tribe. In 1836, William S. Williams purchased the land from the federal government and named it after himself. The village was officially incorporated in 1891.
The village of Williams Bay has a long history of being a popular summer destination for tourists. The area was known for its beautiful scenery and recreational activities, such as fishing, boating, and swimming. The village was also home to several resorts, including the Grand Geneva Resort and Spa, which opened in 1968.
Geography
Williams Bay is located in Walworth County, Wisconsin, United States. The village is situated on the western shore of Geneva Lake, and is part of the Lake Geneva Micropolitan Statistical Area. The village is located approximately 25 miles southwest of Milwaukee and 60 miles northwest of Chicago.
The village of Williams Bay has a total area of 2.2 square miles, all of which is land. The village is located at an elevation of 845 feet above sea level. The village is bordered by the towns of Linn, Geneva, and LaFayette.
Economy
The economy of Williams Bay is largely based on tourism and recreation. The village is home to several resorts, including the Grand Geneva Resort and Spa, which opened in 1968. The resort offers a variety of amenities, including golf courses, a spa, and a variety of restaurants.
The village is also home to several marinas, which offer boat rentals and other services. The village is also home to several restaurants, bars, and shops.
Demographics
As of the 2010 census, the village of Williams Bay had a population of 2,521. The racial makeup of the village was 97.2% White, 0.7% African American, 0.3% Native American, 0.4% Asian, 0.1% Pacific Islander, 0.3% from other races, and 0.9% from two or more races. Hispanic or Latino of any race were 1.3% of the population.
The median household income in the village was $50,972, and the median family income was $62,813. The per capita income for the village was $30,945. About 4.3% of families and 6.2% of the population were below the poverty line, including 8.2% of those under age 18 and 4.2% of those age 65 or over.
Common Questions
What is Per Capita Income in Williams Bay?
Per Capita income in Williams Bay is $50,238.
What is the Median Family Income in Williams Bay?
Median Family Income in Williams Bay is $119,199.
What is the Median Household income in Williams Bay?
Median Household Income in Williams Bay is $71,250.
What is Income or Wage Gap in Williams Bay?
Income or Wage Gap in Williams Bay is 42.1%.
Women in Williams Bay earn 57.9 cents for every dollar earned by a man.
What is Inequality or Gini Index in Williams Bay?
Inequality or Gini Index in Williams Bay is 0.53.
What is the Total Population of Williams Bay?
Total Population of Williams Bay is 2,947.
What is the Total Male Population of Williams Bay?
Total Male Population of Williams Bay is 1,394.
What is the Total Female Population of Williams Bay?
Total Female Population of Williams Bay is 1,553.
What is the Ratio of Males per 100 Females in Williams Bay?
There are 89.76 Males per 100 Females in Williams Bay.
What is the Ratio of Females per 100 Males in Williams Bay?
There are 111.41 Females per 100 Males in Williams Bay.
What is the Median Population Age in Williams Bay?
Median Population Age in Williams Bay is 48.2 Years.
What is the Average Family Size in Williams Bay
Average Family Size in Williams Bay is 3.2 People.
What is the Average Household Size in Williams Bay
Average Household Size in Williams Bay is 2.4 People.
How Large is the Labor Force in Williams Bay?
There are 1,288 People in the Labor Forcein in Williams Bay.
What is the Percentage of People in the Labor Force in Williams Bay?
55.1% of People are in the Labor Force in Williams Bay.
What is the Unemployment Rate in Williams Bay?
Unemployment Rate in Williams Bay is 4.1%.