Weyauwega, WI Map & Demographics
Weyauwega Map
Weyauwega Overview
$27,746
PER CAPITA INCOME
$60,978
AVG FAMILY INCOME
$61,316
AVG HOUSEHOLD INCOME
20.8%
WAGE / INCOME GAP [ % ]
79.2¢/ $1
WAGE / INCOME GAP [ $ ]
0.35
INEQUALITY / GINI INDEX
1,857
TOTAL POPULATION
922
MALE POPULATION
935
FEMALE POPULATION
98.61
MALES / 100 FEMALES
101.41
FEMALES / 100 MALES
36.1
MEDIAN AGE
2.9
AVG FAMILY SIZE
2.5
AVG HOUSEHOLD SIZE
950
LABOR FORCE [ PEOPLE ]
64.7%
PERCENT IN LABOR FORCE
0.5%
UNEMPLOYMENT RATE
Weyauwega Zip Codes
Weyauwega Area Codes
Income in Weyauwega
Income Overview in Weyauwega
Per Capita Income in Weyauwega is $27,746, while median incomes of families and households are $60,978 and $61,316 respectively.
| Characteristic | Number | Measure |
| Per Capita Income | 1,857 | $27,746 |
| Median Family Income | 470 | $60,978 |
| Mean Family Income | 470 | $69,049 |
| Median Household Income | 708 | $61,316 |
| Mean Household Income | 708 | $66,574 |
| Income Deficit | 470 | $0 |
| Wage / Income Gap (%) | 1,857 | 20.83% |
| Wage / Income Gap ($) | 1,857 | 79.17¢ per $1 |
| Gini / Inequality Index | 1,857 | 0.35 |
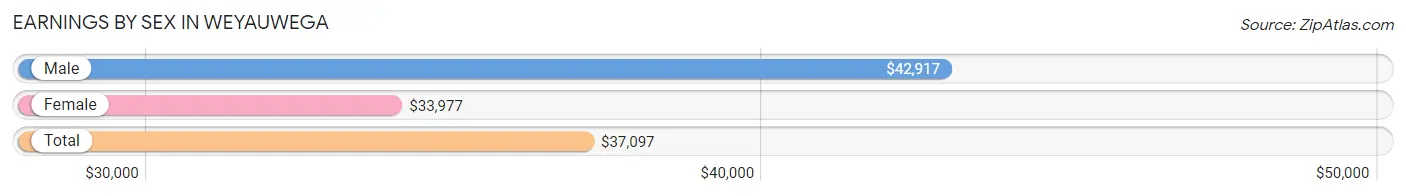
Earnings by Sex in Weyauwega
Average Earnings in Weyauwega are $37,097, $42,917 for men and $33,977 for women, a difference of 20.8%.
| Sex | Number | Average Earnings |
| Male | 513 (51.6%) | $42,917 |
| Female | 481 (48.4%) | $33,977 |
| Total | 994 (100.0%) | $37,097 |
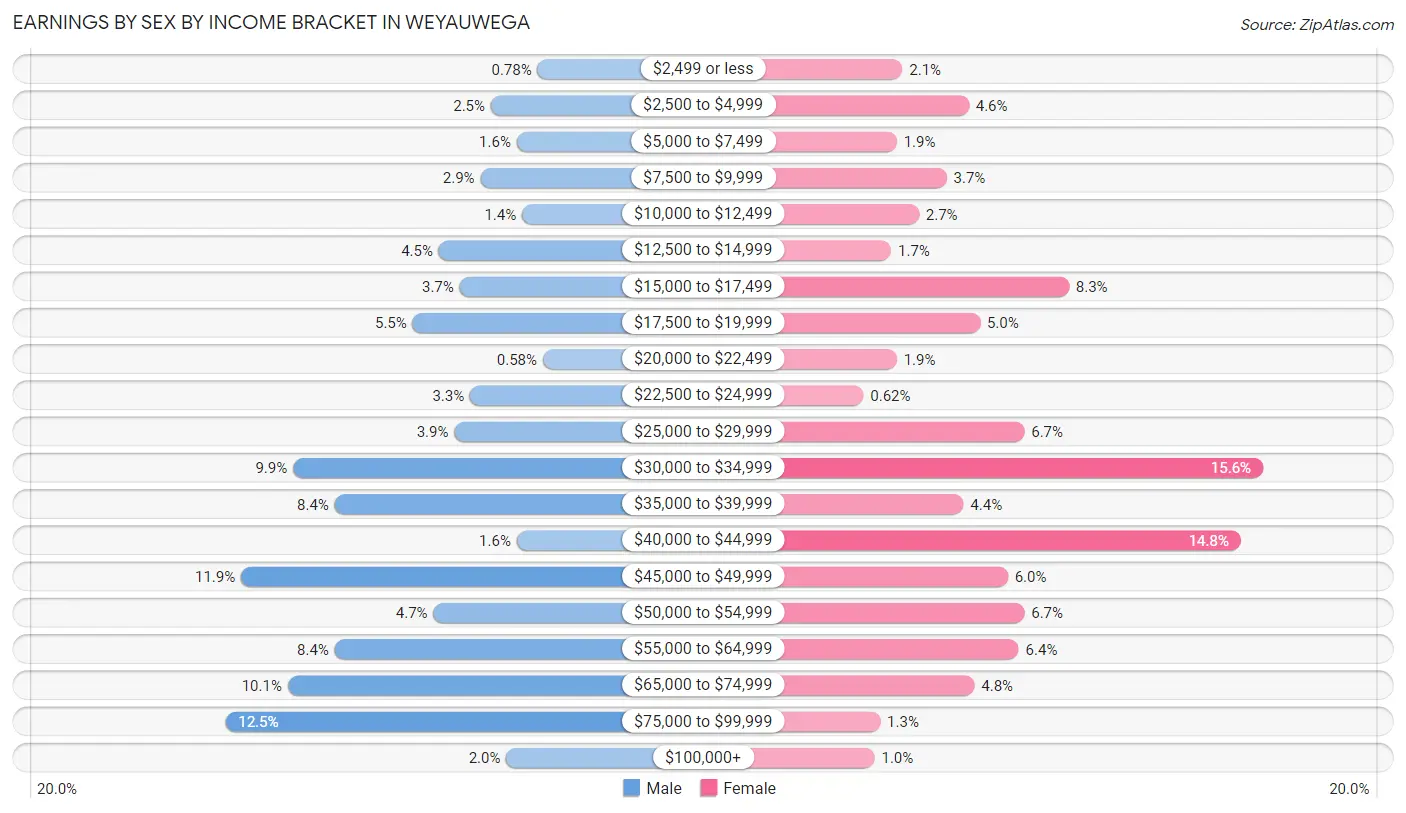
Earnings by Sex by Income Bracket in Weyauwega
The most common earnings brackets in Weyauwega are $75,000 to $99,999 for men (64 | 12.5%) and $30,000 to $34,999 for women (75 | 15.6%).
| Income | Male | Female |
| $2,499 or less | 4 (0.8%) | 10 (2.1%) |
| $2,500 to $4,999 | 13 (2.5%) | 22 (4.6%) |
| $5,000 to $7,499 | 8 (1.6%) | 9 (1.9%) |
| $7,500 to $9,999 | 15 (2.9%) | 18 (3.7%) |
| $10,000 to $12,499 | 7 (1.4%) | 13 (2.7%) |
| $12,500 to $14,999 | 23 (4.5%) | 8 (1.7%) |
| $15,000 to $17,499 | 19 (3.7%) | 40 (8.3%) |
| $17,500 to $19,999 | 28 (5.5%) | 24 (5.0%) |
| $20,000 to $22,499 | 3 (0.6%) | 9 (1.9%) |
| $22,500 to $24,999 | 17 (3.3%) | 3 (0.6%) |
| $25,000 to $29,999 | 20 (3.9%) | 32 (6.7%) |
| $30,000 to $34,999 | 51 (9.9%) | 75 (15.6%) |
| $35,000 to $39,999 | 43 (8.4%) | 21 (4.4%) |
| $40,000 to $44,999 | 8 (1.6%) | 71 (14.8%) |
| $45,000 to $49,999 | 61 (11.9%) | 29 (6.0%) |
| $50,000 to $54,999 | 24 (4.7%) | 32 (6.7%) |
| $55,000 to $64,999 | 43 (8.4%) | 31 (6.4%) |
| $65,000 to $74,999 | 52 (10.1%) | 23 (4.8%) |
| $75,000 to $99,999 | 64 (12.5%) | 6 (1.3%) |
| $100,000+ | 10 (1.9%) | 5 (1.0%) |
| Total | 513 (100.0%) | 481 (100.0%) |
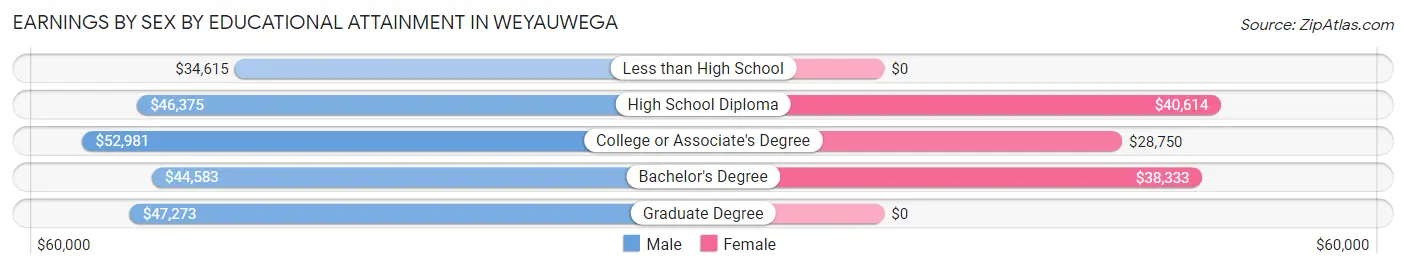
Earnings by Sex by Educational Attainment in Weyauwega
Average earnings in Weyauwega are $46,648 for men and $34,620 for women, a difference of 25.8%. Men with an educational attainment of college or associate's degree enjoy the highest average annual earnings of $52,981, while those with less than high school education earn the least with $34,615. Women with an educational attainment of high school diploma earn the most with the average annual earnings of $40,614, while those with college or associate's degree education have the smallest earnings of $28,750.
| Educational Attainment | Male Income | Female Income |
| Less than High School | $34,615 | $0 |
| High School Diploma | $46,375 | $40,614 |
| College or Associate's Degree | $52,981 | $28,750 |
| Bachelor's Degree | $44,583 | $38,333 |
| Graduate Degree | $47,273 | $0 |
| Total | $46,648 | $34,620 |
Family Income in Weyauwega
Family Income Brackets in Weyauwega
According to the Weyauwega family income data, there are 187 families falling into the $50,000 to $74,999 income range, which is the most common income bracket and makes up 39.8% of all families.
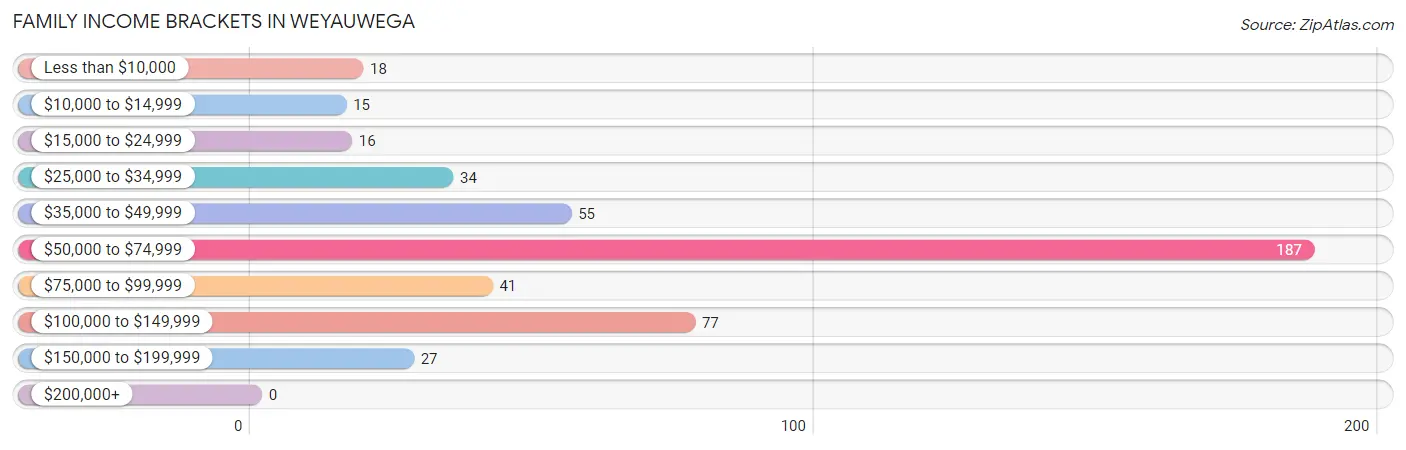
| Income Bracket | # Families | % Families |
| Less than $10,000 | 18 | 3.8% |
| $10,000 to $14,999 | 15 | 3.2% |
| $15,000 to $24,999 | 16 | 3.4% |
| $25,000 to $34,999 | 34 | 7.2% |
| $35,000 to $49,999 | 55 | 11.7% |
| $50,000 to $74,999 | 187 | 39.8% |
| $75,000 to $99,999 | 41 | 8.7% |
| $100,000 to $149,999 | 77 | 16.4% |
| $150,000 to $199,999 | 27 | 5.7% |
| $200,000+ | 0 | 0.0% |
Family Income by Famaliy Size in Weyauwega
4-person families (95 | 20.2%) account for the highest median family income in Weyauwega with $73,869 per family, while 2-person families (242 | 51.5%) have the highest median income of $28,386 per family member.
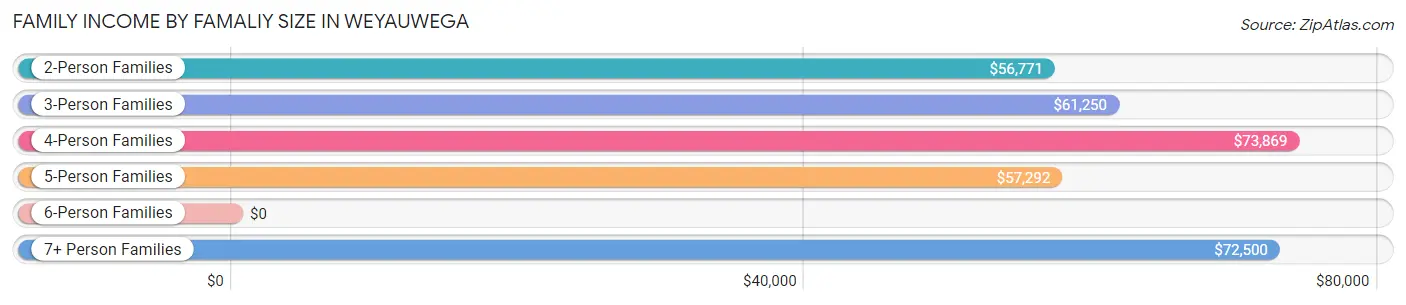
| Income Bracket | # Families | Median Income |
| 2-Person Families | 242 (51.5%) | $56,771 |
| 3-Person Families | 105 (22.3%) | $61,250 |
| 4-Person Families | 95 (20.2%) | $73,869 |
| 5-Person Families | 22 (4.7%) | $57,292 |
| 6-Person Families | 0 (0.0%) | $0 |
| 7+ Person Families | 6 (1.3%) | $72,500 |
| Total | 470 (100.0%) | $60,978 |
Family Income by Number of Earners in Weyauwega
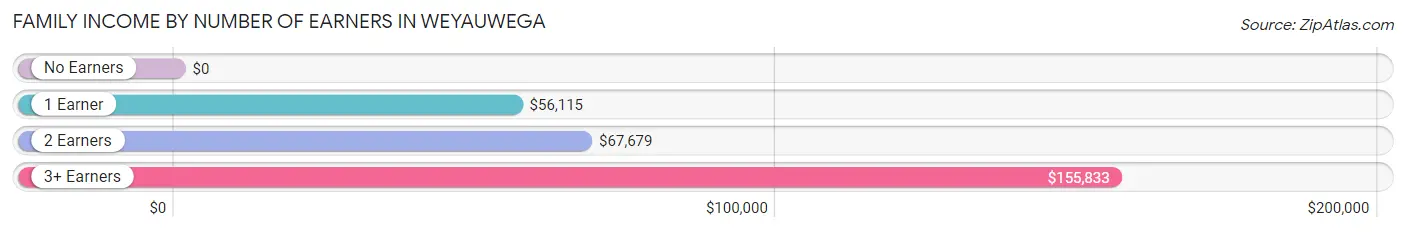
| Number of Earners | # Families | Median Income |
| No Earners | 52 (11.1%) | $0 |
| 1 Earner | 189 (40.2%) | $56,115 |
| 2 Earners | 189 (40.2%) | $67,679 |
| 3+ Earners | 40 (8.5%) | $155,833 |
| Total | 470 (100.0%) | $60,978 |
Household Income in Weyauwega
Household Income Brackets in Weyauwega
With 239 households falling in the category, the $50,000 to $74,999 income range is the most frequent in Weyauwega, accounting for 33.8% of all households. In contrast, only 3 households (0.4%) fall into the $200,000+ income bracket, making it the least populous group.
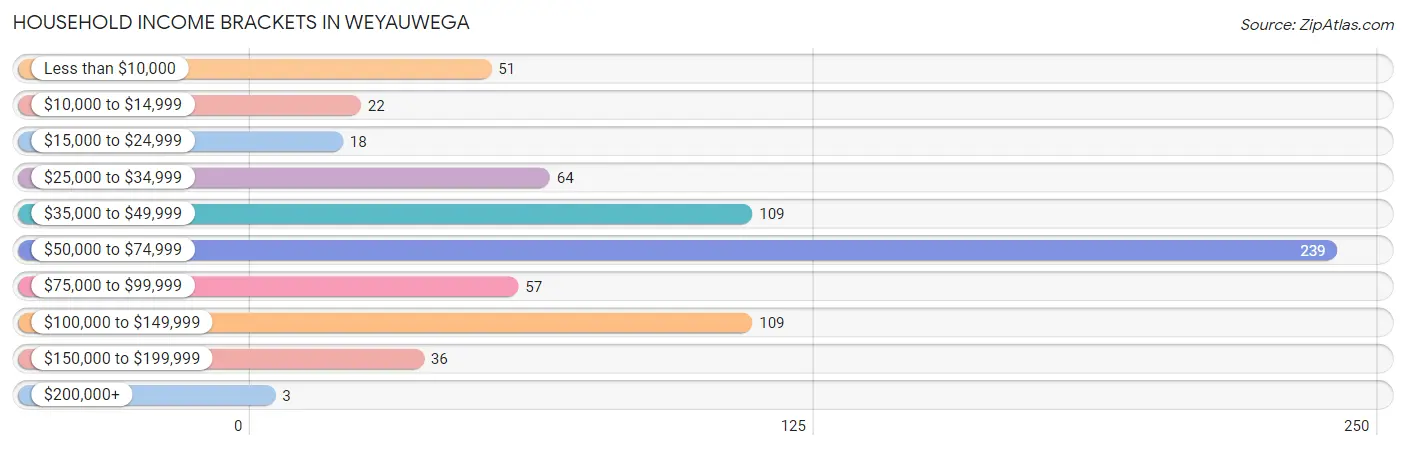
| Income Bracket | # Households | % Households |
| Less than $10,000 | 51 | 7.2% |
| $10,000 to $14,999 | 22 | 3.1% |
| $15,000 to $24,999 | 18 | 2.5% |
| $25,000 to $34,999 | 64 | 9.0% |
| $35,000 to $49,999 | 109 | 15.4% |
| $50,000 to $74,999 | 239 | 33.8% |
| $75,000 to $99,999 | 57 | 8.1% |
| $100,000 to $149,999 | 109 | 15.4% |
| $150,000 to $199,999 | 36 | 5.1% |
| $200,000+ | 3 | 0.4% |
Household Income by Householder Age in Weyauwega
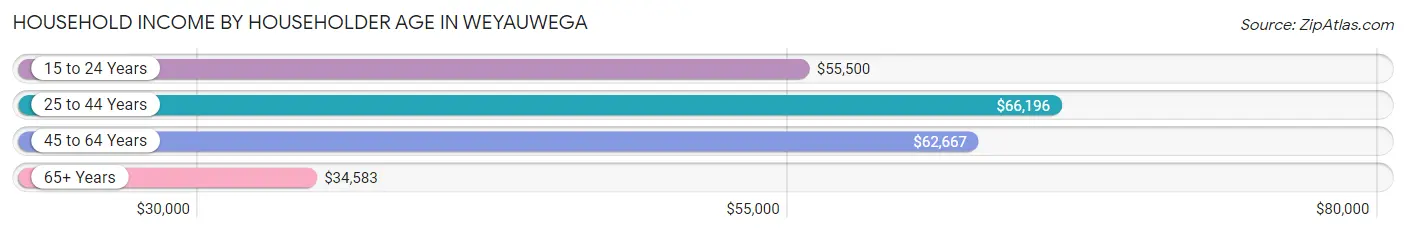
The median household income in Weyauwega is $61,316, with the highest median household income of $66,196 found in the 25 to 44 years age bracket for the primary householder. A total of 236 households (33.3%) fall into this category. Meanwhile, the 65+ years age bracket for the primary householder has the lowest median household income of $34,583, with 120 households (17.0%) in this group.
| Income Bracket | # Households | Median Income |
| 15 to 24 Years | 54 (7.6%) | $55,500 |
| 25 to 44 Years | 236 (33.3%) | $66,196 |
| 45 to 64 Years | 298 (42.1%) | $62,667 |
| 65+ Years | 120 (17.0%) | $34,583 |
| Total | 708 (100.0%) | $61,316 |
Poverty in Weyauwega
Income Below Poverty by Sex and Age in Weyauwega
With 11.8% poverty level for males and 11.7% for females among the residents of Weyauwega, 6 to 11 year old males and 15 year old females are the most vulnerable to poverty, with 16 males (19.5%) and 11 females (50.0%) in their respective age groups living below the poverty level.
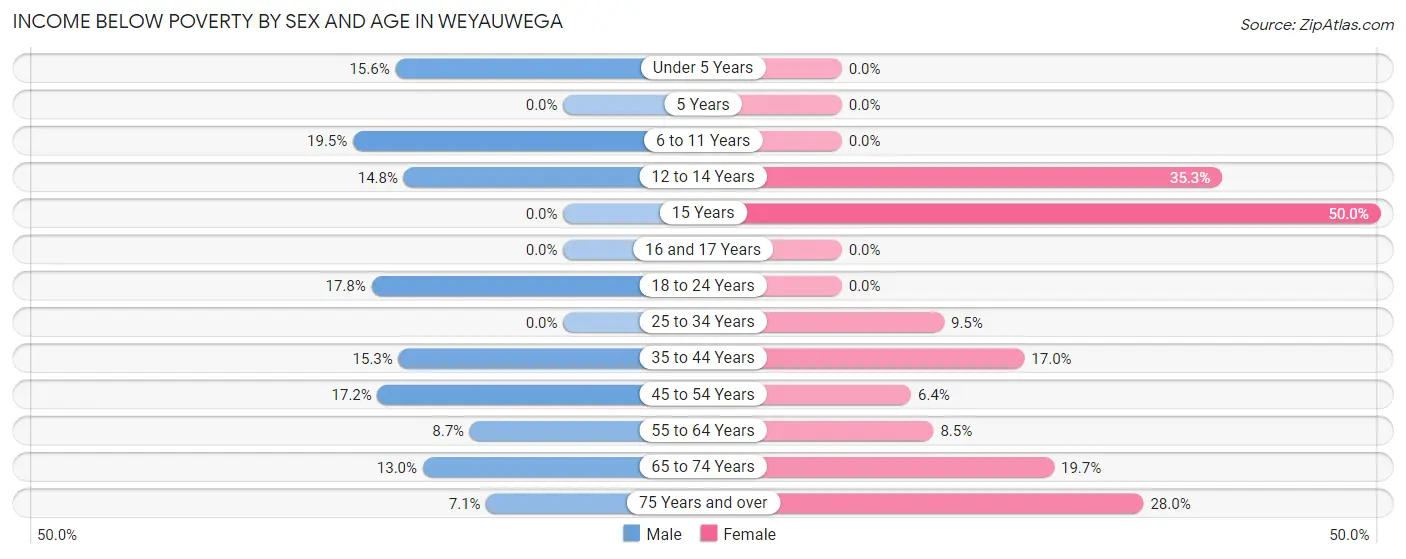
| Age Bracket | Male | Female |
| Under 5 Years | 12 (15.6%) | 0 (0.0%) |
| 5 Years | 0 (0.0%) | 0 (0.0%) |
| 6 to 11 Years | 16 (19.5%) | 0 (0.0%) |
| 12 to 14 Years | 4 (14.8%) | 12 (35.3%) |
| 15 Years | 0 (0.0%) | 11 (50.0%) |
| 16 and 17 Years | 0 (0.0%) | 0 (0.0%) |
| 18 to 24 Years | 21 (17.8%) | 0 (0.0%) |
| 25 to 34 Years | 0 (0.0%) | 15 (9.5%) |
| 35 to 44 Years | 13 (15.3%) | 20 (17.0%) |
| 45 to 54 Years | 15 (17.2%) | 11 (6.4%) |
| 55 to 64 Years | 13 (8.7%) | 8 (8.5%) |
| 65 to 74 Years | 6 (13.0%) | 13 (19.7%) |
| 75 Years and over | 1 (7.1%) | 14 (28.0%) |
| Total | 101 (11.8%) | 104 (11.7%) |
Income Above Poverty by Sex and Age in Weyauwega
According to the poverty statistics in Weyauwega, males aged 5 years and females aged under 5 years are the age groups that are most secure financially, with 100.0% of males and 100.0% of females in these age groups living above the poverty line.
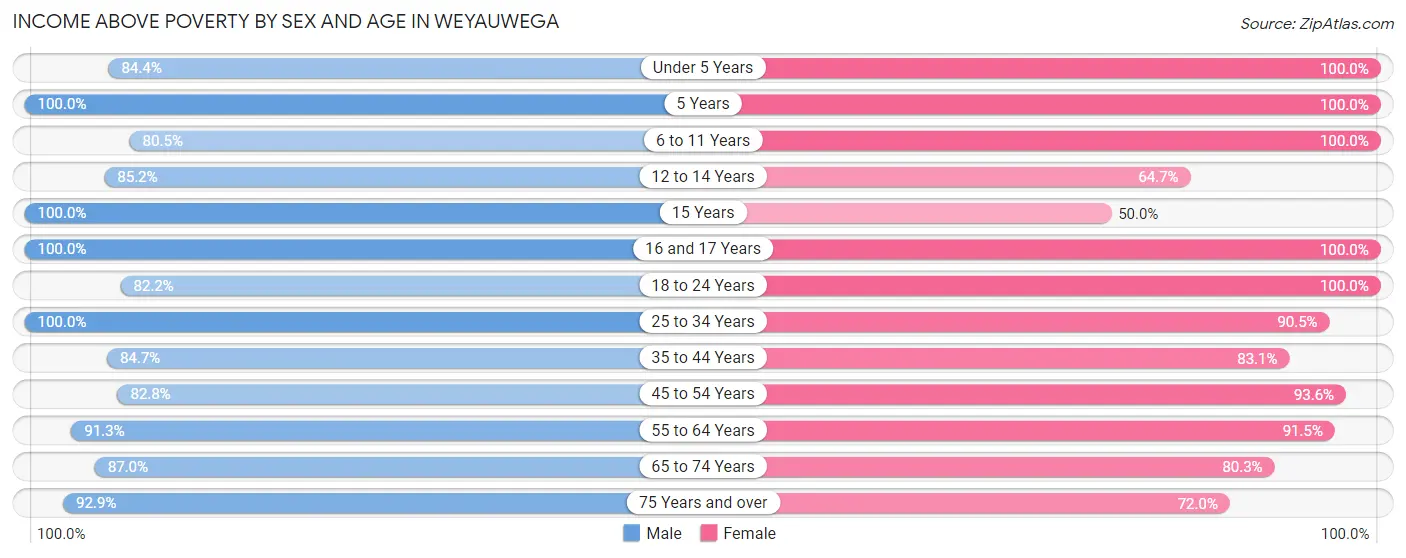
| Age Bracket | Male | Female |
| Under 5 Years | 65 (84.4%) | 52 (100.0%) |
| 5 Years | 6 (100.0%) | 4 (100.0%) |
| 6 to 11 Years | 66 (80.5%) | 39 (100.0%) |
| 12 to 14 Years | 23 (85.2%) | 22 (64.7%) |
| 15 Years | 17 (100.0%) | 11 (50.0%) |
| 16 and 17 Years | 18 (100.0%) | 30 (100.0%) |
| 18 to 24 Years | 97 (82.2%) | 55 (100.0%) |
| 25 to 34 Years | 125 (100.0%) | 143 (90.5%) |
| 35 to 44 Years | 72 (84.7%) | 98 (83.1%) |
| 45 to 54 Years | 72 (82.8%) | 160 (93.6%) |
| 55 to 64 Years | 137 (91.3%) | 86 (91.5%) |
| 65 to 74 Years | 40 (87.0%) | 53 (80.3%) |
| 75 Years and over | 13 (92.9%) | 36 (72.0%) |
| Total | 751 (88.1%) | 789 (88.3%) |
Income Below Poverty Among Married-Couple Families in Weyauwega
The poverty statistics for married-couple families in Weyauwega show that 6.1% or 19 of the total 313 families live below the poverty line. Families with no children have the highest poverty rate of 10.4%, comprising of 19 families. On the other hand, families with 1 or 2 children have the lowest poverty rate of 0.0%, which includes 0 families.
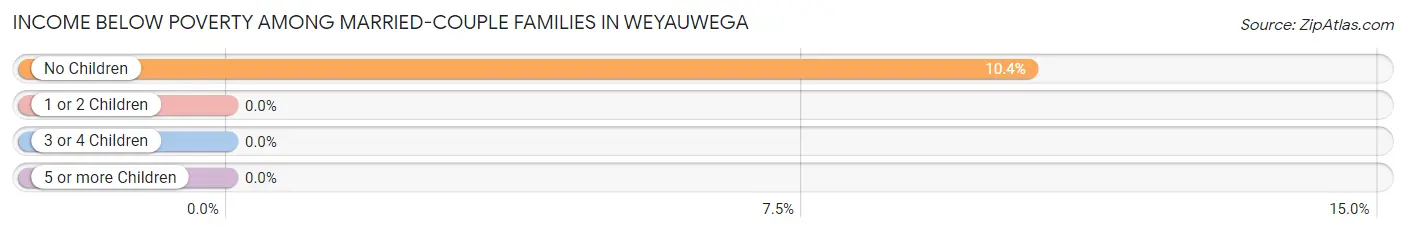
| Children | Above Poverty | Below Poverty |
| No Children | 163 (89.6%) | 19 (10.4%) |
| 1 or 2 Children | 118 (100.0%) | 0 (0.0%) |
| 3 or 4 Children | 8 (100.0%) | 0 (0.0%) |
| 5 or more Children | 5 (100.0%) | 0 (0.0%) |
| Total | 294 (93.9%) | 19 (6.1%) |
Income Below Poverty Among Single-Parent Households in Weyauwega
According to the poverty data in Weyauwega, 7.4% or 4 single-father households and 24.3% or 25 single-mother households are living below the poverty line. Among single-father households, those with 1 or 2 children have the highest poverty rate, with 4 households (12.9%) experiencing poverty. Likewise, among single-mother households, those with 1 or 2 children have the highest poverty rate, with 25 households (37.9%) falling below the poverty line.
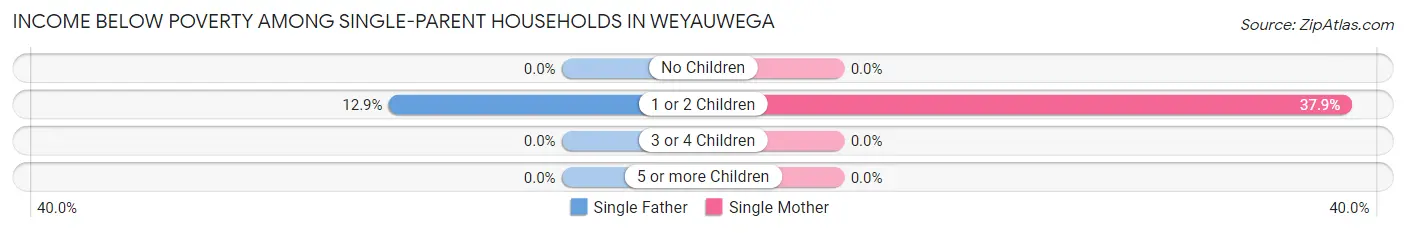
| Children | Single Father | Single Mother |
| No Children | 0 (0.0%) | 0 (0.0%) |
| 1 or 2 Children | 4 (12.9%) | 25 (37.9%) |
| 3 or 4 Children | 0 (0.0%) | 0 (0.0%) |
| 5 or more Children | 0 (0.0%) | 0 (0.0%) |
| Total | 4 (7.4%) | 25 (24.3%) |
Income Below Poverty Among Married-Couple vs Single-Parent Households in Weyauwega
The poverty data for Weyauwega shows that 19 of the married-couple family households (6.1%) and 29 of the single-parent households (18.5%) are living below the poverty level. Within the married-couple family households, those with no children have the highest poverty rate, with 19 households (10.4%) falling below the poverty line. Among the single-parent households, those with 1 or 2 children have the highest poverty rate, with 29 household (29.9%) living below poverty.
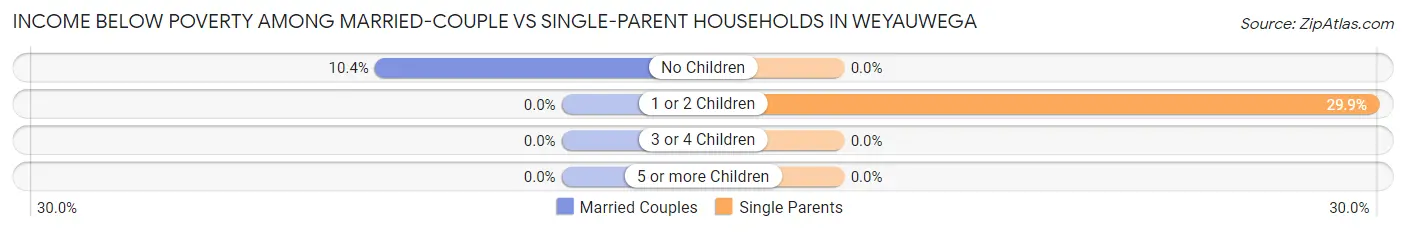
| Children | Married-Couple Families | Single-Parent Households |
| No Children | 19 (10.4%) | 0 (0.0%) |
| 1 or 2 Children | 0 (0.0%) | 29 (29.9%) |
| 3 or 4 Children | 0 (0.0%) | 0 (0.0%) |
| 5 or more Children | 0 (0.0%) | 0 (0.0%) |
| Total | 19 (6.1%) | 29 (18.5%) |
Race in Weyauwega
The most populous races in Weyauwega are White / Caucasian (1,817 | 97.9%), Hispanic or Latino (38 | 2.1%), and Two or more Races (26 | 1.4%).
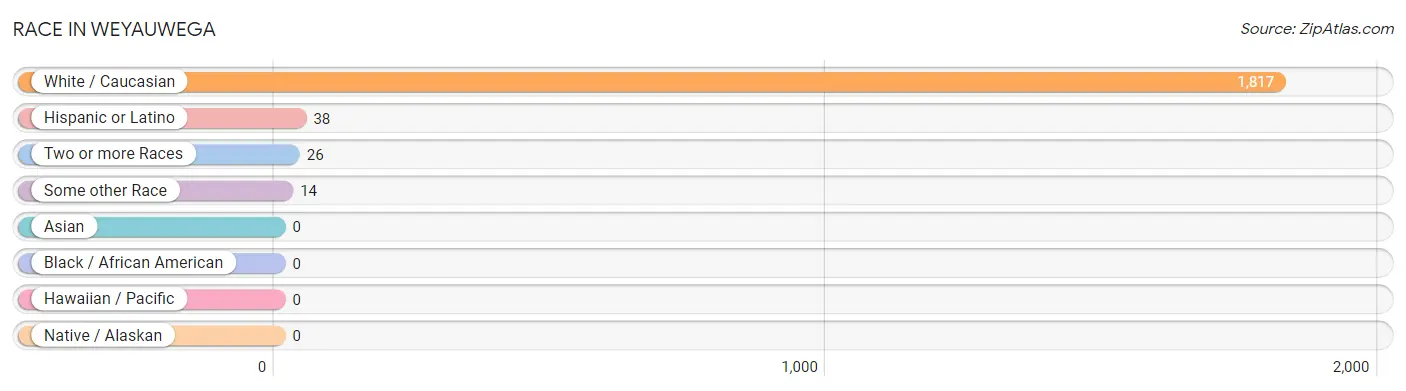
| Race | # Population | % Population |
| Asian | 0 | 0.0% |
| Black / African American | 0 | 0.0% |
| Hawaiian / Pacific | 0 | 0.0% |
| Hispanic or Latino | 38 | 2.1% |
| Native / Alaskan | 0 | 0.0% |
| White / Caucasian | 1,817 | 97.9% |
| Two or more Races | 26 | 1.4% |
| Some other Race | 14 | 0.7% |
| Total | 1,857 | 100.0% |
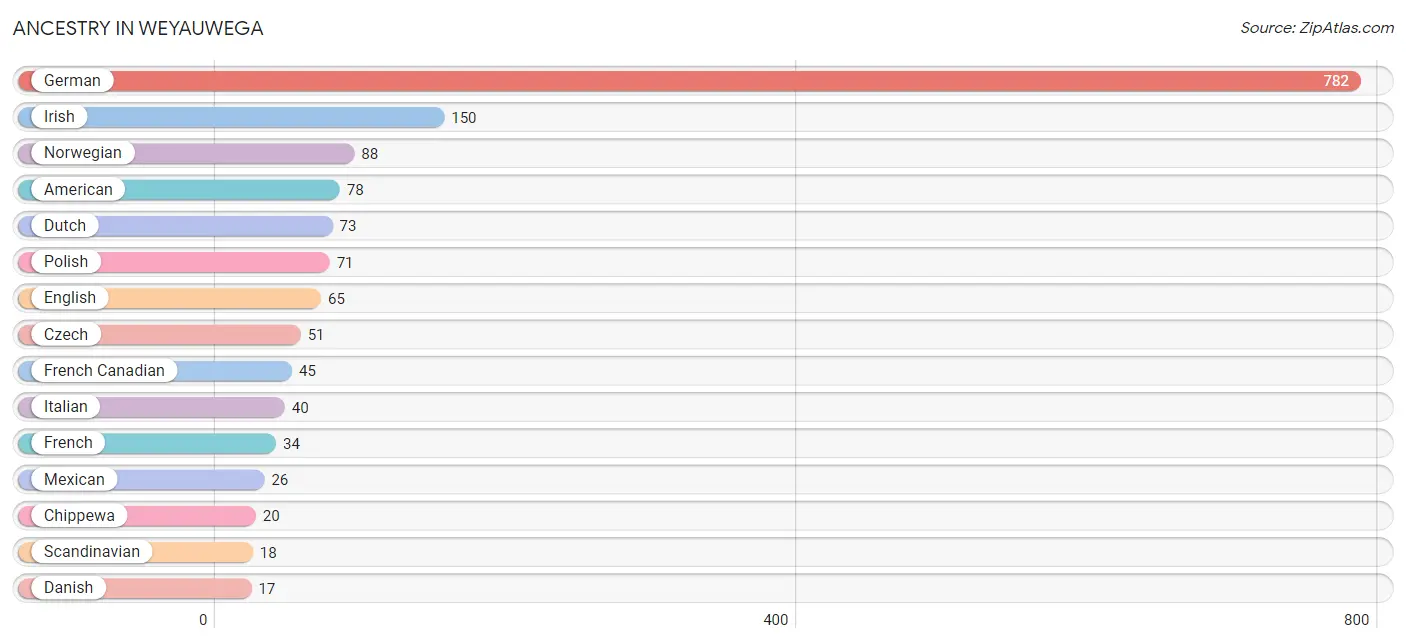
Ancestry in Weyauwega
The most populous ancestries reported in Weyauwega are German (782 | 42.1%), Irish (150 | 8.1%), Norwegian (88 | 4.7%), American (78 | 4.2%), and Dutch (73 | 3.9%), together accounting for 63.1% of all Weyauwega residents.
| Ancestry | # Population | % Population |
| American | 78 | 4.2% |
| Armenian | 5 | 0.3% |
| Belgian | 4 | 0.2% |
| Bhutanese | 2 | 0.1% |
| Blackfeet | 1 | 0.1% |
| British | 7 | 0.4% |
| Chippewa | 20 | 1.1% |
| Czech | 51 | 2.8% |
| Danish | 17 | 0.9% |
| Dutch | 73 | 3.9% |
| Eastern European | 3 | 0.2% |
| English | 65 | 3.5% |
| European | 16 | 0.9% |
| Finnish | 3 | 0.2% |
| French | 34 | 1.8% |
| French Canadian | 45 | 2.4% |
| German | 782 | 42.1% |
| Greek | 8 | 0.4% |
| Irish | 150 | 8.1% |
| Italian | 40 | 2.1% |
| Mexican | 26 | 1.4% |
| Norwegian | 88 | 4.7% |
| Pennsylvania German | 2 | 0.1% |
| Polish | 71 | 3.8% |
| Puerto Rican | 12 | 0.6% |
| Russian | 14 | 0.7% |
| Scandinavian | 18 | 1.0% |
| Scotch-Irish | 5 | 0.3% |
| Scottish | 4 | 0.2% |
| Slovene | 9 | 0.5% |
| Swedish | 2 | 0.1% |
| Swiss | 10 | 0.5% |
| Ukrainian | 6 | 0.3% |
| Yugoslavian | 3 | 0.2% | View All 34 Rows |
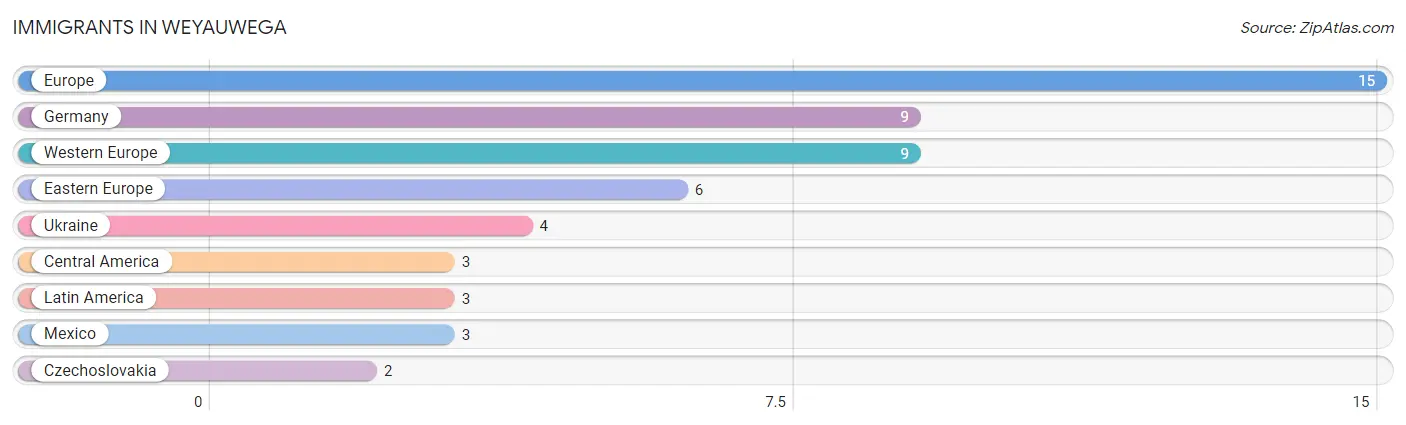
Immigrants in Weyauwega
The most numerous immigrant groups reported in Weyauwega came from Europe (15 | 0.8%), Germany (9 | 0.5%), Western Europe (9 | 0.5%), Eastern Europe (6 | 0.3%), and Ukraine (4 | 0.2%), together accounting for 2.3% of all Weyauwega residents.
| Immigration Origin | # Population | % Population |
| Central America | 3 | 0.2% |
| Czechoslovakia | 2 | 0.1% |
| Eastern Europe | 6 | 0.3% |
| Europe | 15 | 0.8% |
| Germany | 9 | 0.5% |
| Latin America | 3 | 0.2% |
| Mexico | 3 | 0.2% |
| Ukraine | 4 | 0.2% |
| Western Europe | 9 | 0.5% | View All 9 Rows |
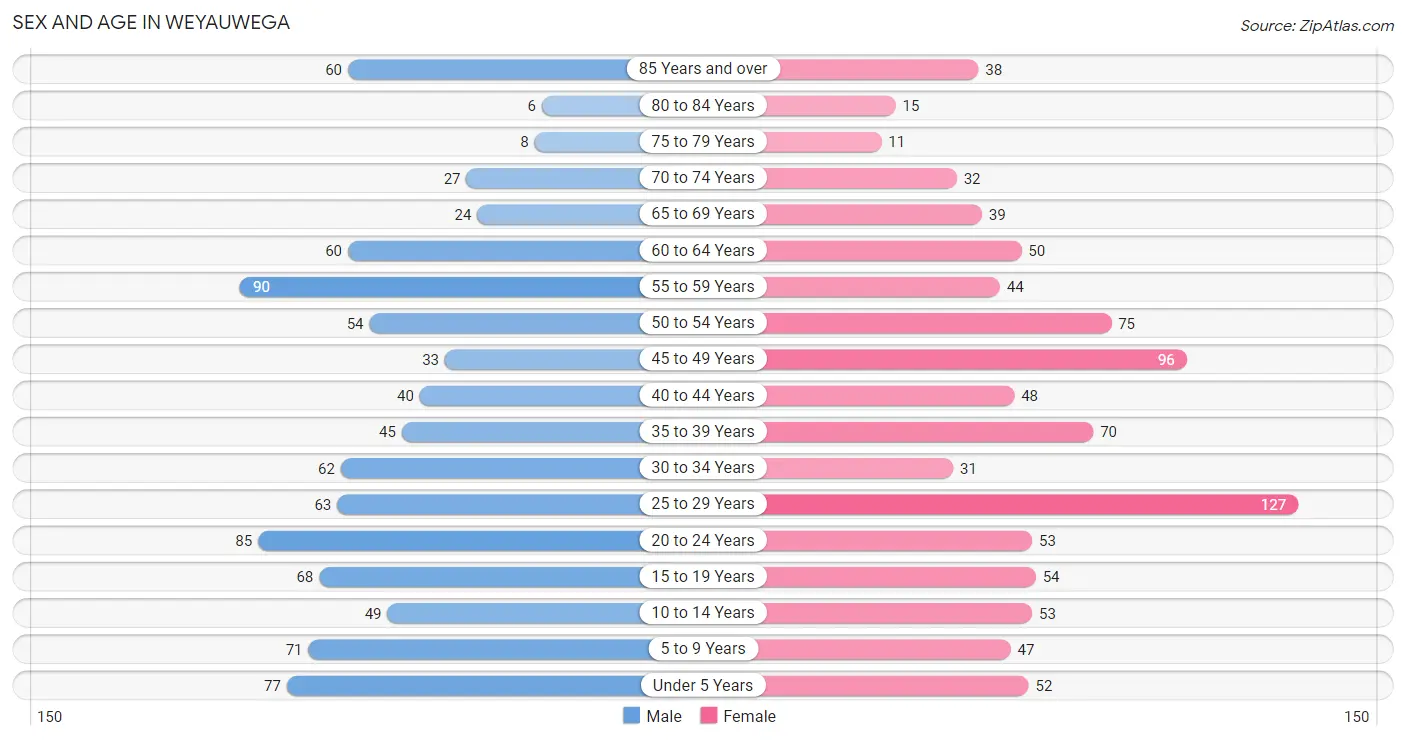
Sex and Age in Weyauwega
Sex and Age in Weyauwega
The most populous age groups in Weyauwega are 55 to 59 Years (90 | 9.8%) for men and 25 to 29 Years (127 | 13.6%) for women.
| Age Bracket | Male | Female |
| Under 5 Years | 77 (8.4%) | 52 (5.6%) |
| 5 to 9 Years | 71 (7.7%) | 47 (5.0%) |
| 10 to 14 Years | 49 (5.3%) | 53 (5.7%) |
| 15 to 19 Years | 68 (7.4%) | 54 (5.8%) |
| 20 to 24 Years | 85 (9.2%) | 53 (5.7%) |
| 25 to 29 Years | 63 (6.8%) | 127 (13.6%) |
| 30 to 34 Years | 62 (6.7%) | 31 (3.3%) |
| 35 to 39 Years | 45 (4.9%) | 70 (7.5%) |
| 40 to 44 Years | 40 (4.3%) | 48 (5.1%) |
| 45 to 49 Years | 33 (3.6%) | 96 (10.3%) |
| 50 to 54 Years | 54 (5.9%) | 75 (8.0%) |
| 55 to 59 Years | 90 (9.8%) | 44 (4.7%) |
| 60 to 64 Years | 60 (6.5%) | 50 (5.3%) |
| 65 to 69 Years | 24 (2.6%) | 39 (4.2%) |
| 70 to 74 Years | 27 (2.9%) | 32 (3.4%) |
| 75 to 79 Years | 8 (0.9%) | 11 (1.2%) |
| 80 to 84 Years | 6 (0.6%) | 15 (1.6%) |
| 85 Years and over | 60 (6.5%) | 38 (4.1%) |
| Total | 922 (100.0%) | 935 (100.0%) |
Families and Households in Weyauwega
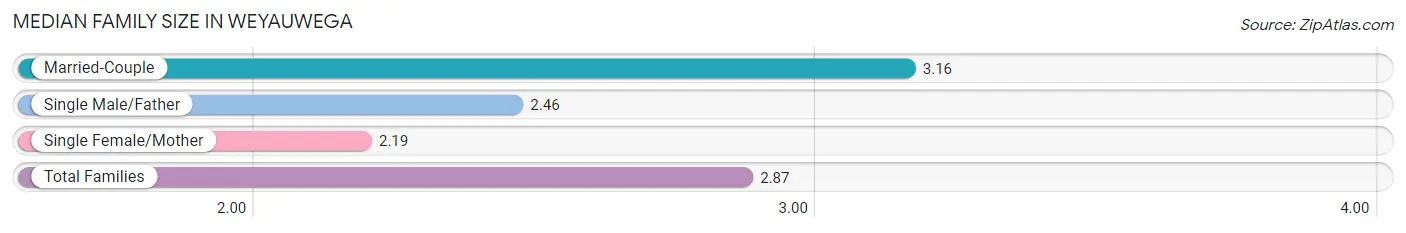
Median Family Size in Weyauwega
The median family size in Weyauwega is 2.87 persons per family, with married-couple families (313 | 66.6%) accounting for the largest median family size of 3.16 persons per family. On the other hand, single female/mother families (103 | 21.9%) represent the smallest median family size with 2.19 persons per family.
| Family Type | # Families | Family Size |
| Married-Couple | 313 (66.6%) | 3.16 |
| Single Male/Father | 54 (11.5%) | 2.46 |
| Single Female/Mother | 103 (21.9%) | 2.19 |
| Total Families | 470 (100.0%) | 2.87 |
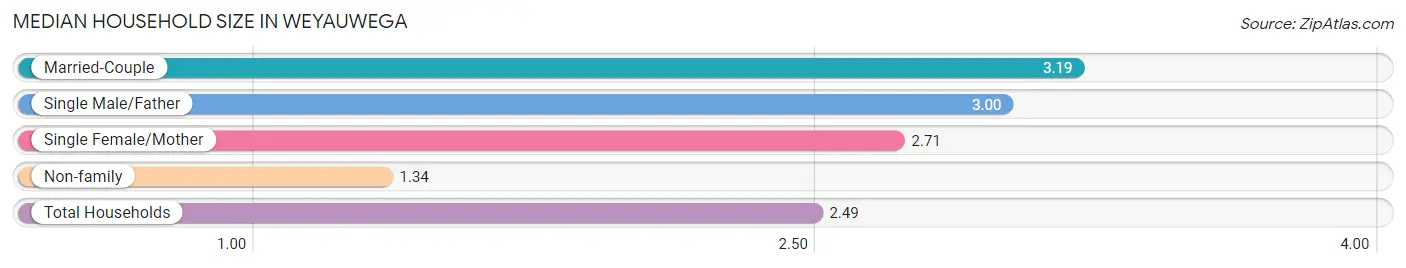
Median Household Size in Weyauwega
The median household size in Weyauwega is 2.49 persons per household, with married-couple households (313 | 44.2%) accounting for the largest median household size of 3.19 persons per household. non-family households (238 | 33.6%) represent the smallest median household size with 1.34 persons per household.
| Household Type | # Households | Household Size |
| Married-Couple | 313 (44.2%) | 3.19 |
| Single Male/Father | 54 (7.6%) | 3.00 |
| Single Female/Mother | 103 (14.5%) | 2.71 |
| Non-family | 238 (33.6%) | 1.34 |
| Total Households | 708 (100.0%) | 2.49 |
Household Size by Marriage Status in Weyauwega
Out of a total of 708 households in Weyauwega, 470 (66.4%) are family households, while 238 (33.6%) are nonfamily households. The most numerous type of family households are 2-person households, comprising 203, and the most common type of nonfamily households are 1-person households, comprising 172.
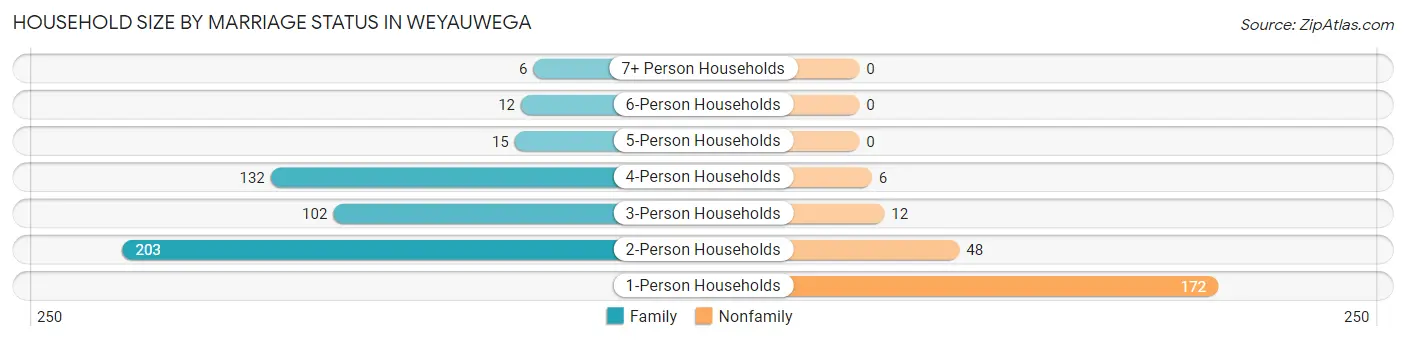
| Household Size | Family Households | Nonfamily Households |
| 1-Person Households | - | 172 (24.3%) |
| 2-Person Households | 203 (28.7%) | 48 (6.8%) |
| 3-Person Households | 102 (14.4%) | 12 (1.7%) |
| 4-Person Households | 132 (18.6%) | 6 (0.9%) |
| 5-Person Households | 15 (2.1%) | 0 (0.0%) |
| 6-Person Households | 12 (1.7%) | 0 (0.0%) |
| 7+ Person Households | 6 (0.9%) | 0 (0.0%) |
| Total | 470 (66.4%) | 238 (33.6%) |
Female Fertility in Weyauwega
Fertility by Age in Weyauwega
Average fertility rate in Weyauwega is 44.0 births per 1,000 women. Women in the age bracket of 20 to 34 years have the highest fertility rate with 90.0 births per 1,000 women. Women in the age bracket of 20 to 34 years acount for 86.4% of all women with births.
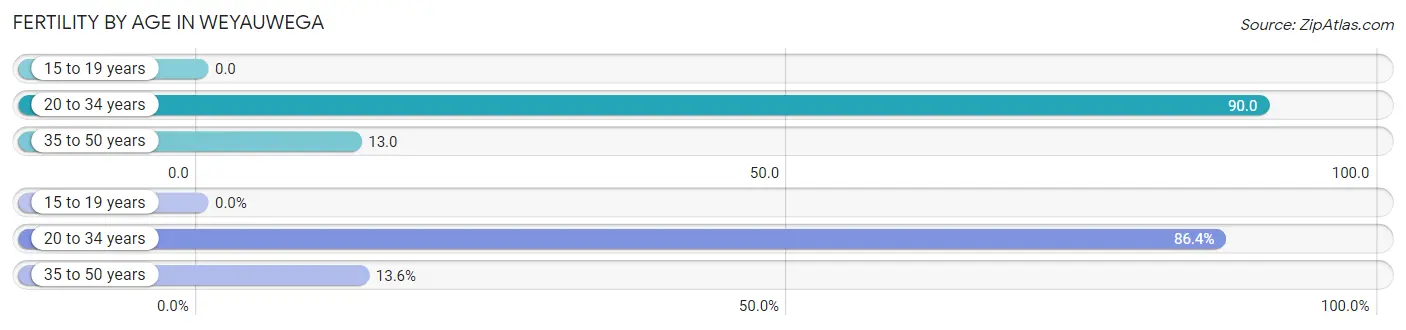
| Age Bracket | Women with Births | Births / 1,000 Women |
| 15 to 19 years | 0 (0.0%) | 0.0 |
| 20 to 34 years | 19 (86.4%) | 90.0 |
| 35 to 50 years | 3 (13.6%) | 13.0 |
| Total | 22 (100.0%) | 44.0 |
Fertility by Age by Marriage Status in Weyauwega
68.2% of women with births (22) in Weyauwega are married. The highest percentage of unmarried women with births falls into 35 to 50 years age bracket with 100.0% of them unmarried at the time of birth, while the lowest percentage of unmarried women with births belong to 20 to 34 years age bracket with 21.1% of them unmarried.
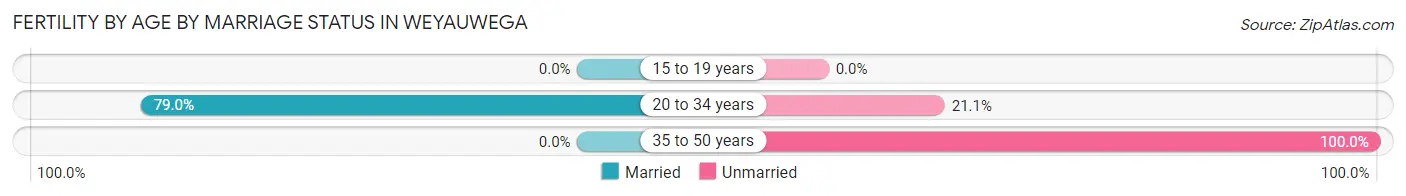
| Age Bracket | Married | Unmarried |
| 15 to 19 years | 0 (0.0%) | 0 (0.0%) |
| 20 to 34 years | 15 (78.9%) | 4 (21.0%) |
| 35 to 50 years | 0 (0.0%) | 3 (100.0%) |
| Total | 15 (68.2%) | 7 (31.8%) |
Fertility by Education in Weyauwega
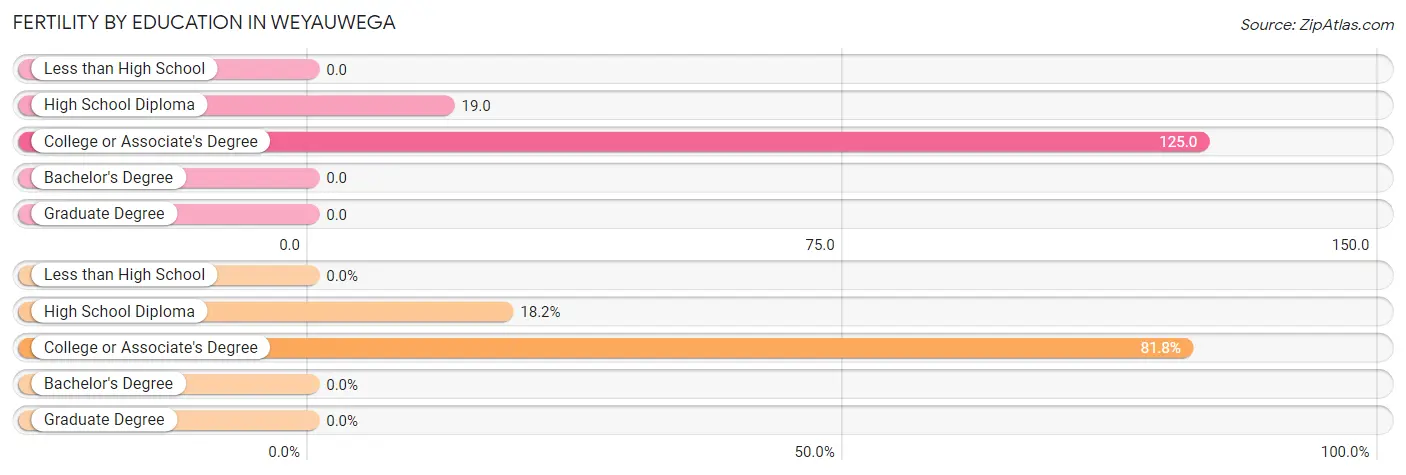
| Educational Attainment | Women with Births | Births / 1,000 Women |
| Less than High School | 0 (0.0%) | 0.0 |
| High School Diploma | 4 (18.2%) | 19.0 |
| College or Associate's Degree | 18 (81.8%) | 125.0 |
| Bachelor's Degree | 0 (0.0%) | 0.0 |
| Graduate Degree | 0 (0.0%) | 0.0 |
| Total | 22 (100.0%) | 44.0 |
Fertility by Education by Marriage Status in Weyauwega
31.8% of women with births in Weyauwega are unmarried. Women with the educational attainment of high school diploma are most likely to be married with 75.0% of them married at childbirth, while women with the educational attainment of college or associate's degree are least likely to be married with 33.3% of them unmarried at childbirth.
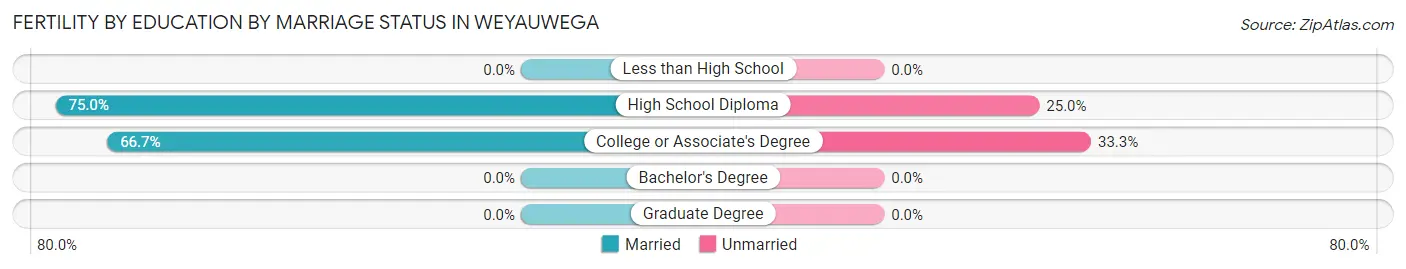
| Educational Attainment | Married | Unmarried |
| Less than High School | 0 (0.0%) | 0 (0.0%) |
| High School Diploma | 3 (75.0%) | 1 (25.0%) |
| College or Associate's Degree | 12 (66.7%) | 6 (33.3%) |
| Bachelor's Degree | 0 (0.0%) | 0 (0.0%) |
| Graduate Degree | 0 (0.0%) | 0 (0.0%) |
| Total | 15 (68.2%) | 7 (31.8%) |
Employment Characteristics in Weyauwega
Employment by Class of Employer in Weyauwega
Among the 937 employed individuals in Weyauwega, private company employees (658 | 70.2%), not-for-profit organizations (121 | 12.9%), and self-employed (not incorporated) (52 | 5.6%) make up the most common classes of employment.
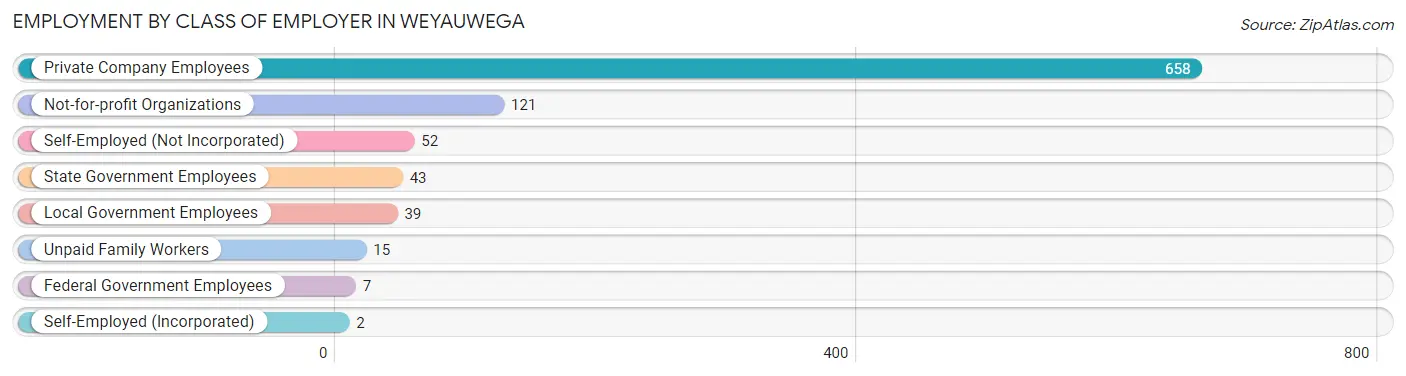
| Employer Class | # Employees | % Employees |
| Private Company Employees | 658 | 70.2% |
| Self-Employed (Incorporated) | 2 | 0.2% |
| Self-Employed (Not Incorporated) | 52 | 5.6% |
| Not-for-profit Organizations | 121 | 12.9% |
| Local Government Employees | 39 | 4.2% |
| State Government Employees | 43 | 4.6% |
| Federal Government Employees | 7 | 0.7% |
| Unpaid Family Workers | 15 | 1.6% |
| Total | 937 | 100.0% |
Employment Status by Age in Weyauwega
According to the labor force statistics for Weyauwega, out of the total population over 16 years of age (1,469), 64.7% or 950 individuals are in the labor force, with 0.5% or 5 of them unemployed. The age group with the highest labor force participation rate is 30 to 34 years, with 100.0% or 93 individuals in the labor force. Within the labor force, the 16 to 19 years age range has the highest percentage of unemployed individuals, with 10.3% or 3 of them being unemployed.
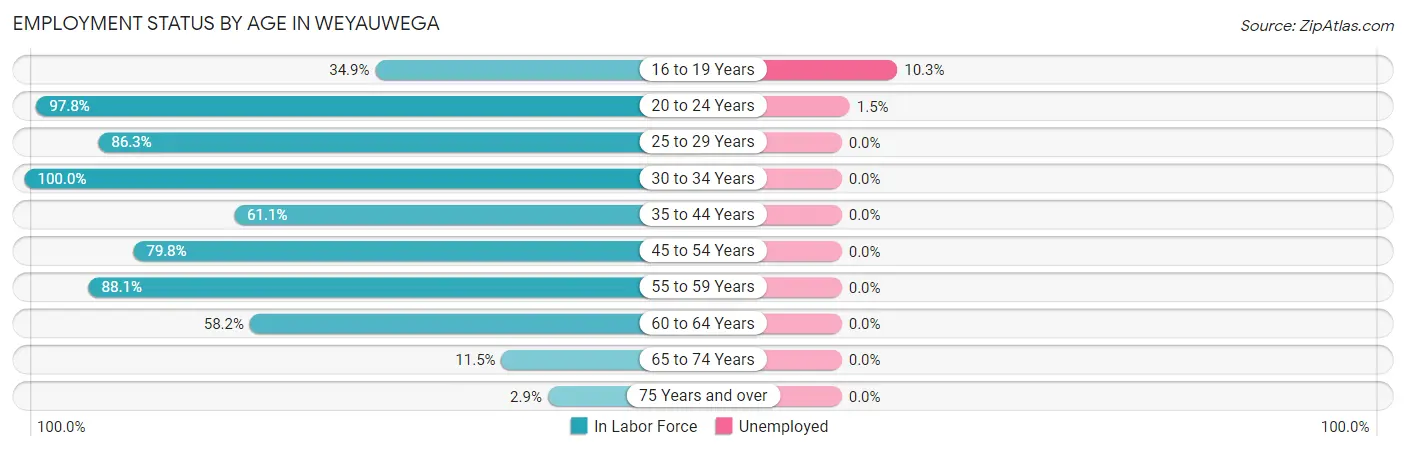
| Age Bracket | In Labor Force | Unemployed |
| 16 to 19 Years | 29 (34.9%) | 3 (10.3%) |
| 20 to 24 Years | 135 (97.8%) | 2 (1.5%) |
| 25 to 29 Years | 164 (86.3%) | 0 (0.0%) |
| 30 to 34 Years | 93 (100.0%) | 0 (0.0%) |
| 35 to 44 Years | 124 (61.1%) | 0 (0.0%) |
| 45 to 54 Years | 206 (79.8%) | 0 (0.0%) |
| 55 to 59 Years | 118 (88.1%) | 0 (0.0%) |
| 60 to 64 Years | 64 (58.2%) | 0 (0.0%) |
| 65 to 74 Years | 14 (11.5%) | 0 (0.0%) |
| 75 Years and over | 4 (2.9%) | 0 (0.0%) |
| Total | 950 (64.7%) | 5 (0.5%) |
Employment Status by Educational Attainment in Weyauwega
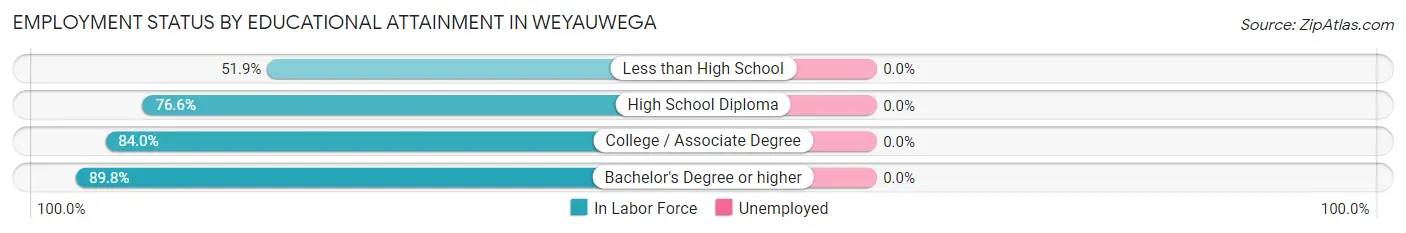
| Educational Attainment | In Labor Force | Unemployed |
| Less than High School | 54 (51.9%) | 0 (0.0%) |
| High School Diploma | 373 (76.6%) | 0 (0.0%) |
| College / Associate Degree | 210 (84.0%) | 0 (0.0%) |
| Bachelor's Degree or higher | 132 (89.8%) | 0 (0.0%) |
| Total | 769 (77.8%) | 0 (0.0%) |
Employment Occupations by Sex in Weyauwega
Management, Business, Science and Arts Occupations
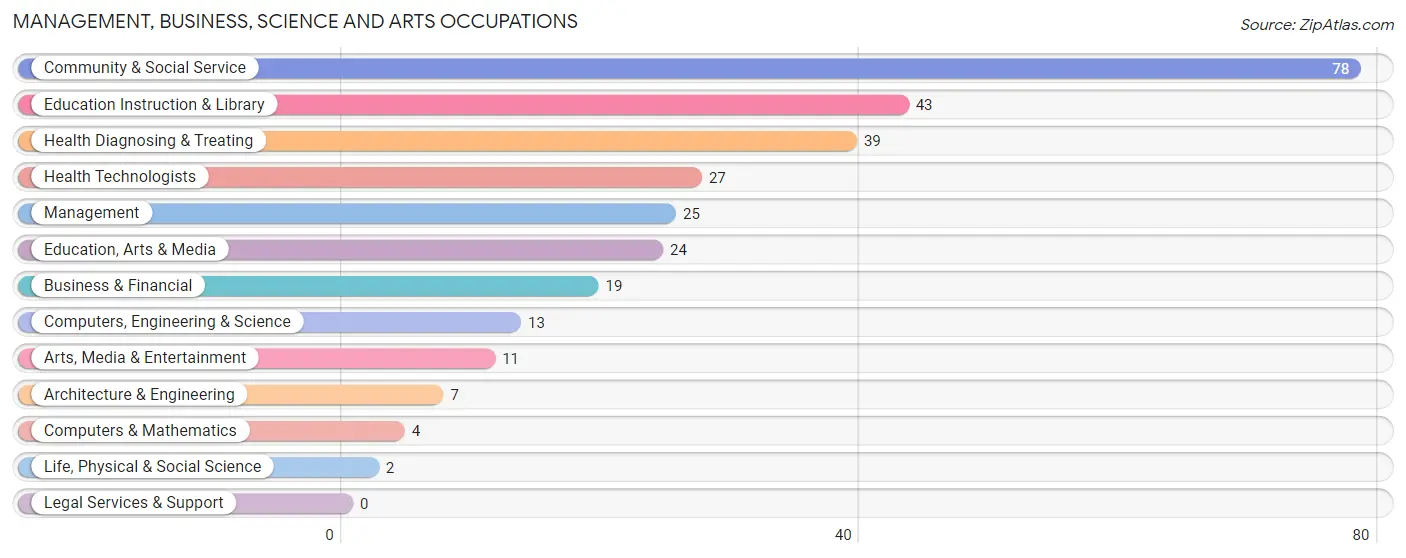
The most common Management, Business, Science and Arts occupations in Weyauwega are Community & Social Service (78 | 8.3%), Education Instruction & Library (43 | 4.5%), Health Diagnosing & Treating (39 | 4.1%), Health Technologists (27 | 2.9%), and Management (25 | 2.6%).
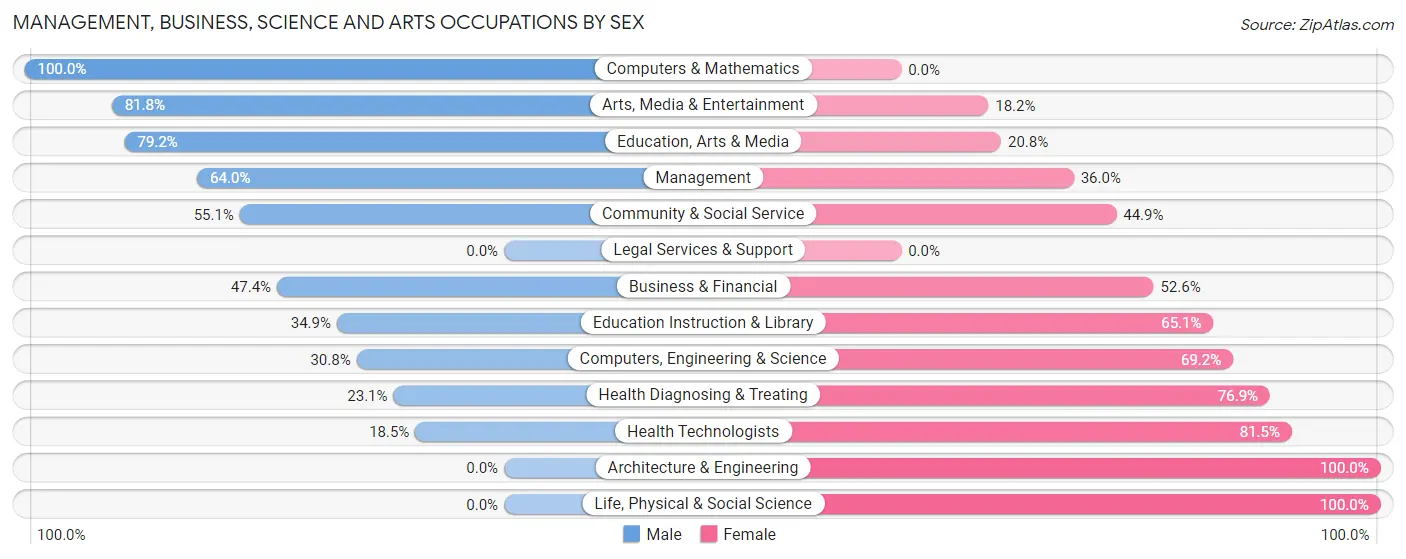
Management, Business, Science and Arts Occupations by Sex
Within the Management, Business, Science and Arts occupations in Weyauwega, the most male-oriented occupations are Computers & Mathematics (100.0%), Arts, Media & Entertainment (81.8%), and Education, Arts & Media (79.2%), while the most female-oriented occupations are Architecture & Engineering (100.0%), Life, Physical & Social Science (100.0%), and Health Technologists (81.5%).
| Occupation | Male | Female |
| Management | 16 (64.0%) | 9 (36.0%) |
| Business & Financial | 9 (47.4%) | 10 (52.6%) |
| Computers, Engineering & Science | 4 (30.8%) | 9 (69.2%) |
| Computers & Mathematics | 4 (100.0%) | 0 (0.0%) |
| Architecture & Engineering | 0 (0.0%) | 7 (100.0%) |
| Life, Physical & Social Science | 0 (0.0%) | 2 (100.0%) |
| Community & Social Service | 43 (55.1%) | 35 (44.9%) |
| Education, Arts & Media | 19 (79.2%) | 5 (20.8%) |
| Legal Services & Support | 0 (0.0%) | 0 (0.0%) |
| Education Instruction & Library | 15 (34.9%) | 28 (65.1%) |
| Arts, Media & Entertainment | 9 (81.8%) | 2 (18.2%) |
| Health Diagnosing & Treating | 9 (23.1%) | 30 (76.9%) |
| Health Technologists | 5 (18.5%) | 22 (81.5%) |
| Total (Category) | 81 (46.6%) | 93 (53.4%) |
| Total (Overall) | 484 (51.2%) | 462 (48.8%) |
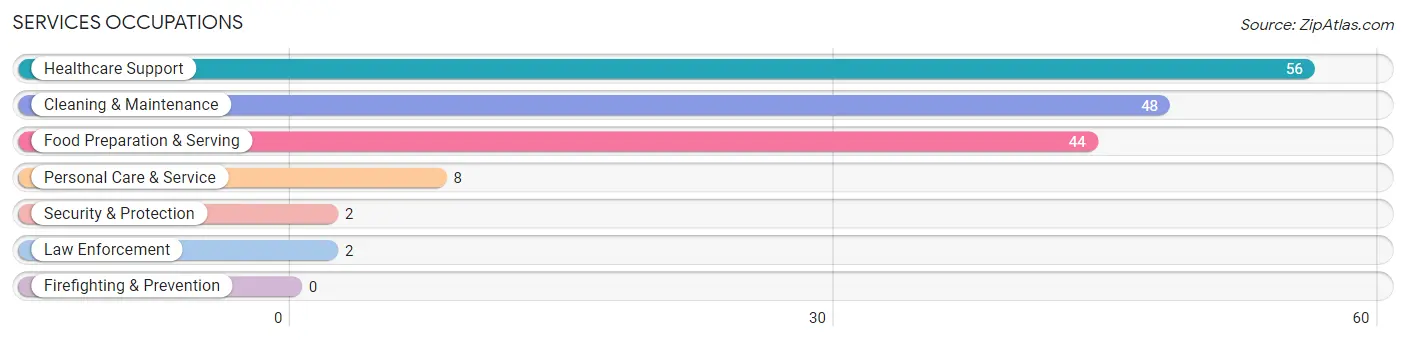
Services Occupations
The most common Services occupations in Weyauwega are Healthcare Support (56 | 5.9%), Cleaning & Maintenance (48 | 5.1%), Food Preparation & Serving (44 | 4.6%), Personal Care & Service (8 | 0.9%), and Security & Protection (2 | 0.2%).
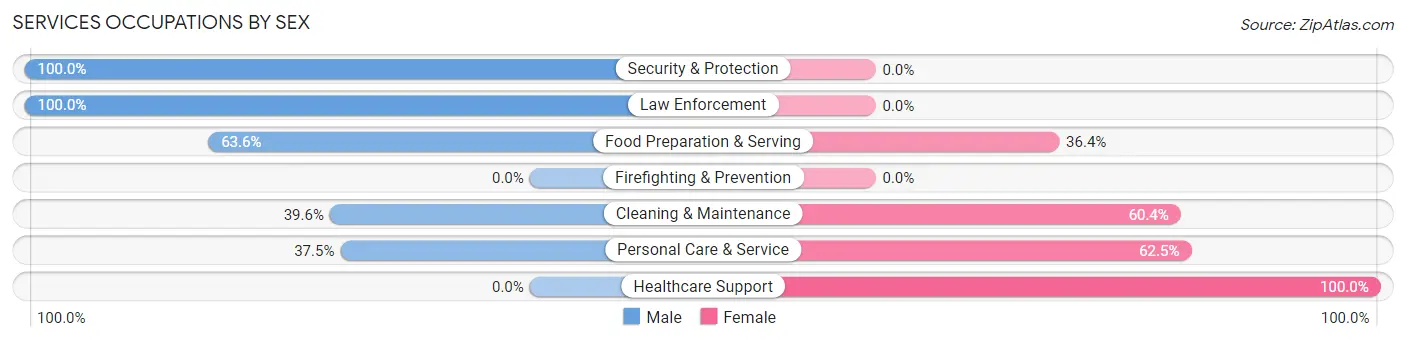
Services Occupations by Sex
Within the Services occupations in Weyauwega, the most male-oriented occupations are Security & Protection (100.0%), Law Enforcement (100.0%), and Food Preparation & Serving (63.6%), while the most female-oriented occupations are Healthcare Support (100.0%), Personal Care & Service (62.5%), and Cleaning & Maintenance (60.4%).
| Occupation | Male | Female |
| Healthcare Support | 0 (0.0%) | 56 (100.0%) |
| Security & Protection | 2 (100.0%) | 0 (0.0%) |
| Firefighting & Prevention | 0 (0.0%) | 0 (0.0%) |
| Law Enforcement | 2 (100.0%) | 0 (0.0%) |
| Food Preparation & Serving | 28 (63.6%) | 16 (36.4%) |
| Cleaning & Maintenance | 19 (39.6%) | 29 (60.4%) |
| Personal Care & Service | 3 (37.5%) | 5 (62.5%) |
| Total (Category) | 52 (32.9%) | 106 (67.1%) |
| Total (Overall) | 484 (51.2%) | 462 (48.8%) |
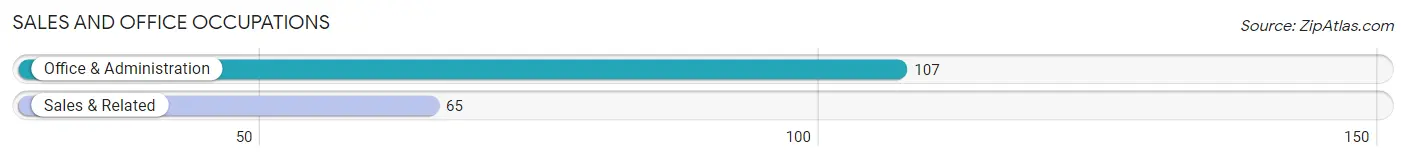
Sales and Office Occupations
The most common Sales and Office occupations in Weyauwega are Office & Administration (107 | 11.3%), and Sales & Related (65 | 6.9%).
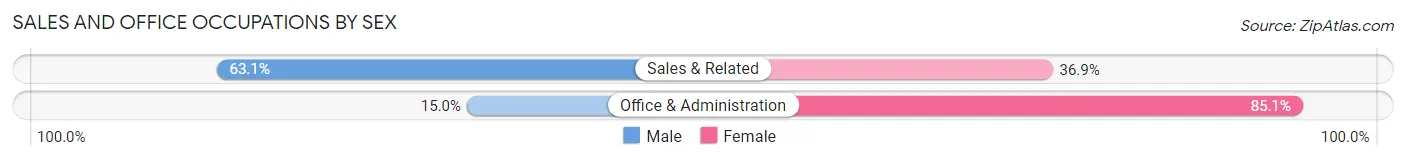
Sales and Office Occupations by Sex
| Occupation | Male | Female |
| Sales & Related | 41 (63.1%) | 24 (36.9%) |
| Office & Administration | 16 (14.9%) | 91 (85.1%) |
| Total (Category) | 57 (33.1%) | 115 (66.9%) |
| Total (Overall) | 484 (51.2%) | 462 (48.8%) |
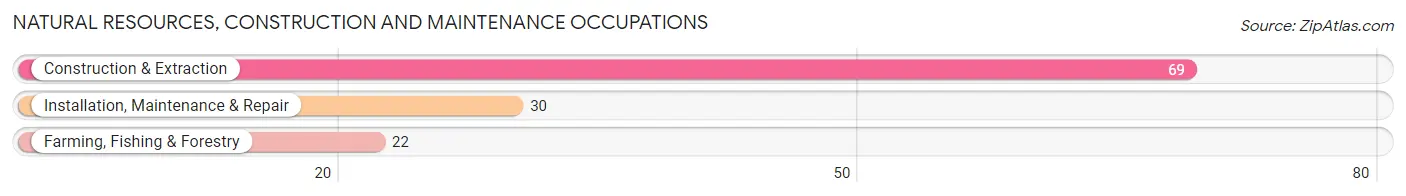
Natural Resources, Construction and Maintenance Occupations
The most common Natural Resources, Construction and Maintenance occupations in Weyauwega are Construction & Extraction (69 | 7.3%), Installation, Maintenance & Repair (30 | 3.2%), and Farming, Fishing & Forestry (22 | 2.3%).
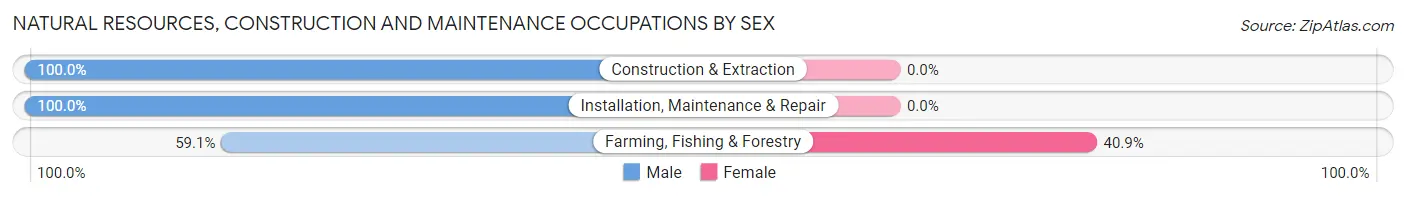
Natural Resources, Construction and Maintenance Occupations by Sex
| Occupation | Male | Female |
| Farming, Fishing & Forestry | 13 (59.1%) | 9 (40.9%) |
| Construction & Extraction | 69 (100.0%) | 0 (0.0%) |
| Installation, Maintenance & Repair | 30 (100.0%) | 0 (0.0%) |
| Total (Category) | 112 (92.6%) | 9 (7.4%) |
| Total (Overall) | 484 (51.2%) | 462 (48.8%) |
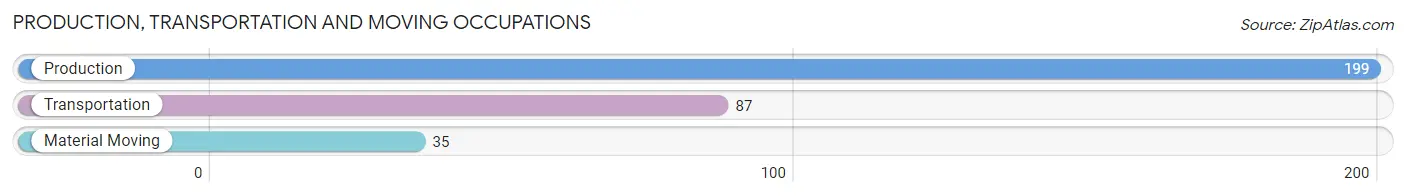
Production, Transportation and Moving Occupations
The most common Production, Transportation and Moving occupations in Weyauwega are Production (199 | 21.0%), Transportation (87 | 9.2%), and Material Moving (35 | 3.7%).
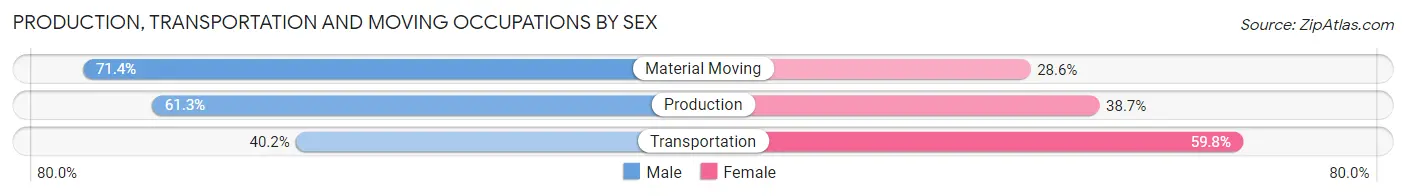
Production, Transportation and Moving Occupations by Sex
| Occupation | Male | Female |
| Production | 122 (61.3%) | 77 (38.7%) |
| Transportation | 35 (40.2%) | 52 (59.8%) |
| Material Moving | 25 (71.4%) | 10 (28.6%) |
| Total (Category) | 182 (56.7%) | 139 (43.3%) |
| Total (Overall) | 484 (51.2%) | 462 (48.8%) |
Employment Industries by Sex in Weyauwega
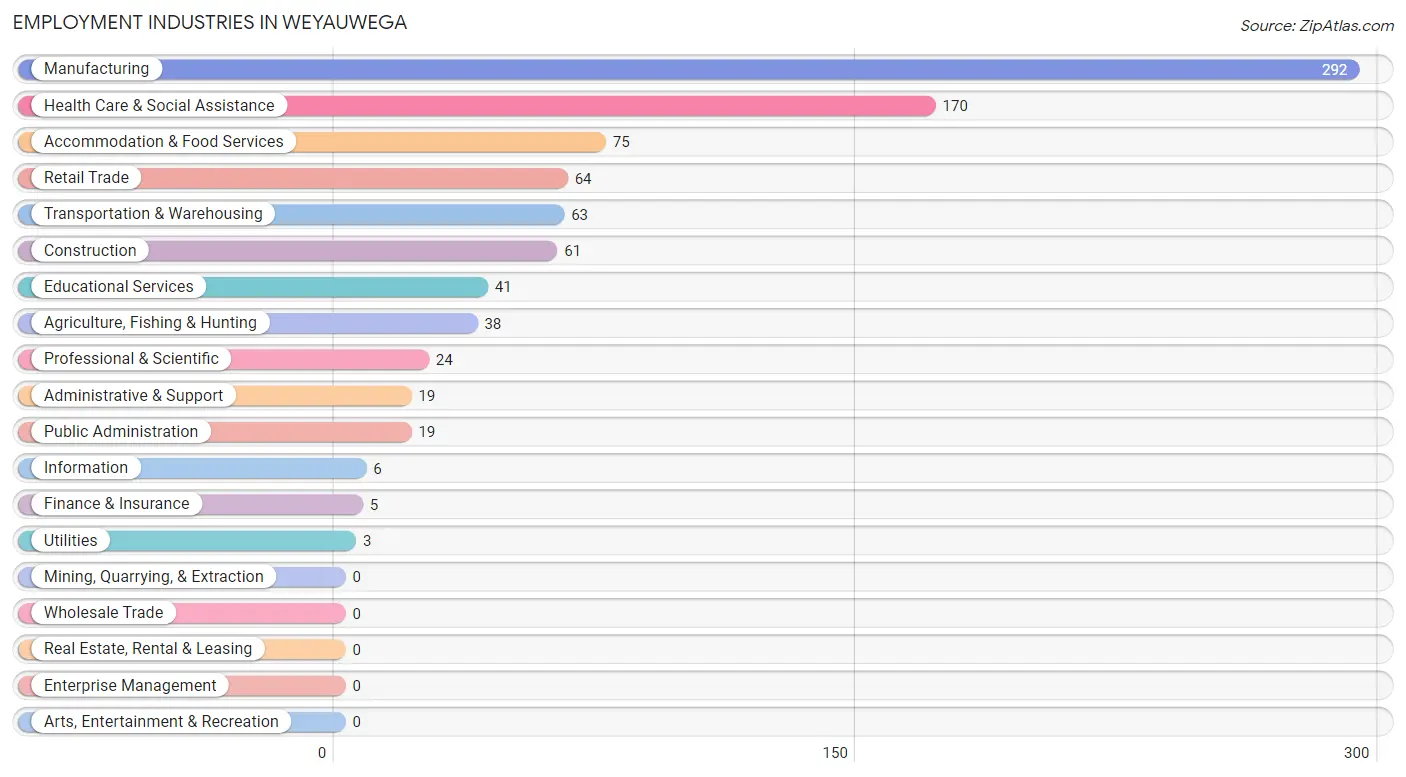
Employment Industries in Weyauwega
The major employment industries in Weyauwega include Manufacturing (292 | 30.9%), Health Care & Social Assistance (170 | 18.0%), Accommodation & Food Services (75 | 7.9%), Retail Trade (64 | 6.8%), and Transportation & Warehousing (63 | 6.7%).
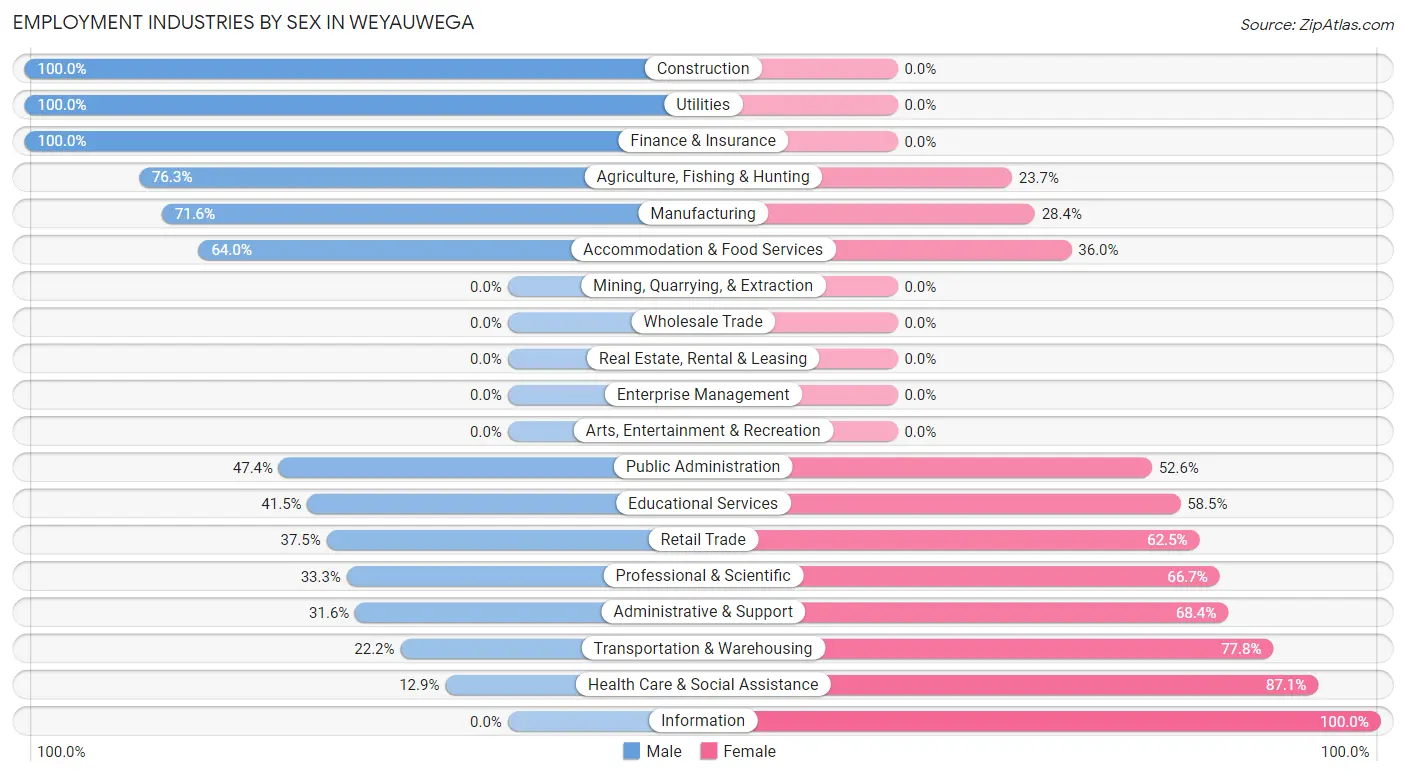
Employment Industries by Sex in Weyauwega
The Weyauwega industries that see more men than women are Construction (100.0%), Utilities (100.0%), and Finance & Insurance (100.0%), whereas the industries that tend to have a higher number of women are Information (100.0%), Health Care & Social Assistance (87.1%), and Transportation & Warehousing (77.8%).
| Industry | Male | Female |
| Agriculture, Fishing & Hunting | 29 (76.3%) | 9 (23.7%) |
| Mining, Quarrying, & Extraction | 0 (0.0%) | 0 (0.0%) |
| Construction | 61 (100.0%) | 0 (0.0%) |
| Manufacturing | 209 (71.6%) | 83 (28.4%) |
| Wholesale Trade | 0 (0.0%) | 0 (0.0%) |
| Retail Trade | 24 (37.5%) | 40 (62.5%) |
| Transportation & Warehousing | 14 (22.2%) | 49 (77.8%) |
| Utilities | 3 (100.0%) | 0 (0.0%) |
| Information | 0 (0.0%) | 6 (100.0%) |
| Finance & Insurance | 5 (100.0%) | 0 (0.0%) |
| Real Estate, Rental & Leasing | 0 (0.0%) | 0 (0.0%) |
| Professional & Scientific | 8 (33.3%) | 16 (66.7%) |
| Enterprise Management | 0 (0.0%) | 0 (0.0%) |
| Administrative & Support | 6 (31.6%) | 13 (68.4%) |
| Educational Services | 17 (41.5%) | 24 (58.5%) |
| Health Care & Social Assistance | 22 (12.9%) | 148 (87.1%) |
| Arts, Entertainment & Recreation | 0 (0.0%) | 0 (0.0%) |
| Accommodation & Food Services | 48 (64.0%) | 27 (36.0%) |
| Public Administration | 9 (47.4%) | 10 (52.6%) |
| Total | 484 (51.2%) | 462 (48.8%) |
Education in Weyauwega
School Enrollment in Weyauwega
The most common levels of schooling among the 354 students in Weyauwega are high school (119 | 33.6%), elementary school (105 | 29.7%), and middle school (75 | 21.2%).
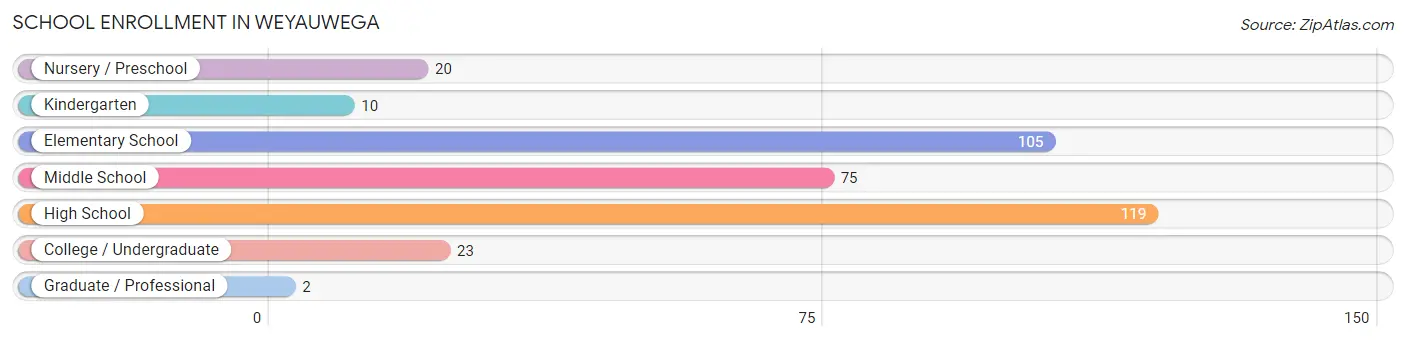
| School Level | # Students | % Students |
| Nursery / Preschool | 20 | 5.7% |
| Kindergarten | 10 | 2.8% |
| Elementary School | 105 | 29.7% |
| Middle School | 75 | 21.2% |
| High School | 119 | 33.6% |
| College / Undergraduate | 23 | 6.5% |
| Graduate / Professional | 2 | 0.6% |
| Total | 354 | 100.0% |
School Enrollment by Age by Funding Source in Weyauwega
Out of a total of 354 students who are enrolled in schools in Weyauwega, 56 (15.8%) attend a private institution, while the remaining 298 (84.2%) are enrolled in public schools. The age group of 18 to 19 year olds has the highest likelihood of being enrolled in private schools, with 3 (50.0% in the age bracket) enrolled. Conversely, the age group of 20 to 24 year olds has the lowest likelihood of being enrolled in a private school, with 11 (100.0% in the age bracket) attending a public institution.
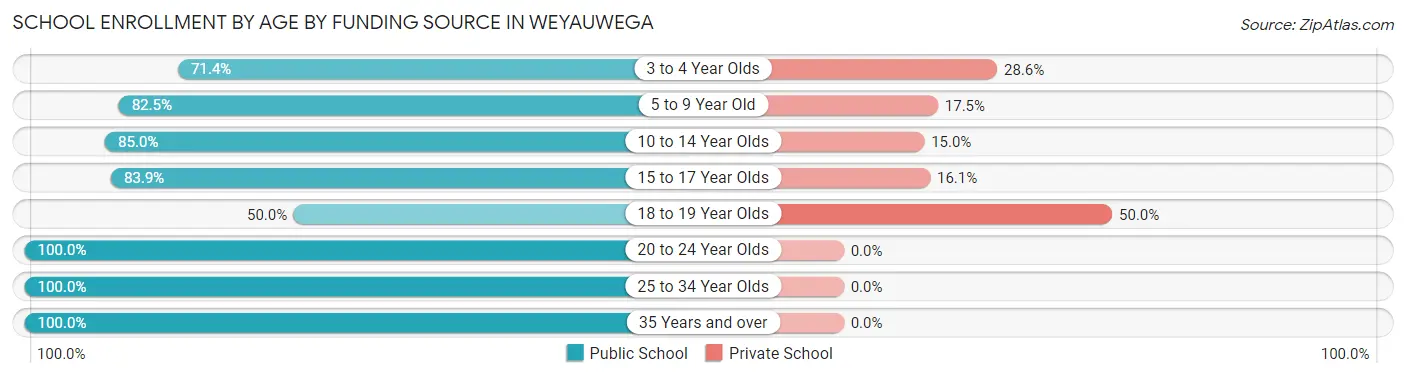
| Age Bracket | Public School | Private School |
| 3 to 4 Year Olds | 10 (71.4%) | 4 (28.6%) |
| 5 to 9 Year Old | 94 (82.5%) | 20 (17.5%) |
| 10 to 14 Year Olds | 85 (85.0%) | 15 (15.0%) |
| 15 to 17 Year Olds | 73 (83.9%) | 14 (16.1%) |
| 18 to 19 Year Olds | 3 (50.0%) | 3 (50.0%) |
| 20 to 24 Year Olds | 11 (100.0%) | 0 (0.0%) |
| 25 to 34 Year Olds | 7 (100.0%) | 0 (0.0%) |
| 35 Years and over | 15 (100.0%) | 0 (0.0%) |
| Total | 298 (84.2%) | 56 (15.8%) |
Educational Attainment by Field of Study in Weyauwega
Education (61 | 28.9%), science & technology (33 | 15.6%), bio, nature & agricultural (19 | 9.0%), social sciences (17 | 8.1%), and business (16 | 7.6%) are the most common fields of study among 211 individuals in Weyauwega who have obtained a bachelor's degree or higher.
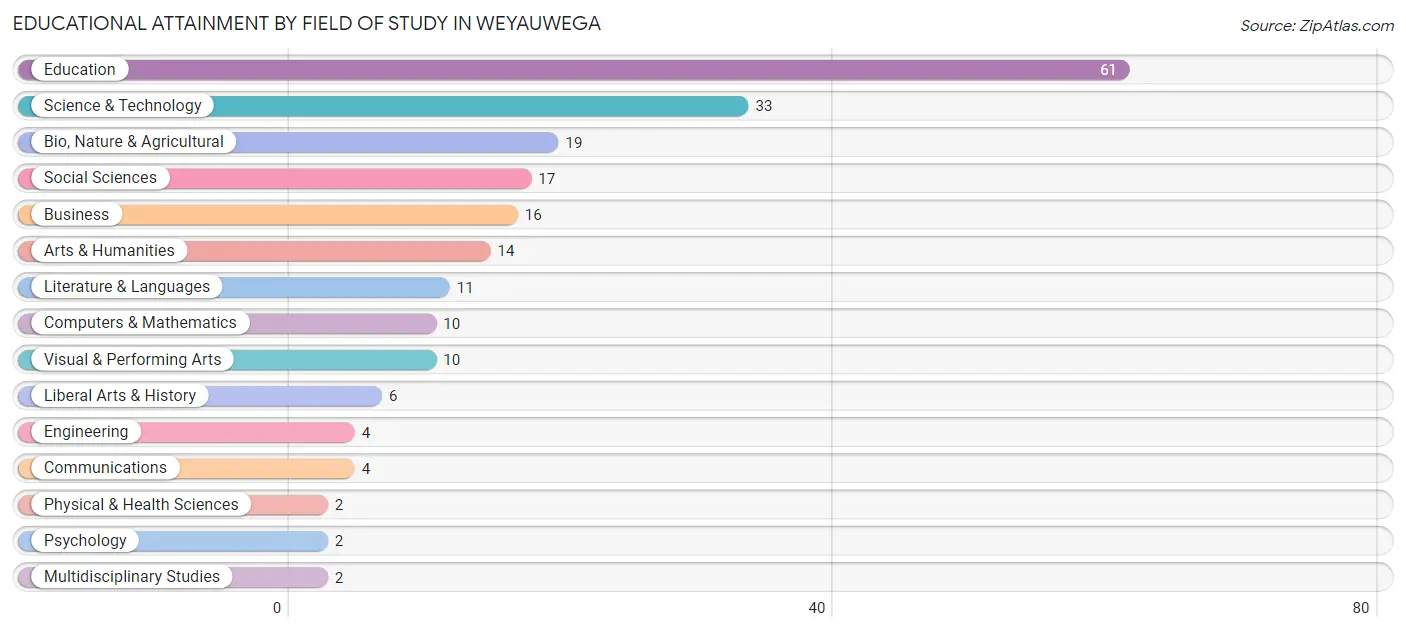
| Field of Study | # Graduates | % Graduates |
| Computers & Mathematics | 10 | 4.7% |
| Bio, Nature & Agricultural | 19 | 9.0% |
| Physical & Health Sciences | 2 | 0.9% |
| Psychology | 2 | 0.9% |
| Social Sciences | 17 | 8.1% |
| Engineering | 4 | 1.9% |
| Multidisciplinary Studies | 2 | 0.9% |
| Science & Technology | 33 | 15.6% |
| Business | 16 | 7.6% |
| Education | 61 | 28.9% |
| Literature & Languages | 11 | 5.2% |
| Liberal Arts & History | 6 | 2.8% |
| Visual & Performing Arts | 10 | 4.7% |
| Communications | 4 | 1.9% |
| Arts & Humanities | 14 | 6.6% |
| Total | 211 | 100.0% |
Transportation & Commute in Weyauwega
Vehicle Availability by Sex in Weyauwega
The most prevalent vehicle ownership categories in Weyauwega are males with 2 vehicles (270, accounting for 56.6%) and females with 2 vehicles (180, making up 58.8%).
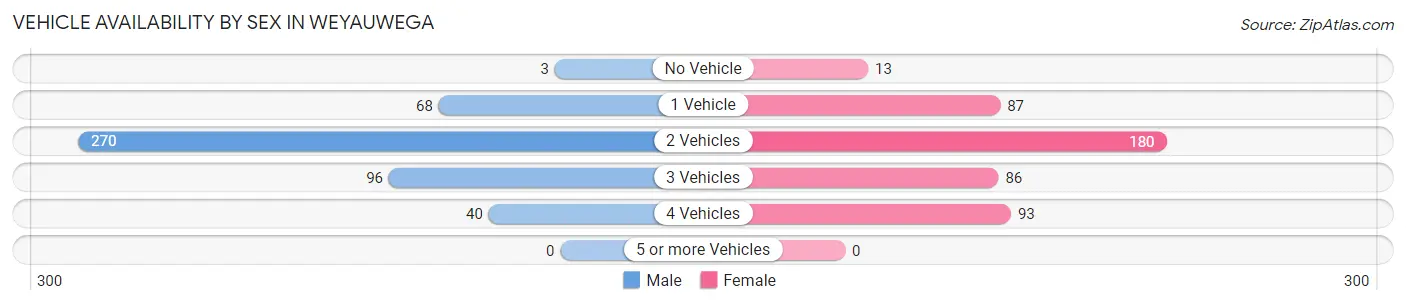
| Vehicles Available | Male | Female |
| No Vehicle | 3 (0.6%) | 13 (2.8%) |
| 1 Vehicle | 68 (14.3%) | 87 (19.0%) |
| 2 Vehicles | 270 (56.6%) | 180 (39.2%) |
| 3 Vehicles | 96 (20.1%) | 86 (18.7%) |
| 4 Vehicles | 40 (8.4%) | 93 (20.3%) |
| 5 or more Vehicles | 0 (0.0%) | 0 (0.0%) |
| Total | 477 (100.0%) | 459 (100.0%) |
Commute Time in Weyauwega
The most frequently occuring commute durations in Weyauwega are 15 to 19 minutes (233 commuters, 26.2%), less than 5 minutes (135 commuters, 15.2%), and 5 to 9 minutes (114 commuters, 12.8%).
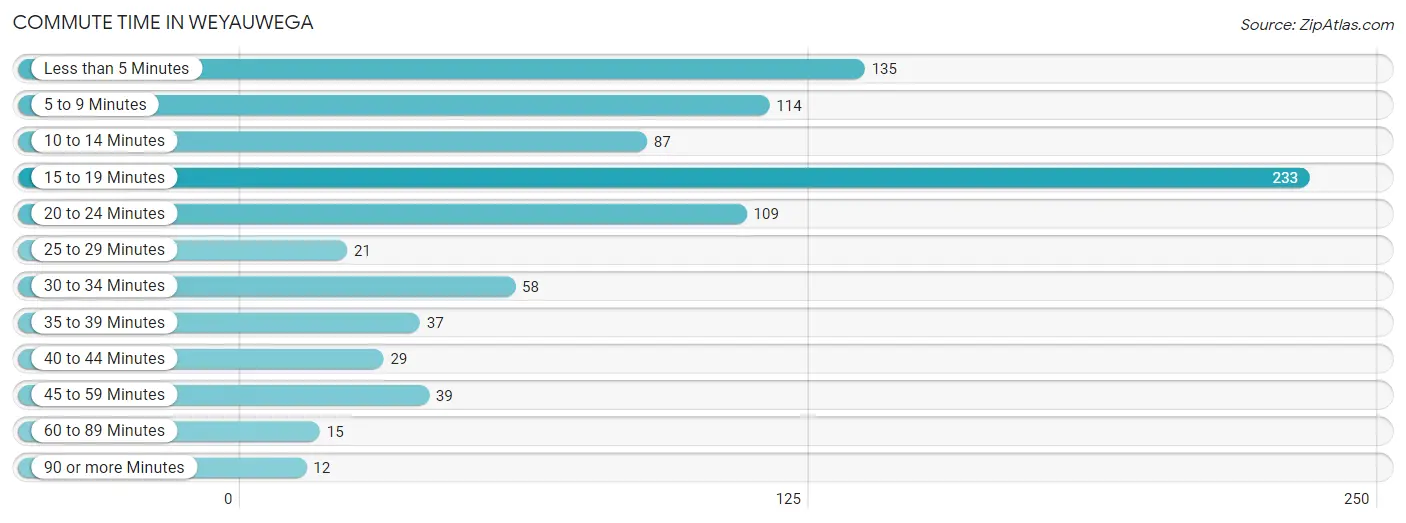
| Commute Time | # Commuters | % Commuters |
| Less than 5 Minutes | 135 | 15.2% |
| 5 to 9 Minutes | 114 | 12.8% |
| 10 to 14 Minutes | 87 | 9.8% |
| 15 to 19 Minutes | 233 | 26.2% |
| 20 to 24 Minutes | 109 | 12.3% |
| 25 to 29 Minutes | 21 | 2.4% |
| 30 to 34 Minutes | 58 | 6.5% |
| 35 to 39 Minutes | 37 | 4.2% |
| 40 to 44 Minutes | 29 | 3.3% |
| 45 to 59 Minutes | 39 | 4.4% |
| 60 to 89 Minutes | 15 | 1.7% |
| 90 or more Minutes | 12 | 1.3% |
Commute Time by Sex in Weyauwega
The most common commute times in Weyauwega are less than 5 minutes (91 commuters, 20.3%) for males and 15 to 19 minutes (143 commuters, 32.4%) for females.
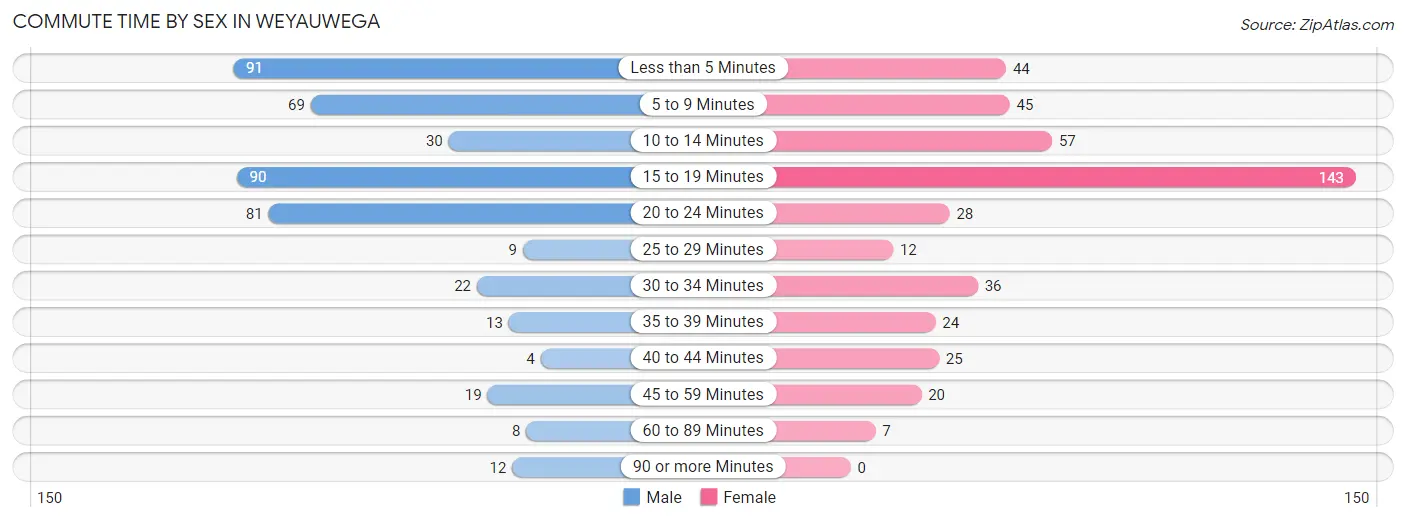
| Commute Time | Male | Female |
| Less than 5 Minutes | 91 (20.3%) | 44 (10.0%) |
| 5 to 9 Minutes | 69 (15.4%) | 45 (10.2%) |
| 10 to 14 Minutes | 30 (6.7%) | 57 (12.9%) |
| 15 to 19 Minutes | 90 (20.1%) | 143 (32.4%) |
| 20 to 24 Minutes | 81 (18.1%) | 28 (6.4%) |
| 25 to 29 Minutes | 9 (2.0%) | 12 (2.7%) |
| 30 to 34 Minutes | 22 (4.9%) | 36 (8.2%) |
| 35 to 39 Minutes | 13 (2.9%) | 24 (5.4%) |
| 40 to 44 Minutes | 4 (0.9%) | 25 (5.7%) |
| 45 to 59 Minutes | 19 (4.2%) | 20 (4.5%) |
| 60 to 89 Minutes | 8 (1.8%) | 7 (1.6%) |
| 90 or more Minutes | 12 (2.7%) | 0 (0.0%) |
Time of Departure to Work by Sex in Weyauwega
The most frequent times of departure to work in Weyauwega are 7:00 AM to 7:29 AM (62, 13.8%) for males and 12:00 AM to 4:59 AM (66, 15.0%) for females.
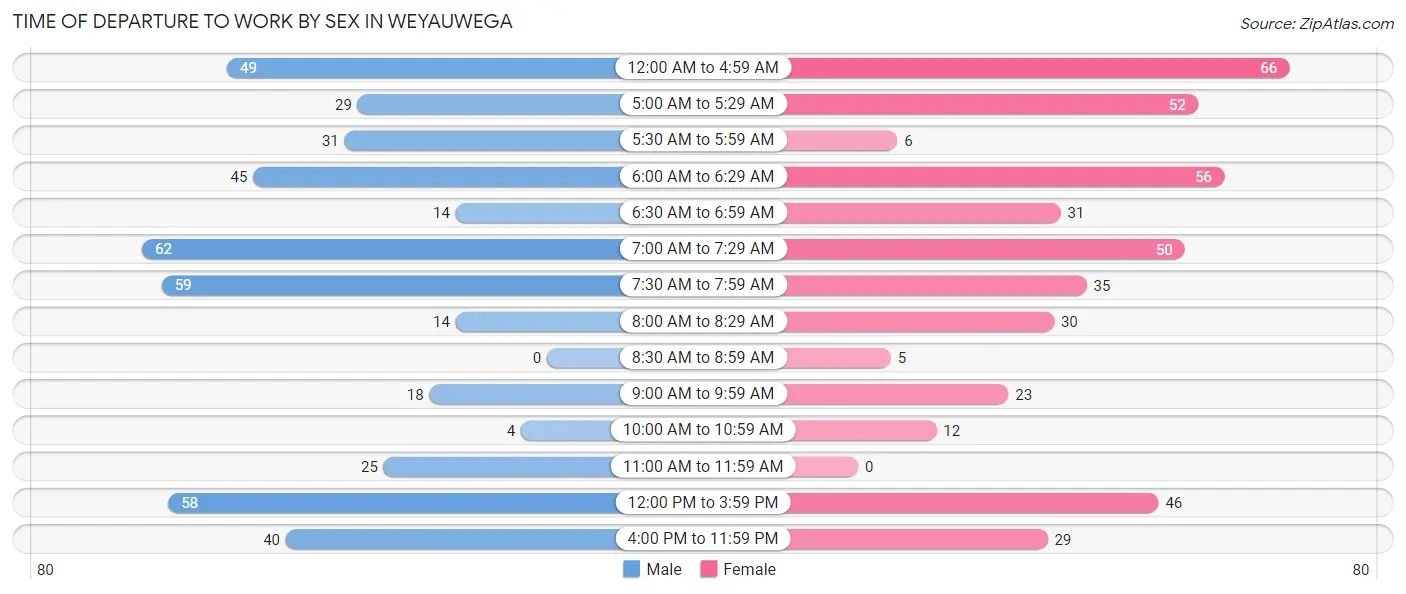
| Time of Departure | Male | Female |
| 12:00 AM to 4:59 AM | 49 (10.9%) | 66 (15.0%) |
| 5:00 AM to 5:29 AM | 29 (6.5%) | 52 (11.8%) |
| 5:30 AM to 5:59 AM | 31 (6.9%) | 6 (1.4%) |
| 6:00 AM to 6:29 AM | 45 (10.0%) | 56 (12.7%) |
| 6:30 AM to 6:59 AM | 14 (3.1%) | 31 (7.0%) |
| 7:00 AM to 7:29 AM | 62 (13.8%) | 50 (11.3%) |
| 7:30 AM to 7:59 AM | 59 (13.2%) | 35 (7.9%) |
| 8:00 AM to 8:29 AM | 14 (3.1%) | 30 (6.8%) |
| 8:30 AM to 8:59 AM | 0 (0.0%) | 5 (1.1%) |
| 9:00 AM to 9:59 AM | 18 (4.0%) | 23 (5.2%) |
| 10:00 AM to 10:59 AM | 4 (0.9%) | 12 (2.7%) |
| 11:00 AM to 11:59 AM | 25 (5.6%) | 0 (0.0%) |
| 12:00 PM to 3:59 PM | 58 (13.0%) | 46 (10.4%) |
| 4:00 PM to 11:59 PM | 40 (8.9%) | 29 (6.6%) |
| Total | 448 (100.0%) | 441 (100.0%) |
Housing Occupancy in Weyauwega
Occupancy by Ownership in Weyauwega
Of the total 708 dwellings in Weyauwega, owner-occupied units account for 436 (61.6%), while renter-occupied units make up 272 (38.4%).
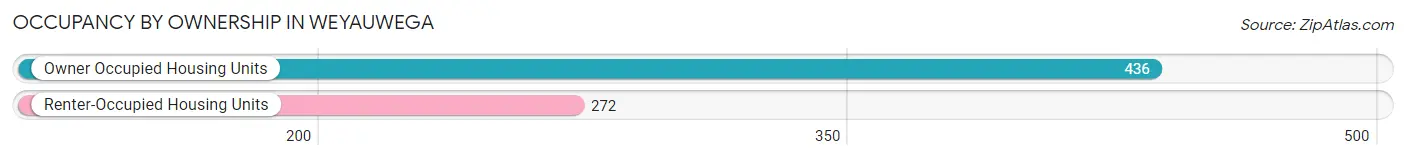
| Occupancy | # Housing Units | % Housing Units |
| Owner Occupied Housing Units | 436 | 61.6% |
| Renter-Occupied Housing Units | 272 | 38.4% |
| Total Occupied Housing Units | 708 | 100.0% |
Occupancy by Household Size in Weyauwega
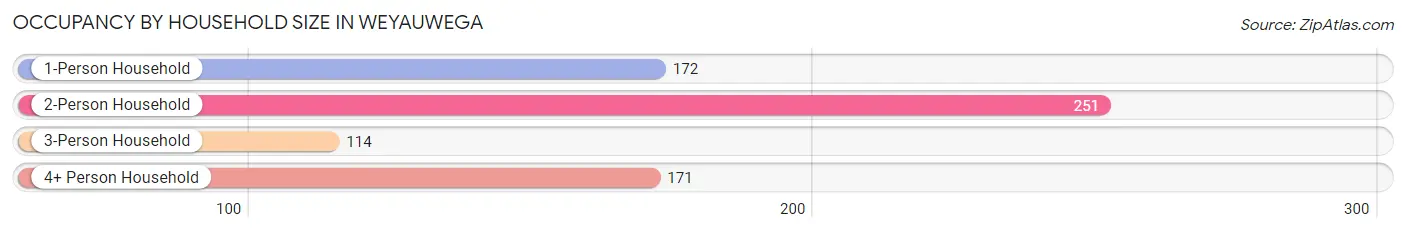
| Household Size | # Housing Units | % Housing Units |
| 1-Person Household | 172 | 24.3% |
| 2-Person Household | 251 | 35.4% |
| 3-Person Household | 114 | 16.1% |
| 4+ Person Household | 171 | 24.1% |
| Total Housing Units | 708 | 100.0% |
Occupancy by Ownership by Household Size in Weyauwega
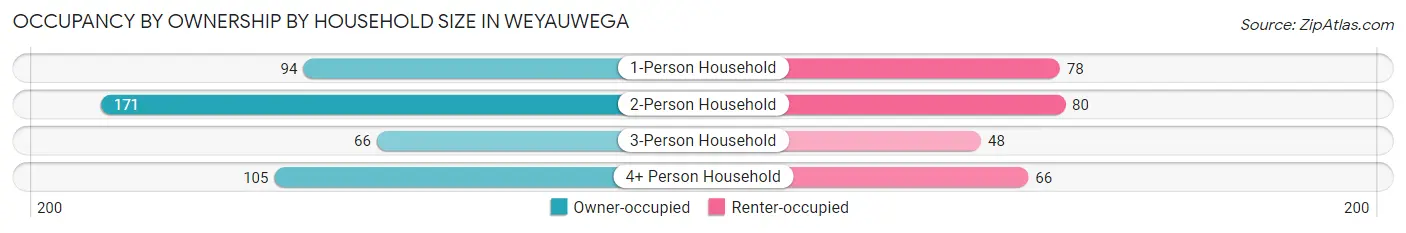
| Household Size | Owner-occupied | Renter-occupied |
| 1-Person Household | 94 (54.6%) | 78 (45.4%) |
| 2-Person Household | 171 (68.1%) | 80 (31.9%) |
| 3-Person Household | 66 (57.9%) | 48 (42.1%) |
| 4+ Person Household | 105 (61.4%) | 66 (38.6%) |
| Total Housing Units | 436 (61.6%) | 272 (38.4%) |
Occupancy by Educational Attainment in Weyauwega
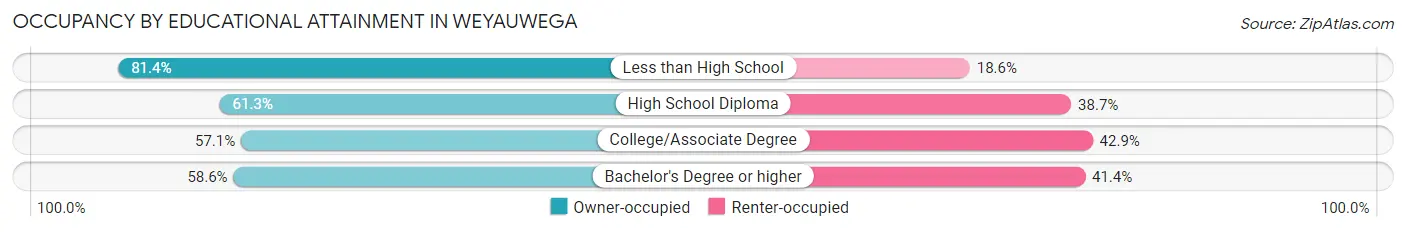
| Household Size | Owner-occupied | Renter-occupied |
| Less than High School | 57 (81.4%) | 13 (18.6%) |
| High School Diploma | 192 (61.3%) | 121 (38.7%) |
| College/Associate Degree | 129 (57.1%) | 97 (42.9%) |
| Bachelor's Degree or higher | 58 (58.6%) | 41 (41.4%) |
Occupancy by Age of Householder in Weyauwega
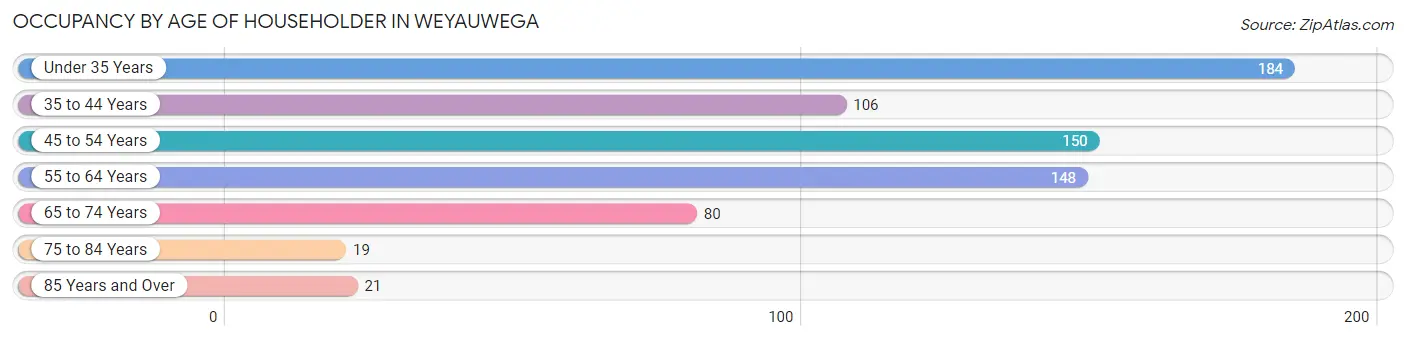
| Age Bracket | # Households | % Households |
| Under 35 Years | 184 | 26.0% |
| 35 to 44 Years | 106 | 15.0% |
| 45 to 54 Years | 150 | 21.2% |
| 55 to 64 Years | 148 | 20.9% |
| 65 to 74 Years | 80 | 11.3% |
| 75 to 84 Years | 19 | 2.7% |
| 85 Years and Over | 21 | 3.0% |
| Total | 708 | 100.0% |
Housing Finances in Weyauwega
Median Income by Occupancy in Weyauwega
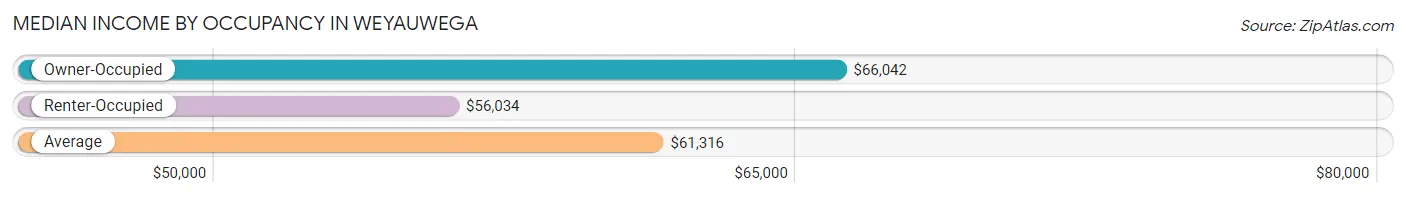
| Occupancy Type | # Households | Median Income |
| Owner-Occupied | 436 (61.6%) | $66,042 |
| Renter-Occupied | 272 (38.4%) | $56,034 |
| Average | 708 (100.0%) | $61,316 |
Occupancy by Householder Income Bracket in Weyauwega
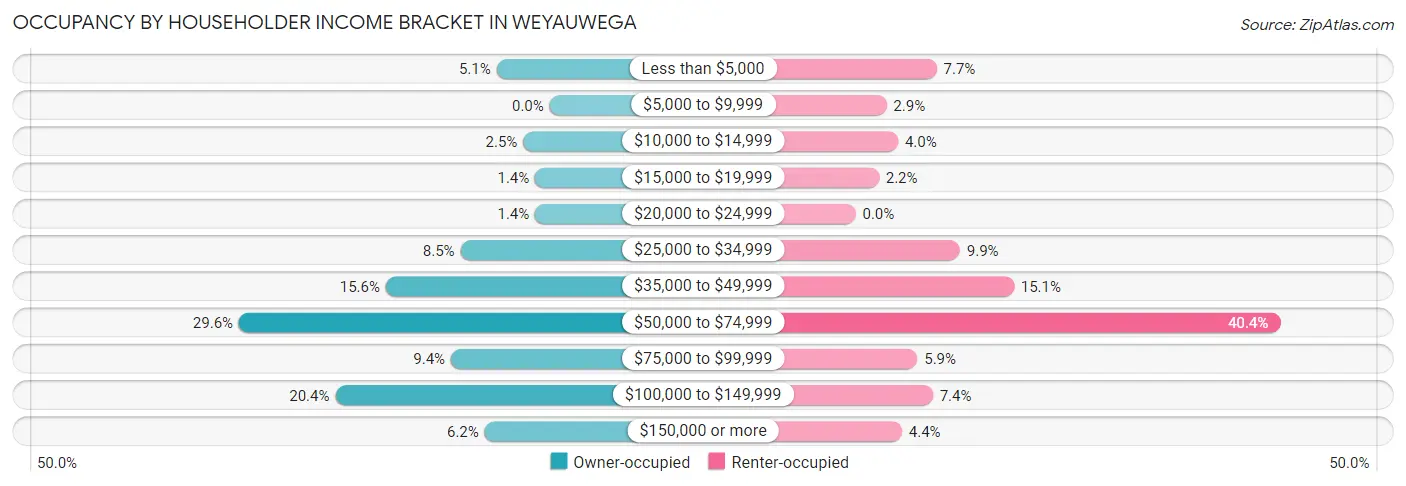
| Income Bracket | Owner-occupied | Renter-occupied |
| Less than $5,000 | 22 (5.1%) | 21 (7.7%) |
| $5,000 to $9,999 | 0 (0.0%) | 8 (2.9%) |
| $10,000 to $14,999 | 11 (2.5%) | 11 (4.0%) |
| $15,000 to $19,999 | 6 (1.4%) | 6 (2.2%) |
| $20,000 to $24,999 | 6 (1.4%) | 0 (0.0%) |
| $25,000 to $34,999 | 37 (8.5%) | 27 (9.9%) |
| $35,000 to $49,999 | 68 (15.6%) | 41 (15.1%) |
| $50,000 to $74,999 | 129 (29.6%) | 110 (40.4%) |
| $75,000 to $99,999 | 41 (9.4%) | 16 (5.9%) |
| $100,000 to $149,999 | 89 (20.4%) | 20 (7.3%) |
| $150,000 or more | 27 (6.2%) | 12 (4.4%) |
| Total | 436 (100.0%) | 272 (100.0%) |
Monthly Housing Cost Tiers in Weyauwega
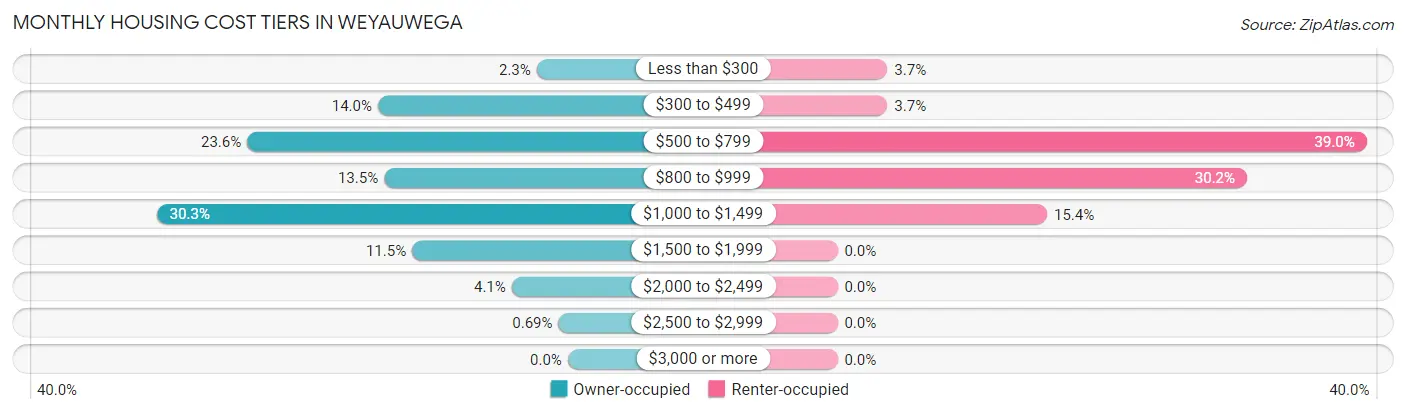
| Monthly Cost | Owner-occupied | Renter-occupied |
| Less than $300 | 10 (2.3%) | 10 (3.7%) |
| $300 to $499 | 61 (14.0%) | 10 (3.7%) |
| $500 to $799 | 103 (23.6%) | 106 (39.0%) |
| $800 to $999 | 59 (13.5%) | 82 (30.1%) |
| $1,000 to $1,499 | 132 (30.3%) | 42 (15.4%) |
| $1,500 to $1,999 | 50 (11.5%) | 0 (0.0%) |
| $2,000 to $2,499 | 18 (4.1%) | 0 (0.0%) |
| $2,500 to $2,999 | 3 (0.7%) | 0 (0.0%) |
| $3,000 or more | 0 (0.0%) | 0 (0.0%) |
| Total | 436 (100.0%) | 272 (100.0%) |
Physical Housing Characteristics in Weyauwega
Housing Structures in Weyauwega
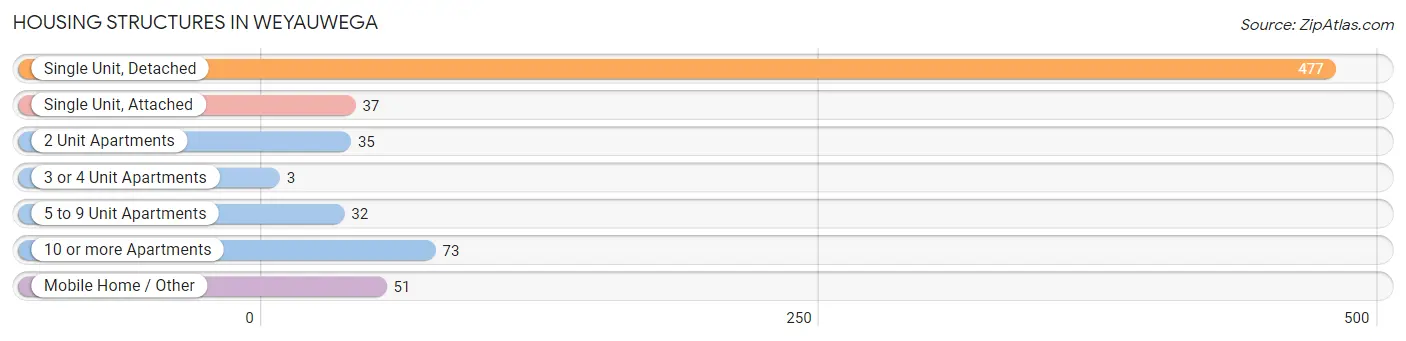
| Structure Type | # Housing Units | % Housing Units |
| Single Unit, Detached | 477 | 67.4% |
| Single Unit, Attached | 37 | 5.2% |
| 2 Unit Apartments | 35 | 4.9% |
| 3 or 4 Unit Apartments | 3 | 0.4% |
| 5 to 9 Unit Apartments | 32 | 4.5% |
| 10 or more Apartments | 73 | 10.3% |
| Mobile Home / Other | 51 | 7.2% |
| Total | 708 | 100.0% |
Housing Structures by Occupancy in Weyauwega
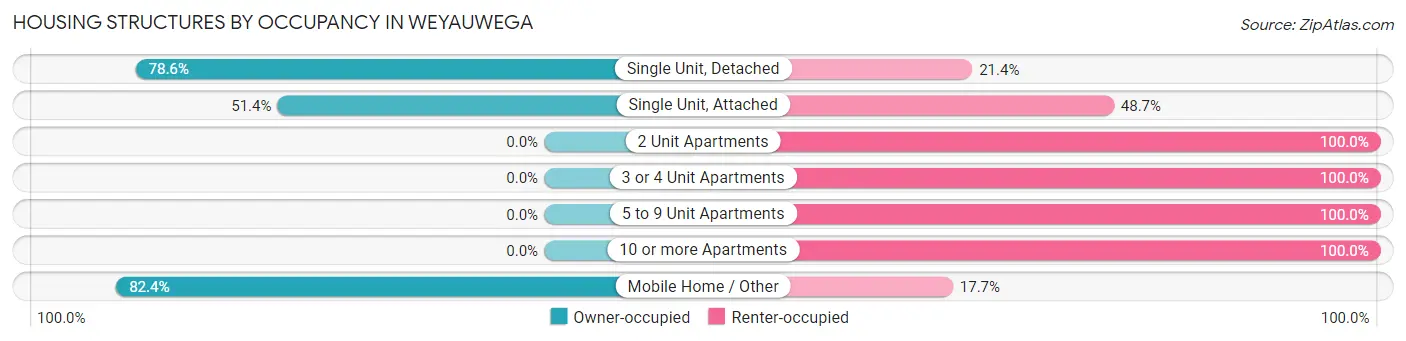
| Structure Type | Owner-occupied | Renter-occupied |
| Single Unit, Detached | 375 (78.6%) | 102 (21.4%) |
| Single Unit, Attached | 19 (51.3%) | 18 (48.6%) |
| 2 Unit Apartments | 0 (0.0%) | 35 (100.0%) |
| 3 or 4 Unit Apartments | 0 (0.0%) | 3 (100.0%) |
| 5 to 9 Unit Apartments | 0 (0.0%) | 32 (100.0%) |
| 10 or more Apartments | 0 (0.0%) | 73 (100.0%) |
| Mobile Home / Other | 42 (82.4%) | 9 (17.6%) |
| Total | 436 (61.6%) | 272 (38.4%) |
Housing Structures by Number of Rooms in Weyauwega
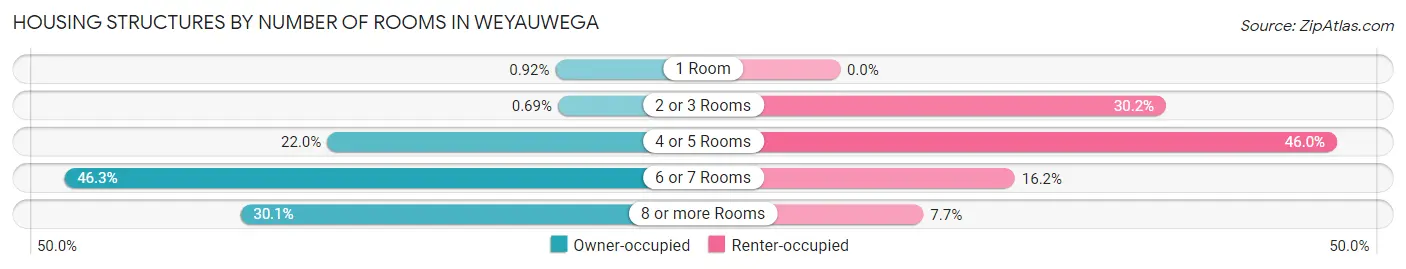
| Number of Rooms | Owner-occupied | Renter-occupied |
| 1 Room | 4 (0.9%) | 0 (0.0%) |
| 2 or 3 Rooms | 3 (0.7%) | 82 (30.1%) |
| 4 or 5 Rooms | 96 (22.0%) | 125 (46.0%) |
| 6 or 7 Rooms | 202 (46.3%) | 44 (16.2%) |
| 8 or more Rooms | 131 (30.0%) | 21 (7.7%) |
| Total | 436 (100.0%) | 272 (100.0%) |
Housing Structure by Heating Type in Weyauwega
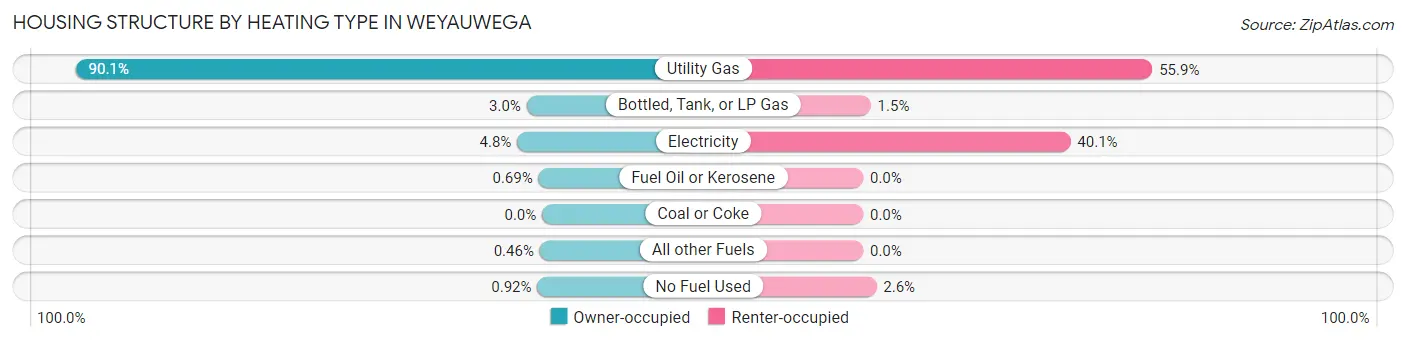
| Heating Type | Owner-occupied | Renter-occupied |
| Utility Gas | 393 (90.1%) | 152 (55.9%) |
| Bottled, Tank, or LP Gas | 13 (3.0%) | 4 (1.5%) |
| Electricity | 21 (4.8%) | 109 (40.1%) |
| Fuel Oil or Kerosene | 3 (0.7%) | 0 (0.0%) |
| Coal or Coke | 0 (0.0%) | 0 (0.0%) |
| All other Fuels | 2 (0.5%) | 0 (0.0%) |
| No Fuel Used | 4 (0.9%) | 7 (2.6%) |
| Total | 436 (100.0%) | 272 (100.0%) |
Household Vehicle Usage in Weyauwega
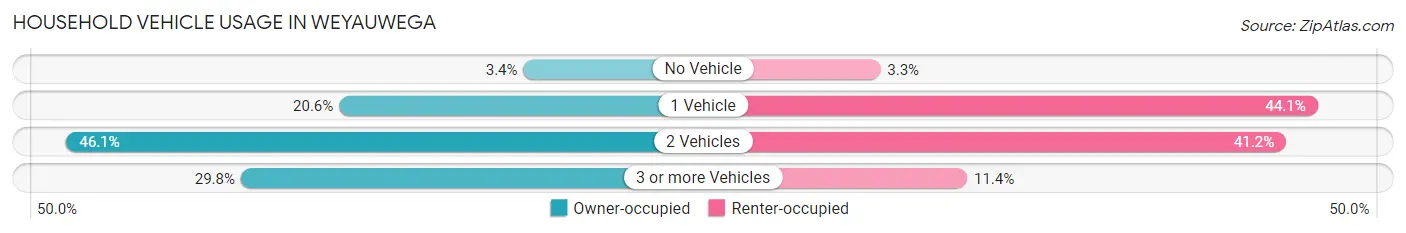
| Vehicles per Household | Owner-occupied | Renter-occupied |
| No Vehicle | 15 (3.4%) | 9 (3.3%) |
| 1 Vehicle | 90 (20.6%) | 120 (44.1%) |
| 2 Vehicles | 201 (46.1%) | 112 (41.2%) |
| 3 or more Vehicles | 130 (29.8%) | 31 (11.4%) |
| Total | 436 (100.0%) | 272 (100.0%) |
Real Estate & Mortgages in Weyauwega
Real Estate and Mortgage Overview in Weyauwega
| Characteristic | Without Mortgage | With Mortgage |
| Housing Units | 181 | 255 |
| Median Property Value | $98,700 | $137,100 |
| Median Household Income | $49,196 | $25 |
| Monthly Housing Costs | $581 | $0 |
| Real Estate Taxes | $2,490 | $0 |
Property Value by Mortgage Status in Weyauwega
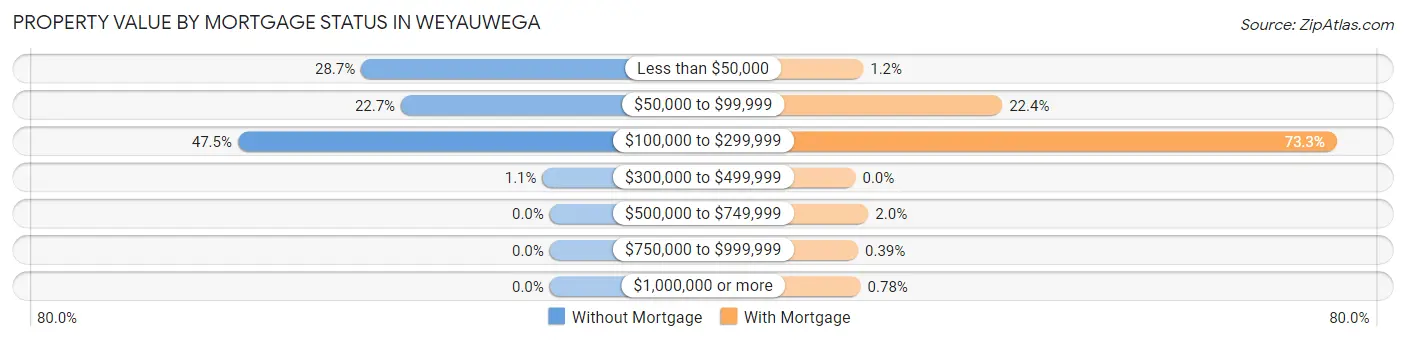
| Property Value | Without Mortgage | With Mortgage |
| Less than $50,000 | 52 (28.7%) | 3 (1.2%) |
| $50,000 to $99,999 | 41 (22.7%) | 57 (22.4%) |
| $100,000 to $299,999 | 86 (47.5%) | 187 (73.3%) |
| $300,000 to $499,999 | 2 (1.1%) | 0 (0.0%) |
| $500,000 to $749,999 | 0 (0.0%) | 5 (2.0%) |
| $750,000 to $999,999 | 0 (0.0%) | 1 (0.4%) |
| $1,000,000 or more | 0 (0.0%) | 2 (0.8%) |
| Total | 181 (100.0%) | 255 (100.0%) |
Household Income by Mortgage Status in Weyauwega
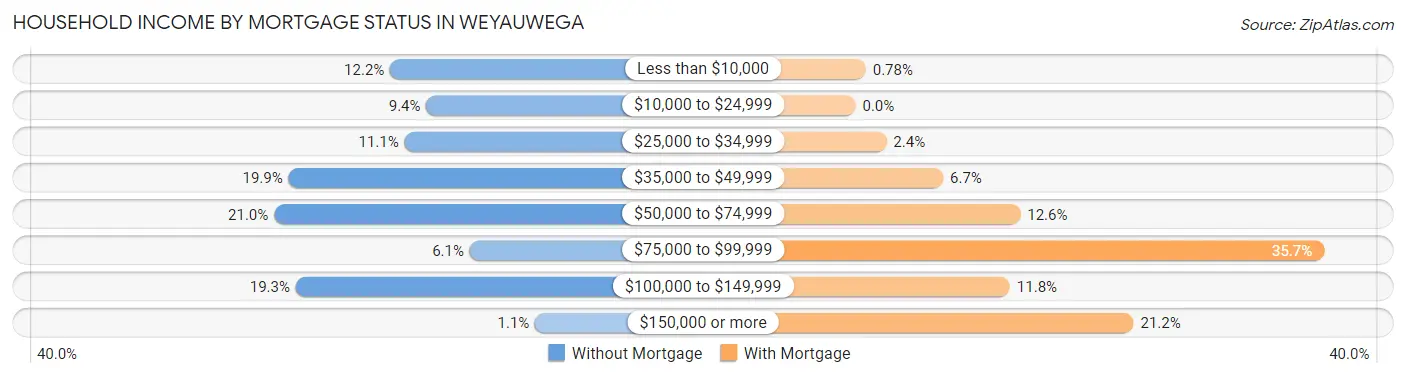
| Household Income | Without Mortgage | With Mortgage |
| Less than $10,000 | 22 (12.1%) | 2 (0.8%) |
| $10,000 to $24,999 | 17 (9.4%) | 0 (0.0%) |
| $25,000 to $34,999 | 20 (11.1%) | 6 (2.4%) |
| $35,000 to $49,999 | 36 (19.9%) | 17 (6.7%) |
| $50,000 to $74,999 | 38 (21.0%) | 32 (12.6%) |
| $75,000 to $99,999 | 11 (6.1%) | 91 (35.7%) |
| $100,000 to $149,999 | 35 (19.3%) | 30 (11.8%) |
| $150,000 or more | 2 (1.1%) | 54 (21.2%) |
| Total | 181 (100.0%) | 255 (100.0%) |
Property Value to Household Income Ratio in Weyauwega
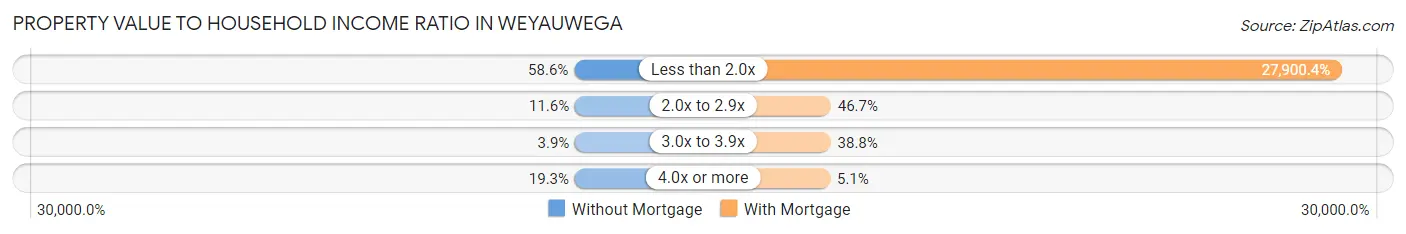
| Value-to-Income Ratio | Without Mortgage | With Mortgage |
| Less than 2.0x | 106 (58.6%) | 71,146 (27,900.4%) |
| 2.0x to 2.9x | 21 (11.6%) | 119 (46.7%) |
| 3.0x to 3.9x | 7 (3.9%) | 99 (38.8%) |
| 4.0x or more | 35 (19.3%) | 13 (5.1%) |
| Total | 181 (100.0%) | 255 (100.0%) |
Real Estate Taxes by Mortgage Status in Weyauwega
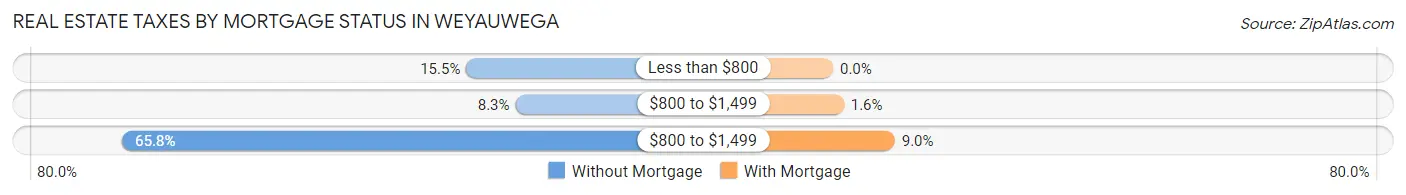
| Property Taxes | Without Mortgage | With Mortgage |
| Less than $800 | 28 (15.5%) | 0 (0.0%) |
| $800 to $1,499 | 15 (8.3%) | 4 (1.6%) |
| $800 to $1,499 | 119 (65.7%) | 23 (9.0%) |
| Total | 181 (100.0%) | 255 (100.0%) |
Health & Disability in Weyauwega
Health Insurance Coverage by Age in Weyauwega
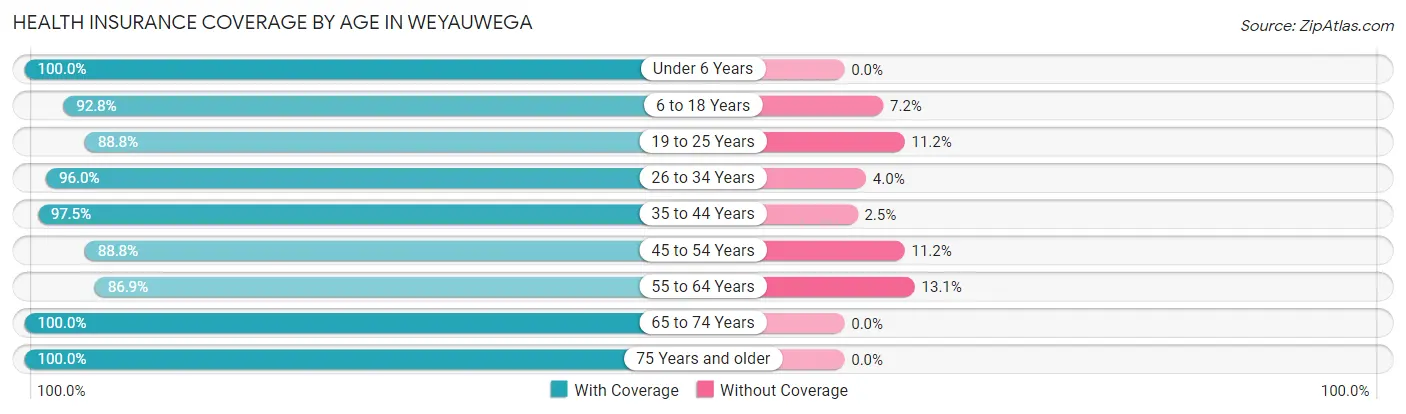
| Age Bracket | With Coverage | Without Coverage |
| Under 6 Years | 139 (100.0%) | 0 (0.0%) |
| 6 to 18 Years | 295 (92.8%) | 23 (7.2%) |
| 19 to 25 Years | 166 (88.8%) | 21 (11.2%) |
| 26 to 34 Years | 238 (96.0%) | 10 (4.0%) |
| 35 to 44 Years | 198 (97.5%) | 5 (2.5%) |
| 45 to 54 Years | 229 (88.8%) | 29 (11.2%) |
| 55 to 64 Years | 212 (86.9%) | 32 (13.1%) |
| 65 to 74 Years | 112 (100.0%) | 0 (0.0%) |
| 75 Years and older | 64 (100.0%) | 0 (0.0%) |
| Total | 1,653 (93.2%) | 120 (6.8%) |
Health Insurance Coverage by Citizenship Status in Weyauwega
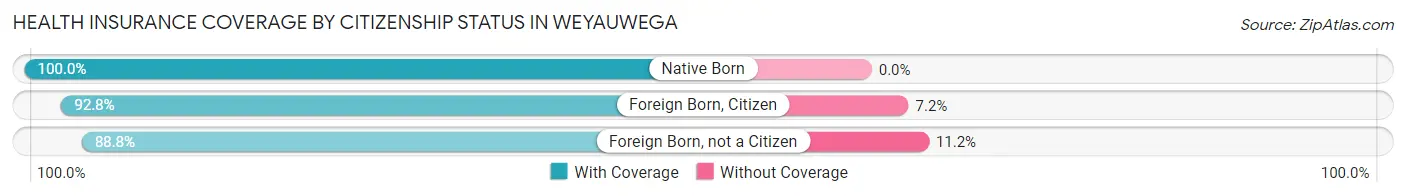
| Citizenship Status | With Coverage | Without Coverage |
| Native Born | 139 (100.0%) | 0 (0.0%) |
| Foreign Born, Citizen | 295 (92.8%) | 23 (7.2%) |
| Foreign Born, not a Citizen | 166 (88.8%) | 21 (11.2%) |
Health Insurance Coverage by Household Income in Weyauwega
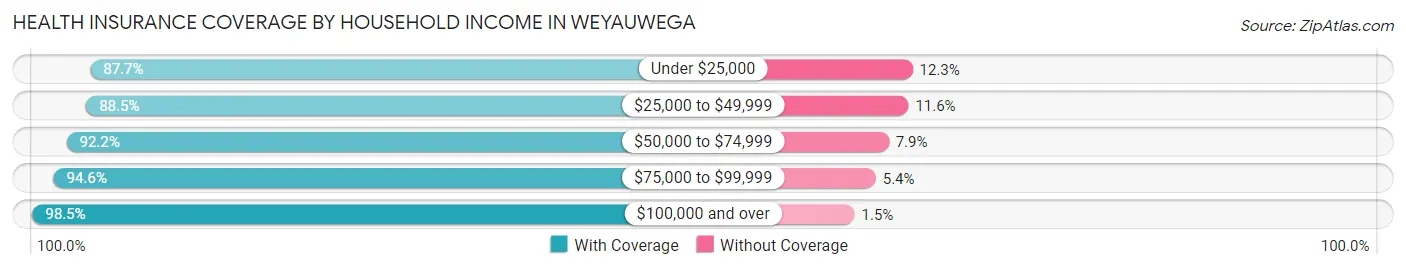
| Household Income | With Coverage | Without Coverage |
| Under $25,000 | 114 (87.7%) | 16 (12.3%) |
| $25,000 to $49,999 | 268 (88.4%) | 35 (11.6%) |
| $50,000 to $74,999 | 610 (92.1%) | 52 (7.9%) |
| $75,000 to $99,999 | 174 (94.6%) | 10 (5.4%) |
| $100,000 and over | 474 (98.5%) | 7 (1.5%) |
Public vs Private Health Insurance Coverage by Age in Weyauwega
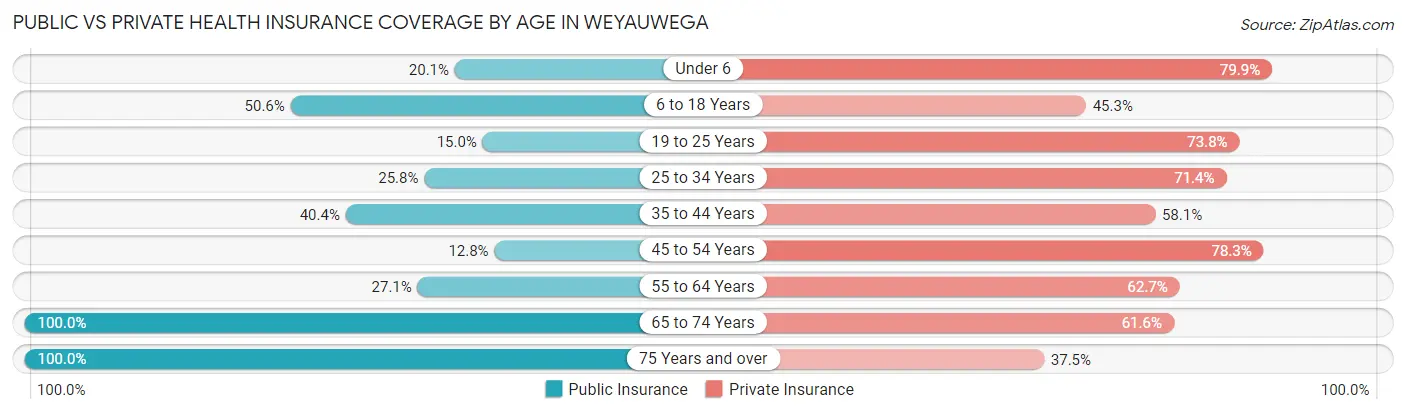
| Age Bracket | Public Insurance | Private Insurance |
| Under 6 | 28 (20.1%) | 111 (79.9%) |
| 6 to 18 Years | 161 (50.6%) | 144 (45.3%) |
| 19 to 25 Years | 28 (15.0%) | 138 (73.8%) |
| 25 to 34 Years | 64 (25.8%) | 177 (71.4%) |
| 35 to 44 Years | 82 (40.4%) | 118 (58.1%) |
| 45 to 54 Years | 33 (12.8%) | 202 (78.3%) |
| 55 to 64 Years | 66 (27.1%) | 153 (62.7%) |
| 65 to 74 Years | 112 (100.0%) | 69 (61.6%) |
| 75 Years and over | 64 (100.0%) | 24 (37.5%) |
| Total | 638 (36.0%) | 1,136 (64.1%) |
Disability Status by Sex by Age in Weyauwega
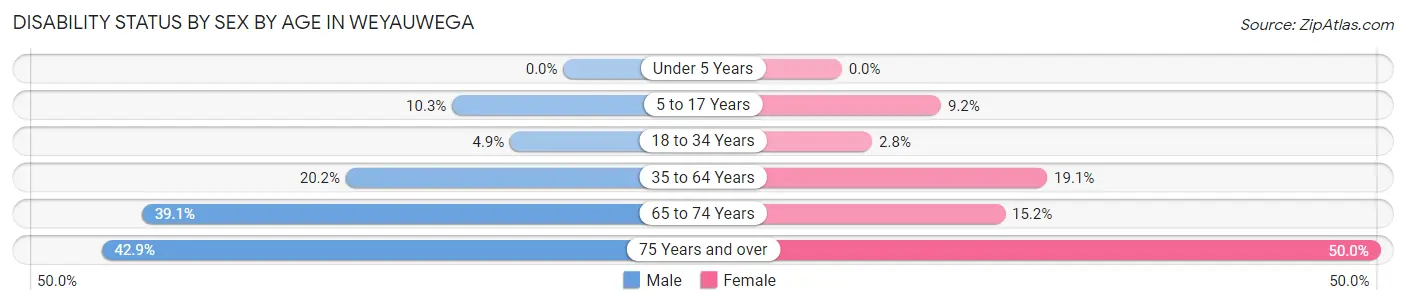
| Age Bracket | Male | Female |
| Under 5 Years | 0 (0.0%) | 0 (0.0%) |
| 5 to 17 Years | 16 (10.3%) | 14 (9.2%) |
| 18 to 34 Years | 12 (4.9%) | 6 (2.8%) |
| 35 to 64 Years | 65 (20.2%) | 73 (19.1%) |
| 65 to 74 Years | 18 (39.1%) | 10 (15.1%) |
| 75 Years and over | 6 (42.9%) | 25 (50.0%) |
Disability Class by Sex by Age in Weyauwega
Disability Class: Hearing Difficulty
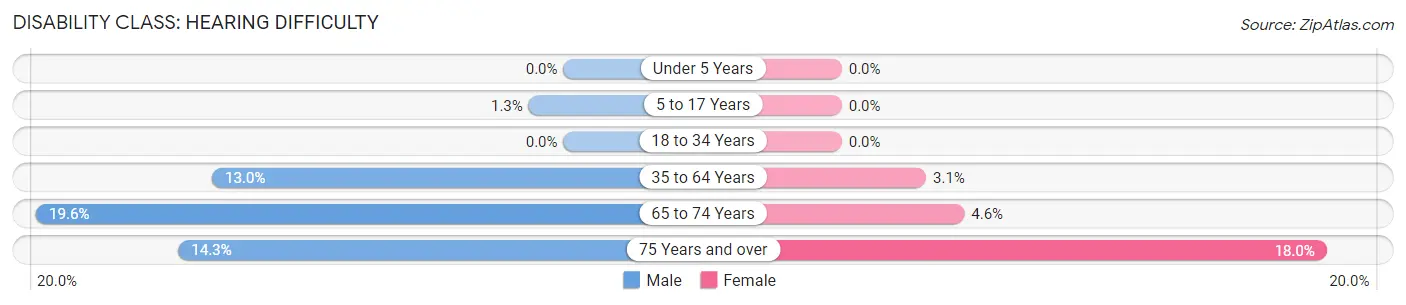
| Age Bracket | Male | Female |
| Under 5 Years | 0 (0.0%) | 0 (0.0%) |
| 5 to 17 Years | 2 (1.3%) | 0 (0.0%) |
| 18 to 34 Years | 0 (0.0%) | 0 (0.0%) |
| 35 to 64 Years | 42 (13.0%) | 12 (3.1%) |
| 65 to 74 Years | 9 (19.6%) | 3 (4.5%) |
| 75 Years and over | 2 (14.3%) | 9 (18.0%) |
Disability Class: Vision Difficulty
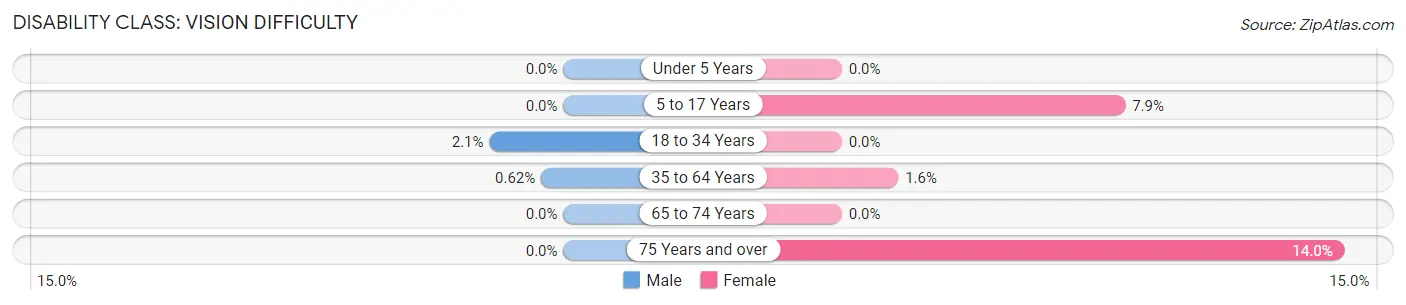
| Age Bracket | Male | Female |
| Under 5 Years | 0 (0.0%) | 0 (0.0%) |
| 5 to 17 Years | 0 (0.0%) | 12 (7.9%) |
| 18 to 34 Years | 5 (2.1%) | 0 (0.0%) |
| 35 to 64 Years | 2 (0.6%) | 6 (1.6%) |
| 65 to 74 Years | 0 (0.0%) | 0 (0.0%) |
| 75 Years and over | 0 (0.0%) | 7 (14.0%) |
Disability Class: Cognitive Difficulty
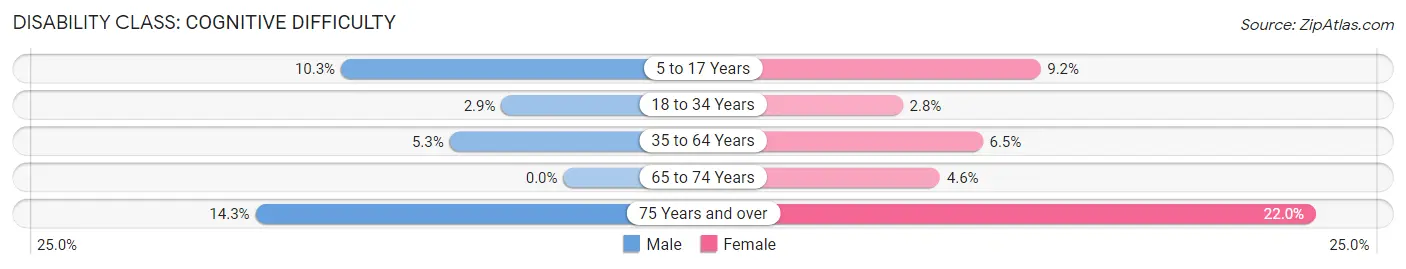
| Age Bracket | Male | Female |
| 5 to 17 Years | 16 (10.3%) | 14 (9.2%) |
| 18 to 34 Years | 7 (2.9%) | 6 (2.8%) |
| 35 to 64 Years | 17 (5.3%) | 25 (6.5%) |
| 65 to 74 Years | 0 (0.0%) | 3 (4.5%) |
| 75 Years and over | 2 (14.3%) | 11 (22.0%) |
Disability Class: Ambulatory Difficulty
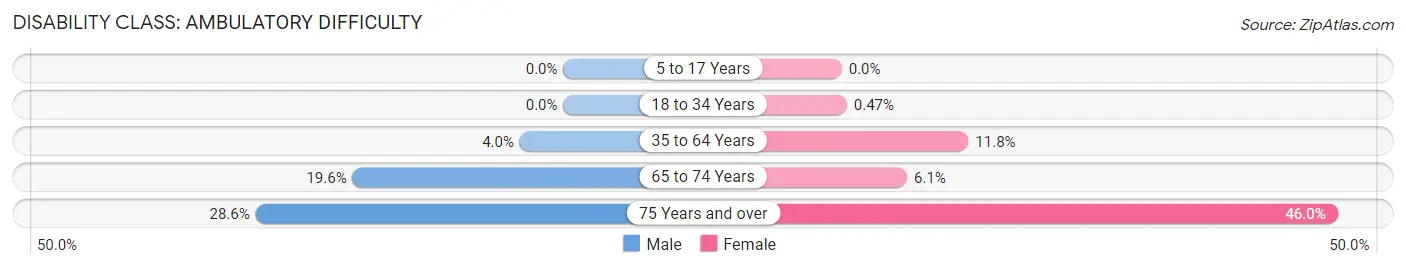
| Age Bracket | Male | Female |
| 5 to 17 Years | 0 (0.0%) | 0 (0.0%) |
| 18 to 34 Years | 0 (0.0%) | 1 (0.5%) |
| 35 to 64 Years | 13 (4.0%) | 45 (11.7%) |
| 65 to 74 Years | 9 (19.6%) | 4 (6.1%) |
| 75 Years and over | 4 (28.6%) | 23 (46.0%) |
Disability Class: Self-Care Difficulty
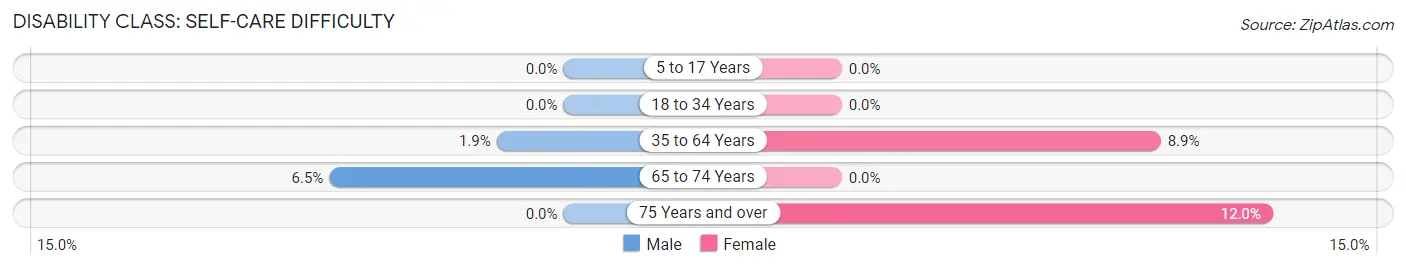
| Age Bracket | Male | Female |
| 5 to 17 Years | 0 (0.0%) | 0 (0.0%) |
| 18 to 34 Years | 0 (0.0%) | 0 (0.0%) |
| 35 to 64 Years | 6 (1.9%) | 34 (8.9%) |
| 65 to 74 Years | 3 (6.5%) | 0 (0.0%) |
| 75 Years and over | 0 (0.0%) | 6 (12.0%) |
Technology Access in Weyauwega
Computing Device Access in Weyauwega
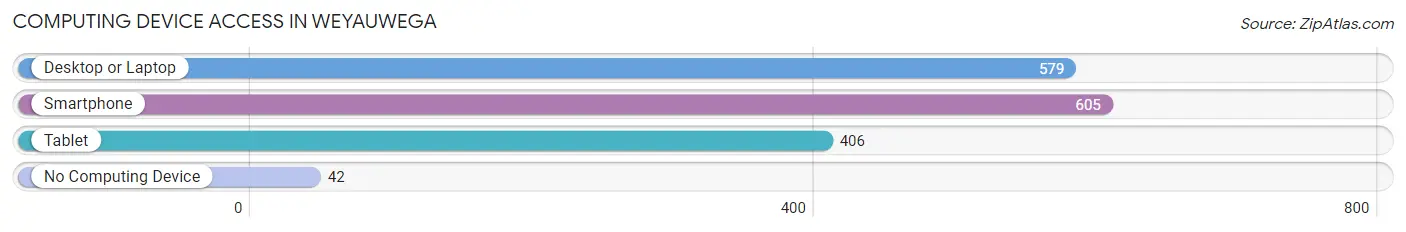
| Device Type | # Households | % Households |
| Desktop or Laptop | 579 | 81.8% |
| Smartphone | 605 | 85.5% |
| Tablet | 406 | 57.3% |
| No Computing Device | 42 | 5.9% |
| Total | 708 | 100.0% |
Internet Access in Weyauwega
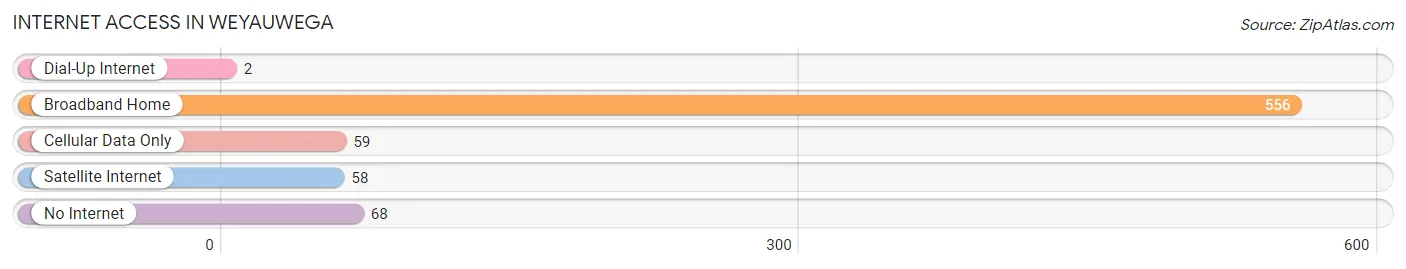
| Internet Type | # Households | % Households |
| Dial-Up Internet | 2 | 0.3% |
| Broadband Home | 556 | 78.5% |
| Cellular Data Only | 59 | 8.3% |
| Satellite Internet | 58 | 8.2% |
| No Internet | 68 | 9.6% |
| Total | 708 | 100.0% |
Weyauwega Summary
Weyauwega, Wisconsin is a small city located in Waupaca County, Wisconsin. It is situated on the Wolf River, about halfway between Appleton and Wausau. The city has a population of 2,521 people, according to the 2010 census.
History
Weyauwega was first settled in 1848 by a group of German immigrants. The city was originally known as Weyauwegau, which means “place of the wild geese” in the language of the Potawatomi Indians. The city was officially incorporated in 1872.
In the late 19th century, Weyauwega was a major center for the lumber industry. The city was home to several sawmills and lumberyards, and the Wolf River was used to transport logs to the mills. The city also had a thriving agricultural industry, with many farmers growing potatoes, corn, and other crops.
In the early 20th century, Weyauwega became a popular tourist destination. The city was home to several resorts, including the Weyauwega Hotel, which was built in 1906. The city also had a number of amusement parks, including the Weyauwega Amusement Park, which opened in 1910.
Geography
Weyauwega is located in central Wisconsin, about halfway between Appleton and Wausau. The city is situated on the Wolf River, which flows through the city and is used for recreational activities such as fishing and boating. The city is surrounded by rolling hills and forests, and is home to several parks and nature preserves.
Economy
Weyauwega’s economy is largely based on agriculture and tourism. The city is home to several farms, which produce potatoes, corn, and other crops. The city is also home to several resorts and tourist attractions, including the Weyauwega Hotel and the Weyauwega Amusement Park.
Demographics
According to the 2010 census, Weyauwega has a population of 2,521 people. The city has a median household income of $41,944, and the median age is 41.7 years. The city is predominantly white, with 92.3% of the population identifying as white. The city also has a small Hispanic population, with 4.2% of the population identifying as Hispanic or Latino.
Conclusion
Weyauwega, Wisconsin is a small city located in Waupaca County, Wisconsin. It is situated on the Wolf River, about halfway between Appleton and Wausau. The city has a population of 2,521 people, according to the 2010 census. Weyauwega’s economy is largely based on agriculture and tourism, and the city is home to several farms, resorts, and tourist attractions. The city is predominantly white, with 92.3% of the population identifying as white. The city also has a small Hispanic population, with 4.2% of the population identifying as Hispanic or Latino.
Common Questions
What is Per Capita Income in Weyauwega?
Per Capita income in Weyauwega is $27,746.
What is the Median Family Income in Weyauwega?
Median Family Income in Weyauwega is $60,978.
What is the Median Household income in Weyauwega?
Median Household Income in Weyauwega is $61,316.
What is Income or Wage Gap in Weyauwega?
Income or Wage Gap in Weyauwega is 20.8%.
Women in Weyauwega earn 79.2 cents for every dollar earned by a man.
What is Inequality or Gini Index in Weyauwega?
Inequality or Gini Index in Weyauwega is 0.35.
What is the Total Population of Weyauwega?
Total Population of Weyauwega is 1,857.
What is the Total Male Population of Weyauwega?
Total Male Population of Weyauwega is 922.
What is the Total Female Population of Weyauwega?
Total Female Population of Weyauwega is 935.
What is the Ratio of Males per 100 Females in Weyauwega?
There are 98.61 Males per 100 Females in Weyauwega.
What is the Ratio of Females per 100 Males in Weyauwega?
There are 101.41 Females per 100 Males in Weyauwega.
What is the Median Population Age in Weyauwega?
Median Population Age in Weyauwega is 36.1 Years.
What is the Average Family Size in Weyauwega
Average Family Size in Weyauwega is 2.9 People.
What is the Average Household Size in Weyauwega
Average Household Size in Weyauwega is 2.5 People.
How Large is the Labor Force in Weyauwega?
There are 950 People in the Labor Forcein in Weyauwega.
What is the Percentage of People in the Labor Force in Weyauwega?
64.7% of People are in the Labor Force in Weyauwega.
What is the Unemployment Rate in Weyauwega?
Unemployment Rate in Weyauwega is 0.5%.