Webster, WI Map & Demographics
Webster Map
Webster Overview
$24,838
PER CAPITA INCOME
$42,143
AVG FAMILY INCOME
$40,938
AVG HOUSEHOLD INCOME
18.4%
WAGE / INCOME GAP [ % ]
81.6¢/ $1
WAGE / INCOME GAP [ $ ]
0.47
INEQUALITY / GINI INDEX
665
TOTAL POPULATION
288
MALE POPULATION
377
FEMALE POPULATION
76.39
MALES / 100 FEMALES
130.90
FEMALES / 100 MALES
39.6
MEDIAN AGE
3.0
AVG FAMILY SIZE
2.2
AVG HOUSEHOLD SIZE
286
LABOR FORCE [ PEOPLE ]
55.6%
PERCENT IN LABOR FORCE
Webster Zip Codes
Webster Area Codes
Income in Webster
Income Overview in Webster
Per Capita Income in Webster is $24,838, while median incomes of families and households are $42,143 and $40,938 respectively.
| Characteristic | Number | Measure |
| Per Capita Income | 665 | $24,838 |
| Median Family Income | 144 | $42,143 |
| Mean Family Income | 144 | $66,939 |
| Median Household Income | 298 | $40,938 |
| Mean Household Income | 298 | $53,264 |
| Income Deficit | 144 | $0 |
| Wage / Income Gap (%) | 665 | 18.38% |
| Wage / Income Gap ($) | 665 | 81.62¢ per $1 |
| Gini / Inequality Index | 665 | 0.47 |
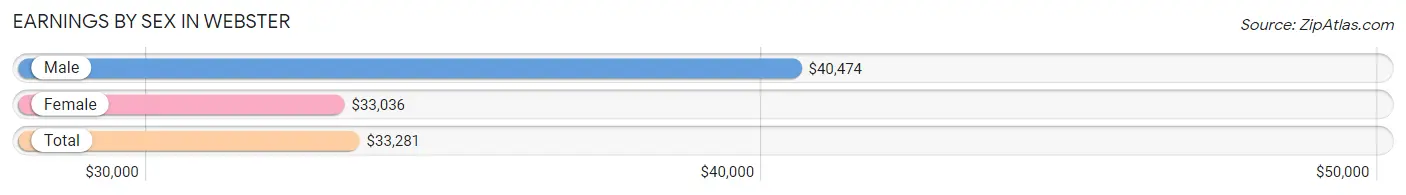
Earnings by Sex in Webster
Average Earnings in Webster are $33,281, $40,474 for men and $33,036 for women, a difference of 18.4%.
| Sex | Number | Average Earnings |
| Male | 137 (45.8%) | $40,474 |
| Female | 162 (54.2%) | $33,036 |
| Total | 299 (100.0%) | $33,281 |
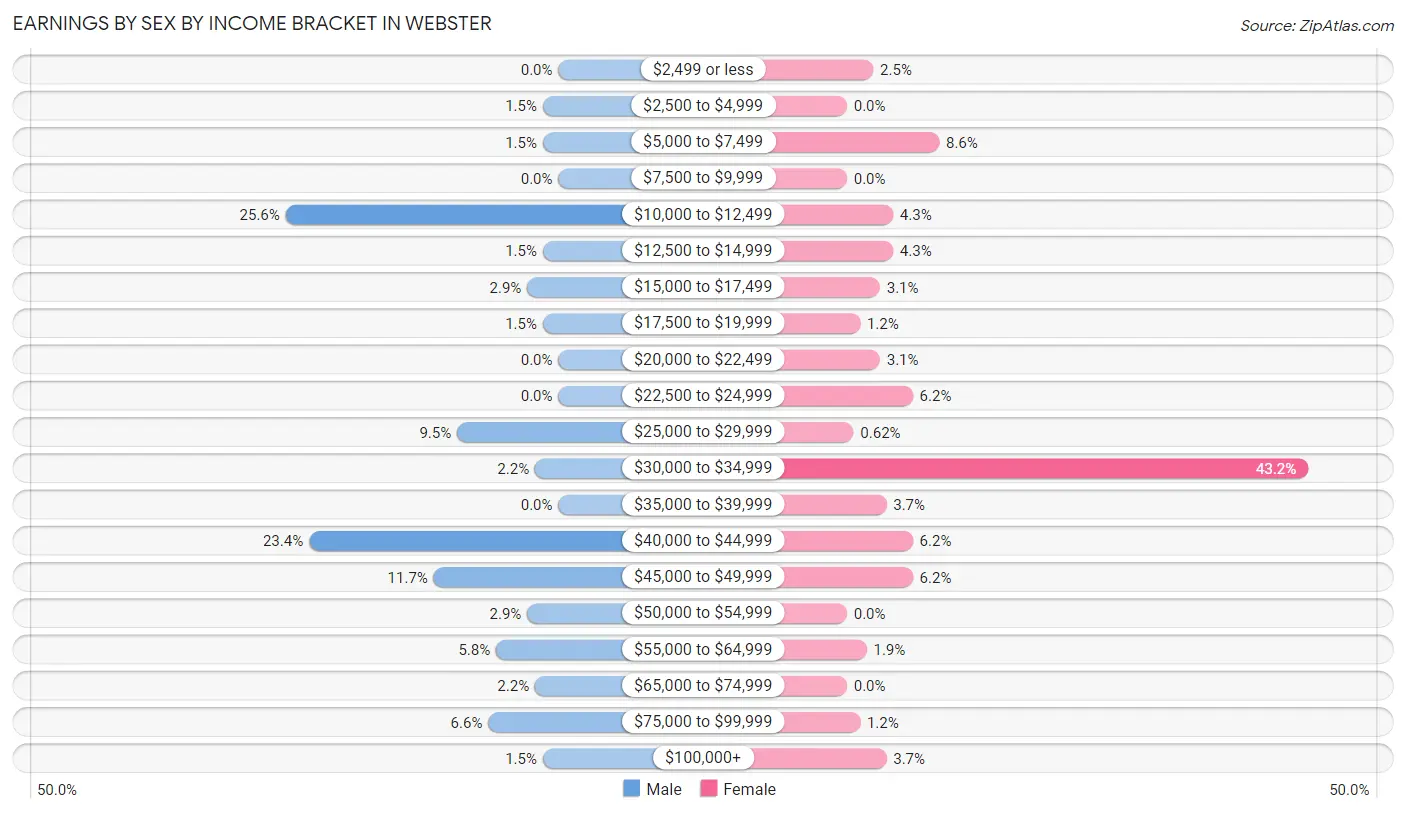
Earnings by Sex by Income Bracket in Webster
The most common earnings brackets in Webster are $10,000 to $12,499 for men (35 | 25.6%) and $30,000 to $34,999 for women (70 | 43.2%).
| Income | Male | Female |
| $2,499 or less | 0 (0.0%) | 4 (2.5%) |
| $2,500 to $4,999 | 2 (1.5%) | 0 (0.0%) |
| $5,000 to $7,499 | 2 (1.5%) | 14 (8.6%) |
| $7,500 to $9,999 | 0 (0.0%) | 0 (0.0%) |
| $10,000 to $12,499 | 35 (25.6%) | 7 (4.3%) |
| $12,500 to $14,999 | 2 (1.5%) | 7 (4.3%) |
| $15,000 to $17,499 | 4 (2.9%) | 5 (3.1%) |
| $17,500 to $19,999 | 2 (1.5%) | 2 (1.2%) |
| $20,000 to $22,499 | 0 (0.0%) | 5 (3.1%) |
| $22,500 to $24,999 | 0 (0.0%) | 10 (6.2%) |
| $25,000 to $29,999 | 13 (9.5%) | 1 (0.6%) |
| $30,000 to $34,999 | 3 (2.2%) | 70 (43.2%) |
| $35,000 to $39,999 | 0 (0.0%) | 6 (3.7%) |
| $40,000 to $44,999 | 32 (23.4%) | 10 (6.2%) |
| $45,000 to $49,999 | 16 (11.7%) | 10 (6.2%) |
| $50,000 to $54,999 | 4 (2.9%) | 0 (0.0%) |
| $55,000 to $64,999 | 8 (5.8%) | 3 (1.8%) |
| $65,000 to $74,999 | 3 (2.2%) | 0 (0.0%) |
| $75,000 to $99,999 | 9 (6.6%) | 2 (1.2%) |
| $100,000+ | 2 (1.5%) | 6 (3.7%) |
| Total | 137 (100.0%) | 162 (100.0%) |
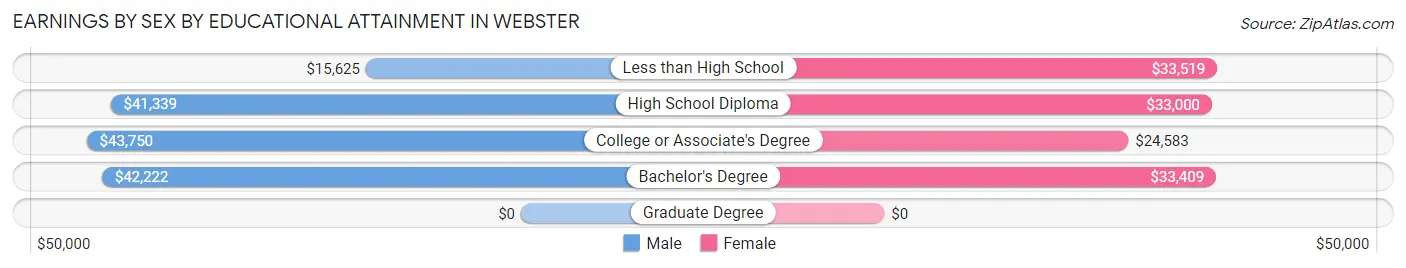
Earnings by Sex by Educational Attainment in Webster
Average earnings in Webster are $41,509 for men and $33,099 for women, a difference of 20.3%. Men with an educational attainment of college or associate's degree enjoy the highest average annual earnings of $43,750, while those with less than high school education earn the least with $15,625. Women with an educational attainment of less than high school earn the most with the average annual earnings of $33,519, while those with college or associate's degree education have the smallest earnings of $24,583.
| Educational Attainment | Male Income | Female Income |
| Less than High School | $15,625 | $33,519 |
| High School Diploma | $41,339 | $33,000 |
| College or Associate's Degree | $43,750 | $24,583 |
| Bachelor's Degree | $42,222 | $33,409 |
| Graduate Degree | - | - |
| Total | $41,509 | $33,099 |
Family Income in Webster
Family Income Brackets in Webster
According to the Webster family income data, there are 36 families falling into the $25,000 to $34,999 income range, which is the most common income bracket and makes up 25.0% of all families.
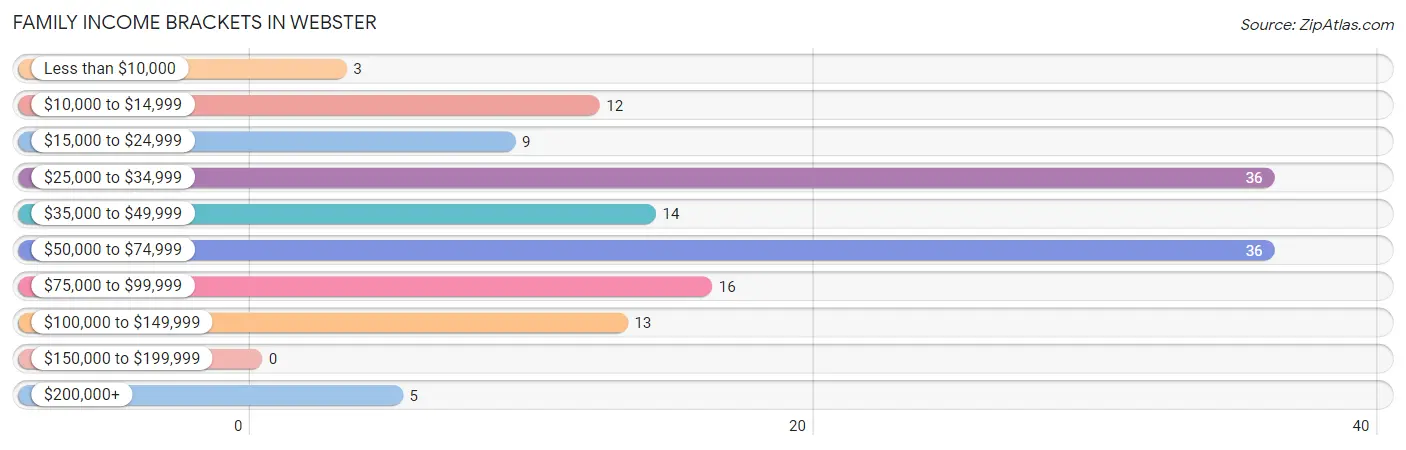
| Income Bracket | # Families | % Families |
| Less than $10,000 | 3 | 2.1% |
| $10,000 to $14,999 | 12 | 8.3% |
| $15,000 to $24,999 | 9 | 6.3% |
| $25,000 to $34,999 | 36 | 25.0% |
| $35,000 to $49,999 | 14 | 9.7% |
| $50,000 to $74,999 | 36 | 25.0% |
| $75,000 to $99,999 | 16 | 11.1% |
| $100,000 to $149,999 | 13 | 9.0% |
| $150,000 to $199,999 | 0 | 0.0% |
| $200,000+ | 5 | 3.5% |
Family Income by Famaliy Size in Webster
4-person families (13 | 9.0%) account for the highest median family income in Webster with $83,750 per family, while 2-person families (77 | 53.5%) have the highest median income of $27,188 per family member.
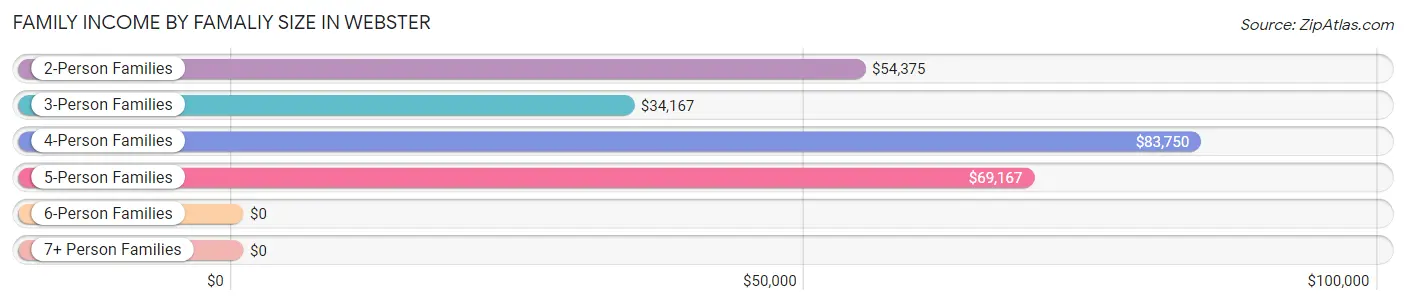
| Income Bracket | # Families | Median Income |
| 2-Person Families | 77 (53.5%) | $54,375 |
| 3-Person Families | 42 (29.2%) | $34,167 |
| 4-Person Families | 13 (9.0%) | $83,750 |
| 5-Person Families | 10 (6.9%) | $69,167 |
| 6-Person Families | 0 (0.0%) | $0 |
| 7+ Person Families | 2 (1.4%) | $0 |
| Total | 144 (100.0%) | $42,143 |
Family Income by Number of Earners in Webster
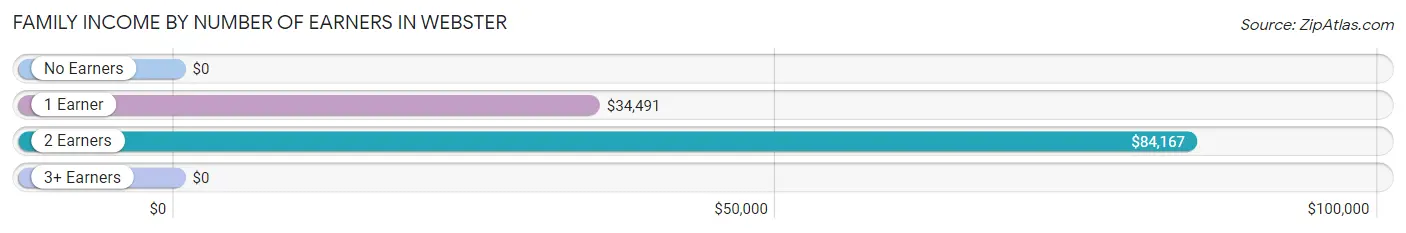
| Number of Earners | # Families | Median Income |
| No Earners | 25 (17.4%) | $0 |
| 1 Earner | 69 (47.9%) | $34,491 |
| 2 Earners | 50 (34.7%) | $84,167 |
| 3+ Earners | 0 (0.0%) | $0 |
| Total | 144 (100.0%) | $42,143 |
Household Income in Webster
Household Income Brackets in Webster
With 57 households falling in the category, the $35,000 to $49,999 income range is the most frequent in Webster, accounting for 19.1% of all households. In contrast, only 5 households (1.7%) fall into the $200,000+ income bracket, making it the least populous group.
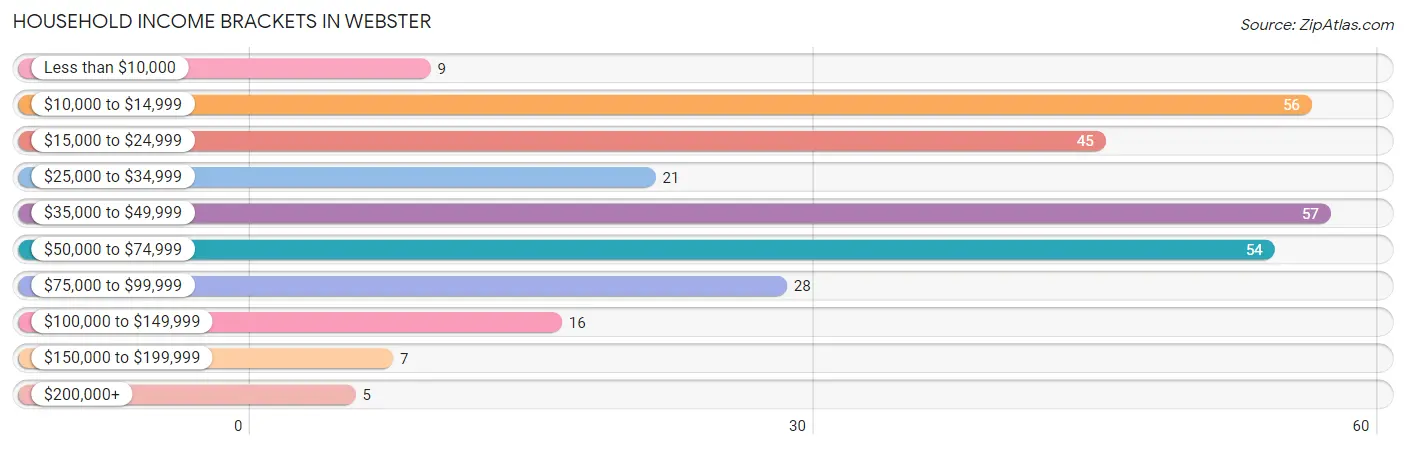
| Income Bracket | # Households | % Households |
| Less than $10,000 | 9 | 3.0% |
| $10,000 to $14,999 | 56 | 18.8% |
| $15,000 to $24,999 | 45 | 15.1% |
| $25,000 to $34,999 | 21 | 7.0% |
| $35,000 to $49,999 | 57 | 19.1% |
| $50,000 to $74,999 | 54 | 18.1% |
| $75,000 to $99,999 | 28 | 9.4% |
| $100,000 to $149,999 | 16 | 5.4% |
| $150,000 to $199,999 | 7 | 2.3% |
| $200,000+ | 5 | 1.7% |
Household Income by Householder Age in Webster
The median household income in Webster is $40,938, with the highest median household income of $44,491 found in the 25 to 44 years age bracket for the primary householder. A total of 81 households (27.2%) fall into this category. Meanwhile, the 15 to 24 years age bracket for the primary householder has the lowest median household income of $0, with 7 households (2.4%) in this group.
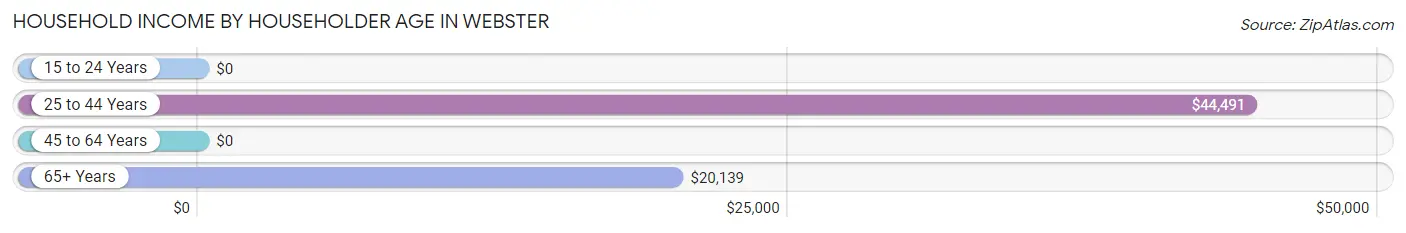
| Income Bracket | # Households | Median Income |
| 15 to 24 Years | 7 (2.4%) | $0 |
| 25 to 44 Years | 81 (27.2%) | $44,491 |
| 45 to 64 Years | 101 (33.9%) | $0 |
| 65+ Years | 109 (36.6%) | $20,139 |
| Total | 298 (100.0%) | $40,938 |
Poverty in Webster
Income Below Poverty by Sex and Age in Webster
With 19.1% poverty level for males and 19.9% for females among the residents of Webster, 18 to 24 year old males and 16 and 17 year old females are the most vulnerable to poverty, with 28 males (62.2%) and 4 females (100.0%) in their respective age groups living below the poverty level.
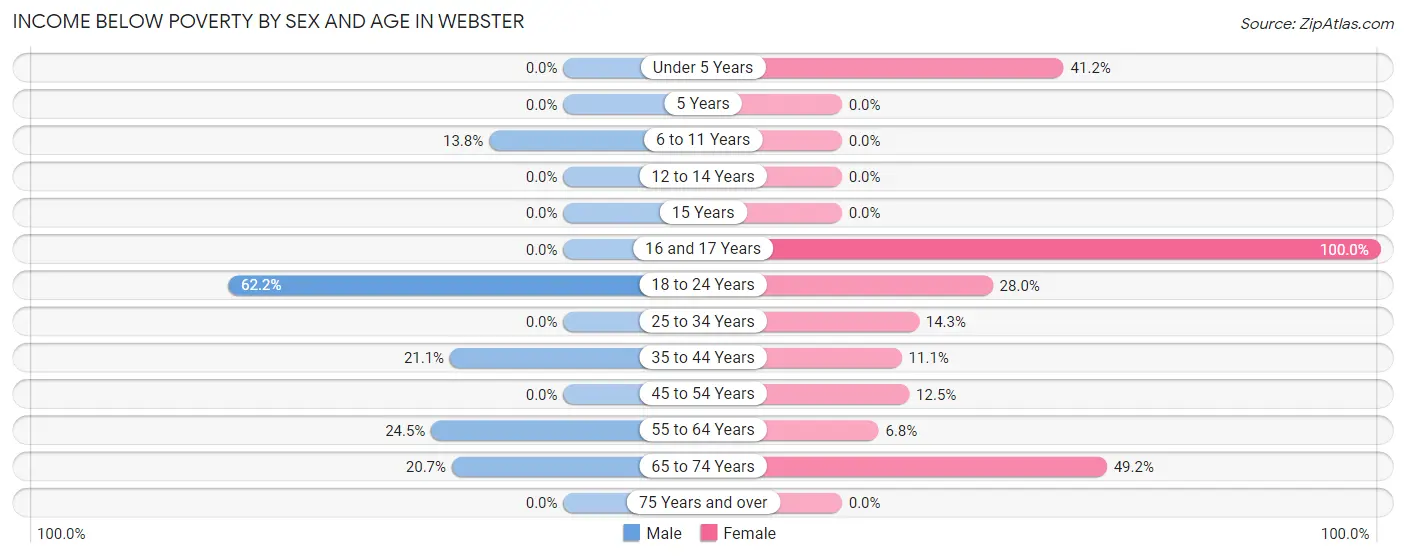
| Age Bracket | Male | Female |
| Under 5 Years | 0 (0.0%) | 14 (41.2%) |
| 5 Years | 0 (0.0%) | 0 (0.0%) |
| 6 to 11 Years | 4 (13.8%) | 0 (0.0%) |
| 12 to 14 Years | 0 (0.0%) | 0 (0.0%) |
| 15 Years | 0 (0.0%) | 0 (0.0%) |
| 16 and 17 Years | 0 (0.0%) | 4 (100.0%) |
| 18 to 24 Years | 28 (62.2%) | 7 (28.0%) |
| 25 to 34 Years | 0 (0.0%) | 8 (14.3%) |
| 35 to 44 Years | 4 (21.0%) | 3 (11.1%) |
| 45 to 54 Years | 0 (0.0%) | 5 (12.5%) |
| 55 to 64 Years | 13 (24.5%) | 3 (6.8%) |
| 65 to 74 Years | 6 (20.7%) | 30 (49.2%) |
| 75 Years and over | 0 (0.0%) | 0 (0.0%) |
| Total | 55 (19.1%) | 74 (19.9%) |
Income Above Poverty by Sex and Age in Webster
According to the poverty statistics in Webster, males aged under 5 years and females aged 5 years are the age groups that are most secure financially, with 100.0% of males and 100.0% of females in these age groups living above the poverty line.
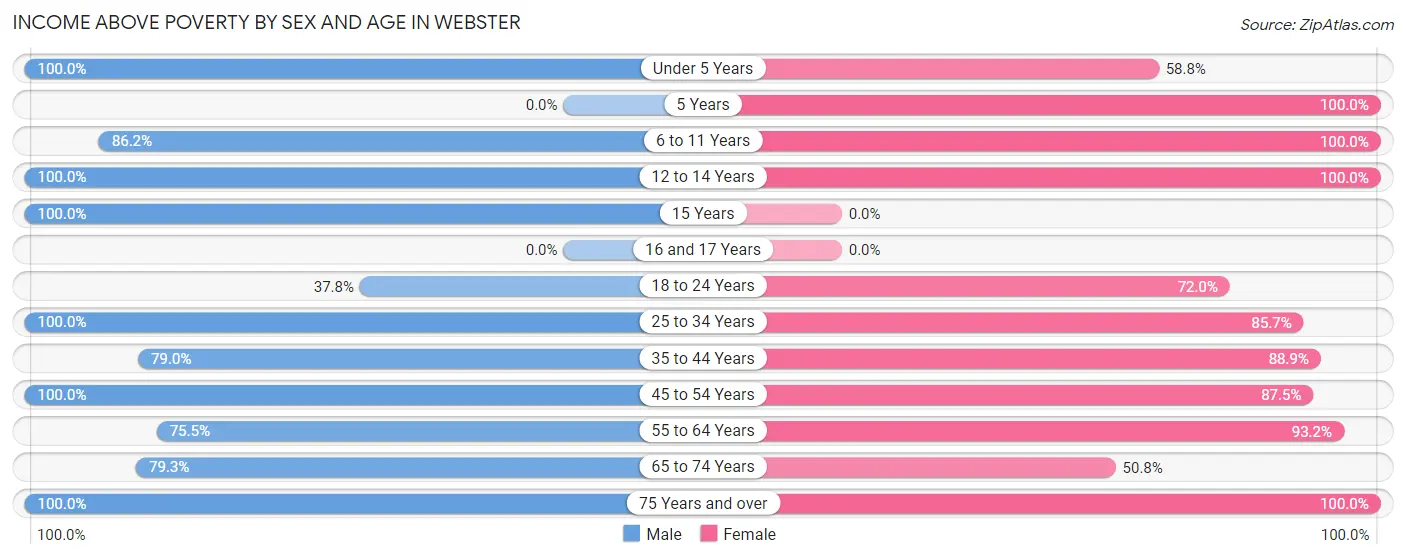
| Age Bracket | Male | Female |
| Under 5 Years | 13 (100.0%) | 20 (58.8%) |
| 5 Years | 0 (0.0%) | 23 (100.0%) |
| 6 to 11 Years | 25 (86.2%) | 21 (100.0%) |
| 12 to 14 Years | 16 (100.0%) | 7 (100.0%) |
| 15 Years | 3 (100.0%) | 0 (0.0%) |
| 16 and 17 Years | 0 (0.0%) | 0 (0.0%) |
| 18 to 24 Years | 17 (37.8%) | 18 (72.0%) |
| 25 to 34 Years | 28 (100.0%) | 48 (85.7%) |
| 35 to 44 Years | 15 (78.9%) | 24 (88.9%) |
| 45 to 54 Years | 36 (100.0%) | 35 (87.5%) |
| 55 to 64 Years | 40 (75.5%) | 41 (93.2%) |
| 65 to 74 Years | 23 (79.3%) | 31 (50.8%) |
| 75 Years and over | 17 (100.0%) | 30 (100.0%) |
| Total | 233 (80.9%) | 298 (80.1%) |
Income Below Poverty Among Married-Couple Families in Webster
The poverty statistics for married-couple families in Webster show that 6.2% or 5 of the total 80 families live below the poverty line. Families with 1 or 2 children have the highest poverty rate of 16.7%, comprising of 3 families. On the other hand, families with 3 or 4 children have the lowest poverty rate of 0.0%, which includes 0 families.
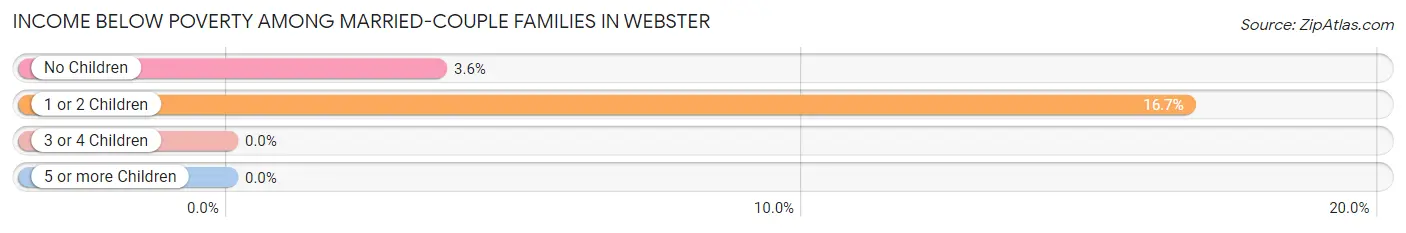
| Children | Above Poverty | Below Poverty |
| No Children | 53 (96.4%) | 2 (3.6%) |
| 1 or 2 Children | 15 (83.3%) | 3 (16.7%) |
| 3 or 4 Children | 5 (100.0%) | 0 (0.0%) |
| 5 or more Children | 2 (100.0%) | 0 (0.0%) |
| Total | 75 (93.8%) | 5 (6.2%) |
Income Below Poverty Among Single-Parent Households in Webster
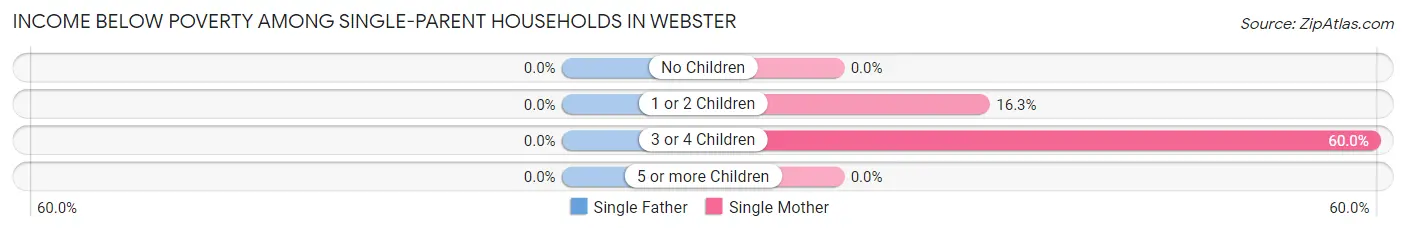
| Children | Single Father | Single Mother |
| No Children | 0 (0.0%) | 0 (0.0%) |
| 1 or 2 Children | 0 (0.0%) | 7 (16.3%) |
| 3 or 4 Children | 0 (0.0%) | 3 (60.0%) |
| 5 or more Children | 0 (0.0%) | 0 (0.0%) |
| Total | 0 (0.0%) | 10 (19.6%) |
Income Below Poverty Among Married-Couple vs Single-Parent Households in Webster
The poverty data for Webster shows that 5 of the married-couple family households (6.2%) and 10 of the single-parent households (15.6%) are living below the poverty level. Within the married-couple family households, those with 1 or 2 children have the highest poverty rate, with 3 households (16.7%) falling below the poverty line. Among the single-parent households, those with 3 or 4 children have the highest poverty rate, with 3 household (42.9%) living below poverty.
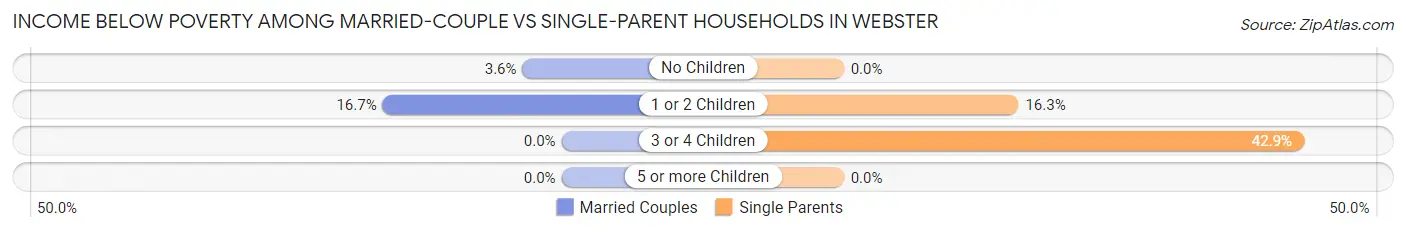
| Children | Married-Couple Families | Single-Parent Households |
| No Children | 2 (3.6%) | 0 (0.0%) |
| 1 or 2 Children | 3 (16.7%) | 7 (16.3%) |
| 3 or 4 Children | 0 (0.0%) | 3 (42.9%) |
| 5 or more Children | 0 (0.0%) | 0 (0.0%) |
| Total | 5 (6.2%) | 10 (15.6%) |
Race in Webster
The most populous races in Webster are White / Caucasian (597 | 89.8%), Native / Alaskan (34 | 5.1%), and Black / African American (19 | 2.9%).
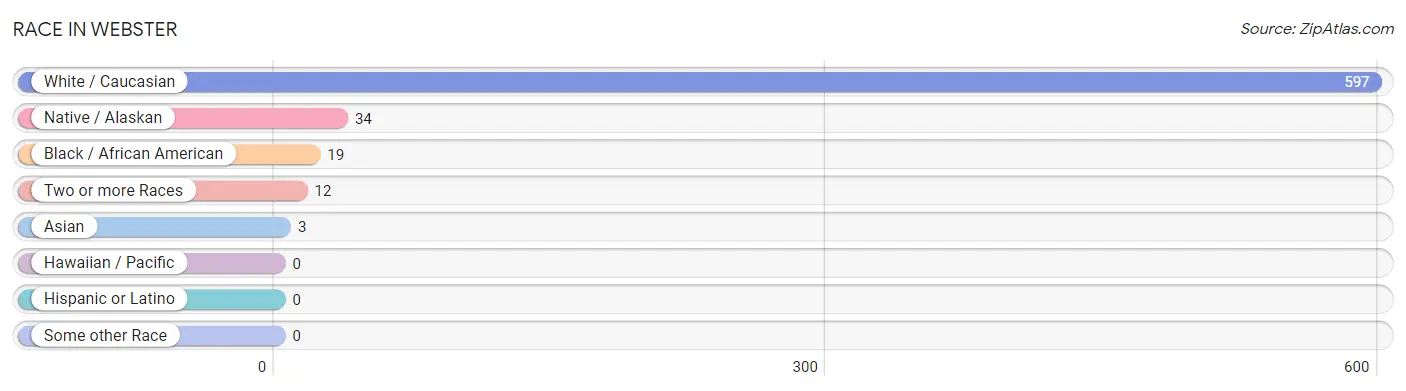
| Race | # Population | % Population |
| Asian | 3 | 0.4% |
| Black / African American | 19 | 2.9% |
| Hawaiian / Pacific | 0 | 0.0% |
| Hispanic or Latino | 0 | 0.0% |
| Native / Alaskan | 34 | 5.1% |
| White / Caucasian | 597 | 89.8% |
| Two or more Races | 12 | 1.8% |
| Some other Race | 0 | 0.0% |
| Total | 665 | 100.0% |
Ancestry in Webster
The most populous ancestries reported in Webster are German (196 | 29.5%), American (115 | 17.3%), Norwegian (105 | 15.8%), English (62 | 9.3%), and Irish (53 | 8.0%), together accounting for 79.8% of all Webster residents.
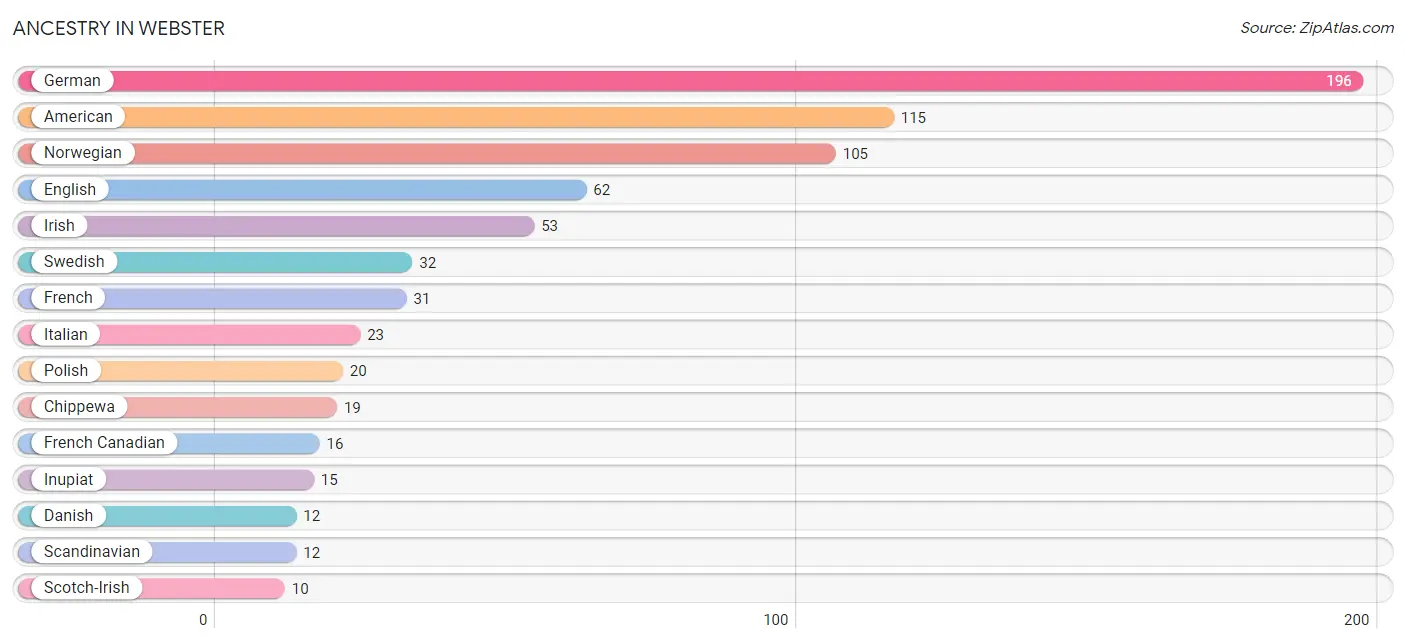
| Ancestry | # Population | % Population |
| American | 115 | 17.3% |
| Arab | 1 | 0.2% |
| British | 2 | 0.3% |
| Chippewa | 19 | 2.9% |
| Czech | 7 | 1.1% |
| Danish | 12 | 1.8% |
| Eastern European | 2 | 0.3% |
| English | 62 | 9.3% |
| French | 31 | 4.7% |
| French Canadian | 16 | 2.4% |
| German | 196 | 29.5% |
| Inupiat | 15 | 2.3% |
| Irish | 53 | 8.0% |
| Italian | 23 | 3.5% |
| Lebanese | 1 | 0.2% |
| Northern European | 2 | 0.3% |
| Norwegian | 105 | 15.8% |
| Polish | 20 | 3.0% |
| Russian | 4 | 0.6% |
| Scandinavian | 12 | 1.8% |
| Scotch-Irish | 10 | 1.5% |
| Scottish | 4 | 0.6% |
| Swedish | 32 | 4.8% | View All 23 Rows |
Immigrants in Webster
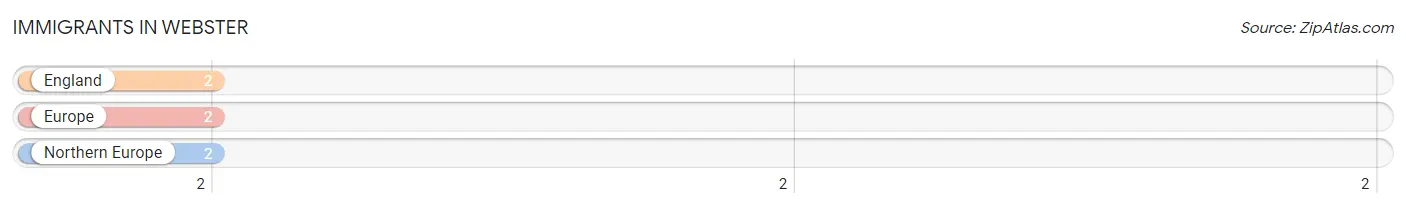
The most numerous immigrant groups reported in Webster came from England (2 | 0.3%), Europe (2 | 0.3%), and Northern Europe (2 | 0.3%), together accounting for 0.9% of all Webster residents.
| Immigration Origin | # Population | % Population |
| England | 2 | 0.3% |
| Europe | 2 | 0.3% |
| Northern Europe | 2 | 0.3% | View All 3 Rows |
Sex and Age in Webster
Sex and Age in Webster
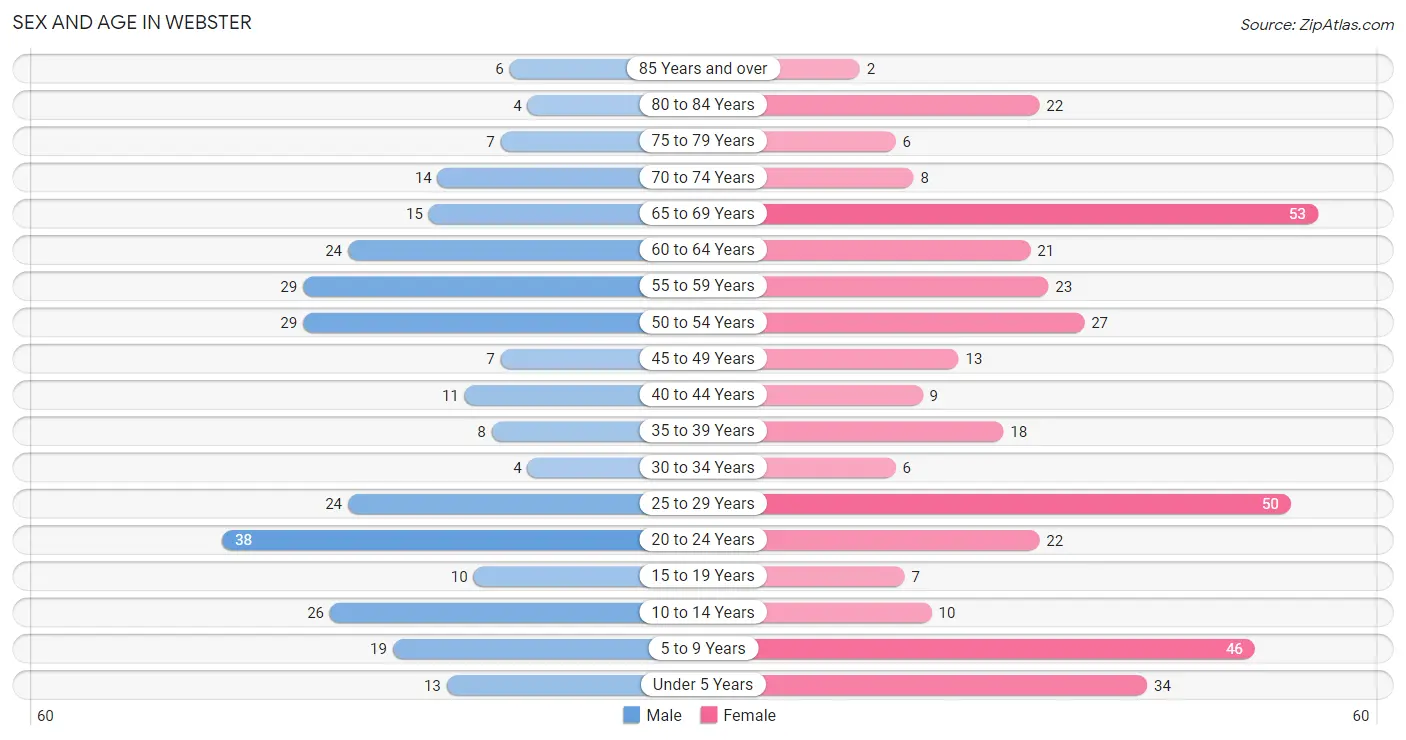
The most populous age groups in Webster are 20 to 24 Years (38 | 13.2%) for men and 65 to 69 Years (53 | 14.1%) for women.
| Age Bracket | Male | Female |
| Under 5 Years | 13 (4.5%) | 34 (9.0%) |
| 5 to 9 Years | 19 (6.6%) | 46 (12.2%) |
| 10 to 14 Years | 26 (9.0%) | 10 (2.6%) |
| 15 to 19 Years | 10 (3.5%) | 7 (1.9%) |
| 20 to 24 Years | 38 (13.2%) | 22 (5.8%) |
| 25 to 29 Years | 24 (8.3%) | 50 (13.3%) |
| 30 to 34 Years | 4 (1.4%) | 6 (1.6%) |
| 35 to 39 Years | 8 (2.8%) | 18 (4.8%) |
| 40 to 44 Years | 11 (3.8%) | 9 (2.4%) |
| 45 to 49 Years | 7 (2.4%) | 13 (3.5%) |
| 50 to 54 Years | 29 (10.1%) | 27 (7.2%) |
| 55 to 59 Years | 29 (10.1%) | 23 (6.1%) |
| 60 to 64 Years | 24 (8.3%) | 21 (5.6%) |
| 65 to 69 Years | 15 (5.2%) | 53 (14.1%) |
| 70 to 74 Years | 14 (4.9%) | 8 (2.1%) |
| 75 to 79 Years | 7 (2.4%) | 6 (1.6%) |
| 80 to 84 Years | 4 (1.4%) | 22 (5.8%) |
| 85 Years and over | 6 (2.1%) | 2 (0.5%) |
| Total | 288 (100.0%) | 377 (100.0%) |
Families and Households in Webster
Median Family Size in Webster
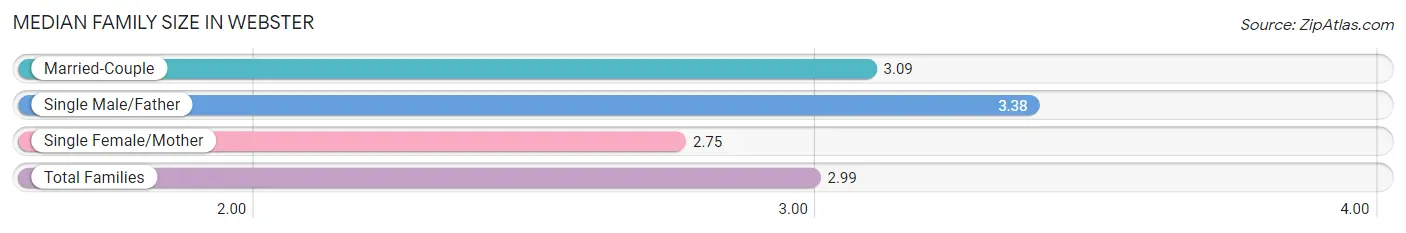
The median family size in Webster is 2.99 persons per family, with single male/father families (13 | 9.0%) accounting for the largest median family size of 3.38 persons per family. On the other hand, single female/mother families (51 | 35.4%) represent the smallest median family size with 2.75 persons per family.
| Family Type | # Families | Family Size |
| Married-Couple | 80 (55.6%) | 3.09 |
| Single Male/Father | 13 (9.0%) | 3.38 |
| Single Female/Mother | 51 (35.4%) | 2.75 |
| Total Families | 144 (100.0%) | 2.99 |
Median Household Size in Webster
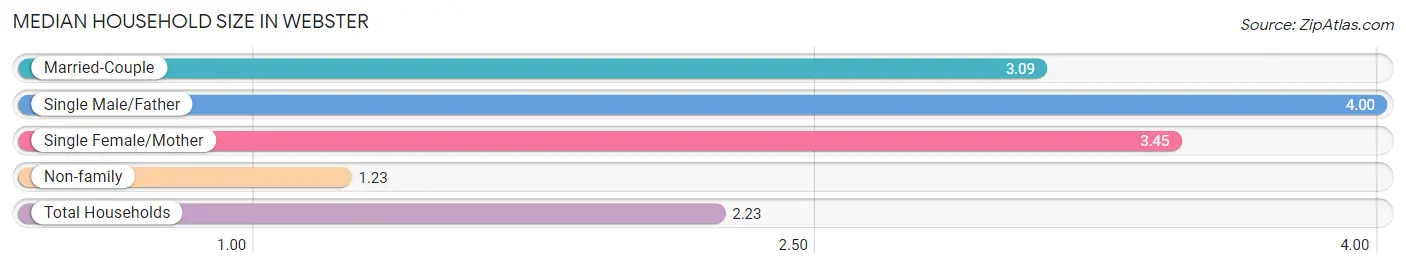
The median household size in Webster is 2.23 persons per household, with single male/father households (13 | 4.4%) accounting for the largest median household size of 4 persons per household. non-family households (154 | 51.7%) represent the smallest median household size with 1.23 persons per household.
| Household Type | # Households | Household Size |
| Married-Couple | 80 (26.9%) | 3.09 |
| Single Male/Father | 13 (4.4%) | 4.00 |
| Single Female/Mother | 51 (17.1%) | 3.45 |
| Non-family | 154 (51.7%) | 1.23 |
| Total Households | 298 (100.0%) | 2.23 |
Household Size by Marriage Status in Webster
Out of a total of 298 households in Webster, 144 (48.3%) are family households, while 154 (51.7%) are nonfamily households. The most numerous type of family households are 2-person households, comprising 65, and the most common type of nonfamily households are 1-person households, comprising 127.
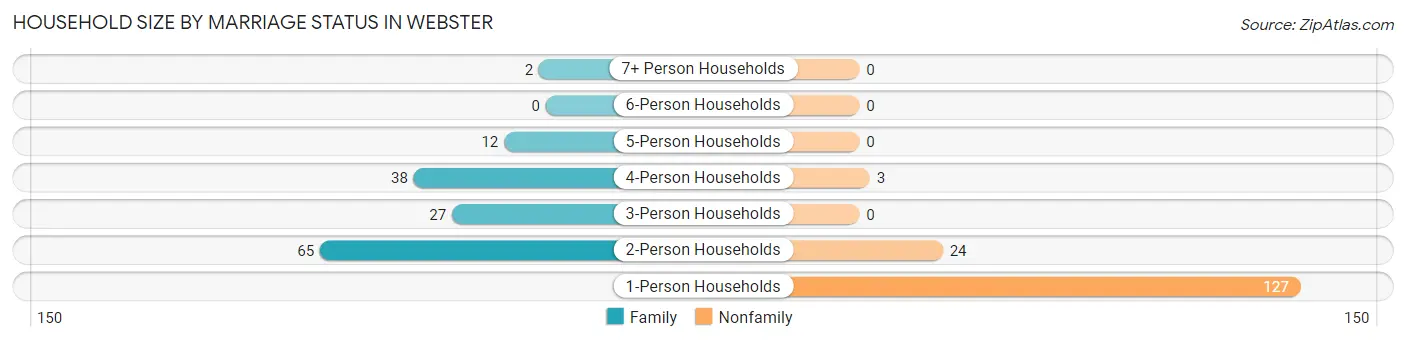
| Household Size | Family Households | Nonfamily Households |
| 1-Person Households | - | 127 (42.6%) |
| 2-Person Households | 65 (21.8%) | 24 (8.1%) |
| 3-Person Households | 27 (9.1%) | 0 (0.0%) |
| 4-Person Households | 38 (12.8%) | 3 (1.0%) |
| 5-Person Households | 12 (4.0%) | 0 (0.0%) |
| 6-Person Households | 0 (0.0%) | 0 (0.0%) |
| 7+ Person Households | 2 (0.7%) | 0 (0.0%) |
| Total | 144 (48.3%) | 154 (51.7%) |
Female Fertility in Webster
Fertility by Age in Webster
Average fertility rate in Webster is 55.0 births per 1,000 women. Women in the age bracket of 20 to 34 years have the highest fertility rate with 90.0 births per 1,000 women. Women in the age bracket of 20 to 34 years acount for 100.0% of all women with births.
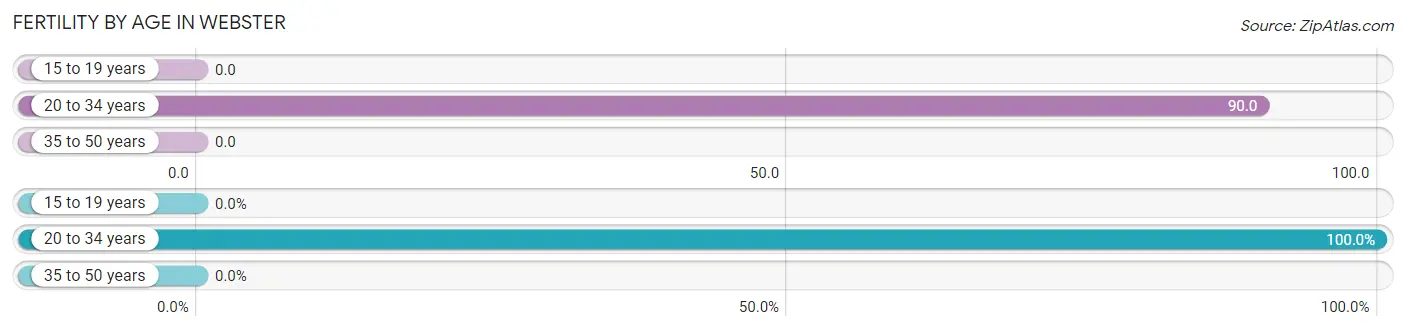
| Age Bracket | Women with Births | Births / 1,000 Women |
| 15 to 19 years | 0 (0.0%) | 0.0 |
| 20 to 34 years | 7 (100.0%) | 90.0 |
| 35 to 50 years | 0 (0.0%) | 0.0 |
| Total | 7 (100.0%) | 55.0 |
Fertility by Age by Marriage Status in Webster
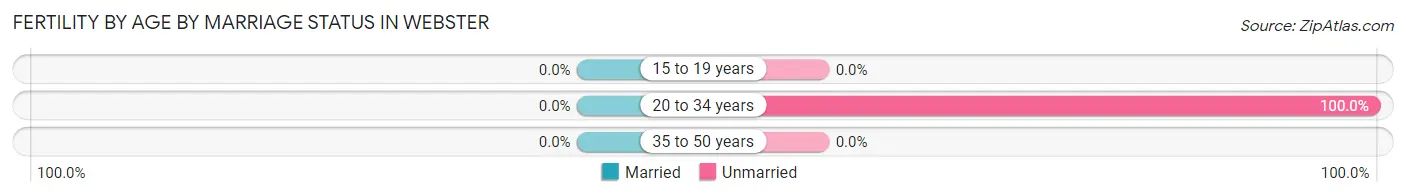
| Age Bracket | Married | Unmarried |
| 15 to 19 years | 0 (0.0%) | 0 (0.0%) |
| 20 to 34 years | 0 (0.0%) | 7 (100.0%) |
| 35 to 50 years | 0 (0.0%) | 0 (0.0%) |
| Total | 0 (0.0%) | 7 (100.0%) |
Fertility by Education in Webster
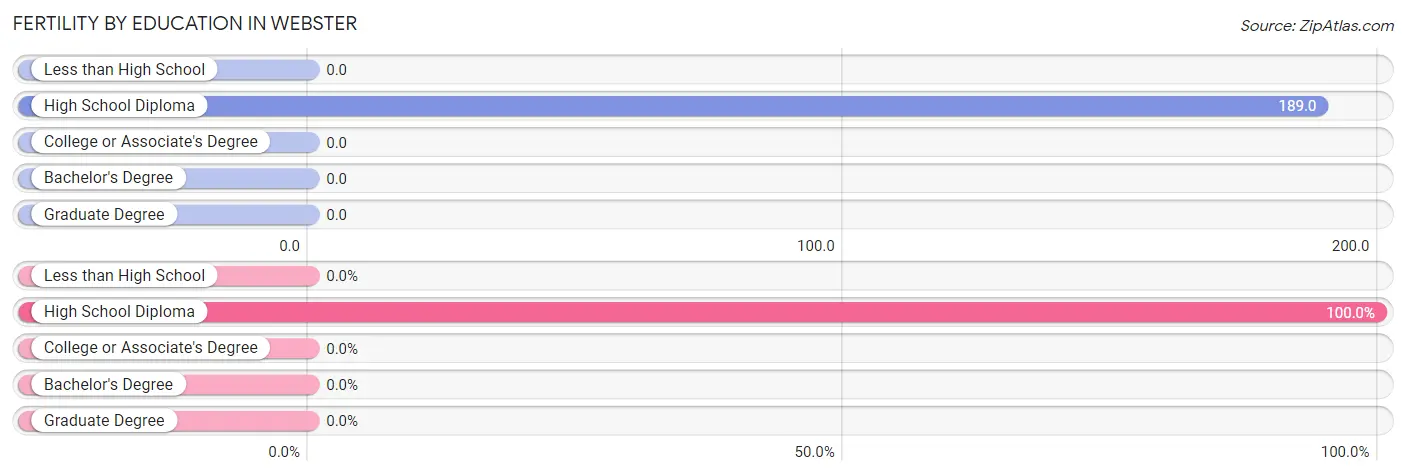
| Educational Attainment | Women with Births | Births / 1,000 Women |
| Less than High School | 0 (0.0%) | 0.0 |
| High School Diploma | 7 (100.0%) | 189.0 |
| College or Associate's Degree | 0 (0.0%) | 0.0 |
| Bachelor's Degree | 0 (0.0%) | 0.0 |
| Graduate Degree | 0 (0.0%) | 0.0 |
| Total | 7 (100.0%) | 55.0 |
Fertility by Education by Marriage Status in Webster
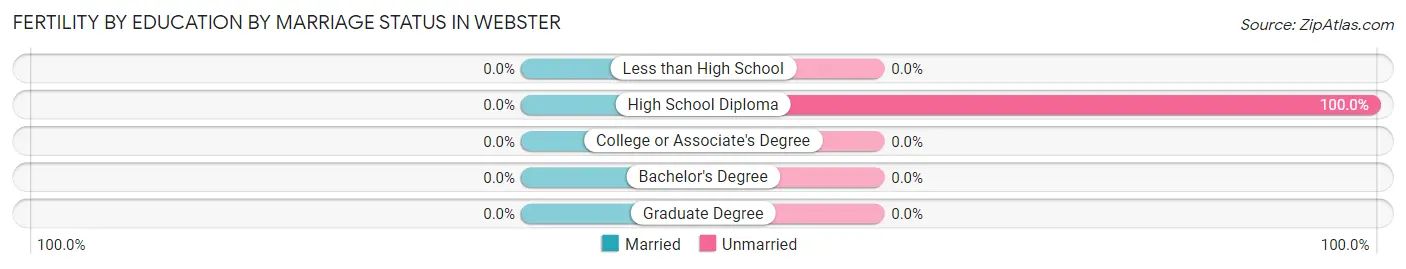
| Educational Attainment | Married | Unmarried |
| Less than High School | 0 (0.0%) | 0 (0.0%) |
| High School Diploma | 0 (0.0%) | 7 (100.0%) |
| College or Associate's Degree | 0 (0.0%) | 0 (0.0%) |
| Bachelor's Degree | 0 (0.0%) | 0 (0.0%) |
| Graduate Degree | 0 (0.0%) | 0 (0.0%) |
| Total | 0 (0.0%) | 7 (100.0%) |
Employment Characteristics in Webster
Employment by Class of Employer in Webster
Among the 279 employed individuals in Webster, private company employees (162 | 58.1%), not-for-profit organizations (67 | 24.0%), and local government employees (23 | 8.2%) make up the most common classes of employment.
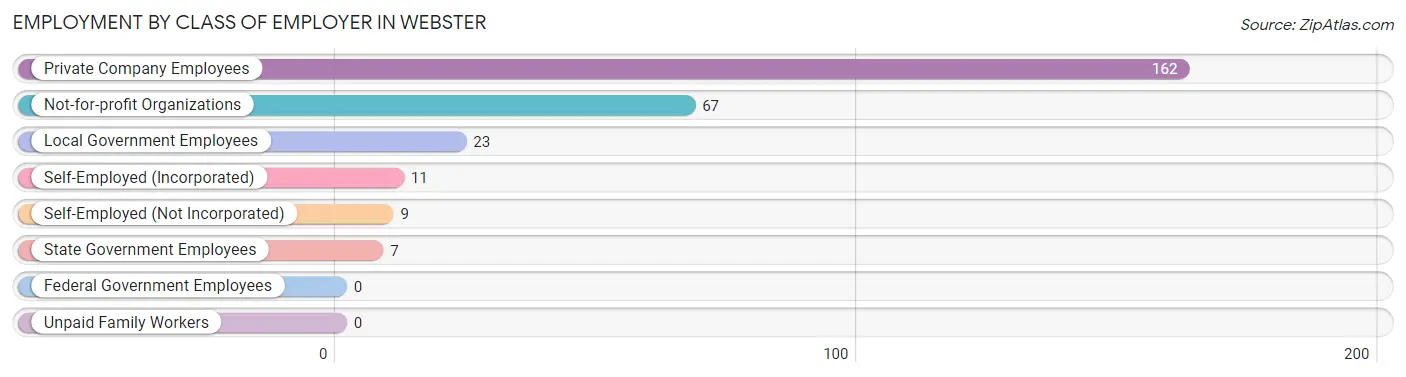
| Employer Class | # Employees | % Employees |
| Private Company Employees | 162 | 58.1% |
| Self-Employed (Incorporated) | 11 | 3.9% |
| Self-Employed (Not Incorporated) | 9 | 3.2% |
| Not-for-profit Organizations | 67 | 24.0% |
| Local Government Employees | 23 | 8.2% |
| State Government Employees | 7 | 2.5% |
| Federal Government Employees | 0 | 0.0% |
| Unpaid Family Workers | 0 | 0.0% |
| Total | 279 | 100.0% |
Employment Status by Age in Webster
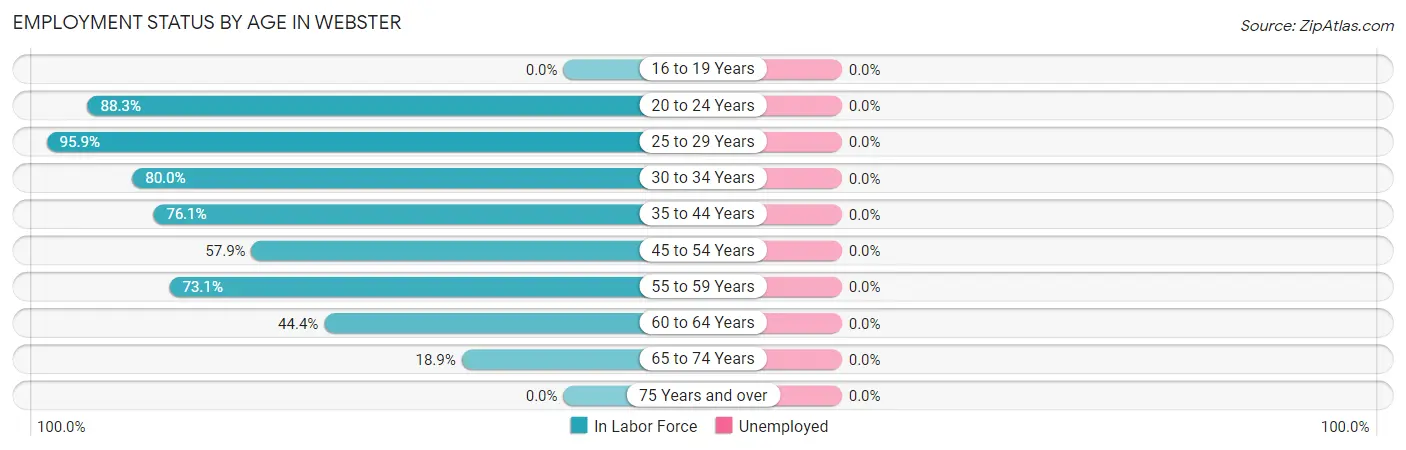
| Age Bracket | In Labor Force | Unemployed |
| 16 to 19 Years | 0 (0.0%) | 0 (0.0%) |
| 20 to 24 Years | 53 (88.3%) | 0 (0.0%) |
| 25 to 29 Years | 71 (95.9%) | 0 (0.0%) |
| 30 to 34 Years | 8 (80.0%) | 0 (0.0%) |
| 35 to 44 Years | 35 (76.1%) | 0 (0.0%) |
| 45 to 54 Years | 44 (57.9%) | 0 (0.0%) |
| 55 to 59 Years | 38 (73.1%) | 0 (0.0%) |
| 60 to 64 Years | 20 (44.4%) | 0 (0.0%) |
| 65 to 74 Years | 17 (18.9%) | 0 (0.0%) |
| 75 Years and over | 0 (0.0%) | 0 (0.0%) |
| Total | 286 (55.6%) | 0 (0.0%) |
Employment Status by Educational Attainment in Webster
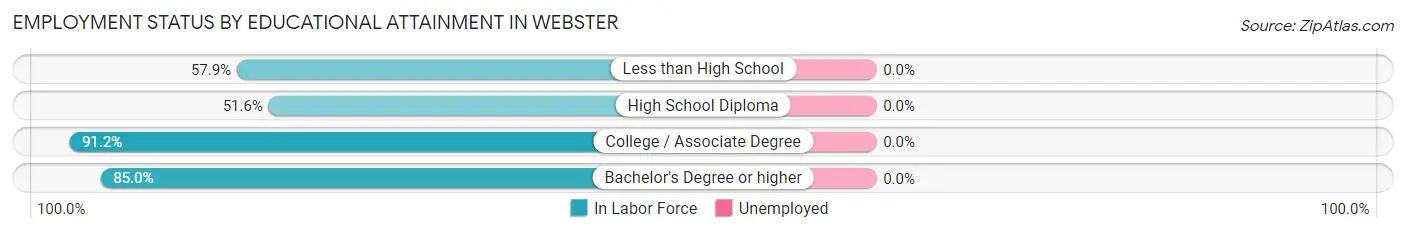
| Educational Attainment | In Labor Force | Unemployed |
| Less than High School | 33 (57.9%) | 0 (0.0%) |
| High School Diploma | 49 (51.6%) | 0 (0.0%) |
| College / Associate Degree | 83 (91.2%) | 0 (0.0%) |
| Bachelor's Degree or higher | 51 (85.0%) | 0 (0.0%) |
| Total | 216 (71.3%) | 0 (0.0%) |
Employment Occupations by Sex in Webster
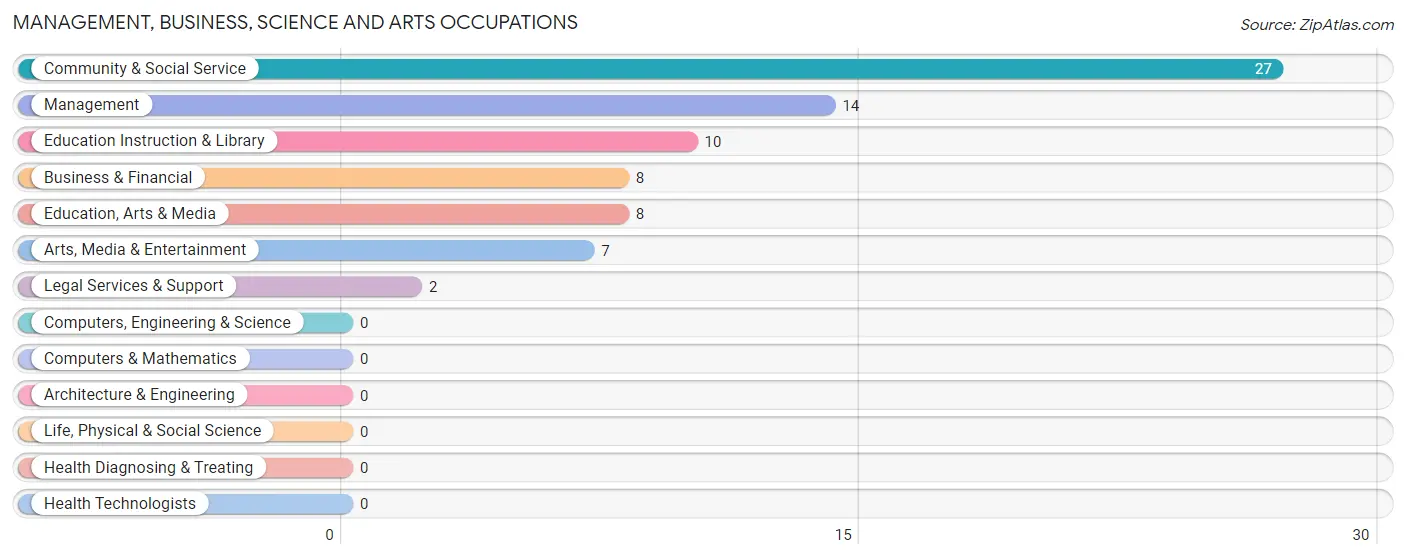
Management, Business, Science and Arts Occupations
The most common Management, Business, Science and Arts occupations in Webster are Community & Social Service (27 | 9.4%), Management (14 | 4.9%), Education Instruction & Library (10 | 3.5%), Business & Financial (8 | 2.8%), and Education, Arts & Media (8 | 2.8%).
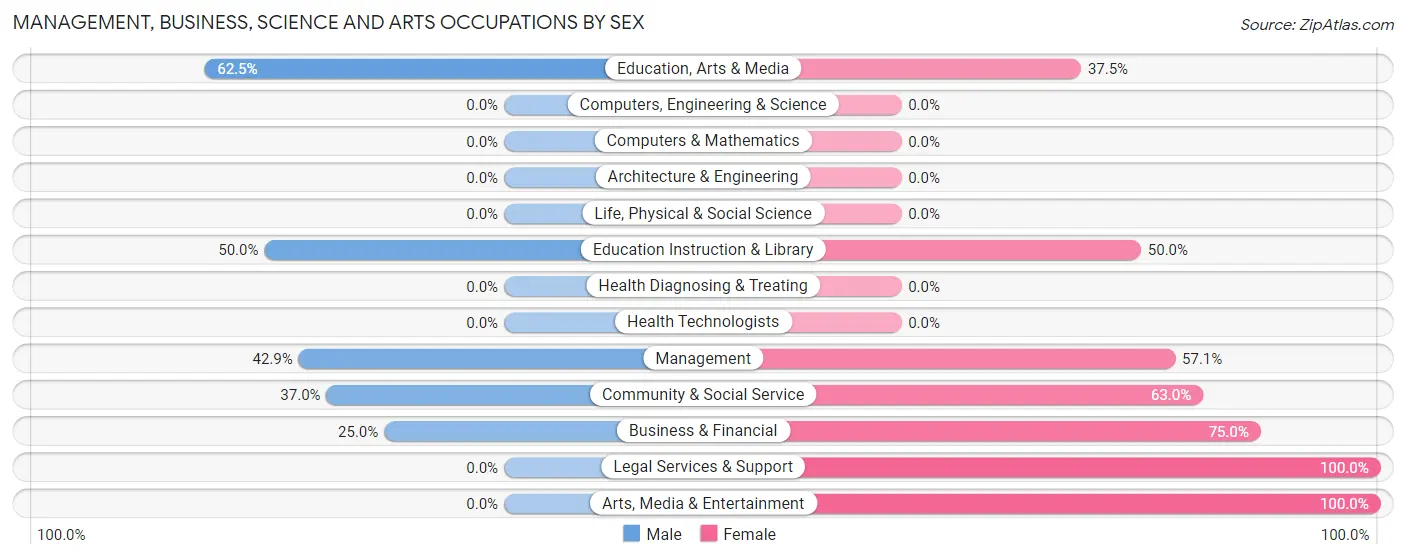
Management, Business, Science and Arts Occupations by Sex
Within the Management, Business, Science and Arts occupations in Webster, the most male-oriented occupations are Education, Arts & Media (62.5%), Education Instruction & Library (50.0%), and Management (42.9%), while the most female-oriented occupations are Legal Services & Support (100.0%), Arts, Media & Entertainment (100.0%), and Business & Financial (75.0%).
| Occupation | Male | Female |
| Management | 6 (42.9%) | 8 (57.1%) |
| Business & Financial | 2 (25.0%) | 6 (75.0%) |
| Computers, Engineering & Science | 0 (0.0%) | 0 (0.0%) |
| Computers & Mathematics | 0 (0.0%) | 0 (0.0%) |
| Architecture & Engineering | 0 (0.0%) | 0 (0.0%) |
| Life, Physical & Social Science | 0 (0.0%) | 0 (0.0%) |
| Community & Social Service | 10 (37.0%) | 17 (63.0%) |
| Education, Arts & Media | 5 (62.5%) | 3 (37.5%) |
| Legal Services & Support | 0 (0.0%) | 2 (100.0%) |
| Education Instruction & Library | 5 (50.0%) | 5 (50.0%) |
| Arts, Media & Entertainment | 0 (0.0%) | 7 (100.0%) |
| Health Diagnosing & Treating | 0 (0.0%) | 0 (0.0%) |
| Health Technologists | 0 (0.0%) | 0 (0.0%) |
| Total (Category) | 18 (36.7%) | 31 (63.3%) |
| Total (Overall) | 133 (46.5%) | 153 (53.5%) |
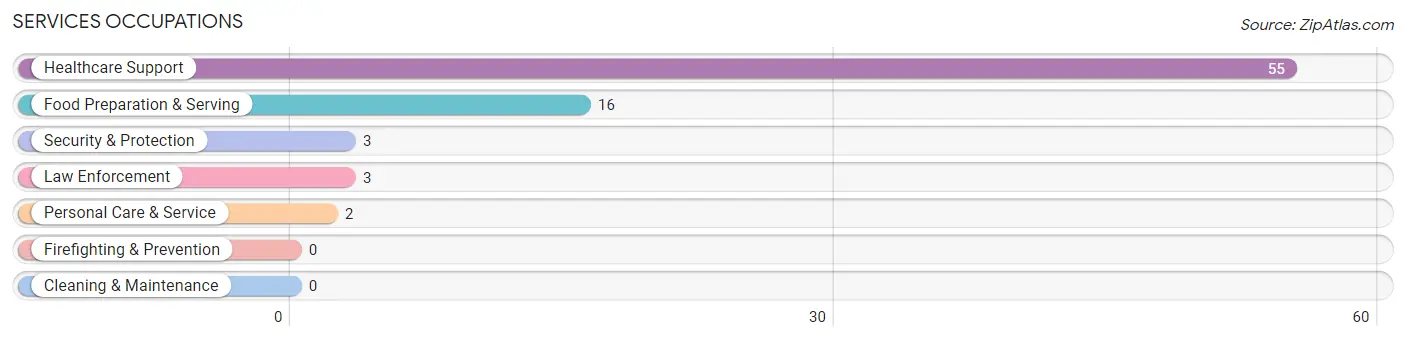
Services Occupations
The most common Services occupations in Webster are Healthcare Support (55 | 19.2%), Food Preparation & Serving (16 | 5.6%), Security & Protection (3 | 1.1%), Law Enforcement (3 | 1.1%), and Personal Care & Service (2 | 0.7%).
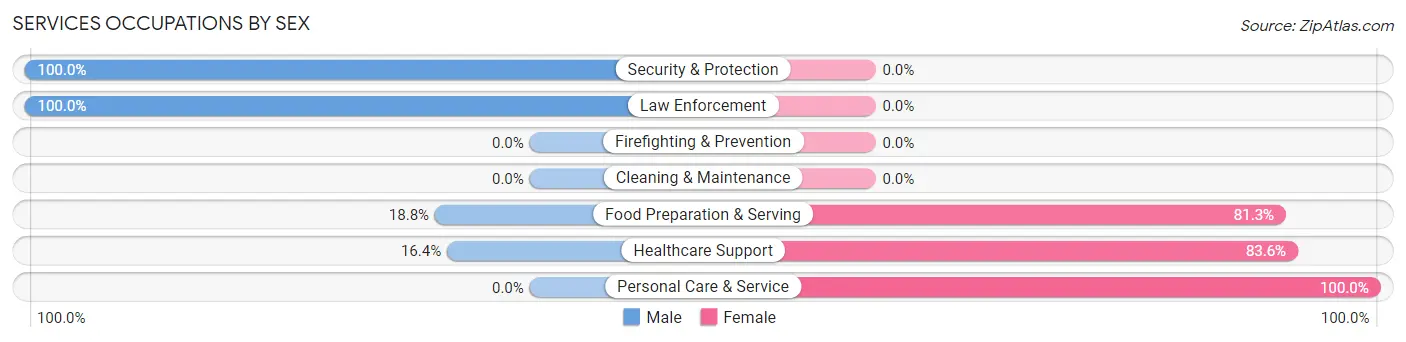
Services Occupations by Sex
Within the Services occupations in Webster, the most male-oriented occupations are Security & Protection (100.0%), Law Enforcement (100.0%), and Food Preparation & Serving (18.8%), while the most female-oriented occupations are Personal Care & Service (100.0%), Healthcare Support (83.6%), and Food Preparation & Serving (81.2%).
| Occupation | Male | Female |
| Healthcare Support | 9 (16.4%) | 46 (83.6%) |
| Security & Protection | 3 (100.0%) | 0 (0.0%) |
| Firefighting & Prevention | 0 (0.0%) | 0 (0.0%) |
| Law Enforcement | 3 (100.0%) | 0 (0.0%) |
| Food Preparation & Serving | 3 (18.8%) | 13 (81.2%) |
| Cleaning & Maintenance | 0 (0.0%) | 0 (0.0%) |
| Personal Care & Service | 0 (0.0%) | 2 (100.0%) |
| Total (Category) | 15 (19.7%) | 61 (80.3%) |
| Total (Overall) | 133 (46.5%) | 153 (53.5%) |
Sales and Office Occupations
The most common Sales and Office occupations in Webster are Office & Administration (47 | 16.4%), and Sales & Related (21 | 7.3%).
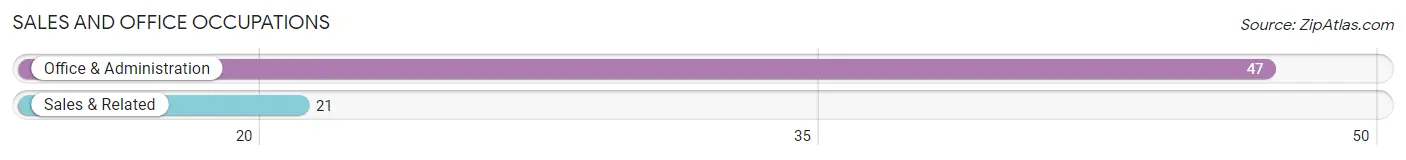
Sales and Office Occupations by Sex
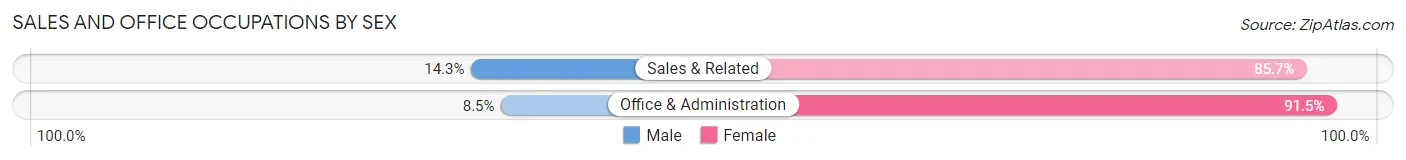
| Occupation | Male | Female |
| Sales & Related | 3 (14.3%) | 18 (85.7%) |
| Office & Administration | 4 (8.5%) | 43 (91.5%) |
| Total (Category) | 7 (10.3%) | 61 (89.7%) |
| Total (Overall) | 133 (46.5%) | 153 (53.5%) |
Natural Resources, Construction and Maintenance Occupations
The most common Natural Resources, Construction and Maintenance occupations in Webster are , and Installation, Maintenance & Repair (19 | 6.6%).
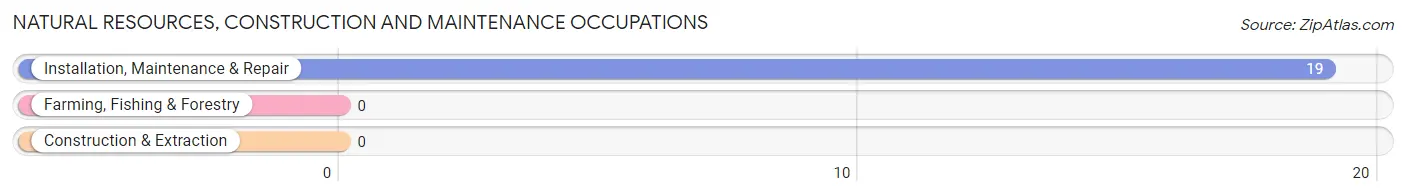
Natural Resources, Construction and Maintenance Occupations by Sex
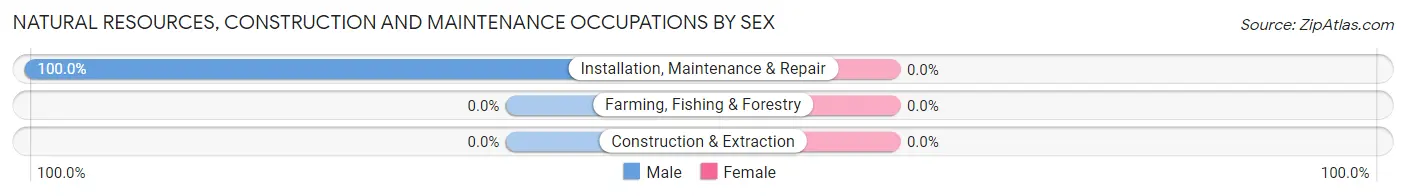
| Occupation | Male | Female |
| Farming, Fishing & Forestry | 0 (0.0%) | 0 (0.0%) |
| Construction & Extraction | 0 (0.0%) | 0 (0.0%) |
| Installation, Maintenance & Repair | 19 (100.0%) | 0 (0.0%) |
| Total (Category) | 19 (100.0%) | 0 (0.0%) |
| Total (Overall) | 133 (46.5%) | 153 (53.5%) |
Production, Transportation and Moving Occupations
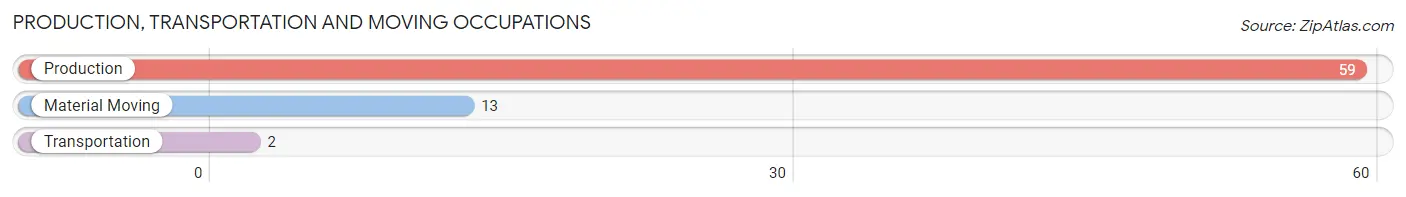
The most common Production, Transportation and Moving occupations in Webster are Production (59 | 20.6%), Material Moving (13 | 4.5%), and Transportation (2 | 0.7%).
Production, Transportation and Moving Occupations by Sex
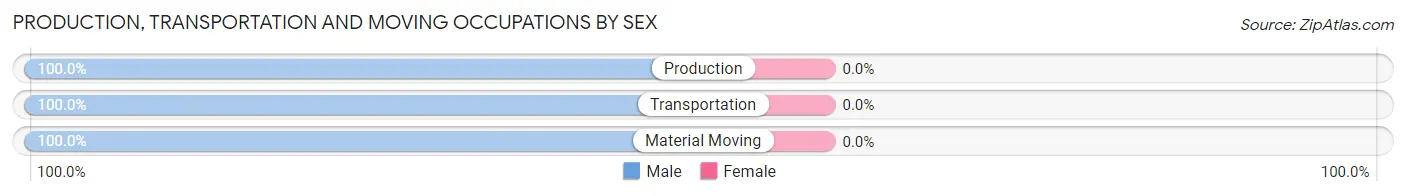
| Occupation | Male | Female |
| Production | 59 (100.0%) | 0 (0.0%) |
| Transportation | 2 (100.0%) | 0 (0.0%) |
| Material Moving | 13 (100.0%) | 0 (0.0%) |
| Total (Category) | 74 (100.0%) | 0 (0.0%) |
| Total (Overall) | 133 (46.5%) | 153 (53.5%) |
Employment Industries by Sex in Webster
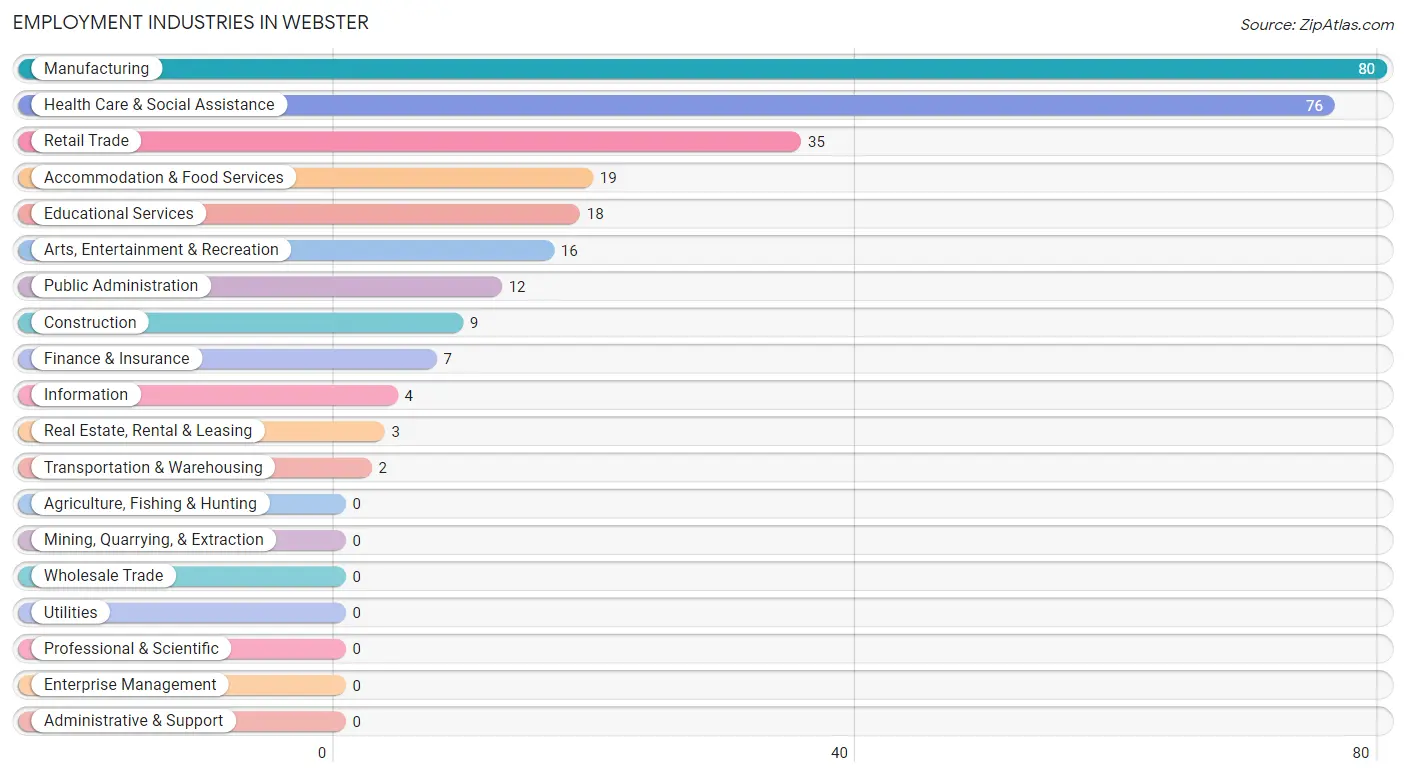
Employment Industries in Webster
The major employment industries in Webster include Manufacturing (80 | 28.0%), Health Care & Social Assistance (76 | 26.6%), Retail Trade (35 | 12.2%), Accommodation & Food Services (19 | 6.6%), and Educational Services (18 | 6.3%).
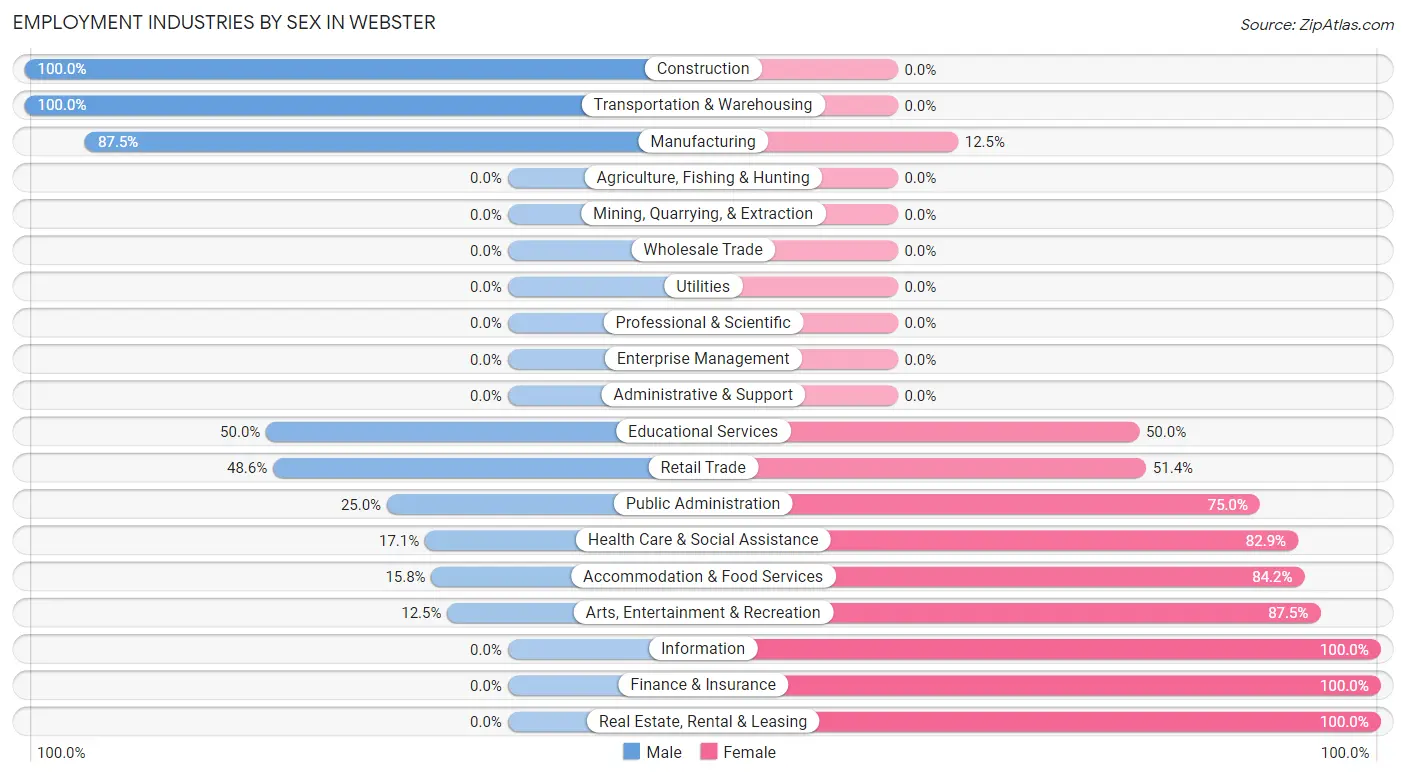
Employment Industries by Sex in Webster
The Webster industries that see more men than women are Construction (100.0%), Transportation & Warehousing (100.0%), and Manufacturing (87.5%), whereas the industries that tend to have a higher number of women are Information (100.0%), Finance & Insurance (100.0%), and Real Estate, Rental & Leasing (100.0%).
| Industry | Male | Female |
| Agriculture, Fishing & Hunting | 0 (0.0%) | 0 (0.0%) |
| Mining, Quarrying, & Extraction | 0 (0.0%) | 0 (0.0%) |
| Construction | 9 (100.0%) | 0 (0.0%) |
| Manufacturing | 70 (87.5%) | 10 (12.5%) |
| Wholesale Trade | 0 (0.0%) | 0 (0.0%) |
| Retail Trade | 17 (48.6%) | 18 (51.4%) |
| Transportation & Warehousing | 2 (100.0%) | 0 (0.0%) |
| Utilities | 0 (0.0%) | 0 (0.0%) |
| Information | 0 (0.0%) | 4 (100.0%) |
| Finance & Insurance | 0 (0.0%) | 7 (100.0%) |
| Real Estate, Rental & Leasing | 0 (0.0%) | 3 (100.0%) |
| Professional & Scientific | 0 (0.0%) | 0 (0.0%) |
| Enterprise Management | 0 (0.0%) | 0 (0.0%) |
| Administrative & Support | 0 (0.0%) | 0 (0.0%) |
| Educational Services | 9 (50.0%) | 9 (50.0%) |
| Health Care & Social Assistance | 13 (17.1%) | 63 (82.9%) |
| Arts, Entertainment & Recreation | 2 (12.5%) | 14 (87.5%) |
| Accommodation & Food Services | 3 (15.8%) | 16 (84.2%) |
| Public Administration | 3 (25.0%) | 9 (75.0%) |
| Total | 133 (46.5%) | 153 (53.5%) |
Education in Webster
School Enrollment in Webster
The most common levels of schooling among the 132 students in Webster are elementary school (37 | 28.0%), middle school (33 | 25.0%), and nursery / preschool (23 | 17.4%).
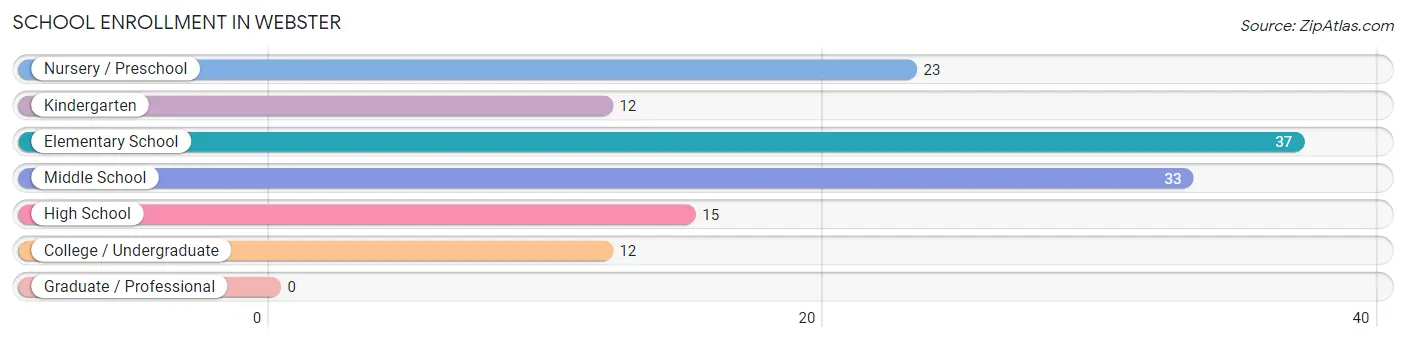
| School Level | # Students | % Students |
| Nursery / Preschool | 23 | 17.4% |
| Kindergarten | 12 | 9.1% |
| Elementary School | 37 | 28.0% |
| Middle School | 33 | 25.0% |
| High School | 15 | 11.4% |
| College / Undergraduate | 12 | 9.1% |
| Graduate / Professional | 0 | 0.0% |
| Total | 132 | 100.0% |
School Enrollment by Age by Funding Source in Webster
Out of a total of 132 students who are enrolled in schools in Webster, 19 (14.4%) attend a private institution, while the remaining 113 (85.6%) are enrolled in public schools. The age group of 35 years and over has the highest likelihood of being enrolled in private schools, with 5 (71.4% in the age bracket) enrolled. Conversely, the age group of 3 to 4 year olds has the lowest likelihood of being enrolled in a private school, with 4 (100.0% in the age bracket) attending a public institution.
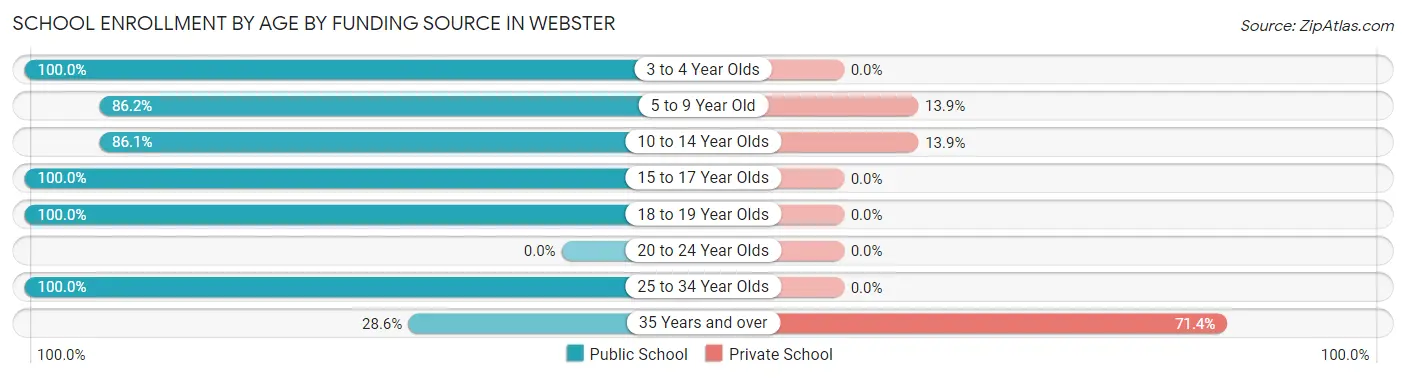
| Age Bracket | Public School | Private School |
| 3 to 4 Year Olds | 4 (100.0%) | 0 (0.0%) |
| 5 to 9 Year Old | 56 (86.2%) | 9 (13.9%) |
| 10 to 14 Year Olds | 31 (86.1%) | 5 (13.9%) |
| 15 to 17 Year Olds | 7 (100.0%) | 0 (0.0%) |
| 18 to 19 Year Olds | 10 (100.0%) | 0 (0.0%) |
| 20 to 24 Year Olds | 0 (0.0%) | 0 (0.0%) |
| 25 to 34 Year Olds | 3 (100.0%) | 0 (0.0%) |
| 35 Years and over | 2 (28.6%) | 5 (71.4%) |
| Total | 113 (85.6%) | 19 (14.4%) |
Educational Attainment by Field of Study in Webster
Business (18 | 19.8%), visual & performing arts (17 | 18.7%), communications (12 | 13.2%), education (11 | 12.1%), and bio, nature & agricultural (10 | 11.0%) are the most common fields of study among 91 individuals in Webster who have obtained a bachelor's degree or higher.
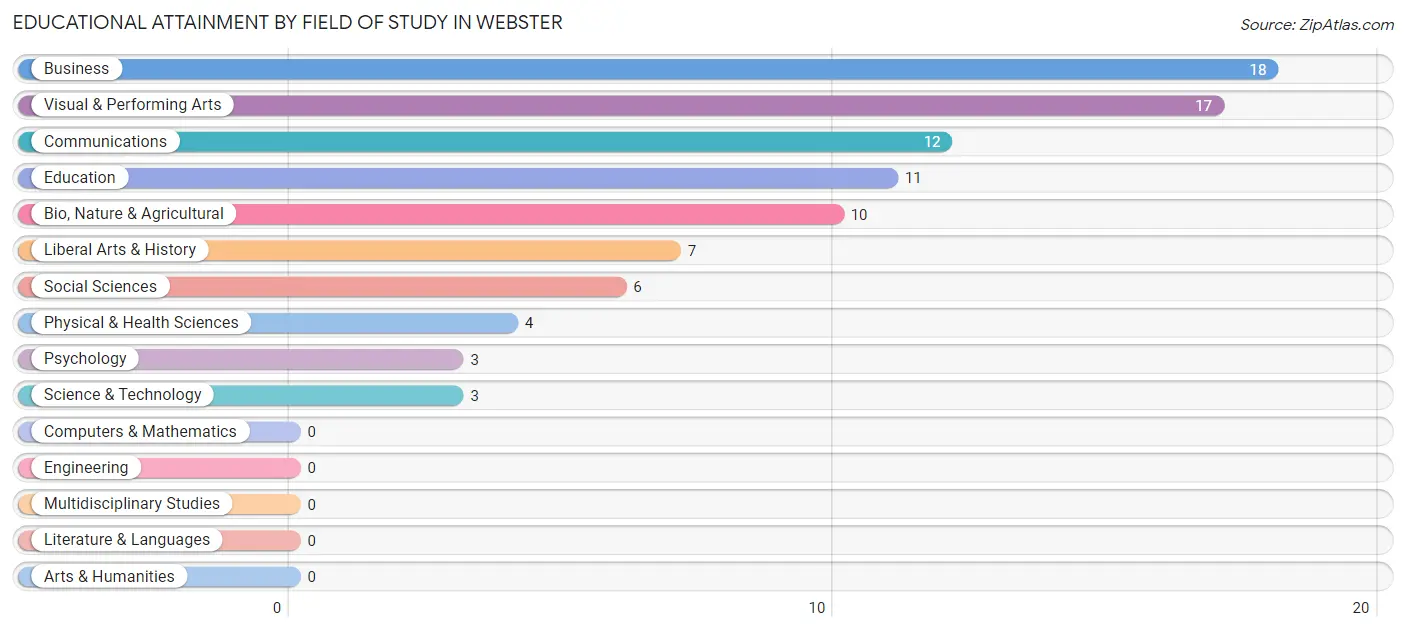
| Field of Study | # Graduates | % Graduates |
| Computers & Mathematics | 0 | 0.0% |
| Bio, Nature & Agricultural | 10 | 11.0% |
| Physical & Health Sciences | 4 | 4.4% |
| Psychology | 3 | 3.3% |
| Social Sciences | 6 | 6.6% |
| Engineering | 0 | 0.0% |
| Multidisciplinary Studies | 0 | 0.0% |
| Science & Technology | 3 | 3.3% |
| Business | 18 | 19.8% |
| Education | 11 | 12.1% |
| Literature & Languages | 0 | 0.0% |
| Liberal Arts & History | 7 | 7.7% |
| Visual & Performing Arts | 17 | 18.7% |
| Communications | 12 | 13.2% |
| Arts & Humanities | 0 | 0.0% |
| Total | 91 | 100.0% |
Transportation & Commute in Webster
Vehicle Availability by Sex in Webster
The most prevalent vehicle ownership categories in Webster are males with 2 vehicles (55, accounting for 43.0%) and females with 2 vehicles (39, making up 36.4%).
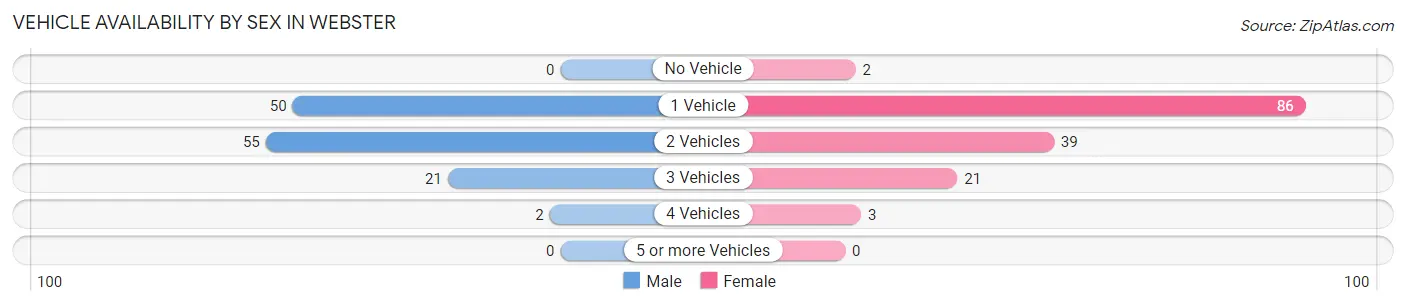
| Vehicles Available | Male | Female |
| No Vehicle | 0 (0.0%) | 2 (1.3%) |
| 1 Vehicle | 50 (39.1%) | 86 (57.0%) |
| 2 Vehicles | 55 (43.0%) | 39 (25.8%) |
| 3 Vehicles | 21 (16.4%) | 21 (13.9%) |
| 4 Vehicles | 2 (1.6%) | 3 (2.0%) |
| 5 or more Vehicles | 0 (0.0%) | 0 (0.0%) |
| Total | 128 (100.0%) | 151 (100.0%) |
Commute Time in Webster
The most frequently occuring commute durations in Webster are 10 to 14 minutes (79 commuters, 28.8%), 5 to 9 minutes (43 commuters, 15.7%), and 45 to 59 minutes (35 commuters, 12.8%).
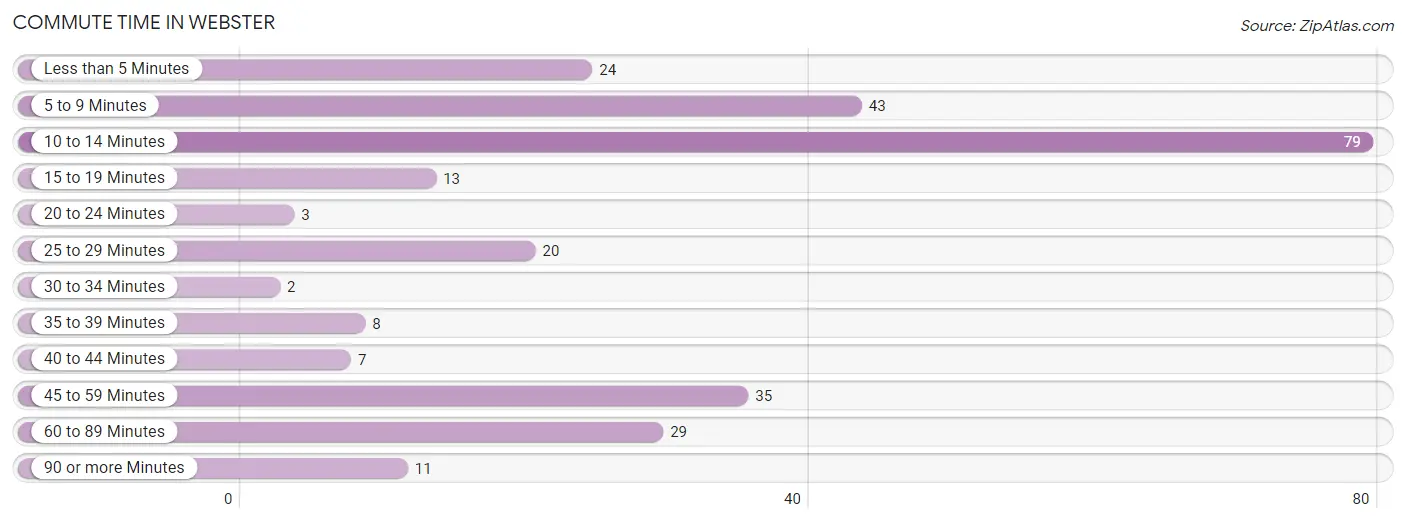
| Commute Time | # Commuters | % Commuters |
| Less than 5 Minutes | 24 | 8.8% |
| 5 to 9 Minutes | 43 | 15.7% |
| 10 to 14 Minutes | 79 | 28.8% |
| 15 to 19 Minutes | 13 | 4.7% |
| 20 to 24 Minutes | 3 | 1.1% |
| 25 to 29 Minutes | 20 | 7.3% |
| 30 to 34 Minutes | 2 | 0.7% |
| 35 to 39 Minutes | 8 | 2.9% |
| 40 to 44 Minutes | 7 | 2.5% |
| 45 to 59 Minutes | 35 | 12.8% |
| 60 to 89 Minutes | 29 | 10.6% |
| 90 or more Minutes | 11 | 4.0% |
Commute Time by Sex in Webster
The most common commute times in Webster are 10 to 14 minutes (41 commuters, 32.0%) for males and 10 to 14 minutes (38 commuters, 26.0%) for females.
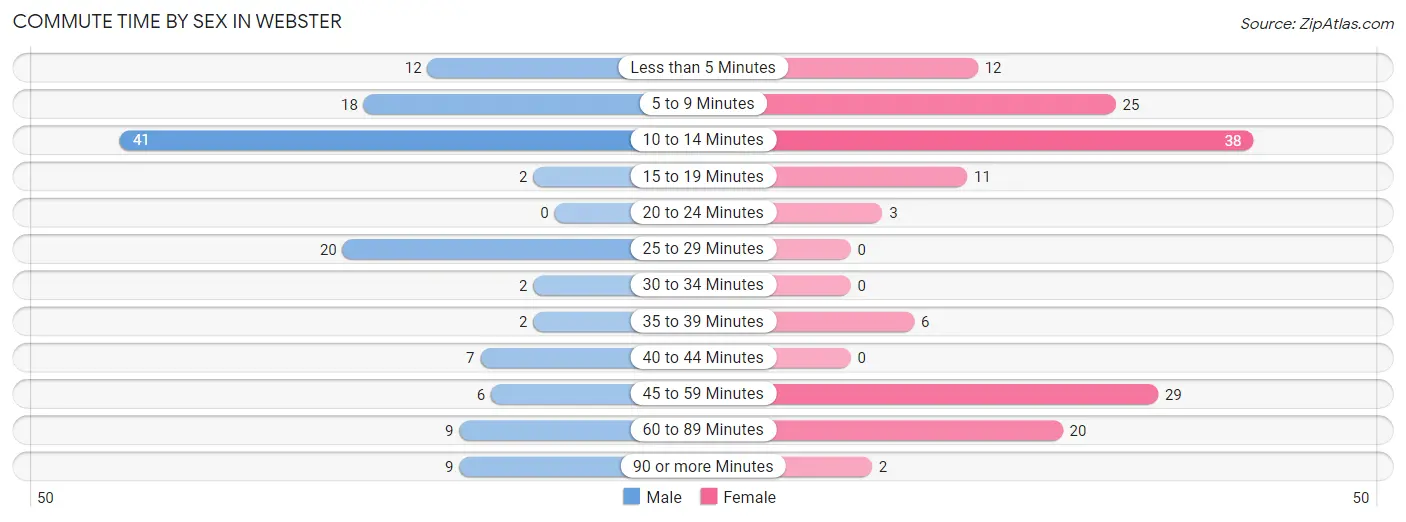
| Commute Time | Male | Female |
| Less than 5 Minutes | 12 (9.4%) | 12 (8.2%) |
| 5 to 9 Minutes | 18 (14.1%) | 25 (17.1%) |
| 10 to 14 Minutes | 41 (32.0%) | 38 (26.0%) |
| 15 to 19 Minutes | 2 (1.6%) | 11 (7.5%) |
| 20 to 24 Minutes | 0 (0.0%) | 3 (2.1%) |
| 25 to 29 Minutes | 20 (15.6%) | 0 (0.0%) |
| 30 to 34 Minutes | 2 (1.6%) | 0 (0.0%) |
| 35 to 39 Minutes | 2 (1.6%) | 6 (4.1%) |
| 40 to 44 Minutes | 7 (5.5%) | 0 (0.0%) |
| 45 to 59 Minutes | 6 (4.7%) | 29 (19.9%) |
| 60 to 89 Minutes | 9 (7.0%) | 20 (13.7%) |
| 90 or more Minutes | 9 (7.0%) | 2 (1.4%) |
Time of Departure to Work by Sex in Webster
The most frequent times of departure to work in Webster are 12:00 PM to 3:59 PM (33, 25.8%) for males and 9:00 AM to 9:59 AM (32, 21.9%) for females.
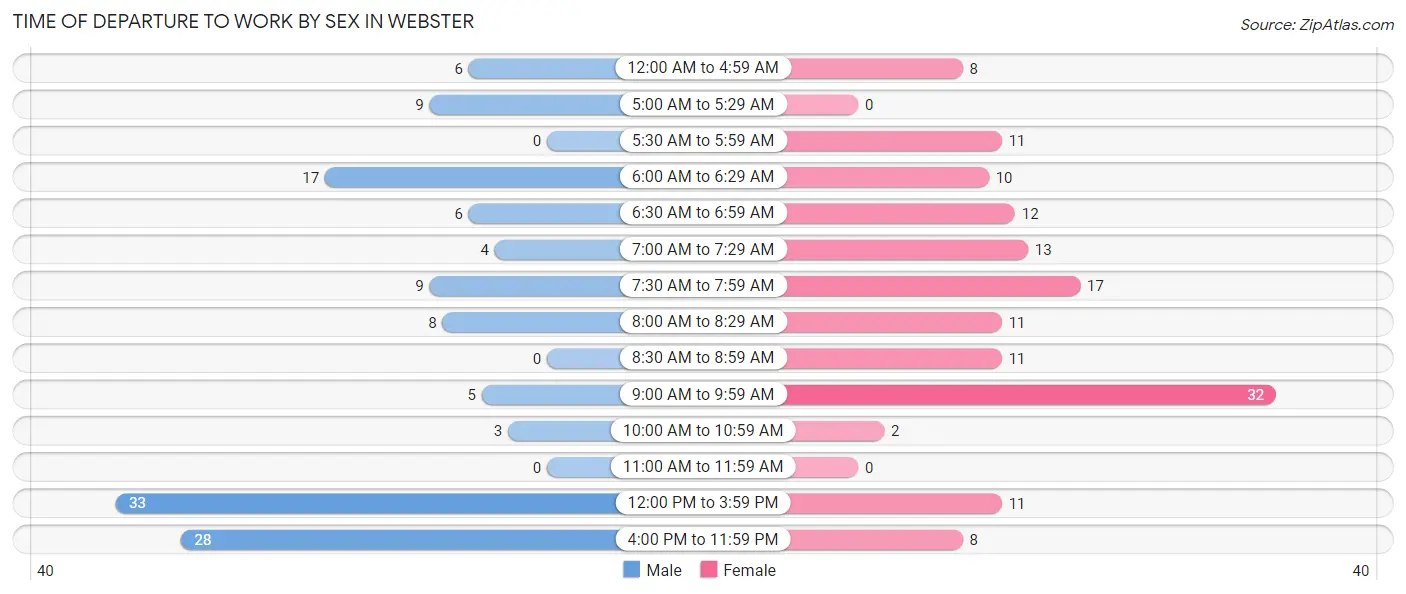
| Time of Departure | Male | Female |
| 12:00 AM to 4:59 AM | 6 (4.7%) | 8 (5.5%) |
| 5:00 AM to 5:29 AM | 9 (7.0%) | 0 (0.0%) |
| 5:30 AM to 5:59 AM | 0 (0.0%) | 11 (7.5%) |
| 6:00 AM to 6:29 AM | 17 (13.3%) | 10 (6.9%) |
| 6:30 AM to 6:59 AM | 6 (4.7%) | 12 (8.2%) |
| 7:00 AM to 7:29 AM | 4 (3.1%) | 13 (8.9%) |
| 7:30 AM to 7:59 AM | 9 (7.0%) | 17 (11.6%) |
| 8:00 AM to 8:29 AM | 8 (6.2%) | 11 (7.5%) |
| 8:30 AM to 8:59 AM | 0 (0.0%) | 11 (7.5%) |
| 9:00 AM to 9:59 AM | 5 (3.9%) | 32 (21.9%) |
| 10:00 AM to 10:59 AM | 3 (2.3%) | 2 (1.4%) |
| 11:00 AM to 11:59 AM | 0 (0.0%) | 0 (0.0%) |
| 12:00 PM to 3:59 PM | 33 (25.8%) | 11 (7.5%) |
| 4:00 PM to 11:59 PM | 28 (21.9%) | 8 (5.5%) |
| Total | 128 (100.0%) | 146 (100.0%) |
Housing Occupancy in Webster
Occupancy by Ownership in Webster
Of the total 298 dwellings in Webster, owner-occupied units account for 131 (44.0%), while renter-occupied units make up 167 (56.0%).
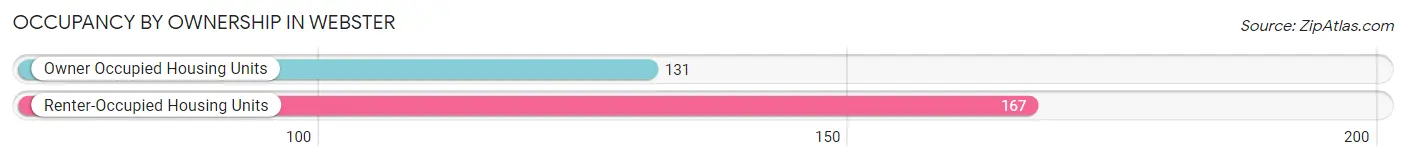
| Occupancy | # Housing Units | % Housing Units |
| Owner Occupied Housing Units | 131 | 44.0% |
| Renter-Occupied Housing Units | 167 | 56.0% |
| Total Occupied Housing Units | 298 | 100.0% |
Occupancy by Household Size in Webster
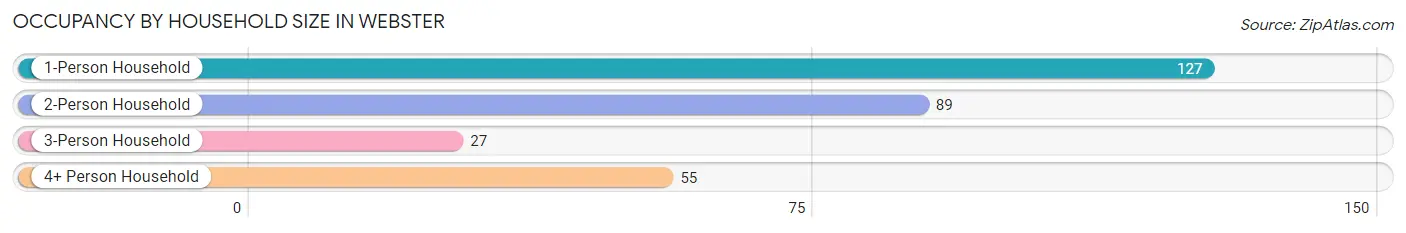
| Household Size | # Housing Units | % Housing Units |
| 1-Person Household | 127 | 42.6% |
| 2-Person Household | 89 | 29.9% |
| 3-Person Household | 27 | 9.1% |
| 4+ Person Household | 55 | 18.5% |
| Total Housing Units | 298 | 100.0% |
Occupancy by Ownership by Household Size in Webster
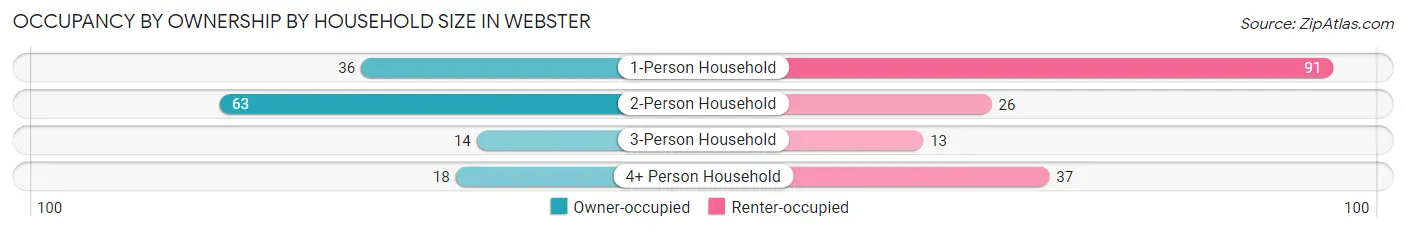
| Household Size | Owner-occupied | Renter-occupied |
| 1-Person Household | 36 (28.3%) | 91 (71.7%) |
| 2-Person Household | 63 (70.8%) | 26 (29.2%) |
| 3-Person Household | 14 (51.8%) | 13 (48.1%) |
| 4+ Person Household | 18 (32.7%) | 37 (67.3%) |
| Total Housing Units | 131 (44.0%) | 167 (56.0%) |
Occupancy by Educational Attainment in Webster
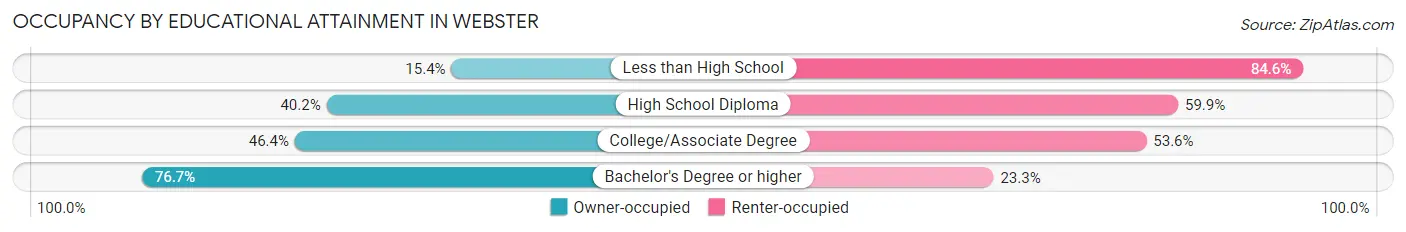
| Household Size | Owner-occupied | Renter-occupied |
| Less than High School | 6 (15.4%) | 33 (84.6%) |
| High School Diploma | 53 (40.2%) | 79 (59.9%) |
| College/Associate Degree | 39 (46.4%) | 45 (53.6%) |
| Bachelor's Degree or higher | 33 (76.7%) | 10 (23.3%) |
Occupancy by Age of Householder in Webster
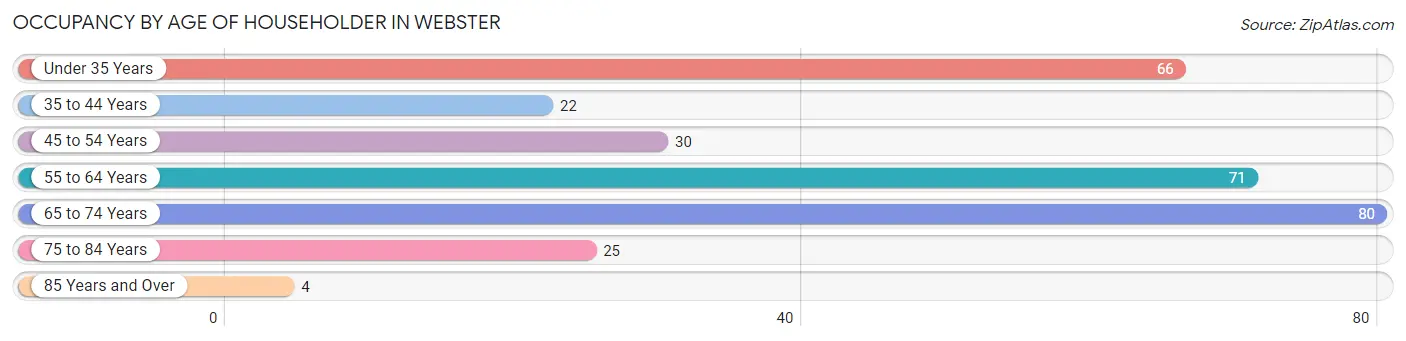
| Age Bracket | # Households | % Households |
| Under 35 Years | 66 | 22.2% |
| 35 to 44 Years | 22 | 7.4% |
| 45 to 54 Years | 30 | 10.1% |
| 55 to 64 Years | 71 | 23.8% |
| 65 to 74 Years | 80 | 26.9% |
| 75 to 84 Years | 25 | 8.4% |
| 85 Years and Over | 4 | 1.3% |
| Total | 298 | 100.0% |
Housing Finances in Webster
Median Income by Occupancy in Webster
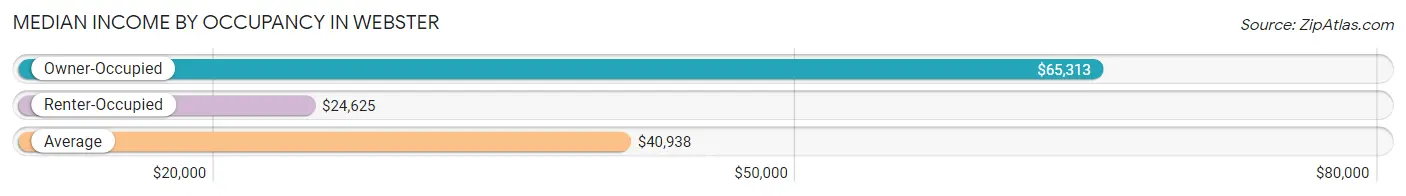
| Occupancy Type | # Households | Median Income |
| Owner-Occupied | 131 (44.0%) | $65,313 |
| Renter-Occupied | 167 (56.0%) | $24,625 |
| Average | 298 (100.0%) | $40,938 |
Occupancy by Householder Income Bracket in Webster
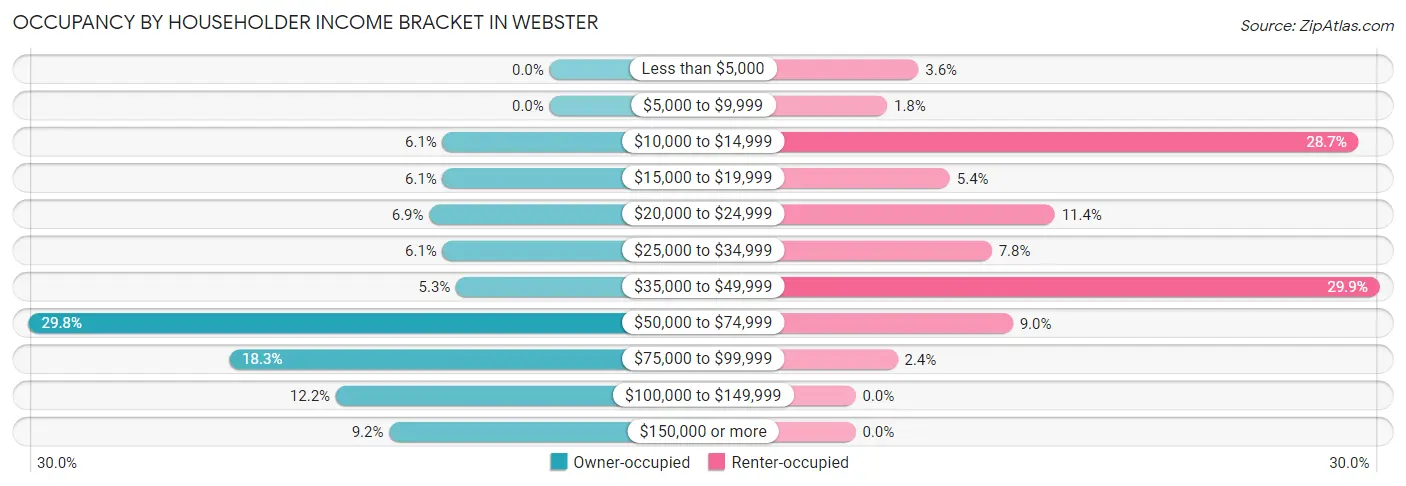
| Income Bracket | Owner-occupied | Renter-occupied |
| Less than $5,000 | 0 (0.0%) | 6 (3.6%) |
| $5,000 to $9,999 | 0 (0.0%) | 3 (1.8%) |
| $10,000 to $14,999 | 8 (6.1%) | 48 (28.7%) |
| $15,000 to $19,999 | 8 (6.1%) | 9 (5.4%) |
| $20,000 to $24,999 | 9 (6.9%) | 19 (11.4%) |
| $25,000 to $34,999 | 8 (6.1%) | 13 (7.8%) |
| $35,000 to $49,999 | 7 (5.3%) | 50 (29.9%) |
| $50,000 to $74,999 | 39 (29.8%) | 15 (9.0%) |
| $75,000 to $99,999 | 24 (18.3%) | 4 (2.4%) |
| $100,000 to $149,999 | 16 (12.2%) | 0 (0.0%) |
| $150,000 or more | 12 (9.2%) | 0 (0.0%) |
| Total | 131 (100.0%) | 167 (100.0%) |
Monthly Housing Cost Tiers in Webster
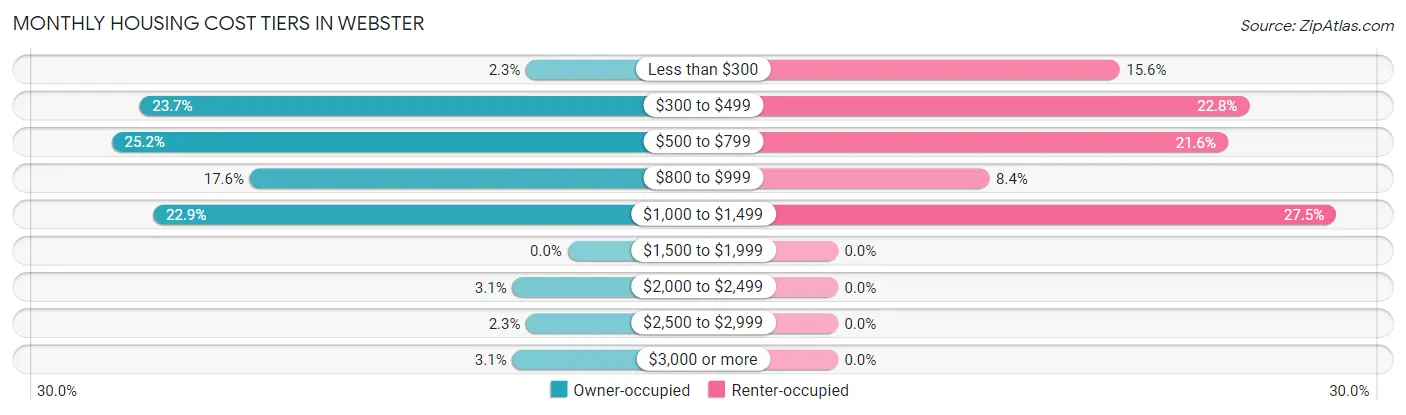
| Monthly Cost | Owner-occupied | Renter-occupied |
| Less than $300 | 3 (2.3%) | 26 (15.6%) |
| $300 to $499 | 31 (23.7%) | 38 (22.8%) |
| $500 to $799 | 33 (25.2%) | 36 (21.6%) |
| $800 to $999 | 23 (17.6%) | 14 (8.4%) |
| $1,000 to $1,499 | 30 (22.9%) | 46 (27.5%) |
| $1,500 to $1,999 | 0 (0.0%) | 0 (0.0%) |
| $2,000 to $2,499 | 4 (3.0%) | 0 (0.0%) |
| $2,500 to $2,999 | 3 (2.3%) | 0 (0.0%) |
| $3,000 or more | 4 (3.0%) | 0 (0.0%) |
| Total | 131 (100.0%) | 167 (100.0%) |
Physical Housing Characteristics in Webster
Housing Structures in Webster
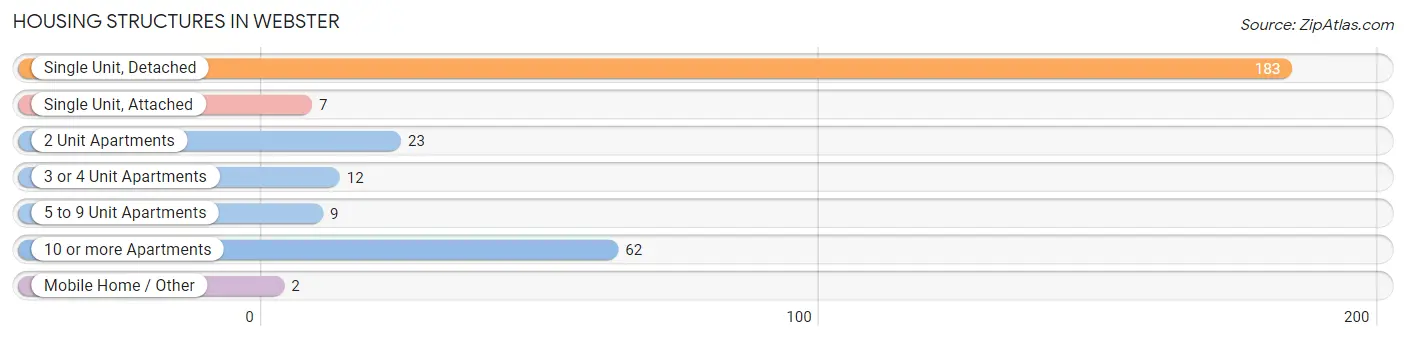
| Structure Type | # Housing Units | % Housing Units |
| Single Unit, Detached | 183 | 61.4% |
| Single Unit, Attached | 7 | 2.4% |
| 2 Unit Apartments | 23 | 7.7% |
| 3 or 4 Unit Apartments | 12 | 4.0% |
| 5 to 9 Unit Apartments | 9 | 3.0% |
| 10 or more Apartments | 62 | 20.8% |
| Mobile Home / Other | 2 | 0.7% |
| Total | 298 | 100.0% |
Housing Structures by Occupancy in Webster
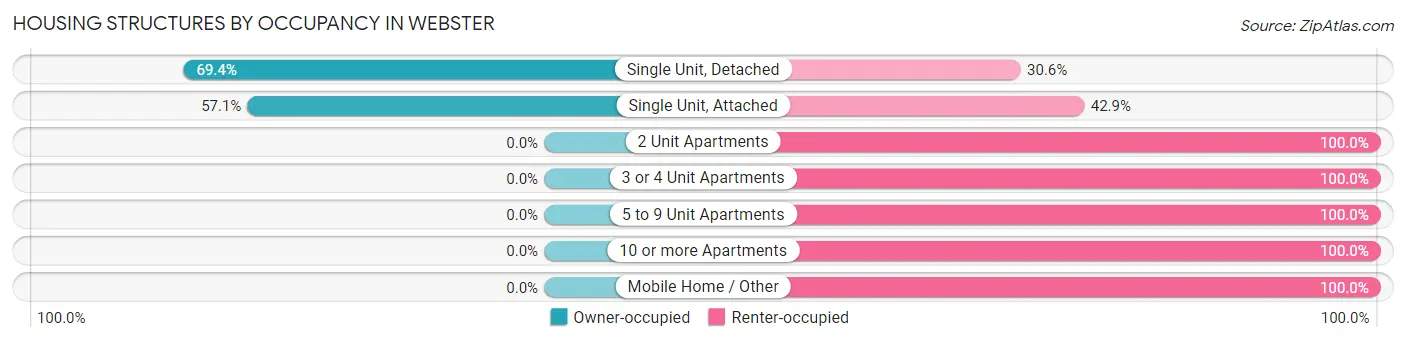
| Structure Type | Owner-occupied | Renter-occupied |
| Single Unit, Detached | 127 (69.4%) | 56 (30.6%) |
| Single Unit, Attached | 4 (57.1%) | 3 (42.9%) |
| 2 Unit Apartments | 0 (0.0%) | 23 (100.0%) |
| 3 or 4 Unit Apartments | 0 (0.0%) | 12 (100.0%) |
| 5 to 9 Unit Apartments | 0 (0.0%) | 9 (100.0%) |
| 10 or more Apartments | 0 (0.0%) | 62 (100.0%) |
| Mobile Home / Other | 0 (0.0%) | 2 (100.0%) |
| Total | 131 (44.0%) | 167 (56.0%) |
Housing Structures by Number of Rooms in Webster
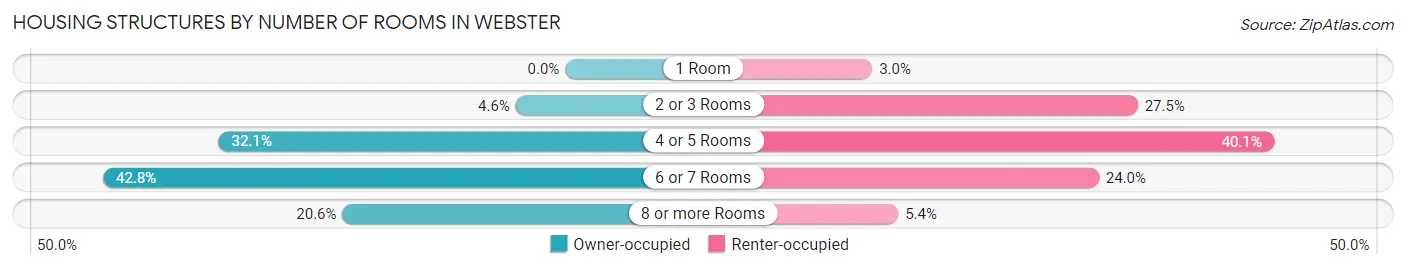
| Number of Rooms | Owner-occupied | Renter-occupied |
| 1 Room | 0 (0.0%) | 5 (3.0%) |
| 2 or 3 Rooms | 6 (4.6%) | 46 (27.5%) |
| 4 or 5 Rooms | 42 (32.1%) | 67 (40.1%) |
| 6 or 7 Rooms | 56 (42.7%) | 40 (23.9%) |
| 8 or more Rooms | 27 (20.6%) | 9 (5.4%) |
| Total | 131 (100.0%) | 167 (100.0%) |
Housing Structure by Heating Type in Webster
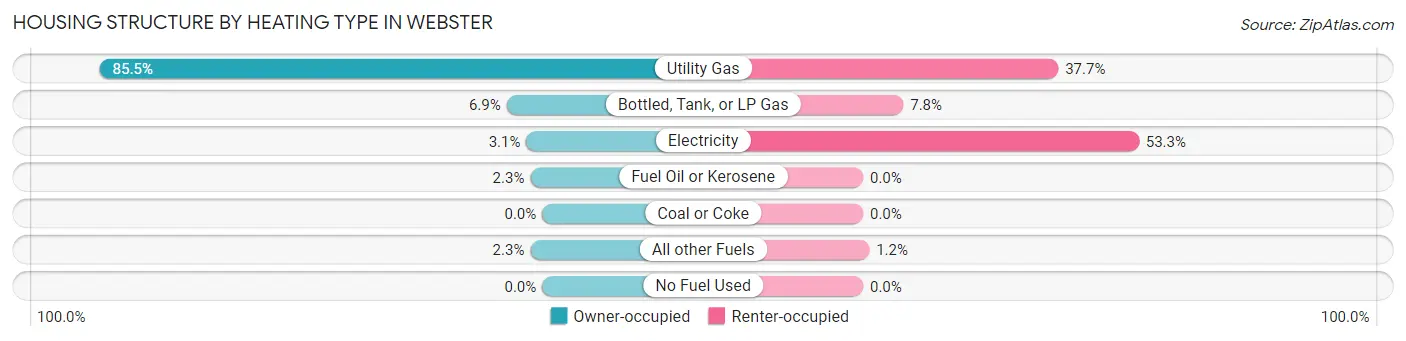
| Heating Type | Owner-occupied | Renter-occupied |
| Utility Gas | 112 (85.5%) | 63 (37.7%) |
| Bottled, Tank, or LP Gas | 9 (6.9%) | 13 (7.8%) |
| Electricity | 4 (3.0%) | 89 (53.3%) |
| Fuel Oil or Kerosene | 3 (2.3%) | 0 (0.0%) |
| Coal or Coke | 0 (0.0%) | 0 (0.0%) |
| All other Fuels | 3 (2.3%) | 2 (1.2%) |
| No Fuel Used | 0 (0.0%) | 0 (0.0%) |
| Total | 131 (100.0%) | 167 (100.0%) |
Household Vehicle Usage in Webster
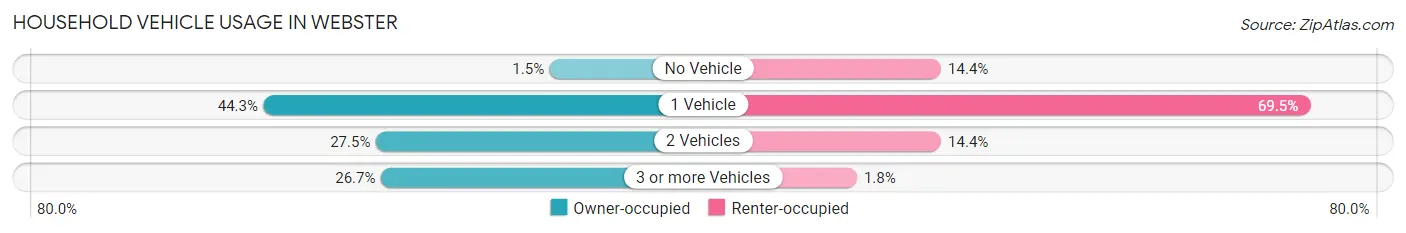
| Vehicles per Household | Owner-occupied | Renter-occupied |
| No Vehicle | 2 (1.5%) | 24 (14.4%) |
| 1 Vehicle | 58 (44.3%) | 116 (69.5%) |
| 2 Vehicles | 36 (27.5%) | 24 (14.4%) |
| 3 or more Vehicles | 35 (26.7%) | 3 (1.8%) |
| Total | 131 (100.0%) | 167 (100.0%) |
Real Estate & Mortgages in Webster
Real Estate and Mortgage Overview in Webster
| Characteristic | Without Mortgage | With Mortgage |
| Housing Units | 35 | 96 |
| Median Property Value | $108,800 | $125,000 |
| Median Household Income | $54,375 | $6 |
| Monthly Housing Costs | $481 | $4 |
| Real Estate Taxes | $1,813 | $0 |
Property Value by Mortgage Status in Webster
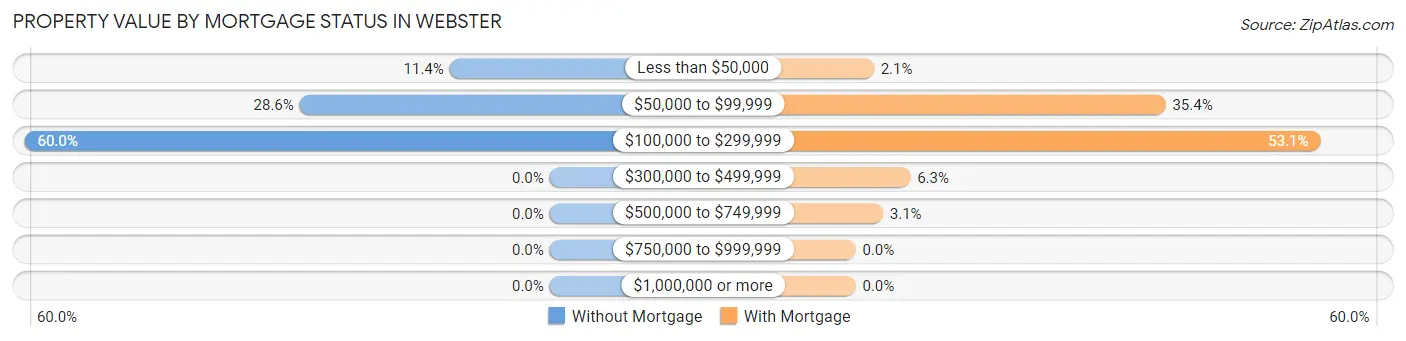
| Property Value | Without Mortgage | With Mortgage |
| Less than $50,000 | 4 (11.4%) | 2 (2.1%) |
| $50,000 to $99,999 | 10 (28.6%) | 34 (35.4%) |
| $100,000 to $299,999 | 21 (60.0%) | 51 (53.1%) |
| $300,000 to $499,999 | 0 (0.0%) | 6 (6.2%) |
| $500,000 to $749,999 | 0 (0.0%) | 3 (3.1%) |
| $750,000 to $999,999 | 0 (0.0%) | 0 (0.0%) |
| $1,000,000 or more | 0 (0.0%) | 0 (0.0%) |
| Total | 35 (100.0%) | 96 (100.0%) |
Household Income by Mortgage Status in Webster
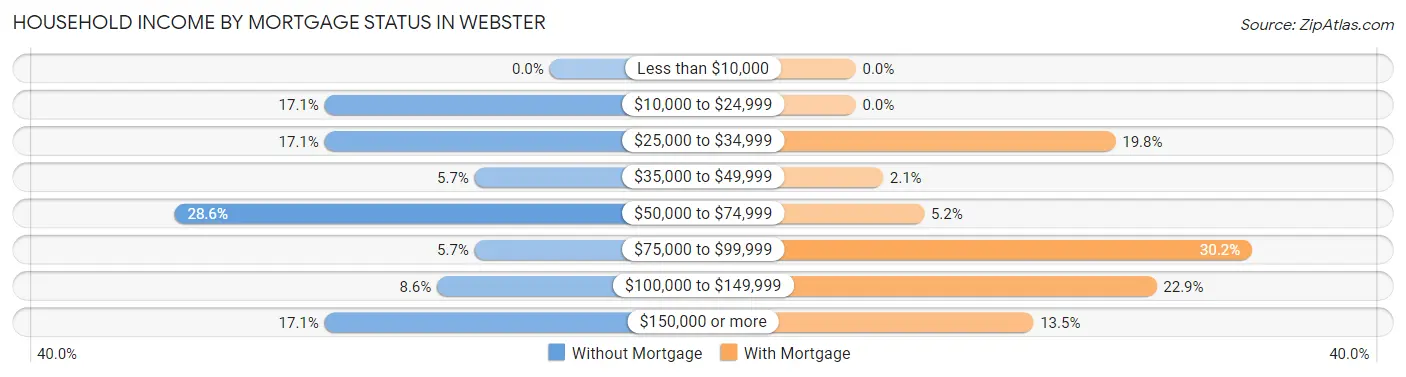
| Household Income | Without Mortgage | With Mortgage |
| Less than $10,000 | 0 (0.0%) | 0 (0.0%) |
| $10,000 to $24,999 | 6 (17.1%) | 0 (0.0%) |
| $25,000 to $34,999 | 6 (17.1%) | 19 (19.8%) |
| $35,000 to $49,999 | 2 (5.7%) | 2 (2.1%) |
| $50,000 to $74,999 | 10 (28.6%) | 5 (5.2%) |
| $75,000 to $99,999 | 2 (5.7%) | 29 (30.2%) |
| $100,000 to $149,999 | 3 (8.6%) | 22 (22.9%) |
| $150,000 or more | 6 (17.1%) | 13 (13.5%) |
| Total | 35 (100.0%) | 96 (100.0%) |
Property Value to Household Income Ratio in Webster
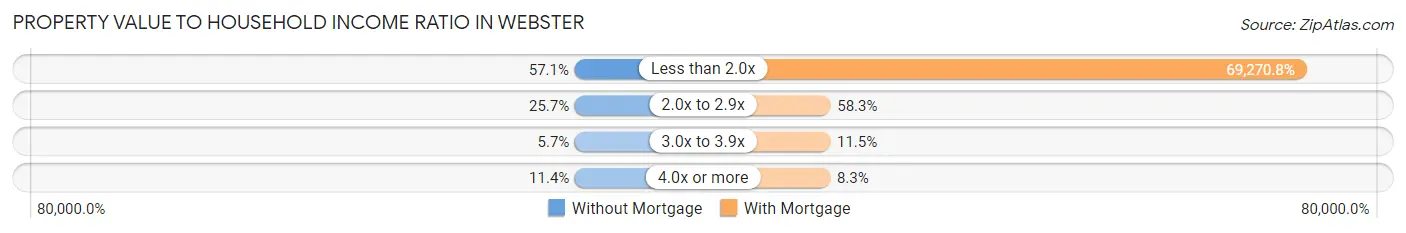
| Value-to-Income Ratio | Without Mortgage | With Mortgage |
| Less than 2.0x | 20 (57.1%) | 66,500 (69,270.8%) |
| 2.0x to 2.9x | 9 (25.7%) | 56 (58.3%) |
| 3.0x to 3.9x | 2 (5.7%) | 11 (11.5%) |
| 4.0x or more | 4 (11.4%) | 8 (8.3%) |
| Total | 35 (100.0%) | 96 (100.0%) |
Real Estate Taxes by Mortgage Status in Webster
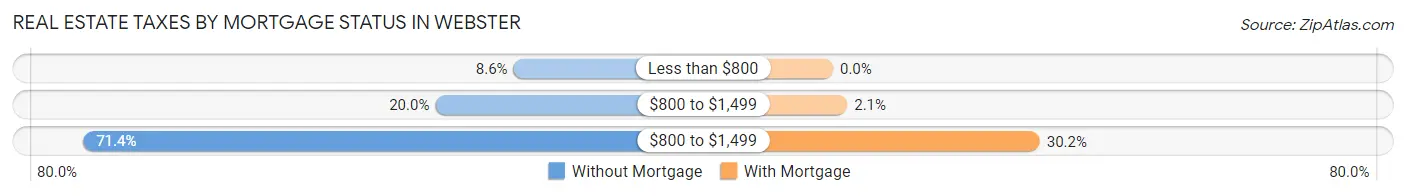
| Property Taxes | Without Mortgage | With Mortgage |
| Less than $800 | 3 (8.6%) | 0 (0.0%) |
| $800 to $1,499 | 7 (20.0%) | 2 (2.1%) |
| $800 to $1,499 | 25 (71.4%) | 29 (30.2%) |
| Total | 35 (100.0%) | 96 (100.0%) |
Health & Disability in Webster
Health Insurance Coverage by Age in Webster
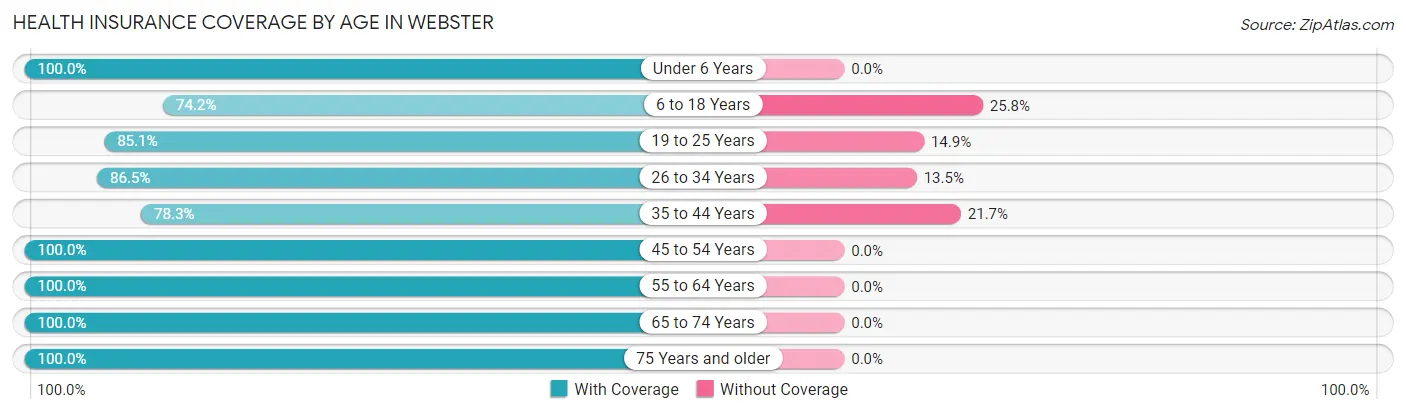
| Age Bracket | With Coverage | Without Coverage |
| Under 6 Years | 72 (100.0%) | 0 (0.0%) |
| 6 to 18 Years | 66 (74.2%) | 23 (25.8%) |
| 19 to 25 Years | 63 (85.1%) | 11 (14.9%) |
| 26 to 34 Years | 64 (86.5%) | 10 (13.5%) |
| 35 to 44 Years | 36 (78.3%) | 10 (21.7%) |
| 45 to 54 Years | 76 (100.0%) | 0 (0.0%) |
| 55 to 64 Years | 97 (100.0%) | 0 (0.0%) |
| 65 to 74 Years | 90 (100.0%) | 0 (0.0%) |
| 75 Years and older | 47 (100.0%) | 0 (0.0%) |
| Total | 611 (91.9%) | 54 (8.1%) |
Health Insurance Coverage by Citizenship Status in Webster
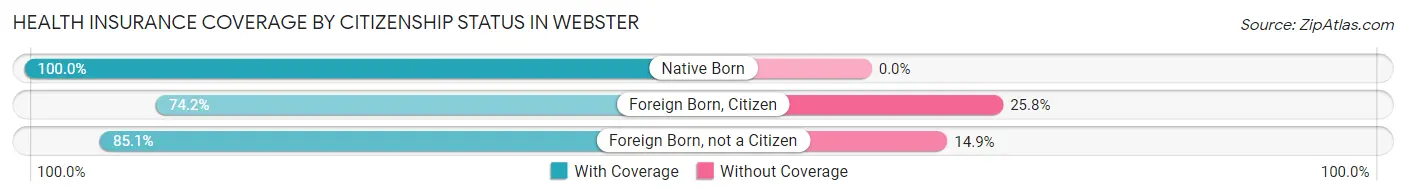
| Citizenship Status | With Coverage | Without Coverage |
| Native Born | 72 (100.0%) | 0 (0.0%) |
| Foreign Born, Citizen | 66 (74.2%) | 23 (25.8%) |
| Foreign Born, not a Citizen | 63 (85.1%) | 11 (14.9%) |
Health Insurance Coverage by Household Income in Webster
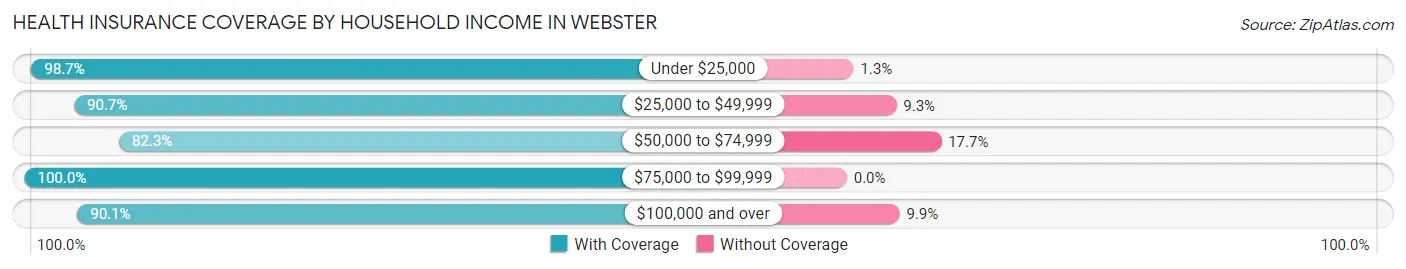
| Household Income | With Coverage | Without Coverage |
| Under $25,000 | 155 (98.7%) | 2 (1.3%) |
| $25,000 to $49,999 | 176 (90.7%) | 18 (9.3%) |
| $50,000 to $74,999 | 121 (82.3%) | 26 (17.7%) |
| $75,000 to $99,999 | 86 (100.0%) | 0 (0.0%) |
| $100,000 and over | 73 (90.1%) | 8 (9.9%) |
Public vs Private Health Insurance Coverage by Age in Webster
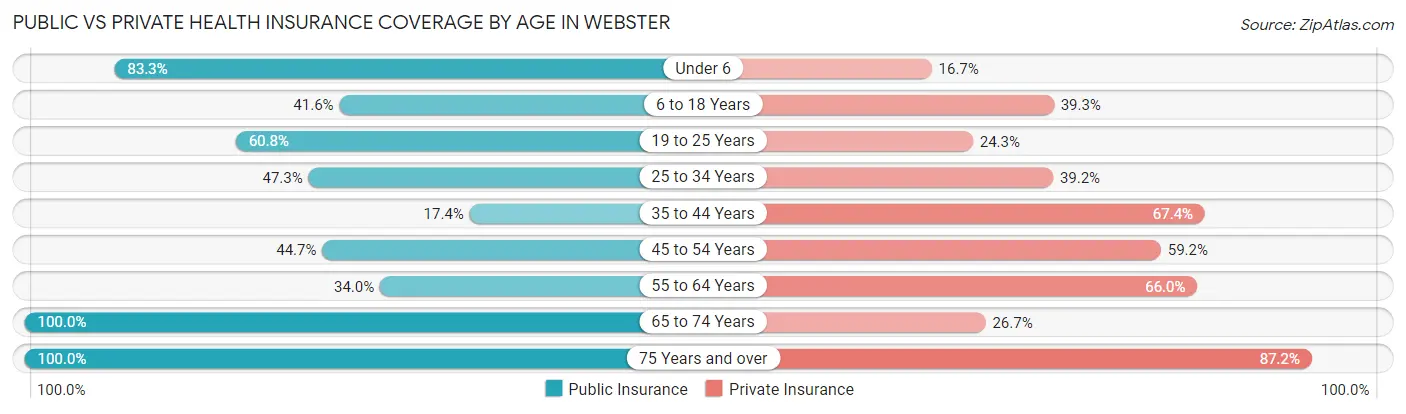
| Age Bracket | Public Insurance | Private Insurance |
| Under 6 | 60 (83.3%) | 12 (16.7%) |
| 6 to 18 Years | 37 (41.6%) | 35 (39.3%) |
| 19 to 25 Years | 45 (60.8%) | 18 (24.3%) |
| 25 to 34 Years | 35 (47.3%) | 29 (39.2%) |
| 35 to 44 Years | 8 (17.4%) | 31 (67.4%) |
| 45 to 54 Years | 34 (44.7%) | 45 (59.2%) |
| 55 to 64 Years | 33 (34.0%) | 64 (66.0%) |
| 65 to 74 Years | 90 (100.0%) | 24 (26.7%) |
| 75 Years and over | 47 (100.0%) | 41 (87.2%) |
| Total | 389 (58.5%) | 299 (45.0%) |
Disability Status by Sex by Age in Webster
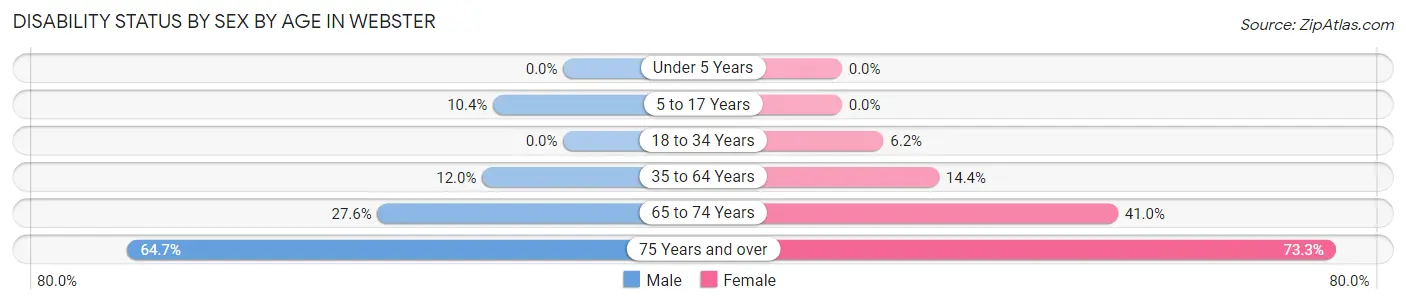
| Age Bracket | Male | Female |
| Under 5 Years | 0 (0.0%) | 0 (0.0%) |
| 5 to 17 Years | 5 (10.4%) | 0 (0.0%) |
| 18 to 34 Years | 0 (0.0%) | 5 (6.2%) |
| 35 to 64 Years | 13 (12.0%) | 16 (14.4%) |
| 65 to 74 Years | 8 (27.6%) | 25 (41.0%) |
| 75 Years and over | 11 (64.7%) | 22 (73.3%) |
Disability Class by Sex by Age in Webster
Disability Class: Hearing Difficulty
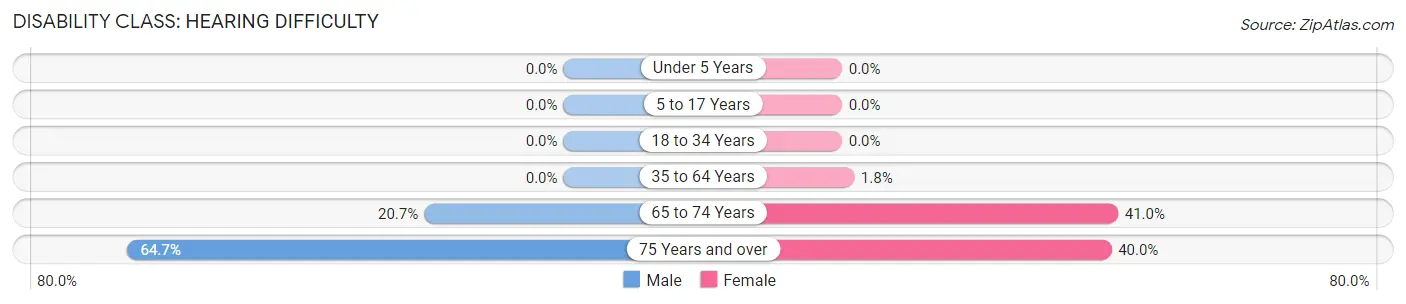
| Age Bracket | Male | Female |
| Under 5 Years | 0 (0.0%) | 0 (0.0%) |
| 5 to 17 Years | 0 (0.0%) | 0 (0.0%) |
| 18 to 34 Years | 0 (0.0%) | 0 (0.0%) |
| 35 to 64 Years | 0 (0.0%) | 2 (1.8%) |
| 65 to 74 Years | 6 (20.7%) | 25 (41.0%) |
| 75 Years and over | 11 (64.7%) | 12 (40.0%) |
Disability Class: Vision Difficulty
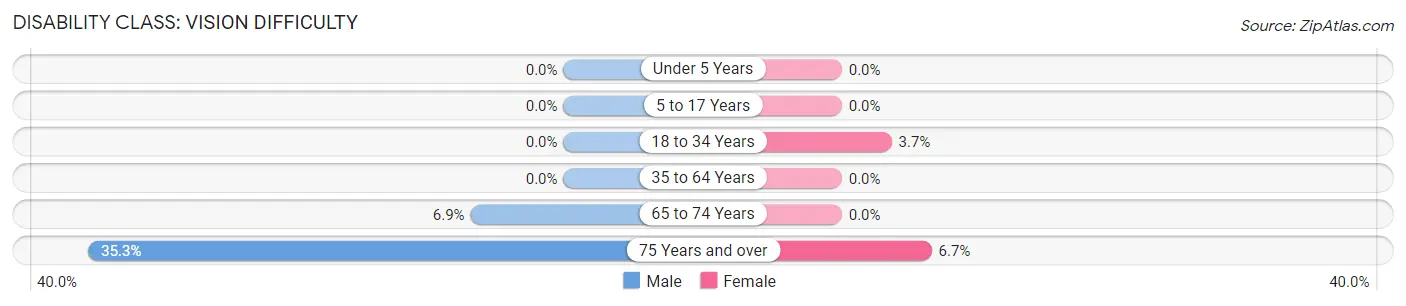
| Age Bracket | Male | Female |
| Under 5 Years | 0 (0.0%) | 0 (0.0%) |
| 5 to 17 Years | 0 (0.0%) | 0 (0.0%) |
| 18 to 34 Years | 0 (0.0%) | 3 (3.7%) |
| 35 to 64 Years | 0 (0.0%) | 0 (0.0%) |
| 65 to 74 Years | 2 (6.9%) | 0 (0.0%) |
| 75 Years and over | 6 (35.3%) | 2 (6.7%) |
Disability Class: Cognitive Difficulty
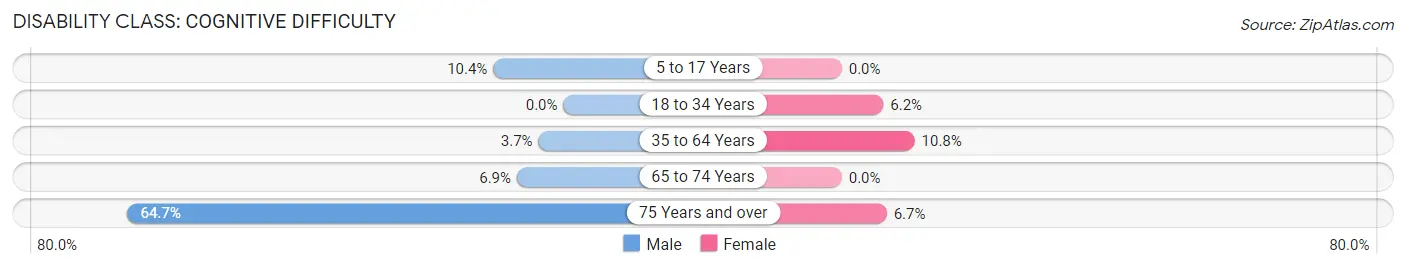
| Age Bracket | Male | Female |
| 5 to 17 Years | 5 (10.4%) | 0 (0.0%) |
| 18 to 34 Years | 0 (0.0%) | 5 (6.2%) |
| 35 to 64 Years | 4 (3.7%) | 12 (10.8%) |
| 65 to 74 Years | 2 (6.9%) | 0 (0.0%) |
| 75 Years and over | 11 (64.7%) | 2 (6.7%) |
Disability Class: Ambulatory Difficulty
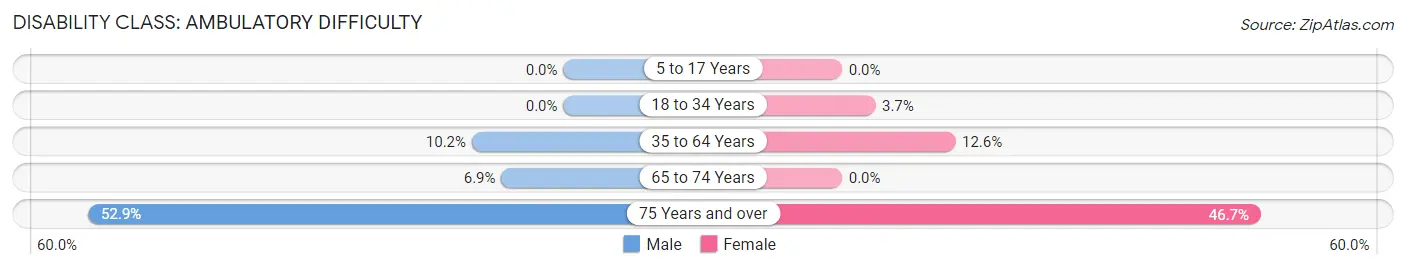
| Age Bracket | Male | Female |
| 5 to 17 Years | 0 (0.0%) | 0 (0.0%) |
| 18 to 34 Years | 0 (0.0%) | 3 (3.7%) |
| 35 to 64 Years | 11 (10.2%) | 14 (12.6%) |
| 65 to 74 Years | 2 (6.9%) | 0 (0.0%) |
| 75 Years and over | 9 (52.9%) | 14 (46.7%) |
Disability Class: Self-Care Difficulty
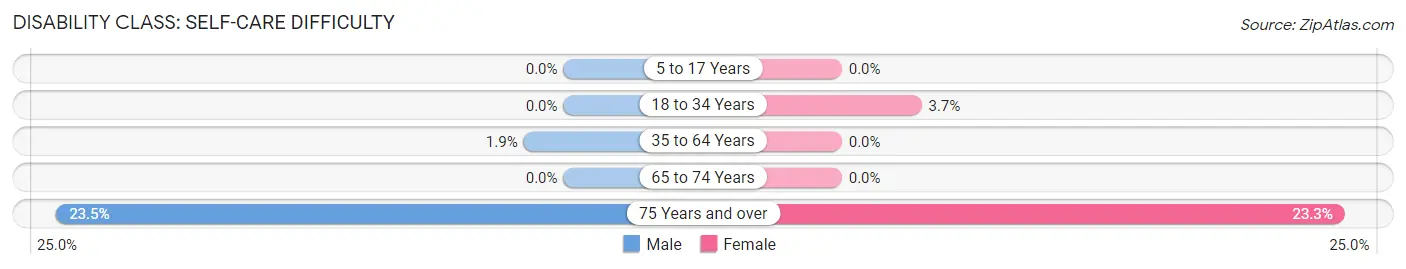
| Age Bracket | Male | Female |
| 5 to 17 Years | 0 (0.0%) | 0 (0.0%) |
| 18 to 34 Years | 0 (0.0%) | 3 (3.7%) |
| 35 to 64 Years | 2 (1.8%) | 0 (0.0%) |
| 65 to 74 Years | 0 (0.0%) | 0 (0.0%) |
| 75 Years and over | 4 (23.5%) | 7 (23.3%) |
Technology Access in Webster
Computing Device Access in Webster
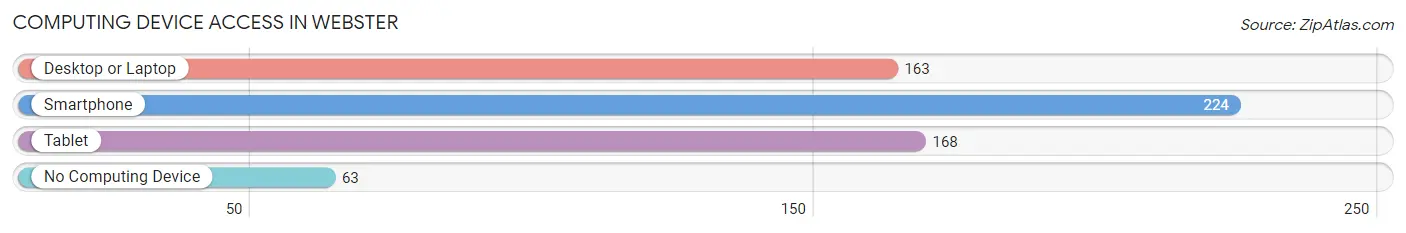
| Device Type | # Households | % Households |
| Desktop or Laptop | 163 | 54.7% |
| Smartphone | 224 | 75.2% |
| Tablet | 168 | 56.4% |
| No Computing Device | 63 | 21.1% |
| Total | 298 | 100.0% |
Internet Access in Webster
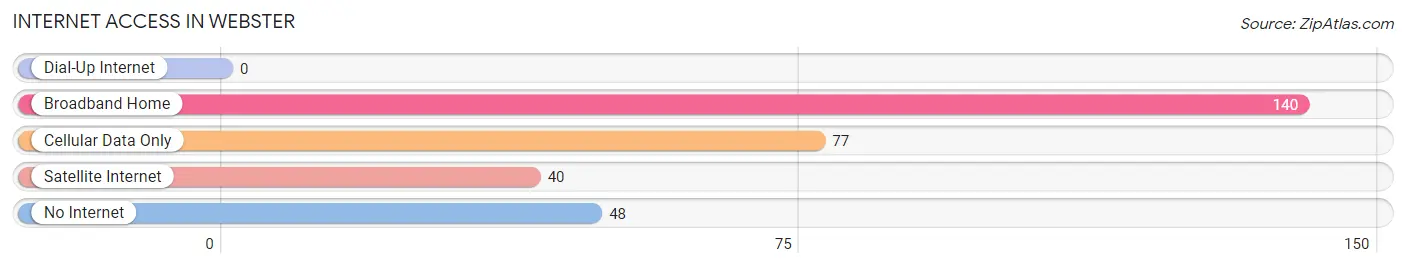
| Internet Type | # Households | % Households |
| Dial-Up Internet | 0 | 0.0% |
| Broadband Home | 140 | 47.0% |
| Cellular Data Only | 77 | 25.8% |
| Satellite Internet | 40 | 13.4% |
| No Internet | 48 | 16.1% |
| Total | 298 | 100.0% |
Webster Summary
Webster, Wisconsin is a small town located in Burnett County in the northwestern part of the state. It is situated on the banks of the Yellow River, and is surrounded by rolling hills and forests. The town has a population of just over 1,000 people, and is known for its rural charm and friendly atmosphere.
Webster was first settled in the late 1800s by a group of Swedish immigrants. The town was named after a local settler, John Webster, who was the first to build a home in the area. The town quickly grew, and by the early 1900s, it had become a thriving community with a variety of businesses, including a sawmill, a general store, and a blacksmith shop.
The economy of Webster has traditionally been based on agriculture and forestry. The town is home to several dairy farms, as well as a number of small family-owned businesses. In recent years, the town has seen an influx of new businesses, including a winery, a brewery, and a distillery.
The geography of Webster is characterized by rolling hills and forests. The town is located in the St. Croix River Valley, and is surrounded by the Chippewa National Forest. The Yellow River runs through the town, and is a popular spot for fishing and canoeing.
The climate in Webster is typical of the Upper Midwest, with cold winters and hot summers. The average temperature in the winter is around 20 degrees Fahrenheit, and in the summer it is around 70 degrees. The town receives an average of 30 inches of snow each year.
The demographics of Webster are largely white, with a small percentage of African Americans and Hispanics. The median household income is around $45,000, and the median home value is around $150,000. The town has a low unemployment rate, and the majority of residents are employed in the agricultural and forestry industries.
Webster is a small town with a big heart. It is a great place to live, work, and raise a family. The town is known for its friendly atmosphere and rural charm, and is a great place to escape the hustle and bustle of city life.
Common Questions
What is Per Capita Income in Webster?
Per Capita income in Webster is $24,838.
What is the Median Family Income in Webster?
Median Family Income in Webster is $42,143.
What is the Median Household income in Webster?
Median Household Income in Webster is $40,938.
What is Income or Wage Gap in Webster?
Income or Wage Gap in Webster is 18.4%.
Women in Webster earn 81.6 cents for every dollar earned by a man.
What is Inequality or Gini Index in Webster?
Inequality or Gini Index in Webster is 0.47.
What is the Total Population of Webster?
Total Population of Webster is 665.
What is the Total Male Population of Webster?
Total Male Population of Webster is 288.
What is the Total Female Population of Webster?
Total Female Population of Webster is 377.
What is the Ratio of Males per 100 Females in Webster?
There are 76.39 Males per 100 Females in Webster.
What is the Ratio of Females per 100 Males in Webster?
There are 130.90 Females per 100 Males in Webster.
What is the Median Population Age in Webster?
Median Population Age in Webster is 39.6 Years.
What is the Average Family Size in Webster
Average Family Size in Webster is 3.0 People.
What is the Average Household Size in Webster
Average Household Size in Webster is 2.2 People.
How Large is the Labor Force in Webster?
There are 286 People in the Labor Forcein in Webster.
What is the Percentage of People in the Labor Force in Webster?
55.6% of People are in the Labor Force in Webster.