Waterloo, WI Map & Demographics
Waterloo Map
Waterloo Overview
$35,336
PER CAPITA INCOME
$64,196
AVG FAMILY INCOME
$72,666
AVG HOUSEHOLD INCOME
17.7%
WAGE / INCOME GAP [ % ]
82.3¢/ $1
WAGE / INCOME GAP [ $ ]
0.39
INEQUALITY / GINI INDEX
3,511
TOTAL POPULATION
1,839
MALE POPULATION
1,672
FEMALE POPULATION
109.99
MALES / 100 FEMALES
90.92
FEMALES / 100 MALES
40.9
MEDIAN AGE
2.7
AVG FAMILY SIZE
2.2
AVG HOUSEHOLD SIZE
1,976
LABOR FORCE [ PEOPLE ]
72.0%
PERCENT IN LABOR FORCE
3.5%
UNEMPLOYMENT RATE
Waterloo Zip Codes
Waterloo Area Codes
Income in Waterloo
Income Overview in Waterloo
Per Capita Income in Waterloo is $35,336, while median incomes of families and households are $64,196 and $72,666 respectively.
| Characteristic | Number | Measure |
| Per Capita Income | 3,511 | $35,336 |
| Median Family Income | 980 | $64,196 |
| Mean Family Income | 980 | $80,082 |
| Median Household Income | 1,557 | $72,666 |
| Mean Household Income | 1,557 | $76,902 |
| Income Deficit | 980 | $0 |
| Wage / Income Gap (%) | 3,511 | 17.70% |
| Wage / Income Gap ($) | 3,511 | 82.30¢ per $1 |
| Gini / Inequality Index | 3,511 | 0.39 |
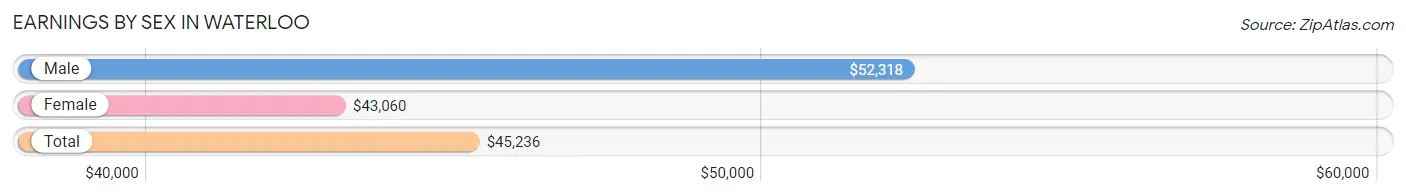
Earnings by Sex in Waterloo
Average Earnings in Waterloo are $45,236, $52,318 for men and $43,060 for women, a difference of 17.7%.
| Sex | Number | Average Earnings |
| Male | 1,206 (59.5%) | $52,318 |
| Female | 820 (40.5%) | $43,060 |
| Total | 2,026 (100.0%) | $45,236 |
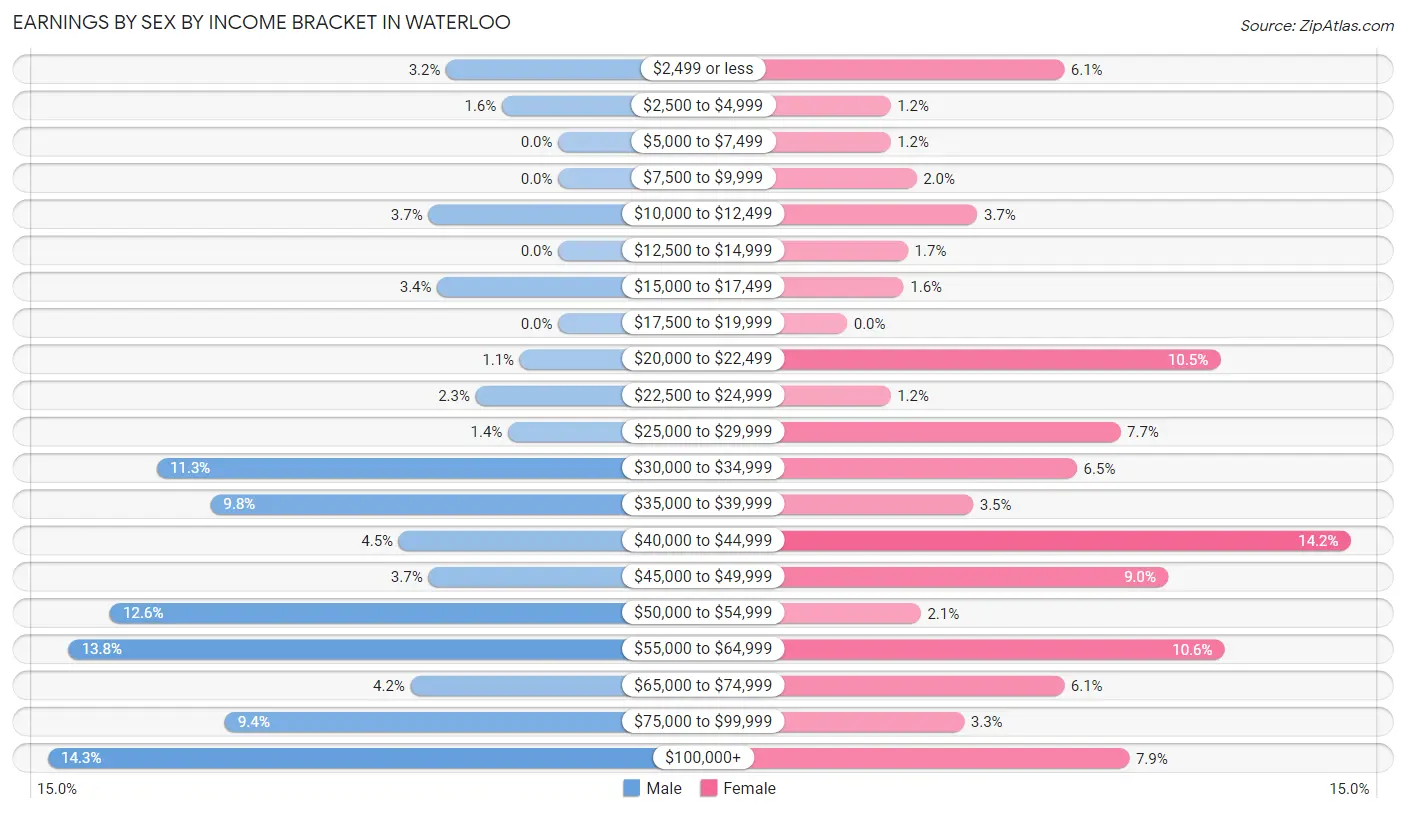
Earnings by Sex by Income Bracket in Waterloo
The most common earnings brackets in Waterloo are $100,000+ for men (173 | 14.3%) and $40,000 to $44,999 for women (116 | 14.1%).
| Income | Male | Female |
| $2,499 or less | 38 (3.2%) | 50 (6.1%) |
| $2,500 to $4,999 | 19 (1.6%) | 10 (1.2%) |
| $5,000 to $7,499 | 0 (0.0%) | 10 (1.2%) |
| $7,500 to $9,999 | 0 (0.0%) | 16 (1.9%) |
| $10,000 to $12,499 | 44 (3.6%) | 30 (3.7%) |
| $12,500 to $14,999 | 0 (0.0%) | 14 (1.7%) |
| $15,000 to $17,499 | 41 (3.4%) | 13 (1.6%) |
| $17,500 to $19,999 | 0 (0.0%) | 0 (0.0%) |
| $20,000 to $22,499 | 13 (1.1%) | 86 (10.5%) |
| $22,500 to $24,999 | 28 (2.3%) | 10 (1.2%) |
| $25,000 to $29,999 | 17 (1.4%) | 63 (7.7%) |
| $30,000 to $34,999 | 136 (11.3%) | 53 (6.5%) |
| $35,000 to $39,999 | 118 (9.8%) | 29 (3.5%) |
| $40,000 to $44,999 | 54 (4.5%) | 116 (14.1%) |
| $45,000 to $49,999 | 44 (3.6%) | 74 (9.0%) |
| $50,000 to $54,999 | 152 (12.6%) | 17 (2.1%) |
| $55,000 to $64,999 | 166 (13.8%) | 87 (10.6%) |
| $65,000 to $74,999 | 50 (4.2%) | 50 (6.1%) |
| $75,000 to $99,999 | 113 (9.4%) | 27 (3.3%) |
| $100,000+ | 173 (14.3%) | 65 (7.9%) |
| Total | 1,206 (100.0%) | 820 (100.0%) |
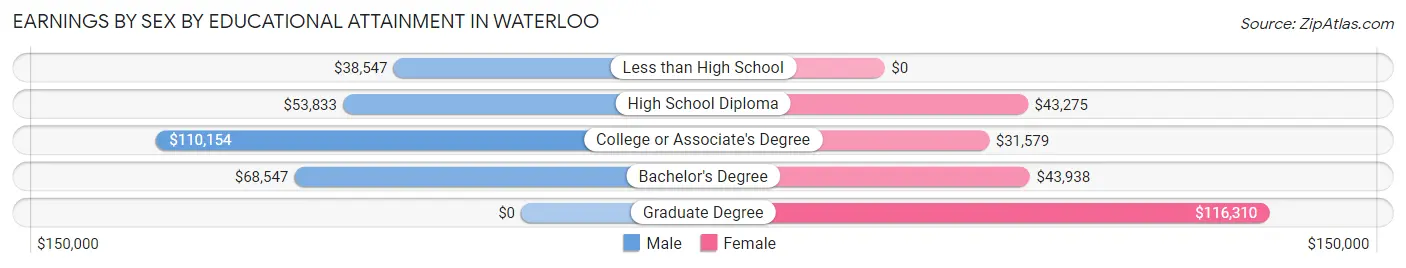
Earnings by Sex by Educational Attainment in Waterloo
Average earnings in Waterloo are $56,352 for men and $43,276 for women, a difference of 23.2%. Men with an educational attainment of college or associate's degree enjoy the highest average annual earnings of $110,154, while those with less than high school education earn the least with $38,547. Women with an educational attainment of graduate degree earn the most with the average annual earnings of $116,310, while those with college or associate's degree education have the smallest earnings of $31,579.
| Educational Attainment | Male Income | Female Income |
| Less than High School | $38,547 | $0 |
| High School Diploma | $53,833 | $43,275 |
| College or Associate's Degree | $110,154 | $31,579 |
| Bachelor's Degree | $68,547 | $43,938 |
| Graduate Degree | - | - |
| Total | $56,352 | $43,276 |
Family Income in Waterloo
Family Income Brackets in Waterloo
According to the Waterloo family income data, there are 265 families falling into the $100,000 to $149,999 income range, which is the most common income bracket and makes up 27.0% of all families. Conversely, the $200,000+ income bracket is the least frequent group with only 14 families (1.4%) belonging to this category.
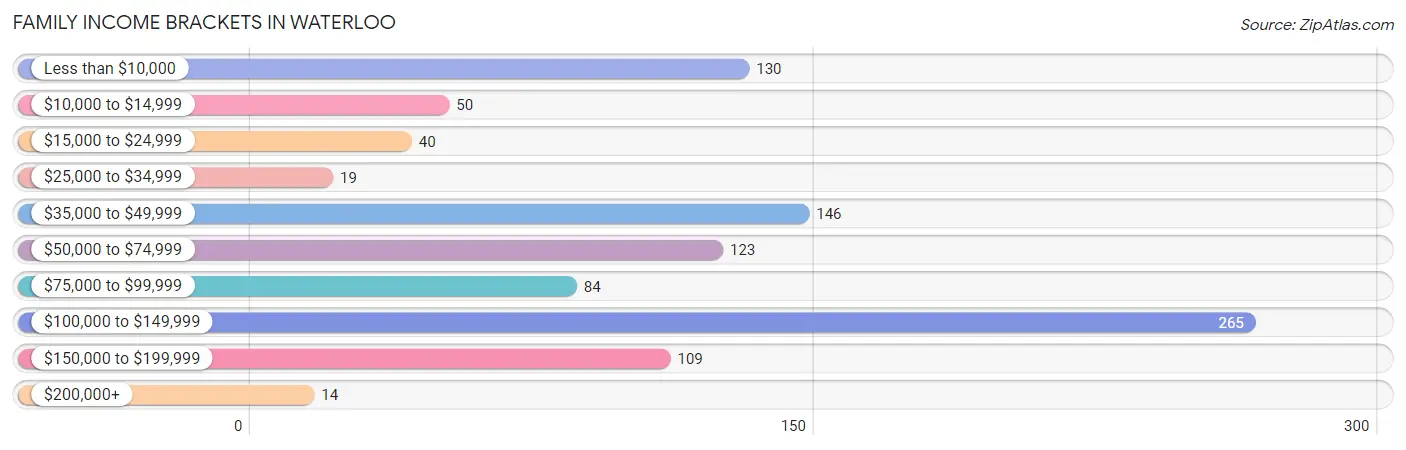
| Income Bracket | # Families | % Families |
| Less than $10,000 | 130 | 13.3% |
| $10,000 to $14,999 | 50 | 5.1% |
| $15,000 to $24,999 | 40 | 4.1% |
| $25,000 to $34,999 | 19 | 1.9% |
| $35,000 to $49,999 | 146 | 14.9% |
| $50,000 to $74,999 | 123 | 12.6% |
| $75,000 to $99,999 | 84 | 8.6% |
| $100,000 to $149,999 | 265 | 27.0% |
| $150,000 to $199,999 | 109 | 11.1% |
| $200,000+ | 14 | 1.4% |
Family Income by Famaliy Size in Waterloo
4-person families (101 | 10.3%) account for the highest median family income in Waterloo with $147,883 per family, while 4-person families (101 | 10.3%) have the highest median income of $36,971 per family member.
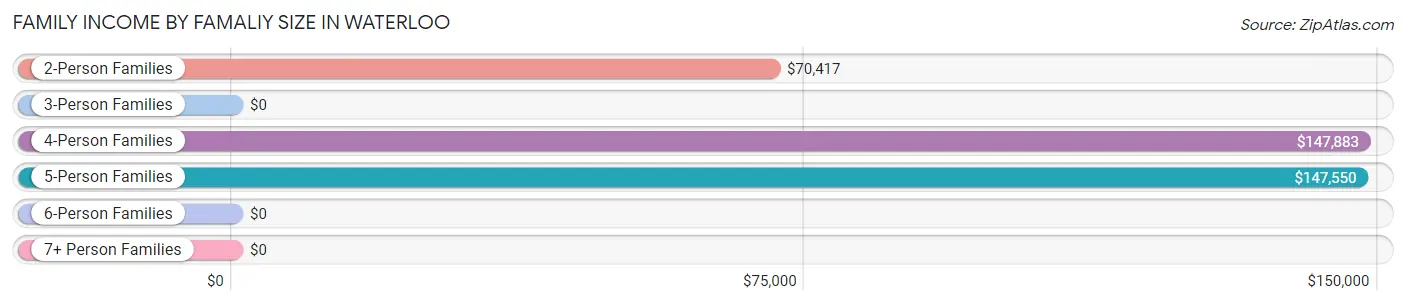
| Income Bracket | # Families | Median Income |
| 2-Person Families | 491 (50.1%) | $70,417 |
| 3-Person Families | 290 (29.6%) | $0 |
| 4-Person Families | 101 (10.3%) | $147,883 |
| 5-Person Families | 98 (10.0%) | $147,550 |
| 6-Person Families | 0 (0.0%) | $0 |
| 7+ Person Families | 0 (0.0%) | $0 |
| Total | 980 (100.0%) | $64,196 |
Family Income by Number of Earners in Waterloo
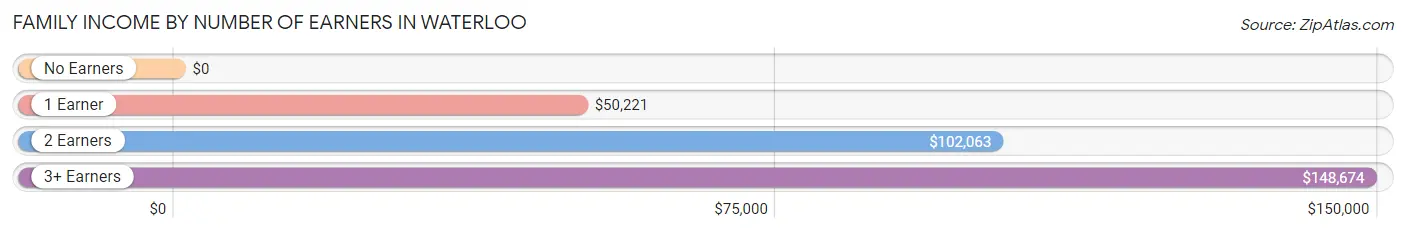
| Number of Earners | # Families | Median Income |
| No Earners | 234 (23.9%) | $0 |
| 1 Earner | 259 (26.4%) | $50,221 |
| 2 Earners | 354 (36.1%) | $102,063 |
| 3+ Earners | 133 (13.6%) | $148,674 |
| Total | 980 (100.0%) | $64,196 |
Household Income in Waterloo
Household Income Brackets in Waterloo
With 481 households falling in the category, the $100,000 to $149,999 income range is the most frequent in Waterloo, accounting for 30.9% of all households. In contrast, only 14 households (0.9%) fall into the $200,000+ income bracket, making it the least populous group.
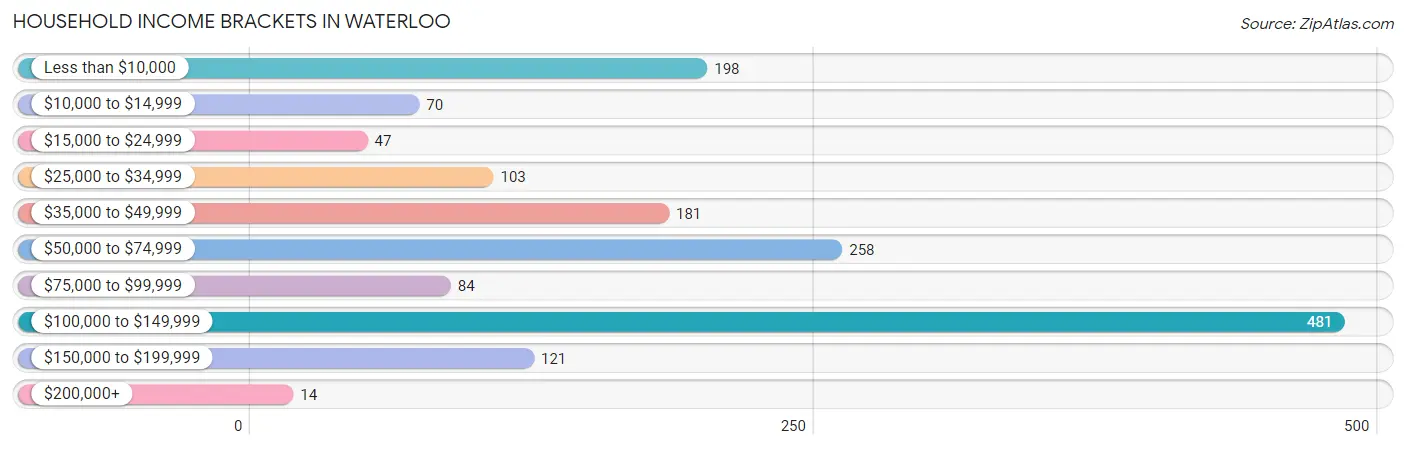
| Income Bracket | # Households | % Households |
| Less than $10,000 | 198 | 12.7% |
| $10,000 to $14,999 | 70 | 4.5% |
| $15,000 to $24,999 | 47 | 3.0% |
| $25,000 to $34,999 | 103 | 6.6% |
| $35,000 to $49,999 | 181 | 11.6% |
| $50,000 to $74,999 | 258 | 16.6% |
| $75,000 to $99,999 | 84 | 5.4% |
| $100,000 to $149,999 | 481 | 30.9% |
| $150,000 to $199,999 | 121 | 7.8% |
| $200,000+ | 14 | 0.9% |
Household Income by Householder Age in Waterloo
The median household income in Waterloo is $72,666, with the highest median household income of $110,244 found in the 45 to 64 years age bracket for the primary householder. A total of 589 households (37.8%) fall into this category. Meanwhile, the 15 to 24 years age bracket for the primary householder has the lowest median household income of $0, with 96 households (6.2%) in this group.
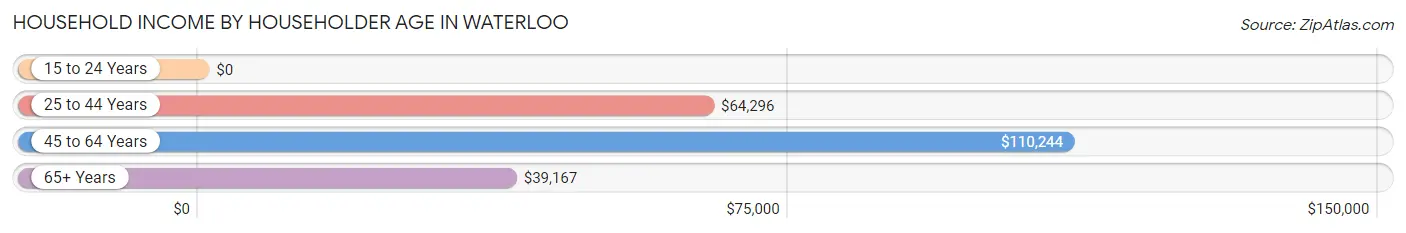
| Income Bracket | # Households | Median Income |
| 15 to 24 Years | 96 (6.2%) | $0 |
| 25 to 44 Years | 522 (33.5%) | $64,296 |
| 45 to 64 Years | 589 (37.8%) | $110,244 |
| 65+ Years | 350 (22.5%) | $39,167 |
| Total | 1,557 (100.0%) | $72,666 |
Poverty in Waterloo
Income Below Poverty by Sex and Age in Waterloo
With 12.9% poverty level for males and 24.2% for females among the residents of Waterloo, 15 year old males and 65 to 74 year old females are the most vulnerable to poverty, with 17 males (68.0%) and 98 females (49.5%) in their respective age groups living below the poverty level.
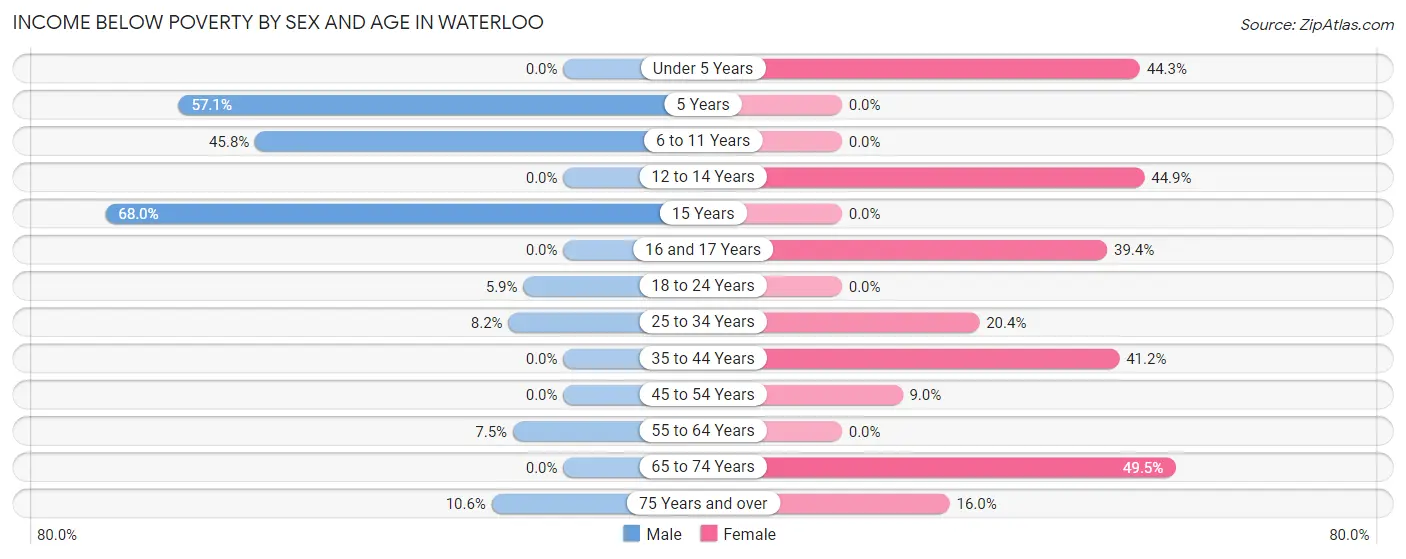
| Age Bracket | Male | Female |
| Under 5 Years | 0 (0.0%) | 50 (44.3%) |
| 5 Years | 52 (57.1%) | 0 (0.0%) |
| 6 to 11 Years | 108 (45.8%) | 0 (0.0%) |
| 12 to 14 Years | 0 (0.0%) | 53 (44.9%) |
| 15 Years | 17 (68.0%) | 0 (0.0%) |
| 16 and 17 Years | 0 (0.0%) | 13 (39.4%) |
| 18 to 24 Years | 17 (5.9%) | 0 (0.0%) |
| 25 to 34 Years | 19 (8.2%) | 40 (20.4%) |
| 35 to 44 Years | 0 (0.0%) | 110 (41.2%) |
| 45 to 54 Years | 0 (0.0%) | 20 (9.0%) |
| 55 to 64 Years | 17 (7.5%) | 0 (0.0%) |
| 65 to 74 Years | 0 (0.0%) | 98 (49.5%) |
| 75 Years and over | 5 (10.6%) | 20 (16.0%) |
| Total | 235 (12.9%) | 404 (24.2%) |
Income Above Poverty by Sex and Age in Waterloo
According to the poverty statistics in Waterloo, males aged under 5 years and females aged 6 to 11 years are the age groups that are most secure financially, with 100.0% of males and 100.0% of females in these age groups living above the poverty line.
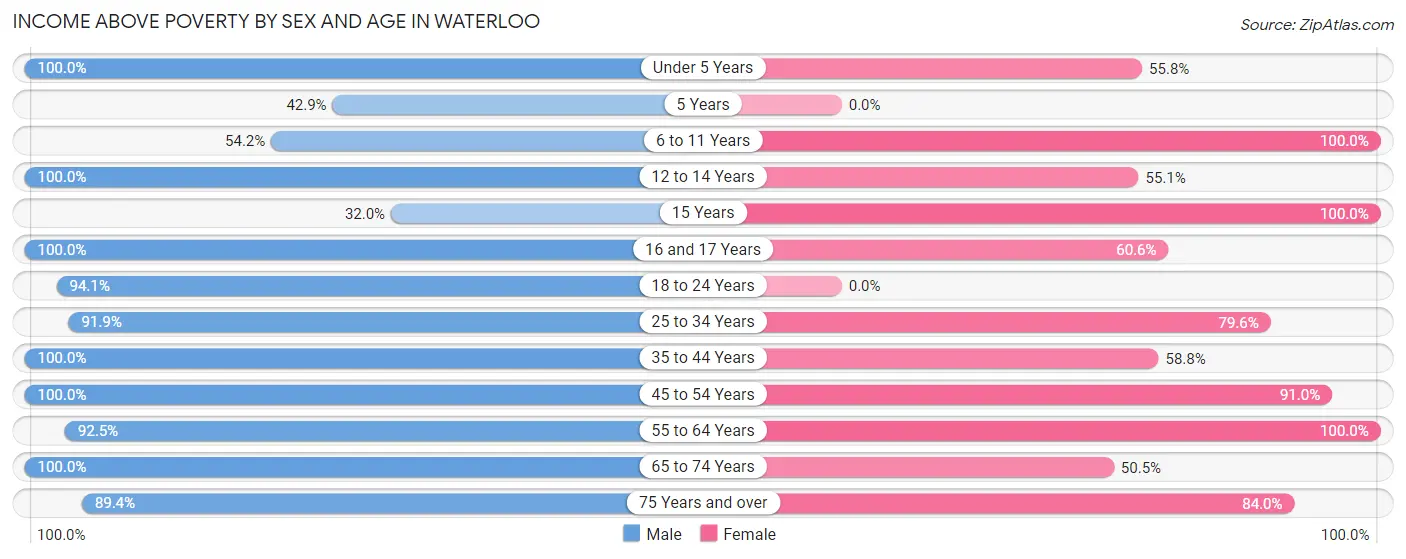
| Age Bracket | Male | Female |
| Under 5 Years | 40 (100.0%) | 63 (55.7%) |
| 5 Years | 39 (42.9%) | 0 (0.0%) |
| 6 to 11 Years | 128 (54.2%) | 106 (100.0%) |
| 12 to 14 Years | 9 (100.0%) | 65 (55.1%) |
| 15 Years | 8 (32.0%) | 10 (100.0%) |
| 16 and 17 Years | 29 (100.0%) | 20 (60.6%) |
| 18 to 24 Years | 269 (94.1%) | 0 (0.0%) |
| 25 to 34 Years | 214 (91.8%) | 156 (79.6%) |
| 35 to 44 Years | 158 (100.0%) | 157 (58.8%) |
| 45 to 54 Years | 282 (100.0%) | 202 (91.0%) |
| 55 to 64 Years | 210 (92.5%) | 284 (100.0%) |
| 65 to 74 Years | 158 (100.0%) | 100 (50.5%) |
| 75 Years and over | 42 (89.4%) | 105 (84.0%) |
| Total | 1,586 (87.1%) | 1,268 (75.8%) |
Income Below Poverty Among Married-Couple Families in Waterloo
The poverty statistics for married-couple families in Waterloo show that 8.1% or 50 of the total 619 families live below the poverty line. Families with no children have the highest poverty rate of 11.3%, comprising of 50 families. On the other hand, families with 1 or 2 children have the lowest poverty rate of 0.0%, which includes 0 families.
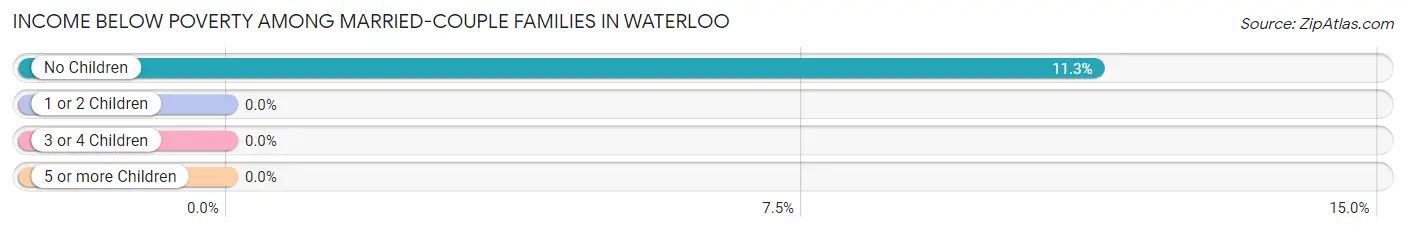
| Children | Above Poverty | Below Poverty |
| No Children | 392 (88.7%) | 50 (11.3%) |
| 1 or 2 Children | 149 (100.0%) | 0 (0.0%) |
| 3 or 4 Children | 28 (100.0%) | 0 (0.0%) |
| 5 or more Children | 0 (0.0%) | 0 (0.0%) |
| Total | 569 (91.9%) | 50 (8.1%) |
Income Below Poverty Among Single-Parent Households in Waterloo
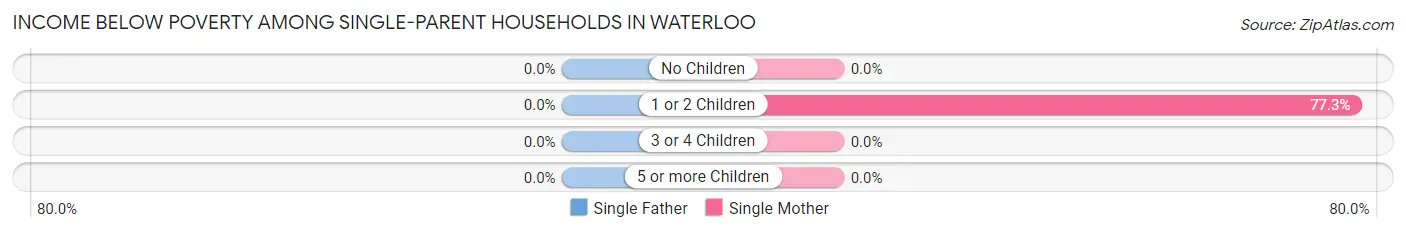
| Children | Single Father | Single Mother |
| No Children | 0 (0.0%) | 0 (0.0%) |
| 1 or 2 Children | 0 (0.0%) | 170 (77.3%) |
| 3 or 4 Children | 0 (0.0%) | 0 (0.0%) |
| 5 or more Children | 0 (0.0%) | 0 (0.0%) |
| Total | 0 (0.0%) | 170 (69.7%) |
Income Below Poverty Among Married-Couple vs Single-Parent Households in Waterloo
The poverty data for Waterloo shows that 50 of the married-couple family households (8.1%) and 170 of the single-parent households (47.1%) are living below the poverty level. Within the married-couple family households, those with no children have the highest poverty rate, with 50 households (11.3%) falling below the poverty line. Among the single-parent households, those with 1 or 2 children have the highest poverty rate, with 170 household (52.1%) living below poverty.
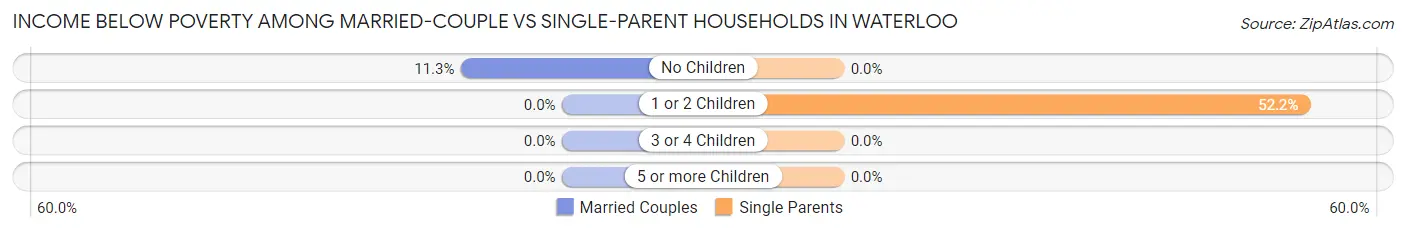
| Children | Married-Couple Families | Single-Parent Households |
| No Children | 50 (11.3%) | 0 (0.0%) |
| 1 or 2 Children | 0 (0.0%) | 170 (52.1%) |
| 3 or 4 Children | 0 (0.0%) | 0 (0.0%) |
| 5 or more Children | 0 (0.0%) | 0 (0.0%) |
| Total | 50 (8.1%) | 170 (47.1%) |
Race in Waterloo
The most populous races in Waterloo are White / Caucasian (3,051 | 86.9%), Two or more Races (378 | 10.8%), and Hispanic or Latino (251 | 7.1%).
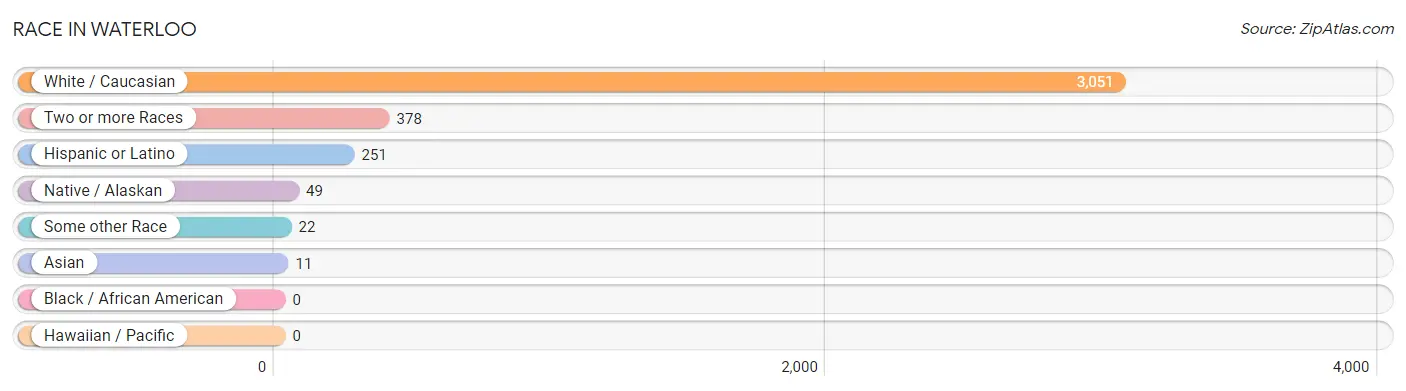
| Race | # Population | % Population |
| Asian | 11 | 0.3% |
| Black / African American | 0 | 0.0% |
| Hawaiian / Pacific | 0 | 0.0% |
| Hispanic or Latino | 251 | 7.1% |
| Native / Alaskan | 49 | 1.4% |
| White / Caucasian | 3,051 | 86.9% |
| Two or more Races | 378 | 10.8% |
| Some other Race | 22 | 0.6% |
| Total | 3,511 | 100.0% |
Ancestry in Waterloo
The most populous ancestries reported in Waterloo are German (1,527 | 43.5%), Norwegian (618 | 17.6%), Irish (351 | 10.0%), Mexican (213 | 6.1%), and English (149 | 4.2%), together accounting for 81.4% of all Waterloo residents.
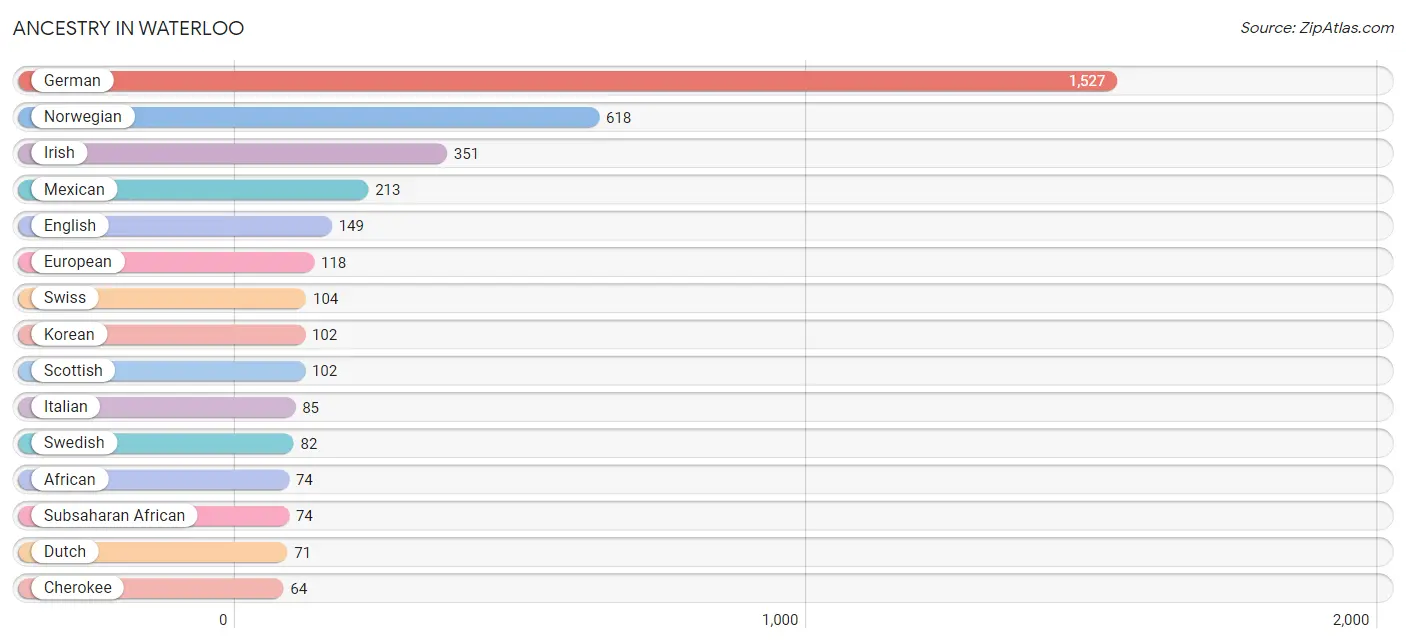
| Ancestry | # Population | % Population |
| African | 74 | 2.1% |
| American | 46 | 1.3% |
| British | 10 | 0.3% |
| Cherokee | 64 | 1.8% |
| Choctaw | 15 | 0.4% |
| Croatian | 30 | 0.9% |
| Czech | 27 | 0.8% |
| Danish | 63 | 1.8% |
| Dutch | 71 | 2.0% |
| English | 149 | 4.2% |
| European | 118 | 3.4% |
| French | 62 | 1.8% |
| German | 1,527 | 43.5% |
| Greek | 17 | 0.5% |
| Hungarian | 14 | 0.4% |
| Indian (Asian) | 11 | 0.3% |
| Irish | 351 | 10.0% |
| Italian | 85 | 2.4% |
| Korean | 102 | 2.9% |
| Mexican | 213 | 6.1% |
| Northern European | 50 | 1.4% |
| Norwegian | 618 | 17.6% |
| Polish | 28 | 0.8% |
| Puerto Rican | 38 | 1.1% |
| Scottish | 102 | 2.9% |
| Slovak | 30 | 0.9% |
| Subsaharan African | 74 | 2.1% |
| Swedish | 82 | 2.3% |
| Swiss | 104 | 3.0% | View All 29 Rows |
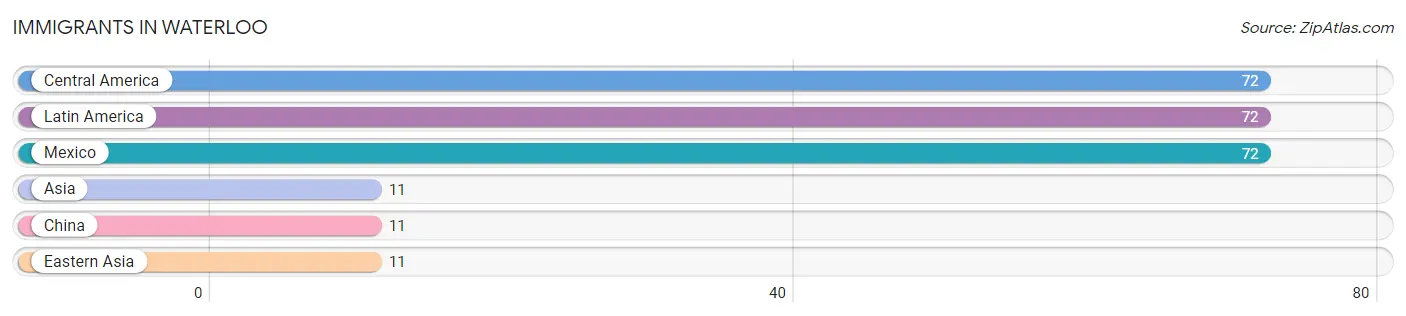
Immigrants in Waterloo
The most numerous immigrant groups reported in Waterloo came from Central America (72 | 2.1%), Latin America (72 | 2.1%), Mexico (72 | 2.1%), Asia (11 | 0.3%), and China (11 | 0.3%), together accounting for 6.8% of all Waterloo residents.
| Immigration Origin | # Population | % Population |
| Asia | 11 | 0.3% |
| Central America | 72 | 2.1% |
| China | 11 | 0.3% |
| Eastern Asia | 11 | 0.3% |
| Latin America | 72 | 2.1% |
| Mexico | 72 | 2.1% | View All 6 Rows |
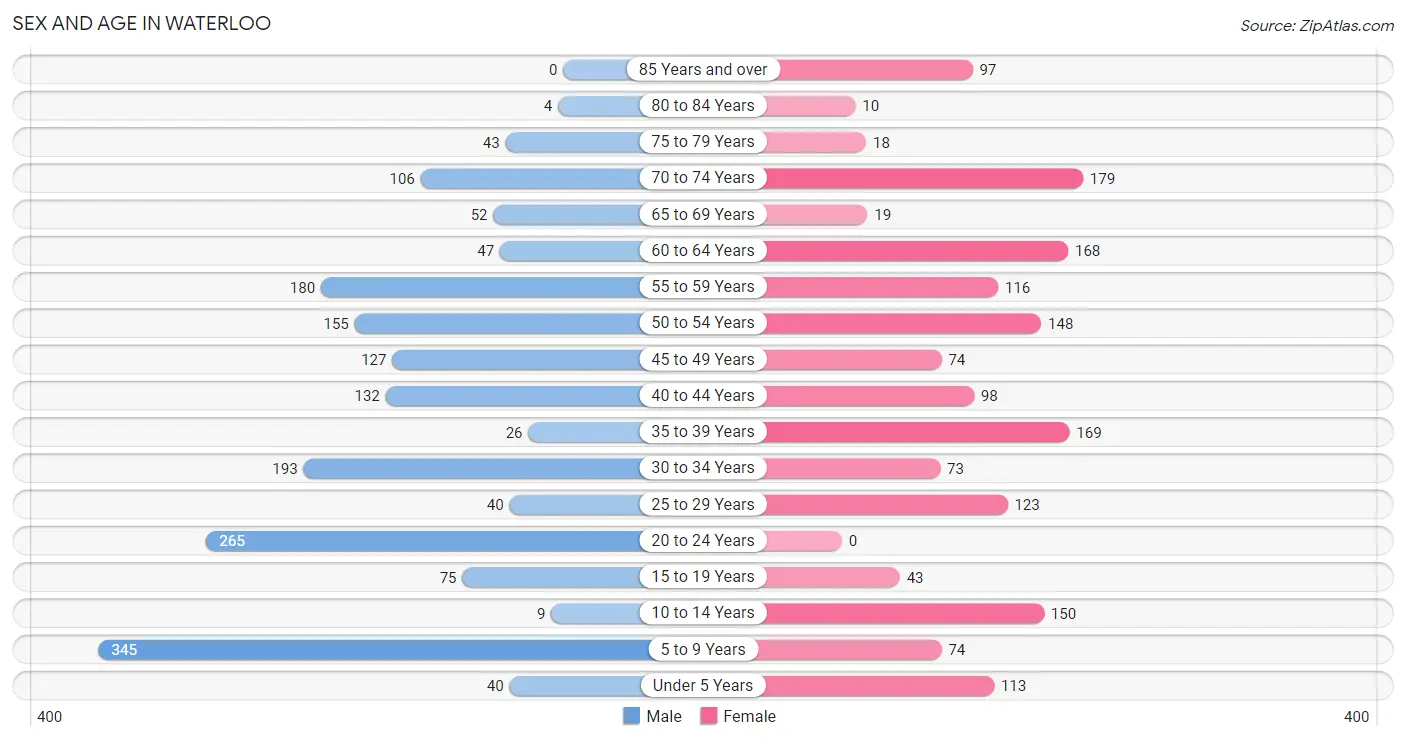
Sex and Age in Waterloo
Sex and Age in Waterloo
The most populous age groups in Waterloo are 5 to 9 Years (345 | 18.8%) for men and 70 to 74 Years (179 | 10.7%) for women.
| Age Bracket | Male | Female |
| Under 5 Years | 40 (2.2%) | 113 (6.8%) |
| 5 to 9 Years | 345 (18.8%) | 74 (4.4%) |
| 10 to 14 Years | 9 (0.5%) | 150 (9.0%) |
| 15 to 19 Years | 75 (4.1%) | 43 (2.6%) |
| 20 to 24 Years | 265 (14.4%) | 0 (0.0%) |
| 25 to 29 Years | 40 (2.2%) | 123 (7.4%) |
| 30 to 34 Years | 193 (10.5%) | 73 (4.4%) |
| 35 to 39 Years | 26 (1.4%) | 169 (10.1%) |
| 40 to 44 Years | 132 (7.2%) | 98 (5.9%) |
| 45 to 49 Years | 127 (6.9%) | 74 (4.4%) |
| 50 to 54 Years | 155 (8.4%) | 148 (8.8%) |
| 55 to 59 Years | 180 (9.8%) | 116 (6.9%) |
| 60 to 64 Years | 47 (2.6%) | 168 (10.1%) |
| 65 to 69 Years | 52 (2.8%) | 19 (1.1%) |
| 70 to 74 Years | 106 (5.8%) | 179 (10.7%) |
| 75 to 79 Years | 43 (2.3%) | 18 (1.1%) |
| 80 to 84 Years | 4 (0.2%) | 10 (0.6%) |
| 85 Years and over | 0 (0.0%) | 97 (5.8%) |
| Total | 1,839 (100.0%) | 1,672 (100.0%) |
Families and Households in Waterloo
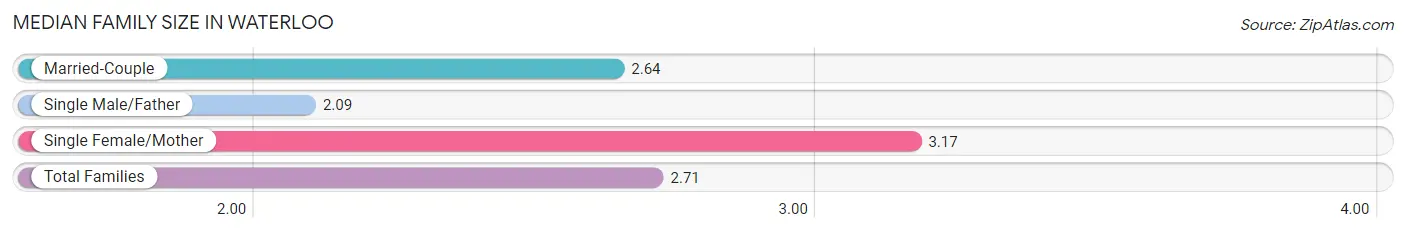
Median Family Size in Waterloo
The median family size in Waterloo is 2.71 persons per family, with single female/mother families (244 | 24.9%) accounting for the largest median family size of 3.17 persons per family. On the other hand, single male/father families (117 | 11.9%) represent the smallest median family size with 2.09 persons per family.
| Family Type | # Families | Family Size |
| Married-Couple | 619 (63.2%) | 2.64 |
| Single Male/Father | 117 (11.9%) | 2.09 |
| Single Female/Mother | 244 (24.9%) | 3.17 |
| Total Families | 980 (100.0%) | 2.71 |
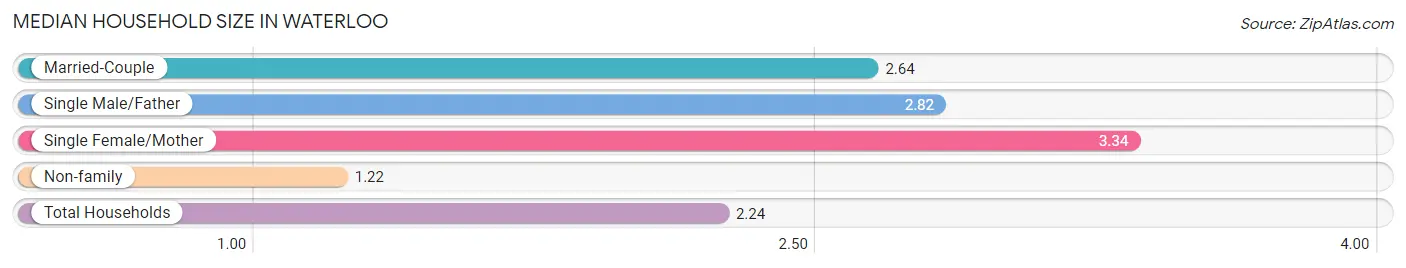
Median Household Size in Waterloo
The median household size in Waterloo is 2.24 persons per household, with single female/mother households (244 | 15.7%) accounting for the largest median household size of 3.34 persons per household. non-family households (577 | 37.1%) represent the smallest median household size with 1.22 persons per household.
| Household Type | # Households | Household Size |
| Married-Couple | 619 (39.8%) | 2.64 |
| Single Male/Father | 117 (7.5%) | 2.82 |
| Single Female/Mother | 244 (15.7%) | 3.34 |
| Non-family | 577 (37.1%) | 1.22 |
| Total Households | 1,557 (100.0%) | 2.24 |
Household Size by Marriage Status in Waterloo
Out of a total of 1,557 households in Waterloo, 980 (62.9%) are family households, while 577 (37.1%) are nonfamily households. The most numerous type of family households are 2-person households, comprising 432, and the most common type of nonfamily households are 1-person households, comprising 486.
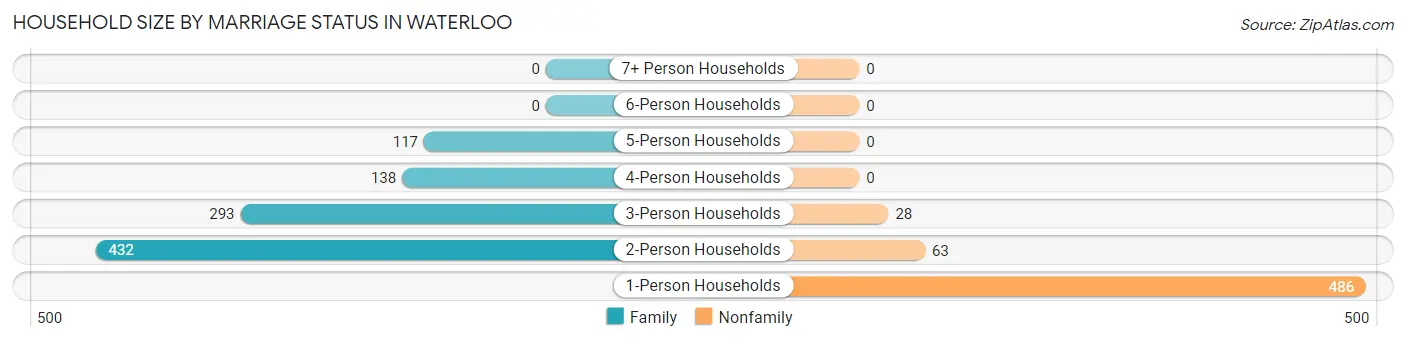
| Household Size | Family Households | Nonfamily Households |
| 1-Person Households | - | 486 (31.2%) |
| 2-Person Households | 432 (27.8%) | 63 (4.1%) |
| 3-Person Households | 293 (18.8%) | 28 (1.8%) |
| 4-Person Households | 138 (8.9%) | 0 (0.0%) |
| 5-Person Households | 117 (7.5%) | 0 (0.0%) |
| 6-Person Households | 0 (0.0%) | 0 (0.0%) |
| 7+ Person Households | 0 (0.0%) | 0 (0.0%) |
| Total | 980 (62.9%) | 577 (37.1%) |
Female Fertility in Waterloo
Fertility by Age in Waterloo
Average fertility rate in Waterloo is 120.0 births per 1,000 women. Women in the age bracket of 20 to 34 years have the highest fertility rate with 276.0 births per 1,000 women. Women in the age bracket of 20 to 34 years acount for 72.0% of all women with births.
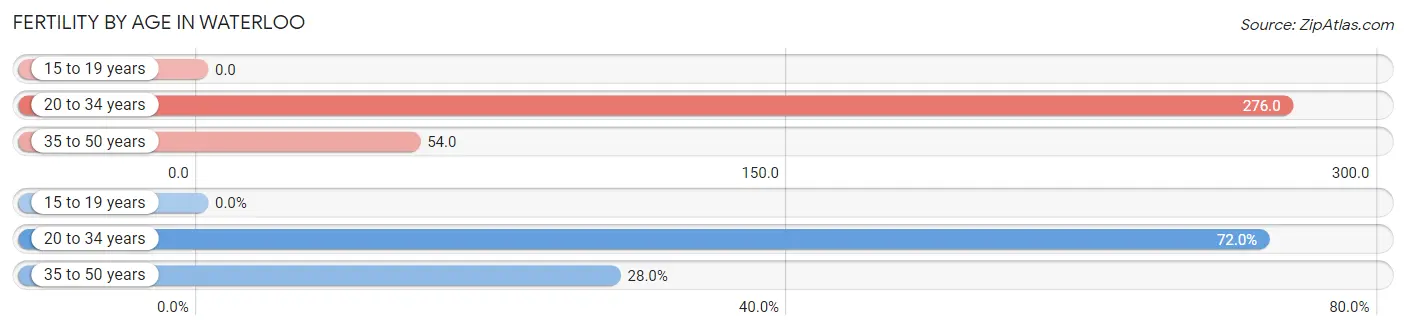
| Age Bracket | Women with Births | Births / 1,000 Women |
| 15 to 19 years | 0 (0.0%) | 0.0 |
| 20 to 34 years | 54 (72.0%) | 276.0 |
| 35 to 50 years | 21 (28.0%) | 54.0 |
| Total | 75 (100.0%) | 120.0 |
Fertility by Age by Marriage Status in Waterloo
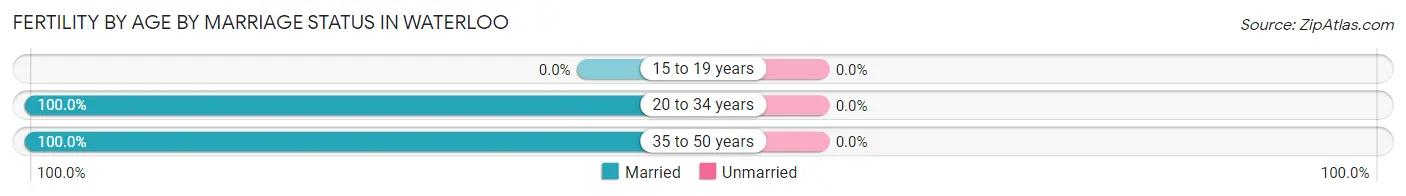
| Age Bracket | Married | Unmarried |
| 15 to 19 years | 0 (0.0%) | 0 (0.0%) |
| 20 to 34 years | 54 (100.0%) | 0 (0.0%) |
| 35 to 50 years | 21 (100.0%) | 0 (0.0%) |
| Total | 75 (100.0%) | 0 (0.0%) |
Fertility by Education in Waterloo
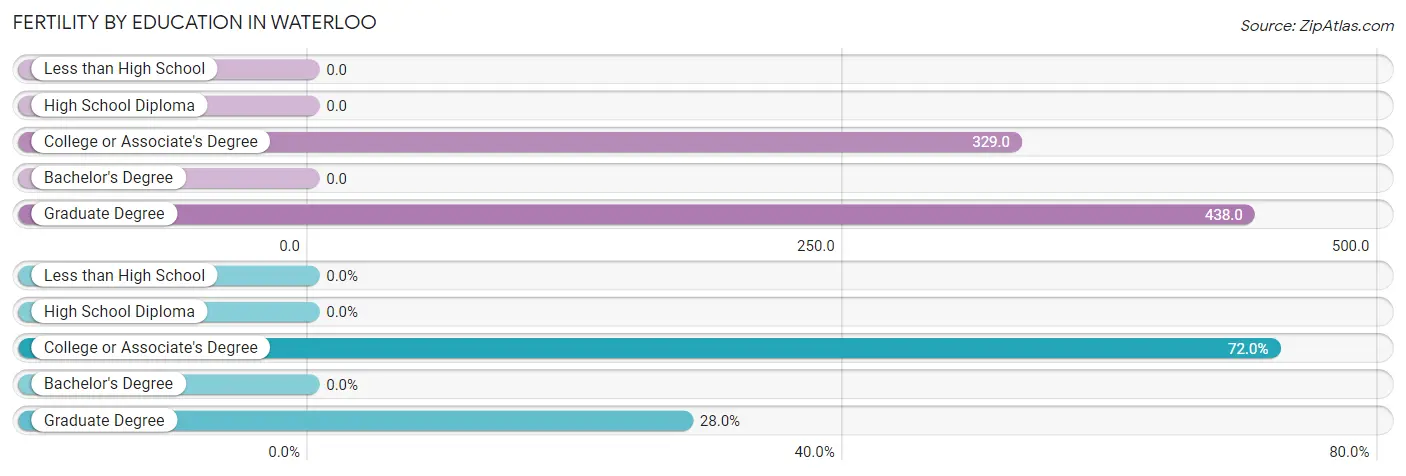
| Educational Attainment | Women with Births | Births / 1,000 Women |
| Less than High School | 0 (0.0%) | 0.0 |
| High School Diploma | 0 (0.0%) | 0.0 |
| College or Associate's Degree | 54 (72.0%) | 329.0 |
| Bachelor's Degree | 0 (0.0%) | 0.0 |
| Graduate Degree | 21 (28.0%) | 438.0 |
| Total | 75 (100.0%) | 120.0 |
Fertility by Education by Marriage Status in Waterloo
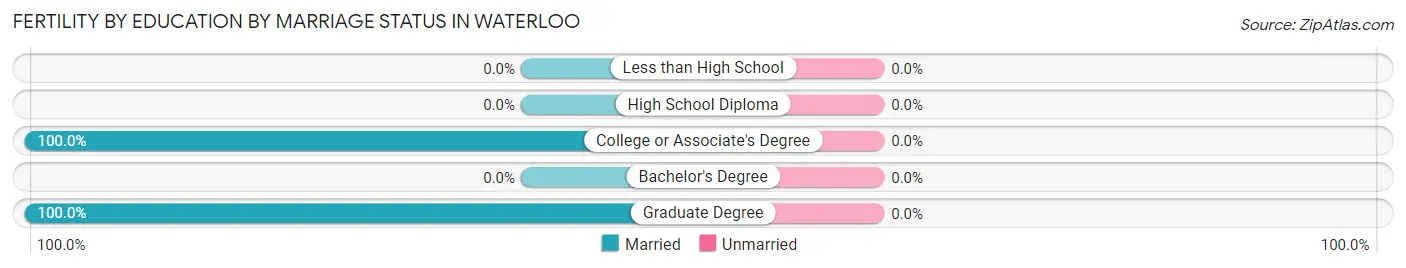
| Educational Attainment | Married | Unmarried |
| Less than High School | 0 (0.0%) | 0 (0.0%) |
| High School Diploma | 0 (0.0%) | 0 (0.0%) |
| College or Associate's Degree | 54 (100.0%) | 0 (0.0%) |
| Bachelor's Degree | 0 (0.0%) | 0 (0.0%) |
| Graduate Degree | 21 (100.0%) | 0 (0.0%) |
| Total | 75 (100.0%) | 0 (0.0%) |
Employment Characteristics in Waterloo
Employment by Class of Employer in Waterloo
Among the 1,908 employed individuals in Waterloo, private company employees (1,536 | 80.5%), local government employees (135 | 7.1%), and not-for-profit organizations (96 | 5.0%) make up the most common classes of employment.
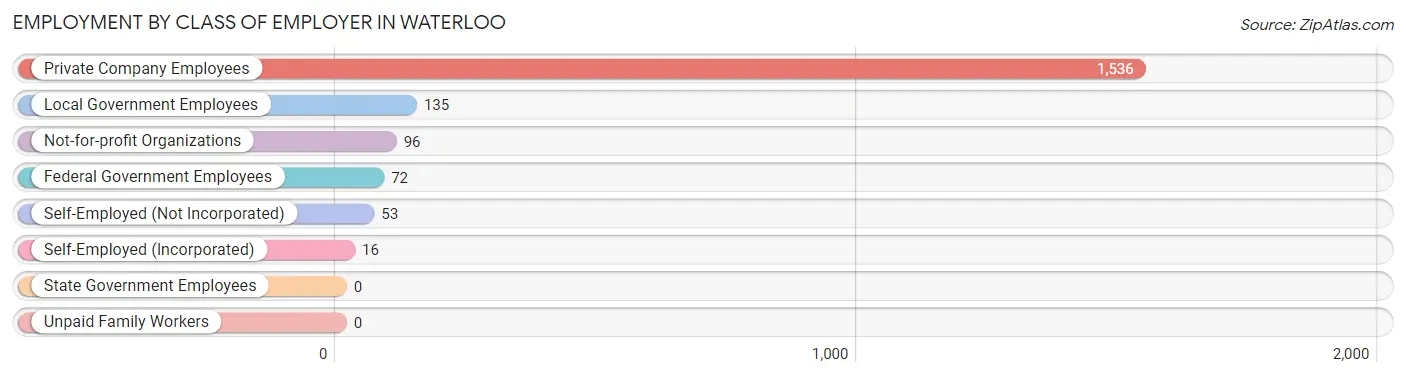
| Employer Class | # Employees | % Employees |
| Private Company Employees | 1,536 | 80.5% |
| Self-Employed (Incorporated) | 16 | 0.8% |
| Self-Employed (Not Incorporated) | 53 | 2.8% |
| Not-for-profit Organizations | 96 | 5.0% |
| Local Government Employees | 135 | 7.1% |
| State Government Employees | 0 | 0.0% |
| Federal Government Employees | 72 | 3.8% |
| Unpaid Family Workers | 0 | 0.0% |
| Total | 1,908 | 100.0% |
Employment Status by Age in Waterloo
According to the labor force statistics for Waterloo, out of the total population over 16 years of age (2,745), 72.0% or 1,976 individuals are in the labor force, with 3.5% or 69 of them unemployed. The age group with the highest labor force participation rate is 30 to 34 years, with 94.0% or 250 individuals in the labor force. Within the labor force, the 16 to 19 years age range has the highest percentage of unemployed individuals, with 39.4% or 13 of them being unemployed.
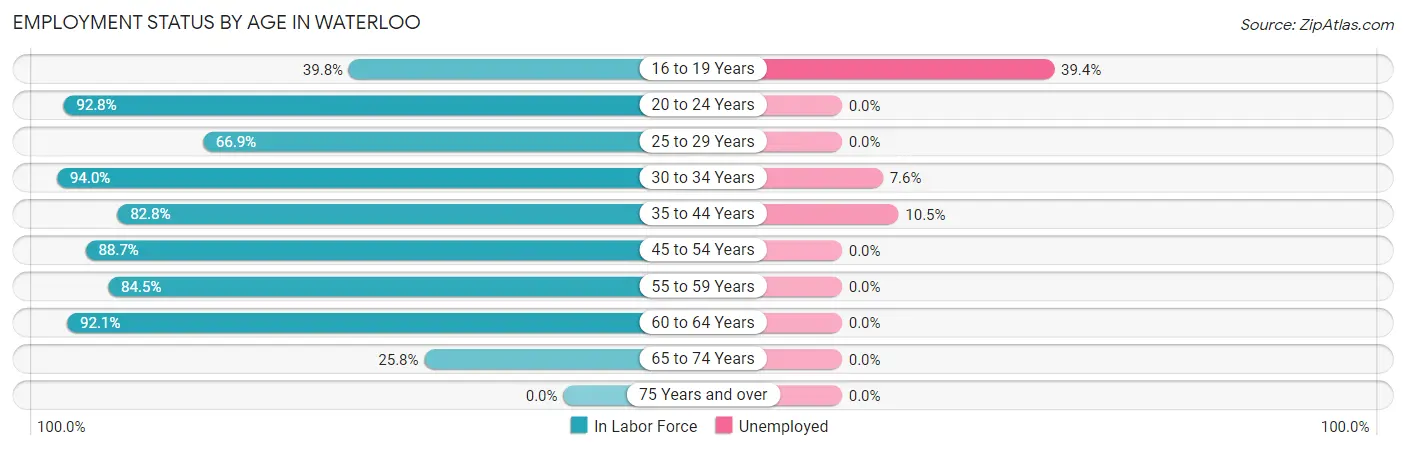
| Age Bracket | In Labor Force | Unemployed |
| 16 to 19 Years | 33 (39.8%) | 13 (39.4%) |
| 20 to 24 Years | 246 (92.8%) | 0 (0.0%) |
| 25 to 29 Years | 109 (66.9%) | 0 (0.0%) |
| 30 to 34 Years | 250 (94.0%) | 19 (7.6%) |
| 35 to 44 Years | 352 (82.8%) | 37 (10.5%) |
| 45 to 54 Years | 447 (88.7%) | 0 (0.0%) |
| 55 to 59 Years | 250 (84.5%) | 0 (0.0%) |
| 60 to 64 Years | 198 (92.1%) | 0 (0.0%) |
| 65 to 74 Years | 92 (25.8%) | 0 (0.0%) |
| 75 Years and over | 0 (0.0%) | 0 (0.0%) |
| Total | 1,976 (72.0%) | 69 (3.5%) |
Employment Status by Educational Attainment in Waterloo
According to labor force statistics for Waterloo, 85.9% of individuals (1,605) out of the total population between 25 and 64 years of age (1,869) are in the labor force, with 3.5% or 56 of them being unemployed. The group with the highest labor force participation rate are those with the educational attainment of less than high school, with 91.7% or 99 individuals in the labor force. Within the labor force, individuals with college / associate degree education have the highest percentage of unemployment, with 11.7% or 37 of them being unemployed.
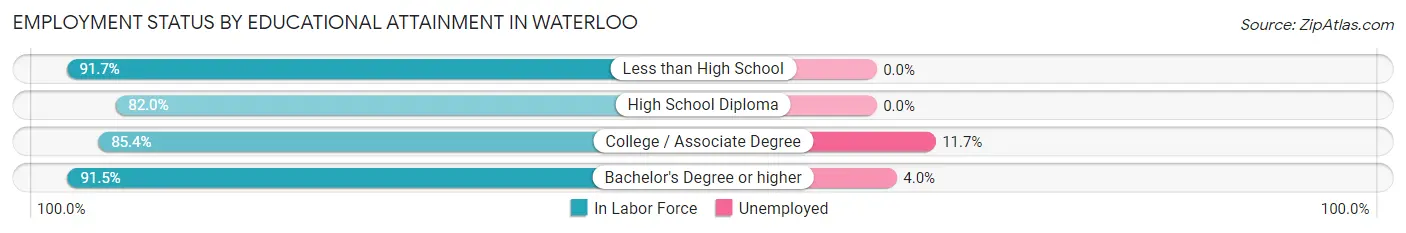
| Educational Attainment | In Labor Force | Unemployed |
| Less than High School | 99 (91.7%) | 0 (0.0%) |
| High School Diploma | 708 (82.0%) | 0 (0.0%) |
| College / Associate Degree | 317 (85.4%) | 43 (11.7%) |
| Bachelor's Degree or higher | 482 (91.5%) | 21 (4.0%) |
| Total | 1,605 (85.9%) | 65 (3.5%) |
Employment Occupations by Sex in Waterloo
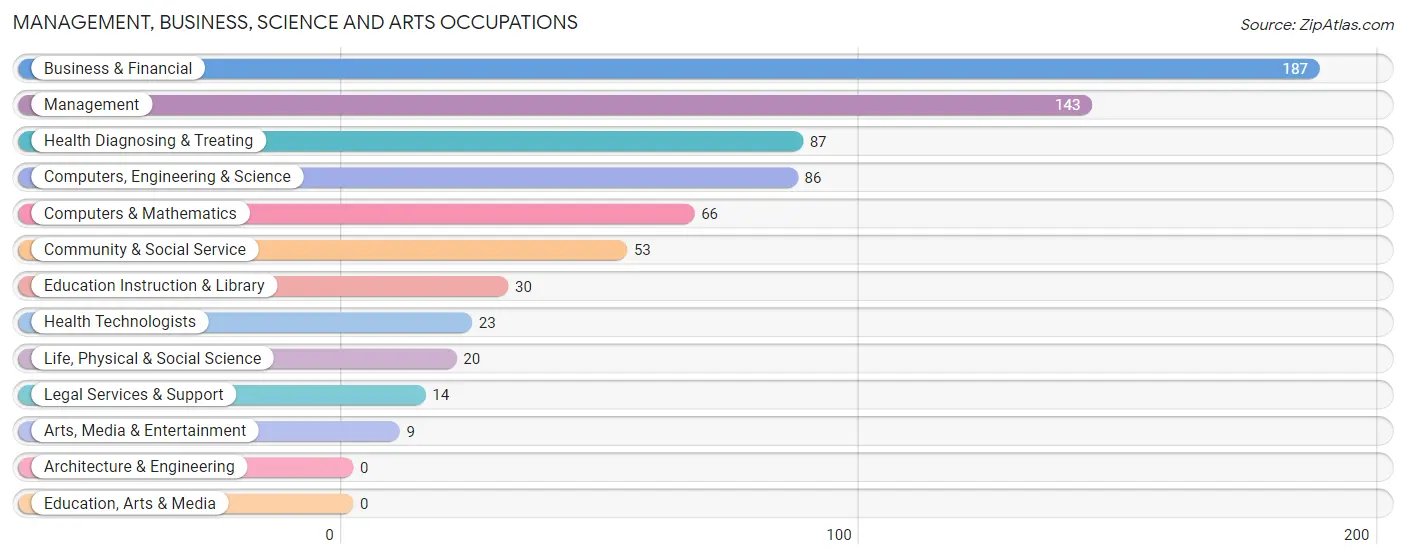
Management, Business, Science and Arts Occupations
The most common Management, Business, Science and Arts occupations in Waterloo are Business & Financial (187 | 9.9%), Management (143 | 7.5%), Health Diagnosing & Treating (87 | 4.6%), Computers, Engineering & Science (86 | 4.5%), and Computers & Mathematics (66 | 3.5%).
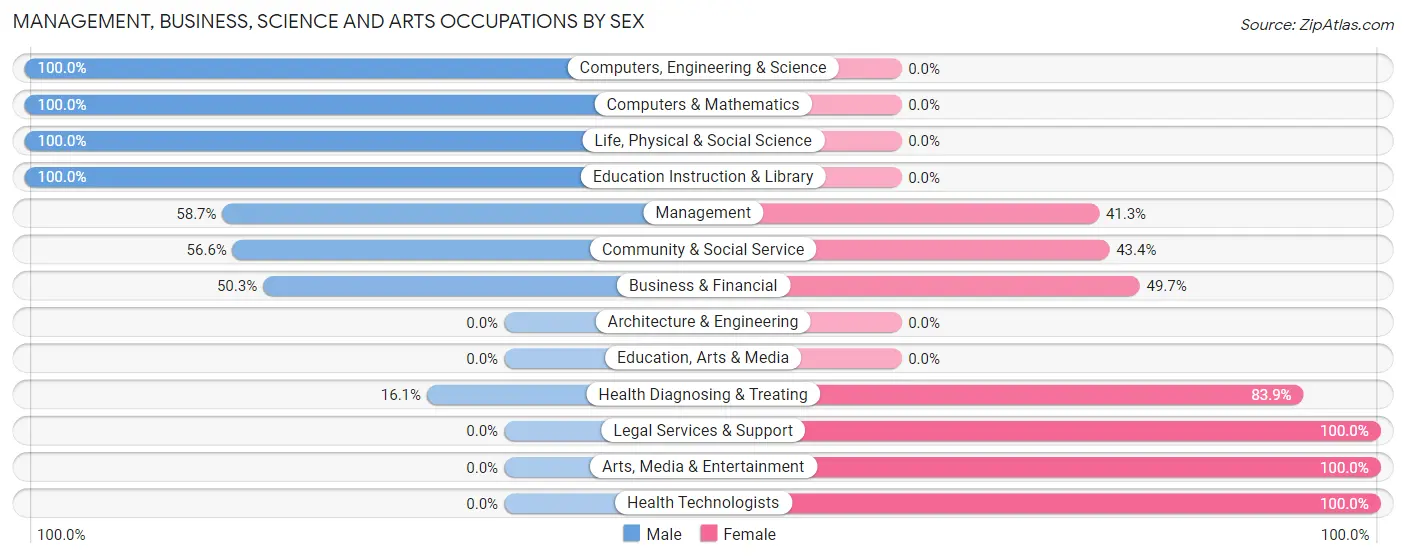
Management, Business, Science and Arts Occupations by Sex
Within the Management, Business, Science and Arts occupations in Waterloo, the most male-oriented occupations are Computers, Engineering & Science (100.0%), Computers & Mathematics (100.0%), and Life, Physical & Social Science (100.0%), while the most female-oriented occupations are Legal Services & Support (100.0%), Arts, Media & Entertainment (100.0%), and Health Technologists (100.0%).
| Occupation | Male | Female |
| Management | 84 (58.7%) | 59 (41.3%) |
| Business & Financial | 94 (50.3%) | 93 (49.7%) |
| Computers, Engineering & Science | 86 (100.0%) | 0 (0.0%) |
| Computers & Mathematics | 66 (100.0%) | 0 (0.0%) |
| Architecture & Engineering | 0 (0.0%) | 0 (0.0%) |
| Life, Physical & Social Science | 20 (100.0%) | 0 (0.0%) |
| Community & Social Service | 30 (56.6%) | 23 (43.4%) |
| Education, Arts & Media | 0 (0.0%) | 0 (0.0%) |
| Legal Services & Support | 0 (0.0%) | 14 (100.0%) |
| Education Instruction & Library | 30 (100.0%) | 0 (0.0%) |
| Arts, Media & Entertainment | 0 (0.0%) | 9 (100.0%) |
| Health Diagnosing & Treating | 14 (16.1%) | 73 (83.9%) |
| Health Technologists | 0 (0.0%) | 23 (100.0%) |
| Total (Category) | 308 (55.4%) | 248 (44.6%) |
| Total (Overall) | 1,148 (60.5%) | 751 (39.6%) |
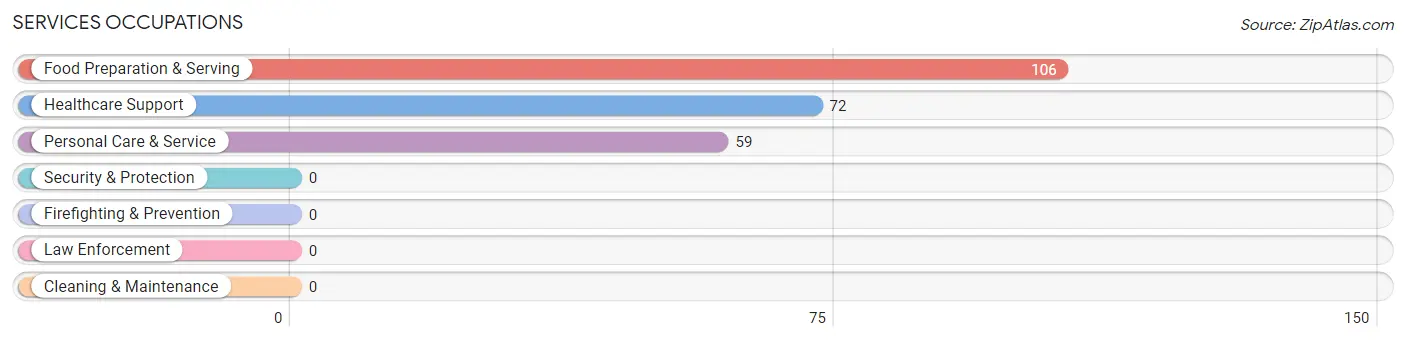
Services Occupations
The most common Services occupations in Waterloo are Food Preparation & Serving (106 | 5.6%), Healthcare Support (72 | 3.8%), and Personal Care & Service (59 | 3.1%).
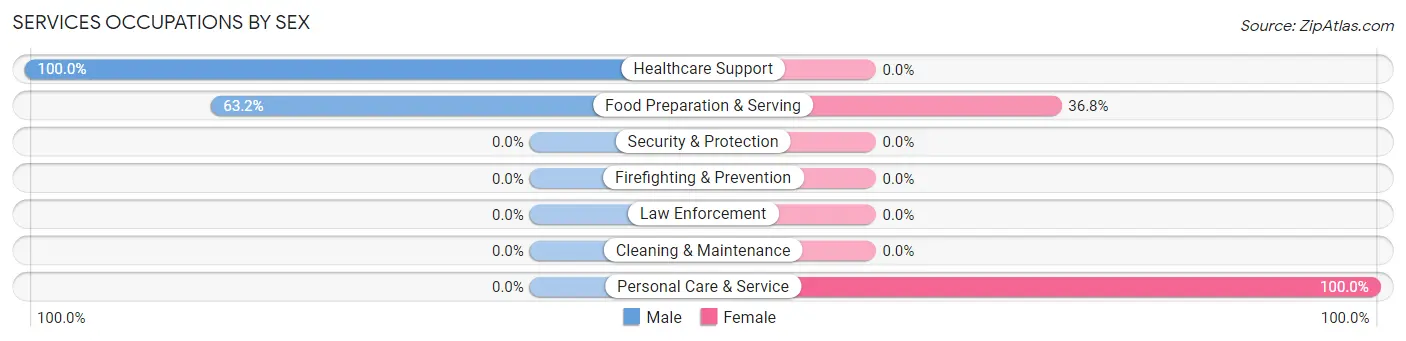
Services Occupations by Sex
Within the Services occupations in Waterloo, the most male-oriented occupations are Healthcare Support (100.0%), and Food Preparation & Serving (63.2%), while the most female-oriented occupations are Personal Care & Service (100.0%), and Food Preparation & Serving (36.8%).
| Occupation | Male | Female |
| Healthcare Support | 72 (100.0%) | 0 (0.0%) |
| Security & Protection | 0 (0.0%) | 0 (0.0%) |
| Firefighting & Prevention | 0 (0.0%) | 0 (0.0%) |
| Law Enforcement | 0 (0.0%) | 0 (0.0%) |
| Food Preparation & Serving | 67 (63.2%) | 39 (36.8%) |
| Cleaning & Maintenance | 0 (0.0%) | 0 (0.0%) |
| Personal Care & Service | 0 (0.0%) | 59 (100.0%) |
| Total (Category) | 139 (58.7%) | 98 (41.3%) |
| Total (Overall) | 1,148 (60.5%) | 751 (39.6%) |
Sales and Office Occupations
The most common Sales and Office occupations in Waterloo are Office & Administration (133 | 7.0%), and Sales & Related (128 | 6.7%).

Sales and Office Occupations by Sex
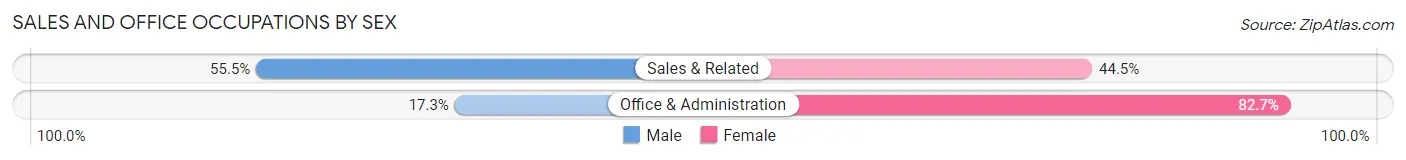
| Occupation | Male | Female |
| Sales & Related | 71 (55.5%) | 57 (44.5%) |
| Office & Administration | 23 (17.3%) | 110 (82.7%) |
| Total (Category) | 94 (36.0%) | 167 (64.0%) |
| Total (Overall) | 1,148 (60.5%) | 751 (39.6%) |
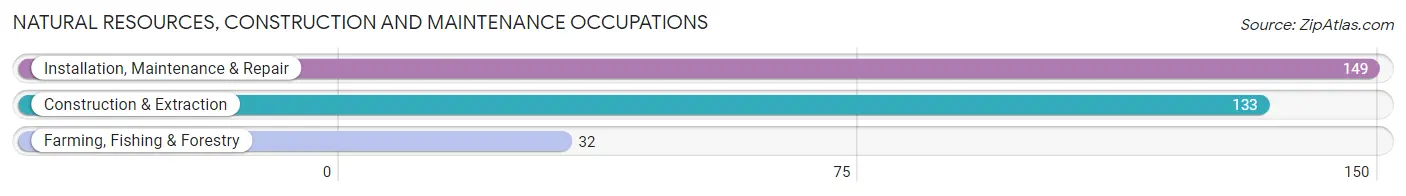
Natural Resources, Construction and Maintenance Occupations
The most common Natural Resources, Construction and Maintenance occupations in Waterloo are Installation, Maintenance & Repair (149 | 7.9%), Construction & Extraction (133 | 7.0%), and Farming, Fishing & Forestry (32 | 1.7%).
Natural Resources, Construction and Maintenance Occupations by Sex
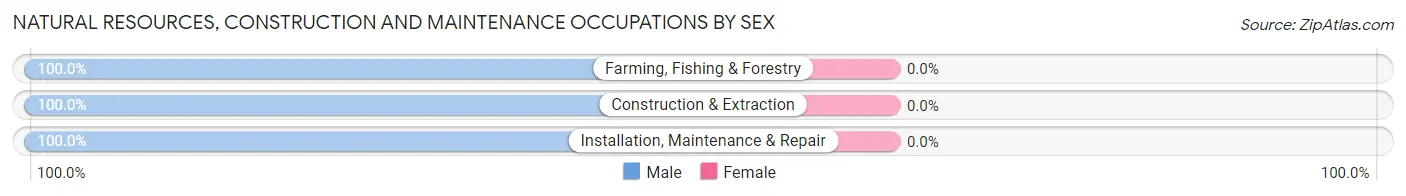
| Occupation | Male | Female |
| Farming, Fishing & Forestry | 32 (100.0%) | 0 (0.0%) |
| Construction & Extraction | 133 (100.0%) | 0 (0.0%) |
| Installation, Maintenance & Repair | 149 (100.0%) | 0 (0.0%) |
| Total (Category) | 314 (100.0%) | 0 (0.0%) |
| Total (Overall) | 1,148 (60.5%) | 751 (39.6%) |
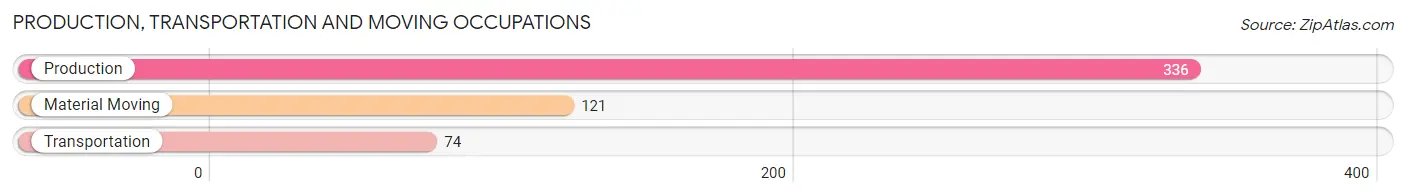
Production, Transportation and Moving Occupations
The most common Production, Transportation and Moving occupations in Waterloo are Production (336 | 17.7%), Material Moving (121 | 6.4%), and Transportation (74 | 3.9%).
Production, Transportation and Moving Occupations by Sex
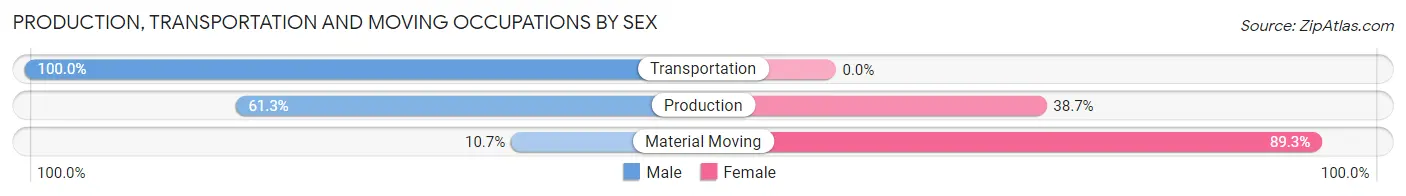
| Occupation | Male | Female |
| Production | 206 (61.3%) | 130 (38.7%) |
| Transportation | 74 (100.0%) | 0 (0.0%) |
| Material Moving | 13 (10.7%) | 108 (89.3%) |
| Total (Category) | 293 (55.2%) | 238 (44.8%) |
| Total (Overall) | 1,148 (60.5%) | 751 (39.6%) |
Employment Industries by Sex in Waterloo
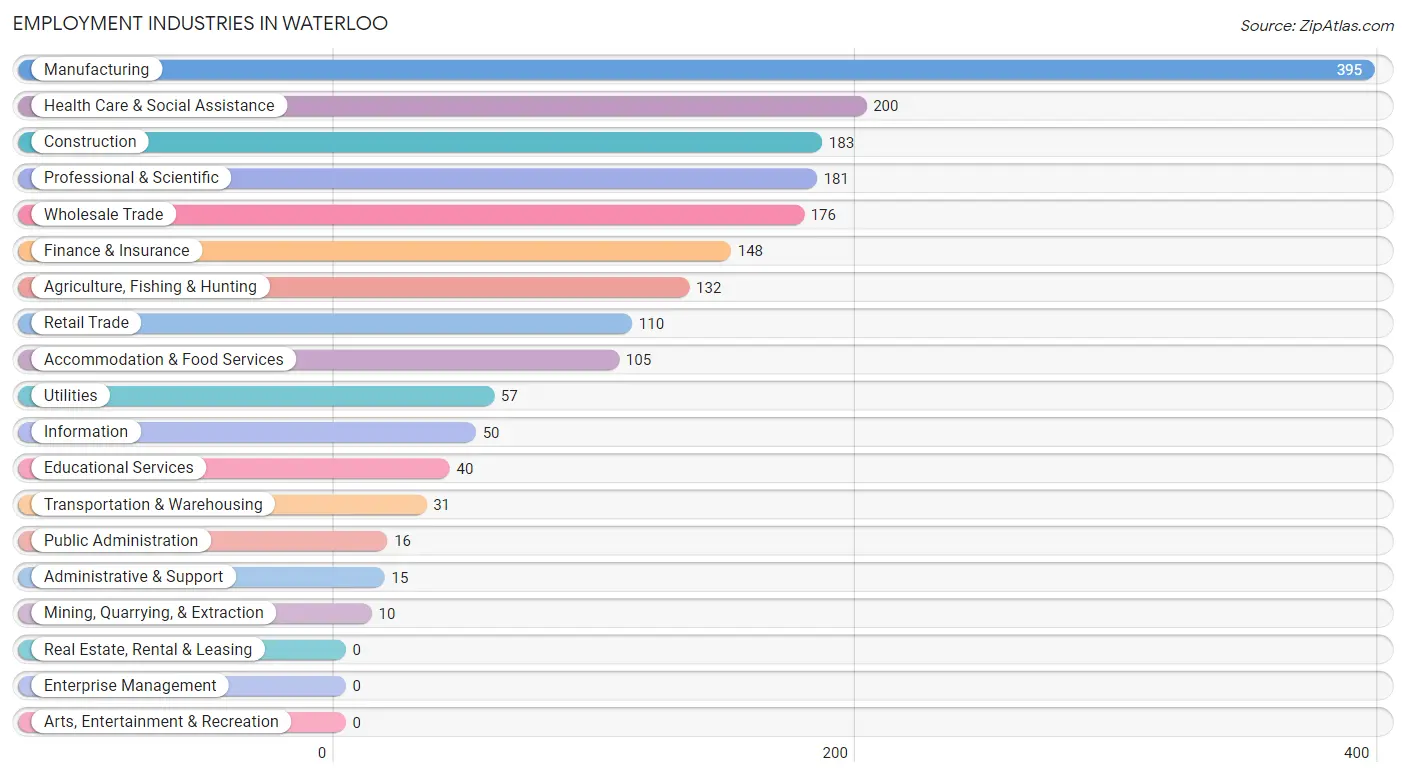
Employment Industries in Waterloo
The major employment industries in Waterloo include Manufacturing (395 | 20.8%), Health Care & Social Assistance (200 | 10.5%), Construction (183 | 9.6%), Professional & Scientific (181 | 9.5%), and Wholesale Trade (176 | 9.3%).
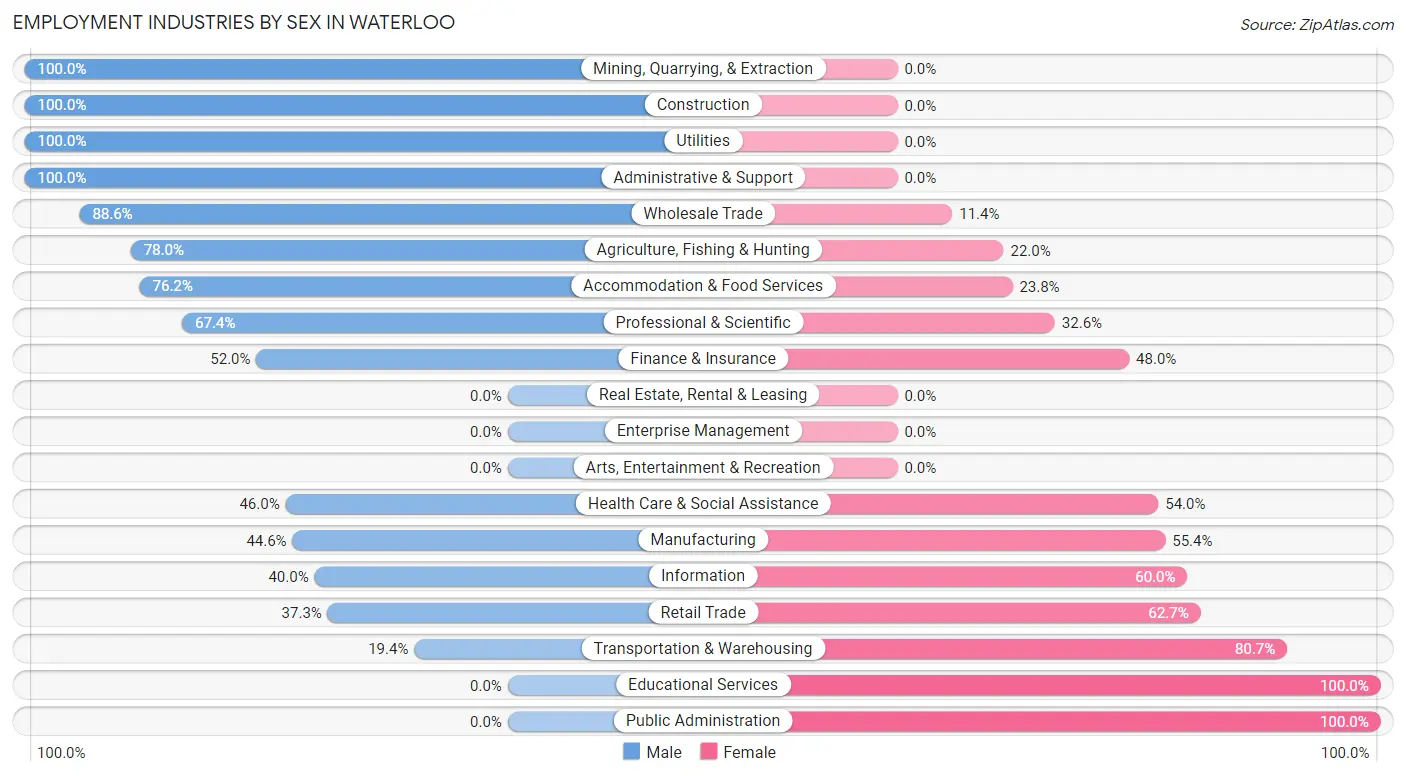
Employment Industries by Sex in Waterloo
The Waterloo industries that see more men than women are Mining, Quarrying, & Extraction (100.0%), Construction (100.0%), and Utilities (100.0%), whereas the industries that tend to have a higher number of women are Educational Services (100.0%), Public Administration (100.0%), and Transportation & Warehousing (80.6%).
| Industry | Male | Female |
| Agriculture, Fishing & Hunting | 103 (78.0%) | 29 (22.0%) |
| Mining, Quarrying, & Extraction | 10 (100.0%) | 0 (0.0%) |
| Construction | 183 (100.0%) | 0 (0.0%) |
| Manufacturing | 176 (44.6%) | 219 (55.4%) |
| Wholesale Trade | 156 (88.6%) | 20 (11.4%) |
| Retail Trade | 41 (37.3%) | 69 (62.7%) |
| Transportation & Warehousing | 6 (19.4%) | 25 (80.6%) |
| Utilities | 57 (100.0%) | 0 (0.0%) |
| Information | 20 (40.0%) | 30 (60.0%) |
| Finance & Insurance | 77 (52.0%) | 71 (48.0%) |
| Real Estate, Rental & Leasing | 0 (0.0%) | 0 (0.0%) |
| Professional & Scientific | 122 (67.4%) | 59 (32.6%) |
| Enterprise Management | 0 (0.0%) | 0 (0.0%) |
| Administrative & Support | 15 (100.0%) | 0 (0.0%) |
| Educational Services | 0 (0.0%) | 40 (100.0%) |
| Health Care & Social Assistance | 92 (46.0%) | 108 (54.0%) |
| Arts, Entertainment & Recreation | 0 (0.0%) | 0 (0.0%) |
| Accommodation & Food Services | 80 (76.2%) | 25 (23.8%) |
| Public Administration | 0 (0.0%) | 16 (100.0%) |
| Total | 1,148 (60.5%) | 751 (39.6%) |
Education in Waterloo
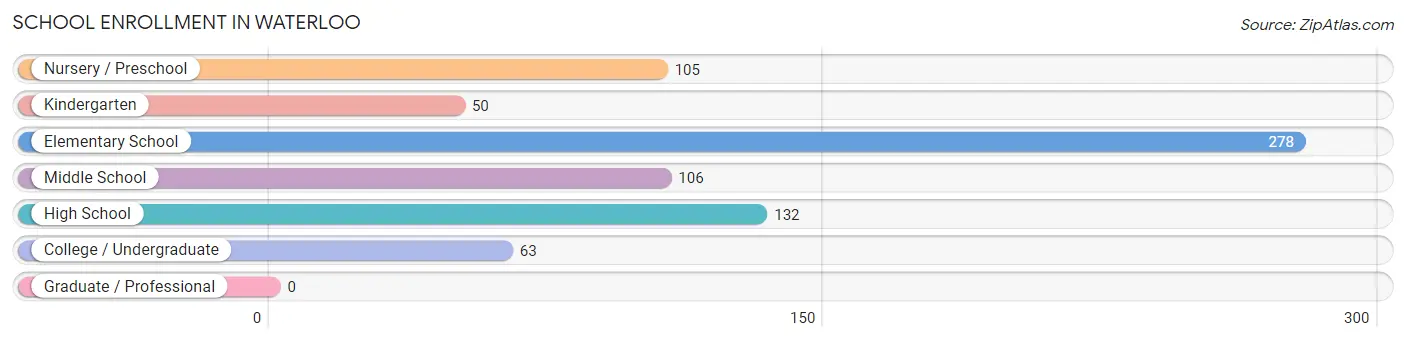
School Enrollment in Waterloo
The most common levels of schooling among the 734 students in Waterloo are elementary school (278 | 37.9%), high school (132 | 18.0%), and middle school (106 | 14.4%).
| School Level | # Students | % Students |
| Nursery / Preschool | 105 | 14.3% |
| Kindergarten | 50 | 6.8% |
| Elementary School | 278 | 37.9% |
| Middle School | 106 | 14.4% |
| High School | 132 | 18.0% |
| College / Undergraduate | 63 | 8.6% |
| Graduate / Professional | 0 | 0.0% |
| Total | 734 | 100.0% |
School Enrollment by Age by Funding Source in Waterloo
Out of a total of 734 students who are enrolled in schools in Waterloo, 100 (13.6%) attend a private institution, while the remaining 634 (86.4%) are enrolled in public schools. The age group of 3 to 4 year olds has the highest likelihood of being enrolled in private schools, with 14 (100.0% in the age bracket) enrolled. Conversely, the age group of 15 to 17 year olds has the lowest likelihood of being enrolled in a private school, with 79 (100.0% in the age bracket) attending a public institution.
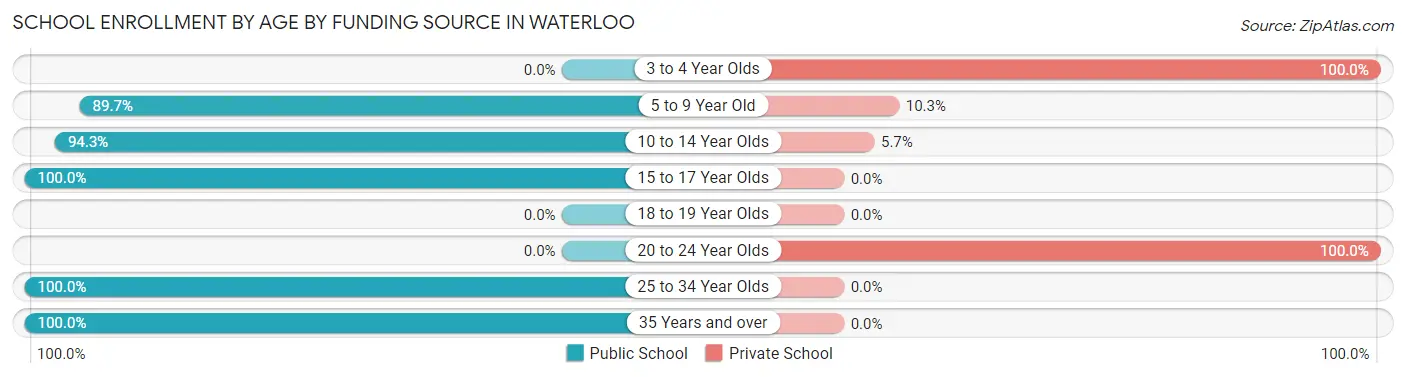
| Age Bracket | Public School | Private School |
| 3 to 4 Year Olds | 0 (0.0%) | 14 (100.0%) |
| 5 to 9 Year Old | 376 (89.7%) | 43 (10.3%) |
| 10 to 14 Year Olds | 150 (94.3%) | 9 (5.7%) |
| 15 to 17 Year Olds | 79 (100.0%) | 0 (0.0%) |
| 18 to 19 Year Olds | 0 (0.0%) | 0 (0.0%) |
| 20 to 24 Year Olds | 0 (0.0%) | 34 (100.0%) |
| 25 to 34 Year Olds | 12 (100.0%) | 0 (0.0%) |
| 35 Years and over | 17 (100.0%) | 0 (0.0%) |
| Total | 634 (86.4%) | 100 (13.6%) |
Educational Attainment by Field of Study in Waterloo
Business (124 | 19.4%), bio, nature & agricultural (110 | 17.2%), education (99 | 15.5%), computers & mathematics (66 | 10.3%), and psychology (59 | 9.2%) are the most common fields of study among 638 individuals in Waterloo who have obtained a bachelor's degree or higher.
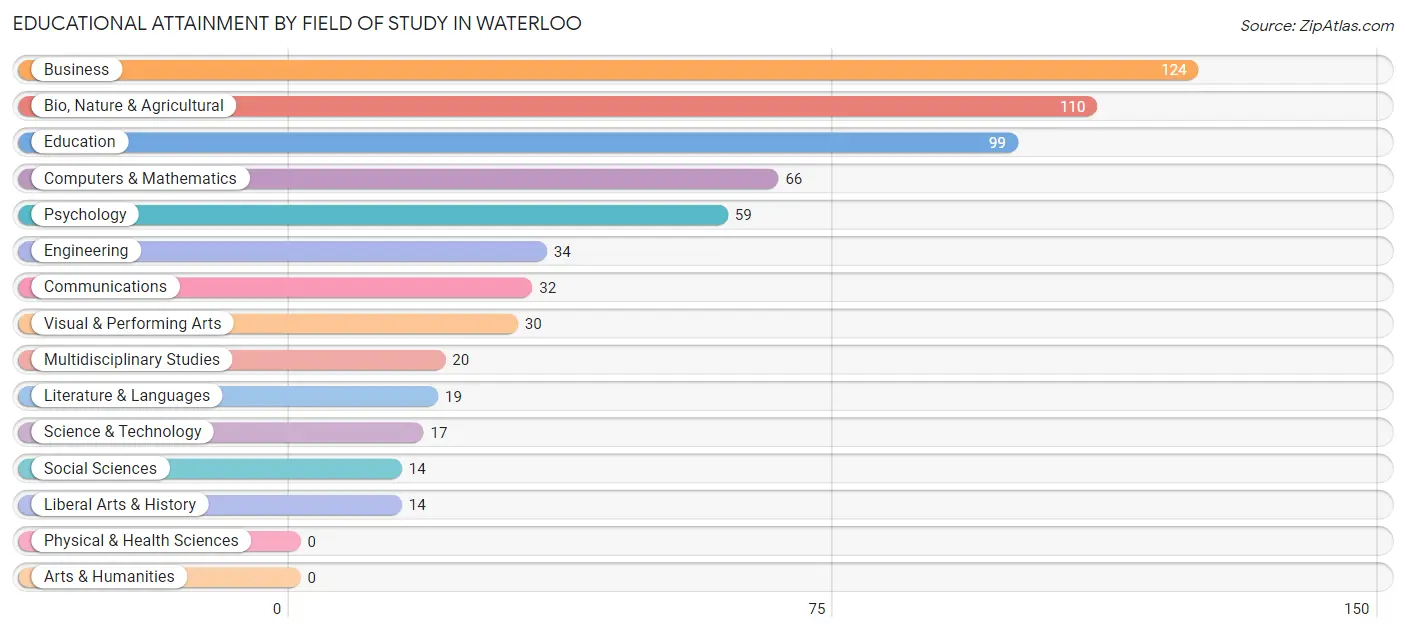
| Field of Study | # Graduates | % Graduates |
| Computers & Mathematics | 66 | 10.3% |
| Bio, Nature & Agricultural | 110 | 17.2% |
| Physical & Health Sciences | 0 | 0.0% |
| Psychology | 59 | 9.2% |
| Social Sciences | 14 | 2.2% |
| Engineering | 34 | 5.3% |
| Multidisciplinary Studies | 20 | 3.1% |
| Science & Technology | 17 | 2.7% |
| Business | 124 | 19.4% |
| Education | 99 | 15.5% |
| Literature & Languages | 19 | 3.0% |
| Liberal Arts & History | 14 | 2.2% |
| Visual & Performing Arts | 30 | 4.7% |
| Communications | 32 | 5.0% |
| Arts & Humanities | 0 | 0.0% |
| Total | 638 | 100.0% |
Transportation & Commute in Waterloo
Vehicle Availability by Sex in Waterloo
The most prevalent vehicle ownership categories in Waterloo are males with 2 vehicles (505, accounting for 44.0%) and females with 2 vehicles (347, making up 67.7%).
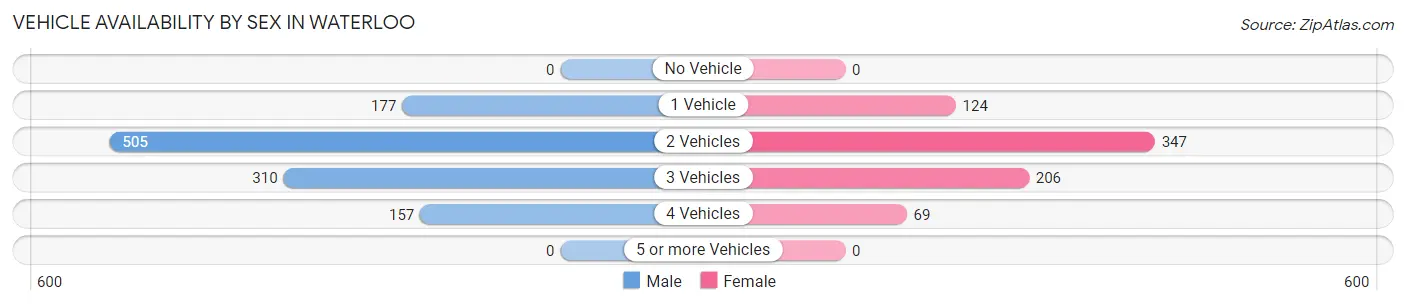
| Vehicles Available | Male | Female |
| No Vehicle | 0 (0.0%) | 0 (0.0%) |
| 1 Vehicle | 177 (15.4%) | 124 (16.6%) |
| 2 Vehicles | 505 (44.0%) | 347 (46.5%) |
| 3 Vehicles | 310 (27.0%) | 206 (27.6%) |
| 4 Vehicles | 157 (13.7%) | 69 (9.2%) |
| 5 or more Vehicles | 0 (0.0%) | 0 (0.0%) |
| Total | 1,149 (100.0%) | 746 (100.0%) |
Commute Time in Waterloo
The most frequently occuring commute durations in Waterloo are 20 to 24 minutes (357 commuters, 21.6%), 30 to 34 minutes (264 commuters, 16.0%), and 45 to 59 minutes (255 commuters, 15.4%).
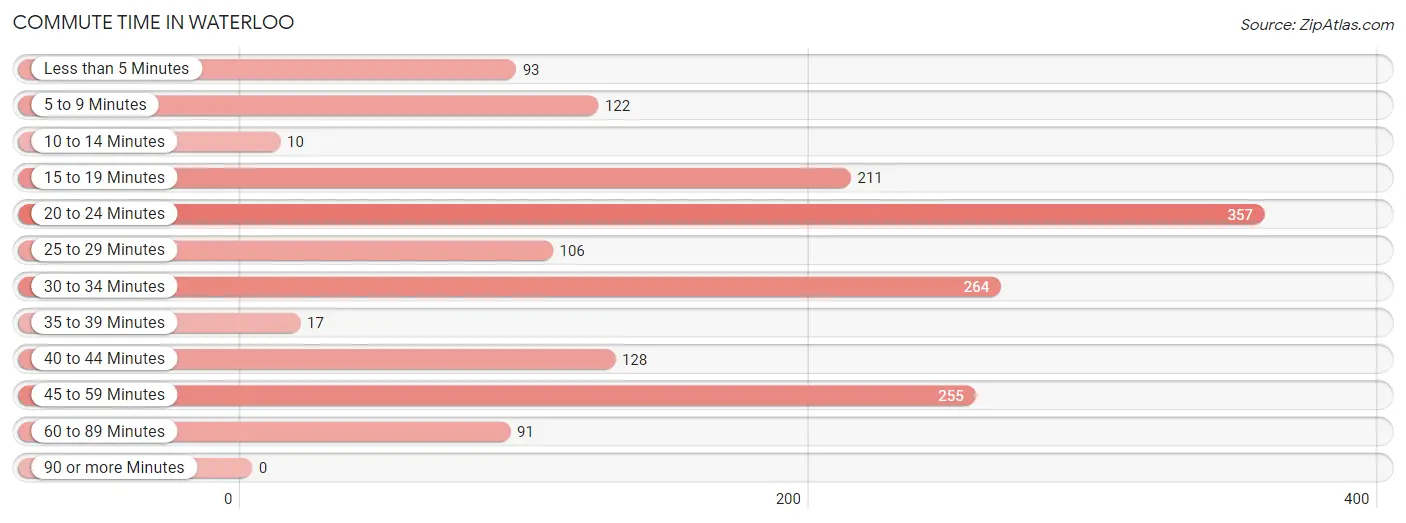
| Commute Time | # Commuters | % Commuters |
| Less than 5 Minutes | 93 | 5.6% |
| 5 to 9 Minutes | 122 | 7.4% |
| 10 to 14 Minutes | 10 | 0.6% |
| 15 to 19 Minutes | 211 | 12.8% |
| 20 to 24 Minutes | 357 | 21.6% |
| 25 to 29 Minutes | 106 | 6.4% |
| 30 to 34 Minutes | 264 | 16.0% |
| 35 to 39 Minutes | 17 | 1.0% |
| 40 to 44 Minutes | 128 | 7.7% |
| 45 to 59 Minutes | 255 | 15.4% |
| 60 to 89 Minutes | 91 | 5.5% |
| 90 or more Minutes | 0 | 0.0% |
Commute Time by Sex in Waterloo
The most common commute times in Waterloo are 20 to 24 minutes (236 commuters, 24.1%) for males and 15 to 19 minutes (147 commuters, 21.8%) for females.
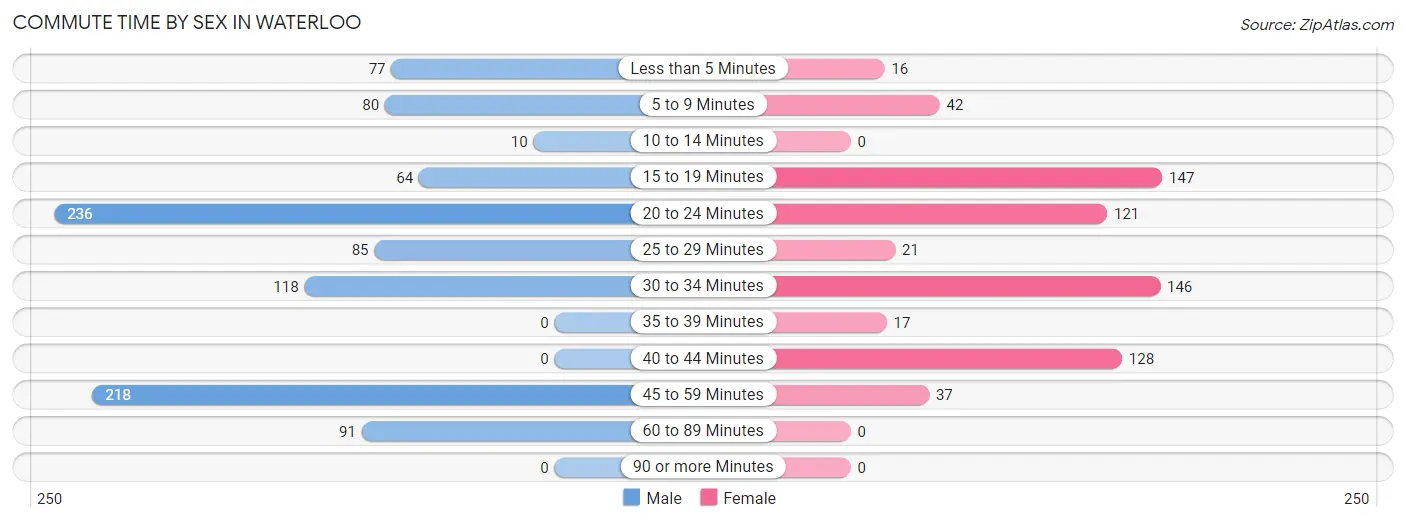
| Commute Time | Male | Female |
| Less than 5 Minutes | 77 (7.9%) | 16 (2.4%) |
| 5 to 9 Minutes | 80 (8.2%) | 42 (6.2%) |
| 10 to 14 Minutes | 10 (1.0%) | 0 (0.0%) |
| 15 to 19 Minutes | 64 (6.5%) | 147 (21.8%) |
| 20 to 24 Minutes | 236 (24.1%) | 121 (17.9%) |
| 25 to 29 Minutes | 85 (8.7%) | 21 (3.1%) |
| 30 to 34 Minutes | 118 (12.0%) | 146 (21.6%) |
| 35 to 39 Minutes | 0 (0.0%) | 17 (2.5%) |
| 40 to 44 Minutes | 0 (0.0%) | 128 (19.0%) |
| 45 to 59 Minutes | 218 (22.3%) | 37 (5.5%) |
| 60 to 89 Minutes | 91 (9.3%) | 0 (0.0%) |
| 90 or more Minutes | 0 (0.0%) | 0 (0.0%) |
Time of Departure to Work by Sex in Waterloo
The most frequent times of departure to work in Waterloo are 12:00 PM to 3:59 PM (179, 18.3%) for males and 6:00 AM to 6:29 AM (115, 17.0%) for females.
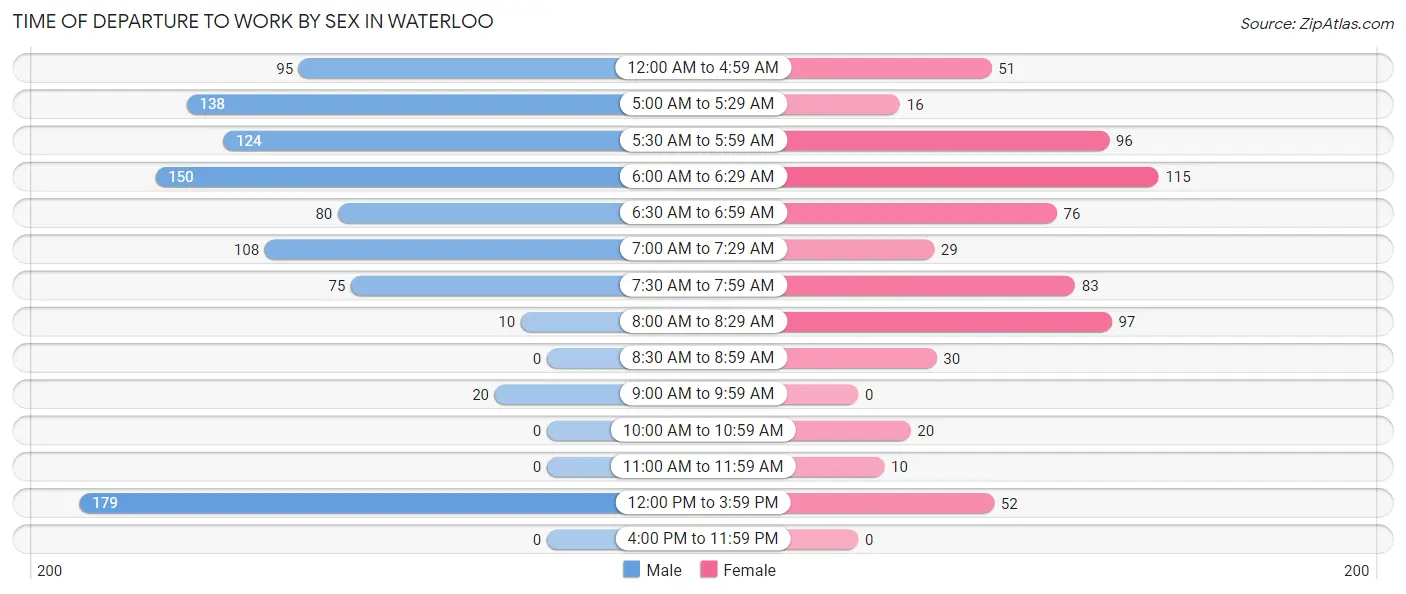
| Time of Departure | Male | Female |
| 12:00 AM to 4:59 AM | 95 (9.7%) | 51 (7.6%) |
| 5:00 AM to 5:29 AM | 138 (14.1%) | 16 (2.4%) |
| 5:30 AM to 5:59 AM | 124 (12.7%) | 96 (14.2%) |
| 6:00 AM to 6:29 AM | 150 (15.3%) | 115 (17.0%) |
| 6:30 AM to 6:59 AM | 80 (8.2%) | 76 (11.3%) |
| 7:00 AM to 7:29 AM | 108 (11.0%) | 29 (4.3%) |
| 7:30 AM to 7:59 AM | 75 (7.7%) | 83 (12.3%) |
| 8:00 AM to 8:29 AM | 10 (1.0%) | 97 (14.4%) |
| 8:30 AM to 8:59 AM | 0 (0.0%) | 30 (4.4%) |
| 9:00 AM to 9:59 AM | 20 (2.0%) | 0 (0.0%) |
| 10:00 AM to 10:59 AM | 0 (0.0%) | 20 (3.0%) |
| 11:00 AM to 11:59 AM | 0 (0.0%) | 10 (1.5%) |
| 12:00 PM to 3:59 PM | 179 (18.3%) | 52 (7.7%) |
| 4:00 PM to 11:59 PM | 0 (0.0%) | 0 (0.0%) |
| Total | 979 (100.0%) | 675 (100.0%) |
Housing Occupancy in Waterloo
Occupancy by Ownership in Waterloo
Of the total 1,557 dwellings in Waterloo, owner-occupied units account for 1,071 (68.8%), while renter-occupied units make up 486 (31.2%).
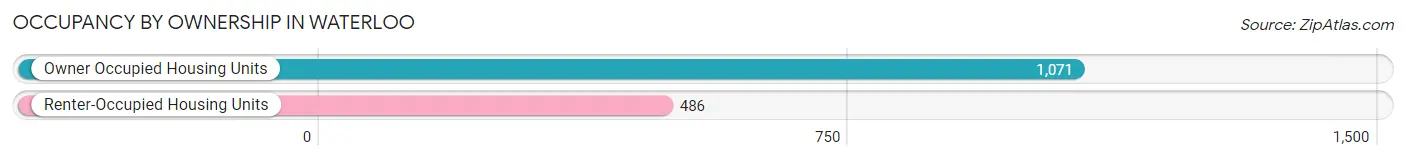
| Occupancy | # Housing Units | % Housing Units |
| Owner Occupied Housing Units | 1,071 | 68.8% |
| Renter-Occupied Housing Units | 486 | 31.2% |
| Total Occupied Housing Units | 1,557 | 100.0% |
Occupancy by Household Size in Waterloo
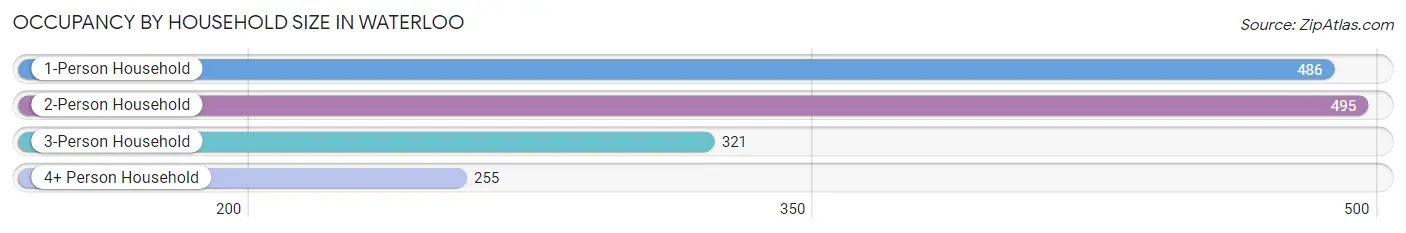
| Household Size | # Housing Units | % Housing Units |
| 1-Person Household | 486 | 31.2% |
| 2-Person Household | 495 | 31.8% |
| 3-Person Household | 321 | 20.6% |
| 4+ Person Household | 255 | 16.4% |
| Total Housing Units | 1,557 | 100.0% |
Occupancy by Ownership by Household Size in Waterloo
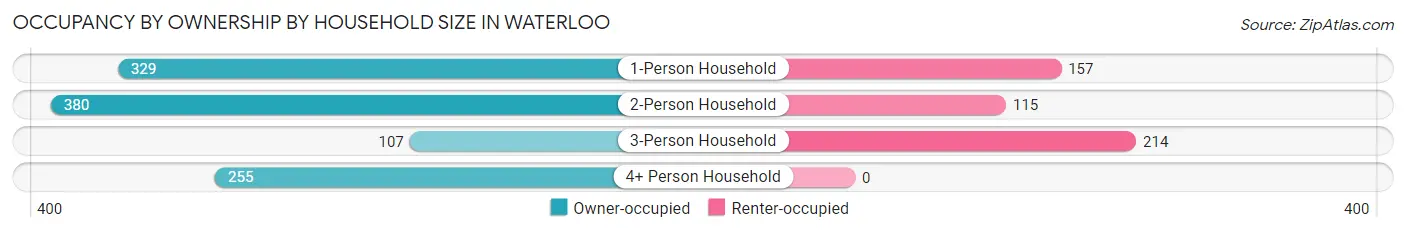
| Household Size | Owner-occupied | Renter-occupied |
| 1-Person Household | 329 (67.7%) | 157 (32.3%) |
| 2-Person Household | 380 (76.8%) | 115 (23.2%) |
| 3-Person Household | 107 (33.3%) | 214 (66.7%) |
| 4+ Person Household | 255 (100.0%) | 0 (0.0%) |
| Total Housing Units | 1,071 (68.8%) | 486 (31.2%) |
Occupancy by Educational Attainment in Waterloo
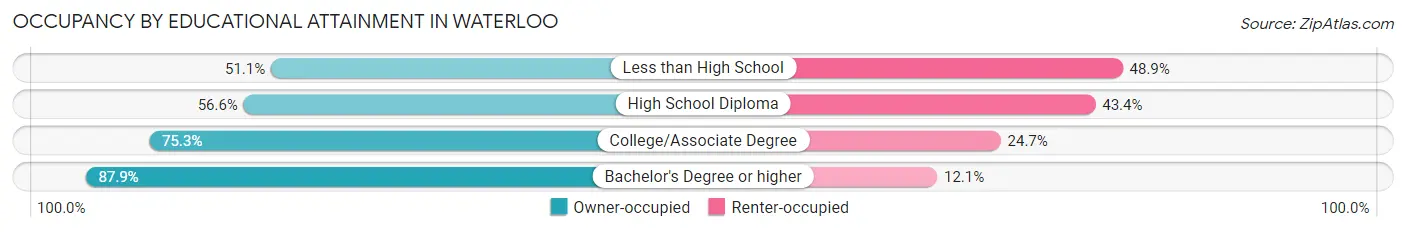
| Household Size | Owner-occupied | Renter-occupied |
| Less than High School | 45 (51.1%) | 43 (48.9%) |
| High School Diploma | 375 (56.6%) | 288 (43.4%) |
| College/Associate Degree | 345 (75.3%) | 113 (24.7%) |
| Bachelor's Degree or higher | 306 (87.9%) | 42 (12.1%) |
Occupancy by Age of Householder in Waterloo
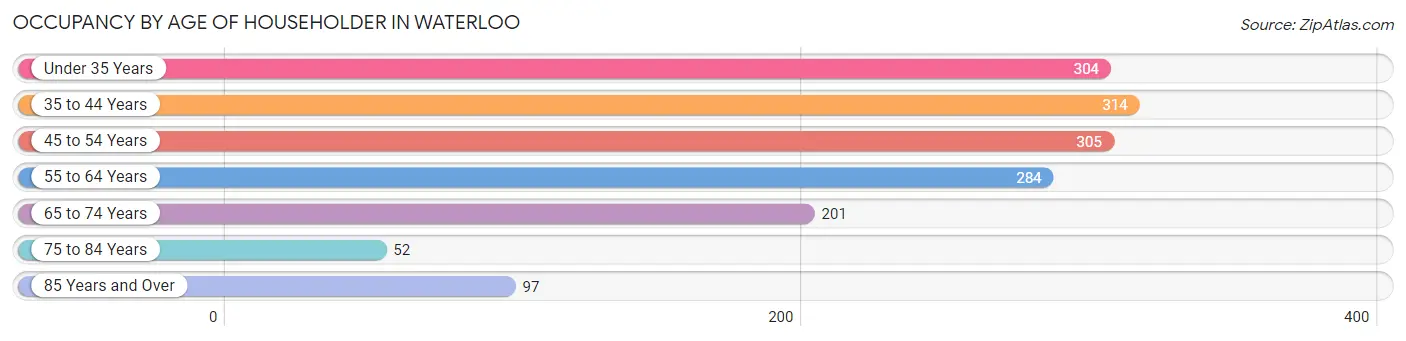
| Age Bracket | # Households | % Households |
| Under 35 Years | 304 | 19.5% |
| 35 to 44 Years | 314 | 20.2% |
| 45 to 54 Years | 305 | 19.6% |
| 55 to 64 Years | 284 | 18.2% |
| 65 to 74 Years | 201 | 12.9% |
| 75 to 84 Years | 52 | 3.3% |
| 85 Years and Over | 97 | 6.2% |
| Total | 1,557 | 100.0% |
Housing Finances in Waterloo
Median Income by Occupancy in Waterloo
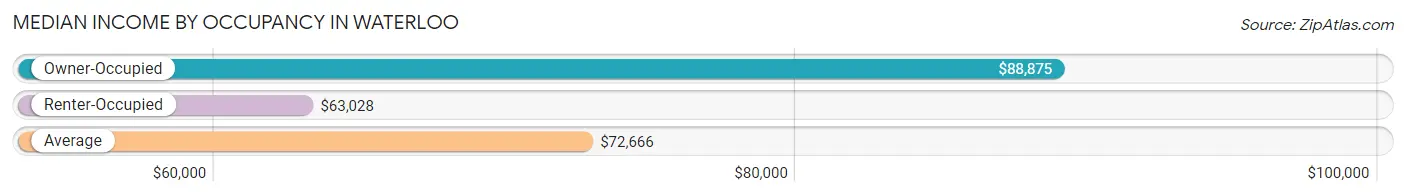
| Occupancy Type | # Households | Median Income |
| Owner-Occupied | 1,071 (68.8%) | $88,875 |
| Renter-Occupied | 486 (31.2%) | $63,028 |
| Average | 1,557 (100.0%) | $72,666 |
Occupancy by Householder Income Bracket in Waterloo
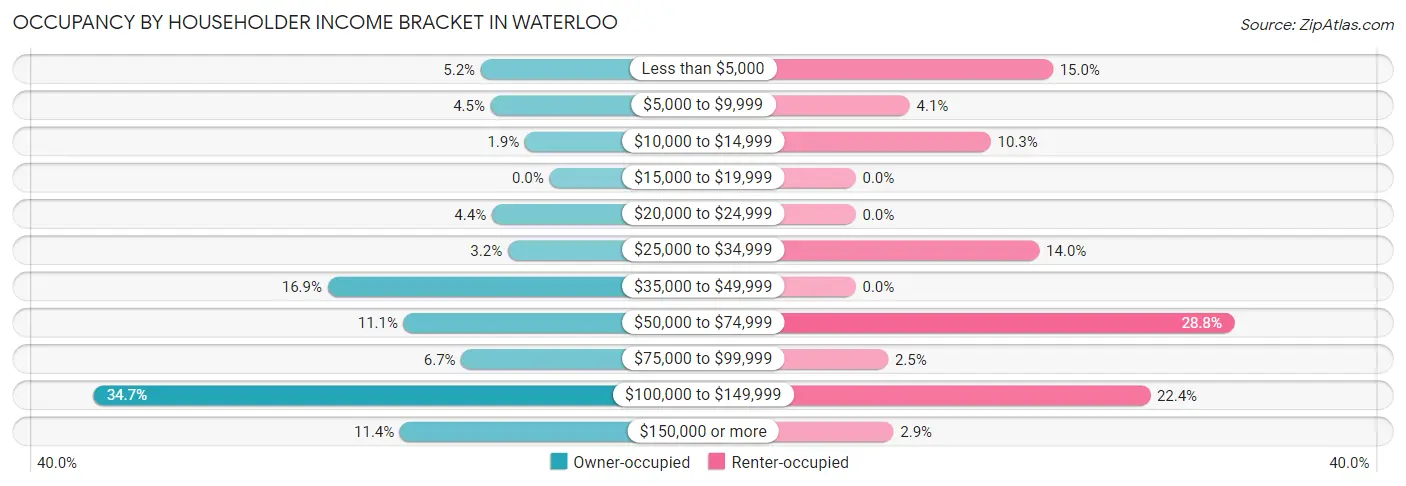
| Income Bracket | Owner-occupied | Renter-occupied |
| Less than $5,000 | 56 (5.2%) | 73 (15.0%) |
| $5,000 to $9,999 | 48 (4.5%) | 20 (4.1%) |
| $10,000 to $14,999 | 20 (1.9%) | 50 (10.3%) |
| $15,000 to $19,999 | 0 (0.0%) | 0 (0.0%) |
| $20,000 to $24,999 | 47 (4.4%) | 0 (0.0%) |
| $25,000 to $34,999 | 34 (3.2%) | 68 (14.0%) |
| $35,000 to $49,999 | 181 (16.9%) | 0 (0.0%) |
| $50,000 to $74,999 | 119 (11.1%) | 140 (28.8%) |
| $75,000 to $99,999 | 72 (6.7%) | 12 (2.5%) |
| $100,000 to $149,999 | 372 (34.7%) | 109 (22.4%) |
| $150,000 or more | 122 (11.4%) | 14 (2.9%) |
| Total | 1,071 (100.0%) | 486 (100.0%) |
Monthly Housing Cost Tiers in Waterloo
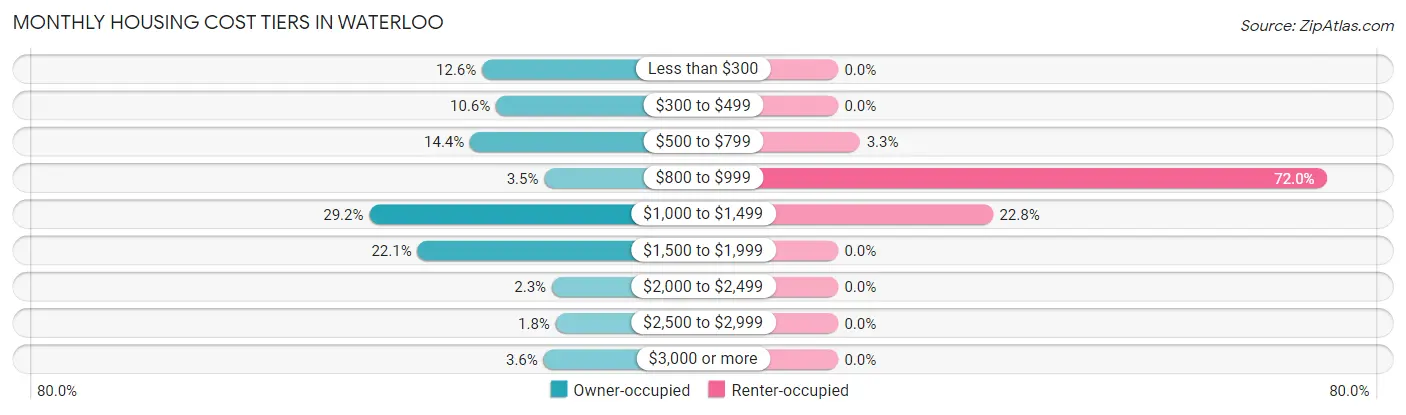
| Monthly Cost | Owner-occupied | Renter-occupied |
| Less than $300 | 135 (12.6%) | 0 (0.0%) |
| $300 to $499 | 113 (10.5%) | 0 (0.0%) |
| $500 to $799 | 154 (14.4%) | 16 (3.3%) |
| $800 to $999 | 37 (3.5%) | 350 (72.0%) |
| $1,000 to $1,499 | 313 (29.2%) | 111 (22.8%) |
| $1,500 to $1,999 | 237 (22.1%) | 0 (0.0%) |
| $2,000 to $2,499 | 25 (2.3%) | 0 (0.0%) |
| $2,500 to $2,999 | 19 (1.8%) | 0 (0.0%) |
| $3,000 or more | 38 (3.5%) | 0 (0.0%) |
| Total | 1,071 (100.0%) | 486 (100.0%) |
Physical Housing Characteristics in Waterloo
Housing Structures in Waterloo
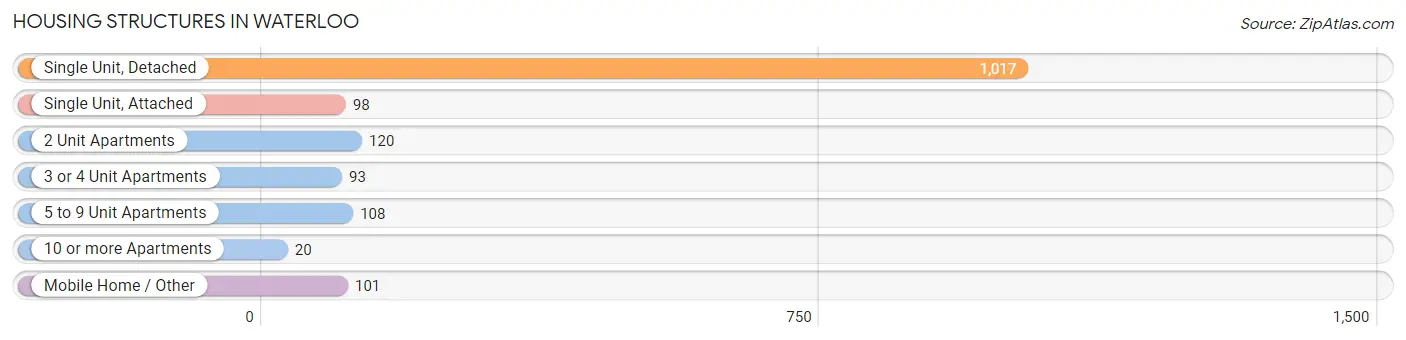
| Structure Type | # Housing Units | % Housing Units |
| Single Unit, Detached | 1,017 | 65.3% |
| Single Unit, Attached | 98 | 6.3% |
| 2 Unit Apartments | 120 | 7.7% |
| 3 or 4 Unit Apartments | 93 | 6.0% |
| 5 to 9 Unit Apartments | 108 | 6.9% |
| 10 or more Apartments | 20 | 1.3% |
| Mobile Home / Other | 101 | 6.5% |
| Total | 1,557 | 100.0% |
Housing Structures by Occupancy in Waterloo
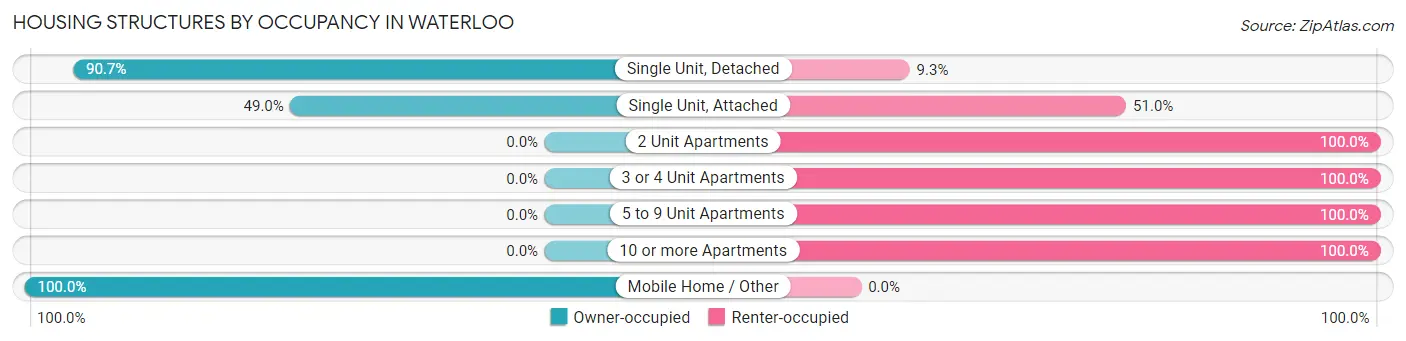
| Structure Type | Owner-occupied | Renter-occupied |
| Single Unit, Detached | 922 (90.7%) | 95 (9.3%) |
| Single Unit, Attached | 48 (49.0%) | 50 (51.0%) |
| 2 Unit Apartments | 0 (0.0%) | 120 (100.0%) |
| 3 or 4 Unit Apartments | 0 (0.0%) | 93 (100.0%) |
| 5 to 9 Unit Apartments | 0 (0.0%) | 108 (100.0%) |
| 10 or more Apartments | 0 (0.0%) | 20 (100.0%) |
| Mobile Home / Other | 101 (100.0%) | 0 (0.0%) |
| Total | 1,071 (68.8%) | 486 (31.2%) |
Housing Structures by Number of Rooms in Waterloo
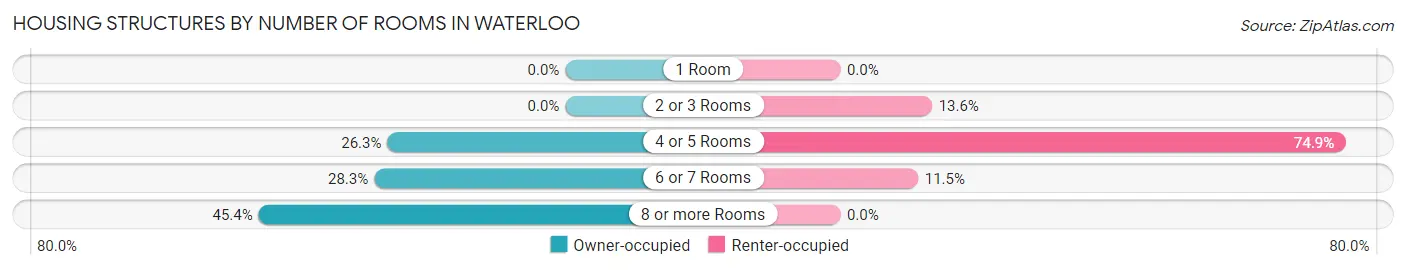
| Number of Rooms | Owner-occupied | Renter-occupied |
| 1 Room | 0 (0.0%) | 0 (0.0%) |
| 2 or 3 Rooms | 0 (0.0%) | 66 (13.6%) |
| 4 or 5 Rooms | 282 (26.3%) | 364 (74.9%) |
| 6 or 7 Rooms | 303 (28.3%) | 56 (11.5%) |
| 8 or more Rooms | 486 (45.4%) | 0 (0.0%) |
| Total | 1,071 (100.0%) | 486 (100.0%) |
Housing Structure by Heating Type in Waterloo
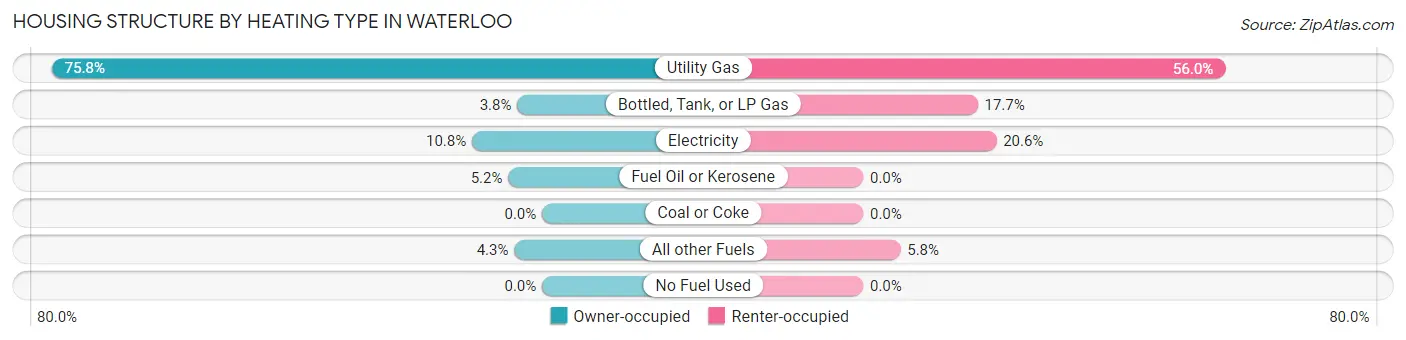
| Heating Type | Owner-occupied | Renter-occupied |
| Utility Gas | 812 (75.8%) | 272 (56.0%) |
| Bottled, Tank, or LP Gas | 41 (3.8%) | 86 (17.7%) |
| Electricity | 116 (10.8%) | 100 (20.6%) |
| Fuel Oil or Kerosene | 56 (5.2%) | 0 (0.0%) |
| Coal or Coke | 0 (0.0%) | 0 (0.0%) |
| All other Fuels | 46 (4.3%) | 28 (5.8%) |
| No Fuel Used | 0 (0.0%) | 0 (0.0%) |
| Total | 1,071 (100.0%) | 486 (100.0%) |
Household Vehicle Usage in Waterloo
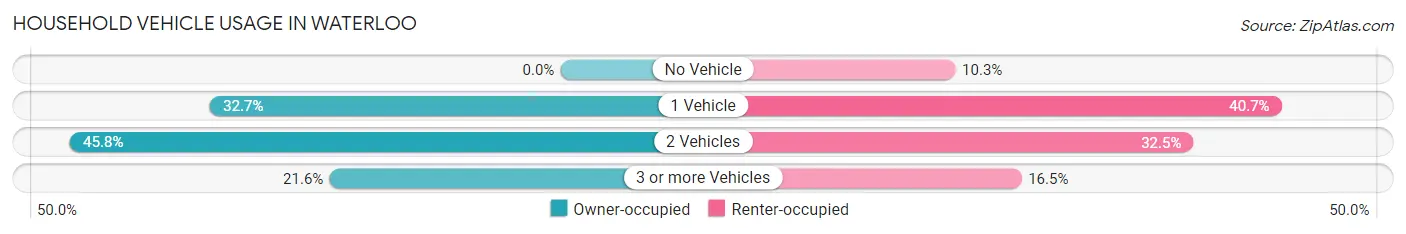
| Vehicles per Household | Owner-occupied | Renter-occupied |
| No Vehicle | 0 (0.0%) | 50 (10.3%) |
| 1 Vehicle | 350 (32.7%) | 198 (40.7%) |
| 2 Vehicles | 490 (45.8%) | 158 (32.5%) |
| 3 or more Vehicles | 231 (21.6%) | 80 (16.5%) |
| Total | 1,071 (100.0%) | 486 (100.0%) |
Real Estate & Mortgages in Waterloo
Real Estate and Mortgage Overview in Waterloo
| Characteristic | Without Mortgage | With Mortgage |
| Housing Units | 447 | 624 |
| Median Property Value | $177,500 | $203,000 |
| Median Household Income | $47,729 | $109 |
| Monthly Housing Costs | $515 | $38 |
| Real Estate Taxes | $4,036 | $0 |
Property Value by Mortgage Status in Waterloo
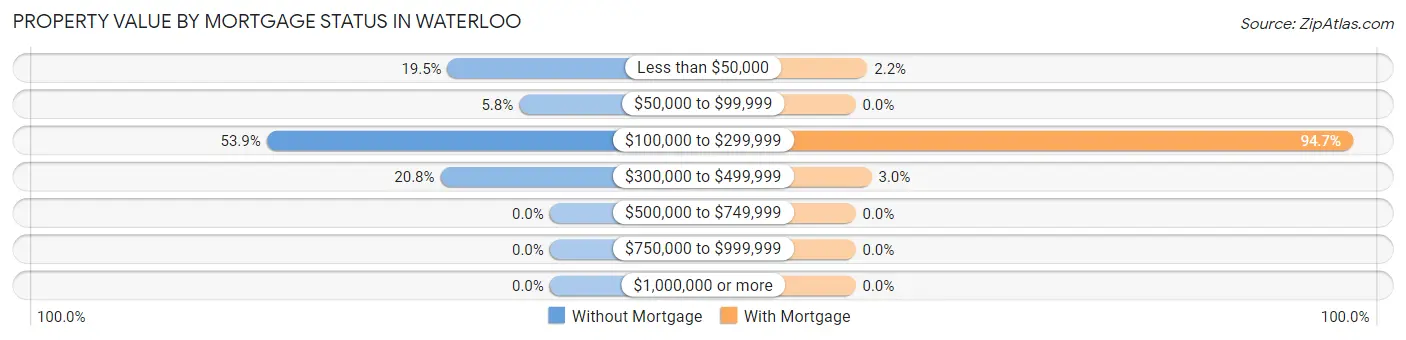
| Property Value | Without Mortgage | With Mortgage |
| Less than $50,000 | 87 (19.5%) | 14 (2.2%) |
| $50,000 to $99,999 | 26 (5.8%) | 0 (0.0%) |
| $100,000 to $299,999 | 241 (53.9%) | 591 (94.7%) |
| $300,000 to $499,999 | 93 (20.8%) | 19 (3.0%) |
| $500,000 to $749,999 | 0 (0.0%) | 0 (0.0%) |
| $750,000 to $999,999 | 0 (0.0%) | 0 (0.0%) |
| $1,000,000 or more | 0 (0.0%) | 0 (0.0%) |
| Total | 447 (100.0%) | 624 (100.0%) |
Household Income by Mortgage Status in Waterloo
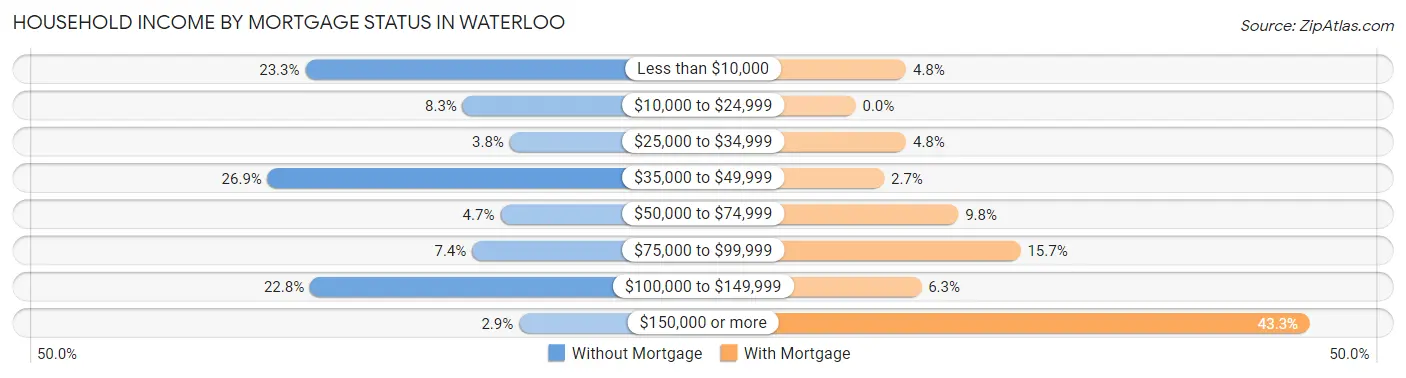
| Household Income | Without Mortgage | With Mortgage |
| Less than $10,000 | 104 (23.3%) | 30 (4.8%) |
| $10,000 to $24,999 | 37 (8.3%) | 0 (0.0%) |
| $25,000 to $34,999 | 17 (3.8%) | 30 (4.8%) |
| $35,000 to $49,999 | 120 (26.9%) | 17 (2.7%) |
| $50,000 to $74,999 | 21 (4.7%) | 61 (9.8%) |
| $75,000 to $99,999 | 33 (7.4%) | 98 (15.7%) |
| $100,000 to $149,999 | 102 (22.8%) | 39 (6.2%) |
| $150,000 or more | 13 (2.9%) | 270 (43.3%) |
| Total | 447 (100.0%) | 624 (100.0%) |
Property Value to Household Income Ratio in Waterloo
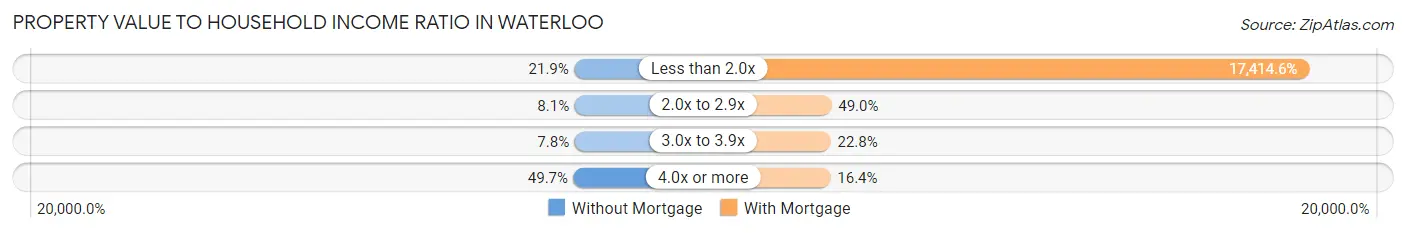
| Value-to-Income Ratio | Without Mortgage | With Mortgage |
| Less than 2.0x | 98 (21.9%) | 108,667 (17,414.6%) |
| 2.0x to 2.9x | 36 (8.1%) | 306 (49.0%) |
| 3.0x to 3.9x | 35 (7.8%) | 142 (22.8%) |
| 4.0x or more | 222 (49.7%) | 102 (16.4%) |
| Total | 447 (100.0%) | 624 (100.0%) |
Real Estate Taxes by Mortgage Status in Waterloo
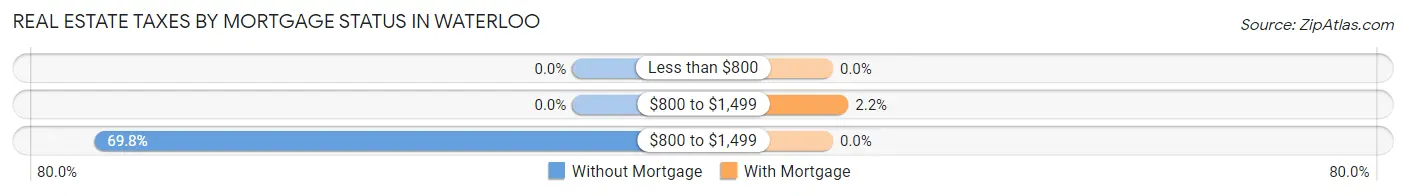
| Property Taxes | Without Mortgage | With Mortgage |
| Less than $800 | 0 (0.0%) | 0 (0.0%) |
| $800 to $1,499 | 0 (0.0%) | 14 (2.2%) |
| $800 to $1,499 | 312 (69.8%) | 0 (0.0%) |
| Total | 447 (100.0%) | 624 (100.0%) |
Health & Disability in Waterloo
Health Insurance Coverage by Age in Waterloo
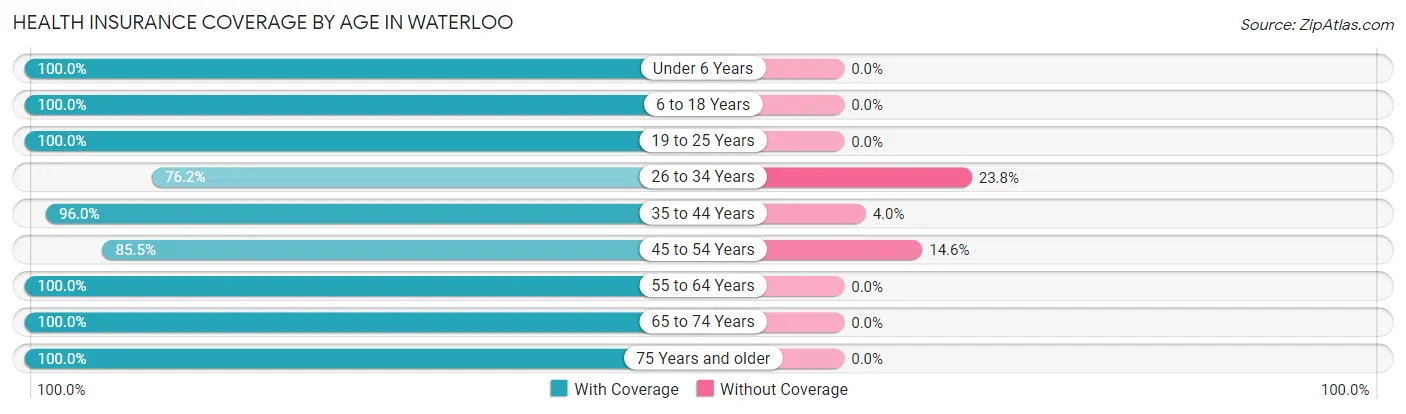
| Age Bracket | With Coverage | Without Coverage |
| Under 6 Years | 244 (100.0%) | 0 (0.0%) |
| 6 to 18 Years | 605 (100.0%) | 0 (0.0%) |
| 19 to 25 Years | 265 (100.0%) | 0 (0.0%) |
| 26 to 34 Years | 327 (76.2%) | 102 (23.8%) |
| 35 to 44 Years | 408 (96.0%) | 17 (4.0%) |
| 45 to 54 Years | 423 (85.5%) | 72 (14.5%) |
| 55 to 64 Years | 511 (100.0%) | 0 (0.0%) |
| 65 to 74 Years | 356 (100.0%) | 0 (0.0%) |
| 75 Years and older | 172 (100.0%) | 0 (0.0%) |
| Total | 3,311 (94.6%) | 191 (5.4%) |
Health Insurance Coverage by Citizenship Status in Waterloo
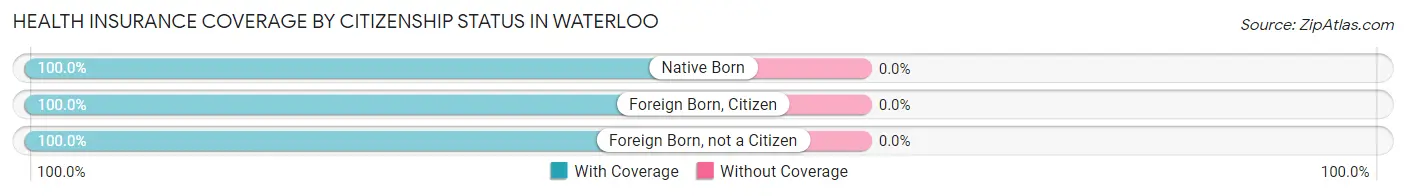
| Citizenship Status | With Coverage | Without Coverage |
| Native Born | 244 (100.0%) | 0 (0.0%) |
| Foreign Born, Citizen | 605 (100.0%) | 0 (0.0%) |
| Foreign Born, not a Citizen | 265 (100.0%) | 0 (0.0%) |
Health Insurance Coverage by Household Income in Waterloo
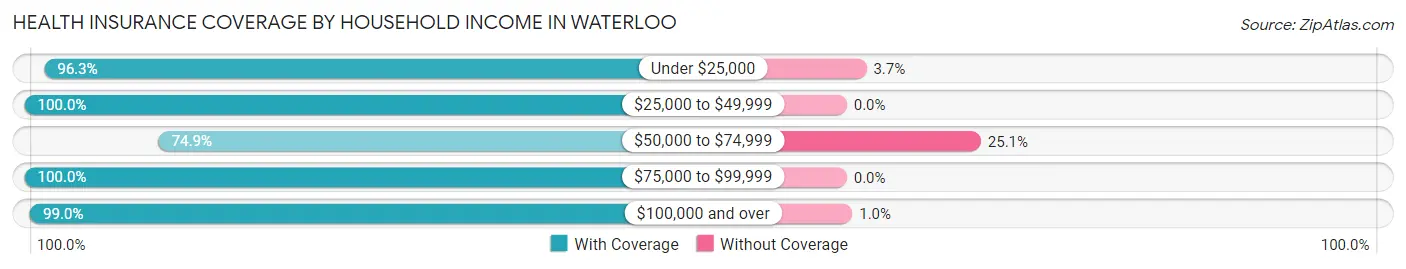
| Household Income | With Coverage | Without Coverage |
| Under $25,000 | 496 (96.3%) | 19 (3.7%) |
| $25,000 to $49,999 | 510 (100.0%) | 0 (0.0%) |
| $50,000 to $74,999 | 462 (74.9%) | 155 (25.1%) |
| $75,000 to $99,999 | 184 (100.0%) | 0 (0.0%) |
| $100,000 and over | 1,633 (99.0%) | 17 (1.0%) |
Public vs Private Health Insurance Coverage by Age in Waterloo
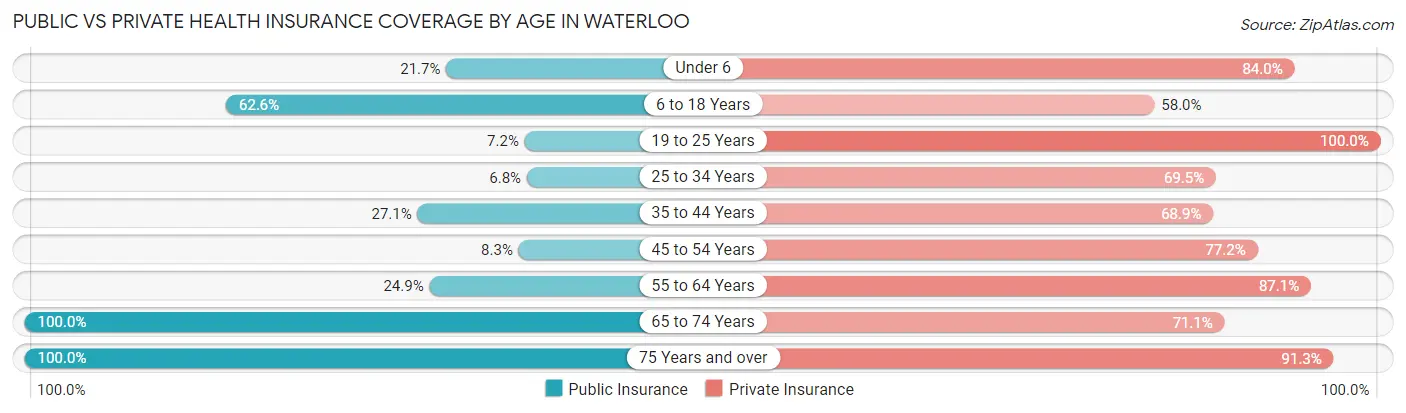
| Age Bracket | Public Insurance | Private Insurance |
| Under 6 | 53 (21.7%) | 205 (84.0%) |
| 6 to 18 Years | 379 (62.6%) | 351 (58.0%) |
| 19 to 25 Years | 19 (7.2%) | 265 (100.0%) |
| 25 to 34 Years | 29 (6.8%) | 298 (69.5%) |
| 35 to 44 Years | 115 (27.1%) | 293 (68.9%) |
| 45 to 54 Years | 41 (8.3%) | 382 (77.2%) |
| 55 to 64 Years | 127 (24.8%) | 445 (87.1%) |
| 65 to 74 Years | 356 (100.0%) | 253 (71.1%) |
| 75 Years and over | 172 (100.0%) | 157 (91.3%) |
| Total | 1,291 (36.9%) | 2,649 (75.6%) |
Disability Status by Sex by Age in Waterloo
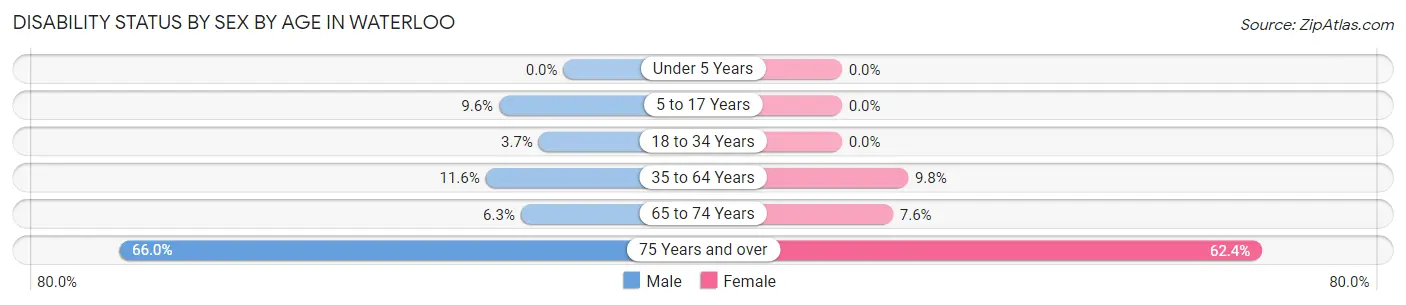
| Age Bracket | Male | Female |
| Under 5 Years | 0 (0.0%) | 0 (0.0%) |
| 5 to 17 Years | 39 (9.6%) | 0 (0.0%) |
| 18 to 34 Years | 19 (3.7%) | 0 (0.0%) |
| 35 to 64 Years | 76 (11.6%) | 76 (9.8%) |
| 65 to 74 Years | 10 (6.3%) | 15 (7.6%) |
| 75 Years and over | 31 (66.0%) | 78 (62.4%) |
Disability Class by Sex by Age in Waterloo
Disability Class: Hearing Difficulty
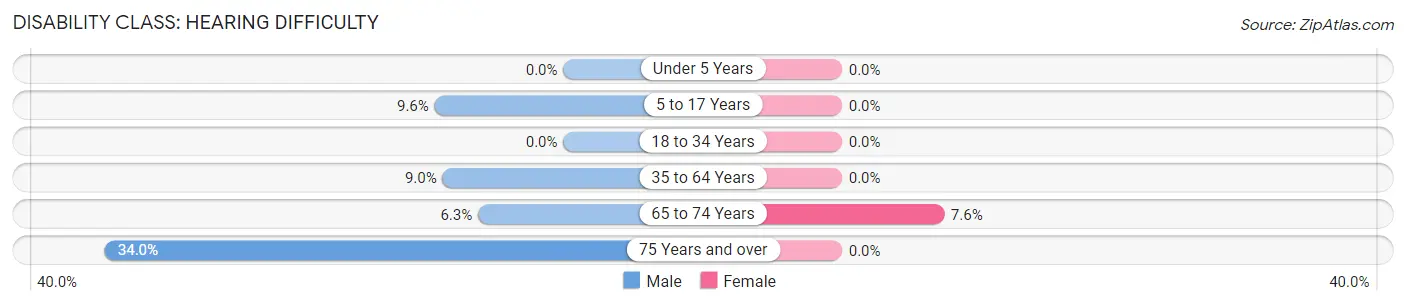
| Age Bracket | Male | Female |
| Under 5 Years | 0 (0.0%) | 0 (0.0%) |
| 5 to 17 Years | 39 (9.6%) | 0 (0.0%) |
| 18 to 34 Years | 0 (0.0%) | 0 (0.0%) |
| 35 to 64 Years | 59 (9.0%) | 0 (0.0%) |
| 65 to 74 Years | 10 (6.3%) | 15 (7.6%) |
| 75 Years and over | 16 (34.0%) | 0 (0.0%) |
Disability Class: Vision Difficulty
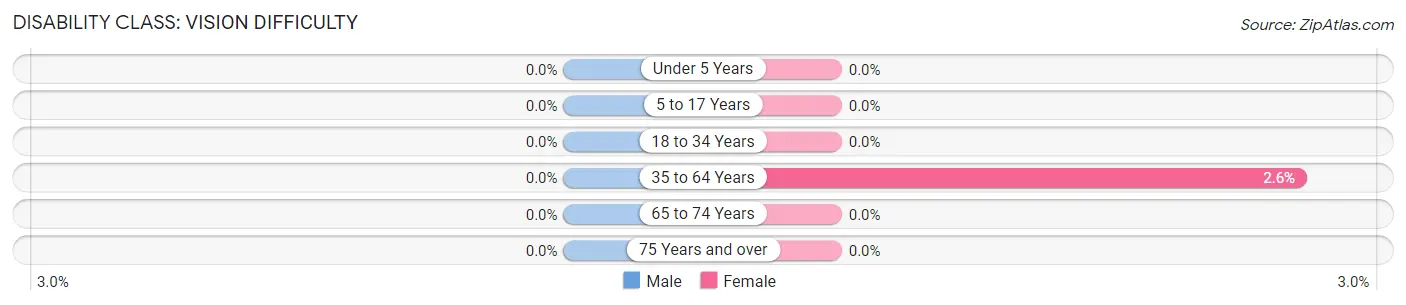
| Age Bracket | Male | Female |
| Under 5 Years | 0 (0.0%) | 0 (0.0%) |
| 5 to 17 Years | 0 (0.0%) | 0 (0.0%) |
| 18 to 34 Years | 0 (0.0%) | 0 (0.0%) |
| 35 to 64 Years | 0 (0.0%) | 20 (2.6%) |
| 65 to 74 Years | 0 (0.0%) | 0 (0.0%) |
| 75 Years and over | 0 (0.0%) | 0 (0.0%) |
Disability Class: Cognitive Difficulty
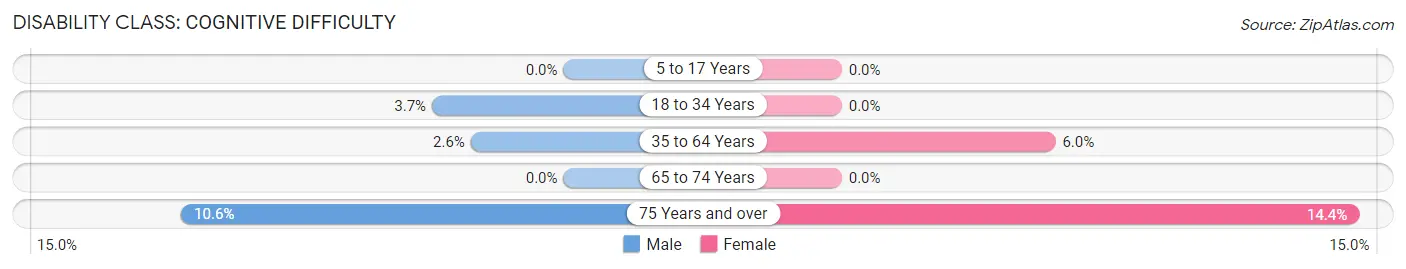
| Age Bracket | Male | Female |
| 5 to 17 Years | 0 (0.0%) | 0 (0.0%) |
| 18 to 34 Years | 19 (3.7%) | 0 (0.0%) |
| 35 to 64 Years | 17 (2.6%) | 46 (5.9%) |
| 65 to 74 Years | 0 (0.0%) | 0 (0.0%) |
| 75 Years and over | 5 (10.6%) | 18 (14.4%) |
Disability Class: Ambulatory Difficulty
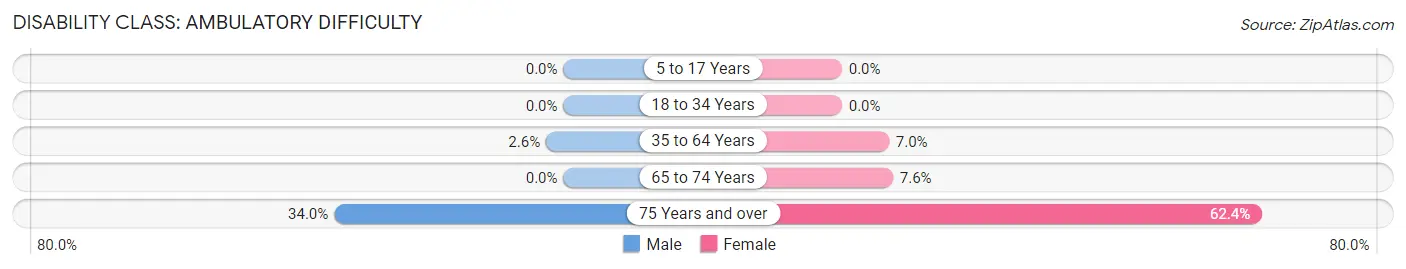
| Age Bracket | Male | Female |
| 5 to 17 Years | 0 (0.0%) | 0 (0.0%) |
| 18 to 34 Years | 0 (0.0%) | 0 (0.0%) |
| 35 to 64 Years | 17 (2.6%) | 54 (7.0%) |
| 65 to 74 Years | 0 (0.0%) | 15 (7.6%) |
| 75 Years and over | 16 (34.0%) | 78 (62.4%) |
Disability Class: Self-Care Difficulty
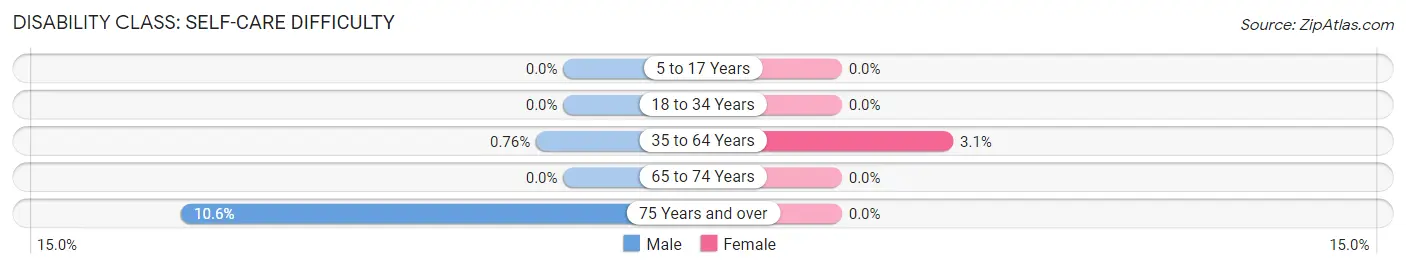
| Age Bracket | Male | Female |
| 5 to 17 Years | 0 (0.0%) | 0 (0.0%) |
| 18 to 34 Years | 0 (0.0%) | 0 (0.0%) |
| 35 to 64 Years | 5 (0.8%) | 24 (3.1%) |
| 65 to 74 Years | 0 (0.0%) | 0 (0.0%) |
| 75 Years and over | 5 (10.6%) | 0 (0.0%) |
Technology Access in Waterloo
Computing Device Access in Waterloo
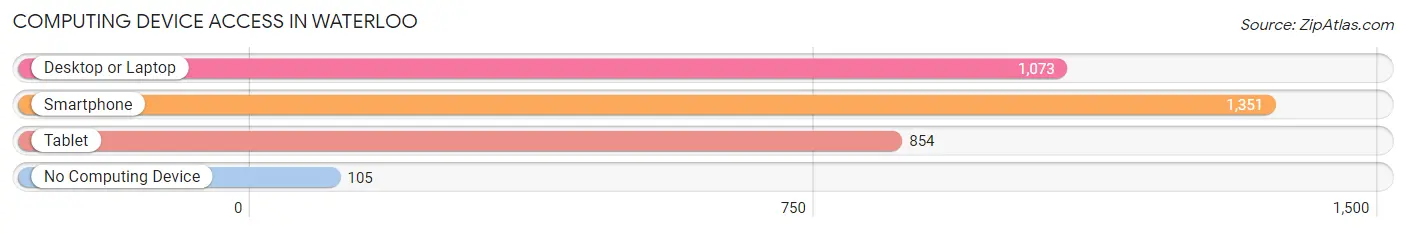
| Device Type | # Households | % Households |
| Desktop or Laptop | 1,073 | 68.9% |
| Smartphone | 1,351 | 86.8% |
| Tablet | 854 | 54.8% |
| No Computing Device | 105 | 6.7% |
| Total | 1,557 | 100.0% |
Internet Access in Waterloo
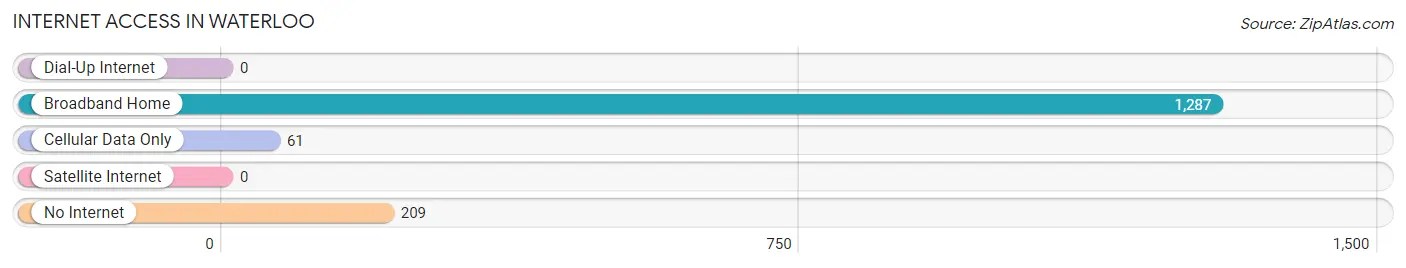
| Internet Type | # Households | % Households |
| Dial-Up Internet | 0 | 0.0% |
| Broadband Home | 1,287 | 82.7% |
| Cellular Data Only | 61 | 3.9% |
| Satellite Internet | 0 | 0.0% |
| No Internet | 209 | 13.4% |
| Total | 1,557 | 100.0% |
Waterloo Summary
Waterloo, Wisconsin is a small city located in the south-central part of the state, in the county of Jefferson. It is situated on the banks of the Crawfish River, and is part of the Madison Metropolitan Statistical Area. The city has a population of approximately 8,000 people, and is known for its small-town charm and friendly atmosphere.
History
Waterloo was first settled in 1845 by a group of German immigrants, who named the town after the Battle of Waterloo in Belgium. The town was officially incorporated in 1853, and the first mayor was elected in 1854. The city was originally a farming community, and the main crops were wheat, corn, and oats. In the late 19th century, the city began to grow and develop, and by the early 20th century, it had become a thriving industrial center. The city was home to several factories, including a paper mill, a flour mill, and a canning factory.
Geography
Waterloo is located in south-central Wisconsin, in the county of Jefferson. It is situated on the banks of the Crawfish River, and is part of the Madison Metropolitan Statistical Area. The city has a total area of 4.2 square miles, of which 4.1 square miles is land and 0.1 square miles is water. The city is located in a hilly region, and the terrain is mostly flat.
Economy
Waterloo’s economy is largely based on agriculture and manufacturing. The city is home to several factories, including a paper mill, a flour mill, and a canning factory. The city also has a number of small businesses, including restaurants, retail stores, and service providers. The city is also home to a number of tourist attractions, including the Waterloo Historical Society Museum, the Waterloo State Recreation Area, and the Crawfish River.
Demographics
As of the 2010 census, Waterloo had a population of 8,039 people. The racial makeup of the city was 94.2% White, 0.7% African American, 0.3% Native American, 0.7% Asian, 0.1% Pacific Islander, 2.3% from other races, and 1.9% from two or more races. Hispanic or Latino of any race were 4.2% of the population. The median household income was $45,945, and the median family income was $54,945. The per capita income was $21,945.
Waterloo is a small city with a rich history and a friendly atmosphere. It is home to a number of factories and small businesses, and is a popular tourist destination. The city has a diverse population, and is a great place to live and work.
Common Questions
What is Per Capita Income in Waterloo?
Per Capita income in Waterloo is $35,336.
What is the Median Family Income in Waterloo?
Median Family Income in Waterloo is $64,196.
What is the Median Household income in Waterloo?
Median Household Income in Waterloo is $72,666.
What is Income or Wage Gap in Waterloo?
Income or Wage Gap in Waterloo is 17.7%.
Women in Waterloo earn 82.3 cents for every dollar earned by a man.
What is Inequality or Gini Index in Waterloo?
Inequality or Gini Index in Waterloo is 0.39.
What is the Total Population of Waterloo?
Total Population of Waterloo is 3,511.
What is the Total Male Population of Waterloo?
Total Male Population of Waterloo is 1,839.
What is the Total Female Population of Waterloo?
Total Female Population of Waterloo is 1,672.
What is the Ratio of Males per 100 Females in Waterloo?
There are 109.99 Males per 100 Females in Waterloo.
What is the Ratio of Females per 100 Males in Waterloo?
There are 90.92 Females per 100 Males in Waterloo.
What is the Median Population Age in Waterloo?
Median Population Age in Waterloo is 40.9 Years.
What is the Average Family Size in Waterloo
Average Family Size in Waterloo is 2.7 People.
What is the Average Household Size in Waterloo
Average Household Size in Waterloo is 2.2 People.
How Large is the Labor Force in Waterloo?
There are 1,976 People in the Labor Forcein in Waterloo.
What is the Percentage of People in the Labor Force in Waterloo?
72.0% of People are in the Labor Force in Waterloo.
What is the Unemployment Rate in Waterloo?
Unemployment Rate in Waterloo is 3.5%.