Warrens, WI Map & Demographics
Warrens Map
Warrens Overview
$34,199
PER CAPITA INCOME
$73,125
AVG FAMILY INCOME
$73,438
AVG HOUSEHOLD INCOME
22.6%
WAGE / INCOME GAP [ % ]
77.4¢/ $1
WAGE / INCOME GAP [ $ ]
$17,330
FAMILY INCOME DEFICIT
0.38
INEQUALITY / GINI INDEX
504
TOTAL POPULATION
248
MALE POPULATION
256
FEMALE POPULATION
96.88
MALES / 100 FEMALES
103.23
FEMALES / 100 MALES
38.5
MEDIAN AGE
2.8
AVG FAMILY SIZE
2.5
AVG HOUSEHOLD SIZE
249
LABOR FORCE [ PEOPLE ]
66.4%
PERCENT IN LABOR FORCE
0.4%
UNEMPLOYMENT RATE
Warrens Zip Codes
Warrens Area Codes
Income in Warrens
Income Overview in Warrens
Per Capita Income in Warrens is $34,199, while median incomes of families and households are $73,125 and $73,438 respectively.
| Characteristic | Number | Measure |
| Per Capita Income | 504 | $34,199 |
| Median Family Income | 150 | $73,125 |
| Mean Family Income | 150 | $81,537 |
| Median Household Income | 204 | $73,438 |
| Mean Household Income | 204 | $85,158 |
| Income Deficit | 150 | $17,330 |
| Wage / Income Gap (%) | 504 | 22.57% |
| Wage / Income Gap ($) | 504 | 77.43¢ per $1 |
| Gini / Inequality Index | 504 | 0.38 |
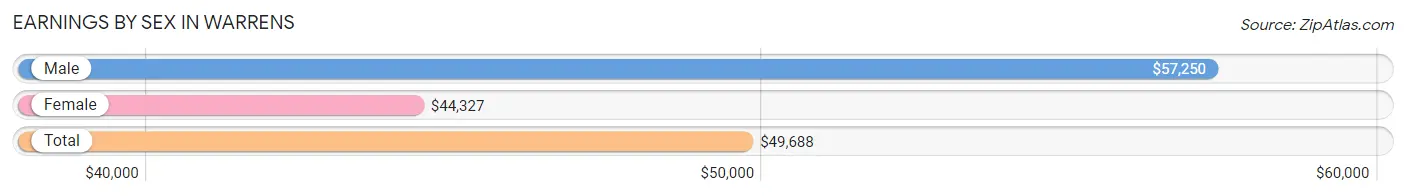
Earnings by Sex in Warrens
Average Earnings in Warrens are $49,688, $57,250 for men and $44,327 for women, a difference of 22.6%.
| Sex | Number | Average Earnings |
| Male | 141 (52.6%) | $57,250 |
| Female | 127 (47.4%) | $44,327 |
| Total | 268 (100.0%) | $49,688 |
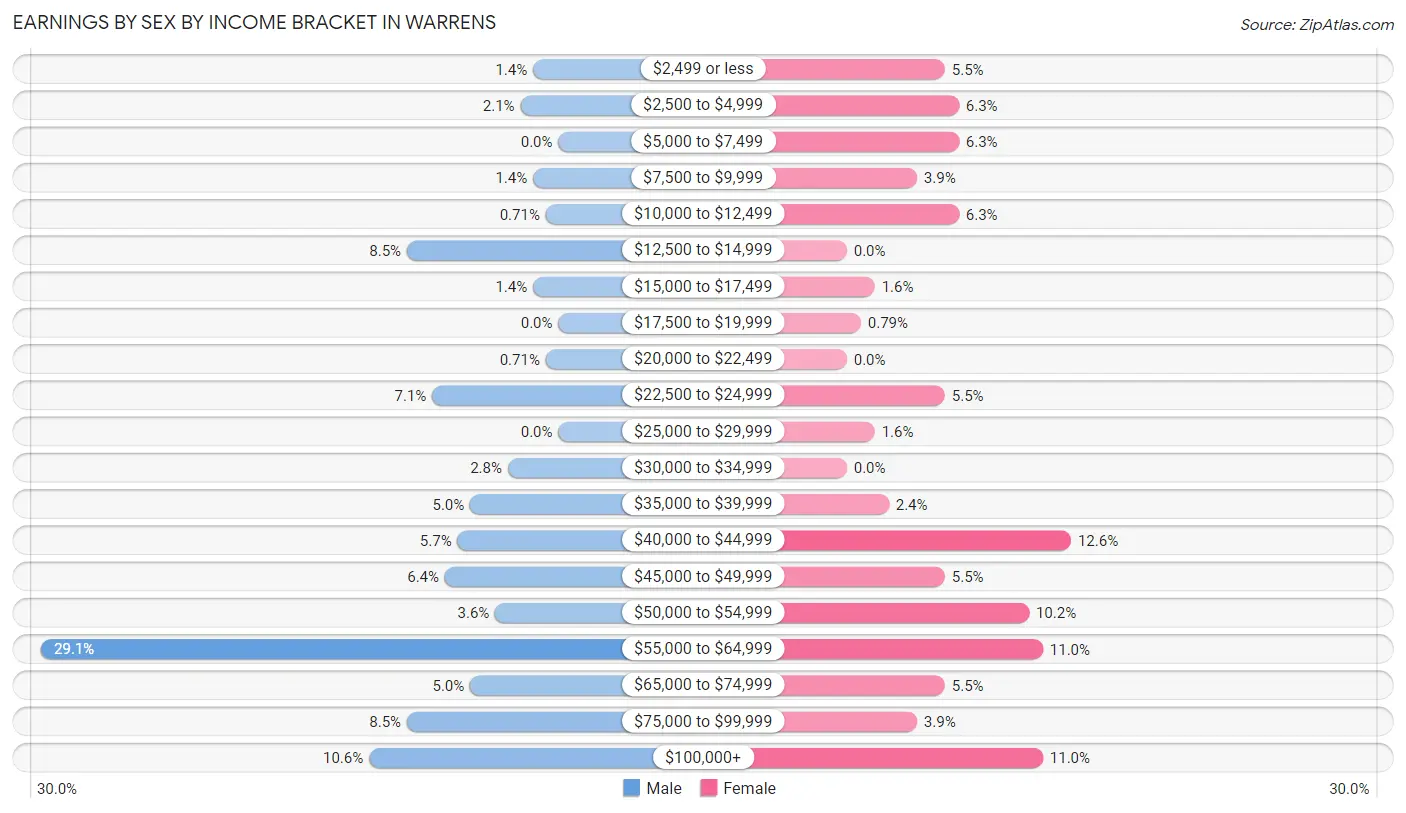
Earnings by Sex by Income Bracket in Warrens
The most common earnings brackets in Warrens are $55,000 to $64,999 for men (41 | 29.1%) and $40,000 to $44,999 for women (16 | 12.6%).
| Income | Male | Female |
| $2,499 or less | 2 (1.4%) | 7 (5.5%) |
| $2,500 to $4,999 | 3 (2.1%) | 8 (6.3%) |
| $5,000 to $7,499 | 0 (0.0%) | 8 (6.3%) |
| $7,500 to $9,999 | 2 (1.4%) | 5 (3.9%) |
| $10,000 to $12,499 | 1 (0.7%) | 8 (6.3%) |
| $12,500 to $14,999 | 12 (8.5%) | 0 (0.0%) |
| $15,000 to $17,499 | 2 (1.4%) | 2 (1.6%) |
| $17,500 to $19,999 | 0 (0.0%) | 1 (0.8%) |
| $20,000 to $22,499 | 1 (0.7%) | 0 (0.0%) |
| $22,500 to $24,999 | 10 (7.1%) | 7 (5.5%) |
| $25,000 to $29,999 | 0 (0.0%) | 2 (1.6%) |
| $30,000 to $34,999 | 4 (2.8%) | 0 (0.0%) |
| $35,000 to $39,999 | 7 (5.0%) | 3 (2.4%) |
| $40,000 to $44,999 | 8 (5.7%) | 16 (12.6%) |
| $45,000 to $49,999 | 9 (6.4%) | 7 (5.5%) |
| $50,000 to $54,999 | 5 (3.5%) | 13 (10.2%) |
| $55,000 to $64,999 | 41 (29.1%) | 14 (11.0%) |
| $65,000 to $74,999 | 7 (5.0%) | 7 (5.5%) |
| $75,000 to $99,999 | 12 (8.5%) | 5 (3.9%) |
| $100,000+ | 15 (10.6%) | 14 (11.0%) |
| Total | 141 (100.0%) | 127 (100.0%) |
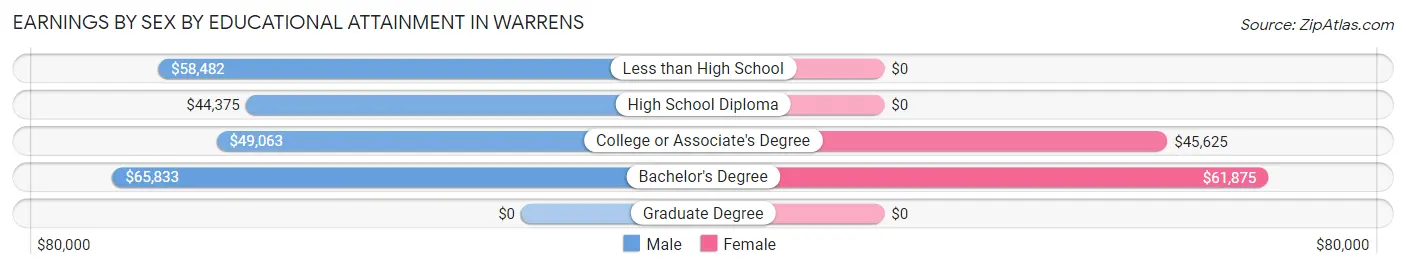
Earnings by Sex by Educational Attainment in Warrens
Average earnings in Warrens are $57,788 for men and $48,438 for women, a difference of 16.2%. Men with an educational attainment of bachelor's degree enjoy the highest average annual earnings of $65,833, while those with high school diploma education earn the least with $44,375. Women with an educational attainment of bachelor's degree earn the most with the average annual earnings of $61,875, while those with college or associate's degree education have the smallest earnings of $45,625.
| Educational Attainment | Male Income | Female Income |
| Less than High School | $58,482 | $0 |
| High School Diploma | $44,375 | $0 |
| College or Associate's Degree | $49,063 | $45,625 |
| Bachelor's Degree | $65,833 | $61,875 |
| Graduate Degree | - | - |
| Total | $57,788 | $48,438 |
Family Income in Warrens
Family Income Brackets in Warrens
According to the Warrens family income data, there are 41 families falling into the $50,000 to $74,999 income range, which is the most common income bracket and makes up 27.3% of all families.
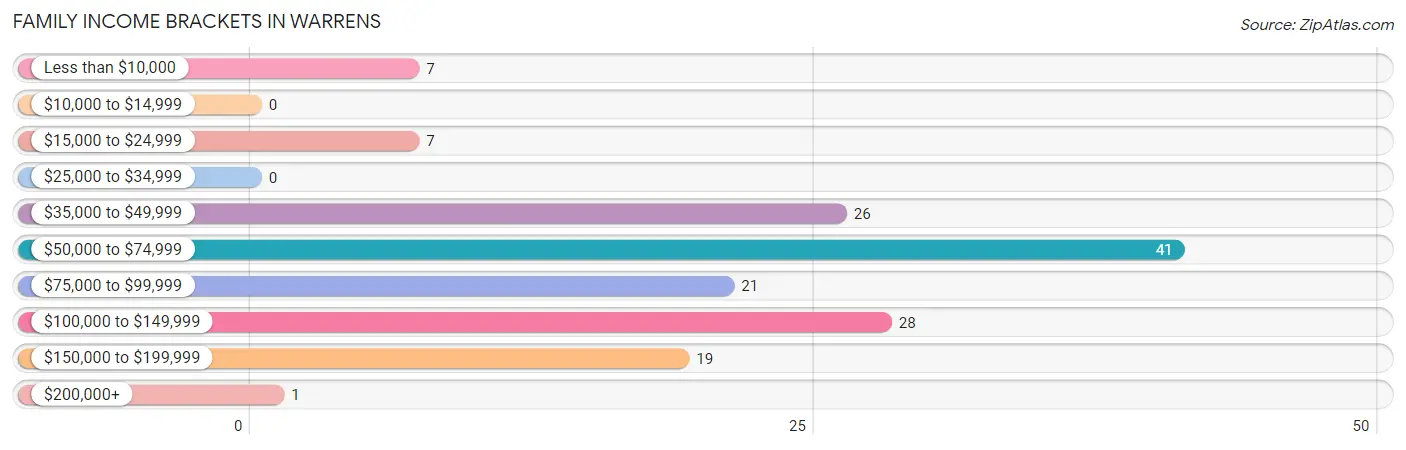
| Income Bracket | # Families | % Families |
| Less than $10,000 | 7 | 4.7% |
| $10,000 to $14,999 | 0 | 0.0% |
| $15,000 to $24,999 | 7 | 4.7% |
| $25,000 to $34,999 | 0 | 0.0% |
| $35,000 to $49,999 | 26 | 17.3% |
| $50,000 to $74,999 | 41 | 27.3% |
| $75,000 to $99,999 | 21 | 14.0% |
| $100,000 to $149,999 | 28 | 18.7% |
| $150,000 to $199,999 | 19 | 12.7% |
| $200,000+ | 1 | 0.7% |
Family Income by Famaliy Size in Warrens
3-person families (27 | 18.0%) account for the highest median family income in Warrens with $83,750 per family, while 2-person families (83 | 55.3%) have the highest median income of $28,906 per family member.
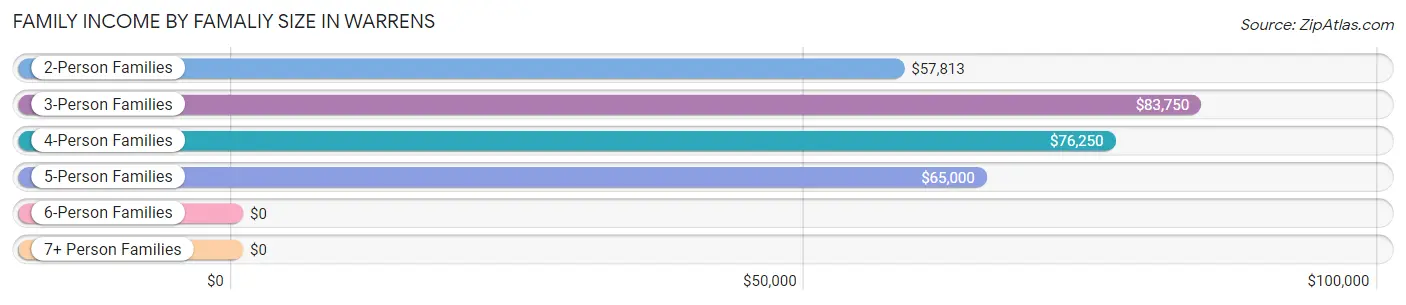
| Income Bracket | # Families | Median Income |
| 2-Person Families | 83 (55.3%) | $57,813 |
| 3-Person Families | 27 (18.0%) | $83,750 |
| 4-Person Families | 30 (20.0%) | $76,250 |
| 5-Person Families | 6 (4.0%) | $65,000 |
| 6-Person Families | 4 (2.7%) | $0 |
| 7+ Person Families | 0 (0.0%) | $0 |
| Total | 150 (100.0%) | $73,125 |
Family Income by Number of Earners in Warrens
The median family income in Warrens is $73,125, with families comprising 3+ earners (4) having the highest median family income of $131,250, while families with no earners (19) have the lowest median family income of $42,917, accounting for 2.7% and 12.7% of families, respectively.
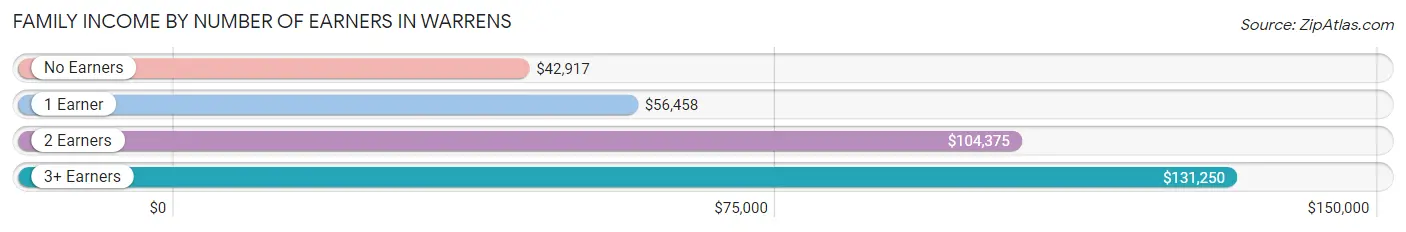
| Number of Earners | # Families | Median Income |
| No Earners | 19 (12.7%) | $42,917 |
| 1 Earner | 65 (43.3%) | $56,458 |
| 2 Earners | 62 (41.3%) | $104,375 |
| 3+ Earners | 4 (2.7%) | $131,250 |
| Total | 150 (100.0%) | $73,125 |
Household Income in Warrens
Household Income Brackets in Warrens
With 40 households falling in the category, the $100,000 to $149,999 income range is the most frequent in Warrens, accounting for 19.6% of all households. In contrast, only 2 households (1.0%) fall into the $200,000+ income bracket, making it the least populous group.
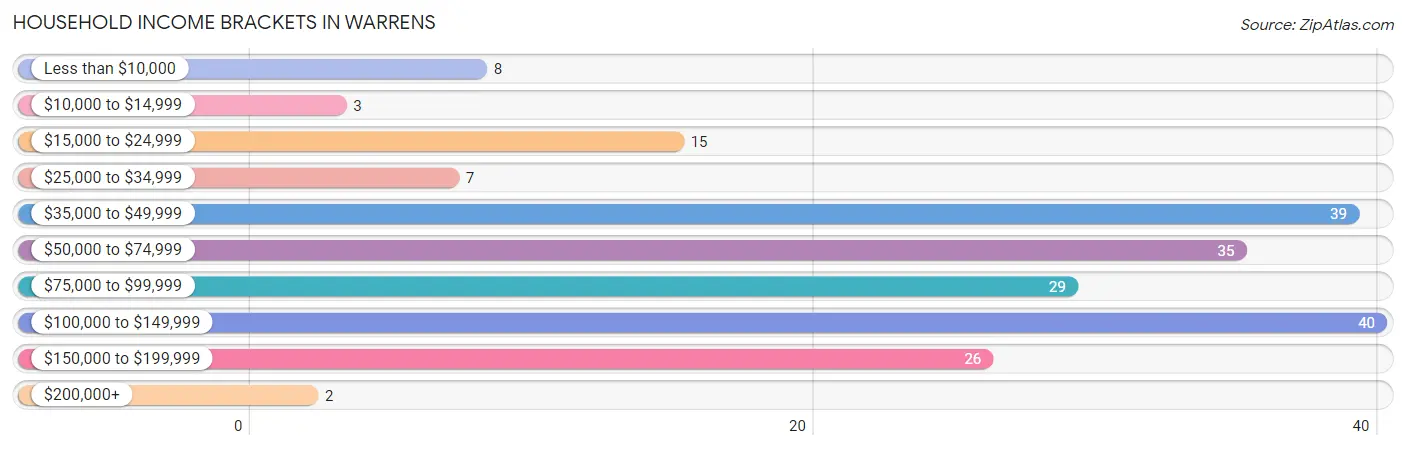
| Income Bracket | # Households | % Households |
| Less than $10,000 | 8 | 3.9% |
| $10,000 to $14,999 | 3 | 1.5% |
| $15,000 to $24,999 | 15 | 7.4% |
| $25,000 to $34,999 | 7 | 3.4% |
| $35,000 to $49,999 | 39 | 19.1% |
| $50,000 to $74,999 | 35 | 17.2% |
| $75,000 to $99,999 | 29 | 14.2% |
| $100,000 to $149,999 | 40 | 19.6% |
| $150,000 to $199,999 | 26 | 12.7% |
| $200,000+ | 2 | 1.0% |
Household Income by Householder Age in Warrens
The median household income in Warrens is $73,438, with the highest median household income of $95,938 found in the 45 to 64 years age bracket for the primary householder. A total of 71 households (34.8%) fall into this category. Meanwhile, the 15 to 24 years age bracket for the primary householder has the lowest median household income of $0, with 12 households (5.9%) in this group.
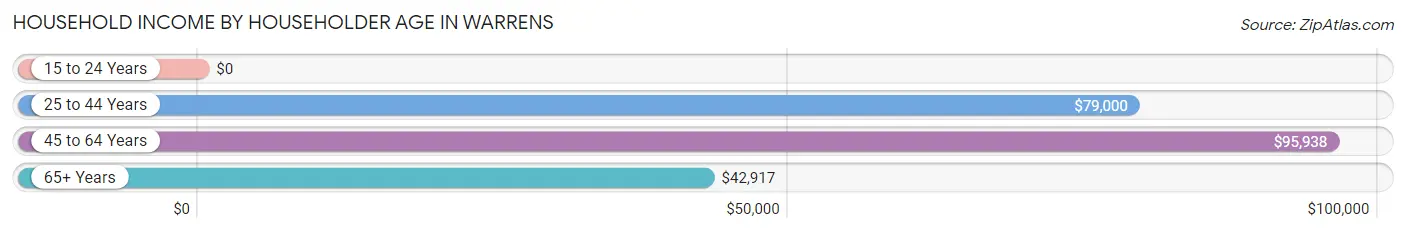
| Income Bracket | # Households | Median Income |
| 15 to 24 Years | 12 (5.9%) | $0 |
| 25 to 44 Years | 76 (37.2%) | $79,000 |
| 45 to 64 Years | 71 (34.8%) | $95,938 |
| 65+ Years | 45 (22.1%) | $42,917 |
| Total | 204 (100.0%) | $73,438 |
Poverty in Warrens
Income Below Poverty by Sex and Age in Warrens
With 3.2% poverty level for males and 13.3% for females among the residents of Warrens, 15 year old males and under 5 year old females are the most vulnerable to poverty, with 2 males (40.0%) and 10 females (71.4%) in their respective age groups living below the poverty level.
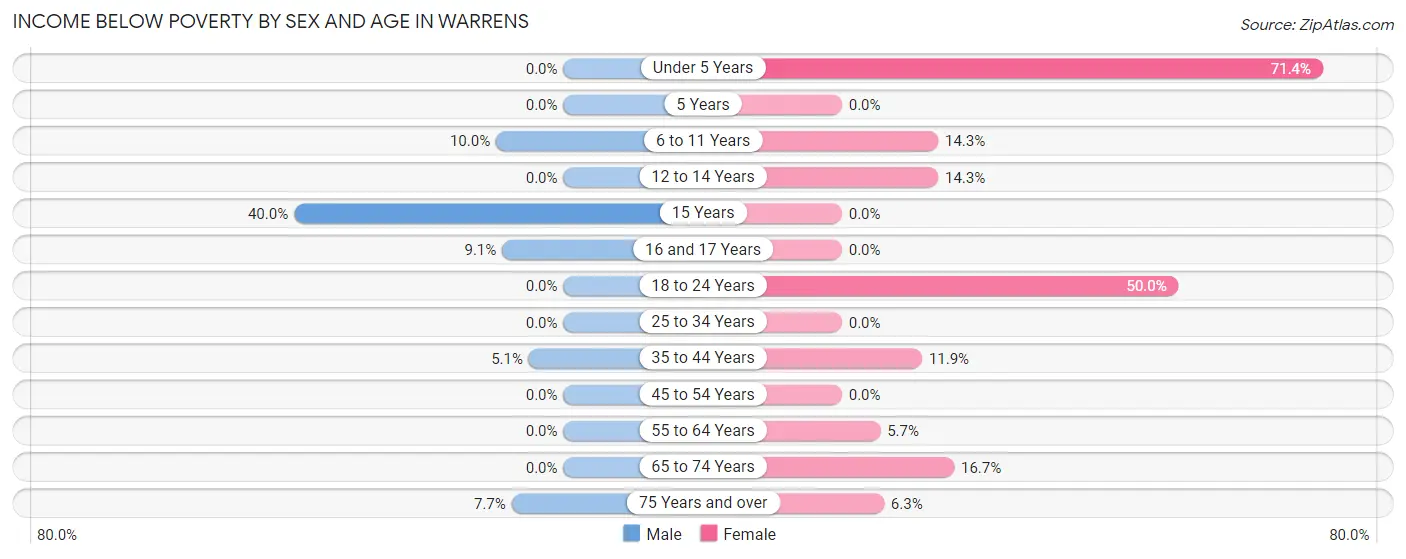
| Age Bracket | Male | Female |
| Under 5 Years | 0 (0.0%) | 10 (71.4%) |
| 5 Years | 0 (0.0%) | 0 (0.0%) |
| 6 to 11 Years | 2 (10.0%) | 4 (14.3%) |
| 12 to 14 Years | 0 (0.0%) | 2 (14.3%) |
| 15 Years | 2 (40.0%) | 0 (0.0%) |
| 16 and 17 Years | 1 (9.1%) | 0 (0.0%) |
| 18 to 24 Years | 0 (0.0%) | 7 (50.0%) |
| 25 to 34 Years | 0 (0.0%) | 0 (0.0%) |
| 35 to 44 Years | 2 (5.1%) | 5 (11.9%) |
| 45 to 54 Years | 0 (0.0%) | 0 (0.0%) |
| 55 to 64 Years | 0 (0.0%) | 2 (5.7%) |
| 65 to 74 Years | 0 (0.0%) | 3 (16.7%) |
| 75 Years and over | 1 (7.7%) | 1 (6.2%) |
| Total | 8 (3.2%) | 34 (13.3%) |
Income Above Poverty by Sex and Age in Warrens
According to the poverty statistics in Warrens, males aged under 5 years and females aged 5 years are the age groups that are most secure financially, with 100.0% of males and 100.0% of females in these age groups living above the poverty line.
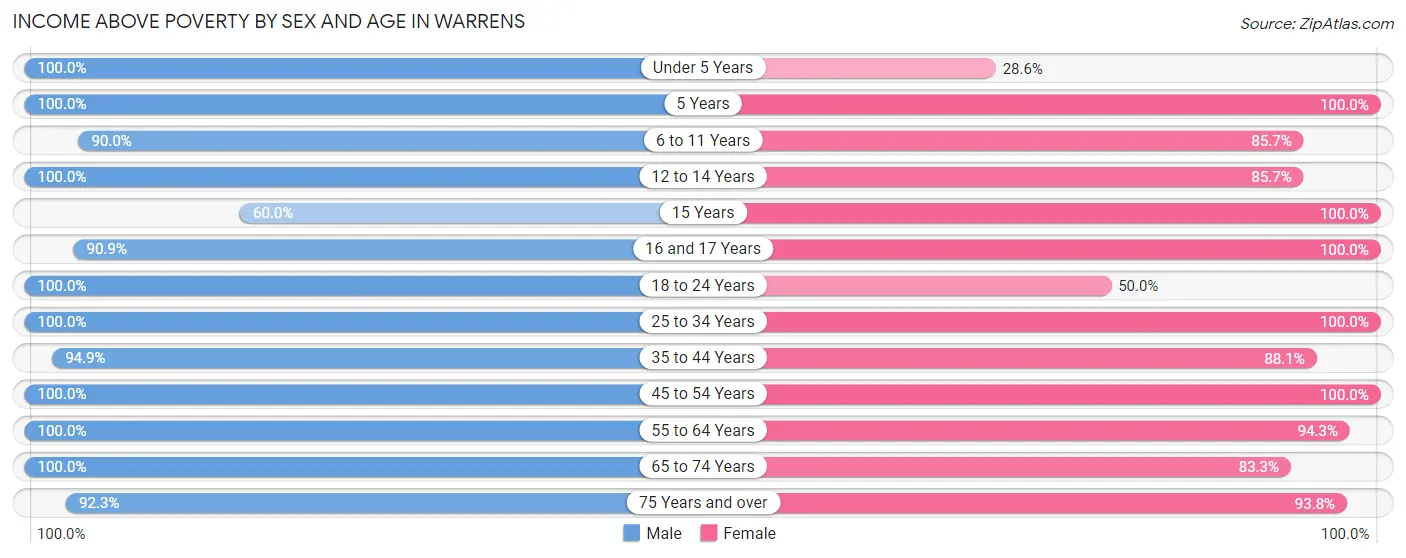
| Age Bracket | Male | Female |
| Under 5 Years | 23 (100.0%) | 4 (28.6%) |
| 5 Years | 2 (100.0%) | 5 (100.0%) |
| 6 to 11 Years | 18 (90.0%) | 24 (85.7%) |
| 12 to 14 Years | 3 (100.0%) | 12 (85.7%) |
| 15 Years | 3 (60.0%) | 15 (100.0%) |
| 16 and 17 Years | 10 (90.9%) | 4 (100.0%) |
| 18 to 24 Years | 5 (100.0%) | 7 (50.0%) |
| 25 to 34 Years | 33 (100.0%) | 29 (100.0%) |
| 35 to 44 Years | 37 (94.9%) | 37 (88.1%) |
| 45 to 54 Years | 42 (100.0%) | 22 (100.0%) |
| 55 to 64 Years | 34 (100.0%) | 33 (94.3%) |
| 65 to 74 Years | 18 (100.0%) | 15 (83.3%) |
| 75 Years and over | 12 (92.3%) | 15 (93.8%) |
| Total | 240 (96.8%) | 222 (86.7%) |
Income Below Poverty Among Married-Couple Families in Warrens
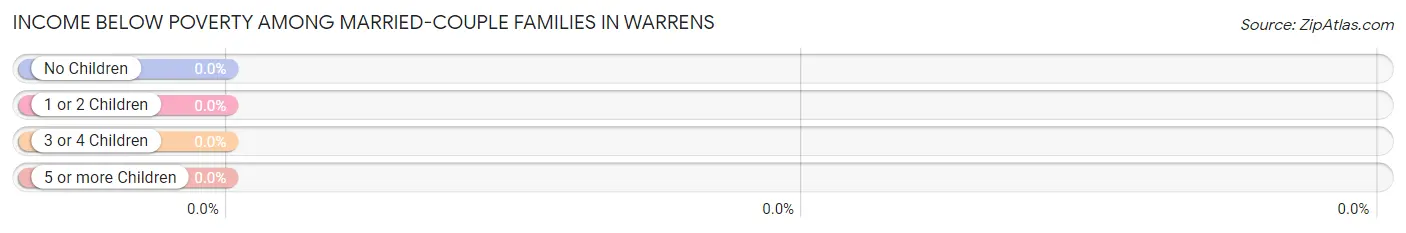
| Children | Above Poverty | Below Poverty |
| No Children | 71 (100.0%) | 0 (0.0%) |
| 1 or 2 Children | 36 (100.0%) | 0 (0.0%) |
| 3 or 4 Children | 7 (100.0%) | 0 (0.0%) |
| 5 or more Children | 0 (0.0%) | 0 (0.0%) |
| Total | 114 (100.0%) | 0 (0.0%) |
Income Below Poverty Among Single-Parent Households in Warrens
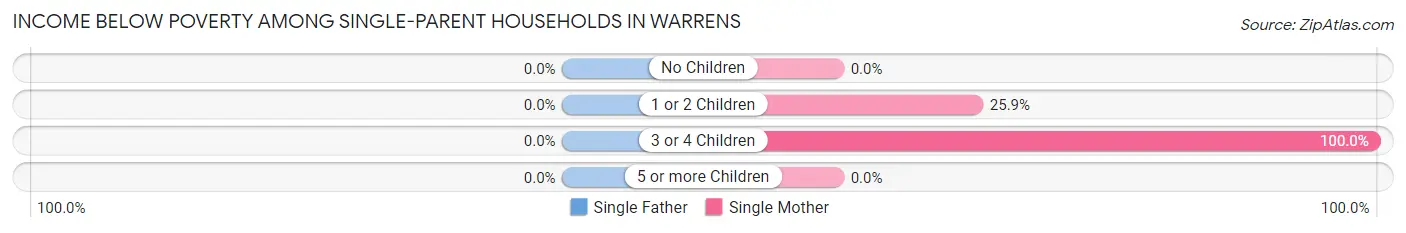
| Children | Single Father | Single Mother |
| No Children | 0 (0.0%) | 0 (0.0%) |
| 1 or 2 Children | 0 (0.0%) | 7 (25.9%) |
| 3 or 4 Children | 0 (0.0%) | 3 (100.0%) |
| 5 or more Children | 0 (0.0%) | 0 (0.0%) |
| Total | 0 (0.0%) | 10 (32.3%) |
Income Below Poverty Among Married-Couple vs Single-Parent Households in Warrens
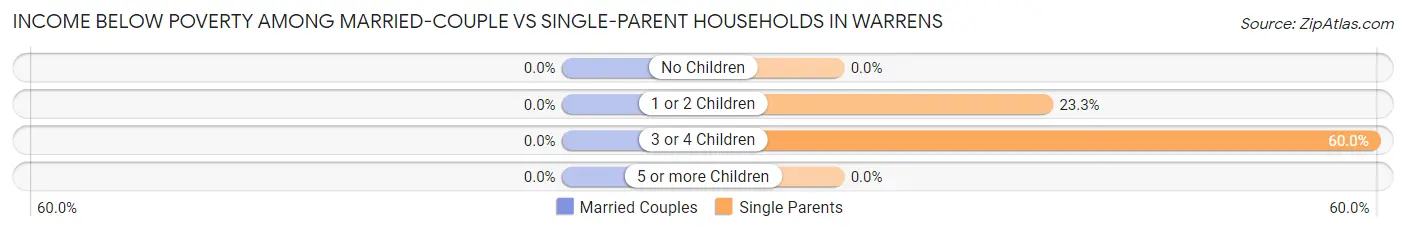
| Children | Married-Couple Families | Single-Parent Households |
| No Children | 0 (0.0%) | 0 (0.0%) |
| 1 or 2 Children | 0 (0.0%) | 7 (23.3%) |
| 3 or 4 Children | 0 (0.0%) | 3 (60.0%) |
| 5 or more Children | 0 (0.0%) | 0 (0.0%) |
| Total | 0 (0.0%) | 10 (27.8%) |
Race in Warrens
The most populous races in Warrens are White / Caucasian (452 | 89.7%), Native / Alaskan (40 | 7.9%), and Two or more Races (11 | 2.2%).
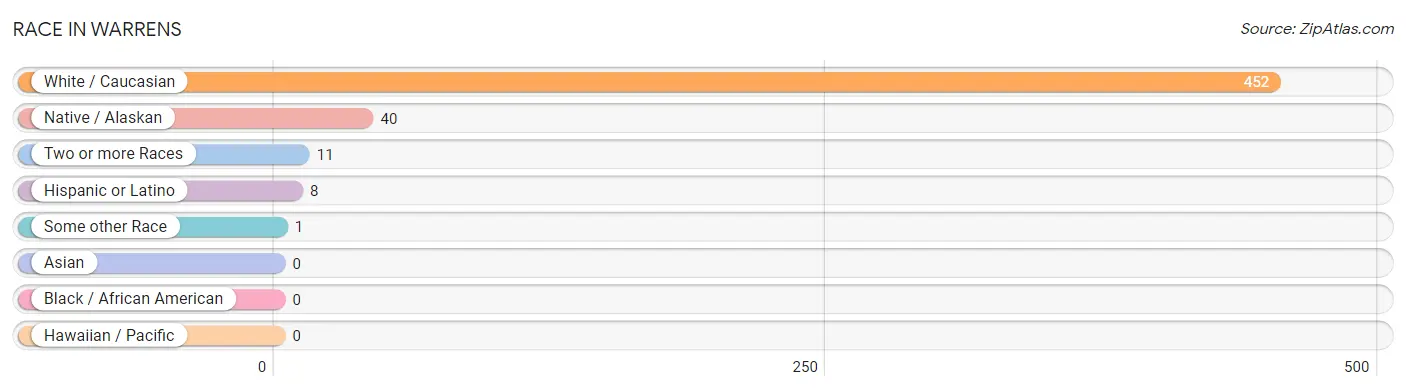
| Race | # Population | % Population |
| Asian | 0 | 0.0% |
| Black / African American | 0 | 0.0% |
| Hawaiian / Pacific | 0 | 0.0% |
| Hispanic or Latino | 8 | 1.6% |
| Native / Alaskan | 40 | 7.9% |
| White / Caucasian | 452 | 89.7% |
| Two or more Races | 11 | 2.2% |
| Some other Race | 1 | 0.2% |
| Total | 504 | 100.0% |
Ancestry in Warrens
The most populous ancestries reported in Warrens are German (236 | 46.8%), Irish (63 | 12.5%), Italian (45 | 8.9%), Polish (36 | 7.1%), and English (33 | 6.6%), together accounting for 82.0% of all Warrens residents.
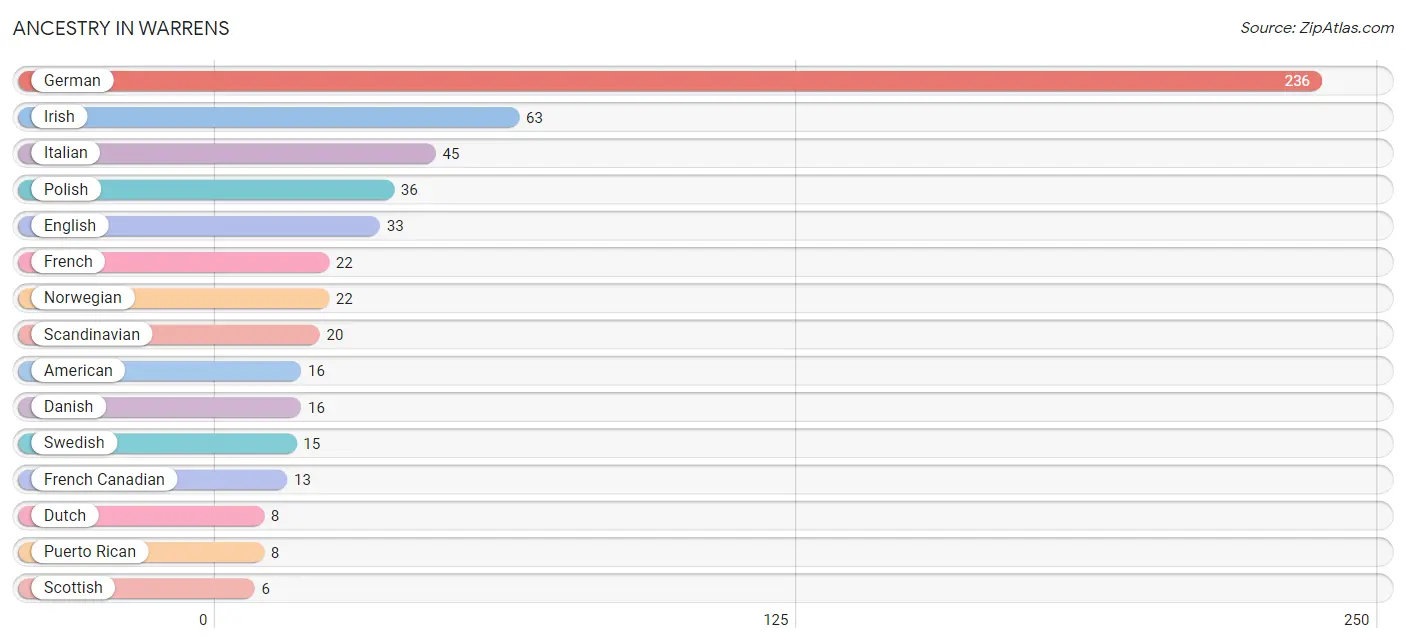
| Ancestry | # Population | % Population |
| American | 16 | 3.2% |
| Belgian | 5 | 1.0% |
| Blackfeet | 1 | 0.2% |
| Chippewa | 1 | 0.2% |
| Czech | 2 | 0.4% |
| Czechoslovakian | 2 | 0.4% |
| Danish | 16 | 3.2% |
| Dutch | 8 | 1.6% |
| English | 33 | 6.6% |
| French | 22 | 4.4% |
| French Canadian | 13 | 2.6% |
| German | 236 | 46.8% |
| Indian (Asian) | 1 | 0.2% |
| Irish | 63 | 12.5% |
| Italian | 45 | 8.9% |
| Lithuanian | 1 | 0.2% |
| Norwegian | 22 | 4.4% |
| Polish | 36 | 7.1% |
| Puerto Rican | 8 | 1.6% |
| Scandinavian | 20 | 4.0% |
| Scottish | 6 | 1.2% |
| Sioux | 1 | 0.2% |
| Swedish | 15 | 3.0% |
| Welsh | 2 | 0.4% | View All 24 Rows |
Immigrants in Warrens

| Immigration Origin | # Population | % Population | View All 0 Rows |
Sex and Age in Warrens
Sex and Age in Warrens
The most populous age groups in Warrens are 30 to 34 Years (29 | 11.7%) for men and 35 to 39 Years (30 | 11.7%) for women.
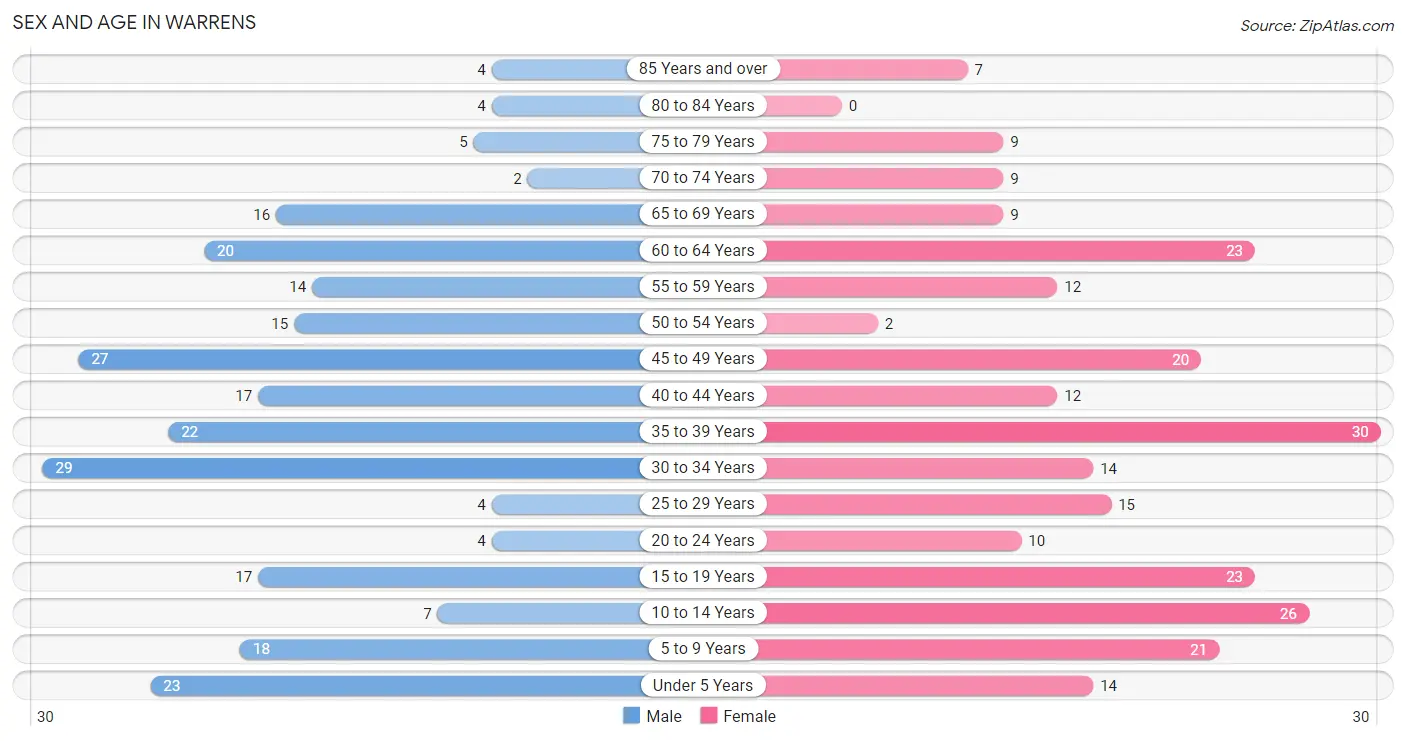
| Age Bracket | Male | Female |
| Under 5 Years | 23 (9.3%) | 14 (5.5%) |
| 5 to 9 Years | 18 (7.3%) | 21 (8.2%) |
| 10 to 14 Years | 7 (2.8%) | 26 (10.2%) |
| 15 to 19 Years | 17 (6.9%) | 23 (9.0%) |
| 20 to 24 Years | 4 (1.6%) | 10 (3.9%) |
| 25 to 29 Years | 4 (1.6%) | 15 (5.9%) |
| 30 to 34 Years | 29 (11.7%) | 14 (5.5%) |
| 35 to 39 Years | 22 (8.9%) | 30 (11.7%) |
| 40 to 44 Years | 17 (6.9%) | 12 (4.7%) |
| 45 to 49 Years | 27 (10.9%) | 20 (7.8%) |
| 50 to 54 Years | 15 (6.0%) | 2 (0.8%) |
| 55 to 59 Years | 14 (5.7%) | 12 (4.7%) |
| 60 to 64 Years | 20 (8.1%) | 23 (9.0%) |
| 65 to 69 Years | 16 (6.5%) | 9 (3.5%) |
| 70 to 74 Years | 2 (0.8%) | 9 (3.5%) |
| 75 to 79 Years | 5 (2.0%) | 9 (3.5%) |
| 80 to 84 Years | 4 (1.6%) | 0 (0.0%) |
| 85 Years and over | 4 (1.6%) | 7 (2.7%) |
| Total | 248 (100.0%) | 256 (100.0%) |
Families and Households in Warrens
Median Family Size in Warrens
The median family size in Warrens is 2.81 persons per family, with married-couple families (114 | 76.0%) accounting for the largest median family size of 2.83 persons per family. On the other hand, single female/mother families (31 | 20.7%) represent the smallest median family size with 2.71 persons per family.
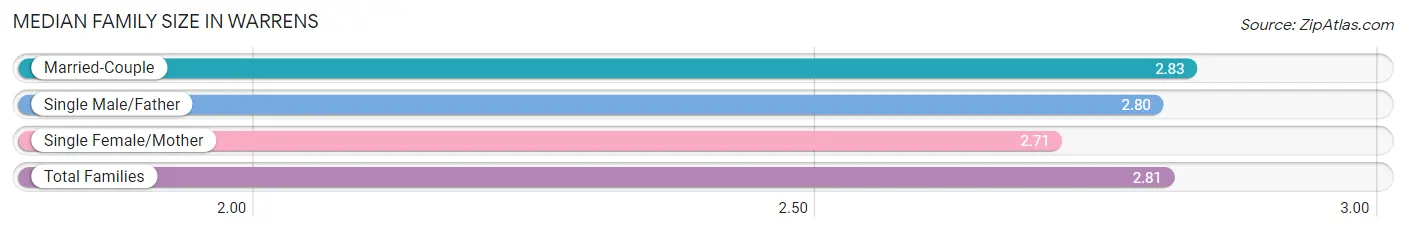
| Family Type | # Families | Family Size |
| Married-Couple | 114 (76.0%) | 2.83 |
| Single Male/Father | 5 (3.3%) | 2.80 |
| Single Female/Mother | 31 (20.7%) | 2.71 |
| Total Families | 150 (100.0%) | 2.81 |
Median Household Size in Warrens
The median household size in Warrens is 2.46 persons per household, with single female/mother households (31 | 15.2%) accounting for the largest median household size of 3.29 persons per household. non-family households (54 | 26.5%) represent the smallest median household size with 1.13 persons per household.
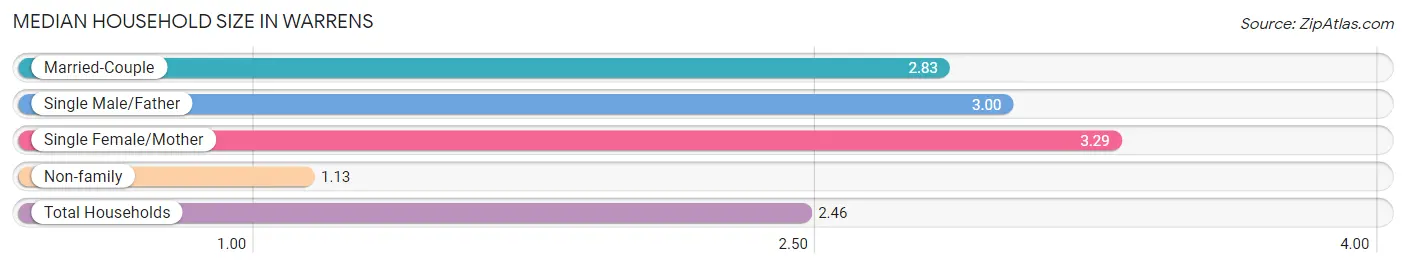
| Household Type | # Households | Household Size |
| Married-Couple | 114 (55.9%) | 2.83 |
| Single Male/Father | 5 (2.5%) | 3.00 |
| Single Female/Mother | 31 (15.2%) | 3.29 |
| Non-family | 54 (26.5%) | 1.13 |
| Total Households | 204 (100.0%) | 2.46 |
Household Size by Marriage Status in Warrens
Out of a total of 204 households in Warrens, 150 (73.5%) are family households, while 54 (26.5%) are nonfamily households. The most numerous type of family households are 2-person households, comprising 71, and the most common type of nonfamily households are 1-person households, comprising 47.
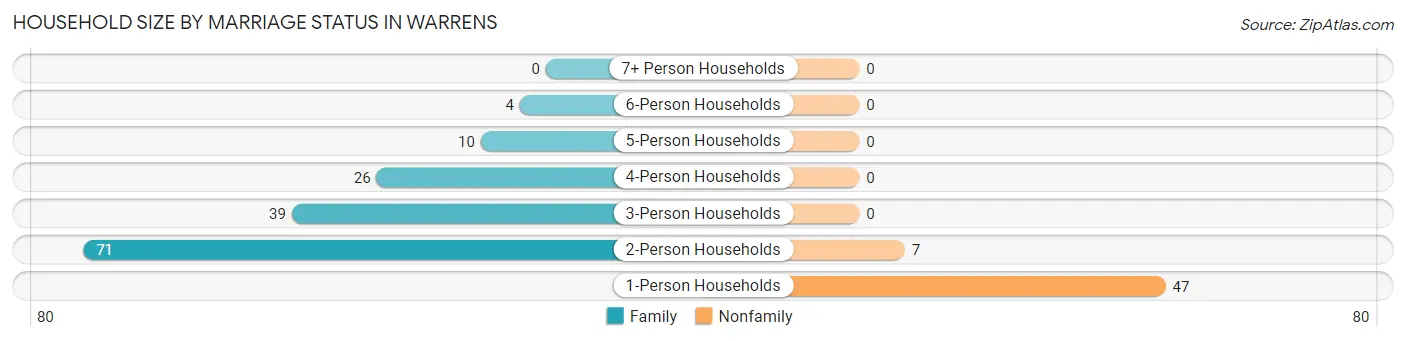
| Household Size | Family Households | Nonfamily Households |
| 1-Person Households | - | 47 (23.0%) |
| 2-Person Households | 71 (34.8%) | 7 (3.4%) |
| 3-Person Households | 39 (19.1%) | 0 (0.0%) |
| 4-Person Households | 26 (12.8%) | 0 (0.0%) |
| 5-Person Households | 10 (4.9%) | 0 (0.0%) |
| 6-Person Households | 4 (2.0%) | 0 (0.0%) |
| 7+ Person Households | 0 (0.0%) | 0 (0.0%) |
| Total | 150 (73.5%) | 54 (26.5%) |
Female Fertility in Warrens
Fertility by Age in Warrens
Average fertility rate in Warrens is 97.0 births per 1,000 women. Women in the age bracket of 20 to 34 years have the highest fertility rate with 308.0 births per 1,000 women. Women in the age bracket of 20 to 34 years acount for 100.0% of all women with births.
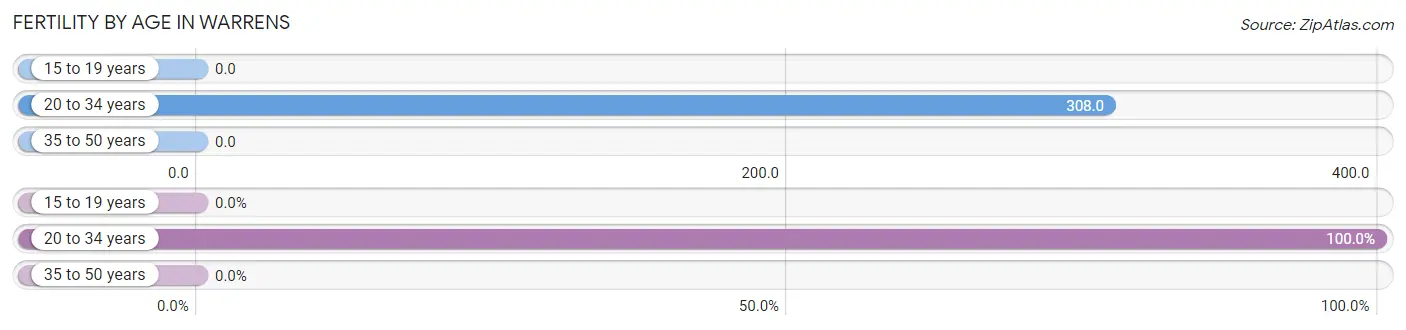
| Age Bracket | Women with Births | Births / 1,000 Women |
| 15 to 19 years | 0 (0.0%) | 0.0 |
| 20 to 34 years | 12 (100.0%) | 308.0 |
| 35 to 50 years | 0 (0.0%) | 0.0 |
| Total | 12 (100.0%) | 97.0 |
Fertility by Age by Marriage Status in Warrens
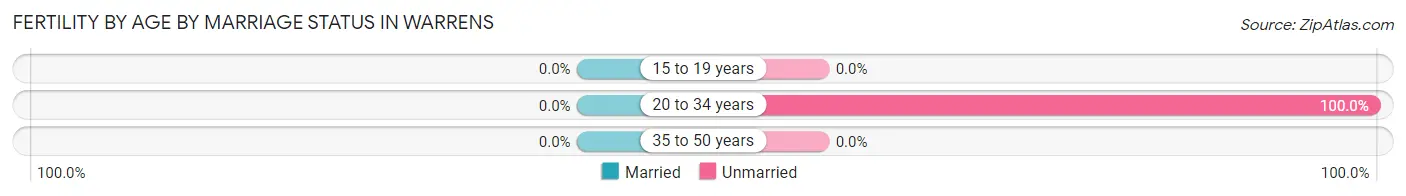
| Age Bracket | Married | Unmarried |
| 15 to 19 years | 0 (0.0%) | 0 (0.0%) |
| 20 to 34 years | 0 (0.0%) | 12 (100.0%) |
| 35 to 50 years | 0 (0.0%) | 0 (0.0%) |
| Total | 0 (0.0%) | 12 (100.0%) |
Fertility by Education in Warrens
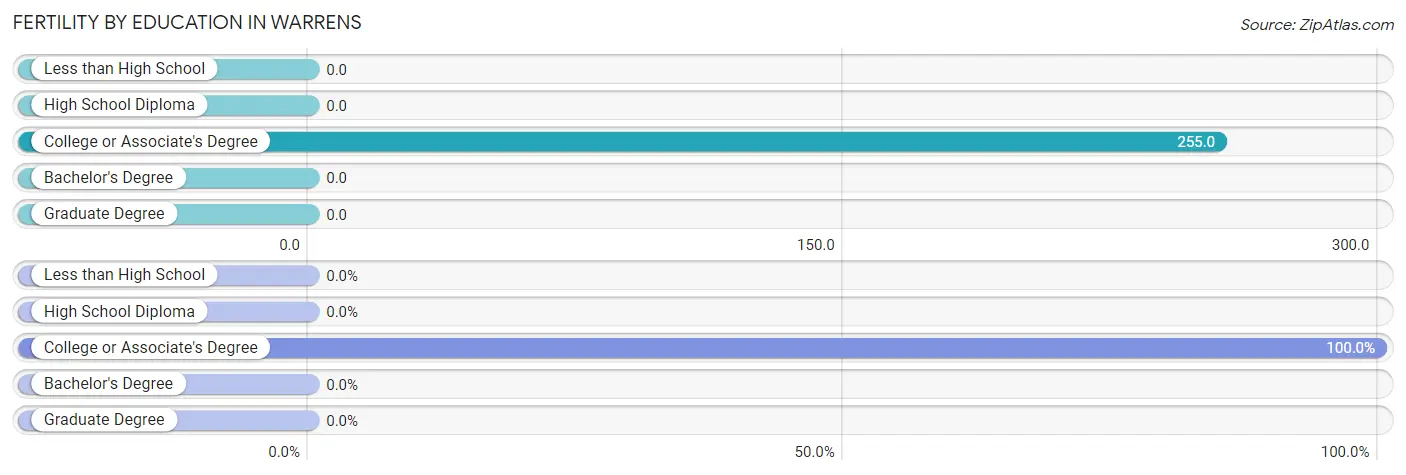
| Educational Attainment | Women with Births | Births / 1,000 Women |
| Less than High School | 0 (0.0%) | 0.0 |
| High School Diploma | 0 (0.0%) | 0.0 |
| College or Associate's Degree | 12 (100.0%) | 255.0 |
| Bachelor's Degree | 0 (0.0%) | 0.0 |
| Graduate Degree | 0 (0.0%) | 0.0 |
| Total | 12 (100.0%) | 97.0 |
Fertility by Education by Marriage Status in Warrens
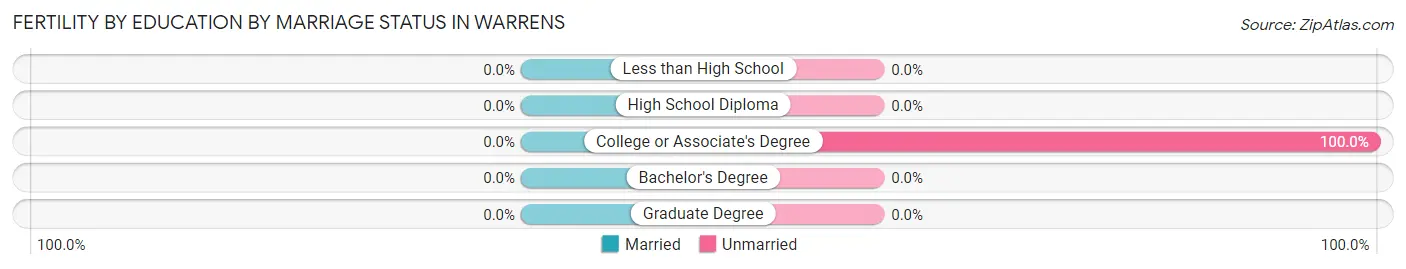
| Educational Attainment | Married | Unmarried |
| Less than High School | 0 (0.0%) | 0 (0.0%) |
| High School Diploma | 0 (0.0%) | 0 (0.0%) |
| College or Associate's Degree | 0 (0.0%) | 12 (100.0%) |
| Bachelor's Degree | 0 (0.0%) | 0 (0.0%) |
| Graduate Degree | 0 (0.0%) | 0 (0.0%) |
| Total | 0 (0.0%) | 12 (100.0%) |
Employment Characteristics in Warrens
Employment by Class of Employer in Warrens
Among the 241 employed individuals in Warrens, private company employees (106 | 44.0%), federal government employees (79 | 32.8%), and local government employees (16 | 6.6%) make up the most common classes of employment.
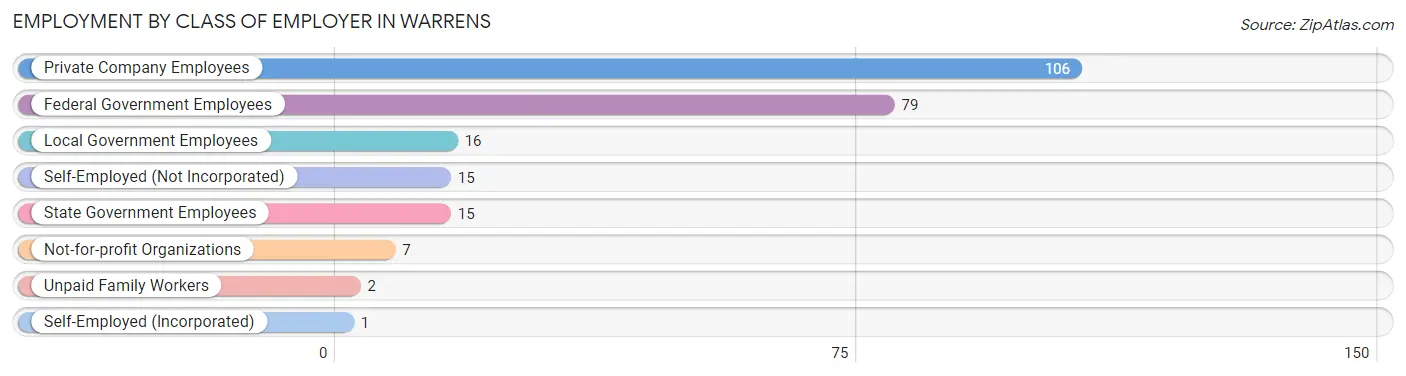
| Employer Class | # Employees | % Employees |
| Private Company Employees | 106 | 44.0% |
| Self-Employed (Incorporated) | 1 | 0.4% |
| Self-Employed (Not Incorporated) | 15 | 6.2% |
| Not-for-profit Organizations | 7 | 2.9% |
| Local Government Employees | 16 | 6.6% |
| State Government Employees | 15 | 6.2% |
| Federal Government Employees | 79 | 32.8% |
| Unpaid Family Workers | 2 | 0.8% |
| Total | 241 | 100.0% |
Employment Status by Age in Warrens
According to the labor force statistics for Warrens, out of the total population over 16 years of age (375), 66.4% or 249 individuals are in the labor force, with 0.4% or 1 of them unemployed. The age group with the highest labor force participation rate is 20 to 24 years, with 100.0% or 14 individuals in the labor force. Within the labor force, the 30 to 34 years age range has the highest percentage of unemployed individuals, with 2.6% or 1 of them being unemployed.
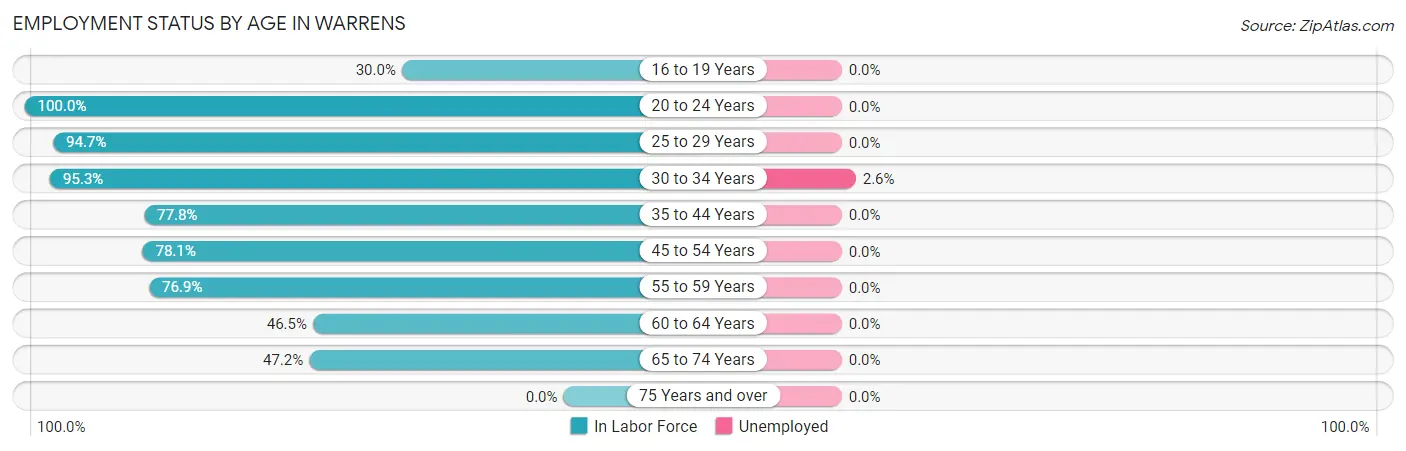
| Age Bracket | In Labor Force | Unemployed |
| 16 to 19 Years | 6 (30.0%) | 0 (0.0%) |
| 20 to 24 Years | 14 (100.0%) | 0 (0.0%) |
| 25 to 29 Years | 18 (94.7%) | 0 (0.0%) |
| 30 to 34 Years | 41 (95.3%) | 1 (2.6%) |
| 35 to 44 Years | 63 (77.8%) | 0 (0.0%) |
| 45 to 54 Years | 50 (78.1%) | 0 (0.0%) |
| 55 to 59 Years | 20 (76.9%) | 0 (0.0%) |
| 60 to 64 Years | 20 (46.5%) | 0 (0.0%) |
| 65 to 74 Years | 17 (47.2%) | 0 (0.0%) |
| 75 Years and over | 0 (0.0%) | 0 (0.0%) |
| Total | 249 (66.4%) | 1 (0.4%) |
Employment Status by Educational Attainment in Warrens
According to labor force statistics for Warrens, 76.8% of individuals (212) out of the total population between 25 and 64 years of age (276) are in the labor force, with 0.5% or 1 of them being unemployed. The group with the highest labor force participation rate are those with the educational attainment of bachelor's degree or higher, with 89.0% or 65 individuals in the labor force. Within the labor force, individuals with bachelor's degree or higher education have the highest percentage of unemployment, with 1.6% or 1 of them being unemployed.
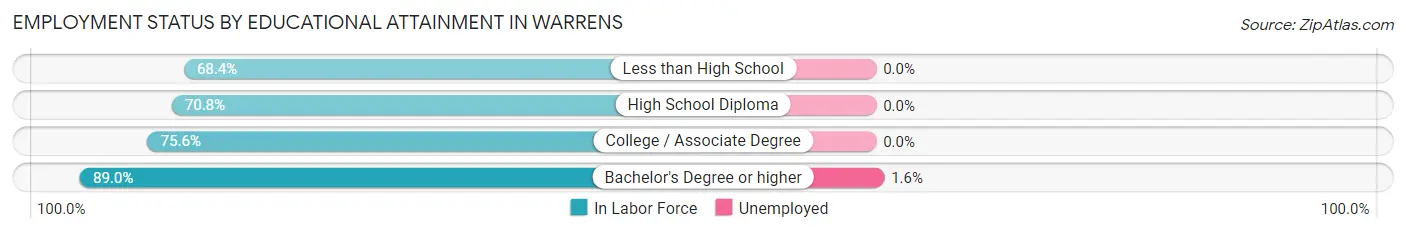
| Educational Attainment | In Labor Force | Unemployed |
| Less than High School | 13 (68.4%) | 0 (0.0%) |
| High School Diploma | 75 (70.8%) | 0 (0.0%) |
| College / Associate Degree | 59 (75.6%) | 0 (0.0%) |
| Bachelor's Degree or higher | 65 (89.0%) | 1 (1.6%) |
| Total | 212 (76.8%) | 1 (0.5%) |
Employment Occupations by Sex in Warrens
Management, Business, Science and Arts Occupations
The most common Management, Business, Science and Arts occupations in Warrens are Management (36 | 14.9%), Health Diagnosing & Treating (24 | 9.9%), Health Technologists (24 | 9.9%), Community & Social Service (9 | 3.7%), and Computers, Engineering & Science (8 | 3.3%).
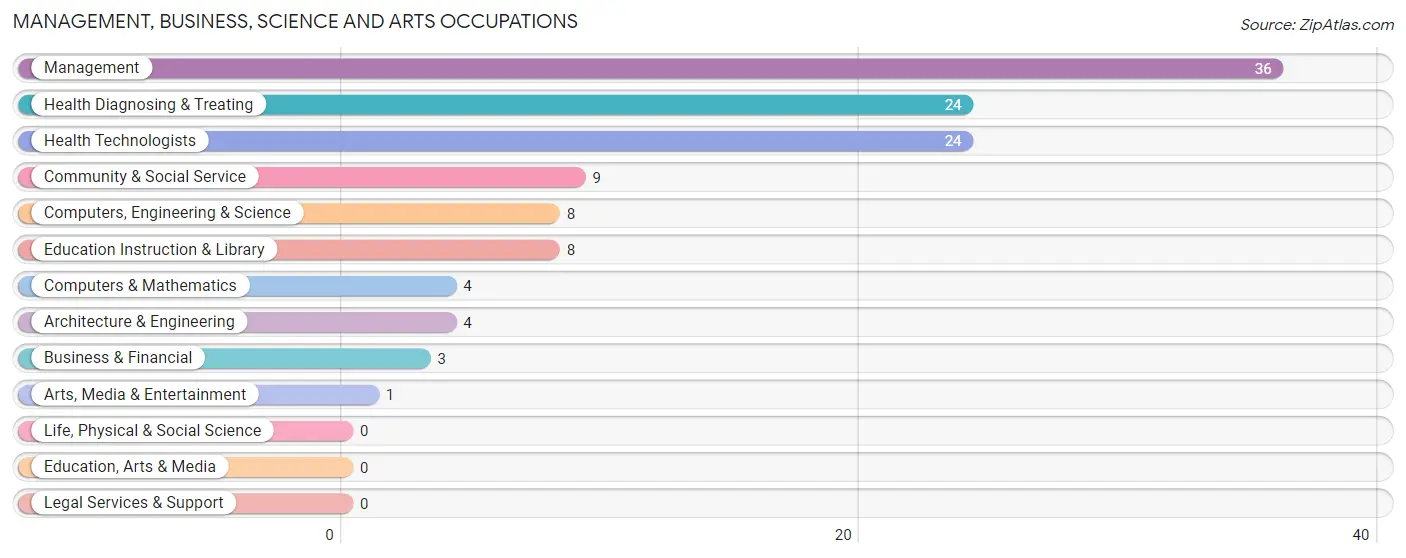
Management, Business, Science and Arts Occupations by Sex
Within the Management, Business, Science and Arts occupations in Warrens, the most male-oriented occupations are Management (88.9%), Health Diagnosing & Treating (29.2%), and Health Technologists (29.2%), while the most female-oriented occupations are Business & Financial (100.0%), Computers & Mathematics (100.0%), and Arts, Media & Entertainment (100.0%).
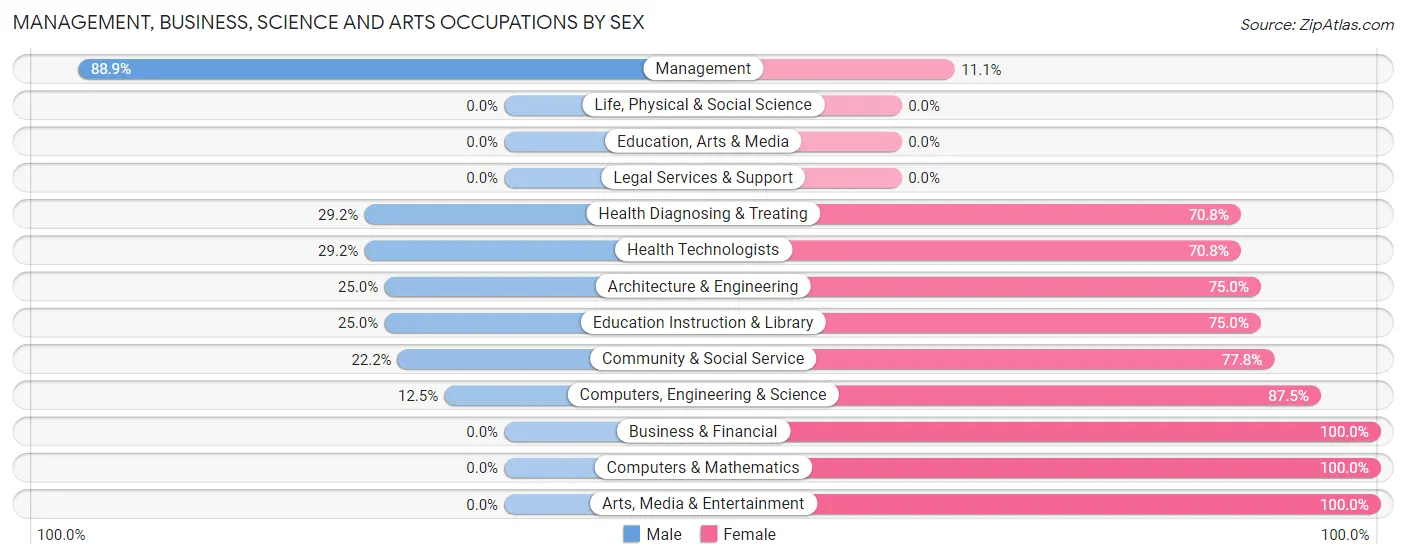
| Occupation | Male | Female |
| Management | 32 (88.9%) | 4 (11.1%) |
| Business & Financial | 0 (0.0%) | 3 (100.0%) |
| Computers, Engineering & Science | 1 (12.5%) | 7 (87.5%) |
| Computers & Mathematics | 0 (0.0%) | 4 (100.0%) |
| Architecture & Engineering | 1 (25.0%) | 3 (75.0%) |
| Life, Physical & Social Science | 0 (0.0%) | 0 (0.0%) |
| Community & Social Service | 2 (22.2%) | 7 (77.8%) |
| Education, Arts & Media | 0 (0.0%) | 0 (0.0%) |
| Legal Services & Support | 0 (0.0%) | 0 (0.0%) |
| Education Instruction & Library | 2 (25.0%) | 6 (75.0%) |
| Arts, Media & Entertainment | 0 (0.0%) | 1 (100.0%) |
| Health Diagnosing & Treating | 7 (29.2%) | 17 (70.8%) |
| Health Technologists | 7 (29.2%) | 17 (70.8%) |
| Total (Category) | 42 (52.5%) | 38 (47.5%) |
| Total (Overall) | 127 (52.5%) | 115 (47.5%) |
Services Occupations
The most common Services occupations in Warrens are Cleaning & Maintenance (27 | 11.2%), Healthcare Support (20 | 8.3%), Security & Protection (7 | 2.9%), Law Enforcement (4 | 1.7%), and Food Preparation & Serving (4 | 1.7%).
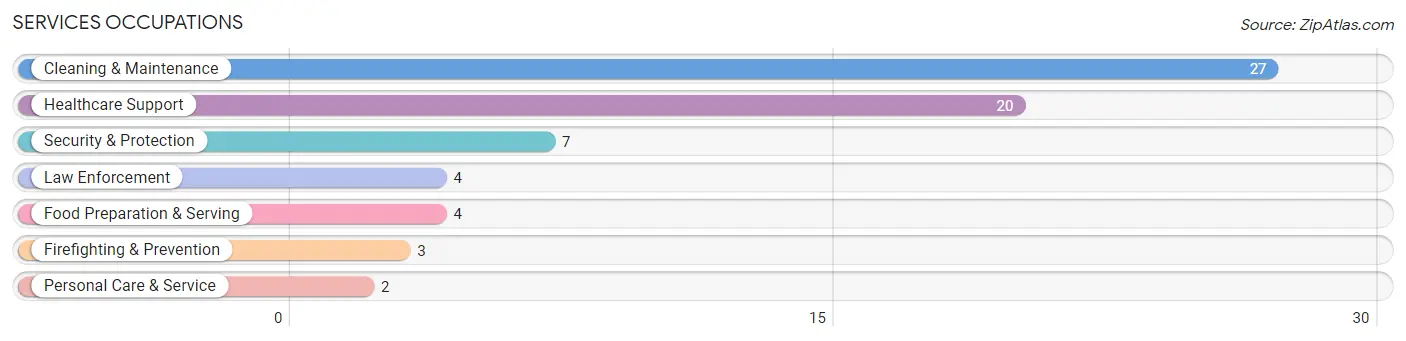
Services Occupations by Sex
Within the Services occupations in Warrens, the most male-oriented occupations are Security & Protection (100.0%), Firefighting & Prevention (100.0%), and Law Enforcement (100.0%), while the most female-oriented occupations are Food Preparation & Serving (100.0%), Personal Care & Service (100.0%), and Healthcare Support (95.0%).
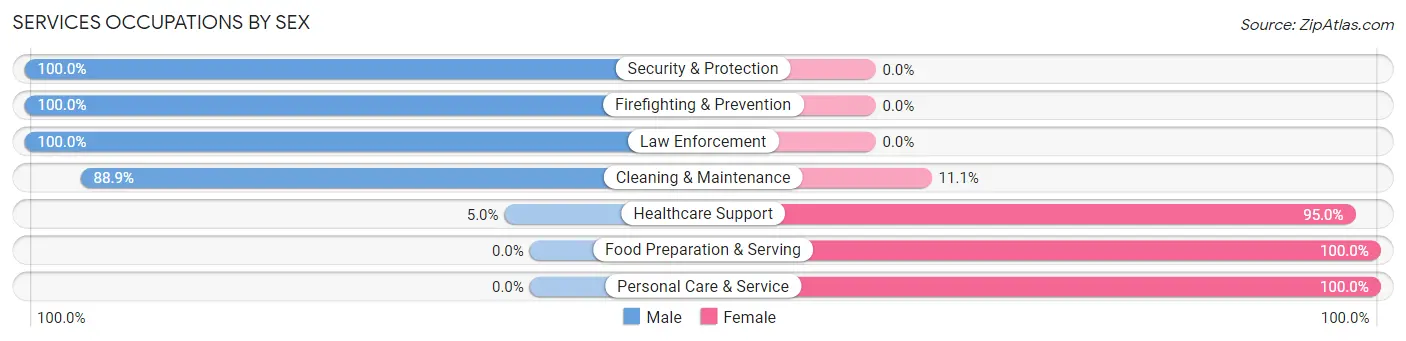
| Occupation | Male | Female |
| Healthcare Support | 1 (5.0%) | 19 (95.0%) |
| Security & Protection | 7 (100.0%) | 0 (0.0%) |
| Firefighting & Prevention | 3 (100.0%) | 0 (0.0%) |
| Law Enforcement | 4 (100.0%) | 0 (0.0%) |
| Food Preparation & Serving | 0 (0.0%) | 4 (100.0%) |
| Cleaning & Maintenance | 24 (88.9%) | 3 (11.1%) |
| Personal Care & Service | 0 (0.0%) | 2 (100.0%) |
| Total (Category) | 32 (53.3%) | 28 (46.7%) |
| Total (Overall) | 127 (52.5%) | 115 (47.5%) |
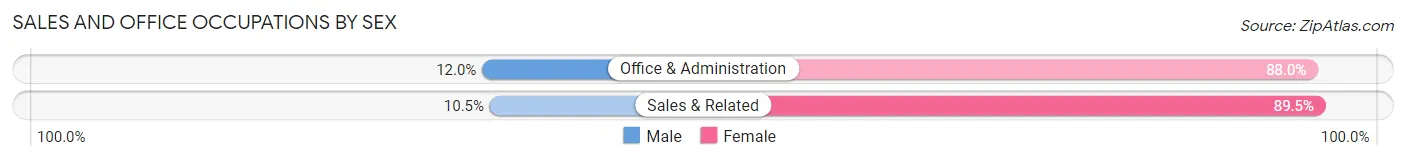
Sales and Office Occupations
The most common Sales and Office occupations in Warrens are Office & Administration (25 | 10.3%), and Sales & Related (19 | 7.9%).
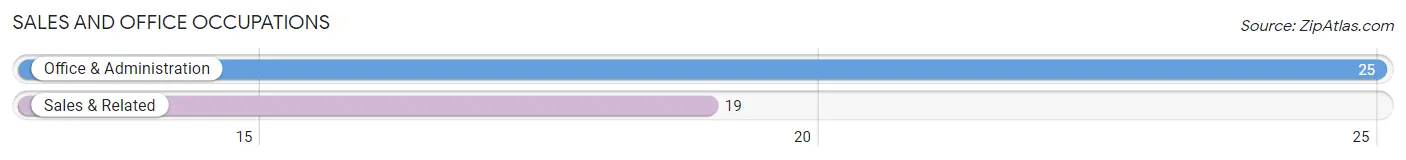
Sales and Office Occupations by Sex
| Occupation | Male | Female |
| Sales & Related | 2 (10.5%) | 17 (89.5%) |
| Office & Administration | 3 (12.0%) | 22 (88.0%) |
| Total (Category) | 5 (11.4%) | 39 (88.6%) |
| Total (Overall) | 127 (52.5%) | 115 (47.5%) |
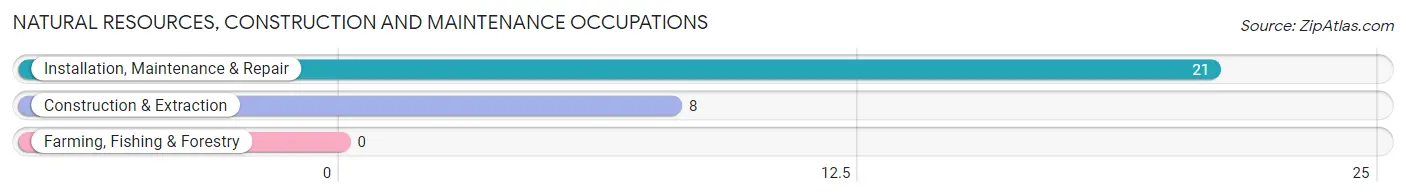
Natural Resources, Construction and Maintenance Occupations
The most common Natural Resources, Construction and Maintenance occupations in Warrens are Installation, Maintenance & Repair (21 | 8.7%), and Construction & Extraction (8 | 3.3%).
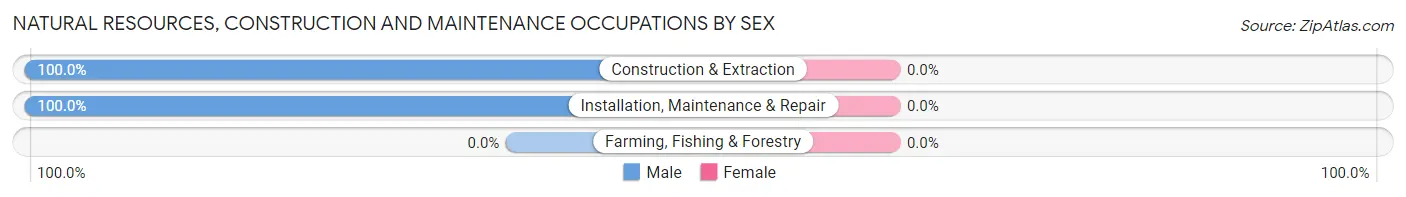
Natural Resources, Construction and Maintenance Occupations by Sex
| Occupation | Male | Female |
| Farming, Fishing & Forestry | 0 (0.0%) | 0 (0.0%) |
| Construction & Extraction | 8 (100.0%) | 0 (0.0%) |
| Installation, Maintenance & Repair | 21 (100.0%) | 0 (0.0%) |
| Total (Category) | 29 (100.0%) | 0 (0.0%) |
| Total (Overall) | 127 (52.5%) | 115 (47.5%) |
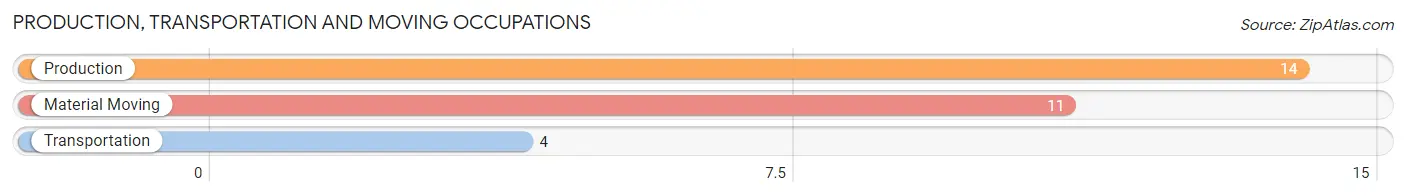
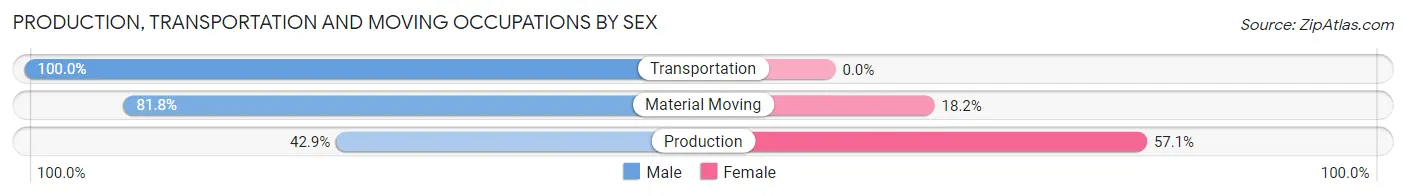
Production, Transportation and Moving Occupations
The most common Production, Transportation and Moving occupations in Warrens are Production (14 | 5.8%), Material Moving (11 | 4.5%), and Transportation (4 | 1.7%).
Production, Transportation and Moving Occupations by Sex
| Occupation | Male | Female |
| Production | 6 (42.9%) | 8 (57.1%) |
| Transportation | 4 (100.0%) | 0 (0.0%) |
| Material Moving | 9 (81.8%) | 2 (18.2%) |
| Total (Category) | 19 (65.5%) | 10 (34.5%) |
| Total (Overall) | 127 (52.5%) | 115 (47.5%) |
Employment Industries by Sex in Warrens
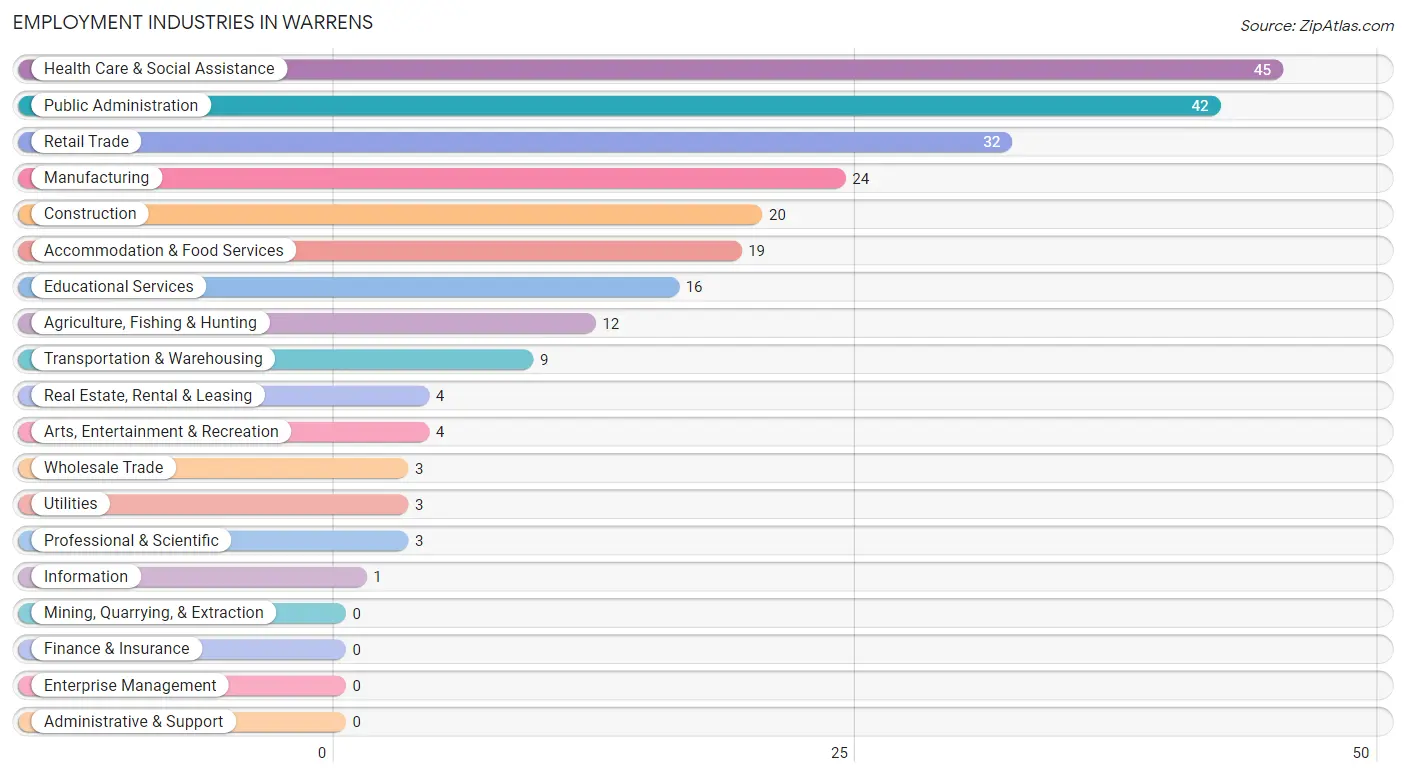
Employment Industries in Warrens
The major employment industries in Warrens include Health Care & Social Assistance (45 | 18.6%), Public Administration (42 | 17.4%), Retail Trade (32 | 13.2%), Manufacturing (24 | 9.9%), and Construction (20 | 8.3%).
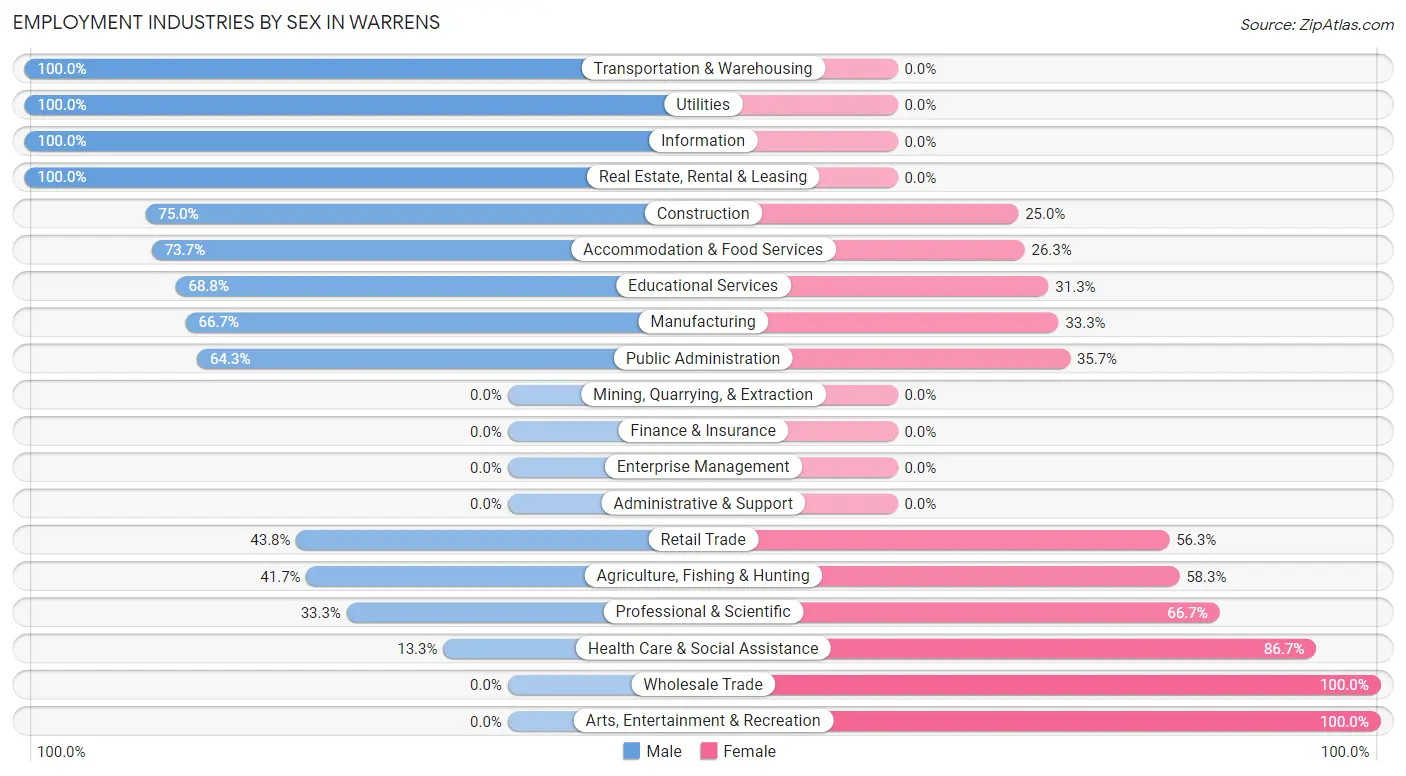
Employment Industries by Sex in Warrens
The Warrens industries that see more men than women are Transportation & Warehousing (100.0%), Utilities (100.0%), and Information (100.0%), whereas the industries that tend to have a higher number of women are Wholesale Trade (100.0%), Arts, Entertainment & Recreation (100.0%), and Health Care & Social Assistance (86.7%).
| Industry | Male | Female |
| Agriculture, Fishing & Hunting | 5 (41.7%) | 7 (58.3%) |
| Mining, Quarrying, & Extraction | 0 (0.0%) | 0 (0.0%) |
| Construction | 15 (75.0%) | 5 (25.0%) |
| Manufacturing | 16 (66.7%) | 8 (33.3%) |
| Wholesale Trade | 0 (0.0%) | 3 (100.0%) |
| Retail Trade | 14 (43.8%) | 18 (56.2%) |
| Transportation & Warehousing | 9 (100.0%) | 0 (0.0%) |
| Utilities | 3 (100.0%) | 0 (0.0%) |
| Information | 1 (100.0%) | 0 (0.0%) |
| Finance & Insurance | 0 (0.0%) | 0 (0.0%) |
| Real Estate, Rental & Leasing | 4 (100.0%) | 0 (0.0%) |
| Professional & Scientific | 1 (33.3%) | 2 (66.7%) |
| Enterprise Management | 0 (0.0%) | 0 (0.0%) |
| Administrative & Support | 0 (0.0%) | 0 (0.0%) |
| Educational Services | 11 (68.8%) | 5 (31.2%) |
| Health Care & Social Assistance | 6 (13.3%) | 39 (86.7%) |
| Arts, Entertainment & Recreation | 0 (0.0%) | 4 (100.0%) |
| Accommodation & Food Services | 14 (73.7%) | 5 (26.3%) |
| Public Administration | 27 (64.3%) | 15 (35.7%) |
| Total | 127 (52.5%) | 115 (47.5%) |
Education in Warrens
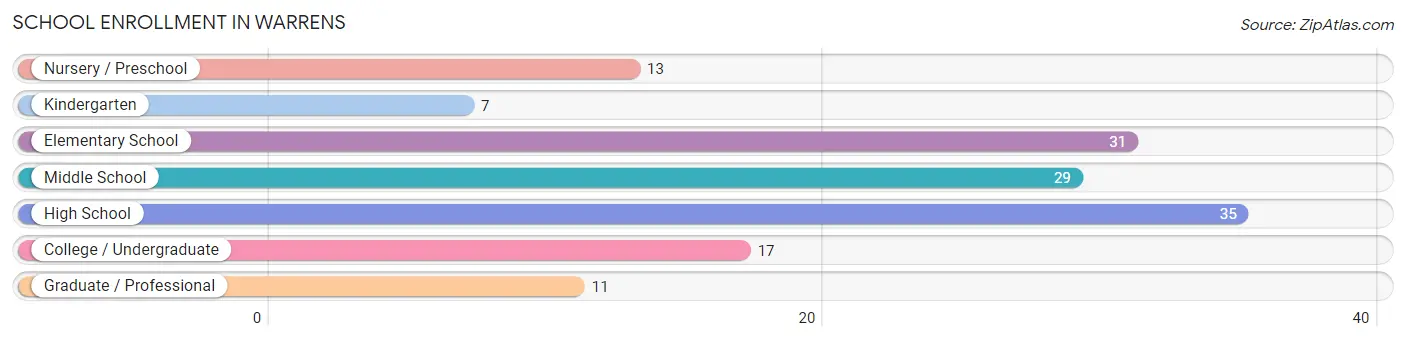
School Enrollment in Warrens
The most common levels of schooling among the 143 students in Warrens are high school (35 | 24.5%), elementary school (31 | 21.7%), and middle school (29 | 20.3%).
| School Level | # Students | % Students |
| Nursery / Preschool | 13 | 9.1% |
| Kindergarten | 7 | 4.9% |
| Elementary School | 31 | 21.7% |
| Middle School | 29 | 20.3% |
| High School | 35 | 24.5% |
| College / Undergraduate | 17 | 11.9% |
| Graduate / Professional | 11 | 7.7% |
| Total | 143 | 100.0% |
School Enrollment by Age by Funding Source in Warrens
Out of a total of 143 students who are enrolled in schools in Warrens, 28 (19.6%) attend a private institution, while the remaining 115 (80.4%) are enrolled in public schools. The age group of 25 to 34 year olds has the highest likelihood of being enrolled in private schools, with 5 (45.5% in the age bracket) enrolled. Conversely, the age group of 18 to 19 year olds has the lowest likelihood of being enrolled in a private school, with 3 (100.0% in the age bracket) attending a public institution.
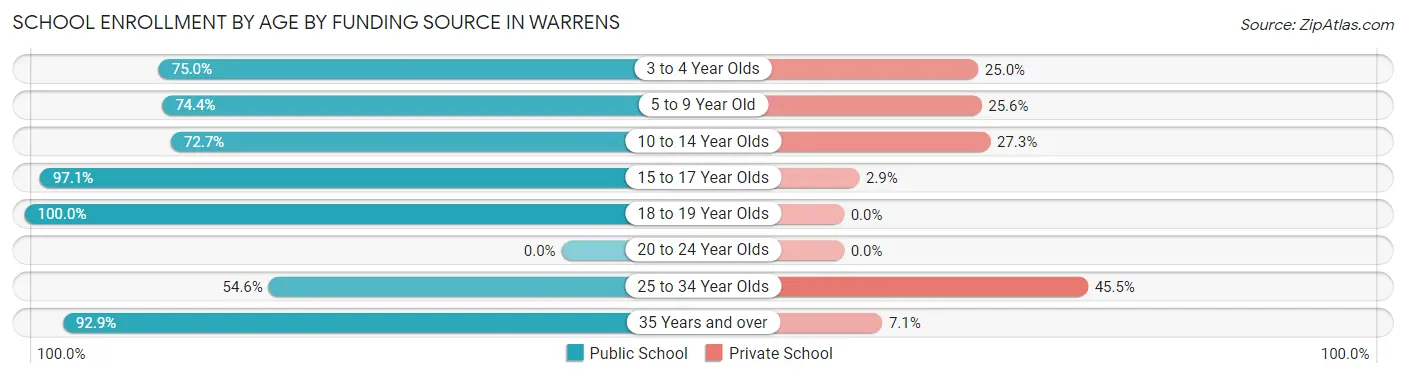
| Age Bracket | Public School | Private School |
| 3 to 4 Year Olds | 6 (75.0%) | 2 (25.0%) |
| 5 to 9 Year Old | 29 (74.4%) | 10 (25.6%) |
| 10 to 14 Year Olds | 24 (72.7%) | 9 (27.3%) |
| 15 to 17 Year Olds | 34 (97.1%) | 1 (2.9%) |
| 18 to 19 Year Olds | 3 (100.0%) | 0 (0.0%) |
| 20 to 24 Year Olds | 0 (0.0%) | 0 (0.0%) |
| 25 to 34 Year Olds | 6 (54.5%) | 5 (45.5%) |
| 35 Years and over | 13 (92.9%) | 1 (7.1%) |
| Total | 115 (80.4%) | 28 (19.6%) |
Educational Attainment by Field of Study in Warrens
Education (18 | 21.4%), science & technology (13 | 15.5%), social sciences (10 | 11.9%), business (10 | 11.9%), and bio, nature & agricultural (9 | 10.7%) are the most common fields of study among 84 individuals in Warrens who have obtained a bachelor's degree or higher.
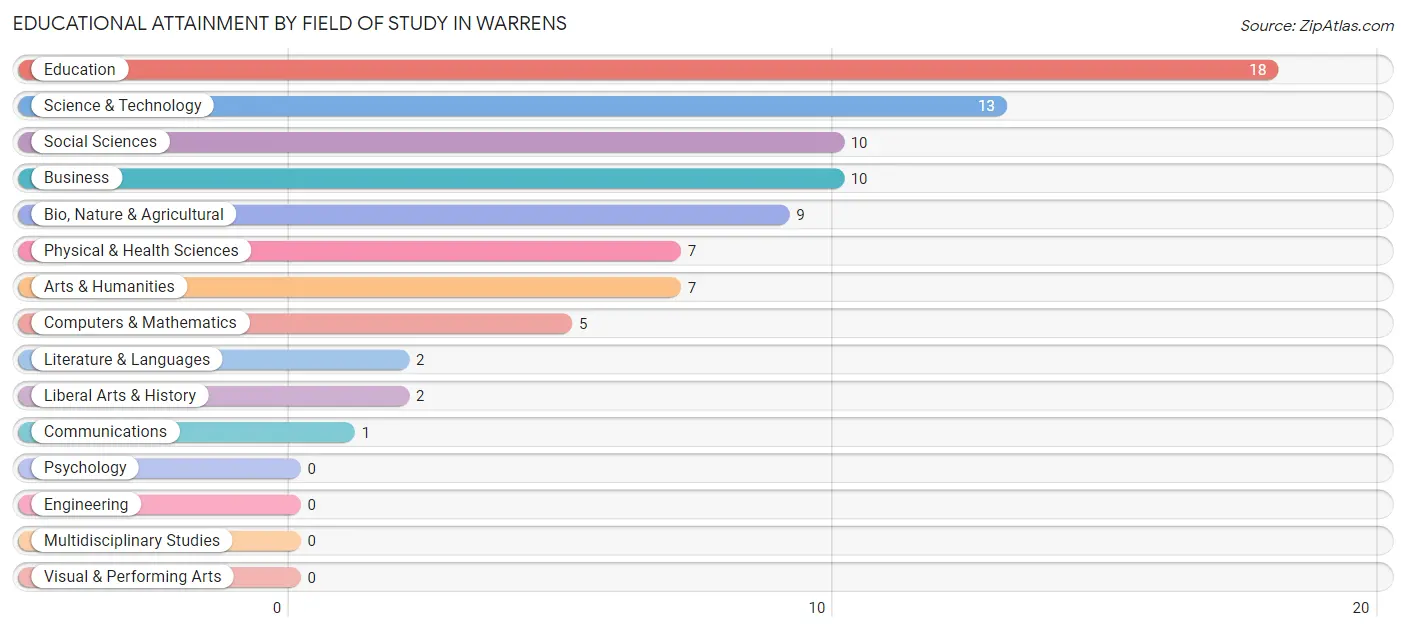
| Field of Study | # Graduates | % Graduates |
| Computers & Mathematics | 5 | 5.9% |
| Bio, Nature & Agricultural | 9 | 10.7% |
| Physical & Health Sciences | 7 | 8.3% |
| Psychology | 0 | 0.0% |
| Social Sciences | 10 | 11.9% |
| Engineering | 0 | 0.0% |
| Multidisciplinary Studies | 0 | 0.0% |
| Science & Technology | 13 | 15.5% |
| Business | 10 | 11.9% |
| Education | 18 | 21.4% |
| Literature & Languages | 2 | 2.4% |
| Liberal Arts & History | 2 | 2.4% |
| Visual & Performing Arts | 0 | 0.0% |
| Communications | 1 | 1.2% |
| Arts & Humanities | 7 | 8.3% |
| Total | 84 | 100.0% |
Transportation & Commute in Warrens
Vehicle Availability by Sex in Warrens
The most prevalent vehicle ownership categories in Warrens are males with 2 vehicles (93, accounting for 71.5%) and females with 2 vehicles (74, making up 83.8%).
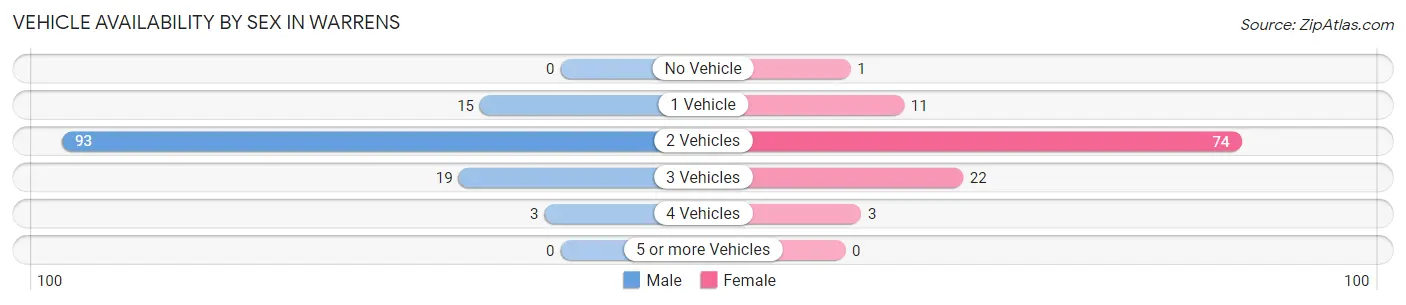
| Vehicles Available | Male | Female |
| No Vehicle | 0 (0.0%) | 1 (0.9%) |
| 1 Vehicle | 15 (11.5%) | 11 (9.9%) |
| 2 Vehicles | 93 (71.5%) | 74 (66.7%) |
| 3 Vehicles | 19 (14.6%) | 22 (19.8%) |
| 4 Vehicles | 3 (2.3%) | 3 (2.7%) |
| 5 or more Vehicles | 0 (0.0%) | 0 (0.0%) |
| Total | 130 (100.0%) | 111 (100.0%) |
Commute Time in Warrens
The most frequently occuring commute durations in Warrens are 15 to 19 minutes (65 commuters, 28.6%), 10 to 14 minutes (34 commuters, 15.0%), and 20 to 24 minutes (32 commuters, 14.1%).
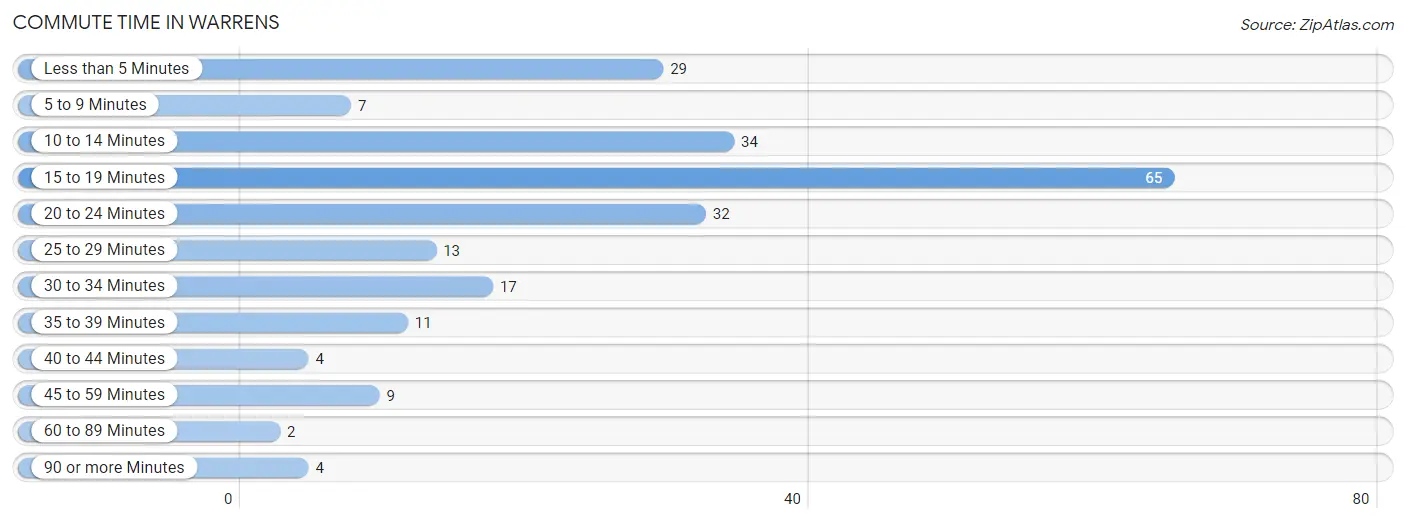
| Commute Time | # Commuters | % Commuters |
| Less than 5 Minutes | 29 | 12.8% |
| 5 to 9 Minutes | 7 | 3.1% |
| 10 to 14 Minutes | 34 | 15.0% |
| 15 to 19 Minutes | 65 | 28.6% |
| 20 to 24 Minutes | 32 | 14.1% |
| 25 to 29 Minutes | 13 | 5.7% |
| 30 to 34 Minutes | 17 | 7.5% |
| 35 to 39 Minutes | 11 | 4.9% |
| 40 to 44 Minutes | 4 | 1.8% |
| 45 to 59 Minutes | 9 | 4.0% |
| 60 to 89 Minutes | 2 | 0.9% |
| 90 or more Minutes | 4 | 1.8% |
Commute Time by Sex in Warrens
The most common commute times in Warrens are 10 to 14 minutes (30 commuters, 24.0%) for males and 15 to 19 minutes (39 commuters, 38.2%) for females.
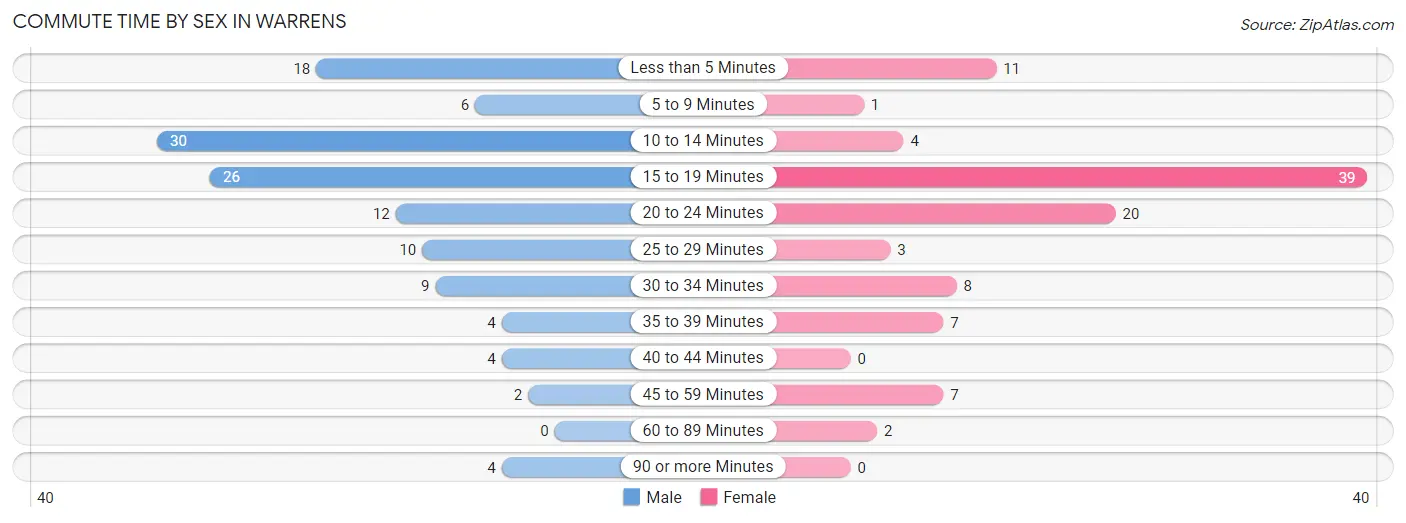
| Commute Time | Male | Female |
| Less than 5 Minutes | 18 (14.4%) | 11 (10.8%) |
| 5 to 9 Minutes | 6 (4.8%) | 1 (1.0%) |
| 10 to 14 Minutes | 30 (24.0%) | 4 (3.9%) |
| 15 to 19 Minutes | 26 (20.8%) | 39 (38.2%) |
| 20 to 24 Minutes | 12 (9.6%) | 20 (19.6%) |
| 25 to 29 Minutes | 10 (8.0%) | 3 (2.9%) |
| 30 to 34 Minutes | 9 (7.2%) | 8 (7.8%) |
| 35 to 39 Minutes | 4 (3.2%) | 7 (6.9%) |
| 40 to 44 Minutes | 4 (3.2%) | 0 (0.0%) |
| 45 to 59 Minutes | 2 (1.6%) | 7 (6.9%) |
| 60 to 89 Minutes | 0 (0.0%) | 2 (2.0%) |
| 90 or more Minutes | 4 (3.2%) | 0 (0.0%) |
Time of Departure to Work by Sex in Warrens
The most frequent times of departure to work in Warrens are 6:30 AM to 6:59 AM (26, 20.8%) for males and 7:00 AM to 7:29 AM (28, 27.5%) for females.
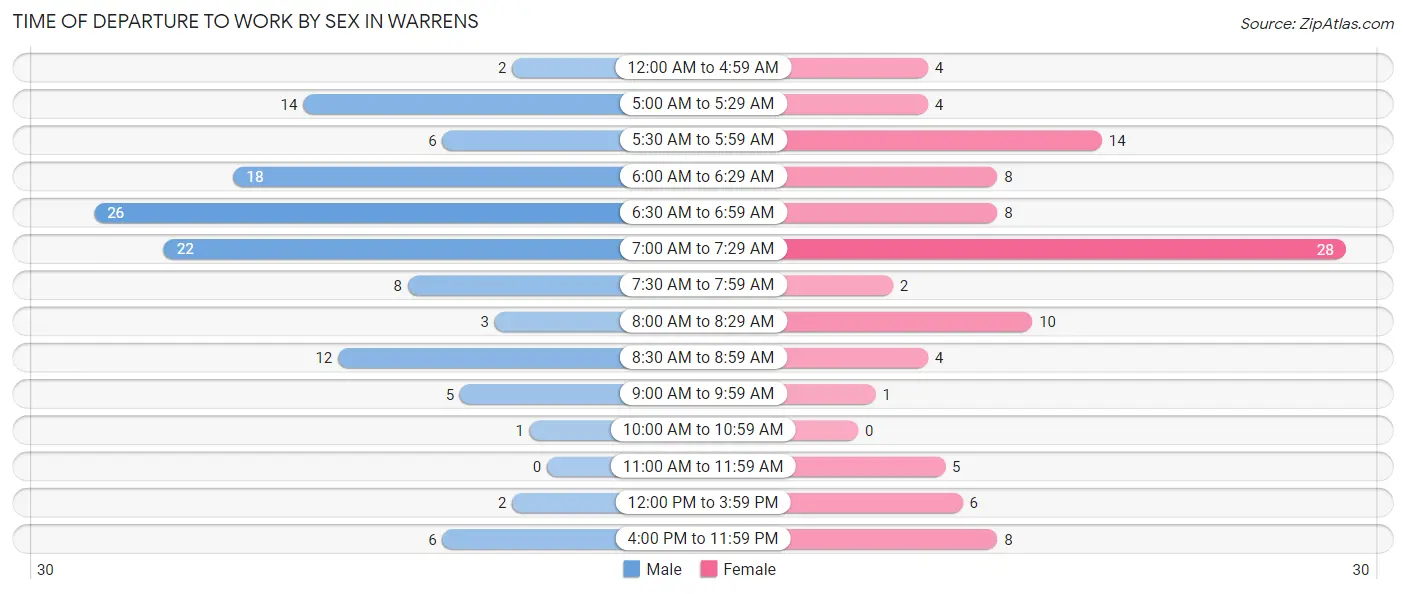
| Time of Departure | Male | Female |
| 12:00 AM to 4:59 AM | 2 (1.6%) | 4 (3.9%) |
| 5:00 AM to 5:29 AM | 14 (11.2%) | 4 (3.9%) |
| 5:30 AM to 5:59 AM | 6 (4.8%) | 14 (13.7%) |
| 6:00 AM to 6:29 AM | 18 (14.4%) | 8 (7.8%) |
| 6:30 AM to 6:59 AM | 26 (20.8%) | 8 (7.8%) |
| 7:00 AM to 7:29 AM | 22 (17.6%) | 28 (27.5%) |
| 7:30 AM to 7:59 AM | 8 (6.4%) | 2 (2.0%) |
| 8:00 AM to 8:29 AM | 3 (2.4%) | 10 (9.8%) |
| 8:30 AM to 8:59 AM | 12 (9.6%) | 4 (3.9%) |
| 9:00 AM to 9:59 AM | 5 (4.0%) | 1 (1.0%) |
| 10:00 AM to 10:59 AM | 1 (0.8%) | 0 (0.0%) |
| 11:00 AM to 11:59 AM | 0 (0.0%) | 5 (4.9%) |
| 12:00 PM to 3:59 PM | 2 (1.6%) | 6 (5.9%) |
| 4:00 PM to 11:59 PM | 6 (4.8%) | 8 (7.8%) |
| Total | 125 (100.0%) | 102 (100.0%) |
Housing Occupancy in Warrens
Occupancy by Ownership in Warrens
Of the total 204 dwellings in Warrens, owner-occupied units account for 110 (53.9%), while renter-occupied units make up 94 (46.1%).
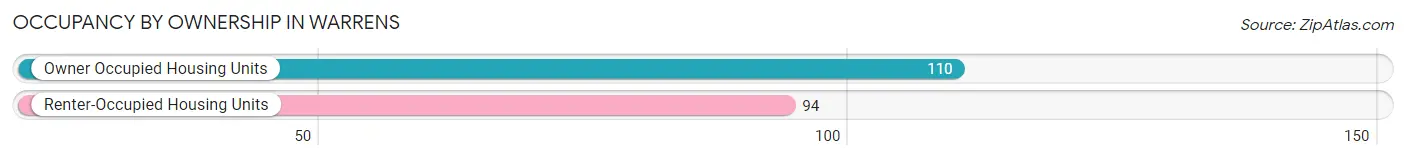
| Occupancy | # Housing Units | % Housing Units |
| Owner Occupied Housing Units | 110 | 53.9% |
| Renter-Occupied Housing Units | 94 | 46.1% |
| Total Occupied Housing Units | 204 | 100.0% |
Occupancy by Household Size in Warrens
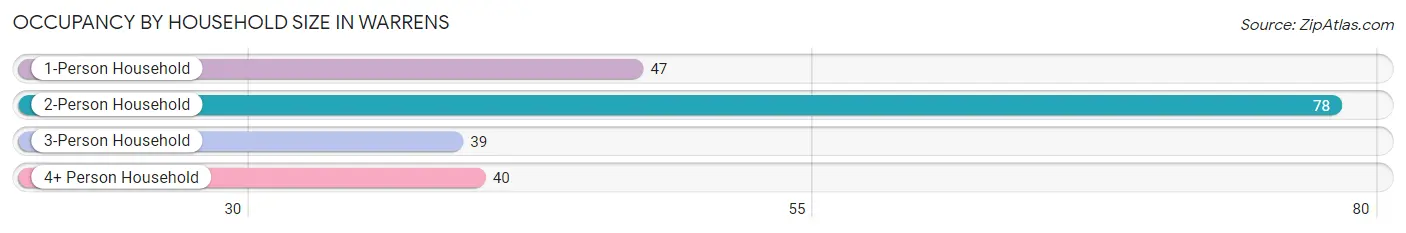
| Household Size | # Housing Units | % Housing Units |
| 1-Person Household | 47 | 23.0% |
| 2-Person Household | 78 | 38.2% |
| 3-Person Household | 39 | 19.1% |
| 4+ Person Household | 40 | 19.6% |
| Total Housing Units | 204 | 100.0% |
Occupancy by Ownership by Household Size in Warrens
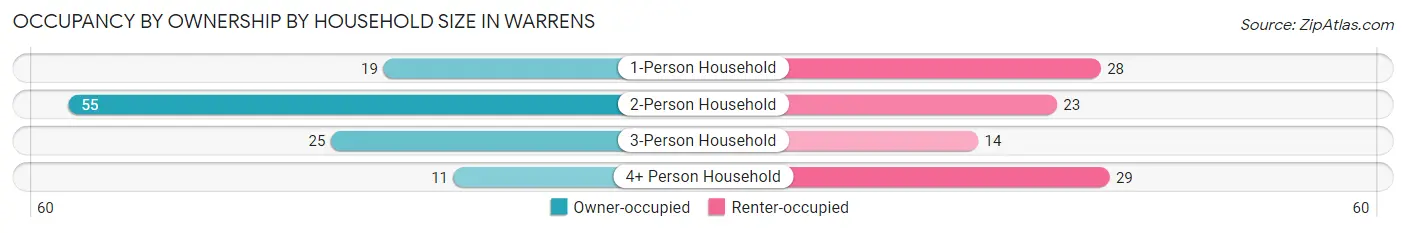
| Household Size | Owner-occupied | Renter-occupied |
| 1-Person Household | 19 (40.4%) | 28 (59.6%) |
| 2-Person Household | 55 (70.5%) | 23 (29.5%) |
| 3-Person Household | 25 (64.1%) | 14 (35.9%) |
| 4+ Person Household | 11 (27.5%) | 29 (72.5%) |
| Total Housing Units | 110 (53.9%) | 94 (46.1%) |
Occupancy by Educational Attainment in Warrens
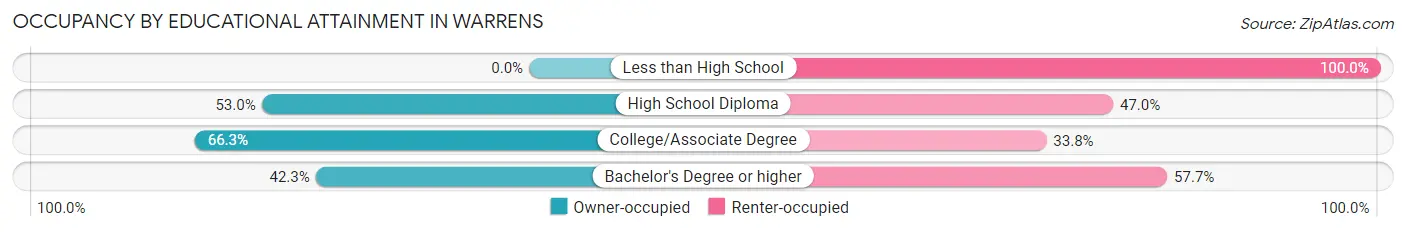
| Household Size | Owner-occupied | Renter-occupied |
| Less than High School | 0 (0.0%) | 6 (100.0%) |
| High School Diploma | 35 (53.0%) | 31 (47.0%) |
| College/Associate Degree | 53 (66.2%) | 27 (33.8%) |
| Bachelor's Degree or higher | 22 (42.3%) | 30 (57.7%) |
Occupancy by Age of Householder in Warrens
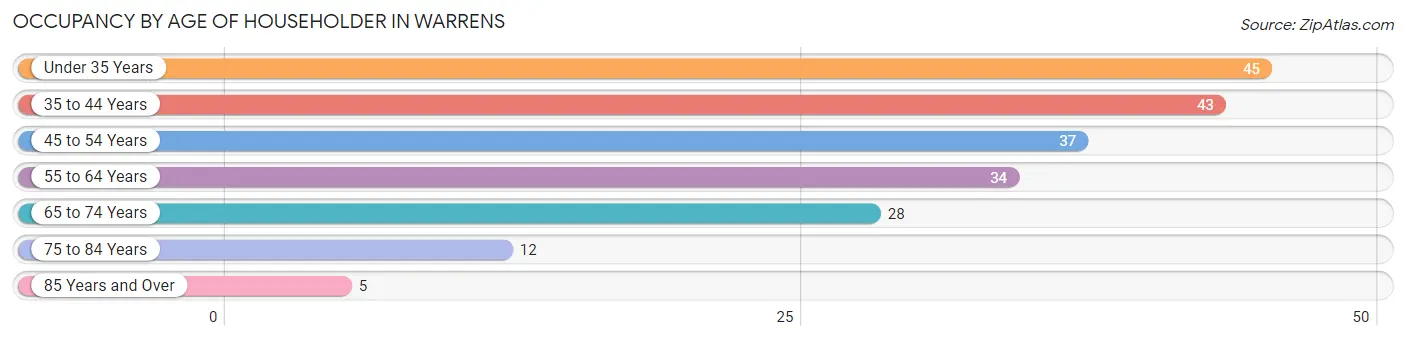
| Age Bracket | # Households | % Households |
| Under 35 Years | 45 | 22.1% |
| 35 to 44 Years | 43 | 21.1% |
| 45 to 54 Years | 37 | 18.1% |
| 55 to 64 Years | 34 | 16.7% |
| 65 to 74 Years | 28 | 13.7% |
| 75 to 84 Years | 12 | 5.9% |
| 85 Years and Over | 5 | 2.5% |
| Total | 204 | 100.0% |
Housing Finances in Warrens
Median Income by Occupancy in Warrens
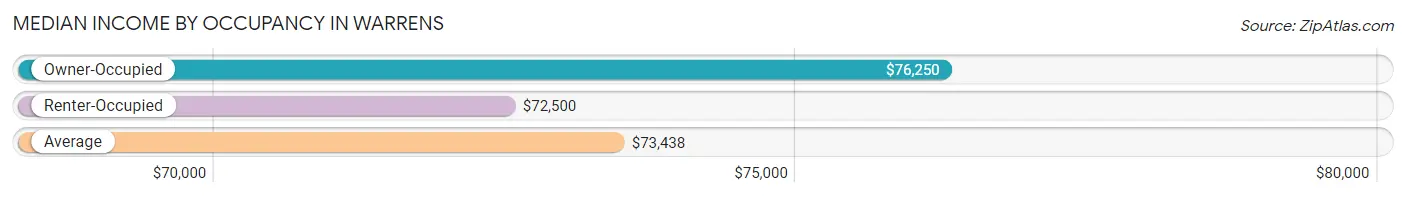
| Occupancy Type | # Households | Median Income |
| Owner-Occupied | 110 (53.9%) | $76,250 |
| Renter-Occupied | 94 (46.1%) | $72,500 |
| Average | 204 (100.0%) | $73,438 |
Occupancy by Householder Income Bracket in Warrens
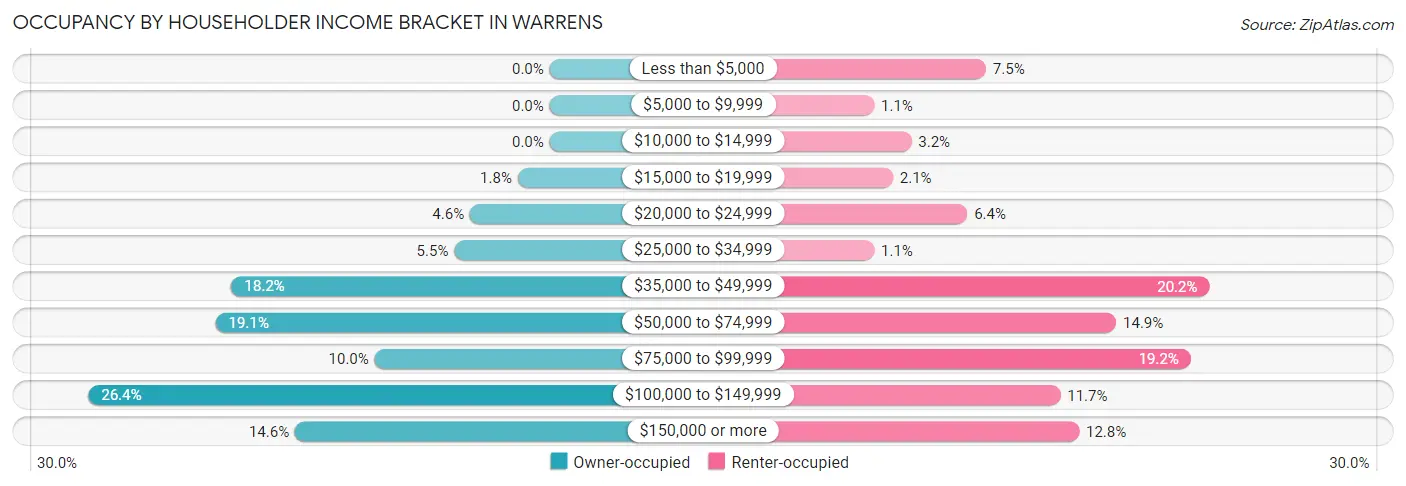
| Income Bracket | Owner-occupied | Renter-occupied |
| Less than $5,000 | 0 (0.0%) | 7 (7.4%) |
| $5,000 to $9,999 | 0 (0.0%) | 1 (1.1%) |
| $10,000 to $14,999 | 0 (0.0%) | 3 (3.2%) |
| $15,000 to $19,999 | 2 (1.8%) | 2 (2.1%) |
| $20,000 to $24,999 | 5 (4.5%) | 6 (6.4%) |
| $25,000 to $34,999 | 6 (5.4%) | 1 (1.1%) |
| $35,000 to $49,999 | 20 (18.2%) | 19 (20.2%) |
| $50,000 to $74,999 | 21 (19.1%) | 14 (14.9%) |
| $75,000 to $99,999 | 11 (10.0%) | 18 (19.2%) |
| $100,000 to $149,999 | 29 (26.4%) | 11 (11.7%) |
| $150,000 or more | 16 (14.5%) | 12 (12.8%) |
| Total | 110 (100.0%) | 94 (100.0%) |
Monthly Housing Cost Tiers in Warrens
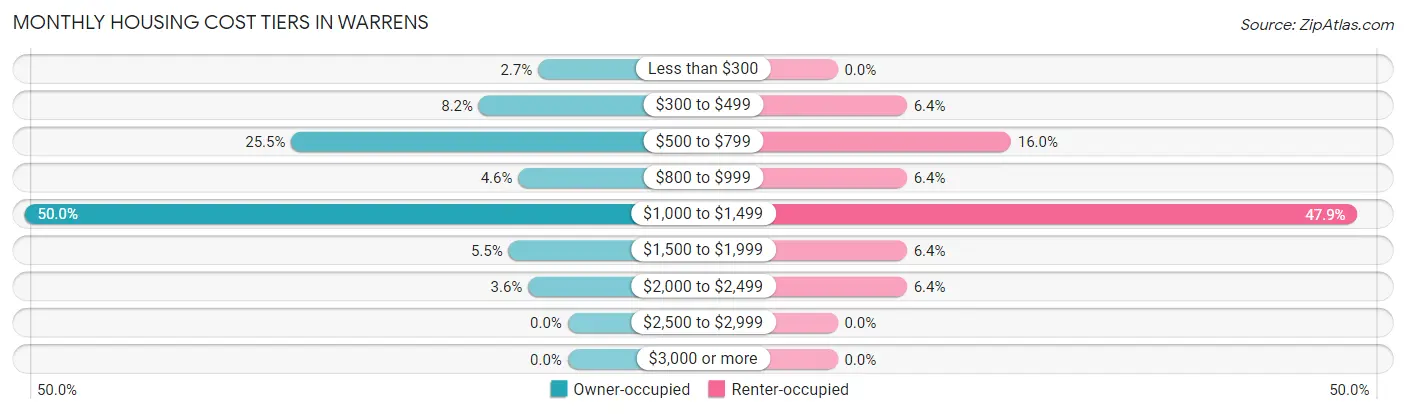
| Monthly Cost | Owner-occupied | Renter-occupied |
| Less than $300 | 3 (2.7%) | 0 (0.0%) |
| $300 to $499 | 9 (8.2%) | 6 (6.4%) |
| $500 to $799 | 28 (25.5%) | 15 (16.0%) |
| $800 to $999 | 5 (4.5%) | 6 (6.4%) |
| $1,000 to $1,499 | 55 (50.0%) | 45 (47.9%) |
| $1,500 to $1,999 | 6 (5.4%) | 6 (6.4%) |
| $2,000 to $2,499 | 4 (3.6%) | 6 (6.4%) |
| $2,500 to $2,999 | 0 (0.0%) | 0 (0.0%) |
| $3,000 or more | 0 (0.0%) | 0 (0.0%) |
| Total | 110 (100.0%) | 94 (100.0%) |
Physical Housing Characteristics in Warrens
Housing Structures in Warrens
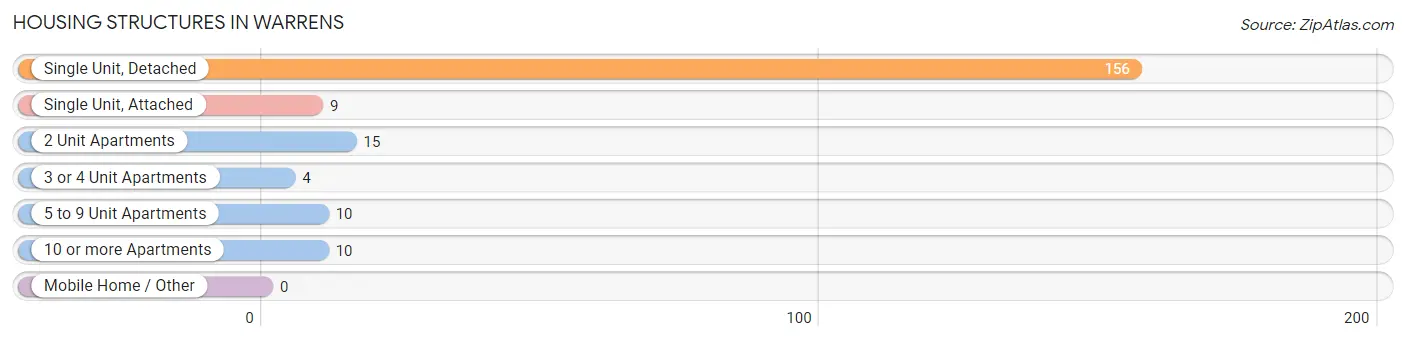
| Structure Type | # Housing Units | % Housing Units |
| Single Unit, Detached | 156 | 76.5% |
| Single Unit, Attached | 9 | 4.4% |
| 2 Unit Apartments | 15 | 7.3% |
| 3 or 4 Unit Apartments | 4 | 2.0% |
| 5 to 9 Unit Apartments | 10 | 4.9% |
| 10 or more Apartments | 10 | 4.9% |
| Mobile Home / Other | 0 | 0.0% |
| Total | 204 | 100.0% |
Housing Structures by Occupancy in Warrens
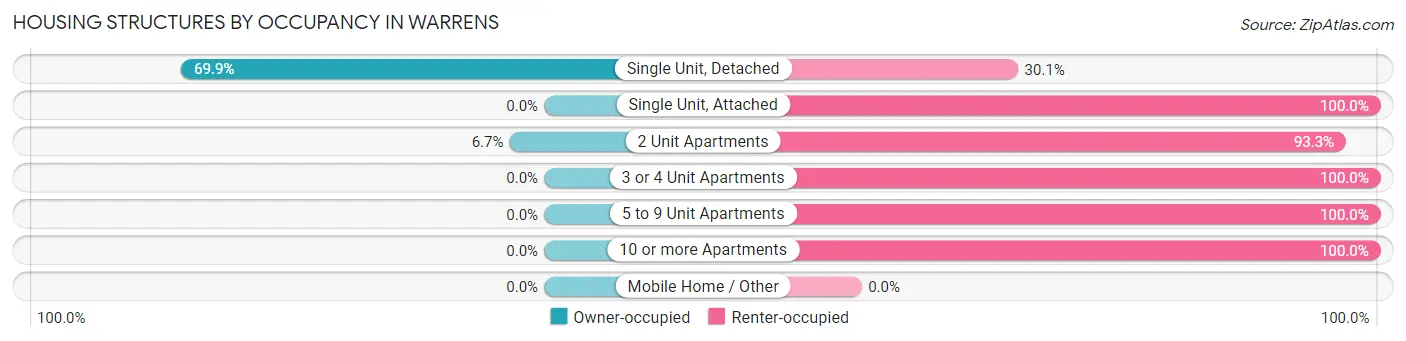
| Structure Type | Owner-occupied | Renter-occupied |
| Single Unit, Detached | 109 (69.9%) | 47 (30.1%) |
| Single Unit, Attached | 0 (0.0%) | 9 (100.0%) |
| 2 Unit Apartments | 1 (6.7%) | 14 (93.3%) |
| 3 or 4 Unit Apartments | 0 (0.0%) | 4 (100.0%) |
| 5 to 9 Unit Apartments | 0 (0.0%) | 10 (100.0%) |
| 10 or more Apartments | 0 (0.0%) | 10 (100.0%) |
| Mobile Home / Other | 0 (0.0%) | 0 (0.0%) |
| Total | 110 (53.9%) | 94 (46.1%) |
Housing Structures by Number of Rooms in Warrens
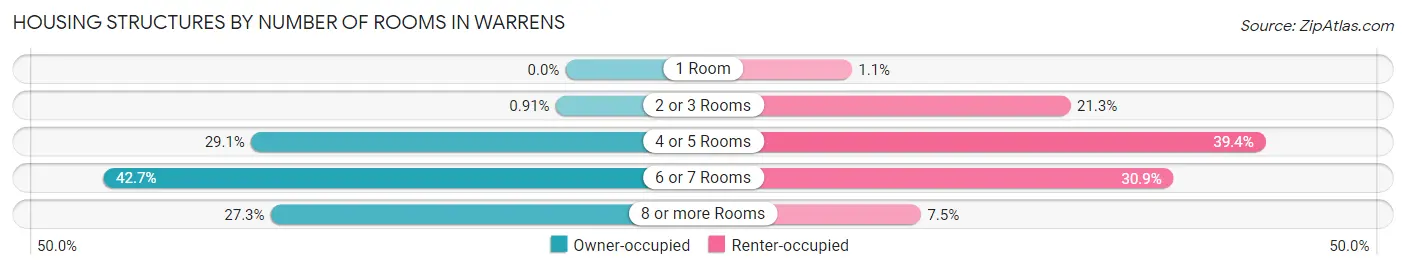
| Number of Rooms | Owner-occupied | Renter-occupied |
| 1 Room | 0 (0.0%) | 1 (1.1%) |
| 2 or 3 Rooms | 1 (0.9%) | 20 (21.3%) |
| 4 or 5 Rooms | 32 (29.1%) | 37 (39.4%) |
| 6 or 7 Rooms | 47 (42.7%) | 29 (30.8%) |
| 8 or more Rooms | 30 (27.3%) | 7 (7.4%) |
| Total | 110 (100.0%) | 94 (100.0%) |
Housing Structure by Heating Type in Warrens
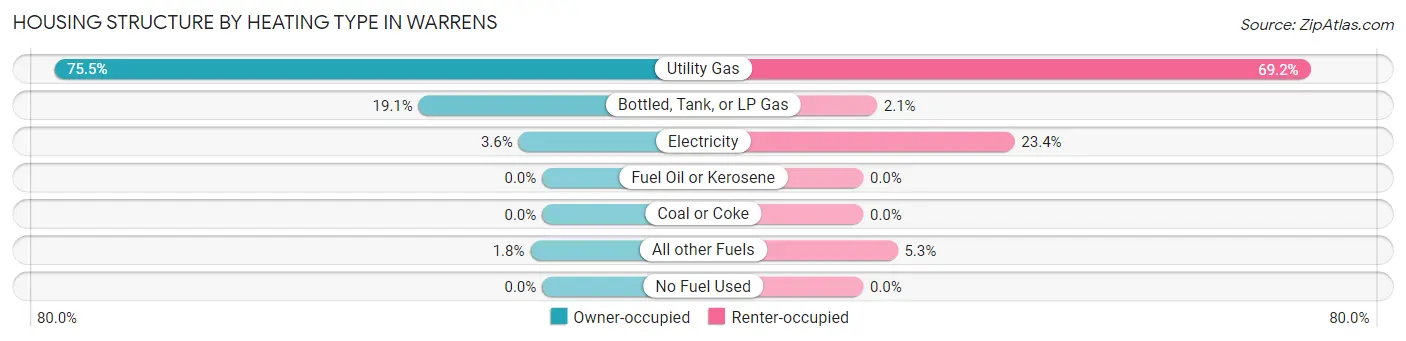
| Heating Type | Owner-occupied | Renter-occupied |
| Utility Gas | 83 (75.4%) | 65 (69.2%) |
| Bottled, Tank, or LP Gas | 21 (19.1%) | 2 (2.1%) |
| Electricity | 4 (3.6%) | 22 (23.4%) |
| Fuel Oil or Kerosene | 0 (0.0%) | 0 (0.0%) |
| Coal or Coke | 0 (0.0%) | 0 (0.0%) |
| All other Fuels | 2 (1.8%) | 5 (5.3%) |
| No Fuel Used | 0 (0.0%) | 0 (0.0%) |
| Total | 110 (100.0%) | 94 (100.0%) |
Household Vehicle Usage in Warrens
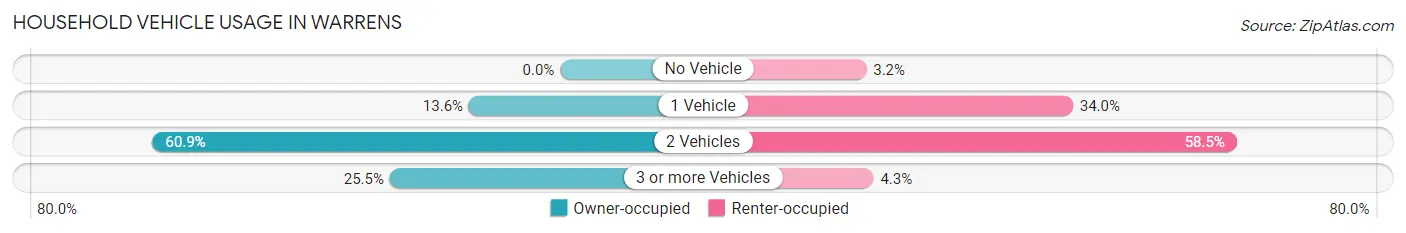
| Vehicles per Household | Owner-occupied | Renter-occupied |
| No Vehicle | 0 (0.0%) | 3 (3.2%) |
| 1 Vehicle | 15 (13.6%) | 32 (34.0%) |
| 2 Vehicles | 67 (60.9%) | 55 (58.5%) |
| 3 or more Vehicles | 28 (25.5%) | 4 (4.3%) |
| Total | 110 (100.0%) | 94 (100.0%) |
Real Estate & Mortgages in Warrens
Real Estate and Mortgage Overview in Warrens
| Characteristic | Without Mortgage | With Mortgage |
| Housing Units | 47 | 63 |
| Median Property Value | $155,300 | $137,500 |
| Median Household Income | $44,271 | $12 |
| Monthly Housing Costs | $627 | $0 |
| Real Estate Taxes | $3,750 | $0 |
Property Value by Mortgage Status in Warrens
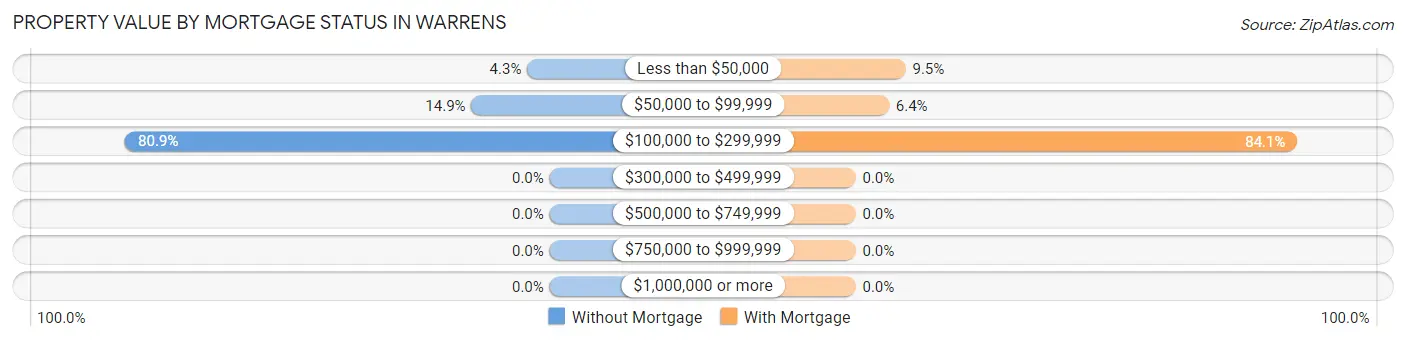
| Property Value | Without Mortgage | With Mortgage |
| Less than $50,000 | 2 (4.3%) | 6 (9.5%) |
| $50,000 to $99,999 | 7 (14.9%) | 4 (6.4%) |
| $100,000 to $299,999 | 38 (80.8%) | 53 (84.1%) |
| $300,000 to $499,999 | 0 (0.0%) | 0 (0.0%) |
| $500,000 to $749,999 | 0 (0.0%) | 0 (0.0%) |
| $750,000 to $999,999 | 0 (0.0%) | 0 (0.0%) |
| $1,000,000 or more | 0 (0.0%) | 0 (0.0%) |
| Total | 47 (100.0%) | 63 (100.0%) |
Household Income by Mortgage Status in Warrens
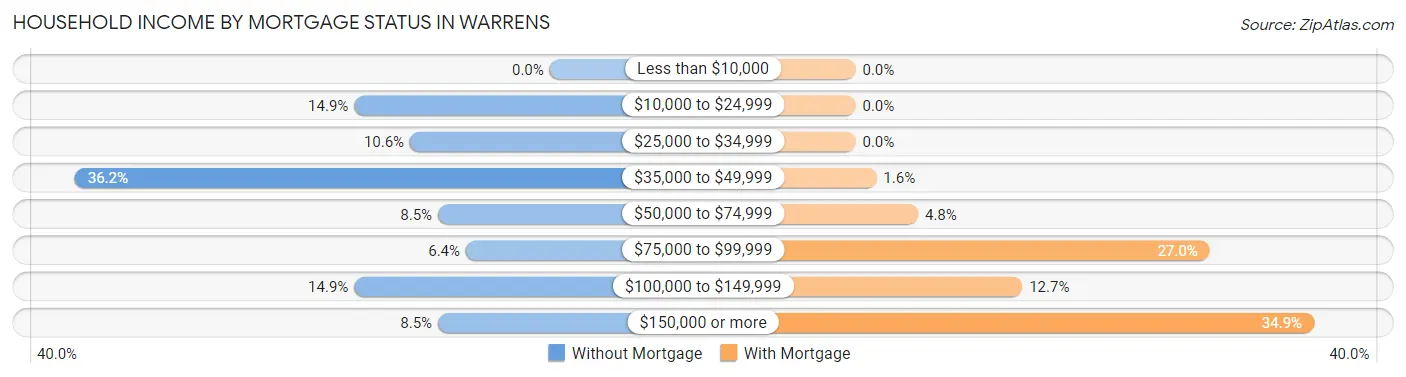
| Household Income | Without Mortgage | With Mortgage |
| Less than $10,000 | 0 (0.0%) | 0 (0.0%) |
| $10,000 to $24,999 | 7 (14.9%) | 0 (0.0%) |
| $25,000 to $34,999 | 5 (10.6%) | 0 (0.0%) |
| $35,000 to $49,999 | 17 (36.2%) | 1 (1.6%) |
| $50,000 to $74,999 | 4 (8.5%) | 3 (4.8%) |
| $75,000 to $99,999 | 3 (6.4%) | 17 (27.0%) |
| $100,000 to $149,999 | 7 (14.9%) | 8 (12.7%) |
| $150,000 or more | 4 (8.5%) | 22 (34.9%) |
| Total | 47 (100.0%) | 63 (100.0%) |
Property Value to Household Income Ratio in Warrens
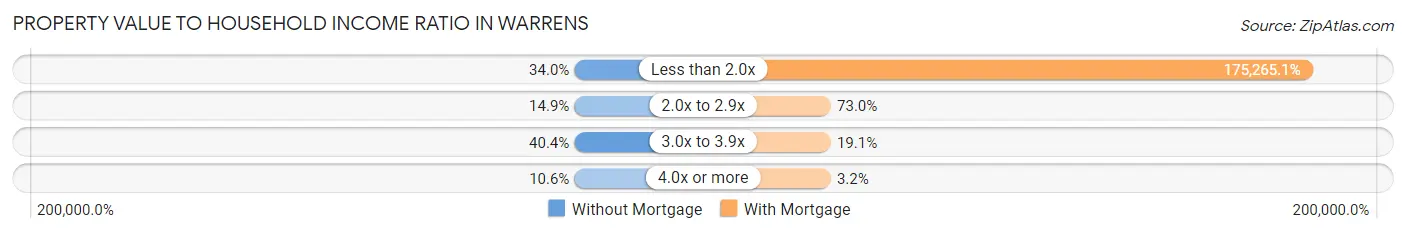
| Value-to-Income Ratio | Without Mortgage | With Mortgage |
| Less than 2.0x | 16 (34.0%) | 110,417 (175,265.1%) |
| 2.0x to 2.9x | 7 (14.9%) | 46 (73.0%) |
| 3.0x to 3.9x | 19 (40.4%) | 12 (19.1%) |
| 4.0x or more | 5 (10.6%) | 2 (3.2%) |
| Total | 47 (100.0%) | 63 (100.0%) |
Real Estate Taxes by Mortgage Status in Warrens
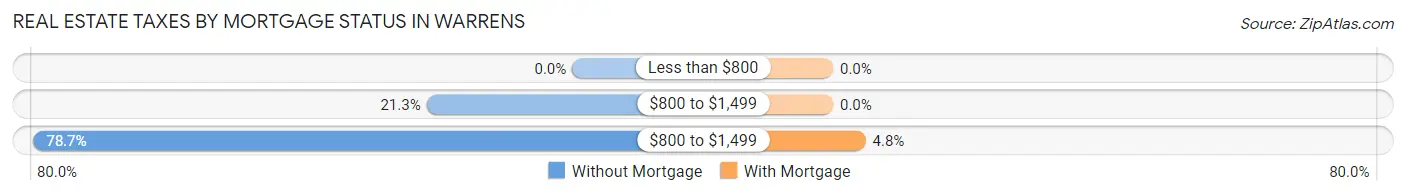
| Property Taxes | Without Mortgage | With Mortgage |
| Less than $800 | 0 (0.0%) | 0 (0.0%) |
| $800 to $1,499 | 10 (21.3%) | 0 (0.0%) |
| $800 to $1,499 | 37 (78.7%) | 3 (4.8%) |
| Total | 47 (100.0%) | 63 (100.0%) |
Health & Disability in Warrens
Health Insurance Coverage by Age in Warrens
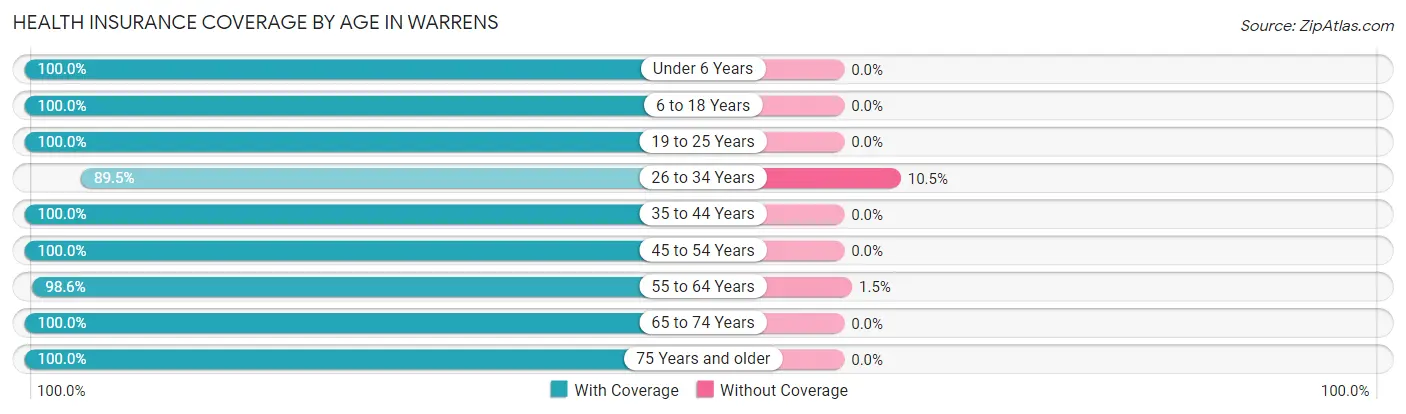
| Age Bracket | With Coverage | Without Coverage |
| Under 6 Years | 44 (100.0%) | 0 (0.0%) |
| 6 to 18 Years | 102 (100.0%) | 0 (0.0%) |
| 19 to 25 Years | 19 (100.0%) | 0 (0.0%) |
| 26 to 34 Years | 51 (89.5%) | 6 (10.5%) |
| 35 to 44 Years | 78 (100.0%) | 0 (0.0%) |
| 45 to 54 Years | 64 (100.0%) | 0 (0.0%) |
| 55 to 64 Years | 68 (98.6%) | 1 (1.5%) |
| 65 to 74 Years | 36 (100.0%) | 0 (0.0%) |
| 75 Years and older | 29 (100.0%) | 0 (0.0%) |
| Total | 491 (98.6%) | 7 (1.4%) |
Health Insurance Coverage by Citizenship Status in Warrens
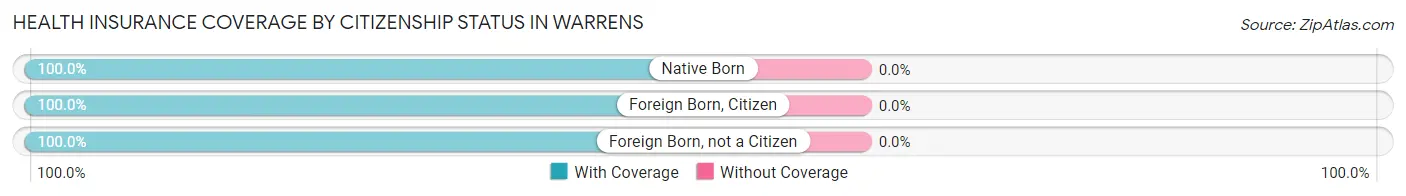
| Citizenship Status | With Coverage | Without Coverage |
| Native Born | 44 (100.0%) | 0 (0.0%) |
| Foreign Born, Citizen | 102 (100.0%) | 0 (0.0%) |
| Foreign Born, not a Citizen | 19 (100.0%) | 0 (0.0%) |
Health Insurance Coverage by Household Income in Warrens
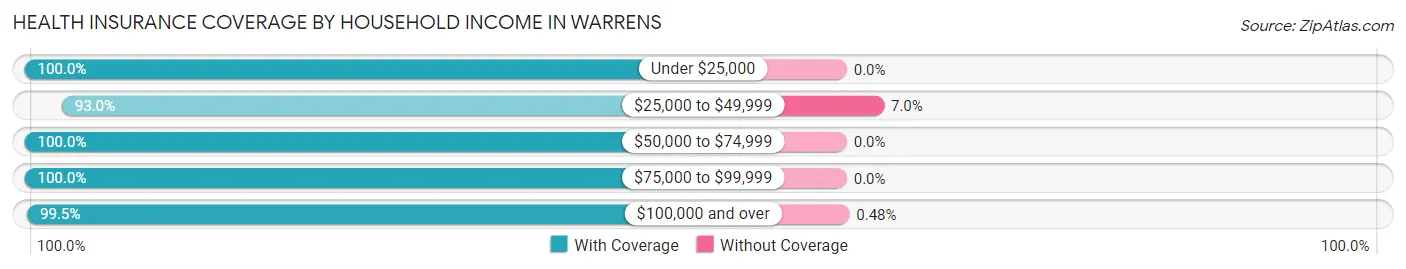
| Household Income | With Coverage | Without Coverage |
| Under $25,000 | 51 (100.0%) | 0 (0.0%) |
| $25,000 to $49,999 | 80 (93.0%) | 6 (7.0%) |
| $50,000 to $74,999 | 82 (100.0%) | 0 (0.0%) |
| $75,000 to $99,999 | 67 (100.0%) | 0 (0.0%) |
| $100,000 and over | 208 (99.5%) | 1 (0.5%) |
Public vs Private Health Insurance Coverage by Age in Warrens
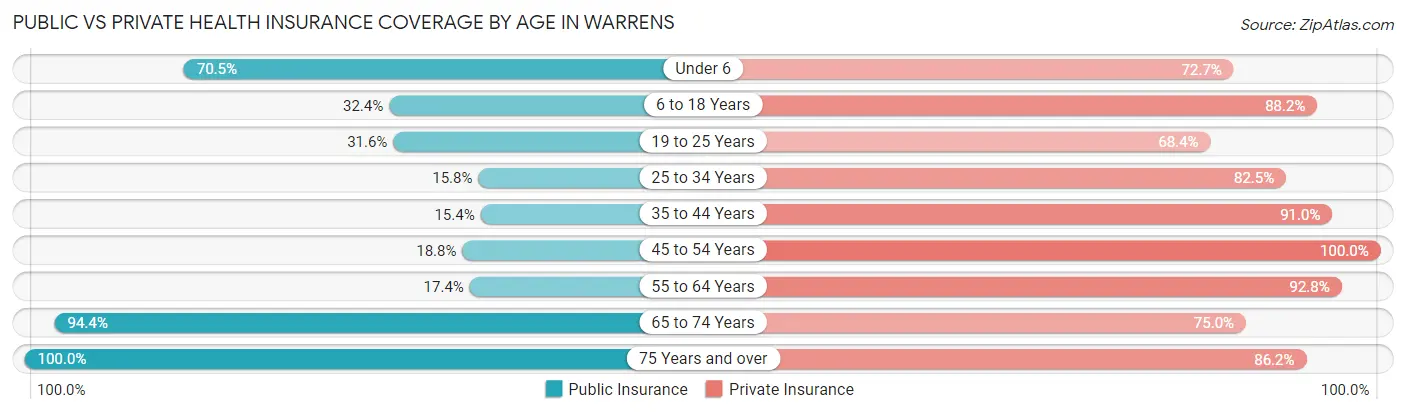
| Age Bracket | Public Insurance | Private Insurance |
| Under 6 | 31 (70.5%) | 32 (72.7%) |
| 6 to 18 Years | 33 (32.4%) | 90 (88.2%) |
| 19 to 25 Years | 6 (31.6%) | 13 (68.4%) |
| 25 to 34 Years | 9 (15.8%) | 47 (82.5%) |
| 35 to 44 Years | 12 (15.4%) | 71 (91.0%) |
| 45 to 54 Years | 12 (18.8%) | 64 (100.0%) |
| 55 to 64 Years | 12 (17.4%) | 64 (92.7%) |
| 65 to 74 Years | 34 (94.4%) | 27 (75.0%) |
| 75 Years and over | 29 (100.0%) | 25 (86.2%) |
| Total | 178 (35.7%) | 433 (87.0%) |
Disability Status by Sex by Age in Warrens
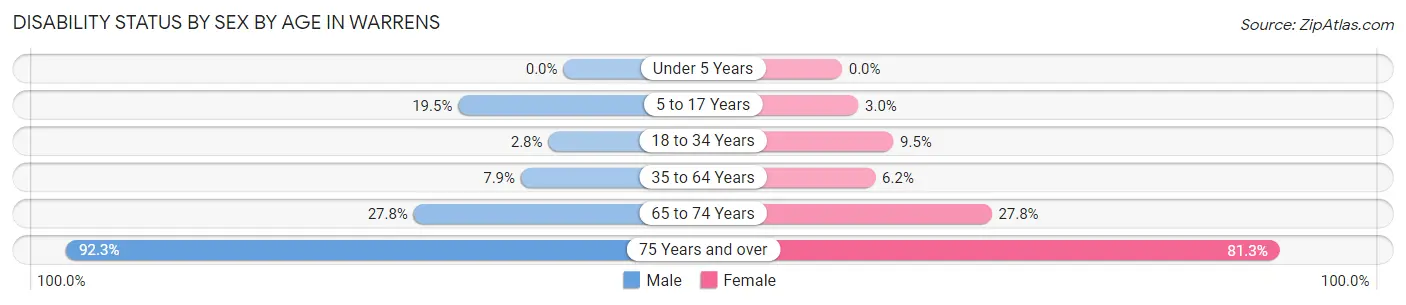
| Age Bracket | Male | Female |
| Under 5 Years | 0 (0.0%) | 0 (0.0%) |
| 5 to 17 Years | 8 (19.5%) | 2 (3.0%) |
| 18 to 34 Years | 1 (2.8%) | 4 (9.5%) |
| 35 to 64 Years | 9 (7.9%) | 6 (6.2%) |
| 65 to 74 Years | 5 (27.8%) | 5 (27.8%) |
| 75 Years and over | 12 (92.3%) | 13 (81.2%) |
Disability Class by Sex by Age in Warrens
Disability Class: Hearing Difficulty
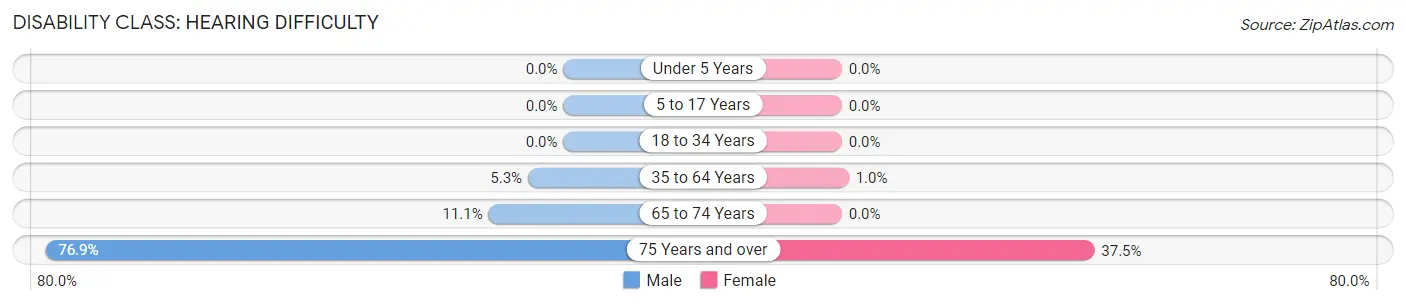
| Age Bracket | Male | Female |
| Under 5 Years | 0 (0.0%) | 0 (0.0%) |
| 5 to 17 Years | 0 (0.0%) | 0 (0.0%) |
| 18 to 34 Years | 0 (0.0%) | 0 (0.0%) |
| 35 to 64 Years | 6 (5.3%) | 1 (1.0%) |
| 65 to 74 Years | 2 (11.1%) | 0 (0.0%) |
| 75 Years and over | 10 (76.9%) | 6 (37.5%) |
Disability Class: Vision Difficulty
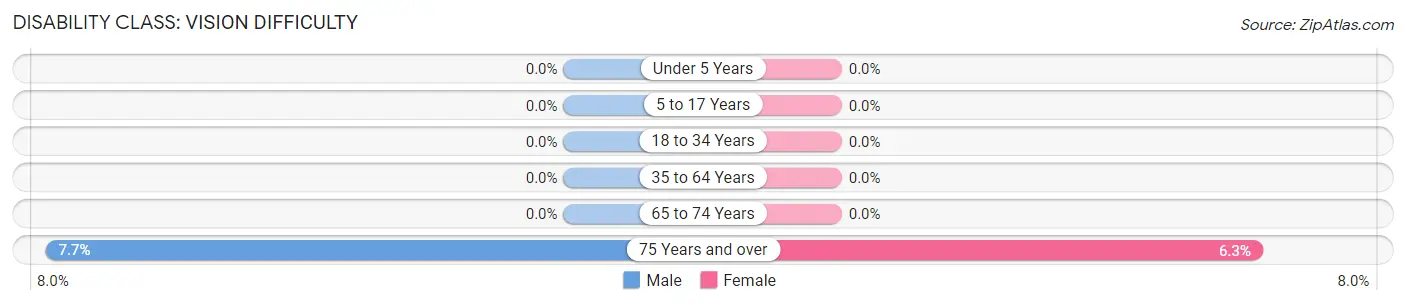
| Age Bracket | Male | Female |
| Under 5 Years | 0 (0.0%) | 0 (0.0%) |
| 5 to 17 Years | 0 (0.0%) | 0 (0.0%) |
| 18 to 34 Years | 0 (0.0%) | 0 (0.0%) |
| 35 to 64 Years | 0 (0.0%) | 0 (0.0%) |
| 65 to 74 Years | 0 (0.0%) | 0 (0.0%) |
| 75 Years and over | 1 (7.7%) | 1 (6.2%) |
Disability Class: Cognitive Difficulty
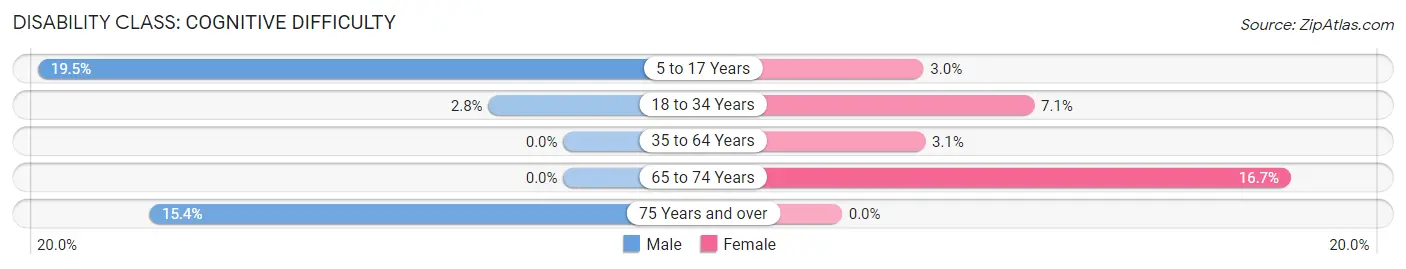
| Age Bracket | Male | Female |
| 5 to 17 Years | 8 (19.5%) | 2 (3.0%) |
| 18 to 34 Years | 1 (2.8%) | 3 (7.1%) |
| 35 to 64 Years | 0 (0.0%) | 3 (3.1%) |
| 65 to 74 Years | 0 (0.0%) | 3 (16.7%) |
| 75 Years and over | 2 (15.4%) | 0 (0.0%) |
Disability Class: Ambulatory Difficulty
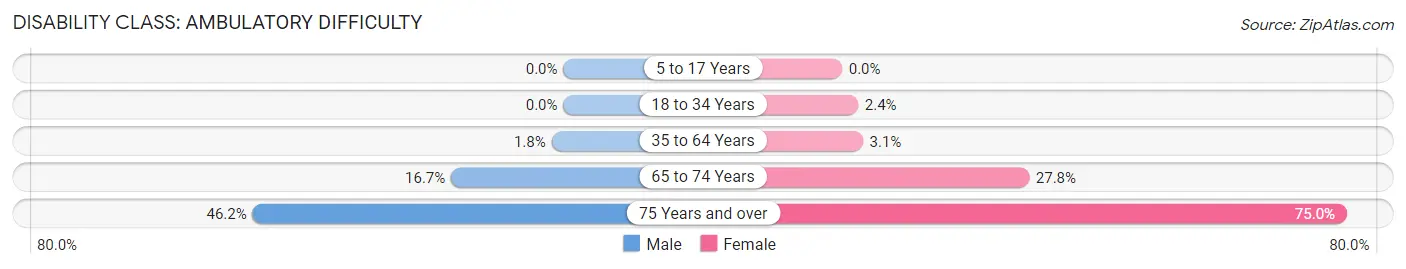
| Age Bracket | Male | Female |
| 5 to 17 Years | 0 (0.0%) | 0 (0.0%) |
| 18 to 34 Years | 0 (0.0%) | 1 (2.4%) |
| 35 to 64 Years | 2 (1.8%) | 3 (3.1%) |
| 65 to 74 Years | 3 (16.7%) | 5 (27.8%) |
| 75 Years and over | 6 (46.2%) | 12 (75.0%) |
Disability Class: Self-Care Difficulty
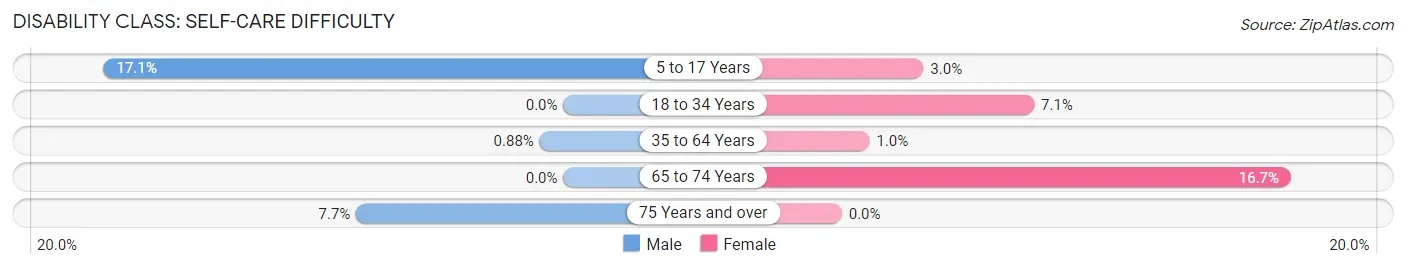
| Age Bracket | Male | Female |
| 5 to 17 Years | 7 (17.1%) | 2 (3.0%) |
| 18 to 34 Years | 0 (0.0%) | 3 (7.1%) |
| 35 to 64 Years | 1 (0.9%) | 1 (1.0%) |
| 65 to 74 Years | 0 (0.0%) | 3 (16.7%) |
| 75 Years and over | 1 (7.7%) | 0 (0.0%) |
Technology Access in Warrens
Computing Device Access in Warrens
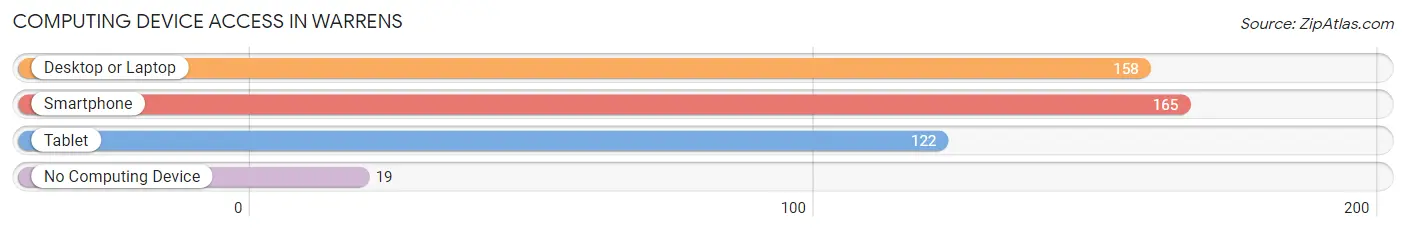
| Device Type | # Households | % Households |
| Desktop or Laptop | 158 | 77.4% |
| Smartphone | 165 | 80.9% |
| Tablet | 122 | 59.8% |
| No Computing Device | 19 | 9.3% |
| Total | 204 | 100.0% |
Internet Access in Warrens
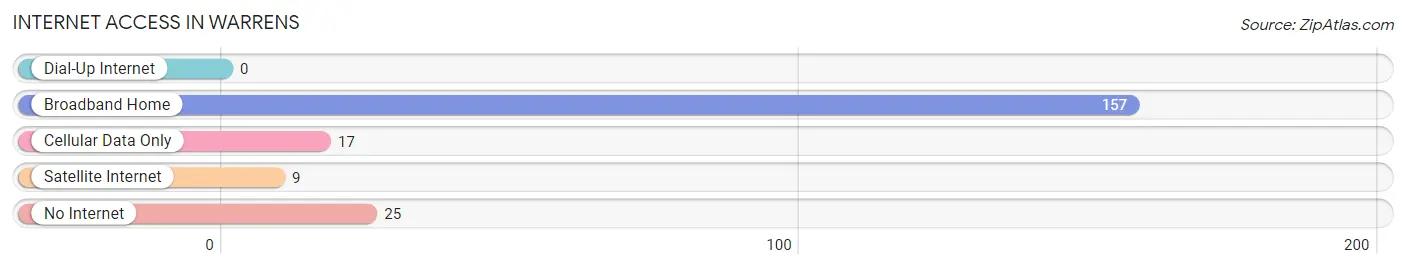
| Internet Type | # Households | % Households |
| Dial-Up Internet | 0 | 0.0% |
| Broadband Home | 157 | 77.0% |
| Cellular Data Only | 17 | 8.3% |
| Satellite Internet | 9 | 4.4% |
| No Internet | 25 | 12.2% |
| Total | 204 | 100.0% |
Warrens Summary
Warrens is a small unincorporated community located in Monroe County, Wisconsin, United States. It is situated in the town of Warrens, which is located in the southwestern corner of the county. The population of Warrens was estimated to be around 500 in 2020.
History
The area that is now Warrens was first settled in the early 1800s by a group of German immigrants. The town was originally known as “New Berlin” and was later renamed “Warrens” after a local settler, Warren Smith. The town was officially incorporated in 1876.
In the late 1800s, Warrens was a thriving agricultural community. The town was home to several dairy farms, as well as a number of other businesses, including a sawmill, a grist mill, and a blacksmith shop.
In the early 1900s, the town began to decline as the railroad bypassed it and the local economy shifted away from agriculture. The population of Warrens decreased steadily over the next several decades, and by the 1970s, the town was nearly abandoned.
In the late 1970s, the town began to experience a resurgence as a tourist destination. The town is now home to several popular attractions, including the Warrens Cranberry Festival, which is held every September.
Geography
Warrens is located in the southwestern corner of Monroe County, Wisconsin. It is situated in the town of Warrens, which is bordered by the towns of La Grange, Tomah, and Wilton. The town is located approximately 25 miles south of the city of Tomah and 40 miles west of the city of La Crosse.
The terrain of Warrens is mostly flat, with some rolling hills in the surrounding area. The town is located in the Central Plain region of Wisconsin, which is characterized by flat, fertile farmland. The town is located in the Driftless Area, which is an area of Wisconsin that was not affected by the last glacial period.
Economy
The economy of Warrens is largely based on tourism and agriculture. The town is home to several popular tourist attractions, including the Warrens Cranberry Festival, which is held every September. The festival attracts thousands of visitors each year and is one of the largest cranberry festivals in the United States.
The town is also home to several dairy farms, as well as a number of other businesses, including a sawmill, a grist mill, and a blacksmith shop. The town is also home to a number of small retail stores and restaurants.
Demographics
The population of Warrens was estimated to be around 500 in 2020. The town is predominantly white, with approximately 95% of the population identifying as white. The median household income in Warrens is $45,000, and the median home value is $150,000. The town has a low unemployment rate of 3.5%.
Conclusion
Warrens is a small unincorporated community located in Monroe County, Wisconsin. The town has a long history, dating back to the early 1800s, and has experienced a resurgence in recent years as a popular tourist destination. The economy of Warrens is largely based on tourism and agriculture, and the town is home to several popular attractions, including the Warrens Cranberry Festival. The population of Warrens was estimated to be around 500 in 2020, and the town is predominantly white.
Common Questions
What is Per Capita Income in Warrens?
Per Capita income in Warrens is $34,199.
What is the Median Family Income in Warrens?
Median Family Income in Warrens is $73,125.
What is the Median Household income in Warrens?
Median Household Income in Warrens is $73,438.
What is Income or Wage Gap in Warrens?
Income or Wage Gap in Warrens is 22.6%.
Women in Warrens earn 77.4 cents for every dollar earned by a man.
What is Family Income Deficit in Warrens?
Family Income Deficit in Warrens is $17,330.
Families that are below poverty line in Warrens earn $17,330 less on average than the poverty threshold level.
What is Inequality or Gini Index in Warrens?
Inequality or Gini Index in Warrens is 0.38.
What is the Total Population of Warrens?
Total Population of Warrens is 504.
What is the Total Male Population of Warrens?
Total Male Population of Warrens is 248.
What is the Total Female Population of Warrens?
Total Female Population of Warrens is 256.
What is the Ratio of Males per 100 Females in Warrens?
There are 96.88 Males per 100 Females in Warrens.
What is the Ratio of Females per 100 Males in Warrens?
There are 103.23 Females per 100 Males in Warrens.
What is the Median Population Age in Warrens?
Median Population Age in Warrens is 38.5 Years.
What is the Average Family Size in Warrens
Average Family Size in Warrens is 2.8 People.
What is the Average Household Size in Warrens
Average Household Size in Warrens is 2.5 People.
How Large is the Labor Force in Warrens?
There are 249 People in the Labor Forcein in Warrens.
What is the Percentage of People in the Labor Force in Warrens?
66.4% of People are in the Labor Force in Warrens.
What is the Unemployment Rate in Warrens?
Unemployment Rate in Warrens is 0.4%.