Viola, WI Map & Demographics
Viola Map
Viola Overview
$29,321
PER CAPITA INCOME
$88,214
AVG FAMILY INCOME
$68,750
AVG HOUSEHOLD INCOME
36.7%
WAGE / INCOME GAP [ % ]
63.3¢/ $1
WAGE / INCOME GAP [ $ ]
$18,209
FAMILY INCOME DEFICIT
0.37
INEQUALITY / GINI INDEX
575
TOTAL POPULATION
313
MALE POPULATION
262
FEMALE POPULATION
119.47
MALES / 100 FEMALES
83.71
FEMALES / 100 MALES
39.6
MEDIAN AGE
3.0
AVG FAMILY SIZE
2.5
AVG HOUSEHOLD SIZE
302
LABOR FORCE [ PEOPLE ]
65.4%
PERCENT IN LABOR FORCE
3.3%
UNEMPLOYMENT RATE
Viola Zip Codes
Viola Area Codes
Income in Viola
Income Overview in Viola
Per Capita Income in Viola is $29,321, while median incomes of families and households are $88,214 and $68,750 respectively.
| Characteristic | Number | Measure |
| Per Capita Income | 575 | $29,321 |
| Median Family Income | 146 | $88,214 |
| Mean Family Income | 146 | $86,579 |
| Median Household Income | 226 | $68,750 |
| Mean Household Income | 226 | $73,240 |
| Income Deficit | 146 | $18,209 |
| Wage / Income Gap (%) | 575 | 36.68% |
| Wage / Income Gap ($) | 575 | 63.32¢ per $1 |
| Gini / Inequality Index | 575 | 0.37 |
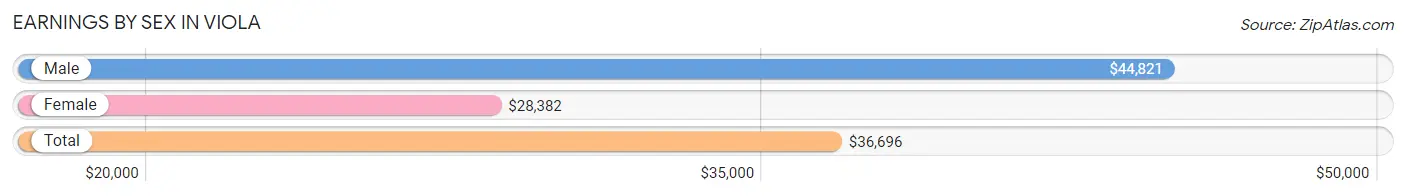
Earnings by Sex in Viola
Average Earnings in Viola are $36,696, $44,821 for men and $28,382 for women, a difference of 36.7%.
| Sex | Number | Average Earnings |
| Male | 181 (57.5%) | $44,821 |
| Female | 134 (42.5%) | $28,382 |
| Total | 315 (100.0%) | $36,696 |
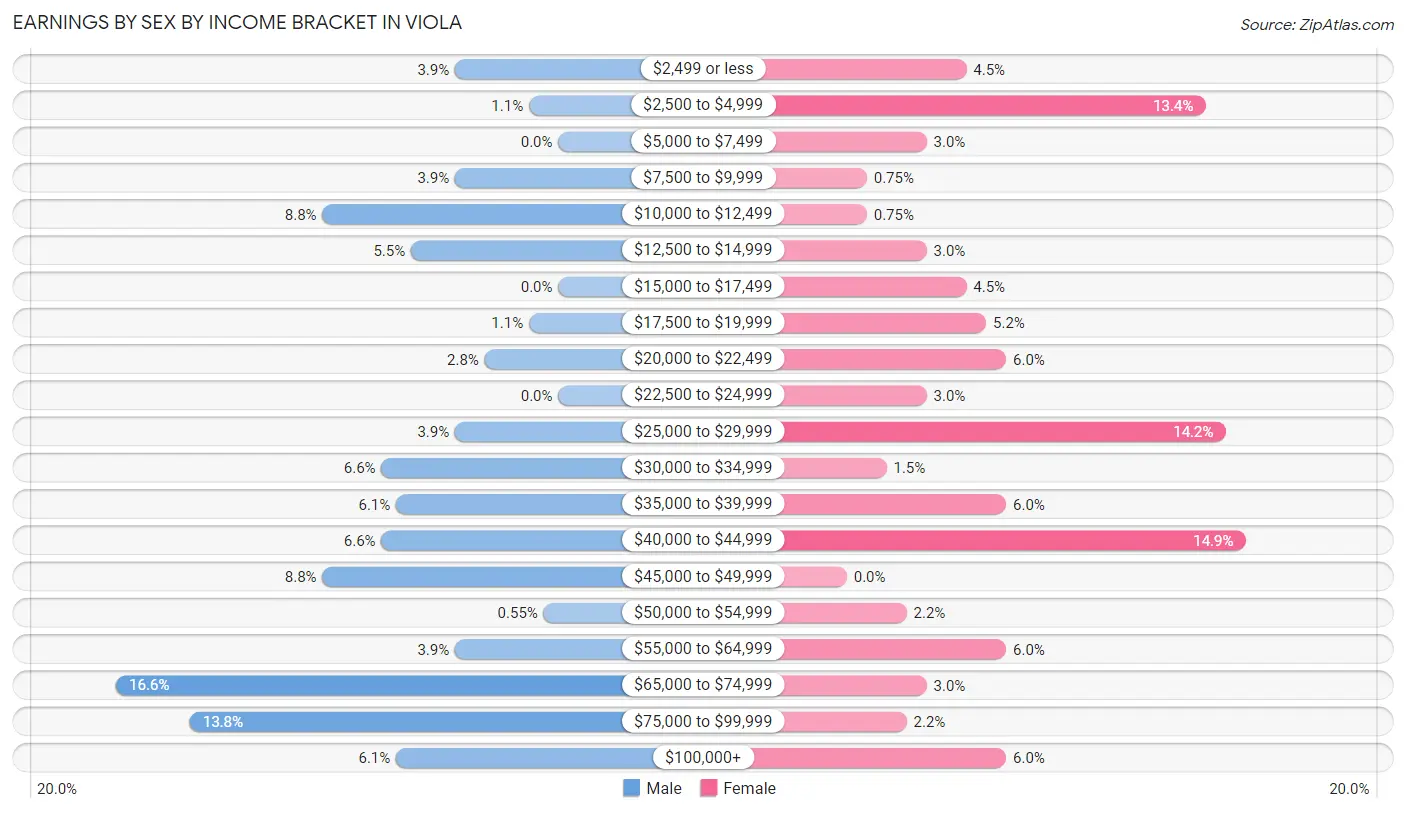
Earnings by Sex by Income Bracket in Viola
The most common earnings brackets in Viola are $65,000 to $74,999 for men (30 | 16.6%) and $40,000 to $44,999 for women (20 | 14.9%).
| Income | Male | Female |
| $2,499 or less | 7 (3.9%) | 6 (4.5%) |
| $2,500 to $4,999 | 2 (1.1%) | 18 (13.4%) |
| $5,000 to $7,499 | 0 (0.0%) | 4 (3.0%) |
| $7,500 to $9,999 | 7 (3.9%) | 1 (0.7%) |
| $10,000 to $12,499 | 16 (8.8%) | 1 (0.7%) |
| $12,500 to $14,999 | 10 (5.5%) | 4 (3.0%) |
| $15,000 to $17,499 | 0 (0.0%) | 6 (4.5%) |
| $17,500 to $19,999 | 2 (1.1%) | 7 (5.2%) |
| $20,000 to $22,499 | 5 (2.8%) | 8 (6.0%) |
| $22,500 to $24,999 | 0 (0.0%) | 4 (3.0%) |
| $25,000 to $29,999 | 7 (3.9%) | 19 (14.2%) |
| $30,000 to $34,999 | 12 (6.6%) | 2 (1.5%) |
| $35,000 to $39,999 | 11 (6.1%) | 8 (6.0%) |
| $40,000 to $44,999 | 12 (6.6%) | 20 (14.9%) |
| $45,000 to $49,999 | 16 (8.8%) | 0 (0.0%) |
| $50,000 to $54,999 | 1 (0.5%) | 3 (2.2%) |
| $55,000 to $64,999 | 7 (3.9%) | 8 (6.0%) |
| $65,000 to $74,999 | 30 (16.6%) | 4 (3.0%) |
| $75,000 to $99,999 | 25 (13.8%) | 3 (2.2%) |
| $100,000+ | 11 (6.1%) | 8 (6.0%) |
| Total | 181 (100.0%) | 134 (100.0%) |
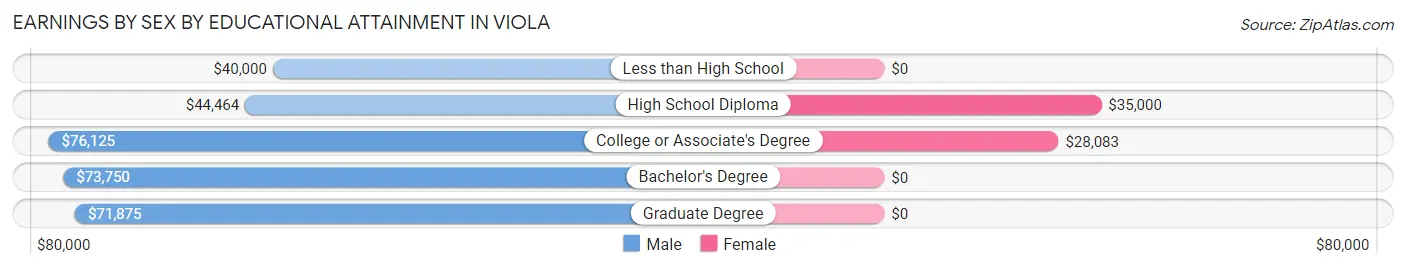
Earnings by Sex by Educational Attainment in Viola
Average earnings in Viola are $56,250 for men and $28,235 for women, a difference of 49.8%. Men with an educational attainment of college or associate's degree enjoy the highest average annual earnings of $76,125, while those with less than high school education earn the least with $40,000. Women with an educational attainment of high school diploma earn the most with the average annual earnings of $35,000, while those with college or associate's degree education have the smallest earnings of $28,083.
| Educational Attainment | Male Income | Female Income |
| Less than High School | $40,000 | $0 |
| High School Diploma | $44,464 | $35,000 |
| College or Associate's Degree | $76,125 | $28,083 |
| Bachelor's Degree | $73,750 | $0 |
| Graduate Degree | $71,875 | $0 |
| Total | $56,250 | $28,235 |
Family Income in Viola
Family Income Brackets in Viola
According to the Viola family income data, there are 41 families falling into the $100,000 to $149,999 income range, which is the most common income bracket and makes up 28.1% of all families. Conversely, the $200,000+ income bracket is the least frequent group with only 2 families (1.4%) belonging to this category.
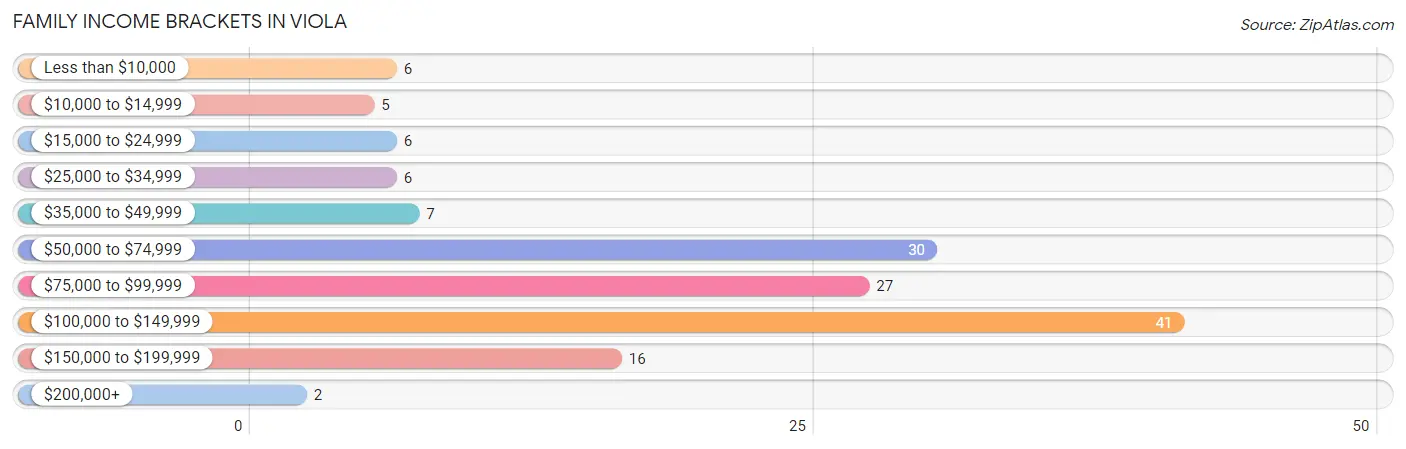
| Income Bracket | # Families | % Families |
| Less than $10,000 | 6 | 4.1% |
| $10,000 to $14,999 | 5 | 3.4% |
| $15,000 to $24,999 | 6 | 4.1% |
| $25,000 to $34,999 | 6 | 4.1% |
| $35,000 to $49,999 | 7 | 4.8% |
| $50,000 to $74,999 | 30 | 20.5% |
| $75,000 to $99,999 | 27 | 18.5% |
| $100,000 to $149,999 | 41 | 28.1% |
| $150,000 to $199,999 | 16 | 11.0% |
| $200,000+ | 2 | 1.4% |
Family Income by Famaliy Size in Viola
2-person families (66 | 45.2%) account for the highest median family income in Viola with $96,250 per family, while 2-person families (66 | 45.2%) have the highest median income of $48,125 per family member.
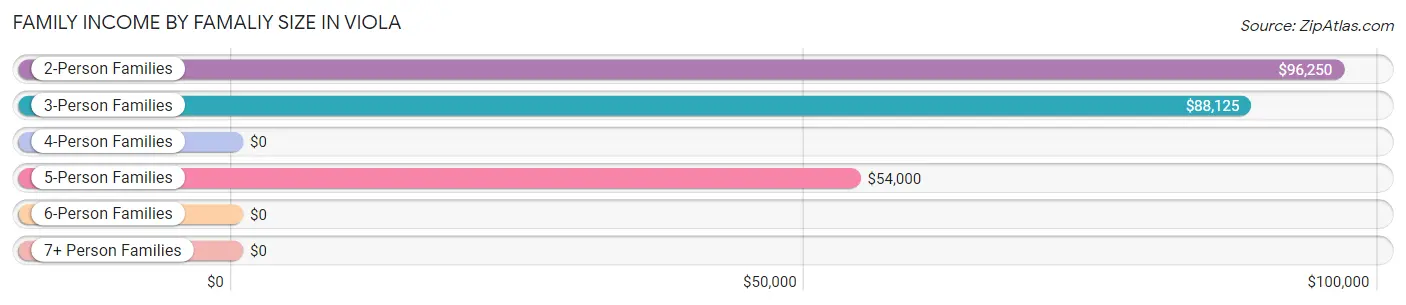
| Income Bracket | # Families | Median Income |
| 2-Person Families | 66 (45.2%) | $96,250 |
| 3-Person Families | 35 (24.0%) | $88,125 |
| 4-Person Families | 30 (20.5%) | $0 |
| 5-Person Families | 12 (8.2%) | $54,000 |
| 6-Person Families | 3 (2.1%) | $0 |
| 7+ Person Families | 0 (0.0%) | $0 |
| Total | 146 (100.0%) | $88,214 |
Family Income by Number of Earners in Viola
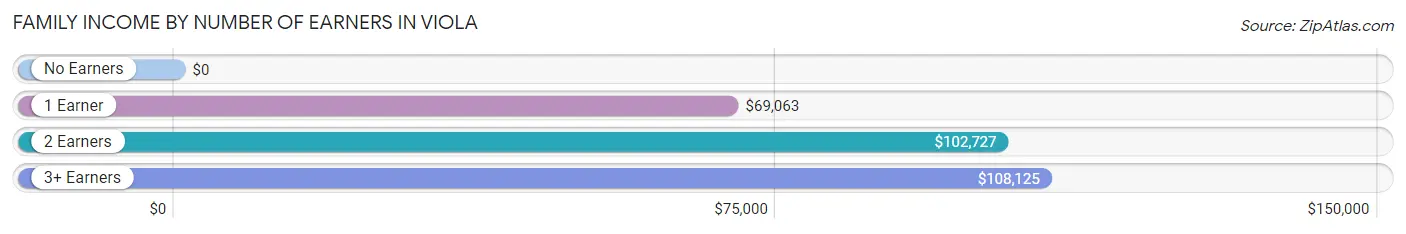
| Number of Earners | # Families | Median Income |
| No Earners | 16 (11.0%) | $0 |
| 1 Earner | 55 (37.7%) | $69,063 |
| 2 Earners | 64 (43.8%) | $102,727 |
| 3+ Earners | 11 (7.5%) | $108,125 |
| Total | 146 (100.0%) | $88,214 |
Household Income in Viola
Household Income Brackets in Viola
With 48 households falling in the category, the $75,000 to $99,999 income range is the most frequent in Viola, accounting for 21.2% of all households. In contrast, only 2 households (0.9%) fall into the $200,000+ income bracket, making it the least populous group.
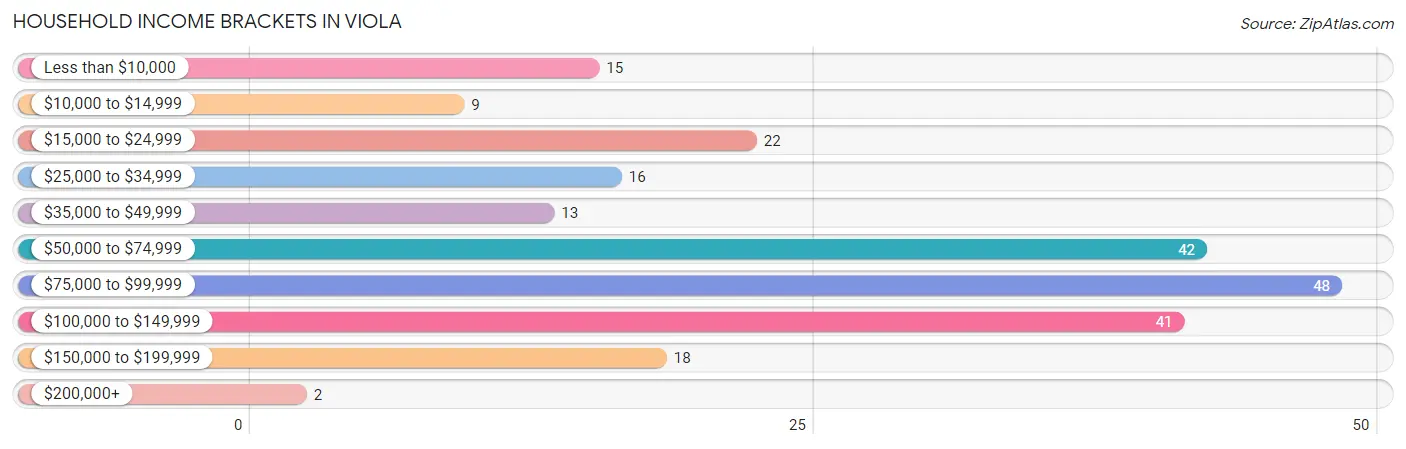
| Income Bracket | # Households | % Households |
| Less than $10,000 | 15 | 6.6% |
| $10,000 to $14,999 | 9 | 4.0% |
| $15,000 to $24,999 | 22 | 9.7% |
| $25,000 to $34,999 | 16 | 7.1% |
| $35,000 to $49,999 | 13 | 5.8% |
| $50,000 to $74,999 | 42 | 18.6% |
| $75,000 to $99,999 | 48 | 21.2% |
| $100,000 to $149,999 | 41 | 18.1% |
| $150,000 to $199,999 | 18 | 8.0% |
| $200,000+ | 2 | 0.9% |
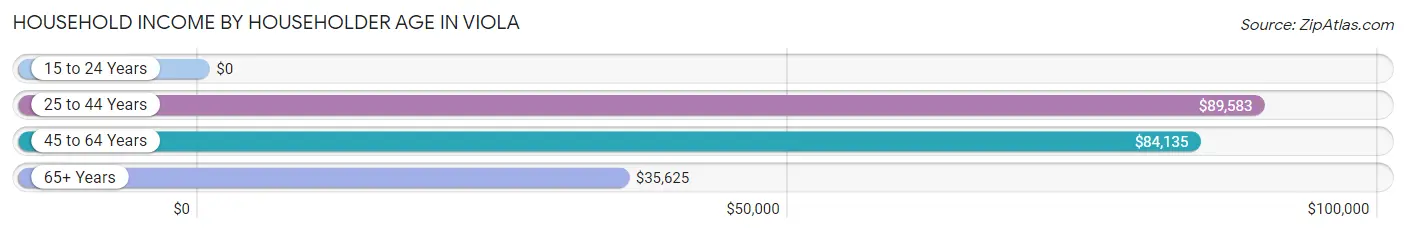
Household Income by Householder Age in Viola
The median household income in Viola is $68,750, with the highest median household income of $89,583 found in the 25 to 44 years age bracket for the primary householder. A total of 57 households (25.2%) fall into this category. Meanwhile, the 15 to 24 years age bracket for the primary householder has the lowest median household income of $0, with 8 households (3.5%) in this group.
| Income Bracket | # Households | Median Income |
| 15 to 24 Years | 8 (3.5%) | $0 |
| 25 to 44 Years | 57 (25.2%) | $89,583 |
| 45 to 64 Years | 99 (43.8%) | $84,135 |
| 65+ Years | 62 (27.4%) | $35,625 |
| Total | 226 (100.0%) | $68,750 |
Poverty in Viola
Income Below Poverty by Sex and Age in Viola
With 9.9% poverty level for males and 14.1% for females among the residents of Viola, under 5 year old males and 5 year old females are the most vulnerable to poverty, with 4 males (44.4%) and 4 females (100.0%) in their respective age groups living below the poverty level.
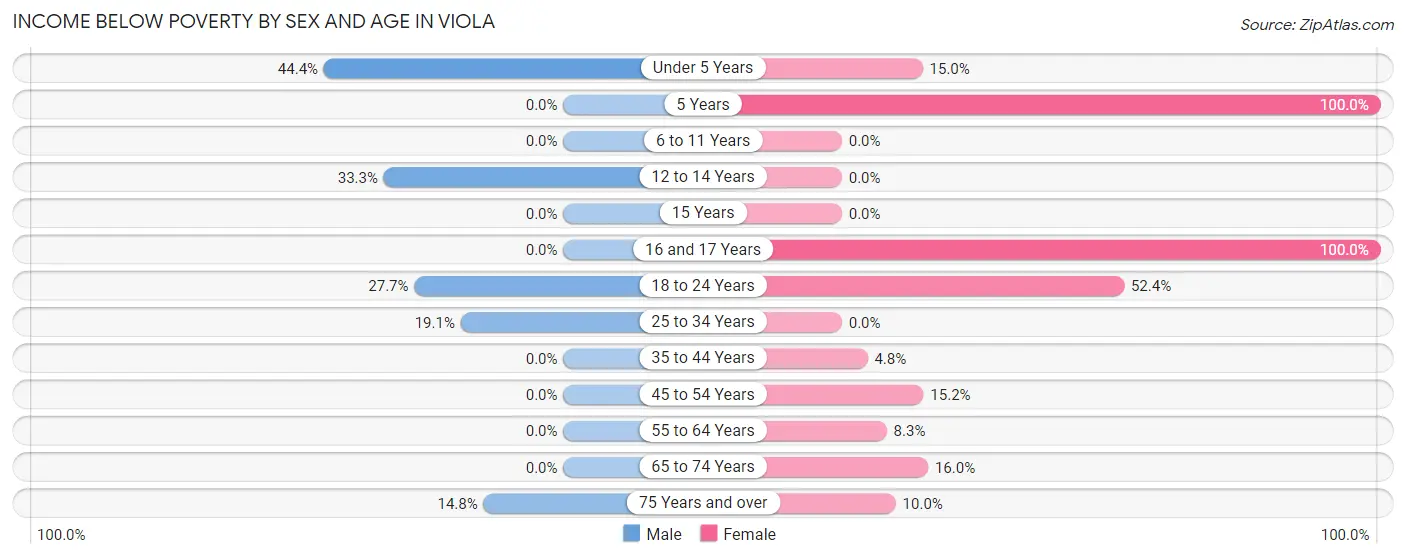
| Age Bracket | Male | Female |
| Under 5 Years | 4 (44.4%) | 3 (15.0%) |
| 5 Years | 0 (0.0%) | 4 (100.0%) |
| 6 to 11 Years | 0 (0.0%) | 0 (0.0%) |
| 12 to 14 Years | 6 (33.3%) | 0 (0.0%) |
| 15 Years | 0 (0.0%) | 0 (0.0%) |
| 16 and 17 Years | 0 (0.0%) | 2 (100.0%) |
| 18 to 24 Years | 13 (27.7%) | 11 (52.4%) |
| 25 to 34 Years | 4 (19.1%) | 0 (0.0%) |
| 35 to 44 Years | 0 (0.0%) | 3 (4.8%) |
| 45 to 54 Years | 0 (0.0%) | 5 (15.1%) |
| 55 to 64 Years | 0 (0.0%) | 3 (8.3%) |
| 65 to 74 Years | 0 (0.0%) | 4 (16.0%) |
| 75 Years and over | 4 (14.8%) | 2 (10.0%) |
| Total | 31 (9.9%) | 37 (14.1%) |
Income Above Poverty by Sex and Age in Viola
According to the poverty statistics in Viola, males aged 6 to 11 years and females aged 6 to 11 years are the age groups that are most secure financially, with 100.0% of males and 100.0% of females in these age groups living above the poverty line.
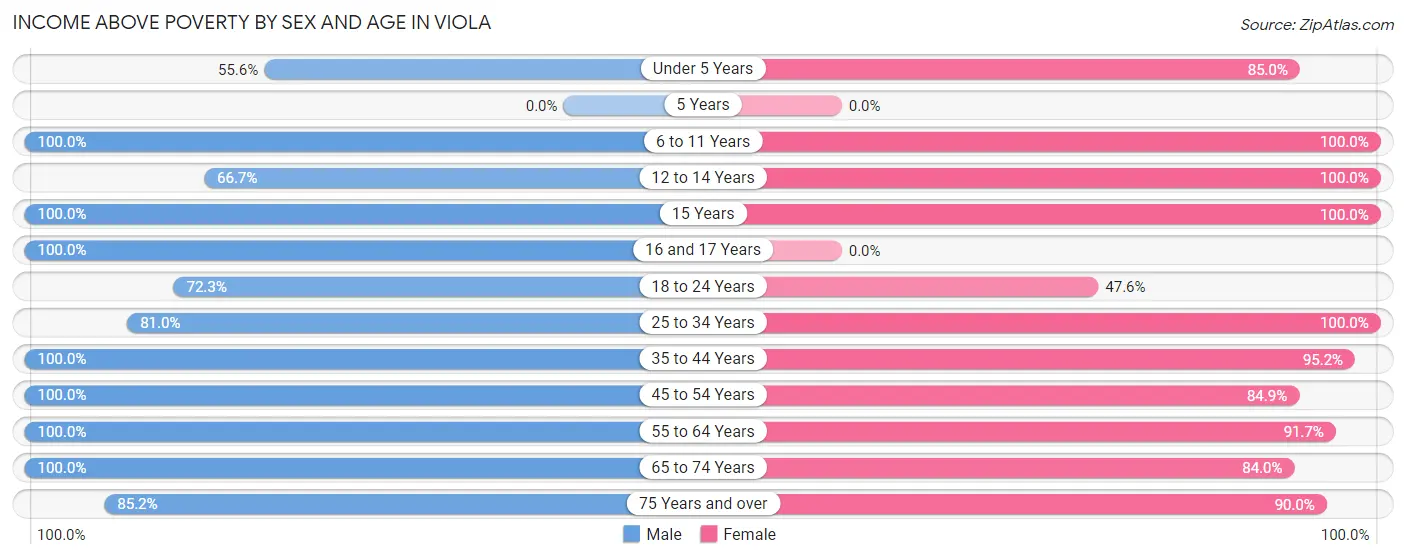
| Age Bracket | Male | Female |
| Under 5 Years | 5 (55.6%) | 17 (85.0%) |
| 5 Years | 0 (0.0%) | 0 (0.0%) |
| 6 to 11 Years | 32 (100.0%) | 8 (100.0%) |
| 12 to 14 Years | 12 (66.7%) | 16 (100.0%) |
| 15 Years | 2 (100.0%) | 4 (100.0%) |
| 16 and 17 Years | 13 (100.0%) | 0 (0.0%) |
| 18 to 24 Years | 34 (72.3%) | 10 (47.6%) |
| 25 to 34 Years | 17 (80.9%) | 10 (100.0%) |
| 35 to 44 Years | 45 (100.0%) | 60 (95.2%) |
| 45 to 54 Years | 39 (100.0%) | 28 (84.9%) |
| 55 to 64 Years | 38 (100.0%) | 33 (91.7%) |
| 65 to 74 Years | 22 (100.0%) | 21 (84.0%) |
| 75 Years and over | 23 (85.2%) | 18 (90.0%) |
| Total | 282 (90.1%) | 225 (85.9%) |
Income Below Poverty Among Married-Couple Families in Viola
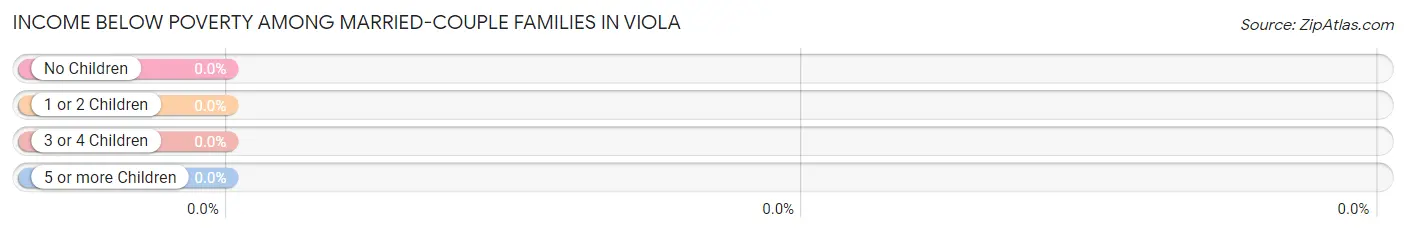
| Children | Above Poverty | Below Poverty |
| No Children | 55 (100.0%) | 0 (0.0%) |
| 1 or 2 Children | 33 (100.0%) | 0 (0.0%) |
| 3 or 4 Children | 10 (100.0%) | 0 (0.0%) |
| 5 or more Children | 0 (0.0%) | 0 (0.0%) |
| Total | 98 (100.0%) | 0 (0.0%) |
Income Below Poverty Among Single-Parent Households in Viola
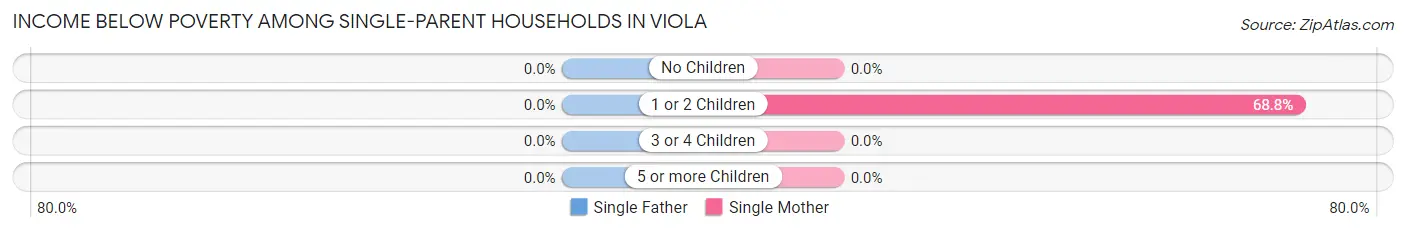
| Children | Single Father | Single Mother |
| No Children | 0 (0.0%) | 0 (0.0%) |
| 1 or 2 Children | 0 (0.0%) | 11 (68.8%) |
| 3 or 4 Children | 0 (0.0%) | 0 (0.0%) |
| 5 or more Children | 0 (0.0%) | 0 (0.0%) |
| Total | 0 (0.0%) | 11 (50.0%) |
Income Below Poverty Among Married-Couple vs Single-Parent Households in Viola
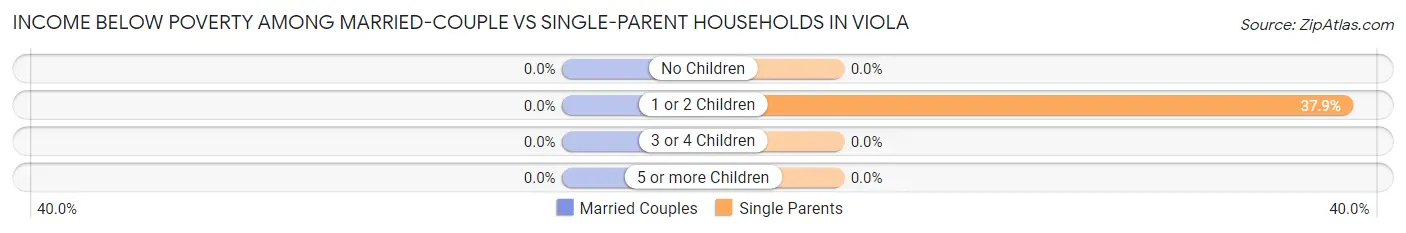
| Children | Married-Couple Families | Single-Parent Households |
| No Children | 0 (0.0%) | 0 (0.0%) |
| 1 or 2 Children | 0 (0.0%) | 11 (37.9%) |
| 3 or 4 Children | 0 (0.0%) | 0 (0.0%) |
| 5 or more Children | 0 (0.0%) | 0 (0.0%) |
| Total | 0 (0.0%) | 11 (22.9%) |
Race in Viola
The most populous races in Viola are White / Caucasian (558 | 97.0%), Two or more Races (11 | 1.9%), and Black / African American (6 | 1.0%).
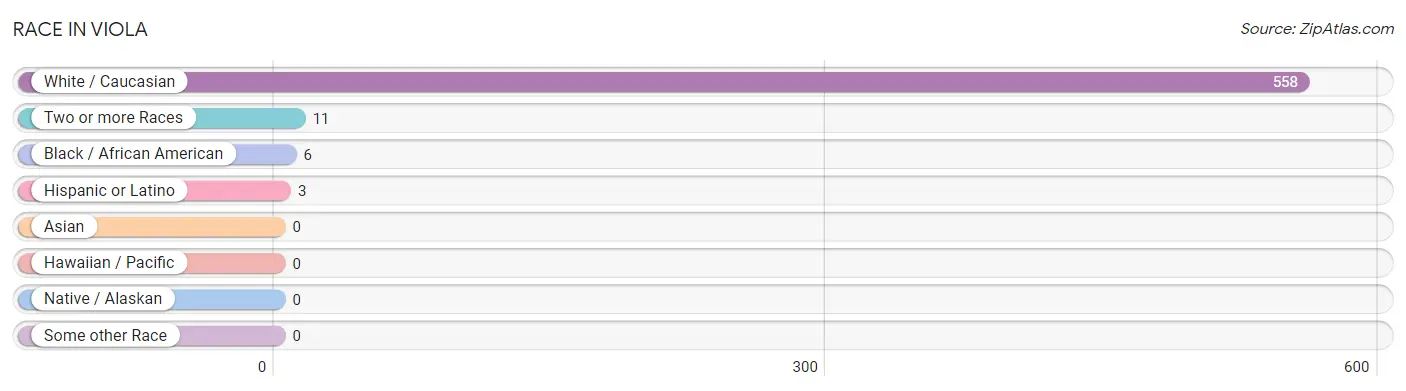
| Race | # Population | % Population |
| Asian | 0 | 0.0% |
| Black / African American | 6 | 1.0% |
| Hawaiian / Pacific | 0 | 0.0% |
| Hispanic or Latino | 3 | 0.5% |
| Native / Alaskan | 0 | 0.0% |
| White / Caucasian | 558 | 97.0% |
| Two or more Races | 11 | 1.9% |
| Some other Race | 0 | 0.0% |
| Total | 575 | 100.0% |
Ancestry in Viola
The most populous ancestries reported in Viola are German (229 | 39.8%), Norwegian (126 | 21.9%), Irish (69 | 12.0%), English (48 | 8.4%), and Italian (21 | 3.6%), together accounting for 85.7% of all Viola residents.
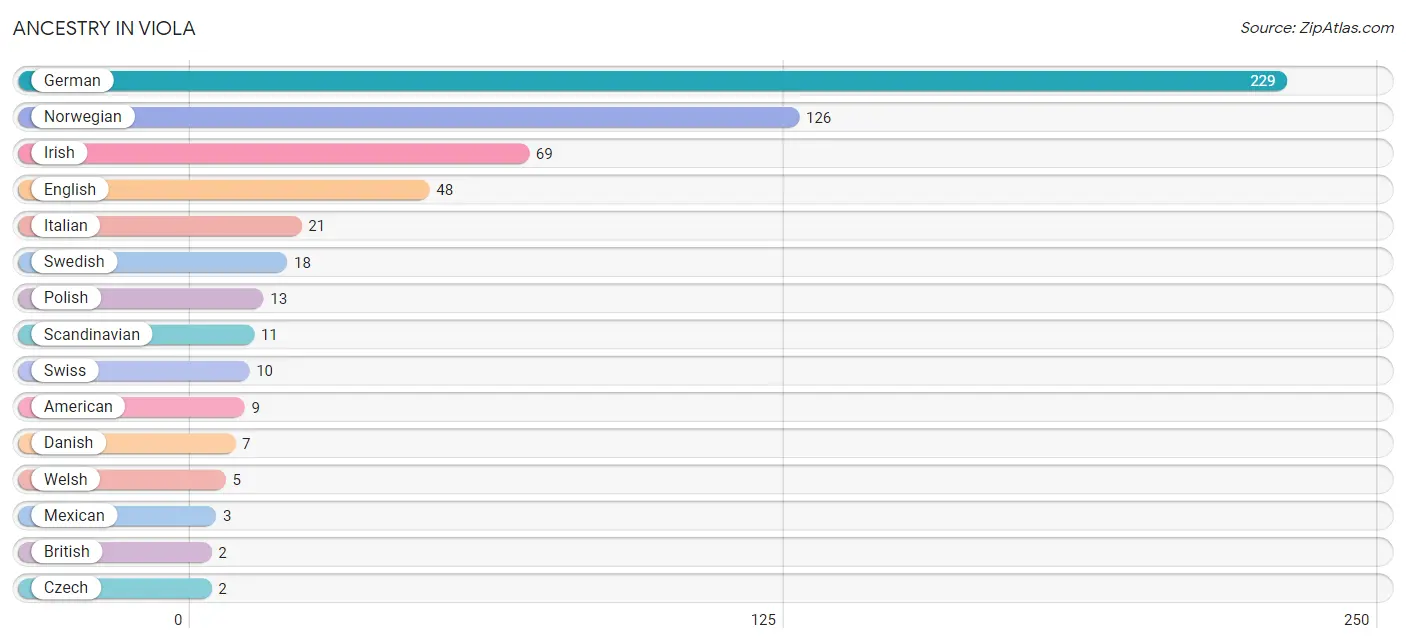
| Ancestry | # Population | % Population |
| American | 9 | 1.6% |
| British | 2 | 0.4% |
| Cherokee | 1 | 0.2% |
| Czech | 2 | 0.4% |
| Danish | 7 | 1.2% |
| Dutch | 2 | 0.4% |
| English | 48 | 8.4% |
| European | 2 | 0.4% |
| French | 1 | 0.2% |
| French Canadian | 2 | 0.4% |
| German | 229 | 39.8% |
| Irish | 69 | 12.0% |
| Italian | 21 | 3.6% |
| Mexican | 3 | 0.5% |
| Norwegian | 126 | 21.9% |
| Polish | 13 | 2.3% |
| Scandinavian | 11 | 1.9% |
| Swedish | 18 | 3.1% |
| Swiss | 10 | 1.7% |
| Welsh | 5 | 0.9% | View All 20 Rows |
Immigrants in Viola
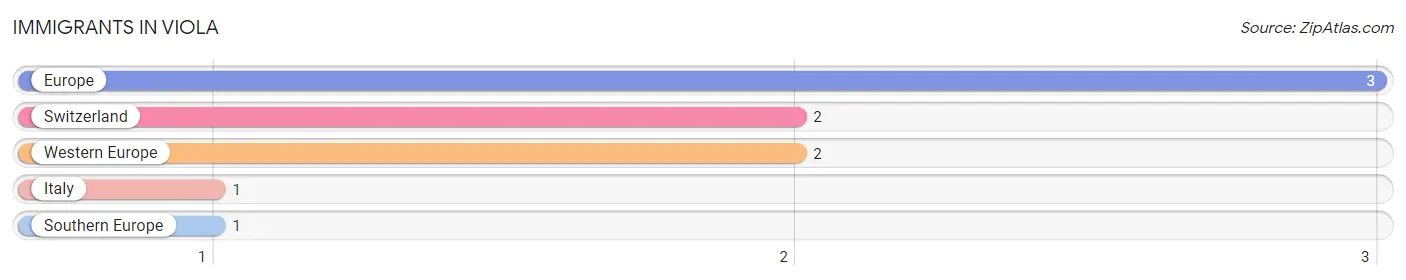
The most numerous immigrant groups reported in Viola came from Europe (3 | 0.5%), Switzerland (2 | 0.4%), Western Europe (2 | 0.4%), Italy (1 | 0.2%), and Southern Europe (1 | 0.2%), together accounting for 1.6% of all Viola residents.
| Immigration Origin | # Population | % Population |
| Europe | 3 | 0.5% |
| Italy | 1 | 0.2% |
| Southern Europe | 1 | 0.2% |
| Switzerland | 2 | 0.4% |
| Western Europe | 2 | 0.4% | View All 5 Rows |
Sex and Age in Viola
Sex and Age in Viola
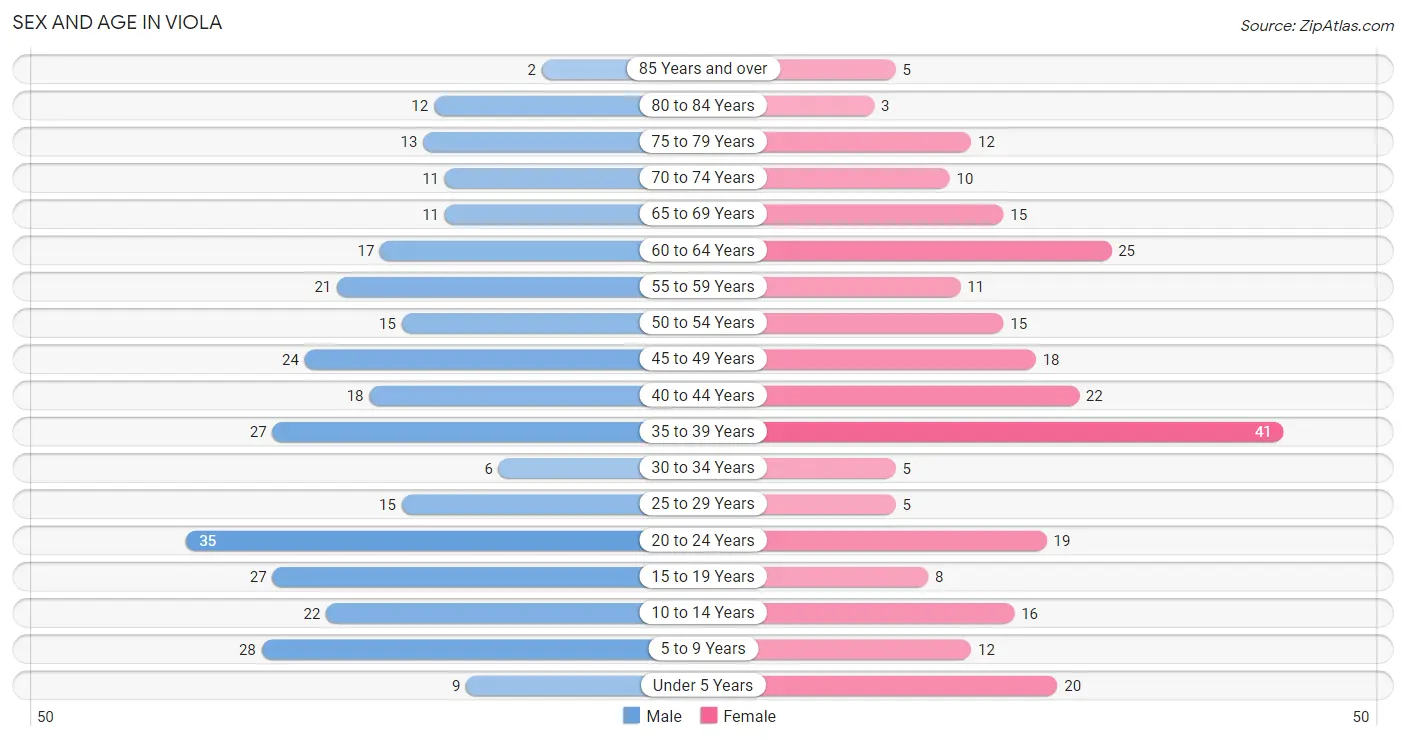
The most populous age groups in Viola are 20 to 24 Years (35 | 11.2%) for men and 35 to 39 Years (41 | 15.7%) for women.
| Age Bracket | Male | Female |
| Under 5 Years | 9 (2.9%) | 20 (7.6%) |
| 5 to 9 Years | 28 (8.9%) | 12 (4.6%) |
| 10 to 14 Years | 22 (7.0%) | 16 (6.1%) |
| 15 to 19 Years | 27 (8.6%) | 8 (3.0%) |
| 20 to 24 Years | 35 (11.2%) | 19 (7.2%) |
| 25 to 29 Years | 15 (4.8%) | 5 (1.9%) |
| 30 to 34 Years | 6 (1.9%) | 5 (1.9%) |
| 35 to 39 Years | 27 (8.6%) | 41 (15.7%) |
| 40 to 44 Years | 18 (5.8%) | 22 (8.4%) |
| 45 to 49 Years | 24 (7.7%) | 18 (6.9%) |
| 50 to 54 Years | 15 (4.8%) | 15 (5.7%) |
| 55 to 59 Years | 21 (6.7%) | 11 (4.2%) |
| 60 to 64 Years | 17 (5.4%) | 25 (9.5%) |
| 65 to 69 Years | 11 (3.5%) | 15 (5.7%) |
| 70 to 74 Years | 11 (3.5%) | 10 (3.8%) |
| 75 to 79 Years | 13 (4.2%) | 12 (4.6%) |
| 80 to 84 Years | 12 (3.8%) | 3 (1.1%) |
| 85 Years and over | 2 (0.6%) | 5 (1.9%) |
| Total | 313 (100.0%) | 262 (100.0%) |
Families and Households in Viola
Median Family Size in Viola
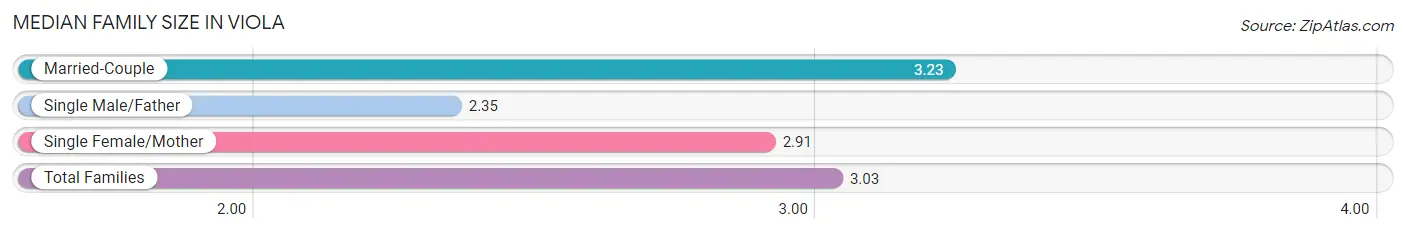
The median family size in Viola is 3.03 persons per family, with married-couple families (98 | 67.1%) accounting for the largest median family size of 3.23 persons per family. On the other hand, single male/father families (26 | 17.8%) represent the smallest median family size with 2.35 persons per family.
| Family Type | # Families | Family Size |
| Married-Couple | 98 (67.1%) | 3.23 |
| Single Male/Father | 26 (17.8%) | 2.35 |
| Single Female/Mother | 22 (15.1%) | 2.91 |
| Total Families | 146 (100.0%) | 3.03 |
Median Household Size in Viola
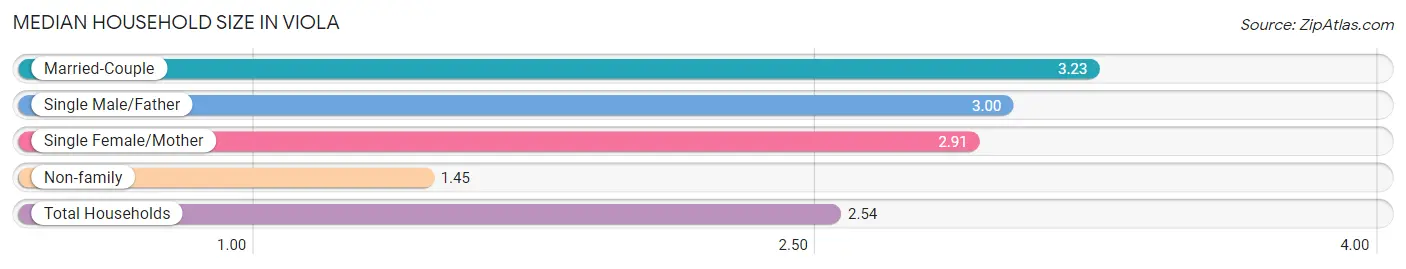
The median household size in Viola is 2.54 persons per household, with married-couple households (98 | 43.4%) accounting for the largest median household size of 3.23 persons per household. non-family households (80 | 35.4%) represent the smallest median household size with 1.45 persons per household.
| Household Type | # Households | Household Size |
| Married-Couple | 98 (43.4%) | 3.23 |
| Single Male/Father | 26 (11.5%) | 3.00 |
| Single Female/Mother | 22 (9.7%) | 2.91 |
| Non-family | 80 (35.4%) | 1.45 |
| Total Households | 226 (100.0%) | 2.54 |
Household Size by Marriage Status in Viola
Out of a total of 226 households in Viola, 146 (64.6%) are family households, while 80 (35.4%) are nonfamily households. The most numerous type of family households are 2-person households, comprising 58, and the most common type of nonfamily households are 1-person households, comprising 55.
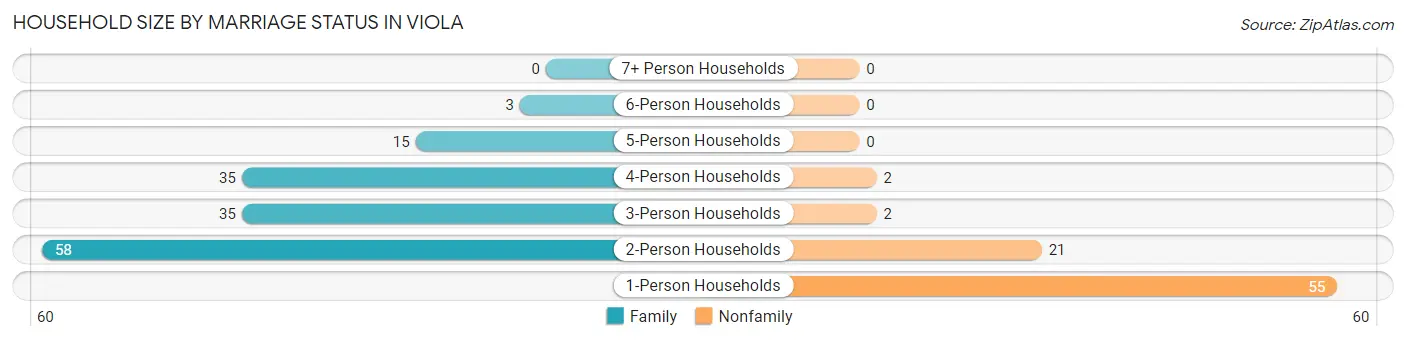
| Household Size | Family Households | Nonfamily Households |
| 1-Person Households | - | 55 (24.3%) |
| 2-Person Households | 58 (25.7%) | 21 (9.3%) |
| 3-Person Households | 35 (15.5%) | 2 (0.9%) |
| 4-Person Households | 35 (15.5%) | 2 (0.9%) |
| 5-Person Households | 15 (6.6%) | 0 (0.0%) |
| 6-Person Households | 3 (1.3%) | 0 (0.0%) |
| 7+ Person Households | 0 (0.0%) | 0 (0.0%) |
| Total | 146 (64.6%) | 80 (35.4%) |
Female Fertility in Viola
Fertility by Age in Viola
Average fertility rate in Viola is 16.0 births per 1,000 women. Women in the age bracket of 35 to 50 years have the highest fertility rate with 23.0 births per 1,000 women. Women in the age bracket of 35 to 50 years acount for 100.0% of all women with births.
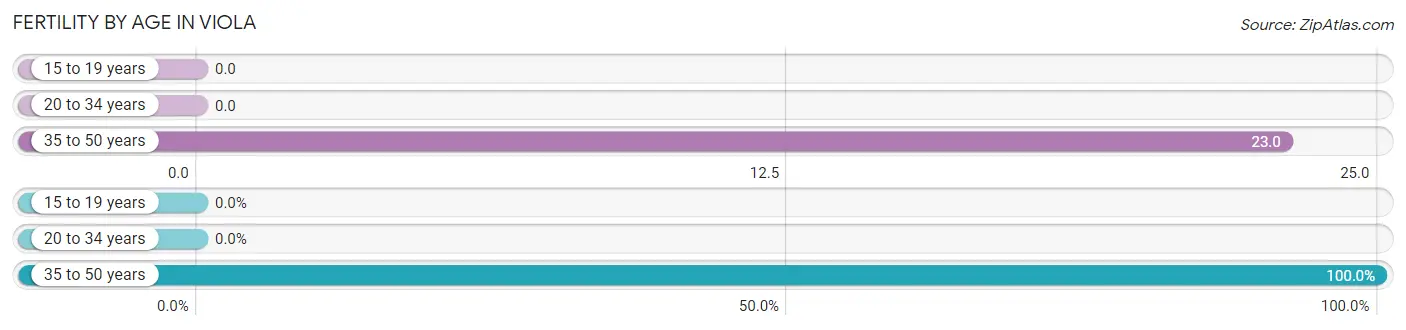
| Age Bracket | Women with Births | Births / 1,000 Women |
| 15 to 19 years | 0 (0.0%) | 0.0 |
| 20 to 34 years | 0 (0.0%) | 0.0 |
| 35 to 50 years | 2 (100.0%) | 23.0 |
| Total | 2 (100.0%) | 16.0 |
Fertility by Age by Marriage Status in Viola
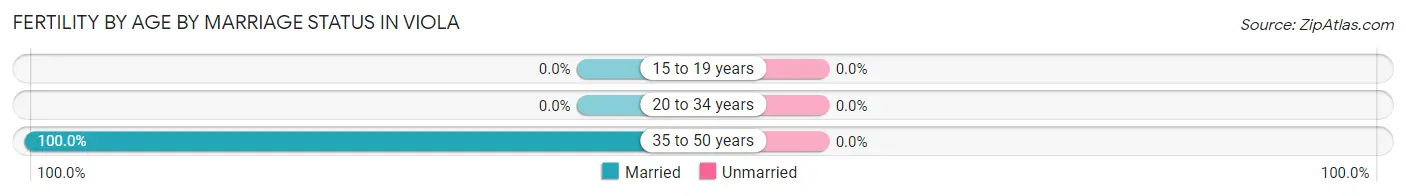
| Age Bracket | Married | Unmarried |
| 15 to 19 years | 0 (0.0%) | 0 (0.0%) |
| 20 to 34 years | 0 (0.0%) | 0 (0.0%) |
| 35 to 50 years | 2 (100.0%) | 0 (0.0%) |
| Total | 2 (100.0%) | 0 (0.0%) |
Fertility by Education in Viola
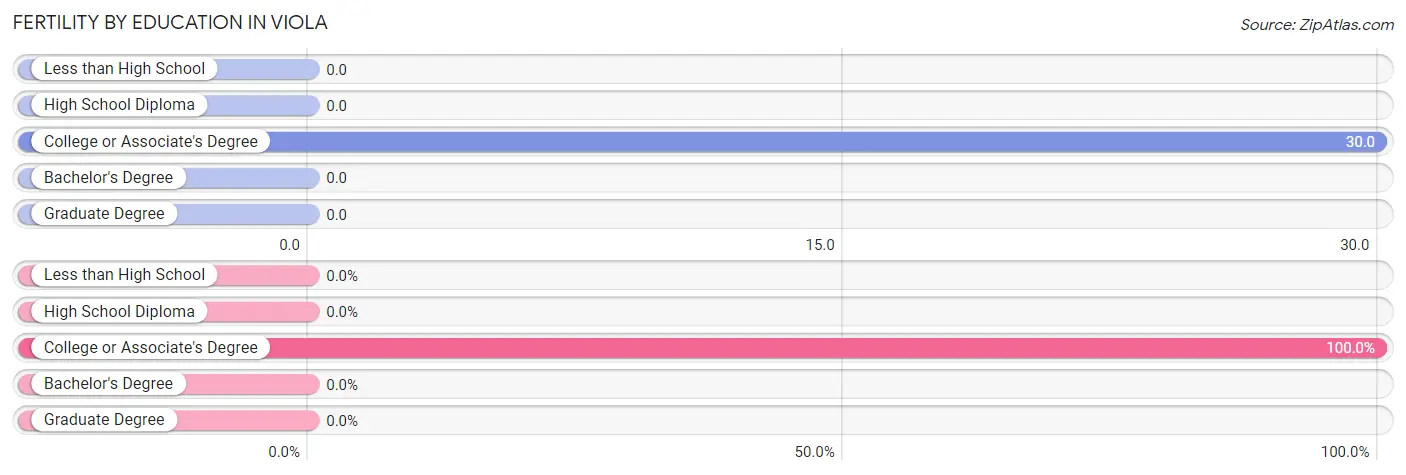
| Educational Attainment | Women with Births | Births / 1,000 Women |
| Less than High School | 0 (0.0%) | 0.0 |
| High School Diploma | 0 (0.0%) | 0.0 |
| College or Associate's Degree | 2 (100.0%) | 30.0 |
| Bachelor's Degree | 0 (0.0%) | 0.0 |
| Graduate Degree | 0 (0.0%) | 0.0 |
| Total | 2 (100.0%) | 16.0 |
Fertility by Education by Marriage Status in Viola
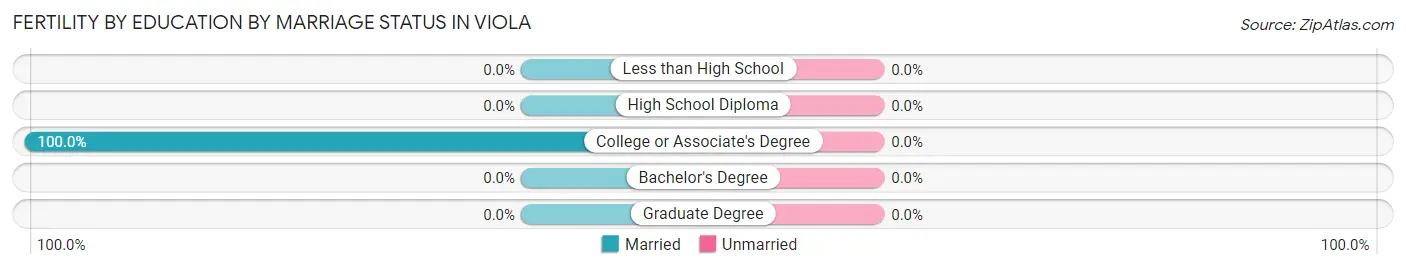
| Educational Attainment | Married | Unmarried |
| Less than High School | 0 (0.0%) | 0 (0.0%) |
| High School Diploma | 0 (0.0%) | 0 (0.0%) |
| College or Associate's Degree | 2 (100.0%) | 0 (0.0%) |
| Bachelor's Degree | 0 (0.0%) | 0 (0.0%) |
| Graduate Degree | 0 (0.0%) | 0 (0.0%) |
| Total | 2 (100.0%) | 0 (0.0%) |
Employment Characteristics in Viola
Employment by Class of Employer in Viola
Among the 292 employed individuals in Viola, private company employees (237 | 81.2%), self-employed (not incorporated) (22 | 7.5%), and not-for-profit organizations (16 | 5.5%) make up the most common classes of employment.
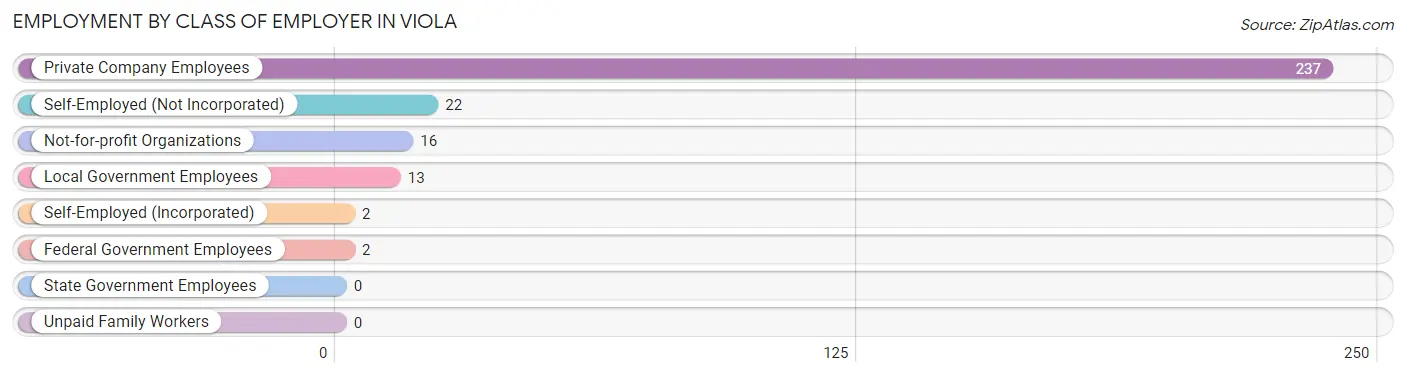
| Employer Class | # Employees | % Employees |
| Private Company Employees | 237 | 81.2% |
| Self-Employed (Incorporated) | 2 | 0.7% |
| Self-Employed (Not Incorporated) | 22 | 7.5% |
| Not-for-profit Organizations | 16 | 5.5% |
| Local Government Employees | 13 | 4.4% |
| State Government Employees | 0 | 0.0% |
| Federal Government Employees | 2 | 0.7% |
| Unpaid Family Workers | 0 | 0.0% |
| Total | 292 | 100.0% |
Employment Status by Age in Viola
According to the labor force statistics for Viola, out of the total population over 16 years of age (462), 65.4% or 302 individuals are in the labor force, with 3.3% or 10 of them unemployed. The age group with the highest labor force participation rate is 25 to 29 years, with 100.0% or 20 individuals in the labor force. Within the labor force, the 16 to 19 years age range has the highest percentage of unemployed individuals, with 13.3% or 2 of them being unemployed.
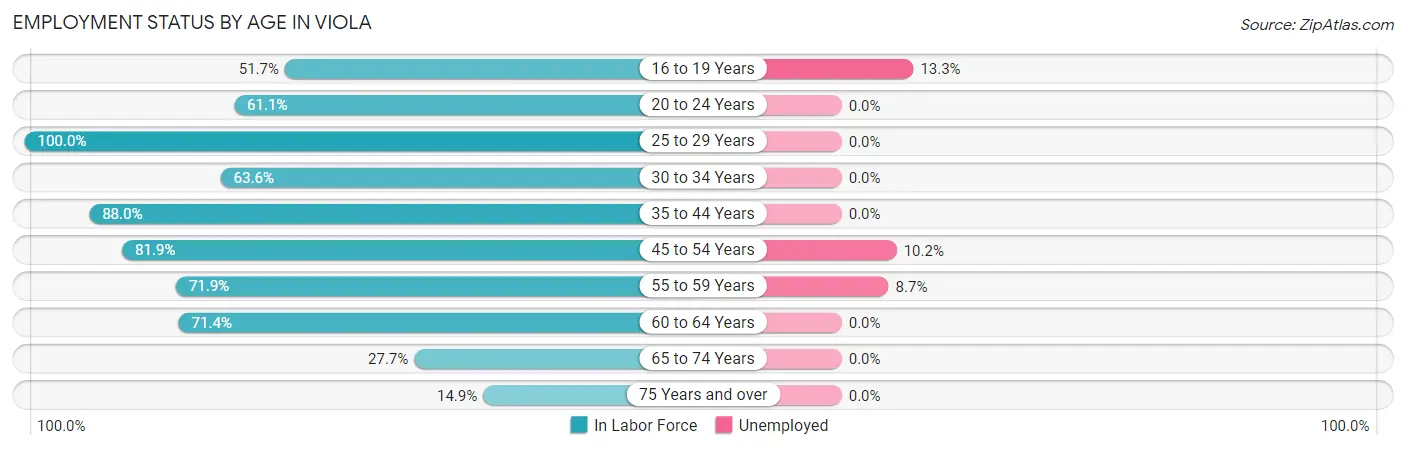
| Age Bracket | In Labor Force | Unemployed |
| 16 to 19 Years | 15 (51.7%) | 2 (13.3%) |
| 20 to 24 Years | 33 (61.1%) | 0 (0.0%) |
| 25 to 29 Years | 20 (100.0%) | 0 (0.0%) |
| 30 to 34 Years | 7 (63.6%) | 0 (0.0%) |
| 35 to 44 Years | 95 (88.0%) | 0 (0.0%) |
| 45 to 54 Years | 59 (81.9%) | 6 (10.2%) |
| 55 to 59 Years | 23 (71.9%) | 2 (8.7%) |
| 60 to 64 Years | 30 (71.4%) | 0 (0.0%) |
| 65 to 74 Years | 13 (27.7%) | 0 (0.0%) |
| 75 Years and over | 7 (14.9%) | 0 (0.0%) |
| Total | 302 (65.4%) | 10 (3.3%) |
Employment Status by Educational Attainment in Viola
According to labor force statistics for Viola, 82.1% of individuals (234) out of the total population between 25 and 64 years of age (285) are in the labor force, with 3.4% or 8 of them being unemployed. The group with the highest labor force participation rate are those with the educational attainment of bachelor's degree or higher, with 92.3% or 24 individuals in the labor force. Within the labor force, individuals with less than high school education have the highest percentage of unemployment, with 14.3% or 2 of them being unemployed.
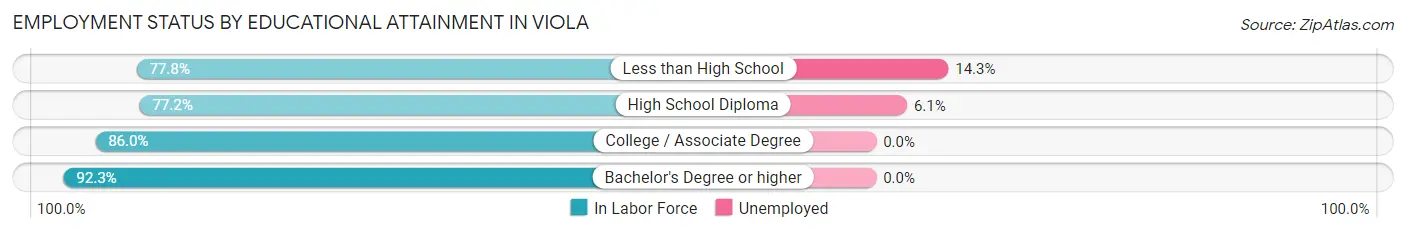
| Educational Attainment | In Labor Force | Unemployed |
| Less than High School | 14 (77.8%) | 3 (14.3%) |
| High School Diploma | 98 (77.2%) | 8 (6.1%) |
| College / Associate Degree | 98 (86.0%) | 0 (0.0%) |
| Bachelor's Degree or higher | 24 (92.3%) | 0 (0.0%) |
| Total | 234 (82.1%) | 10 (3.4%) |
Employment Occupations by Sex in Viola
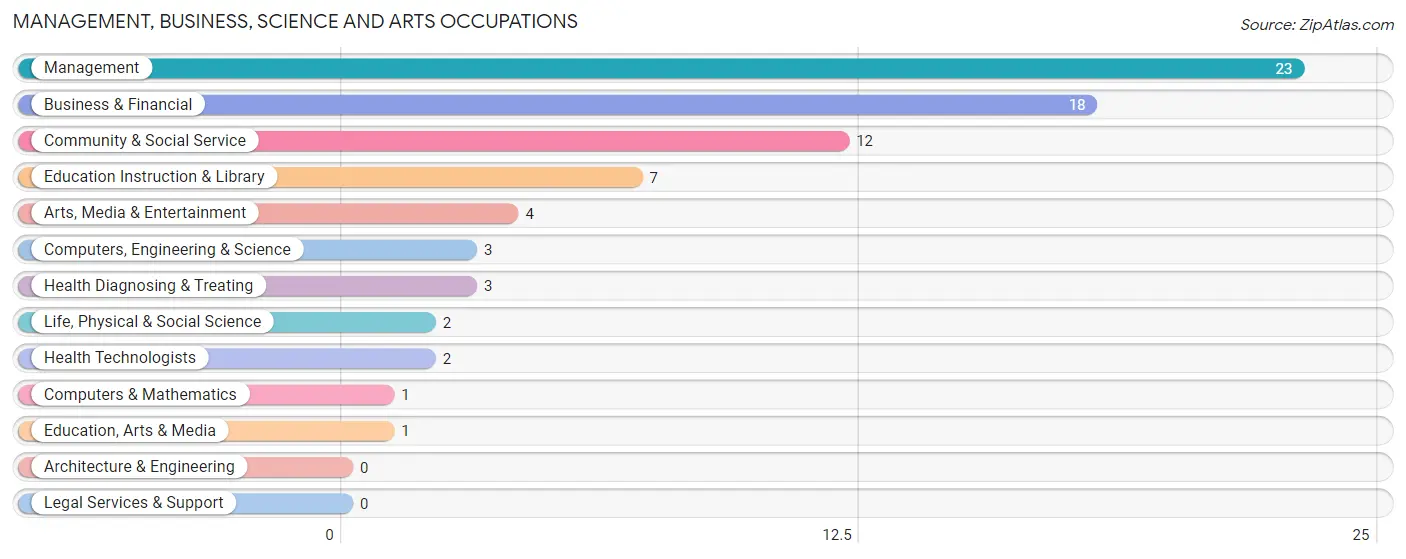
Management, Business, Science and Arts Occupations
The most common Management, Business, Science and Arts occupations in Viola are Management (23 | 7.9%), Business & Financial (18 | 6.2%), Community & Social Service (12 | 4.1%), Education Instruction & Library (7 | 2.4%), and Arts, Media & Entertainment (4 | 1.4%).
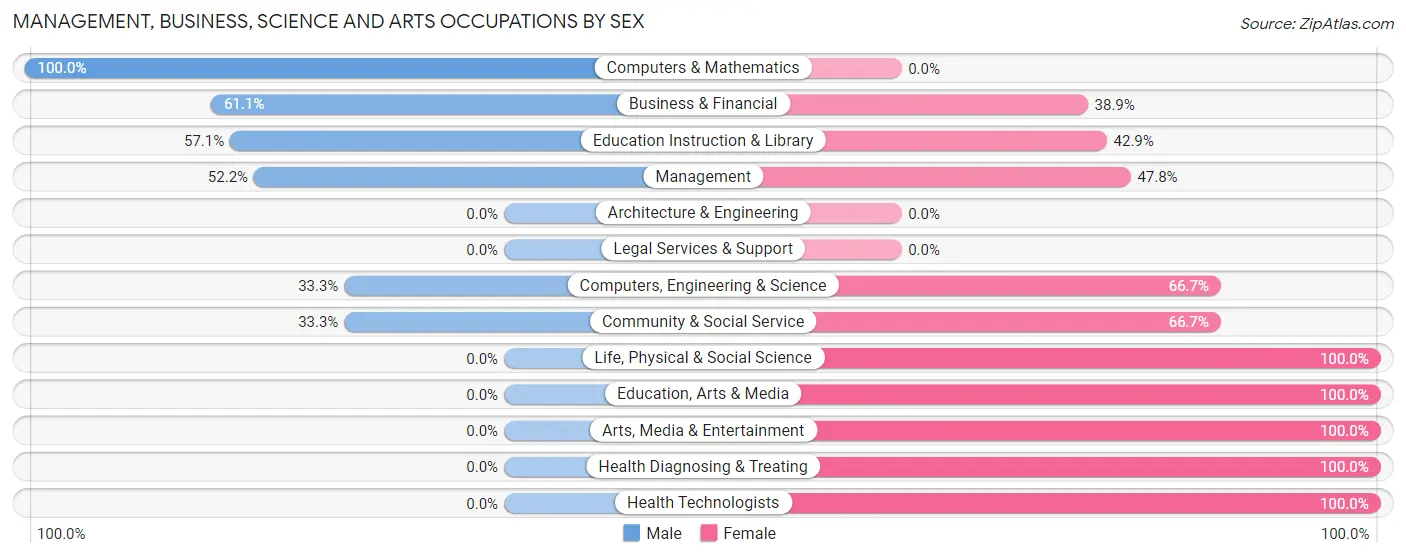
Management, Business, Science and Arts Occupations by Sex
Within the Management, Business, Science and Arts occupations in Viola, the most male-oriented occupations are Computers & Mathematics (100.0%), Business & Financial (61.1%), and Education Instruction & Library (57.1%), while the most female-oriented occupations are Life, Physical & Social Science (100.0%), Education, Arts & Media (100.0%), and Arts, Media & Entertainment (100.0%).
| Occupation | Male | Female |
| Management | 12 (52.2%) | 11 (47.8%) |
| Business & Financial | 11 (61.1%) | 7 (38.9%) |
| Computers, Engineering & Science | 1 (33.3%) | 2 (66.7%) |
| Computers & Mathematics | 1 (100.0%) | 0 (0.0%) |
| Architecture & Engineering | 0 (0.0%) | 0 (0.0%) |
| Life, Physical & Social Science | 0 (0.0%) | 2 (100.0%) |
| Community & Social Service | 4 (33.3%) | 8 (66.7%) |
| Education, Arts & Media | 0 (0.0%) | 1 (100.0%) |
| Legal Services & Support | 0 (0.0%) | 0 (0.0%) |
| Education Instruction & Library | 4 (57.1%) | 3 (42.9%) |
| Arts, Media & Entertainment | 0 (0.0%) | 4 (100.0%) |
| Health Diagnosing & Treating | 0 (0.0%) | 3 (100.0%) |
| Health Technologists | 0 (0.0%) | 2 (100.0%) |
| Total (Category) | 28 (47.5%) | 31 (52.5%) |
| Total (Overall) | 169 (57.9%) | 123 (42.1%) |
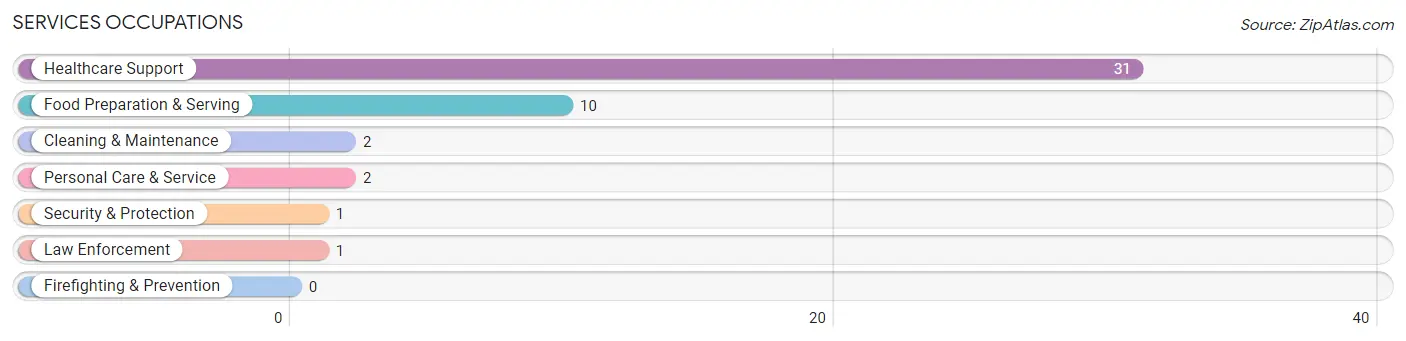
Services Occupations
The most common Services occupations in Viola are Healthcare Support (31 | 10.6%), Food Preparation & Serving (10 | 3.4%), Cleaning & Maintenance (2 | 0.7%), Personal Care & Service (2 | 0.7%), and Security & Protection (1 | 0.3%).
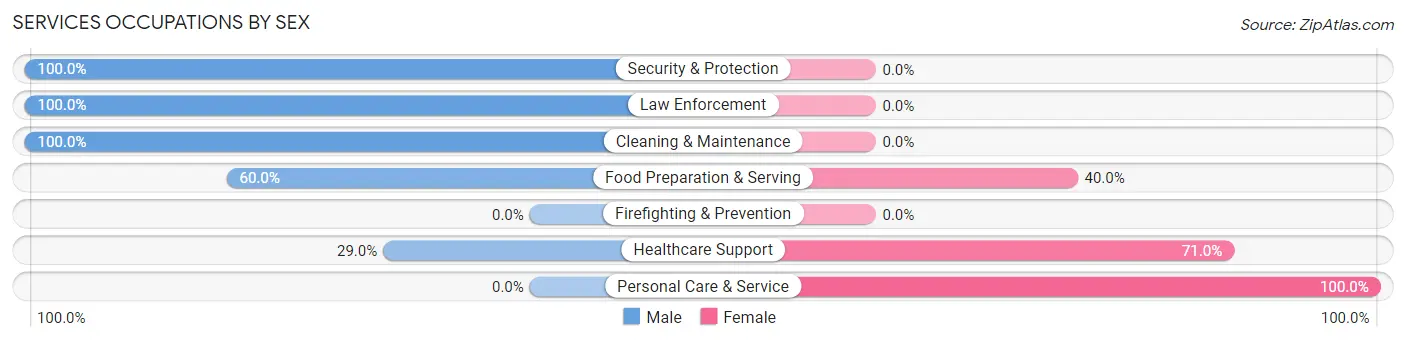
Services Occupations by Sex
Within the Services occupations in Viola, the most male-oriented occupations are Security & Protection (100.0%), Law Enforcement (100.0%), and Cleaning & Maintenance (100.0%), while the most female-oriented occupations are Personal Care & Service (100.0%), Healthcare Support (71.0%), and Food Preparation & Serving (40.0%).
| Occupation | Male | Female |
| Healthcare Support | 9 (29.0%) | 22 (71.0%) |
| Security & Protection | 1 (100.0%) | 0 (0.0%) |
| Firefighting & Prevention | 0 (0.0%) | 0 (0.0%) |
| Law Enforcement | 1 (100.0%) | 0 (0.0%) |
| Food Preparation & Serving | 6 (60.0%) | 4 (40.0%) |
| Cleaning & Maintenance | 2 (100.0%) | 0 (0.0%) |
| Personal Care & Service | 0 (0.0%) | 2 (100.0%) |
| Total (Category) | 18 (39.1%) | 28 (60.9%) |
| Total (Overall) | 169 (57.9%) | 123 (42.1%) |
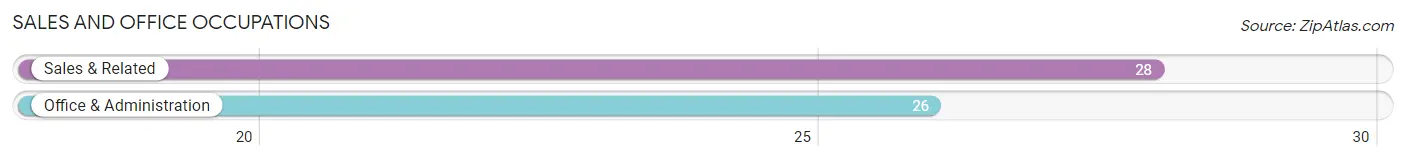
Sales and Office Occupations
The most common Sales and Office occupations in Viola are Sales & Related (28 | 9.6%), and Office & Administration (26 | 8.9%).
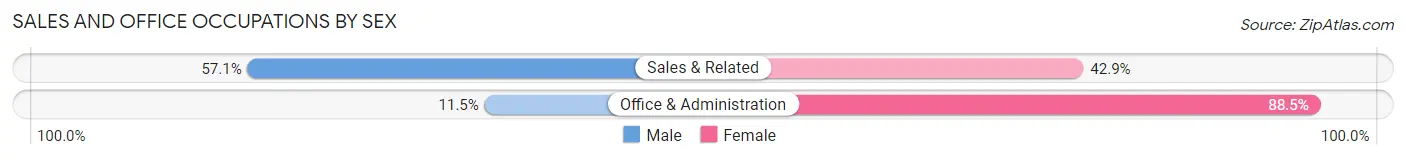
Sales and Office Occupations by Sex
| Occupation | Male | Female |
| Sales & Related | 16 (57.1%) | 12 (42.9%) |
| Office & Administration | 3 (11.5%) | 23 (88.5%) |
| Total (Category) | 19 (35.2%) | 35 (64.8%) |
| Total (Overall) | 169 (57.9%) | 123 (42.1%) |
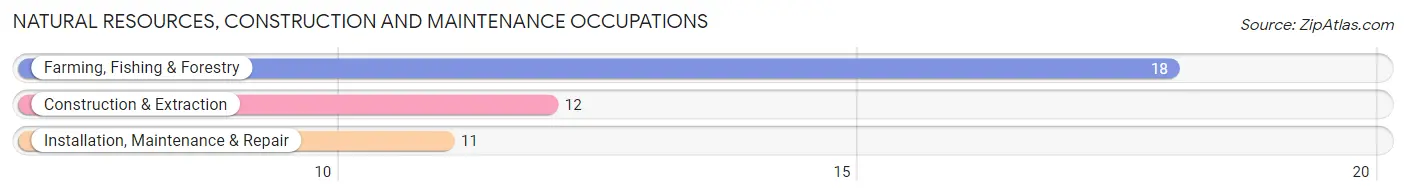
Natural Resources, Construction and Maintenance Occupations
The most common Natural Resources, Construction and Maintenance occupations in Viola are Farming, Fishing & Forestry (18 | 6.2%), Construction & Extraction (12 | 4.1%), and Installation, Maintenance & Repair (11 | 3.8%).
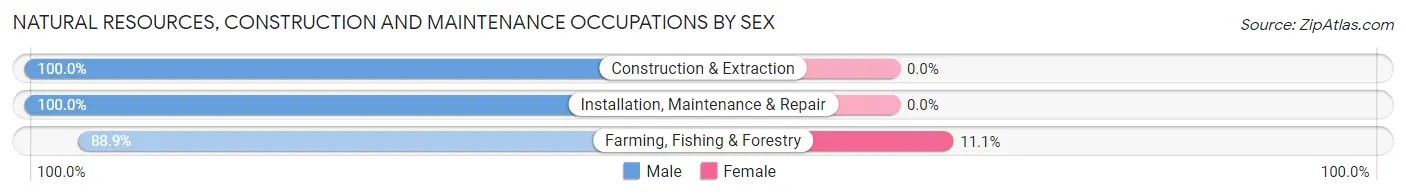
Natural Resources, Construction and Maintenance Occupations by Sex
| Occupation | Male | Female |
| Farming, Fishing & Forestry | 16 (88.9%) | 2 (11.1%) |
| Construction & Extraction | 12 (100.0%) | 0 (0.0%) |
| Installation, Maintenance & Repair | 11 (100.0%) | 0 (0.0%) |
| Total (Category) | 39 (95.1%) | 2 (4.9%) |
| Total (Overall) | 169 (57.9%) | 123 (42.1%) |
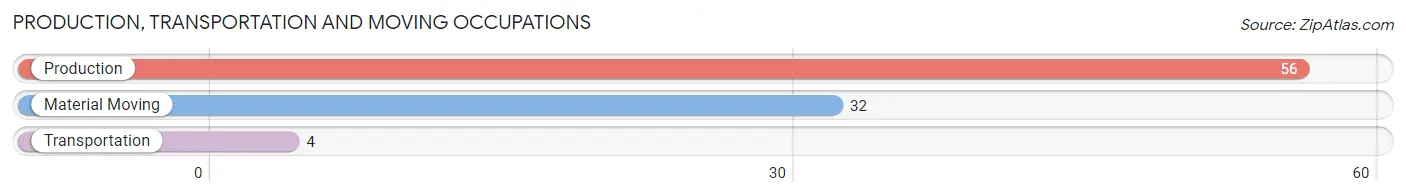
Production, Transportation and Moving Occupations
The most common Production, Transportation and Moving occupations in Viola are Production (56 | 19.2%), Material Moving (32 | 11.0%), and Transportation (4 | 1.4%).
Production, Transportation and Moving Occupations by Sex
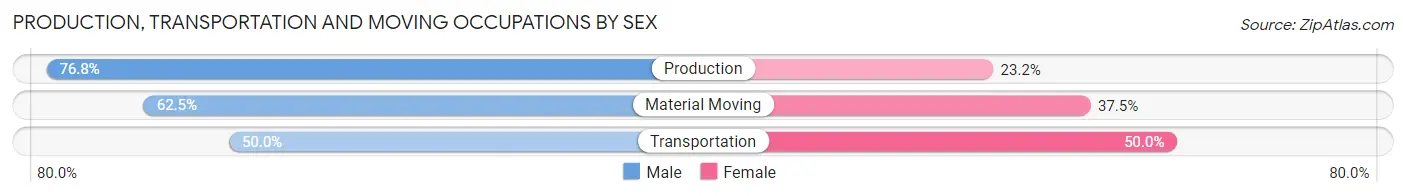
| Occupation | Male | Female |
| Production | 43 (76.8%) | 13 (23.2%) |
| Transportation | 2 (50.0%) | 2 (50.0%) |
| Material Moving | 20 (62.5%) | 12 (37.5%) |
| Total (Category) | 65 (70.7%) | 27 (29.3%) |
| Total (Overall) | 169 (57.9%) | 123 (42.1%) |
Employment Industries by Sex in Viola
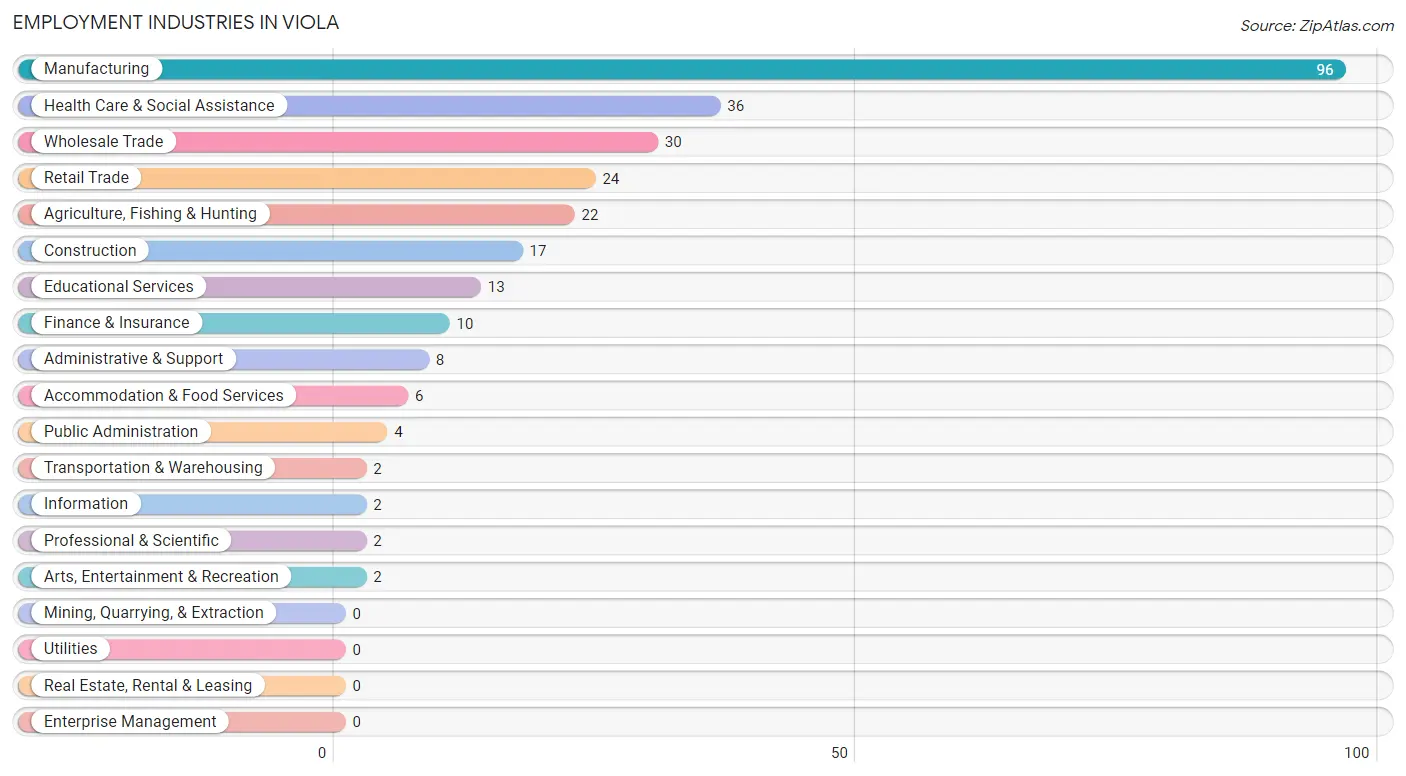
Employment Industries in Viola
The major employment industries in Viola include Manufacturing (96 | 32.9%), Health Care & Social Assistance (36 | 12.3%), Wholesale Trade (30 | 10.3%), Retail Trade (24 | 8.2%), and Agriculture, Fishing & Hunting (22 | 7.5%).
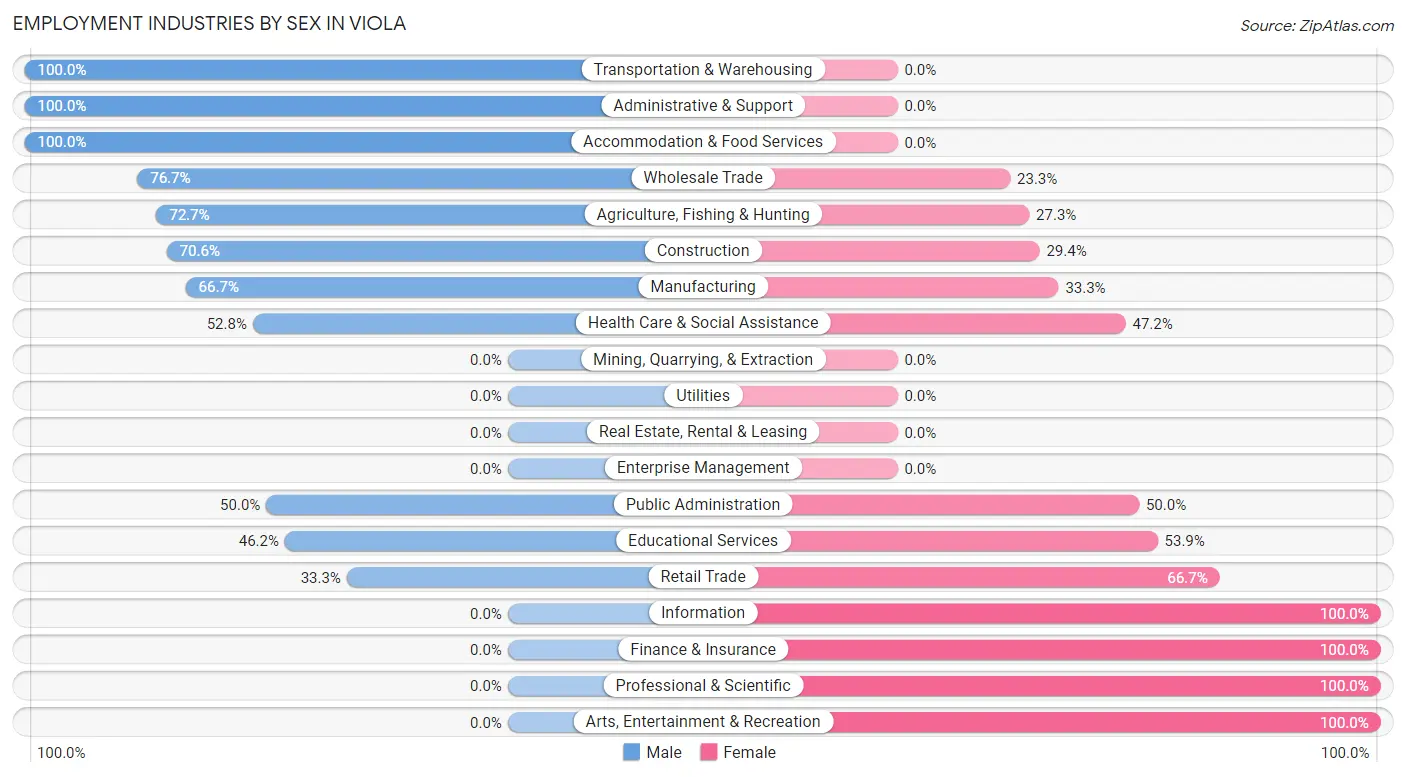
Employment Industries by Sex in Viola
The Viola industries that see more men than women are Transportation & Warehousing (100.0%), Administrative & Support (100.0%), and Accommodation & Food Services (100.0%), whereas the industries that tend to have a higher number of women are Information (100.0%), Finance & Insurance (100.0%), and Professional & Scientific (100.0%).
| Industry | Male | Female |
| Agriculture, Fishing & Hunting | 16 (72.7%) | 6 (27.3%) |
| Mining, Quarrying, & Extraction | 0 (0.0%) | 0 (0.0%) |
| Construction | 12 (70.6%) | 5 (29.4%) |
| Manufacturing | 64 (66.7%) | 32 (33.3%) |
| Wholesale Trade | 23 (76.7%) | 7 (23.3%) |
| Retail Trade | 8 (33.3%) | 16 (66.7%) |
| Transportation & Warehousing | 2 (100.0%) | 0 (0.0%) |
| Utilities | 0 (0.0%) | 0 (0.0%) |
| Information | 0 (0.0%) | 2 (100.0%) |
| Finance & Insurance | 0 (0.0%) | 10 (100.0%) |
| Real Estate, Rental & Leasing | 0 (0.0%) | 0 (0.0%) |
| Professional & Scientific | 0 (0.0%) | 2 (100.0%) |
| Enterprise Management | 0 (0.0%) | 0 (0.0%) |
| Administrative & Support | 8 (100.0%) | 0 (0.0%) |
| Educational Services | 6 (46.2%) | 7 (53.8%) |
| Health Care & Social Assistance | 19 (52.8%) | 17 (47.2%) |
| Arts, Entertainment & Recreation | 0 (0.0%) | 2 (100.0%) |
| Accommodation & Food Services | 6 (100.0%) | 0 (0.0%) |
| Public Administration | 2 (50.0%) | 2 (50.0%) |
| Total | 169 (57.9%) | 123 (42.1%) |
Education in Viola
School Enrollment in Viola
The most common levels of schooling among the 146 students in Viola are high school (38 | 26.0%), elementary school (36 | 24.7%), and middle school (33 | 22.6%).
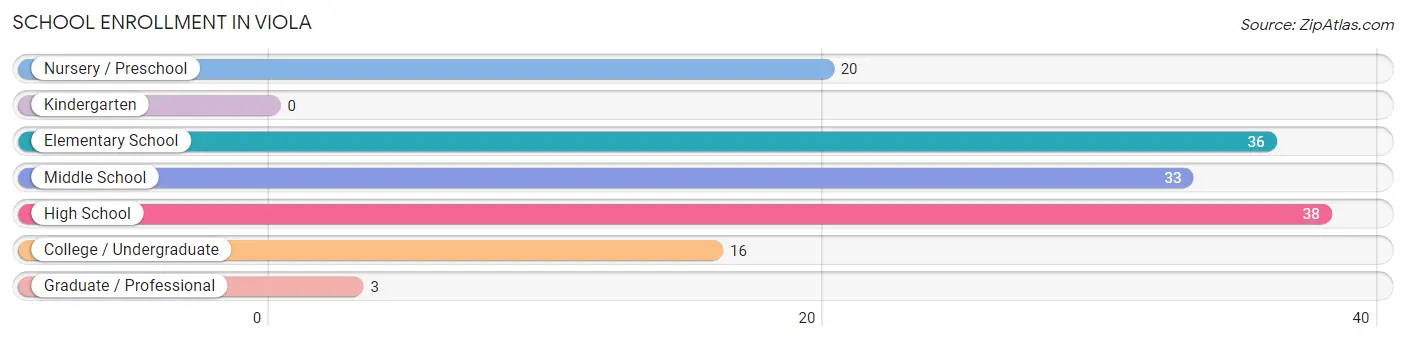
| School Level | # Students | % Students |
| Nursery / Preschool | 20 | 13.7% |
| Kindergarten | 0 | 0.0% |
| Elementary School | 36 | 24.7% |
| Middle School | 33 | 22.6% |
| High School | 38 | 26.0% |
| College / Undergraduate | 16 | 11.0% |
| Graduate / Professional | 3 | 2.1% |
| Total | 146 | 100.0% |
School Enrollment by Age by Funding Source in Viola
Out of a total of 146 students who are enrolled in schools in Viola, 15 (10.3%) attend a private institution, while the remaining 131 (89.7%) are enrolled in public schools. The age group of 20 to 24 year olds has the highest likelihood of being enrolled in private schools, with 5 (31.2% in the age bracket) enrolled. Conversely, the age group of 3 to 4 year olds has the lowest likelihood of being enrolled in a private school, with 16 (100.0% in the age bracket) attending a public institution.
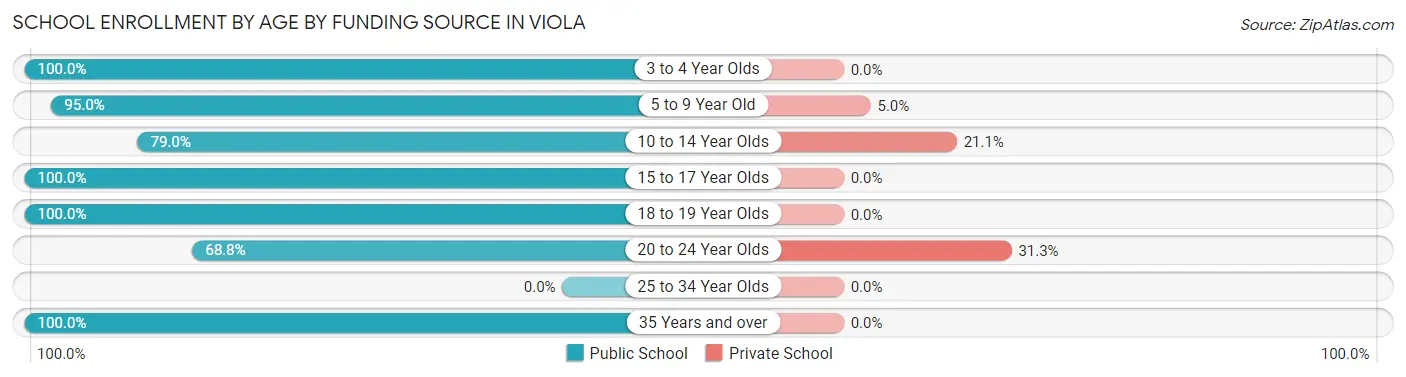
| Age Bracket | Public School | Private School |
| 3 to 4 Year Olds | 16 (100.0%) | 0 (0.0%) |
| 5 to 9 Year Old | 38 (95.0%) | 2 (5.0%) |
| 10 to 14 Year Olds | 30 (78.9%) | 8 (21.0%) |
| 15 to 17 Year Olds | 21 (100.0%) | 0 (0.0%) |
| 18 to 19 Year Olds | 13 (100.0%) | 0 (0.0%) |
| 20 to 24 Year Olds | 11 (68.8%) | 5 (31.2%) |
| 25 to 34 Year Olds | 0 (0.0%) | 0 (0.0%) |
| 35 Years and over | 2 (100.0%) | 0 (0.0%) |
| Total | 131 (89.7%) | 15 (10.3%) |
Educational Attainment by Field of Study in Viola
Bio, nature & agricultural (15 | 33.3%), education (15 | 33.3%), science & technology (4 | 8.9%), physical & health sciences (3 | 6.7%), and business (3 | 6.7%) are the most common fields of study among 45 individuals in Viola who have obtained a bachelor's degree or higher.
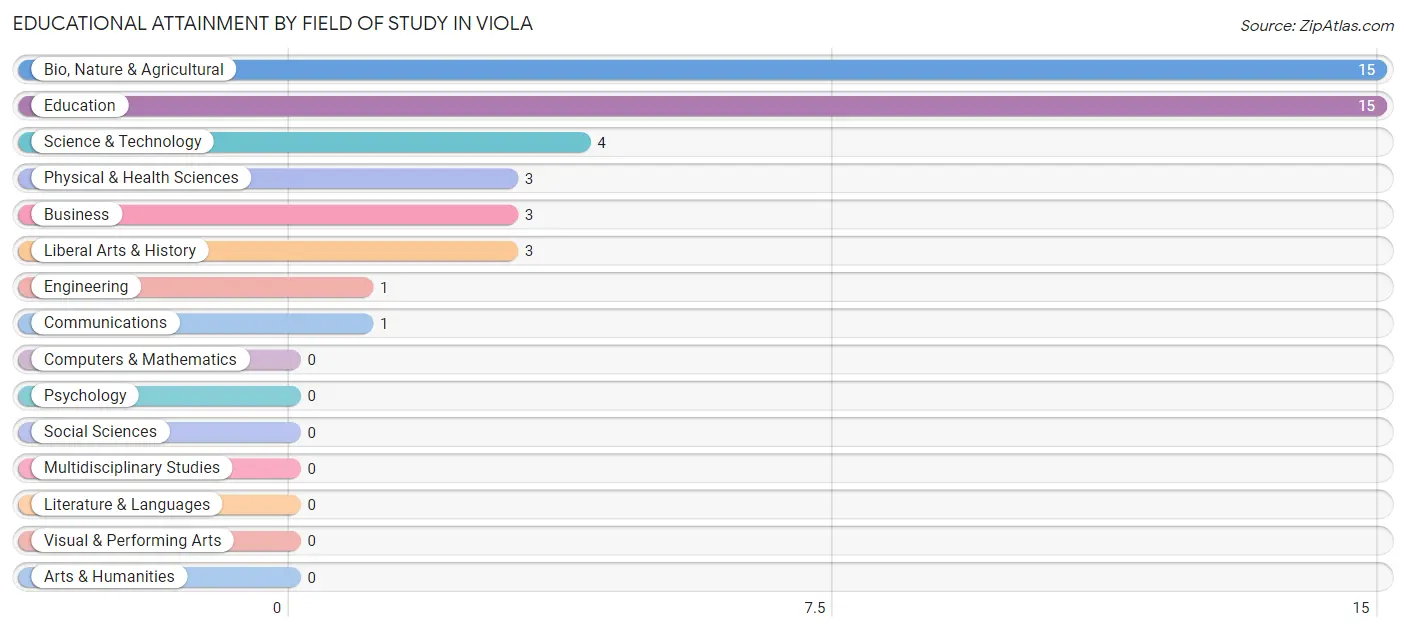
| Field of Study | # Graduates | % Graduates |
| Computers & Mathematics | 0 | 0.0% |
| Bio, Nature & Agricultural | 15 | 33.3% |
| Physical & Health Sciences | 3 | 6.7% |
| Psychology | 0 | 0.0% |
| Social Sciences | 0 | 0.0% |
| Engineering | 1 | 2.2% |
| Multidisciplinary Studies | 0 | 0.0% |
| Science & Technology | 4 | 8.9% |
| Business | 3 | 6.7% |
| Education | 15 | 33.3% |
| Literature & Languages | 0 | 0.0% |
| Liberal Arts & History | 3 | 6.7% |
| Visual & Performing Arts | 0 | 0.0% |
| Communications | 1 | 2.2% |
| Arts & Humanities | 0 | 0.0% |
| Total | 45 | 100.0% |
Transportation & Commute in Viola
Vehicle Availability by Sex in Viola
The most prevalent vehicle ownership categories in Viola are males with 2 vehicles (64, accounting for 37.9%) and females with 2 vehicles (52, making up 52.0%).
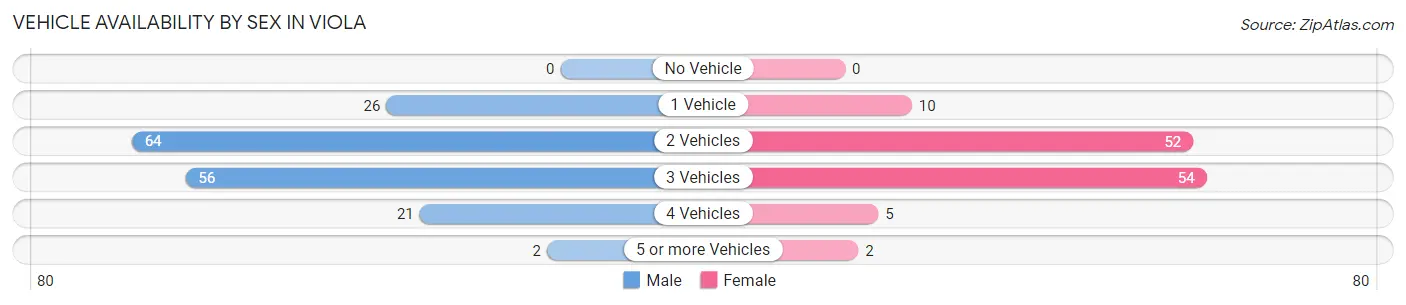
| Vehicles Available | Male | Female |
| No Vehicle | 0 (0.0%) | 0 (0.0%) |
| 1 Vehicle | 26 (15.4%) | 10 (8.1%) |
| 2 Vehicles | 64 (37.9%) | 52 (42.3%) |
| 3 Vehicles | 56 (33.1%) | 54 (43.9%) |
| 4 Vehicles | 21 (12.4%) | 5 (4.1%) |
| 5 or more Vehicles | 2 (1.2%) | 2 (1.6%) |
| Total | 169 (100.0%) | 123 (100.0%) |
Commute Time in Viola
The most frequently occuring commute durations in Viola are 30 to 34 minutes (66 commuters, 24.7%), 5 to 9 minutes (55 commuters, 20.6%), and 20 to 24 minutes (31 commuters, 11.6%).
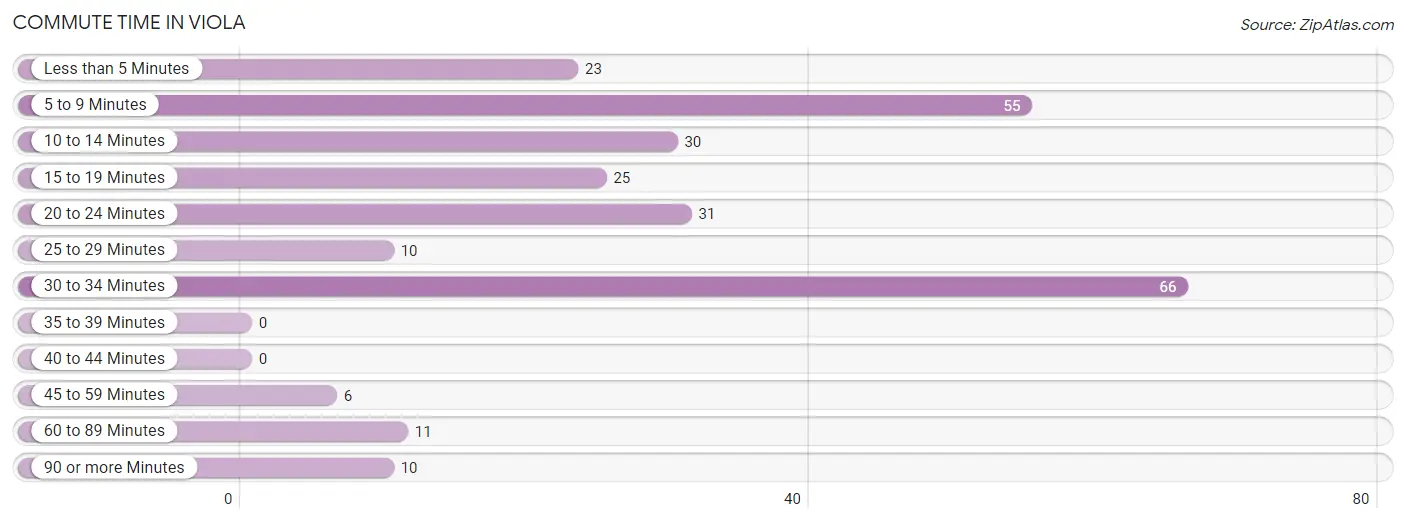
| Commute Time | # Commuters | % Commuters |
| Less than 5 Minutes | 23 | 8.6% |
| 5 to 9 Minutes | 55 | 20.6% |
| 10 to 14 Minutes | 30 | 11.2% |
| 15 to 19 Minutes | 25 | 9.4% |
| 20 to 24 Minutes | 31 | 11.6% |
| 25 to 29 Minutes | 10 | 3.7% |
| 30 to 34 Minutes | 66 | 24.7% |
| 35 to 39 Minutes | 0 | 0.0% |
| 40 to 44 Minutes | 0 | 0.0% |
| 45 to 59 Minutes | 6 | 2.2% |
| 60 to 89 Minutes | 11 | 4.1% |
| 90 or more Minutes | 10 | 3.7% |
Commute Time by Sex in Viola
The most common commute times in Viola are 30 to 34 minutes (41 commuters, 28.1%) for males and 5 to 9 minutes (32 commuters, 26.5%) for females.
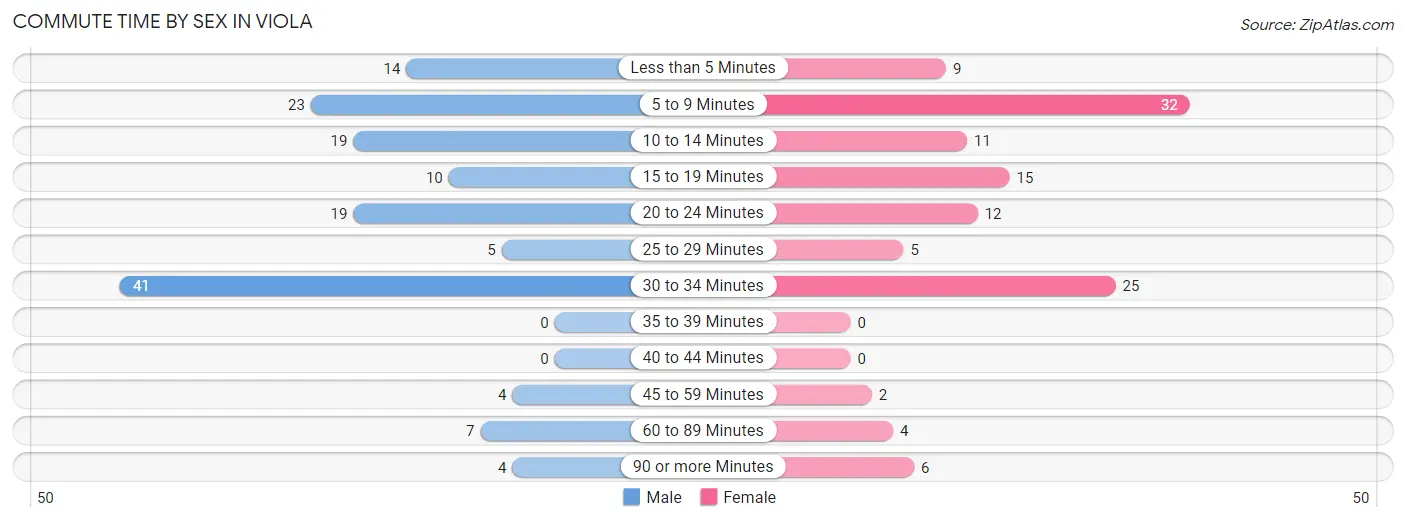
| Commute Time | Male | Female |
| Less than 5 Minutes | 14 (9.6%) | 9 (7.4%) |
| 5 to 9 Minutes | 23 (15.8%) | 32 (26.5%) |
| 10 to 14 Minutes | 19 (13.0%) | 11 (9.1%) |
| 15 to 19 Minutes | 10 (6.9%) | 15 (12.4%) |
| 20 to 24 Minutes | 19 (13.0%) | 12 (9.9%) |
| 25 to 29 Minutes | 5 (3.4%) | 5 (4.1%) |
| 30 to 34 Minutes | 41 (28.1%) | 25 (20.7%) |
| 35 to 39 Minutes | 0 (0.0%) | 0 (0.0%) |
| 40 to 44 Minutes | 0 (0.0%) | 0 (0.0%) |
| 45 to 59 Minutes | 4 (2.7%) | 2 (1.7%) |
| 60 to 89 Minutes | 7 (4.8%) | 4 (3.3%) |
| 90 or more Minutes | 4 (2.7%) | 6 (5.0%) |
Time of Departure to Work by Sex in Viola
The most frequent times of departure to work in Viola are 7:00 AM to 7:29 AM (24, 16.4%) for males and 6:30 AM to 6:59 AM (22, 18.2%) for females.
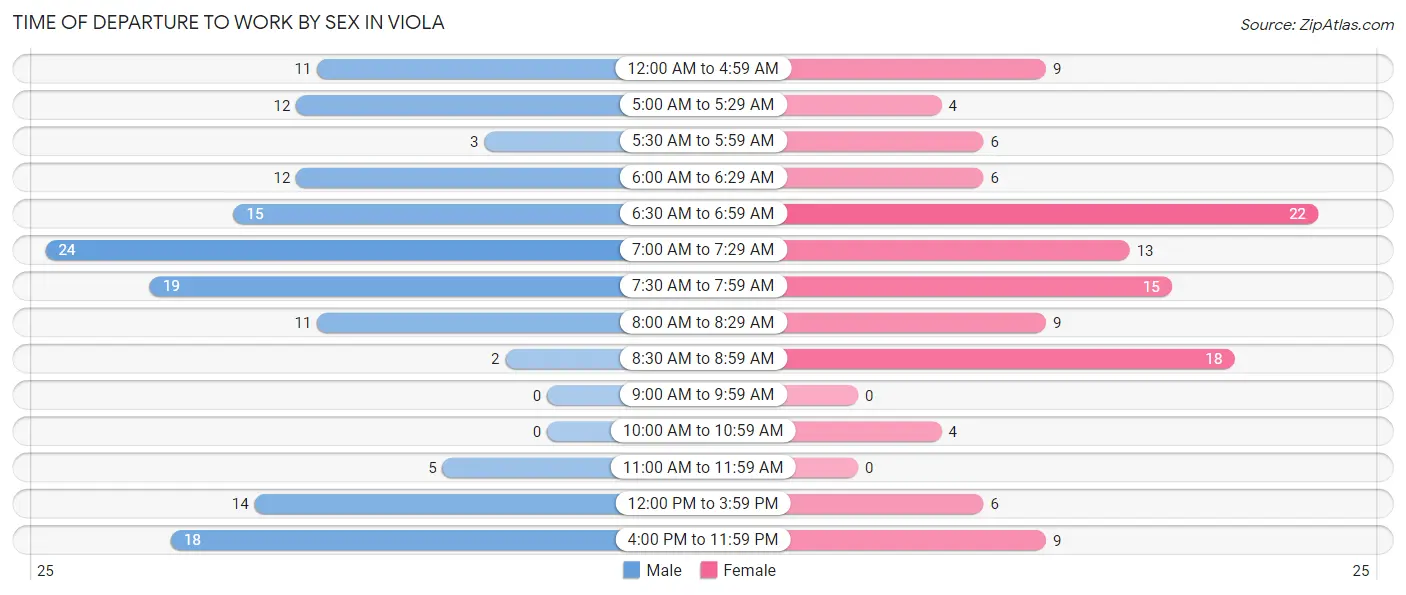
| Time of Departure | Male | Female |
| 12:00 AM to 4:59 AM | 11 (7.5%) | 9 (7.4%) |
| 5:00 AM to 5:29 AM | 12 (8.2%) | 4 (3.3%) |
| 5:30 AM to 5:59 AM | 3 (2.1%) | 6 (5.0%) |
| 6:00 AM to 6:29 AM | 12 (8.2%) | 6 (5.0%) |
| 6:30 AM to 6:59 AM | 15 (10.3%) | 22 (18.2%) |
| 7:00 AM to 7:29 AM | 24 (16.4%) | 13 (10.7%) |
| 7:30 AM to 7:59 AM | 19 (13.0%) | 15 (12.4%) |
| 8:00 AM to 8:29 AM | 11 (7.5%) | 9 (7.4%) |
| 8:30 AM to 8:59 AM | 2 (1.4%) | 18 (14.9%) |
| 9:00 AM to 9:59 AM | 0 (0.0%) | 0 (0.0%) |
| 10:00 AM to 10:59 AM | 0 (0.0%) | 4 (3.3%) |
| 11:00 AM to 11:59 AM | 5 (3.4%) | 0 (0.0%) |
| 12:00 PM to 3:59 PM | 14 (9.6%) | 6 (5.0%) |
| 4:00 PM to 11:59 PM | 18 (12.3%) | 9 (7.4%) |
| Total | 146 (100.0%) | 121 (100.0%) |
Housing Occupancy in Viola
Occupancy by Ownership in Viola
Of the total 226 dwellings in Viola, owner-occupied units account for 176 (77.9%), while renter-occupied units make up 50 (22.1%).
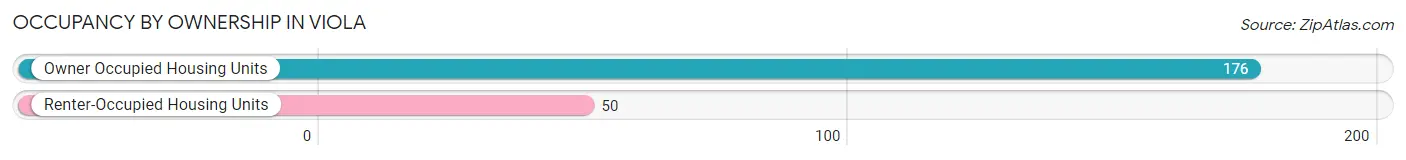
| Occupancy | # Housing Units | % Housing Units |
| Owner Occupied Housing Units | 176 | 77.9% |
| Renter-Occupied Housing Units | 50 | 22.1% |
| Total Occupied Housing Units | 226 | 100.0% |
Occupancy by Household Size in Viola
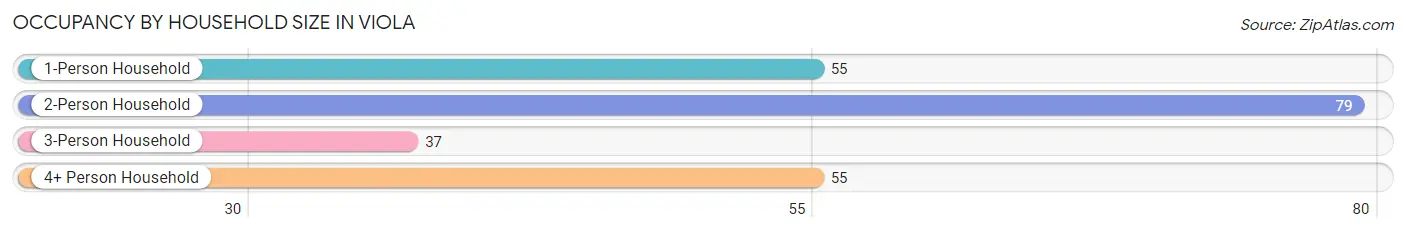
| Household Size | # Housing Units | % Housing Units |
| 1-Person Household | 55 | 24.3% |
| 2-Person Household | 79 | 35.0% |
| 3-Person Household | 37 | 16.4% |
| 4+ Person Household | 55 | 24.3% |
| Total Housing Units | 226 | 100.0% |
Occupancy by Ownership by Household Size in Viola
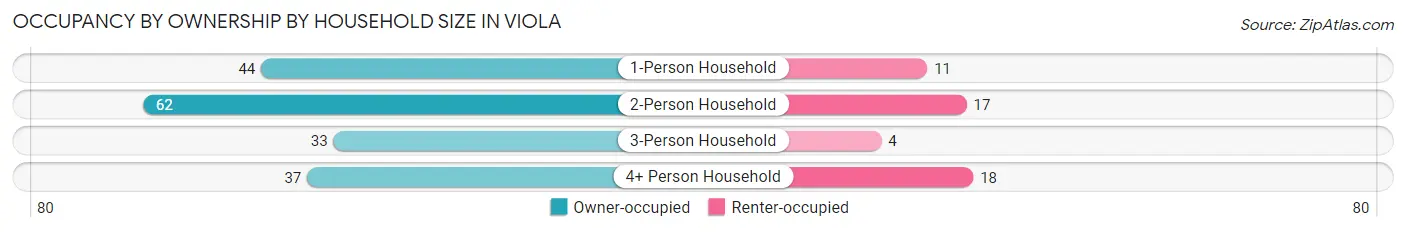
| Household Size | Owner-occupied | Renter-occupied |
| 1-Person Household | 44 (80.0%) | 11 (20.0%) |
| 2-Person Household | 62 (78.5%) | 17 (21.5%) |
| 3-Person Household | 33 (89.2%) | 4 (10.8%) |
| 4+ Person Household | 37 (67.3%) | 18 (32.7%) |
| Total Housing Units | 176 (77.9%) | 50 (22.1%) |
Occupancy by Educational Attainment in Viola
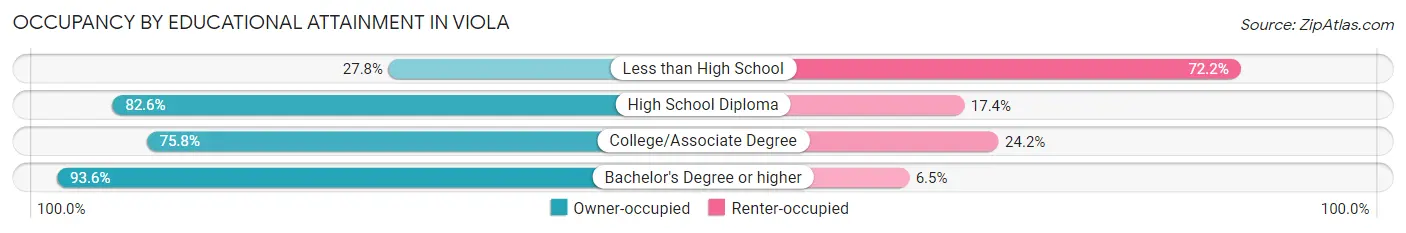
| Household Size | Owner-occupied | Renter-occupied |
| Less than High School | 5 (27.8%) | 13 (72.2%) |
| High School Diploma | 95 (82.6%) | 20 (17.4%) |
| College/Associate Degree | 47 (75.8%) | 15 (24.2%) |
| Bachelor's Degree or higher | 29 (93.5%) | 2 (6.5%) |
Occupancy by Age of Householder in Viola
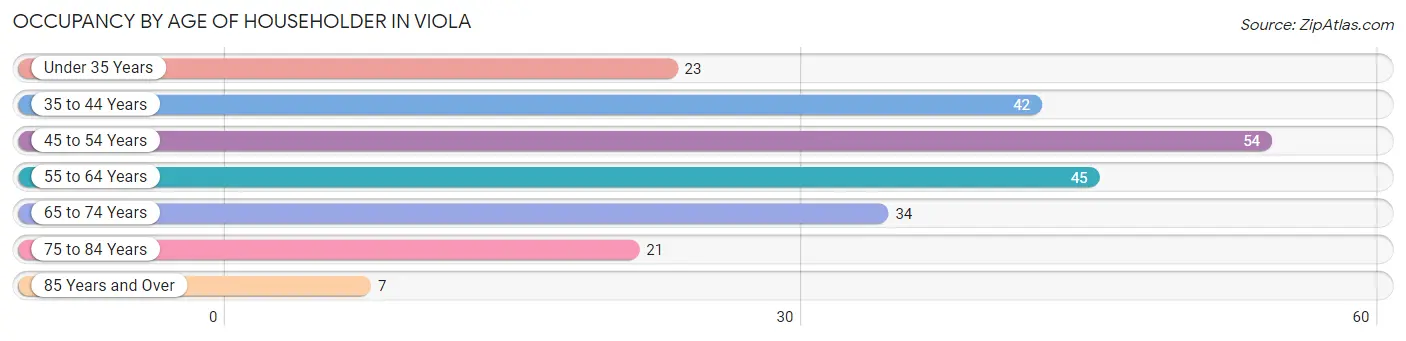
| Age Bracket | # Households | % Households |
| Under 35 Years | 23 | 10.2% |
| 35 to 44 Years | 42 | 18.6% |
| 45 to 54 Years | 54 | 23.9% |
| 55 to 64 Years | 45 | 19.9% |
| 65 to 74 Years | 34 | 15.0% |
| 75 to 84 Years | 21 | 9.3% |
| 85 Years and Over | 7 | 3.1% |
| Total | 226 | 100.0% |
Housing Finances in Viola
Median Income by Occupancy in Viola
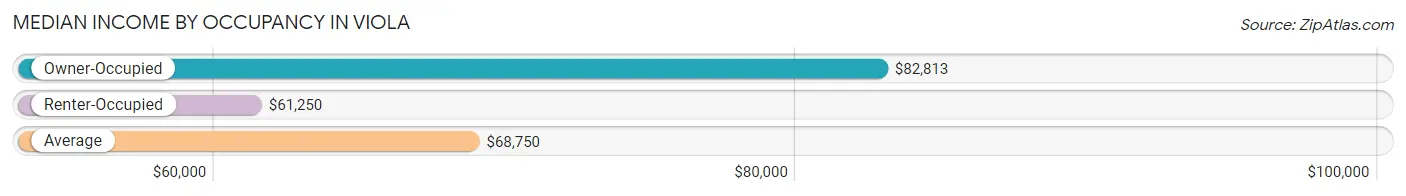
| Occupancy Type | # Households | Median Income |
| Owner-Occupied | 176 (77.9%) | $82,813 |
| Renter-Occupied | 50 (22.1%) | $61,250 |
| Average | 226 (100.0%) | $68,750 |
Occupancy by Householder Income Bracket in Viola
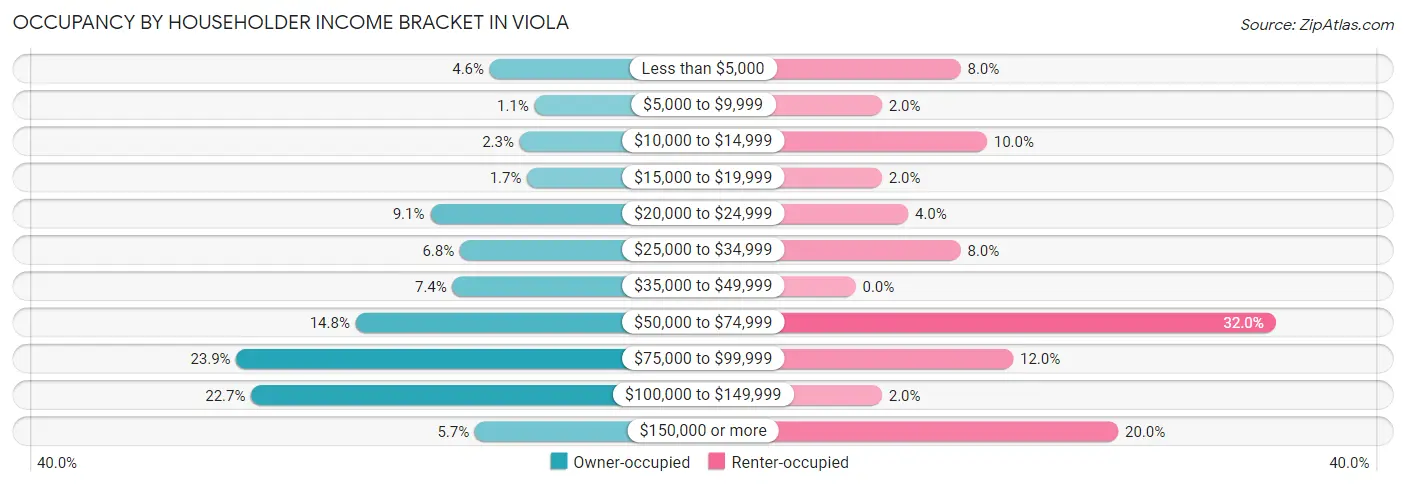
| Income Bracket | Owner-occupied | Renter-occupied |
| Less than $5,000 | 8 (4.5%) | 4 (8.0%) |
| $5,000 to $9,999 | 2 (1.1%) | 1 (2.0%) |
| $10,000 to $14,999 | 4 (2.3%) | 5 (10.0%) |
| $15,000 to $19,999 | 3 (1.7%) | 1 (2.0%) |
| $20,000 to $24,999 | 16 (9.1%) | 2 (4.0%) |
| $25,000 to $34,999 | 12 (6.8%) | 4 (8.0%) |
| $35,000 to $49,999 | 13 (7.4%) | 0 (0.0%) |
| $50,000 to $74,999 | 26 (14.8%) | 16 (32.0%) |
| $75,000 to $99,999 | 42 (23.9%) | 6 (12.0%) |
| $100,000 to $149,999 | 40 (22.7%) | 1 (2.0%) |
| $150,000 or more | 10 (5.7%) | 10 (20.0%) |
| Total | 176 (100.0%) | 50 (100.0%) |
Monthly Housing Cost Tiers in Viola
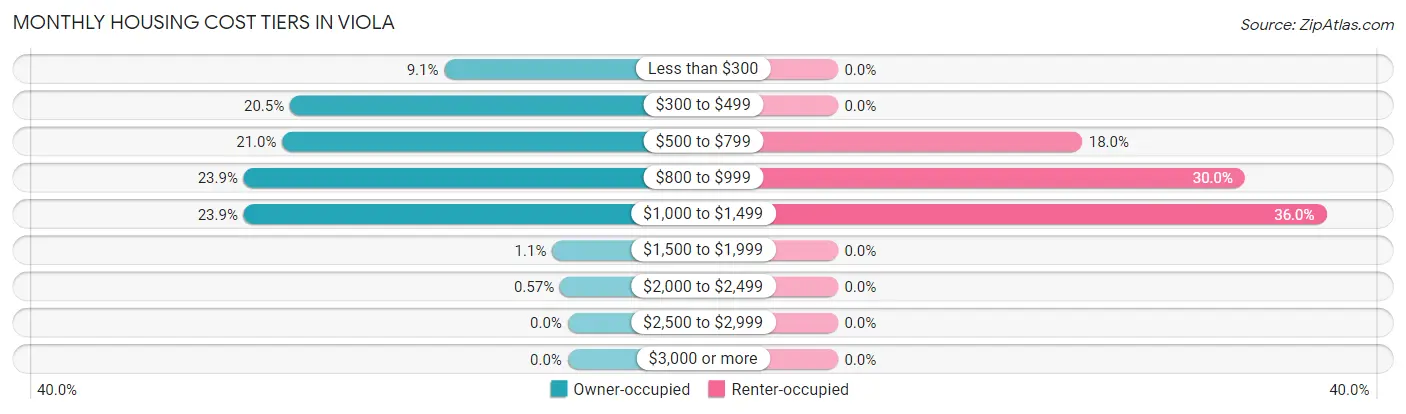
| Monthly Cost | Owner-occupied | Renter-occupied |
| Less than $300 | 16 (9.1%) | 0 (0.0%) |
| $300 to $499 | 36 (20.4%) | 0 (0.0%) |
| $500 to $799 | 37 (21.0%) | 9 (18.0%) |
| $800 to $999 | 42 (23.9%) | 15 (30.0%) |
| $1,000 to $1,499 | 42 (23.9%) | 18 (36.0%) |
| $1,500 to $1,999 | 2 (1.1%) | 0 (0.0%) |
| $2,000 to $2,499 | 1 (0.6%) | 0 (0.0%) |
| $2,500 to $2,999 | 0 (0.0%) | 0 (0.0%) |
| $3,000 or more | 0 (0.0%) | 0 (0.0%) |
| Total | 176 (100.0%) | 50 (100.0%) |
Physical Housing Characteristics in Viola
Housing Structures in Viola
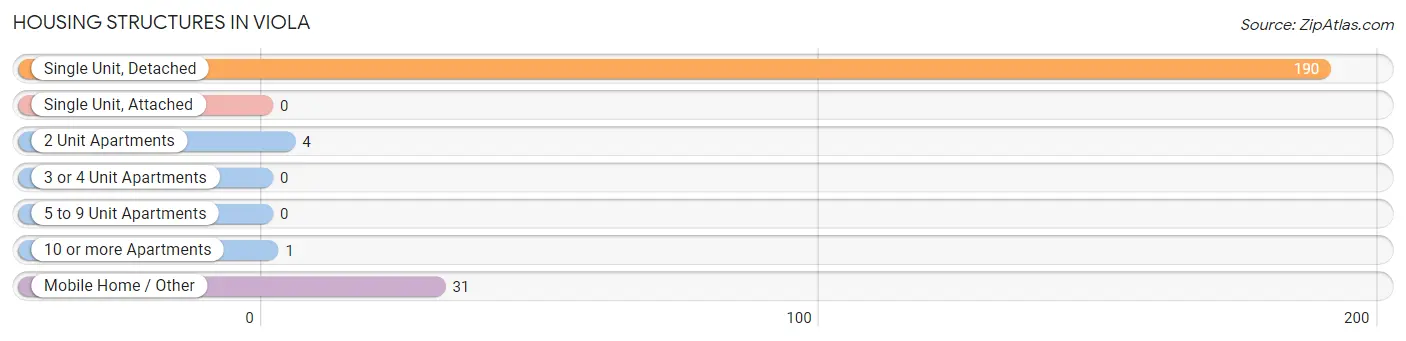
| Structure Type | # Housing Units | % Housing Units |
| Single Unit, Detached | 190 | 84.1% |
| Single Unit, Attached | 0 | 0.0% |
| 2 Unit Apartments | 4 | 1.8% |
| 3 or 4 Unit Apartments | 0 | 0.0% |
| 5 to 9 Unit Apartments | 0 | 0.0% |
| 10 or more Apartments | 1 | 0.4% |
| Mobile Home / Other | 31 | 13.7% |
| Total | 226 | 100.0% |
Housing Structures by Occupancy in Viola
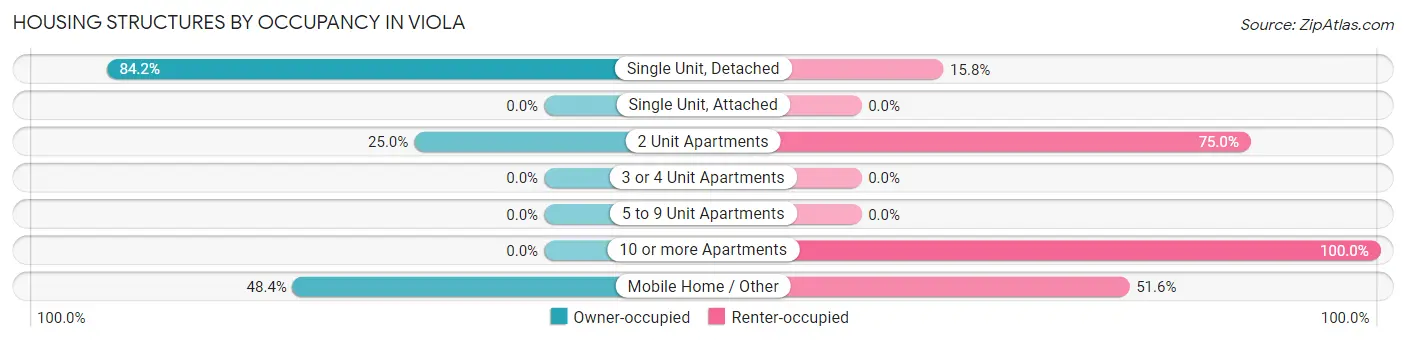
| Structure Type | Owner-occupied | Renter-occupied |
| Single Unit, Detached | 160 (84.2%) | 30 (15.8%) |
| Single Unit, Attached | 0 (0.0%) | 0 (0.0%) |
| 2 Unit Apartments | 1 (25.0%) | 3 (75.0%) |
| 3 or 4 Unit Apartments | 0 (0.0%) | 0 (0.0%) |
| 5 to 9 Unit Apartments | 0 (0.0%) | 0 (0.0%) |
| 10 or more Apartments | 0 (0.0%) | 1 (100.0%) |
| Mobile Home / Other | 15 (48.4%) | 16 (51.6%) |
| Total | 176 (77.9%) | 50 (22.1%) |
Housing Structures by Number of Rooms in Viola
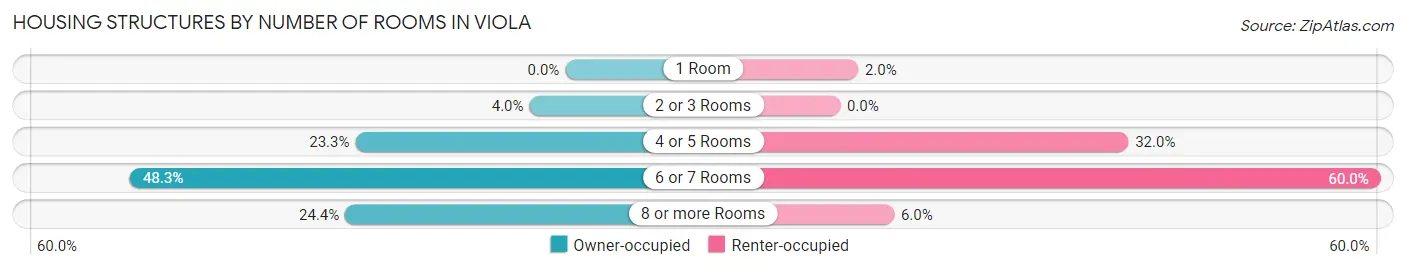
| Number of Rooms | Owner-occupied | Renter-occupied |
| 1 Room | 0 (0.0%) | 1 (2.0%) |
| 2 or 3 Rooms | 7 (4.0%) | 0 (0.0%) |
| 4 or 5 Rooms | 41 (23.3%) | 16 (32.0%) |
| 6 or 7 Rooms | 85 (48.3%) | 30 (60.0%) |
| 8 or more Rooms | 43 (24.4%) | 3 (6.0%) |
| Total | 176 (100.0%) | 50 (100.0%) |
Housing Structure by Heating Type in Viola
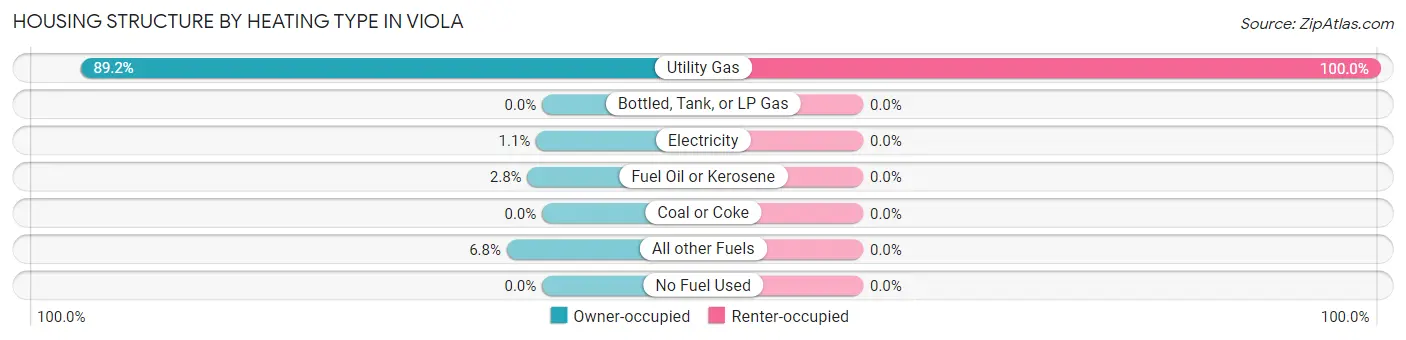
| Heating Type | Owner-occupied | Renter-occupied |
| Utility Gas | 157 (89.2%) | 50 (100.0%) |
| Bottled, Tank, or LP Gas | 0 (0.0%) | 0 (0.0%) |
| Electricity | 2 (1.1%) | 0 (0.0%) |
| Fuel Oil or Kerosene | 5 (2.8%) | 0 (0.0%) |
| Coal or Coke | 0 (0.0%) | 0 (0.0%) |
| All other Fuels | 12 (6.8%) | 0 (0.0%) |
| No Fuel Used | 0 (0.0%) | 0 (0.0%) |
| Total | 176 (100.0%) | 50 (100.0%) |
Household Vehicle Usage in Viola
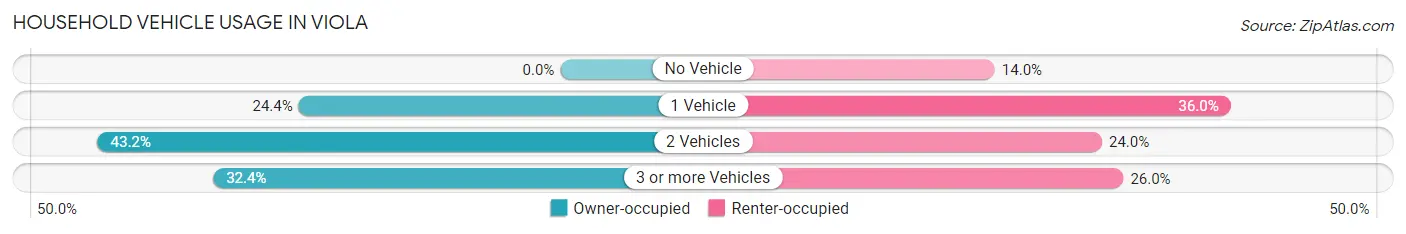
| Vehicles per Household | Owner-occupied | Renter-occupied |
| No Vehicle | 0 (0.0%) | 7 (14.0%) |
| 1 Vehicle | 43 (24.4%) | 18 (36.0%) |
| 2 Vehicles | 76 (43.2%) | 12 (24.0%) |
| 3 or more Vehicles | 57 (32.4%) | 13 (26.0%) |
| Total | 176 (100.0%) | 50 (100.0%) |
Real Estate & Mortgages in Viola
Real Estate and Mortgage Overview in Viola
| Characteristic | Without Mortgage | With Mortgage |
| Housing Units | 77 | 99 |
| Median Property Value | $79,000 | $98,600 |
| Median Household Income | $69,063 | $8 |
| Monthly Housing Costs | $444 | $0 |
| Real Estate Taxes | $1,190 | $0 |
Property Value by Mortgage Status in Viola
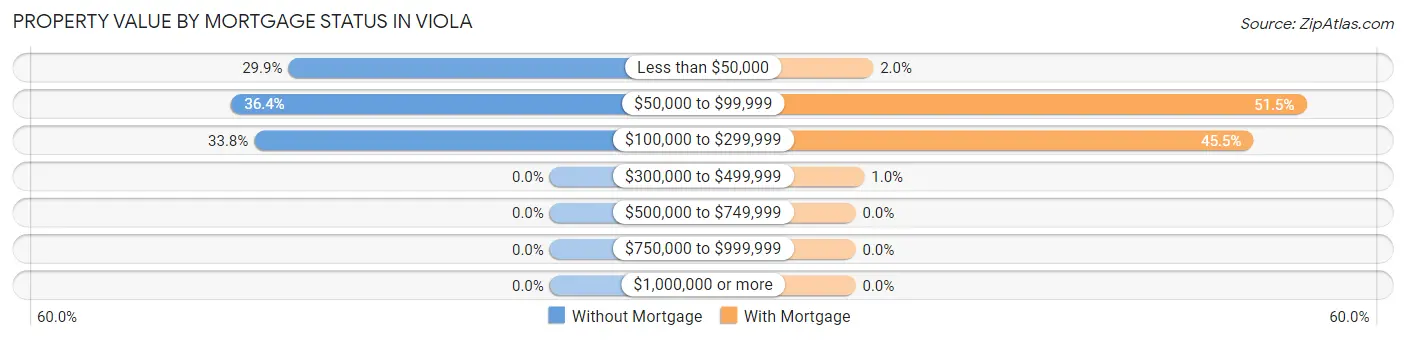
| Property Value | Without Mortgage | With Mortgage |
| Less than $50,000 | 23 (29.9%) | 2 (2.0%) |
| $50,000 to $99,999 | 28 (36.4%) | 51 (51.5%) |
| $100,000 to $299,999 | 26 (33.8%) | 45 (45.5%) |
| $300,000 to $499,999 | 0 (0.0%) | 1 (1.0%) |
| $500,000 to $749,999 | 0 (0.0%) | 0 (0.0%) |
| $750,000 to $999,999 | 0 (0.0%) | 0 (0.0%) |
| $1,000,000 or more | 0 (0.0%) | 0 (0.0%) |
| Total | 77 (100.0%) | 99 (100.0%) |
Household Income by Mortgage Status in Viola
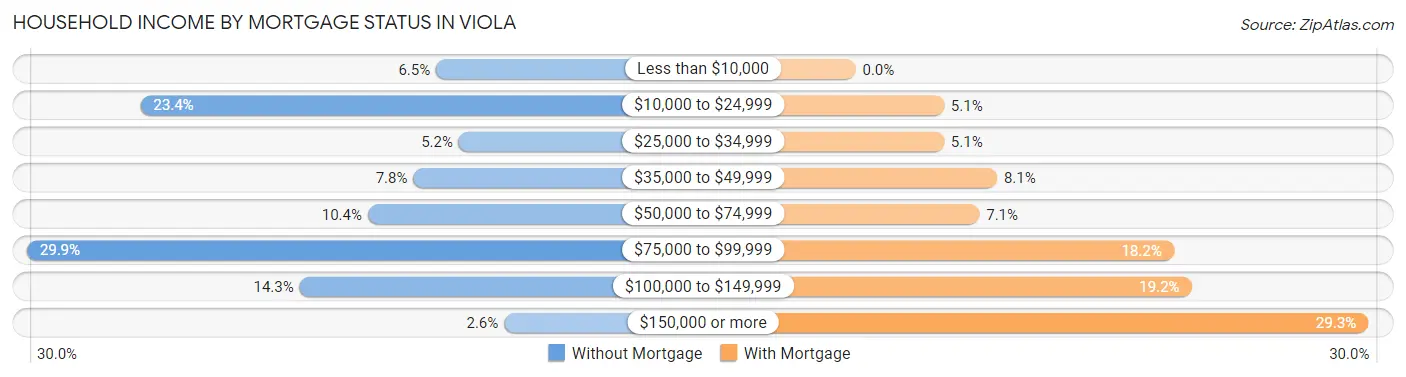
| Household Income | Without Mortgage | With Mortgage |
| Less than $10,000 | 5 (6.5%) | 0 (0.0%) |
| $10,000 to $24,999 | 18 (23.4%) | 5 (5.1%) |
| $25,000 to $34,999 | 4 (5.2%) | 5 (5.1%) |
| $35,000 to $49,999 | 6 (7.8%) | 8 (8.1%) |
| $50,000 to $74,999 | 8 (10.4%) | 7 (7.1%) |
| $75,000 to $99,999 | 23 (29.9%) | 18 (18.2%) |
| $100,000 to $149,999 | 11 (14.3%) | 19 (19.2%) |
| $150,000 or more | 2 (2.6%) | 29 (29.3%) |
| Total | 77 (100.0%) | 99 (100.0%) |
Property Value to Household Income Ratio in Viola
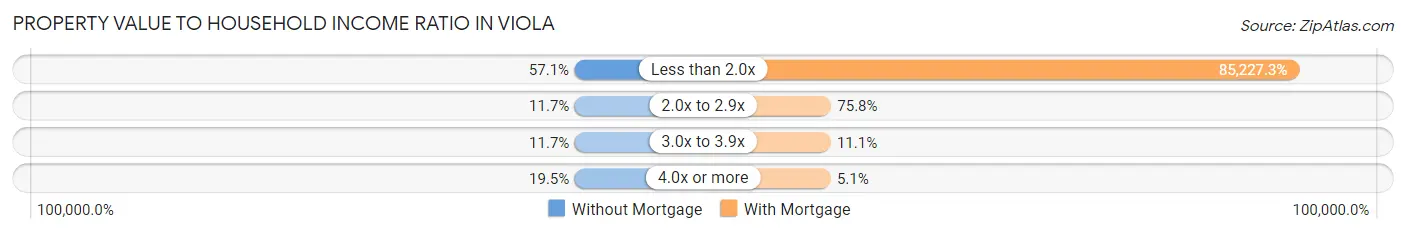
| Value-to-Income Ratio | Without Mortgage | With Mortgage |
| Less than 2.0x | 44 (57.1%) | 84,375 (85,227.3%) |
| 2.0x to 2.9x | 9 (11.7%) | 75 (75.8%) |
| 3.0x to 3.9x | 9 (11.7%) | 11 (11.1%) |
| 4.0x or more | 15 (19.5%) | 5 (5.1%) |
| Total | 77 (100.0%) | 99 (100.0%) |
Real Estate Taxes by Mortgage Status in Viola
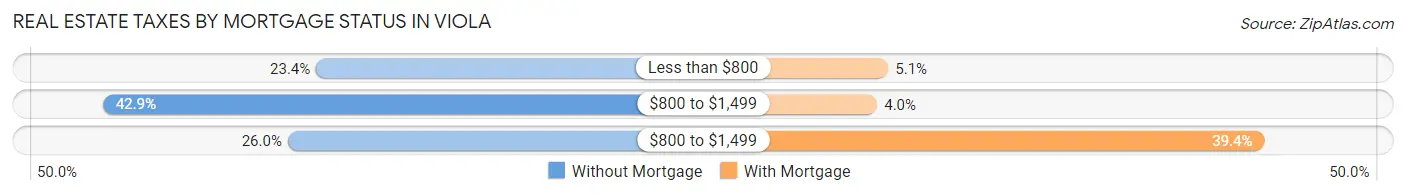
| Property Taxes | Without Mortgage | With Mortgage |
| Less than $800 | 18 (23.4%) | 5 (5.1%) |
| $800 to $1,499 | 33 (42.9%) | 4 (4.0%) |
| $800 to $1,499 | 20 (26.0%) | 39 (39.4%) |
| Total | 77 (100.0%) | 99 (100.0%) |
Health & Disability in Viola
Health Insurance Coverage by Age in Viola
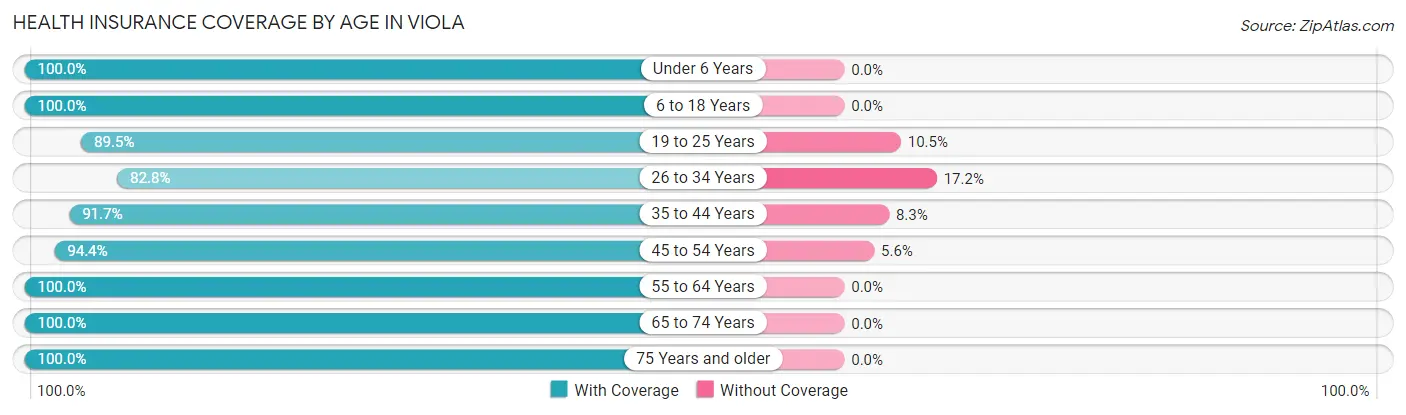
| Age Bracket | With Coverage | Without Coverage |
| Under 6 Years | 33 (100.0%) | 0 (0.0%) |
| 6 to 18 Years | 108 (100.0%) | 0 (0.0%) |
| 19 to 25 Years | 51 (89.5%) | 6 (10.5%) |
| 26 to 34 Years | 24 (82.8%) | 5 (17.2%) |
| 35 to 44 Years | 99 (91.7%) | 9 (8.3%) |
| 45 to 54 Years | 68 (94.4%) | 4 (5.6%) |
| 55 to 64 Years | 74 (100.0%) | 0 (0.0%) |
| 65 to 74 Years | 47 (100.0%) | 0 (0.0%) |
| 75 Years and older | 47 (100.0%) | 0 (0.0%) |
| Total | 551 (95.8%) | 24 (4.2%) |
Health Insurance Coverage by Citizenship Status in Viola
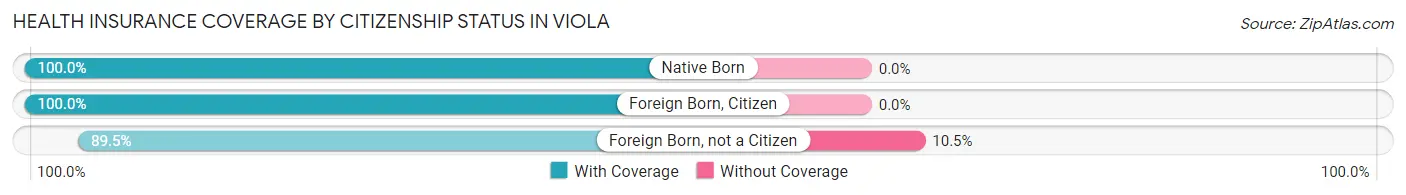
| Citizenship Status | With Coverage | Without Coverage |
| Native Born | 33 (100.0%) | 0 (0.0%) |
| Foreign Born, Citizen | 108 (100.0%) | 0 (0.0%) |
| Foreign Born, not a Citizen | 51 (89.5%) | 6 (10.5%) |
Health Insurance Coverage by Household Income in Viola
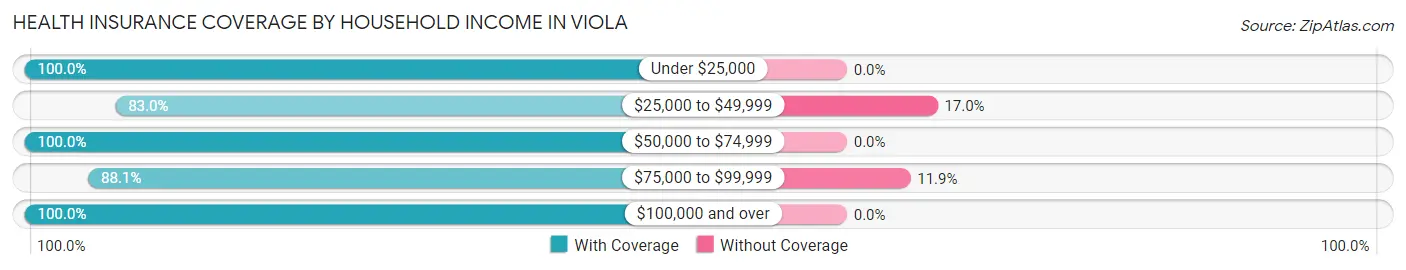
| Household Income | With Coverage | Without Coverage |
| Under $25,000 | 76 (100.0%) | 0 (0.0%) |
| $25,000 to $49,999 | 44 (83.0%) | 9 (17.0%) |
| $50,000 to $74,999 | 120 (100.0%) | 0 (0.0%) |
| $75,000 to $99,999 | 111 (88.1%) | 15 (11.9%) |
| $100,000 and over | 200 (100.0%) | 0 (0.0%) |
Public vs Private Health Insurance Coverage by Age in Viola
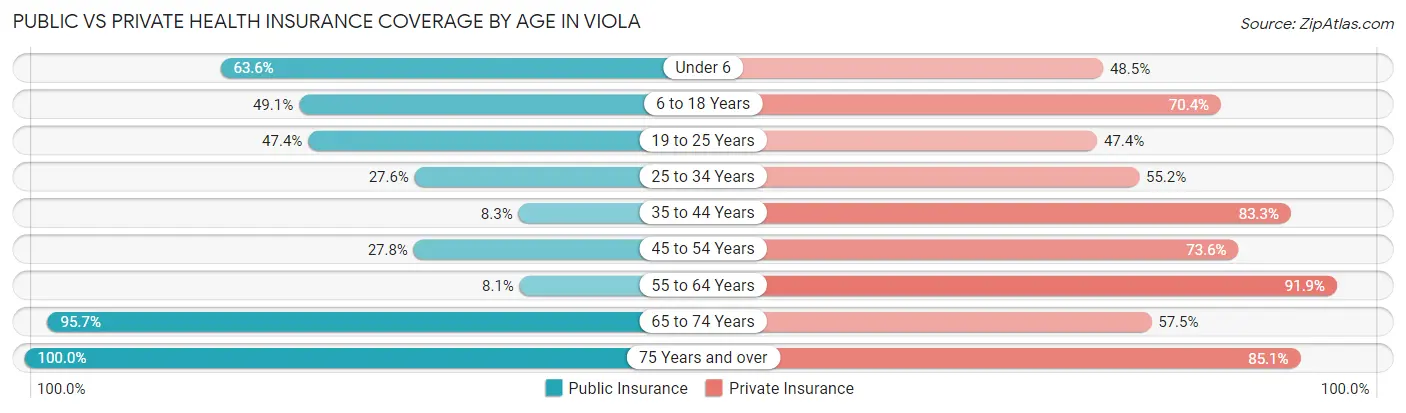
| Age Bracket | Public Insurance | Private Insurance |
| Under 6 | 21 (63.6%) | 16 (48.5%) |
| 6 to 18 Years | 53 (49.1%) | 76 (70.4%) |
| 19 to 25 Years | 27 (47.4%) | 27 (47.4%) |
| 25 to 34 Years | 8 (27.6%) | 16 (55.2%) |
| 35 to 44 Years | 9 (8.3%) | 90 (83.3%) |
| 45 to 54 Years | 20 (27.8%) | 53 (73.6%) |
| 55 to 64 Years | 6 (8.1%) | 68 (91.9%) |
| 65 to 74 Years | 45 (95.7%) | 27 (57.5%) |
| 75 Years and over | 47 (100.0%) | 40 (85.1%) |
| Total | 236 (41.0%) | 413 (71.8%) |
Disability Status by Sex by Age in Viola
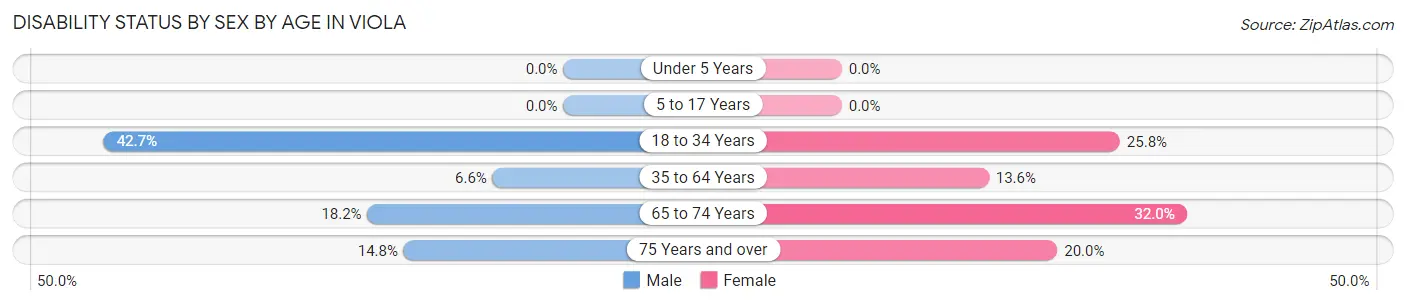
| Age Bracket | Male | Female |
| Under 5 Years | 0 (0.0%) | 0 (0.0%) |
| 5 to 17 Years | 0 (0.0%) | 0 (0.0%) |
| 18 to 34 Years | 29 (42.6%) | 8 (25.8%) |
| 35 to 64 Years | 8 (6.6%) | 18 (13.6%) |
| 65 to 74 Years | 4 (18.2%) | 8 (32.0%) |
| 75 Years and over | 4 (14.8%) | 4 (20.0%) |
Disability Class by Sex by Age in Viola
Disability Class: Hearing Difficulty
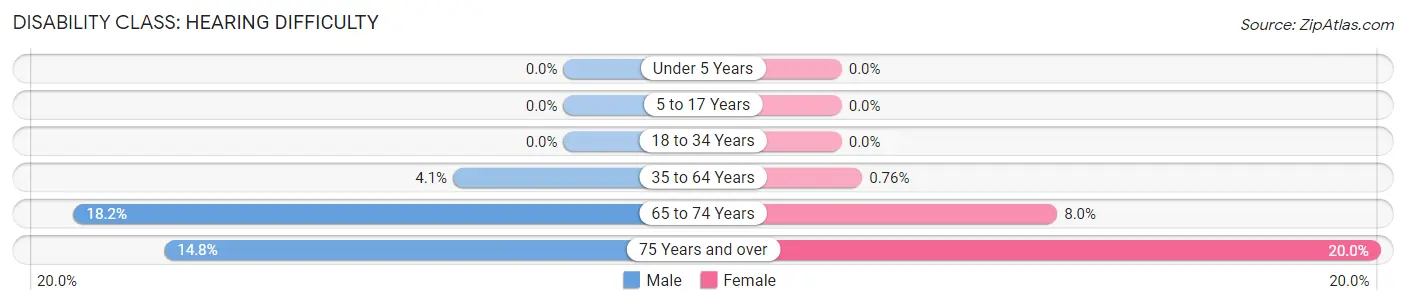
| Age Bracket | Male | Female |
| Under 5 Years | 0 (0.0%) | 0 (0.0%) |
| 5 to 17 Years | 0 (0.0%) | 0 (0.0%) |
| 18 to 34 Years | 0 (0.0%) | 0 (0.0%) |
| 35 to 64 Years | 5 (4.1%) | 1 (0.8%) |
| 65 to 74 Years | 4 (18.2%) | 2 (8.0%) |
| 75 Years and over | 4 (14.8%) | 4 (20.0%) |
Disability Class: Vision Difficulty
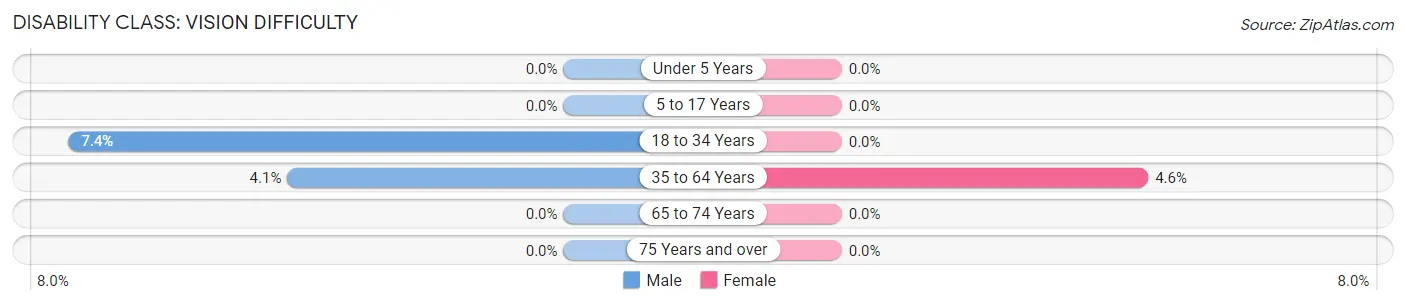
| Age Bracket | Male | Female |
| Under 5 Years | 0 (0.0%) | 0 (0.0%) |
| 5 to 17 Years | 0 (0.0%) | 0 (0.0%) |
| 18 to 34 Years | 5 (7.3%) | 0 (0.0%) |
| 35 to 64 Years | 5 (4.1%) | 6 (4.5%) |
| 65 to 74 Years | 0 (0.0%) | 0 (0.0%) |
| 75 Years and over | 0 (0.0%) | 0 (0.0%) |
Disability Class: Cognitive Difficulty
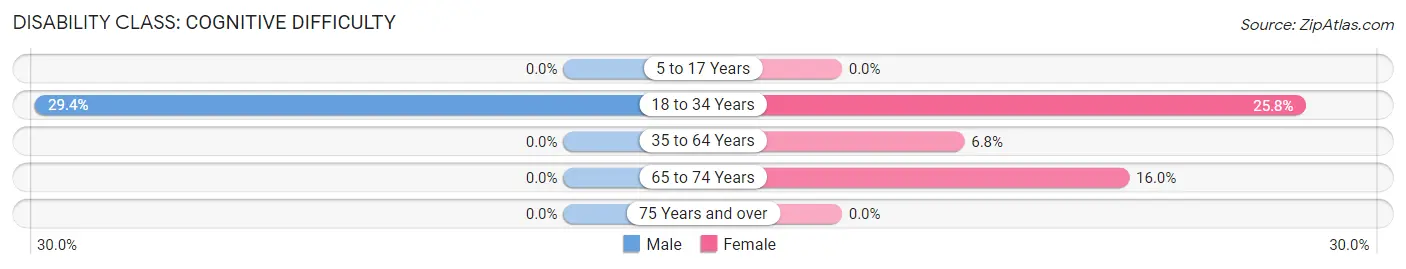
| Age Bracket | Male | Female |
| 5 to 17 Years | 0 (0.0%) | 0 (0.0%) |
| 18 to 34 Years | 20 (29.4%) | 8 (25.8%) |
| 35 to 64 Years | 0 (0.0%) | 9 (6.8%) |
| 65 to 74 Years | 0 (0.0%) | 4 (16.0%) |
| 75 Years and over | 0 (0.0%) | 0 (0.0%) |
Disability Class: Ambulatory Difficulty
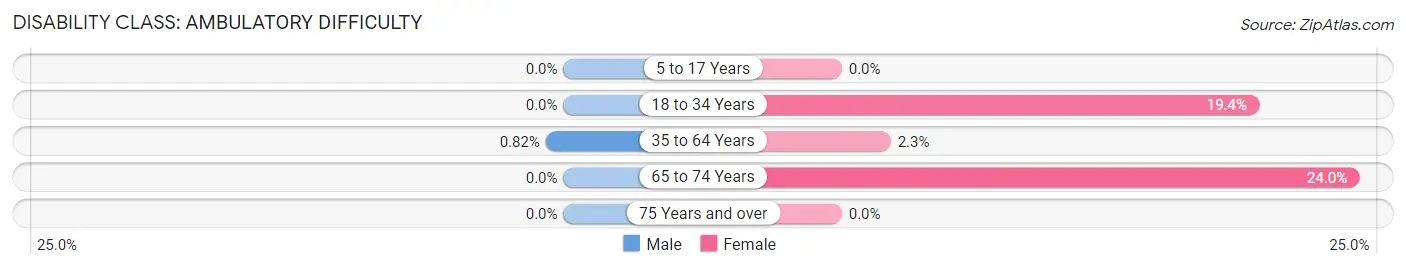
| Age Bracket | Male | Female |
| 5 to 17 Years | 0 (0.0%) | 0 (0.0%) |
| 18 to 34 Years | 0 (0.0%) | 6 (19.4%) |
| 35 to 64 Years | 1 (0.8%) | 3 (2.3%) |
| 65 to 74 Years | 0 (0.0%) | 6 (24.0%) |
| 75 Years and over | 0 (0.0%) | 0 (0.0%) |
Disability Class: Self-Care Difficulty
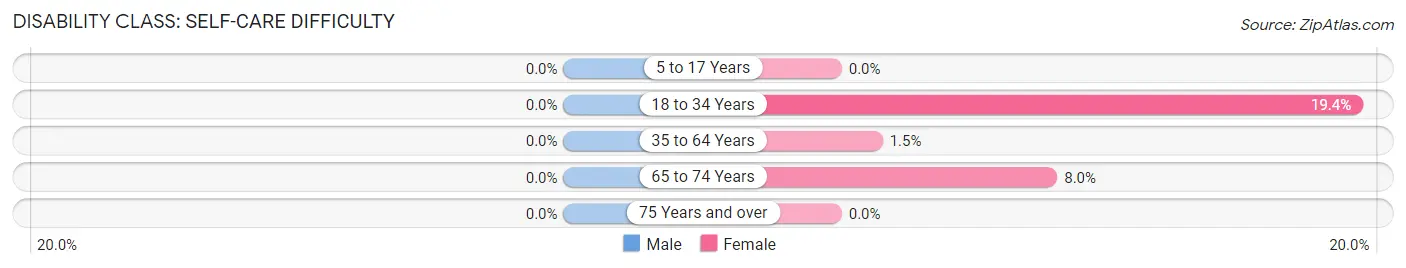
| Age Bracket | Male | Female |
| 5 to 17 Years | 0 (0.0%) | 0 (0.0%) |
| 18 to 34 Years | 0 (0.0%) | 6 (19.4%) |
| 35 to 64 Years | 0 (0.0%) | 2 (1.5%) |
| 65 to 74 Years | 0 (0.0%) | 2 (8.0%) |
| 75 Years and over | 0 (0.0%) | 0 (0.0%) |
Technology Access in Viola
Computing Device Access in Viola
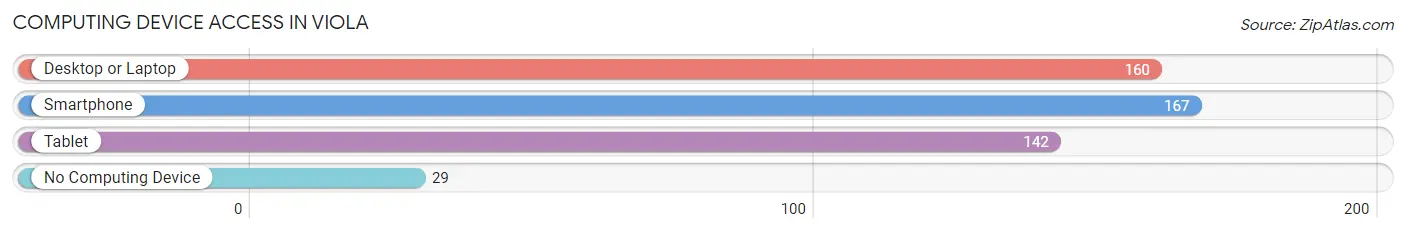
| Device Type | # Households | % Households |
| Desktop or Laptop | 160 | 70.8% |
| Smartphone | 167 | 73.9% |
| Tablet | 142 | 62.8% |
| No Computing Device | 29 | 12.8% |
| Total | 226 | 100.0% |
Internet Access in Viola
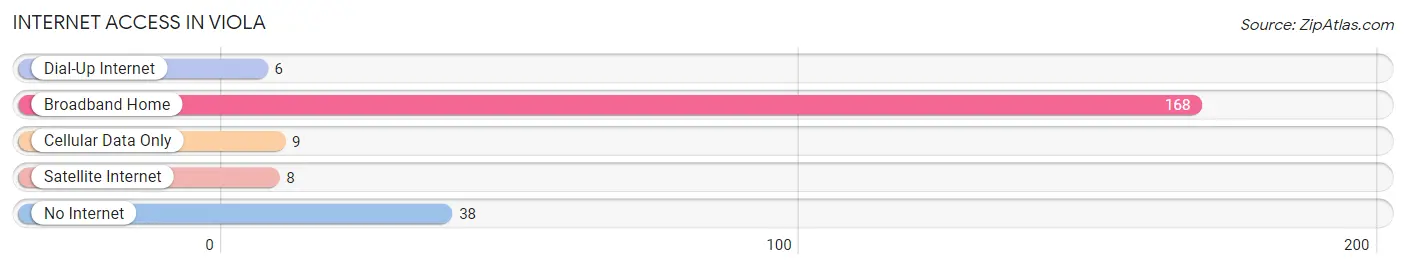
| Internet Type | # Households | % Households |
| Dial-Up Internet | 6 | 2.6% |
| Broadband Home | 168 | 74.3% |
| Cellular Data Only | 9 | 4.0% |
| Satellite Internet | 8 | 3.5% |
| No Internet | 38 | 16.8% |
| Total | 226 | 100.0% |
Viola Summary
Viola is a small village located in Richland County, Wisconsin, United States. The village is situated on the banks of the Pine River, a tributary of the Wisconsin River. The population of Viola was 545 at the 2010 census.
History
Viola was founded in 1856 by a group of settlers from New York. The village was named after the daughter of one of the settlers, Viola Smith. The settlers built a sawmill and a gristmill on the banks of the Pine River, and the village quickly grew. By the late 19th century, Viola had become a thriving community with a variety of businesses, including a general store, a blacksmith shop, a hotel, and a post office.
In the early 20th century, Viola was a popular tourist destination, with visitors coming to enjoy the scenic beauty of the Pine River. The village also had a thriving agricultural industry, with dairy farms and orchards producing apples, pears, and other fruits.
Geography
Viola is located at 43°25'17" North, 90°37'45" West (43.4214, -90.6292). The village is situated on the banks of the Pine River, a tributary of the Wisconsin River. The village is located in the Driftless Area, a region of Wisconsin that was not glaciated during the last ice age. The area is characterized by rolling hills and valleys, and is home to a variety of wildlife.
Economy
Viola's economy is largely based on agriculture and tourism. The village is home to several dairy farms, as well as orchards that produce apples, pears, and other fruits. The village also has a variety of small businesses, including a general store, a hardware store, and a restaurant.
Tourism is an important part of the local economy, with visitors coming to enjoy the scenic beauty of the Pine River. The village is also home to a variety of outdoor activities, including fishing, hunting, and camping.
Demographics
As of the 2010 census, the population of Viola was 545. The racial makeup of the village was 97.3% White, 0.2% African American, 0.2% Native American, 0.2% Asian, 0.4% from other races, and 1.7% from two or more races. Hispanic or Latino of any race were 1.3% of the population.
The median household income in Viola was $45,000, and the median family income was $50,000. The per capita income for the village was $20,000. About 8.3% of families and 10.2% of the population were below the poverty line, including 14.3% of those under age 18 and 5.3% of those age 65 or over.
Common Questions
What is Per Capita Income in Viola?
Per Capita income in Viola is $29,321.
What is the Median Family Income in Viola?
Median Family Income in Viola is $88,214.
What is the Median Household income in Viola?
Median Household Income in Viola is $68,750.
What is Income or Wage Gap in Viola?
Income or Wage Gap in Viola is 36.7%.
Women in Viola earn 63.3 cents for every dollar earned by a man.
What is Family Income Deficit in Viola?
Family Income Deficit in Viola is $18,209.
Families that are below poverty line in Viola earn $18,209 less on average than the poverty threshold level.
What is Inequality or Gini Index in Viola?
Inequality or Gini Index in Viola is 0.37.
What is the Total Population of Viola?
Total Population of Viola is 575.
What is the Total Male Population of Viola?
Total Male Population of Viola is 313.
What is the Total Female Population of Viola?
Total Female Population of Viola is 262.
What is the Ratio of Males per 100 Females in Viola?
There are 119.47 Males per 100 Females in Viola.
What is the Ratio of Females per 100 Males in Viola?
There are 83.71 Females per 100 Males in Viola.
What is the Median Population Age in Viola?
Median Population Age in Viola is 39.6 Years.
What is the Average Family Size in Viola
Average Family Size in Viola is 3.0 People.
What is the Average Household Size in Viola
Average Household Size in Viola is 2.5 People.
How Large is the Labor Force in Viola?
There are 302 People in the Labor Forcein in Viola.
What is the Percentage of People in the Labor Force in Viola?
65.4% of People are in the Labor Force in Viola.
What is the Unemployment Rate in Viola?
Unemployment Rate in Viola is 3.3%.