Trempealeau, WI Map & Demographics
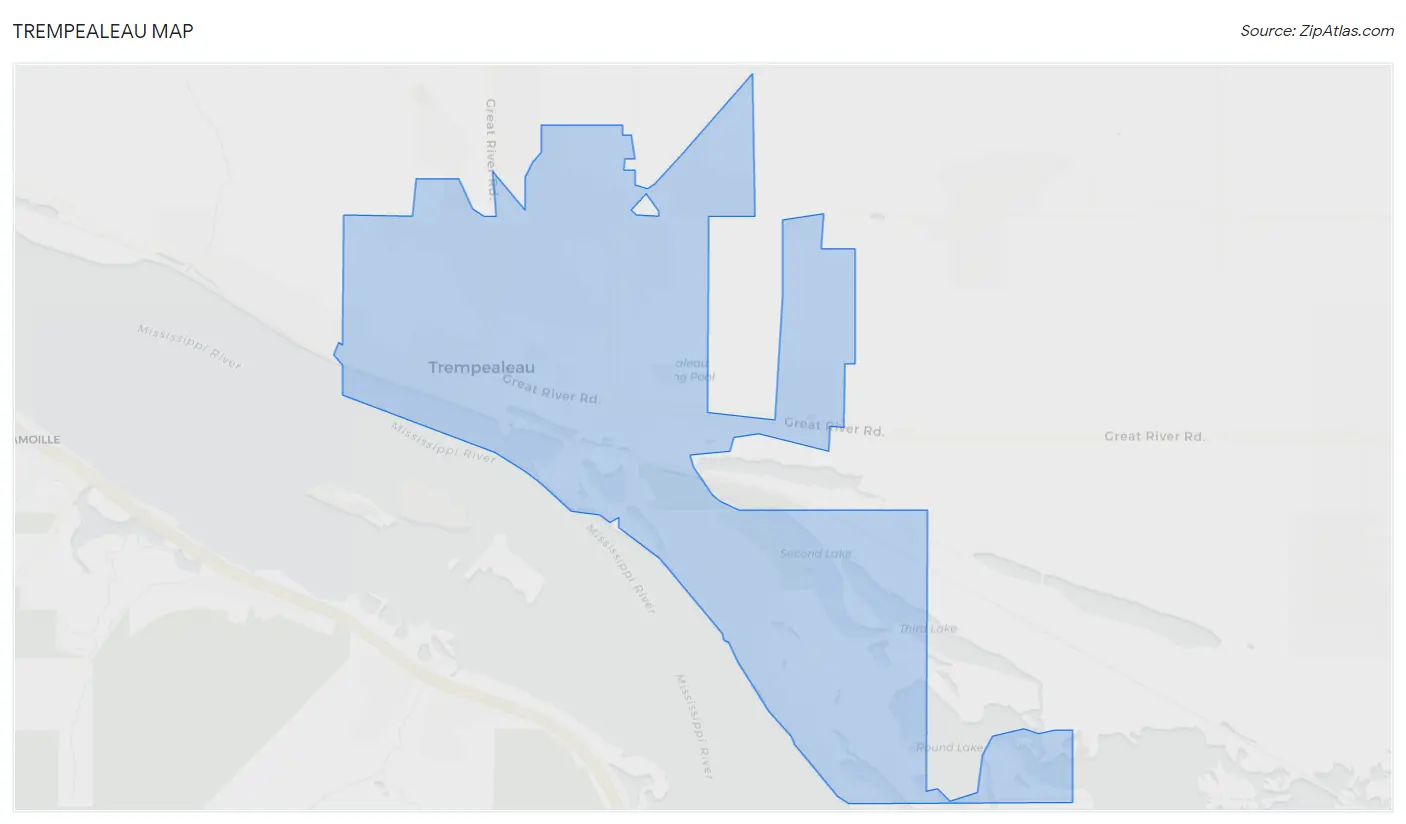
Trempealeau Map
Trempealeau Overview
$35,113
PER CAPITA INCOME
$92,000
AVG FAMILY INCOME
$62,115
AVG HOUSEHOLD INCOME
23.6%
WAGE / INCOME GAP [ % ]
76.4¢/ $1
WAGE / INCOME GAP [ $ ]
0.38
INEQUALITY / GINI INDEX
1,769
TOTAL POPULATION
775
MALE POPULATION
994
FEMALE POPULATION
77.97
MALES / 100 FEMALES
128.26
FEMALES / 100 MALES
46.5
MEDIAN AGE
3.1
AVG FAMILY SIZE
2.2
AVG HOUSEHOLD SIZE
958
LABOR FORCE [ PEOPLE ]
64.8%
PERCENT IN LABOR FORCE
2.1%
UNEMPLOYMENT RATE
Trempealeau Zip Codes
Trempealeau Area Codes
Income in Trempealeau
Income Overview in Trempealeau
Per Capita Income in Trempealeau is $35,113, while median incomes of families and households are $92,000 and $62,115 respectively.
| Characteristic | Number | Measure |
| Per Capita Income | 1,769 | $35,113 |
| Median Family Income | 430 | $92,000 |
| Mean Family Income | 430 | $103,773 |
| Median Household Income | 806 | $62,115 |
| Mean Household Income | 806 | $77,150 |
| Income Deficit | 430 | $0 |
| Wage / Income Gap (%) | 1,769 | 23.60% |
| Wage / Income Gap ($) | 1,769 | 76.40¢ per $1 |
| Gini / Inequality Index | 1,769 | 0.38 |
Earnings by Sex in Trempealeau
Average Earnings in Trempealeau are $33,973, $40,789 for men and $31,161 for women, a difference of 23.6%.
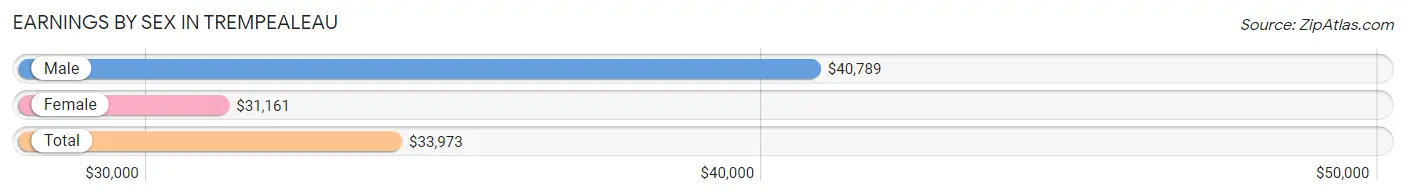
| Sex | Number | Average Earnings |
| Male | 480 (44.8%) | $40,789 |
| Female | 592 (55.2%) | $31,161 |
| Total | 1,072 (100.0%) | $33,973 |
Earnings by Sex by Income Bracket in Trempealeau
The most common earnings brackets in Trempealeau are $75,000 to $99,999 for men (58 | 12.1%) and $30,000 to $34,999 for women (80 | 13.5%).
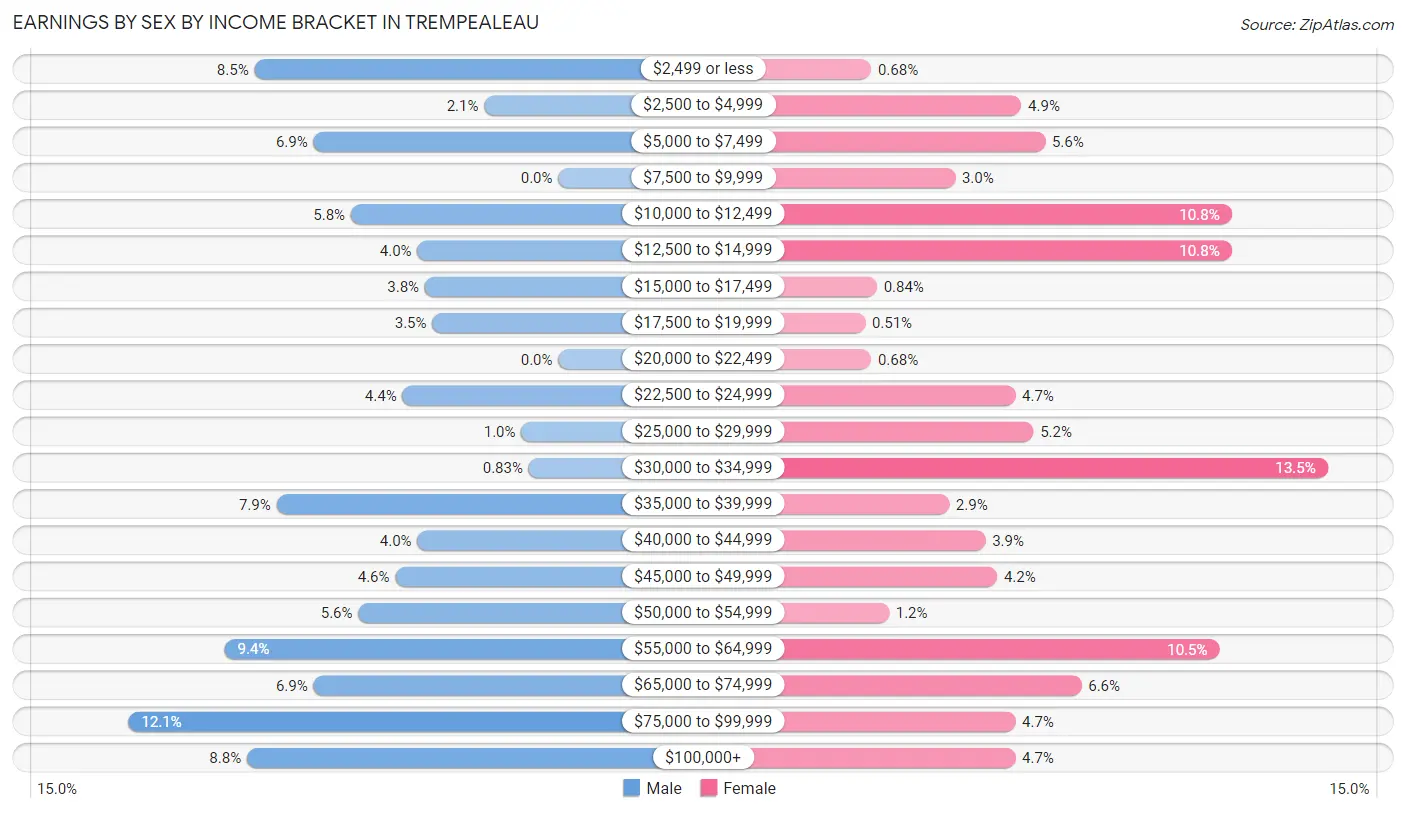
| Income | Male | Female |
| $2,499 or less | 41 (8.5%) | 4 (0.7%) |
| $2,500 to $4,999 | 10 (2.1%) | 29 (4.9%) |
| $5,000 to $7,499 | 33 (6.9%) | 33 (5.6%) |
| $7,500 to $9,999 | 0 (0.0%) | 18 (3.0%) |
| $10,000 to $12,499 | 28 (5.8%) | 64 (10.8%) |
| $12,500 to $14,999 | 19 (4.0%) | 64 (10.8%) |
| $15,000 to $17,499 | 18 (3.7%) | 5 (0.8%) |
| $17,500 to $19,999 | 17 (3.5%) | 3 (0.5%) |
| $20,000 to $22,499 | 0 (0.0%) | 4 (0.7%) |
| $22,500 to $24,999 | 21 (4.4%) | 28 (4.7%) |
| $25,000 to $29,999 | 5 (1.0%) | 31 (5.2%) |
| $30,000 to $34,999 | 4 (0.8%) | 80 (13.5%) |
| $35,000 to $39,999 | 38 (7.9%) | 17 (2.9%) |
| $40,000 to $44,999 | 19 (4.0%) | 23 (3.9%) |
| $45,000 to $49,999 | 22 (4.6%) | 25 (4.2%) |
| $50,000 to $54,999 | 27 (5.6%) | 7 (1.2%) |
| $55,000 to $64,999 | 45 (9.4%) | 62 (10.5%) |
| $65,000 to $74,999 | 33 (6.9%) | 39 (6.6%) |
| $75,000 to $99,999 | 58 (12.1%) | 28 (4.7%) |
| $100,000+ | 42 (8.7%) | 28 (4.7%) |
| Total | 480 (100.0%) | 592 (100.0%) |
Earnings by Sex by Educational Attainment in Trempealeau
Average earnings in Trempealeau are $47,266 for men and $38,942 for women, a difference of 17.6%. Men with an educational attainment of graduate degree enjoy the highest average annual earnings of $95,833, while those with high school diploma education earn the least with $36,179. Women with an educational attainment of graduate degree earn the most with the average annual earnings of $56,429, while those with high school diploma education have the smallest earnings of $31,667.
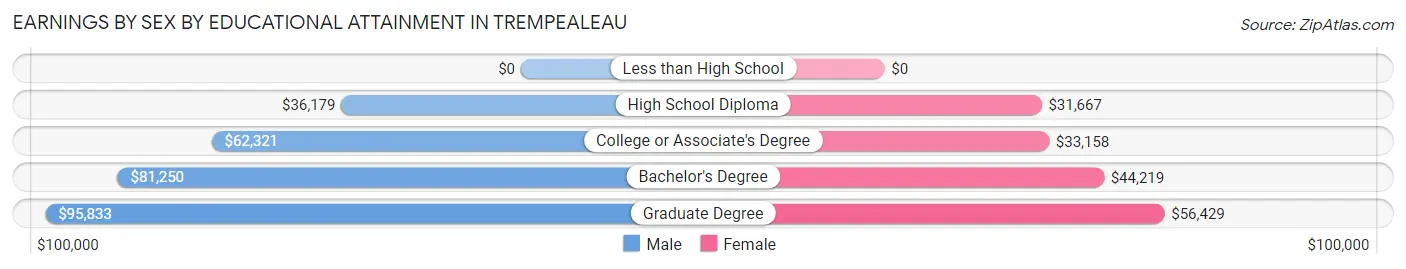
| Educational Attainment | Male Income | Female Income |
| Less than High School | - | - |
| High School Diploma | $36,179 | $31,667 |
| College or Associate's Degree | $62,321 | $33,158 |
| Bachelor's Degree | $81,250 | $44,219 |
| Graduate Degree | $95,833 | $56,429 |
| Total | $47,266 | $38,942 |
Family Income in Trempealeau
Family Income Brackets in Trempealeau
According to the Trempealeau family income data, there are 112 families falling into the $100,000 to $149,999 income range, which is the most common income bracket and makes up 26.1% of all families.
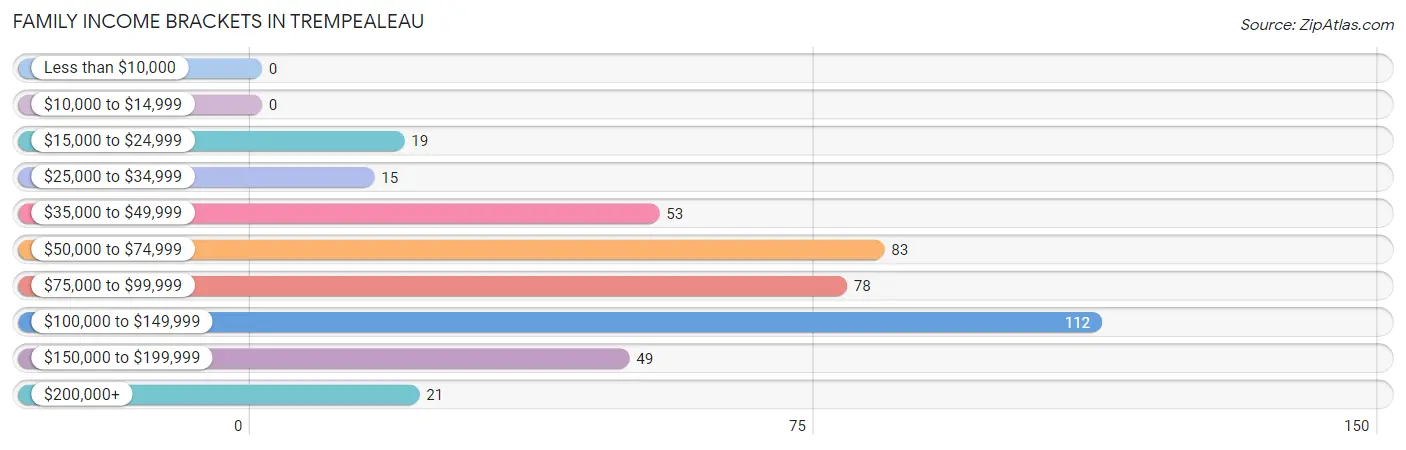
| Income Bracket | # Families | % Families |
| Less than $10,000 | 0 | 0.0% |
| $10,000 to $14,999 | 0 | 0.0% |
| $15,000 to $24,999 | 19 | 4.4% |
| $25,000 to $34,999 | 15 | 3.5% |
| $35,000 to $49,999 | 53 | 12.3% |
| $50,000 to $74,999 | 83 | 19.3% |
| $75,000 to $99,999 | 78 | 18.1% |
| $100,000 to $149,999 | 112 | 26.0% |
| $150,000 to $199,999 | 49 | 11.4% |
| $200,000+ | 21 | 4.9% |
Family Income by Famaliy Size in Trempealeau
3-person families (71 | 16.5%) account for the highest median family income in Trempealeau with $156,750 per family, while 3-person families (71 | 16.5%) have the highest median income of $52,250 per family member.
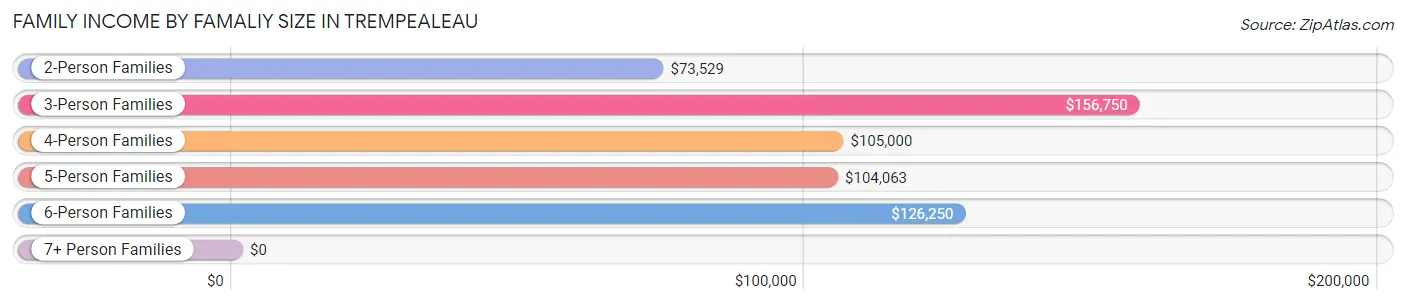
| Income Bracket | # Families | Median Income |
| 2-Person Families | 246 (57.2%) | $73,529 |
| 3-Person Families | 71 (16.5%) | $156,750 |
| 4-Person Families | 70 (16.3%) | $105,000 |
| 5-Person Families | 27 (6.3%) | $104,063 |
| 6-Person Families | 16 (3.7%) | $126,250 |
| 7+ Person Families | 0 (0.0%) | $0 |
| Total | 430 (100.0%) | $92,000 |
Family Income by Number of Earners in Trempealeau
The median family income in Trempealeau is $92,000, with families comprising 3+ earners (92) having the highest median family income of $110,000, while families with no earners (85) have the lowest median family income of $55,234, accounting for 21.4% and 19.8% of families, respectively.
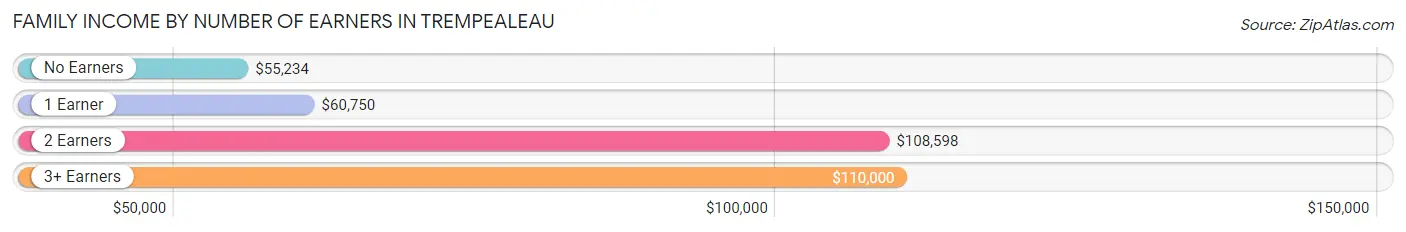
| Number of Earners | # Families | Median Income |
| No Earners | 85 (19.8%) | $55,234 |
| 1 Earner | 70 (16.3%) | $60,750 |
| 2 Earners | 183 (42.6%) | $108,598 |
| 3+ Earners | 92 (21.4%) | $110,000 |
| Total | 430 (100.0%) | $92,000 |
Household Income in Trempealeau
Household Income Brackets in Trempealeau
With 198 households falling in the category, the $35,000 to $49,999 income range is the most frequent in Trempealeau, accounting for 24.6% of all households. In contrast, only 13 households (1.6%) fall into the less than $10,000 income bracket, making it the least populous group.
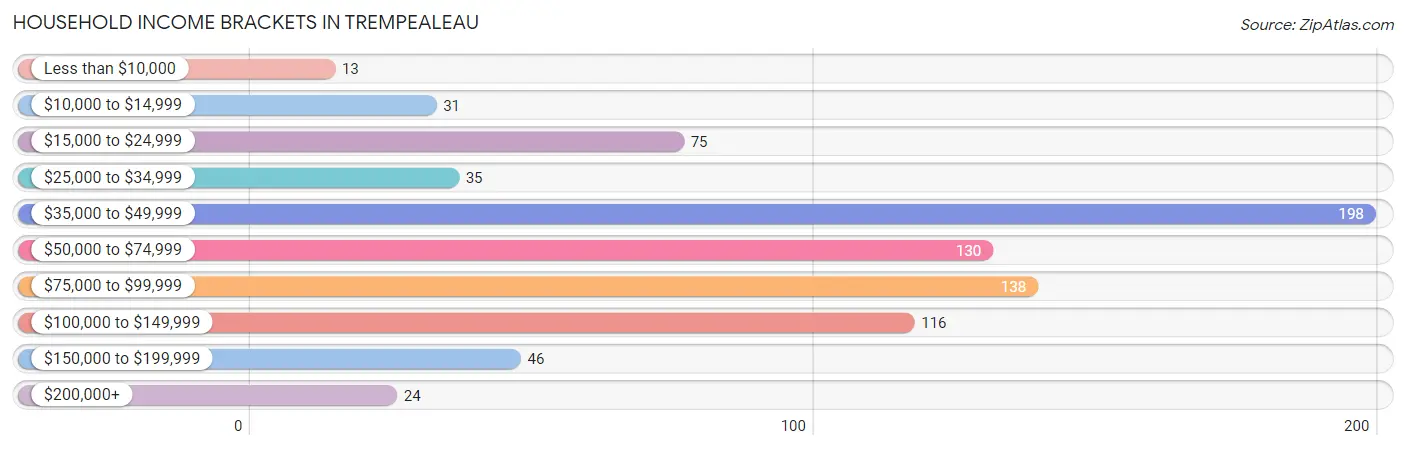
| Income Bracket | # Households | % Households |
| Less than $10,000 | 13 | 1.6% |
| $10,000 to $14,999 | 31 | 3.8% |
| $15,000 to $24,999 | 75 | 9.3% |
| $25,000 to $34,999 | 35 | 4.3% |
| $35,000 to $49,999 | 198 | 24.6% |
| $50,000 to $74,999 | 130 | 16.1% |
| $75,000 to $99,999 | 138 | 17.1% |
| $100,000 to $149,999 | 116 | 14.4% |
| $150,000 to $199,999 | 46 | 5.7% |
| $200,000+ | 24 | 3.0% |
Household Income by Householder Age in Trempealeau
The median household income in Trempealeau is $62,115, with the highest median household income of $98,542 found in the 25 to 44 years age bracket for the primary householder. A total of 133 households (16.5%) fall into this category. Meanwhile, the 15 to 24 years age bracket for the primary householder has the lowest median household income of $48,705, with 85 households (10.5%) in this group.
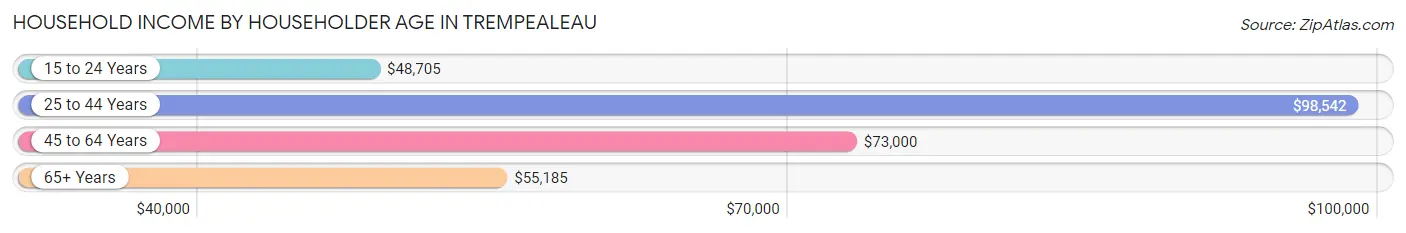
| Income Bracket | # Households | Median Income |
| 15 to 24 Years | 85 (10.5%) | $48,705 |
| 25 to 44 Years | 133 (16.5%) | $98,542 |
| 45 to 64 Years | 278 (34.5%) | $73,000 |
| 65+ Years | 310 (38.5%) | $55,185 |
| Total | 806 (100.0%) | $62,115 |
Poverty in Trempealeau
Income Below Poverty by Sex and Age in Trempealeau
With 3.0% poverty level for males and 8.7% for females among the residents of Trempealeau, 45 to 54 year old males and 18 to 24 year old females are the most vulnerable to poverty, with 7 males (9.9%) and 61 females (42.1%) in their respective age groups living below the poverty level.
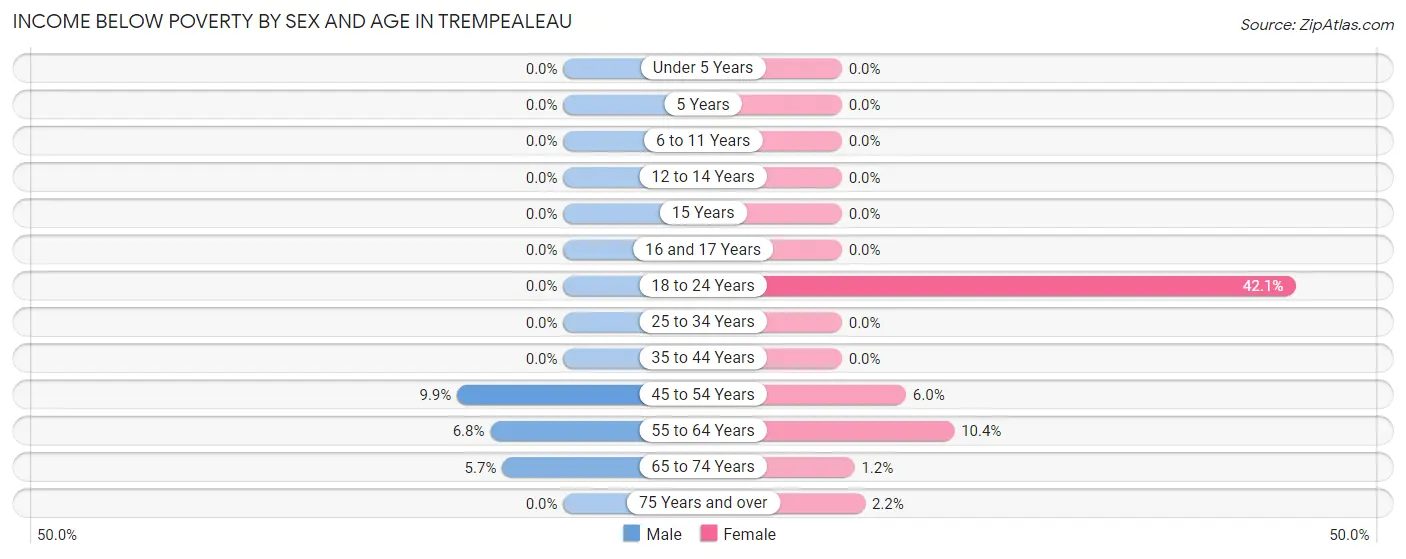
| Age Bracket | Male | Female |
| Under 5 Years | 0 (0.0%) | 0 (0.0%) |
| 5 Years | 0 (0.0%) | 0 (0.0%) |
| 6 to 11 Years | 0 (0.0%) | 0 (0.0%) |
| 12 to 14 Years | 0 (0.0%) | 0 (0.0%) |
| 15 Years | 0 (0.0%) | 0 (0.0%) |
| 16 and 17 Years | 0 (0.0%) | 0 (0.0%) |
| 18 to 24 Years | 0 (0.0%) | 61 (42.1%) |
| 25 to 34 Years | 0 (0.0%) | 0 (0.0%) |
| 35 to 44 Years | 0 (0.0%) | 0 (0.0%) |
| 45 to 54 Years | 7 (9.9%) | 5 (5.9%) |
| 55 to 64 Years | 8 (6.8%) | 17 (10.4%) |
| 65 to 74 Years | 8 (5.7%) | 2 (1.2%) |
| 75 Years and over | 0 (0.0%) | 2 (2.1%) |
| Total | 23 (3.0%) | 87 (8.7%) |
Income Above Poverty by Sex and Age in Trempealeau
According to the poverty statistics in Trempealeau, males aged under 5 years and females aged under 5 years are the age groups that are most secure financially, with 100.0% of males and 100.0% of females in these age groups living above the poverty line.
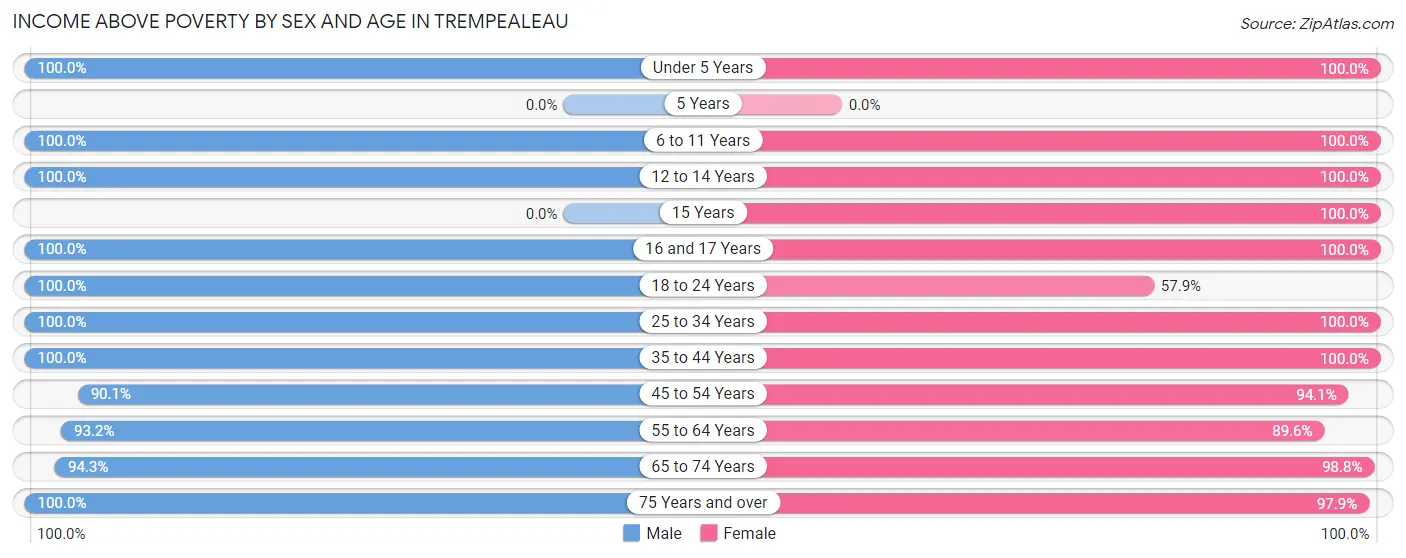
| Age Bracket | Male | Female |
| Under 5 Years | 40 (100.0%) | 77 (100.0%) |
| 5 Years | 0 (0.0%) | 0 (0.0%) |
| 6 to 11 Years | 69 (100.0%) | 50 (100.0%) |
| 12 to 14 Years | 18 (100.0%) | 31 (100.0%) |
| 15 Years | 0 (0.0%) | 5 (100.0%) |
| 16 and 17 Years | 20 (100.0%) | 42 (100.0%) |
| 18 to 24 Years | 61 (100.0%) | 84 (57.9%) |
| 25 to 34 Years | 98 (100.0%) | 68 (100.0%) |
| 35 to 44 Years | 80 (100.0%) | 66 (100.0%) |
| 45 to 54 Years | 64 (90.1%) | 79 (94.1%) |
| 55 to 64 Years | 110 (93.2%) | 146 (89.6%) |
| 65 to 74 Years | 133 (94.3%) | 168 (98.8%) |
| 75 Years and over | 59 (100.0%) | 91 (97.9%) |
| Total | 752 (97.0%) | 907 (91.2%) |
Income Below Poverty Among Married-Couple Families in Trempealeau
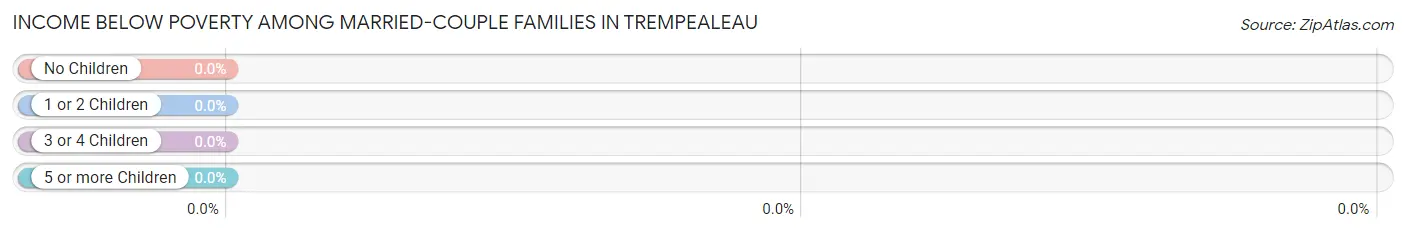
| Children | Above Poverty | Below Poverty |
| No Children | 260 (100.0%) | 0 (0.0%) |
| 1 or 2 Children | 75 (100.0%) | 0 (0.0%) |
| 3 or 4 Children | 43 (100.0%) | 0 (0.0%) |
| 5 or more Children | 0 (0.0%) | 0 (0.0%) |
| Total | 378 (100.0%) | 0 (0.0%) |
Income Below Poverty Among Single-Parent Households in Trempealeau
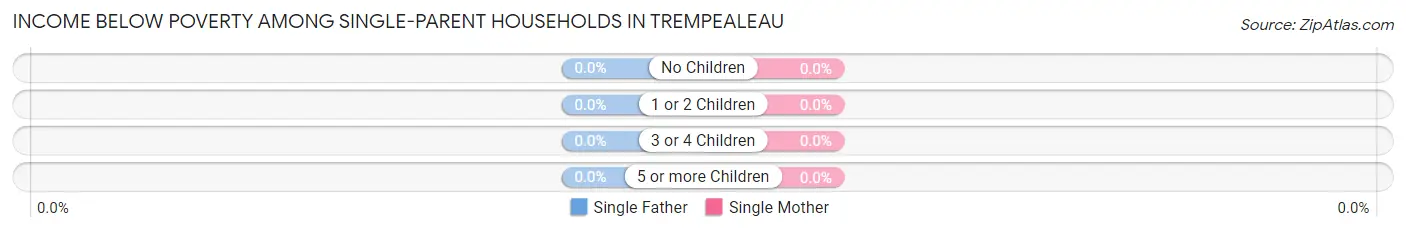
| Children | Single Father | Single Mother |
| No Children | 0 (0.0%) | 0 (0.0%) |
| 1 or 2 Children | 0 (0.0%) | 0 (0.0%) |
| 3 or 4 Children | 0 (0.0%) | 0 (0.0%) |
| 5 or more Children | 0 (0.0%) | 0 (0.0%) |
| Total | 0 (0.0%) | 0 (0.0%) |
Income Below Poverty Among Married-Couple vs Single-Parent Households in Trempealeau
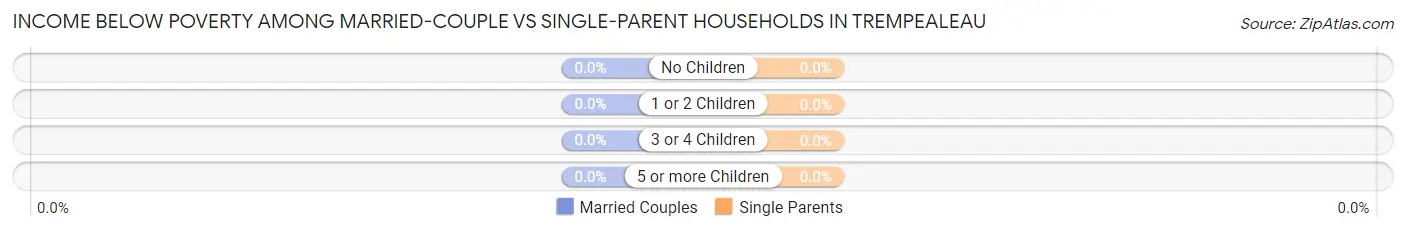
| Children | Married-Couple Families | Single-Parent Households |
| No Children | 0 (0.0%) | 0 (0.0%) |
| 1 or 2 Children | 0 (0.0%) | 0 (0.0%) |
| 3 or 4 Children | 0 (0.0%) | 0 (0.0%) |
| 5 or more Children | 0 (0.0%) | 0 (0.0%) |
| Total | 0 (0.0%) | 0 (0.0%) |
Race in Trempealeau
The most populous races in Trempealeau are White / Caucasian (1,729 | 97.7%), Two or more Races (32 | 1.8%), and Asian (5 | 0.3%).
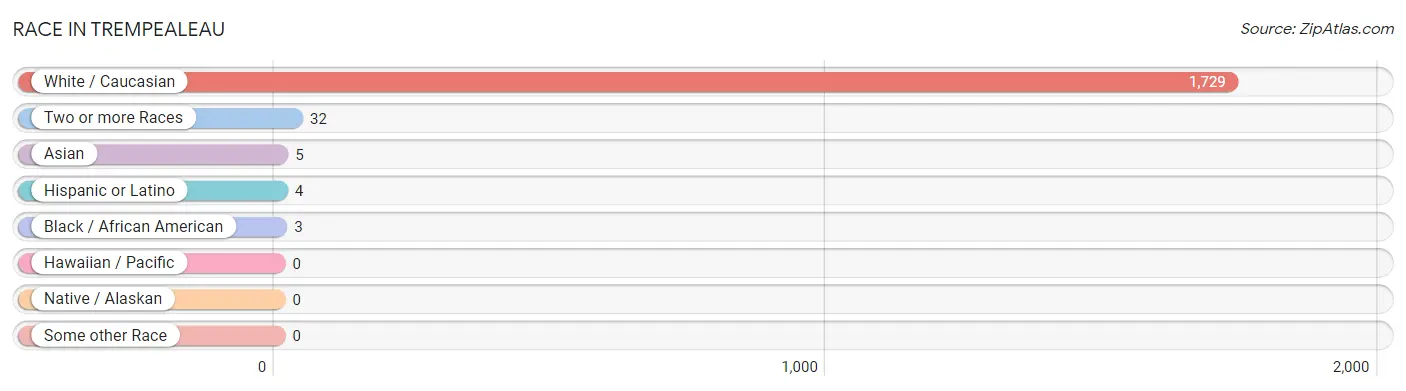
| Race | # Population | % Population |
| Asian | 5 | 0.3% |
| Black / African American | 3 | 0.2% |
| Hawaiian / Pacific | 0 | 0.0% |
| Hispanic or Latino | 4 | 0.2% |
| Native / Alaskan | 0 | 0.0% |
| White / Caucasian | 1,729 | 97.7% |
| Two or more Races | 32 | 1.8% |
| Some other Race | 0 | 0.0% |
| Total | 1,769 | 100.0% |
Ancestry in Trempealeau
The most populous ancestries reported in Trempealeau are German (719 | 40.6%), Norwegian (393 | 22.2%), Polish (337 | 19.1%), Irish (222 | 12.6%), and English (167 | 9.4%), together accounting for 103.9% of all Trempealeau residents.
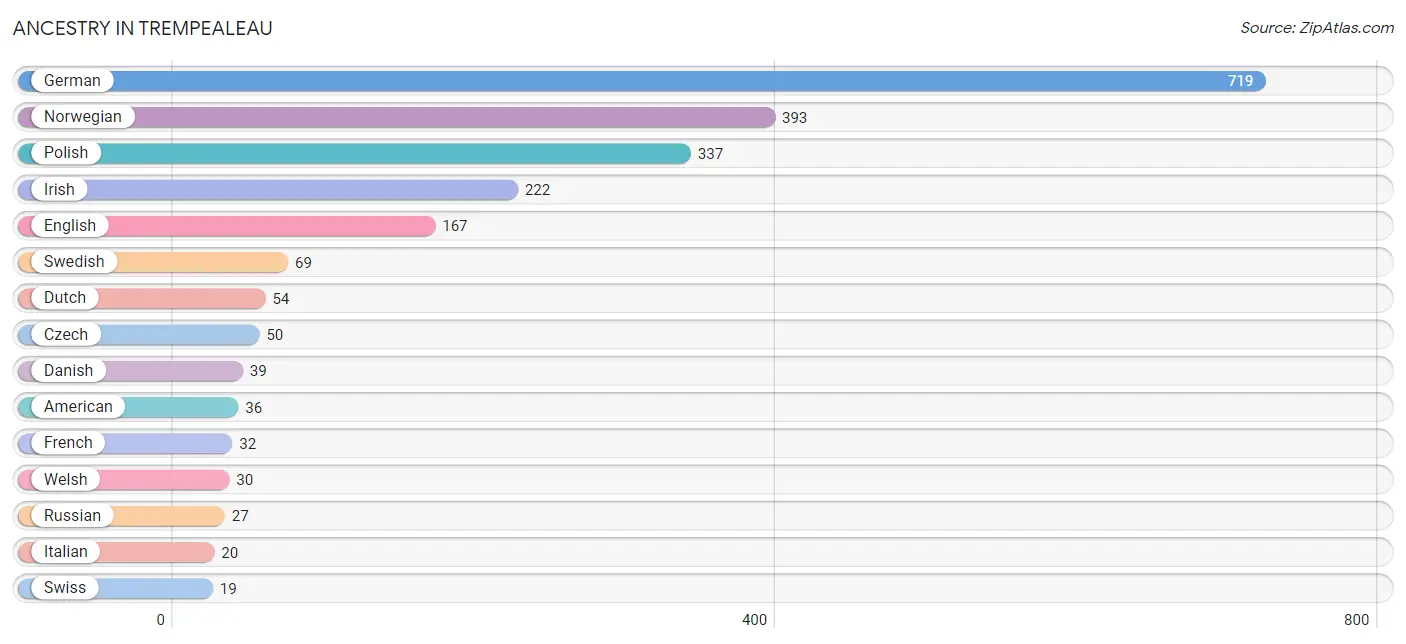
| Ancestry | # Population | % Population |
| American | 36 | 2.0% |
| Austrian | 5 | 0.3% |
| Belgian | 10 | 0.6% |
| Blackfeet | 4 | 0.2% |
| British | 7 | 0.4% |
| Cherokee | 4 | 0.2% |
| Croatian | 2 | 0.1% |
| Cuban | 3 | 0.2% |
| Czech | 50 | 2.8% |
| Danish | 39 | 2.2% |
| Dutch | 54 | 3.0% |
| English | 167 | 9.4% |
| European | 11 | 0.6% |
| Finnish | 3 | 0.2% |
| French | 32 | 1.8% |
| French Canadian | 3 | 0.2% |
| German | 719 | 40.6% |
| Hungarian | 7 | 0.4% |
| Irish | 222 | 12.6% |
| Italian | 20 | 1.1% |
| Korean | 5 | 0.3% |
| Menominee | 11 | 0.6% |
| Mexican | 1 | 0.1% |
| Norwegian | 393 | 22.2% |
| Polish | 337 | 19.1% |
| Russian | 27 | 1.5% |
| Scandinavian | 10 | 0.6% |
| Scotch-Irish | 8 | 0.4% |
| Scottish | 11 | 0.6% |
| Serbian | 2 | 0.1% |
| Swedish | 69 | 3.9% |
| Swiss | 19 | 1.1% |
| Ukrainian | 6 | 0.3% |
| Welsh | 30 | 1.7% | View All 34 Rows |
Immigrants in Trempealeau
The most numerous immigrant groups reported in Trempealeau came from Asia (5 | 0.3%), Europe (5 | 0.3%), Netherlands (5 | 0.3%), Philippines (5 | 0.3%), and South Eastern Asia (5 | 0.3%), together accounting for 1.4% of all Trempealeau residents.
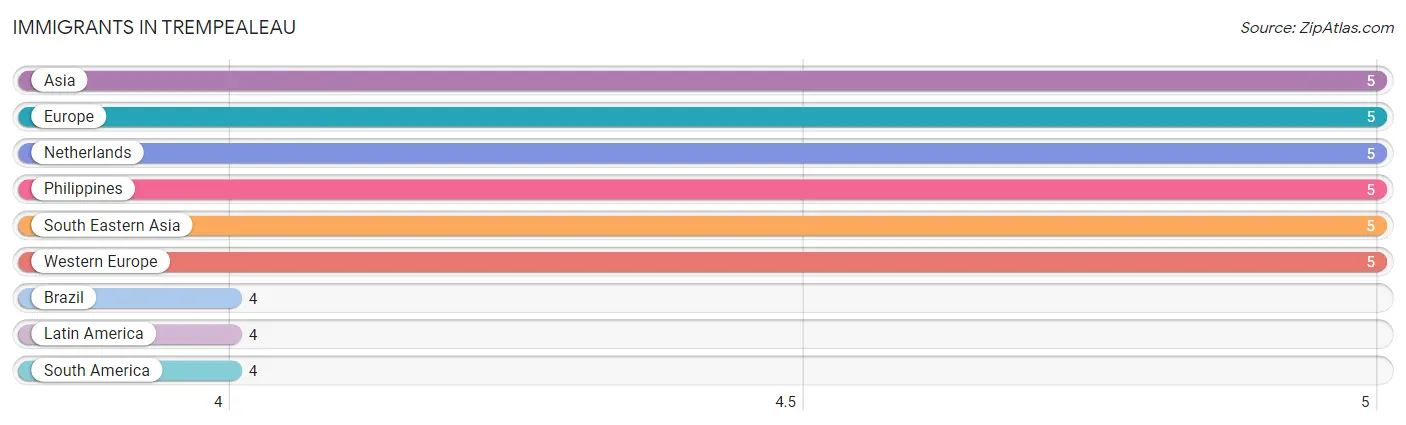
| Immigration Origin | # Population | % Population |
| Asia | 5 | 0.3% |
| Brazil | 4 | 0.2% |
| Europe | 5 | 0.3% |
| Latin America | 4 | 0.2% |
| Netherlands | 5 | 0.3% |
| Philippines | 5 | 0.3% |
| South America | 4 | 0.2% |
| South Eastern Asia | 5 | 0.3% |
| Western Europe | 5 | 0.3% | View All 9 Rows |
Sex and Age in Trempealeau
Sex and Age in Trempealeau
The most populous age groups in Trempealeau are 70 to 74 Years (90 | 11.6%) for men and 20 to 24 Years (119 | 12.0%) for women.
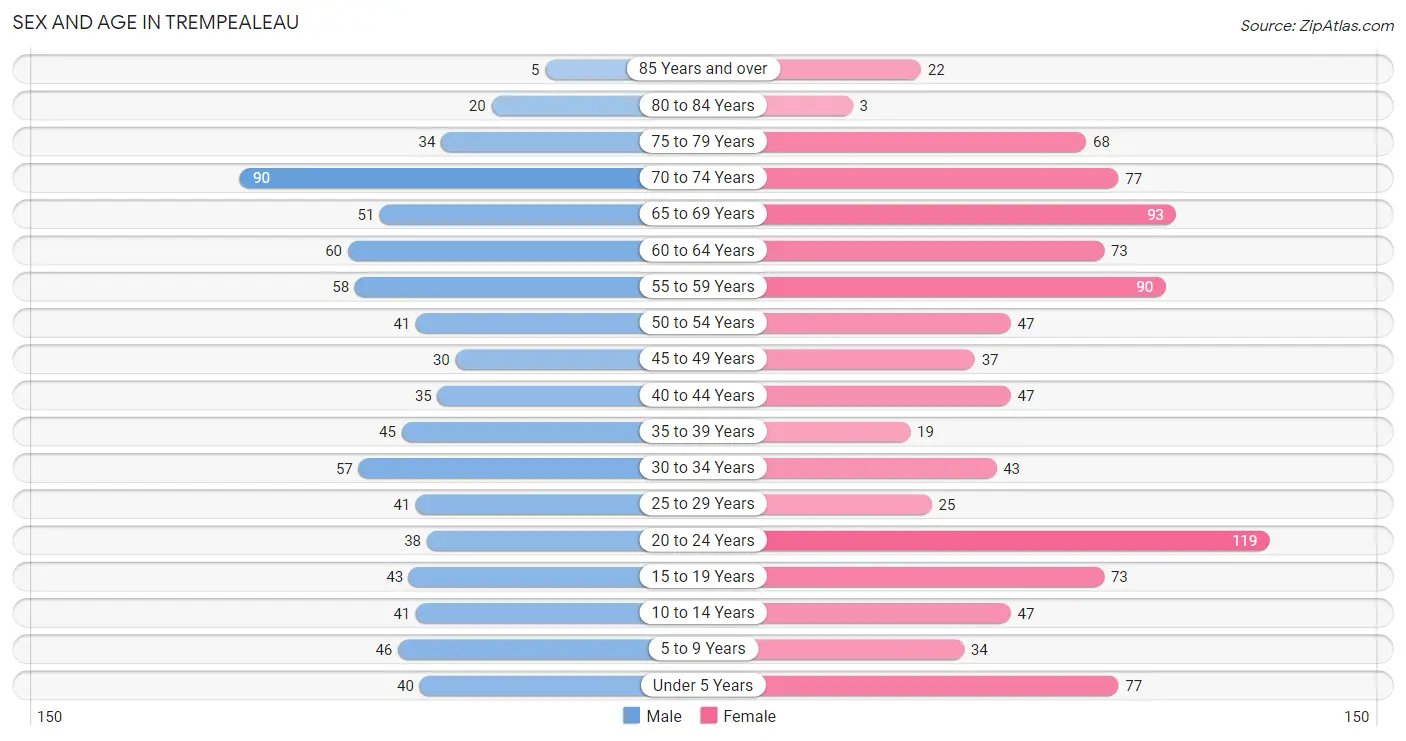
| Age Bracket | Male | Female |
| Under 5 Years | 40 (5.2%) | 77 (7.7%) |
| 5 to 9 Years | 46 (5.9%) | 34 (3.4%) |
| 10 to 14 Years | 41 (5.3%) | 47 (4.7%) |
| 15 to 19 Years | 43 (5.6%) | 73 (7.3%) |
| 20 to 24 Years | 38 (4.9%) | 119 (12.0%) |
| 25 to 29 Years | 41 (5.3%) | 25 (2.5%) |
| 30 to 34 Years | 57 (7.3%) | 43 (4.3%) |
| 35 to 39 Years | 45 (5.8%) | 19 (1.9%) |
| 40 to 44 Years | 35 (4.5%) | 47 (4.7%) |
| 45 to 49 Years | 30 (3.9%) | 37 (3.7%) |
| 50 to 54 Years | 41 (5.3%) | 47 (4.7%) |
| 55 to 59 Years | 58 (7.5%) | 90 (9.0%) |
| 60 to 64 Years | 60 (7.7%) | 73 (7.3%) |
| 65 to 69 Years | 51 (6.6%) | 93 (9.4%) |
| 70 to 74 Years | 90 (11.6%) | 77 (7.7%) |
| 75 to 79 Years | 34 (4.4%) | 68 (6.8%) |
| 80 to 84 Years | 20 (2.6%) | 3 (0.3%) |
| 85 Years and over | 5 (0.6%) | 22 (2.2%) |
| Total | 775 (100.0%) | 994 (100.0%) |
Families and Households in Trempealeau
Median Family Size in Trempealeau
The median family size in Trempealeau is 3.10 persons per family, with single female/mother families (34 | 7.9%) accounting for the largest median family size of 4.38 persons per family. On the other hand, single male/father families (18 | 4.2%) represent the smallest median family size with 2.67 persons per family.
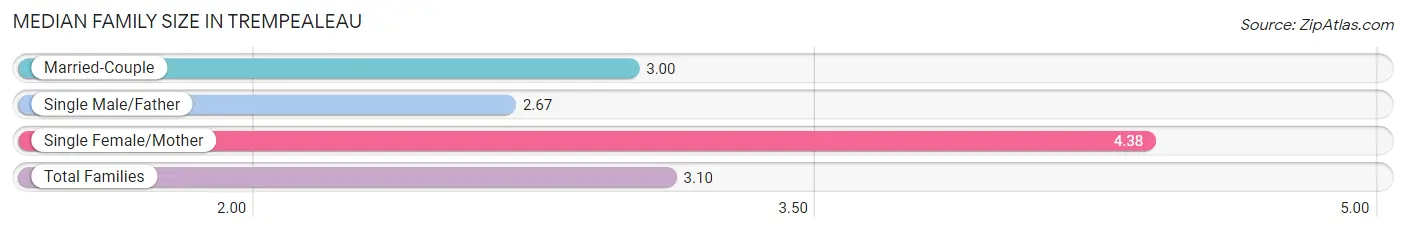
| Family Type | # Families | Family Size |
| Married-Couple | 378 (87.9%) | 3.00 |
| Single Male/Father | 18 (4.2%) | 2.67 |
| Single Female/Mother | 34 (7.9%) | 4.38 |
| Total Families | 430 (100.0%) | 3.10 |
Median Household Size in Trempealeau
The median household size in Trempealeau is 2.19 persons per household, with single female/mother households (34 | 4.2%) accounting for the largest median household size of 4.91 persons per household. non-family households (376 | 46.7%) represent the smallest median household size with 1.11 persons per household.
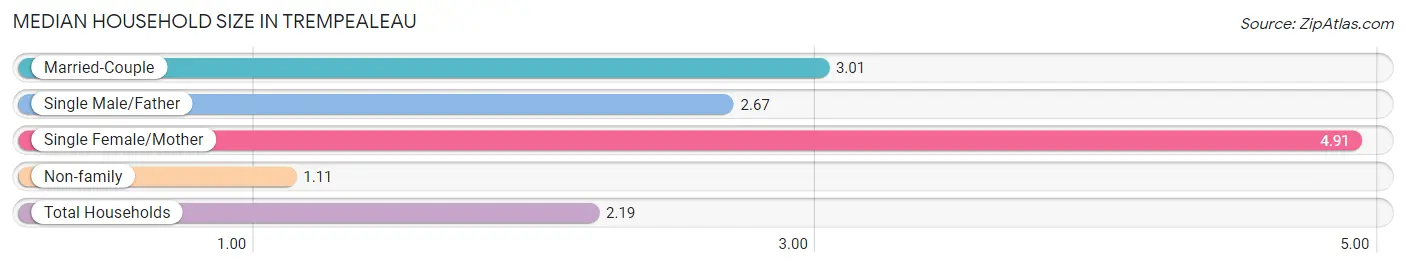
| Household Type | # Households | Household Size |
| Married-Couple | 378 (46.9%) | 3.01 |
| Single Male/Father | 18 (2.2%) | 2.67 |
| Single Female/Mother | 34 (4.2%) | 4.91 |
| Non-family | 376 (46.7%) | 1.11 |
| Total Households | 806 (100.0%) | 2.19 |
Household Size by Marriage Status in Trempealeau
Out of a total of 806 households in Trempealeau, 430 (53.3%) are family households, while 376 (46.7%) are nonfamily households. The most numerous type of family households are 2-person households, comprising 235, and the most common type of nonfamily households are 1-person households, comprising 303.
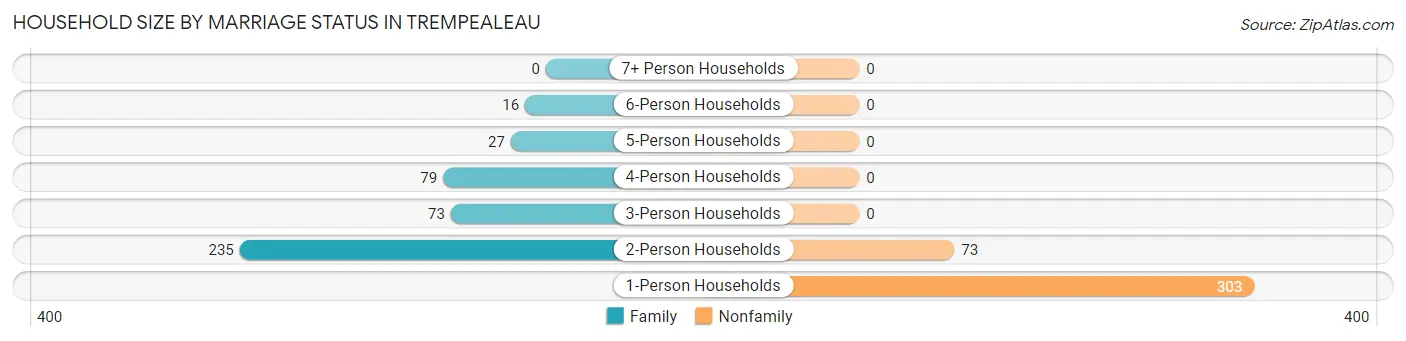
| Household Size | Family Households | Nonfamily Households |
| 1-Person Households | - | 303 (37.6%) |
| 2-Person Households | 235 (29.2%) | 73 (9.1%) |
| 3-Person Households | 73 (9.1%) | 0 (0.0%) |
| 4-Person Households | 79 (9.8%) | 0 (0.0%) |
| 5-Person Households | 27 (3.4%) | 0 (0.0%) |
| 6-Person Households | 16 (2.0%) | 0 (0.0%) |
| 7+ Person Households | 0 (0.0%) | 0 (0.0%) |
| Total | 430 (53.3%) | 376 (46.7%) |
Female Fertility in Trempealeau
Fertility by Age in Trempealeau
Average fertility rate in Trempealeau is 52.0 births per 1,000 women. Women in the age bracket of 20 to 34 years have the highest fertility rate with 64.0 births per 1,000 women. Women in the age bracket of 20 to 34 years acount for 60.0% of all women with births.
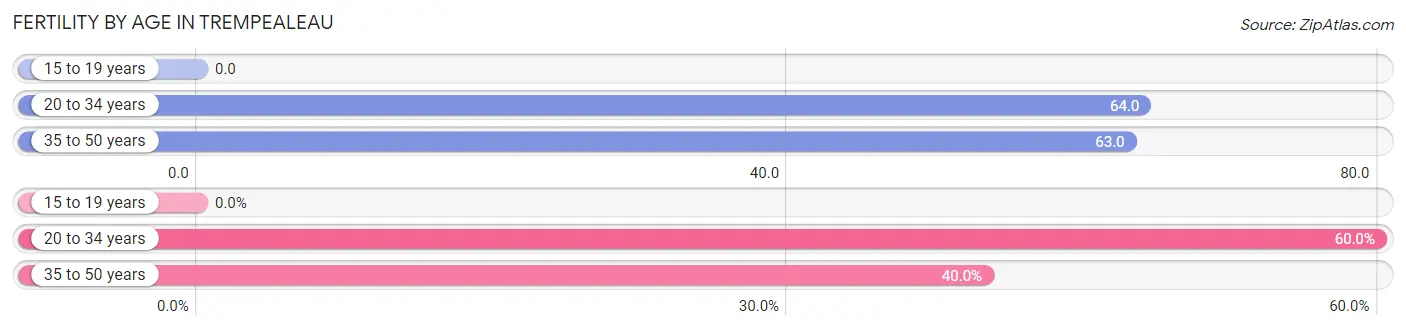
| Age Bracket | Women with Births | Births / 1,000 Women |
| 15 to 19 years | 0 (0.0%) | 0.0 |
| 20 to 34 years | 12 (60.0%) | 64.0 |
| 35 to 50 years | 8 (40.0%) | 63.0 |
| Total | 20 (100.0%) | 52.0 |
Fertility by Age by Marriage Status in Trempealeau
95.0% of women with births (20) in Trempealeau are married. The highest percentage of unmarried women with births falls into 20 to 34 years age bracket with 8.3% of them unmarried at the time of birth, while the lowest percentage of unmarried women with births belong to 35 to 50 years age bracket with 0.0% of them unmarried.
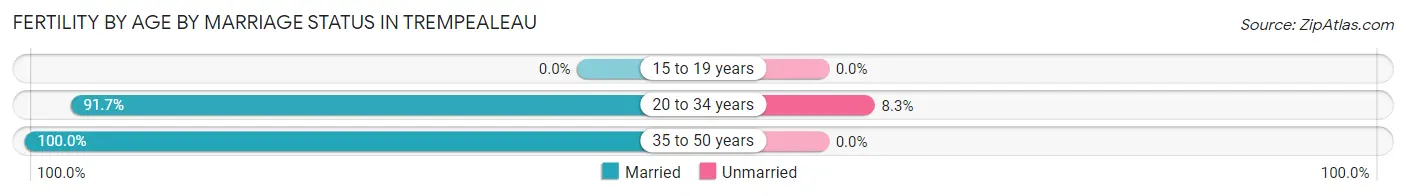
| Age Bracket | Married | Unmarried |
| 15 to 19 years | 0 (0.0%) | 0 (0.0%) |
| 20 to 34 years | 11 (91.7%) | 1 (8.3%) |
| 35 to 50 years | 8 (100.0%) | 0 (0.0%) |
| Total | 19 (95.0%) | 1 (5.0%) |
Fertility by Education in Trempealeau
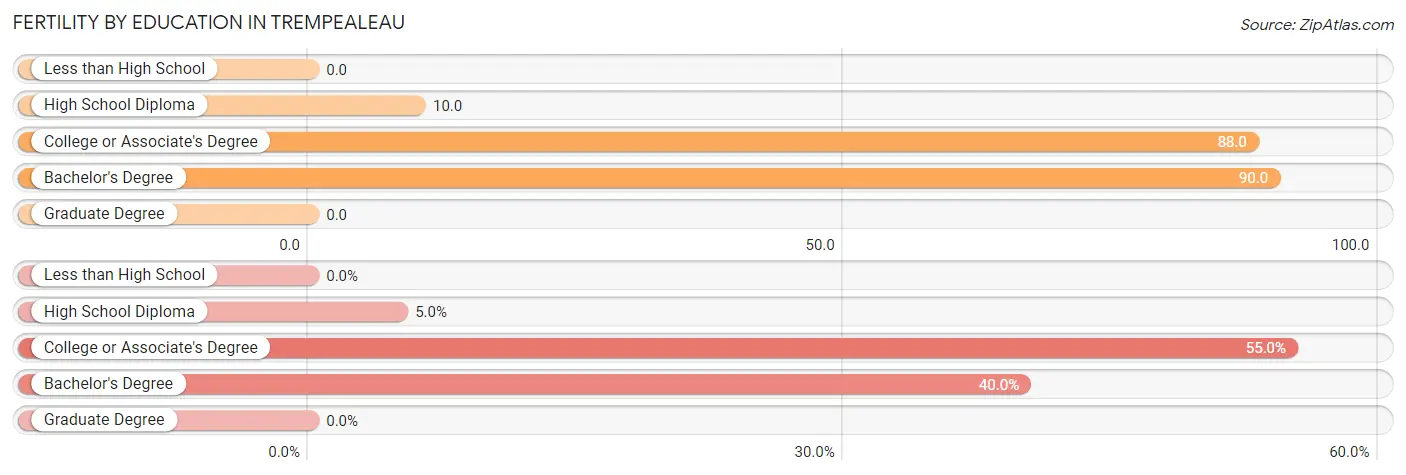
| Educational Attainment | Women with Births | Births / 1,000 Women |
| Less than High School | 0 (0.0%) | 0.0 |
| High School Diploma | 1 (5.0%) | 10.0 |
| College or Associate's Degree | 11 (55.0%) | 88.0 |
| Bachelor's Degree | 8 (40.0%) | 90.0 |
| Graduate Degree | 0 (0.0%) | 0.0 |
| Total | 20 (100.0%) | 52.0 |
Fertility by Education by Marriage Status in Trempealeau
5.0% of women with births in Trempealeau are unmarried. Women with the educational attainment of college or associate's degree are most likely to be married with 100.0% of them married at childbirth, while women with the educational attainment of high school diploma are least likely to be married with 100.0% of them unmarried at childbirth.
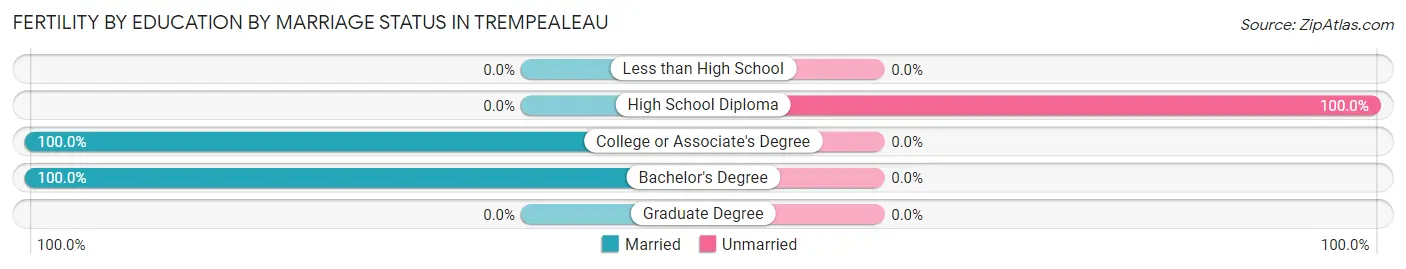
| Educational Attainment | Married | Unmarried |
| Less than High School | 0 (0.0%) | 0 (0.0%) |
| High School Diploma | 0 (0.0%) | 1 (100.0%) |
| College or Associate's Degree | 11 (100.0%) | 0 (0.0%) |
| Bachelor's Degree | 8 (100.0%) | 0 (0.0%) |
| Graduate Degree | 0 (0.0%) | 0 (0.0%) |
| Total | 19 (95.0%) | 1 (5.0%) |
Employment Characteristics in Trempealeau
Employment by Class of Employer in Trempealeau
Among the 938 employed individuals in Trempealeau, private company employees (751 | 80.1%), not-for-profit organizations (68 | 7.2%), and local government employees (39 | 4.2%) make up the most common classes of employment.
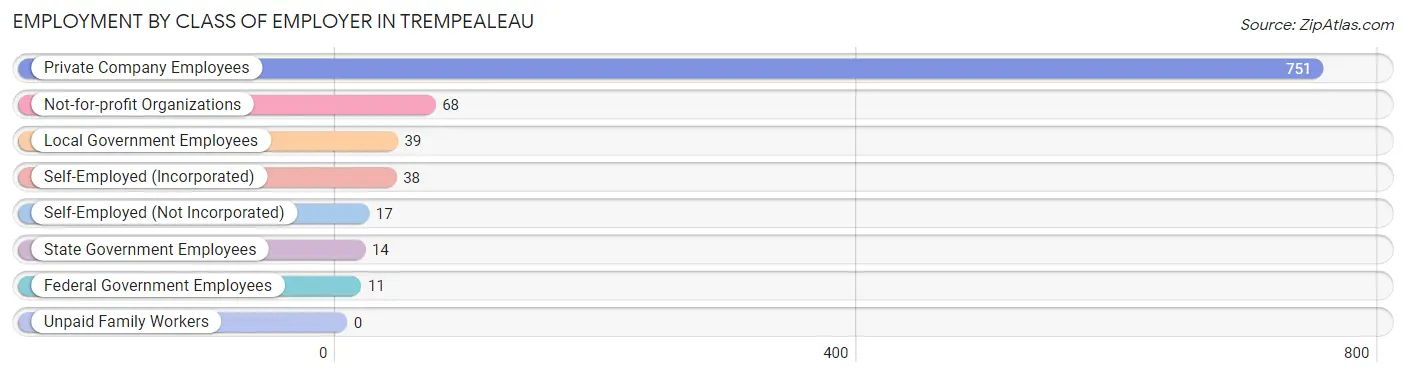
| Employer Class | # Employees | % Employees |
| Private Company Employees | 751 | 80.1% |
| Self-Employed (Incorporated) | 38 | 4.1% |
| Self-Employed (Not Incorporated) | 17 | 1.8% |
| Not-for-profit Organizations | 68 | 7.2% |
| Local Government Employees | 39 | 4.2% |
| State Government Employees | 14 | 1.5% |
| Federal Government Employees | 11 | 1.2% |
| Unpaid Family Workers | 0 | 0.0% |
| Total | 938 | 100.0% |
Employment Status by Age in Trempealeau
According to the labor force statistics for Trempealeau, out of the total population over 16 years of age (1,479), 64.8% or 958 individuals are in the labor force, with 2.1% or 20 of them unemployed. The age group with the highest labor force participation rate is 35 to 44 years, with 100.0% or 146 individuals in the labor force. Within the labor force, the 25 to 29 years age range has the highest percentage of unemployed individuals, with 8.3% or 5 of them being unemployed.
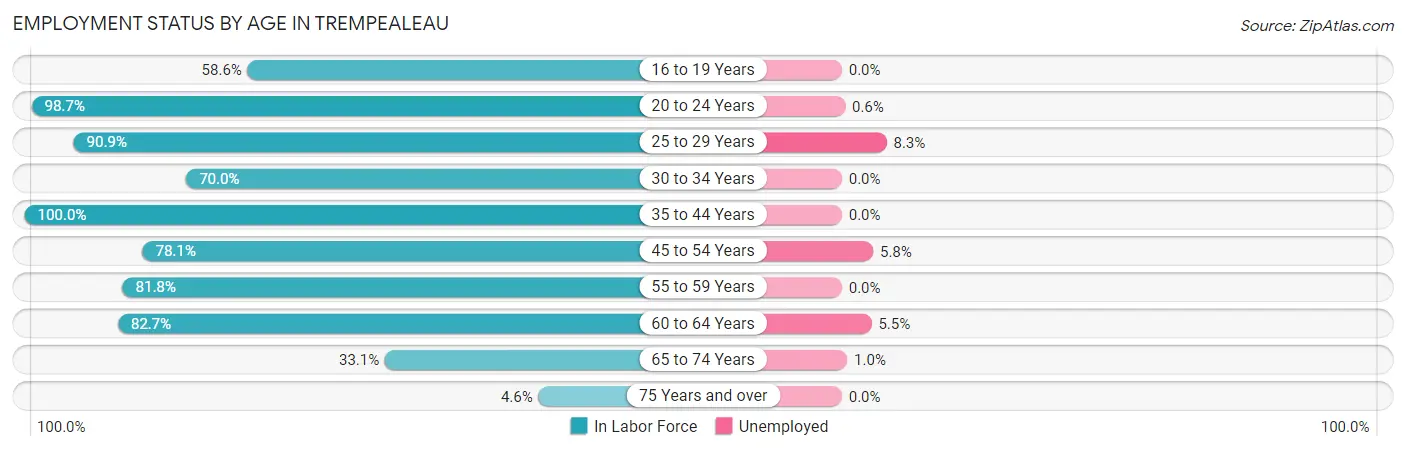
| Age Bracket | In Labor Force | Unemployed |
| 16 to 19 Years | 65 (58.6%) | 0 (0.0%) |
| 20 to 24 Years | 155 (98.7%) | 1 (0.6%) |
| 25 to 29 Years | 60 (90.9%) | 5 (8.3%) |
| 30 to 34 Years | 70 (70.0%) | 0 (0.0%) |
| 35 to 44 Years | 146 (100.0%) | 0 (0.0%) |
| 45 to 54 Years | 121 (78.1%) | 7 (5.8%) |
| 55 to 59 Years | 121 (81.8%) | 0 (0.0%) |
| 60 to 64 Years | 110 (82.7%) | 6 (5.5%) |
| 65 to 74 Years | 103 (33.1%) | 1 (1.0%) |
| 75 Years and over | 7 (4.6%) | 0 (0.0%) |
| Total | 958 (64.8%) | 20 (2.1%) |
Employment Status by Educational Attainment in Trempealeau
According to labor force statistics for Trempealeau, 84.0% of individuals (628) out of the total population between 25 and 64 years of age (748) are in the labor force, with 2.9% or 18 of them being unemployed. The group with the highest labor force participation rate are those with the educational attainment of bachelor's degree or higher, with 84.8% or 173 individuals in the labor force. Within the labor force, individuals with college / associate degree education have the highest percentage of unemployment, with 5.0% or 13 of them being unemployed.
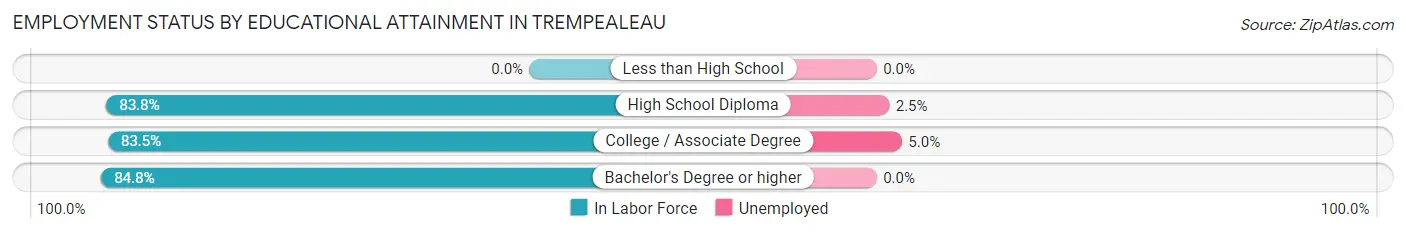
| Educational Attainment | In Labor Force | Unemployed |
| Less than High School | 0 (0.0%) | 0 (0.0%) |
| High School Diploma | 197 (83.8%) | 6 (2.5%) |
| College / Associate Degree | 258 (83.5%) | 15 (5.0%) |
| Bachelor's Degree or higher | 173 (84.8%) | 0 (0.0%) |
| Total | 628 (84.0%) | 22 (2.9%) |
Employment Occupations by Sex in Trempealeau
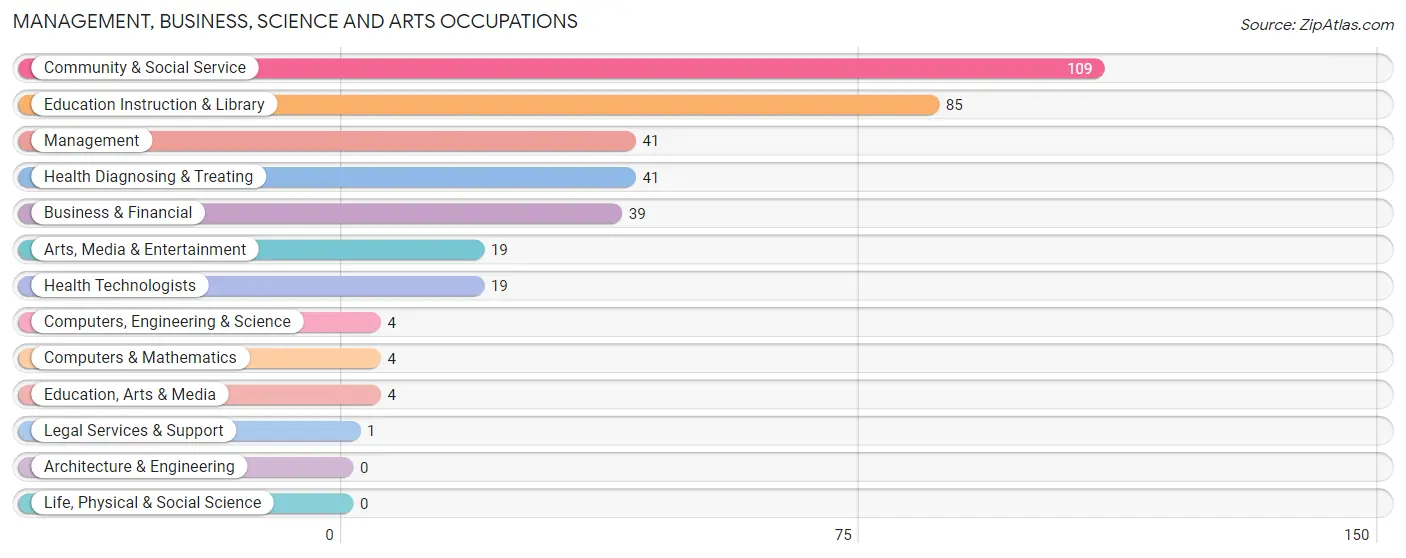
Management, Business, Science and Arts Occupations
The most common Management, Business, Science and Arts occupations in Trempealeau are Community & Social Service (109 | 11.6%), Education Instruction & Library (85 | 9.1%), Management (41 | 4.4%), Health Diagnosing & Treating (41 | 4.4%), and Business & Financial (39 | 4.2%).
Management, Business, Science and Arts Occupations by Sex
Within the Management, Business, Science and Arts occupations in Trempealeau, the most male-oriented occupations are Computers, Engineering & Science (100.0%), Computers & Mathematics (100.0%), and Legal Services & Support (100.0%), while the most female-oriented occupations are Education, Arts & Media (100.0%), Health Technologists (100.0%), and Education Instruction & Library (95.3%).
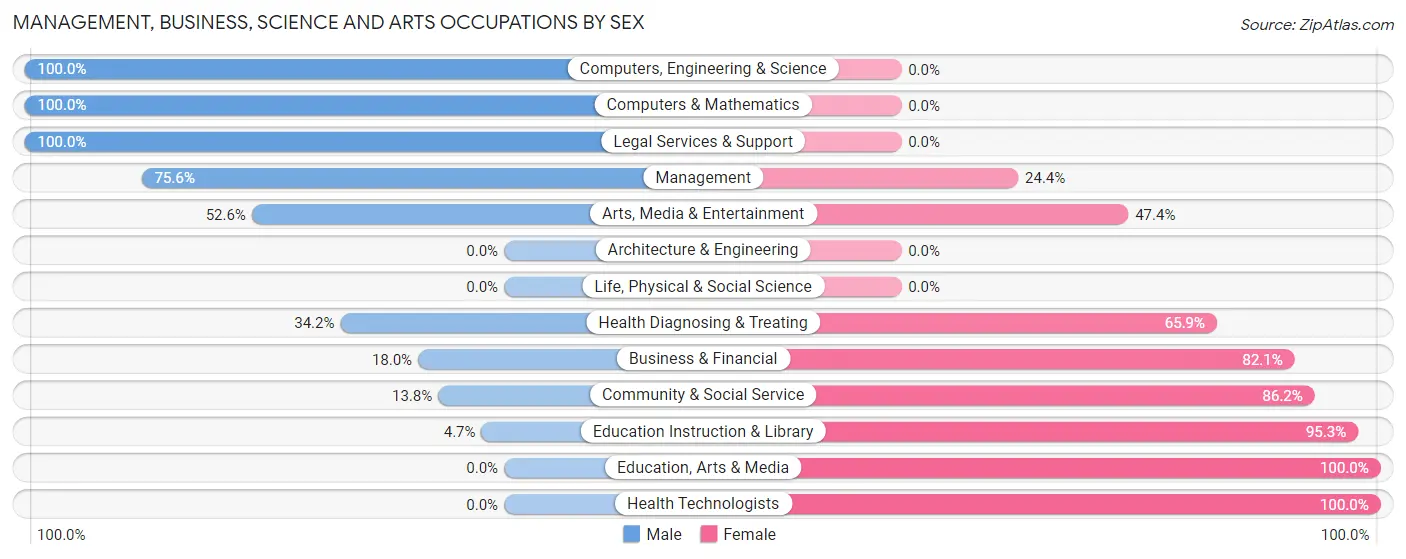
| Occupation | Male | Female |
| Management | 31 (75.6%) | 10 (24.4%) |
| Business & Financial | 7 (17.9%) | 32 (82.1%) |
| Computers, Engineering & Science | 4 (100.0%) | 0 (0.0%) |
| Computers & Mathematics | 4 (100.0%) | 0 (0.0%) |
| Architecture & Engineering | 0 (0.0%) | 0 (0.0%) |
| Life, Physical & Social Science | 0 (0.0%) | 0 (0.0%) |
| Community & Social Service | 15 (13.8%) | 94 (86.2%) |
| Education, Arts & Media | 0 (0.0%) | 4 (100.0%) |
| Legal Services & Support | 1 (100.0%) | 0 (0.0%) |
| Education Instruction & Library | 4 (4.7%) | 81 (95.3%) |
| Arts, Media & Entertainment | 10 (52.6%) | 9 (47.4%) |
| Health Diagnosing & Treating | 14 (34.2%) | 27 (65.8%) |
| Health Technologists | 0 (0.0%) | 19 (100.0%) |
| Total (Category) | 71 (30.3%) | 163 (69.7%) |
| Total (Overall) | 402 (42.9%) | 536 (57.1%) |
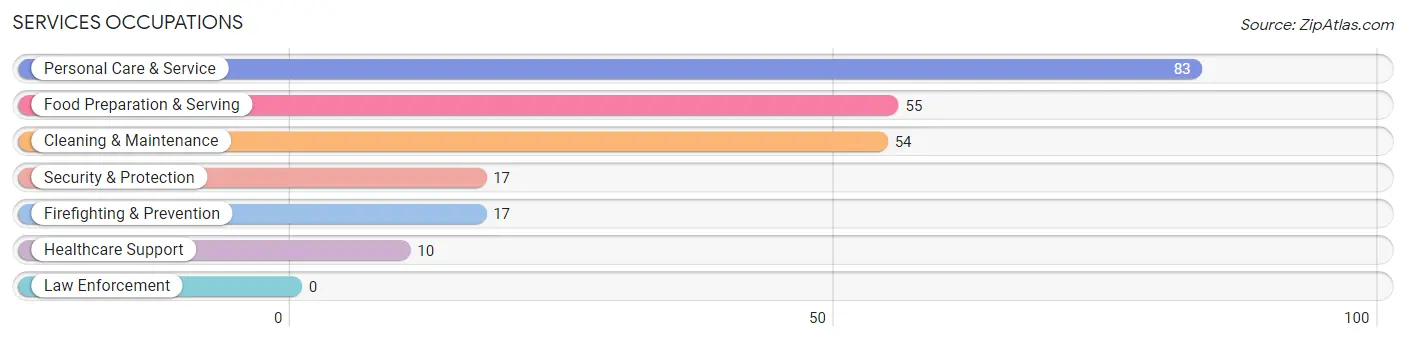
Services Occupations
The most common Services occupations in Trempealeau are Personal Care & Service (83 | 8.8%), Food Preparation & Serving (55 | 5.9%), Cleaning & Maintenance (54 | 5.8%), Security & Protection (17 | 1.8%), and Firefighting & Prevention (17 | 1.8%).
Services Occupations by Sex
Within the Services occupations in Trempealeau, the most male-oriented occupations are Food Preparation & Serving (34.5%), Cleaning & Maintenance (20.4%), and Security & Protection (17.6%), while the most female-oriented occupations are Healthcare Support (100.0%), Personal Care & Service (100.0%), and Security & Protection (82.4%).
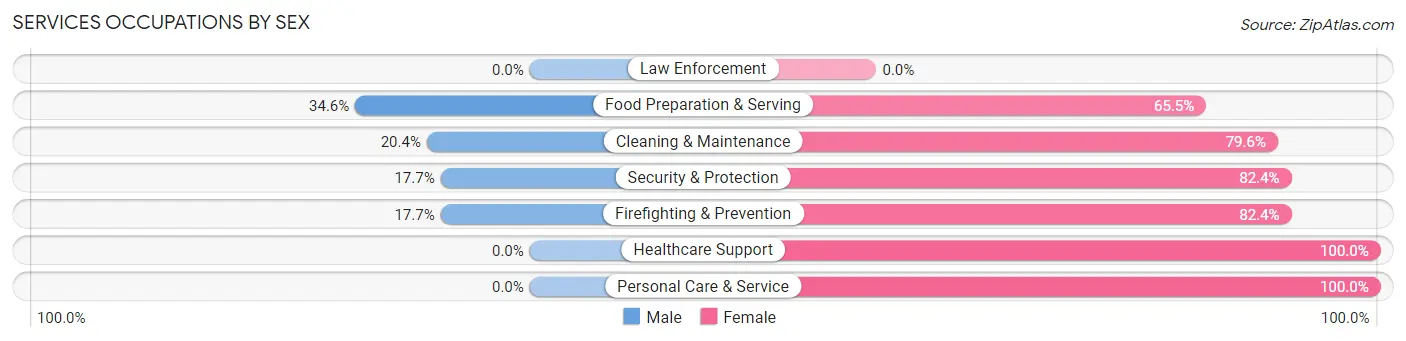
| Occupation | Male | Female |
| Healthcare Support | 0 (0.0%) | 10 (100.0%) |
| Security & Protection | 3 (17.6%) | 14 (82.4%) |
| Firefighting & Prevention | 3 (17.6%) | 14 (82.4%) |
| Law Enforcement | 0 (0.0%) | 0 (0.0%) |
| Food Preparation & Serving | 19 (34.5%) | 36 (65.4%) |
| Cleaning & Maintenance | 11 (20.4%) | 43 (79.6%) |
| Personal Care & Service | 0 (0.0%) | 83 (100.0%) |
| Total (Category) | 33 (15.1%) | 186 (84.9%) |
| Total (Overall) | 402 (42.9%) | 536 (57.1%) |
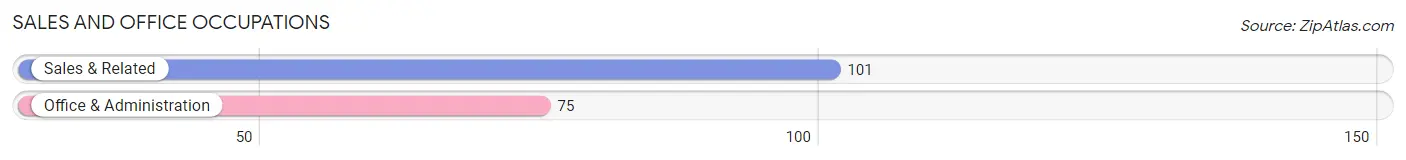
Sales and Office Occupations
The most common Sales and Office occupations in Trempealeau are Sales & Related (101 | 10.8%), and Office & Administration (75 | 8.0%).
Sales and Office Occupations by Sex
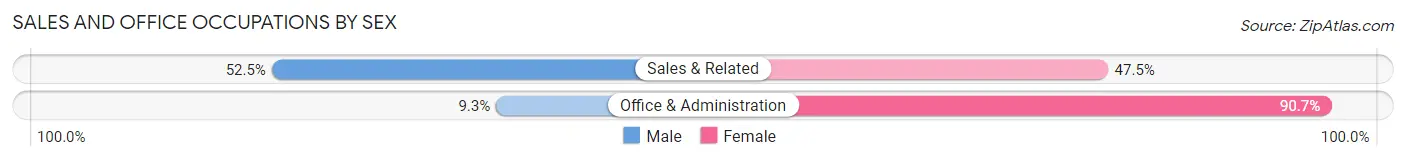
| Occupation | Male | Female |
| Sales & Related | 53 (52.5%) | 48 (47.5%) |
| Office & Administration | 7 (9.3%) | 68 (90.7%) |
| Total (Category) | 60 (34.1%) | 116 (65.9%) |
| Total (Overall) | 402 (42.9%) | 536 (57.1%) |
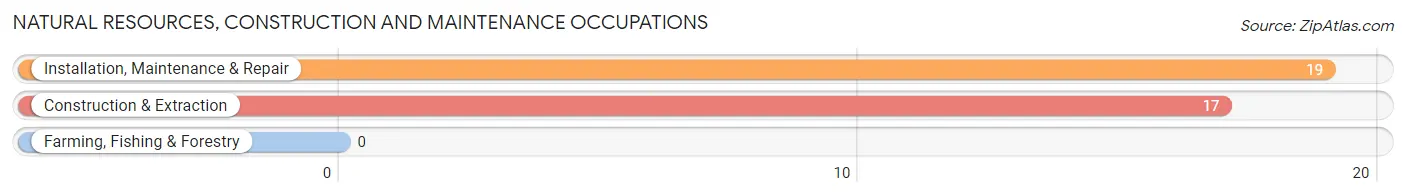
Natural Resources, Construction and Maintenance Occupations
The most common Natural Resources, Construction and Maintenance occupations in Trempealeau are Installation, Maintenance & Repair (19 | 2.0%), and Construction & Extraction (17 | 1.8%).
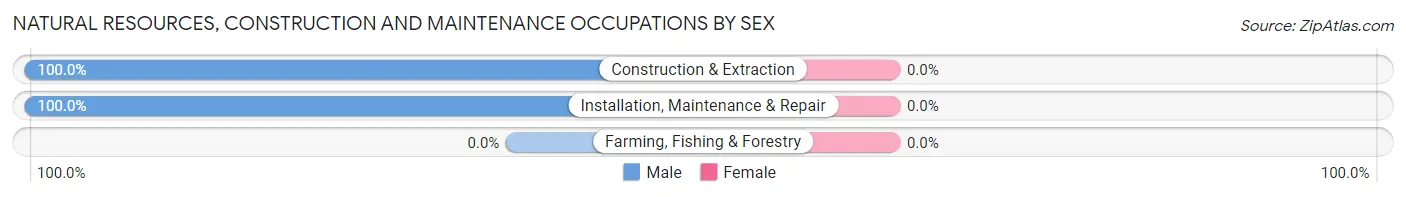
Natural Resources, Construction and Maintenance Occupations by Sex
| Occupation | Male | Female |
| Farming, Fishing & Forestry | 0 (0.0%) | 0 (0.0%) |
| Construction & Extraction | 17 (100.0%) | 0 (0.0%) |
| Installation, Maintenance & Repair | 19 (100.0%) | 0 (0.0%) |
| Total (Category) | 36 (100.0%) | 0 (0.0%) |
| Total (Overall) | 402 (42.9%) | 536 (57.1%) |
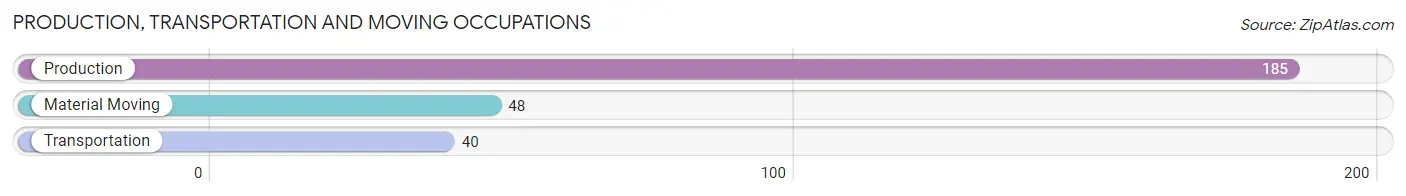
Production, Transportation and Moving Occupations
The most common Production, Transportation and Moving occupations in Trempealeau are Production (185 | 19.7%), Material Moving (48 | 5.1%), and Transportation (40 | 4.3%).
Production, Transportation and Moving Occupations by Sex
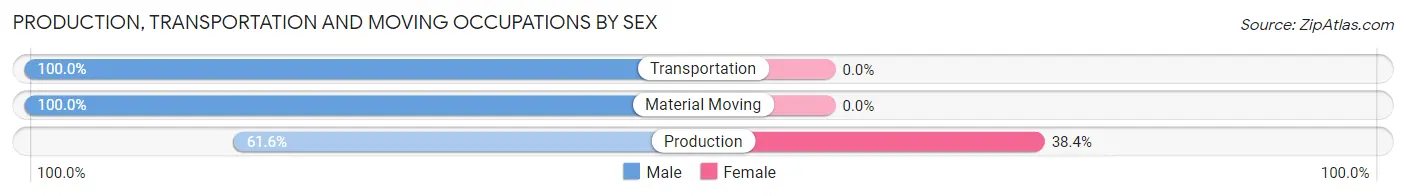
| Occupation | Male | Female |
| Production | 114 (61.6%) | 71 (38.4%) |
| Transportation | 40 (100.0%) | 0 (0.0%) |
| Material Moving | 48 (100.0%) | 0 (0.0%) |
| Total (Category) | 202 (74.0%) | 71 (26.0%) |
| Total (Overall) | 402 (42.9%) | 536 (57.1%) |
Employment Industries by Sex in Trempealeau
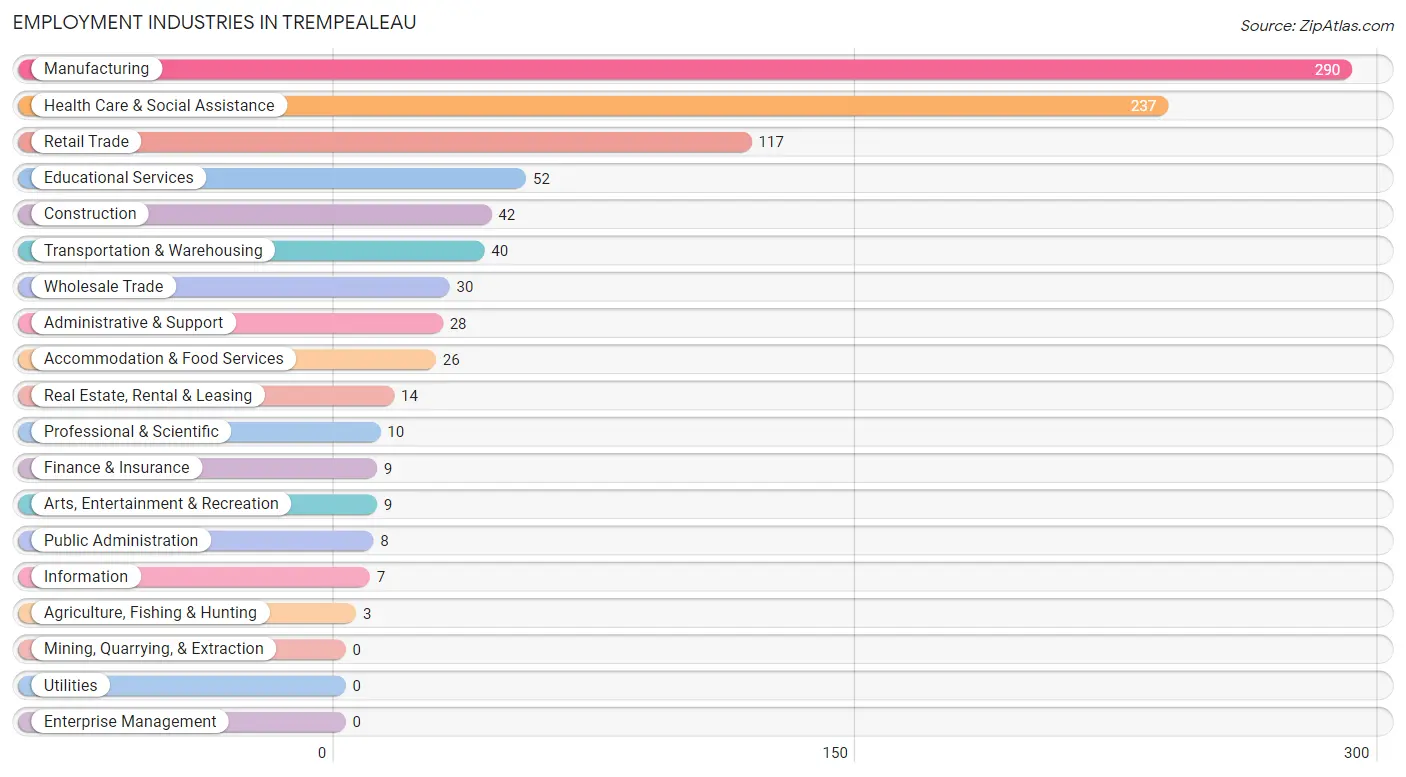
Employment Industries in Trempealeau
The major employment industries in Trempealeau include Manufacturing (290 | 30.9%), Health Care & Social Assistance (237 | 25.3%), Retail Trade (117 | 12.5%), Educational Services (52 | 5.5%), and Construction (42 | 4.5%).
Employment Industries by Sex in Trempealeau
The Trempealeau industries that see more men than women are Agriculture, Fishing & Hunting (100.0%), Wholesale Trade (100.0%), and Public Administration (100.0%), whereas the industries that tend to have a higher number of women are Information (100.0%), Finance & Insurance (100.0%), and Arts, Entertainment & Recreation (100.0%).
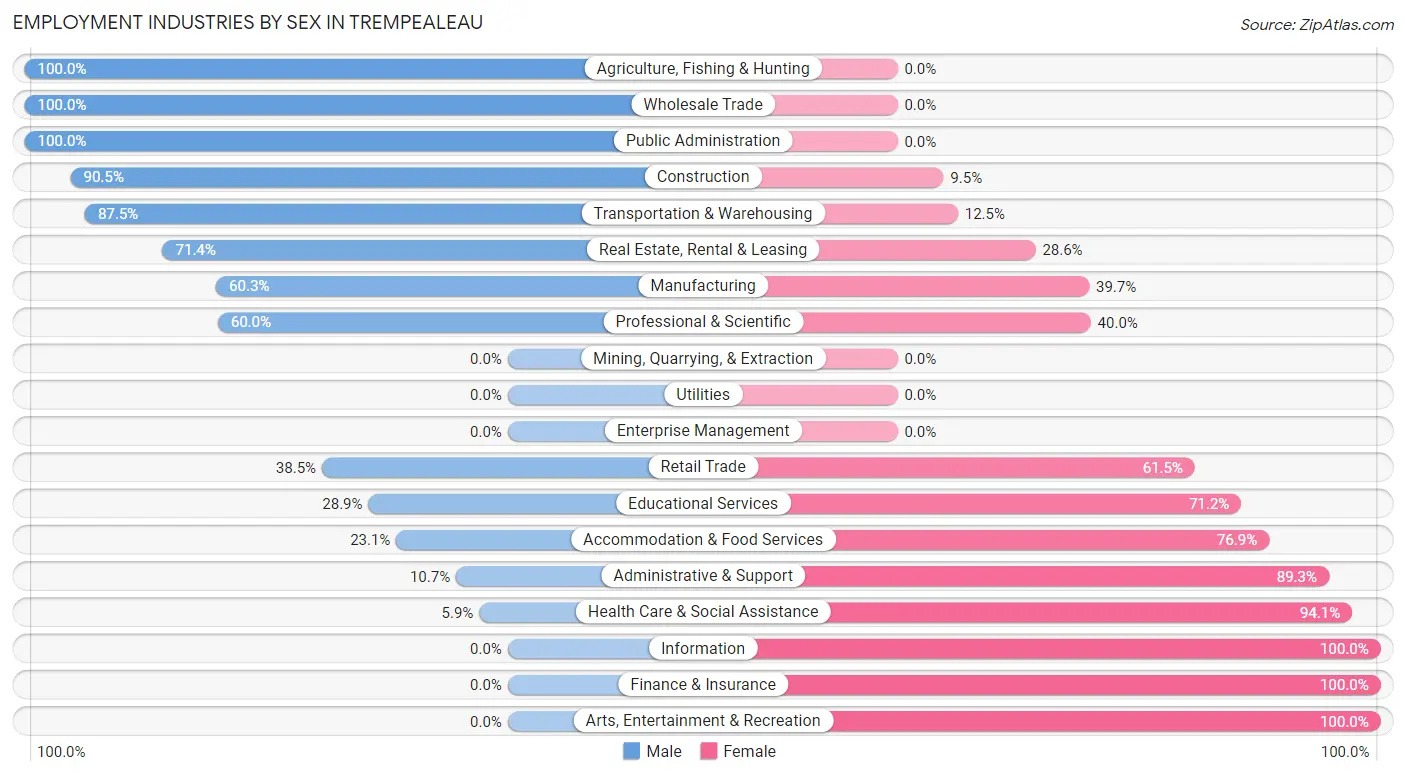
| Industry | Male | Female |
| Agriculture, Fishing & Hunting | 3 (100.0%) | 0 (0.0%) |
| Mining, Quarrying, & Extraction | 0 (0.0%) | 0 (0.0%) |
| Construction | 38 (90.5%) | 4 (9.5%) |
| Manufacturing | 175 (60.3%) | 115 (39.7%) |
| Wholesale Trade | 30 (100.0%) | 0 (0.0%) |
| Retail Trade | 45 (38.5%) | 72 (61.5%) |
| Transportation & Warehousing | 35 (87.5%) | 5 (12.5%) |
| Utilities | 0 (0.0%) | 0 (0.0%) |
| Information | 0 (0.0%) | 7 (100.0%) |
| Finance & Insurance | 0 (0.0%) | 9 (100.0%) |
| Real Estate, Rental & Leasing | 10 (71.4%) | 4 (28.6%) |
| Professional & Scientific | 6 (60.0%) | 4 (40.0%) |
| Enterprise Management | 0 (0.0%) | 0 (0.0%) |
| Administrative & Support | 3 (10.7%) | 25 (89.3%) |
| Educational Services | 15 (28.8%) | 37 (71.2%) |
| Health Care & Social Assistance | 14 (5.9%) | 223 (94.1%) |
| Arts, Entertainment & Recreation | 0 (0.0%) | 9 (100.0%) |
| Accommodation & Food Services | 6 (23.1%) | 20 (76.9%) |
| Public Administration | 8 (100.0%) | 0 (0.0%) |
| Total | 402 (42.9%) | 536 (57.1%) |
Education in Trempealeau
School Enrollment in Trempealeau
The most common levels of schooling among the 401 students in Trempealeau are college / undergraduate (152 | 37.9%), elementary school (91 | 22.7%), and high school (67 | 16.7%).
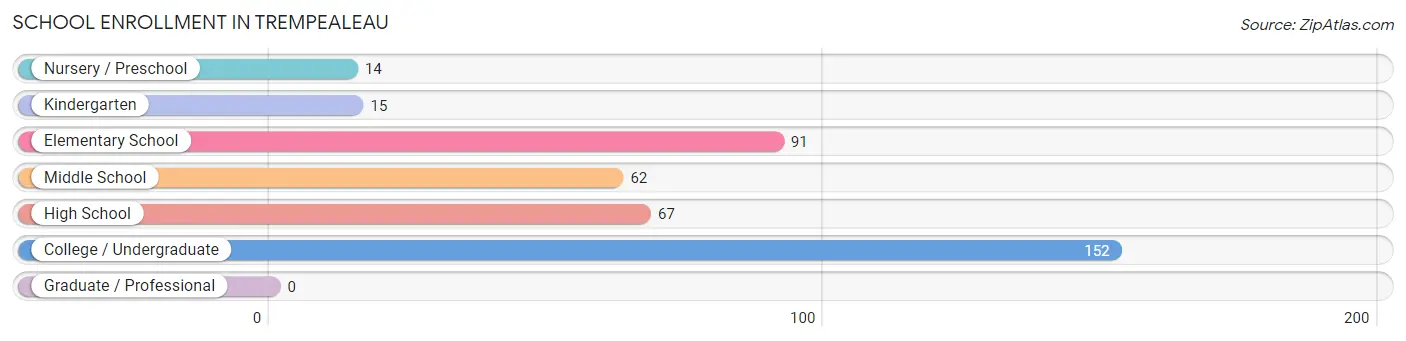
| School Level | # Students | % Students |
| Nursery / Preschool | 14 | 3.5% |
| Kindergarten | 15 | 3.7% |
| Elementary School | 91 | 22.7% |
| Middle School | 62 | 15.5% |
| High School | 67 | 16.7% |
| College / Undergraduate | 152 | 37.9% |
| Graduate / Professional | 0 | 0.0% |
| Total | 401 | 100.0% |
School Enrollment by Age by Funding Source in Trempealeau
Out of a total of 401 students who are enrolled in schools in Trempealeau, 33 (8.2%) attend a private institution, while the remaining 368 (91.8%) are enrolled in public schools. The age group of 35 years and over has the highest likelihood of being enrolled in private schools, with 4 (36.4% in the age bracket) enrolled. Conversely, the age group of 5 to 9 year old has the lowest likelihood of being enrolled in a private school, with 80 (100.0% in the age bracket) attending a public institution.
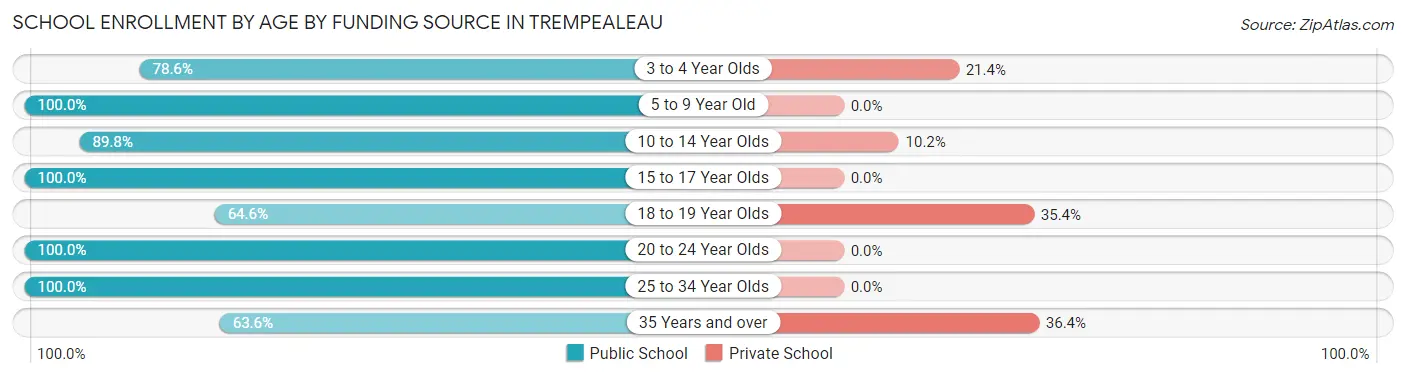
| Age Bracket | Public School | Private School |
| 3 to 4 Year Olds | 11 (78.6%) | 3 (21.4%) |
| 5 to 9 Year Old | 80 (100.0%) | 0 (0.0%) |
| 10 to 14 Year Olds | 79 (89.8%) | 9 (10.2%) |
| 15 to 17 Year Olds | 67 (100.0%) | 0 (0.0%) |
| 18 to 19 Year Olds | 31 (64.6%) | 17 (35.4%) |
| 20 to 24 Year Olds | 86 (100.0%) | 0 (0.0%) |
| 25 to 34 Year Olds | 7 (100.0%) | 0 (0.0%) |
| 35 Years and over | 7 (63.6%) | 4 (36.4%) |
| Total | 368 (91.8%) | 33 (8.2%) |
Educational Attainment by Field of Study in Trempealeau
Business (94 | 30.0%), education (79 | 25.2%), literature & languages (28 | 8.9%), bio, nature & agricultural (22 | 7.0%), and visual & performing arts (22 | 7.0%) are the most common fields of study among 313 individuals in Trempealeau who have obtained a bachelor's degree or higher.
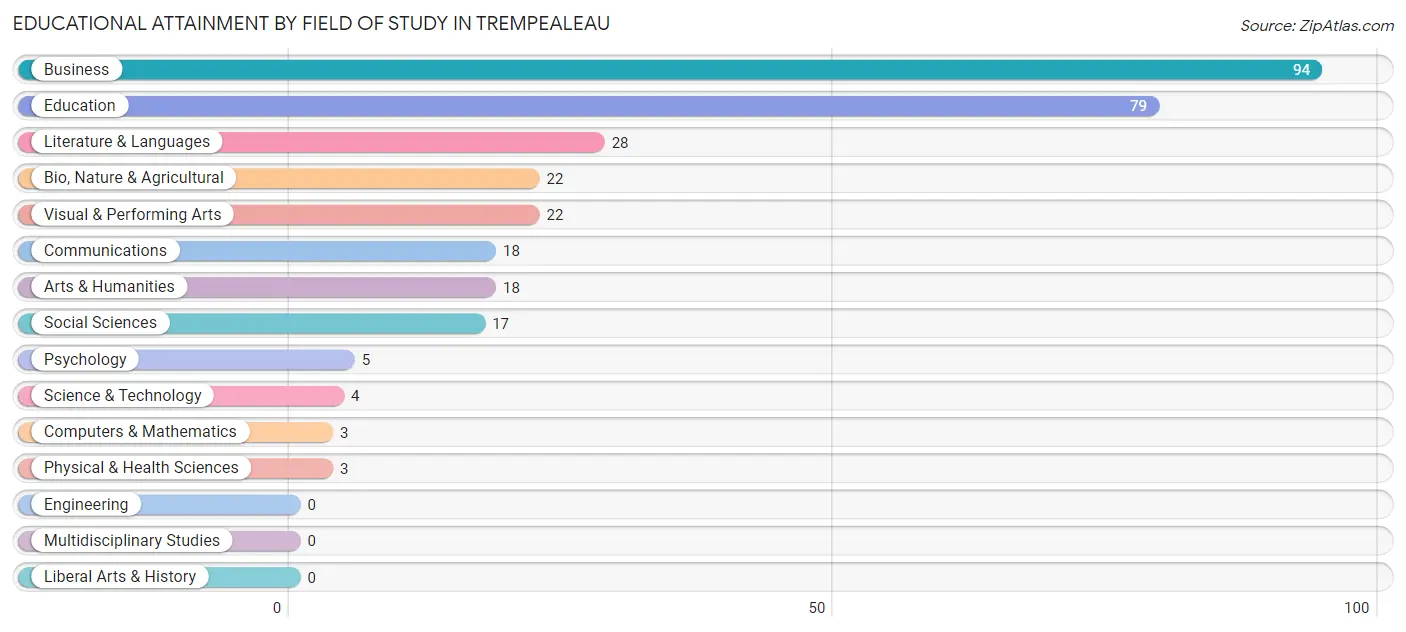
| Field of Study | # Graduates | % Graduates |
| Computers & Mathematics | 3 | 1.0% |
| Bio, Nature & Agricultural | 22 | 7.0% |
| Physical & Health Sciences | 3 | 1.0% |
| Psychology | 5 | 1.6% |
| Social Sciences | 17 | 5.4% |
| Engineering | 0 | 0.0% |
| Multidisciplinary Studies | 0 | 0.0% |
| Science & Technology | 4 | 1.3% |
| Business | 94 | 30.0% |
| Education | 79 | 25.2% |
| Literature & Languages | 28 | 8.9% |
| Liberal Arts & History | 0 | 0.0% |
| Visual & Performing Arts | 22 | 7.0% |
| Communications | 18 | 5.8% |
| Arts & Humanities | 18 | 5.8% |
| Total | 313 | 100.0% |
Transportation & Commute in Trempealeau
Vehicle Availability by Sex in Trempealeau
The most prevalent vehicle ownership categories in Trempealeau are males with 2 vehicles (147, accounting for 36.6%) and females with 2 vehicles (174, making up 27.4%).
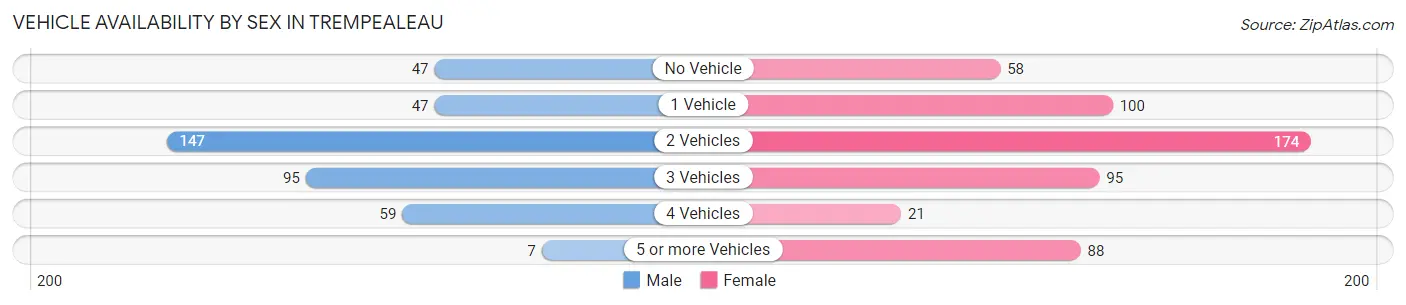
| Vehicles Available | Male | Female |
| No Vehicle | 47 (11.7%) | 58 (10.8%) |
| 1 Vehicle | 47 (11.7%) | 100 (18.7%) |
| 2 Vehicles | 147 (36.6%) | 174 (32.5%) |
| 3 Vehicles | 95 (23.6%) | 95 (17.7%) |
| 4 Vehicles | 59 (14.7%) | 21 (3.9%) |
| 5 or more Vehicles | 7 (1.7%) | 88 (16.4%) |
| Total | 402 (100.0%) | 536 (100.0%) |
Commute Time in Trempealeau
The most frequently occuring commute durations in Trempealeau are 25 to 29 minutes (183 commuters, 20.6%), 30 to 34 minutes (141 commuters, 15.9%), and 20 to 24 minutes (135 commuters, 15.2%).
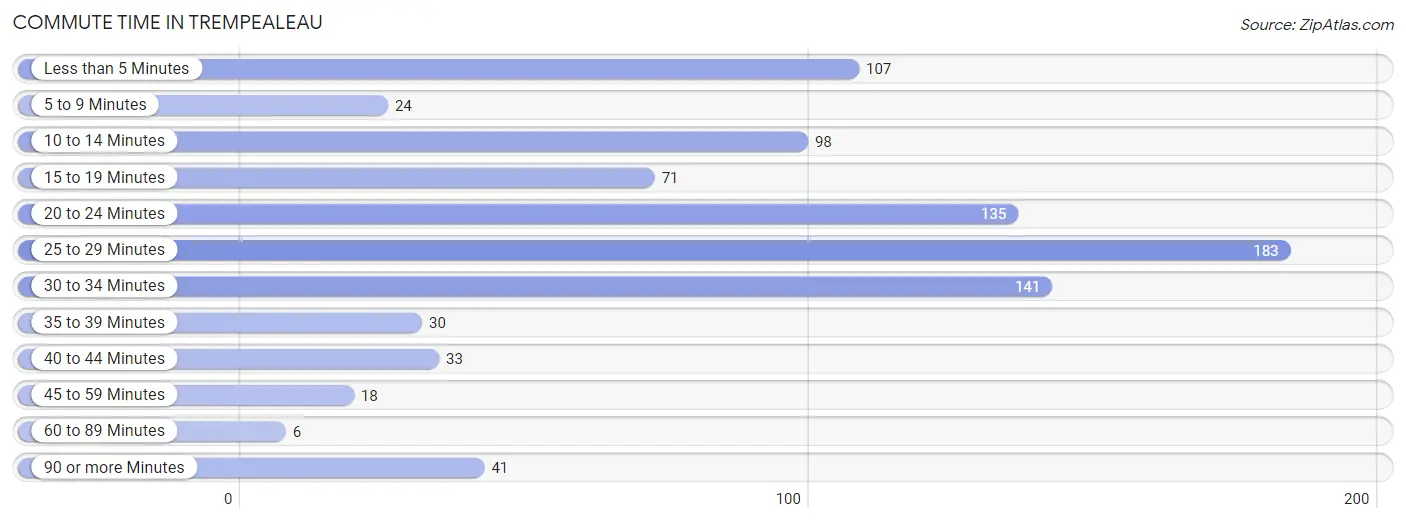
| Commute Time | # Commuters | % Commuters |
| Less than 5 Minutes | 107 | 12.1% |
| 5 to 9 Minutes | 24 | 2.7% |
| 10 to 14 Minutes | 98 | 11.1% |
| 15 to 19 Minutes | 71 | 8.0% |
| 20 to 24 Minutes | 135 | 15.2% |
| 25 to 29 Minutes | 183 | 20.6% |
| 30 to 34 Minutes | 141 | 15.9% |
| 35 to 39 Minutes | 30 | 3.4% |
| 40 to 44 Minutes | 33 | 3.7% |
| 45 to 59 Minutes | 18 | 2.0% |
| 60 to 89 Minutes | 6 | 0.7% |
| 90 or more Minutes | 41 | 4.6% |
Commute Time by Sex in Trempealeau
The most common commute times in Trempealeau are 25 to 29 minutes (137 commuters, 36.4%) for males and less than 5 minutes (103 commuters, 20.2%) for females.
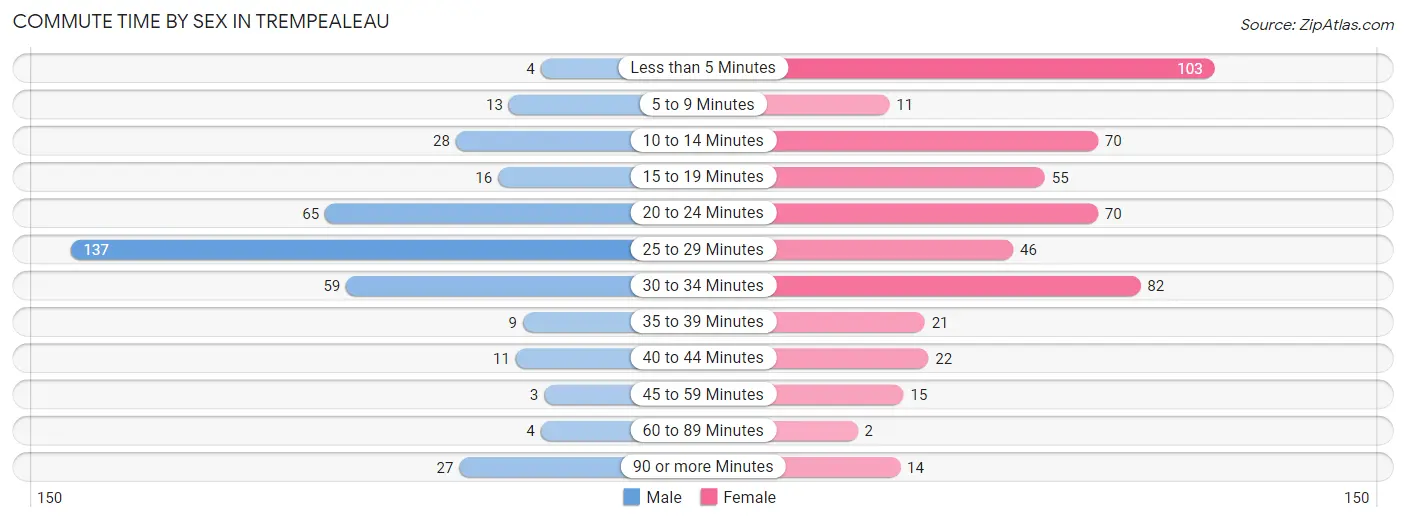
| Commute Time | Male | Female |
| Less than 5 Minutes | 4 (1.1%) | 103 (20.2%) |
| 5 to 9 Minutes | 13 (3.5%) | 11 (2.1%) |
| 10 to 14 Minutes | 28 (7.4%) | 70 (13.7%) |
| 15 to 19 Minutes | 16 (4.3%) | 55 (10.8%) |
| 20 to 24 Minutes | 65 (17.3%) | 70 (13.7%) |
| 25 to 29 Minutes | 137 (36.4%) | 46 (9.0%) |
| 30 to 34 Minutes | 59 (15.7%) | 82 (16.1%) |
| 35 to 39 Minutes | 9 (2.4%) | 21 (4.1%) |
| 40 to 44 Minutes | 11 (2.9%) | 22 (4.3%) |
| 45 to 59 Minutes | 3 (0.8%) | 15 (2.9%) |
| 60 to 89 Minutes | 4 (1.1%) | 2 (0.4%) |
| 90 or more Minutes | 27 (7.2%) | 14 (2.7%) |
Time of Departure to Work by Sex in Trempealeau
The most frequent times of departure to work in Trempealeau are 6:30 AM to 6:59 AM (65, 17.3%) for males and 7:30 AM to 7:59 AM (119, 23.3%) for females.
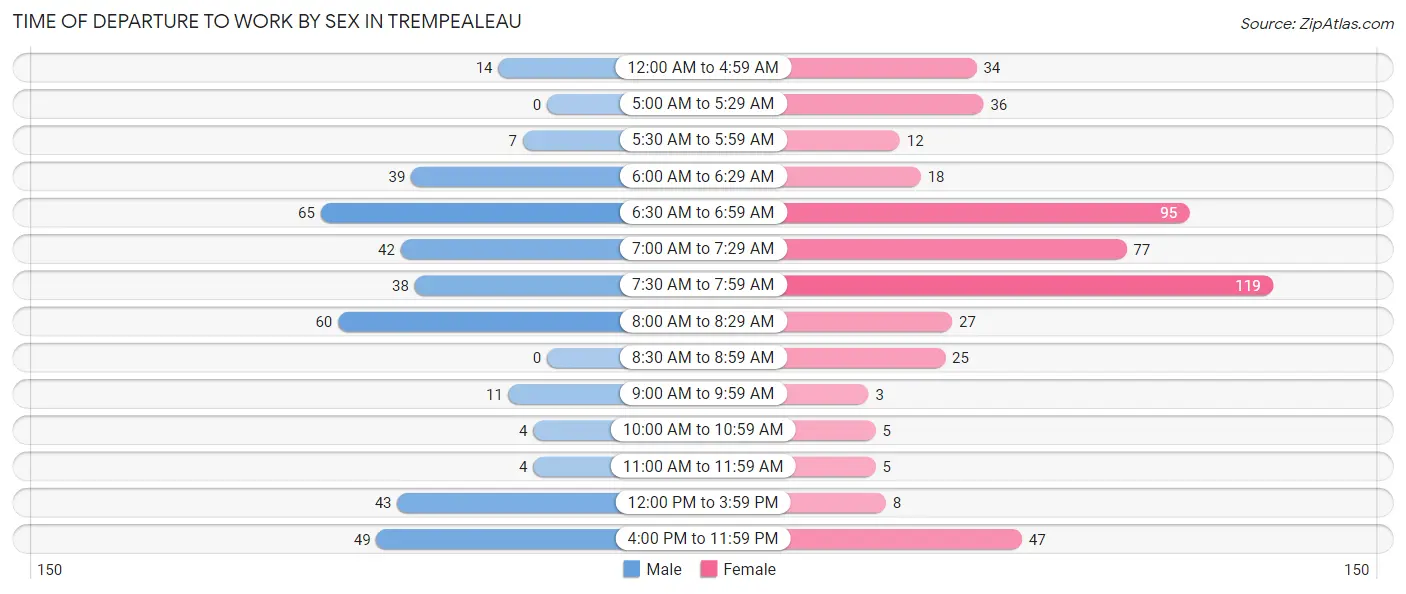
| Time of Departure | Male | Female |
| 12:00 AM to 4:59 AM | 14 (3.7%) | 34 (6.7%) |
| 5:00 AM to 5:29 AM | 0 (0.0%) | 36 (7.0%) |
| 5:30 AM to 5:59 AM | 7 (1.9%) | 12 (2.4%) |
| 6:00 AM to 6:29 AM | 39 (10.4%) | 18 (3.5%) |
| 6:30 AM to 6:59 AM | 65 (17.3%) | 95 (18.6%) |
| 7:00 AM to 7:29 AM | 42 (11.2%) | 77 (15.1%) |
| 7:30 AM to 7:59 AM | 38 (10.1%) | 119 (23.3%) |
| 8:00 AM to 8:29 AM | 60 (16.0%) | 27 (5.3%) |
| 8:30 AM to 8:59 AM | 0 (0.0%) | 25 (4.9%) |
| 9:00 AM to 9:59 AM | 11 (2.9%) | 3 (0.6%) |
| 10:00 AM to 10:59 AM | 4 (1.1%) | 5 (1.0%) |
| 11:00 AM to 11:59 AM | 4 (1.1%) | 5 (1.0%) |
| 12:00 PM to 3:59 PM | 43 (11.4%) | 8 (1.6%) |
| 4:00 PM to 11:59 PM | 49 (13.0%) | 47 (9.2%) |
| Total | 376 (100.0%) | 511 (100.0%) |
Housing Occupancy in Trempealeau
Occupancy by Ownership in Trempealeau
Of the total 806 dwellings in Trempealeau, owner-occupied units account for 514 (63.8%), while renter-occupied units make up 292 (36.2%).
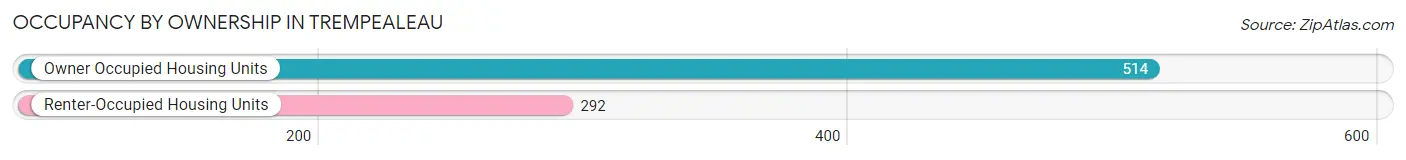
| Occupancy | # Housing Units | % Housing Units |
| Owner Occupied Housing Units | 514 | 63.8% |
| Renter-Occupied Housing Units | 292 | 36.2% |
| Total Occupied Housing Units | 806 | 100.0% |
Occupancy by Household Size in Trempealeau
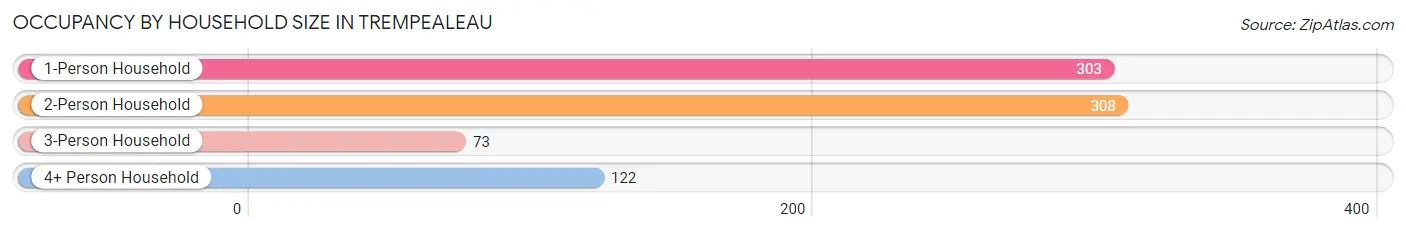
| Household Size | # Housing Units | % Housing Units |
| 1-Person Household | 303 | 37.6% |
| 2-Person Household | 308 | 38.2% |
| 3-Person Household | 73 | 9.1% |
| 4+ Person Household | 122 | 15.1% |
| Total Housing Units | 806 | 100.0% |
Occupancy by Ownership by Household Size in Trempealeau
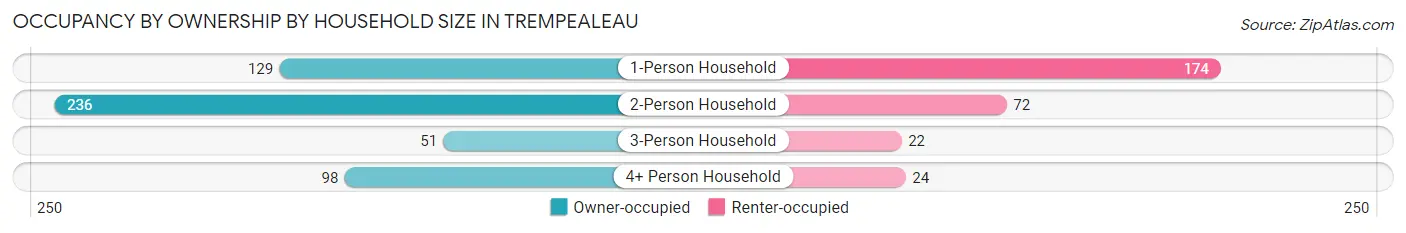
| Household Size | Owner-occupied | Renter-occupied |
| 1-Person Household | 129 (42.6%) | 174 (57.4%) |
| 2-Person Household | 236 (76.6%) | 72 (23.4%) |
| 3-Person Household | 51 (69.9%) | 22 (30.1%) |
| 4+ Person Household | 98 (80.3%) | 24 (19.7%) |
| Total Housing Units | 514 (63.8%) | 292 (36.2%) |
Occupancy by Educational Attainment in Trempealeau
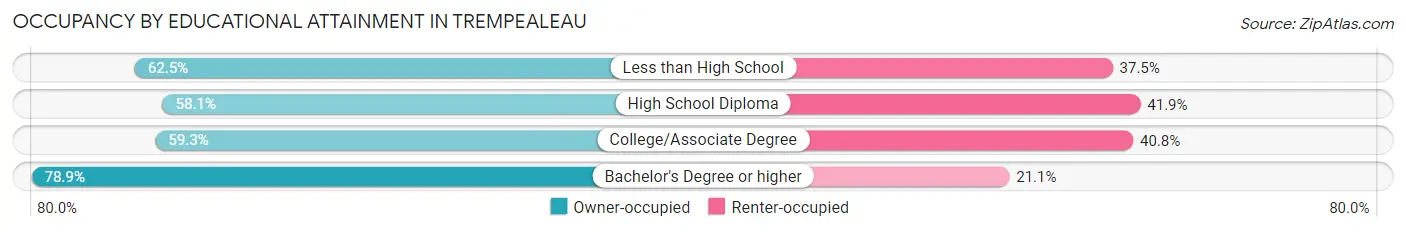
| Household Size | Owner-occupied | Renter-occupied |
| Less than High School | 5 (62.5%) | 3 (37.5%) |
| High School Diploma | 147 (58.1%) | 106 (41.9%) |
| College/Associate Degree | 205 (59.3%) | 141 (40.7%) |
| Bachelor's Degree or higher | 157 (78.9%) | 42 (21.1%) |
Occupancy by Age of Householder in Trempealeau
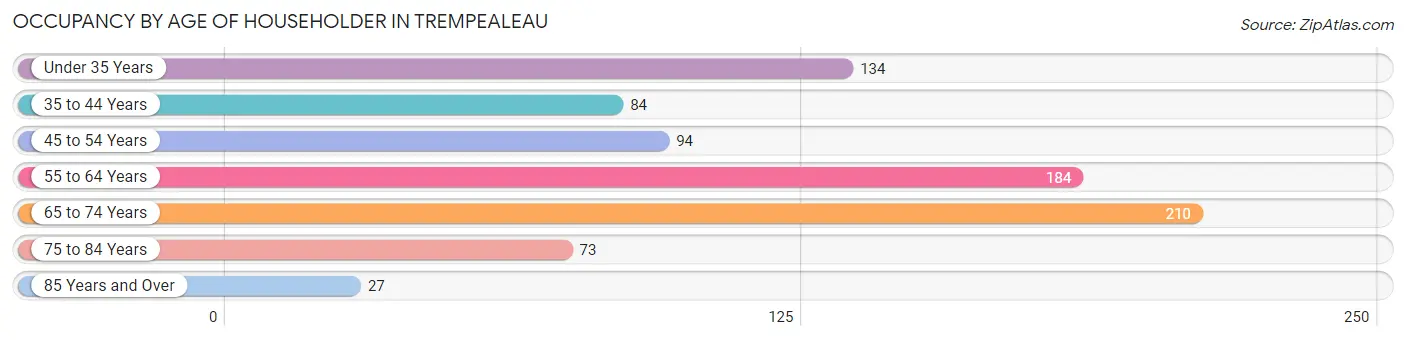
| Age Bracket | # Households | % Households |
| Under 35 Years | 134 | 16.6% |
| 35 to 44 Years | 84 | 10.4% |
| 45 to 54 Years | 94 | 11.7% |
| 55 to 64 Years | 184 | 22.8% |
| 65 to 74 Years | 210 | 26.1% |
| 75 to 84 Years | 73 | 9.1% |
| 85 Years and Over | 27 | 3.4% |
| Total | 806 | 100.0% |
Housing Finances in Trempealeau
Median Income by Occupancy in Trempealeau
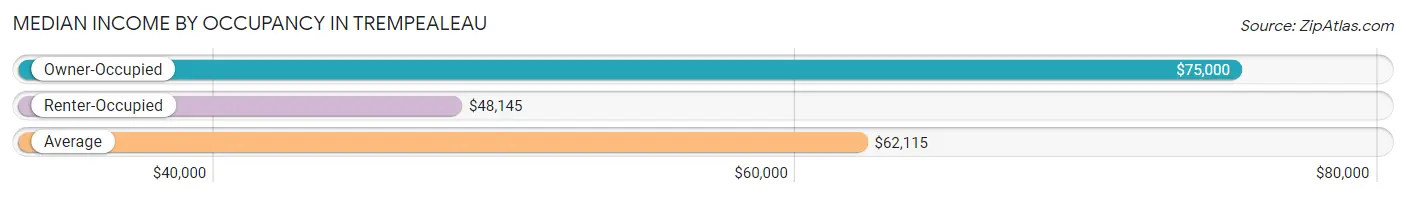
| Occupancy Type | # Households | Median Income |
| Owner-Occupied | 514 (63.8%) | $75,000 |
| Renter-Occupied | 292 (36.2%) | $48,145 |
| Average | 806 (100.0%) | $62,115 |
Occupancy by Householder Income Bracket in Trempealeau
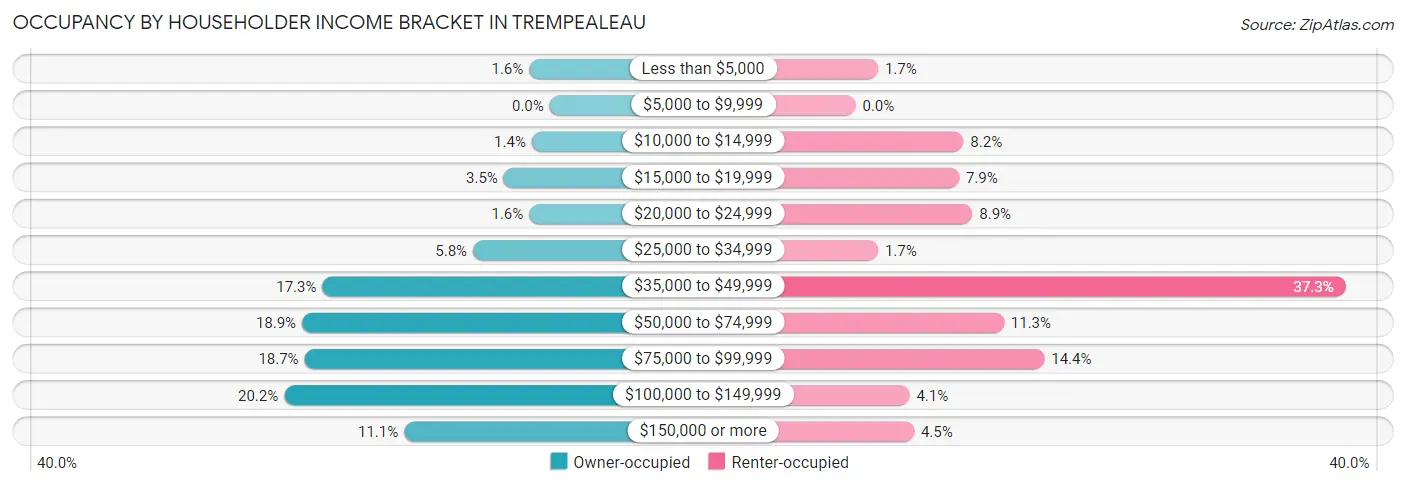
| Income Bracket | Owner-occupied | Renter-occupied |
| Less than $5,000 | 8 (1.6%) | 5 (1.7%) |
| $5,000 to $9,999 | 0 (0.0%) | 0 (0.0%) |
| $10,000 to $14,999 | 7 (1.4%) | 24 (8.2%) |
| $15,000 to $19,999 | 18 (3.5%) | 23 (7.9%) |
| $20,000 to $24,999 | 8 (1.6%) | 26 (8.9%) |
| $25,000 to $34,999 | 30 (5.8%) | 5 (1.7%) |
| $35,000 to $49,999 | 89 (17.3%) | 109 (37.3%) |
| $50,000 to $74,999 | 97 (18.9%) | 33 (11.3%) |
| $75,000 to $99,999 | 96 (18.7%) | 42 (14.4%) |
| $100,000 to $149,999 | 104 (20.2%) | 12 (4.1%) |
| $150,000 or more | 57 (11.1%) | 13 (4.4%) |
| Total | 514 (100.0%) | 292 (100.0%) |
Monthly Housing Cost Tiers in Trempealeau
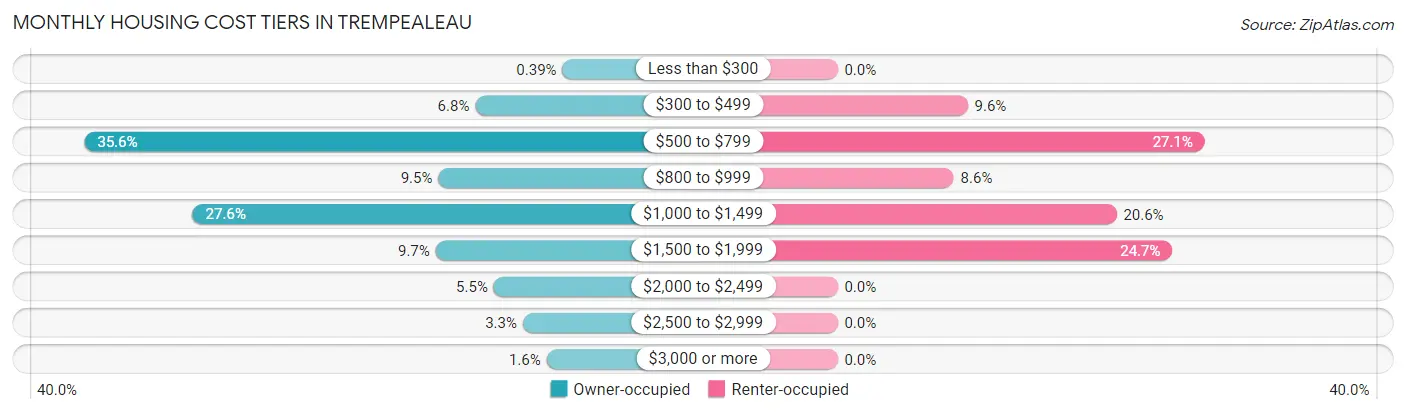
| Monthly Cost | Owner-occupied | Renter-occupied |
| Less than $300 | 2 (0.4%) | 0 (0.0%) |
| $300 to $499 | 35 (6.8%) | 28 (9.6%) |
| $500 to $799 | 183 (35.6%) | 79 (27.1%) |
| $800 to $999 | 49 (9.5%) | 25 (8.6%) |
| $1,000 to $1,499 | 142 (27.6%) | 60 (20.5%) |
| $1,500 to $1,999 | 50 (9.7%) | 72 (24.7%) |
| $2,000 to $2,499 | 28 (5.4%) | 0 (0.0%) |
| $2,500 to $2,999 | 17 (3.3%) | 0 (0.0%) |
| $3,000 or more | 8 (1.6%) | 0 (0.0%) |
| Total | 514 (100.0%) | 292 (100.0%) |
Physical Housing Characteristics in Trempealeau
Housing Structures in Trempealeau
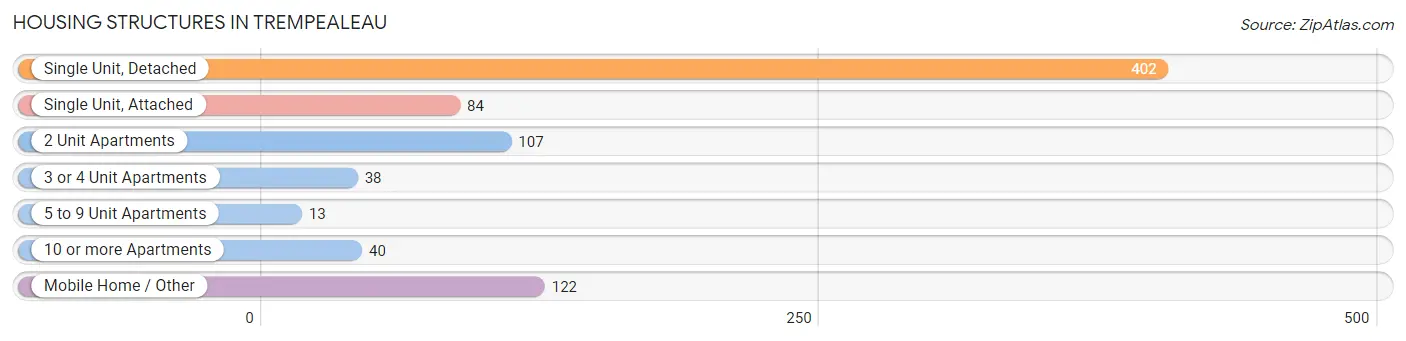
| Structure Type | # Housing Units | % Housing Units |
| Single Unit, Detached | 402 | 49.9% |
| Single Unit, Attached | 84 | 10.4% |
| 2 Unit Apartments | 107 | 13.3% |
| 3 or 4 Unit Apartments | 38 | 4.7% |
| 5 to 9 Unit Apartments | 13 | 1.6% |
| 10 or more Apartments | 40 | 5.0% |
| Mobile Home / Other | 122 | 15.1% |
| Total | 806 | 100.0% |
Housing Structures by Occupancy in Trempealeau
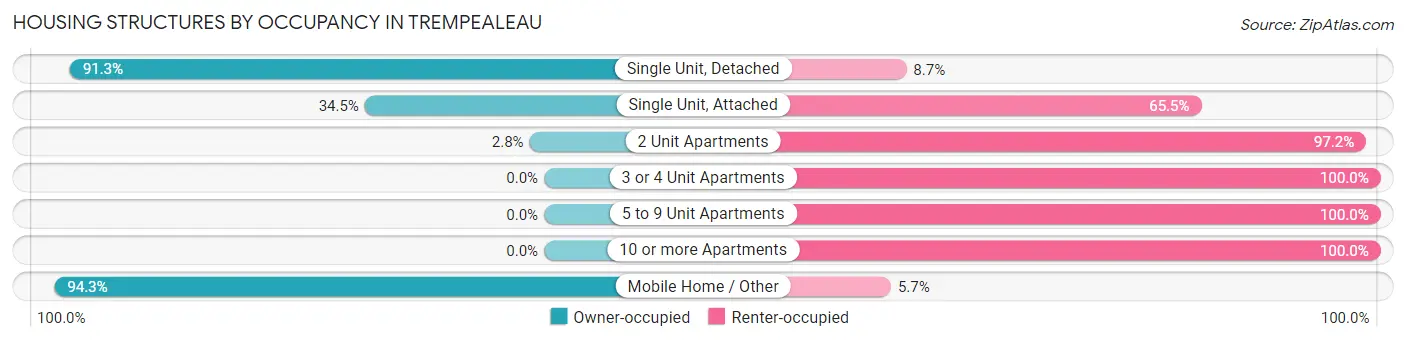
| Structure Type | Owner-occupied | Renter-occupied |
| Single Unit, Detached | 367 (91.3%) | 35 (8.7%) |
| Single Unit, Attached | 29 (34.5%) | 55 (65.5%) |
| 2 Unit Apartments | 3 (2.8%) | 104 (97.2%) |
| 3 or 4 Unit Apartments | 0 (0.0%) | 38 (100.0%) |
| 5 to 9 Unit Apartments | 0 (0.0%) | 13 (100.0%) |
| 10 or more Apartments | 0 (0.0%) | 40 (100.0%) |
| Mobile Home / Other | 115 (94.3%) | 7 (5.7%) |
| Total | 514 (63.8%) | 292 (36.2%) |
Housing Structures by Number of Rooms in Trempealeau
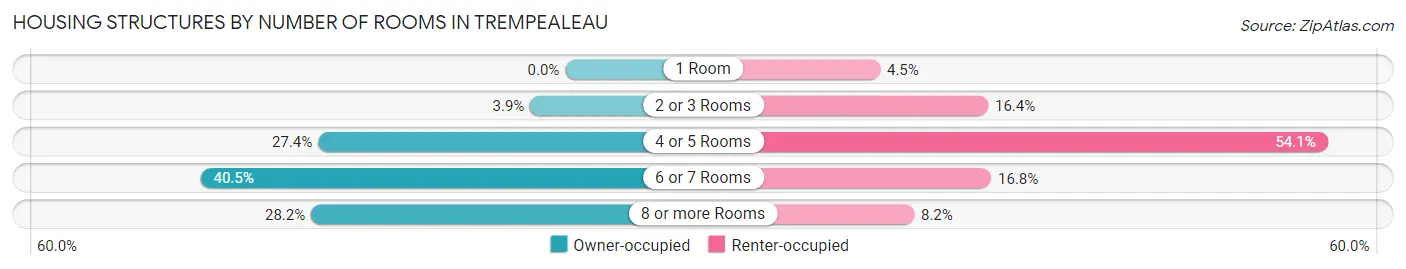
| Number of Rooms | Owner-occupied | Renter-occupied |
| 1 Room | 0 (0.0%) | 13 (4.4%) |
| 2 or 3 Rooms | 20 (3.9%) | 48 (16.4%) |
| 4 or 5 Rooms | 141 (27.4%) | 158 (54.1%) |
| 6 or 7 Rooms | 208 (40.5%) | 49 (16.8%) |
| 8 or more Rooms | 145 (28.2%) | 24 (8.2%) |
| Total | 514 (100.0%) | 292 (100.0%) |
Housing Structure by Heating Type in Trempealeau
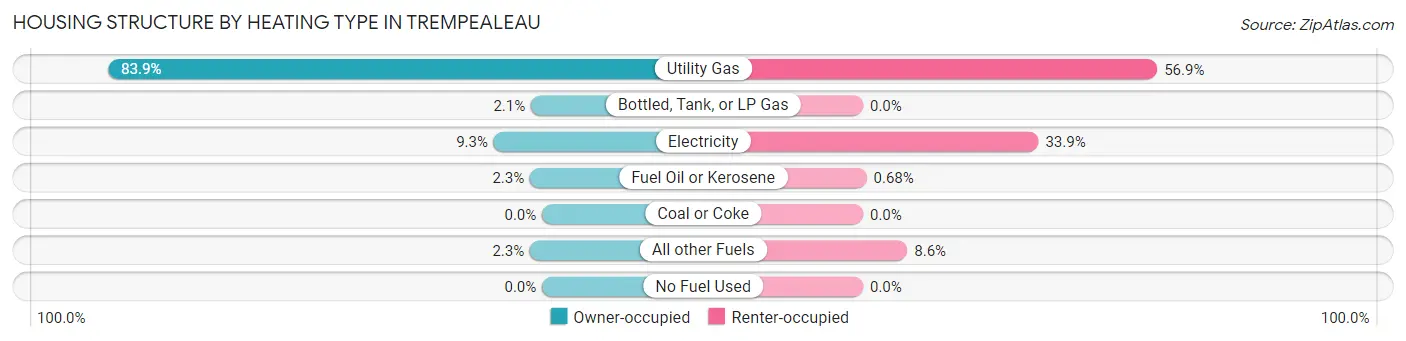
| Heating Type | Owner-occupied | Renter-occupied |
| Utility Gas | 431 (83.9%) | 166 (56.9%) |
| Bottled, Tank, or LP Gas | 11 (2.1%) | 0 (0.0%) |
| Electricity | 48 (9.3%) | 99 (33.9%) |
| Fuel Oil or Kerosene | 12 (2.3%) | 2 (0.7%) |
| Coal or Coke | 0 (0.0%) | 0 (0.0%) |
| All other Fuels | 12 (2.3%) | 25 (8.6%) |
| No Fuel Used | 0 (0.0%) | 0 (0.0%) |
| Total | 514 (100.0%) | 292 (100.0%) |
Household Vehicle Usage in Trempealeau
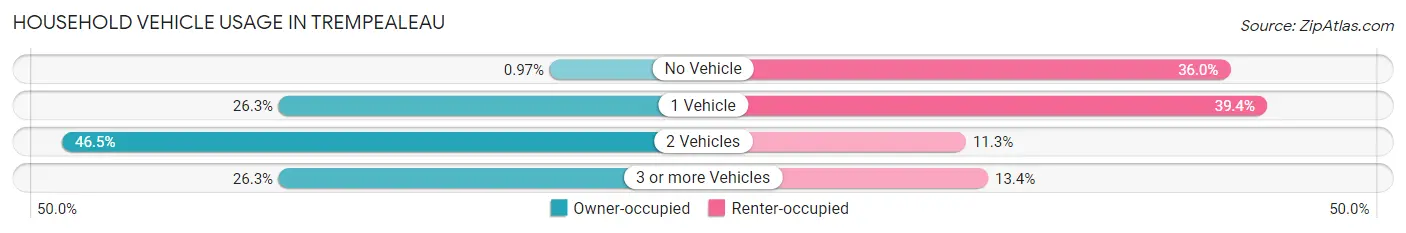
| Vehicles per Household | Owner-occupied | Renter-occupied |
| No Vehicle | 5 (1.0%) | 105 (36.0%) |
| 1 Vehicle | 135 (26.3%) | 115 (39.4%) |
| 2 Vehicles | 239 (46.5%) | 33 (11.3%) |
| 3 or more Vehicles | 135 (26.3%) | 39 (13.4%) |
| Total | 514 (100.0%) | 292 (100.0%) |
Real Estate & Mortgages in Trempealeau
Real Estate and Mortgage Overview in Trempealeau
| Characteristic | Without Mortgage | With Mortgage |
| Housing Units | 248 | 266 |
| Median Property Value | $168,500 | $200,000 |
| Median Household Income | $59,167 | $41 |
| Monthly Housing Costs | $641 | $8 |
| Real Estate Taxes | $3,327 | $18 |
Property Value by Mortgage Status in Trempealeau
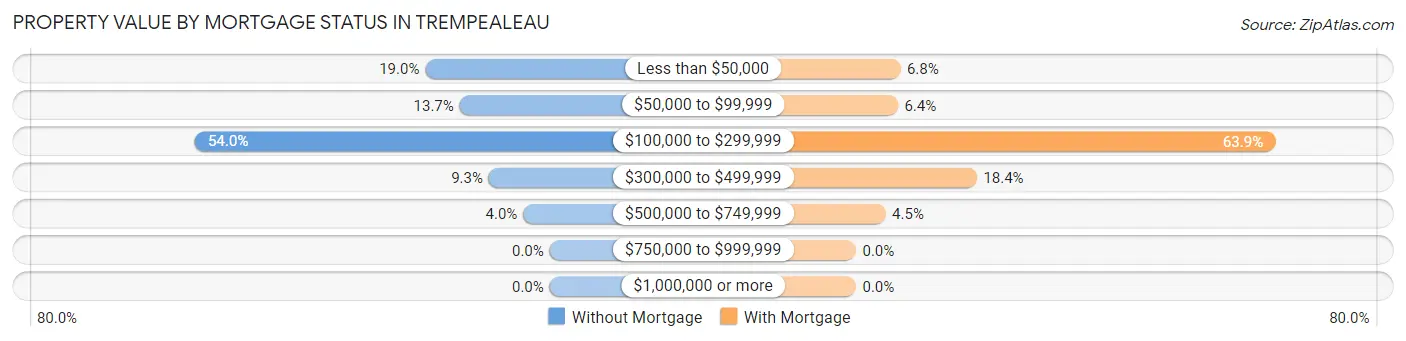
| Property Value | Without Mortgage | With Mortgage |
| Less than $50,000 | 47 (19.0%) | 18 (6.8%) |
| $50,000 to $99,999 | 34 (13.7%) | 17 (6.4%) |
| $100,000 to $299,999 | 134 (54.0%) | 170 (63.9%) |
| $300,000 to $499,999 | 23 (9.3%) | 49 (18.4%) |
| $500,000 to $749,999 | 10 (4.0%) | 12 (4.5%) |
| $750,000 to $999,999 | 0 (0.0%) | 0 (0.0%) |
| $1,000,000 or more | 0 (0.0%) | 0 (0.0%) |
| Total | 248 (100.0%) | 266 (100.0%) |
Household Income by Mortgage Status in Trempealeau
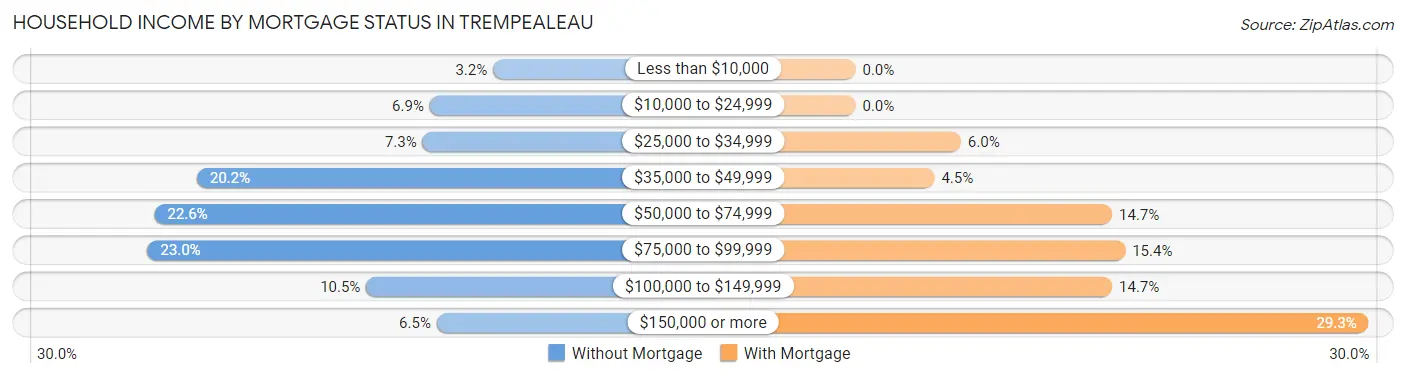
| Household Income | Without Mortgage | With Mortgage |
| Less than $10,000 | 8 (3.2%) | 0 (0.0%) |
| $10,000 to $24,999 | 17 (6.9%) | 0 (0.0%) |
| $25,000 to $34,999 | 18 (7.3%) | 16 (6.0%) |
| $35,000 to $49,999 | 50 (20.2%) | 12 (4.5%) |
| $50,000 to $74,999 | 56 (22.6%) | 39 (14.7%) |
| $75,000 to $99,999 | 57 (23.0%) | 41 (15.4%) |
| $100,000 to $149,999 | 26 (10.5%) | 39 (14.7%) |
| $150,000 or more | 16 (6.5%) | 78 (29.3%) |
| Total | 248 (100.0%) | 266 (100.0%) |
Property Value to Household Income Ratio in Trempealeau
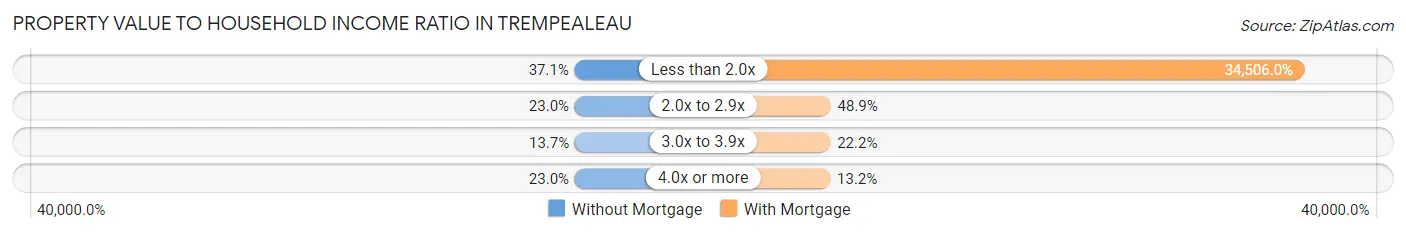
| Value-to-Income Ratio | Without Mortgage | With Mortgage |
| Less than 2.0x | 92 (37.1%) | 91,786 (34,506.0%) |
| 2.0x to 2.9x | 57 (23.0%) | 130 (48.9%) |
| 3.0x to 3.9x | 34 (13.7%) | 59 (22.2%) |
| 4.0x or more | 57 (23.0%) | 35 (13.2%) |
| Total | 248 (100.0%) | 266 (100.0%) |
Real Estate Taxes by Mortgage Status in Trempealeau
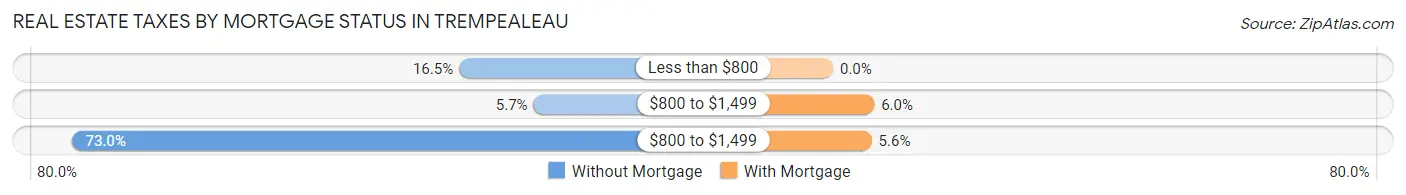
| Property Taxes | Without Mortgage | With Mortgage |
| Less than $800 | 41 (16.5%) | 0 (0.0%) |
| $800 to $1,499 | 14 (5.7%) | 16 (6.0%) |
| $800 to $1,499 | 181 (73.0%) | 15 (5.6%) |
| Total | 248 (100.0%) | 266 (100.0%) |
Health & Disability in Trempealeau
Health Insurance Coverage by Age in Trempealeau
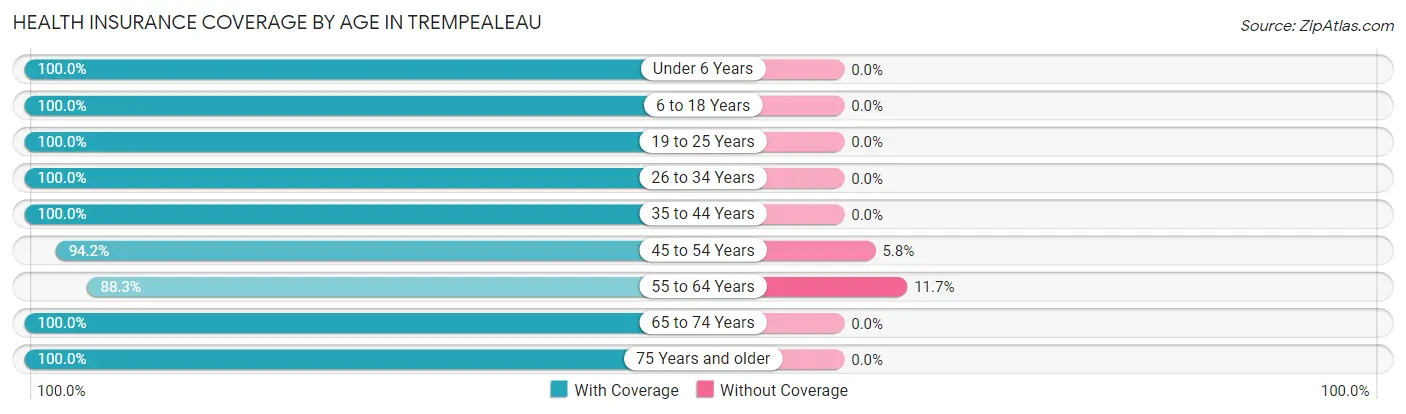
| Age Bracket | With Coverage | Without Coverage |
| Under 6 Years | 117 (100.0%) | 0 (0.0%) |
| 6 to 18 Years | 240 (100.0%) | 0 (0.0%) |
| 19 to 25 Years | 242 (100.0%) | 0 (0.0%) |
| 26 to 34 Years | 125 (100.0%) | 0 (0.0%) |
| 35 to 44 Years | 146 (100.0%) | 0 (0.0%) |
| 45 to 54 Years | 146 (94.2%) | 9 (5.8%) |
| 55 to 64 Years | 248 (88.3%) | 33 (11.7%) |
| 65 to 74 Years | 311 (100.0%) | 0 (0.0%) |
| 75 Years and older | 152 (100.0%) | 0 (0.0%) |
| Total | 1,727 (97.6%) | 42 (2.4%) |
Health Insurance Coverage by Citizenship Status in Trempealeau
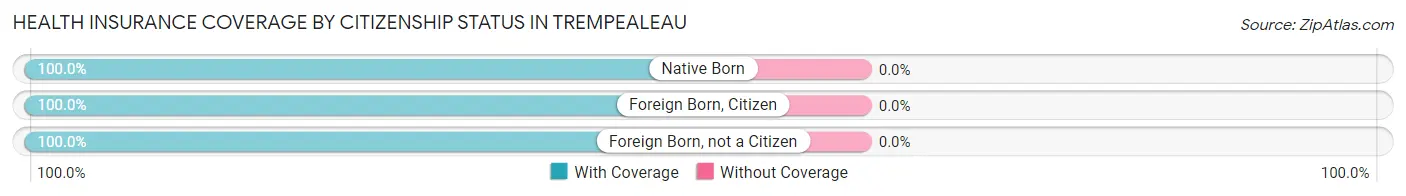
| Citizenship Status | With Coverage | Without Coverage |
| Native Born | 117 (100.0%) | 0 (0.0%) |
| Foreign Born, Citizen | 240 (100.0%) | 0 (0.0%) |
| Foreign Born, not a Citizen | 242 (100.0%) | 0 (0.0%) |
Health Insurance Coverage by Household Income in Trempealeau
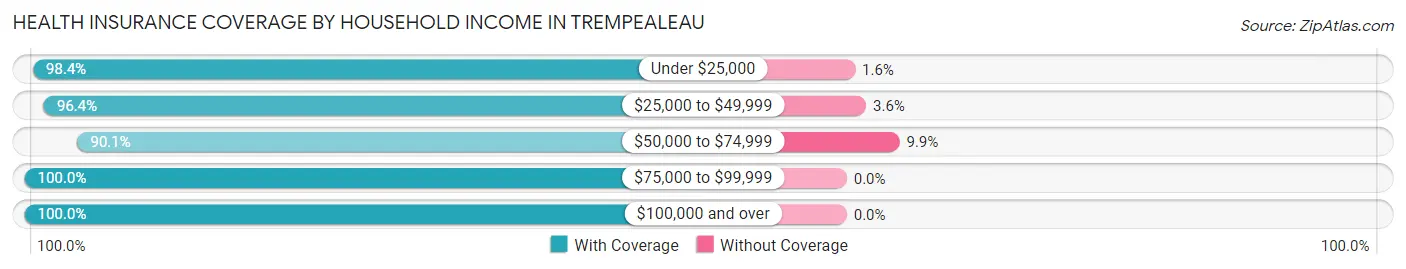
| Household Income | With Coverage | Without Coverage |
| Under $25,000 | 126 (98.4%) | 2 (1.6%) |
| $25,000 to $49,999 | 401 (96.4%) | 15 (3.6%) |
| $50,000 to $74,999 | 228 (90.1%) | 25 (9.9%) |
| $75,000 to $99,999 | 355 (100.0%) | 0 (0.0%) |
| $100,000 and over | 617 (100.0%) | 0 (0.0%) |
Public vs Private Health Insurance Coverage by Age in Trempealeau
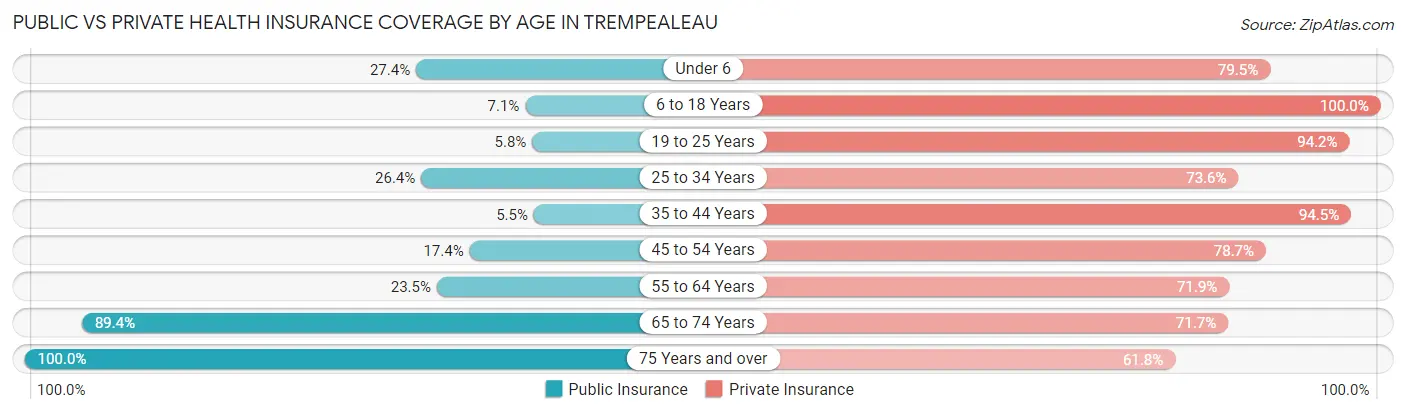
| Age Bracket | Public Insurance | Private Insurance |
| Under 6 | 32 (27.4%) | 93 (79.5%) |
| 6 to 18 Years | 17 (7.1%) | 240 (100.0%) |
| 19 to 25 Years | 14 (5.8%) | 228 (94.2%) |
| 25 to 34 Years | 33 (26.4%) | 92 (73.6%) |
| 35 to 44 Years | 8 (5.5%) | 138 (94.5%) |
| 45 to 54 Years | 27 (17.4%) | 122 (78.7%) |
| 55 to 64 Years | 66 (23.5%) | 202 (71.9%) |
| 65 to 74 Years | 278 (89.4%) | 223 (71.7%) |
| 75 Years and over | 152 (100.0%) | 94 (61.8%) |
| Total | 627 (35.4%) | 1,432 (80.9%) |
Disability Status by Sex by Age in Trempealeau
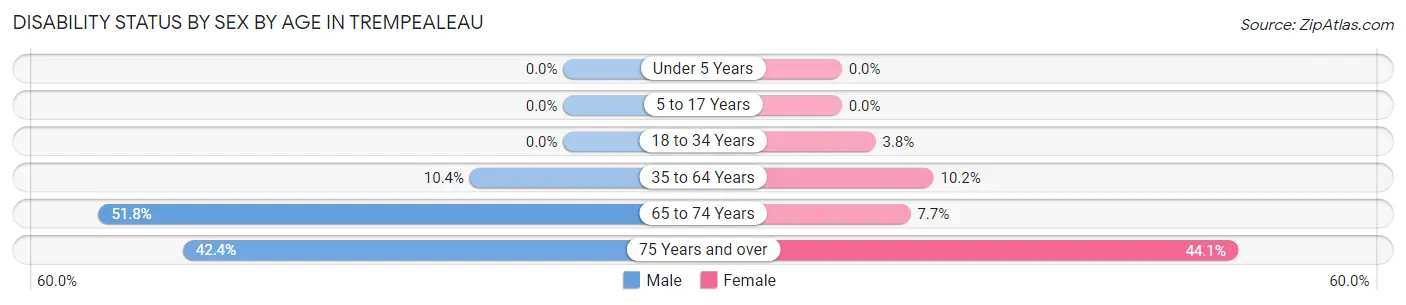
| Age Bracket | Male | Female |
| Under 5 Years | 0 (0.0%) | 0 (0.0%) |
| 5 to 17 Years | 0 (0.0%) | 0 (0.0%) |
| 18 to 34 Years | 0 (0.0%) | 8 (3.8%) |
| 35 to 64 Years | 28 (10.4%) | 32 (10.2%) |
| 65 to 74 Years | 73 (51.8%) | 13 (7.6%) |
| 75 Years and over | 25 (42.4%) | 41 (44.1%) |
Disability Class by Sex by Age in Trempealeau
Disability Class: Hearing Difficulty
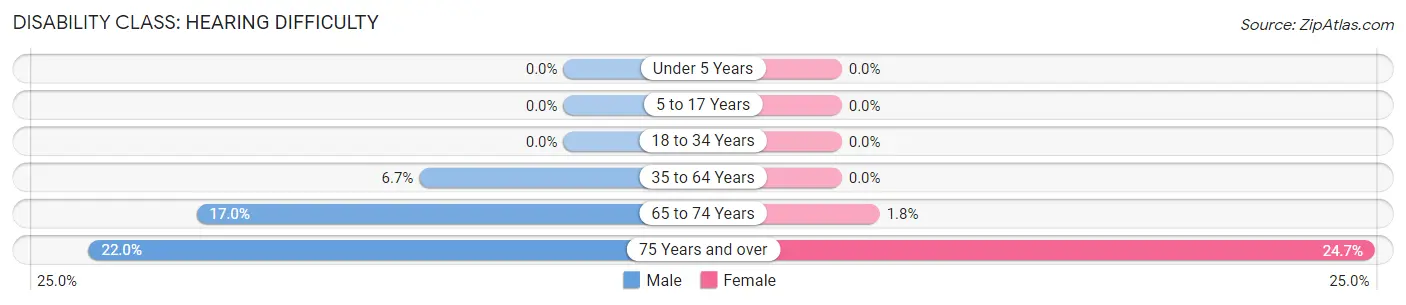
| Age Bracket | Male | Female |
| Under 5 Years | 0 (0.0%) | 0 (0.0%) |
| 5 to 17 Years | 0 (0.0%) | 0 (0.0%) |
| 18 to 34 Years | 0 (0.0%) | 0 (0.0%) |
| 35 to 64 Years | 18 (6.7%) | 0 (0.0%) |
| 65 to 74 Years | 24 (17.0%) | 3 (1.8%) |
| 75 Years and over | 13 (22.0%) | 23 (24.7%) |
Disability Class: Vision Difficulty
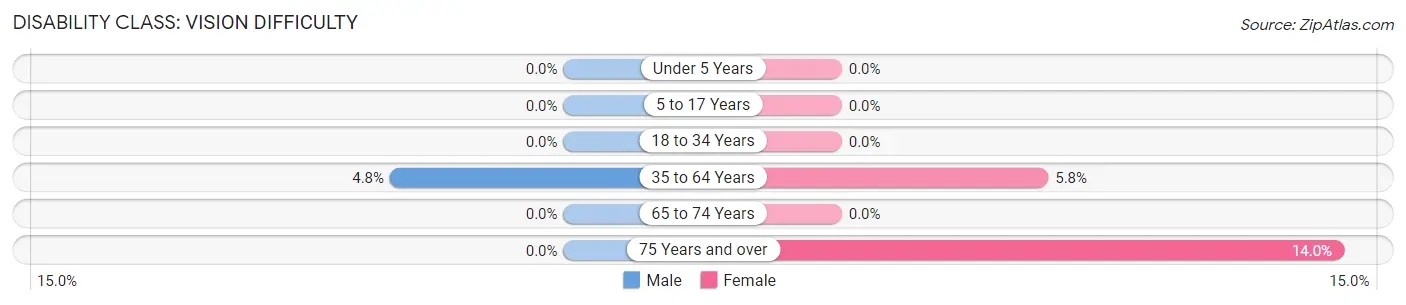
| Age Bracket | Male | Female |
| Under 5 Years | 0 (0.0%) | 0 (0.0%) |
| 5 to 17 Years | 0 (0.0%) | 0 (0.0%) |
| 18 to 34 Years | 0 (0.0%) | 0 (0.0%) |
| 35 to 64 Years | 13 (4.8%) | 18 (5.8%) |
| 65 to 74 Years | 0 (0.0%) | 0 (0.0%) |
| 75 Years and over | 0 (0.0%) | 13 (14.0%) |
Disability Class: Cognitive Difficulty
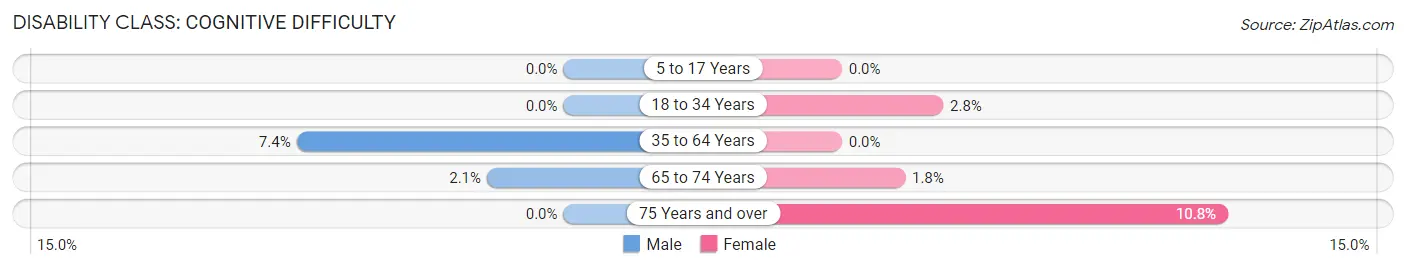
| Age Bracket | Male | Female |
| 5 to 17 Years | 0 (0.0%) | 0 (0.0%) |
| 18 to 34 Years | 0 (0.0%) | 6 (2.8%) |
| 35 to 64 Years | 20 (7.4%) | 0 (0.0%) |
| 65 to 74 Years | 3 (2.1%) | 3 (1.8%) |
| 75 Years and over | 0 (0.0%) | 10 (10.7%) |
Disability Class: Ambulatory Difficulty
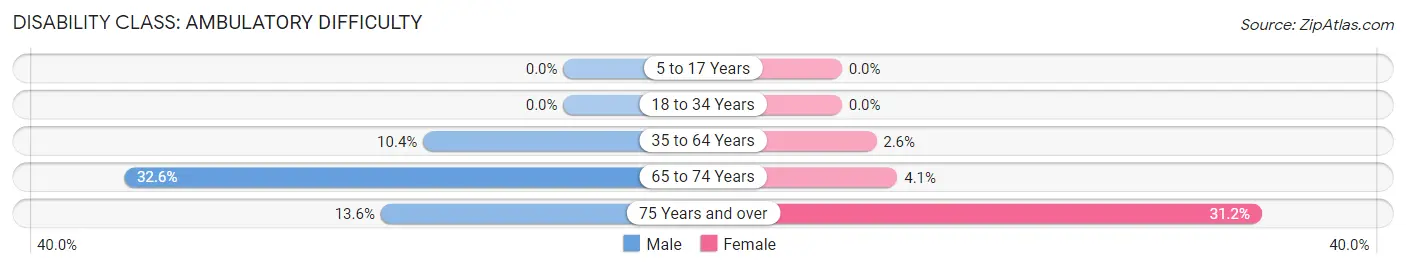
| Age Bracket | Male | Female |
| 5 to 17 Years | 0 (0.0%) | 0 (0.0%) |
| 18 to 34 Years | 0 (0.0%) | 0 (0.0%) |
| 35 to 64 Years | 28 (10.4%) | 8 (2.6%) |
| 65 to 74 Years | 46 (32.6%) | 7 (4.1%) |
| 75 Years and over | 8 (13.6%) | 29 (31.2%) |
Disability Class: Self-Care Difficulty
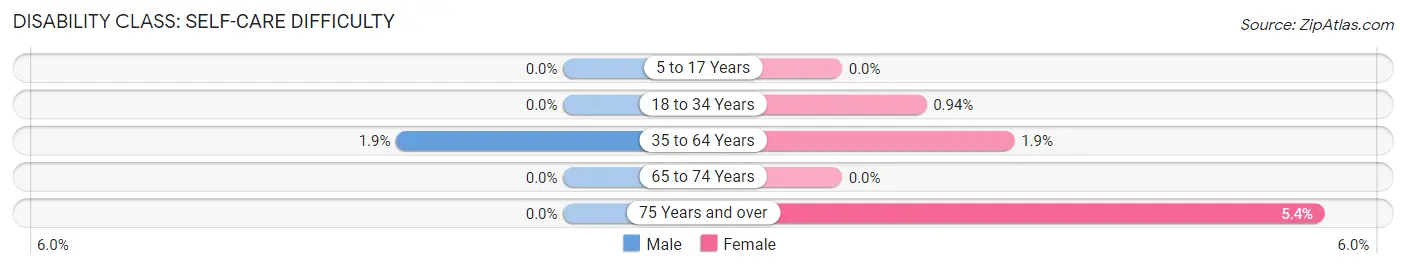
| Age Bracket | Male | Female |
| 5 to 17 Years | 0 (0.0%) | 0 (0.0%) |
| 18 to 34 Years | 0 (0.0%) | 2 (0.9%) |
| 35 to 64 Years | 5 (1.9%) | 6 (1.9%) |
| 65 to 74 Years | 0 (0.0%) | 0 (0.0%) |
| 75 Years and over | 0 (0.0%) | 5 (5.4%) |
Technology Access in Trempealeau
Computing Device Access in Trempealeau

| Device Type | # Households | % Households |
| Desktop or Laptop | 598 | 74.2% |
| Smartphone | 710 | 88.1% |
| Tablet | 473 | 58.7% |
| No Computing Device | 44 | 5.5% |
| Total | 806 | 100.0% |
Internet Access in Trempealeau
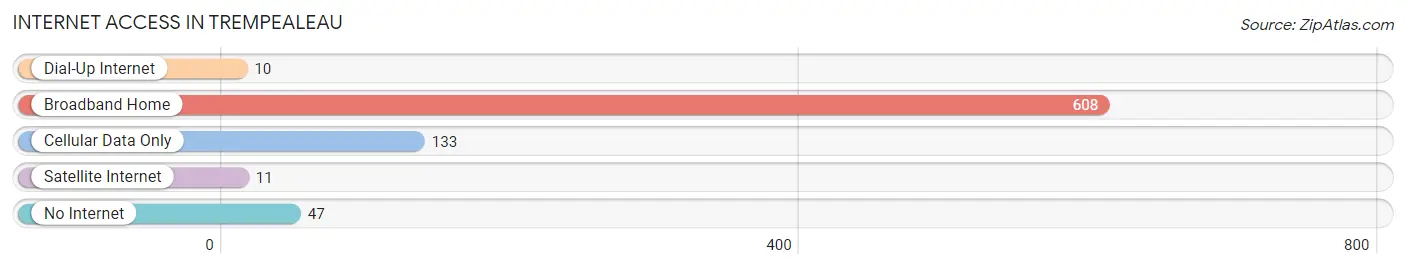
| Internet Type | # Households | % Households |
| Dial-Up Internet | 10 | 1.2% |
| Broadband Home | 608 | 75.4% |
| Cellular Data Only | 133 | 16.5% |
| Satellite Internet | 11 | 1.4% |
| No Internet | 47 | 5.8% |
| Total | 806 | 100.0% |
Trempealeau Summary
Trempealeau, Wisconsin is a small village located in the western part of the state, in Trempealeau County. It is situated on the banks of the Mississippi River, and is home to a population of just over 1,000 people. The village is known for its rich history, beautiful geography, and vibrant economy.
History
Trempealeau was first settled in 1837 by a group of French-Canadian fur traders. The village was named after the nearby Trempealeau Mountain, which was named by the French-Canadian fur traders after the French phrase “trempe l’eau”, which translates to “paddle the water”. The village was officially incorporated in 1856, and has since grown to become a vibrant community.
The village has a rich history of industry and commerce. In the late 19th century, the village was home to a number of sawmills, gristmills, and other businesses. The village was also home to a number of factories, including a woolen mill, a paper mill, and a flour mill. The village was also home to a number of stores, including a general store, a hardware store, and a drug store.
Geography
Trempealeau is located in the western part of Wisconsin, in Trempealeau County. The village is situated on the banks of the Mississippi River, and is surrounded by rolling hills and lush forests. The village is located approximately 25 miles south of La Crosse, Wisconsin, and is approximately 90 miles from Minneapolis, Minnesota.
The village is home to a number of parks and recreational areas, including the Trempealeau National Wildlife Refuge, which is home to a variety of wildlife, including bald eagles, ospreys, and trumpeter swans. The village is also home to a number of historic sites, including the Trempealeau County Historical Society Museum, which is home to a variety of artifacts and exhibits related to the history of the village.
Economy
Trempealeau’s economy is largely based on agriculture and tourism. The village is home to a number of farms, which produce a variety of crops, including corn, soybeans, and hay. The village is also home to a number of wineries, which produce a variety of wines.
The village is also home to a number of businesses, including restaurants, retail stores, and service providers. The village is also home to a number of manufacturing companies, which produce a variety of products, including furniture, clothing, and electronics.
Demographics
As of the 2010 census, the population of Trempealeau was 1,037. The village is predominantly white, with 95.3% of the population identifying as white. The village is also home to a small Hispanic population, with 2.2% of the population identifying as Hispanic or Latino. The village is also home to a small African American population, with 0.7% of the population identifying as African American. The village is also home to a small Asian population, with 0.6% of the population identifying as Asian. The median household income in the village is $45,938, and the median home value is $128,400.
Common Questions
What is Per Capita Income in Trempealeau?
Per Capita income in Trempealeau is $35,113.
What is the Median Family Income in Trempealeau?
Median Family Income in Trempealeau is $92,000.
What is the Median Household income in Trempealeau?
Median Household Income in Trempealeau is $62,115.
What is Income or Wage Gap in Trempealeau?
Income or Wage Gap in Trempealeau is 23.6%.
Women in Trempealeau earn 76.4 cents for every dollar earned by a man.
What is Inequality or Gini Index in Trempealeau?
Inequality or Gini Index in Trempealeau is 0.38.
What is the Total Population of Trempealeau?
Total Population of Trempealeau is 1,769.
What is the Total Male Population of Trempealeau?
Total Male Population of Trempealeau is 775.
What is the Total Female Population of Trempealeau?
Total Female Population of Trempealeau is 994.
What is the Ratio of Males per 100 Females in Trempealeau?
There are 77.97 Males per 100 Females in Trempealeau.
What is the Ratio of Females per 100 Males in Trempealeau?
There are 128.26 Females per 100 Males in Trempealeau.
What is the Median Population Age in Trempealeau?
Median Population Age in Trempealeau is 46.5 Years.
What is the Average Family Size in Trempealeau
Average Family Size in Trempealeau is 3.1 People.
What is the Average Household Size in Trempealeau
Average Household Size in Trempealeau is 2.2 People.
How Large is the Labor Force in Trempealeau?
There are 958 People in the Labor Forcein in Trempealeau.
What is the Percentage of People in the Labor Force in Trempealeau?
64.8% of People are in the Labor Force in Trempealeau.
What is the Unemployment Rate in Trempealeau?
Unemployment Rate in Trempealeau is 2.1%.