Tony, WI Map & Demographics
Tony Map
Tony Overview
$28,787
PER CAPITA INCOME
$105,000
AVG FAMILY INCOME
$86,250
AVG HOUSEHOLD INCOME
52.5%
WAGE / INCOME GAP [ % ]
47.5¢/ $1
WAGE / INCOME GAP [ $ ]
0.34
INEQUALITY / GINI INDEX
127
TOTAL POPULATION
58
MALE POPULATION
69
FEMALE POPULATION
84.06
MALES / 100 FEMALES
118.97
FEMALES / 100 MALES
46.4
MEDIAN AGE
2.8
AVG FAMILY SIZE
2.6
AVG HOUSEHOLD SIZE
53
LABOR FORCE [ PEOPLE ]
53.0%
PERCENT IN LABOR FORCE
1.9%
UNEMPLOYMENT RATE
Tony Zip Codes
Tony Area Codes
Income in Tony
Income Overview in Tony
Per Capita Income in Tony is $28,787, while median incomes of families and households are $105,000 and $86,250 respectively.
| Characteristic | Number | Measure |
| Per Capita Income | 127 | $28,787 |
| Median Family Income | 42 | $105,000 |
| Mean Family Income | 42 | $104,545 |
| Median Household Income | 49 | $86,250 |
| Mean Household Income | 49 | $93,943 |
| Income Deficit | 42 | $0 |
| Wage / Income Gap (%) | 127 | 52.53% |
| Wage / Income Gap ($) | 127 | 47.47¢ per $1 |
| Gini / Inequality Index | 127 | 0.34 |
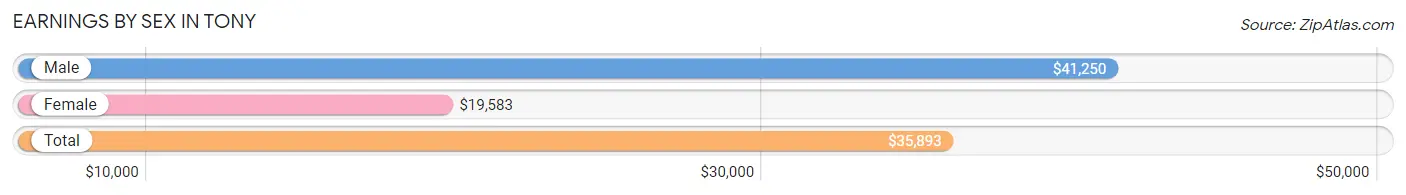
Earnings by Sex in Tony
Average Earnings in Tony are $35,893, $41,250 for men and $19,583 for women, a difference of 52.5%.
| Sex | Number | Average Earnings |
| Male | 28 (50.9%) | $41,250 |
| Female | 27 (49.1%) | $19,583 |
| Total | 55 (100.0%) | $35,893 |
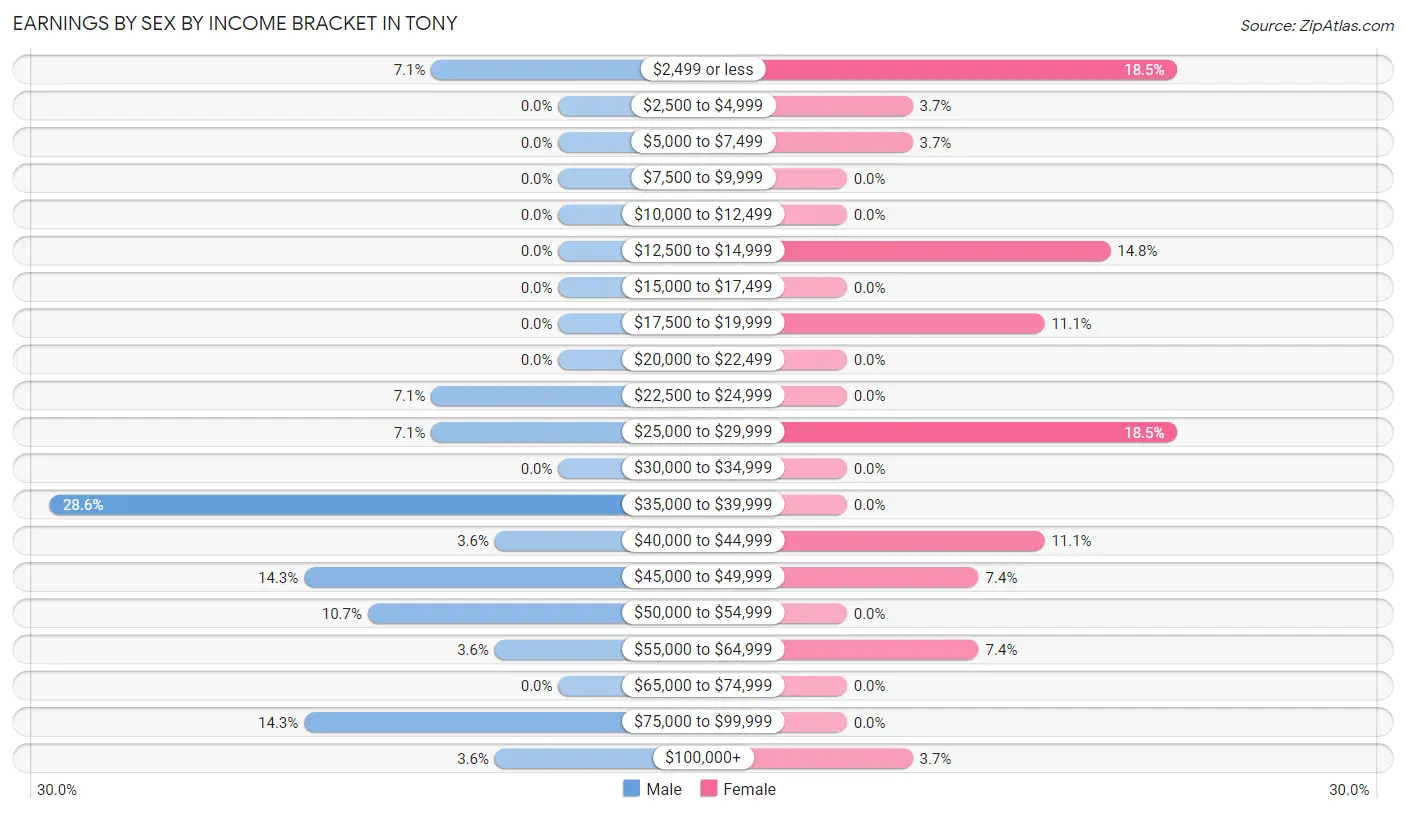
Earnings by Sex by Income Bracket in Tony
The most common earnings brackets in Tony are $35,000 to $39,999 for men (8 | 28.6%) and $2,499 or less for women (5 | 18.5%).
| Income | Male | Female |
| $2,499 or less | 2 (7.1%) | 5 (18.5%) |
| $2,500 to $4,999 | 0 (0.0%) | 1 (3.7%) |
| $5,000 to $7,499 | 0 (0.0%) | 1 (3.7%) |
| $7,500 to $9,999 | 0 (0.0%) | 0 (0.0%) |
| $10,000 to $12,499 | 0 (0.0%) | 0 (0.0%) |
| $12,500 to $14,999 | 0 (0.0%) | 4 (14.8%) |
| $15,000 to $17,499 | 0 (0.0%) | 0 (0.0%) |
| $17,500 to $19,999 | 0 (0.0%) | 3 (11.1%) |
| $20,000 to $22,499 | 0 (0.0%) | 0 (0.0%) |
| $22,500 to $24,999 | 2 (7.1%) | 0 (0.0%) |
| $25,000 to $29,999 | 2 (7.1%) | 5 (18.5%) |
| $30,000 to $34,999 | 0 (0.0%) | 0 (0.0%) |
| $35,000 to $39,999 | 8 (28.6%) | 0 (0.0%) |
| $40,000 to $44,999 | 1 (3.6%) | 3 (11.1%) |
| $45,000 to $49,999 | 4 (14.3%) | 2 (7.4%) |
| $50,000 to $54,999 | 3 (10.7%) | 0 (0.0%) |
| $55,000 to $64,999 | 1 (3.6%) | 2 (7.4%) |
| $65,000 to $74,999 | 0 (0.0%) | 0 (0.0%) |
| $75,000 to $99,999 | 4 (14.3%) | 0 (0.0%) |
| $100,000+ | 1 (3.6%) | 1 (3.7%) |
| Total | 28 (100.0%) | 27 (100.0%) |
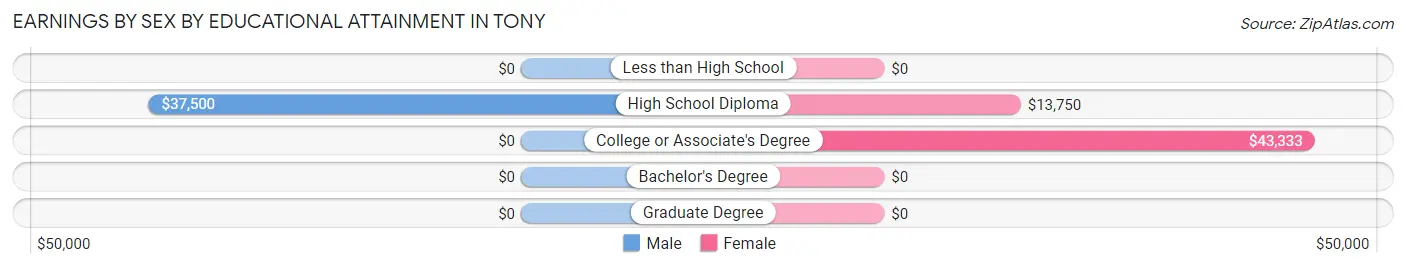
Earnings by Sex by Educational Attainment in Tony
Average earnings in Tony are $41,250 for men and $22,500 for women, a difference of 45.5%. Men with an educational attainment of high school diploma enjoy the highest average annual earnings of $37,500, while those with high school diploma education earn the least with $37,500. Women with an educational attainment of college or associate's degree earn the most with the average annual earnings of $43,333, while those with high school diploma education have the smallest earnings of $13,750.
| Educational Attainment | Male Income | Female Income |
| Less than High School | - | - |
| High School Diploma | $37,500 | $13,750 |
| College or Associate's Degree | - | - |
| Bachelor's Degree | - | - |
| Graduate Degree | - | - |
| Total | $41,250 | $22,500 |
Family Income in Tony
Family Income Brackets in Tony
According to the Tony family income data, there are 17 families falling into the $150,000 to $199,999 income range, which is the most common income bracket and makes up 40.5% of all families. Conversely, the less than $10,000 income bracket is the least frequent group with only 1 families (2.4%) belonging to this category.
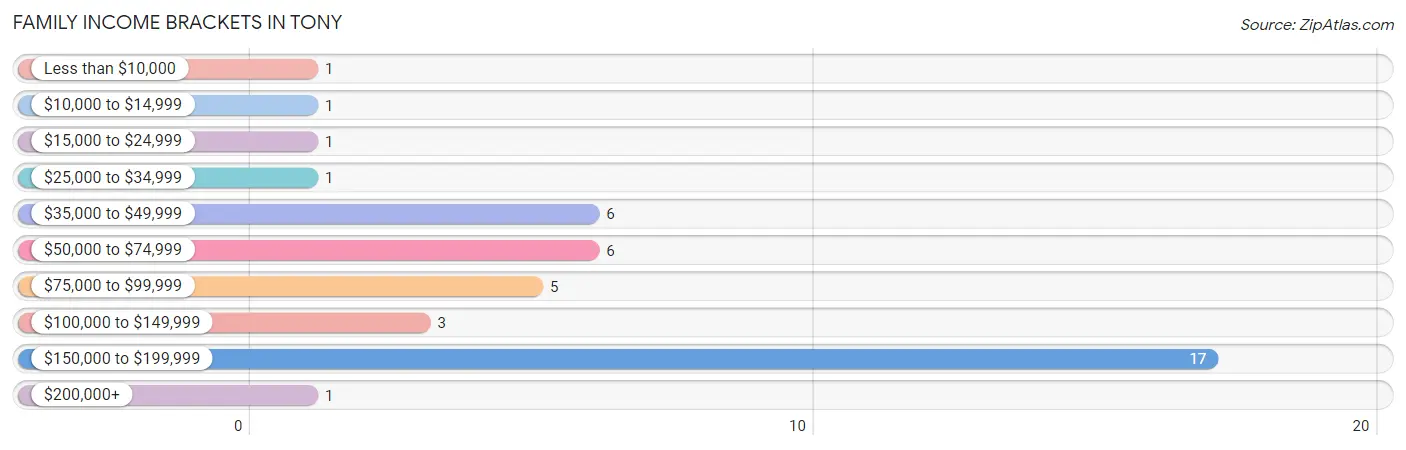
| Income Bracket | # Families | % Families |
| Less than $10,000 | 1 | 2.4% |
| $10,000 to $14,999 | 1 | 2.4% |
| $15,000 to $24,999 | 1 | 2.4% |
| $25,000 to $34,999 | 1 | 2.4% |
| $35,000 to $49,999 | 6 | 14.3% |
| $50,000 to $74,999 | 6 | 14.3% |
| $75,000 to $99,999 | 5 | 11.9% |
| $100,000 to $149,999 | 3 | 7.1% |
| $150,000 to $199,999 | 17 | 40.5% |
| $200,000+ | 1 | 2.4% |
Family Income by Famaliy Size in Tony
3-person families (18 | 42.9%) account for the highest median family income in Tony with $151,538 per family, while 3-person families (18 | 42.9%) have the highest median income of $50,513 per family member.
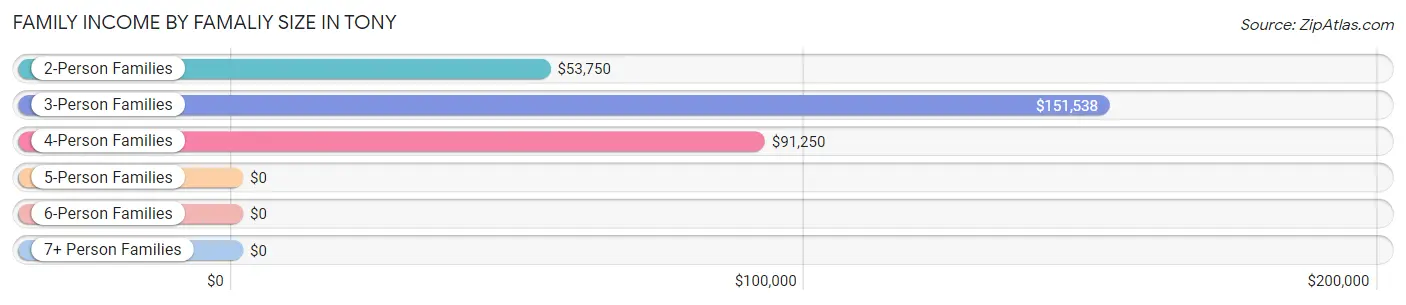
| Income Bracket | # Families | Median Income |
| 2-Person Families | 15 (35.7%) | $53,750 |
| 3-Person Families | 18 (42.9%) | $151,538 |
| 4-Person Families | 6 (14.3%) | $91,250 |
| 5-Person Families | 2 (4.8%) | $0 |
| 6-Person Families | 1 (2.4%) | $0 |
| 7+ Person Families | 0 (0.0%) | $0 |
| Total | 42 (100.0%) | $105,000 |
Family Income by Number of Earners in Tony
The median family income in Tony is $105,000, with families comprising 3+ earners (6) having the highest median family income of $160,625, while families with no earners (7) have the lowest median family income of $48,750, accounting for 14.3% and 16.7% of families, respectively.
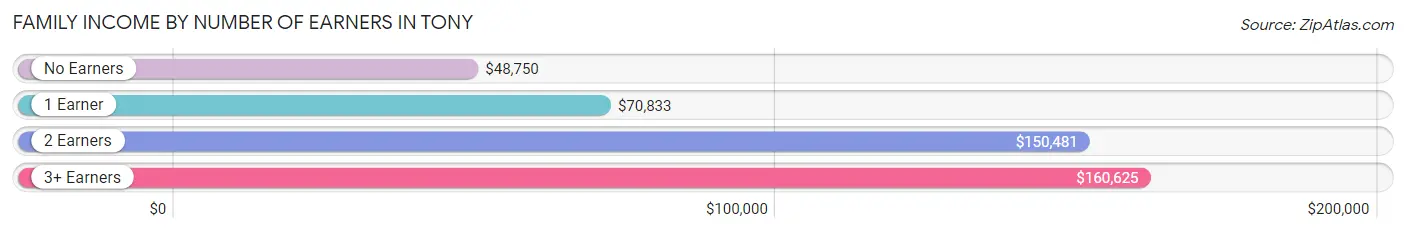
| Number of Earners | # Families | Median Income |
| No Earners | 7 (16.7%) | $48,750 |
| 1 Earner | 6 (14.3%) | $70,833 |
| 2 Earners | 23 (54.8%) | $150,481 |
| 3+ Earners | 6 (14.3%) | $160,625 |
| Total | 42 (100.0%) | $105,000 |
Household Income in Tony
Household Income Brackets in Tony
With 17 households falling in the category, the $150,000 to $199,999 income range is the most frequent in Tony, accounting for 34.7% of all households. In contrast, only 1 households (2.0%) fall into the less than $10,000 income bracket, making it the least populous group.
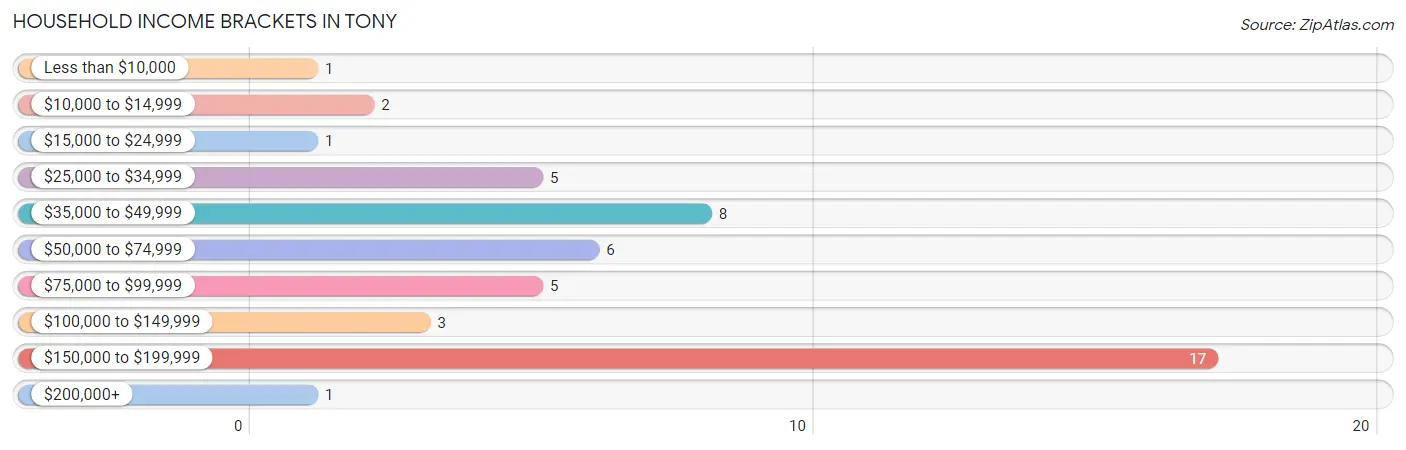
| Income Bracket | # Households | % Households |
| Less than $10,000 | 1 | 2.0% |
| $10,000 to $14,999 | 2 | 4.1% |
| $15,000 to $24,999 | 1 | 2.0% |
| $25,000 to $34,999 | 5 | 10.2% |
| $35,000 to $49,999 | 8 | 16.3% |
| $50,000 to $74,999 | 6 | 12.2% |
| $75,000 to $99,999 | 5 | 10.2% |
| $100,000 to $149,999 | 3 | 6.1% |
| $150,000 to $199,999 | 17 | 34.7% |
| $200,000+ | 1 | 2.0% |
Household Income by Householder Age in Tony
The median household income in Tony is $86,250, with the highest median household income of $150,673 found in the 65+ years age bracket for the primary householder. A total of 27 households (55.1%) fall into this category. Meanwhile, the 15 to 24 years age bracket for the primary householder has the lowest median household income of $0, with 1 households (2.0%) in this group.
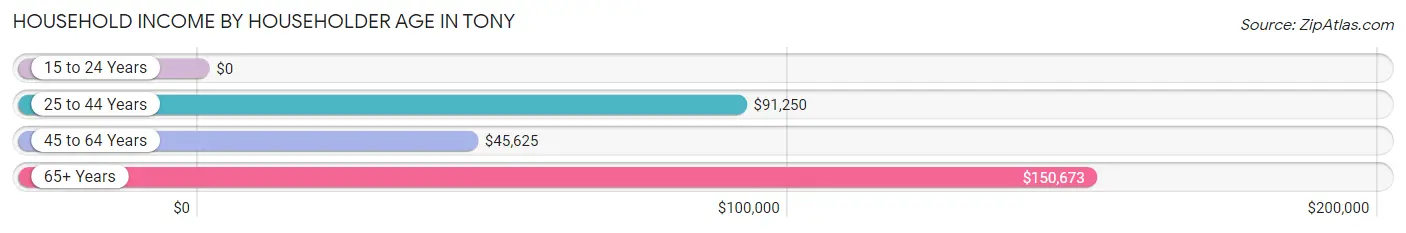
| Income Bracket | # Households | Median Income |
| 15 to 24 Years | 1 (2.0%) | $0 |
| 25 to 44 Years | 8 (16.3%) | $91,250 |
| 45 to 64 Years | 13 (26.5%) | $45,625 |
| 65+ Years | 27 (55.1%) | $150,673 |
| Total | 49 (100.0%) | $86,250 |
Poverty in Tony
Income Below Poverty by Sex and Age in Tony
With 6.9% poverty level for males and 4.3% for females among the residents of Tony, 12 to 14 year old males and 35 to 44 year old females are the most vulnerable to poverty, with 1 males (100.0%) and 2 females (50.0%) in their respective age groups living below the poverty level.
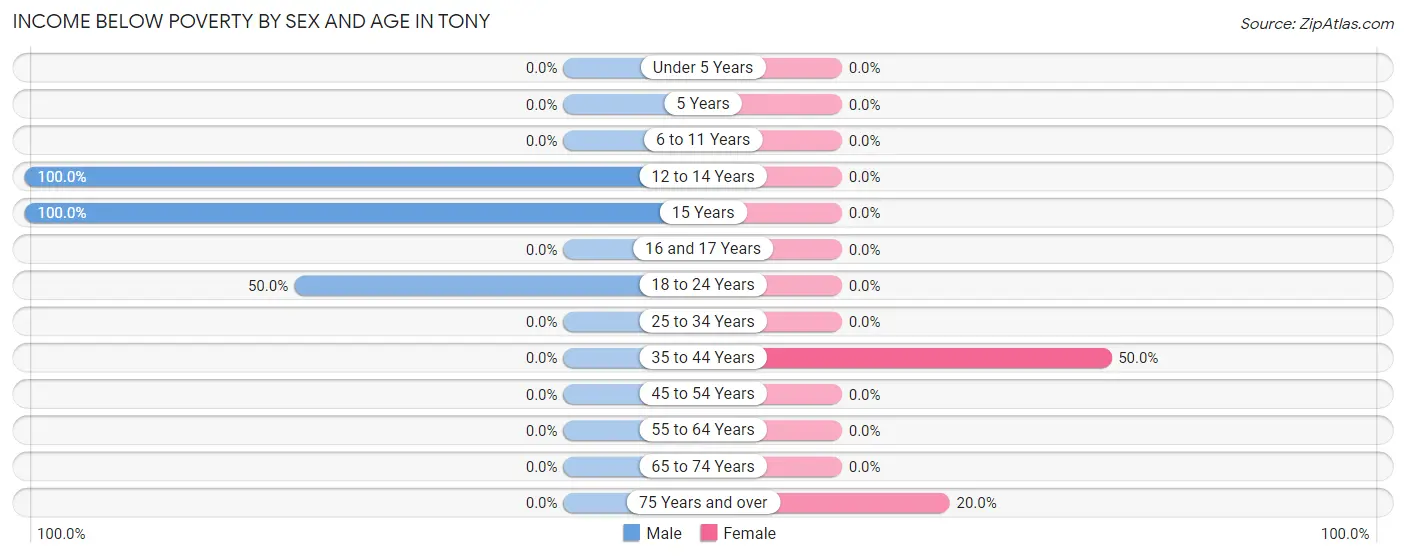
| Age Bracket | Male | Female |
| Under 5 Years | 0 (0.0%) | 0 (0.0%) |
| 5 Years | 0 (0.0%) | 0 (0.0%) |
| 6 to 11 Years | 0 (0.0%) | 0 (0.0%) |
| 12 to 14 Years | 1 (100.0%) | 0 (0.0%) |
| 15 Years | 1 (100.0%) | 0 (0.0%) |
| 16 and 17 Years | 0 (0.0%) | 0 (0.0%) |
| 18 to 24 Years | 2 (50.0%) | 0 (0.0%) |
| 25 to 34 Years | 0 (0.0%) | 0 (0.0%) |
| 35 to 44 Years | 0 (0.0%) | 2 (50.0%) |
| 45 to 54 Years | 0 (0.0%) | 0 (0.0%) |
| 55 to 64 Years | 0 (0.0%) | 0 (0.0%) |
| 65 to 74 Years | 0 (0.0%) | 0 (0.0%) |
| 75 Years and over | 0 (0.0%) | 1 (20.0%) |
| Total | 4 (6.9%) | 3 (4.3%) |
Income Above Poverty by Sex and Age in Tony
According to the poverty statistics in Tony, males aged under 5 years and females aged under 5 years are the age groups that are most secure financially, with 100.0% of males and 100.0% of females in these age groups living above the poverty line.
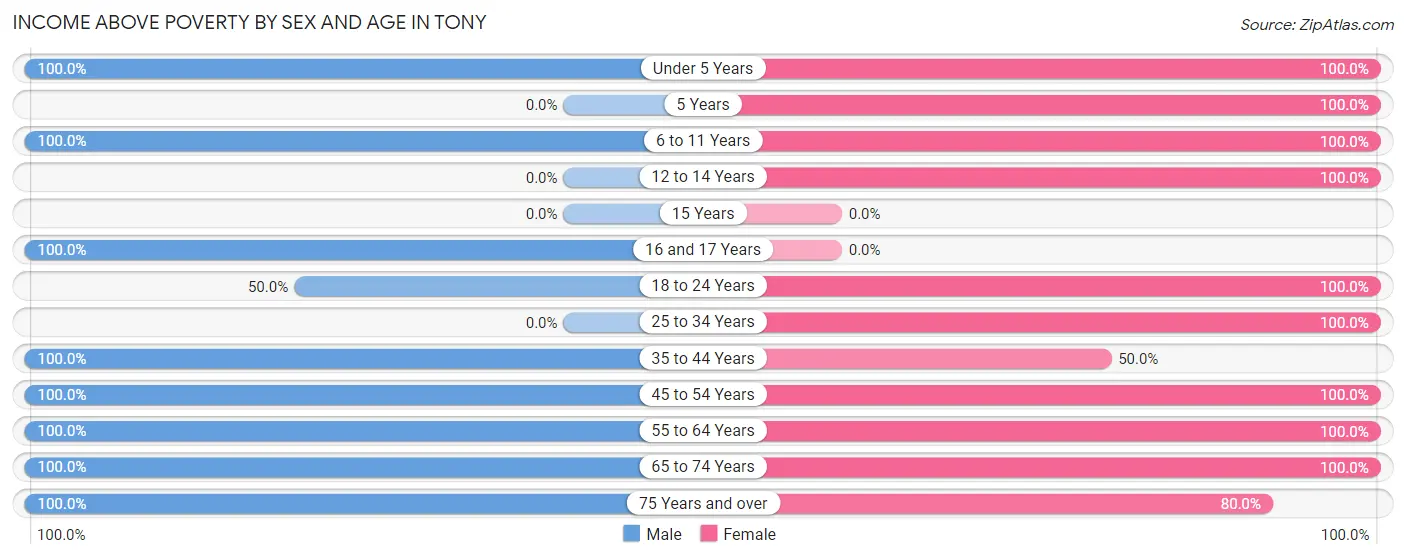
| Age Bracket | Male | Female |
| Under 5 Years | 4 (100.0%) | 1 (100.0%) |
| 5 Years | 0 (0.0%) | 2 (100.0%) |
| 6 to 11 Years | 6 (100.0%) | 10 (100.0%) |
| 12 to 14 Years | 0 (0.0%) | 2 (100.0%) |
| 15 Years | 0 (0.0%) | 0 (0.0%) |
| 16 and 17 Years | 2 (100.0%) | 0 (0.0%) |
| 18 to 24 Years | 2 (50.0%) | 3 (100.0%) |
| 25 to 34 Years | 0 (0.0%) | 10 (100.0%) |
| 35 to 44 Years | 12 (100.0%) | 2 (50.0%) |
| 45 to 54 Years | 5 (100.0%) | 5 (100.0%) |
| 55 to 64 Years | 10 (100.0%) | 10 (100.0%) |
| 65 to 74 Years | 9 (100.0%) | 17 (100.0%) |
| 75 Years and over | 4 (100.0%) | 4 (80.0%) |
| Total | 54 (93.1%) | 66 (95.7%) |
Income Below Poverty Among Married-Couple Families in Tony
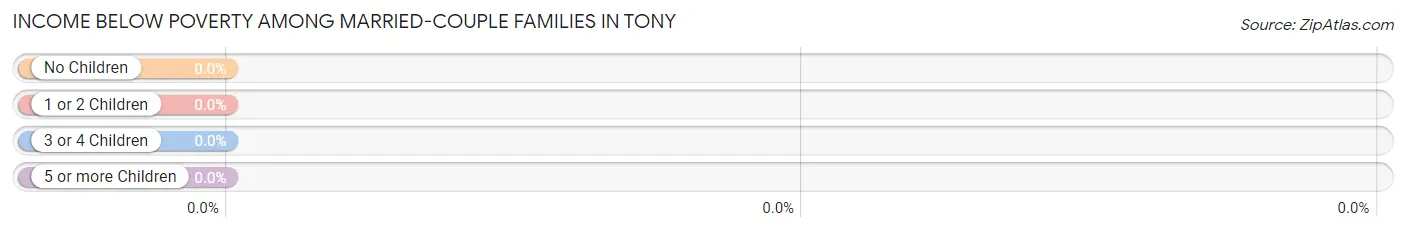
| Children | Above Poverty | Below Poverty |
| No Children | 31 (100.0%) | 0 (0.0%) |
| 1 or 2 Children | 6 (100.0%) | 0 (0.0%) |
| 3 or 4 Children | 1 (100.0%) | 0 (0.0%) |
| 5 or more Children | 0 (0.0%) | 0 (0.0%) |
| Total | 38 (100.0%) | 0 (0.0%) |
Income Below Poverty Among Single-Parent Households in Tony
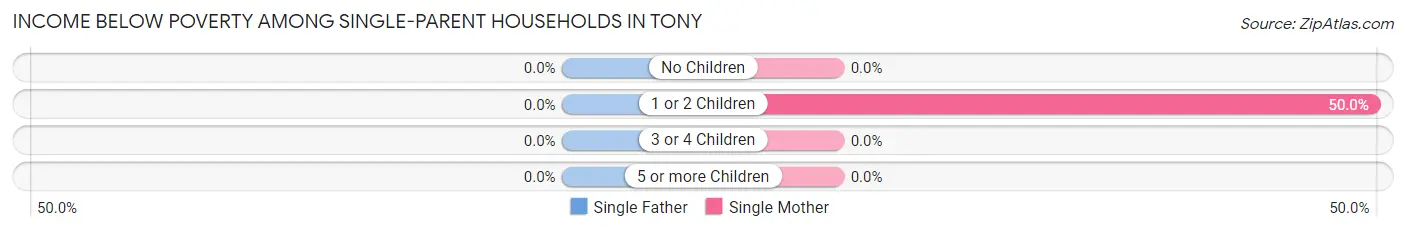
| Children | Single Father | Single Mother |
| No Children | 0 (0.0%) | 0 (0.0%) |
| 1 or 2 Children | 0 (0.0%) | 2 (50.0%) |
| 3 or 4 Children | 0 (0.0%) | 0 (0.0%) |
| 5 or more Children | 0 (0.0%) | 0 (0.0%) |
| Total | 0 (0.0%) | 2 (50.0%) |
Income Below Poverty Among Married-Couple vs Single-Parent Households in Tony
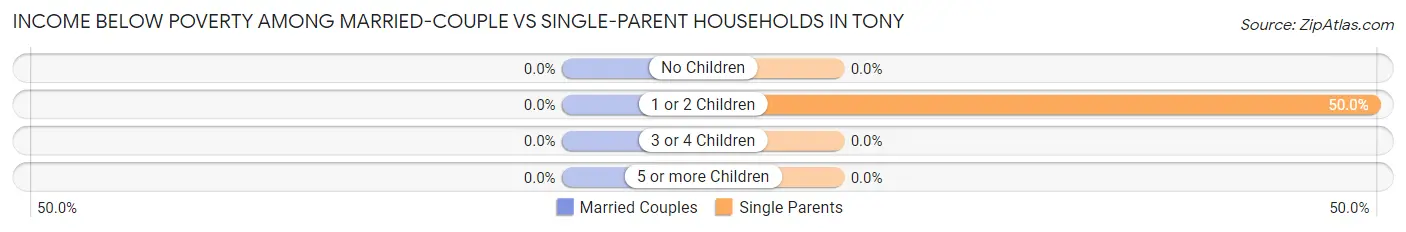
| Children | Married-Couple Families | Single-Parent Households |
| No Children | 0 (0.0%) | 0 (0.0%) |
| 1 or 2 Children | 0 (0.0%) | 2 (50.0%) |
| 3 or 4 Children | 0 (0.0%) | 0 (0.0%) |
| 5 or more Children | 0 (0.0%) | 0 (0.0%) |
| Total | 0 (0.0%) | 2 (50.0%) |
Race in Tony
The most populous races in Tony are White / Caucasian (113 | 89.0%), Two or more Races (8 | 6.3%), and Asian (6 | 4.7%).
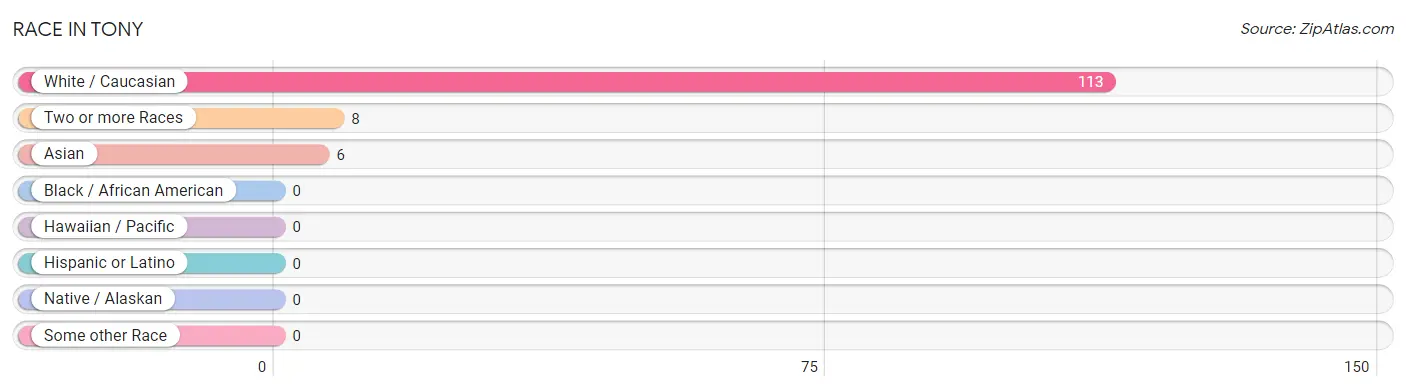
| Race | # Population | % Population |
| Asian | 6 | 4.7% |
| Black / African American | 0 | 0.0% |
| Hawaiian / Pacific | 0 | 0.0% |
| Hispanic or Latino | 0 | 0.0% |
| Native / Alaskan | 0 | 0.0% |
| White / Caucasian | 113 | 89.0% |
| Two or more Races | 8 | 6.3% |
| Some other Race | 0 | 0.0% |
| Total | 127 | 100.0% |
Ancestry in Tony
The most populous ancestries reported in Tony are German (49 | 38.6%), Dutch (15 | 11.8%), Korean (10 | 7.9%), Croatian (9 | 7.1%), and English (8 | 6.3%), together accounting for 71.6% of all Tony residents.
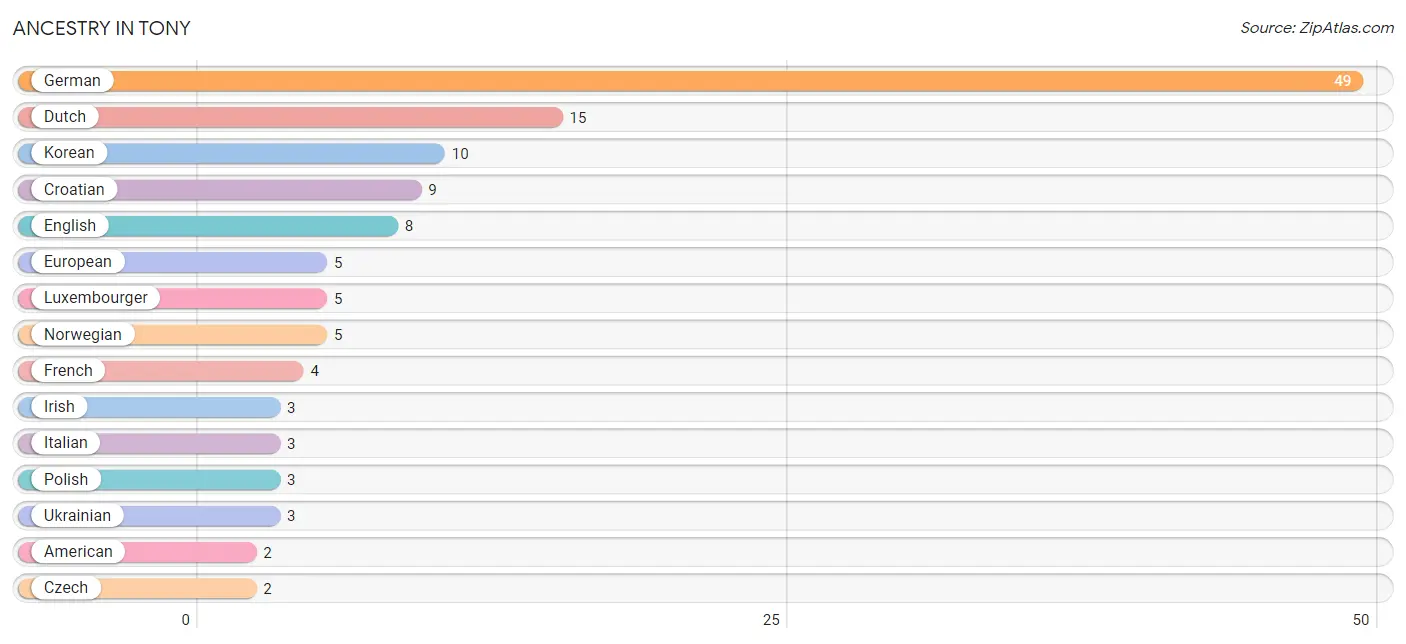
| Ancestry | # Population | % Population |
| American | 2 | 1.6% |
| Croatian | 9 | 7.1% |
| Czech | 2 | 1.6% |
| Dutch | 15 | 11.8% |
| English | 8 | 6.3% |
| European | 5 | 3.9% |
| French | 4 | 3.2% |
| German | 49 | 38.6% |
| Irish | 3 | 2.4% |
| Italian | 3 | 2.4% |
| Korean | 10 | 7.9% |
| Luxembourger | 5 | 3.9% |
| Norwegian | 5 | 3.9% |
| Polish | 3 | 2.4% |
| Ukrainian | 3 | 2.4% | View All 15 Rows |
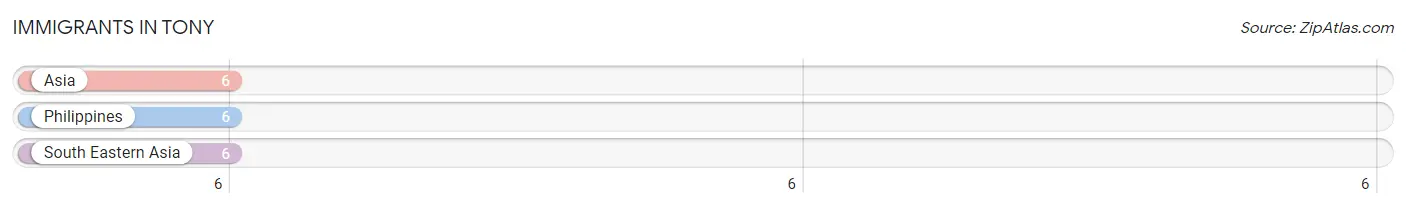
Immigrants in Tony
The most numerous immigrant groups reported in Tony came from Asia (6 | 4.7%), Philippines (6 | 4.7%), and South Eastern Asia (6 | 4.7%), together accounting for 14.2% of all Tony residents.
| Immigration Origin | # Population | % Population |
| Asia | 6 | 4.7% |
| Philippines | 6 | 4.7% |
| South Eastern Asia | 6 | 4.7% | View All 3 Rows |
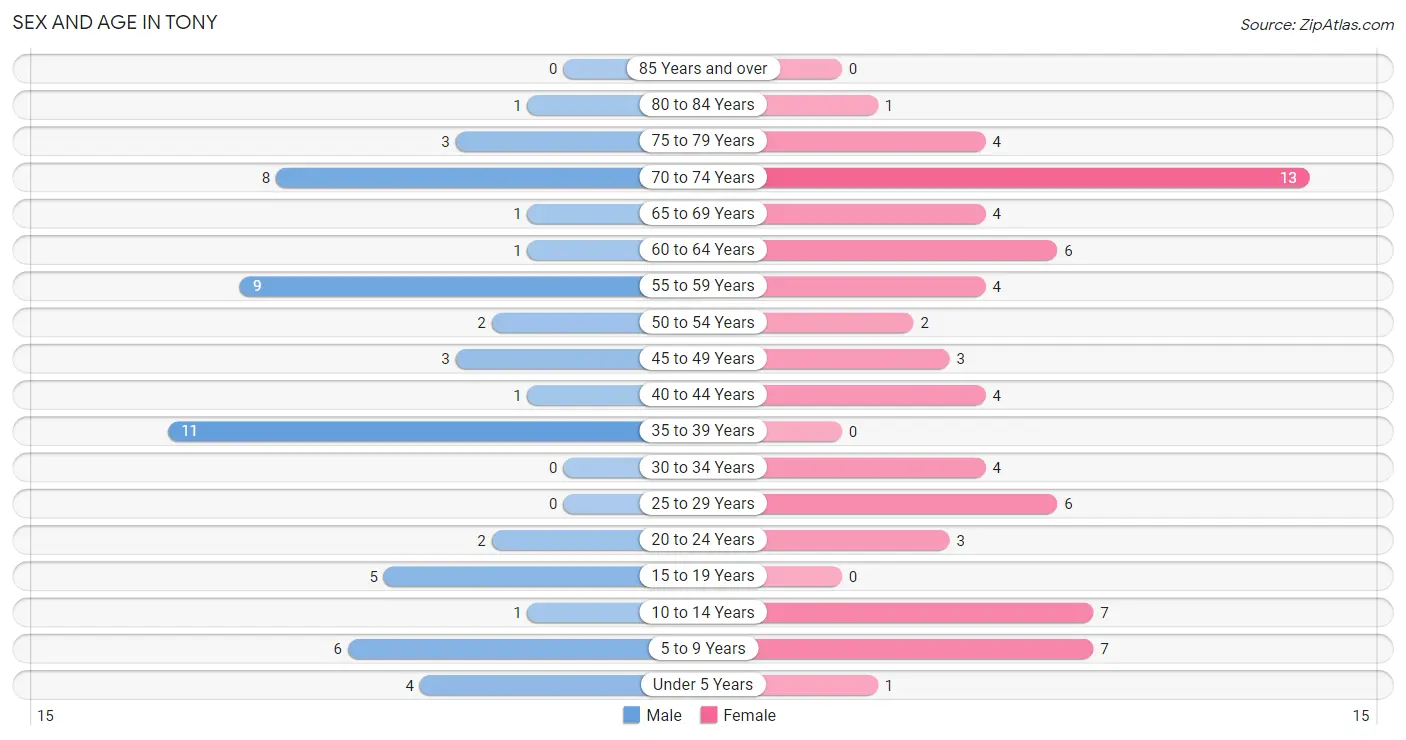
Sex and Age in Tony
Sex and Age in Tony
The most populous age groups in Tony are 35 to 39 Years (11 | 19.0%) for men and 70 to 74 Years (13 | 18.8%) for women.
| Age Bracket | Male | Female |
| Under 5 Years | 4 (6.9%) | 1 (1.5%) |
| 5 to 9 Years | 6 (10.3%) | 7 (10.1%) |
| 10 to 14 Years | 1 (1.7%) | 7 (10.1%) |
| 15 to 19 Years | 5 (8.6%) | 0 (0.0%) |
| 20 to 24 Years | 2 (3.5%) | 3 (4.3%) |
| 25 to 29 Years | 0 (0.0%) | 6 (8.7%) |
| 30 to 34 Years | 0 (0.0%) | 4 (5.8%) |
| 35 to 39 Years | 11 (19.0%) | 0 (0.0%) |
| 40 to 44 Years | 1 (1.7%) | 4 (5.8%) |
| 45 to 49 Years | 3 (5.2%) | 3 (4.3%) |
| 50 to 54 Years | 2 (3.5%) | 2 (2.9%) |
| 55 to 59 Years | 9 (15.5%) | 4 (5.8%) |
| 60 to 64 Years | 1 (1.7%) | 6 (8.7%) |
| 65 to 69 Years | 1 (1.7%) | 4 (5.8%) |
| 70 to 74 Years | 8 (13.8%) | 13 (18.8%) |
| 75 to 79 Years | 3 (5.2%) | 4 (5.8%) |
| 80 to 84 Years | 1 (1.7%) | 1 (1.5%) |
| 85 Years and over | 0 (0.0%) | 0 (0.0%) |
| Total | 58 (100.0%) | 69 (100.0%) |
Families and Households in Tony
Median Family Size in Tony
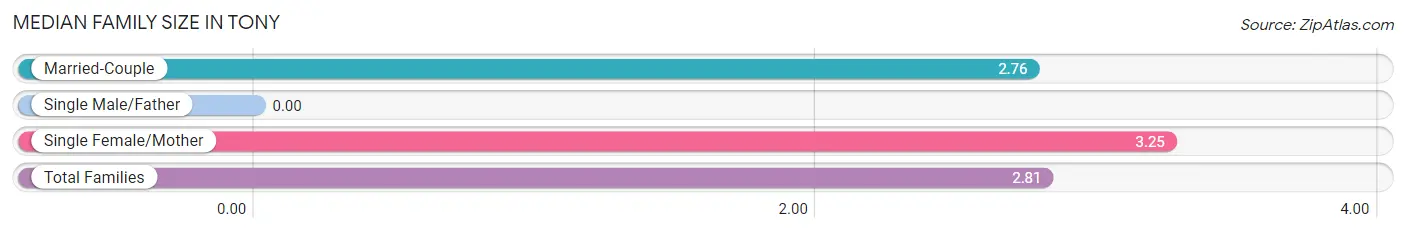
| Family Type | # Families | Family Size |
| Married-Couple | 38 (90.5%) | 2.76 |
| Single Male/Father | 0 (0.0%) | - |
| Single Female/Mother | 4 (9.5%) | 3.25 |
| Total Families | 42 (100.0%) | 2.81 |
Median Household Size in Tony
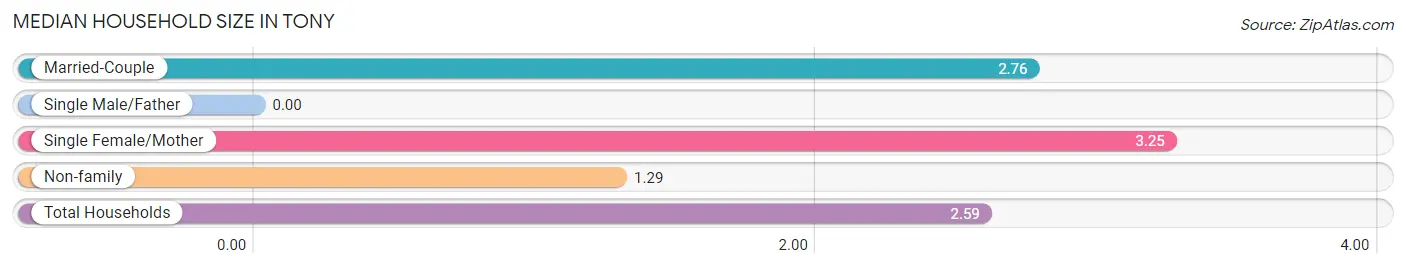
| Household Type | # Households | Household Size |
| Married-Couple | 38 (77.5%) | 2.76 |
| Single Male/Father | 0 (0.0%) | - |
| Single Female/Mother | 4 (8.2%) | 3.25 |
| Non-family | 7 (14.3%) | 1.29 |
| Total Households | 49 (100.0%) | 2.59 |
Household Size by Marriage Status in Tony
Out of a total of 49 households in Tony, 42 (85.7%) are family households, while 7 (14.3%) are nonfamily households. The most numerous type of family households are 3-person households, comprising 18, and the most common type of nonfamily households are 1-person households, comprising 6.
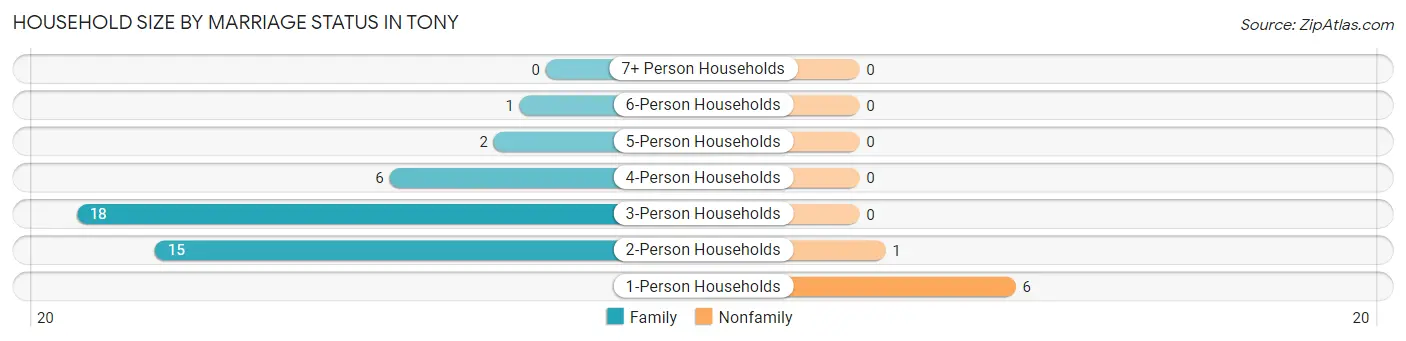
| Household Size | Family Households | Nonfamily Households |
| 1-Person Households | - | 6 (12.2%) |
| 2-Person Households | 15 (30.6%) | 1 (2.0%) |
| 3-Person Households | 18 (36.7%) | 0 (0.0%) |
| 4-Person Households | 6 (12.2%) | 0 (0.0%) |
| 5-Person Households | 2 (4.1%) | 0 (0.0%) |
| 6-Person Households | 1 (2.0%) | 0 (0.0%) |
| 7+ Person Households | 0 (0.0%) | 0 (0.0%) |
| Total | 42 (85.7%) | 7 (14.3%) |
Female Fertility in Tony
Fertility by Age in Tony
| Age Bracket | Women with Births | Births / 1,000 Women |
| 15 to 19 years | 0 (0.0%) | 0.0 |
| 20 to 34 years | 0 (0.0%) | 0.0 |
| 35 to 50 years | 0 (0.0%) | 0.0 |
| Total | 0 (0.0%) | 0.0 |
Fertility by Age by Marriage Status in Tony
| Age Bracket | Married | Unmarried |
| 15 to 19 years | 0 (0.0%) | 0 (0.0%) |
| 20 to 34 years | 0 (0.0%) | 0 (0.0%) |
| 35 to 50 years | 0 (0.0%) | 0 (0.0%) |
| Total | 0 (0.0%) | 0 (0.0%) |
Fertility by Education in Tony
| Educational Attainment | Women with Births | Births / 1,000 Women |
| Less than High School | 0 (0.0%) | 0.0 |
| High School Diploma | 0 (0.0%) | 0.0 |
| College or Associate's Degree | 0 (0.0%) | 0.0 |
| Bachelor's Degree | 0 (0.0%) | 0.0 |
| Graduate Degree | 0 (0.0%) | 0.0 |
| Total | 0 (0.0%) | 0.0 |
Fertility by Education by Marriage Status in Tony
| Educational Attainment | Married | Unmarried |
| Less than High School | 0 (0.0%) | 0 (0.0%) |
| High School Diploma | 0 (0.0%) | 0 (0.0%) |
| College or Associate's Degree | 0 (0.0%) | 0 (0.0%) |
| Bachelor's Degree | 0 (0.0%) | 0 (0.0%) |
| Graduate Degree | 0 (0.0%) | 0 (0.0%) |
| Total | 0 (0.0%) | 0 (0.0%) |
Employment Characteristics in Tony
Employment by Class of Employer in Tony
Among the 52 employed individuals in Tony, private company employees (46 | 88.5%), self-employed (not incorporated) (5 | 9.6%), and not-for-profit organizations (1 | 1.9%) make up the most common classes of employment.
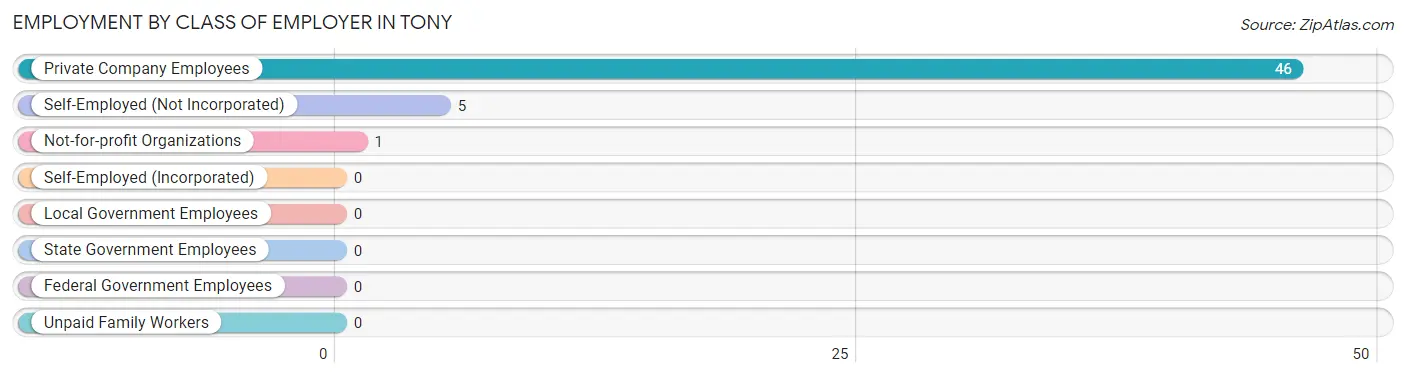
| Employer Class | # Employees | % Employees |
| Private Company Employees | 46 | 88.5% |
| Self-Employed (Incorporated) | 0 | 0.0% |
| Self-Employed (Not Incorporated) | 5 | 9.6% |
| Not-for-profit Organizations | 1 | 1.9% |
| Local Government Employees | 0 | 0.0% |
| State Government Employees | 0 | 0.0% |
| Federal Government Employees | 0 | 0.0% |
| Unpaid Family Workers | 0 | 0.0% |
| Total | 52 | 100.0% |
Employment Status by Age in Tony
According to the labor force statistics for Tony, out of the total population over 16 years of age (100), 53.0% or 53 individuals are in the labor force, with 1.9% or 1 of them unemployed. The age group with the highest labor force participation rate is 30 to 34 years, with 100.0% or 4 individuals in the labor force. Within the labor force, the 35 to 44 years age range has the highest percentage of unemployed individuals, with 7.1% or 1 of them being unemployed.
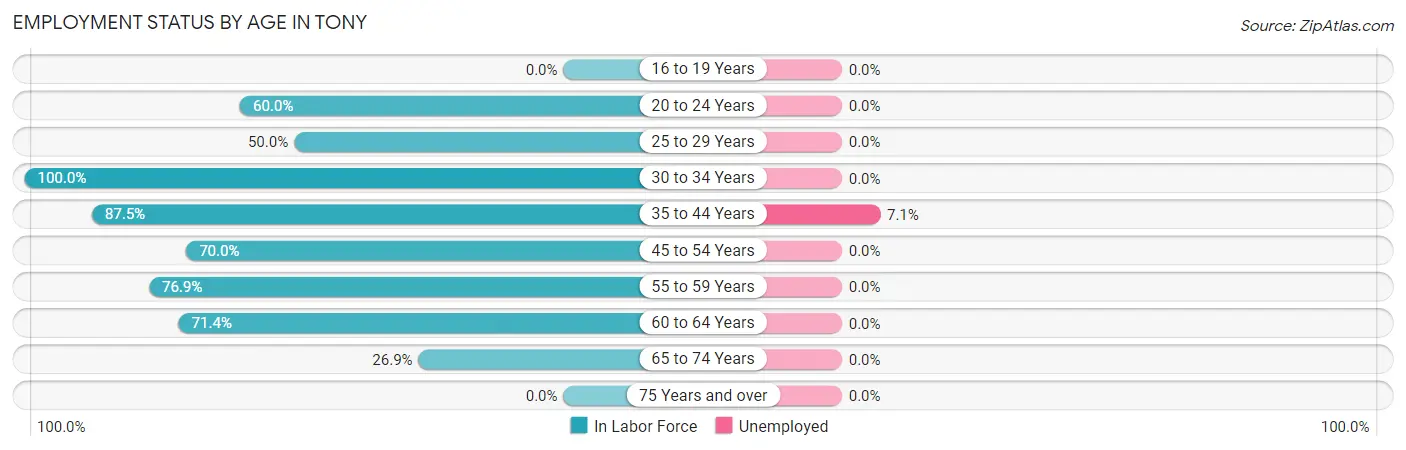
| Age Bracket | In Labor Force | Unemployed |
| 16 to 19 Years | 0 (0.0%) | 0 (0.0%) |
| 20 to 24 Years | 3 (60.0%) | 0 (0.0%) |
| 25 to 29 Years | 3 (50.0%) | 0 (0.0%) |
| 30 to 34 Years | 4 (100.0%) | 0 (0.0%) |
| 35 to 44 Years | 14 (87.5%) | 1 (7.1%) |
| 45 to 54 Years | 7 (70.0%) | 0 (0.0%) |
| 55 to 59 Years | 10 (76.9%) | 0 (0.0%) |
| 60 to 64 Years | 5 (71.4%) | 0 (0.0%) |
| 65 to 74 Years | 7 (26.9%) | 0 (0.0%) |
| 75 Years and over | 0 (0.0%) | 0 (0.0%) |
| Total | 53 (53.0%) | 1 (1.9%) |
Employment Status by Educational Attainment in Tony
According to labor force statistics for Tony, 76.8% of individuals (43) out of the total population between 25 and 64 years of age (56) are in the labor force, with 2.3% or 1 of them being unemployed. The group with the highest labor force participation rate are those with the educational attainment of high school diploma, with 83.3% or 30 individuals in the labor force. Within the labor force, individuals with college / associate degree education have the highest percentage of unemployment, with 12.5% or 1 of them being unemployed.
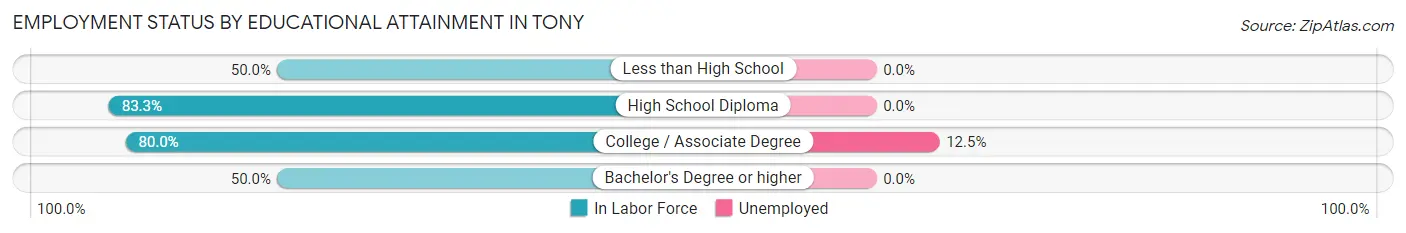
| Educational Attainment | In Labor Force | Unemployed |
| Less than High School | 4 (50.0%) | 0 (0.0%) |
| High School Diploma | 30 (83.3%) | 0 (0.0%) |
| College / Associate Degree | 8 (80.0%) | 1 (12.5%) |
| Bachelor's Degree or higher | 1 (50.0%) | 0 (0.0%) |
| Total | 43 (76.8%) | 1 (2.3%) |
Employment Occupations by Sex in Tony
Management, Business, Science and Arts Occupations
The most common Management, Business, Science and Arts occupations in Tony are Management (11 | 21.1%), Community & Social Service (1 | 1.9%), and Education, Arts & Media (1 | 1.9%).
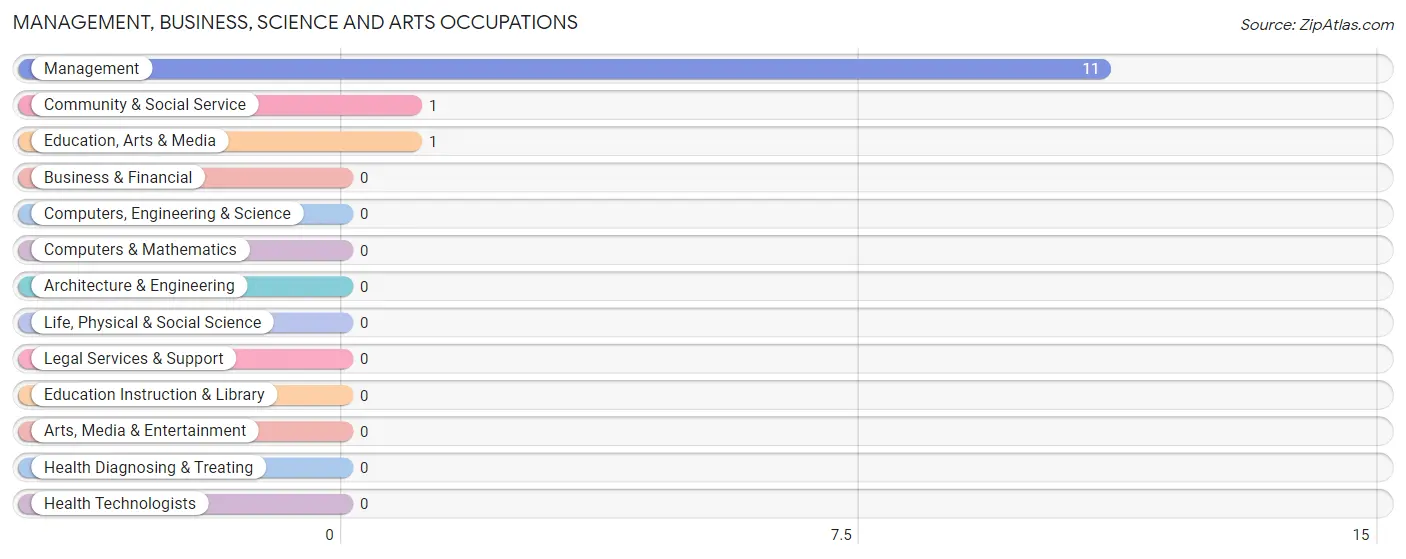
Management, Business, Science and Arts Occupations by Sex
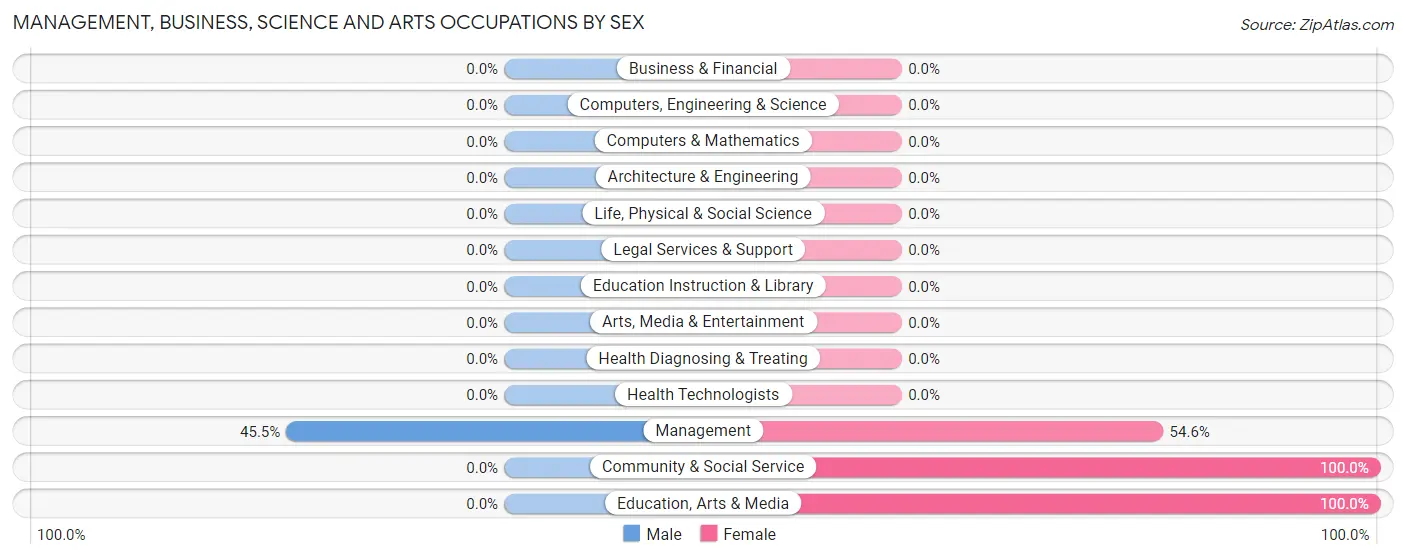
| Occupation | Male | Female |
| Management | 5 (45.5%) | 6 (54.5%) |
| Business & Financial | 0 (0.0%) | 0 (0.0%) |
| Computers, Engineering & Science | 0 (0.0%) | 0 (0.0%) |
| Computers & Mathematics | 0 (0.0%) | 0 (0.0%) |
| Architecture & Engineering | 0 (0.0%) | 0 (0.0%) |
| Life, Physical & Social Science | 0 (0.0%) | 0 (0.0%) |
| Community & Social Service | 0 (0.0%) | 1 (100.0%) |
| Education, Arts & Media | 0 (0.0%) | 1 (100.0%) |
| Legal Services & Support | 0 (0.0%) | 0 (0.0%) |
| Education Instruction & Library | 0 (0.0%) | 0 (0.0%) |
| Arts, Media & Entertainment | 0 (0.0%) | 0 (0.0%) |
| Health Diagnosing & Treating | 0 (0.0%) | 0 (0.0%) |
| Health Technologists | 0 (0.0%) | 0 (0.0%) |
| Total (Category) | 5 (41.7%) | 7 (58.3%) |
| Total (Overall) | 28 (53.8%) | 24 (46.2%) |
Services Occupations
The most common Services occupations in Tony are Food Preparation & Serving (4 | 7.7%), Cleaning & Maintenance (2 | 3.8%), Healthcare Support (1 | 1.9%), and Personal Care & Service (1 | 1.9%).
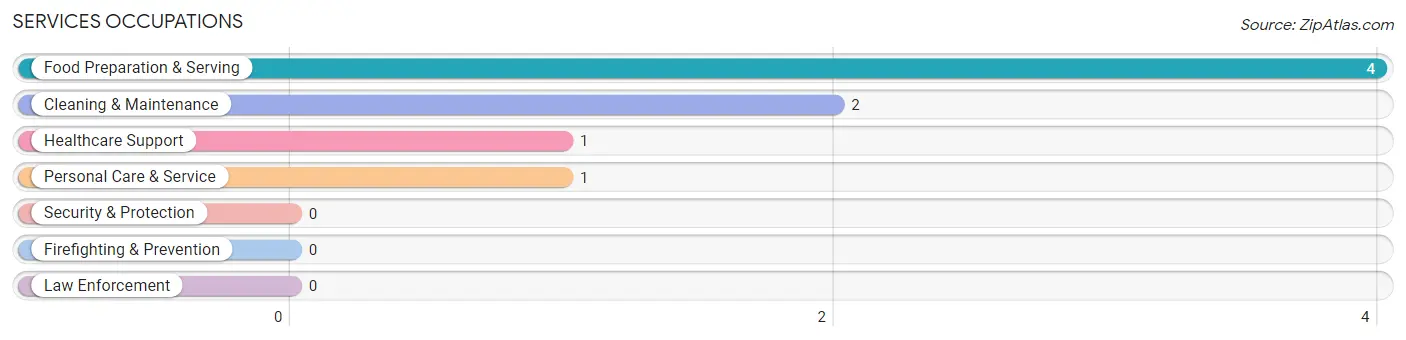
Services Occupations by Sex
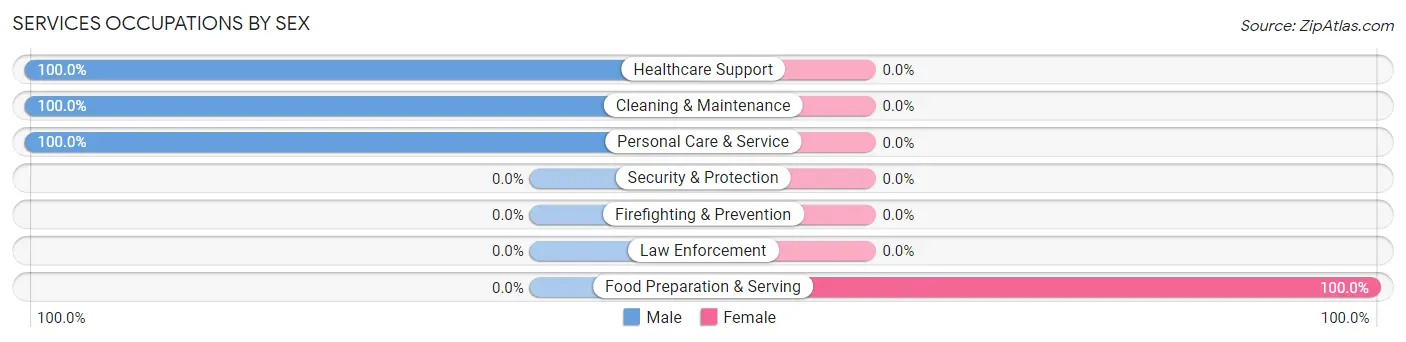
| Occupation | Male | Female |
| Healthcare Support | 1 (100.0%) | 0 (0.0%) |
| Security & Protection | 0 (0.0%) | 0 (0.0%) |
| Firefighting & Prevention | 0 (0.0%) | 0 (0.0%) |
| Law Enforcement | 0 (0.0%) | 0 (0.0%) |
| Food Preparation & Serving | 0 (0.0%) | 4 (100.0%) |
| Cleaning & Maintenance | 2 (100.0%) | 0 (0.0%) |
| Personal Care & Service | 1 (100.0%) | 0 (0.0%) |
| Total (Category) | 4 (50.0%) | 4 (50.0%) |
| Total (Overall) | 28 (53.8%) | 24 (46.2%) |
Sales and Office Occupations
The most common Sales and Office occupations in Tony are , and Office & Administration (6 | 11.5%).
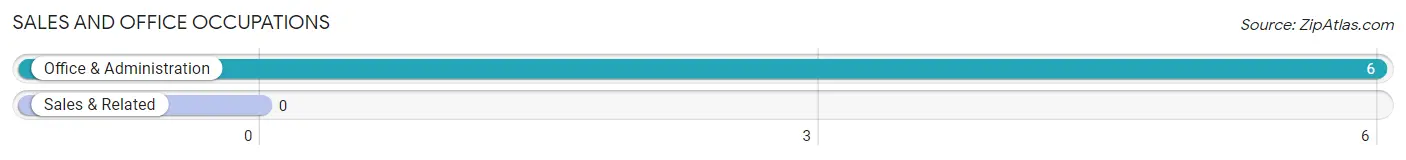
Sales and Office Occupations by Sex
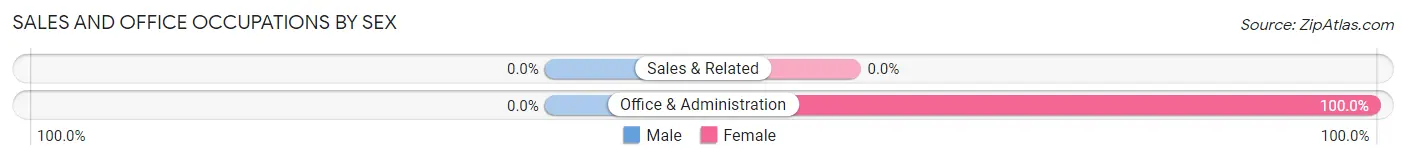
| Occupation | Male | Female |
| Sales & Related | 0 (0.0%) | 0 (0.0%) |
| Office & Administration | 0 (0.0%) | 6 (100.0%) |
| Total (Category) | 0 (0.0%) | 6 (100.0%) |
| Total (Overall) | 28 (53.8%) | 24 (46.2%) |
Natural Resources, Construction and Maintenance Occupations
The most common Natural Resources, Construction and Maintenance occupations in Tony are Farming, Fishing & Forestry (5 | 9.6%), Installation, Maintenance & Repair (3 | 5.8%), and Construction & Extraction (1 | 1.9%).
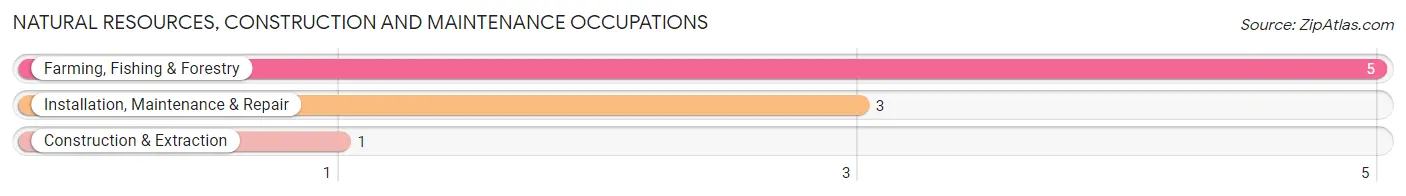
Natural Resources, Construction and Maintenance Occupations by Sex
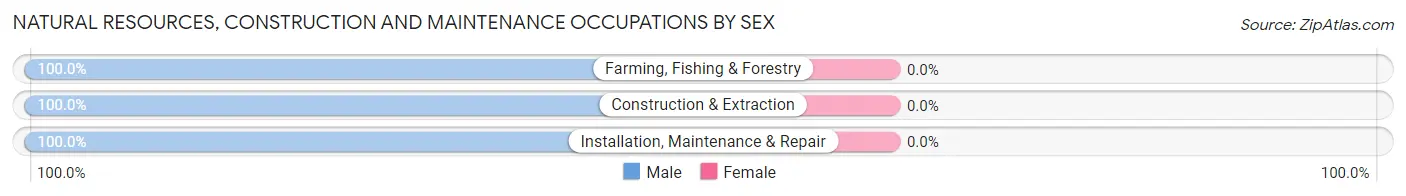
| Occupation | Male | Female |
| Farming, Fishing & Forestry | 5 (100.0%) | 0 (0.0%) |
| Construction & Extraction | 1 (100.0%) | 0 (0.0%) |
| Installation, Maintenance & Repair | 3 (100.0%) | 0 (0.0%) |
| Total (Category) | 9 (100.0%) | 0 (0.0%) |
| Total (Overall) | 28 (53.8%) | 24 (46.2%) |
Production, Transportation and Moving Occupations
The most common Production, Transportation and Moving occupations in Tony are Production (9 | 17.3%), Transportation (5 | 9.6%), and Material Moving (3 | 5.8%).
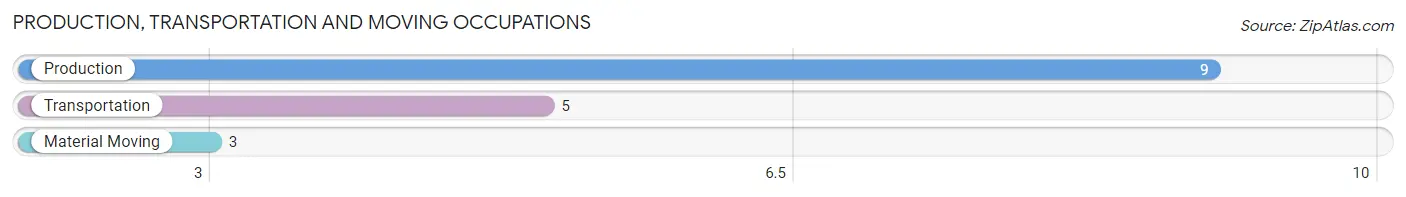
Production, Transportation and Moving Occupations by Sex
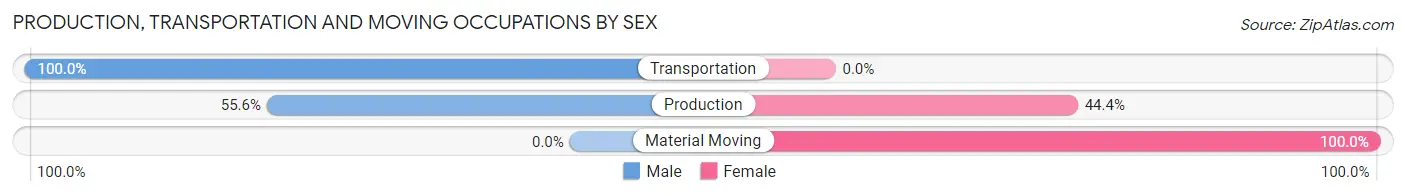
| Occupation | Male | Female |
| Production | 5 (55.6%) | 4 (44.4%) |
| Transportation | 5 (100.0%) | 0 (0.0%) |
| Material Moving | 0 (0.0%) | 3 (100.0%) |
| Total (Category) | 10 (58.8%) | 7 (41.2%) |
| Total (Overall) | 28 (53.8%) | 24 (46.2%) |
Employment Industries by Sex in Tony
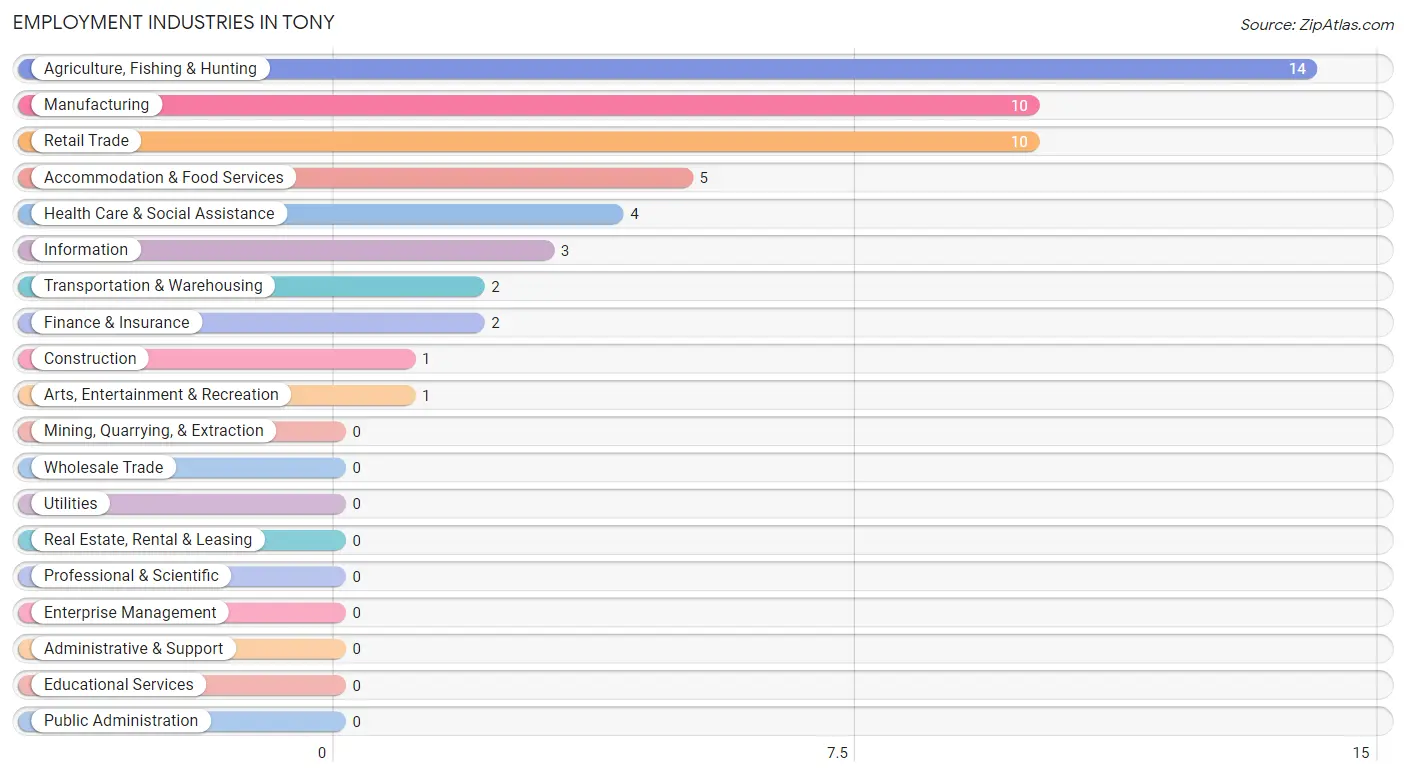
Employment Industries in Tony
The major employment industries in Tony include Agriculture, Fishing & Hunting (14 | 26.9%), Manufacturing (10 | 19.2%), Retail Trade (10 | 19.2%), Accommodation & Food Services (5 | 9.6%), and Health Care & Social Assistance (4 | 7.7%).
Employment Industries by Sex in Tony
The Tony industries that see more men than women are Construction (100.0%), Transportation & Warehousing (100.0%), and Information (100.0%), whereas the industries that tend to have a higher number of women are Finance & Insurance (100.0%), Health Care & Social Assistance (100.0%), and Accommodation & Food Services (100.0%).
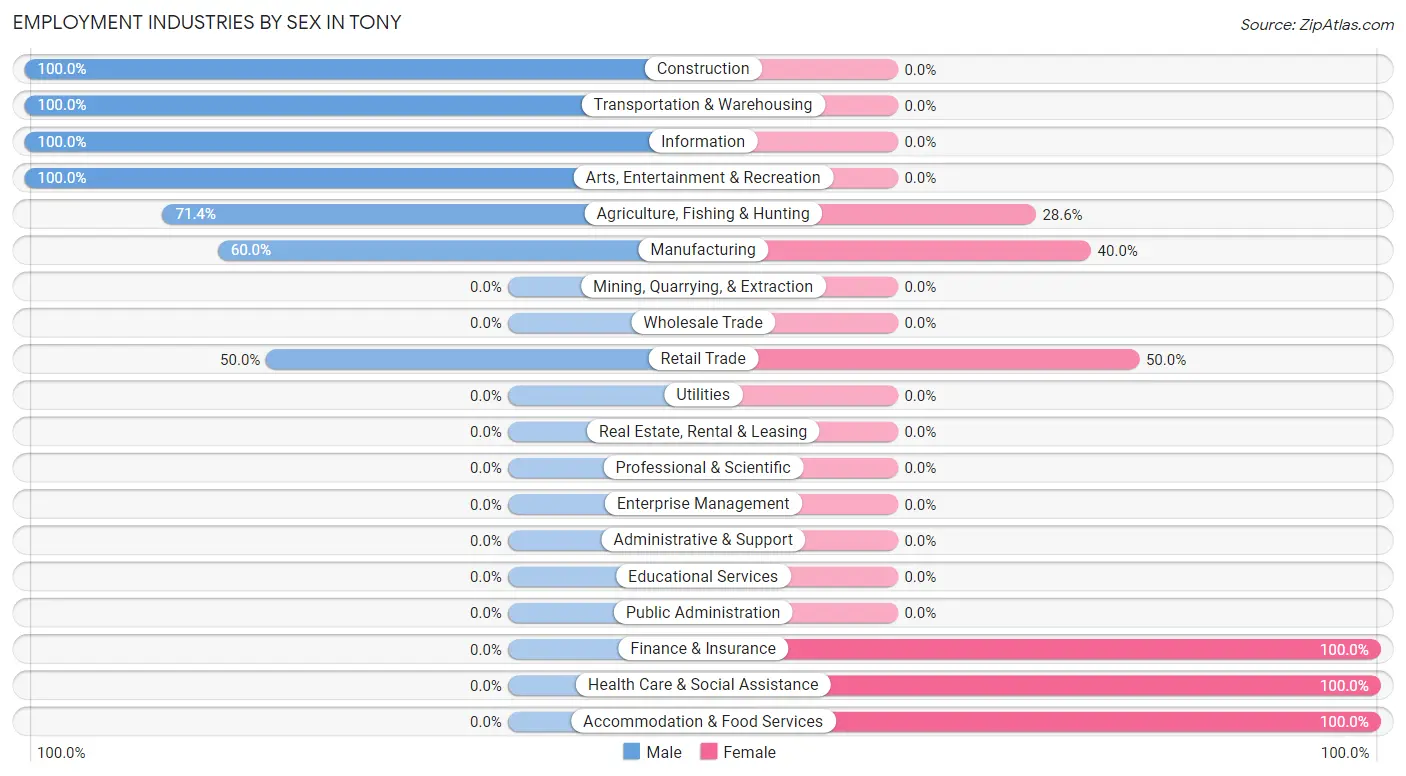
| Industry | Male | Female |
| Agriculture, Fishing & Hunting | 10 (71.4%) | 4 (28.6%) |
| Mining, Quarrying, & Extraction | 0 (0.0%) | 0 (0.0%) |
| Construction | 1 (100.0%) | 0 (0.0%) |
| Manufacturing | 6 (60.0%) | 4 (40.0%) |
| Wholesale Trade | 0 (0.0%) | 0 (0.0%) |
| Retail Trade | 5 (50.0%) | 5 (50.0%) |
| Transportation & Warehousing | 2 (100.0%) | 0 (0.0%) |
| Utilities | 0 (0.0%) | 0 (0.0%) |
| Information | 3 (100.0%) | 0 (0.0%) |
| Finance & Insurance | 0 (0.0%) | 2 (100.0%) |
| Real Estate, Rental & Leasing | 0 (0.0%) | 0 (0.0%) |
| Professional & Scientific | 0 (0.0%) | 0 (0.0%) |
| Enterprise Management | 0 (0.0%) | 0 (0.0%) |
| Administrative & Support | 0 (0.0%) | 0 (0.0%) |
| Educational Services | 0 (0.0%) | 0 (0.0%) |
| Health Care & Social Assistance | 0 (0.0%) | 4 (100.0%) |
| Arts, Entertainment & Recreation | 1 (100.0%) | 0 (0.0%) |
| Accommodation & Food Services | 0 (0.0%) | 5 (100.0%) |
| Public Administration | 0 (0.0%) | 0 (0.0%) |
| Total | 28 (53.8%) | 24 (46.2%) |
Education in Tony
School Enrollment in Tony
The most common levels of schooling among the 26 students in Tony are elementary school (14 | 53.8%), high school (4 | 15.4%), and kindergarten (3 | 11.5%).
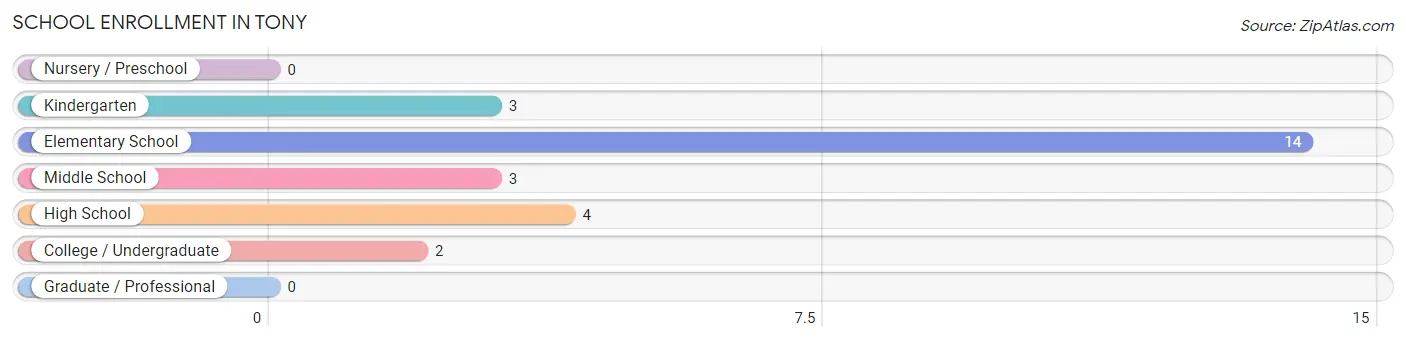
| School Level | # Students | % Students |
| Nursery / Preschool | 0 | 0.0% |
| Kindergarten | 3 | 11.5% |
| Elementary School | 14 | 53.8% |
| Middle School | 3 | 11.5% |
| High School | 4 | 15.4% |
| College / Undergraduate | 2 | 7.7% |
| Graduate / Professional | 0 | 0.0% |
| Total | 26 | 100.0% |
School Enrollment by Age by Funding Source in Tony
Out of a total of 26 students who are enrolled in schools in Tony, 2 (7.7%) attend a private institution, while the remaining 24 (92.3%) are enrolled in public schools. The age group of 15 to 17 year olds has the highest likelihood of being enrolled in private schools, with 2 (66.7% in the age bracket) enrolled. Conversely, the age group of 5 to 9 year old has the lowest likelihood of being enrolled in a private school, with 13 (100.0% in the age bracket) attending a public institution.
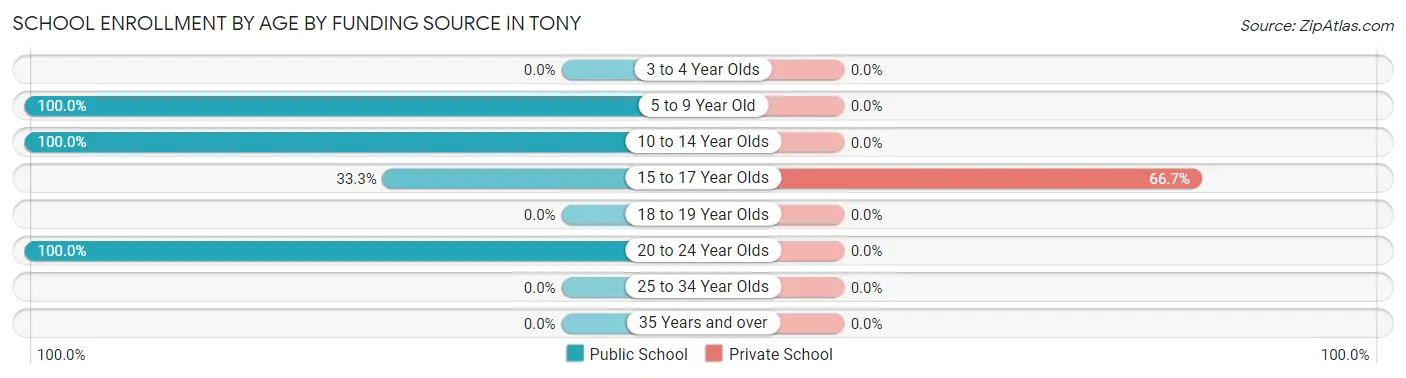
| Age Bracket | Public School | Private School |
| 3 to 4 Year Olds | 0 (0.0%) | 0 (0.0%) |
| 5 to 9 Year Old | 13 (100.0%) | 0 (0.0%) |
| 10 to 14 Year Olds | 8 (100.0%) | 0 (0.0%) |
| 15 to 17 Year Olds | 1 (33.3%) | 2 (66.7%) |
| 18 to 19 Year Olds | 0 (0.0%) | 0 (0.0%) |
| 20 to 24 Year Olds | 2 (100.0%) | 0 (0.0%) |
| 25 to 34 Year Olds | 0 (0.0%) | 0 (0.0%) |
| 35 Years and over | 0 (0.0%) | 0 (0.0%) |
| Total | 24 (92.3%) | 2 (7.7%) |
Educational Attainment by Field of Study in Tony
Education (14 | 73.7%), bio, nature & agricultural (4 | 21.0%), and computers & mathematics (1 | 5.3%) are the most common fields of study among 19 individuals in Tony who have obtained a bachelor's degree or higher.
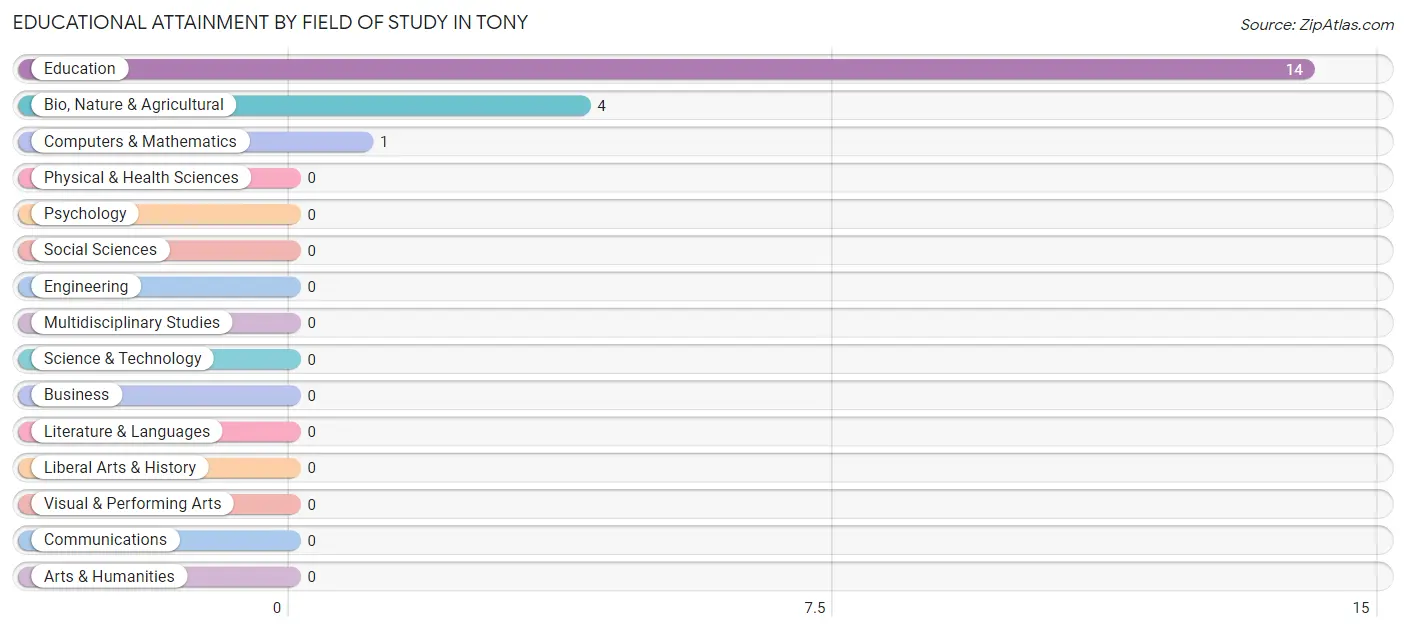
| Field of Study | # Graduates | % Graduates |
| Computers & Mathematics | 1 | 5.3% |
| Bio, Nature & Agricultural | 4 | 21.0% |
| Physical & Health Sciences | 0 | 0.0% |
| Psychology | 0 | 0.0% |
| Social Sciences | 0 | 0.0% |
| Engineering | 0 | 0.0% |
| Multidisciplinary Studies | 0 | 0.0% |
| Science & Technology | 0 | 0.0% |
| Business | 0 | 0.0% |
| Education | 14 | 73.7% |
| Literature & Languages | 0 | 0.0% |
| Liberal Arts & History | 0 | 0.0% |
| Visual & Performing Arts | 0 | 0.0% |
| Communications | 0 | 0.0% |
| Arts & Humanities | 0 | 0.0% |
| Total | 19 | 100.0% |
Transportation & Commute in Tony
Vehicle Availability by Sex in Tony
The most prevalent vehicle ownership categories in Tony are males with 3 vehicles (14, accounting for 50.0%) and females with 3 vehicles (13, making up 58.3%).
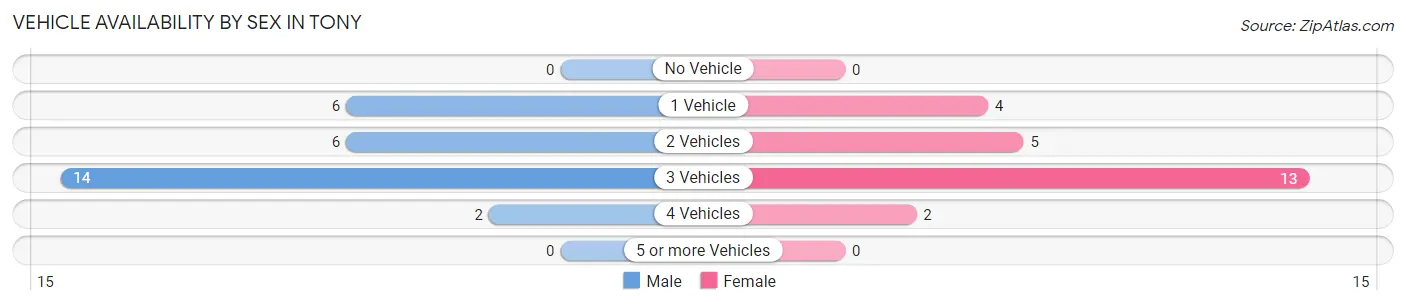
| Vehicles Available | Male | Female |
| No Vehicle | 0 (0.0%) | 0 (0.0%) |
| 1 Vehicle | 6 (21.4%) | 4 (16.7%) |
| 2 Vehicles | 6 (21.4%) | 5 (20.8%) |
| 3 Vehicles | 14 (50.0%) | 13 (54.2%) |
| 4 Vehicles | 2 (7.1%) | 2 (8.3%) |
| 5 or more Vehicles | 0 (0.0%) | 0 (0.0%) |
| Total | 28 (100.0%) | 24 (100.0%) |
Commute Time in Tony
The most frequently occuring commute durations in Tony are 15 to 19 minutes (17 commuters, 44.7%), 20 to 24 minutes (9 commuters, 23.7%), and 10 to 14 minutes (6 commuters, 15.8%).
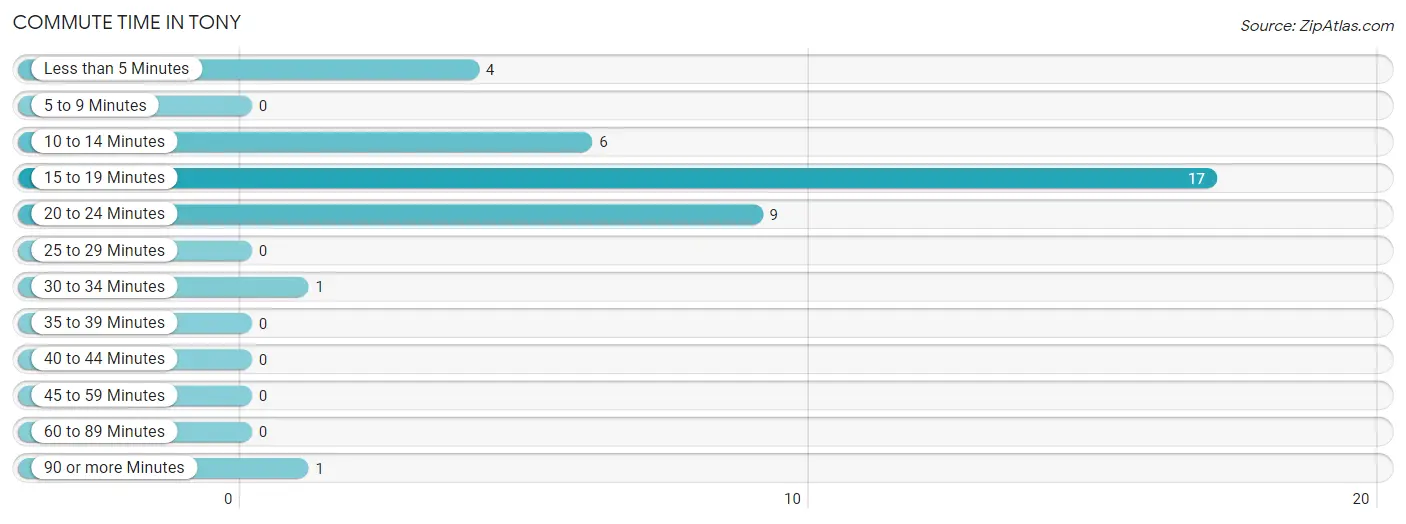
| Commute Time | # Commuters | % Commuters |
| Less than 5 Minutes | 4 | 10.5% |
| 5 to 9 Minutes | 0 | 0.0% |
| 10 to 14 Minutes | 6 | 15.8% |
| 15 to 19 Minutes | 17 | 44.7% |
| 20 to 24 Minutes | 9 | 23.7% |
| 25 to 29 Minutes | 0 | 0.0% |
| 30 to 34 Minutes | 1 | 2.6% |
| 35 to 39 Minutes | 0 | 0.0% |
| 40 to 44 Minutes | 0 | 0.0% |
| 45 to 59 Minutes | 0 | 0.0% |
| 60 to 89 Minutes | 0 | 0.0% |
| 90 or more Minutes | 1 | 2.6% |
Commute Time by Sex in Tony
The most common commute times in Tony are 15 to 19 minutes (7 commuters, 36.8%) for males and 15 to 19 minutes (10 commuters, 52.6%) for females.
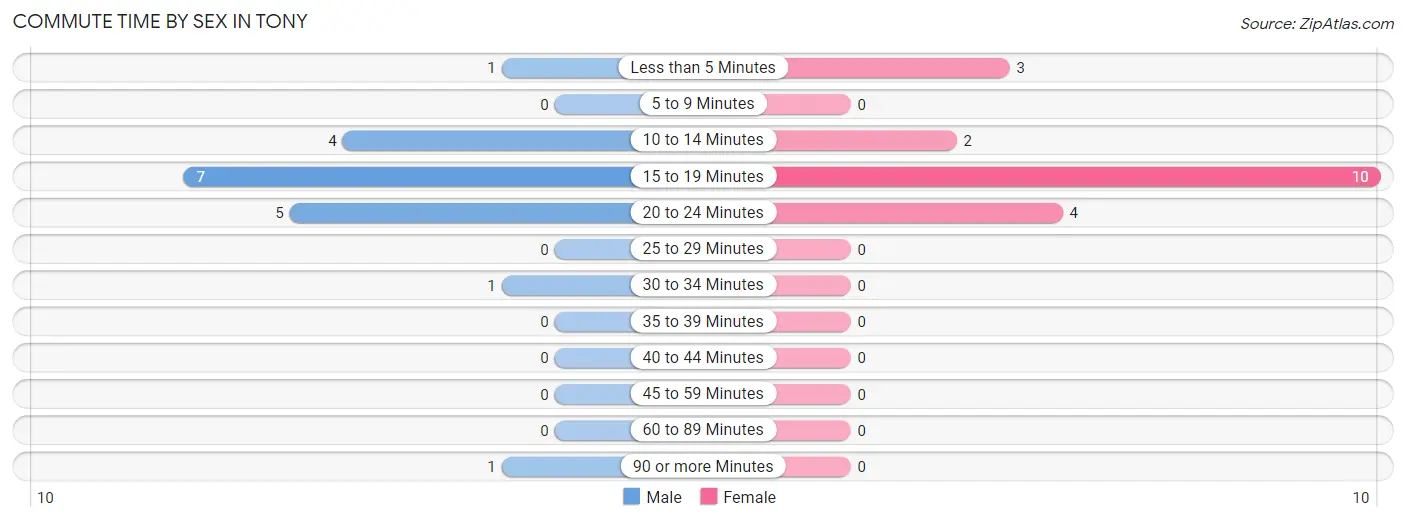
| Commute Time | Male | Female |
| Less than 5 Minutes | 1 (5.3%) | 3 (15.8%) |
| 5 to 9 Minutes | 0 (0.0%) | 0 (0.0%) |
| 10 to 14 Minutes | 4 (21.0%) | 2 (10.5%) |
| 15 to 19 Minutes | 7 (36.8%) | 10 (52.6%) |
| 20 to 24 Minutes | 5 (26.3%) | 4 (21.0%) |
| 25 to 29 Minutes | 0 (0.0%) | 0 (0.0%) |
| 30 to 34 Minutes | 1 (5.3%) | 0 (0.0%) |
| 35 to 39 Minutes | 0 (0.0%) | 0 (0.0%) |
| 40 to 44 Minutes | 0 (0.0%) | 0 (0.0%) |
| 45 to 59 Minutes | 0 (0.0%) | 0 (0.0%) |
| 60 to 89 Minutes | 0 (0.0%) | 0 (0.0%) |
| 90 or more Minutes | 1 (5.3%) | 0 (0.0%) |
Time of Departure to Work by Sex in Tony
The most frequent times of departure to work in Tony are 7:30 AM to 7:59 AM (8, 42.1%) for males and 7:00 AM to 7:29 AM (5, 26.3%) for females.
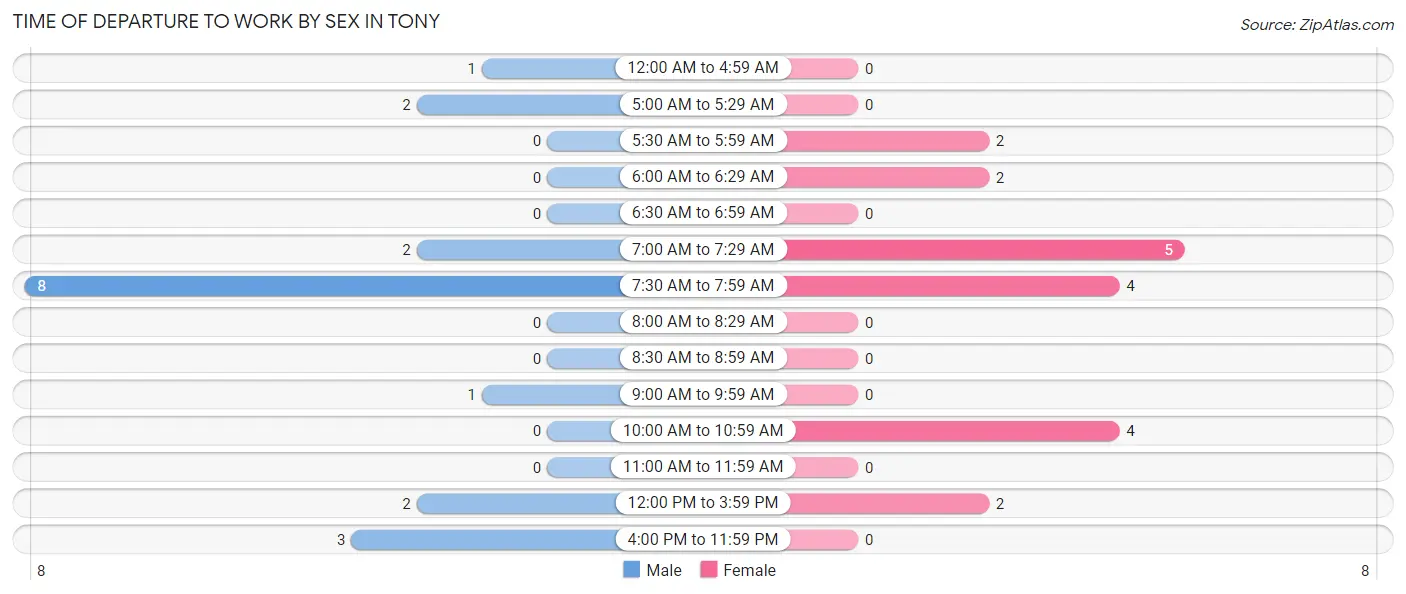
| Time of Departure | Male | Female |
| 12:00 AM to 4:59 AM | 1 (5.3%) | 0 (0.0%) |
| 5:00 AM to 5:29 AM | 2 (10.5%) | 0 (0.0%) |
| 5:30 AM to 5:59 AM | 0 (0.0%) | 2 (10.5%) |
| 6:00 AM to 6:29 AM | 0 (0.0%) | 2 (10.5%) |
| 6:30 AM to 6:59 AM | 0 (0.0%) | 0 (0.0%) |
| 7:00 AM to 7:29 AM | 2 (10.5%) | 5 (26.3%) |
| 7:30 AM to 7:59 AM | 8 (42.1%) | 4 (21.0%) |
| 8:00 AM to 8:29 AM | 0 (0.0%) | 0 (0.0%) |
| 8:30 AM to 8:59 AM | 0 (0.0%) | 0 (0.0%) |
| 9:00 AM to 9:59 AM | 1 (5.3%) | 0 (0.0%) |
| 10:00 AM to 10:59 AM | 0 (0.0%) | 4 (21.0%) |
| 11:00 AM to 11:59 AM | 0 (0.0%) | 0 (0.0%) |
| 12:00 PM to 3:59 PM | 2 (10.5%) | 2 (10.5%) |
| 4:00 PM to 11:59 PM | 3 (15.8%) | 0 (0.0%) |
| Total | 19 (100.0%) | 19 (100.0%) |
Housing Occupancy in Tony
Occupancy by Ownership in Tony
Of the total 49 dwellings in Tony, owner-occupied units account for 44 (89.8%), while renter-occupied units make up 5 (10.2%).
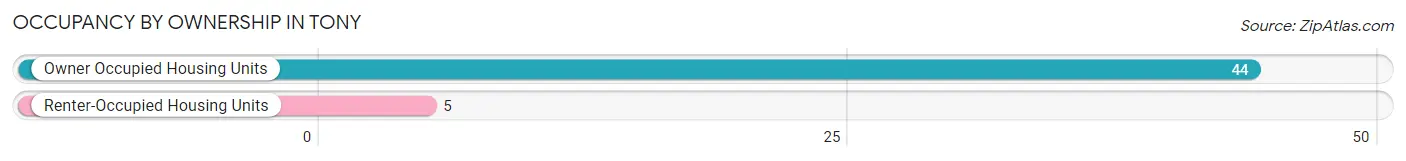
| Occupancy | # Housing Units | % Housing Units |
| Owner Occupied Housing Units | 44 | 89.8% |
| Renter-Occupied Housing Units | 5 | 10.2% |
| Total Occupied Housing Units | 49 | 100.0% |
Occupancy by Household Size in Tony
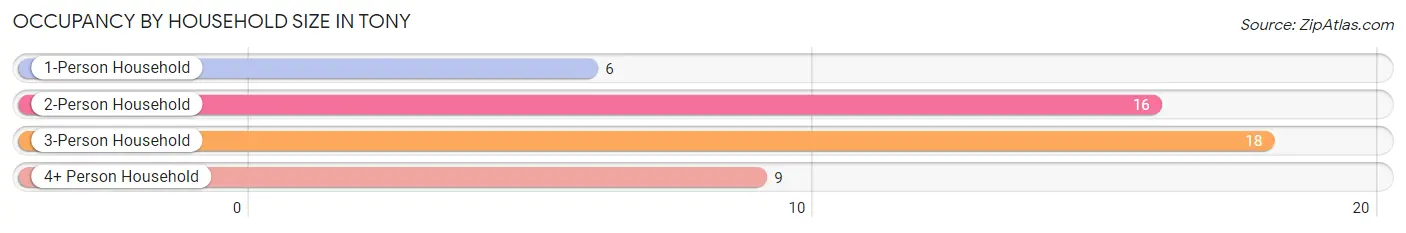
| Household Size | # Housing Units | % Housing Units |
| 1-Person Household | 6 | 12.2% |
| 2-Person Household | 16 | 32.7% |
| 3-Person Household | 18 | 36.7% |
| 4+ Person Household | 9 | 18.4% |
| Total Housing Units | 49 | 100.0% |
Occupancy by Ownership by Household Size in Tony
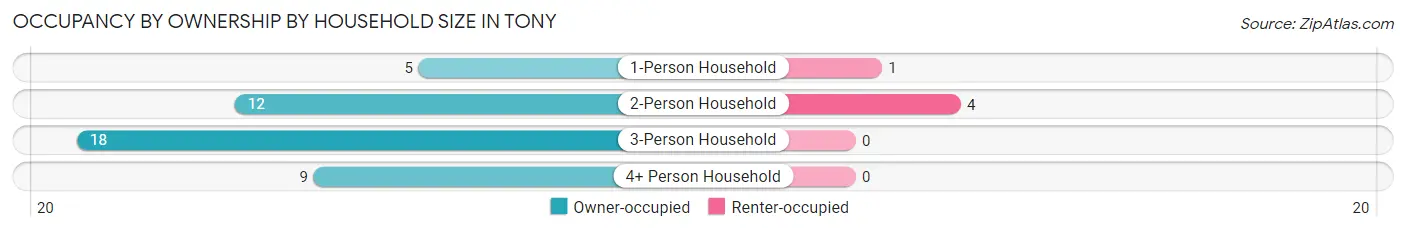
| Household Size | Owner-occupied | Renter-occupied |
| 1-Person Household | 5 (83.3%) | 1 (16.7%) |
| 2-Person Household | 12 (75.0%) | 4 (25.0%) |
| 3-Person Household | 18 (100.0%) | 0 (0.0%) |
| 4+ Person Household | 9 (100.0%) | 0 (0.0%) |
| Total Housing Units | 44 (89.8%) | 5 (10.2%) |
Occupancy by Educational Attainment in Tony
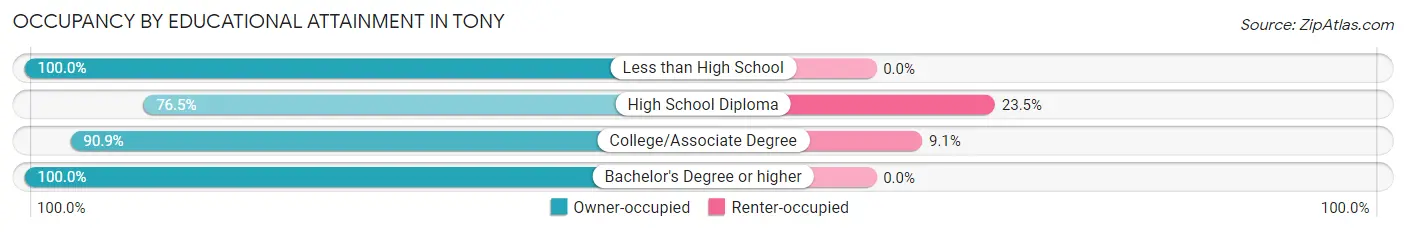
| Household Size | Owner-occupied | Renter-occupied |
| Less than High School | 2 (100.0%) | 0 (0.0%) |
| High School Diploma | 13 (76.5%) | 4 (23.5%) |
| College/Associate Degree | 10 (90.9%) | 1 (9.1%) |
| Bachelor's Degree or higher | 19 (100.0%) | 0 (0.0%) |
Occupancy by Age of Householder in Tony
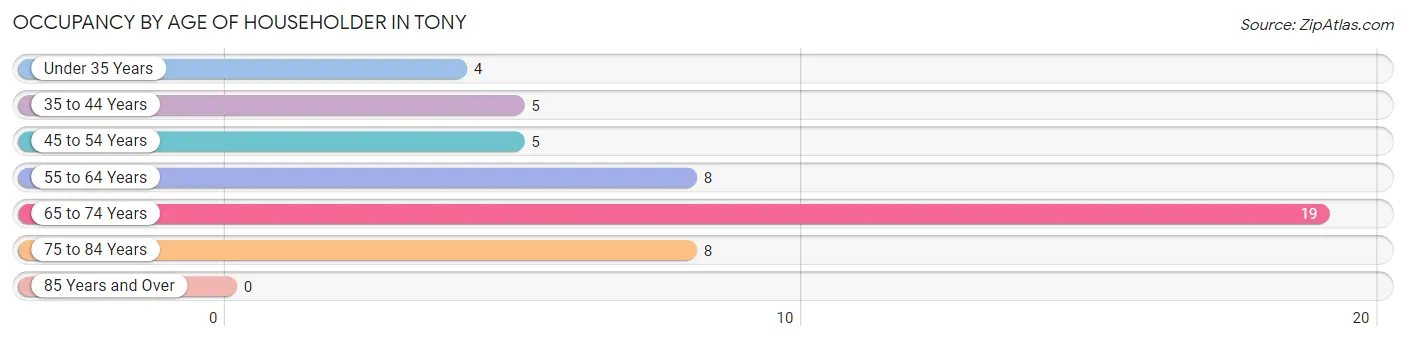
| Age Bracket | # Households | % Households |
| Under 35 Years | 4 | 8.2% |
| 35 to 44 Years | 5 | 10.2% |
| 45 to 54 Years | 5 | 10.2% |
| 55 to 64 Years | 8 | 16.3% |
| 65 to 74 Years | 19 | 38.8% |
| 75 to 84 Years | 8 | 16.3% |
| 85 Years and Over | 0 | 0.0% |
| Total | 49 | 100.0% |
Housing Finances in Tony
Median Income by Occupancy in Tony
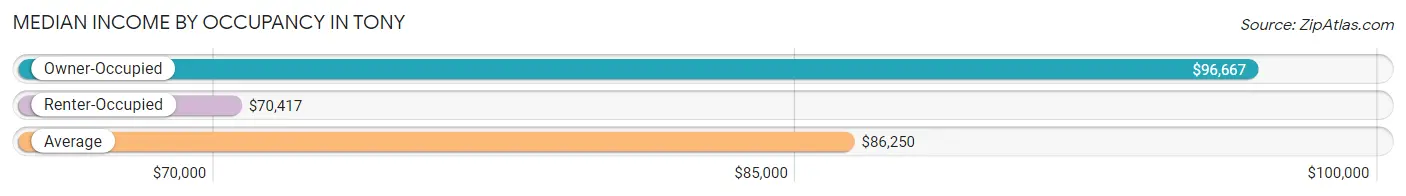
| Occupancy Type | # Households | Median Income |
| Owner-Occupied | 44 (89.8%) | $96,667 |
| Renter-Occupied | 5 (10.2%) | $70,417 |
| Average | 49 (100.0%) | $86,250 |
Occupancy by Householder Income Bracket in Tony
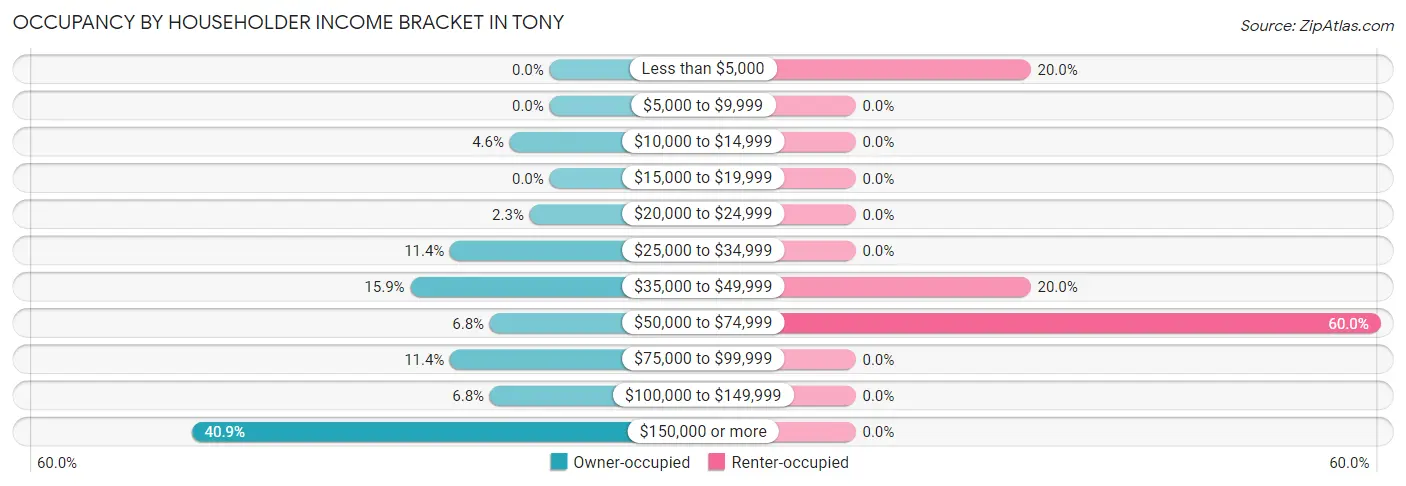
| Income Bracket | Owner-occupied | Renter-occupied |
| Less than $5,000 | 0 (0.0%) | 1 (20.0%) |
| $5,000 to $9,999 | 0 (0.0%) | 0 (0.0%) |
| $10,000 to $14,999 | 2 (4.5%) | 0 (0.0%) |
| $15,000 to $19,999 | 0 (0.0%) | 0 (0.0%) |
| $20,000 to $24,999 | 1 (2.3%) | 0 (0.0%) |
| $25,000 to $34,999 | 5 (11.4%) | 0 (0.0%) |
| $35,000 to $49,999 | 7 (15.9%) | 1 (20.0%) |
| $50,000 to $74,999 | 3 (6.8%) | 3 (60.0%) |
| $75,000 to $99,999 | 5 (11.4%) | 0 (0.0%) |
| $100,000 to $149,999 | 3 (6.8%) | 0 (0.0%) |
| $150,000 or more | 18 (40.9%) | 0 (0.0%) |
| Total | 44 (100.0%) | 5 (100.0%) |
Monthly Housing Cost Tiers in Tony
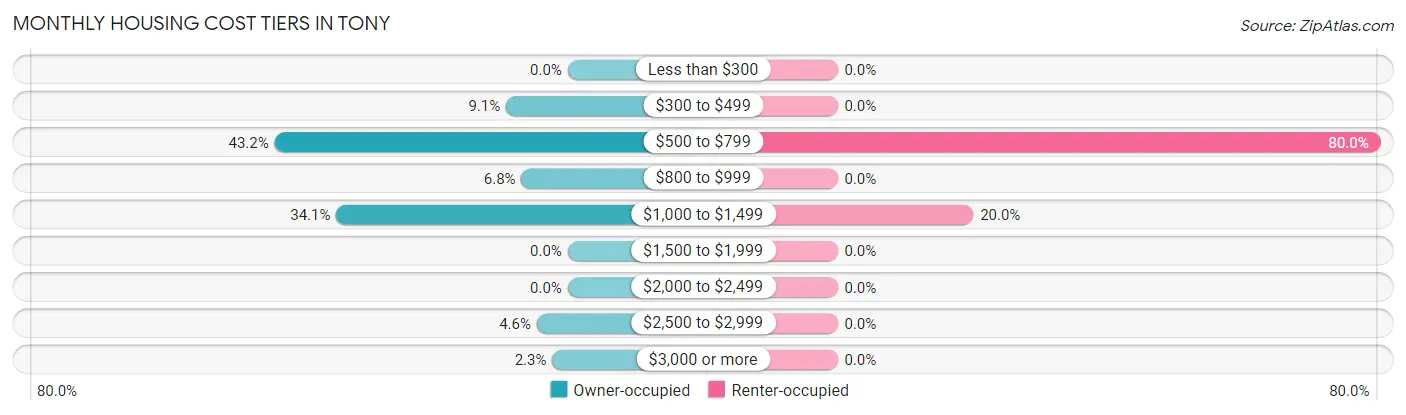
| Monthly Cost | Owner-occupied | Renter-occupied |
| Less than $300 | 0 (0.0%) | 0 (0.0%) |
| $300 to $499 | 4 (9.1%) | 0 (0.0%) |
| $500 to $799 | 19 (43.2%) | 4 (80.0%) |
| $800 to $999 | 3 (6.8%) | 0 (0.0%) |
| $1,000 to $1,499 | 15 (34.1%) | 1 (20.0%) |
| $1,500 to $1,999 | 0 (0.0%) | 0 (0.0%) |
| $2,000 to $2,499 | 0 (0.0%) | 0 (0.0%) |
| $2,500 to $2,999 | 2 (4.5%) | 0 (0.0%) |
| $3,000 or more | 1 (2.3%) | 0 (0.0%) |
| Total | 44 (100.0%) | 5 (100.0%) |
Physical Housing Characteristics in Tony
Housing Structures in Tony
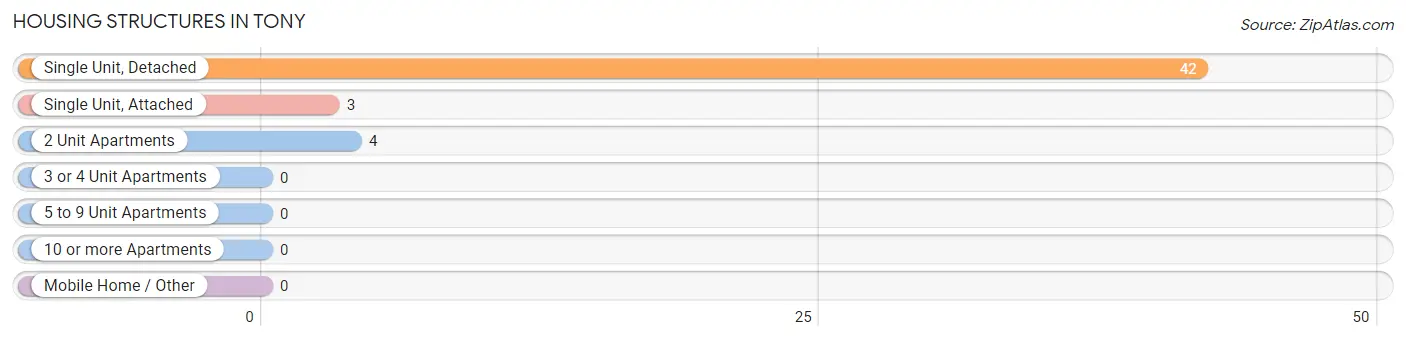
| Structure Type | # Housing Units | % Housing Units |
| Single Unit, Detached | 42 | 85.7% |
| Single Unit, Attached | 3 | 6.1% |
| 2 Unit Apartments | 4 | 8.2% |
| 3 or 4 Unit Apartments | 0 | 0.0% |
| 5 to 9 Unit Apartments | 0 | 0.0% |
| 10 or more Apartments | 0 | 0.0% |
| Mobile Home / Other | 0 | 0.0% |
| Total | 49 | 100.0% |
Housing Structures by Occupancy in Tony
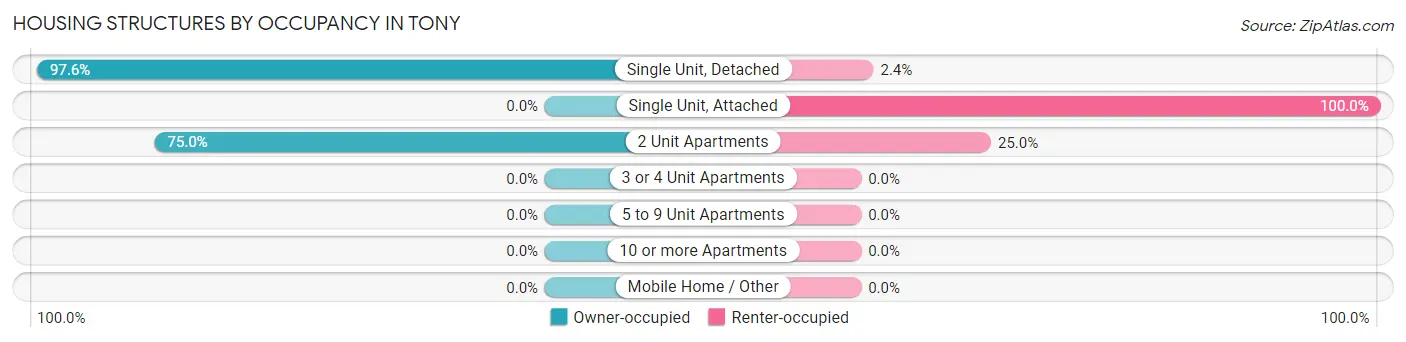
| Structure Type | Owner-occupied | Renter-occupied |
| Single Unit, Detached | 41 (97.6%) | 1 (2.4%) |
| Single Unit, Attached | 0 (0.0%) | 3 (100.0%) |
| 2 Unit Apartments | 3 (75.0%) | 1 (25.0%) |
| 3 or 4 Unit Apartments | 0 (0.0%) | 0 (0.0%) |
| 5 to 9 Unit Apartments | 0 (0.0%) | 0 (0.0%) |
| 10 or more Apartments | 0 (0.0%) | 0 (0.0%) |
| Mobile Home / Other | 0 (0.0%) | 0 (0.0%) |
| Total | 44 (89.8%) | 5 (10.2%) |
Housing Structures by Number of Rooms in Tony
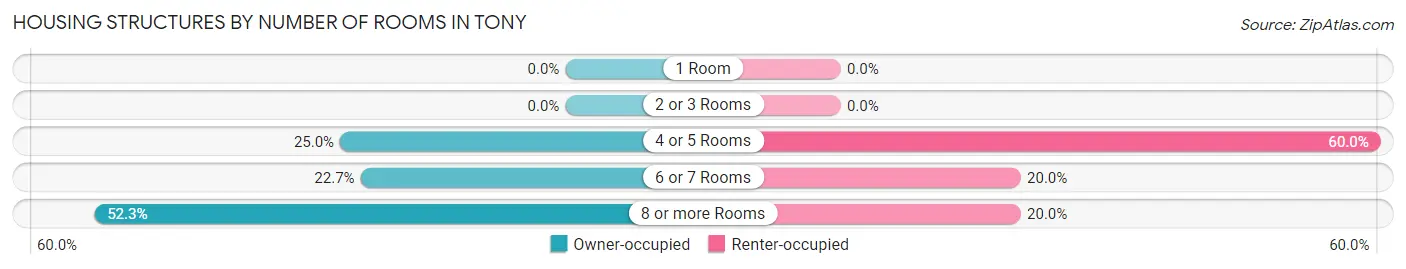
| Number of Rooms | Owner-occupied | Renter-occupied |
| 1 Room | 0 (0.0%) | 0 (0.0%) |
| 2 or 3 Rooms | 0 (0.0%) | 0 (0.0%) |
| 4 or 5 Rooms | 11 (25.0%) | 3 (60.0%) |
| 6 or 7 Rooms | 10 (22.7%) | 1 (20.0%) |
| 8 or more Rooms | 23 (52.3%) | 1 (20.0%) |
| Total | 44 (100.0%) | 5 (100.0%) |
Housing Structure by Heating Type in Tony
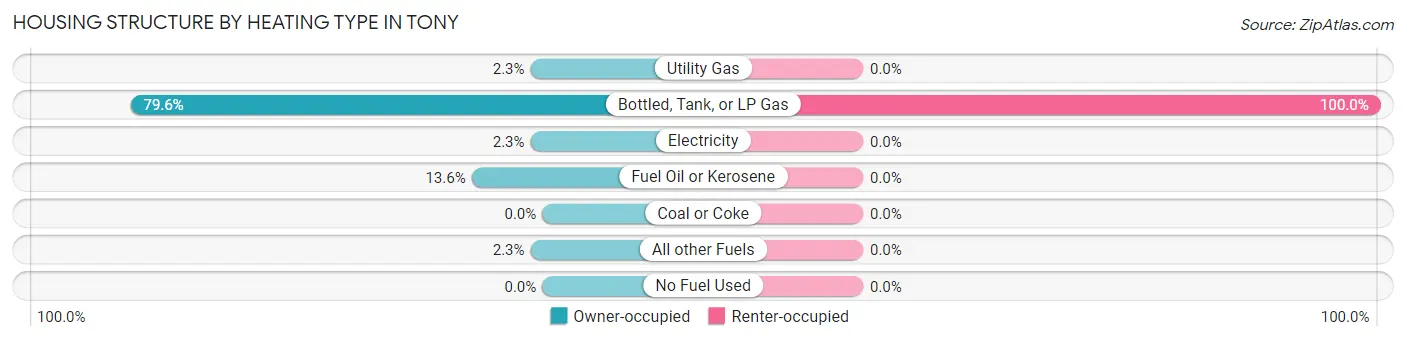
| Heating Type | Owner-occupied | Renter-occupied |
| Utility Gas | 1 (2.3%) | 0 (0.0%) |
| Bottled, Tank, or LP Gas | 35 (79.5%) | 5 (100.0%) |
| Electricity | 1 (2.3%) | 0 (0.0%) |
| Fuel Oil or Kerosene | 6 (13.6%) | 0 (0.0%) |
| Coal or Coke | 0 (0.0%) | 0 (0.0%) |
| All other Fuels | 1 (2.3%) | 0 (0.0%) |
| No Fuel Used | 0 (0.0%) | 0 (0.0%) |
| Total | 44 (100.0%) | 5 (100.0%) |
Household Vehicle Usage in Tony
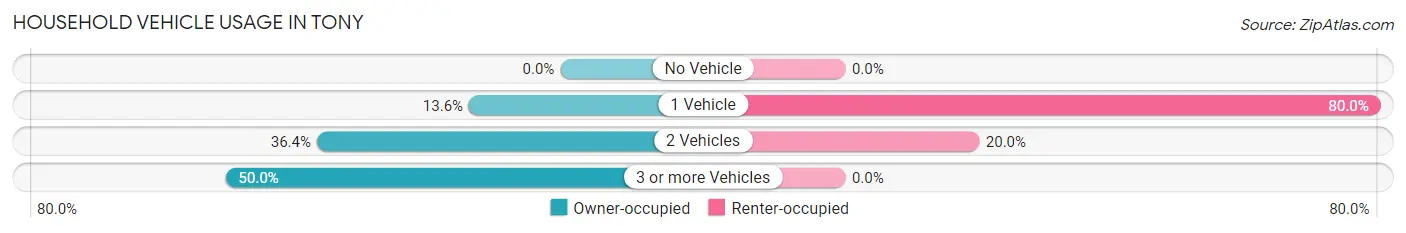
| Vehicles per Household | Owner-occupied | Renter-occupied |
| No Vehicle | 0 (0.0%) | 0 (0.0%) |
| 1 Vehicle | 6 (13.6%) | 4 (80.0%) |
| 2 Vehicles | 16 (36.4%) | 1 (20.0%) |
| 3 or more Vehicles | 22 (50.0%) | 0 (0.0%) |
| Total | 44 (100.0%) | 5 (100.0%) |
Real Estate & Mortgages in Tony
Real Estate and Mortgage Overview in Tony
| Characteristic | Without Mortgage | With Mortgage |
| Housing Units | 28 | 16 |
| Median Property Value | $56,400 | $116,700 |
| Median Household Income | $150,577 | $1 |
| Monthly Housing Costs | $559 | $1 |
| Real Estate Taxes | $1,361 | $0 |
Property Value by Mortgage Status in Tony
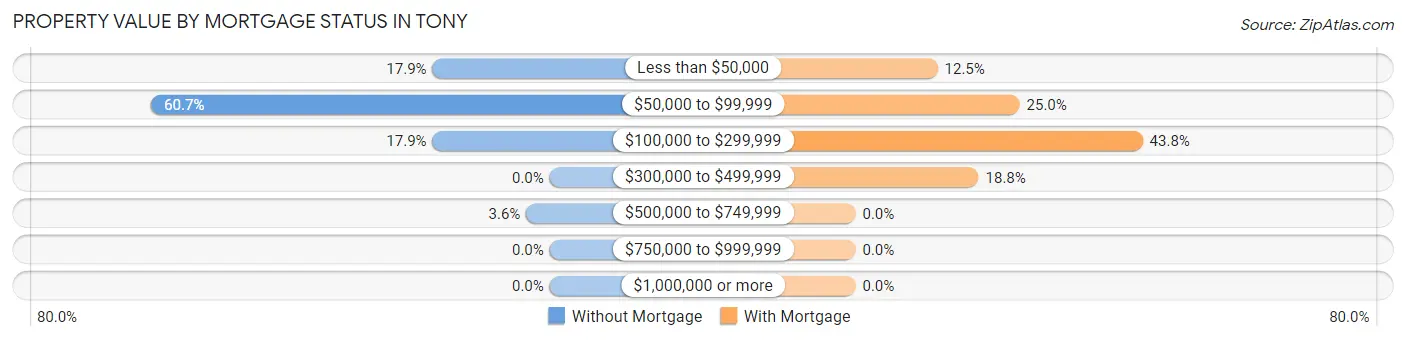
| Property Value | Without Mortgage | With Mortgage |
| Less than $50,000 | 5 (17.9%) | 2 (12.5%) |
| $50,000 to $99,999 | 17 (60.7%) | 4 (25.0%) |
| $100,000 to $299,999 | 5 (17.9%) | 7 (43.8%) |
| $300,000 to $499,999 | 0 (0.0%) | 3 (18.8%) |
| $500,000 to $749,999 | 1 (3.6%) | 0 (0.0%) |
| $750,000 to $999,999 | 0 (0.0%) | 0 (0.0%) |
| $1,000,000 or more | 0 (0.0%) | 0 (0.0%) |
| Total | 28 (100.0%) | 16 (100.0%) |
Household Income by Mortgage Status in Tony
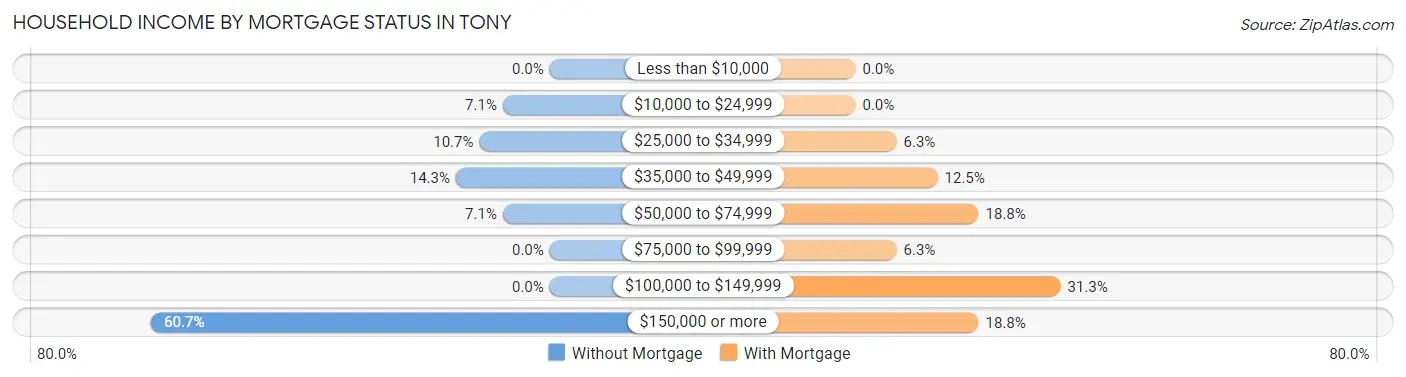
| Household Income | Without Mortgage | With Mortgage |
| Less than $10,000 | 0 (0.0%) | 0 (0.0%) |
| $10,000 to $24,999 | 2 (7.1%) | 0 (0.0%) |
| $25,000 to $34,999 | 3 (10.7%) | 1 (6.2%) |
| $35,000 to $49,999 | 4 (14.3%) | 2 (12.5%) |
| $50,000 to $74,999 | 2 (7.1%) | 3 (18.8%) |
| $75,000 to $99,999 | 0 (0.0%) | 1 (6.2%) |
| $100,000 to $149,999 | 0 (0.0%) | 5 (31.2%) |
| $150,000 or more | 17 (60.7%) | 3 (18.8%) |
| Total | 28 (100.0%) | 16 (100.0%) |
Property Value to Household Income Ratio in Tony
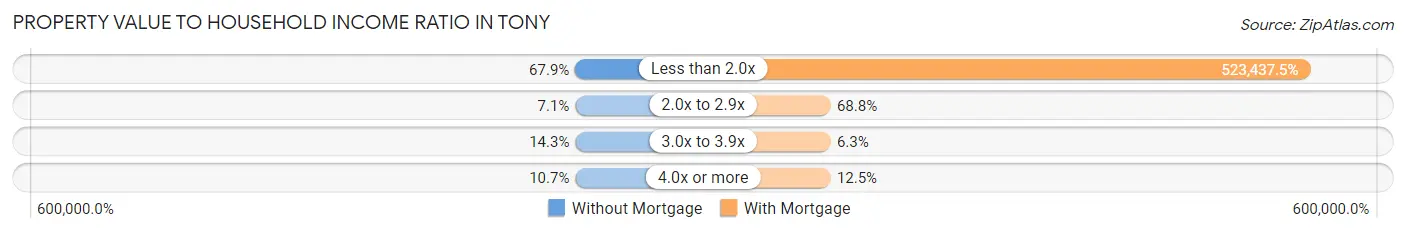
| Value-to-Income Ratio | Without Mortgage | With Mortgage |
| Less than 2.0x | 19 (67.9%) | 83,750 (523,437.5%) |
| 2.0x to 2.9x | 2 (7.1%) | 11 (68.8%) |
| 3.0x to 3.9x | 4 (14.3%) | 1 (6.2%) |
| 4.0x or more | 3 (10.7%) | 2 (12.5%) |
| Total | 28 (100.0%) | 16 (100.0%) |
Real Estate Taxes by Mortgage Status in Tony
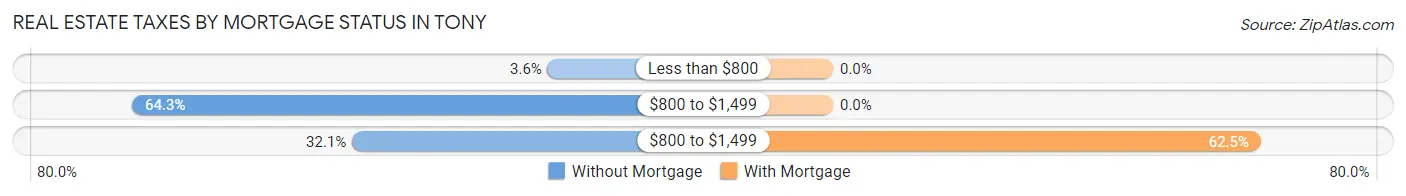
| Property Taxes | Without Mortgage | With Mortgage |
| Less than $800 | 1 (3.6%) | 0 (0.0%) |
| $800 to $1,499 | 18 (64.3%) | 0 (0.0%) |
| $800 to $1,499 | 9 (32.1%) | 10 (62.5%) |
| Total | 28 (100.0%) | 16 (100.0%) |
Health & Disability in Tony
Health Insurance Coverage by Age in Tony
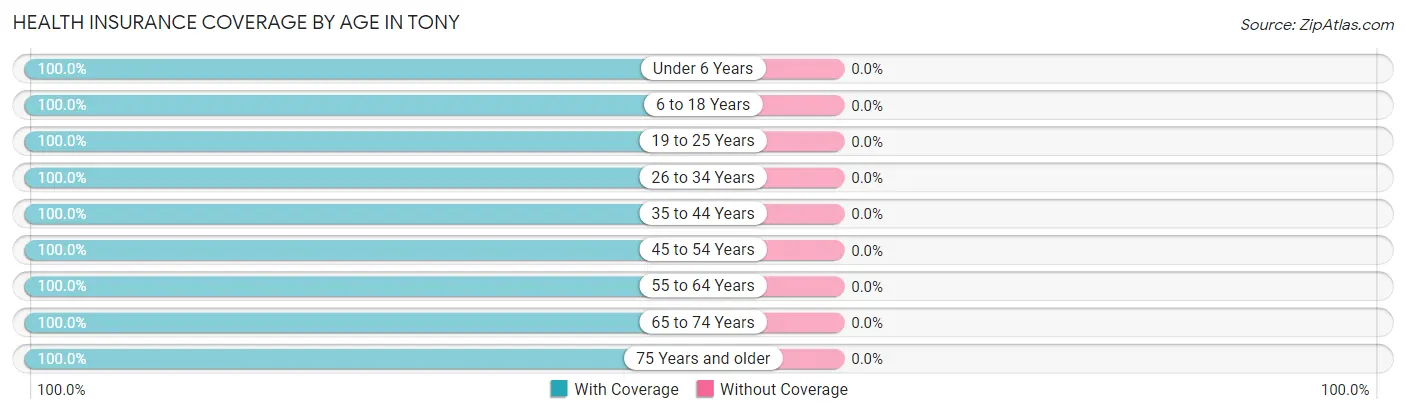
| Age Bracket | With Coverage | Without Coverage |
| Under 6 Years | 7 (100.0%) | 0 (0.0%) |
| 6 to 18 Years | 22 (100.0%) | 0 (0.0%) |
| 19 to 25 Years | 7 (100.0%) | 0 (0.0%) |
| 26 to 34 Years | 10 (100.0%) | 0 (0.0%) |
| 35 to 44 Years | 16 (100.0%) | 0 (0.0%) |
| 45 to 54 Years | 10 (100.0%) | 0 (0.0%) |
| 55 to 64 Years | 20 (100.0%) | 0 (0.0%) |
| 65 to 74 Years | 26 (100.0%) | 0 (0.0%) |
| 75 Years and older | 9 (100.0%) | 0 (0.0%) |
| Total | 127 (100.0%) | 0 (0.0%) |
Health Insurance Coverage by Citizenship Status in Tony
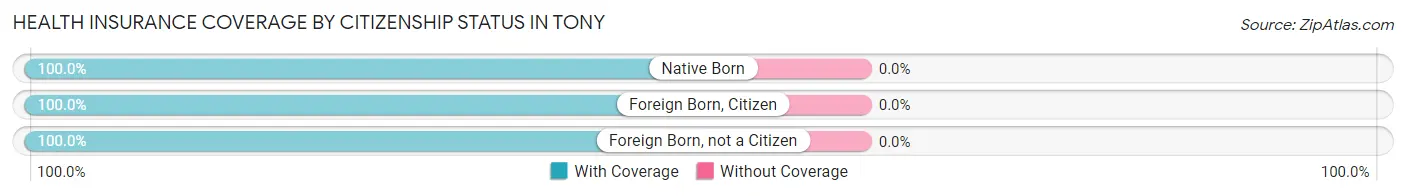
| Citizenship Status | With Coverage | Without Coverage |
| Native Born | 7 (100.0%) | 0 (0.0%) |
| Foreign Born, Citizen | 22 (100.0%) | 0 (0.0%) |
| Foreign Born, not a Citizen | 7 (100.0%) | 0 (0.0%) |
Health Insurance Coverage by Household Income in Tony
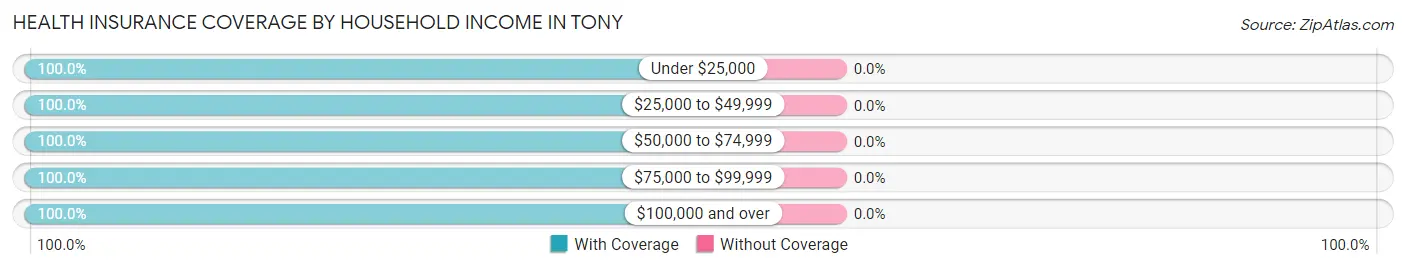
| Household Income | With Coverage | Without Coverage |
| Under $25,000 | 7 (100.0%) | 0 (0.0%) |
| $25,000 to $49,999 | 30 (100.0%) | 0 (0.0%) |
| $50,000 to $74,999 | 25 (100.0%) | 0 (0.0%) |
| $75,000 to $99,999 | 25 (100.0%) | 0 (0.0%) |
| $100,000 and over | 40 (100.0%) | 0 (0.0%) |
Public vs Private Health Insurance Coverage by Age in Tony
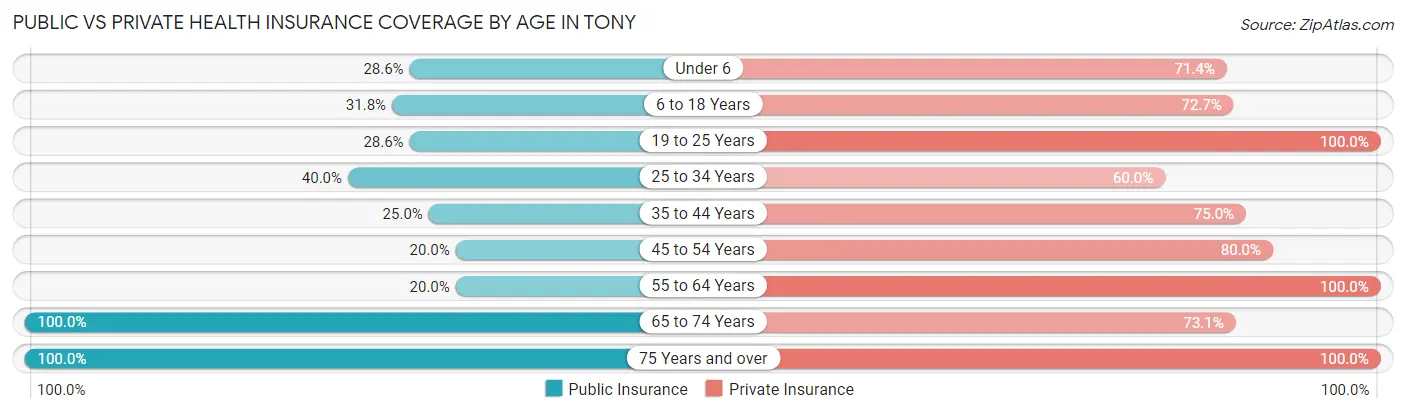
| Age Bracket | Public Insurance | Private Insurance |
| Under 6 | 2 (28.6%) | 5 (71.4%) |
| 6 to 18 Years | 7 (31.8%) | 16 (72.7%) |
| 19 to 25 Years | 2 (28.6%) | 7 (100.0%) |
| 25 to 34 Years | 4 (40.0%) | 6 (60.0%) |
| 35 to 44 Years | 4 (25.0%) | 12 (75.0%) |
| 45 to 54 Years | 2 (20.0%) | 8 (80.0%) |
| 55 to 64 Years | 4 (20.0%) | 20 (100.0%) |
| 65 to 74 Years | 26 (100.0%) | 19 (73.1%) |
| 75 Years and over | 9 (100.0%) | 9 (100.0%) |
| Total | 60 (47.2%) | 102 (80.3%) |
Disability Status by Sex by Age in Tony
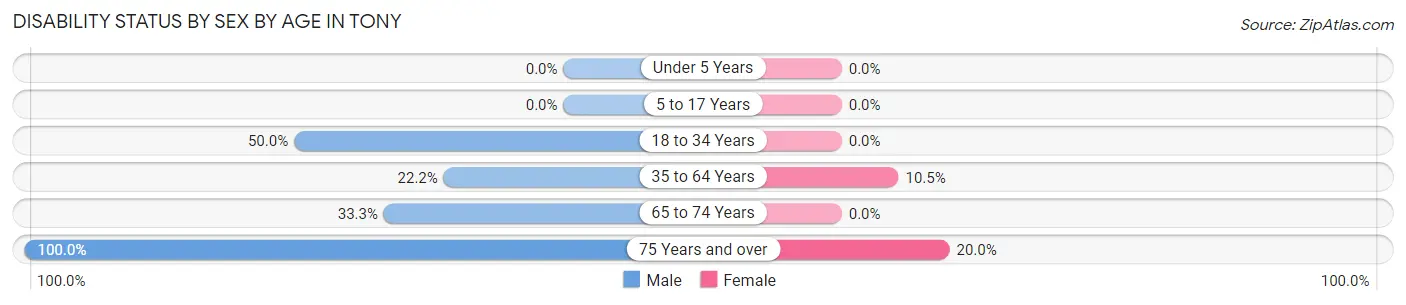
| Age Bracket | Male | Female |
| Under 5 Years | 0 (0.0%) | 0 (0.0%) |
| 5 to 17 Years | 0 (0.0%) | 0 (0.0%) |
| 18 to 34 Years | 2 (50.0%) | 0 (0.0%) |
| 35 to 64 Years | 6 (22.2%) | 2 (10.5%) |
| 65 to 74 Years | 3 (33.3%) | 0 (0.0%) |
| 75 Years and over | 4 (100.0%) | 1 (20.0%) |
Disability Class by Sex by Age in Tony
Disability Class: Hearing Difficulty
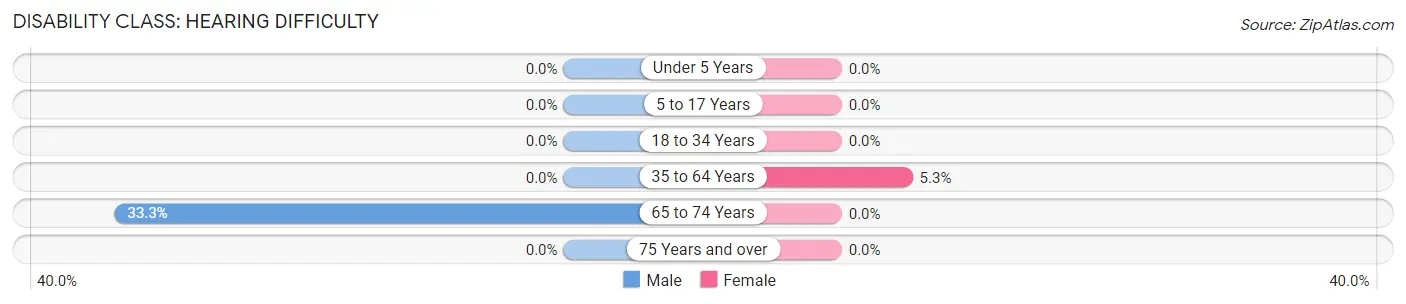
| Age Bracket | Male | Female |
| Under 5 Years | 0 (0.0%) | 0 (0.0%) |
| 5 to 17 Years | 0 (0.0%) | 0 (0.0%) |
| 18 to 34 Years | 0 (0.0%) | 0 (0.0%) |
| 35 to 64 Years | 0 (0.0%) | 1 (5.3%) |
| 65 to 74 Years | 3 (33.3%) | 0 (0.0%) |
| 75 Years and over | 0 (0.0%) | 0 (0.0%) |
Disability Class: Vision Difficulty
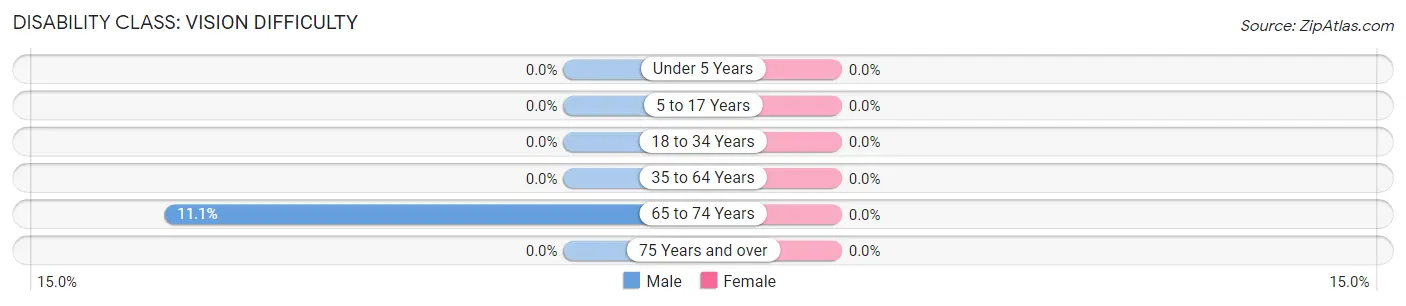
| Age Bracket | Male | Female |
| Under 5 Years | 0 (0.0%) | 0 (0.0%) |
| 5 to 17 Years | 0 (0.0%) | 0 (0.0%) |
| 18 to 34 Years | 0 (0.0%) | 0 (0.0%) |
| 35 to 64 Years | 0 (0.0%) | 0 (0.0%) |
| 65 to 74 Years | 1 (11.1%) | 0 (0.0%) |
| 75 Years and over | 0 (0.0%) | 0 (0.0%) |
Disability Class: Cognitive Difficulty
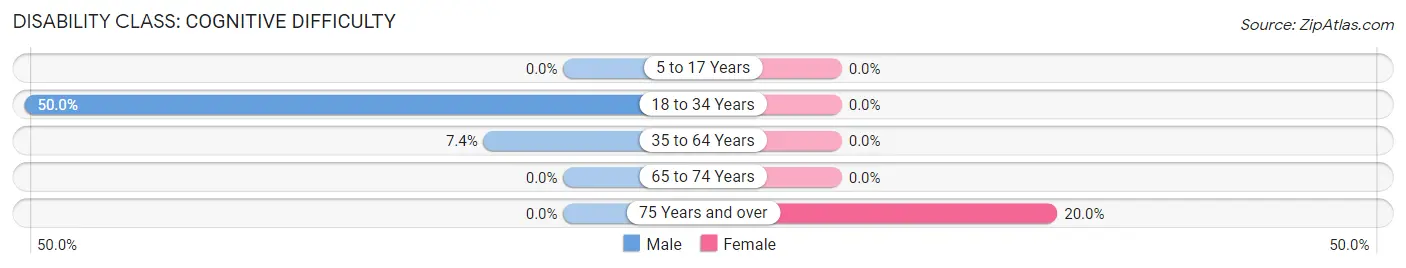
| Age Bracket | Male | Female |
| 5 to 17 Years | 0 (0.0%) | 0 (0.0%) |
| 18 to 34 Years | 2 (50.0%) | 0 (0.0%) |
| 35 to 64 Years | 2 (7.4%) | 0 (0.0%) |
| 65 to 74 Years | 0 (0.0%) | 0 (0.0%) |
| 75 Years and over | 0 (0.0%) | 1 (20.0%) |
Disability Class: Ambulatory Difficulty
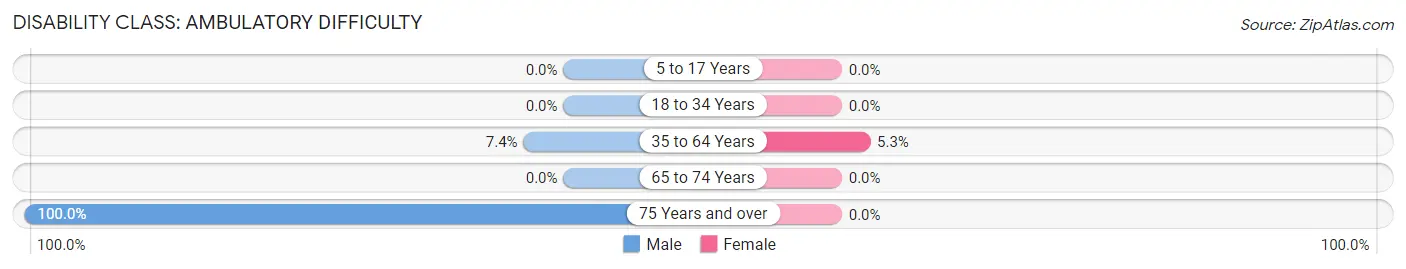
| Age Bracket | Male | Female |
| 5 to 17 Years | 0 (0.0%) | 0 (0.0%) |
| 18 to 34 Years | 0 (0.0%) | 0 (0.0%) |
| 35 to 64 Years | 2 (7.4%) | 1 (5.3%) |
| 65 to 74 Years | 0 (0.0%) | 0 (0.0%) |
| 75 Years and over | 4 (100.0%) | 0 (0.0%) |
Disability Class: Self-Care Difficulty
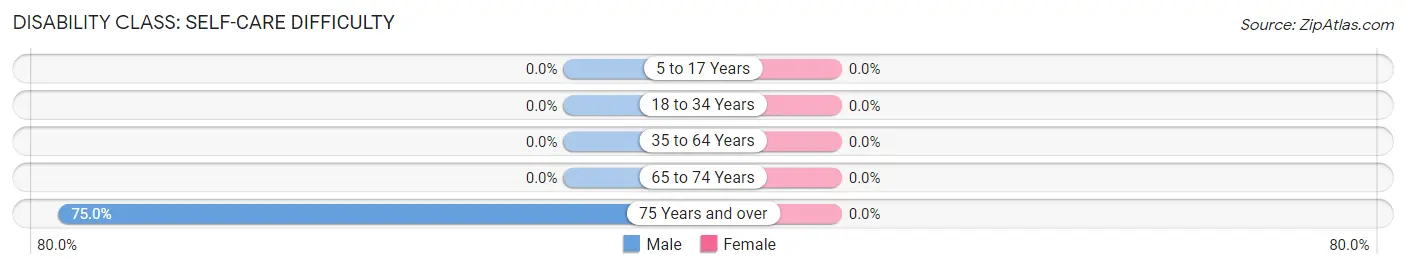
| Age Bracket | Male | Female |
| 5 to 17 Years | 0 (0.0%) | 0 (0.0%) |
| 18 to 34 Years | 0 (0.0%) | 0 (0.0%) |
| 35 to 64 Years | 0 (0.0%) | 0 (0.0%) |
| 65 to 74 Years | 0 (0.0%) | 0 (0.0%) |
| 75 Years and over | 3 (75.0%) | 0 (0.0%) |
Technology Access in Tony
Computing Device Access in Tony
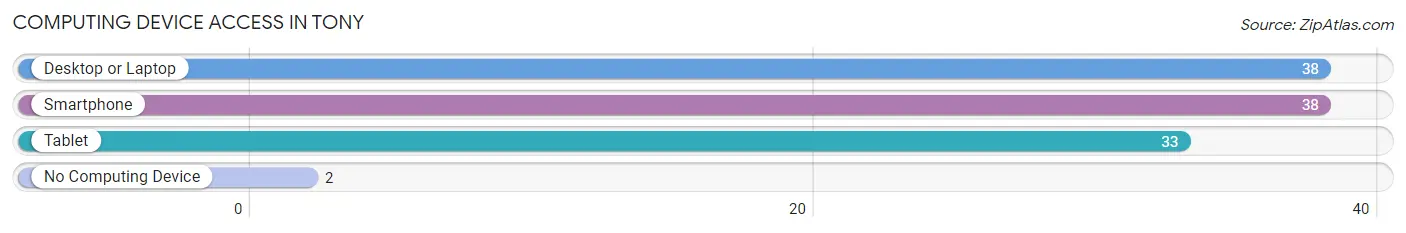
| Device Type | # Households | % Households |
| Desktop or Laptop | 38 | 77.5% |
| Smartphone | 38 | 77.5% |
| Tablet | 33 | 67.3% |
| No Computing Device | 2 | 4.1% |
| Total | 49 | 100.0% |
Internet Access in Tony
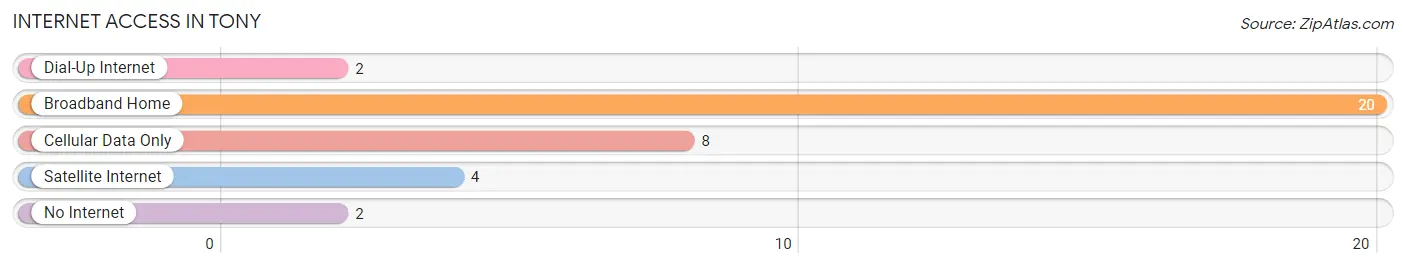
| Internet Type | # Households | % Households |
| Dial-Up Internet | 2 | 4.1% |
| Broadband Home | 20 | 40.8% |
| Cellular Data Only | 8 | 16.3% |
| Satellite Internet | 4 | 8.2% |
| No Internet | 2 | 4.1% |
| Total | 49 | 100.0% |
Tony Summary
Wisconsin is a state located in the Midwestern United States. It is bordered by Minnesota to the west, Iowa to the southwest, Illinois to the south, Lake Michigan to the east, Michigan to the northeast, and Lake Superior to the north. Wisconsin is the 23rd largest state by total area and the 20th most populous. The state capital is Madison, and its largest city is Milwaukee, which is located on the western shore of Lake Michigan.
History
The area that is now Wisconsin was first inhabited by Native American tribes, including the Menominee, Fox, Mascouten, Sauk, Potawatomi, Ojibwe, and Ho-Chunk. French explorers Jacques Marquette and Louis Jolliet explored the area in 1673, and the French established trading posts in the region. The British took control of the area after the French and Indian War, and the area was ceded to the United States in 1783 after the American Revolution. Wisconsin became a territory in 1836 and was admitted to the Union as the 30th state in 1848.
Geography
Wisconsin is located in the north-central United States, and is bordered by Minnesota to the west, Iowa to the southwest, Illinois to the south, Lake Michigan to the east, Michigan to the northeast, and Lake Superior to the north. The state has a total area of 65,498 square miles, making it the 23rd largest state in the country. Wisconsin is divided into five distinct geographic regions: the Central Plain, the Eastern Ridges and Lowlands, the Northern Highlands, the Western Uplands, and the Lake Superior Lowland. The state is home to numerous rivers, including the Wisconsin, Chippewa, Fox, and St. Croix. The state also has numerous lakes, including Lake Michigan, Lake Superior, and Lake Winnebago.
Economy
Wisconsin has a diversified economy, with major industries including manufacturing, agriculture, health care, and tourism. The state is a major producer of dairy products, and is the leading producer of cheese in the United States. Other major agricultural products include corn, soybeans, oats, potatoes, and cranberries. Wisconsin is also a major producer of paper products, and is home to numerous paper mills. The state is also a major producer of machinery, and is home to numerous manufacturing companies, including Harley-Davidson, Johnson Controls, and Kohler. The state is also home to numerous health care companies, including Epic Systems, Aurora Health Care, and Marshfield Clinic. Tourism is also an important part of the state’s economy, with major attractions including the Wisconsin Dells, Door County, and the Apostle Islands National Lakeshore.
Demographics
As of 2019, Wisconsin had an estimated population of 5.8 million, making it the 20th most populous state in the country. The state has a population density of 92.3 people per square mile, and the largest city is Milwaukee, with an estimated population of 595,000. The state is home to numerous ethnic and racial groups, including White (84.2%), Black or African American (6.7%), Hispanic or Latino (6.2%), Asian (2.7%), and Native American (1.2%). The state’s largest religious group is Christianity, with the largest denominations being Roman Catholic (31.5%), Evangelical Protestant (25.2%), and Mainline Protestant (14.2%). The state’s median household income is $59,305, and the poverty rate is 10.2%.
Common Questions
What is Per Capita Income in Tony?
Per Capita income in Tony is $28,787.
What is the Median Family Income in Tony?
Median Family Income in Tony is $105,000.
What is the Median Household income in Tony?
Median Household Income in Tony is $86,250.
What is Income or Wage Gap in Tony?
Income or Wage Gap in Tony is 52.5%.
Women in Tony earn 47.5 cents for every dollar earned by a man.
What is Inequality or Gini Index in Tony?
Inequality or Gini Index in Tony is 0.34.
What is the Total Population of Tony?
Total Population of Tony is 127.
What is the Total Male Population of Tony?
Total Male Population of Tony is 58.
What is the Total Female Population of Tony?
Total Female Population of Tony is 69.
What is the Ratio of Males per 100 Females in Tony?
There are 84.06 Males per 100 Females in Tony.
What is the Ratio of Females per 100 Males in Tony?
There are 118.97 Females per 100 Males in Tony.
What is the Median Population Age in Tony?
Median Population Age in Tony is 46.4 Years.
What is the Average Family Size in Tony
Average Family Size in Tony is 2.8 People.
What is the Average Household Size in Tony
Average Household Size in Tony is 2.6 People.
How Large is the Labor Force in Tony?
There are 53 People in the Labor Forcein in Tony.
What is the Percentage of People in the Labor Force in Tony?
53.0% of People are in the Labor Force in Tony.
What is the Unemployment Rate in Tony?
Unemployment Rate in Tony is 1.9%.