Tomahawk, WI Map & Demographics
Tomahawk Map
Tomahawk Overview
$33,345
PER CAPITA INCOME
$81,154
AVG FAMILY INCOME
$59,800
AVG HOUSEHOLD INCOME
37.8%
WAGE / INCOME GAP [ % ]
62.2¢/ $1
WAGE / INCOME GAP [ $ ]
0.47
INEQUALITY / GINI INDEX
3,413
TOTAL POPULATION
1,597
MALE POPULATION
1,816
FEMALE POPULATION
87.94
MALES / 100 FEMALES
113.71
FEMALES / 100 MALES
40.7
MEDIAN AGE
3.1
AVG FAMILY SIZE
2.4
AVG HOUSEHOLD SIZE
1,653
LABOR FORCE [ PEOPLE ]
59.0%
PERCENT IN LABOR FORCE
7.5%
UNEMPLOYMENT RATE
Tomahawk Zip Codes
Tomahawk Area Codes
Income in Tomahawk
Income Overview in Tomahawk
Per Capita Income in Tomahawk is $33,345, while median incomes of families and households are $81,154 and $59,800 respectively.
| Characteristic | Number | Measure |
| Per Capita Income | 3,413 | $33,345 |
| Median Family Income | 762 | $81,154 |
| Mean Family Income | 762 | $100,637 |
| Median Household Income | 1,394 | $59,800 |
| Mean Household Income | 1,394 | $77,254 |
| Income Deficit | 762 | $0 |
| Wage / Income Gap (%) | 3,413 | 37.81% |
| Wage / Income Gap ($) | 3,413 | 62.19¢ per $1 |
| Gini / Inequality Index | 3,413 | 0.47 |
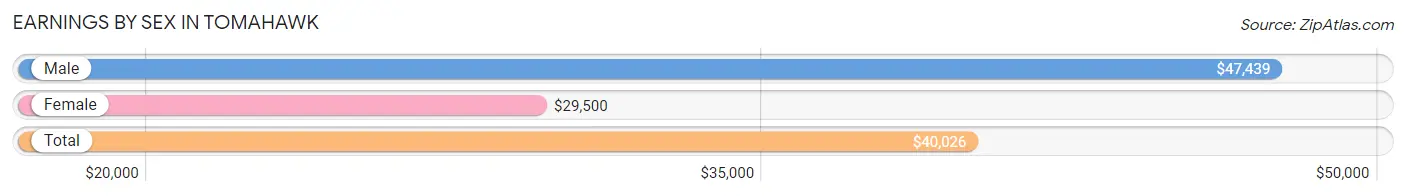
Earnings by Sex in Tomahawk
Average Earnings in Tomahawk are $40,026, $47,439 for men and $29,500 for women, a difference of 37.8%.
| Sex | Number | Average Earnings |
| Male | 918 (52.7%) | $47,439 |
| Female | 824 (47.3%) | $29,500 |
| Total | 1,742 (100.0%) | $40,026 |
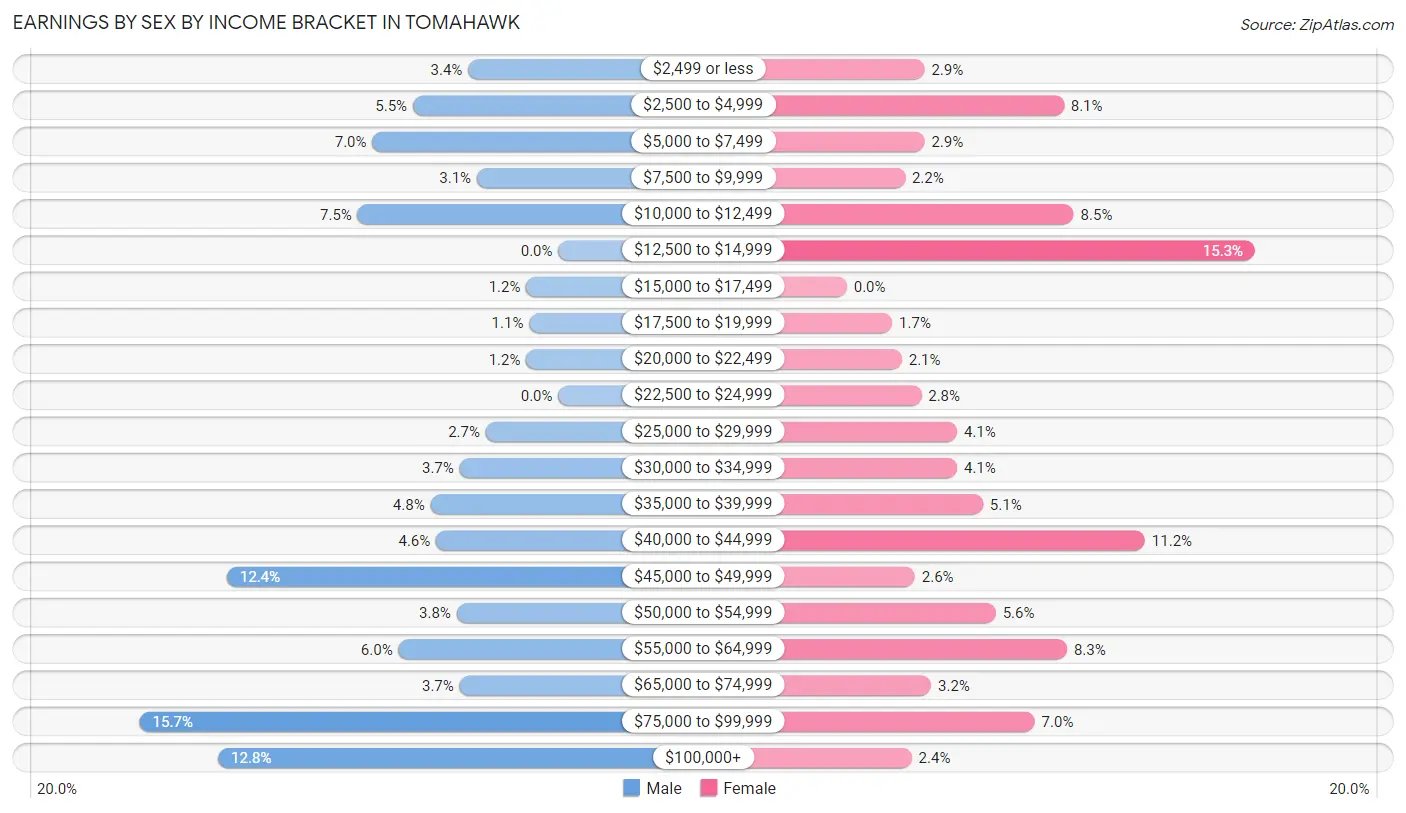
Earnings by Sex by Income Bracket in Tomahawk
The most common earnings brackets in Tomahawk are $75,000 to $99,999 for men (144 | 15.7%) and $12,500 to $14,999 for women (126 | 15.3%).
| Income | Male | Female |
| $2,499 or less | 31 (3.4%) | 24 (2.9%) |
| $2,500 to $4,999 | 50 (5.4%) | 67 (8.1%) |
| $5,000 to $7,499 | 64 (7.0%) | 24 (2.9%) |
| $7,500 to $9,999 | 28 (3.0%) | 18 (2.2%) |
| $10,000 to $12,499 | 69 (7.5%) | 70 (8.5%) |
| $12,500 to $14,999 | 0 (0.0%) | 126 (15.3%) |
| $15,000 to $17,499 | 11 (1.2%) | 0 (0.0%) |
| $17,500 to $19,999 | 10 (1.1%) | 14 (1.7%) |
| $20,000 to $22,499 | 11 (1.2%) | 17 (2.1%) |
| $22,500 to $24,999 | 0 (0.0%) | 23 (2.8%) |
| $25,000 to $29,999 | 25 (2.7%) | 34 (4.1%) |
| $30,000 to $34,999 | 34 (3.7%) | 34 (4.1%) |
| $35,000 to $39,999 | 44 (4.8%) | 42 (5.1%) |
| $40,000 to $44,999 | 42 (4.6%) | 92 (11.2%) |
| $45,000 to $49,999 | 114 (12.4%) | 21 (2.5%) |
| $50,000 to $54,999 | 35 (3.8%) | 46 (5.6%) |
| $55,000 to $64,999 | 55 (6.0%) | 68 (8.3%) |
| $65,000 to $74,999 | 34 (3.7%) | 26 (3.2%) |
| $75,000 to $99,999 | 144 (15.7%) | 58 (7.0%) |
| $100,000+ | 117 (12.8%) | 20 (2.4%) |
| Total | 918 (100.0%) | 824 (100.0%) |
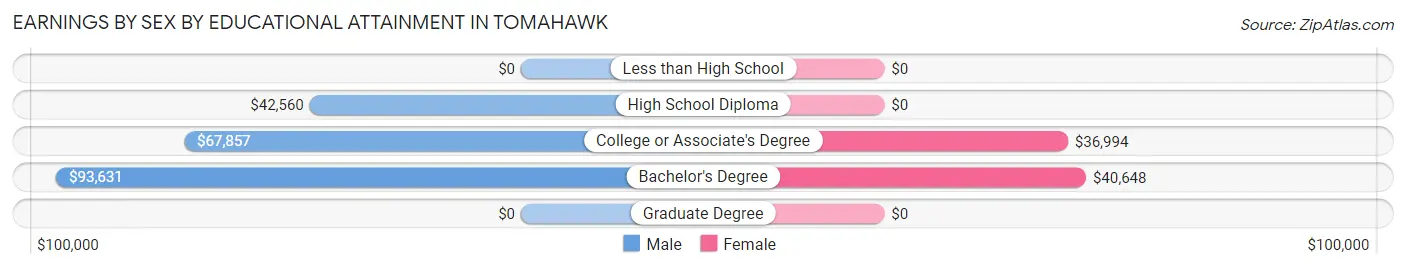
Earnings by Sex by Educational Attainment in Tomahawk
Average earnings in Tomahawk are $48,866 for men and $35,565 for women, a difference of 27.2%. Men with an educational attainment of bachelor's degree enjoy the highest average annual earnings of $93,631, while those with high school diploma education earn the least with $42,560. Women with an educational attainment of bachelor's degree earn the most with the average annual earnings of $40,648, while those with college or associate's degree education have the smallest earnings of $36,994.
| Educational Attainment | Male Income | Female Income |
| Less than High School | - | - |
| High School Diploma | $42,560 | $0 |
| College or Associate's Degree | $67,857 | $36,994 |
| Bachelor's Degree | $93,631 | $40,648 |
| Graduate Degree | - | - |
| Total | $48,866 | $35,565 |
Family Income in Tomahawk
Family Income Brackets in Tomahawk
According to the Tomahawk family income data, there are 190 families falling into the $75,000 to $99,999 income range, which is the most common income bracket and makes up 24.9% of all families. Conversely, the $10,000 to $14,999 income bracket is the least frequent group with only 10 families (1.3%) belonging to this category.
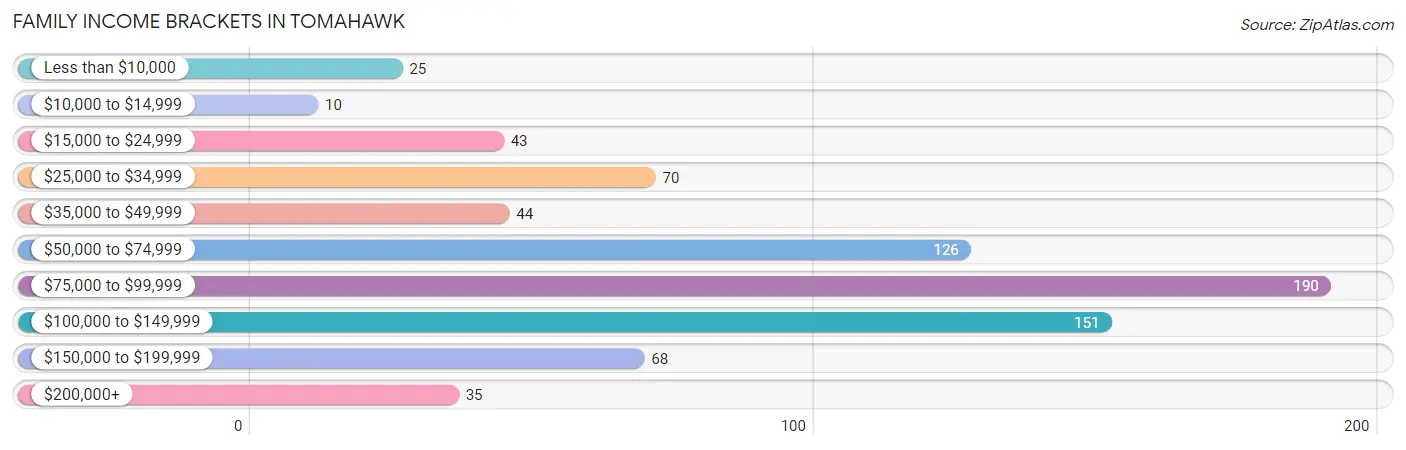
| Income Bracket | # Families | % Families |
| Less than $10,000 | 25 | 3.3% |
| $10,000 to $14,999 | 10 | 1.3% |
| $15,000 to $24,999 | 43 | 5.6% |
| $25,000 to $34,999 | 70 | 9.2% |
| $35,000 to $49,999 | 44 | 5.8% |
| $50,000 to $74,999 | 126 | 16.5% |
| $75,000 to $99,999 | 190 | 24.9% |
| $100,000 to $149,999 | 151 | 19.8% |
| $150,000 to $199,999 | 68 | 8.9% |
| $200,000+ | 35 | 4.6% |
Family Income by Famaliy Size in Tomahawk
4-person families (135 | 17.7%) account for the highest median family income in Tomahawk with $87,260 per family, while 2-person families (372 | 48.8%) have the highest median income of $39,375 per family member.
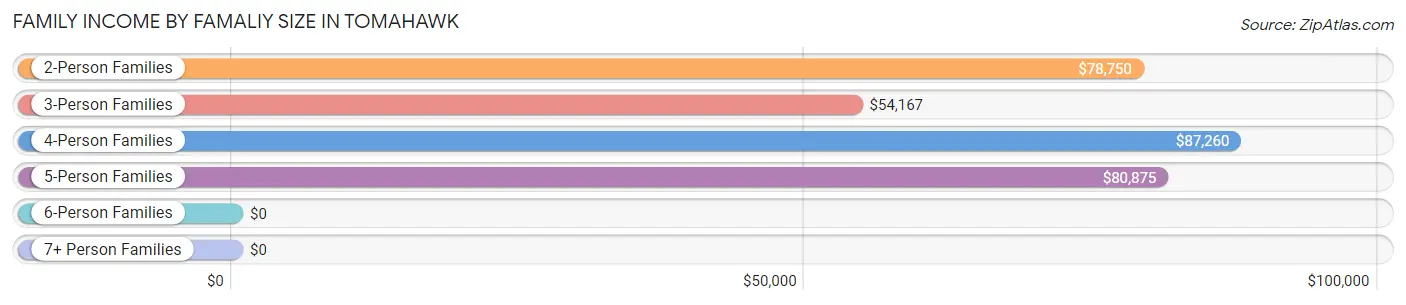
| Income Bracket | # Families | Median Income |
| 2-Person Families | 372 (48.8%) | $78,750 |
| 3-Person Families | 172 (22.6%) | $54,167 |
| 4-Person Families | 135 (17.7%) | $87,260 |
| 5-Person Families | 67 (8.8%) | $80,875 |
| 6-Person Families | 8 (1.1%) | $0 |
| 7+ Person Families | 8 (1.1%) | $0 |
| Total | 762 (100.0%) | $81,154 |
Family Income by Number of Earners in Tomahawk
The median family income in Tomahawk is $81,154, with families comprising 3+ earners (100) having the highest median family income of $105,455, while families with no earners (154) have the lowest median family income of $22,442, accounting for 13.1% and 20.2% of families, respectively.
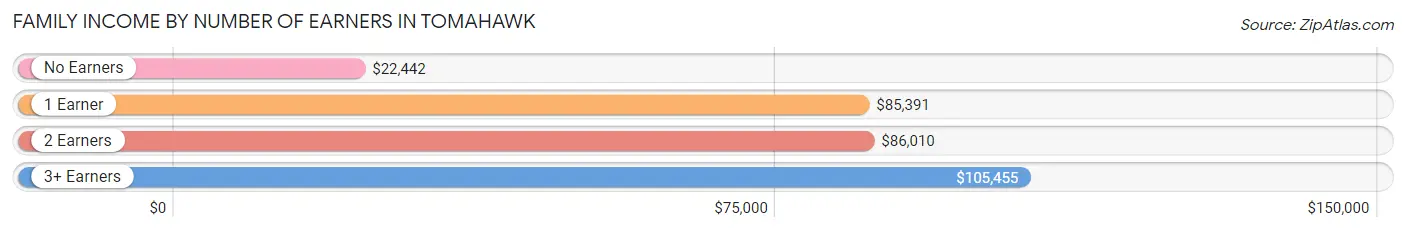
| Number of Earners | # Families | Median Income |
| No Earners | 154 (20.2%) | $22,442 |
| 1 Earner | 207 (27.2%) | $85,391 |
| 2 Earners | 301 (39.5%) | $86,010 |
| 3+ Earners | 100 (13.1%) | $105,455 |
| Total | 762 (100.0%) | $81,154 |
Household Income in Tomahawk
Household Income Brackets in Tomahawk
With 311 households falling in the category, the $75,000 to $99,999 income range is the most frequent in Tomahawk, accounting for 22.3% of all households. In contrast, only 47 households (3.4%) fall into the $200,000+ income bracket, making it the least populous group.
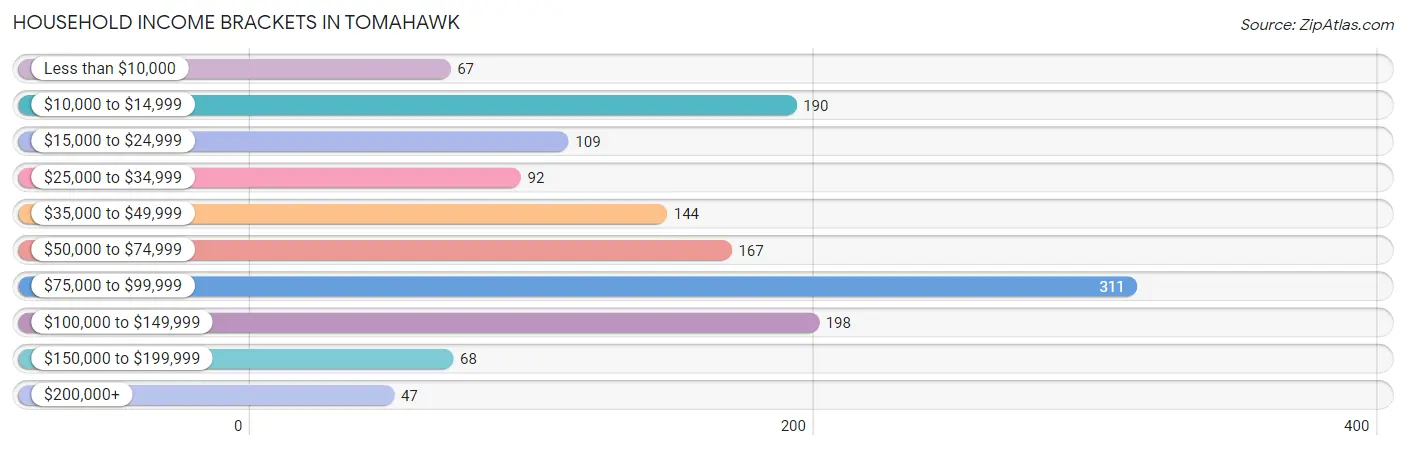
| Income Bracket | # Households | % Households |
| Less than $10,000 | 67 | 4.8% |
| $10,000 to $14,999 | 190 | 13.6% |
| $15,000 to $24,999 | 109 | 7.8% |
| $25,000 to $34,999 | 92 | 6.6% |
| $35,000 to $49,999 | 144 | 10.3% |
| $50,000 to $74,999 | 167 | 12.0% |
| $75,000 to $99,999 | 311 | 22.3% |
| $100,000 to $149,999 | 198 | 14.2% |
| $150,000 to $199,999 | 68 | 4.9% |
| $200,000+ | 47 | 3.4% |
Household Income by Householder Age in Tomahawk
The median household income in Tomahawk is $59,800, with the highest median household income of $75,078 found in the 25 to 44 years age bracket for the primary householder. A total of 383 households (27.5%) fall into this category. Meanwhile, the 15 to 24 years age bracket for the primary householder has the lowest median household income of $0, with 31 households (2.2%) in this group.
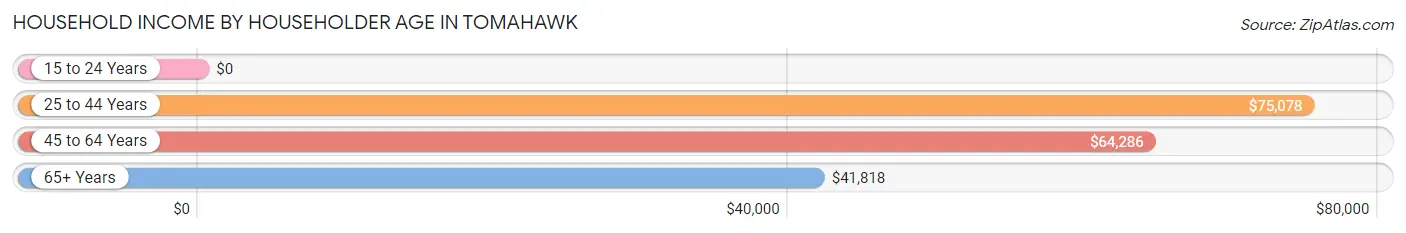
| Income Bracket | # Households | Median Income |
| 15 to 24 Years | 31 (2.2%) | $0 |
| 25 to 44 Years | 383 (27.5%) | $75,078 |
| 45 to 64 Years | 620 (44.5%) | $64,286 |
| 65+ Years | 360 (25.8%) | $41,818 |
| Total | 1,394 (100.0%) | $59,800 |
Poverty in Tomahawk
Income Below Poverty by Sex and Age in Tomahawk
With 11.1% poverty level for males and 14.3% for females among the residents of Tomahawk, under 5 year old males and 16 and 17 year old females are the most vulnerable to poverty, with 28 males (26.7%) and 61 females (61.0%) in their respective age groups living below the poverty level.
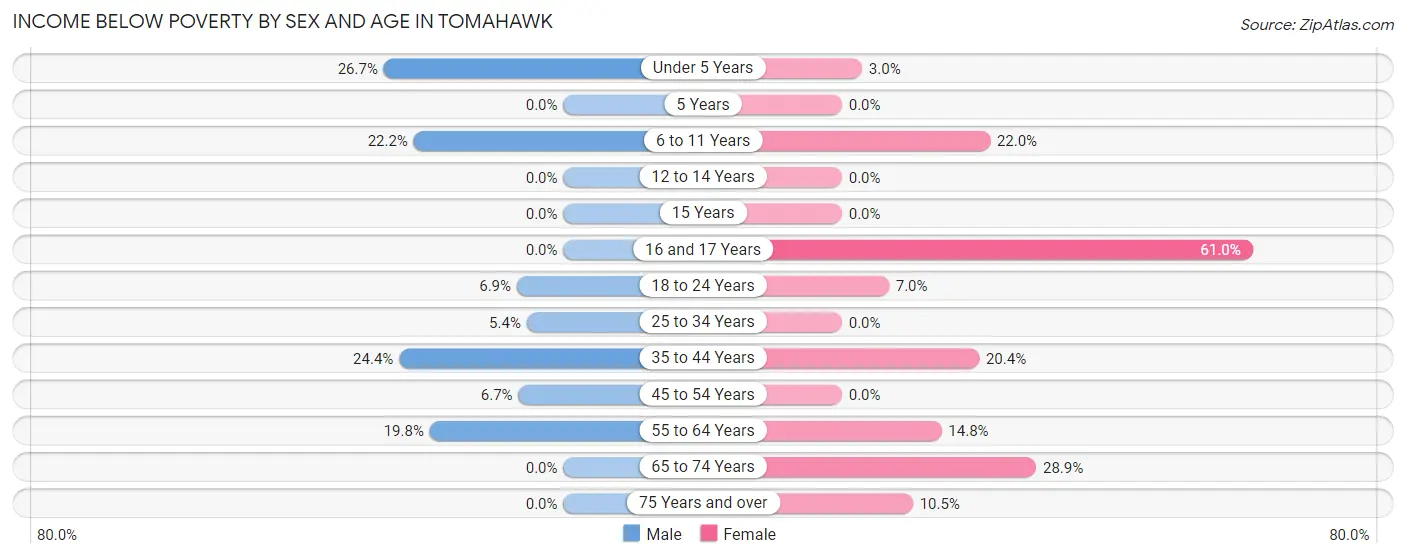
| Age Bracket | Male | Female |
| Under 5 Years | 28 (26.7%) | 2 (3.0%) |
| 5 Years | 0 (0.0%) | 0 (0.0%) |
| 6 to 11 Years | 18 (22.2%) | 22 (22.0%) |
| 12 to 14 Years | 0 (0.0%) | 0 (0.0%) |
| 15 Years | 0 (0.0%) | 0 (0.0%) |
| 16 and 17 Years | 0 (0.0%) | 61 (61.0%) |
| 18 to 24 Years | 10 (6.9%) | 9 (7.0%) |
| 25 to 34 Years | 13 (5.4%) | 0 (0.0%) |
| 35 to 44 Years | 39 (24.4%) | 55 (20.4%) |
| 45 to 54 Years | 16 (6.7%) | 0 (0.0%) |
| 55 to 64 Years | 51 (19.8%) | 42 (14.8%) |
| 65 to 74 Years | 0 (0.0%) | 45 (28.8%) |
| 75 Years and over | 0 (0.0%) | 14 (10.5%) |
| Total | 175 (11.1%) | 250 (14.3%) |
Income Above Poverty by Sex and Age in Tomahawk
According to the poverty statistics in Tomahawk, males aged 5 years and females aged 5 years are the age groups that are most secure financially, with 100.0% of males and 100.0% of females in these age groups living above the poverty line.
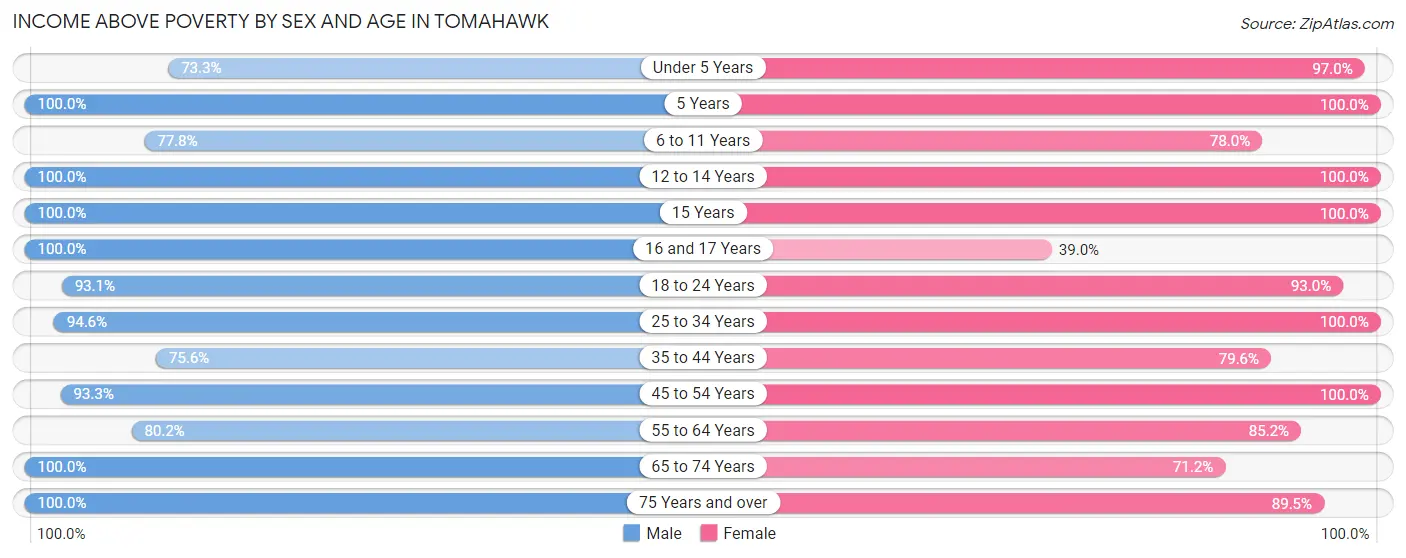
| Age Bracket | Male | Female |
| Under 5 Years | 77 (73.3%) | 65 (97.0%) |
| 5 Years | 8 (100.0%) | 14 (100.0%) |
| 6 to 11 Years | 63 (77.8%) | 78 (78.0%) |
| 12 to 14 Years | 72 (100.0%) | 128 (100.0%) |
| 15 Years | 29 (100.0%) | 7 (100.0%) |
| 16 and 17 Years | 24 (100.0%) | 39 (39.0%) |
| 18 to 24 Years | 135 (93.1%) | 120 (93.0%) |
| 25 to 34 Years | 226 (94.6%) | 171 (100.0%) |
| 35 to 44 Years | 121 (75.6%) | 215 (79.6%) |
| 45 to 54 Years | 224 (93.3%) | 188 (100.0%) |
| 55 to 64 Years | 206 (80.2%) | 242 (85.2%) |
| 65 to 74 Years | 166 (100.0%) | 111 (71.2%) |
| 75 Years and over | 53 (100.0%) | 119 (89.5%) |
| Total | 1,404 (88.9%) | 1,497 (85.7%) |
Income Below Poverty Among Married-Couple Families in Tomahawk
The poverty statistics for married-couple families in Tomahawk show that 0.2% or 1 of the total 632 families live below the poverty line. Families with 3 or 4 children have the highest poverty rate of 2.7%, comprising of 1 families. On the other hand, families with no children have the lowest poverty rate of 0.0%, which includes 0 families.
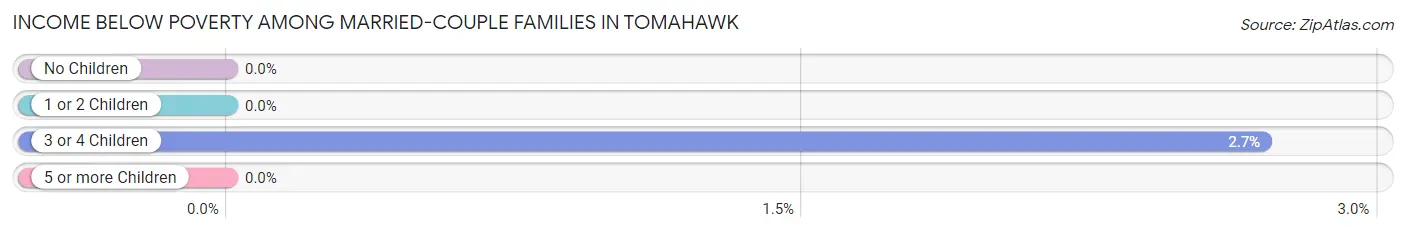
| Children | Above Poverty | Below Poverty |
| No Children | 371 (100.0%) | 0 (0.0%) |
| 1 or 2 Children | 224 (100.0%) | 0 (0.0%) |
| 3 or 4 Children | 36 (97.3%) | 1 (2.7%) |
| 5 or more Children | 0 (0.0%) | 0 (0.0%) |
| Total | 631 (99.8%) | 1 (0.2%) |
Income Below Poverty Among Single-Parent Households in Tomahawk
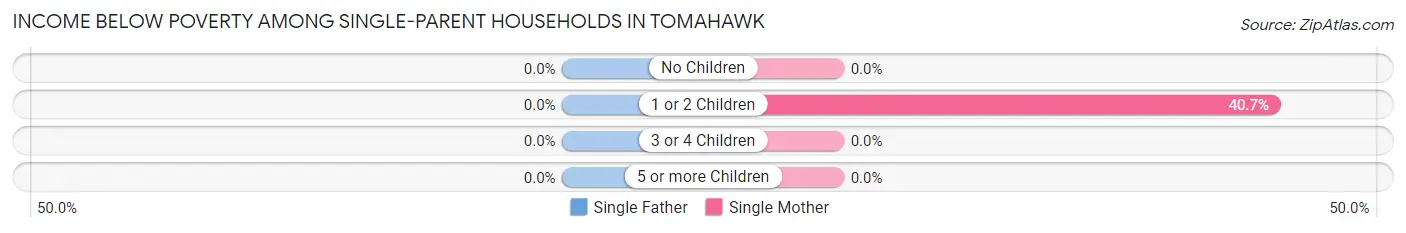
| Children | Single Father | Single Mother |
| No Children | 0 (0.0%) | 0 (0.0%) |
| 1 or 2 Children | 0 (0.0%) | 35 (40.7%) |
| 3 or 4 Children | 0 (0.0%) | 0 (0.0%) |
| 5 or more Children | 0 (0.0%) | 0 (0.0%) |
| Total | 0 (0.0%) | 35 (29.2%) |
Income Below Poverty Among Married-Couple vs Single-Parent Households in Tomahawk
The poverty data for Tomahawk shows that 1 of the married-couple family households (0.2%) and 35 of the single-parent households (26.9%) are living below the poverty level. Within the married-couple family households, those with 3 or 4 children have the highest poverty rate, with 1 households (2.7%) falling below the poverty line. Among the single-parent households, those with 1 or 2 children have the highest poverty rate, with 35 household (40.7%) living below poverty.
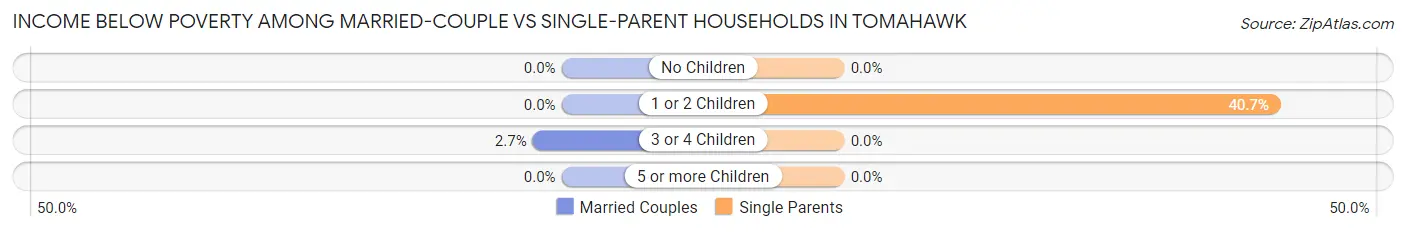
| Children | Married-Couple Families | Single-Parent Households |
| No Children | 0 (0.0%) | 0 (0.0%) |
| 1 or 2 Children | 0 (0.0%) | 35 (40.7%) |
| 3 or 4 Children | 1 (2.7%) | 0 (0.0%) |
| 5 or more Children | 0 (0.0%) | 0 (0.0%) |
| Total | 1 (0.2%) | 35 (26.9%) |
Race in Tomahawk
The most populous races in Tomahawk are White / Caucasian (3,184 | 93.3%), Two or more Races (135 | 4.0%), and Hispanic or Latino (112 | 3.3%).
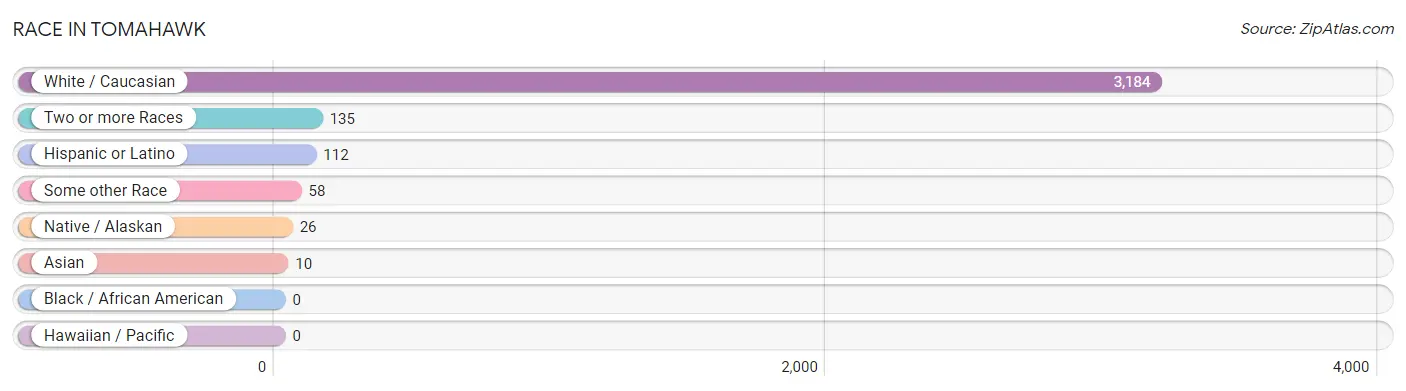
| Race | # Population | % Population |
| Asian | 10 | 0.3% |
| Black / African American | 0 | 0.0% |
| Hawaiian / Pacific | 0 | 0.0% |
| Hispanic or Latino | 112 | 3.3% |
| Native / Alaskan | 26 | 0.8% |
| White / Caucasian | 3,184 | 93.3% |
| Two or more Races | 135 | 4.0% |
| Some other Race | 58 | 1.7% |
| Total | 3,413 | 100.0% |
Ancestry in Tomahawk
The most populous ancestries reported in Tomahawk are German (1,724 | 50.5%), Norwegian (231 | 6.8%), Swedish (214 | 6.3%), American (203 | 5.9%), and Polish (200 | 5.9%), together accounting for 75.4% of all Tomahawk residents.
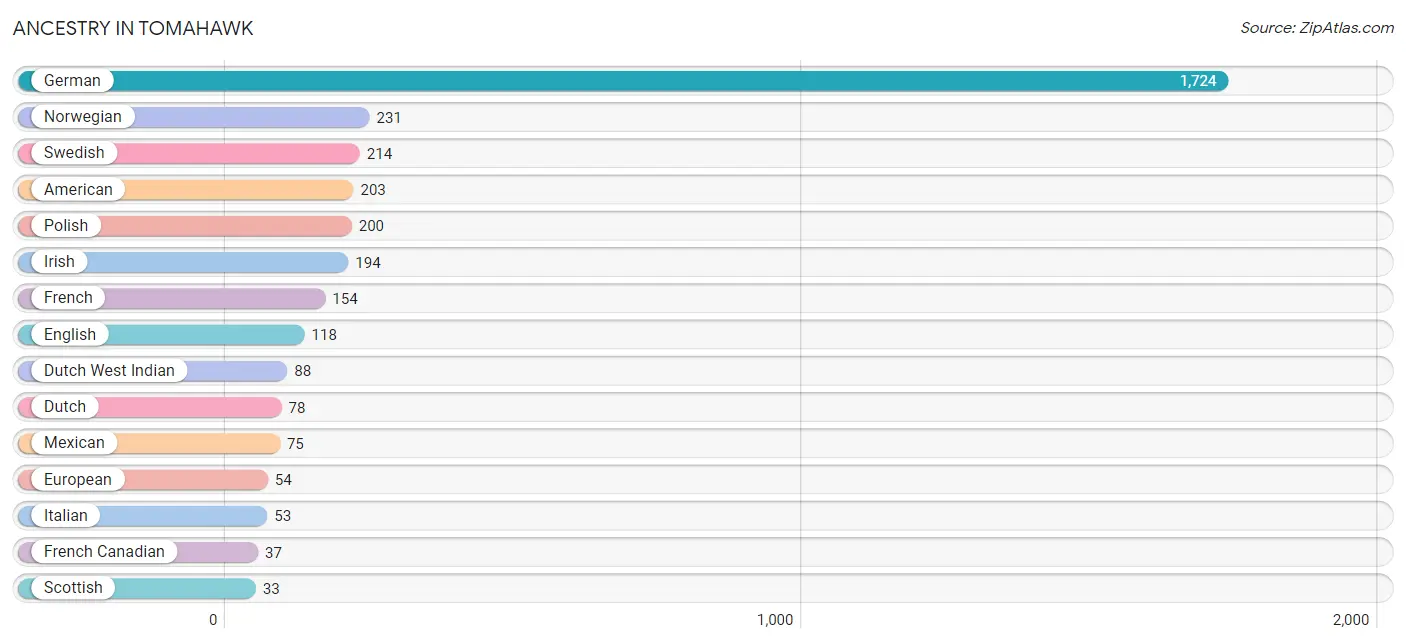
| Ancestry | # Population | % Population |
| American | 203 | 5.9% |
| Bhutanese | 28 | 0.8% |
| Blackfeet | 26 | 0.8% |
| British | 13 | 0.4% |
| Croatian | 7 | 0.2% |
| Cuban | 19 | 0.6% |
| Czech | 32 | 0.9% |
| Danish | 8 | 0.2% |
| Dutch | 78 | 2.3% |
| Dutch West Indian | 88 | 2.6% |
| English | 118 | 3.5% |
| European | 54 | 1.6% |
| Finnish | 29 | 0.9% |
| French | 154 | 4.5% |
| French Canadian | 37 | 1.1% |
| German | 1,724 | 50.5% |
| Hungarian | 8 | 0.2% |
| Icelander | 4 | 0.1% |
| Irish | 194 | 5.7% |
| Italian | 53 | 1.5% |
| Luxembourger | 8 | 0.2% |
| Mexican | 75 | 2.2% |
| Norwegian | 231 | 6.8% |
| Polish | 200 | 5.9% |
| Russian | 10 | 0.3% |
| Scotch-Irish | 27 | 0.8% |
| Scottish | 33 | 1.0% |
| Swedish | 214 | 6.3% |
| Swiss | 21 | 0.6% |
| Ukrainian | 13 | 0.4% | View All 30 Rows |
Immigrants in Tomahawk
The most numerous immigrant groups reported in Tomahawk came from Central America (37 | 1.1%), Latin America (37 | 1.1%), Nicaragua (37 | 1.1%), Europe (13 | 0.4%), and Northern Europe (13 | 0.4%), together accounting for 4.0% of all Tomahawk residents.
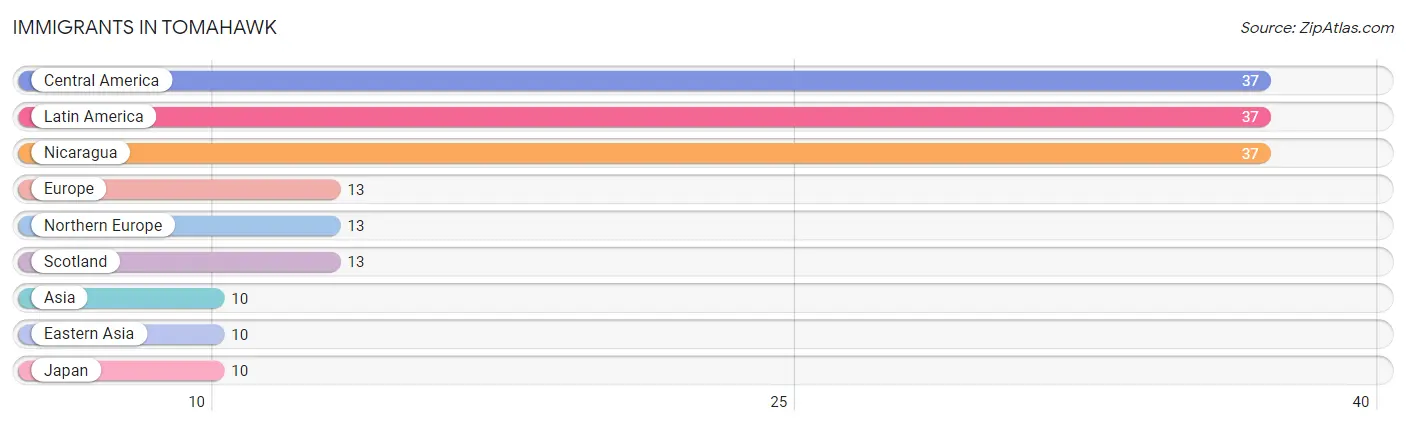
| Immigration Origin | # Population | % Population |
| Asia | 10 | 0.3% |
| Central America | 37 | 1.1% |
| Eastern Asia | 10 | 0.3% |
| Europe | 13 | 0.4% |
| Japan | 10 | 0.3% |
| Latin America | 37 | 1.1% |
| Nicaragua | 37 | 1.1% |
| Northern Europe | 13 | 0.4% |
| Scotland | 13 | 0.4% | View All 9 Rows |
Sex and Age in Tomahawk
Sex and Age in Tomahawk
The most populous age groups in Tomahawk are 55 to 59 Years (153 | 9.6%) for men and 15 to 19 Years (180 | 9.9%) for women.
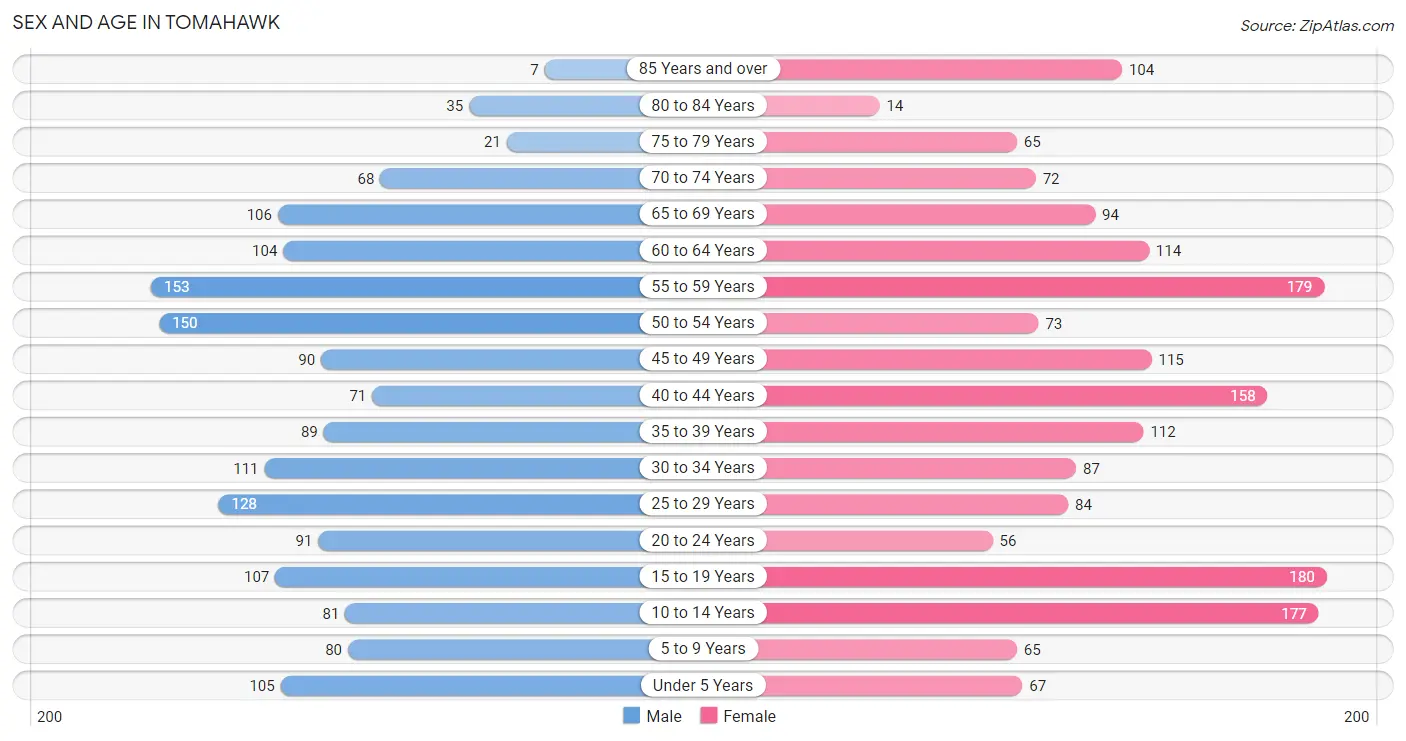
| Age Bracket | Male | Female |
| Under 5 Years | 105 (6.6%) | 67 (3.7%) |
| 5 to 9 Years | 80 (5.0%) | 65 (3.6%) |
| 10 to 14 Years | 81 (5.1%) | 177 (9.8%) |
| 15 to 19 Years | 107 (6.7%) | 180 (9.9%) |
| 20 to 24 Years | 91 (5.7%) | 56 (3.1%) |
| 25 to 29 Years | 128 (8.0%) | 84 (4.6%) |
| 30 to 34 Years | 111 (7.0%) | 87 (4.8%) |
| 35 to 39 Years | 89 (5.6%) | 112 (6.2%) |
| 40 to 44 Years | 71 (4.4%) | 158 (8.7%) |
| 45 to 49 Years | 90 (5.6%) | 115 (6.3%) |
| 50 to 54 Years | 150 (9.4%) | 73 (4.0%) |
| 55 to 59 Years | 153 (9.6%) | 179 (9.9%) |
| 60 to 64 Years | 104 (6.5%) | 114 (6.3%) |
| 65 to 69 Years | 106 (6.6%) | 94 (5.2%) |
| 70 to 74 Years | 68 (4.3%) | 72 (4.0%) |
| 75 to 79 Years | 21 (1.3%) | 65 (3.6%) |
| 80 to 84 Years | 35 (2.2%) | 14 (0.8%) |
| 85 Years and over | 7 (0.4%) | 104 (5.7%) |
| Total | 1,597 (100.0%) | 1,816 (100.0%) |
Families and Households in Tomahawk
Median Family Size in Tomahawk
The median family size in Tomahawk is 3.11 persons per family, with single male/father families (10 | 1.3%) accounting for the largest median family size of 4.1 persons per family. On the other hand, married-couple families (632 | 82.9%) represent the smallest median family size with 3.08 persons per family.
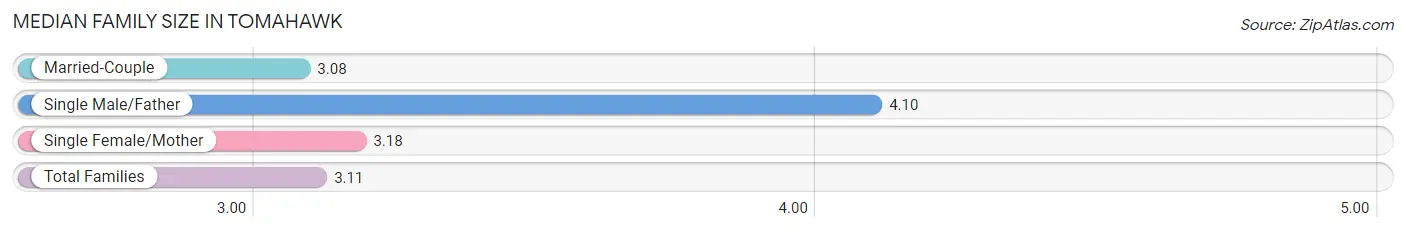
| Family Type | # Families | Family Size |
| Married-Couple | 632 (82.9%) | 3.08 |
| Single Male/Father | 10 (1.3%) | 4.10 |
| Single Female/Mother | 120 (15.8%) | 3.18 |
| Total Families | 762 (100.0%) | 3.11 |
Median Household Size in Tomahawk
The median household size in Tomahawk is 2.37 persons per household, with single male/father households (10 | 0.7%) accounting for the largest median household size of 4.1 persons per household. non-family households (632 | 45.3%) represent the smallest median household size with 1.44 persons per household.
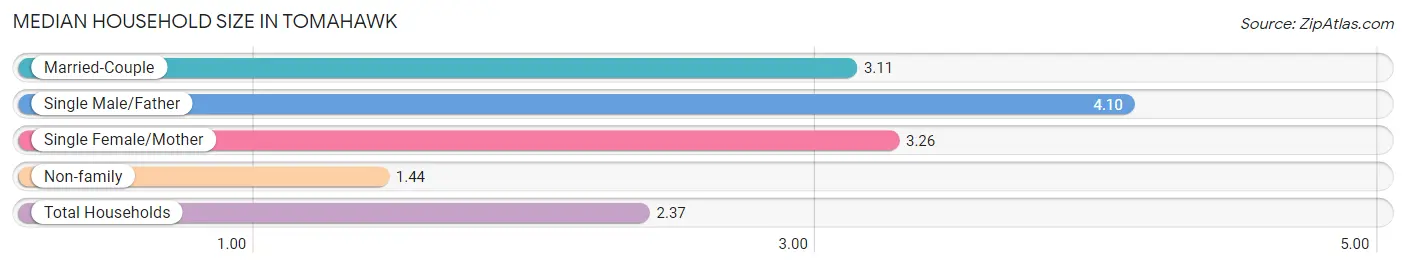
| Household Type | # Households | Household Size |
| Married-Couple | 632 (45.3%) | 3.11 |
| Single Male/Father | 10 (0.7%) | 4.10 |
| Single Female/Mother | 120 (8.6%) | 3.26 |
| Non-family | 632 (45.3%) | 1.44 |
| Total Households | 1,394 (100.0%) | 2.37 |
Household Size by Marriage Status in Tomahawk
Out of a total of 1,394 households in Tomahawk, 762 (54.7%) are family households, while 632 (45.3%) are nonfamily households. The most numerous type of family households are 2-person households, comprising 365, and the most common type of nonfamily households are 1-person households, comprising 529.
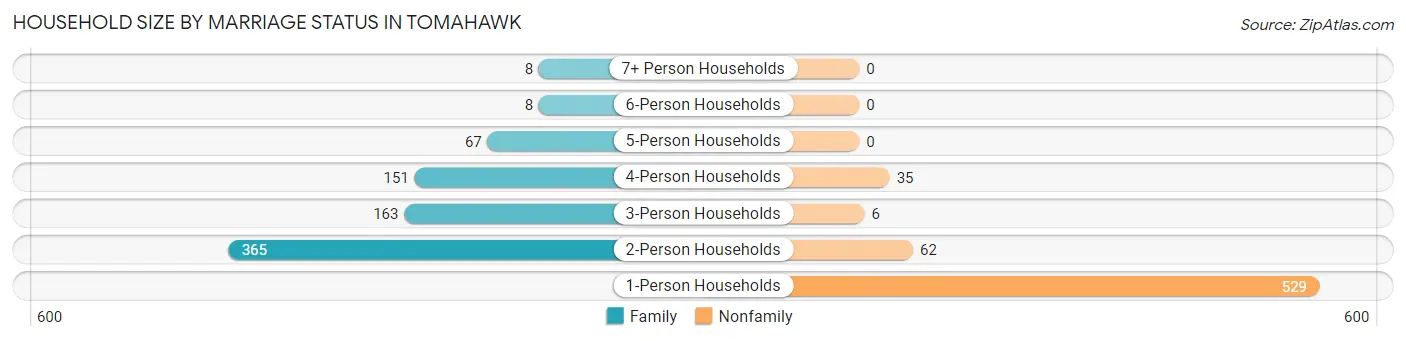
| Household Size | Family Households | Nonfamily Households |
| 1-Person Households | - | 529 (38.0%) |
| 2-Person Households | 365 (26.2%) | 62 (4.4%) |
| 3-Person Households | 163 (11.7%) | 6 (0.4%) |
| 4-Person Households | 151 (10.8%) | 35 (2.5%) |
| 5-Person Households | 67 (4.8%) | 0 (0.0%) |
| 6-Person Households | 8 (0.6%) | 0 (0.0%) |
| 7+ Person Households | 8 (0.6%) | 0 (0.0%) |
| Total | 762 (54.7%) | 632 (45.3%) |
Female Fertility in Tomahawk
Fertility by Age in Tomahawk
Average fertility rate in Tomahawk is 51.0 births per 1,000 women. Women in the age bracket of 20 to 34 years have the highest fertility rate with 137.0 births per 1,000 women. Women in the age bracket of 20 to 34 years acount for 75.6% of all women with births.
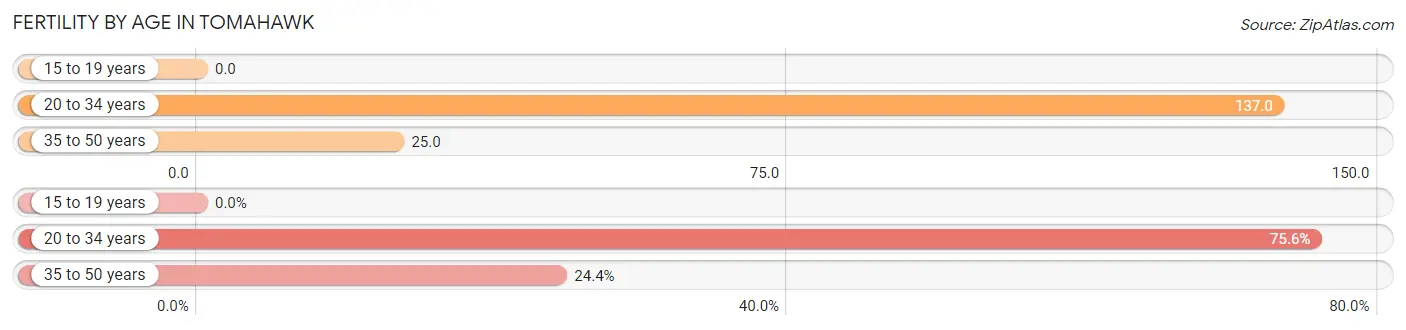
| Age Bracket | Women with Births | Births / 1,000 Women |
| 15 to 19 years | 0 (0.0%) | 0.0 |
| 20 to 34 years | 31 (75.6%) | 137.0 |
| 35 to 50 years | 10 (24.4%) | 25.0 |
| Total | 41 (100.0%) | 51.0 |
Fertility by Age by Marriage Status in Tomahawk
51.2% of women with births (41) in Tomahawk are married. The highest percentage of unmarried women with births falls into 35 to 50 years age bracket with 90.0% of them unmarried at the time of birth, while the lowest percentage of unmarried women with births belong to 20 to 34 years age bracket with 35.5% of them unmarried.
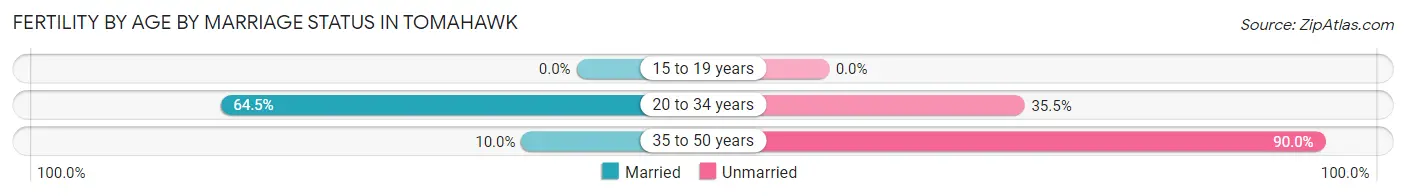
| Age Bracket | Married | Unmarried |
| 15 to 19 years | 0 (0.0%) | 0 (0.0%) |
| 20 to 34 years | 20 (64.5%) | 11 (35.5%) |
| 35 to 50 years | 1 (10.0%) | 9 (90.0%) |
| Total | 21 (51.2%) | 20 (48.8%) |
Fertility by Education in Tomahawk
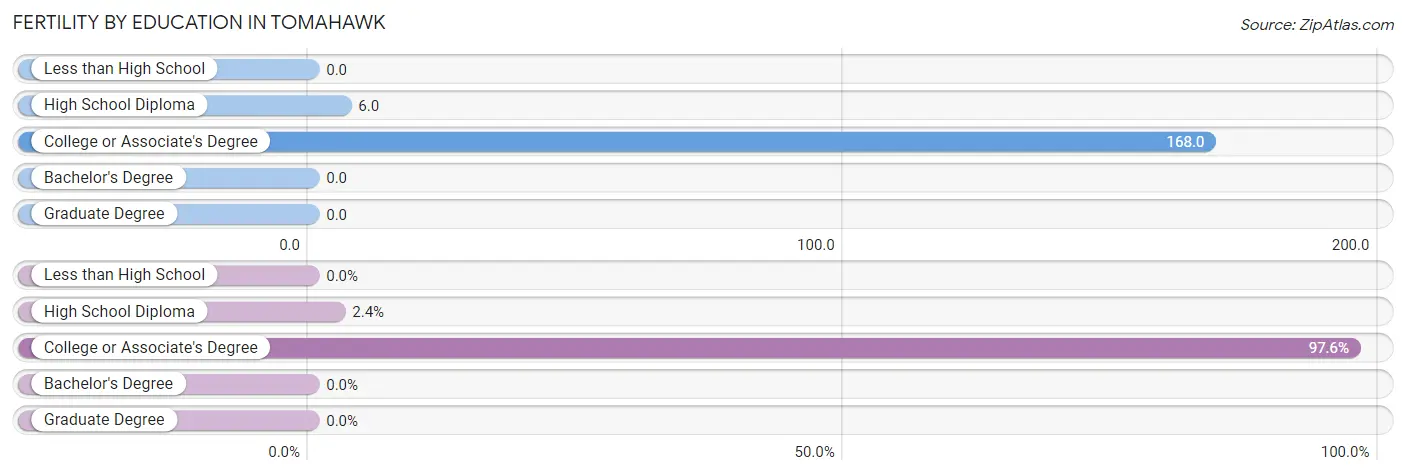
| Educational Attainment | Women with Births | Births / 1,000 Women |
| Less than High School | 0 (0.0%) | 0.0 |
| High School Diploma | 1 (2.4%) | 6.0 |
| College or Associate's Degree | 40 (97.6%) | 168.0 |
| Bachelor's Degree | 0 (0.0%) | 0.0 |
| Graduate Degree | 0 (0.0%) | 0.0 |
| Total | 41 (100.0%) | 51.0 |
Fertility by Education by Marriage Status in Tomahawk
48.8% of women with births in Tomahawk are unmarried. Women with the educational attainment of high school diploma are most likely to be married with 100.0% of them married at childbirth, while women with the educational attainment of college or associate's degree are least likely to be married with 50.0% of them unmarried at childbirth.
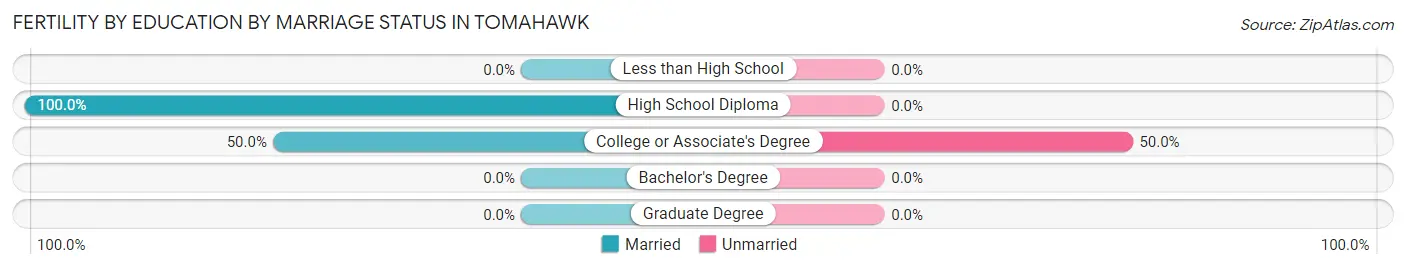
| Educational Attainment | Married | Unmarried |
| Less than High School | 0 (0.0%) | 0 (0.0%) |
| High School Diploma | 1 (100.0%) | 0 (0.0%) |
| College or Associate's Degree | 20 (50.0%) | 20 (50.0%) |
| Bachelor's Degree | 0 (0.0%) | 0 (0.0%) |
| Graduate Degree | 0 (0.0%) | 0 (0.0%) |
| Total | 21 (51.2%) | 20 (48.8%) |
Employment Characteristics in Tomahawk
Employment by Class of Employer in Tomahawk
Among the 1,498 employed individuals in Tomahawk, private company employees (1,098 | 73.3%), local government employees (149 | 10.0%), and not-for-profit organizations (89 | 5.9%) make up the most common classes of employment.
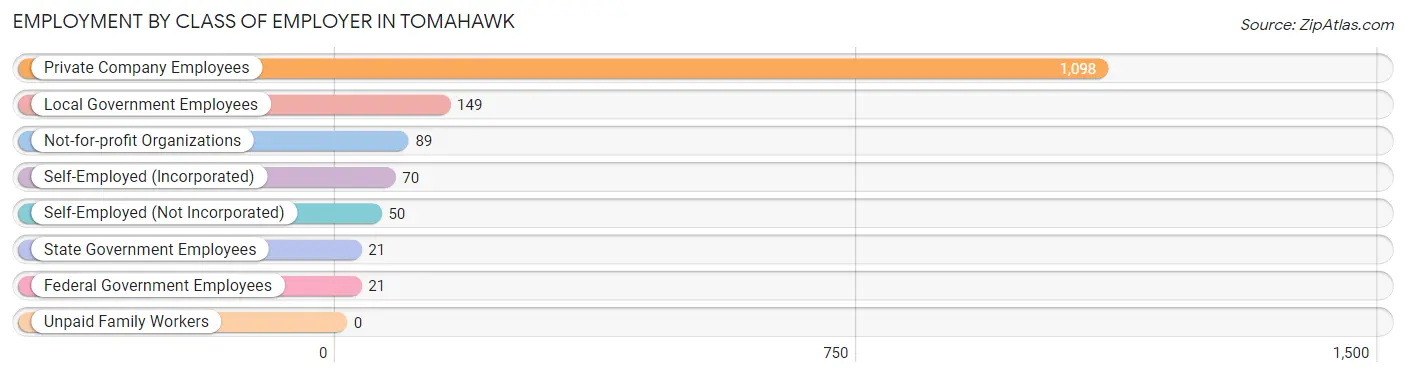
| Employer Class | # Employees | % Employees |
| Private Company Employees | 1,098 | 73.3% |
| Self-Employed (Incorporated) | 70 | 4.7% |
| Self-Employed (Not Incorporated) | 50 | 3.3% |
| Not-for-profit Organizations | 89 | 5.9% |
| Local Government Employees | 149 | 10.0% |
| State Government Employees | 21 | 1.4% |
| Federal Government Employees | 21 | 1.4% |
| Unpaid Family Workers | 0 | 0.0% |
| Total | 1,498 | 100.0% |
Employment Status by Age in Tomahawk
According to the labor force statistics for Tomahawk, out of the total population over 16 years of age (2,802), 59.0% or 1,653 individuals are in the labor force, with 7.5% or 124 of them unemployed. The age group with the highest labor force participation rate is 30 to 34 years, with 100.0% or 198 individuals in the labor force. Within the labor force, the 16 to 19 years age range has the highest percentage of unemployed individuals, with 38.8% or 45 of them being unemployed.
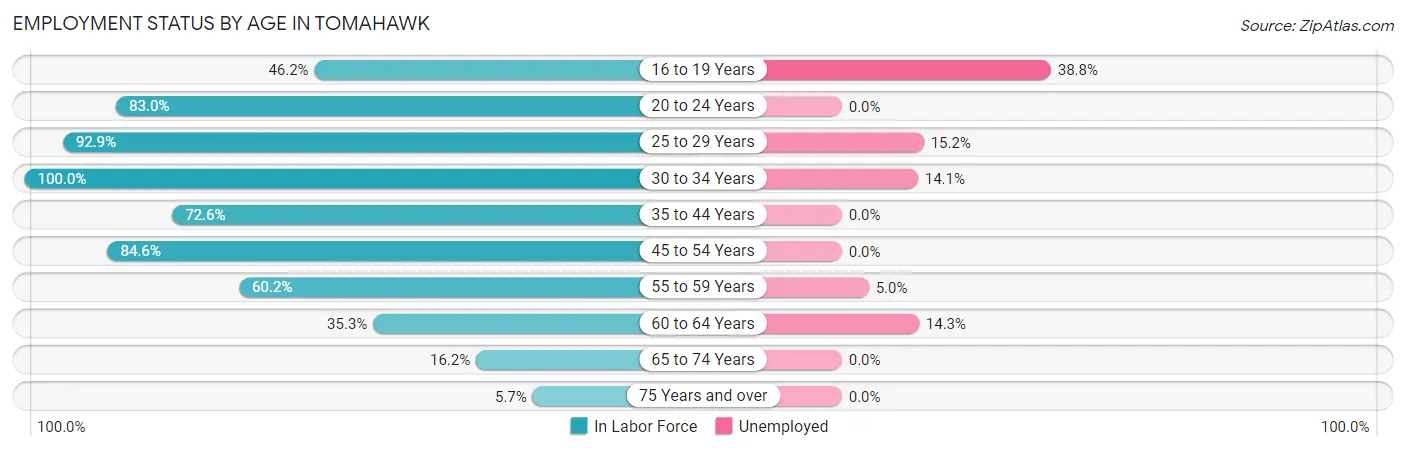
| Age Bracket | In Labor Force | Unemployed |
| 16 to 19 Years | 116 (46.2%) | 45 (38.8%) |
| 20 to 24 Years | 122 (83.0%) | 0 (0.0%) |
| 25 to 29 Years | 197 (92.9%) | 30 (15.2%) |
| 30 to 34 Years | 198 (100.0%) | 28 (14.1%) |
| 35 to 44 Years | 312 (72.6%) | 0 (0.0%) |
| 45 to 54 Years | 362 (84.6%) | 0 (0.0%) |
| 55 to 59 Years | 200 (60.2%) | 10 (5.0%) |
| 60 to 64 Years | 77 (35.3%) | 11 (14.3%) |
| 65 to 74 Years | 55 (16.2%) | 0 (0.0%) |
| 75 Years and over | 14 (5.7%) | 0 (0.0%) |
| Total | 1,653 (59.0%) | 124 (7.5%) |
Employment Status by Educational Attainment in Tomahawk
According to labor force statistics for Tomahawk, 74.0% of individuals (1,345) out of the total population between 25 and 64 years of age (1,818) are in the labor force, with 5.9% or 79 of them being unemployed. The group with the highest labor force participation rate are those with the educational attainment of bachelor's degree or higher, with 89.9% or 346 individuals in the labor force. Within the labor force, individuals with high school diploma education have the highest percentage of unemployment, with 10.4% or 45 of them being unemployed.
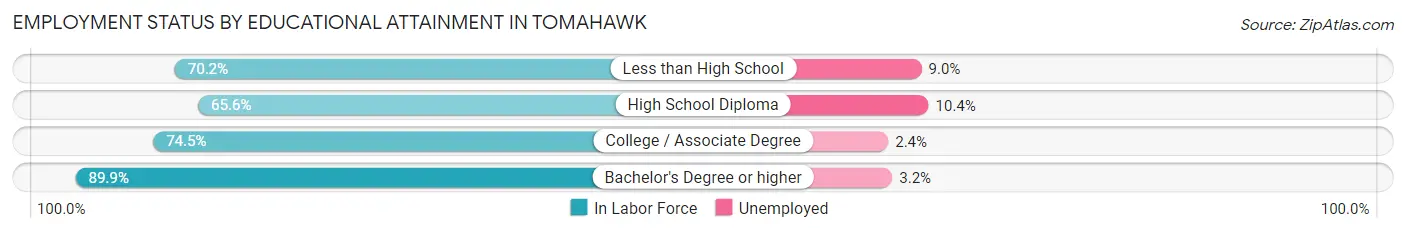
| Educational Attainment | In Labor Force | Unemployed |
| Less than High School | 144 (70.2%) | 18 (9.0%) |
| High School Diploma | 432 (65.6%) | 69 (10.4%) |
| College / Associate Degree | 424 (74.5%) | 14 (2.4%) |
| Bachelor's Degree or higher | 346 (89.9%) | 12 (3.2%) |
| Total | 1,345 (74.0%) | 107 (5.9%) |
Employment Occupations by Sex in Tomahawk
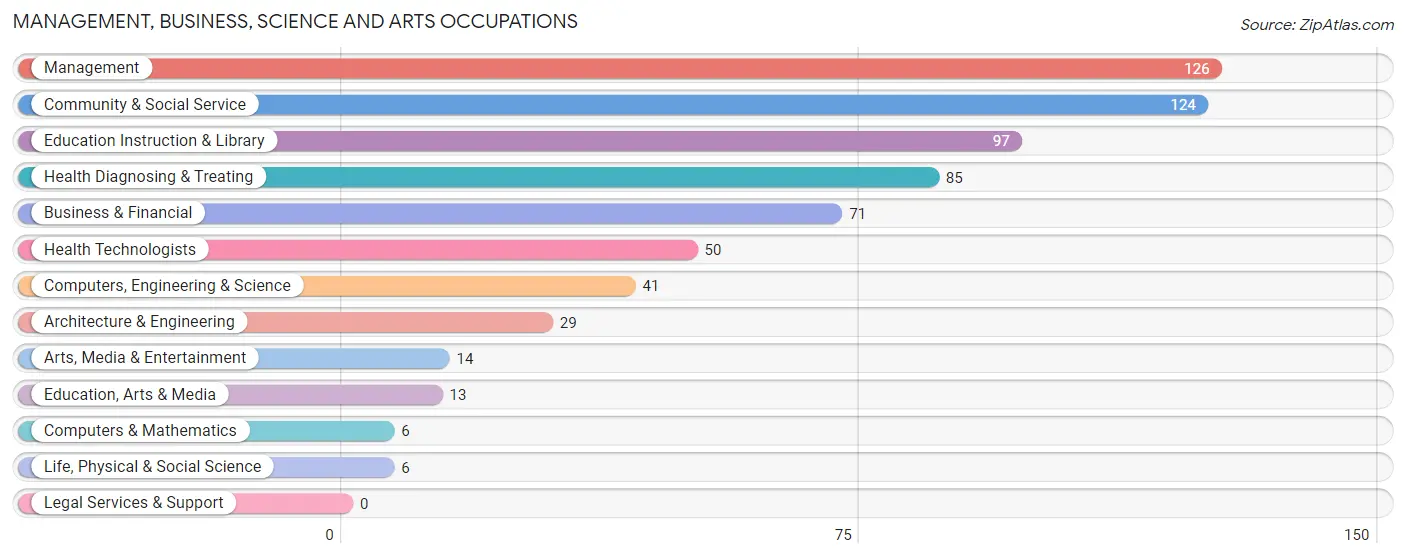
Management, Business, Science and Arts Occupations
The most common Management, Business, Science and Arts occupations in Tomahawk are Management (126 | 8.3%), Community & Social Service (124 | 8.2%), Education Instruction & Library (97 | 6.4%), Health Diagnosing & Treating (85 | 5.6%), and Business & Financial (71 | 4.7%).
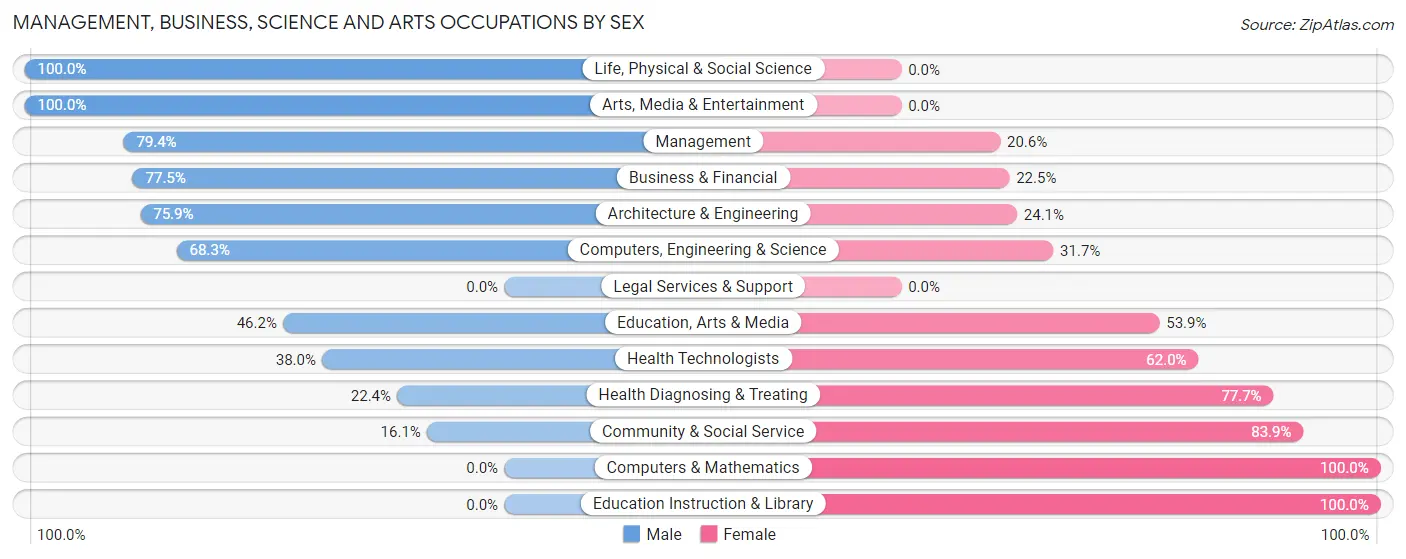
Management, Business, Science and Arts Occupations by Sex
Within the Management, Business, Science and Arts occupations in Tomahawk, the most male-oriented occupations are Life, Physical & Social Science (100.0%), Arts, Media & Entertainment (100.0%), and Management (79.4%), while the most female-oriented occupations are Computers & Mathematics (100.0%), Education Instruction & Library (100.0%), and Community & Social Service (83.9%).
| Occupation | Male | Female |
| Management | 100 (79.4%) | 26 (20.6%) |
| Business & Financial | 55 (77.5%) | 16 (22.5%) |
| Computers, Engineering & Science | 28 (68.3%) | 13 (31.7%) |
| Computers & Mathematics | 0 (0.0%) | 6 (100.0%) |
| Architecture & Engineering | 22 (75.9%) | 7 (24.1%) |
| Life, Physical & Social Science | 6 (100.0%) | 0 (0.0%) |
| Community & Social Service | 20 (16.1%) | 104 (83.9%) |
| Education, Arts & Media | 6 (46.2%) | 7 (53.8%) |
| Legal Services & Support | 0 (0.0%) | 0 (0.0%) |
| Education Instruction & Library | 0 (0.0%) | 97 (100.0%) |
| Arts, Media & Entertainment | 14 (100.0%) | 0 (0.0%) |
| Health Diagnosing & Treating | 19 (22.4%) | 66 (77.6%) |
| Health Technologists | 19 (38.0%) | 31 (62.0%) |
| Total (Category) | 222 (49.7%) | 225 (50.3%) |
| Total (Overall) | 766 (50.4%) | 754 (49.6%) |
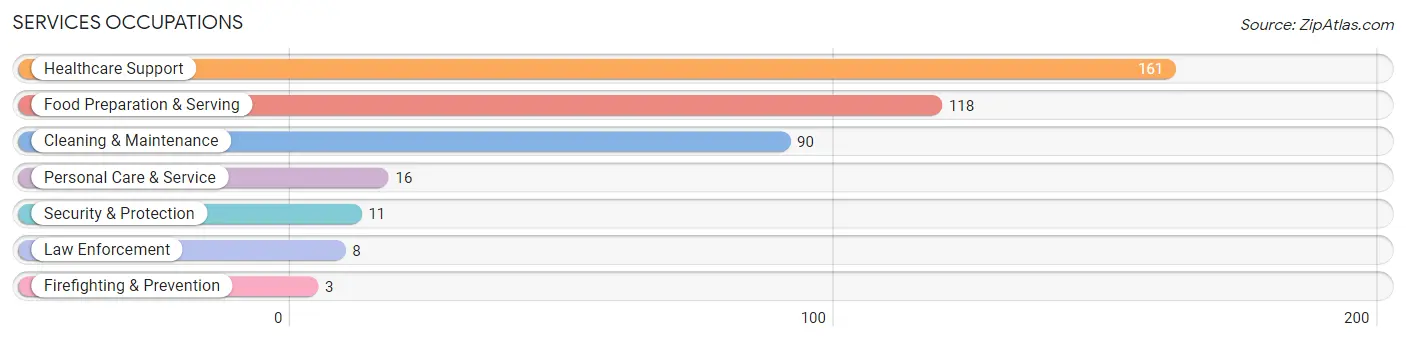
Services Occupations
The most common Services occupations in Tomahawk are Healthcare Support (161 | 10.6%), Food Preparation & Serving (118 | 7.8%), Cleaning & Maintenance (90 | 5.9%), Personal Care & Service (16 | 1.1%), and Security & Protection (11 | 0.7%).
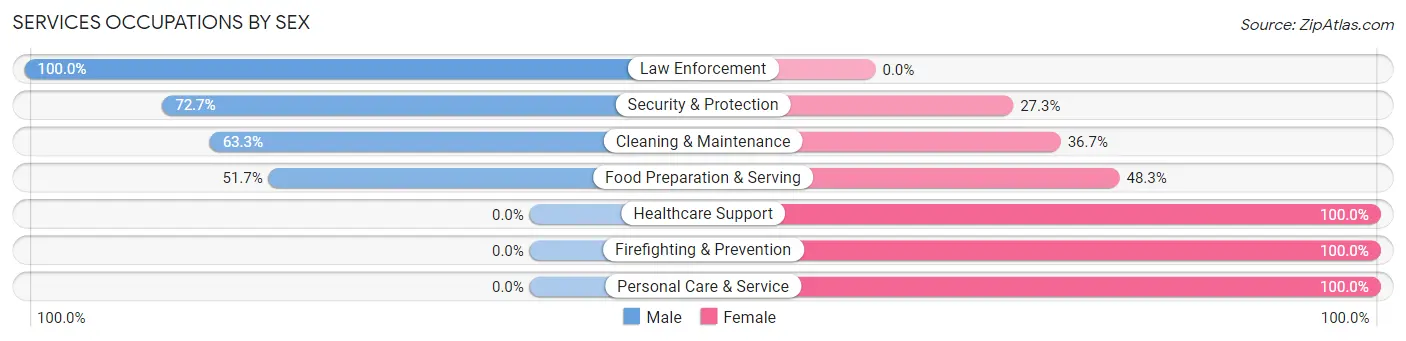
Services Occupations by Sex
Within the Services occupations in Tomahawk, the most male-oriented occupations are Law Enforcement (100.0%), Security & Protection (72.7%), and Cleaning & Maintenance (63.3%), while the most female-oriented occupations are Healthcare Support (100.0%), Firefighting & Prevention (100.0%), and Personal Care & Service (100.0%).
| Occupation | Male | Female |
| Healthcare Support | 0 (0.0%) | 161 (100.0%) |
| Security & Protection | 8 (72.7%) | 3 (27.3%) |
| Firefighting & Prevention | 0 (0.0%) | 3 (100.0%) |
| Law Enforcement | 8 (100.0%) | 0 (0.0%) |
| Food Preparation & Serving | 61 (51.7%) | 57 (48.3%) |
| Cleaning & Maintenance | 57 (63.3%) | 33 (36.7%) |
| Personal Care & Service | 0 (0.0%) | 16 (100.0%) |
| Total (Category) | 126 (31.8%) | 270 (68.2%) |
| Total (Overall) | 766 (50.4%) | 754 (49.6%) |
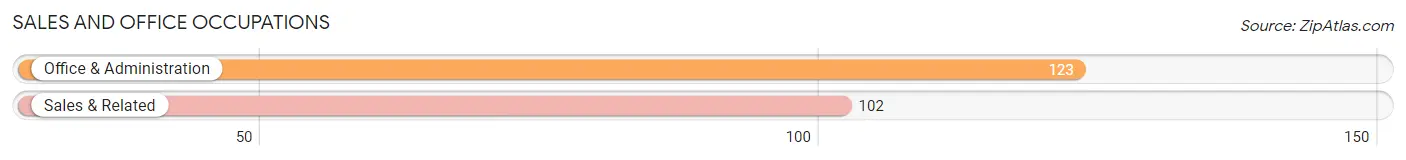
Sales and Office Occupations
The most common Sales and Office occupations in Tomahawk are Office & Administration (123 | 8.1%), and Sales & Related (102 | 6.7%).
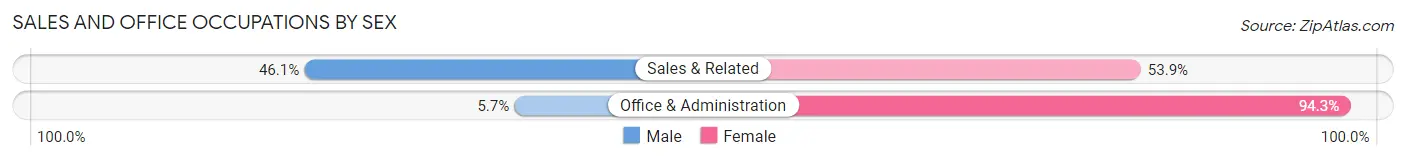
Sales and Office Occupations by Sex
| Occupation | Male | Female |
| Sales & Related | 47 (46.1%) | 55 (53.9%) |
| Office & Administration | 7 (5.7%) | 116 (94.3%) |
| Total (Category) | 54 (24.0%) | 171 (76.0%) |
| Total (Overall) | 766 (50.4%) | 754 (49.6%) |
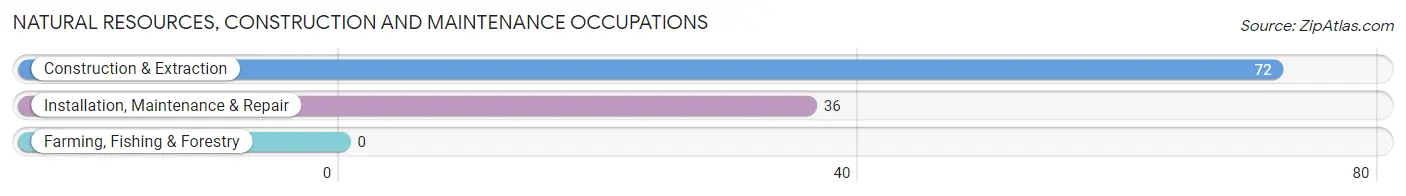
Natural Resources, Construction and Maintenance Occupations
The most common Natural Resources, Construction and Maintenance occupations in Tomahawk are Construction & Extraction (72 | 4.7%), and Installation, Maintenance & Repair (36 | 2.4%).
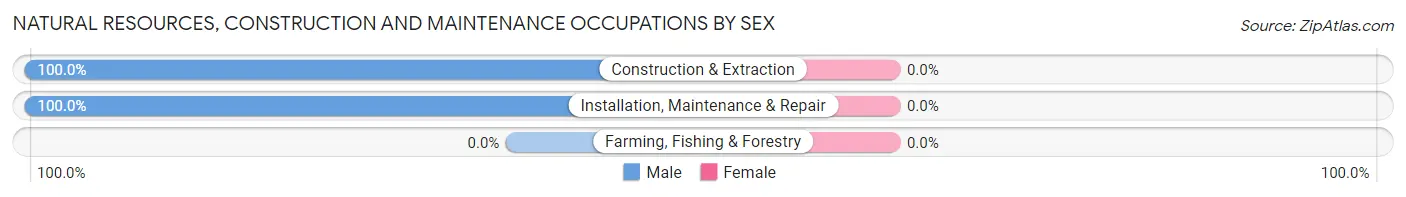
Natural Resources, Construction and Maintenance Occupations by Sex
| Occupation | Male | Female |
| Farming, Fishing & Forestry | 0 (0.0%) | 0 (0.0%) |
| Construction & Extraction | 72 (100.0%) | 0 (0.0%) |
| Installation, Maintenance & Repair | 36 (100.0%) | 0 (0.0%) |
| Total (Category) | 108 (100.0%) | 0 (0.0%) |
| Total (Overall) | 766 (50.4%) | 754 (49.6%) |
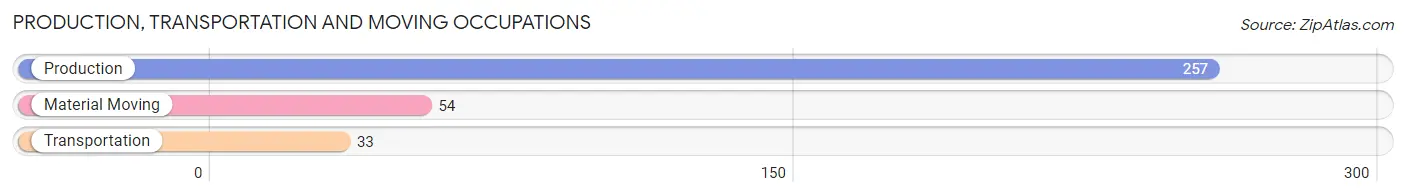
Production, Transportation and Moving Occupations
The most common Production, Transportation and Moving occupations in Tomahawk are Production (257 | 16.9%), Material Moving (54 | 3.5%), and Transportation (33 | 2.2%).
Production, Transportation and Moving Occupations by Sex
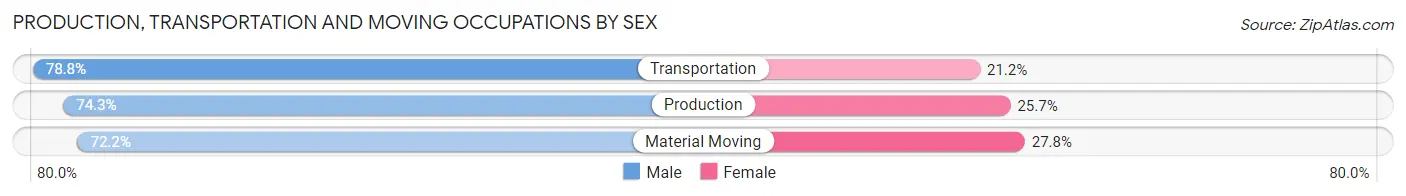
| Occupation | Male | Female |
| Production | 191 (74.3%) | 66 (25.7%) |
| Transportation | 26 (78.8%) | 7 (21.2%) |
| Material Moving | 39 (72.2%) | 15 (27.8%) |
| Total (Category) | 256 (74.4%) | 88 (25.6%) |
| Total (Overall) | 766 (50.4%) | 754 (49.6%) |
Employment Industries by Sex in Tomahawk
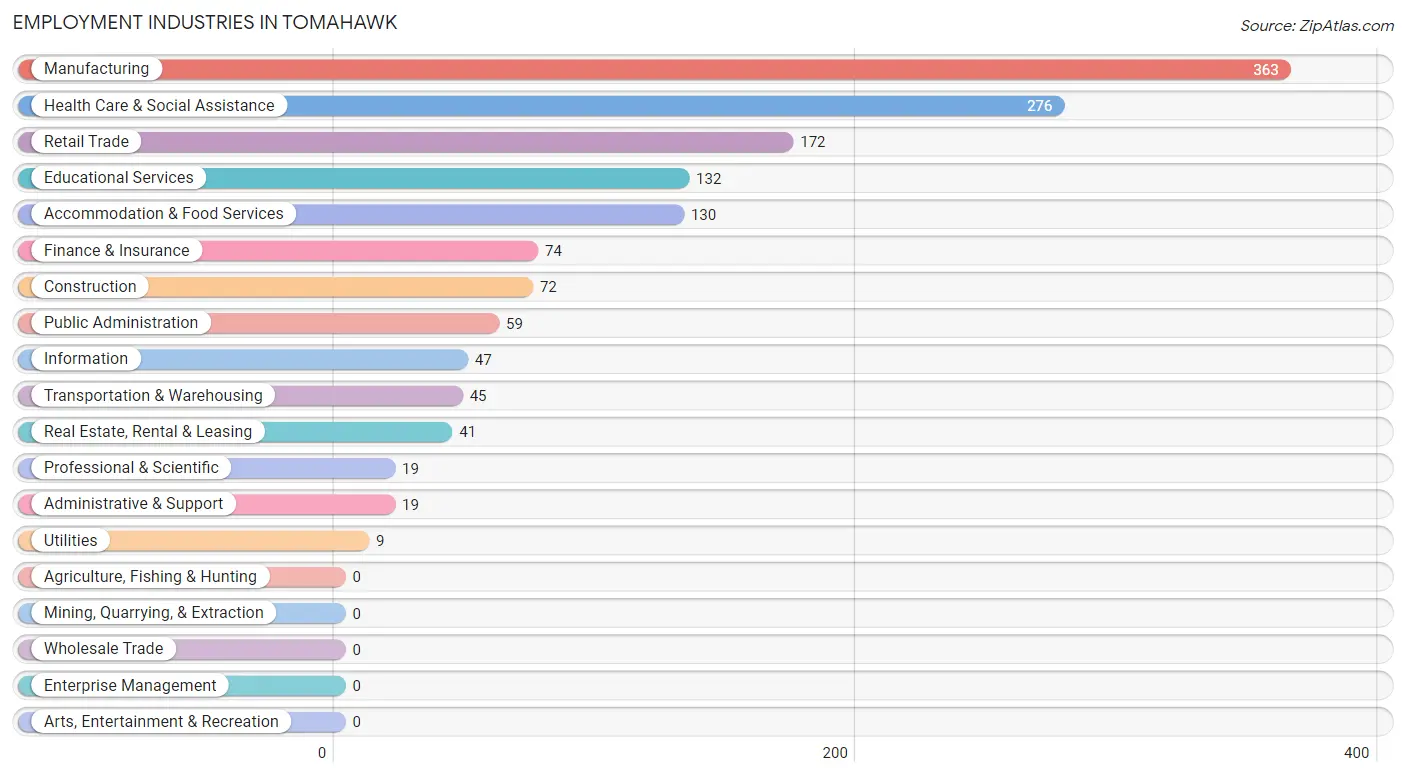
Employment Industries in Tomahawk
The major employment industries in Tomahawk include Manufacturing (363 | 23.9%), Health Care & Social Assistance (276 | 18.2%), Retail Trade (172 | 11.3%), Educational Services (132 | 8.7%), and Accommodation & Food Services (130 | 8.6%).
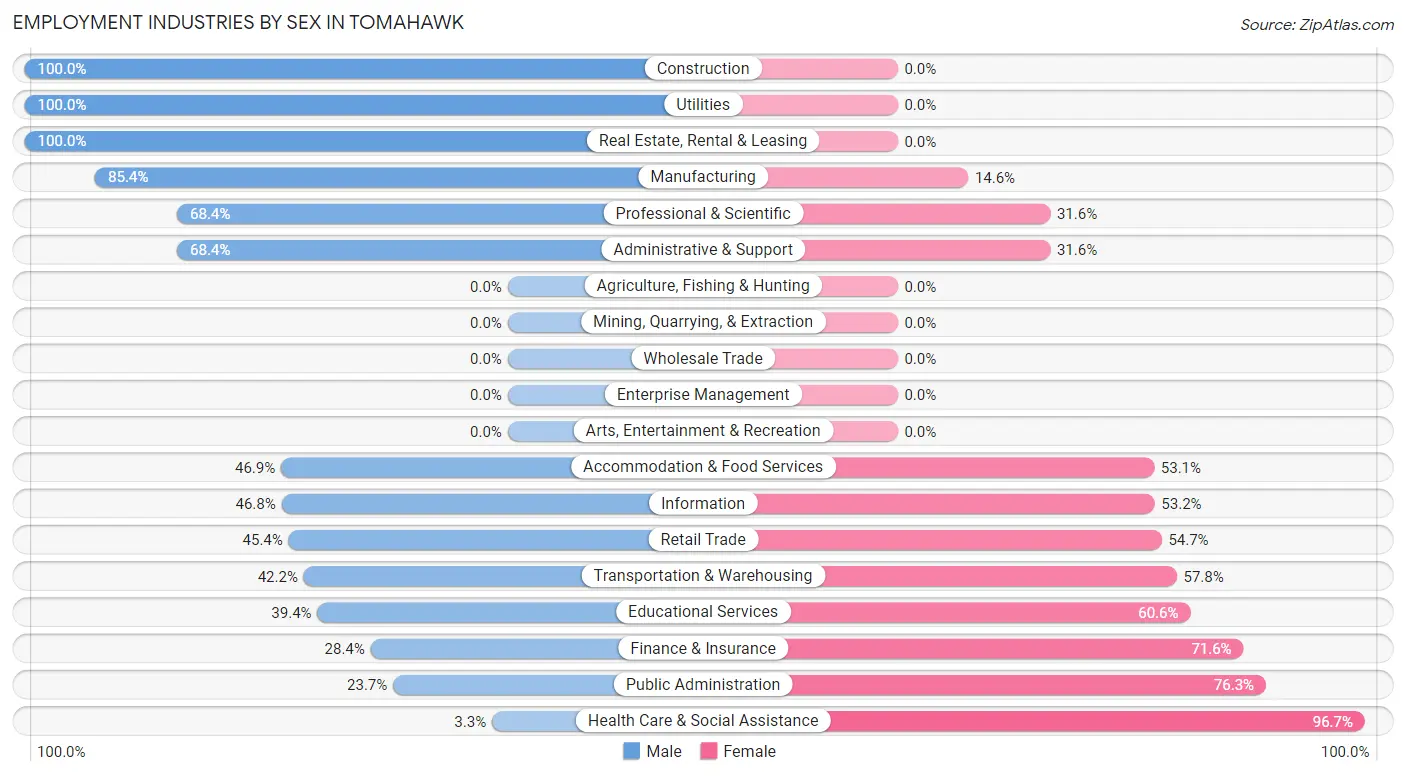
Employment Industries by Sex in Tomahawk
The Tomahawk industries that see more men than women are Construction (100.0%), Utilities (100.0%), and Real Estate, Rental & Leasing (100.0%), whereas the industries that tend to have a higher number of women are Health Care & Social Assistance (96.7%), Public Administration (76.3%), and Finance & Insurance (71.6%).
| Industry | Male | Female |
| Agriculture, Fishing & Hunting | 0 (0.0%) | 0 (0.0%) |
| Mining, Quarrying, & Extraction | 0 (0.0%) | 0 (0.0%) |
| Construction | 72 (100.0%) | 0 (0.0%) |
| Manufacturing | 310 (85.4%) | 53 (14.6%) |
| Wholesale Trade | 0 (0.0%) | 0 (0.0%) |
| Retail Trade | 78 (45.4%) | 94 (54.6%) |
| Transportation & Warehousing | 19 (42.2%) | 26 (57.8%) |
| Utilities | 9 (100.0%) | 0 (0.0%) |
| Information | 22 (46.8%) | 25 (53.2%) |
| Finance & Insurance | 21 (28.4%) | 53 (71.6%) |
| Real Estate, Rental & Leasing | 41 (100.0%) | 0 (0.0%) |
| Professional & Scientific | 13 (68.4%) | 6 (31.6%) |
| Enterprise Management | 0 (0.0%) | 0 (0.0%) |
| Administrative & Support | 13 (68.4%) | 6 (31.6%) |
| Educational Services | 52 (39.4%) | 80 (60.6%) |
| Health Care & Social Assistance | 9 (3.3%) | 267 (96.7%) |
| Arts, Entertainment & Recreation | 0 (0.0%) | 0 (0.0%) |
| Accommodation & Food Services | 61 (46.9%) | 69 (53.1%) |
| Public Administration | 14 (23.7%) | 45 (76.3%) |
| Total | 766 (50.4%) | 754 (49.6%) |
Education in Tomahawk
School Enrollment in Tomahawk
The most common levels of schooling among the 648 students in Tomahawk are high school (249 | 38.4%), middle school (187 | 28.9%), and elementary school (98 | 15.1%).
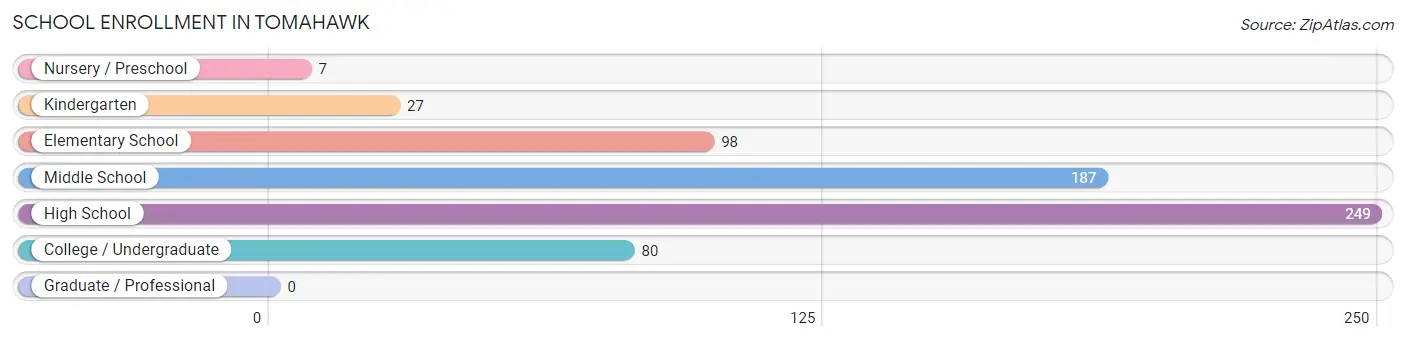
| School Level | # Students | % Students |
| Nursery / Preschool | 7 | 1.1% |
| Kindergarten | 27 | 4.2% |
| Elementary School | 98 | 15.1% |
| Middle School | 187 | 28.9% |
| High School | 249 | 38.4% |
| College / Undergraduate | 80 | 12.3% |
| Graduate / Professional | 0 | 0.0% |
| Total | 648 | 100.0% |
School Enrollment by Age by Funding Source in Tomahawk
Out of a total of 648 students who are enrolled in schools in Tomahawk, 23 (3.5%) attend a private institution, while the remaining 625 (96.5%) are enrolled in public schools. The age group of 5 to 9 year old has the highest likelihood of being enrolled in private schools, with 14 (10.6% in the age bracket) enrolled. Conversely, the age group of 15 to 17 year olds has the lowest likelihood of being enrolled in a private school, with 160 (100.0% in the age bracket) attending a public institution.
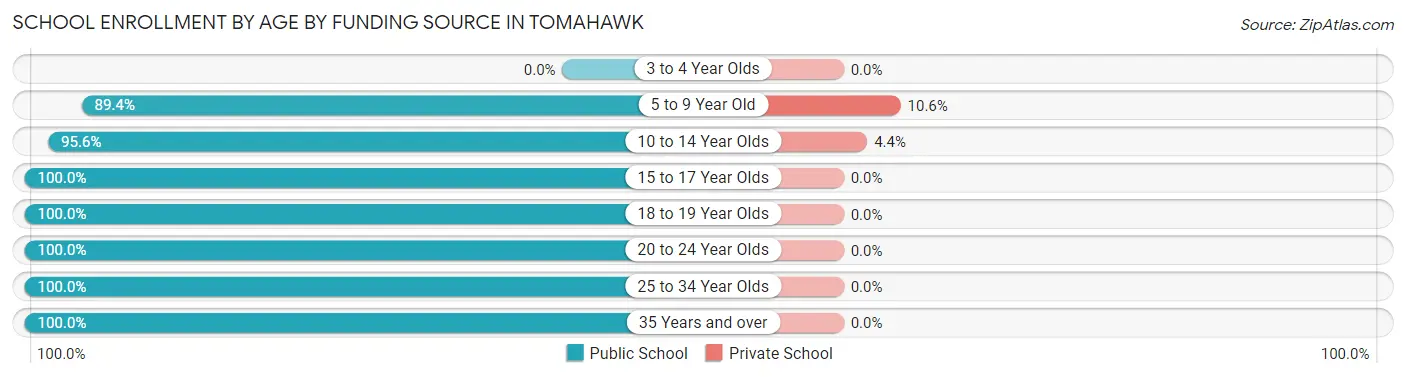
| Age Bracket | Public School | Private School |
| 3 to 4 Year Olds | 0 (0.0%) | 0 (0.0%) |
| 5 to 9 Year Old | 118 (89.4%) | 14 (10.6%) |
| 10 to 14 Year Olds | 196 (95.6%) | 9 (4.4%) |
| 15 to 17 Year Olds | 160 (100.0%) | 0 (0.0%) |
| 18 to 19 Year Olds | 86 (100.0%) | 0 (0.0%) |
| 20 to 24 Year Olds | 30 (100.0%) | 0 (0.0%) |
| 25 to 34 Year Olds | 22 (100.0%) | 0 (0.0%) |
| 35 Years and over | 13 (100.0%) | 0 (0.0%) |
| Total | 625 (96.5%) | 23 (3.5%) |
Educational Attainment by Field of Study in Tomahawk
Education (96 | 18.9%), business (85 | 16.7%), science & technology (61 | 12.0%), bio, nature & agricultural (55 | 10.8%), and arts & humanities (48 | 9.5%) are the most common fields of study among 508 individuals in Tomahawk who have obtained a bachelor's degree or higher.
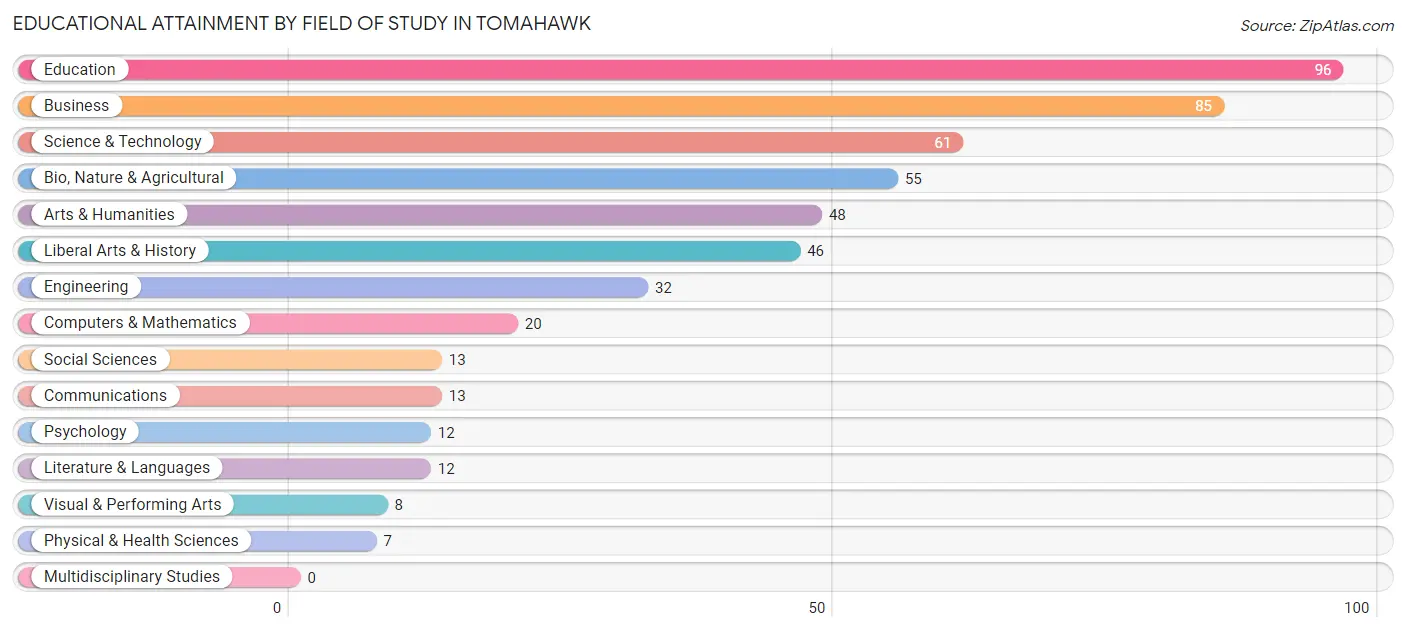
| Field of Study | # Graduates | % Graduates |
| Computers & Mathematics | 20 | 3.9% |
| Bio, Nature & Agricultural | 55 | 10.8% |
| Physical & Health Sciences | 7 | 1.4% |
| Psychology | 12 | 2.4% |
| Social Sciences | 13 | 2.6% |
| Engineering | 32 | 6.3% |
| Multidisciplinary Studies | 0 | 0.0% |
| Science & Technology | 61 | 12.0% |
| Business | 85 | 16.7% |
| Education | 96 | 18.9% |
| Literature & Languages | 12 | 2.4% |
| Liberal Arts & History | 46 | 9.1% |
| Visual & Performing Arts | 8 | 1.6% |
| Communications | 13 | 2.6% |
| Arts & Humanities | 48 | 9.5% |
| Total | 508 | 100.0% |
Transportation & Commute in Tomahawk
Vehicle Availability by Sex in Tomahawk
The most prevalent vehicle ownership categories in Tomahawk are males with 2 vehicles (397, accounting for 54.0%) and females with 2 vehicles (432, making up 52.0%).
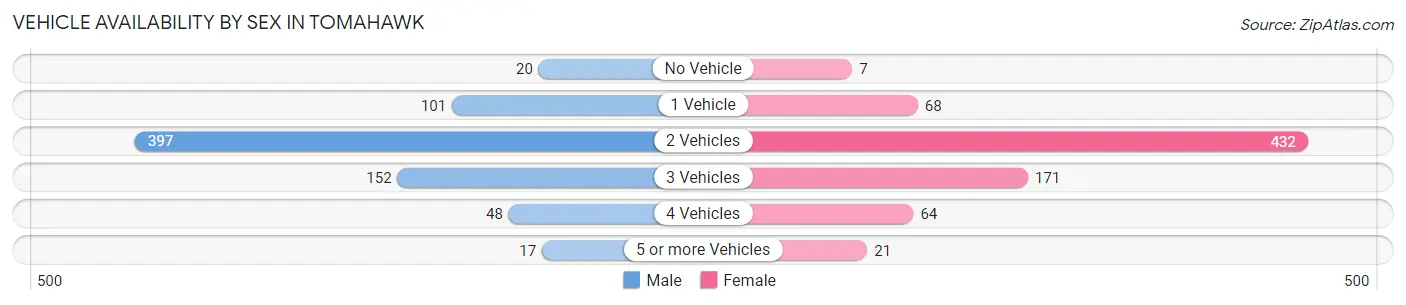
| Vehicles Available | Male | Female |
| No Vehicle | 20 (2.7%) | 7 (0.9%) |
| 1 Vehicle | 101 (13.7%) | 68 (8.9%) |
| 2 Vehicles | 397 (54.0%) | 432 (56.6%) |
| 3 Vehicles | 152 (20.7%) | 171 (22.4%) |
| 4 Vehicles | 48 (6.5%) | 64 (8.4%) |
| 5 or more Vehicles | 17 (2.3%) | 21 (2.8%) |
| Total | 735 (100.0%) | 763 (100.0%) |
Commute Time in Tomahawk
The most frequently occuring commute durations in Tomahawk are 5 to 9 minutes (561 commuters, 38.6%), 30 to 34 minutes (241 commuters, 16.6%), and less than 5 minutes (201 commuters, 13.8%).
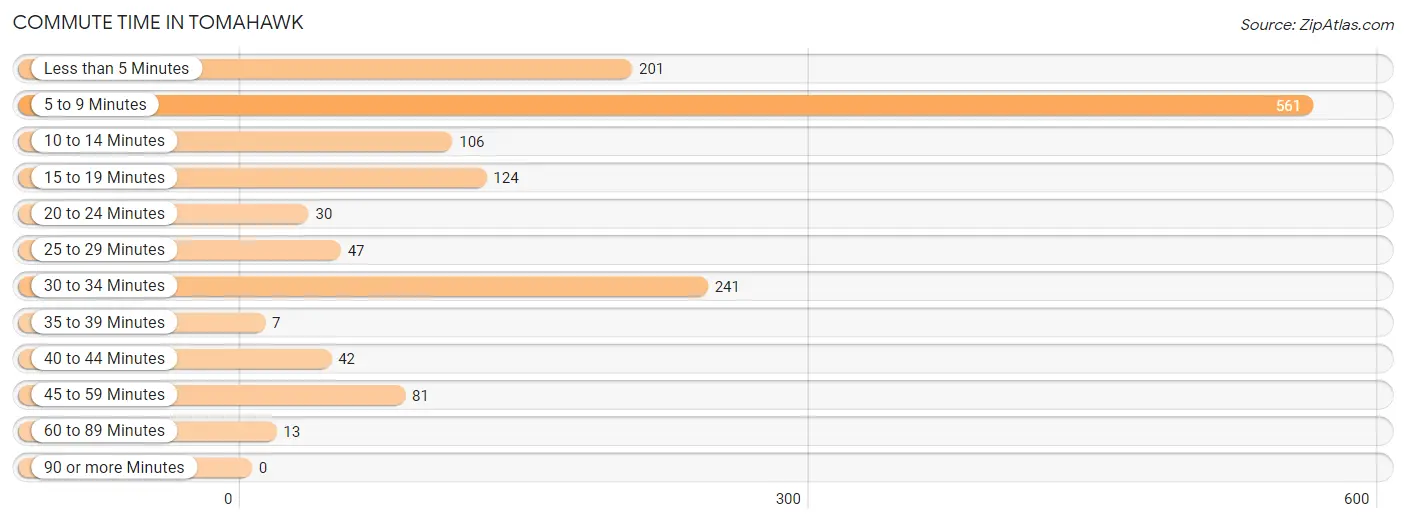
| Commute Time | # Commuters | % Commuters |
| Less than 5 Minutes | 201 | 13.8% |
| 5 to 9 Minutes | 561 | 38.6% |
| 10 to 14 Minutes | 106 | 7.3% |
| 15 to 19 Minutes | 124 | 8.5% |
| 20 to 24 Minutes | 30 | 2.1% |
| 25 to 29 Minutes | 47 | 3.2% |
| 30 to 34 Minutes | 241 | 16.6% |
| 35 to 39 Minutes | 7 | 0.5% |
| 40 to 44 Minutes | 42 | 2.9% |
| 45 to 59 Minutes | 81 | 5.6% |
| 60 to 89 Minutes | 13 | 0.9% |
| 90 or more Minutes | 0 | 0.0% |
Commute Time by Sex in Tomahawk
The most common commute times in Tomahawk are 5 to 9 minutes (288 commuters, 40.3%) for males and 5 to 9 minutes (273 commuters, 37.0%) for females.
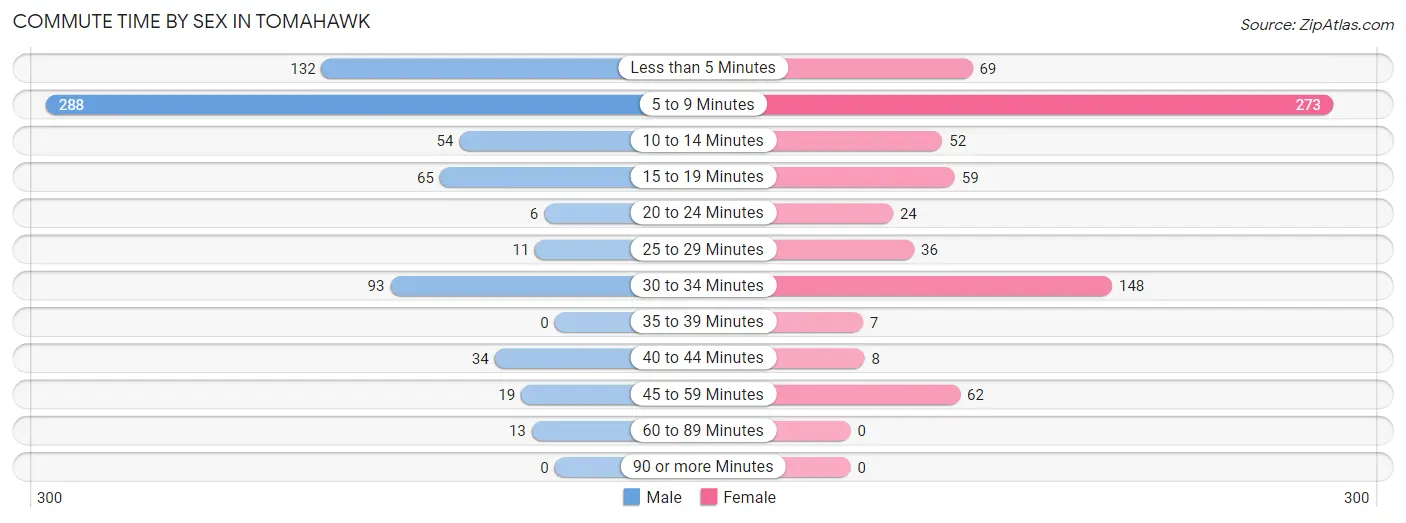
| Commute Time | Male | Female |
| Less than 5 Minutes | 132 (18.5%) | 69 (9.3%) |
| 5 to 9 Minutes | 288 (40.3%) | 273 (37.0%) |
| 10 to 14 Minutes | 54 (7.5%) | 52 (7.0%) |
| 15 to 19 Minutes | 65 (9.1%) | 59 (8.0%) |
| 20 to 24 Minutes | 6 (0.8%) | 24 (3.3%) |
| 25 to 29 Minutes | 11 (1.5%) | 36 (4.9%) |
| 30 to 34 Minutes | 93 (13.0%) | 148 (20.1%) |
| 35 to 39 Minutes | 0 (0.0%) | 7 (0.9%) |
| 40 to 44 Minutes | 34 (4.8%) | 8 (1.1%) |
| 45 to 59 Minutes | 19 (2.7%) | 62 (8.4%) |
| 60 to 89 Minutes | 13 (1.8%) | 0 (0.0%) |
| 90 or more Minutes | 0 (0.0%) | 0 (0.0%) |
Time of Departure to Work by Sex in Tomahawk
The most frequent times of departure to work in Tomahawk are 12:00 AM to 4:59 AM (122, 17.1%) for males and 4:00 PM to 11:59 PM (154, 20.9%) for females.
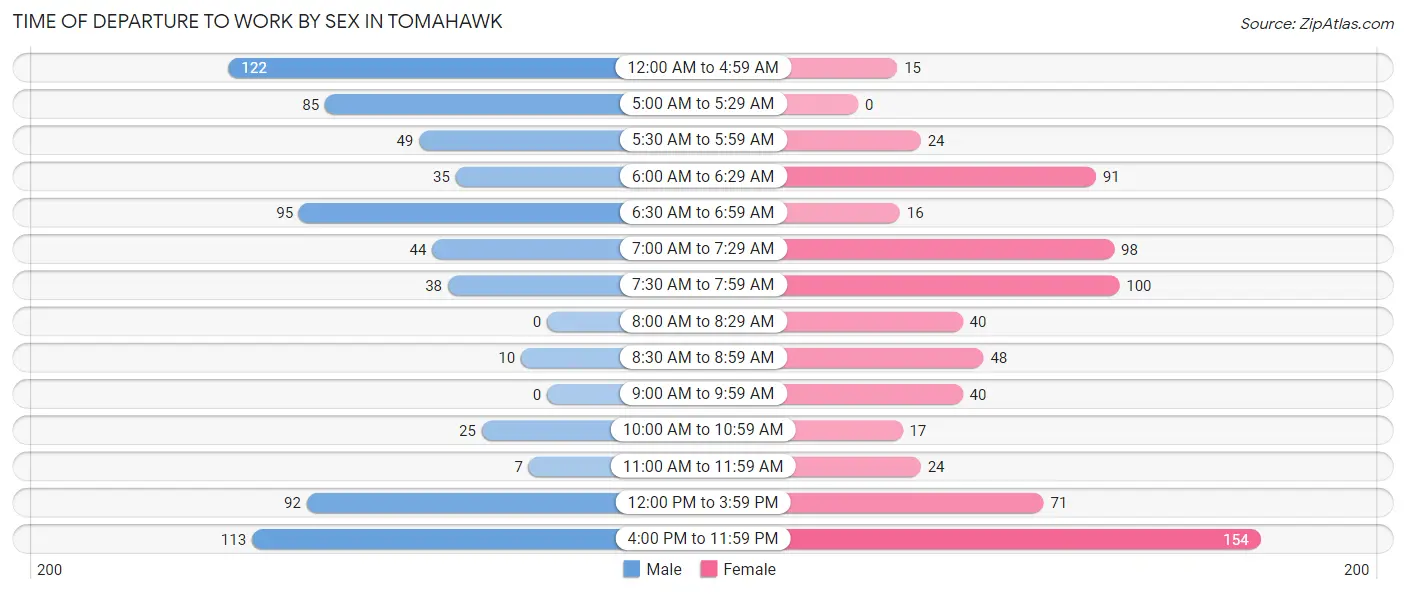
| Time of Departure | Male | Female |
| 12:00 AM to 4:59 AM | 122 (17.1%) | 15 (2.0%) |
| 5:00 AM to 5:29 AM | 85 (11.9%) | 0 (0.0%) |
| 5:30 AM to 5:59 AM | 49 (6.9%) | 24 (3.3%) |
| 6:00 AM to 6:29 AM | 35 (4.9%) | 91 (12.3%) |
| 6:30 AM to 6:59 AM | 95 (13.3%) | 16 (2.2%) |
| 7:00 AM to 7:29 AM | 44 (6.1%) | 98 (13.3%) |
| 7:30 AM to 7:59 AM | 38 (5.3%) | 100 (13.6%) |
| 8:00 AM to 8:29 AM | 0 (0.0%) | 40 (5.4%) |
| 8:30 AM to 8:59 AM | 10 (1.4%) | 48 (6.5%) |
| 9:00 AM to 9:59 AM | 0 (0.0%) | 40 (5.4%) |
| 10:00 AM to 10:59 AM | 25 (3.5%) | 17 (2.3%) |
| 11:00 AM to 11:59 AM | 7 (1.0%) | 24 (3.3%) |
| 12:00 PM to 3:59 PM | 92 (12.9%) | 71 (9.6%) |
| 4:00 PM to 11:59 PM | 113 (15.8%) | 154 (20.9%) |
| Total | 715 (100.0%) | 738 (100.0%) |
Housing Occupancy in Tomahawk
Occupancy by Ownership in Tomahawk
Of the total 1,394 dwellings in Tomahawk, owner-occupied units account for 921 (66.1%), while renter-occupied units make up 473 (33.9%).
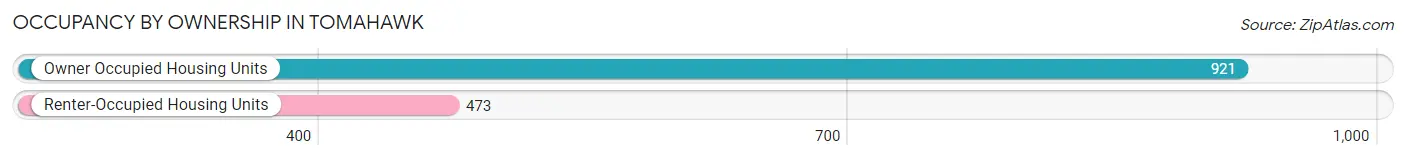
| Occupancy | # Housing Units | % Housing Units |
| Owner Occupied Housing Units | 921 | 66.1% |
| Renter-Occupied Housing Units | 473 | 33.9% |
| Total Occupied Housing Units | 1,394 | 100.0% |
Occupancy by Household Size in Tomahawk
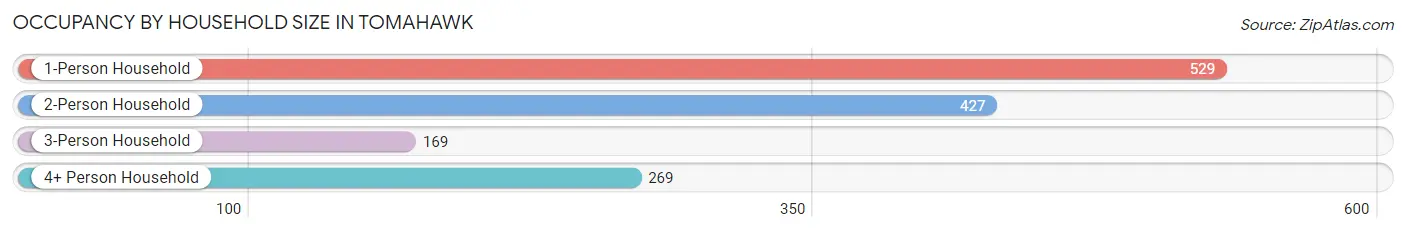
| Household Size | # Housing Units | % Housing Units |
| 1-Person Household | 529 | 38.0% |
| 2-Person Household | 427 | 30.6% |
| 3-Person Household | 169 | 12.1% |
| 4+ Person Household | 269 | 19.3% |
| Total Housing Units | 1,394 | 100.0% |
Occupancy by Ownership by Household Size in Tomahawk
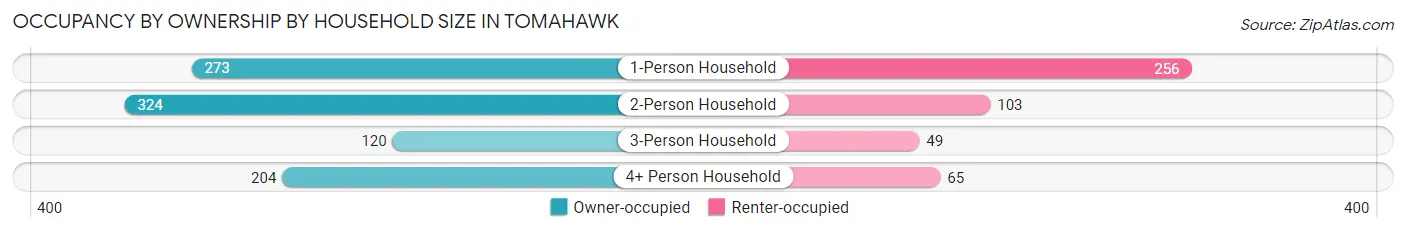
| Household Size | Owner-occupied | Renter-occupied |
| 1-Person Household | 273 (51.6%) | 256 (48.4%) |
| 2-Person Household | 324 (75.9%) | 103 (24.1%) |
| 3-Person Household | 120 (71.0%) | 49 (29.0%) |
| 4+ Person Household | 204 (75.8%) | 65 (24.2%) |
| Total Housing Units | 921 (66.1%) | 473 (33.9%) |
Occupancy by Educational Attainment in Tomahawk
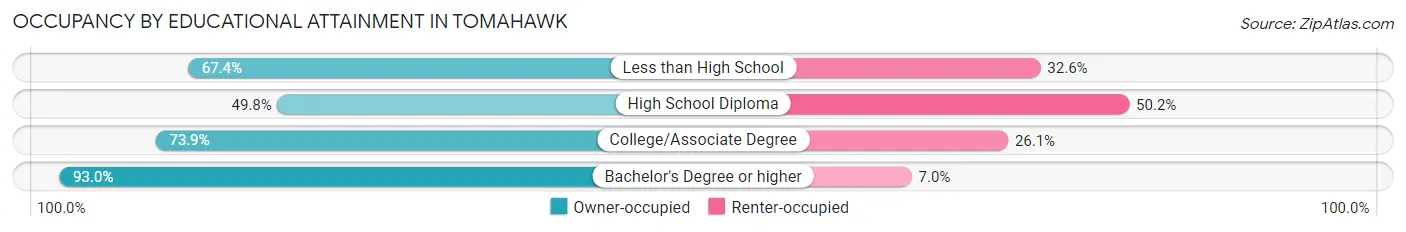
| Household Size | Owner-occupied | Renter-occupied |
| Less than High School | 58 (67.4%) | 28 (32.6%) |
| High School Diploma | 310 (49.8%) | 312 (50.2%) |
| College/Associate Degree | 328 (73.9%) | 116 (26.1%) |
| Bachelor's Degree or higher | 225 (93.0%) | 17 (7.0%) |
Occupancy by Age of Householder in Tomahawk
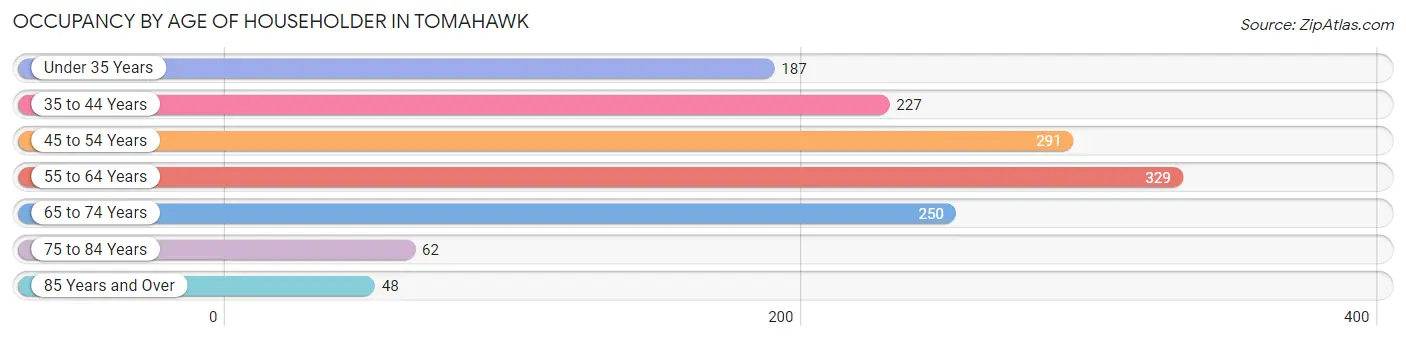
| Age Bracket | # Households | % Households |
| Under 35 Years | 187 | 13.4% |
| 35 to 44 Years | 227 | 16.3% |
| 45 to 54 Years | 291 | 20.9% |
| 55 to 64 Years | 329 | 23.6% |
| 65 to 74 Years | 250 | 17.9% |
| 75 to 84 Years | 62 | 4.4% |
| 85 Years and Over | 48 | 3.4% |
| Total | 1,394 | 100.0% |
Housing Finances in Tomahawk
Median Income by Occupancy in Tomahawk
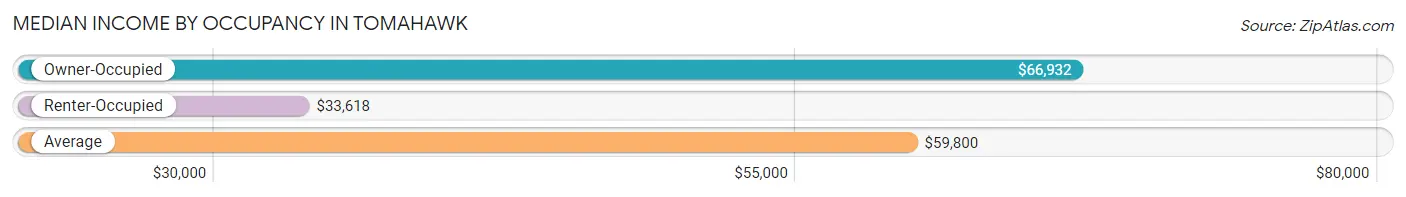
| Occupancy Type | # Households | Median Income |
| Owner-Occupied | 921 (66.1%) | $66,932 |
| Renter-Occupied | 473 (33.9%) | $33,618 |
| Average | 1,394 (100.0%) | $59,800 |
Occupancy by Householder Income Bracket in Tomahawk
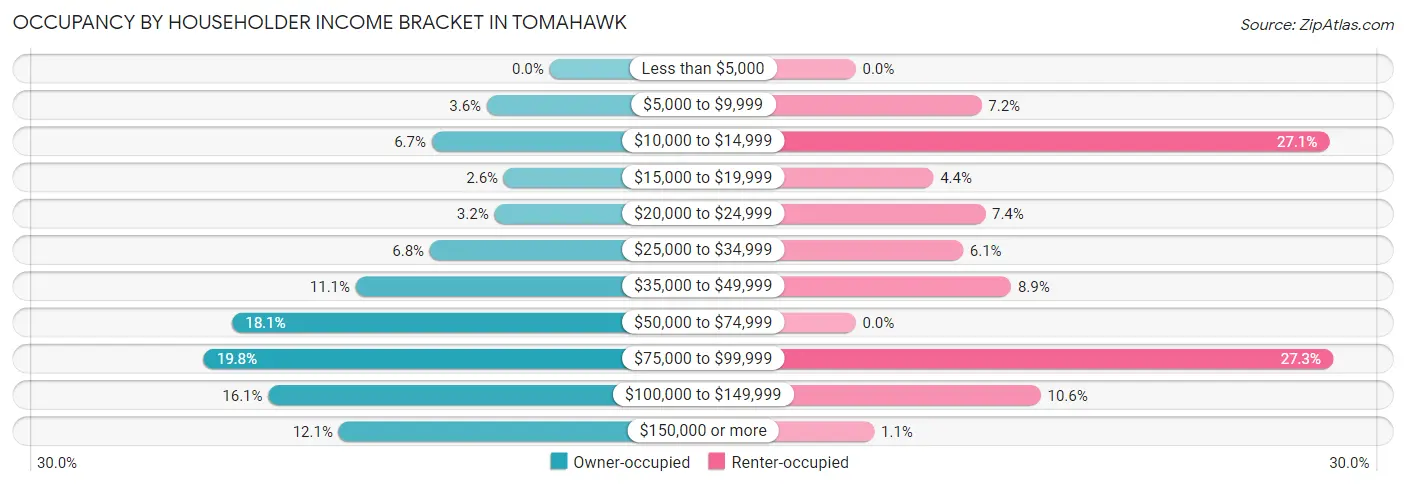
| Income Bracket | Owner-occupied | Renter-occupied |
| Less than $5,000 | 0 (0.0%) | 0 (0.0%) |
| $5,000 to $9,999 | 33 (3.6%) | 34 (7.2%) |
| $10,000 to $14,999 | 62 (6.7%) | 128 (27.1%) |
| $15,000 to $19,999 | 24 (2.6%) | 21 (4.4%) |
| $20,000 to $24,999 | 29 (3.2%) | 35 (7.4%) |
| $25,000 to $34,999 | 63 (6.8%) | 29 (6.1%) |
| $35,000 to $49,999 | 102 (11.1%) | 42 (8.9%) |
| $50,000 to $74,999 | 167 (18.1%) | 0 (0.0%) |
| $75,000 to $99,999 | 182 (19.8%) | 129 (27.3%) |
| $100,000 to $149,999 | 148 (16.1%) | 50 (10.6%) |
| $150,000 or more | 111 (12.0%) | 5 (1.1%) |
| Total | 921 (100.0%) | 473 (100.0%) |
Monthly Housing Cost Tiers in Tomahawk
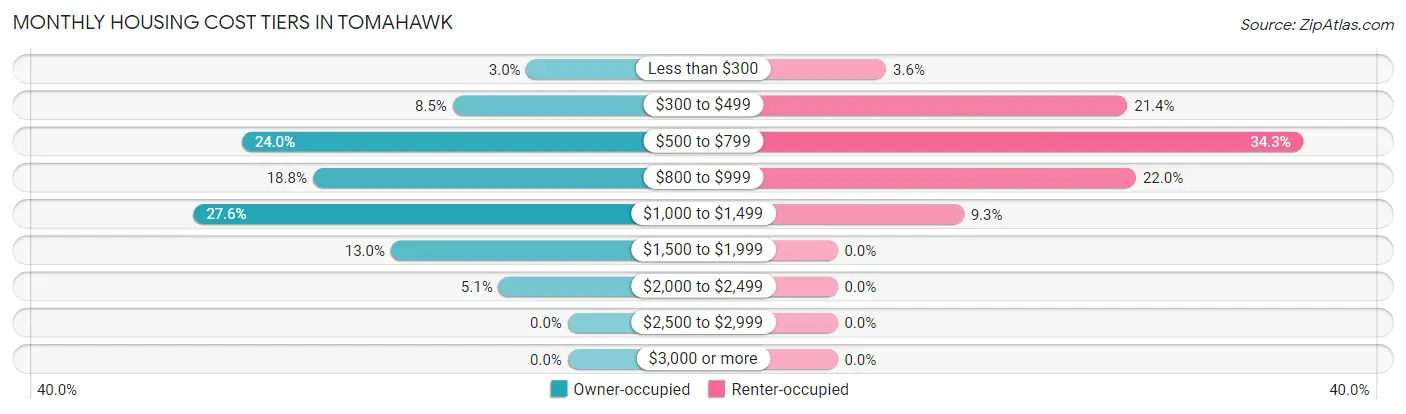
| Monthly Cost | Owner-occupied | Renter-occupied |
| Less than $300 | 28 (3.0%) | 17 (3.6%) |
| $300 to $499 | 78 (8.5%) | 101 (21.3%) |
| $500 to $799 | 221 (24.0%) | 162 (34.3%) |
| $800 to $999 | 173 (18.8%) | 104 (22.0%) |
| $1,000 to $1,499 | 254 (27.6%) | 44 (9.3%) |
| $1,500 to $1,999 | 120 (13.0%) | 0 (0.0%) |
| $2,000 to $2,499 | 47 (5.1%) | 0 (0.0%) |
| $2,500 to $2,999 | 0 (0.0%) | 0 (0.0%) |
| $3,000 or more | 0 (0.0%) | 0 (0.0%) |
| Total | 921 (100.0%) | 473 (100.0%) |
Physical Housing Characteristics in Tomahawk
Housing Structures in Tomahawk
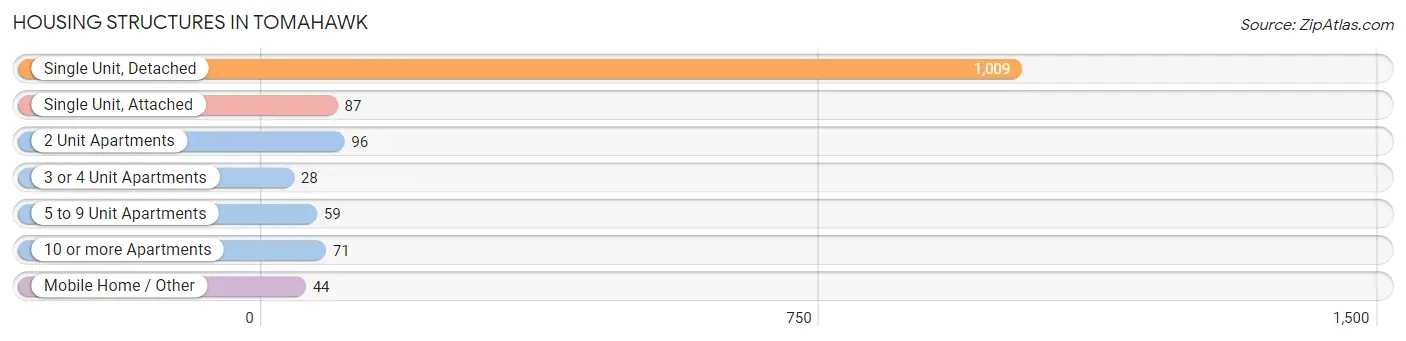
| Structure Type | # Housing Units | % Housing Units |
| Single Unit, Detached | 1,009 | 72.4% |
| Single Unit, Attached | 87 | 6.2% |
| 2 Unit Apartments | 96 | 6.9% |
| 3 or 4 Unit Apartments | 28 | 2.0% |
| 5 to 9 Unit Apartments | 59 | 4.2% |
| 10 or more Apartments | 71 | 5.1% |
| Mobile Home / Other | 44 | 3.2% |
| Total | 1,394 | 100.0% |
Housing Structures by Occupancy in Tomahawk
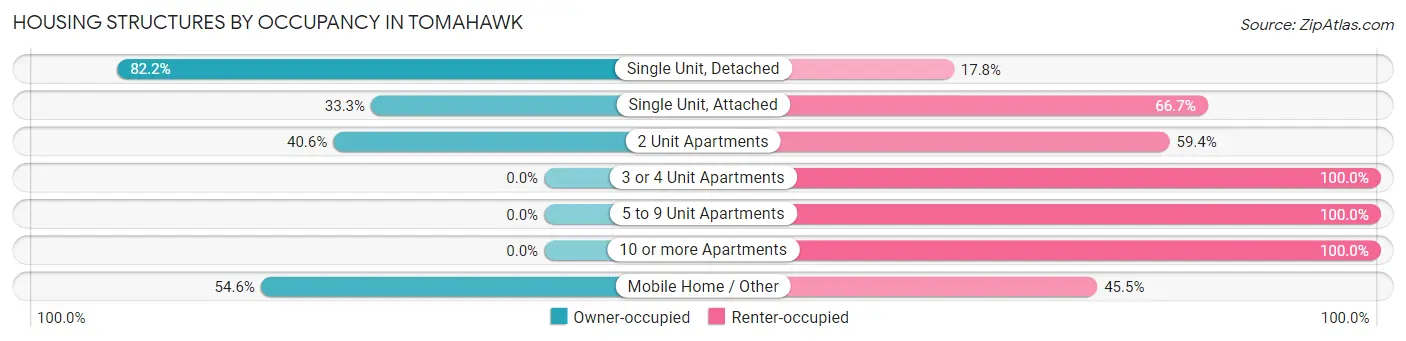
| Structure Type | Owner-occupied | Renter-occupied |
| Single Unit, Detached | 829 (82.2%) | 180 (17.8%) |
| Single Unit, Attached | 29 (33.3%) | 58 (66.7%) |
| 2 Unit Apartments | 39 (40.6%) | 57 (59.4%) |
| 3 or 4 Unit Apartments | 0 (0.0%) | 28 (100.0%) |
| 5 to 9 Unit Apartments | 0 (0.0%) | 59 (100.0%) |
| 10 or more Apartments | 0 (0.0%) | 71 (100.0%) |
| Mobile Home / Other | 24 (54.5%) | 20 (45.5%) |
| Total | 921 (66.1%) | 473 (33.9%) |
Housing Structures by Number of Rooms in Tomahawk
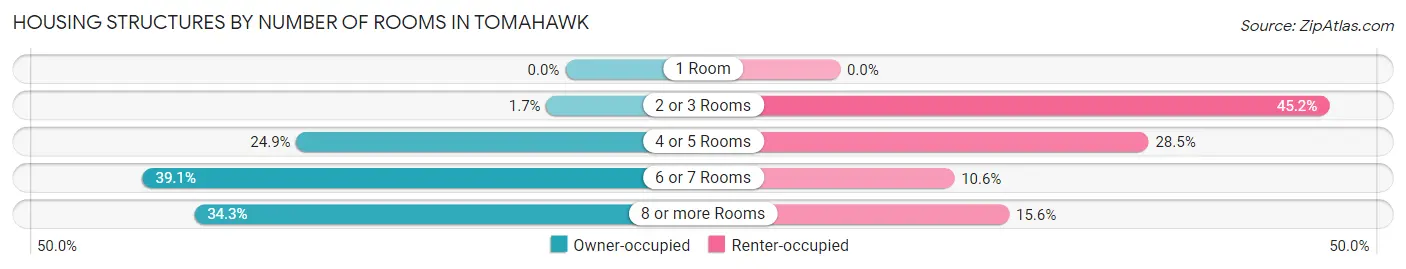
| Number of Rooms | Owner-occupied | Renter-occupied |
| 1 Room | 0 (0.0%) | 0 (0.0%) |
| 2 or 3 Rooms | 16 (1.7%) | 214 (45.2%) |
| 4 or 5 Rooms | 229 (24.9%) | 135 (28.5%) |
| 6 or 7 Rooms | 360 (39.1%) | 50 (10.6%) |
| 8 or more Rooms | 316 (34.3%) | 74 (15.6%) |
| Total | 921 (100.0%) | 473 (100.0%) |
Housing Structure by Heating Type in Tomahawk
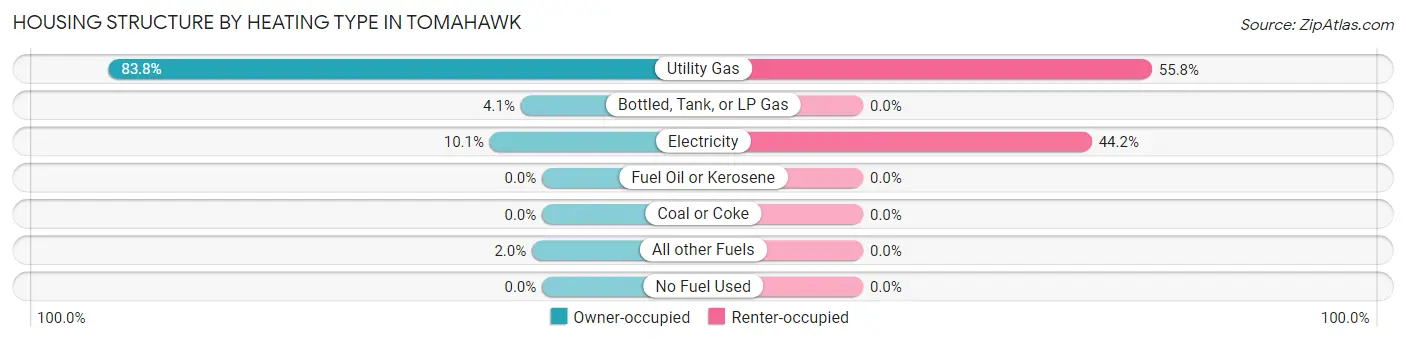
| Heating Type | Owner-occupied | Renter-occupied |
| Utility Gas | 772 (83.8%) | 264 (55.8%) |
| Bottled, Tank, or LP Gas | 38 (4.1%) | 0 (0.0%) |
| Electricity | 93 (10.1%) | 209 (44.2%) |
| Fuel Oil or Kerosene | 0 (0.0%) | 0 (0.0%) |
| Coal or Coke | 0 (0.0%) | 0 (0.0%) |
| All other Fuels | 18 (1.9%) | 0 (0.0%) |
| No Fuel Used | 0 (0.0%) | 0 (0.0%) |
| Total | 921 (100.0%) | 473 (100.0%) |
Household Vehicle Usage in Tomahawk
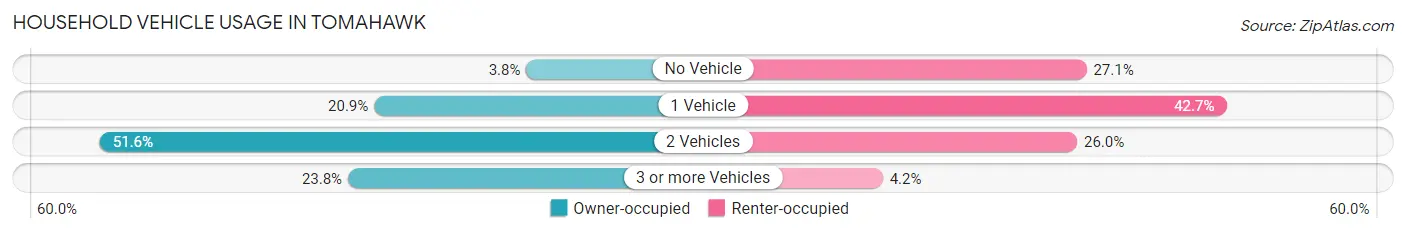
| Vehicles per Household | Owner-occupied | Renter-occupied |
| No Vehicle | 35 (3.8%) | 128 (27.1%) |
| 1 Vehicle | 192 (20.8%) | 202 (42.7%) |
| 2 Vehicles | 475 (51.6%) | 123 (26.0%) |
| 3 or more Vehicles | 219 (23.8%) | 20 (4.2%) |
| Total | 921 (100.0%) | 473 (100.0%) |
Real Estate & Mortgages in Tomahawk
Real Estate and Mortgage Overview in Tomahawk
| Characteristic | Without Mortgage | With Mortgage |
| Housing Units | 278 | 643 |
| Median Property Value | $161,000 | $158,600 |
| Median Household Income | $46,786 | $91 |
| Monthly Housing Costs | $538 | $0 |
| Real Estate Taxes | $2,323 | $17 |
Property Value by Mortgage Status in Tomahawk
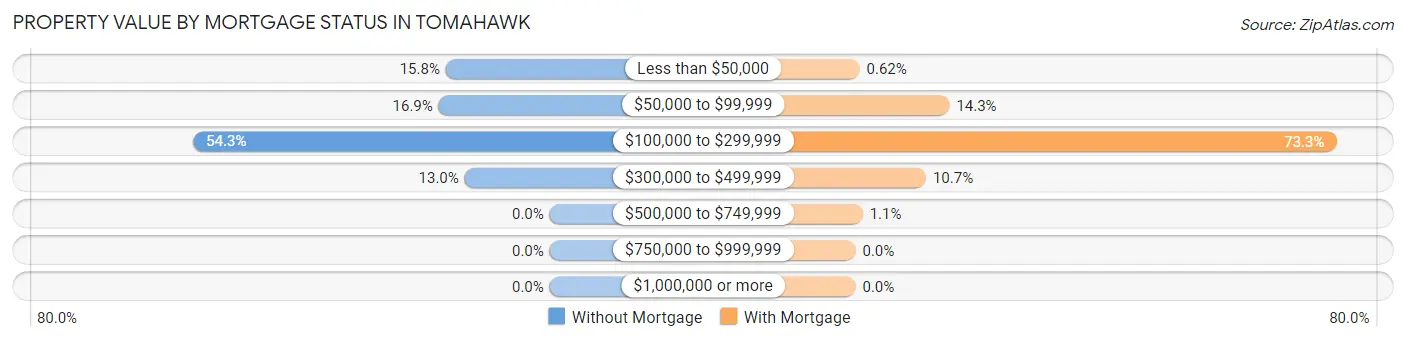
| Property Value | Without Mortgage | With Mortgage |
| Less than $50,000 | 44 (15.8%) | 4 (0.6%) |
| $50,000 to $99,999 | 47 (16.9%) | 92 (14.3%) |
| $100,000 to $299,999 | 151 (54.3%) | 471 (73.3%) |
| $300,000 to $499,999 | 36 (13.0%) | 69 (10.7%) |
| $500,000 to $749,999 | 0 (0.0%) | 7 (1.1%) |
| $750,000 to $999,999 | 0 (0.0%) | 0 (0.0%) |
| $1,000,000 or more | 0 (0.0%) | 0 (0.0%) |
| Total | 278 (100.0%) | 643 (100.0%) |
Household Income by Mortgage Status in Tomahawk
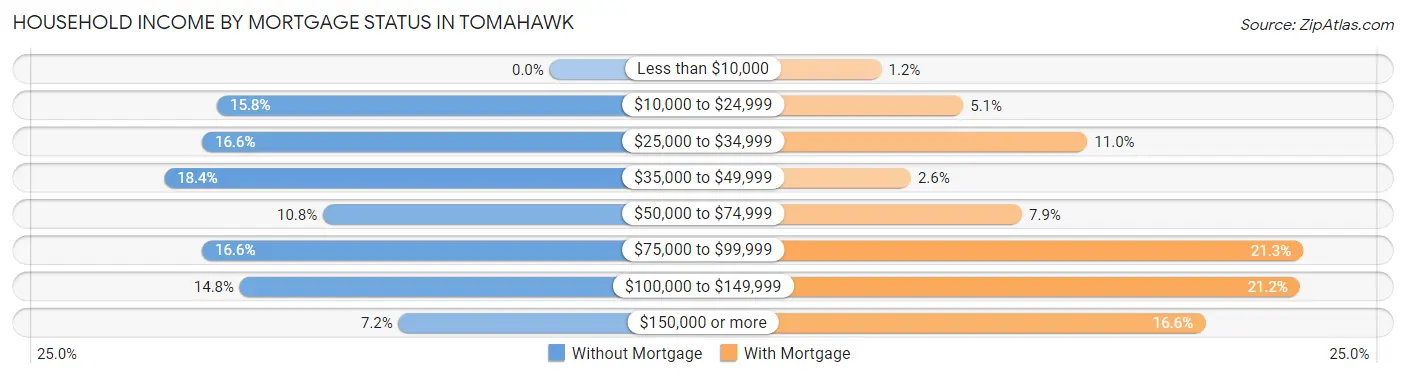
| Household Income | Without Mortgage | With Mortgage |
| Less than $10,000 | 0 (0.0%) | 8 (1.2%) |
| $10,000 to $24,999 | 44 (15.8%) | 33 (5.1%) |
| $25,000 to $34,999 | 46 (16.6%) | 71 (11.0%) |
| $35,000 to $49,999 | 51 (18.3%) | 17 (2.6%) |
| $50,000 to $74,999 | 30 (10.8%) | 51 (7.9%) |
| $75,000 to $99,999 | 46 (16.6%) | 137 (21.3%) |
| $100,000 to $149,999 | 41 (14.7%) | 136 (21.1%) |
| $150,000 or more | 20 (7.2%) | 107 (16.6%) |
| Total | 278 (100.0%) | 643 (100.0%) |
Property Value to Household Income Ratio in Tomahawk
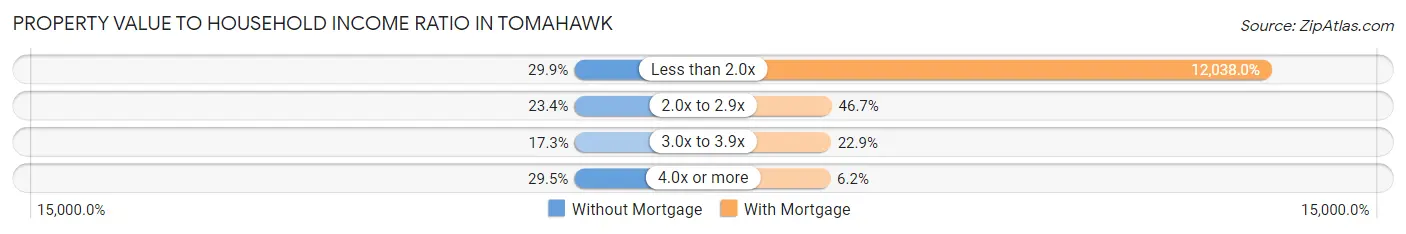
| Value-to-Income Ratio | Without Mortgage | With Mortgage |
| Less than 2.0x | 83 (29.9%) | 77,404 (12,037.9%) |
| 2.0x to 2.9x | 65 (23.4%) | 300 (46.7%) |
| 3.0x to 3.9x | 48 (17.3%) | 147 (22.9%) |
| 4.0x or more | 82 (29.5%) | 40 (6.2%) |
| Total | 278 (100.0%) | 643 (100.0%) |
Real Estate Taxes by Mortgage Status in Tomahawk
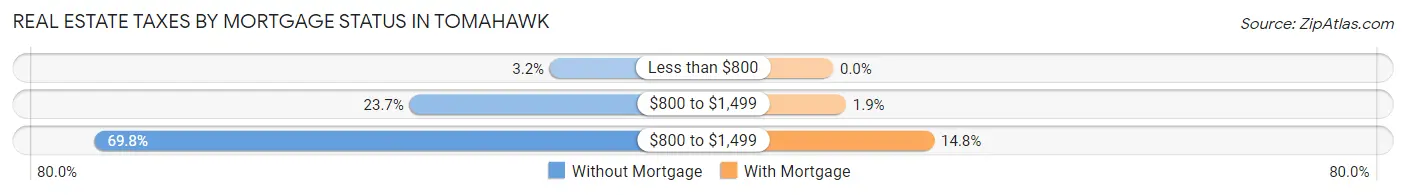
| Property Taxes | Without Mortgage | With Mortgage |
| Less than $800 | 9 (3.2%) | 0 (0.0%) |
| $800 to $1,499 | 66 (23.7%) | 12 (1.9%) |
| $800 to $1,499 | 194 (69.8%) | 95 (14.8%) |
| Total | 278 (100.0%) | 643 (100.0%) |
Health & Disability in Tomahawk
Health Insurance Coverage by Age in Tomahawk
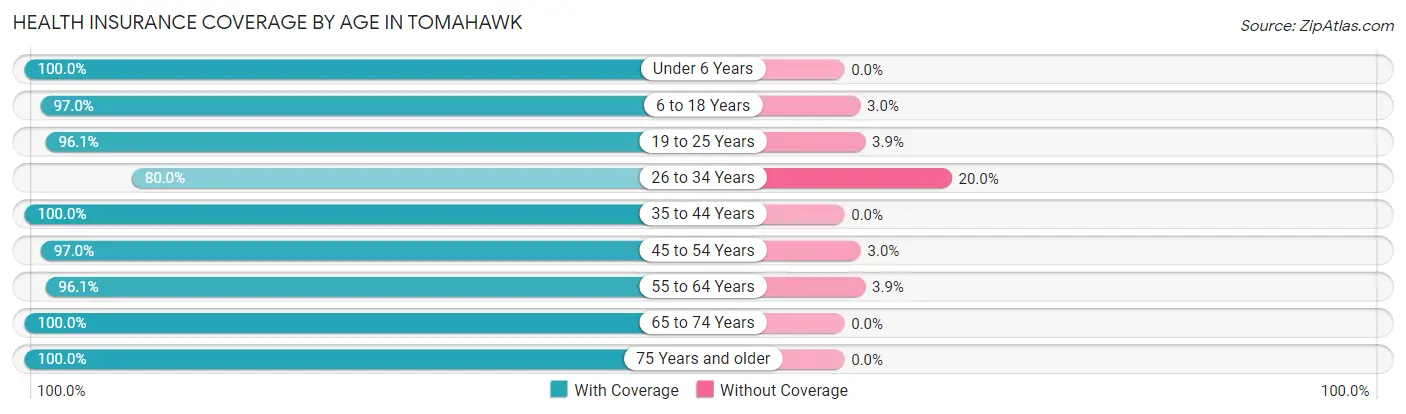
| Age Bracket | With Coverage | Without Coverage |
| Under 6 Years | 194 (100.0%) | 0 (0.0%) |
| 6 to 18 Years | 591 (97.0%) | 18 (3.0%) |
| 19 to 25 Years | 247 (96.1%) | 10 (3.9%) |
| 26 to 34 Years | 280 (80.0%) | 70 (20.0%) |
| 35 to 44 Years | 430 (100.0%) | 0 (0.0%) |
| 45 to 54 Years | 415 (97.0%) | 13 (3.0%) |
| 55 to 64 Years | 520 (96.1%) | 21 (3.9%) |
| 65 to 74 Years | 322 (100.0%) | 0 (0.0%) |
| 75 Years and older | 186 (100.0%) | 0 (0.0%) |
| Total | 3,185 (96.0%) | 132 (4.0%) |
Health Insurance Coverage by Citizenship Status in Tomahawk
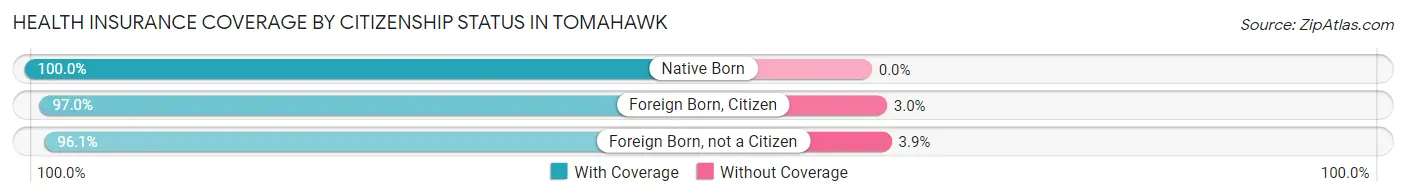
| Citizenship Status | With Coverage | Without Coverage |
| Native Born | 194 (100.0%) | 0 (0.0%) |
| Foreign Born, Citizen | 591 (97.0%) | 18 (3.0%) |
| Foreign Born, not a Citizen | 247 (96.1%) | 10 (3.9%) |
Health Insurance Coverage by Household Income in Tomahawk
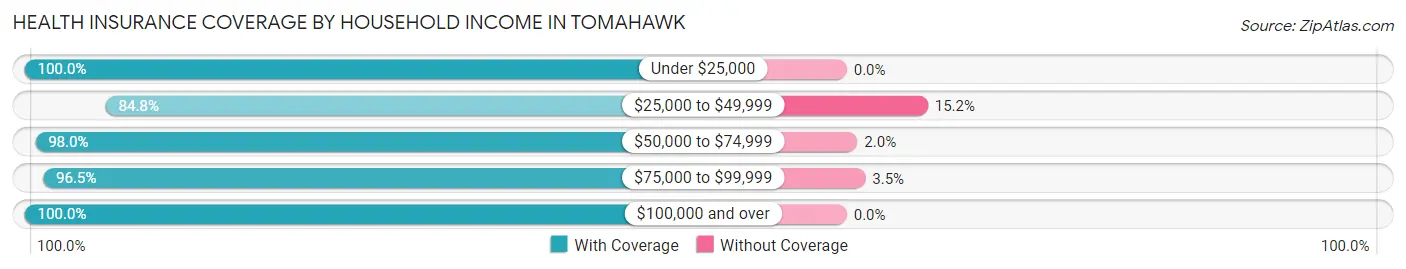
| Household Income | With Coverage | Without Coverage |
| Under $25,000 | 462 (100.0%) | 0 (0.0%) |
| $25,000 to $49,999 | 419 (84.8%) | 75 (15.2%) |
| $50,000 to $74,999 | 493 (98.0%) | 10 (2.0%) |
| $75,000 to $99,999 | 947 (96.5%) | 34 (3.5%) |
| $100,000 and over | 860 (100.0%) | 0 (0.0%) |
Public vs Private Health Insurance Coverage by Age in Tomahawk
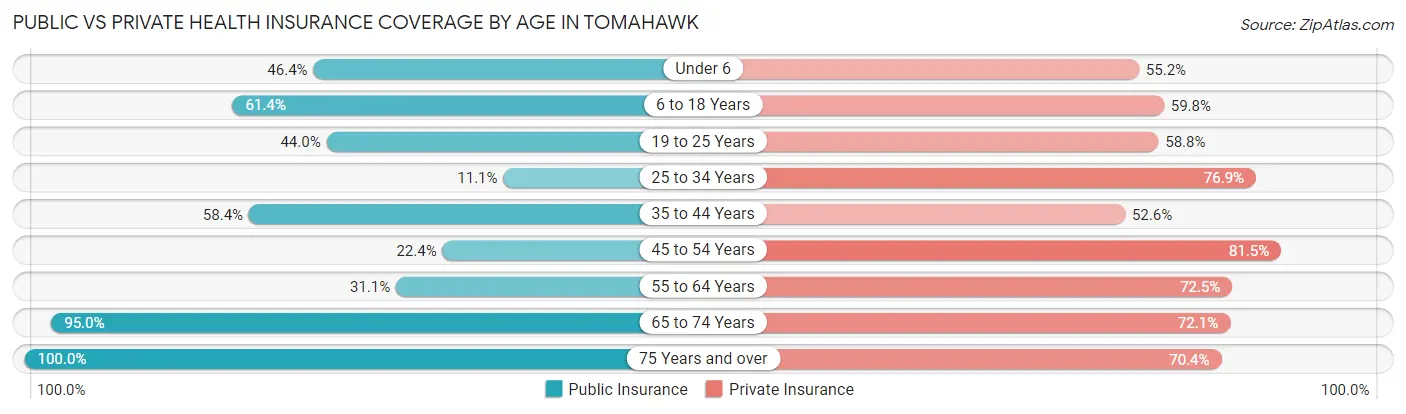
| Age Bracket | Public Insurance | Private Insurance |
| Under 6 | 90 (46.4%) | 107 (55.1%) |
| 6 to 18 Years | 374 (61.4%) | 364 (59.8%) |
| 19 to 25 Years | 113 (44.0%) | 151 (58.8%) |
| 25 to 34 Years | 39 (11.1%) | 269 (76.9%) |
| 35 to 44 Years | 251 (58.4%) | 226 (52.6%) |
| 45 to 54 Years | 96 (22.4%) | 349 (81.5%) |
| 55 to 64 Years | 168 (31.0%) | 392 (72.5%) |
| 65 to 74 Years | 306 (95.0%) | 232 (72.1%) |
| 75 Years and over | 186 (100.0%) | 131 (70.4%) |
| Total | 1,623 (48.9%) | 2,221 (67.0%) |
Disability Status by Sex by Age in Tomahawk
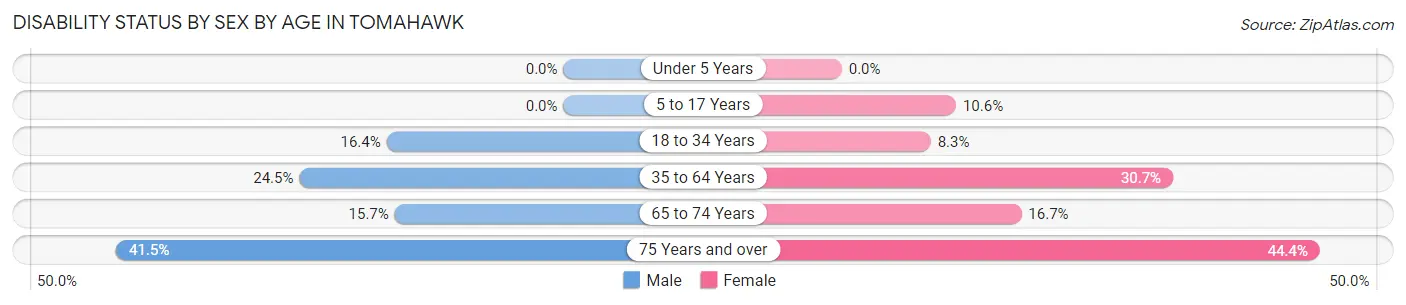
| Age Bracket | Male | Female |
| Under 5 Years | 0 (0.0%) | 0 (0.0%) |
| 5 to 17 Years | 0 (0.0%) | 37 (10.6%) |
| 18 to 34 Years | 63 (16.4%) | 24 (8.3%) |
| 35 to 64 Years | 161 (24.5%) | 228 (30.7%) |
| 65 to 74 Years | 26 (15.7%) | 26 (16.7%) |
| 75 Years and over | 22 (41.5%) | 59 (44.4%) |
Disability Class by Sex by Age in Tomahawk
Disability Class: Hearing Difficulty
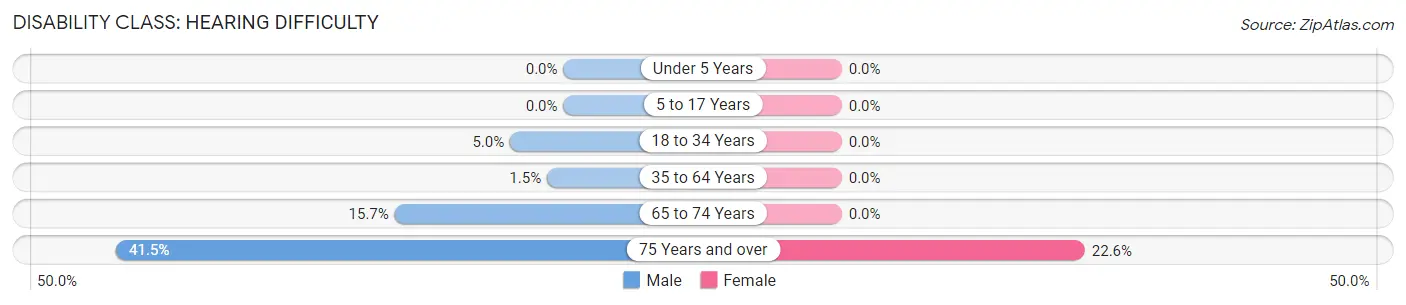
| Age Bracket | Male | Female |
| Under 5 Years | 0 (0.0%) | 0 (0.0%) |
| 5 to 17 Years | 0 (0.0%) | 0 (0.0%) |
| 18 to 34 Years | 19 (5.0%) | 0 (0.0%) |
| 35 to 64 Years | 10 (1.5%) | 0 (0.0%) |
| 65 to 74 Years | 26 (15.7%) | 0 (0.0%) |
| 75 Years and over | 22 (41.5%) | 30 (22.6%) |
Disability Class: Vision Difficulty
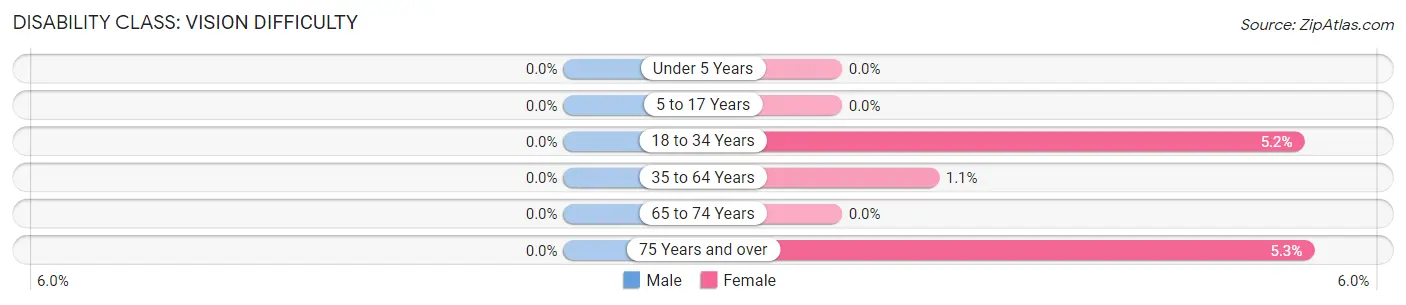
| Age Bracket | Male | Female |
| Under 5 Years | 0 (0.0%) | 0 (0.0%) |
| 5 to 17 Years | 0 (0.0%) | 0 (0.0%) |
| 18 to 34 Years | 0 (0.0%) | 15 (5.1%) |
| 35 to 64 Years | 0 (0.0%) | 8 (1.1%) |
| 65 to 74 Years | 0 (0.0%) | 0 (0.0%) |
| 75 Years and over | 0 (0.0%) | 7 (5.3%) |
Disability Class: Cognitive Difficulty
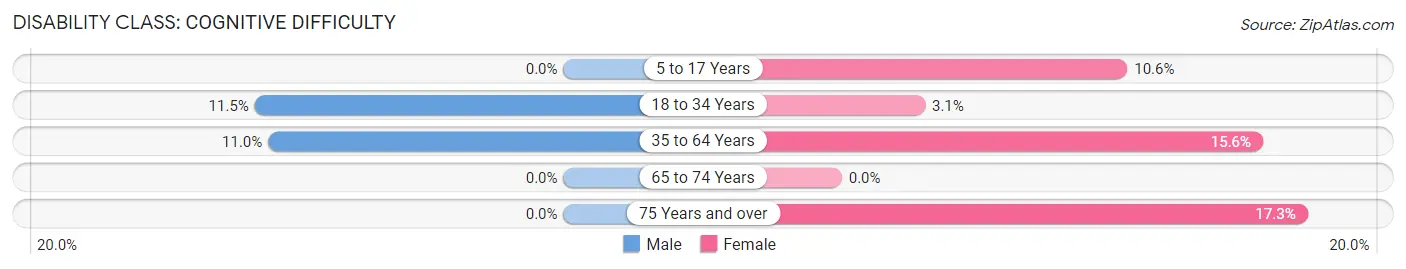
| Age Bracket | Male | Female |
| 5 to 17 Years | 0 (0.0%) | 37 (10.6%) |
| 18 to 34 Years | 44 (11.5%) | 9 (3.1%) |
| 35 to 64 Years | 72 (11.0%) | 116 (15.6%) |
| 65 to 74 Years | 0 (0.0%) | 0 (0.0%) |
| 75 Years and over | 0 (0.0%) | 23 (17.3%) |
Disability Class: Ambulatory Difficulty
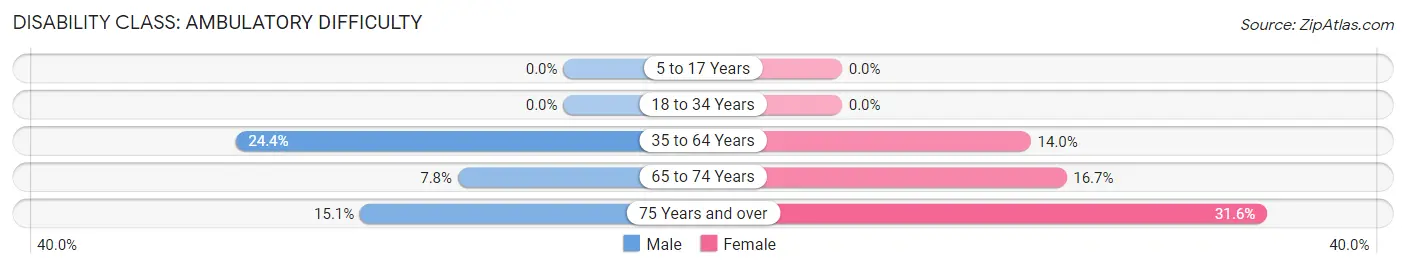
| Age Bracket | Male | Female |
| 5 to 17 Years | 0 (0.0%) | 0 (0.0%) |
| 18 to 34 Years | 0 (0.0%) | 0 (0.0%) |
| 35 to 64 Years | 160 (24.3%) | 104 (14.0%) |
| 65 to 74 Years | 13 (7.8%) | 26 (16.7%) |
| 75 Years and over | 8 (15.1%) | 42 (31.6%) |
Disability Class: Self-Care Difficulty
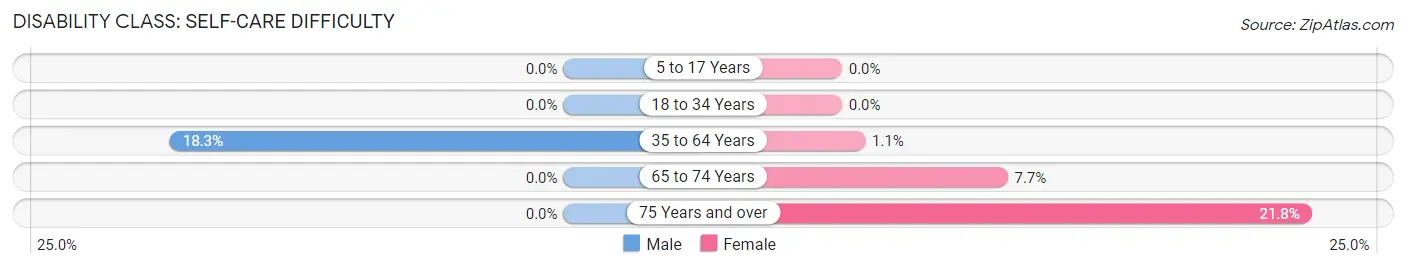
| Age Bracket | Male | Female |
| 5 to 17 Years | 0 (0.0%) | 0 (0.0%) |
| 18 to 34 Years | 0 (0.0%) | 0 (0.0%) |
| 35 to 64 Years | 120 (18.3%) | 8 (1.1%) |
| 65 to 74 Years | 0 (0.0%) | 12 (7.7%) |
| 75 Years and over | 0 (0.0%) | 29 (21.8%) |
Technology Access in Tomahawk
Computing Device Access in Tomahawk
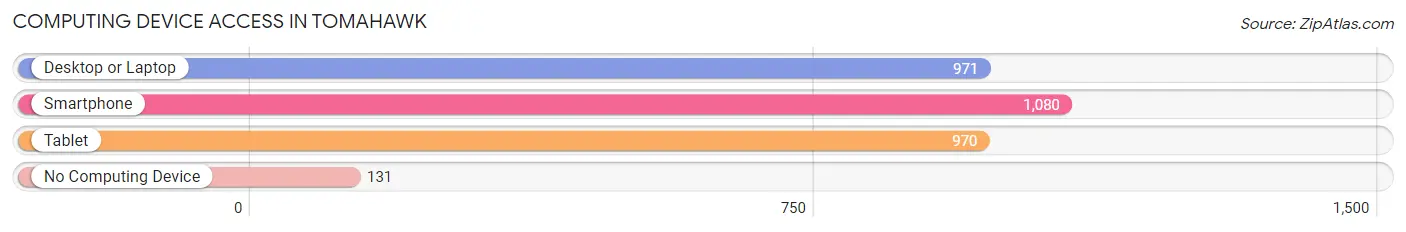
| Device Type | # Households | % Households |
| Desktop or Laptop | 971 | 69.7% |
| Smartphone | 1,080 | 77.5% |
| Tablet | 970 | 69.6% |
| No Computing Device | 131 | 9.4% |
| Total | 1,394 | 100.0% |
Internet Access in Tomahawk
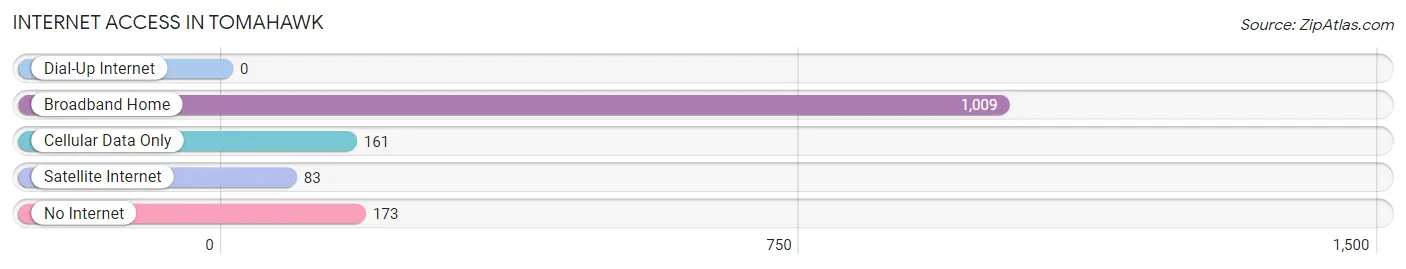
| Internet Type | # Households | % Households |
| Dial-Up Internet | 0 | 0.0% |
| Broadband Home | 1,009 | 72.4% |
| Cellular Data Only | 161 | 11.6% |
| Satellite Internet | 83 | 5.9% |
| No Internet | 173 | 12.4% |
| Total | 1,394 | 100.0% |
Tomahawk Summary
Tomahawk, Wisconsin is a city located in Lincoln County, Wisconsin, United States. The population was 3,719 at the 2010 census. Tomahawk is located in the heart of Wisconsin's Northwoods, and is known for its many lakes, rivers, and forests.
History
Tomahawk was first settled in the late 1800s by lumberjacks and trappers. The city was officially incorporated in 1883. The name Tomahawk was chosen because of the tomahawk-shaped lake located near the city.
The city was a major lumbering center in the late 1800s and early 1900s. The city was also home to a number of sawmills and other wood-related industries. The city was also home to a number of resorts and tourist attractions, including the Tomahawk Hotel, which was built in 1891.
The city was also home to a number of manufacturing companies, including the Tomahawk Manufacturing Company, which produced a variety of products, including furniture, tools, and sporting goods.
Geography
Tomahawk is located at 45°31'17" North, 89°45'17" West (45.5214, -89.7547). The city is located in the heart of Wisconsin's Northwoods, and is surrounded by numerous lakes, rivers, and forests. The city is located on the Wisconsin River, and is approximately 30 miles north of Wausau, Wisconsin.
The city has a total area of 4.2 square miles, all of which is land. The city is located at an elevation of 1,072 feet above sea level.
Economy
Tomahawk's economy is largely based on tourism and manufacturing. The city is home to a number of resorts and tourist attractions, including the Tomahawk Hotel, which was built in 1891. The city is also home to a number of manufacturing companies, including the Tomahawk Manufacturing Company, which produces a variety of products, including furniture, tools, and sporting goods.
The city is also home to a number of retail stores, restaurants, and other businesses. The city is also home to a number of service-based businesses, including medical and legal services.
Demographics
As of the 2010 census, there were 3,719 people, 1,541 households, and 990 families residing in the city. The population density was 890.2 people per square mile. There were 1,717 housing units at an average density of 411.3 per square mile. The racial makeup of the city was 97.2% White, 0.3% African American, 0.7% Native American, 0.3% Asian, 0.1% Pacific Islander, 0.4% from other races, and 1.0% from two or more races. Hispanic or Latino of any race were 1.3% of the population.
There were 1,541 households, out of which 28.2% had children under the age of 18 living with them, 48.2% were married couples living together, 11.2% had a female householder with no husband present, and 36.2% were non-families. 30.3% of all households were made up of individuals, and 14.2% had someone living alone who was 65 years of age or older. The average household size was 2.37 and the average family size was 2.94.
In the city, the population was spread out, with 24.2% under the age of 18, 7.2% from 18 to 24, 25.7% from 25 to 44, 24.2% from 45 to 64, and 18.7% who were 65 years of age or older. The median age was 40 years. For every 100 females, there were 92.2 males. For every 100 females age 18 and over, there were 88.7 males.
The median income for a household in the city was $35,938, and the median income for a family was $45,000. Males had a median income of $31,964 versus $22,500 for females. The per capita income for the city was $19,845. About 8.2% of families and 11.2% of the population were below the poverty line, including 15.2% of those under age 18 and 8.2% of those age 65 or over.
Common Questions
What is Per Capita Income in Tomahawk?
Per Capita income in Tomahawk is $33,345.
What is the Median Family Income in Tomahawk?
Median Family Income in Tomahawk is $81,154.
What is the Median Household income in Tomahawk?
Median Household Income in Tomahawk is $59,800.
What is Income or Wage Gap in Tomahawk?
Income or Wage Gap in Tomahawk is 37.8%.
Women in Tomahawk earn 62.2 cents for every dollar earned by a man.
What is Inequality or Gini Index in Tomahawk?
Inequality or Gini Index in Tomahawk is 0.47.
What is the Total Population of Tomahawk?
Total Population of Tomahawk is 3,413.
What is the Total Male Population of Tomahawk?
Total Male Population of Tomahawk is 1,597.
What is the Total Female Population of Tomahawk?
Total Female Population of Tomahawk is 1,816.
What is the Ratio of Males per 100 Females in Tomahawk?
There are 87.94 Males per 100 Females in Tomahawk.
What is the Ratio of Females per 100 Males in Tomahawk?
There are 113.71 Females per 100 Males in Tomahawk.
What is the Median Population Age in Tomahawk?
Median Population Age in Tomahawk is 40.7 Years.
What is the Average Family Size in Tomahawk
Average Family Size in Tomahawk is 3.1 People.
What is the Average Household Size in Tomahawk
Average Household Size in Tomahawk is 2.4 People.
How Large is the Labor Force in Tomahawk?
There are 1,653 People in the Labor Forcein in Tomahawk.
What is the Percentage of People in the Labor Force in Tomahawk?
59.0% of People are in the Labor Force in Tomahawk.
What is the Unemployment Rate in Tomahawk?
Unemployment Rate in Tomahawk is 7.5%.