Thorp, WI Map & Demographics
Thorp Map
Thorp Overview
$27,939
PER CAPITA INCOME
$64,940
AVG FAMILY INCOME
$53,824
AVG HOUSEHOLD INCOME
34.3%
WAGE / INCOME GAP [ % ]
65.7¢/ $1
WAGE / INCOME GAP [ $ ]
0.38
INEQUALITY / GINI INDEX
1,753
TOTAL POPULATION
847
MALE POPULATION
906
FEMALE POPULATION
93.49
MALES / 100 FEMALES
106.97
FEMALES / 100 MALES
41.5
MEDIAN AGE
2.9
AVG FAMILY SIZE
2.4
AVG HOUSEHOLD SIZE
769
LABOR FORCE [ PEOPLE ]
55.3%
PERCENT IN LABOR FORCE
2.7%
UNEMPLOYMENT RATE
Thorp Zip Codes
Thorp Area Codes
Income in Thorp
Income Overview in Thorp
Per Capita Income in Thorp is $27,939, while median incomes of families and households are $64,940 and $53,824 respectively.
| Characteristic | Number | Measure |
| Per Capita Income | 1,753 | $27,939 |
| Median Family Income | 473 | $64,940 |
| Mean Family Income | 473 | $79,018 |
| Median Household Income | 686 | $53,824 |
| Mean Household Income | 686 | $68,849 |
| Income Deficit | 473 | $0 |
| Wage / Income Gap (%) | 1,753 | 34.26% |
| Wage / Income Gap ($) | 1,753 | 65.74¢ per $1 |
| Gini / Inequality Index | 1,753 | 0.38 |
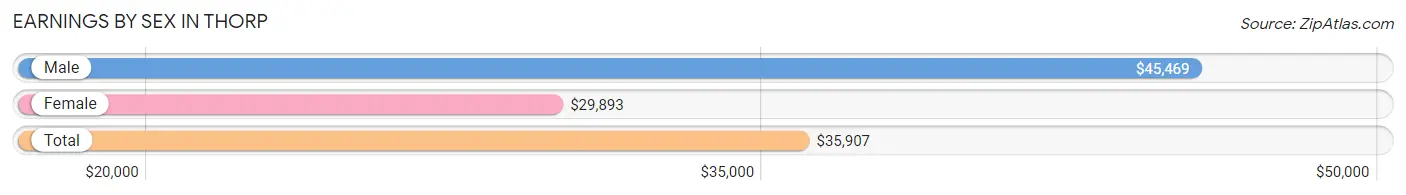
Earnings by Sex in Thorp
Average Earnings in Thorp are $35,907, $45,469 for men and $29,893 for women, a difference of 34.3%.
| Sex | Number | Average Earnings |
| Male | 436 (51.8%) | $45,469 |
| Female | 405 (48.2%) | $29,893 |
| Total | 841 (100.0%) | $35,907 |
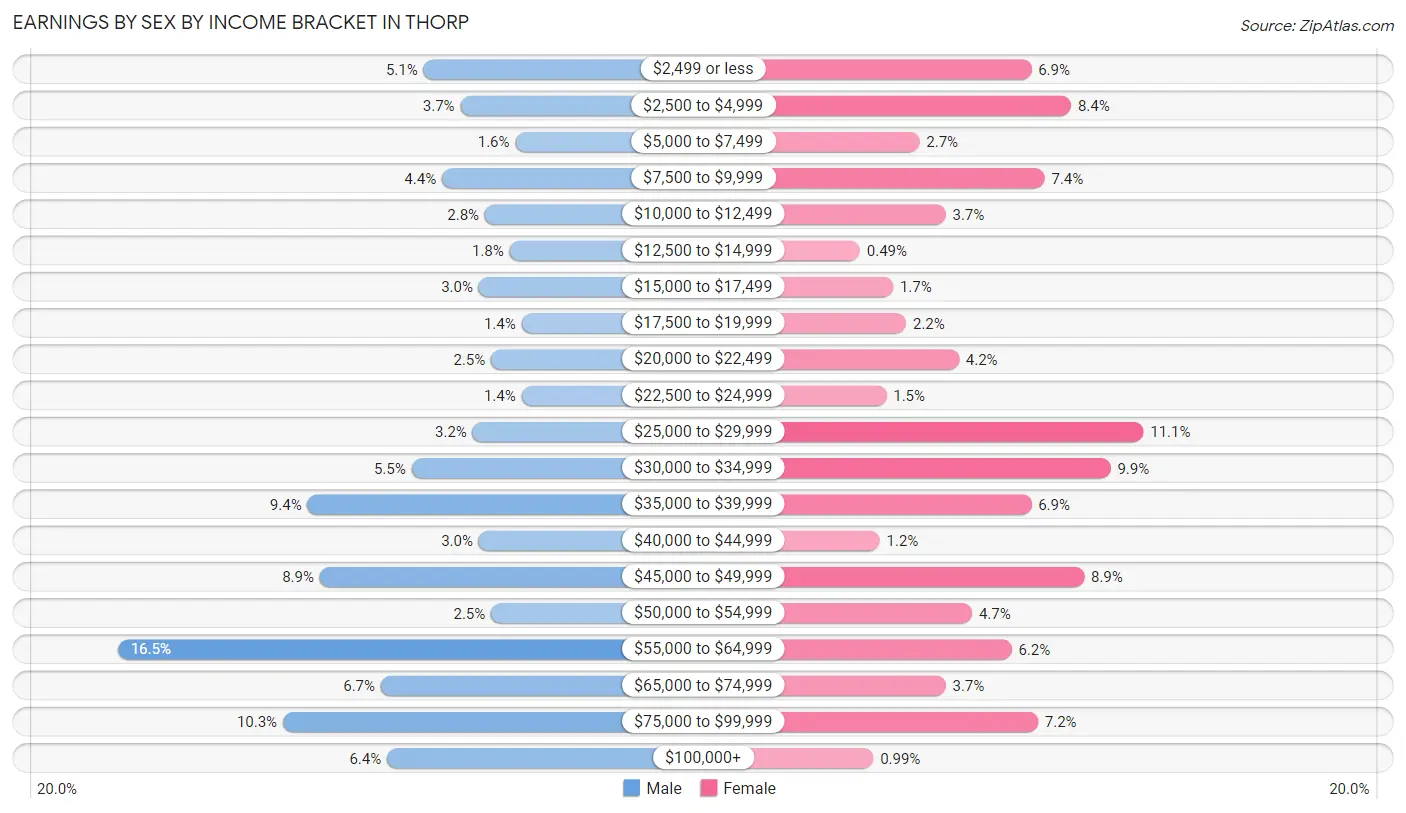
Earnings by Sex by Income Bracket in Thorp
The most common earnings brackets in Thorp are $55,000 to $64,999 for men (72 | 16.5%) and $25,000 to $29,999 for women (45 | 11.1%).
| Income | Male | Female |
| $2,499 or less | 22 (5.1%) | 28 (6.9%) |
| $2,500 to $4,999 | 16 (3.7%) | 34 (8.4%) |
| $5,000 to $7,499 | 7 (1.6%) | 11 (2.7%) |
| $7,500 to $9,999 | 19 (4.4%) | 30 (7.4%) |
| $10,000 to $12,499 | 12 (2.8%) | 15 (3.7%) |
| $12,500 to $14,999 | 8 (1.8%) | 2 (0.5%) |
| $15,000 to $17,499 | 13 (3.0%) | 7 (1.7%) |
| $17,500 to $19,999 | 6 (1.4%) | 9 (2.2%) |
| $20,000 to $22,499 | 11 (2.5%) | 17 (4.2%) |
| $22,500 to $24,999 | 6 (1.4%) | 6 (1.5%) |
| $25,000 to $29,999 | 14 (3.2%) | 45 (11.1%) |
| $30,000 to $34,999 | 24 (5.5%) | 40 (9.9%) |
| $35,000 to $39,999 | 41 (9.4%) | 28 (6.9%) |
| $40,000 to $44,999 | 13 (3.0%) | 5 (1.2%) |
| $45,000 to $49,999 | 39 (8.9%) | 36 (8.9%) |
| $50,000 to $54,999 | 11 (2.5%) | 19 (4.7%) |
| $55,000 to $64,999 | 72 (16.5%) | 25 (6.2%) |
| $65,000 to $74,999 | 29 (6.7%) | 15 (3.7%) |
| $75,000 to $99,999 | 45 (10.3%) | 29 (7.2%) |
| $100,000+ | 28 (6.4%) | 4 (1.0%) |
| Total | 436 (100.0%) | 405 (100.0%) |
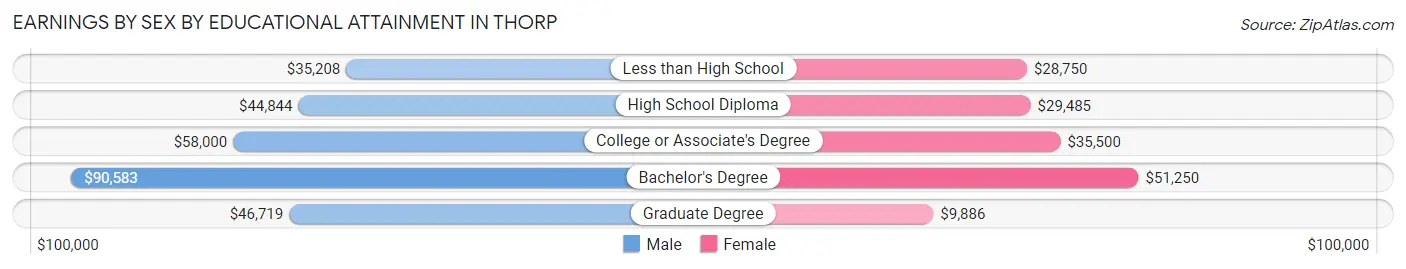
Earnings by Sex by Educational Attainment in Thorp
Average earnings in Thorp are $52,500 for men and $32,250 for women, a difference of 38.6%. Men with an educational attainment of bachelor's degree enjoy the highest average annual earnings of $90,583, while those with less than high school education earn the least with $35,208. Women with an educational attainment of bachelor's degree earn the most with the average annual earnings of $51,250, while those with graduate degree education have the smallest earnings of $9,886.
| Educational Attainment | Male Income | Female Income |
| Less than High School | $35,208 | $28,750 |
| High School Diploma | $44,844 | $29,485 |
| College or Associate's Degree | $58,000 | $35,500 |
| Bachelor's Degree | $90,583 | $51,250 |
| Graduate Degree | $46,719 | $9,886 |
| Total | $52,500 | $32,250 |
Family Income in Thorp
Family Income Brackets in Thorp
According to the Thorp family income data, there are 158 families falling into the $50,000 to $74,999 income range, which is the most common income bracket and makes up 33.4% of all families. Conversely, the $200,000+ income bracket is the least frequent group with only 8 families (1.7%) belonging to this category.
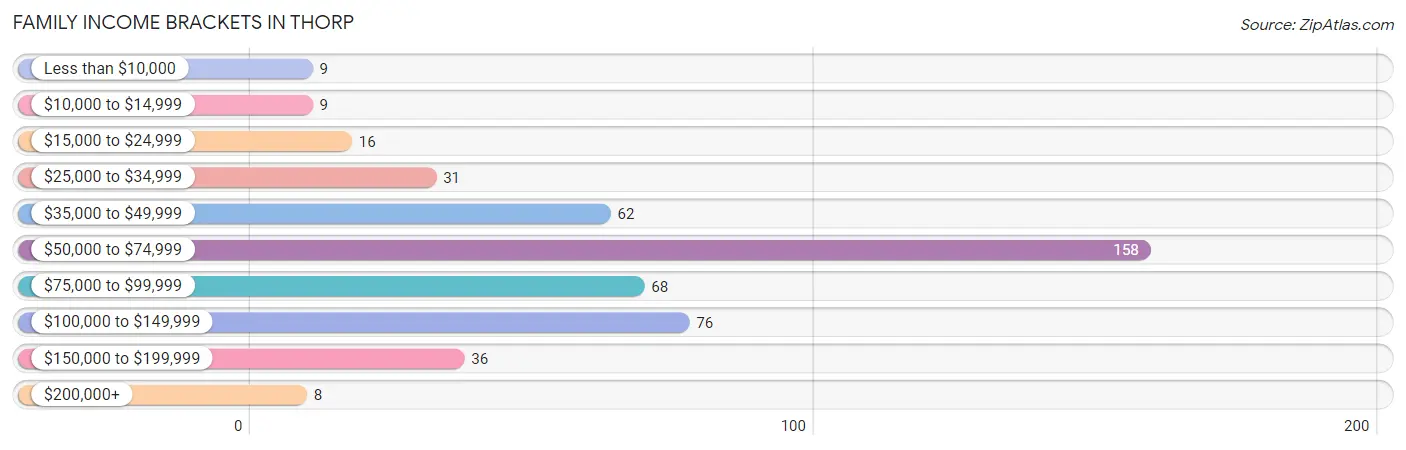
| Income Bracket | # Families | % Families |
| Less than $10,000 | 9 | 1.9% |
| $10,000 to $14,999 | 9 | 1.9% |
| $15,000 to $24,999 | 16 | 3.4% |
| $25,000 to $34,999 | 31 | 6.6% |
| $35,000 to $49,999 | 62 | 13.1% |
| $50,000 to $74,999 | 158 | 33.4% |
| $75,000 to $99,999 | 68 | 14.4% |
| $100,000 to $149,999 | 76 | 16.1% |
| $150,000 to $199,999 | 36 | 7.6% |
| $200,000+ | 8 | 1.7% |
Family Income by Famaliy Size in Thorp
5-person families (36 | 7.6%) account for the highest median family income in Thorp with $170,167 per family, while 5-person families (36 | 7.6%) have the highest median income of $34,033 per family member.
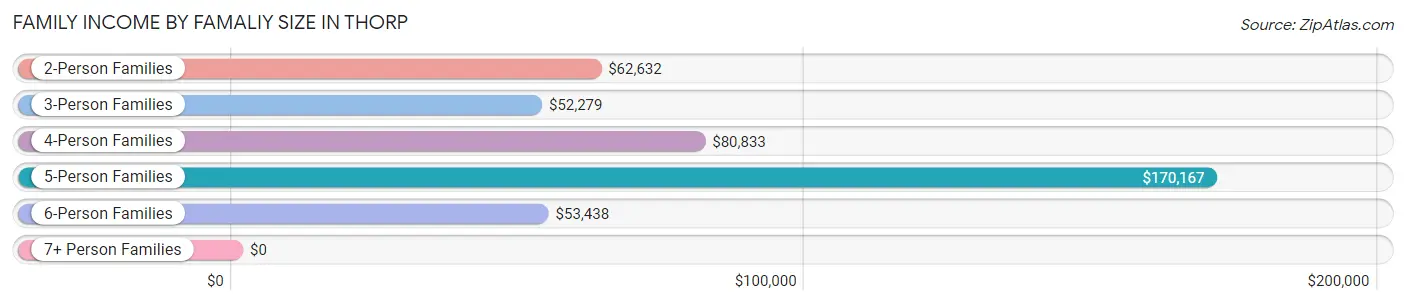
| Income Bracket | # Families | Median Income |
| 2-Person Families | 206 (43.5%) | $62,632 |
| 3-Person Families | 144 (30.4%) | $52,279 |
| 4-Person Families | 68 (14.4%) | $80,833 |
| 5-Person Families | 36 (7.6%) | $170,167 |
| 6-Person Families | 19 (4.0%) | $53,438 |
| 7+ Person Families | 0 (0.0%) | $0 |
| Total | 473 (100.0%) | $64,940 |
Family Income by Number of Earners in Thorp
The median family income in Thorp is $64,940, with families comprising 2 earners (177) having the highest median family income of $94,034, while families with no earners (98) have the lowest median family income of $50,809, accounting for 37.4% and 20.7% of families, respectively.
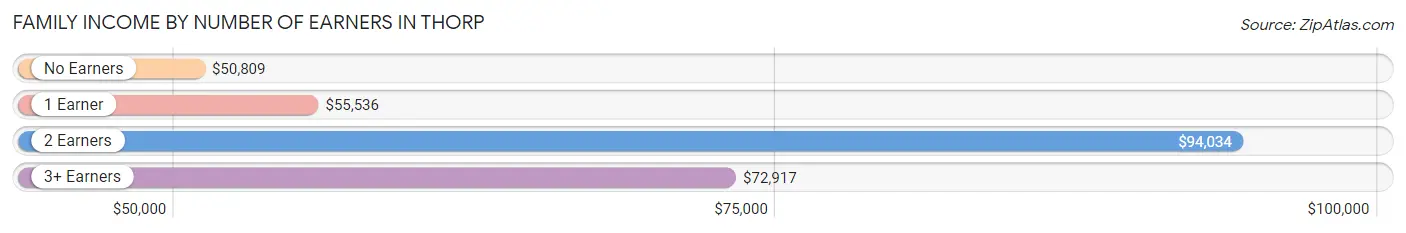
| Number of Earners | # Families | Median Income |
| No Earners | 98 (20.7%) | $50,809 |
| 1 Earner | 139 (29.4%) | $55,536 |
| 2 Earners | 177 (37.4%) | $94,034 |
| 3+ Earners | 59 (12.5%) | $72,917 |
| Total | 473 (100.0%) | $64,940 |
Household Income in Thorp
Household Income Brackets in Thorp
With 166 households falling in the category, the $50,000 to $74,999 income range is the most frequent in Thorp, accounting for 24.2% of all households. In contrast, only 8 households (1.2%) fall into the $200,000+ income bracket, making it the least populous group.
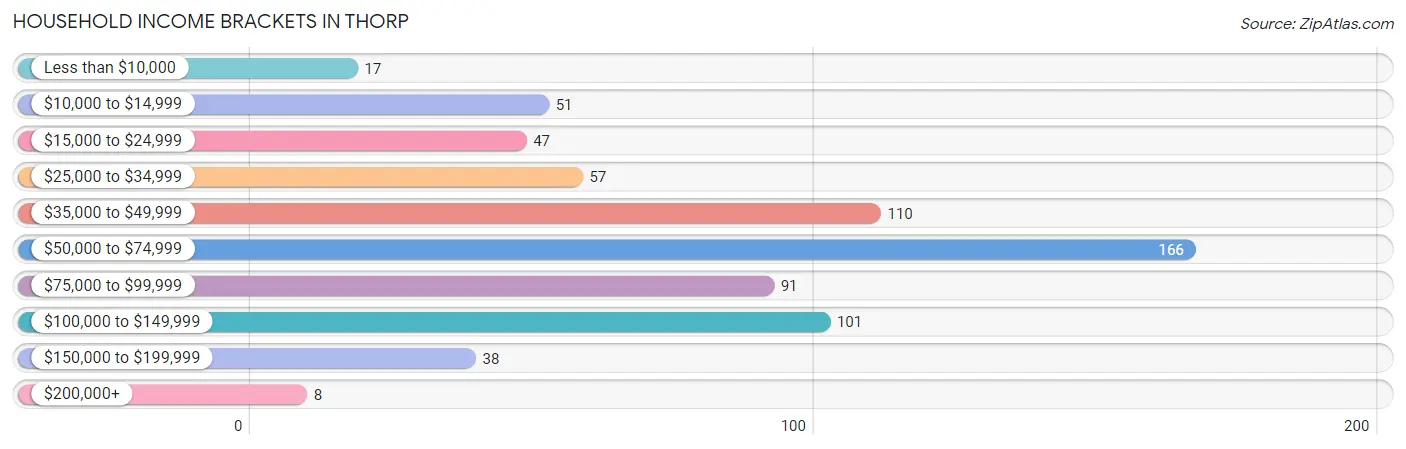
| Income Bracket | # Households | % Households |
| Less than $10,000 | 17 | 2.5% |
| $10,000 to $14,999 | 51 | 7.4% |
| $15,000 to $24,999 | 47 | 6.9% |
| $25,000 to $34,999 | 57 | 8.3% |
| $35,000 to $49,999 | 110 | 16.0% |
| $50,000 to $74,999 | 166 | 24.2% |
| $75,000 to $99,999 | 91 | 13.3% |
| $100,000 to $149,999 | 101 | 14.7% |
| $150,000 to $199,999 | 38 | 5.5% |
| $200,000+ | 8 | 1.2% |
Household Income by Householder Age in Thorp
The median household income in Thorp is $53,824, with the highest median household income of $74,643 found in the 25 to 44 years age bracket for the primary householder. A total of 268 households (39.1%) fall into this category. Meanwhile, the 65+ years age bracket for the primary householder has the lowest median household income of $48,750, with 217 households (31.6%) in this group.
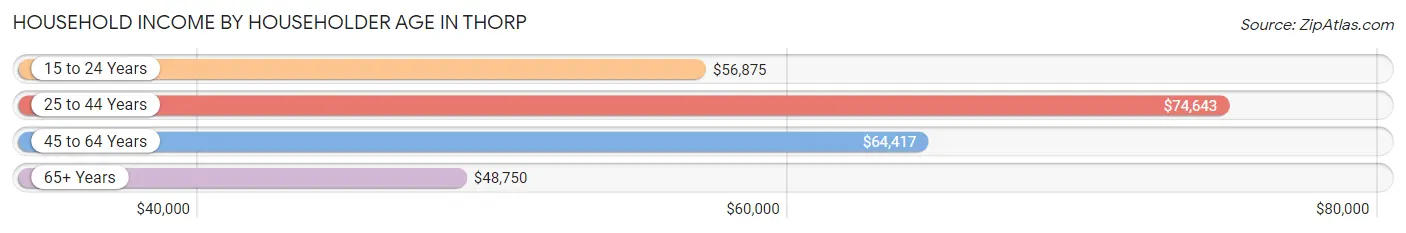
| Income Bracket | # Households | Median Income |
| 15 to 24 Years | 14 (2.0%) | $56,875 |
| 25 to 44 Years | 268 (39.1%) | $74,643 |
| 45 to 64 Years | 187 (27.3%) | $64,417 |
| 65+ Years | 217 (31.6%) | $48,750 |
| Total | 686 (100.0%) | $53,824 |
Poverty in Thorp
Income Below Poverty by Sex and Age in Thorp
With 6.8% poverty level for males and 9.1% for females among the residents of Thorp, 12 to 14 year old males and 12 to 14 year old females are the most vulnerable to poverty, with 5 males (23.8%) and 9 females (37.5%) in their respective age groups living below the poverty level.
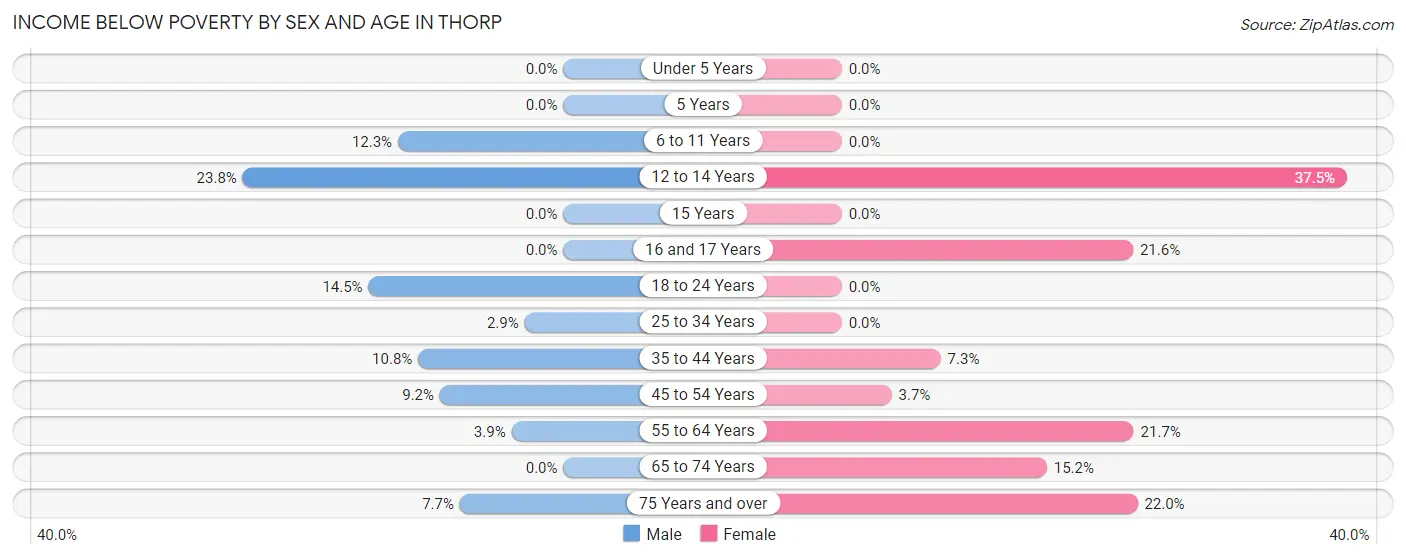
| Age Bracket | Male | Female |
| Under 5 Years | 0 (0.0%) | 0 (0.0%) |
| 5 Years | 0 (0.0%) | 0 (0.0%) |
| 6 to 11 Years | 7 (12.3%) | 0 (0.0%) |
| 12 to 14 Years | 5 (23.8%) | 9 (37.5%) |
| 15 Years | 0 (0.0%) | 0 (0.0%) |
| 16 and 17 Years | 0 (0.0%) | 8 (21.6%) |
| 18 to 24 Years | 11 (14.5%) | 0 (0.0%) |
| 25 to 34 Years | 3 (2.9%) | 0 (0.0%) |
| 35 to 44 Years | 11 (10.8%) | 8 (7.3%) |
| 45 to 54 Years | 10 (9.2%) | 4 (3.7%) |
| 55 to 64 Years | 3 (3.8%) | 13 (21.7%) |
| 65 to 74 Years | 0 (0.0%) | 21 (15.2%) |
| 75 Years and over | 4 (7.7%) | 18 (22.0%) |
| Total | 54 (6.8%) | 81 (9.1%) |
Income Above Poverty by Sex and Age in Thorp
According to the poverty statistics in Thorp, males aged under 5 years and females aged under 5 years are the age groups that are most secure financially, with 100.0% of males and 100.0% of females in these age groups living above the poverty line.
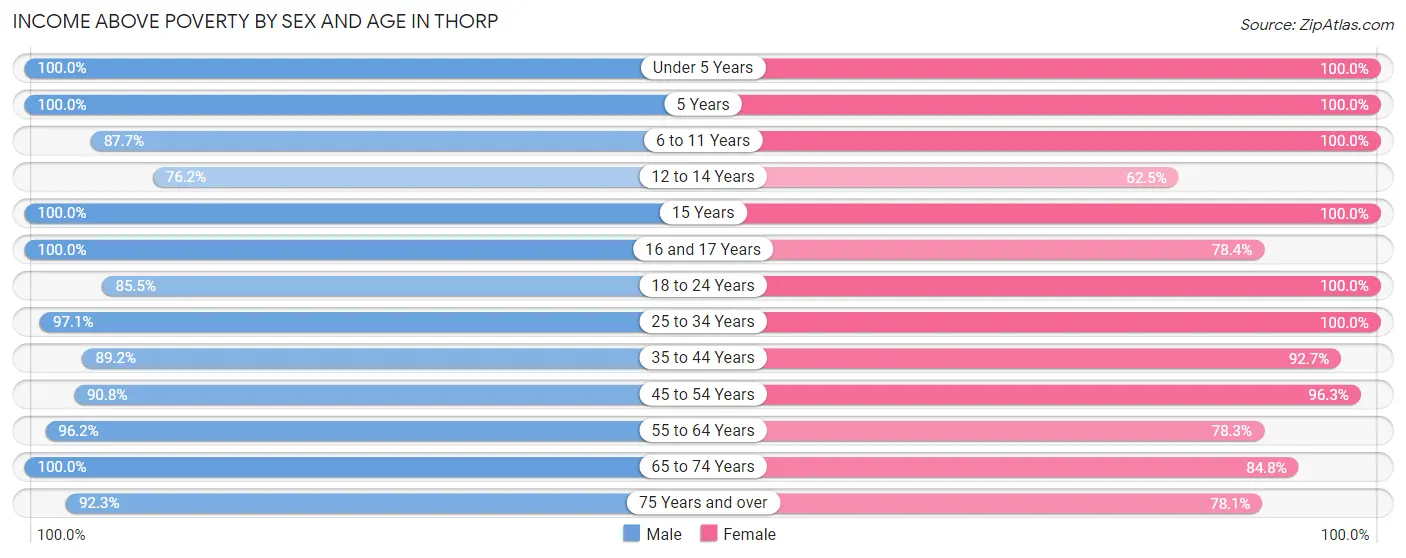
| Age Bracket | Male | Female |
| Under 5 Years | 53 (100.0%) | 52 (100.0%) |
| 5 Years | 3 (100.0%) | 20 (100.0%) |
| 6 to 11 Years | 50 (87.7%) | 78 (100.0%) |
| 12 to 14 Years | 16 (76.2%) | 15 (62.5%) |
| 15 Years | 17 (100.0%) | 34 (100.0%) |
| 16 and 17 Years | 20 (100.0%) | 29 (78.4%) |
| 18 to 24 Years | 65 (85.5%) | 46 (100.0%) |
| 25 to 34 Years | 101 (97.1%) | 101 (100.0%) |
| 35 to 44 Years | 91 (89.2%) | 101 (92.7%) |
| 45 to 54 Years | 99 (90.8%) | 104 (96.3%) |
| 55 to 64 Years | 75 (96.2%) | 47 (78.3%) |
| 65 to 74 Years | 102 (100.0%) | 117 (84.8%) |
| 75 Years and over | 48 (92.3%) | 64 (78.0%) |
| Total | 740 (93.2%) | 808 (90.9%) |
Income Below Poverty Among Married-Couple Families in Thorp
The poverty statistics for married-couple families in Thorp show that 1.4% or 5 of the total 356 families live below the poverty line. Families with no children have the highest poverty rate of 2.8%, comprising of 5 families. On the other hand, families with 1 or 2 children have the lowest poverty rate of 0.0%, which includes 0 families.
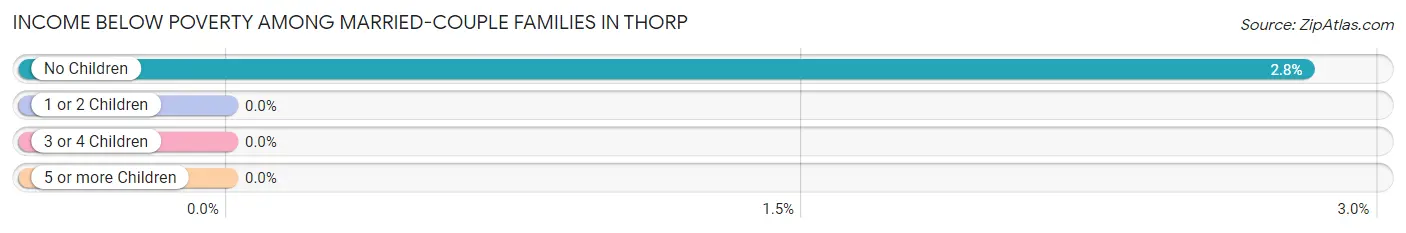
| Children | Above Poverty | Below Poverty |
| No Children | 173 (97.2%) | 5 (2.8%) |
| 1 or 2 Children | 129 (100.0%) | 0 (0.0%) |
| 3 or 4 Children | 49 (100.0%) | 0 (0.0%) |
| 5 or more Children | 0 (0.0%) | 0 (0.0%) |
| Total | 351 (98.6%) | 5 (1.4%) |
Income Below Poverty Among Single-Parent Households in Thorp
According to the poverty data in Thorp, 22.5% or 11 single-father households and 11.8% or 8 single-mother households are living below the poverty line. Among single-father households, those with 1 or 2 children have the highest poverty rate, with 11 households (28.2%) experiencing poverty. Likewise, among single-mother households, those with 3 or 4 children have the highest poverty rate, with 3 households (100.0%) falling below the poverty line.
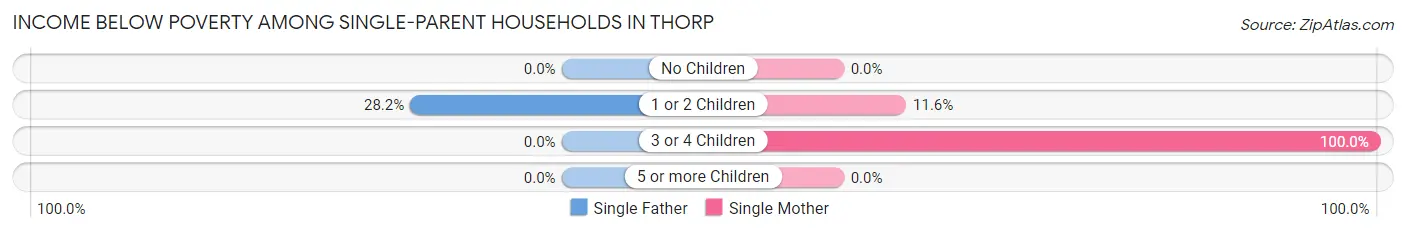
| Children | Single Father | Single Mother |
| No Children | 0 (0.0%) | 0 (0.0%) |
| 1 or 2 Children | 11 (28.2%) | 5 (11.6%) |
| 3 or 4 Children | 0 (0.0%) | 3 (100.0%) |
| 5 or more Children | 0 (0.0%) | 0 (0.0%) |
| Total | 11 (22.5%) | 8 (11.8%) |
Income Below Poverty Among Married-Couple vs Single-Parent Households in Thorp
The poverty data for Thorp shows that 5 of the married-couple family households (1.4%) and 19 of the single-parent households (16.2%) are living below the poverty level. Within the married-couple family households, those with no children have the highest poverty rate, with 5 households (2.8%) falling below the poverty line. Among the single-parent households, those with 3 or 4 children have the highest poverty rate, with 3 household (100.0%) living below poverty.
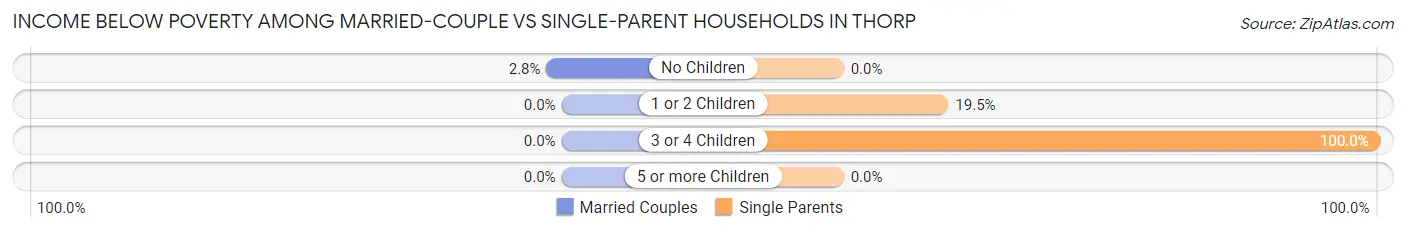
| Children | Married-Couple Families | Single-Parent Households |
| No Children | 5 (2.8%) | 0 (0.0%) |
| 1 or 2 Children | 0 (0.0%) | 16 (19.5%) |
| 3 or 4 Children | 0 (0.0%) | 3 (100.0%) |
| 5 or more Children | 0 (0.0%) | 0 (0.0%) |
| Total | 5 (1.4%) | 19 (16.2%) |
Race in Thorp
The most populous races in Thorp are White / Caucasian (1,647 | 94.0%), Hispanic or Latino (101 | 5.8%), and Two or more Races (62 | 3.5%).
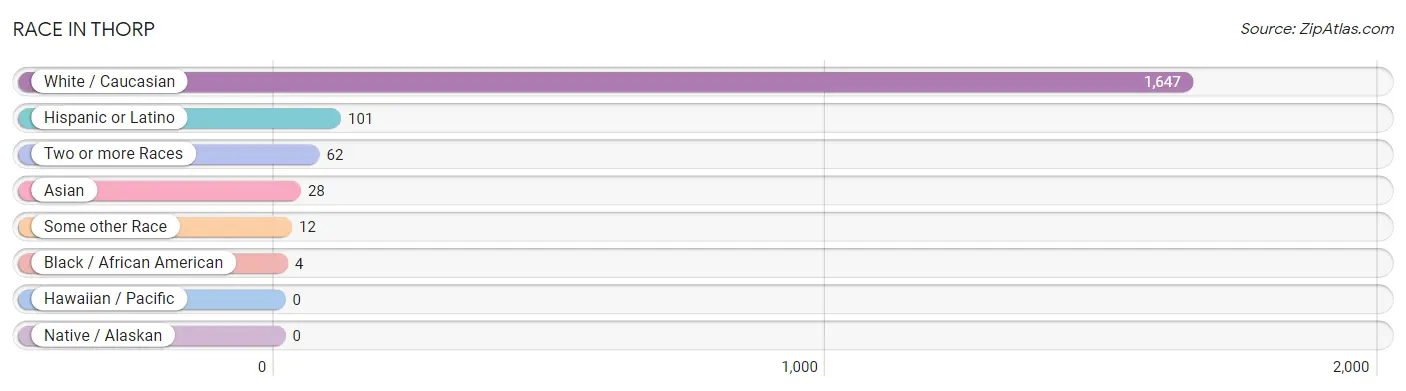
| Race | # Population | % Population |
| Asian | 28 | 1.6% |
| Black / African American | 4 | 0.2% |
| Hawaiian / Pacific | 0 | 0.0% |
| Hispanic or Latino | 101 | 5.8% |
| Native / Alaskan | 0 | 0.0% |
| White / Caucasian | 1,647 | 94.0% |
| Two or more Races | 62 | 3.5% |
| Some other Race | 12 | 0.7% |
| Total | 1,753 | 100.0% |
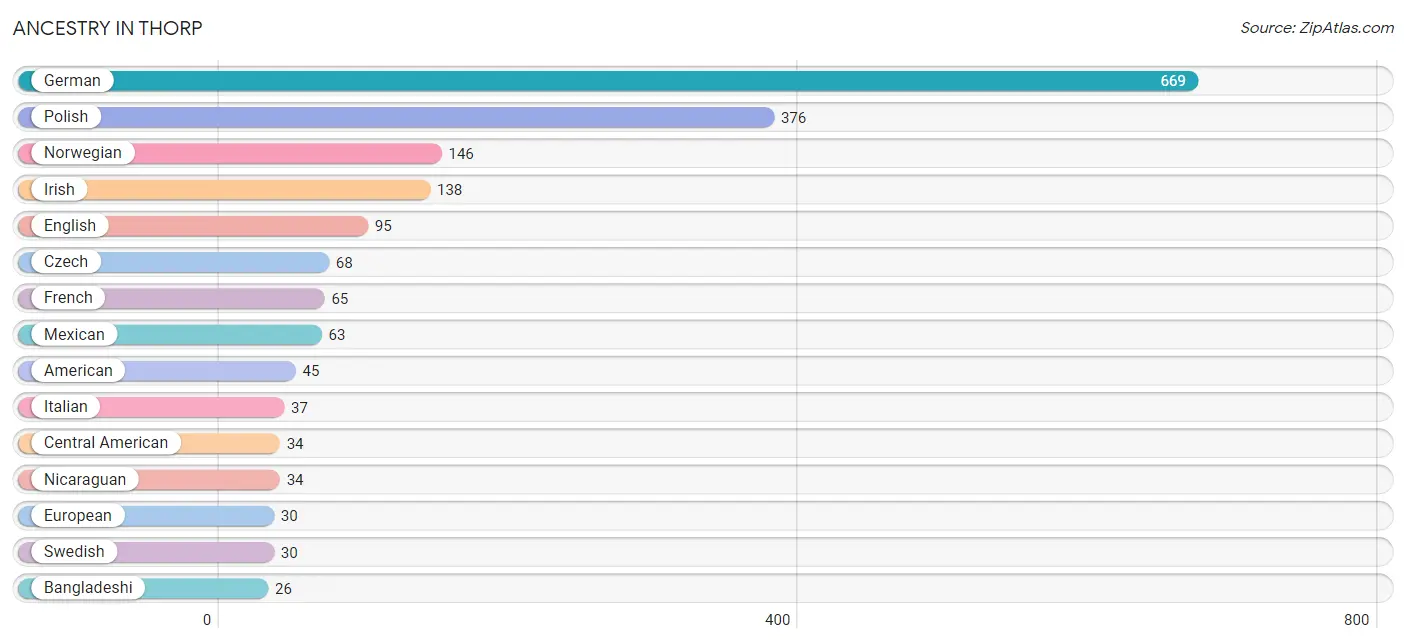
Ancestry in Thorp
The most populous ancestries reported in Thorp are German (669 | 38.2%), Polish (376 | 21.4%), Norwegian (146 | 8.3%), Irish (138 | 7.9%), and English (95 | 5.4%), together accounting for 81.2% of all Thorp residents.
| Ancestry | # Population | % Population |
| American | 45 | 2.6% |
| Arab | 2 | 0.1% |
| Austrian | 4 | 0.2% |
| Bangladeshi | 26 | 1.5% |
| Belgian | 5 | 0.3% |
| British | 3 | 0.2% |
| Cajun | 9 | 0.5% |
| Central American | 34 | 1.9% |
| Croatian | 23 | 1.3% |
| Czech | 68 | 3.9% |
| Danish | 3 | 0.2% |
| Dutch | 16 | 0.9% |
| Egyptian | 2 | 0.1% |
| English | 95 | 5.4% |
| European | 30 | 1.7% |
| French | 65 | 3.7% |
| French Canadian | 1 | 0.1% |
| German | 669 | 38.2% |
| Hungarian | 8 | 0.5% |
| Irish | 138 | 7.9% |
| Italian | 37 | 2.1% |
| Korean | 2 | 0.1% |
| Mexican | 63 | 3.6% |
| Nicaraguan | 34 | 1.9% |
| Norwegian | 146 | 8.3% |
| Polish | 376 | 21.4% |
| Puerto Rican | 3 | 0.2% |
| Russian | 3 | 0.2% |
| Scandinavian | 4 | 0.2% |
| Scotch-Irish | 2 | 0.1% |
| Slovak | 2 | 0.1% |
| Slovene | 8 | 0.5% |
| Spaniard | 1 | 0.1% |
| Swedish | 30 | 1.7% |
| Swiss | 8 | 0.5% |
| Ukrainian | 9 | 0.5% |
| Welsh | 1 | 0.1% | View All 37 Rows |
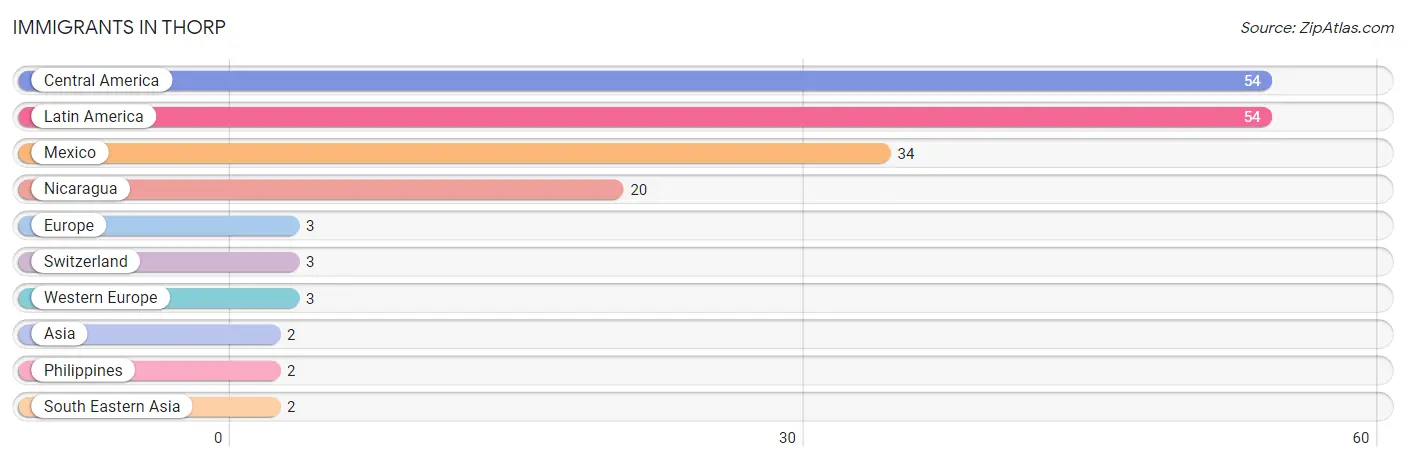
Immigrants in Thorp
The most numerous immigrant groups reported in Thorp came from Central America (54 | 3.1%), Latin America (54 | 3.1%), Mexico (34 | 1.9%), Nicaragua (20 | 1.1%), and Europe (3 | 0.2%), together accounting for 9.4% of all Thorp residents.
| Immigration Origin | # Population | % Population |
| Asia | 2 | 0.1% |
| Central America | 54 | 3.1% |
| Europe | 3 | 0.2% |
| Latin America | 54 | 3.1% |
| Mexico | 34 | 1.9% |
| Nicaragua | 20 | 1.1% |
| Philippines | 2 | 0.1% |
| South Eastern Asia | 2 | 0.1% |
| Switzerland | 3 | 0.2% |
| Western Europe | 3 | 0.2% | View All 10 Rows |
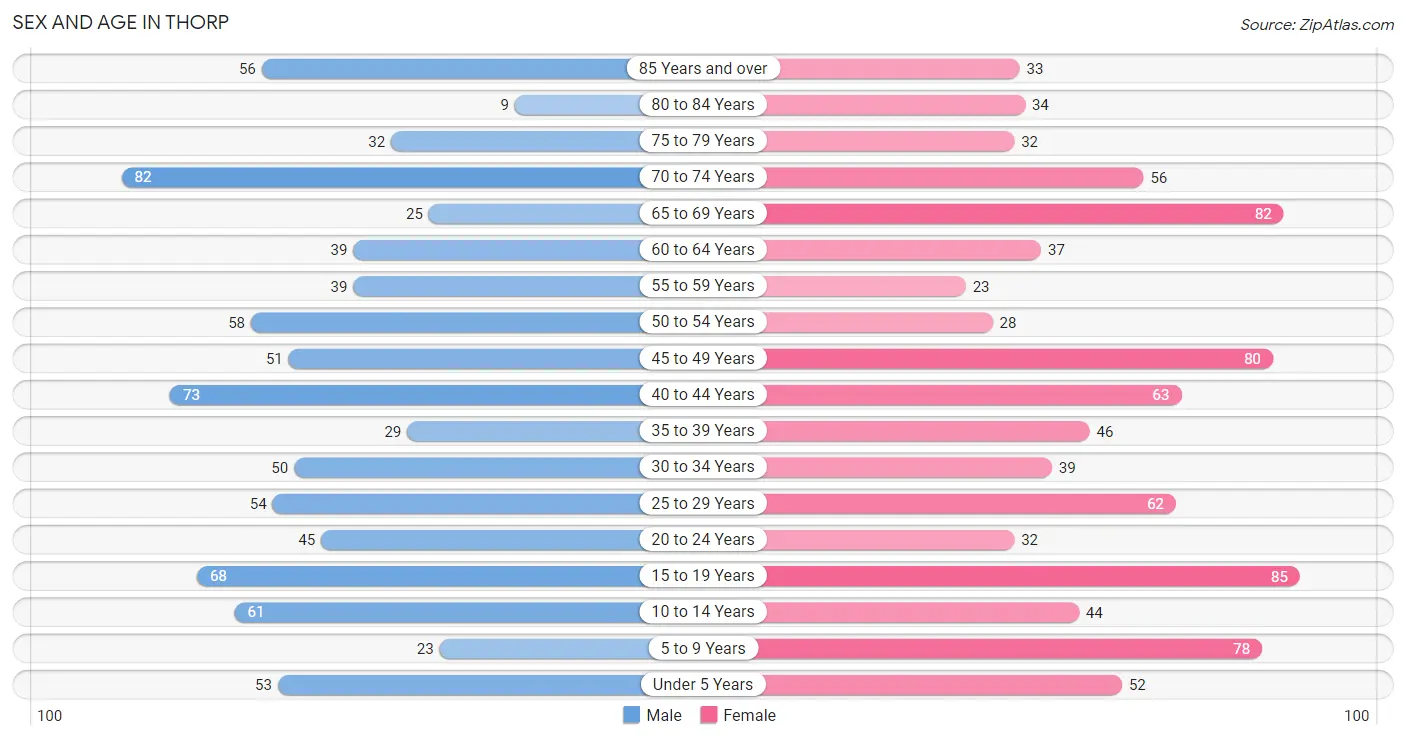
Sex and Age in Thorp
Sex and Age in Thorp
The most populous age groups in Thorp are 70 to 74 Years (82 | 9.7%) for men and 15 to 19 Years (85 | 9.4%) for women.
| Age Bracket | Male | Female |
| Under 5 Years | 53 (6.3%) | 52 (5.7%) |
| 5 to 9 Years | 23 (2.7%) | 78 (8.6%) |
| 10 to 14 Years | 61 (7.2%) | 44 (4.9%) |
| 15 to 19 Years | 68 (8.0%) | 85 (9.4%) |
| 20 to 24 Years | 45 (5.3%) | 32 (3.5%) |
| 25 to 29 Years | 54 (6.4%) | 62 (6.8%) |
| 30 to 34 Years | 50 (5.9%) | 39 (4.3%) |
| 35 to 39 Years | 29 (3.4%) | 46 (5.1%) |
| 40 to 44 Years | 73 (8.6%) | 63 (7.0%) |
| 45 to 49 Years | 51 (6.0%) | 80 (8.8%) |
| 50 to 54 Years | 58 (6.9%) | 28 (3.1%) |
| 55 to 59 Years | 39 (4.6%) | 23 (2.5%) |
| 60 to 64 Years | 39 (4.6%) | 37 (4.1%) |
| 65 to 69 Years | 25 (2.9%) | 82 (9.0%) |
| 70 to 74 Years | 82 (9.7%) | 56 (6.2%) |
| 75 to 79 Years | 32 (3.8%) | 32 (3.5%) |
| 80 to 84 Years | 9 (1.1%) | 34 (3.7%) |
| 85 Years and over | 56 (6.6%) | 33 (3.6%) |
| Total | 847 (100.0%) | 906 (100.0%) |
Families and Households in Thorp
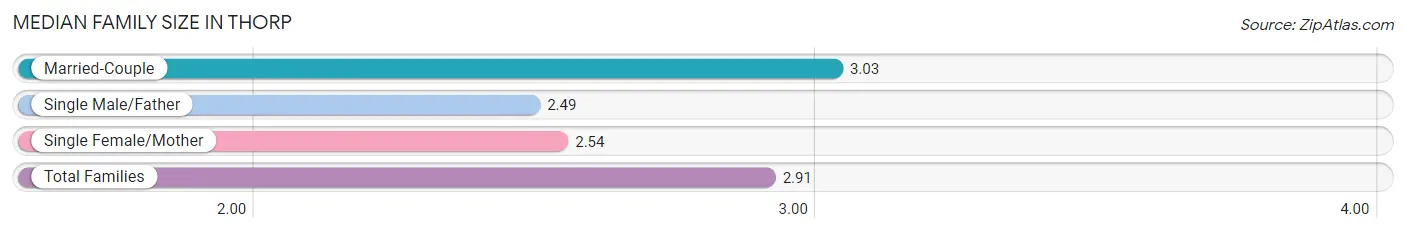
Median Family Size in Thorp
The median family size in Thorp is 2.91 persons per family, with married-couple families (356 | 75.3%) accounting for the largest median family size of 3.03 persons per family. On the other hand, single male/father families (49 | 10.4%) represent the smallest median family size with 2.49 persons per family.
| Family Type | # Families | Family Size |
| Married-Couple | 356 (75.3%) | 3.03 |
| Single Male/Father | 49 (10.4%) | 2.49 |
| Single Female/Mother | 68 (14.4%) | 2.54 |
| Total Families | 473 (100.0%) | 2.91 |
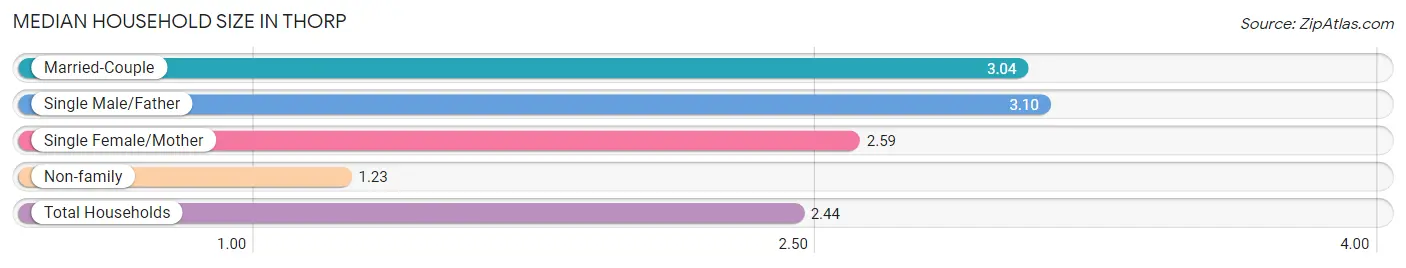
Median Household Size in Thorp
The median household size in Thorp is 2.44 persons per household, with single male/father households (49 | 7.1%) accounting for the largest median household size of 3.1 persons per household. non-family households (213 | 31.0%) represent the smallest median household size with 1.23 persons per household.
| Household Type | # Households | Household Size |
| Married-Couple | 356 (51.9%) | 3.04 |
| Single Male/Father | 49 (7.1%) | 3.10 |
| Single Female/Mother | 68 (9.9%) | 2.59 |
| Non-family | 213 (31.0%) | 1.23 |
| Total Households | 686 (100.0%) | 2.44 |
Household Size by Marriage Status in Thorp
Out of a total of 686 households in Thorp, 473 (69.0%) are family households, while 213 (31.0%) are nonfamily households. The most numerous type of family households are 2-person households, comprising 182, and the most common type of nonfamily households are 1-person households, comprising 195.
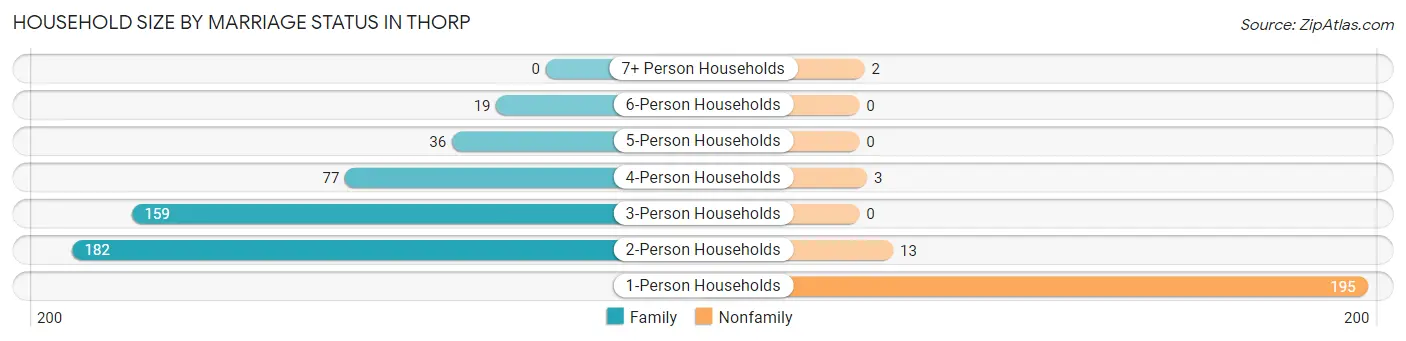
| Household Size | Family Households | Nonfamily Households |
| 1-Person Households | - | 195 (28.4%) |
| 2-Person Households | 182 (26.5%) | 13 (1.9%) |
| 3-Person Households | 159 (23.2%) | 0 (0.0%) |
| 4-Person Households | 77 (11.2%) | 3 (0.4%) |
| 5-Person Households | 36 (5.2%) | 0 (0.0%) |
| 6-Person Households | 19 (2.8%) | 0 (0.0%) |
| 7+ Person Households | 0 (0.0%) | 2 (0.3%) |
| Total | 473 (69.0%) | 213 (31.0%) |
Female Fertility in Thorp
Fertility by Age in Thorp
Average fertility rate in Thorp is 53.0 births per 1,000 women. Women in the age bracket of 20 to 34 years have the highest fertility rate with 120.0 births per 1,000 women. Women in the age bracket of 20 to 34 years acount for 72.7% of all women with births.
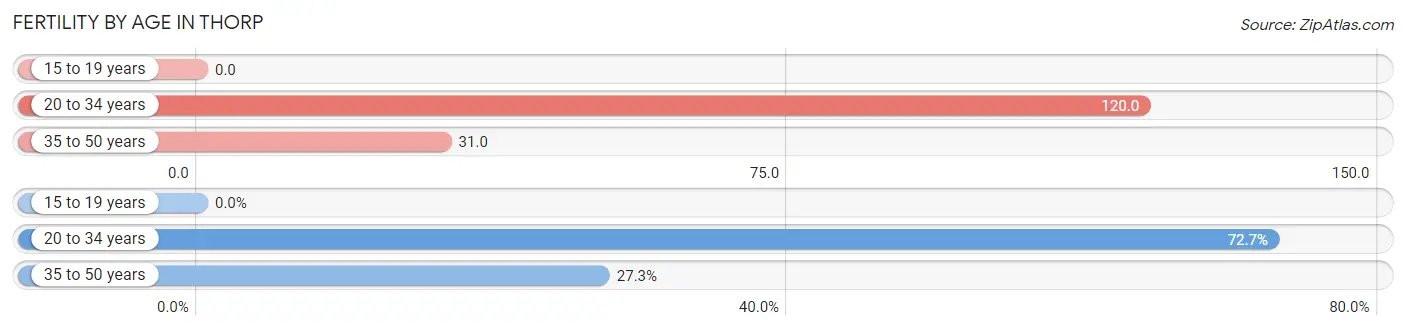
| Age Bracket | Women with Births | Births / 1,000 Women |
| 15 to 19 years | 0 (0.0%) | 0.0 |
| 20 to 34 years | 16 (72.7%) | 120.0 |
| 35 to 50 years | 6 (27.3%) | 31.0 |
| Total | 22 (100.0%) | 53.0 |
Fertility by Age by Marriage Status in Thorp
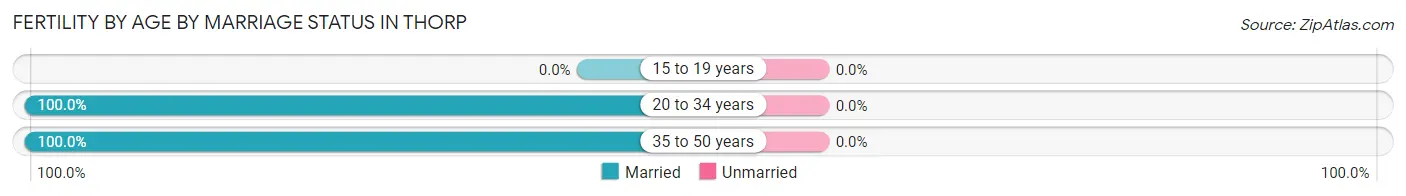
| Age Bracket | Married | Unmarried |
| 15 to 19 years | 0 (0.0%) | 0 (0.0%) |
| 20 to 34 years | 16 (100.0%) | 0 (0.0%) |
| 35 to 50 years | 6 (100.0%) | 0 (0.0%) |
| Total | 22 (100.0%) | 0 (0.0%) |
Fertility by Education in Thorp
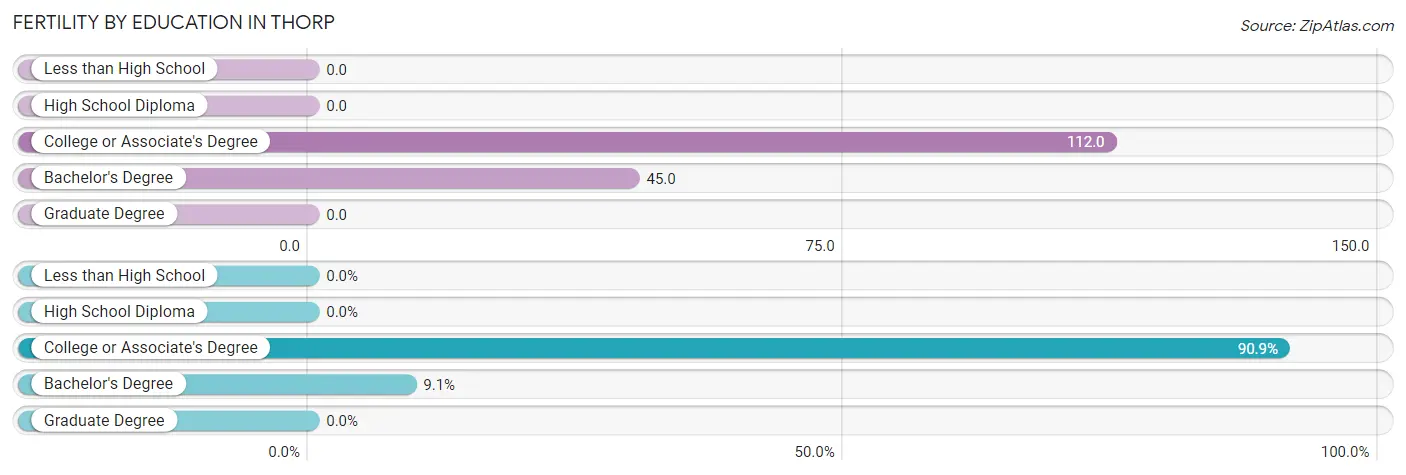
| Educational Attainment | Women with Births | Births / 1,000 Women |
| Less than High School | 0 (0.0%) | 0.0 |
| High School Diploma | 0 (0.0%) | 0.0 |
| College or Associate's Degree | 20 (90.9%) | 112.0 |
| Bachelor's Degree | 2 (9.1%) | 45.0 |
| Graduate Degree | 0 (0.0%) | 0.0 |
| Total | 22 (100.0%) | 53.0 |
Fertility by Education by Marriage Status in Thorp
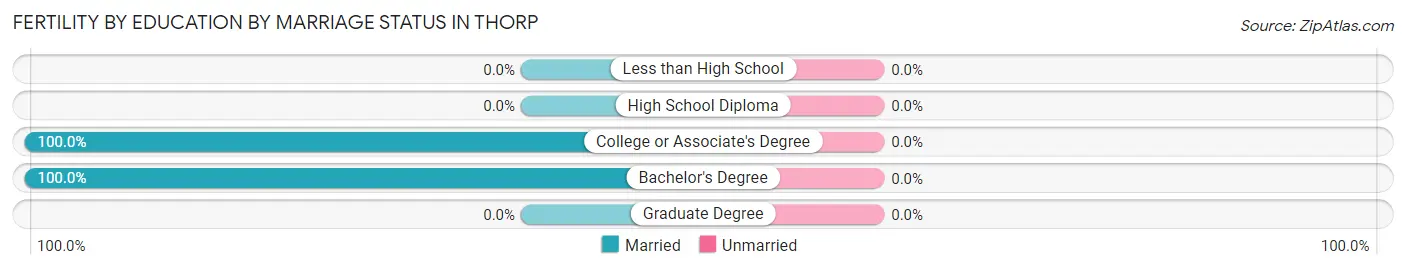
| Educational Attainment | Married | Unmarried |
| Less than High School | 0 (0.0%) | 0 (0.0%) |
| High School Diploma | 0 (0.0%) | 0 (0.0%) |
| College or Associate's Degree | 20 (100.0%) | 0 (0.0%) |
| Bachelor's Degree | 2 (100.0%) | 0 (0.0%) |
| Graduate Degree | 0 (0.0%) | 0 (0.0%) |
| Total | 22 (100.0%) | 0 (0.0%) |
Employment Characteristics in Thorp
Employment by Class of Employer in Thorp
Among the 729 employed individuals in Thorp, private company employees (486 | 66.7%), local government employees (75 | 10.3%), and not-for-profit organizations (57 | 7.8%) make up the most common classes of employment.
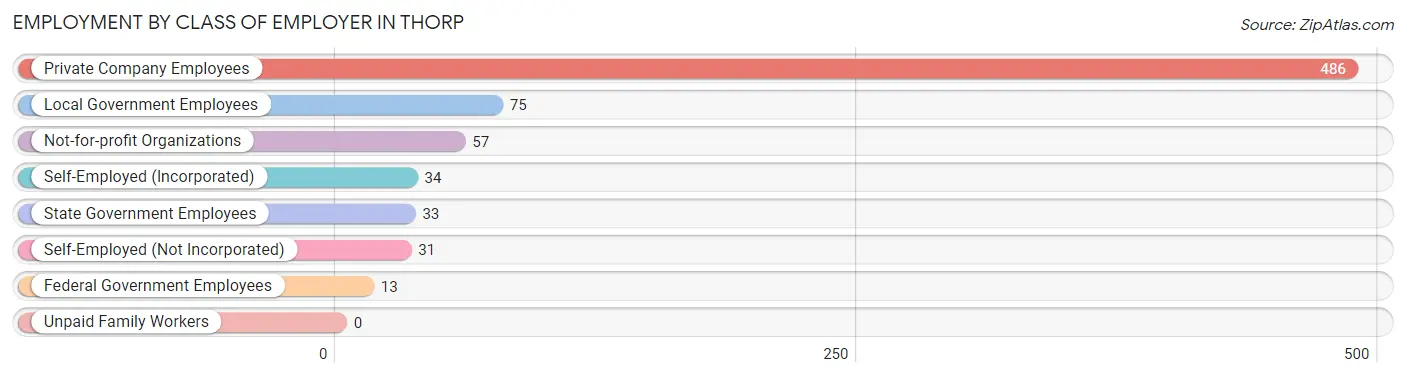
| Employer Class | # Employees | % Employees |
| Private Company Employees | 486 | 66.7% |
| Self-Employed (Incorporated) | 34 | 4.7% |
| Self-Employed (Not Incorporated) | 31 | 4.3% |
| Not-for-profit Organizations | 57 | 7.8% |
| Local Government Employees | 75 | 10.3% |
| State Government Employees | 33 | 4.5% |
| Federal Government Employees | 13 | 1.8% |
| Unpaid Family Workers | 0 | 0.0% |
| Total | 729 | 100.0% |
Employment Status by Age in Thorp
According to the labor force statistics for Thorp, out of the total population over 16 years of age (1,391), 55.3% or 769 individuals are in the labor force, with 2.7% or 21 of them unemployed. The age group with the highest labor force participation rate is 35 to 44 years, with 90.0% or 190 individuals in the labor force. Within the labor force, the 16 to 19 years age range has the highest percentage of unemployed individuals, with 27.8% or 10 of them being unemployed.
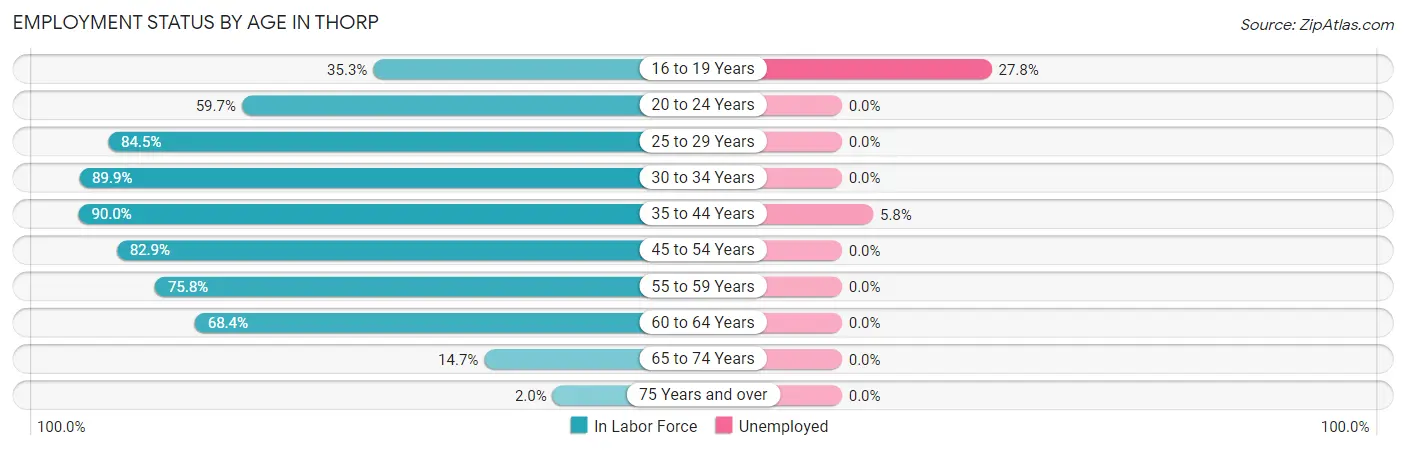
| Age Bracket | In Labor Force | Unemployed |
| 16 to 19 Years | 36 (35.3%) | 10 (27.8%) |
| 20 to 24 Years | 46 (59.7%) | 0 (0.0%) |
| 25 to 29 Years | 98 (84.5%) | 0 (0.0%) |
| 30 to 34 Years | 80 (89.9%) | 0 (0.0%) |
| 35 to 44 Years | 190 (90.0%) | 11 (5.8%) |
| 45 to 54 Years | 180 (82.9%) | 0 (0.0%) |
| 55 to 59 Years | 47 (75.8%) | 0 (0.0%) |
| 60 to 64 Years | 52 (68.4%) | 0 (0.0%) |
| 65 to 74 Years | 36 (14.7%) | 0 (0.0%) |
| 75 Years and over | 4 (2.0%) | 0 (0.0%) |
| Total | 769 (55.3%) | 21 (2.7%) |
Employment Status by Educational Attainment in Thorp
According to labor force statistics for Thorp, 83.9% of individuals (647) out of the total population between 25 and 64 years of age (771) are in the labor force, with 1.7% or 11 of them being unemployed. The group with the highest labor force participation rate are those with the educational attainment of bachelor's degree or higher, with 98.4% or 127 individuals in the labor force. Within the labor force, individuals with college / associate degree education have the highest percentage of unemployment, with 2.7% or 7 of them being unemployed.
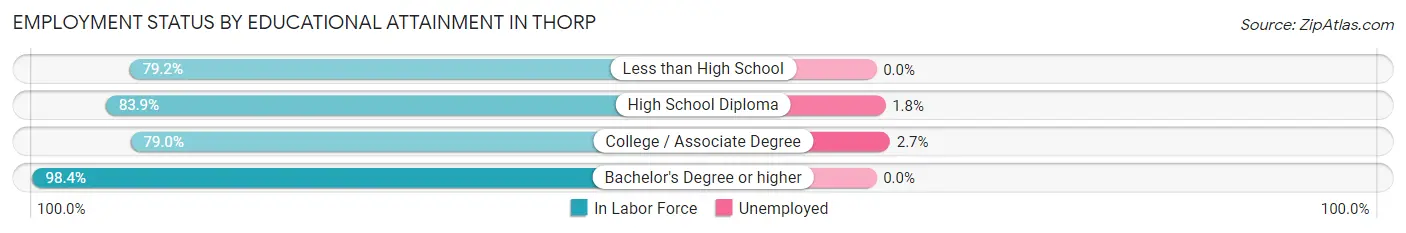
| Educational Attainment | In Labor Force | Unemployed |
| Less than High School | 42 (79.2%) | 0 (0.0%) |
| High School Diploma | 219 (83.9%) | 5 (1.8%) |
| College / Associate Degree | 259 (79.0%) | 9 (2.7%) |
| Bachelor's Degree or higher | 127 (98.4%) | 0 (0.0%) |
| Total | 647 (83.9%) | 13 (1.7%) |
Employment Occupations by Sex in Thorp
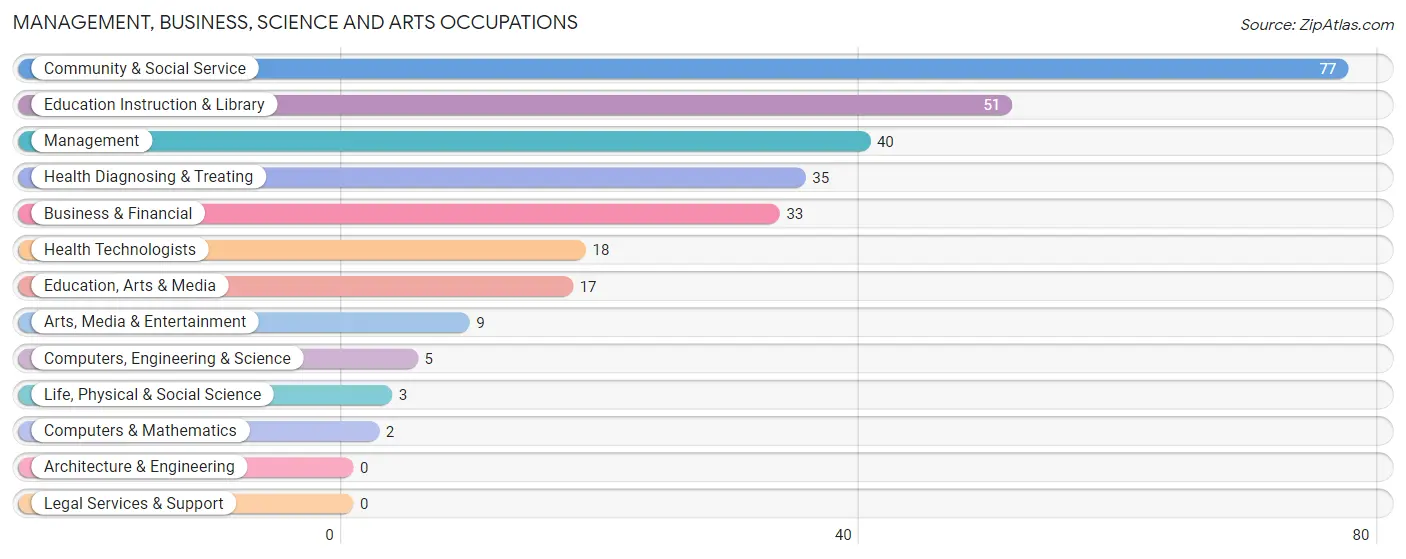
Management, Business, Science and Arts Occupations
The most common Management, Business, Science and Arts occupations in Thorp are Community & Social Service (77 | 10.3%), Education Instruction & Library (51 | 6.8%), Management (40 | 5.3%), Health Diagnosing & Treating (35 | 4.7%), and Business & Financial (33 | 4.4%).
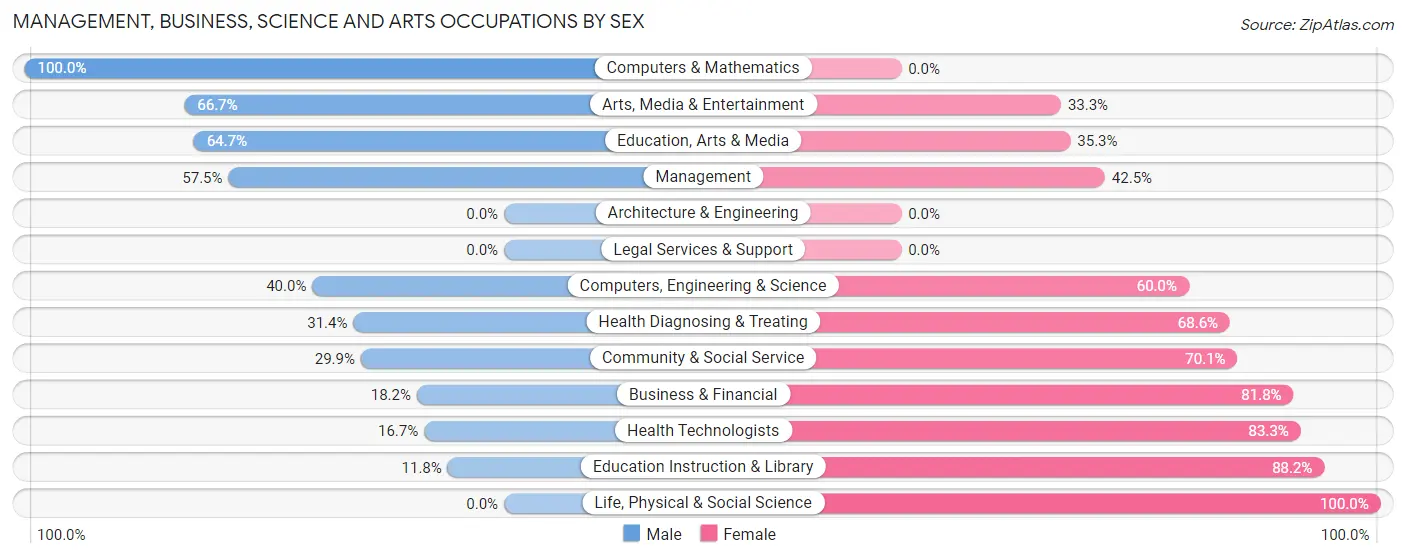
Management, Business, Science and Arts Occupations by Sex
Within the Management, Business, Science and Arts occupations in Thorp, the most male-oriented occupations are Computers & Mathematics (100.0%), Arts, Media & Entertainment (66.7%), and Education, Arts & Media (64.7%), while the most female-oriented occupations are Life, Physical & Social Science (100.0%), Education Instruction & Library (88.2%), and Health Technologists (83.3%).
| Occupation | Male | Female |
| Management | 23 (57.5%) | 17 (42.5%) |
| Business & Financial | 6 (18.2%) | 27 (81.8%) |
| Computers, Engineering & Science | 2 (40.0%) | 3 (60.0%) |
| Computers & Mathematics | 2 (100.0%) | 0 (0.0%) |
| Architecture & Engineering | 0 (0.0%) | 0 (0.0%) |
| Life, Physical & Social Science | 0 (0.0%) | 3 (100.0%) |
| Community & Social Service | 23 (29.9%) | 54 (70.1%) |
| Education, Arts & Media | 11 (64.7%) | 6 (35.3%) |
| Legal Services & Support | 0 (0.0%) | 0 (0.0%) |
| Education Instruction & Library | 6 (11.8%) | 45 (88.2%) |
| Arts, Media & Entertainment | 6 (66.7%) | 3 (33.3%) |
| Health Diagnosing & Treating | 11 (31.4%) | 24 (68.6%) |
| Health Technologists | 3 (16.7%) | 15 (83.3%) |
| Total (Category) | 65 (34.2%) | 125 (65.8%) |
| Total (Overall) | 383 (51.2%) | 365 (48.8%) |
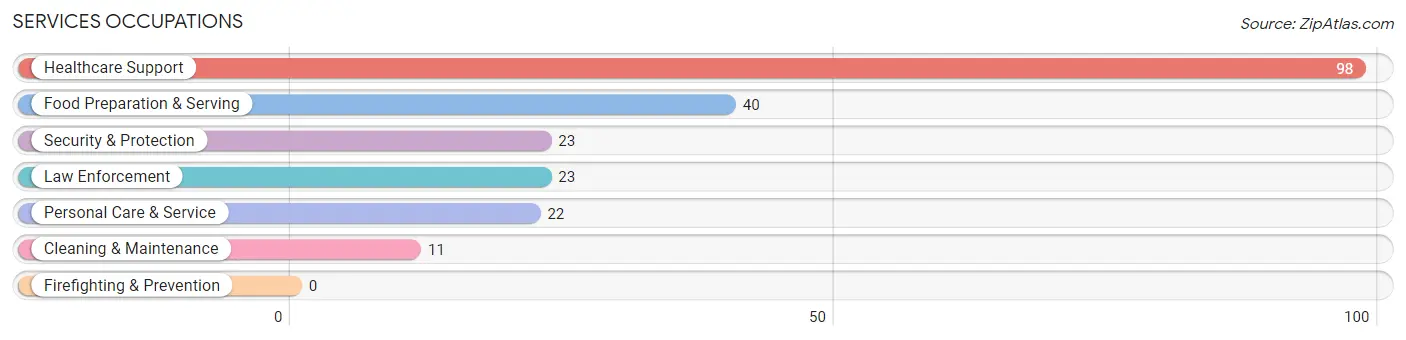
Services Occupations
The most common Services occupations in Thorp are Healthcare Support (98 | 13.1%), Food Preparation & Serving (40 | 5.3%), Security & Protection (23 | 3.1%), Law Enforcement (23 | 3.1%), and Personal Care & Service (22 | 2.9%).
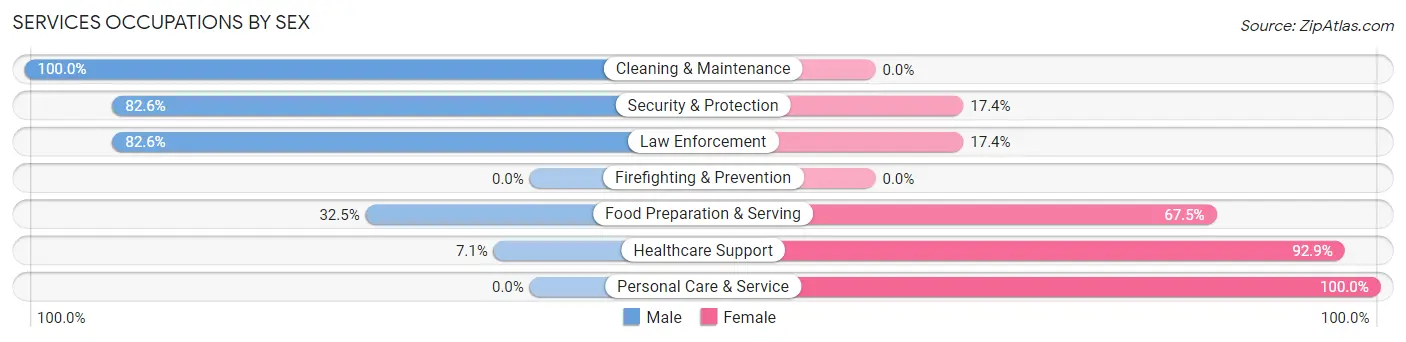
Services Occupations by Sex
Within the Services occupations in Thorp, the most male-oriented occupations are Cleaning & Maintenance (100.0%), Security & Protection (82.6%), and Law Enforcement (82.6%), while the most female-oriented occupations are Personal Care & Service (100.0%), Healthcare Support (92.9%), and Food Preparation & Serving (67.5%).
| Occupation | Male | Female |
| Healthcare Support | 7 (7.1%) | 91 (92.9%) |
| Security & Protection | 19 (82.6%) | 4 (17.4%) |
| Firefighting & Prevention | 0 (0.0%) | 0 (0.0%) |
| Law Enforcement | 19 (82.6%) | 4 (17.4%) |
| Food Preparation & Serving | 13 (32.5%) | 27 (67.5%) |
| Cleaning & Maintenance | 11 (100.0%) | 0 (0.0%) |
| Personal Care & Service | 0 (0.0%) | 22 (100.0%) |
| Total (Category) | 50 (25.8%) | 144 (74.2%) |
| Total (Overall) | 383 (51.2%) | 365 (48.8%) |
Sales and Office Occupations
The most common Sales and Office occupations in Thorp are Office & Administration (95 | 12.7%), and Sales & Related (23 | 3.1%).
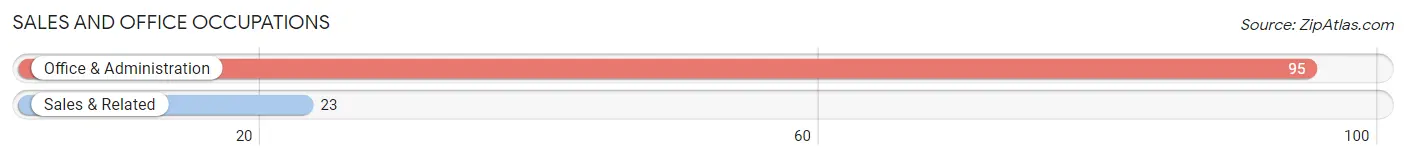
Sales and Office Occupations by Sex
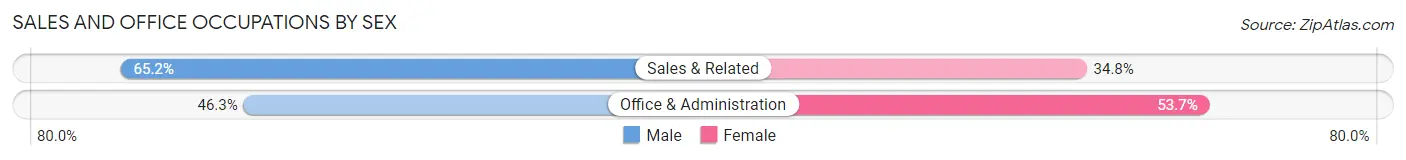
| Occupation | Male | Female |
| Sales & Related | 15 (65.2%) | 8 (34.8%) |
| Office & Administration | 44 (46.3%) | 51 (53.7%) |
| Total (Category) | 59 (50.0%) | 59 (50.0%) |
| Total (Overall) | 383 (51.2%) | 365 (48.8%) |
Natural Resources, Construction and Maintenance Occupations
The most common Natural Resources, Construction and Maintenance occupations in Thorp are Construction & Extraction (44 | 5.9%), Installation, Maintenance & Repair (21 | 2.8%), and Farming, Fishing & Forestry (10 | 1.3%).
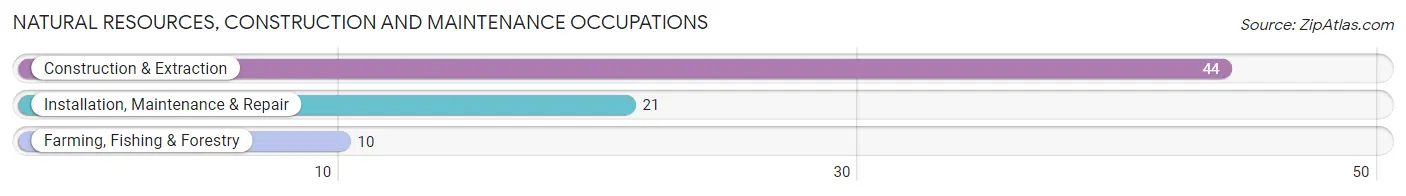
Natural Resources, Construction and Maintenance Occupations by Sex
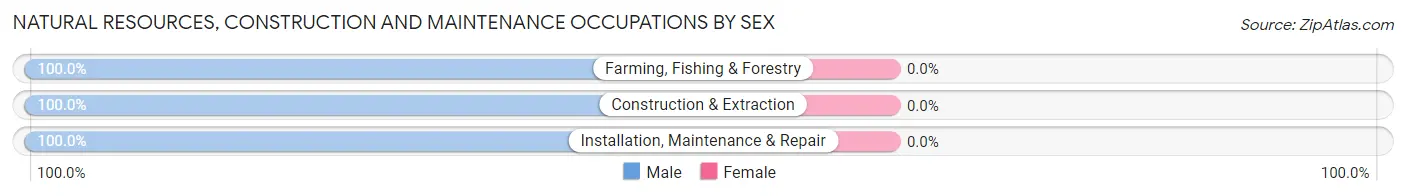
| Occupation | Male | Female |
| Farming, Fishing & Forestry | 10 (100.0%) | 0 (0.0%) |
| Construction & Extraction | 44 (100.0%) | 0 (0.0%) |
| Installation, Maintenance & Repair | 21 (100.0%) | 0 (0.0%) |
| Total (Category) | 75 (100.0%) | 0 (0.0%) |
| Total (Overall) | 383 (51.2%) | 365 (48.8%) |
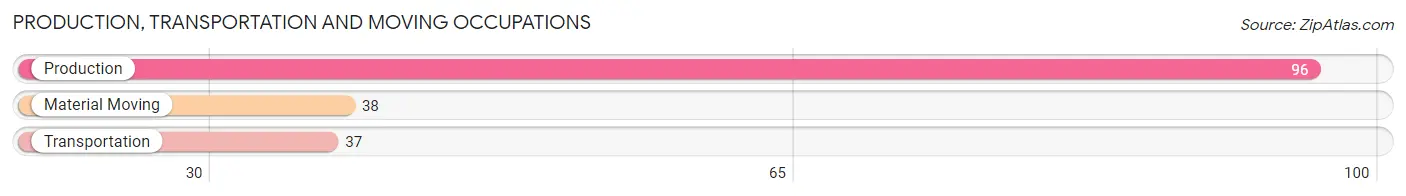
Production, Transportation and Moving Occupations
The most common Production, Transportation and Moving occupations in Thorp are Production (96 | 12.8%), Material Moving (38 | 5.1%), and Transportation (37 | 5.0%).
Production, Transportation and Moving Occupations by Sex
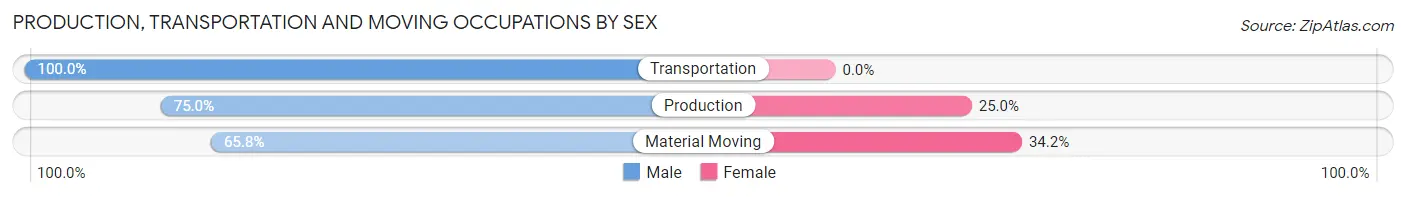
| Occupation | Male | Female |
| Production | 72 (75.0%) | 24 (25.0%) |
| Transportation | 37 (100.0%) | 0 (0.0%) |
| Material Moving | 25 (65.8%) | 13 (34.2%) |
| Total (Category) | 134 (78.4%) | 37 (21.6%) |
| Total (Overall) | 383 (51.2%) | 365 (48.8%) |
Employment Industries by Sex in Thorp
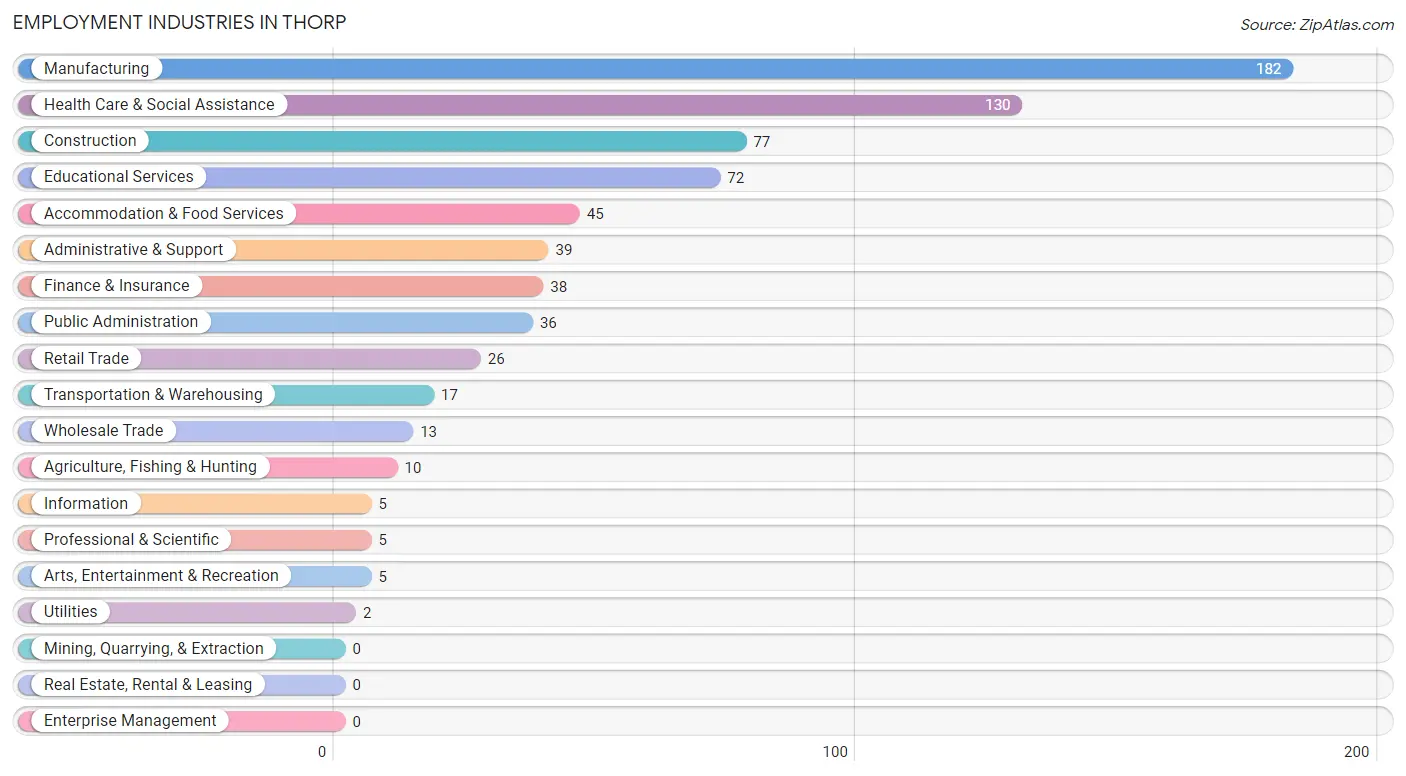
Employment Industries in Thorp
The major employment industries in Thorp include Manufacturing (182 | 24.3%), Health Care & Social Assistance (130 | 17.4%), Construction (77 | 10.3%), Educational Services (72 | 9.6%), and Accommodation & Food Services (45 | 6.0%).
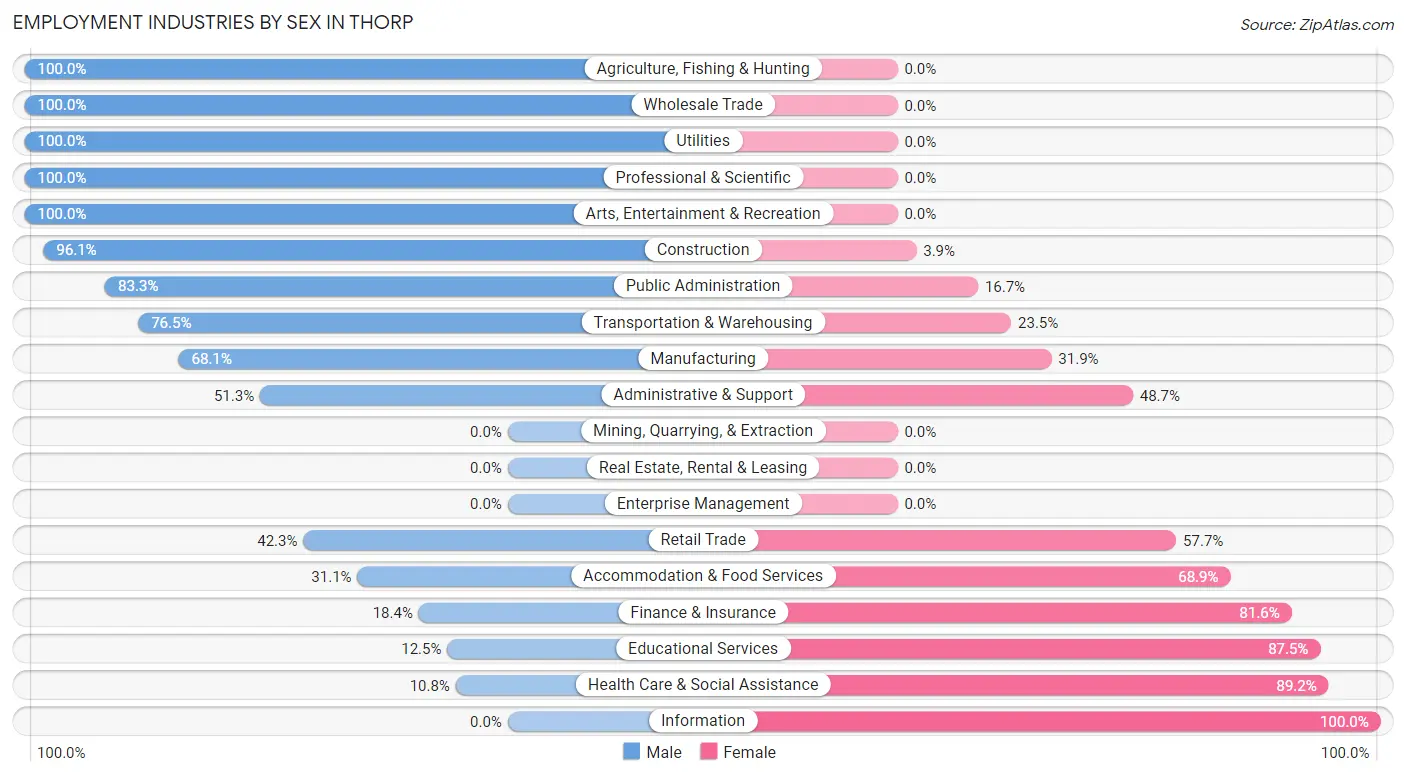
Employment Industries by Sex in Thorp
The Thorp industries that see more men than women are Agriculture, Fishing & Hunting (100.0%), Wholesale Trade (100.0%), and Utilities (100.0%), whereas the industries that tend to have a higher number of women are Information (100.0%), Health Care & Social Assistance (89.2%), and Educational Services (87.5%).
| Industry | Male | Female |
| Agriculture, Fishing & Hunting | 10 (100.0%) | 0 (0.0%) |
| Mining, Quarrying, & Extraction | 0 (0.0%) | 0 (0.0%) |
| Construction | 74 (96.1%) | 3 (3.9%) |
| Manufacturing | 124 (68.1%) | 58 (31.9%) |
| Wholesale Trade | 13 (100.0%) | 0 (0.0%) |
| Retail Trade | 11 (42.3%) | 15 (57.7%) |
| Transportation & Warehousing | 13 (76.5%) | 4 (23.5%) |
| Utilities | 2 (100.0%) | 0 (0.0%) |
| Information | 0 (0.0%) | 5 (100.0%) |
| Finance & Insurance | 7 (18.4%) | 31 (81.6%) |
| Real Estate, Rental & Leasing | 0 (0.0%) | 0 (0.0%) |
| Professional & Scientific | 5 (100.0%) | 0 (0.0%) |
| Enterprise Management | 0 (0.0%) | 0 (0.0%) |
| Administrative & Support | 20 (51.3%) | 19 (48.7%) |
| Educational Services | 9 (12.5%) | 63 (87.5%) |
| Health Care & Social Assistance | 14 (10.8%) | 116 (89.2%) |
| Arts, Entertainment & Recreation | 5 (100.0%) | 0 (0.0%) |
| Accommodation & Food Services | 14 (31.1%) | 31 (68.9%) |
| Public Administration | 30 (83.3%) | 6 (16.7%) |
| Total | 383 (51.2%) | 365 (48.8%) |
Education in Thorp
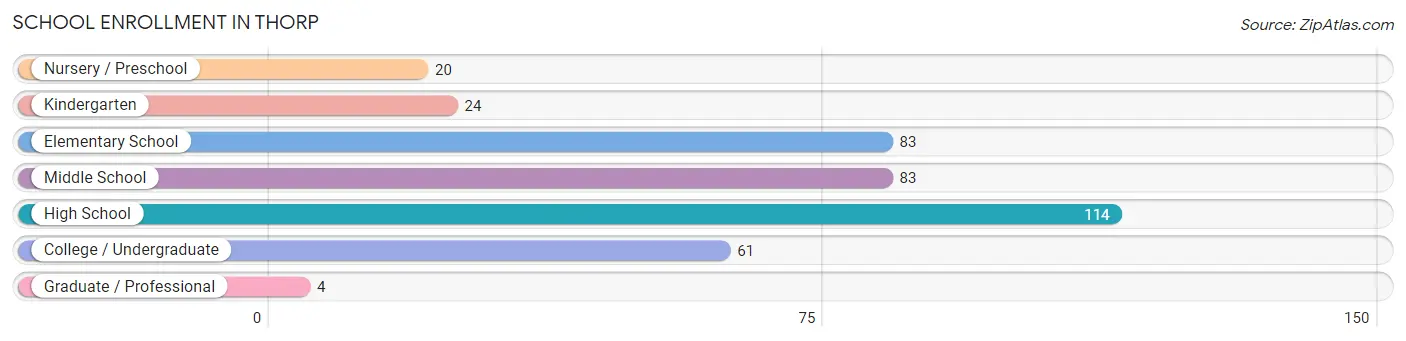
School Enrollment in Thorp
The most common levels of schooling among the 389 students in Thorp are high school (114 | 29.3%), elementary school (83 | 21.3%), and middle school (83 | 21.3%).
| School Level | # Students | % Students |
| Nursery / Preschool | 20 | 5.1% |
| Kindergarten | 24 | 6.2% |
| Elementary School | 83 | 21.3% |
| Middle School | 83 | 21.3% |
| High School | 114 | 29.3% |
| College / Undergraduate | 61 | 15.7% |
| Graduate / Professional | 4 | 1.0% |
| Total | 389 | 100.0% |
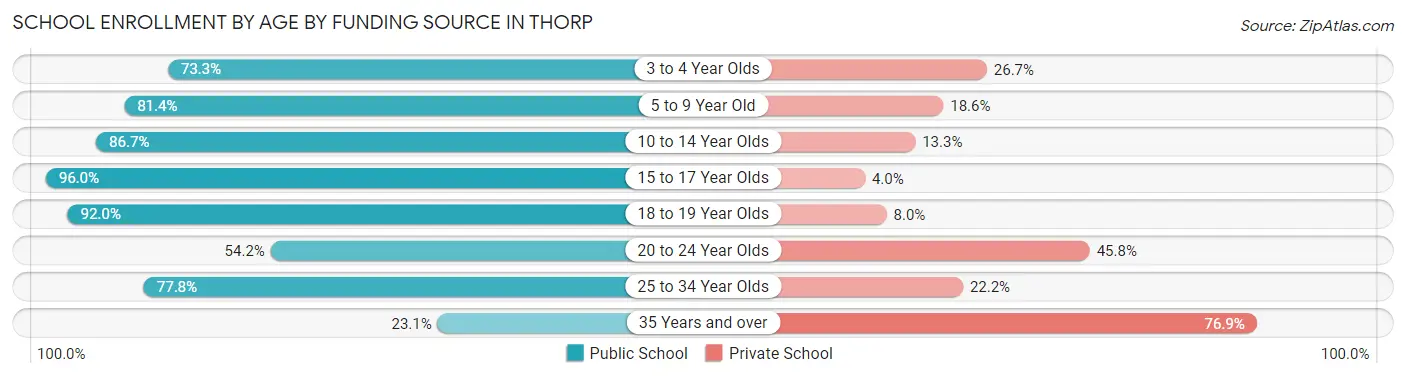
School Enrollment by Age by Funding Source in Thorp
Out of a total of 389 students who are enrolled in schools in Thorp, 65 (16.7%) attend a private institution, while the remaining 324 (83.3%) are enrolled in public schools. The age group of 35 years and over has the highest likelihood of being enrolled in private schools, with 10 (76.9% in the age bracket) enrolled. Conversely, the age group of 15 to 17 year olds has the lowest likelihood of being enrolled in a private school, with 97 (96.0% in the age bracket) attending a public institution.
| Age Bracket | Public School | Private School |
| 3 to 4 Year Olds | 11 (73.3%) | 4 (26.7%) |
| 5 to 9 Year Old | 79 (81.4%) | 18 (18.6%) |
| 10 to 14 Year Olds | 91 (86.7%) | 14 (13.3%) |
| 15 to 17 Year Olds | 97 (96.0%) | 4 (4.0%) |
| 18 to 19 Year Olds | 23 (92.0%) | 2 (8.0%) |
| 20 to 24 Year Olds | 13 (54.2%) | 11 (45.8%) |
| 25 to 34 Year Olds | 7 (77.8%) | 2 (22.2%) |
| 35 Years and over | 3 (23.1%) | 10 (76.9%) |
| Total | 324 (83.3%) | 65 (16.7%) |
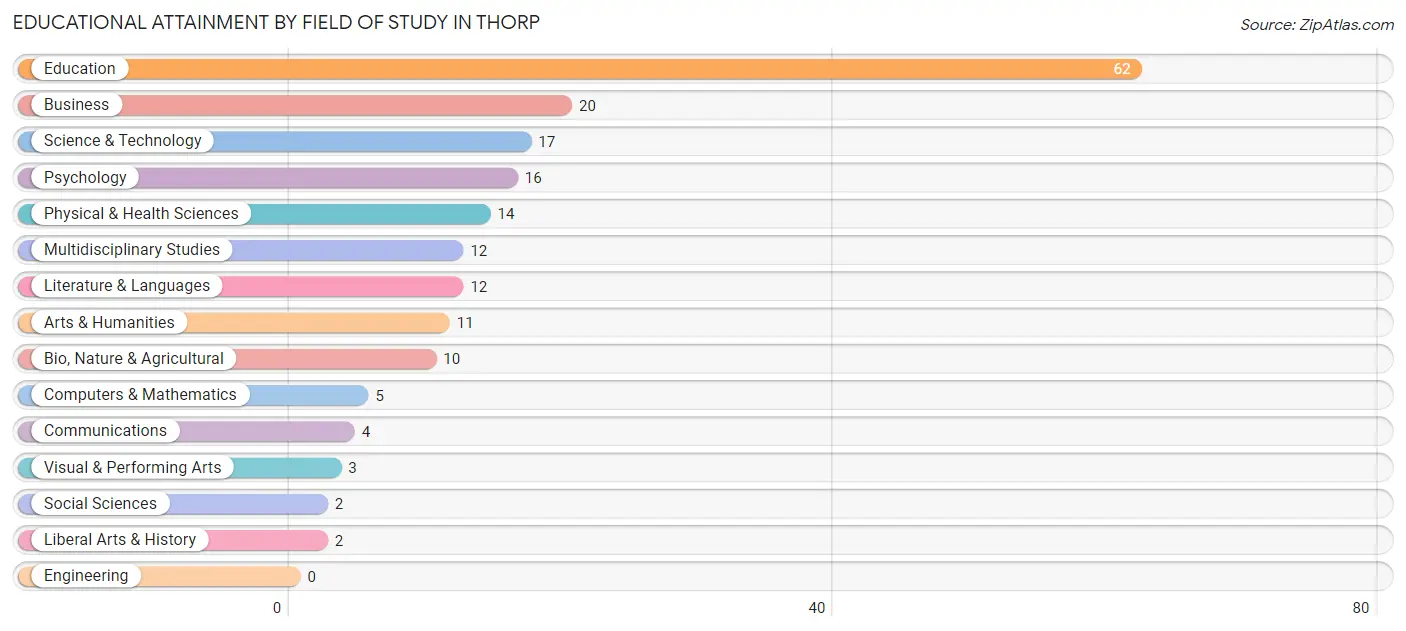
Educational Attainment by Field of Study in Thorp
Education (62 | 32.6%), business (20 | 10.5%), science & technology (17 | 8.9%), psychology (16 | 8.4%), and physical & health sciences (14 | 7.4%) are the most common fields of study among 190 individuals in Thorp who have obtained a bachelor's degree or higher.
| Field of Study | # Graduates | % Graduates |
| Computers & Mathematics | 5 | 2.6% |
| Bio, Nature & Agricultural | 10 | 5.3% |
| Physical & Health Sciences | 14 | 7.4% |
| Psychology | 16 | 8.4% |
| Social Sciences | 2 | 1.1% |
| Engineering | 0 | 0.0% |
| Multidisciplinary Studies | 12 | 6.3% |
| Science & Technology | 17 | 8.9% |
| Business | 20 | 10.5% |
| Education | 62 | 32.6% |
| Literature & Languages | 12 | 6.3% |
| Liberal Arts & History | 2 | 1.1% |
| Visual & Performing Arts | 3 | 1.6% |
| Communications | 4 | 2.1% |
| Arts & Humanities | 11 | 5.8% |
| Total | 190 | 100.0% |
Transportation & Commute in Thorp
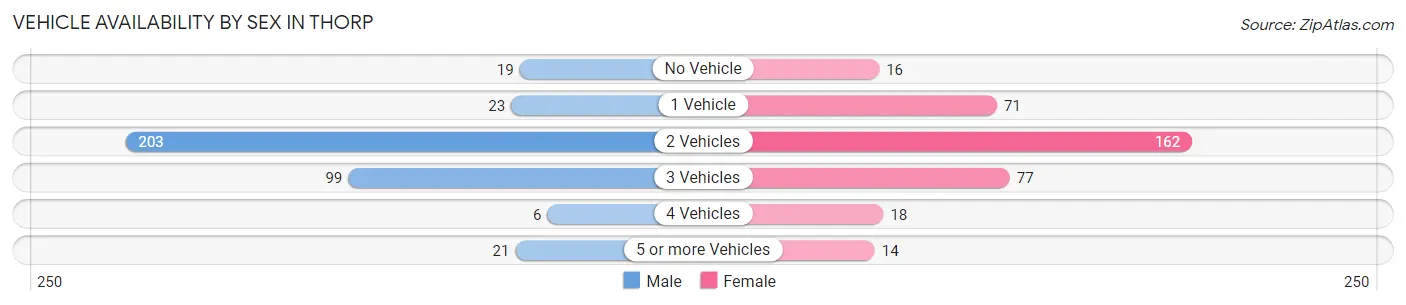
Vehicle Availability by Sex in Thorp
The most prevalent vehicle ownership categories in Thorp are males with 2 vehicles (203, accounting for 54.7%) and females with 2 vehicles (162, making up 56.7%).
| Vehicles Available | Male | Female |
| No Vehicle | 19 (5.1%) | 16 (4.5%) |
| 1 Vehicle | 23 (6.2%) | 71 (19.8%) |
| 2 Vehicles | 203 (54.7%) | 162 (45.3%) |
| 3 Vehicles | 99 (26.7%) | 77 (21.5%) |
| 4 Vehicles | 6 (1.6%) | 18 (5.0%) |
| 5 or more Vehicles | 21 (5.7%) | 14 (3.9%) |
| Total | 371 (100.0%) | 358 (100.0%) |
Commute Time in Thorp
The most frequently occuring commute durations in Thorp are less than 5 minutes (140 commuters, 20.1%), 5 to 9 minutes (131 commuters, 18.8%), and 15 to 19 minutes (117 commuters, 16.8%).
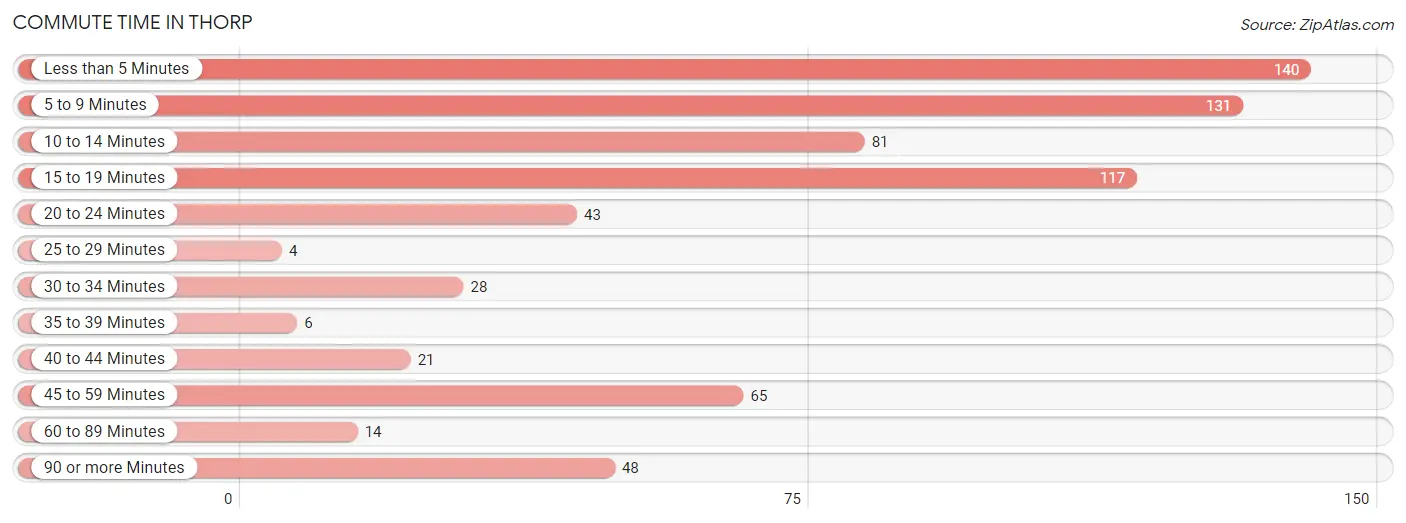
| Commute Time | # Commuters | % Commuters |
| Less than 5 Minutes | 140 | 20.1% |
| 5 to 9 Minutes | 131 | 18.8% |
| 10 to 14 Minutes | 81 | 11.6% |
| 15 to 19 Minutes | 117 | 16.8% |
| 20 to 24 Minutes | 43 | 6.2% |
| 25 to 29 Minutes | 4 | 0.6% |
| 30 to 34 Minutes | 28 | 4.0% |
| 35 to 39 Minutes | 6 | 0.9% |
| 40 to 44 Minutes | 21 | 3.0% |
| 45 to 59 Minutes | 65 | 9.3% |
| 60 to 89 Minutes | 14 | 2.0% |
| 90 or more Minutes | 48 | 6.9% |
Commute Time by Sex in Thorp
The most common commute times in Thorp are less than 5 minutes (83 commuters, 22.9%) for males and 5 to 9 minutes (69 commuters, 20.5%) for females.
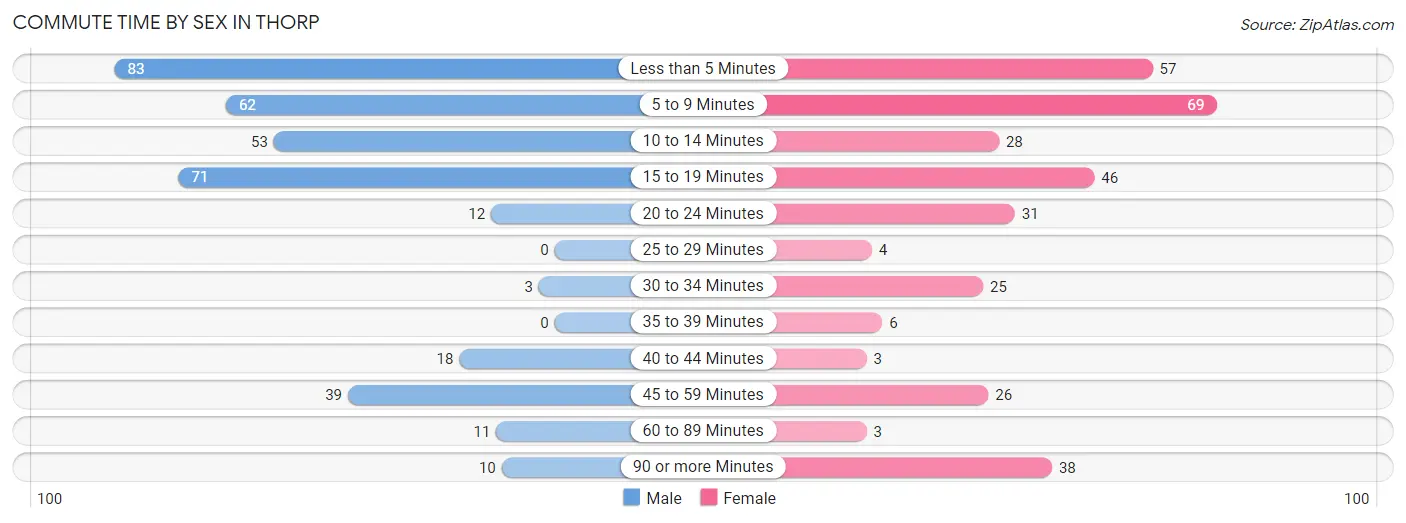
| Commute Time | Male | Female |
| Less than 5 Minutes | 83 (22.9%) | 57 (17.0%) |
| 5 to 9 Minutes | 62 (17.1%) | 69 (20.5%) |
| 10 to 14 Minutes | 53 (14.6%) | 28 (8.3%) |
| 15 to 19 Minutes | 71 (19.6%) | 46 (13.7%) |
| 20 to 24 Minutes | 12 (3.3%) | 31 (9.2%) |
| 25 to 29 Minutes | 0 (0.0%) | 4 (1.2%) |
| 30 to 34 Minutes | 3 (0.8%) | 25 (7.4%) |
| 35 to 39 Minutes | 0 (0.0%) | 6 (1.8%) |
| 40 to 44 Minutes | 18 (5.0%) | 3 (0.9%) |
| 45 to 59 Minutes | 39 (10.8%) | 26 (7.7%) |
| 60 to 89 Minutes | 11 (3.0%) | 3 (0.9%) |
| 90 or more Minutes | 10 (2.8%) | 38 (11.3%) |
Time of Departure to Work by Sex in Thorp
The most frequent times of departure to work in Thorp are 12:00 AM to 4:59 AM (58, 16.0%) for males and 7:30 AM to 7:59 AM (68, 20.2%) for females.
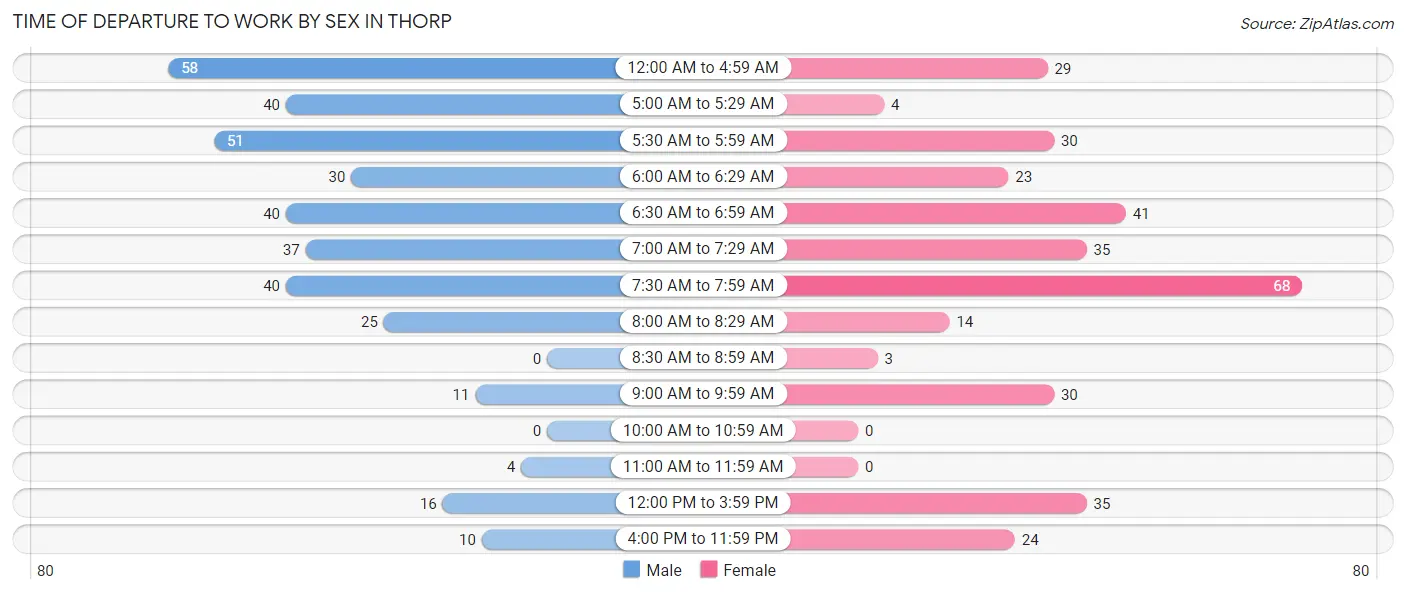
| Time of Departure | Male | Female |
| 12:00 AM to 4:59 AM | 58 (16.0%) | 29 (8.6%) |
| 5:00 AM to 5:29 AM | 40 (11.1%) | 4 (1.2%) |
| 5:30 AM to 5:59 AM | 51 (14.1%) | 30 (8.9%) |
| 6:00 AM to 6:29 AM | 30 (8.3%) | 23 (6.9%) |
| 6:30 AM to 6:59 AM | 40 (11.1%) | 41 (12.2%) |
| 7:00 AM to 7:29 AM | 37 (10.2%) | 35 (10.4%) |
| 7:30 AM to 7:59 AM | 40 (11.1%) | 68 (20.2%) |
| 8:00 AM to 8:29 AM | 25 (6.9%) | 14 (4.2%) |
| 8:30 AM to 8:59 AM | 0 (0.0%) | 3 (0.9%) |
| 9:00 AM to 9:59 AM | 11 (3.0%) | 30 (8.9%) |
| 10:00 AM to 10:59 AM | 0 (0.0%) | 0 (0.0%) |
| 11:00 AM to 11:59 AM | 4 (1.1%) | 0 (0.0%) |
| 12:00 PM to 3:59 PM | 16 (4.4%) | 35 (10.4%) |
| 4:00 PM to 11:59 PM | 10 (2.8%) | 24 (7.1%) |
| Total | 362 (100.0%) | 336 (100.0%) |
Housing Occupancy in Thorp
Occupancy by Ownership in Thorp
Of the total 686 dwellings in Thorp, owner-occupied units account for 476 (69.4%), while renter-occupied units make up 210 (30.6%).
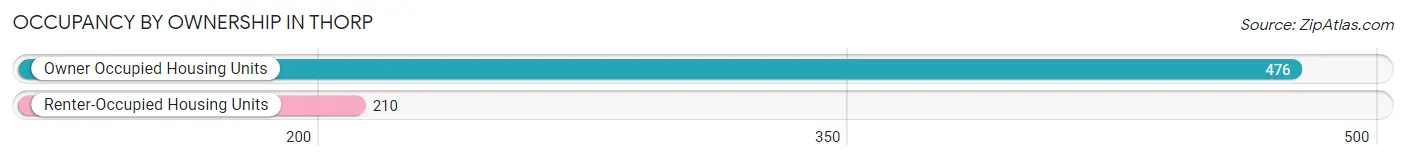
| Occupancy | # Housing Units | % Housing Units |
| Owner Occupied Housing Units | 476 | 69.4% |
| Renter-Occupied Housing Units | 210 | 30.6% |
| Total Occupied Housing Units | 686 | 100.0% |
Occupancy by Household Size in Thorp
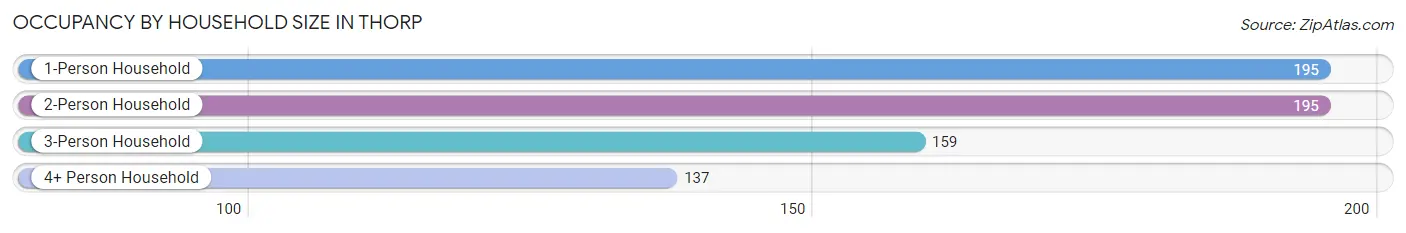
| Household Size | # Housing Units | % Housing Units |
| 1-Person Household | 195 | 28.4% |
| 2-Person Household | 195 | 28.4% |
| 3-Person Household | 159 | 23.2% |
| 4+ Person Household | 137 | 20.0% |
| Total Housing Units | 686 | 100.0% |
Occupancy by Ownership by Household Size in Thorp
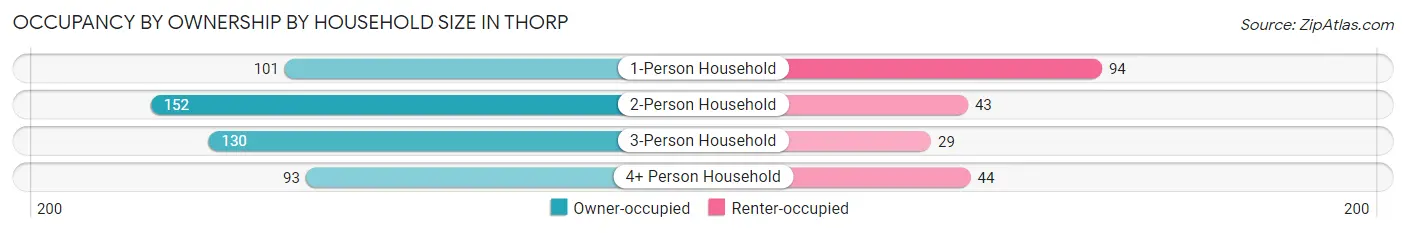
| Household Size | Owner-occupied | Renter-occupied |
| 1-Person Household | 101 (51.8%) | 94 (48.2%) |
| 2-Person Household | 152 (77.9%) | 43 (22.1%) |
| 3-Person Household | 130 (81.8%) | 29 (18.2%) |
| 4+ Person Household | 93 (67.9%) | 44 (32.1%) |
| Total Housing Units | 476 (69.4%) | 210 (30.6%) |
Occupancy by Educational Attainment in Thorp
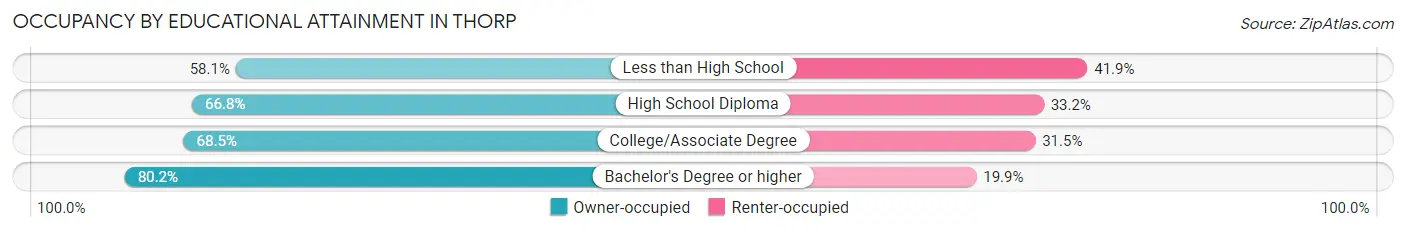
| Household Size | Owner-occupied | Renter-occupied |
| Less than High School | 25 (58.1%) | 18 (41.9%) |
| High School Diploma | 181 (66.8%) | 90 (33.2%) |
| College/Associate Degree | 165 (68.5%) | 76 (31.5%) |
| Bachelor's Degree or higher | 105 (80.1%) | 26 (19.9%) |
Occupancy by Age of Householder in Thorp
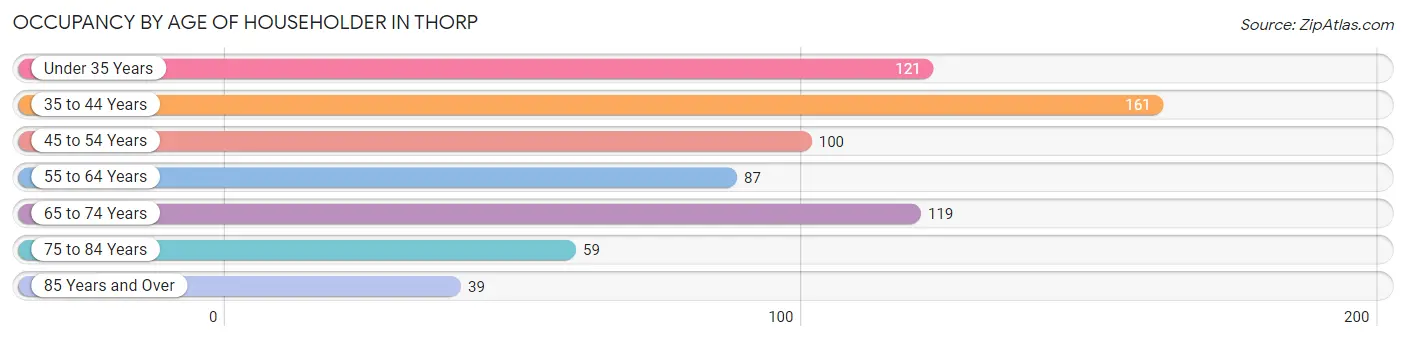
| Age Bracket | # Households | % Households |
| Under 35 Years | 121 | 17.6% |
| 35 to 44 Years | 161 | 23.5% |
| 45 to 54 Years | 100 | 14.6% |
| 55 to 64 Years | 87 | 12.7% |
| 65 to 74 Years | 119 | 17.3% |
| 75 to 84 Years | 59 | 8.6% |
| 85 Years and Over | 39 | 5.7% |
| Total | 686 | 100.0% |
Housing Finances in Thorp
Median Income by Occupancy in Thorp
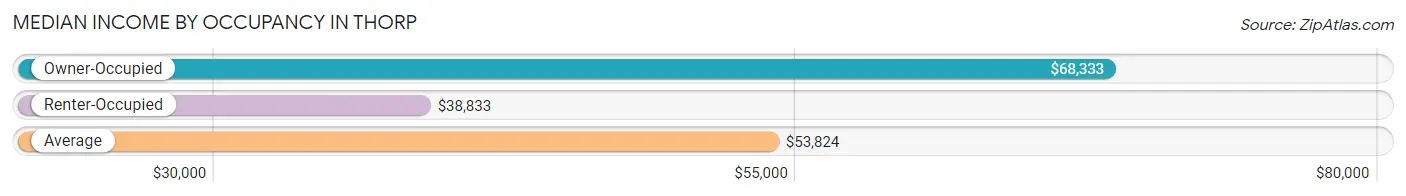
| Occupancy Type | # Households | Median Income |
| Owner-Occupied | 476 (69.4%) | $68,333 |
| Renter-Occupied | 210 (30.6%) | $38,833 |
| Average | 686 (100.0%) | $53,824 |
Occupancy by Householder Income Bracket in Thorp
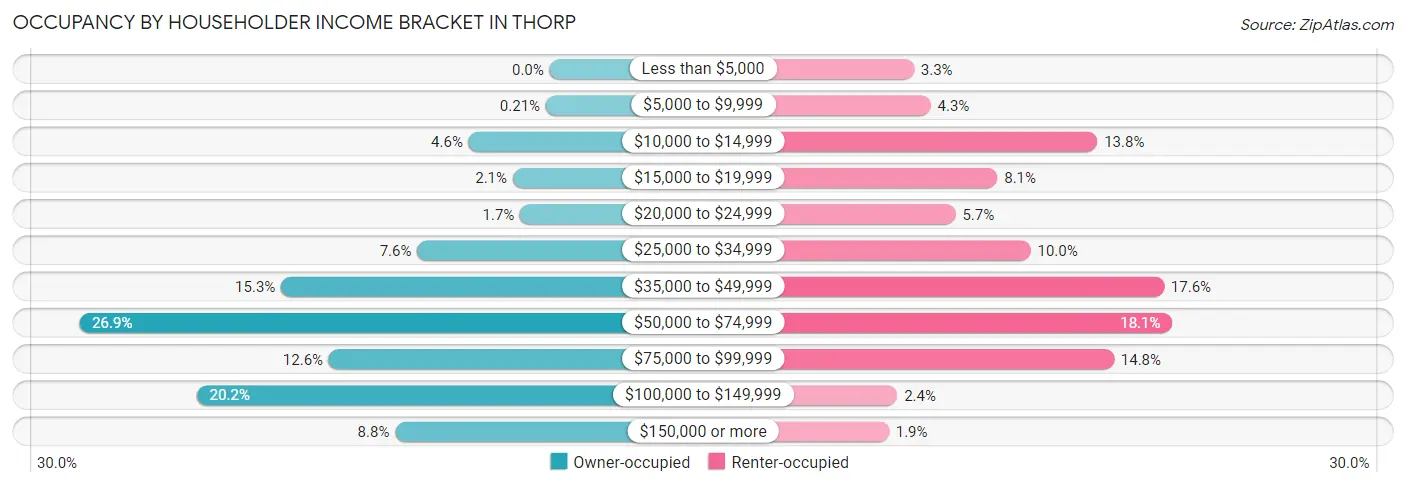
| Income Bracket | Owner-occupied | Renter-occupied |
| Less than $5,000 | 0 (0.0%) | 7 (3.3%) |
| $5,000 to $9,999 | 1 (0.2%) | 9 (4.3%) |
| $10,000 to $14,999 | 22 (4.6%) | 29 (13.8%) |
| $15,000 to $19,999 | 10 (2.1%) | 17 (8.1%) |
| $20,000 to $24,999 | 8 (1.7%) | 12 (5.7%) |
| $25,000 to $34,999 | 36 (7.6%) | 21 (10.0%) |
| $35,000 to $49,999 | 73 (15.3%) | 37 (17.6%) |
| $50,000 to $74,999 | 128 (26.9%) | 38 (18.1%) |
| $75,000 to $99,999 | 60 (12.6%) | 31 (14.8%) |
| $100,000 to $149,999 | 96 (20.2%) | 5 (2.4%) |
| $150,000 or more | 42 (8.8%) | 4 (1.9%) |
| Total | 476 (100.0%) | 210 (100.0%) |
Monthly Housing Cost Tiers in Thorp
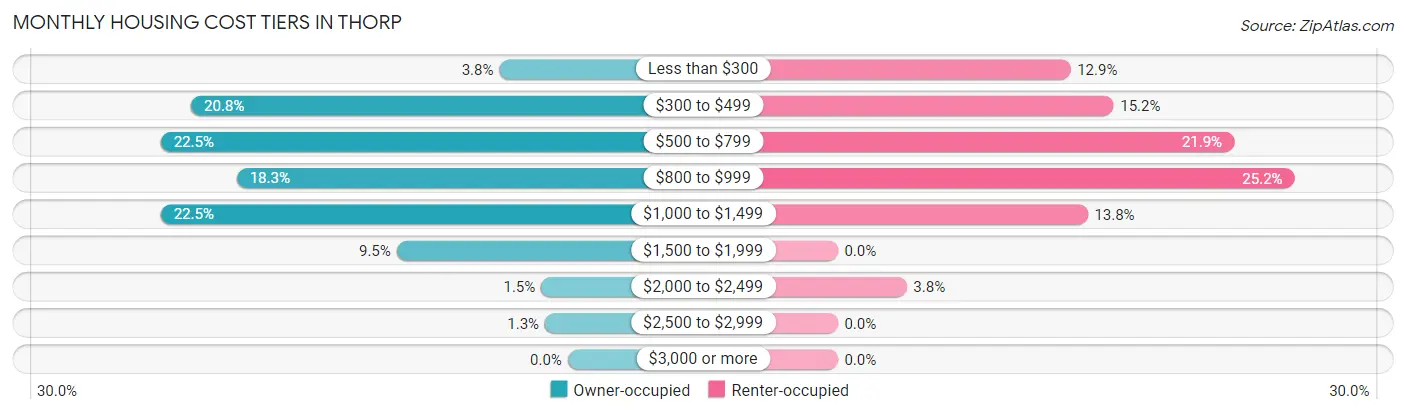
| Monthly Cost | Owner-occupied | Renter-occupied |
| Less than $300 | 18 (3.8%) | 27 (12.9%) |
| $300 to $499 | 99 (20.8%) | 32 (15.2%) |
| $500 to $799 | 107 (22.5%) | 46 (21.9%) |
| $800 to $999 | 87 (18.3%) | 53 (25.2%) |
| $1,000 to $1,499 | 107 (22.5%) | 29 (13.8%) |
| $1,500 to $1,999 | 45 (9.5%) | 0 (0.0%) |
| $2,000 to $2,499 | 7 (1.5%) | 8 (3.8%) |
| $2,500 to $2,999 | 6 (1.3%) | 0 (0.0%) |
| $3,000 or more | 0 (0.0%) | 0 (0.0%) |
| Total | 476 (100.0%) | 210 (100.0%) |
Physical Housing Characteristics in Thorp
Housing Structures in Thorp
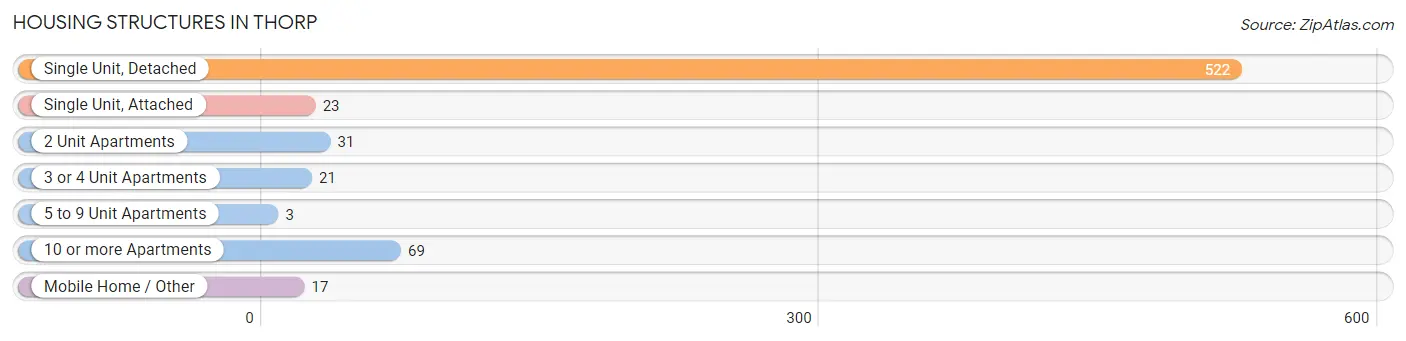
| Structure Type | # Housing Units | % Housing Units |
| Single Unit, Detached | 522 | 76.1% |
| Single Unit, Attached | 23 | 3.4% |
| 2 Unit Apartments | 31 | 4.5% |
| 3 or 4 Unit Apartments | 21 | 3.1% |
| 5 to 9 Unit Apartments | 3 | 0.4% |
| 10 or more Apartments | 69 | 10.1% |
| Mobile Home / Other | 17 | 2.5% |
| Total | 686 | 100.0% |
Housing Structures by Occupancy in Thorp
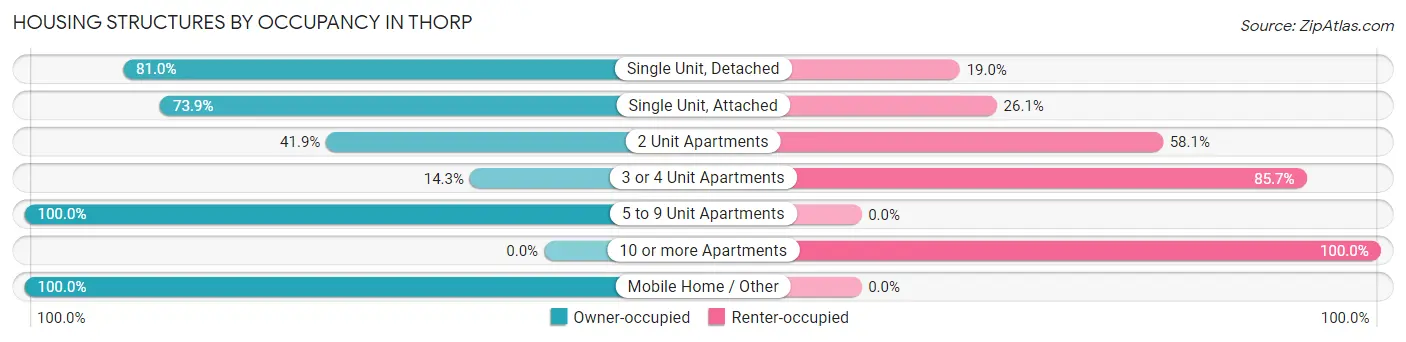
| Structure Type | Owner-occupied | Renter-occupied |
| Single Unit, Detached | 423 (81.0%) | 99 (19.0%) |
| Single Unit, Attached | 17 (73.9%) | 6 (26.1%) |
| 2 Unit Apartments | 13 (41.9%) | 18 (58.1%) |
| 3 or 4 Unit Apartments | 3 (14.3%) | 18 (85.7%) |
| 5 to 9 Unit Apartments | 3 (100.0%) | 0 (0.0%) |
| 10 or more Apartments | 0 (0.0%) | 69 (100.0%) |
| Mobile Home / Other | 17 (100.0%) | 0 (0.0%) |
| Total | 476 (69.4%) | 210 (30.6%) |
Housing Structures by Number of Rooms in Thorp
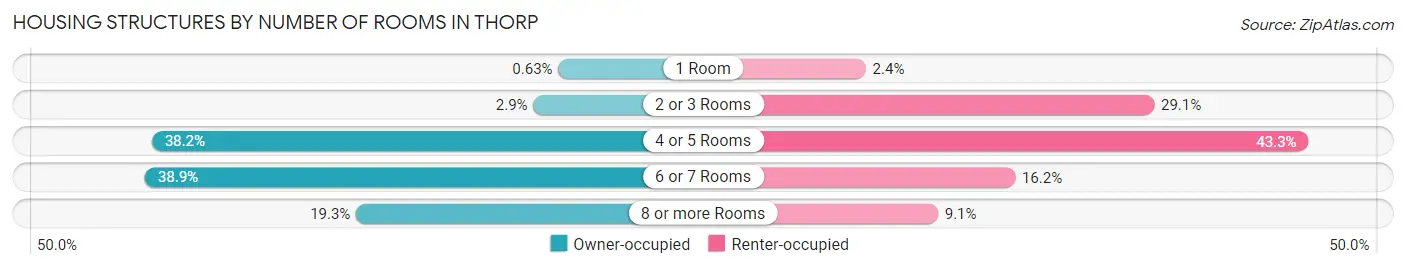
| Number of Rooms | Owner-occupied | Renter-occupied |
| 1 Room | 3 (0.6%) | 5 (2.4%) |
| 2 or 3 Rooms | 14 (2.9%) | 61 (29.0%) |
| 4 or 5 Rooms | 182 (38.2%) | 91 (43.3%) |
| 6 or 7 Rooms | 185 (38.9%) | 34 (16.2%) |
| 8 or more Rooms | 92 (19.3%) | 19 (9.0%) |
| Total | 476 (100.0%) | 210 (100.0%) |
Housing Structure by Heating Type in Thorp
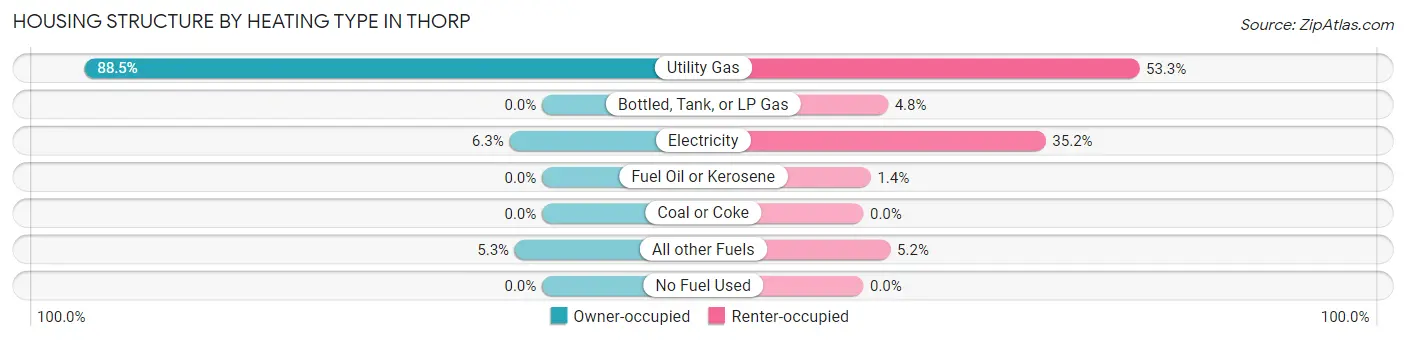
| Heating Type | Owner-occupied | Renter-occupied |
| Utility Gas | 421 (88.4%) | 112 (53.3%) |
| Bottled, Tank, or LP Gas | 0 (0.0%) | 10 (4.8%) |
| Electricity | 30 (6.3%) | 74 (35.2%) |
| Fuel Oil or Kerosene | 0 (0.0%) | 3 (1.4%) |
| Coal or Coke | 0 (0.0%) | 0 (0.0%) |
| All other Fuels | 25 (5.2%) | 11 (5.2%) |
| No Fuel Used | 0 (0.0%) | 0 (0.0%) |
| Total | 476 (100.0%) | 210 (100.0%) |
Household Vehicle Usage in Thorp
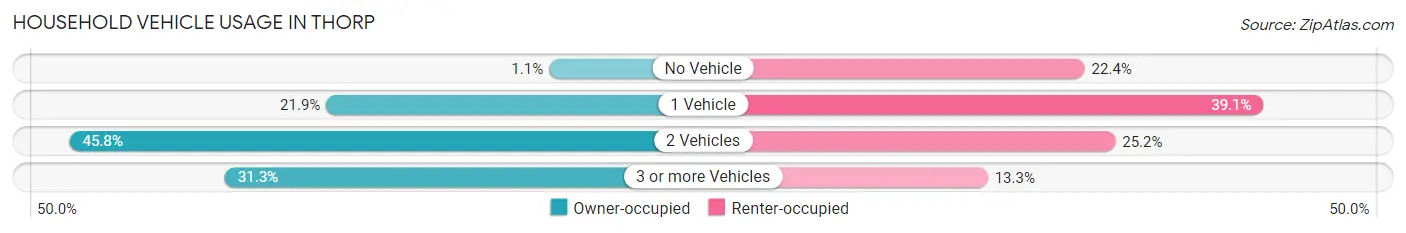
| Vehicles per Household | Owner-occupied | Renter-occupied |
| No Vehicle | 5 (1.1%) | 47 (22.4%) |
| 1 Vehicle | 104 (21.8%) | 82 (39.1%) |
| 2 Vehicles | 218 (45.8%) | 53 (25.2%) |
| 3 or more Vehicles | 149 (31.3%) | 28 (13.3%) |
| Total | 476 (100.0%) | 210 (100.0%) |
Real Estate & Mortgages in Thorp
Real Estate and Mortgage Overview in Thorp
| Characteristic | Without Mortgage | With Mortgage |
| Housing Units | 182 | 294 |
| Median Property Value | $109,400 | $152,900 |
| Median Household Income | $51,397 | $37 |
| Monthly Housing Costs | $449 | $0 |
| Real Estate Taxes | $1,770 | $7 |
Property Value by Mortgage Status in Thorp
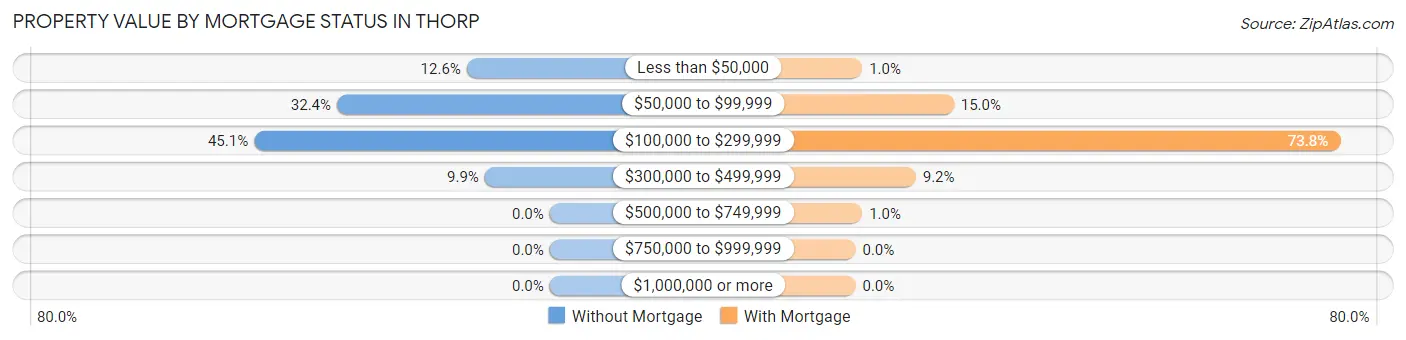
| Property Value | Without Mortgage | With Mortgage |
| Less than $50,000 | 23 (12.6%) | 3 (1.0%) |
| $50,000 to $99,999 | 59 (32.4%) | 44 (15.0%) |
| $100,000 to $299,999 | 82 (45.1%) | 217 (73.8%) |
| $300,000 to $499,999 | 18 (9.9%) | 27 (9.2%) |
| $500,000 to $749,999 | 0 (0.0%) | 3 (1.0%) |
| $750,000 to $999,999 | 0 (0.0%) | 0 (0.0%) |
| $1,000,000 or more | 0 (0.0%) | 0 (0.0%) |
| Total | 182 (100.0%) | 294 (100.0%) |
Household Income by Mortgage Status in Thorp
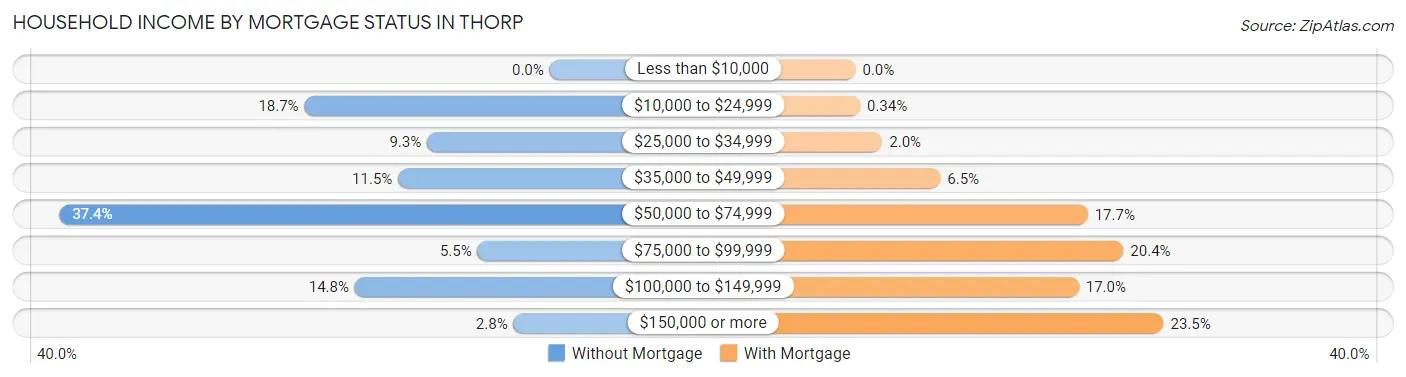
| Household Income | Without Mortgage | With Mortgage |
| Less than $10,000 | 0 (0.0%) | 0 (0.0%) |
| $10,000 to $24,999 | 34 (18.7%) | 1 (0.3%) |
| $25,000 to $34,999 | 17 (9.3%) | 6 (2.0%) |
| $35,000 to $49,999 | 21 (11.5%) | 19 (6.5%) |
| $50,000 to $74,999 | 68 (37.4%) | 52 (17.7%) |
| $75,000 to $99,999 | 10 (5.5%) | 60 (20.4%) |
| $100,000 to $149,999 | 27 (14.8%) | 50 (17.0%) |
| $150,000 or more | 5 (2.8%) | 69 (23.5%) |
| Total | 182 (100.0%) | 294 (100.0%) |
Property Value to Household Income Ratio in Thorp
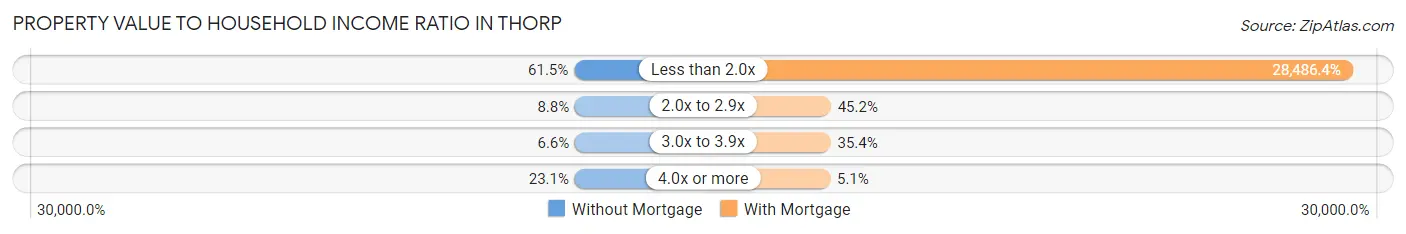
| Value-to-Income Ratio | Without Mortgage | With Mortgage |
| Less than 2.0x | 112 (61.5%) | 83,750 (28,486.4%) |
| 2.0x to 2.9x | 16 (8.8%) | 133 (45.2%) |
| 3.0x to 3.9x | 12 (6.6%) | 104 (35.4%) |
| 4.0x or more | 42 (23.1%) | 15 (5.1%) |
| Total | 182 (100.0%) | 294 (100.0%) |
Real Estate Taxes by Mortgage Status in Thorp
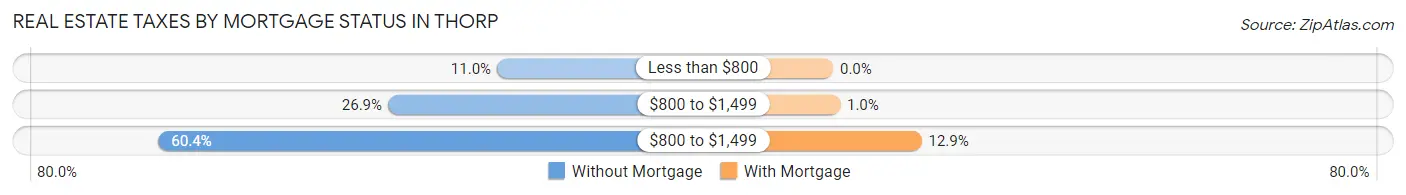
| Property Taxes | Without Mortgage | With Mortgage |
| Less than $800 | 20 (11.0%) | 0 (0.0%) |
| $800 to $1,499 | 49 (26.9%) | 3 (1.0%) |
| $800 to $1,499 | 110 (60.4%) | 38 (12.9%) |
| Total | 182 (100.0%) | 294 (100.0%) |
Health & Disability in Thorp
Health Insurance Coverage by Age in Thorp
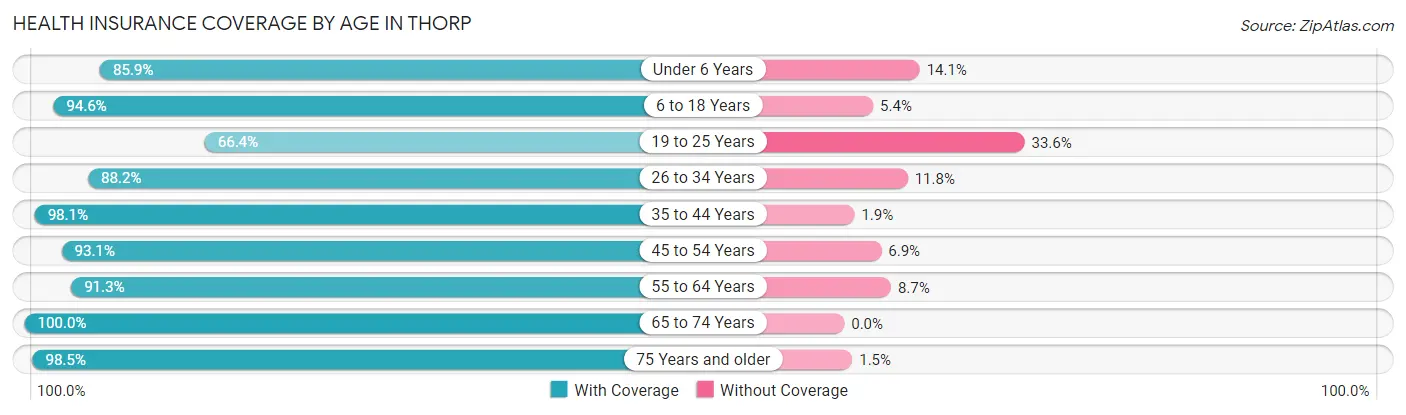
| Age Bracket | With Coverage | Without Coverage |
| Under 6 Years | 110 (85.9%) | 18 (14.1%) |
| 6 to 18 Years | 299 (94.6%) | 17 (5.4%) |
| 19 to 25 Years | 77 (66.4%) | 39 (33.6%) |
| 26 to 34 Years | 164 (88.2%) | 22 (11.8%) |
| 35 to 44 Years | 207 (98.1%) | 4 (1.9%) |
| 45 to 54 Years | 202 (93.1%) | 15 (6.9%) |
| 55 to 64 Years | 126 (91.3%) | 12 (8.7%) |
| 65 to 74 Years | 240 (100.0%) | 0 (0.0%) |
| 75 Years and older | 132 (98.5%) | 2 (1.5%) |
| Total | 1,557 (92.3%) | 129 (7.6%) |
Health Insurance Coverage by Citizenship Status in Thorp
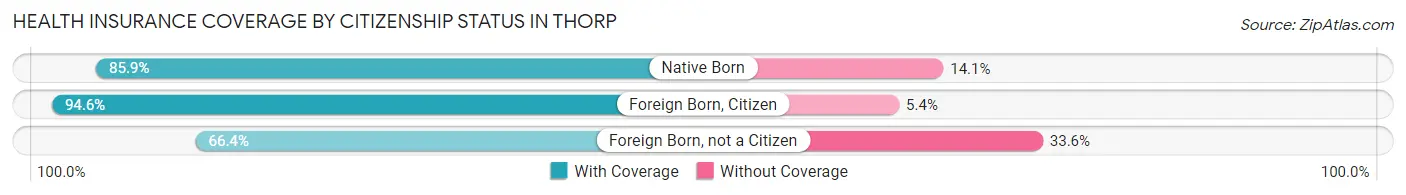
| Citizenship Status | With Coverage | Without Coverage |
| Native Born | 110 (85.9%) | 18 (14.1%) |
| Foreign Born, Citizen | 299 (94.6%) | 17 (5.4%) |
| Foreign Born, not a Citizen | 77 (66.4%) | 39 (33.6%) |
Health Insurance Coverage by Household Income in Thorp
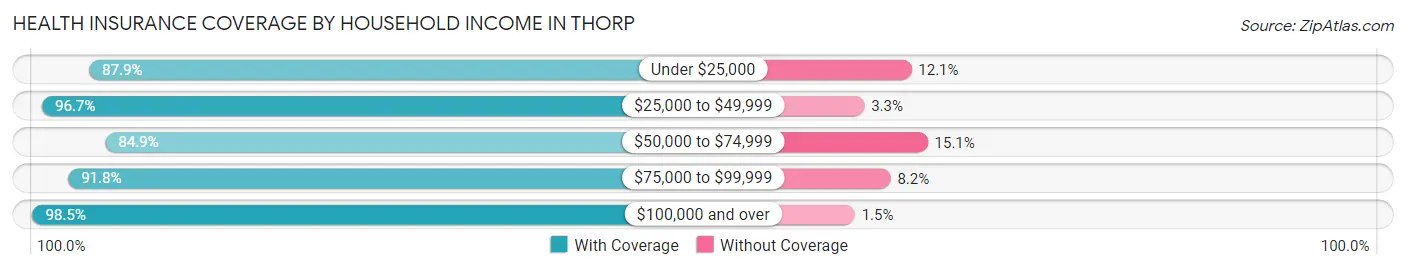
| Household Income | With Coverage | Without Coverage |
| Under $25,000 | 138 (87.9%) | 19 (12.1%) |
| $25,000 to $49,999 | 296 (96.7%) | 10 (3.3%) |
| $50,000 to $74,999 | 398 (84.9%) | 71 (15.1%) |
| $75,000 to $99,999 | 247 (91.8%) | 22 (8.2%) |
| $100,000 and over | 465 (98.5%) | 7 (1.5%) |
Public vs Private Health Insurance Coverage by Age in Thorp
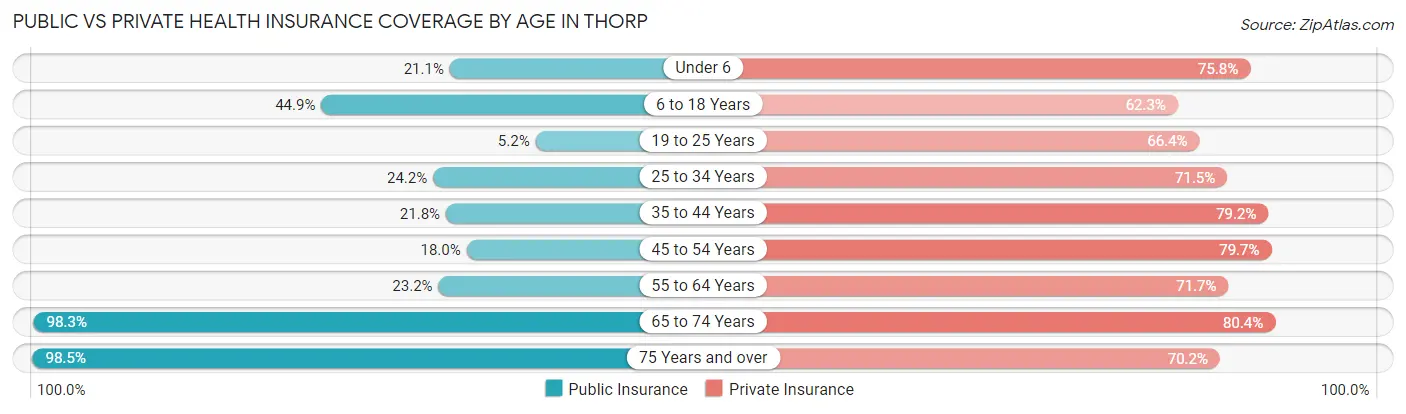
| Age Bracket | Public Insurance | Private Insurance |
| Under 6 | 27 (21.1%) | 97 (75.8%) |
| 6 to 18 Years | 142 (44.9%) | 197 (62.3%) |
| 19 to 25 Years | 6 (5.2%) | 77 (66.4%) |
| 25 to 34 Years | 45 (24.2%) | 133 (71.5%) |
| 35 to 44 Years | 46 (21.8%) | 167 (79.1%) |
| 45 to 54 Years | 39 (18.0%) | 173 (79.7%) |
| 55 to 64 Years | 32 (23.2%) | 99 (71.7%) |
| 65 to 74 Years | 236 (98.3%) | 193 (80.4%) |
| 75 Years and over | 132 (98.5%) | 94 (70.2%) |
| Total | 705 (41.8%) | 1,230 (73.0%) |
Disability Status by Sex by Age in Thorp
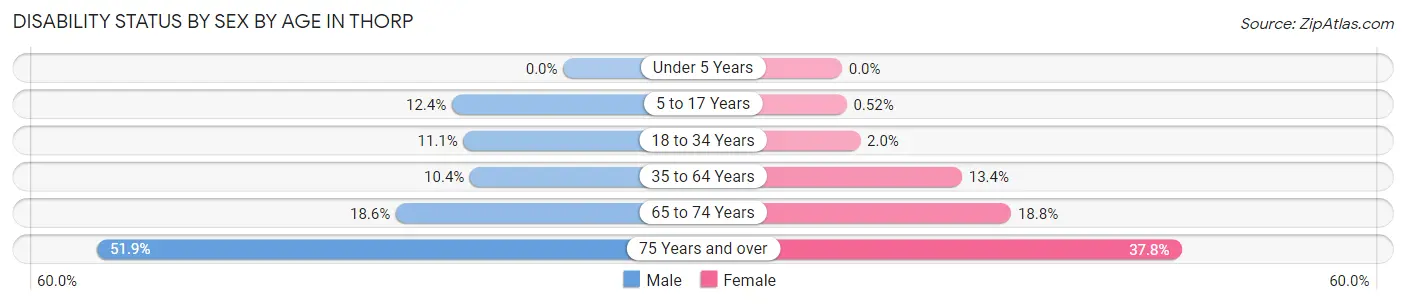
| Age Bracket | Male | Female |
| Under 5 Years | 0 (0.0%) | 0 (0.0%) |
| 5 to 17 Years | 15 (12.4%) | 1 (0.5%) |
| 18 to 34 Years | 20 (11.1%) | 3 (2.0%) |
| 35 to 64 Years | 30 (10.4%) | 37 (13.4%) |
| 65 to 74 Years | 19 (18.6%) | 26 (18.8%) |
| 75 Years and over | 27 (51.9%) | 31 (37.8%) |
Disability Class by Sex by Age in Thorp
Disability Class: Hearing Difficulty
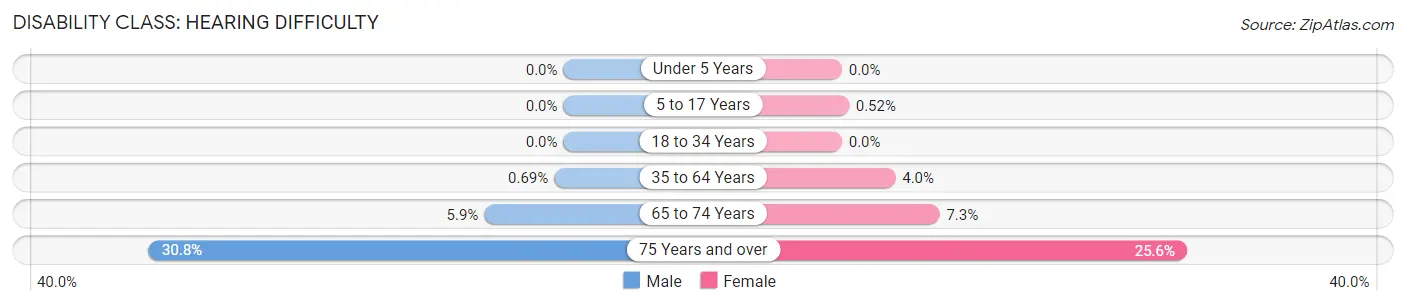
| Age Bracket | Male | Female |
| Under 5 Years | 0 (0.0%) | 0 (0.0%) |
| 5 to 17 Years | 0 (0.0%) | 1 (0.5%) |
| 18 to 34 Years | 0 (0.0%) | 0 (0.0%) |
| 35 to 64 Years | 2 (0.7%) | 11 (4.0%) |
| 65 to 74 Years | 6 (5.9%) | 10 (7.2%) |
| 75 Years and over | 16 (30.8%) | 21 (25.6%) |
Disability Class: Vision Difficulty
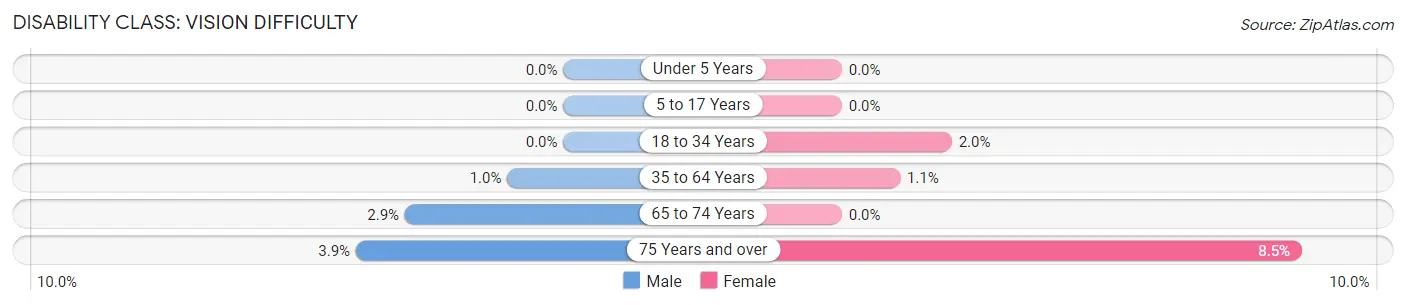
| Age Bracket | Male | Female |
| Under 5 Years | 0 (0.0%) | 0 (0.0%) |
| 5 to 17 Years | 0 (0.0%) | 0 (0.0%) |
| 18 to 34 Years | 0 (0.0%) | 3 (2.0%) |
| 35 to 64 Years | 3 (1.0%) | 3 (1.1%) |
| 65 to 74 Years | 3 (2.9%) | 0 (0.0%) |
| 75 Years and over | 2 (3.8%) | 7 (8.5%) |
Disability Class: Cognitive Difficulty
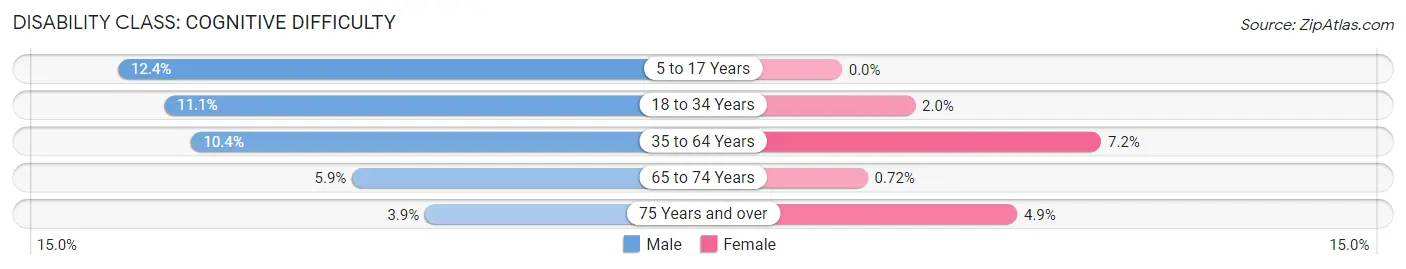
| Age Bracket | Male | Female |
| 5 to 17 Years | 15 (12.4%) | 0 (0.0%) |
| 18 to 34 Years | 20 (11.1%) | 3 (2.0%) |
| 35 to 64 Years | 30 (10.4%) | 20 (7.2%) |
| 65 to 74 Years | 6 (5.9%) | 1 (0.7%) |
| 75 Years and over | 2 (3.8%) | 4 (4.9%) |
Disability Class: Ambulatory Difficulty
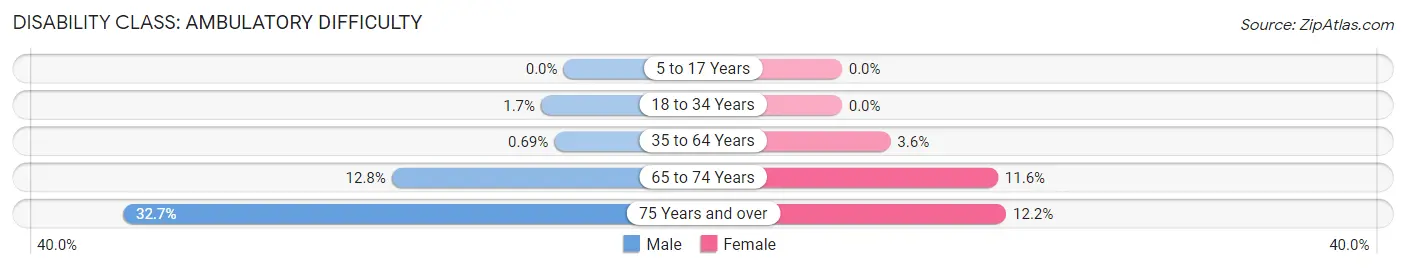
| Age Bracket | Male | Female |
| 5 to 17 Years | 0 (0.0%) | 0 (0.0%) |
| 18 to 34 Years | 3 (1.7%) | 0 (0.0%) |
| 35 to 64 Years | 2 (0.7%) | 10 (3.6%) |
| 65 to 74 Years | 13 (12.8%) | 16 (11.6%) |
| 75 Years and over | 17 (32.7%) | 10 (12.2%) |
Disability Class: Self-Care Difficulty
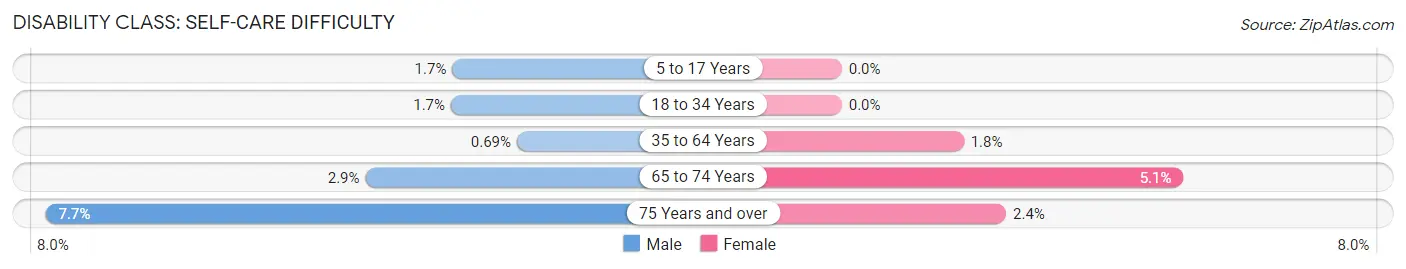
| Age Bracket | Male | Female |
| 5 to 17 Years | 2 (1.7%) | 0 (0.0%) |
| 18 to 34 Years | 3 (1.7%) | 0 (0.0%) |
| 35 to 64 Years | 2 (0.7%) | 5 (1.8%) |
| 65 to 74 Years | 3 (2.9%) | 7 (5.1%) |
| 75 Years and over | 4 (7.7%) | 2 (2.4%) |
Technology Access in Thorp
Computing Device Access in Thorp
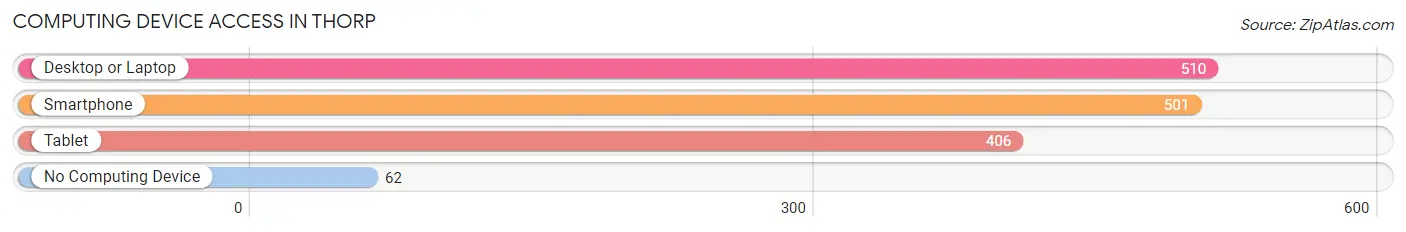
| Device Type | # Households | % Households |
| Desktop or Laptop | 510 | 74.3% |
| Smartphone | 501 | 73.0% |
| Tablet | 406 | 59.2% |
| No Computing Device | 62 | 9.0% |
| Total | 686 | 100.0% |
Internet Access in Thorp
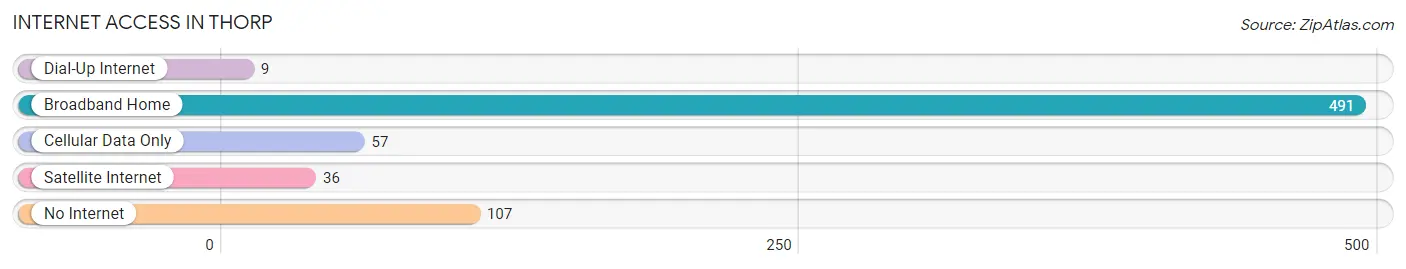
| Internet Type | # Households | % Households |
| Dial-Up Internet | 9 | 1.3% |
| Broadband Home | 491 | 71.6% |
| Cellular Data Only | 57 | 8.3% |
| Satellite Internet | 36 | 5.2% |
| No Internet | 107 | 15.6% |
| Total | 686 | 100.0% |
Thorp Summary
Thorp, Wisconsin is a small village located in Clark County, Wisconsin. It is situated on the banks of the Eau Claire River, about 25 miles east of Eau Claire. The village has a population of 1,717 people, according to the 2010 census.
History
The area that is now Thorp was first settled in the late 1840s by a group of Norwegian immigrants. The village was originally known as “Norway”, but was later changed to “Thorp” in 1872. The name Thorp is derived from the Old Norse word “thorp”, which means “village”.
The village was officially incorporated in 1883. At the time, the village was primarily an agricultural community, with the main crops being wheat, oats, and barley. The village also had a few small businesses, such as a general store, a blacksmith shop, and a sawmill.
In the early 1900s, Thorp began to experience a period of growth and development. The village was connected to the railroad in 1906, which allowed for the transportation of goods and people. This led to the establishment of several new businesses, including a creamery, a cheese factory, and a flour mill.
Geography
Thorp is located in the western part of Clark County, Wisconsin. It is situated on the banks of the Eau Claire River, about 25 miles east of Eau Claire. The village is surrounded by rolling hills and farmland.
The climate in Thorp is classified as humid continental, with cold winters and warm summers. The average annual temperature is around 45 degrees Fahrenheit. The average annual precipitation is around 30 inches.
Economy
The economy of Thorp is primarily based on agriculture and tourism. The village is home to several dairy farms, as well as a few small businesses. The village also has a few restaurants and bars, as well as a few small shops.
Tourism is an important part of the economy in Thorp. The village is home to several parks and recreational areas, including the Eau Claire River State Park. The village also hosts several festivals and events throughout the year, such as the Thorp Cheese Festival and the Thorp Fall Festival.
Demographics
According to the 2010 census, the population of Thorp was 1,717 people. The racial makeup of the village was 97.3% White, 0.6% African American, 0.2% Native American, 0.3% Asian, 0.1% Pacific Islander, 0.7% from other races, and 0.8% from two or more races.
The median household income in Thorp was $41,944, and the median family income was $50,625. The per capita income was $20,845. About 8.3% of the population was below the poverty line.
Thorp is a small village with a rich history and a vibrant economy. The village is home to several dairy farms, as well as a few small businesses. Tourism is an important part of the economy, and the village hosts several festivals and events throughout the year. The population of Thorp is primarily white, with a small percentage of African Americans, Native Americans, Asians, and Pacific Islanders. The median household income is slightly above the national average, and the per capita income is slightly below the national average.
Common Questions
What is Per Capita Income in Thorp?
Per Capita income in Thorp is $27,939.
What is the Median Family Income in Thorp?
Median Family Income in Thorp is $64,940.
What is the Median Household income in Thorp?
Median Household Income in Thorp is $53,824.
What is Income or Wage Gap in Thorp?
Income or Wage Gap in Thorp is 34.3%.
Women in Thorp earn 65.7 cents for every dollar earned by a man.
What is Inequality or Gini Index in Thorp?
Inequality or Gini Index in Thorp is 0.38.
What is the Total Population of Thorp?
Total Population of Thorp is 1,753.
What is the Total Male Population of Thorp?
Total Male Population of Thorp is 847.
What is the Total Female Population of Thorp?
Total Female Population of Thorp is 906.
What is the Ratio of Males per 100 Females in Thorp?
There are 93.49 Males per 100 Females in Thorp.
What is the Ratio of Females per 100 Males in Thorp?
There are 106.97 Females per 100 Males in Thorp.
What is the Median Population Age in Thorp?
Median Population Age in Thorp is 41.5 Years.
What is the Average Family Size in Thorp
Average Family Size in Thorp is 2.9 People.
What is the Average Household Size in Thorp
Average Household Size in Thorp is 2.4 People.
How Large is the Labor Force in Thorp?
There are 769 People in the Labor Forcein in Thorp.
What is the Percentage of People in the Labor Force in Thorp?
55.3% of People are in the Labor Force in Thorp.
What is the Unemployment Rate in Thorp?
Unemployment Rate in Thorp is 2.7%.