Tennyson, WI Map & Demographics
Tennyson Map
Tennyson Overview
$34,664
PER CAPITA INCOME
$89,375
AVG FAMILY INCOME
$61,500
AVG HOUSEHOLD INCOME
33.3%
WAGE / INCOME GAP [ % ]
66.7¢/ $1
WAGE / INCOME GAP [ $ ]
0.27
INEQUALITY / GINI INDEX
374
TOTAL POPULATION
175
MALE POPULATION
199
FEMALE POPULATION
87.94
MALES / 100 FEMALES
113.71
FEMALES / 100 MALES
42.6
MEDIAN AGE
2.9
AVG FAMILY SIZE
2.1
AVG HOUSEHOLD SIZE
195
LABOR FORCE [ PEOPLE ]
61.7%
PERCENT IN LABOR FORCE
2.1%
UNEMPLOYMENT RATE
Income in Tennyson
Income Overview in Tennyson
Per Capita Income in Tennyson is $34,664, while median incomes of families and households are $89,375 and $61,500 respectively.
| Characteristic | Number | Measure |
| Per Capita Income | 374 | $34,664 |
| Median Family Income | 91 | $89,375 |
| Mean Family Income | 91 | $87,524 |
| Median Household Income | 176 | $61,500 |
| Mean Household Income | 176 | $73,540 |
| Income Deficit | 91 | $0 |
| Wage / Income Gap (%) | 374 | 33.26% |
| Wage / Income Gap ($) | 374 | 66.74¢ per $1 |
| Gini / Inequality Index | 374 | 0.27 |
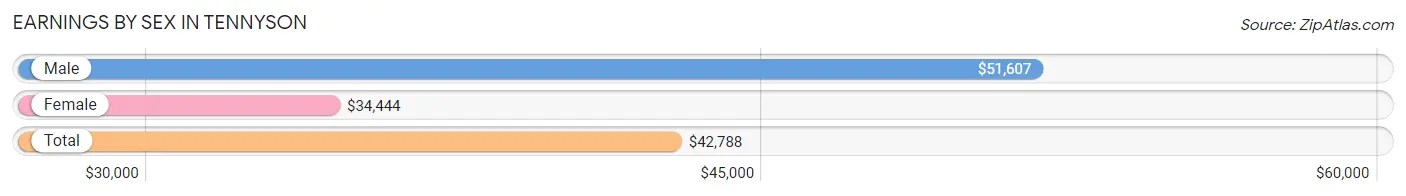
Earnings by Sex in Tennyson
Average Earnings in Tennyson are $42,788, $51,607 for men and $34,444 for women, a difference of 33.3%.
| Sex | Number | Average Earnings |
| Male | 99 (49.7%) | $51,607 |
| Female | 100 (50.2%) | $34,444 |
| Total | 199 (100.0%) | $42,788 |
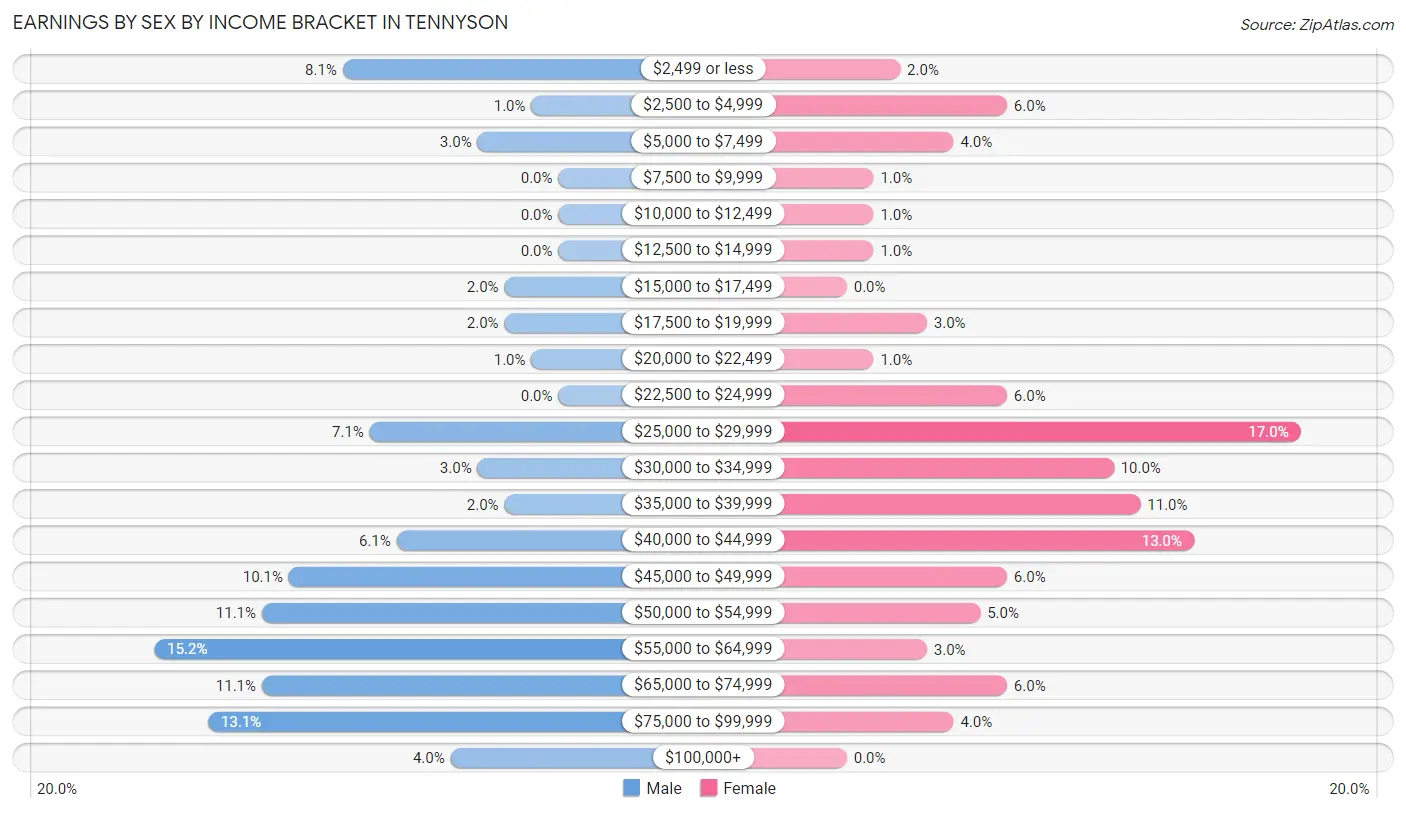
Earnings by Sex by Income Bracket in Tennyson
The most common earnings brackets in Tennyson are $55,000 to $64,999 for men (15 | 15.1%) and $25,000 to $29,999 for women (17 | 17.0%).
| Income | Male | Female |
| $2,499 or less | 8 (8.1%) | 2 (2.0%) |
| $2,500 to $4,999 | 1 (1.0%) | 6 (6.0%) |
| $5,000 to $7,499 | 3 (3.0%) | 4 (4.0%) |
| $7,500 to $9,999 | 0 (0.0%) | 1 (1.0%) |
| $10,000 to $12,499 | 0 (0.0%) | 1 (1.0%) |
| $12,500 to $14,999 | 0 (0.0%) | 1 (1.0%) |
| $15,000 to $17,499 | 2 (2.0%) | 0 (0.0%) |
| $17,500 to $19,999 | 2 (2.0%) | 3 (3.0%) |
| $20,000 to $22,499 | 1 (1.0%) | 1 (1.0%) |
| $22,500 to $24,999 | 0 (0.0%) | 6 (6.0%) |
| $25,000 to $29,999 | 7 (7.1%) | 17 (17.0%) |
| $30,000 to $34,999 | 3 (3.0%) | 10 (10.0%) |
| $35,000 to $39,999 | 2 (2.0%) | 11 (11.0%) |
| $40,000 to $44,999 | 6 (6.1%) | 13 (13.0%) |
| $45,000 to $49,999 | 10 (10.1%) | 6 (6.0%) |
| $50,000 to $54,999 | 11 (11.1%) | 5 (5.0%) |
| $55,000 to $64,999 | 15 (15.1%) | 3 (3.0%) |
| $65,000 to $74,999 | 11 (11.1%) | 6 (6.0%) |
| $75,000 to $99,999 | 13 (13.1%) | 4 (4.0%) |
| $100,000+ | 4 (4.0%) | 0 (0.0%) |
| Total | 99 (100.0%) | 100 (100.0%) |
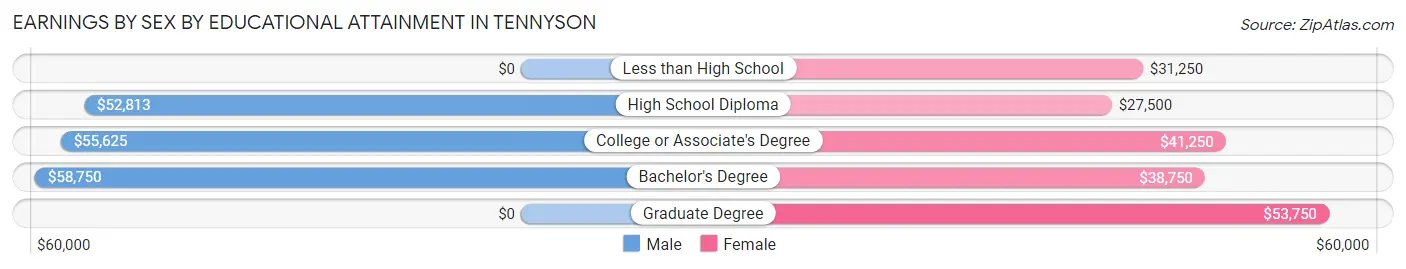
Earnings by Sex by Educational Attainment in Tennyson
Average earnings in Tennyson are $54,063 for men and $34,861 for women, a difference of 35.5%. Men with an educational attainment of bachelor's degree enjoy the highest average annual earnings of $58,750, while those with high school diploma education earn the least with $52,813. Women with an educational attainment of graduate degree earn the most with the average annual earnings of $53,750, while those with high school diploma education have the smallest earnings of $27,500.
| Educational Attainment | Male Income | Female Income |
| Less than High School | - | - |
| High School Diploma | $52,813 | $27,500 |
| College or Associate's Degree | $55,625 | $41,250 |
| Bachelor's Degree | $58,750 | $38,750 |
| Graduate Degree | - | - |
| Total | $54,063 | $34,861 |
Family Income in Tennyson
Family Income Brackets in Tennyson
According to the Tennyson family income data, there are 31 families falling into the $100,000 to $149,999 income range, which is the most common income bracket and makes up 34.1% of all families.
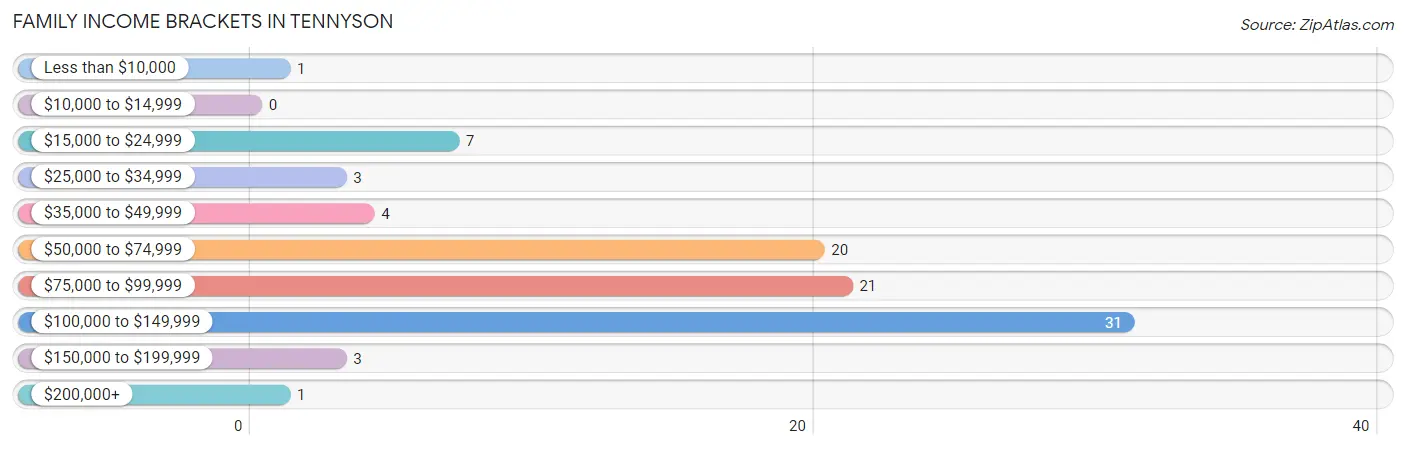
| Income Bracket | # Families | % Families |
| Less than $10,000 | 1 | 1.1% |
| $10,000 to $14,999 | 0 | 0.0% |
| $15,000 to $24,999 | 7 | 7.7% |
| $25,000 to $34,999 | 3 | 3.3% |
| $35,000 to $49,999 | 4 | 4.4% |
| $50,000 to $74,999 | 20 | 22.0% |
| $75,000 to $99,999 | 21 | 23.1% |
| $100,000 to $149,999 | 31 | 34.1% |
| $150,000 to $199,999 | 3 | 3.3% |
| $200,000+ | 1 | 1.1% |
Family Income by Famaliy Size in Tennyson
4-person families (11 | 12.1%) account for the highest median family income in Tennyson with $106,875 per family, while 2-person families (40 | 44.0%) have the highest median income of $38,125 per family member.
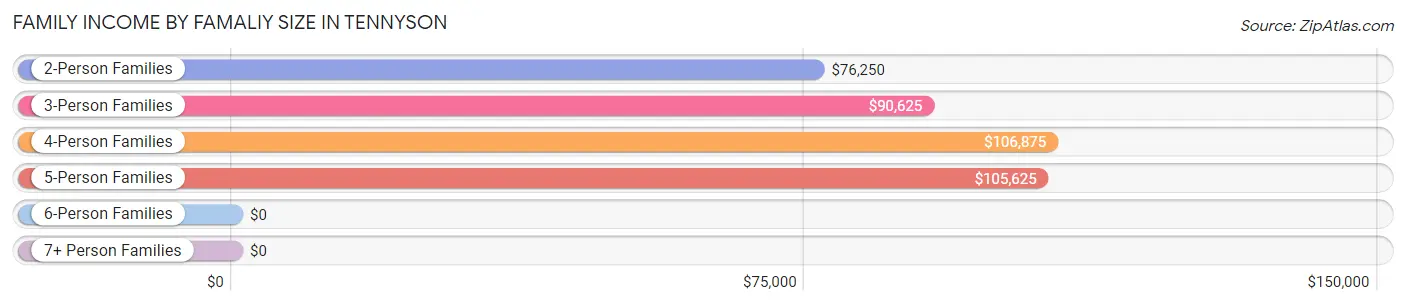
| Income Bracket | # Families | Median Income |
| 2-Person Families | 40 (44.0%) | $76,250 |
| 3-Person Families | 29 (31.9%) | $90,625 |
| 4-Person Families | 11 (12.1%) | $106,875 |
| 5-Person Families | 11 (12.1%) | $105,625 |
| 6-Person Families | 0 (0.0%) | $0 |
| 7+ Person Families | 0 (0.0%) | $0 |
| Total | 91 (100.0%) | $89,375 |
Family Income by Number of Earners in Tennyson
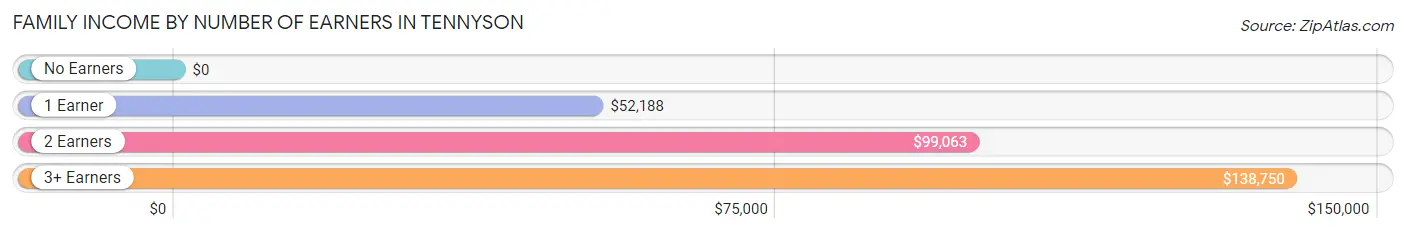
| Number of Earners | # Families | Median Income |
| No Earners | 12 (13.2%) | $0 |
| 1 Earner | 19 (20.9%) | $52,188 |
| 2 Earners | 51 (56.0%) | $99,063 |
| 3+ Earners | 9 (9.9%) | $138,750 |
| Total | 91 (100.0%) | $89,375 |
Household Income in Tennyson
Household Income Brackets in Tennyson
With 79 households falling in the category, the $50,000 to $74,999 income range is the most frequent in Tennyson, accounting for 44.9% of all households. In contrast, only 1 households (0.6%) fall into the $200,000+ income bracket, making it the least populous group.
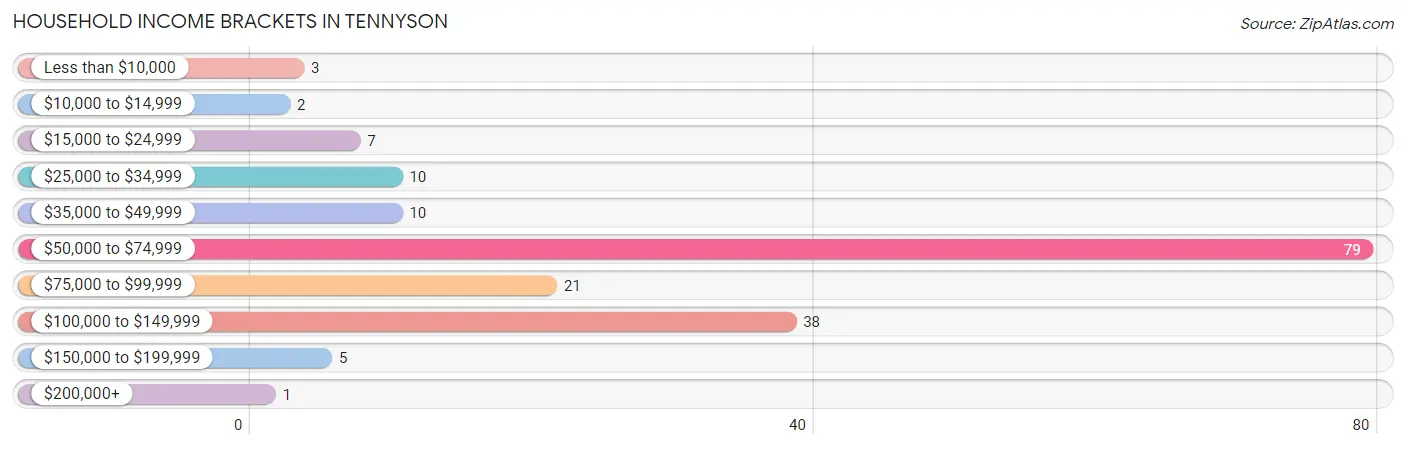
| Income Bracket | # Households | % Households |
| Less than $10,000 | 3 | 1.7% |
| $10,000 to $14,999 | 2 | 1.1% |
| $15,000 to $24,999 | 7 | 4.0% |
| $25,000 to $34,999 | 10 | 5.7% |
| $35,000 to $49,999 | 10 | 5.7% |
| $50,000 to $74,999 | 79 | 44.9% |
| $75,000 to $99,999 | 21 | 11.9% |
| $100,000 to $149,999 | 38 | 21.6% |
| $150,000 to $199,999 | 5 | 2.8% |
| $200,000+ | 1 | 0.6% |
Household Income by Householder Age in Tennyson
The median household income in Tennyson is $61,500, with the highest median household income of $105,313 found in the 25 to 44 years age bracket for the primary householder. A total of 49 households (27.8%) fall into this category. Meanwhile, the 65+ years age bracket for the primary householder has the lowest median household income of $55,982, with 79 households (44.9%) in this group.
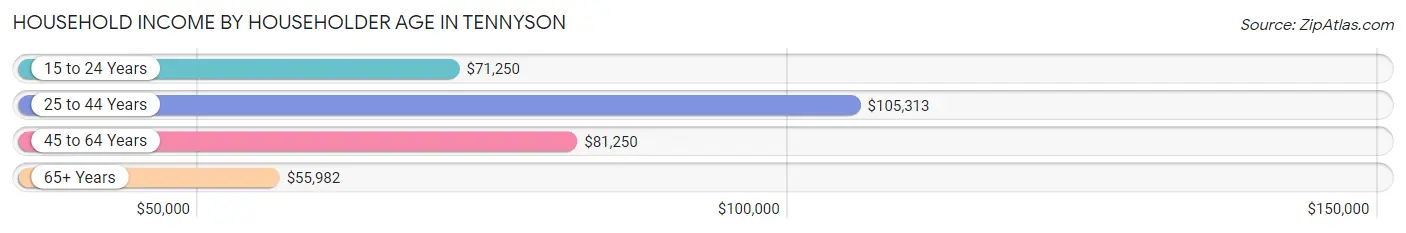
| Income Bracket | # Households | Median Income |
| 15 to 24 Years | 5 (2.8%) | $71,250 |
| 25 to 44 Years | 49 (27.8%) | $105,313 |
| 45 to 64 Years | 43 (24.4%) | $81,250 |
| 65+ Years | 79 (44.9%) | $55,982 |
| Total | 176 (100.0%) | $61,500 |
Poverty in Tennyson
Income Below Poverty by Sex and Age in Tennyson
With 4.0% poverty level for males and 4.6% for females among the residents of Tennyson, 18 to 24 year old males and under 5 year old females are the most vulnerable to poverty, with 4 males (13.3%) and 2 females (25.0%) in their respective age groups living below the poverty level.
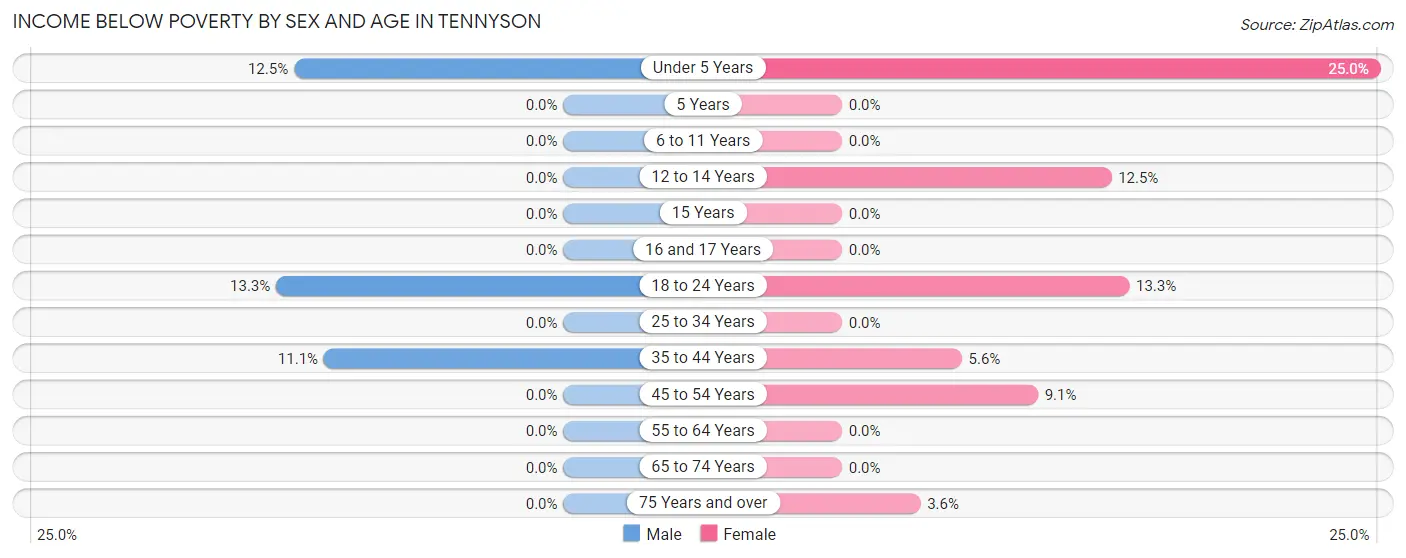
| Age Bracket | Male | Female |
| Under 5 Years | 1 (12.5%) | 2 (25.0%) |
| 5 Years | 0 (0.0%) | 0 (0.0%) |
| 6 to 11 Years | 0 (0.0%) | 0 (0.0%) |
| 12 to 14 Years | 0 (0.0%) | 1 (12.5%) |
| 15 Years | 0 (0.0%) | 0 (0.0%) |
| 16 and 17 Years | 0 (0.0%) | 0 (0.0%) |
| 18 to 24 Years | 4 (13.3%) | 2 (13.3%) |
| 25 to 34 Years | 0 (0.0%) | 0 (0.0%) |
| 35 to 44 Years | 2 (11.1%) | 1 (5.6%) |
| 45 to 54 Years | 0 (0.0%) | 1 (9.1%) |
| 55 to 64 Years | 0 (0.0%) | 0 (0.0%) |
| 65 to 74 Years | 0 (0.0%) | 0 (0.0%) |
| 75 Years and over | 0 (0.0%) | 2 (3.6%) |
| Total | 7 (4.0%) | 9 (4.6%) |
Income Above Poverty by Sex and Age in Tennyson
According to the poverty statistics in Tennyson, males aged 5 years and females aged 6 to 11 years are the age groups that are most secure financially, with 100.0% of males and 100.0% of females in these age groups living above the poverty line.
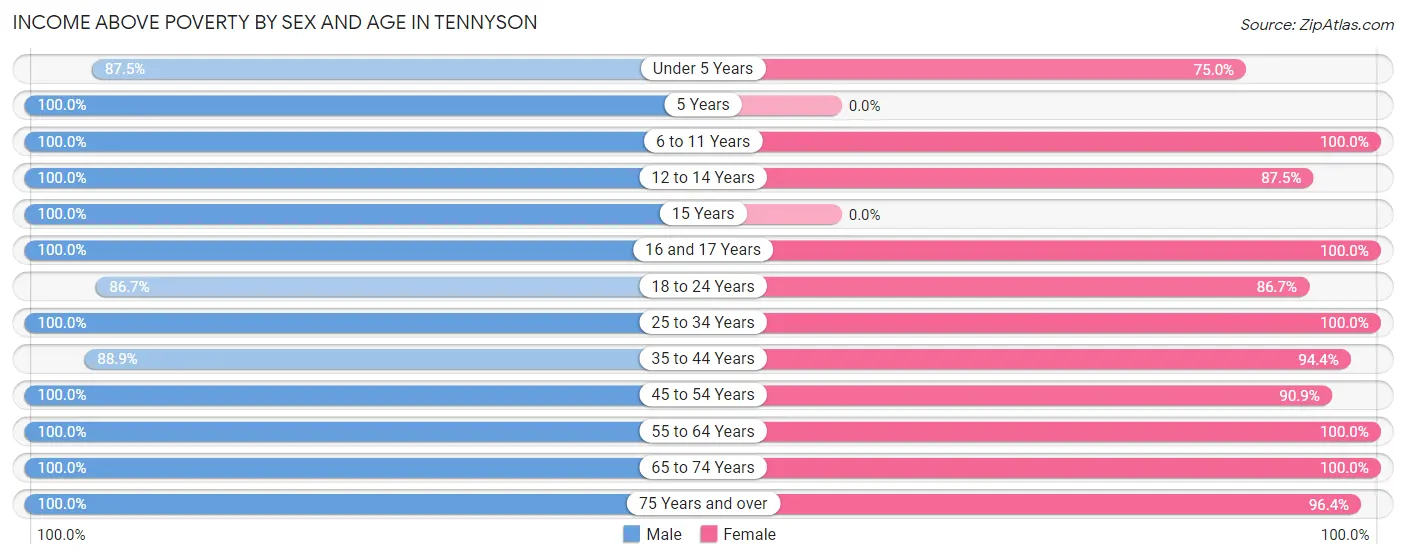
| Age Bracket | Male | Female |
| Under 5 Years | 7 (87.5%) | 6 (75.0%) |
| 5 Years | 3 (100.0%) | 0 (0.0%) |
| 6 to 11 Years | 11 (100.0%) | 10 (100.0%) |
| 12 to 14 Years | 7 (100.0%) | 7 (87.5%) |
| 15 Years | 1 (100.0%) | 0 (0.0%) |
| 16 and 17 Years | 8 (100.0%) | 3 (100.0%) |
| 18 to 24 Years | 26 (86.7%) | 13 (86.7%) |
| 25 to 34 Years | 28 (100.0%) | 26 (100.0%) |
| 35 to 44 Years | 16 (88.9%) | 17 (94.4%) |
| 45 to 54 Years | 13 (100.0%) | 10 (90.9%) |
| 55 to 64 Years | 21 (100.0%) | 31 (100.0%) |
| 65 to 74 Years | 17 (100.0%) | 12 (100.0%) |
| 75 Years and over | 10 (100.0%) | 53 (96.4%) |
| Total | 168 (96.0%) | 188 (95.4%) |
Income Below Poverty Among Married-Couple Families in Tennyson
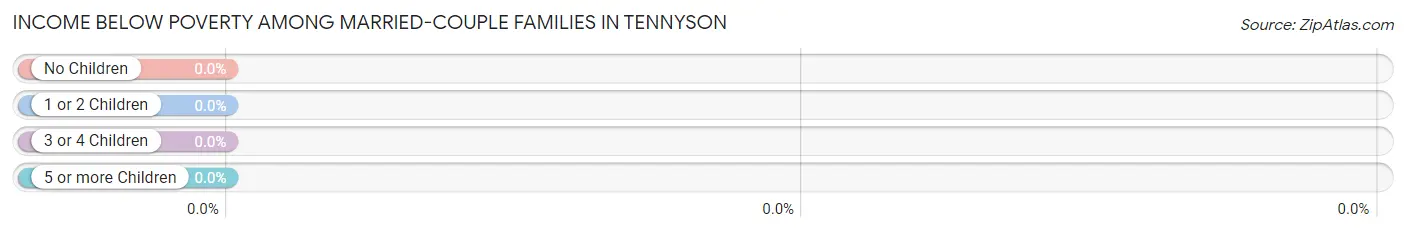
| Children | Above Poverty | Below Poverty |
| No Children | 48 (100.0%) | 0 (0.0%) |
| 1 or 2 Children | 18 (100.0%) | 0 (0.0%) |
| 3 or 4 Children | 8 (100.0%) | 0 (0.0%) |
| 5 or more Children | 0 (0.0%) | 0 (0.0%) |
| Total | 74 (100.0%) | 0 (0.0%) |
Income Below Poverty Among Single-Parent Households in Tennyson
According to the poverty data in Tennyson, 22.2% or 2 single-father households and 12.5% or 1 single-mother households are living below the poverty line. Among single-father households, those with 3 or 4 children have the highest poverty rate, with 2 households (100.0%) experiencing poverty. Likewise, among single-mother households, those with no children have the highest poverty rate, with 1 households (25.0%) falling below the poverty line.
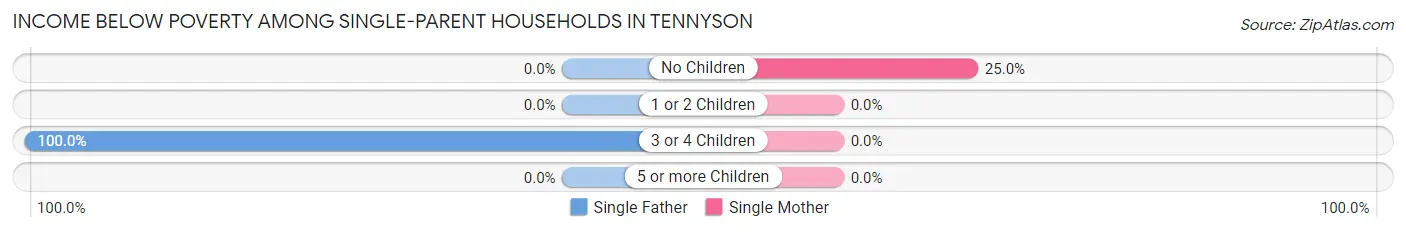
| Children | Single Father | Single Mother |
| No Children | 0 (0.0%) | 1 (25.0%) |
| 1 or 2 Children | 0 (0.0%) | 0 (0.0%) |
| 3 or 4 Children | 2 (100.0%) | 0 (0.0%) |
| 5 or more Children | 0 (0.0%) | 0 (0.0%) |
| Total | 2 (22.2%) | 1 (12.5%) |
Income Below Poverty Among Married-Couple vs Single-Parent Households in Tennyson
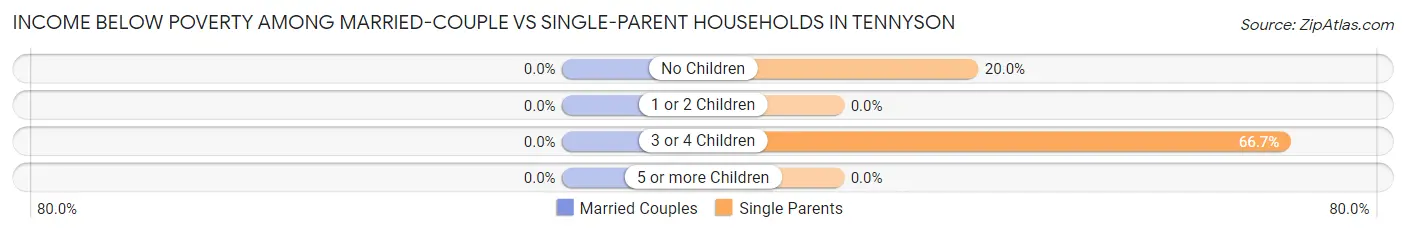
| Children | Married-Couple Families | Single-Parent Households |
| No Children | 0 (0.0%) | 1 (20.0%) |
| 1 or 2 Children | 0 (0.0%) | 0 (0.0%) |
| 3 or 4 Children | 0 (0.0%) | 2 (66.7%) |
| 5 or more Children | 0 (0.0%) | 0 (0.0%) |
| Total | 0 (0.0%) | 3 (17.6%) |
Race in Tennyson
The most populous races in Tennyson are White / Caucasian (368 | 98.4%), Asian (3 | 0.8%), and Black / African American (2 | 0.5%).
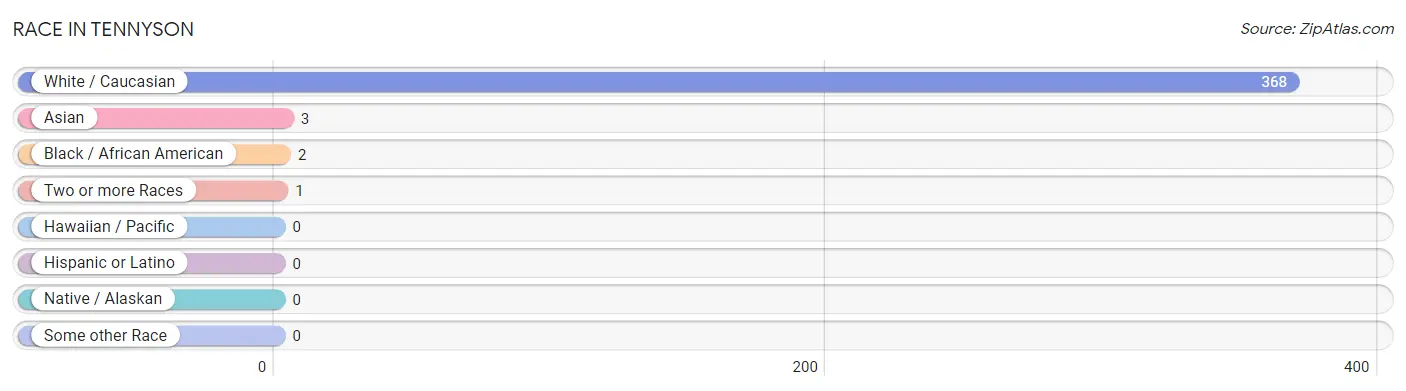
| Race | # Population | % Population |
| Asian | 3 | 0.8% |
| Black / African American | 2 | 0.5% |
| Hawaiian / Pacific | 0 | 0.0% |
| Hispanic or Latino | 0 | 0.0% |
| Native / Alaskan | 0 | 0.0% |
| White / Caucasian | 368 | 98.4% |
| Two or more Races | 1 | 0.3% |
| Some other Race | 0 | 0.0% |
| Total | 374 | 100.0% |
Ancestry in Tennyson
The most populous ancestries reported in Tennyson are German (213 | 57.0%), Irish (42 | 11.2%), Norwegian (14 | 3.7%), Polish (13 | 3.5%), and English (11 | 2.9%), together accounting for 78.3% of all Tennyson residents.
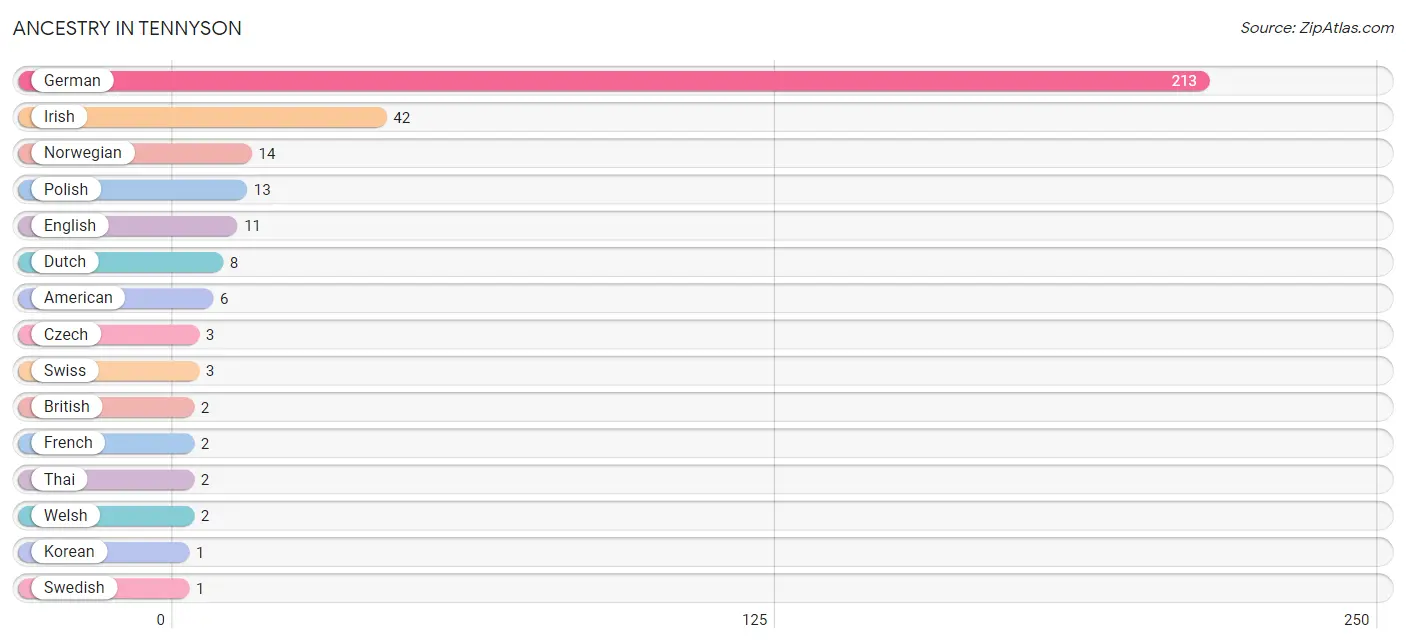
| Ancestry | # Population | % Population |
| American | 6 | 1.6% |
| British | 2 | 0.5% |
| Czech | 3 | 0.8% |
| Dutch | 8 | 2.1% |
| English | 11 | 2.9% |
| French | 2 | 0.5% |
| German | 213 | 57.0% |
| Irish | 42 | 11.2% |
| Korean | 1 | 0.3% |
| Norwegian | 14 | 3.7% |
| Polish | 13 | 3.5% |
| Swedish | 1 | 0.3% |
| Swiss | 3 | 0.8% |
| Thai | 2 | 0.5% |
| Welsh | 2 | 0.5% | View All 15 Rows |
Immigrants in Tennyson
The most numerous immigrant groups reported in Tennyson came from Asia (3 | 0.8%), India (2 | 0.5%), South Central Asia (2 | 0.5%), Philippines (1 | 0.3%), and South Eastern Asia (1 | 0.3%), together accounting for 2.4% of all Tennyson residents.
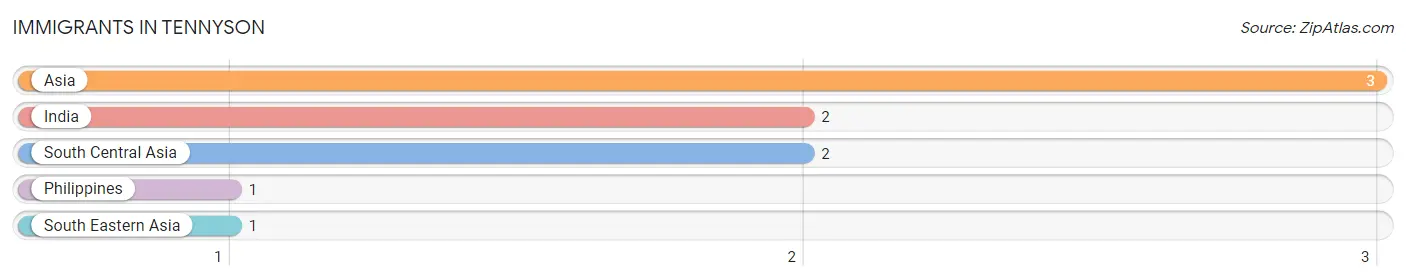
| Immigration Origin | # Population | % Population |
| Asia | 3 | 0.8% |
| India | 2 | 0.5% |
| Philippines | 1 | 0.3% |
| South Central Asia | 2 | 0.5% |
| South Eastern Asia | 1 | 0.3% | View All 5 Rows |
Sex and Age in Tennyson
Sex and Age in Tennyson
The most populous age groups in Tennyson are 15 to 19 Years (30 | 17.1%) for men and 85 Years and over (45 | 22.6%) for women.
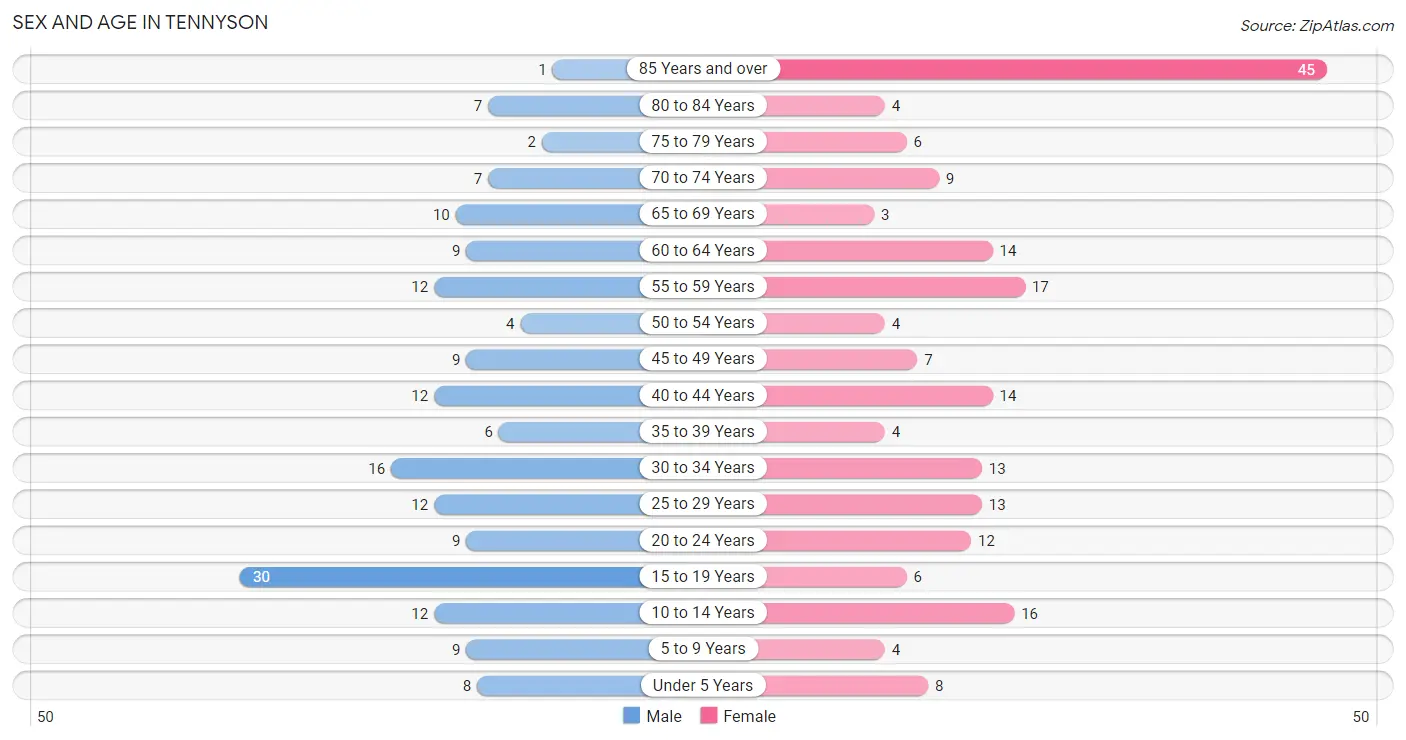
| Age Bracket | Male | Female |
| Under 5 Years | 8 (4.6%) | 8 (4.0%) |
| 5 to 9 Years | 9 (5.1%) | 4 (2.0%) |
| 10 to 14 Years | 12 (6.9%) | 16 (8.0%) |
| 15 to 19 Years | 30 (17.1%) | 6 (3.0%) |
| 20 to 24 Years | 9 (5.1%) | 12 (6.0%) |
| 25 to 29 Years | 12 (6.9%) | 13 (6.5%) |
| 30 to 34 Years | 16 (9.1%) | 13 (6.5%) |
| 35 to 39 Years | 6 (3.4%) | 4 (2.0%) |
| 40 to 44 Years | 12 (6.9%) | 14 (7.0%) |
| 45 to 49 Years | 9 (5.1%) | 7 (3.5%) |
| 50 to 54 Years | 4 (2.3%) | 4 (2.0%) |
| 55 to 59 Years | 12 (6.9%) | 17 (8.5%) |
| 60 to 64 Years | 9 (5.1%) | 14 (7.0%) |
| 65 to 69 Years | 10 (5.7%) | 3 (1.5%) |
| 70 to 74 Years | 7 (4.0%) | 9 (4.5%) |
| 75 to 79 Years | 2 (1.1%) | 6 (3.0%) |
| 80 to 84 Years | 7 (4.0%) | 4 (2.0%) |
| 85 Years and over | 1 (0.6%) | 45 (22.6%) |
| Total | 175 (100.0%) | 199 (100.0%) |
Families and Households in Tennyson
Median Family Size in Tennyson
The median family size in Tennyson is 2.93 persons per family, with single female/mother families (8 | 8.8%) accounting for the largest median family size of 3 persons per family. On the other hand, single male/father families (9 | 9.9%) represent the smallest median family size with 2.56 persons per family.
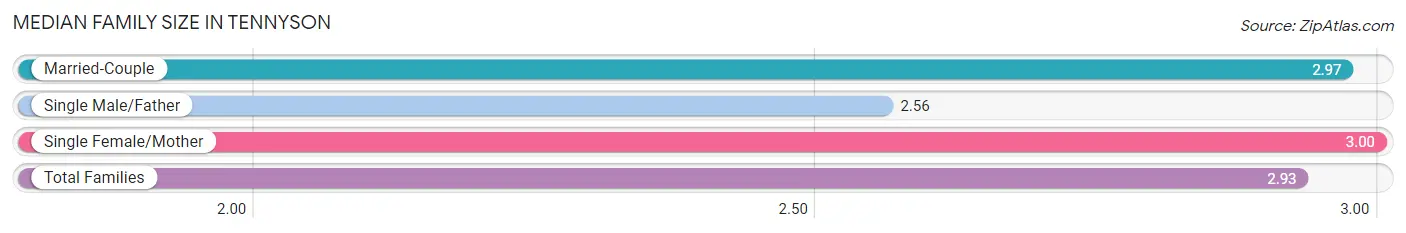
| Family Type | # Families | Family Size |
| Married-Couple | 74 (81.3%) | 2.97 |
| Single Male/Father | 9 (9.9%) | 2.56 |
| Single Female/Mother | 8 (8.8%) | 3.00 |
| Total Families | 91 (100.0%) | 2.93 |
Median Household Size in Tennyson
The median household size in Tennyson is 2.13 persons per household, with married-couple households (74 | 42.0%) accounting for the largest median household size of 3 persons per household. non-family households (85 | 48.3%) represent the smallest median household size with 1.21 persons per household.
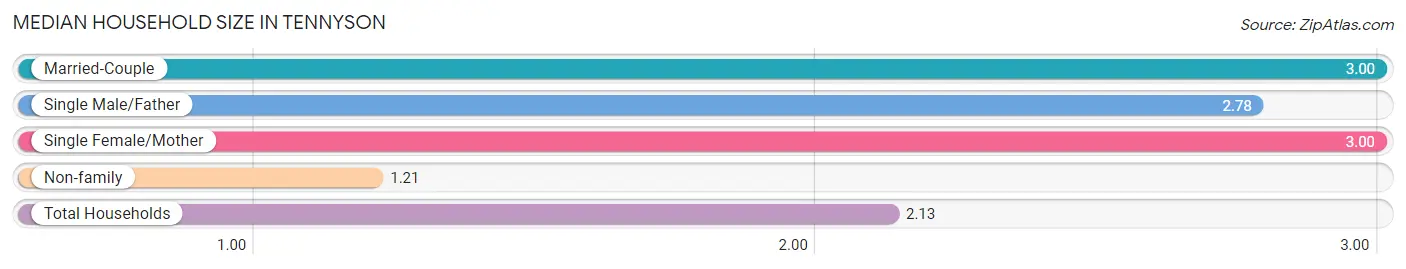
| Household Type | # Households | Household Size |
| Married-Couple | 74 (42.0%) | 3.00 |
| Single Male/Father | 9 (5.1%) | 2.78 |
| Single Female/Mother | 8 (4.5%) | 3.00 |
| Non-family | 85 (48.3%) | 1.21 |
| Total Households | 176 (100.0%) | 2.13 |
Household Size by Marriage Status in Tennyson
Out of a total of 176 households in Tennyson, 91 (51.7%) are family households, while 85 (48.3%) are nonfamily households. The most numerous type of family households are 2-person households, comprising 40, and the most common type of nonfamily households are 1-person households, comprising 71.
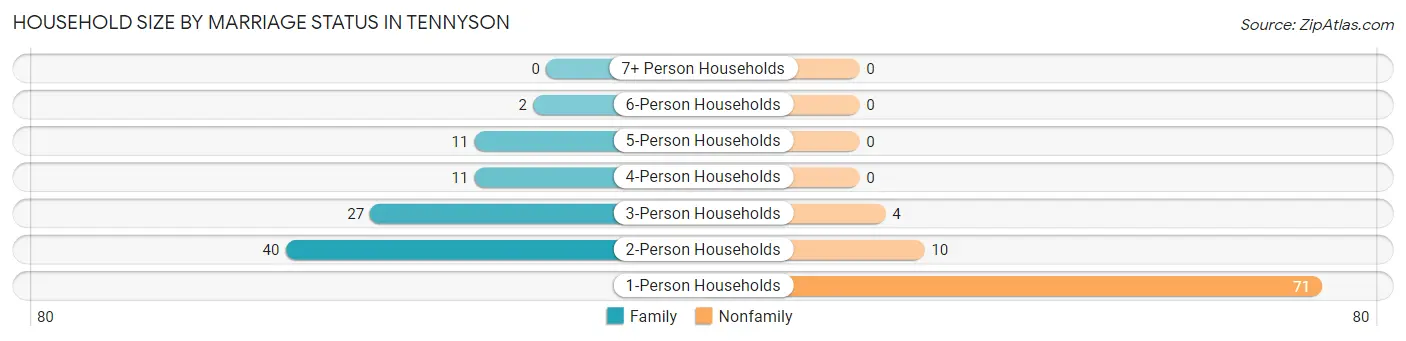
| Household Size | Family Households | Nonfamily Households |
| 1-Person Households | - | 71 (40.3%) |
| 2-Person Households | 40 (22.7%) | 10 (5.7%) |
| 3-Person Households | 27 (15.3%) | 4 (2.3%) |
| 4-Person Households | 11 (6.2%) | 0 (0.0%) |
| 5-Person Households | 11 (6.2%) | 0 (0.0%) |
| 6-Person Households | 2 (1.1%) | 0 (0.0%) |
| 7+ Person Households | 0 (0.0%) | 0 (0.0%) |
| Total | 91 (51.7%) | 85 (48.3%) |
Female Fertility in Tennyson
Fertility by Age in Tennyson
Average fertility rate in Tennyson is 43.0 births per 1,000 women. Women in the age bracket of 20 to 34 years have the highest fertility rate with 79.0 births per 1,000 women. Women in the age bracket of 20 to 34 years acount for 100.0% of all women with births.
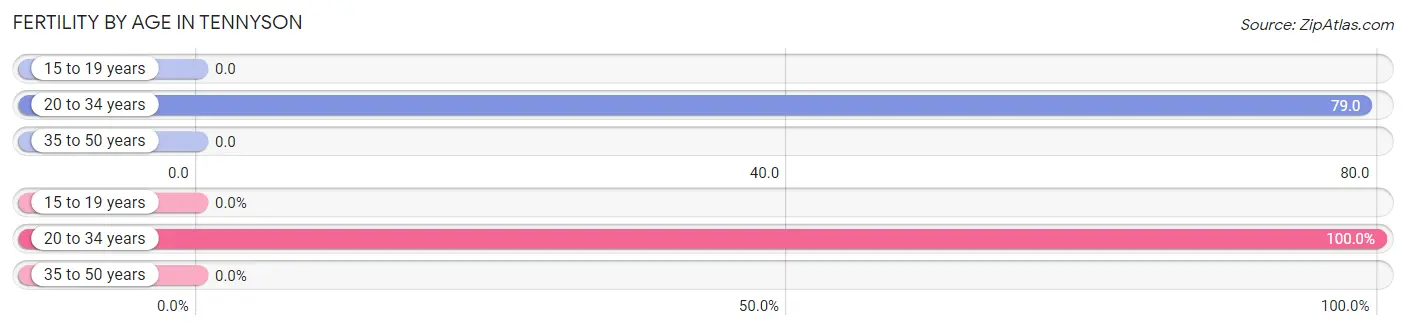
| Age Bracket | Women with Births | Births / 1,000 Women |
| 15 to 19 years | 0 (0.0%) | 0.0 |
| 20 to 34 years | 3 (100.0%) | 79.0 |
| 35 to 50 years | 0 (0.0%) | 0.0 |
| Total | 3 (100.0%) | 43.0 |
Fertility by Age by Marriage Status in Tennyson
66.7% of women with births (3) in Tennyson are married. The highest percentage of unmarried women with births falls into 20 to 34 years age bracket with 33.3% of them unmarried at the time of birth, while the lowest percentage of unmarried women with births belong to 20 to 34 years age bracket with 33.3% of them unmarried.
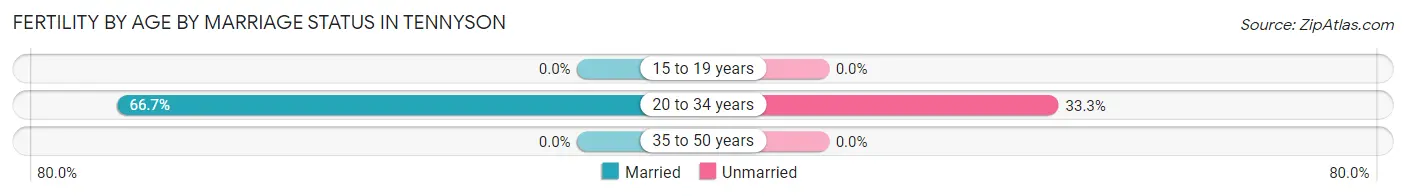
| Age Bracket | Married | Unmarried |
| 15 to 19 years | 0 (0.0%) | 0 (0.0%) |
| 20 to 34 years | 2 (66.7%) | 1 (33.3%) |
| 35 to 50 years | 0 (0.0%) | 0 (0.0%) |
| Total | 2 (66.7%) | 1 (33.3%) |
Fertility by Education in Tennyson
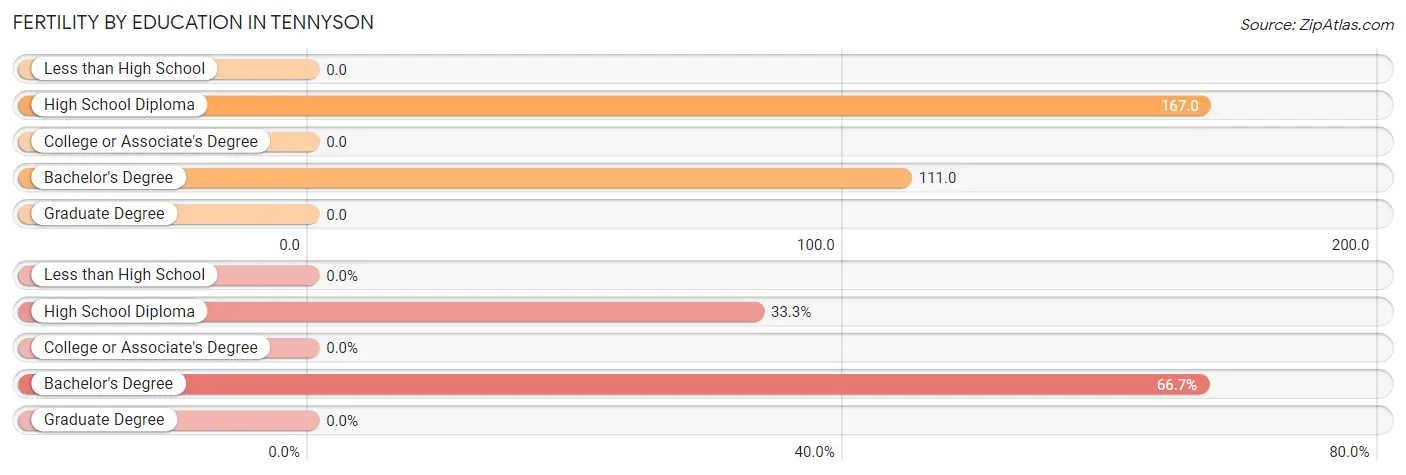
| Educational Attainment | Women with Births | Births / 1,000 Women |
| Less than High School | 0 (0.0%) | 0.0 |
| High School Diploma | 1 (33.3%) | 167.0 |
| College or Associate's Degree | 0 (0.0%) | 0.0 |
| Bachelor's Degree | 2 (66.7%) | 111.0 |
| Graduate Degree | 0 (0.0%) | 0.0 |
| Total | 3 (100.0%) | 43.0 |
Fertility by Education by Marriage Status in Tennyson
33.3% of women with births in Tennyson are unmarried. Women with the educational attainment of bachelor's degree are most likely to be married with 100.0% of them married at childbirth, while women with the educational attainment of high school diploma are least likely to be married with 100.0% of them unmarried at childbirth.
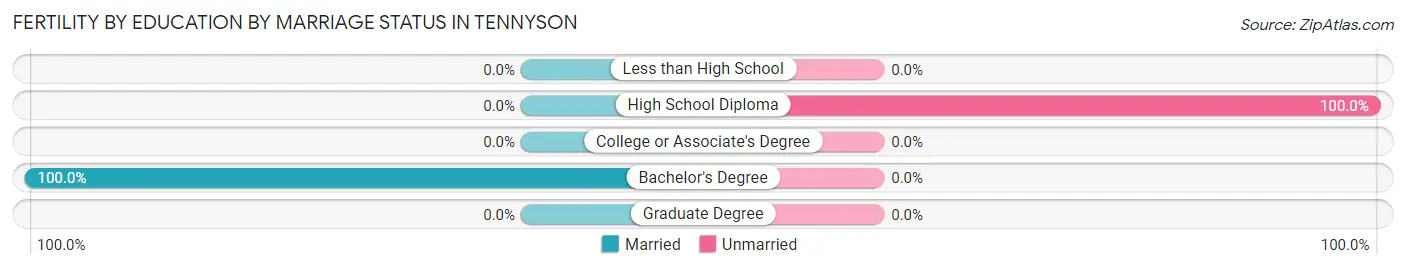
| Educational Attainment | Married | Unmarried |
| Less than High School | 0 (0.0%) | 0 (0.0%) |
| High School Diploma | 0 (0.0%) | 1 (100.0%) |
| College or Associate's Degree | 0 (0.0%) | 0 (0.0%) |
| Bachelor's Degree | 2 (100.0%) | 0 (0.0%) |
| Graduate Degree | 0 (0.0%) | 0 (0.0%) |
| Total | 2 (66.7%) | 1 (33.3%) |
Employment Characteristics in Tennyson
Employment by Class of Employer in Tennyson
Among the 189 employed individuals in Tennyson, private company employees (148 | 78.3%), local government employees (18 | 9.5%), and not-for-profit organizations (13 | 6.9%) make up the most common classes of employment.
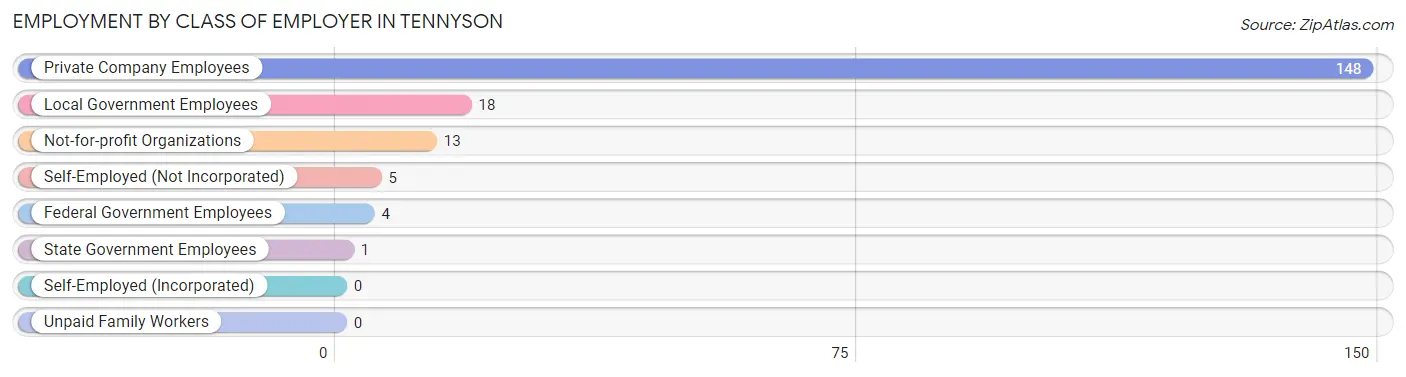
| Employer Class | # Employees | % Employees |
| Private Company Employees | 148 | 78.3% |
| Self-Employed (Incorporated) | 0 | 0.0% |
| Self-Employed (Not Incorporated) | 5 | 2.6% |
| Not-for-profit Organizations | 13 | 6.9% |
| Local Government Employees | 18 | 9.5% |
| State Government Employees | 1 | 0.5% |
| Federal Government Employees | 4 | 2.1% |
| Unpaid Family Workers | 0 | 0.0% |
| Total | 189 | 100.0% |
Employment Status by Age in Tennyson
According to the labor force statistics for Tennyson, out of the total population over 16 years of age (316), 61.7% or 195 individuals are in the labor force, with 2.1% or 4 of them unemployed. The age group with the highest labor force participation rate is 25 to 29 years, with 100.0% or 25 individuals in the labor force. Within the labor force, the 16 to 19 years age range has the highest percentage of unemployed individuals, with 16.7% or 2 of them being unemployed.
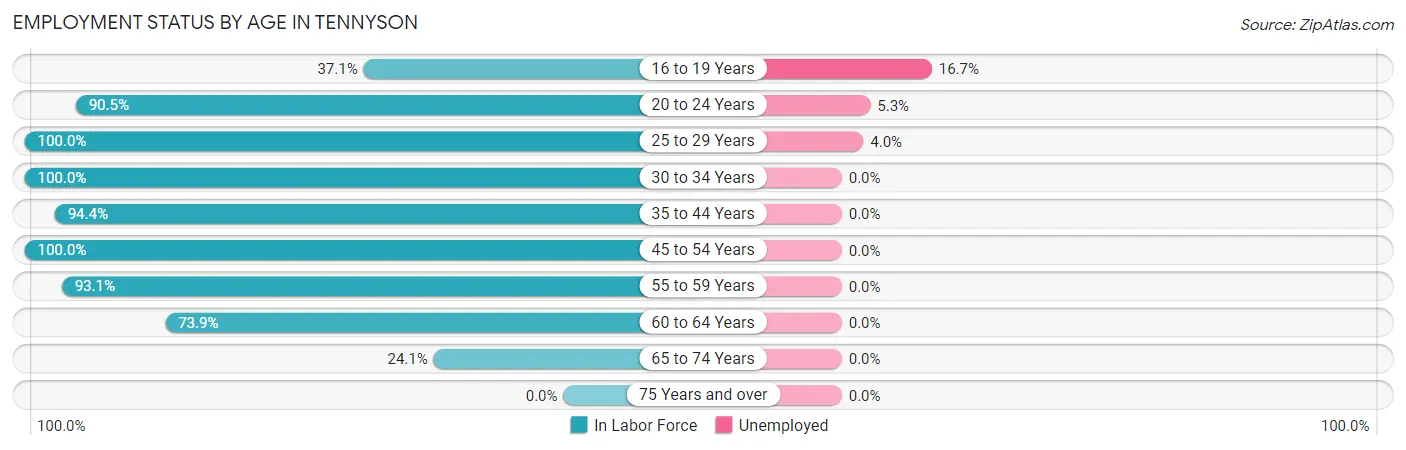
| Age Bracket | In Labor Force | Unemployed |
| 16 to 19 Years | 13 (37.1%) | 2 (16.7%) |
| 20 to 24 Years | 19 (90.5%) | 1 (5.3%) |
| 25 to 29 Years | 25 (100.0%) | 1 (4.0%) |
| 30 to 34 Years | 29 (100.0%) | 0 (0.0%) |
| 35 to 44 Years | 34 (94.4%) | 0 (0.0%) |
| 45 to 54 Years | 24 (100.0%) | 0 (0.0%) |
| 55 to 59 Years | 27 (93.1%) | 0 (0.0%) |
| 60 to 64 Years | 17 (73.9%) | 0 (0.0%) |
| 65 to 74 Years | 7 (24.1%) | 0 (0.0%) |
| 75 Years and over | 0 (0.0%) | 0 (0.0%) |
| Total | 195 (61.7%) | 4 (2.1%) |
Employment Status by Educational Attainment in Tennyson
According to labor force statistics for Tennyson, 94.0% of individuals (156) out of the total population between 25 and 64 years of age (166) are in the labor force, with 0.6% or 1 of them being unemployed. The group with the highest labor force participation rate are those with the educational attainment of college / associate degree, with 98.7% or 76 individuals in the labor force. Within the labor force, individuals with bachelor's degree or higher education have the highest percentage of unemployment, with 2.5% or 1 of them being unemployed.
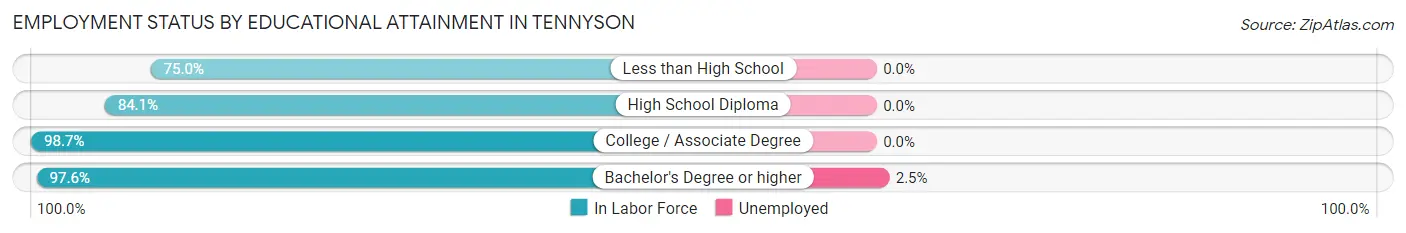
| Educational Attainment | In Labor Force | Unemployed |
| Less than High School | 3 (75.0%) | 0 (0.0%) |
| High School Diploma | 37 (84.1%) | 0 (0.0%) |
| College / Associate Degree | 76 (98.7%) | 0 (0.0%) |
| Bachelor's Degree or higher | 40 (97.6%) | 1 (2.5%) |
| Total | 156 (94.0%) | 1 (0.6%) |
Employment Occupations by Sex in Tennyson
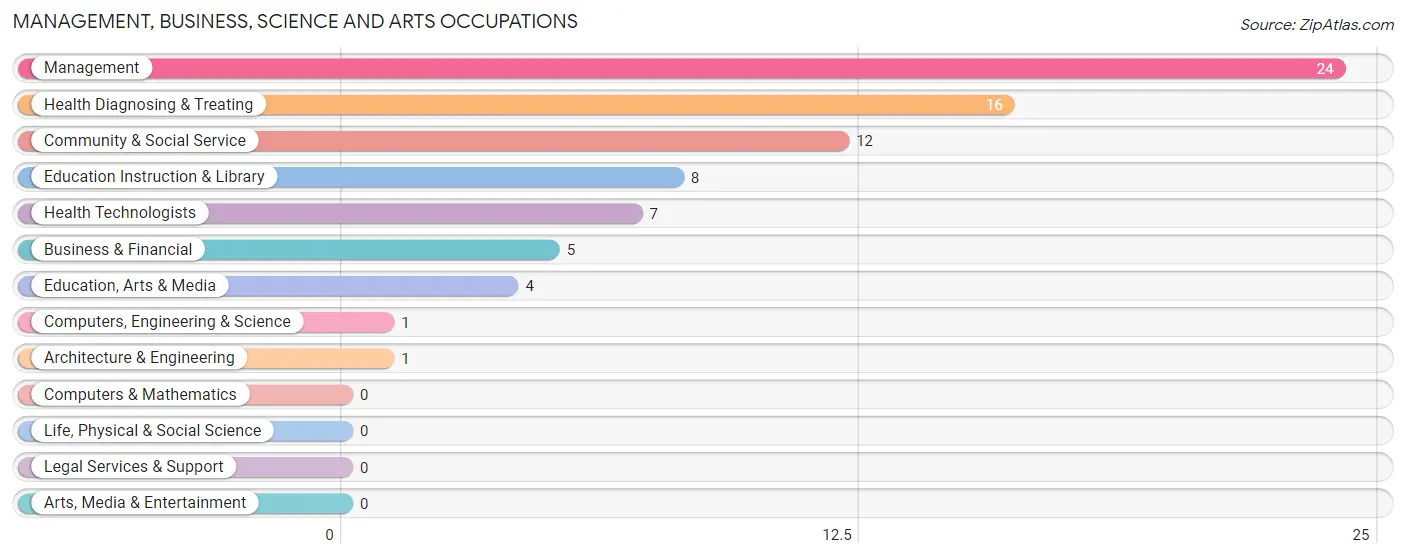
Management, Business, Science and Arts Occupations
The most common Management, Business, Science and Arts occupations in Tennyson are Management (24 | 12.6%), Health Diagnosing & Treating (16 | 8.4%), Community & Social Service (12 | 6.3%), Education Instruction & Library (8 | 4.2%), and Health Technologists (7 | 3.7%).
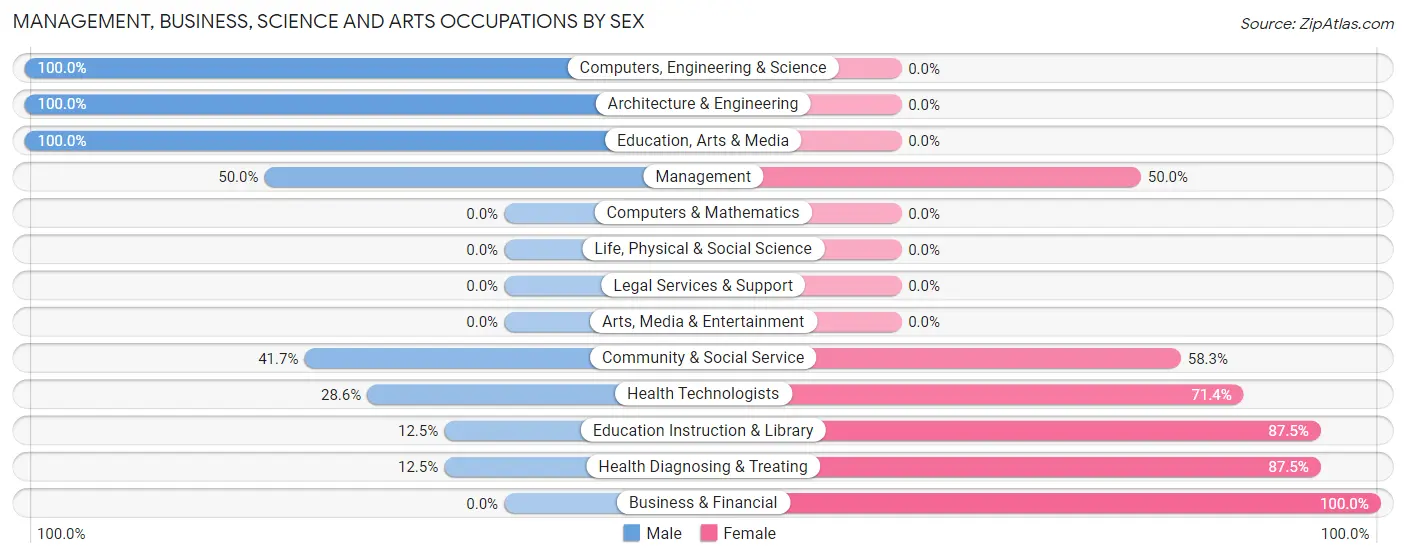
Management, Business, Science and Arts Occupations by Sex
Within the Management, Business, Science and Arts occupations in Tennyson, the most male-oriented occupations are Computers, Engineering & Science (100.0%), Architecture & Engineering (100.0%), and Education, Arts & Media (100.0%), while the most female-oriented occupations are Business & Financial (100.0%), Education Instruction & Library (87.5%), and Health Diagnosing & Treating (87.5%).
| Occupation | Male | Female |
| Management | 12 (50.0%) | 12 (50.0%) |
| Business & Financial | 0 (0.0%) | 5 (100.0%) |
| Computers, Engineering & Science | 1 (100.0%) | 0 (0.0%) |
| Computers & Mathematics | 0 (0.0%) | 0 (0.0%) |
| Architecture & Engineering | 1 (100.0%) | 0 (0.0%) |
| Life, Physical & Social Science | 0 (0.0%) | 0 (0.0%) |
| Community & Social Service | 5 (41.7%) | 7 (58.3%) |
| Education, Arts & Media | 4 (100.0%) | 0 (0.0%) |
| Legal Services & Support | 0 (0.0%) | 0 (0.0%) |
| Education Instruction & Library | 1 (12.5%) | 7 (87.5%) |
| Arts, Media & Entertainment | 0 (0.0%) | 0 (0.0%) |
| Health Diagnosing & Treating | 2 (12.5%) | 14 (87.5%) |
| Health Technologists | 2 (28.6%) | 5 (71.4%) |
| Total (Category) | 20 (34.5%) | 38 (65.5%) |
| Total (Overall) | 93 (48.9%) | 97 (51.0%) |
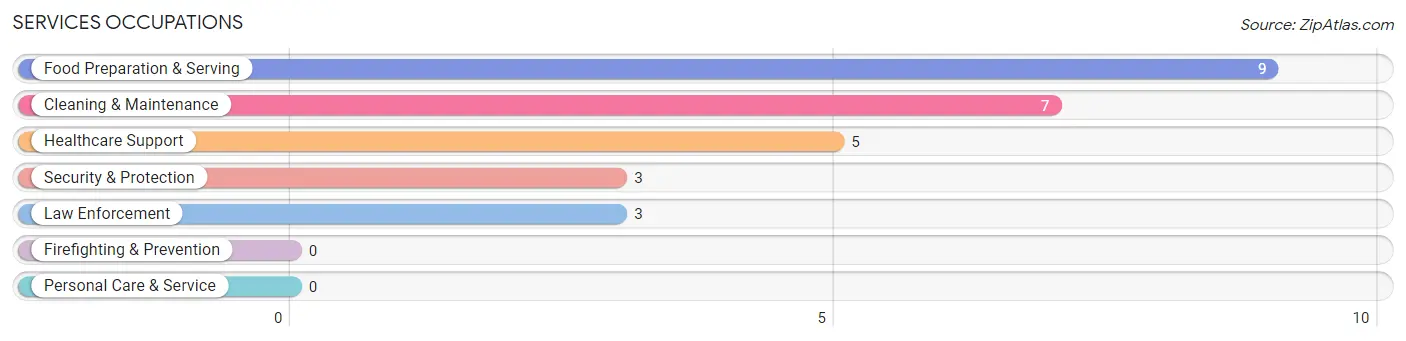
Services Occupations
The most common Services occupations in Tennyson are Food Preparation & Serving (9 | 4.7%), Cleaning & Maintenance (7 | 3.7%), Healthcare Support (5 | 2.6%), Security & Protection (3 | 1.6%), and Law Enforcement (3 | 1.6%).
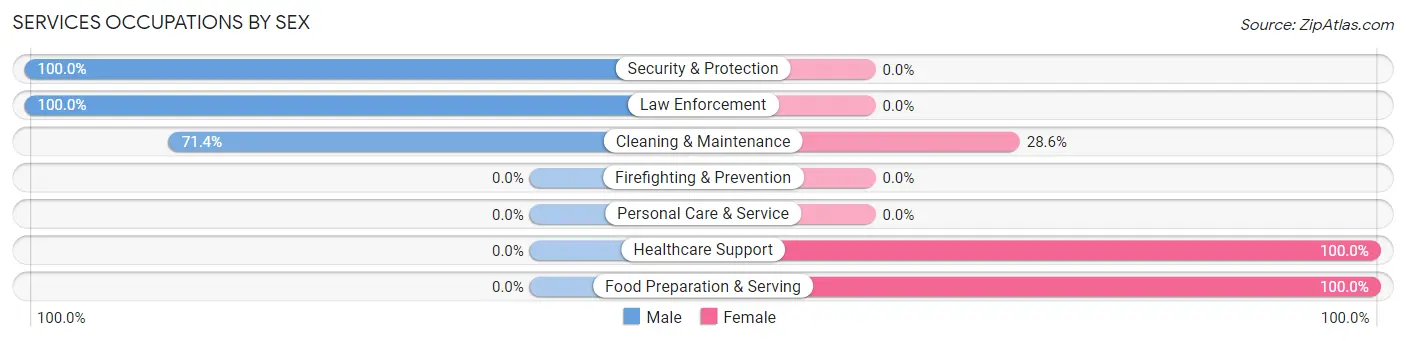
Services Occupations by Sex
Within the Services occupations in Tennyson, the most male-oriented occupations are Security & Protection (100.0%), Law Enforcement (100.0%), and Cleaning & Maintenance (71.4%), while the most female-oriented occupations are Healthcare Support (100.0%), Food Preparation & Serving (100.0%), and Cleaning & Maintenance (28.6%).
| Occupation | Male | Female |
| Healthcare Support | 0 (0.0%) | 5 (100.0%) |
| Security & Protection | 3 (100.0%) | 0 (0.0%) |
| Firefighting & Prevention | 0 (0.0%) | 0 (0.0%) |
| Law Enforcement | 3 (100.0%) | 0 (0.0%) |
| Food Preparation & Serving | 0 (0.0%) | 9 (100.0%) |
| Cleaning & Maintenance | 5 (71.4%) | 2 (28.6%) |
| Personal Care & Service | 0 (0.0%) | 0 (0.0%) |
| Total (Category) | 8 (33.3%) | 16 (66.7%) |
| Total (Overall) | 93 (48.9%) | 97 (51.0%) |
Sales and Office Occupations
The most common Sales and Office occupations in Tennyson are Office & Administration (36 | 19.0%), and Sales & Related (14 | 7.4%).
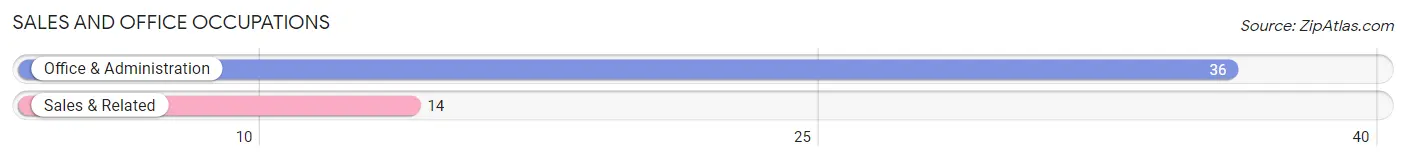
Sales and Office Occupations by Sex
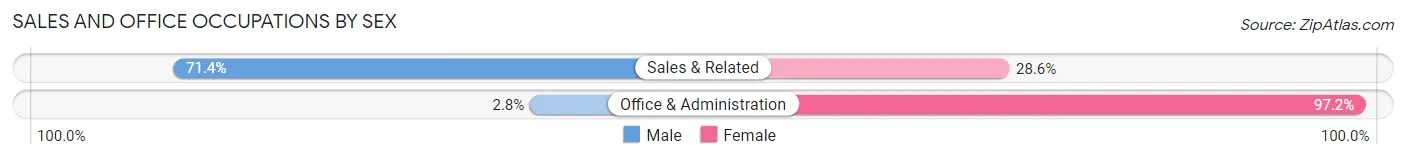
| Occupation | Male | Female |
| Sales & Related | 10 (71.4%) | 4 (28.6%) |
| Office & Administration | 1 (2.8%) | 35 (97.2%) |
| Total (Category) | 11 (22.0%) | 39 (78.0%) |
| Total (Overall) | 93 (48.9%) | 97 (51.0%) |
Natural Resources, Construction and Maintenance Occupations
The most common Natural Resources, Construction and Maintenance occupations in Tennyson are Construction & Extraction (9 | 4.7%), Farming, Fishing & Forestry (6 | 3.2%), and Installation, Maintenance & Repair (5 | 2.6%).
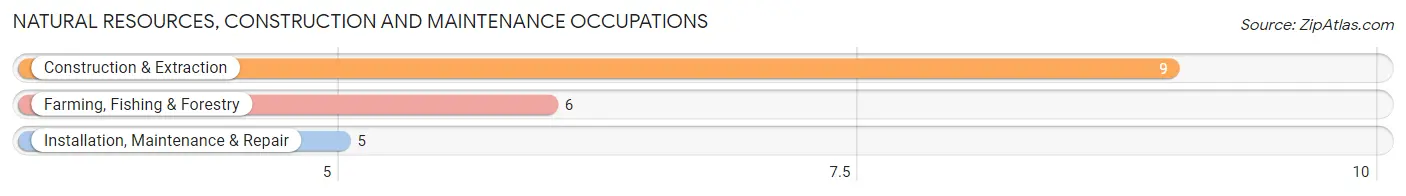
Natural Resources, Construction and Maintenance Occupations by Sex
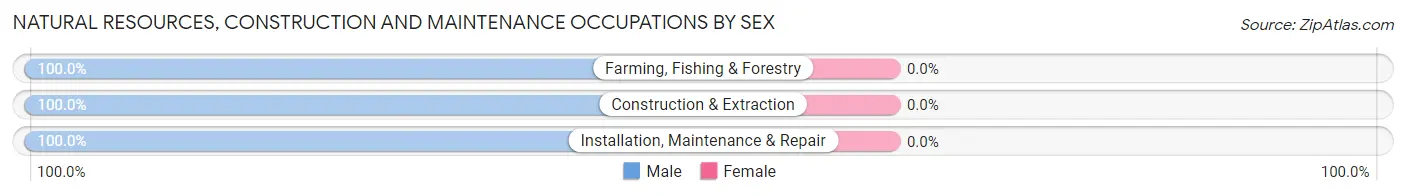
| Occupation | Male | Female |
| Farming, Fishing & Forestry | 6 (100.0%) | 0 (0.0%) |
| Construction & Extraction | 9 (100.0%) | 0 (0.0%) |
| Installation, Maintenance & Repair | 5 (100.0%) | 0 (0.0%) |
| Total (Category) | 20 (100.0%) | 0 (0.0%) |
| Total (Overall) | 93 (48.9%) | 97 (51.0%) |
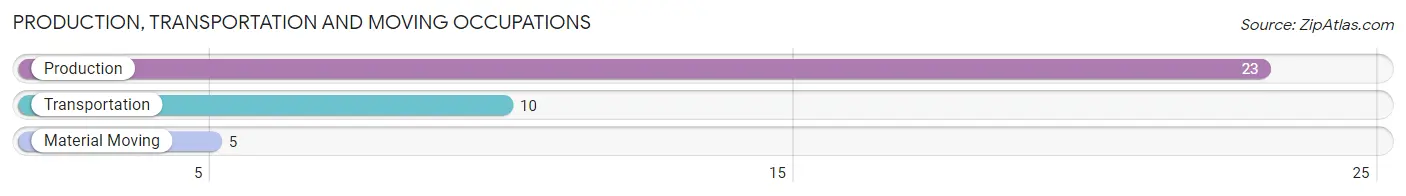
Production, Transportation and Moving Occupations
The most common Production, Transportation and Moving occupations in Tennyson are Production (23 | 12.1%), Transportation (10 | 5.3%), and Material Moving (5 | 2.6%).
Production, Transportation and Moving Occupations by Sex
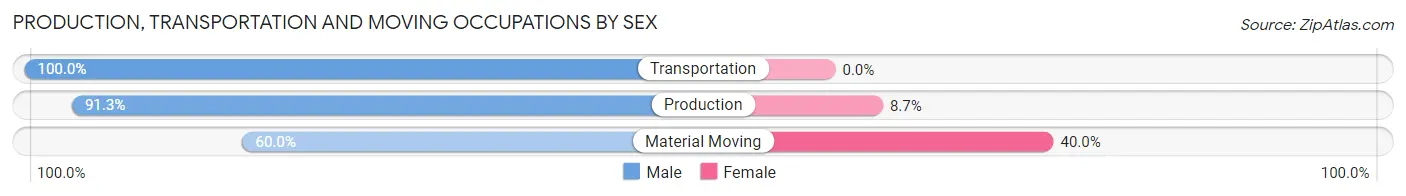
| Occupation | Male | Female |
| Production | 21 (91.3%) | 2 (8.7%) |
| Transportation | 10 (100.0%) | 0 (0.0%) |
| Material Moving | 3 (60.0%) | 2 (40.0%) |
| Total (Category) | 34 (89.5%) | 4 (10.5%) |
| Total (Overall) | 93 (48.9%) | 97 (51.0%) |
Employment Industries by Sex in Tennyson
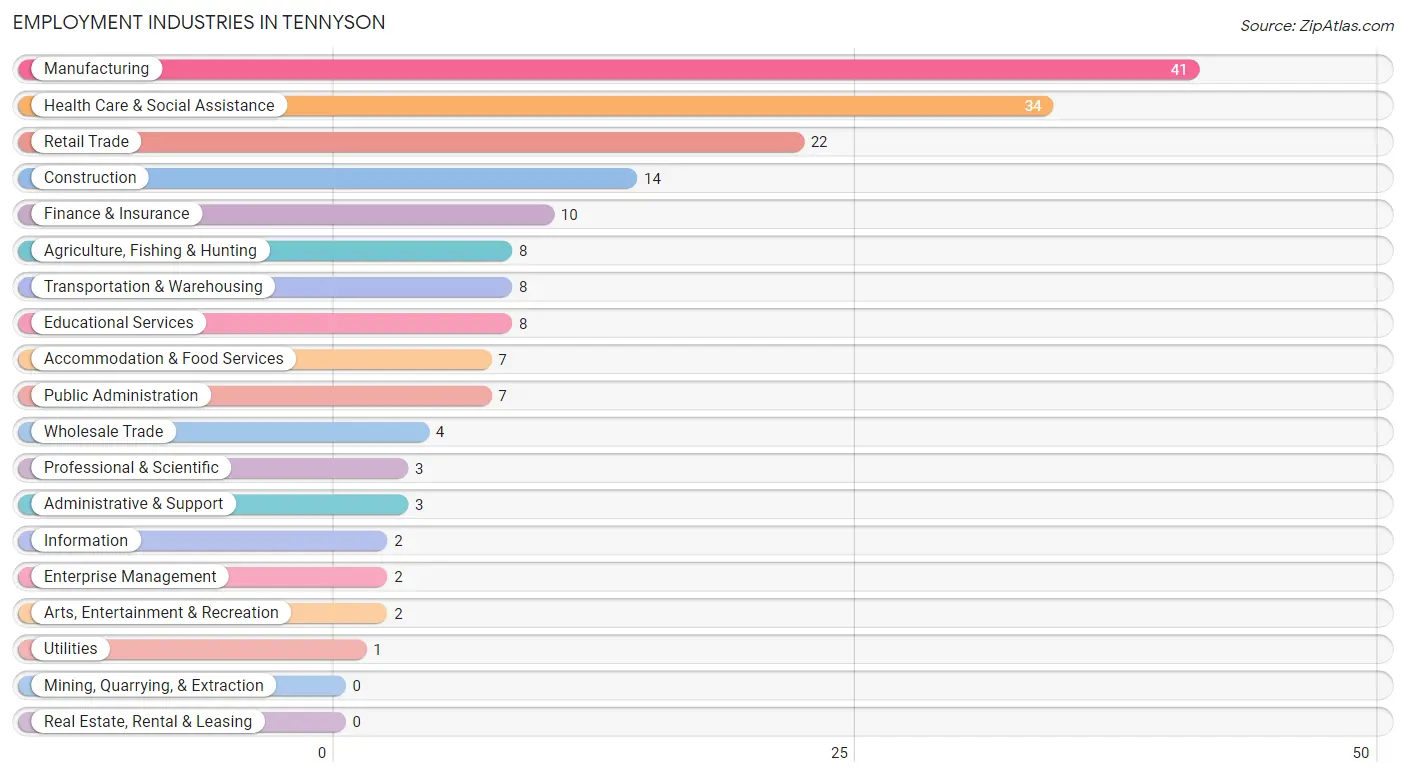
Employment Industries in Tennyson
The major employment industries in Tennyson include Manufacturing (41 | 21.6%), Health Care & Social Assistance (34 | 17.9%), Retail Trade (22 | 11.6%), Construction (14 | 7.4%), and Finance & Insurance (10 | 5.3%).
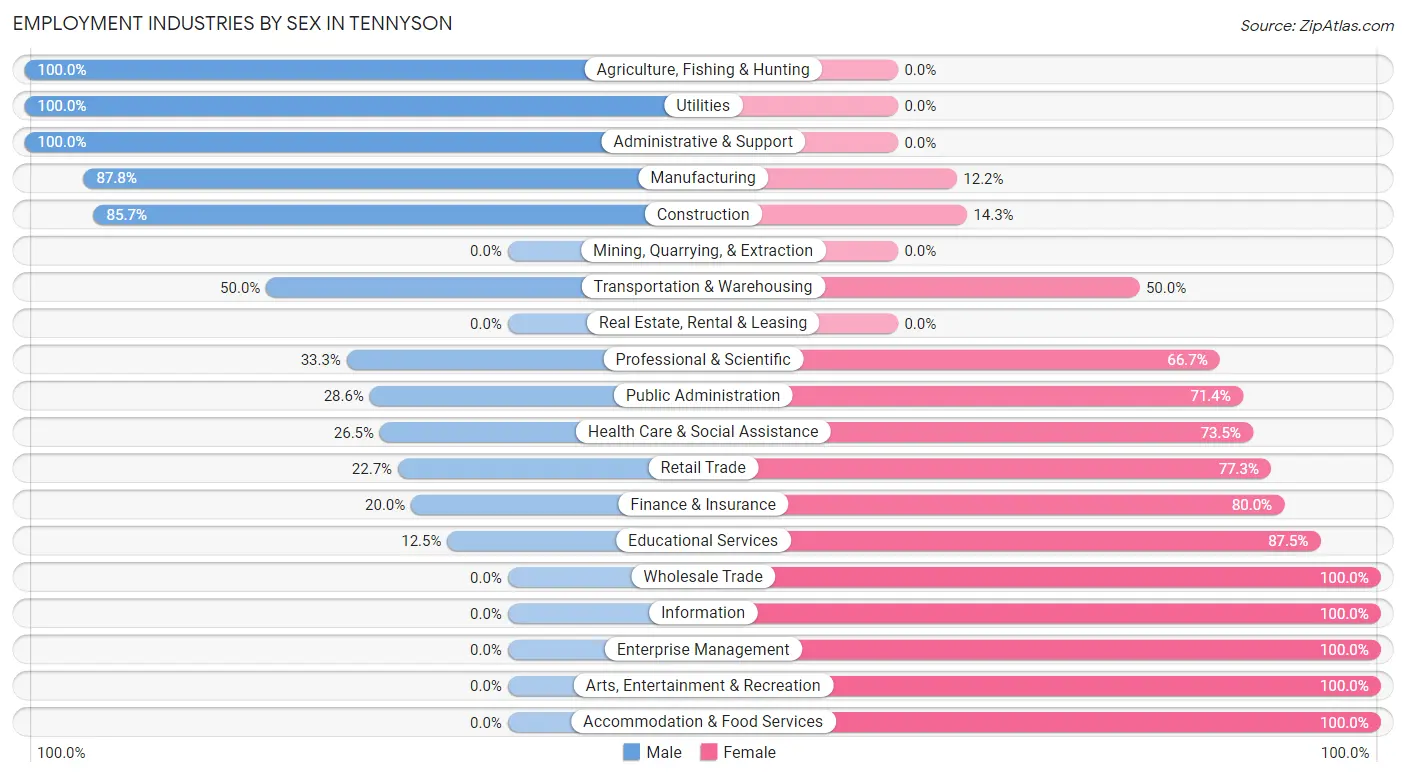
Employment Industries by Sex in Tennyson
The Tennyson industries that see more men than women are Agriculture, Fishing & Hunting (100.0%), Utilities (100.0%), and Administrative & Support (100.0%), whereas the industries that tend to have a higher number of women are Wholesale Trade (100.0%), Information (100.0%), and Enterprise Management (100.0%).
| Industry | Male | Female |
| Agriculture, Fishing & Hunting | 8 (100.0%) | 0 (0.0%) |
| Mining, Quarrying, & Extraction | 0 (0.0%) | 0 (0.0%) |
| Construction | 12 (85.7%) | 2 (14.3%) |
| Manufacturing | 36 (87.8%) | 5 (12.2%) |
| Wholesale Trade | 0 (0.0%) | 4 (100.0%) |
| Retail Trade | 5 (22.7%) | 17 (77.3%) |
| Transportation & Warehousing | 4 (50.0%) | 4 (50.0%) |
| Utilities | 1 (100.0%) | 0 (0.0%) |
| Information | 0 (0.0%) | 2 (100.0%) |
| Finance & Insurance | 2 (20.0%) | 8 (80.0%) |
| Real Estate, Rental & Leasing | 0 (0.0%) | 0 (0.0%) |
| Professional & Scientific | 1 (33.3%) | 2 (66.7%) |
| Enterprise Management | 0 (0.0%) | 2 (100.0%) |
| Administrative & Support | 3 (100.0%) | 0 (0.0%) |
| Educational Services | 1 (12.5%) | 7 (87.5%) |
| Health Care & Social Assistance | 9 (26.5%) | 25 (73.5%) |
| Arts, Entertainment & Recreation | 0 (0.0%) | 2 (100.0%) |
| Accommodation & Food Services | 0 (0.0%) | 7 (100.0%) |
| Public Administration | 2 (28.6%) | 5 (71.4%) |
| Total | 93 (48.9%) | 97 (51.0%) |
Education in Tennyson
School Enrollment in Tennyson
The most common levels of schooling among the 87 students in Tennyson are high school (31 | 35.6%), middle school (22 | 25.3%), and elementary school (12 | 13.8%).
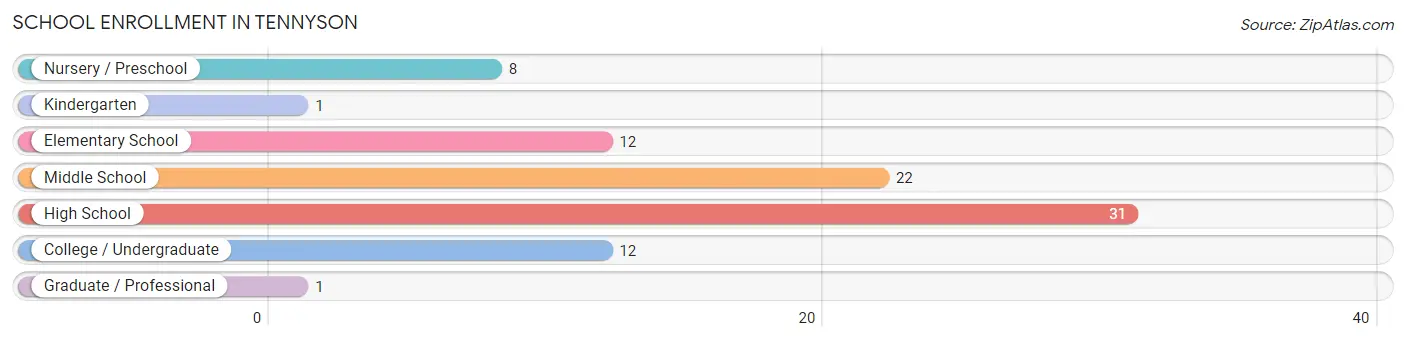
| School Level | # Students | % Students |
| Nursery / Preschool | 8 | 9.2% |
| Kindergarten | 1 | 1.1% |
| Elementary School | 12 | 13.8% |
| Middle School | 22 | 25.3% |
| High School | 31 | 35.6% |
| College / Undergraduate | 12 | 13.8% |
| Graduate / Professional | 1 | 1.1% |
| Total | 87 | 100.0% |
School Enrollment by Age by Funding Source in Tennyson
Out of a total of 87 students who are enrolled in schools in Tennyson, 11 (12.6%) attend a private institution, while the remaining 76 (87.4%) are enrolled in public schools. The age group of 3 to 4 year olds has the highest likelihood of being enrolled in private schools, with 3 (60.0% in the age bracket) enrolled. Conversely, the age group of 15 to 17 year olds has the lowest likelihood of being enrolled in a private school, with 12 (100.0% in the age bracket) attending a public institution.
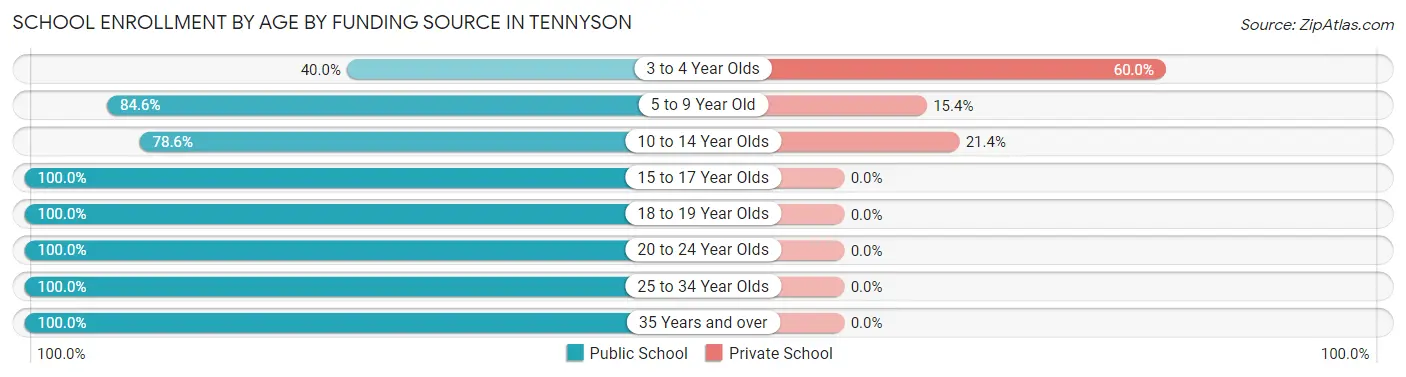
| Age Bracket | Public School | Private School |
| 3 to 4 Year Olds | 2 (40.0%) | 3 (60.0%) |
| 5 to 9 Year Old | 11 (84.6%) | 2 (15.4%) |
| 10 to 14 Year Olds | 22 (78.6%) | 6 (21.4%) |
| 15 to 17 Year Olds | 12 (100.0%) | 0 (0.0%) |
| 18 to 19 Year Olds | 20 (100.0%) | 0 (0.0%) |
| 20 to 24 Year Olds | 1 (100.0%) | 0 (0.0%) |
| 25 to 34 Year Olds | 6 (100.0%) | 0 (0.0%) |
| 35 Years and over | 2 (100.0%) | 0 (0.0%) |
| Total | 76 (87.4%) | 11 (12.6%) |
Educational Attainment by Field of Study in Tennyson
Arts & humanities (10 | 20.0%), psychology (8 | 16.0%), education (8 | 16.0%), science & technology (7 | 14.0%), and business (6 | 12.0%) are the most common fields of study among 50 individuals in Tennyson who have obtained a bachelor's degree or higher.
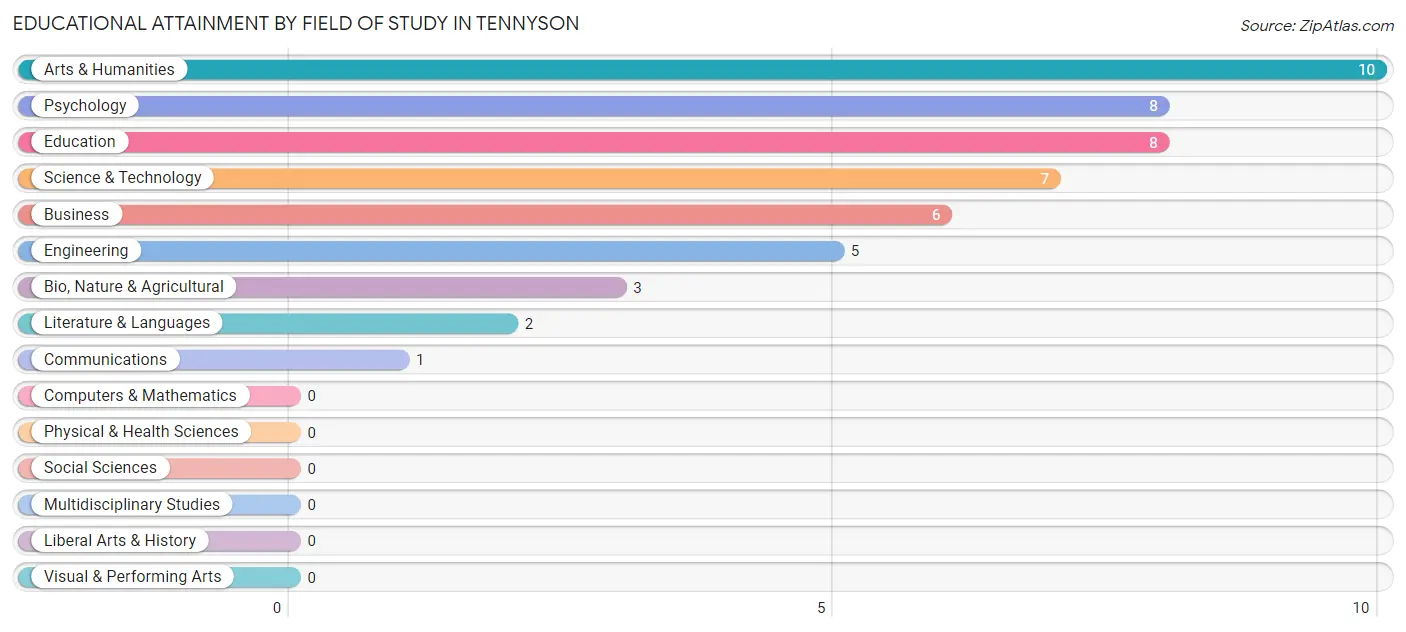
| Field of Study | # Graduates | % Graduates |
| Computers & Mathematics | 0 | 0.0% |
| Bio, Nature & Agricultural | 3 | 6.0% |
| Physical & Health Sciences | 0 | 0.0% |
| Psychology | 8 | 16.0% |
| Social Sciences | 0 | 0.0% |
| Engineering | 5 | 10.0% |
| Multidisciplinary Studies | 0 | 0.0% |
| Science & Technology | 7 | 14.0% |
| Business | 6 | 12.0% |
| Education | 8 | 16.0% |
| Literature & Languages | 2 | 4.0% |
| Liberal Arts & History | 0 | 0.0% |
| Visual & Performing Arts | 0 | 0.0% |
| Communications | 1 | 2.0% |
| Arts & Humanities | 10 | 20.0% |
| Total | 50 | 100.0% |
Transportation & Commute in Tennyson
Vehicle Availability by Sex in Tennyson
The most prevalent vehicle ownership categories in Tennyson are males with 3 vehicles (36, accounting for 39.1%) and females with 3 vehicles (39, making up 37.1%).
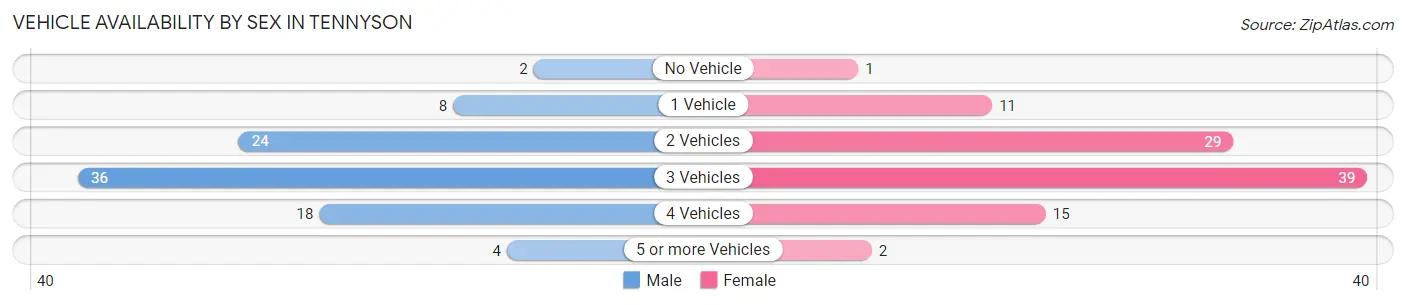
| Vehicles Available | Male | Female |
| No Vehicle | 2 (2.2%) | 1 (1.0%) |
| 1 Vehicle | 8 (8.7%) | 11 (11.3%) |
| 2 Vehicles | 24 (26.1%) | 29 (29.9%) |
| 3 Vehicles | 36 (39.1%) | 39 (40.2%) |
| 4 Vehicles | 18 (19.6%) | 15 (15.5%) |
| 5 or more Vehicles | 4 (4.3%) | 2 (2.1%) |
| Total | 92 (100.0%) | 97 (100.0%) |
Commute Time in Tennyson
The most frequently occuring commute durations in Tennyson are 15 to 19 minutes (31 commuters, 17.2%), 20 to 24 minutes (29 commuters, 16.1%), and 25 to 29 minutes (20 commuters, 11.1%).
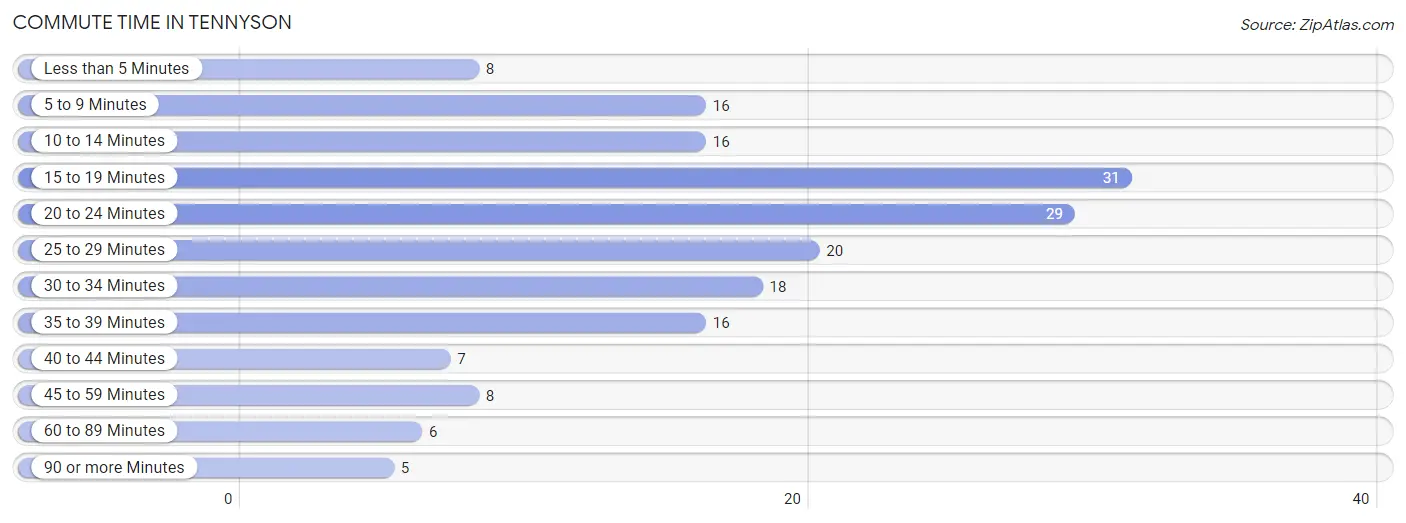
| Commute Time | # Commuters | % Commuters |
| Less than 5 Minutes | 8 | 4.4% |
| 5 to 9 Minutes | 16 | 8.9% |
| 10 to 14 Minutes | 16 | 8.9% |
| 15 to 19 Minutes | 31 | 17.2% |
| 20 to 24 Minutes | 29 | 16.1% |
| 25 to 29 Minutes | 20 | 11.1% |
| 30 to 34 Minutes | 18 | 10.0% |
| 35 to 39 Minutes | 16 | 8.9% |
| 40 to 44 Minutes | 7 | 3.9% |
| 45 to 59 Minutes | 8 | 4.4% |
| 60 to 89 Minutes | 6 | 3.3% |
| 90 or more Minutes | 5 | 2.8% |
Commute Time by Sex in Tennyson
The most common commute times in Tennyson are 20 to 24 minutes (23 commuters, 26.1%) for males and 15 to 19 minutes (18 commuters, 19.6%) for females.
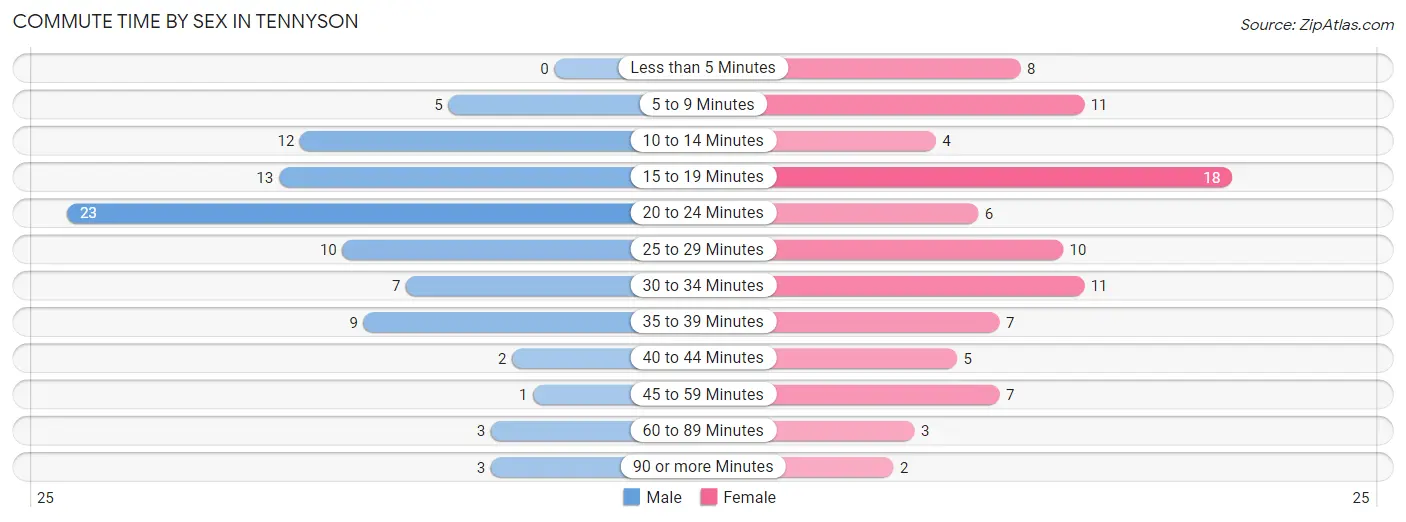
| Commute Time | Male | Female |
| Less than 5 Minutes | 0 (0.0%) | 8 (8.7%) |
| 5 to 9 Minutes | 5 (5.7%) | 11 (12.0%) |
| 10 to 14 Minutes | 12 (13.6%) | 4 (4.3%) |
| 15 to 19 Minutes | 13 (14.8%) | 18 (19.6%) |
| 20 to 24 Minutes | 23 (26.1%) | 6 (6.5%) |
| 25 to 29 Minutes | 10 (11.4%) | 10 (10.9%) |
| 30 to 34 Minutes | 7 (8.0%) | 11 (12.0%) |
| 35 to 39 Minutes | 9 (10.2%) | 7 (7.6%) |
| 40 to 44 Minutes | 2 (2.3%) | 5 (5.4%) |
| 45 to 59 Minutes | 1 (1.1%) | 7 (7.6%) |
| 60 to 89 Minutes | 3 (3.4%) | 3 (3.3%) |
| 90 or more Minutes | 3 (3.4%) | 2 (2.2%) |
Time of Departure to Work by Sex in Tennyson
The most frequent times of departure to work in Tennyson are 7:00 AM to 7:29 AM (15, 17.1%) for males and 7:00 AM to 7:29 AM (38, 41.3%) for females.
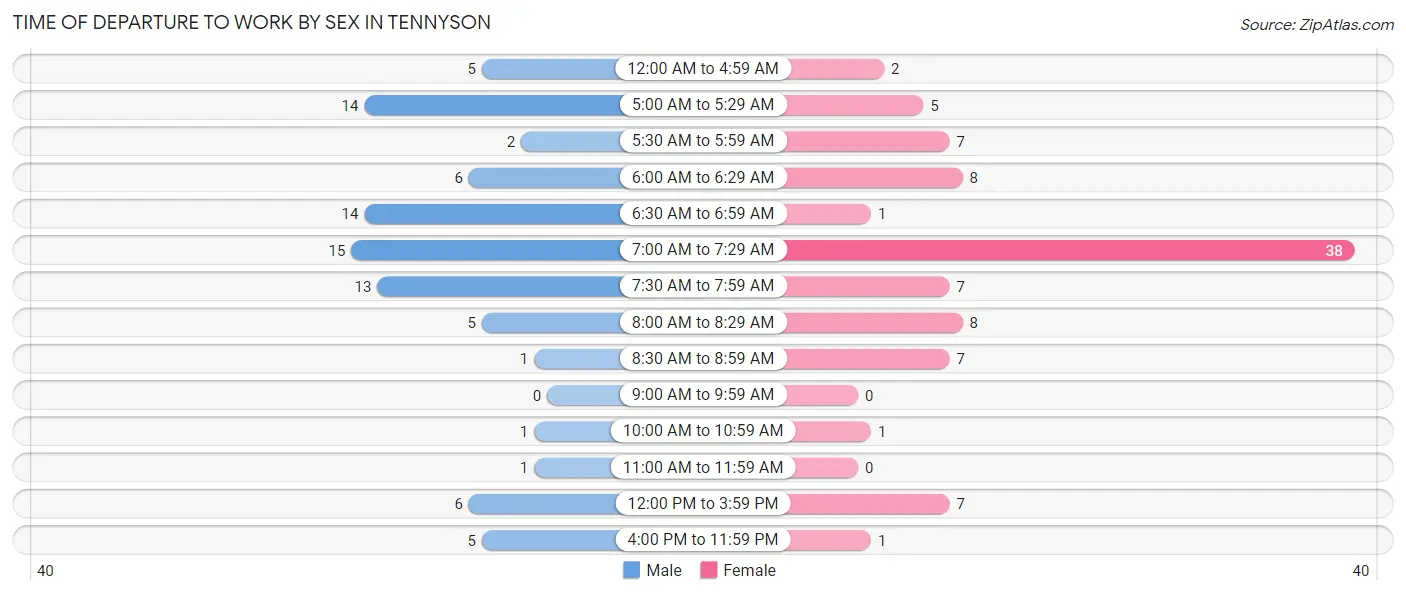
| Time of Departure | Male | Female |
| 12:00 AM to 4:59 AM | 5 (5.7%) | 2 (2.2%) |
| 5:00 AM to 5:29 AM | 14 (15.9%) | 5 (5.4%) |
| 5:30 AM to 5:59 AM | 2 (2.3%) | 7 (7.6%) |
| 6:00 AM to 6:29 AM | 6 (6.8%) | 8 (8.7%) |
| 6:30 AM to 6:59 AM | 14 (15.9%) | 1 (1.1%) |
| 7:00 AM to 7:29 AM | 15 (17.1%) | 38 (41.3%) |
| 7:30 AM to 7:59 AM | 13 (14.8%) | 7 (7.6%) |
| 8:00 AM to 8:29 AM | 5 (5.7%) | 8 (8.7%) |
| 8:30 AM to 8:59 AM | 1 (1.1%) | 7 (7.6%) |
| 9:00 AM to 9:59 AM | 0 (0.0%) | 0 (0.0%) |
| 10:00 AM to 10:59 AM | 1 (1.1%) | 1 (1.1%) |
| 11:00 AM to 11:59 AM | 1 (1.1%) | 0 (0.0%) |
| 12:00 PM to 3:59 PM | 6 (6.8%) | 7 (7.6%) |
| 4:00 PM to 11:59 PM | 5 (5.7%) | 1 (1.1%) |
| Total | 88 (100.0%) | 92 (100.0%) |
Housing Occupancy in Tennyson
Occupancy by Ownership in Tennyson
Of the total 176 dwellings in Tennyson, owner-occupied units account for 148 (84.1%), while renter-occupied units make up 28 (15.9%).
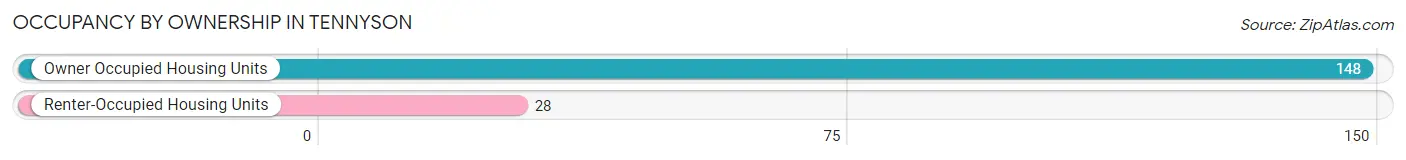
| Occupancy | # Housing Units | % Housing Units |
| Owner Occupied Housing Units | 148 | 84.1% |
| Renter-Occupied Housing Units | 28 | 15.9% |
| Total Occupied Housing Units | 176 | 100.0% |
Occupancy by Household Size in Tennyson
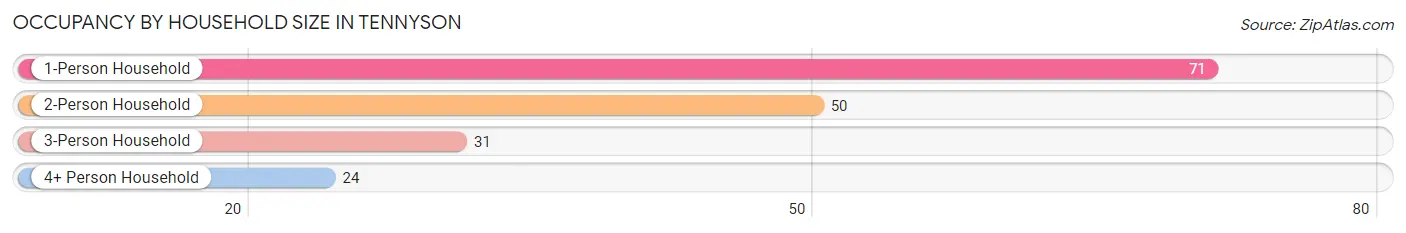
| Household Size | # Housing Units | % Housing Units |
| 1-Person Household | 71 | 40.3% |
| 2-Person Household | 50 | 28.4% |
| 3-Person Household | 31 | 17.6% |
| 4+ Person Household | 24 | 13.6% |
| Total Housing Units | 176 | 100.0% |
Occupancy by Ownership by Household Size in Tennyson
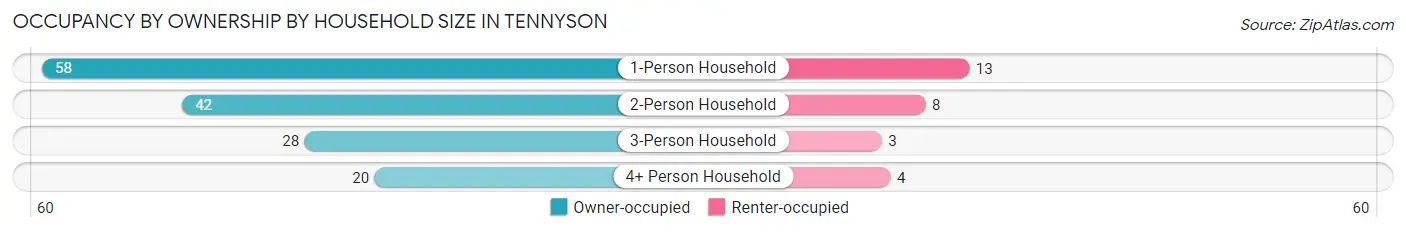
| Household Size | Owner-occupied | Renter-occupied |
| 1-Person Household | 58 (81.7%) | 13 (18.3%) |
| 2-Person Household | 42 (84.0%) | 8 (16.0%) |
| 3-Person Household | 28 (90.3%) | 3 (9.7%) |
| 4+ Person Household | 20 (83.3%) | 4 (16.7%) |
| Total Housing Units | 148 (84.1%) | 28 (15.9%) |
Occupancy by Educational Attainment in Tennyson
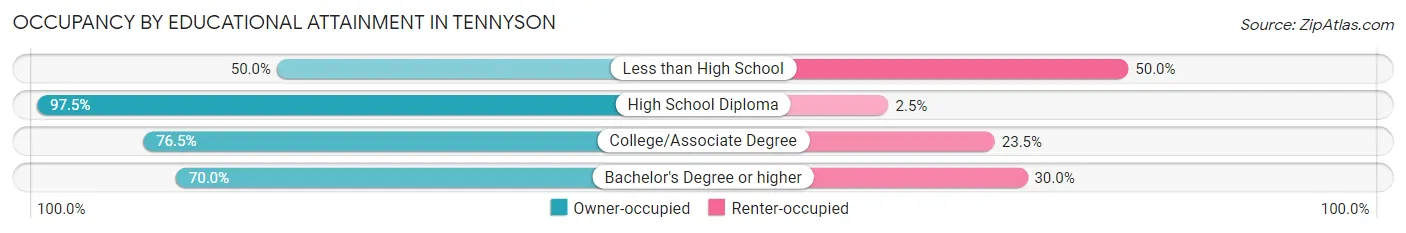
| Household Size | Owner-occupied | Renter-occupied |
| Less than High School | 2 (50.0%) | 2 (50.0%) |
| High School Diploma | 79 (97.5%) | 2 (2.5%) |
| College/Associate Degree | 39 (76.5%) | 12 (23.5%) |
| Bachelor's Degree or higher | 28 (70.0%) | 12 (30.0%) |
Occupancy by Age of Householder in Tennyson
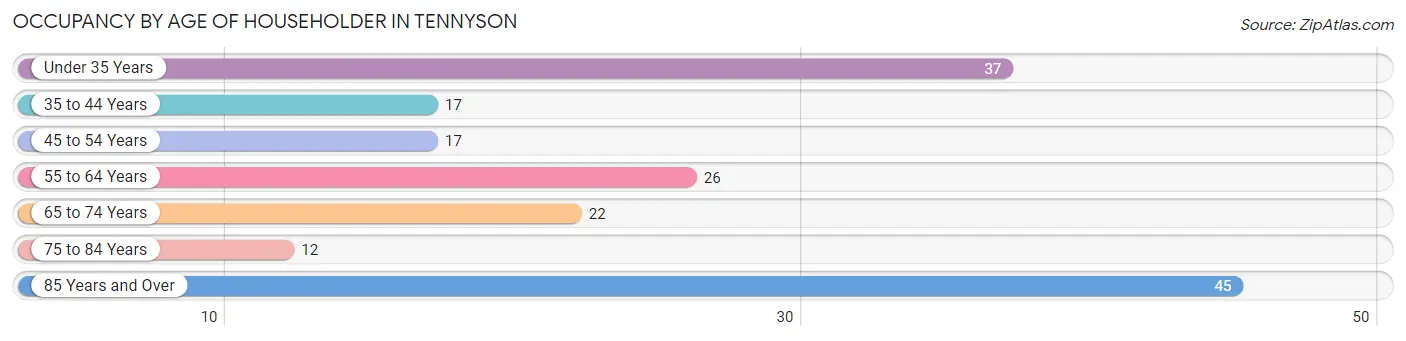
| Age Bracket | # Households | % Households |
| Under 35 Years | 37 | 21.0% |
| 35 to 44 Years | 17 | 9.7% |
| 45 to 54 Years | 17 | 9.7% |
| 55 to 64 Years | 26 | 14.8% |
| 65 to 74 Years | 22 | 12.5% |
| 75 to 84 Years | 12 | 6.8% |
| 85 Years and Over | 45 | 25.6% |
| Total | 176 | 100.0% |
Housing Finances in Tennyson
Median Income by Occupancy in Tennyson
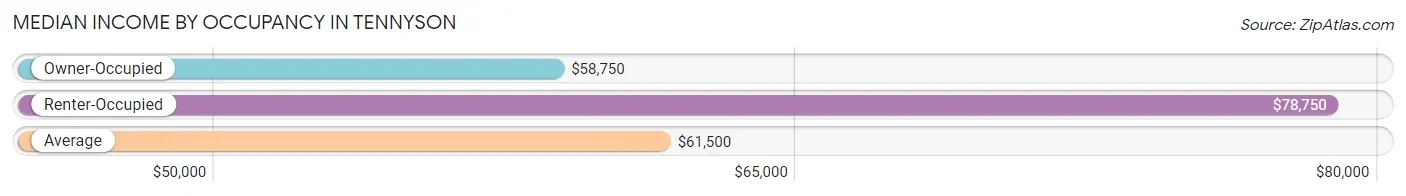
| Occupancy Type | # Households | Median Income |
| Owner-Occupied | 148 (84.1%) | $58,750 |
| Renter-Occupied | 28 (15.9%) | $78,750 |
| Average | 176 (100.0%) | $61,500 |
Occupancy by Householder Income Bracket in Tennyson
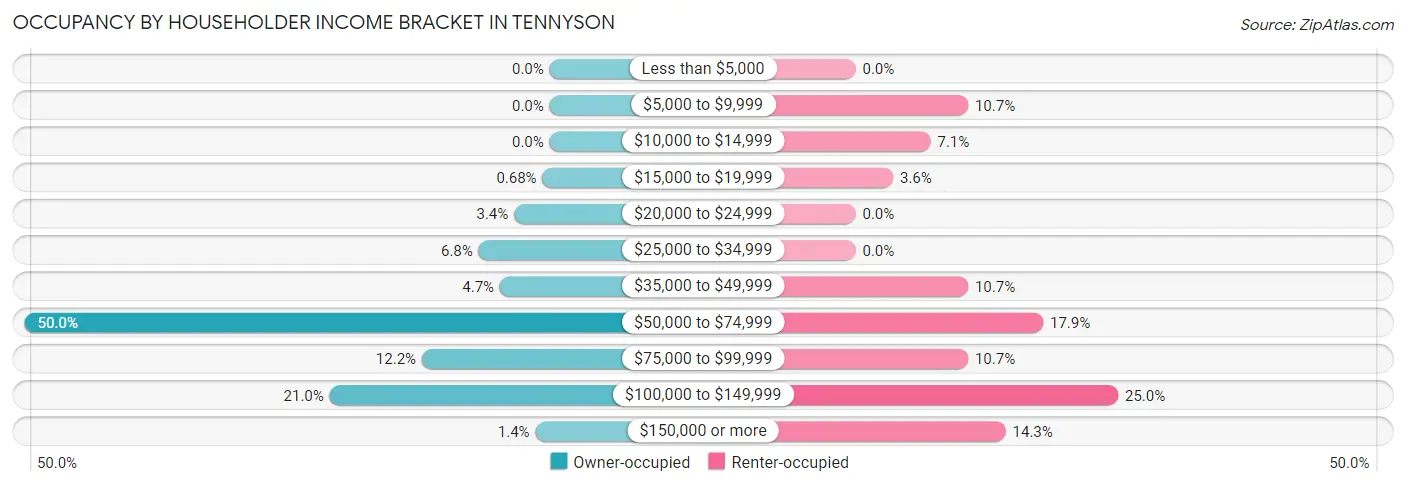
| Income Bracket | Owner-occupied | Renter-occupied |
| Less than $5,000 | 0 (0.0%) | 0 (0.0%) |
| $5,000 to $9,999 | 0 (0.0%) | 3 (10.7%) |
| $10,000 to $14,999 | 0 (0.0%) | 2 (7.1%) |
| $15,000 to $19,999 | 1 (0.7%) | 1 (3.6%) |
| $20,000 to $24,999 | 5 (3.4%) | 0 (0.0%) |
| $25,000 to $34,999 | 10 (6.8%) | 0 (0.0%) |
| $35,000 to $49,999 | 7 (4.7%) | 3 (10.7%) |
| $50,000 to $74,999 | 74 (50.0%) | 5 (17.9%) |
| $75,000 to $99,999 | 18 (12.2%) | 3 (10.7%) |
| $100,000 to $149,999 | 31 (20.9%) | 7 (25.0%) |
| $150,000 or more | 2 (1.3%) | 4 (14.3%) |
| Total | 148 (100.0%) | 28 (100.0%) |
Monthly Housing Cost Tiers in Tennyson
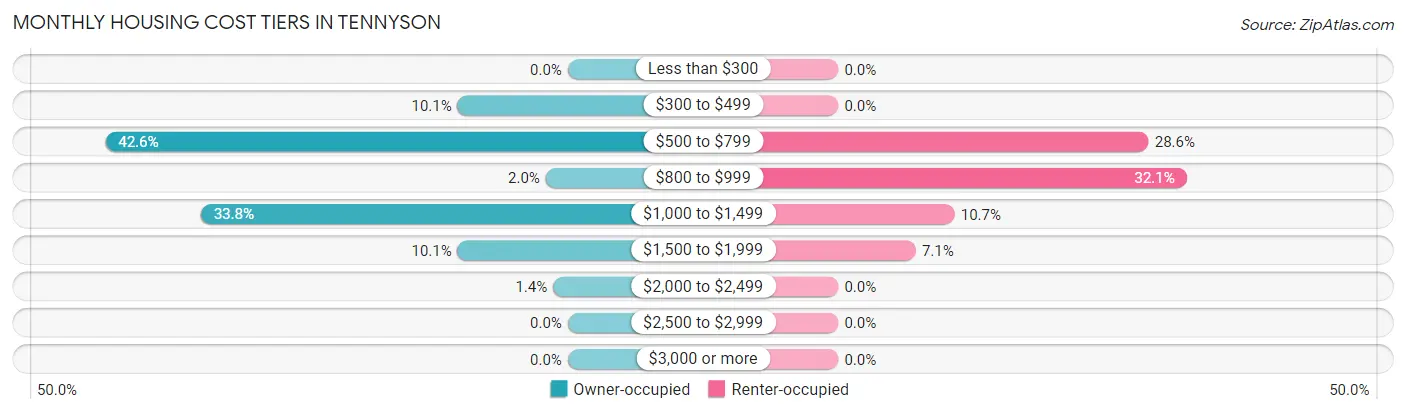
| Monthly Cost | Owner-occupied | Renter-occupied |
| Less than $300 | 0 (0.0%) | 0 (0.0%) |
| $300 to $499 | 15 (10.1%) | 0 (0.0%) |
| $500 to $799 | 63 (42.6%) | 8 (28.6%) |
| $800 to $999 | 3 (2.0%) | 9 (32.1%) |
| $1,000 to $1,499 | 50 (33.8%) | 3 (10.7%) |
| $1,500 to $1,999 | 15 (10.1%) | 2 (7.1%) |
| $2,000 to $2,499 | 2 (1.3%) | 0 (0.0%) |
| $2,500 to $2,999 | 0 (0.0%) | 0 (0.0%) |
| $3,000 or more | 0 (0.0%) | 0 (0.0%) |
| Total | 148 (100.0%) | 28 (100.0%) |
Physical Housing Characteristics in Tennyson
Housing Structures in Tennyson
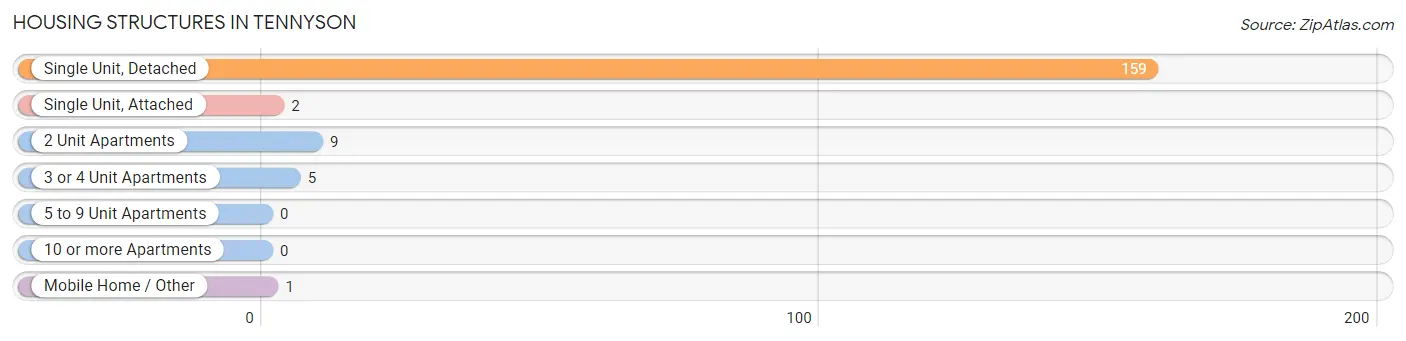
| Structure Type | # Housing Units | % Housing Units |
| Single Unit, Detached | 159 | 90.3% |
| Single Unit, Attached | 2 | 1.1% |
| 2 Unit Apartments | 9 | 5.1% |
| 3 or 4 Unit Apartments | 5 | 2.8% |
| 5 to 9 Unit Apartments | 0 | 0.0% |
| 10 or more Apartments | 0 | 0.0% |
| Mobile Home / Other | 1 | 0.6% |
| Total | 176 | 100.0% |
Housing Structures by Occupancy in Tennyson
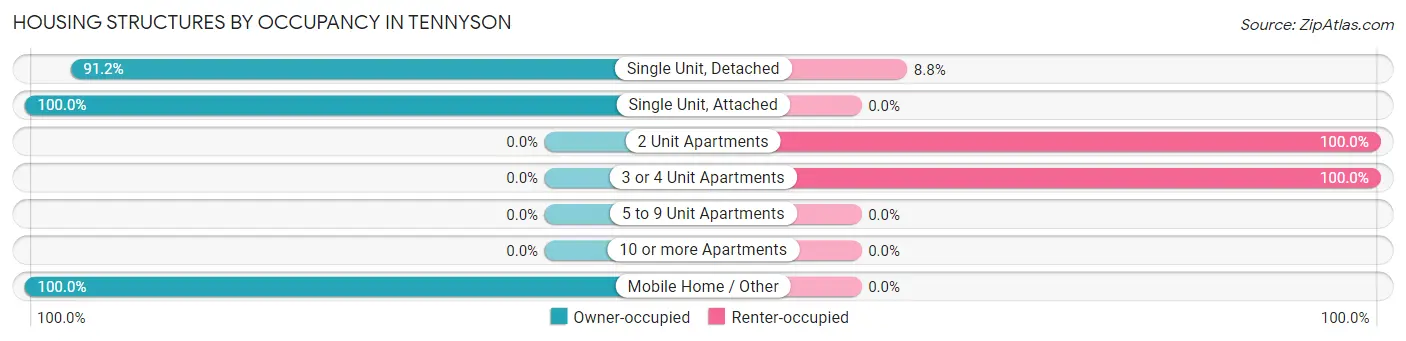
| Structure Type | Owner-occupied | Renter-occupied |
| Single Unit, Detached | 145 (91.2%) | 14 (8.8%) |
| Single Unit, Attached | 2 (100.0%) | 0 (0.0%) |
| 2 Unit Apartments | 0 (0.0%) | 9 (100.0%) |
| 3 or 4 Unit Apartments | 0 (0.0%) | 5 (100.0%) |
| 5 to 9 Unit Apartments | 0 (0.0%) | 0 (0.0%) |
| 10 or more Apartments | 0 (0.0%) | 0 (0.0%) |
| Mobile Home / Other | 1 (100.0%) | 0 (0.0%) |
| Total | 148 (84.1%) | 28 (15.9%) |
Housing Structures by Number of Rooms in Tennyson
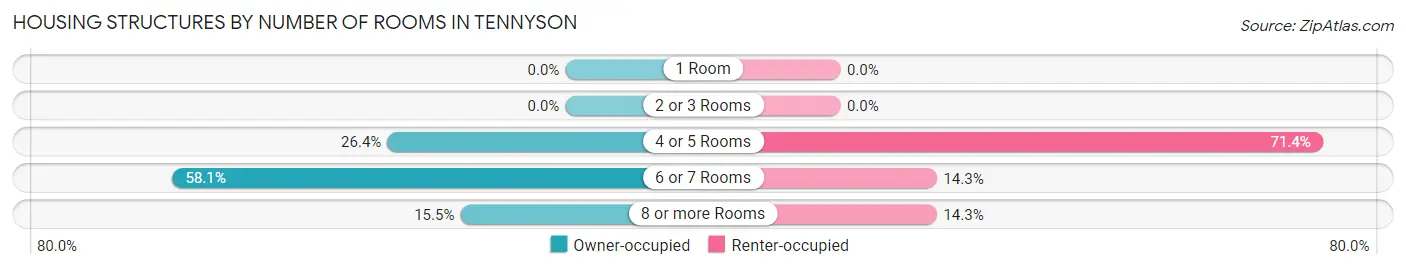
| Number of Rooms | Owner-occupied | Renter-occupied |
| 1 Room | 0 (0.0%) | 0 (0.0%) |
| 2 or 3 Rooms | 0 (0.0%) | 0 (0.0%) |
| 4 or 5 Rooms | 39 (26.4%) | 20 (71.4%) |
| 6 or 7 Rooms | 86 (58.1%) | 4 (14.3%) |
| 8 or more Rooms | 23 (15.5%) | 4 (14.3%) |
| Total | 148 (100.0%) | 28 (100.0%) |
Housing Structure by Heating Type in Tennyson
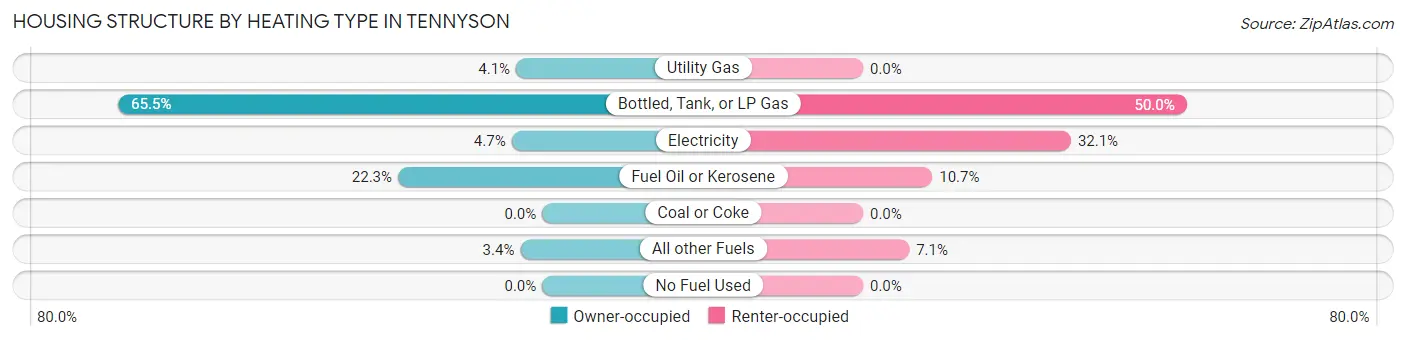
| Heating Type | Owner-occupied | Renter-occupied |
| Utility Gas | 6 (4.1%) | 0 (0.0%) |
| Bottled, Tank, or LP Gas | 97 (65.5%) | 14 (50.0%) |
| Electricity | 7 (4.7%) | 9 (32.1%) |
| Fuel Oil or Kerosene | 33 (22.3%) | 3 (10.7%) |
| Coal or Coke | 0 (0.0%) | 0 (0.0%) |
| All other Fuels | 5 (3.4%) | 2 (7.1%) |
| No Fuel Used | 0 (0.0%) | 0 (0.0%) |
| Total | 148 (100.0%) | 28 (100.0%) |
Household Vehicle Usage in Tennyson
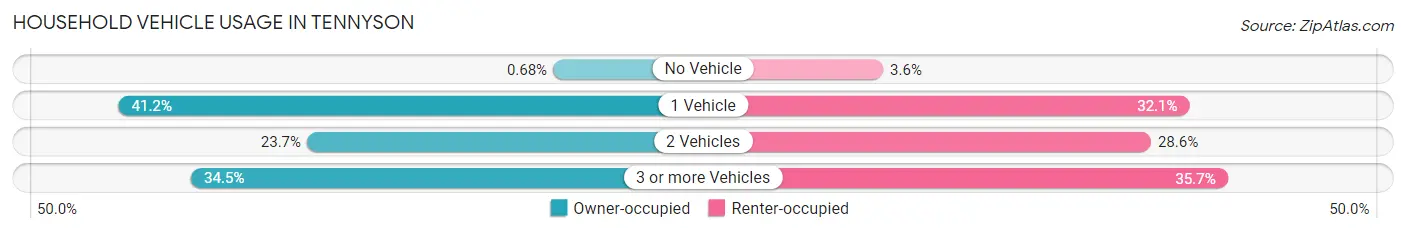
| Vehicles per Household | Owner-occupied | Renter-occupied |
| No Vehicle | 1 (0.7%) | 1 (3.6%) |
| 1 Vehicle | 61 (41.2%) | 9 (32.1%) |
| 2 Vehicles | 35 (23.6%) | 8 (28.6%) |
| 3 or more Vehicles | 51 (34.5%) | 10 (35.7%) |
| Total | 148 (100.0%) | 28 (100.0%) |
Real Estate & Mortgages in Tennyson
Real Estate and Mortgage Overview in Tennyson
| Characteristic | Without Mortgage | With Mortgage |
| Housing Units | 79 | 69 |
| Median Property Value | $119,700 | $158,900 |
| Median Household Income | $56,339 | $2 |
| Monthly Housing Costs | $546 | $0 |
| Real Estate Taxes | $1,438 | $0 |
Property Value by Mortgage Status in Tennyson
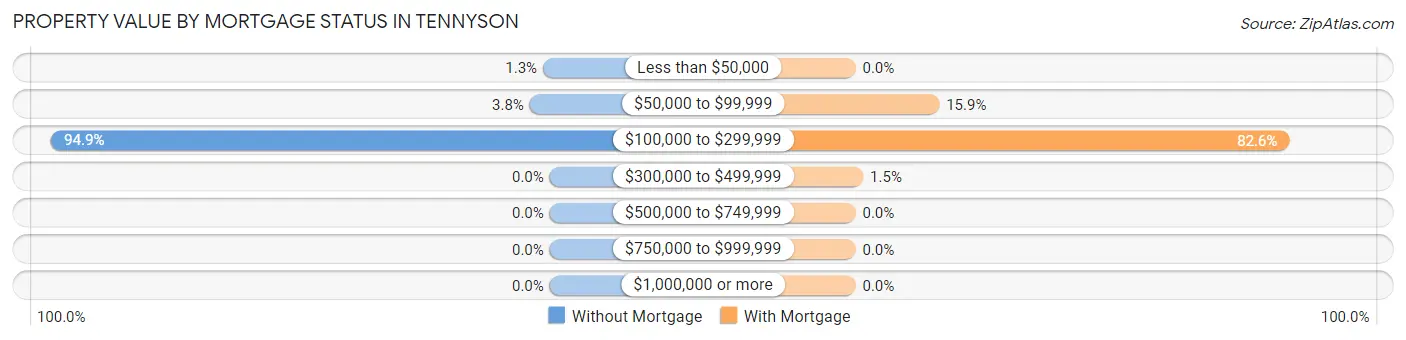
| Property Value | Without Mortgage | With Mortgage |
| Less than $50,000 | 1 (1.3%) | 0 (0.0%) |
| $50,000 to $99,999 | 3 (3.8%) | 11 (15.9%) |
| $100,000 to $299,999 | 75 (94.9%) | 57 (82.6%) |
| $300,000 to $499,999 | 0 (0.0%) | 1 (1.5%) |
| $500,000 to $749,999 | 0 (0.0%) | 0 (0.0%) |
| $750,000 to $999,999 | 0 (0.0%) | 0 (0.0%) |
| $1,000,000 or more | 0 (0.0%) | 0 (0.0%) |
| Total | 79 (100.0%) | 69 (100.0%) |
Household Income by Mortgage Status in Tennyson
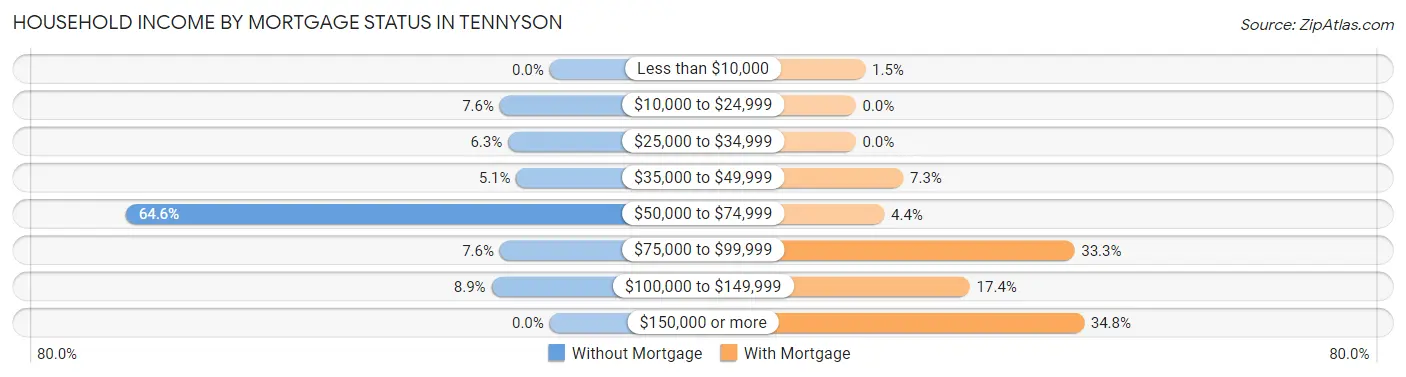
| Household Income | Without Mortgage | With Mortgage |
| Less than $10,000 | 0 (0.0%) | 1 (1.5%) |
| $10,000 to $24,999 | 6 (7.6%) | 0 (0.0%) |
| $25,000 to $34,999 | 5 (6.3%) | 0 (0.0%) |
| $35,000 to $49,999 | 4 (5.1%) | 5 (7.2%) |
| $50,000 to $74,999 | 51 (64.6%) | 3 (4.3%) |
| $75,000 to $99,999 | 6 (7.6%) | 23 (33.3%) |
| $100,000 to $149,999 | 7 (8.9%) | 12 (17.4%) |
| $150,000 or more | 0 (0.0%) | 24 (34.8%) |
| Total | 79 (100.0%) | 69 (100.0%) |
Property Value to Household Income Ratio in Tennyson
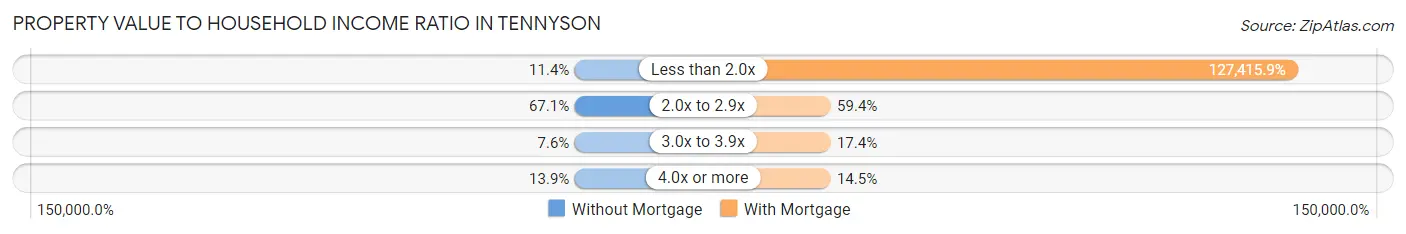
| Value-to-Income Ratio | Without Mortgage | With Mortgage |
| Less than 2.0x | 9 (11.4%) | 87,917 (127,415.9%) |
| 2.0x to 2.9x | 53 (67.1%) | 41 (59.4%) |
| 3.0x to 3.9x | 6 (7.6%) | 12 (17.4%) |
| 4.0x or more | 11 (13.9%) | 10 (14.5%) |
| Total | 79 (100.0%) | 69 (100.0%) |
Real Estate Taxes by Mortgage Status in Tennyson
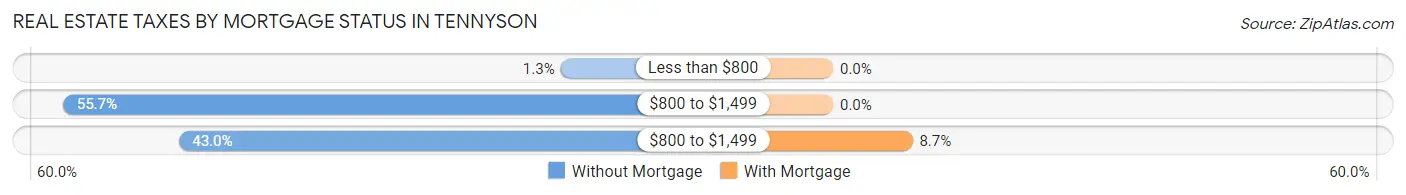
| Property Taxes | Without Mortgage | With Mortgage |
| Less than $800 | 1 (1.3%) | 0 (0.0%) |
| $800 to $1,499 | 44 (55.7%) | 0 (0.0%) |
| $800 to $1,499 | 34 (43.0%) | 6 (8.7%) |
| Total | 79 (100.0%) | 69 (100.0%) |
Health & Disability in Tennyson
Health Insurance Coverage by Age in Tennyson
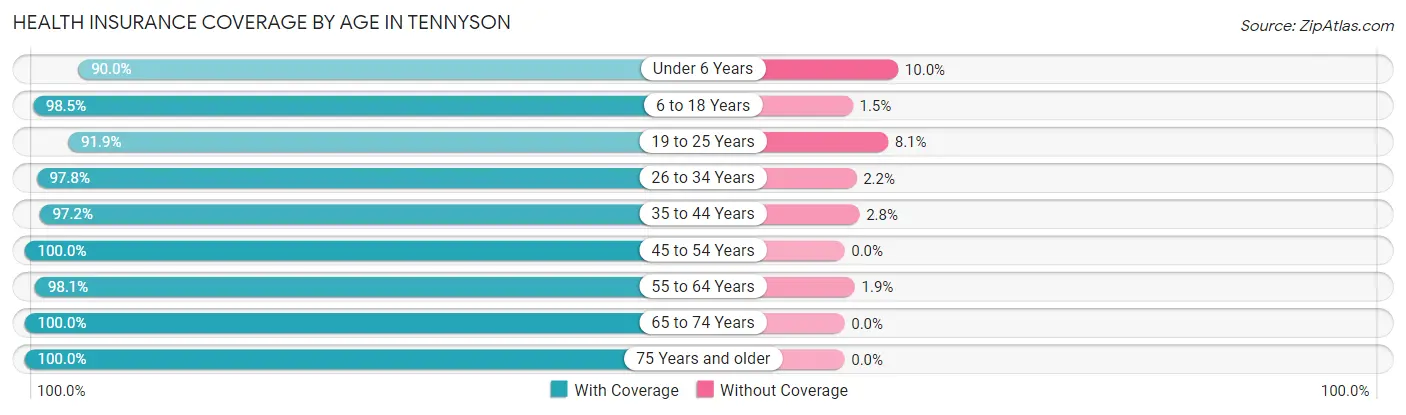
| Age Bracket | With Coverage | Without Coverage |
| Under 6 Years | 18 (90.0%) | 2 (10.0%) |
| 6 to 18 Years | 64 (98.5%) | 1 (1.5%) |
| 19 to 25 Years | 34 (91.9%) | 3 (8.1%) |
| 26 to 34 Years | 44 (97.8%) | 1 (2.2%) |
| 35 to 44 Years | 35 (97.2%) | 1 (2.8%) |
| 45 to 54 Years | 24 (100.0%) | 0 (0.0%) |
| 55 to 64 Years | 51 (98.1%) | 1 (1.9%) |
| 65 to 74 Years | 29 (100.0%) | 0 (0.0%) |
| 75 Years and older | 65 (100.0%) | 0 (0.0%) |
| Total | 364 (97.6%) | 9 (2.4%) |
Health Insurance Coverage by Citizenship Status in Tennyson
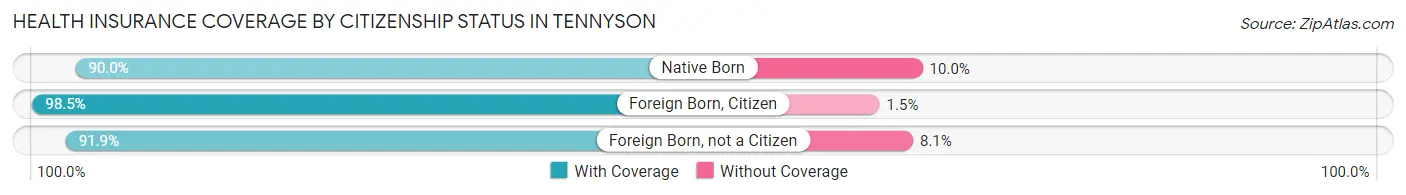
| Citizenship Status | With Coverage | Without Coverage |
| Native Born | 18 (90.0%) | 2 (10.0%) |
| Foreign Born, Citizen | 64 (98.5%) | 1 (1.5%) |
| Foreign Born, not a Citizen | 34 (91.9%) | 3 (8.1%) |
Health Insurance Coverage by Household Income in Tennyson
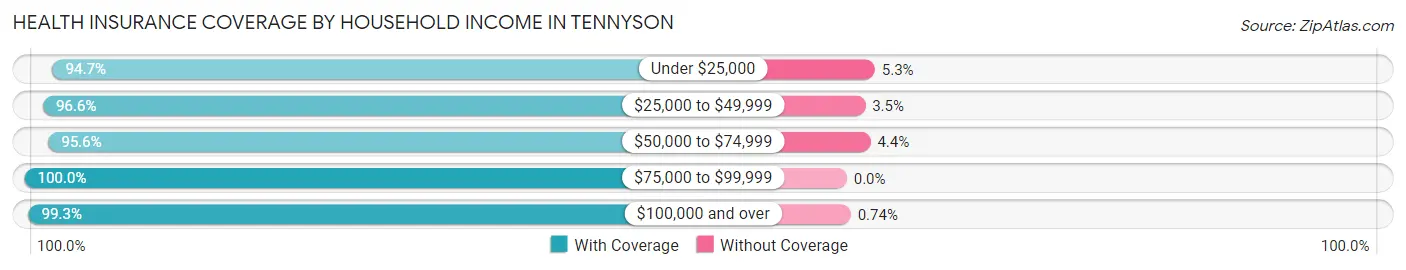
| Household Income | With Coverage | Without Coverage |
| Under $25,000 | 18 (94.7%) | 1 (5.3%) |
| $25,000 to $49,999 | 28 (96.6%) | 1 (3.5%) |
| $50,000 to $74,999 | 129 (95.6%) | 6 (4.4%) |
| $75,000 to $99,999 | 55 (100.0%) | 0 (0.0%) |
| $100,000 and over | 134 (99.3%) | 1 (0.7%) |
Public vs Private Health Insurance Coverage by Age in Tennyson
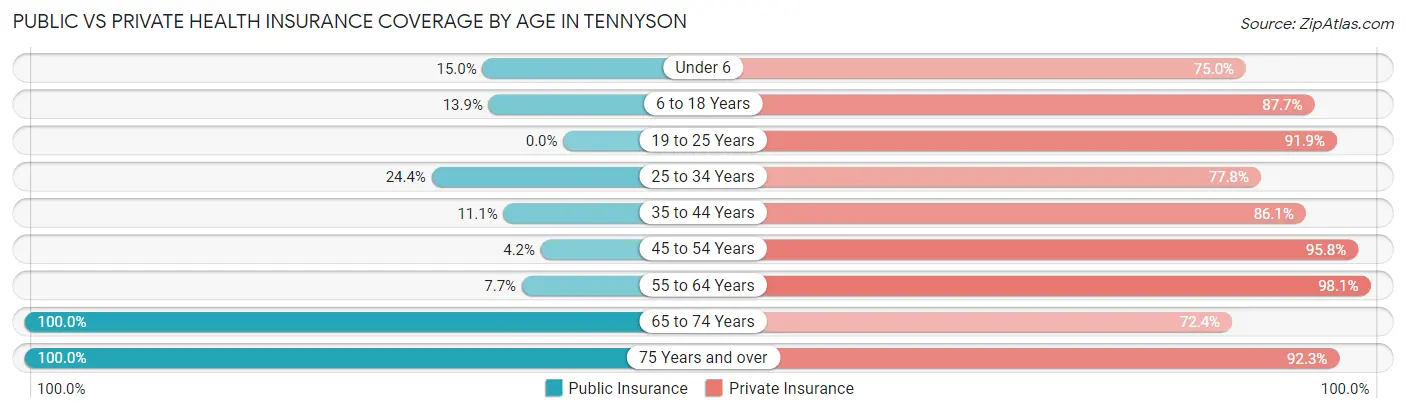
| Age Bracket | Public Insurance | Private Insurance |
| Under 6 | 3 (15.0%) | 15 (75.0%) |
| 6 to 18 Years | 9 (13.9%) | 57 (87.7%) |
| 19 to 25 Years | 0 (0.0%) | 34 (91.9%) |
| 25 to 34 Years | 11 (24.4%) | 35 (77.8%) |
| 35 to 44 Years | 4 (11.1%) | 31 (86.1%) |
| 45 to 54 Years | 1 (4.2%) | 23 (95.8%) |
| 55 to 64 Years | 4 (7.7%) | 51 (98.1%) |
| 65 to 74 Years | 29 (100.0%) | 21 (72.4%) |
| 75 Years and over | 65 (100.0%) | 60 (92.3%) |
| Total | 126 (33.8%) | 327 (87.7%) |
Disability Status by Sex by Age in Tennyson
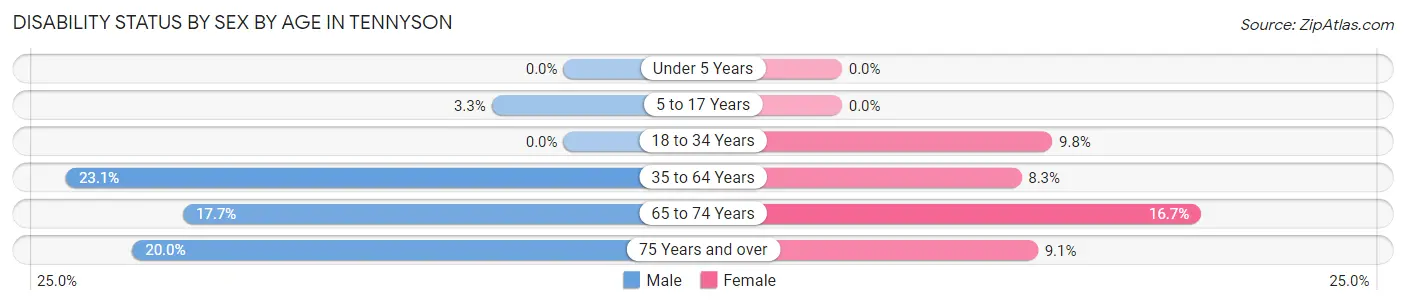
| Age Bracket | Male | Female |
| Under 5 Years | 0 (0.0%) | 0 (0.0%) |
| 5 to 17 Years | 1 (3.3%) | 0 (0.0%) |
| 18 to 34 Years | 0 (0.0%) | 4 (9.8%) |
| 35 to 64 Years | 12 (23.1%) | 5 (8.3%) |
| 65 to 74 Years | 3 (17.6%) | 2 (16.7%) |
| 75 Years and over | 2 (20.0%) | 5 (9.1%) |
Disability Class by Sex by Age in Tennyson
Disability Class: Hearing Difficulty
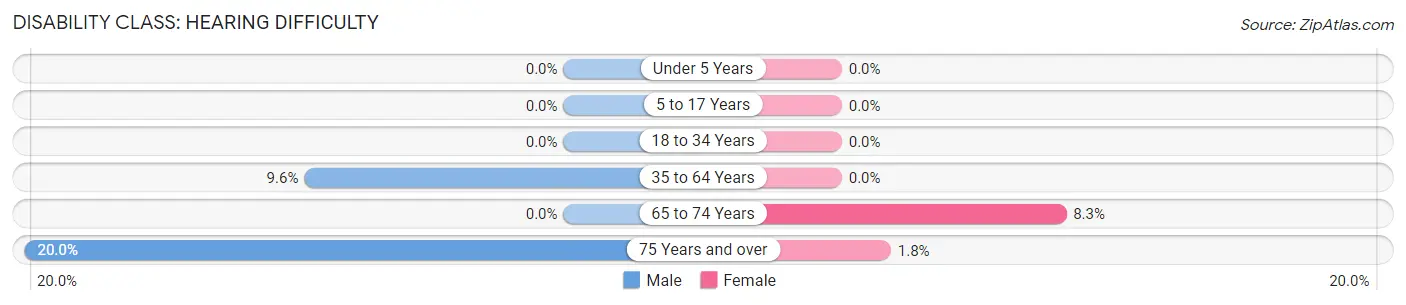
| Age Bracket | Male | Female |
| Under 5 Years | 0 (0.0%) | 0 (0.0%) |
| 5 to 17 Years | 0 (0.0%) | 0 (0.0%) |
| 18 to 34 Years | 0 (0.0%) | 0 (0.0%) |
| 35 to 64 Years | 5 (9.6%) | 0 (0.0%) |
| 65 to 74 Years | 0 (0.0%) | 1 (8.3%) |
| 75 Years and over | 2 (20.0%) | 1 (1.8%) |
Disability Class: Vision Difficulty
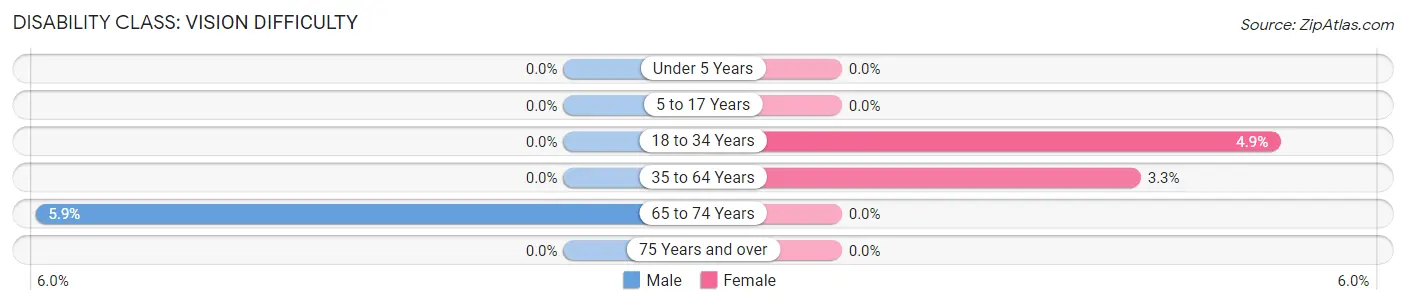
| Age Bracket | Male | Female |
| Under 5 Years | 0 (0.0%) | 0 (0.0%) |
| 5 to 17 Years | 0 (0.0%) | 0 (0.0%) |
| 18 to 34 Years | 0 (0.0%) | 2 (4.9%) |
| 35 to 64 Years | 0 (0.0%) | 2 (3.3%) |
| 65 to 74 Years | 1 (5.9%) | 0 (0.0%) |
| 75 Years and over | 0 (0.0%) | 0 (0.0%) |
Disability Class: Cognitive Difficulty
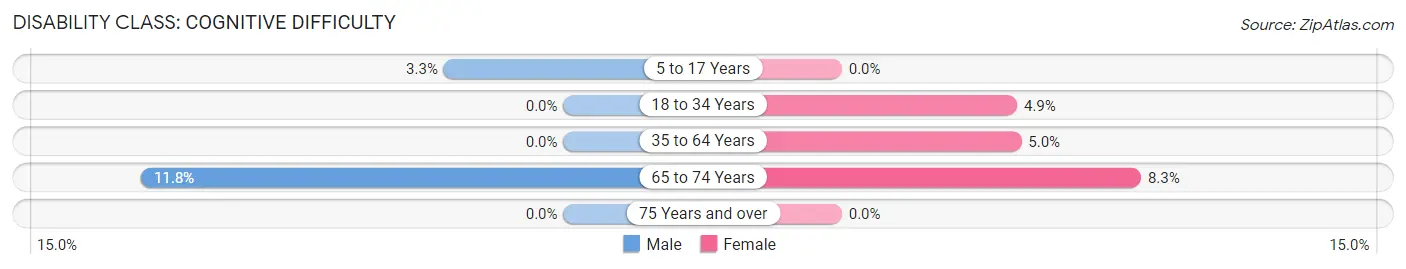
| Age Bracket | Male | Female |
| 5 to 17 Years | 1 (3.3%) | 0 (0.0%) |
| 18 to 34 Years | 0 (0.0%) | 2 (4.9%) |
| 35 to 64 Years | 0 (0.0%) | 3 (5.0%) |
| 65 to 74 Years | 2 (11.8%) | 1 (8.3%) |
| 75 Years and over | 0 (0.0%) | 0 (0.0%) |
Disability Class: Ambulatory Difficulty
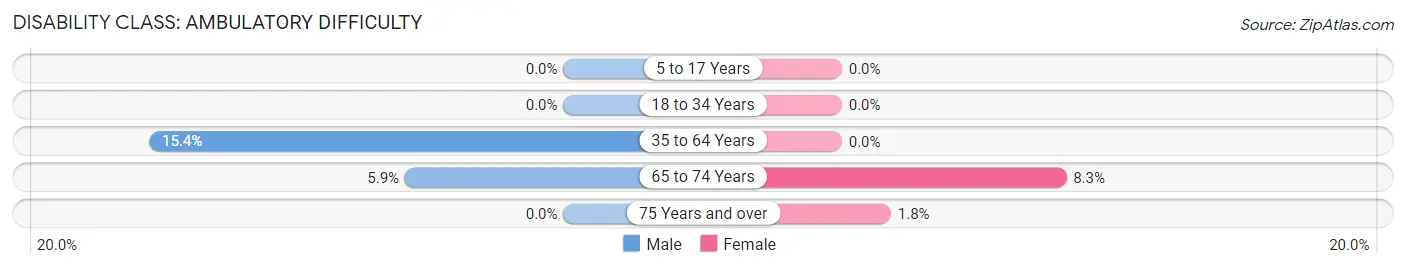
| Age Bracket | Male | Female |
| 5 to 17 Years | 0 (0.0%) | 0 (0.0%) |
| 18 to 34 Years | 0 (0.0%) | 0 (0.0%) |
| 35 to 64 Years | 8 (15.4%) | 0 (0.0%) |
| 65 to 74 Years | 1 (5.9%) | 1 (8.3%) |
| 75 Years and over | 0 (0.0%) | 1 (1.8%) |
Disability Class: Self-Care Difficulty
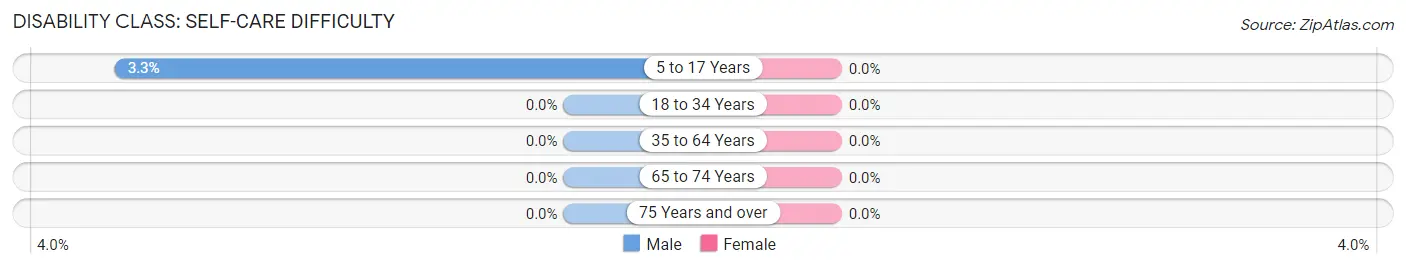
| Age Bracket | Male | Female |
| 5 to 17 Years | 1 (3.3%) | 0 (0.0%) |
| 18 to 34 Years | 0 (0.0%) | 0 (0.0%) |
| 35 to 64 Years | 0 (0.0%) | 0 (0.0%) |
| 65 to 74 Years | 0 (0.0%) | 0 (0.0%) |
| 75 Years and over | 0 (0.0%) | 0 (0.0%) |
Technology Access in Tennyson
Computing Device Access in Tennyson
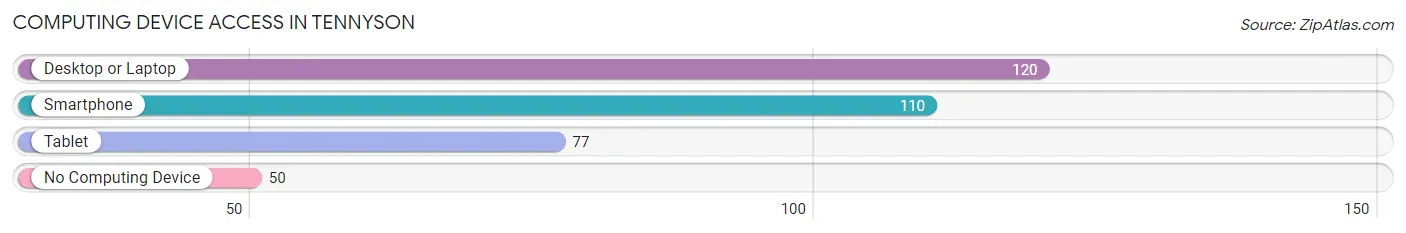
| Device Type | # Households | % Households |
| Desktop or Laptop | 120 | 68.2% |
| Smartphone | 110 | 62.5% |
| Tablet | 77 | 43.8% |
| No Computing Device | 50 | 28.4% |
| Total | 176 | 100.0% |
Internet Access in Tennyson
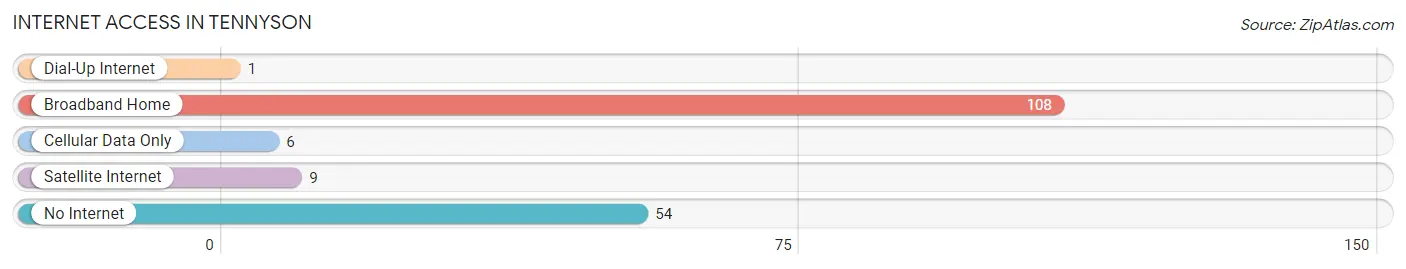
| Internet Type | # Households | % Households |
| Dial-Up Internet | 1 | 0.6% |
| Broadband Home | 108 | 61.4% |
| Cellular Data Only | 6 | 3.4% |
| Satellite Internet | 9 | 5.1% |
| No Internet | 54 | 30.7% |
| Total | 176 | 100.0% |
Tennyson Summary
Tennyson is a small unincorporated community located in the town of Tennyson, in Marinette County, Wisconsin. The community is situated on the banks of the Menominee River, near the border of Wisconsin and Michigan. The population of Tennyson was estimated to be around 200 people in 2020.
History
The area that is now Tennyson was first settled in the late 1800s by a group of Finnish immigrants. The immigrants were attracted to the area due to its abundance of natural resources, including timber and fish. The community was originally known as “Finn Town”, but was later renamed to Tennyson in honor of the English poet Alfred, Lord Tennyson.
The town was officially incorporated in 1891 and was home to a variety of businesses, including a sawmill, a general store, a blacksmith shop, and a post office. The town also had a school, which was built in 1895.
Geography
Tennyson is located in the town of Tennyson, in Marinette County, Wisconsin. The community is situated on the banks of the Menominee River, near the border of Wisconsin and Michigan. The town is located in a rural area, surrounded by forests and farmland.
The climate in Tennyson is classified as humid continental, with cold winters and warm summers. The average temperature in the summer is around 70 degrees Fahrenheit, while the average temperature in the winter is around 20 degrees Fahrenheit.
Economy
The economy of Tennyson is largely based on agriculture and forestry. The town is home to several farms, which produce a variety of crops, including corn, soybeans, and hay. The town also has several sawmills, which produce lumber for the local market.
In addition to agriculture and forestry, Tennyson is also home to several small businesses, including a general store, a gas station, and a restaurant. The town also has a post office and a library.
Demographics
The population of Tennyson was estimated to be around 200 people in 2020. The racial makeup of the town is predominantly white, with a small percentage of African Americans and Native Americans. The median household income in the town is around $45,000, and the median home value is around $100,000.
The town is served by the Marinette County School District, which includes two elementary schools and one high school. The town also has a public library, which offers a variety of services, including books, magazines, and computers.
Conclusion
Tennyson is a small unincorporated community located in the town of Tennyson, in Marinette County, Wisconsin. The community is situated on the banks of the Menominee River, near the border of Wisconsin and Michigan. The population of Tennyson was estimated to be around 200 people in 2020. The economy of the town is largely based on agriculture and forestry, and the town is served by the Marinette County School District. The racial makeup of the town is predominantly white, with a small percentage of African Americans and Native Americans.
Common Questions
What is Per Capita Income in Tennyson?
Per Capita income in Tennyson is $34,664.
What is the Median Family Income in Tennyson?
Median Family Income in Tennyson is $89,375.
What is the Median Household income in Tennyson?
Median Household Income in Tennyson is $61,500.
What is Income or Wage Gap in Tennyson?
Income or Wage Gap in Tennyson is 33.3%.
Women in Tennyson earn 66.7 cents for every dollar earned by a man.
What is Inequality or Gini Index in Tennyson?
Inequality or Gini Index in Tennyson is 0.27.
What is the Total Population of Tennyson?
Total Population of Tennyson is 374.
What is the Total Male Population of Tennyson?
Total Male Population of Tennyson is 175.
What is the Total Female Population of Tennyson?
Total Female Population of Tennyson is 199.
What is the Ratio of Males per 100 Females in Tennyson?
There are 87.94 Males per 100 Females in Tennyson.
What is the Ratio of Females per 100 Males in Tennyson?
There are 113.71 Females per 100 Males in Tennyson.
What is the Median Population Age in Tennyson?
Median Population Age in Tennyson is 42.6 Years.
What is the Average Family Size in Tennyson
Average Family Size in Tennyson is 2.9 People.
What is the Average Household Size in Tennyson
Average Household Size in Tennyson is 2.1 People.
How Large is the Labor Force in Tennyson?
There are 195 People in the Labor Forcein in Tennyson.
What is the Percentage of People in the Labor Force in Tennyson?
61.7% of People are in the Labor Force in Tennyson.
What is the Unemployment Rate in Tennyson?
Unemployment Rate in Tennyson is 2.1%.