Taylor, WI Map & Demographics
Taylor Map
Taylor Overview
$25,591
PER CAPITA INCOME
$54,464
AVG FAMILY INCOME
$52,171
AVG HOUSEHOLD INCOME
24.0%
WAGE / INCOME GAP [ % ]
76.0¢/ $1
WAGE / INCOME GAP [ $ ]
$12,367
FAMILY INCOME DEFICIT
0.36
INEQUALITY / GINI INDEX
363
TOTAL POPULATION
177
MALE POPULATION
186
FEMALE POPULATION
95.16
MALES / 100 FEMALES
105.08
FEMALES / 100 MALES
35.8
MEDIAN AGE
2.7
AVG FAMILY SIZE
2.2
AVG HOUSEHOLD SIZE
206
LABOR FORCE [ PEOPLE ]
75.2%
PERCENT IN LABOR FORCE
4.4%
UNEMPLOYMENT RATE
Taylor Zip Codes
Taylor Area Codes
Income in Taylor
Income Overview in Taylor
Per Capita Income in Taylor is $25,591, while median incomes of families and households are $54,464 and $52,171 respectively.
| Characteristic | Number | Measure |
| Per Capita Income | 363 | $25,591 |
| Median Family Income | 95 | $54,464 |
| Mean Family Income | 95 | $63,678 |
| Median Household Income | 165 | $52,171 |
| Mean Household Income | 165 | $55,751 |
| Income Deficit | 95 | $12,367 |
| Wage / Income Gap (%) | 363 | 24.04% |
| Wage / Income Gap ($) | 363 | 75.96¢ per $1 |
| Gini / Inequality Index | 363 | 0.36 |
Earnings by Sex in Taylor
Average Earnings in Taylor are $39,250, $44,625 for men and $33,897 for women, a difference of 24.0%.
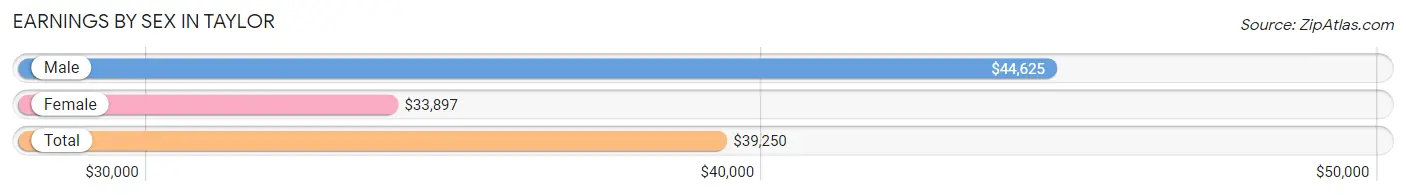
| Sex | Number | Average Earnings |
| Male | 129 (60.3%) | $44,625 |
| Female | 85 (39.7%) | $33,897 |
| Total | 214 (100.0%) | $39,250 |
Earnings by Sex by Income Bracket in Taylor
The most common earnings brackets in Taylor are $50,000 to $54,999 for men (25 | 19.4%) and $30,000 to $34,999 for women (17 | 20.0%).
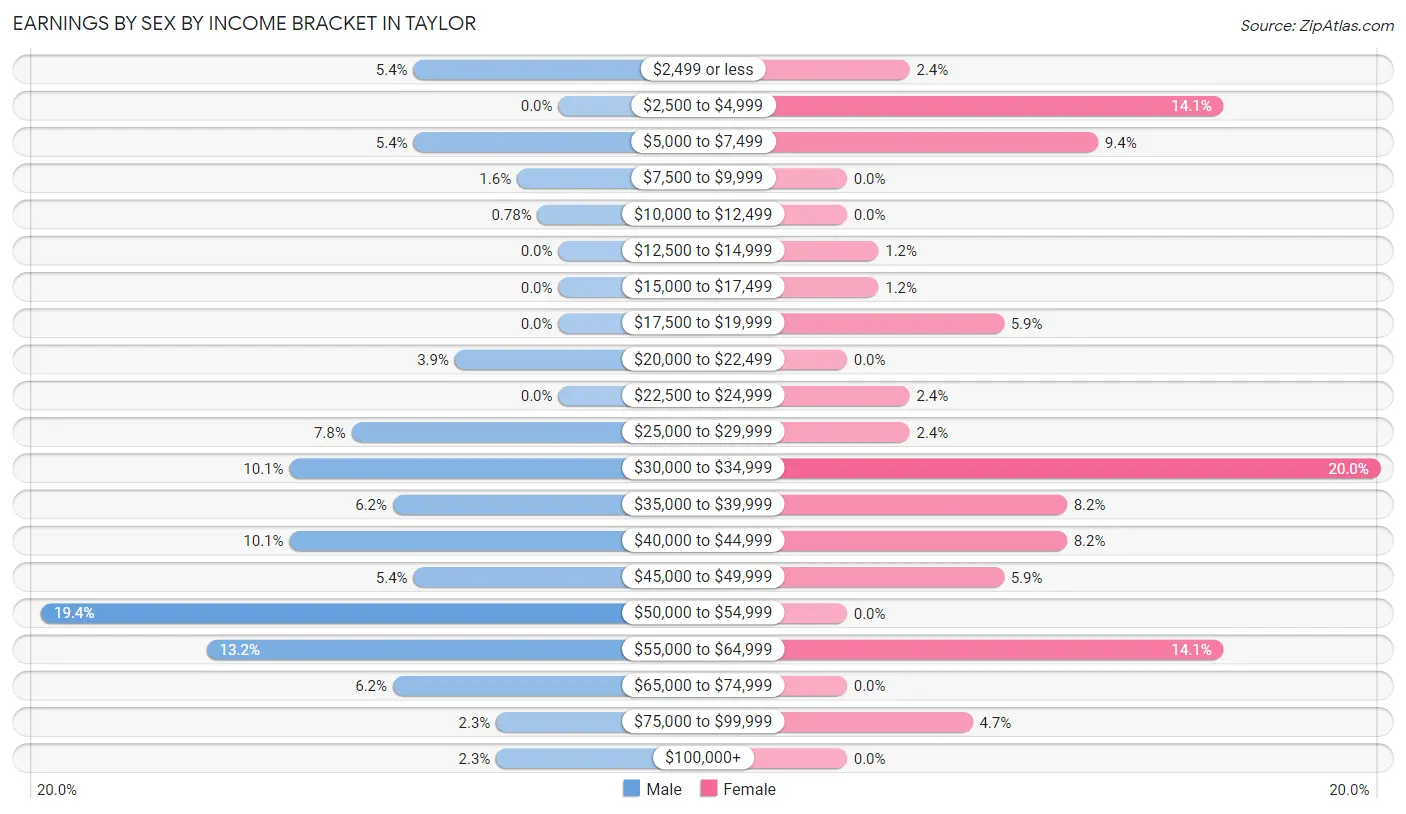
| Income | Male | Female |
| $2,499 or less | 7 (5.4%) | 2 (2.4%) |
| $2,500 to $4,999 | 0 (0.0%) | 12 (14.1%) |
| $5,000 to $7,499 | 7 (5.4%) | 8 (9.4%) |
| $7,500 to $9,999 | 2 (1.5%) | 0 (0.0%) |
| $10,000 to $12,499 | 1 (0.8%) | 0 (0.0%) |
| $12,500 to $14,999 | 0 (0.0%) | 1 (1.2%) |
| $15,000 to $17,499 | 0 (0.0%) | 1 (1.2%) |
| $17,500 to $19,999 | 0 (0.0%) | 5 (5.9%) |
| $20,000 to $22,499 | 5 (3.9%) | 0 (0.0%) |
| $22,500 to $24,999 | 0 (0.0%) | 2 (2.4%) |
| $25,000 to $29,999 | 10 (7.7%) | 2 (2.4%) |
| $30,000 to $34,999 | 13 (10.1%) | 17 (20.0%) |
| $35,000 to $39,999 | 8 (6.2%) | 7 (8.2%) |
| $40,000 to $44,999 | 13 (10.1%) | 7 (8.2%) |
| $45,000 to $49,999 | 7 (5.4%) | 5 (5.9%) |
| $50,000 to $54,999 | 25 (19.4%) | 0 (0.0%) |
| $55,000 to $64,999 | 17 (13.2%) | 12 (14.1%) |
| $65,000 to $74,999 | 8 (6.2%) | 0 (0.0%) |
| $75,000 to $99,999 | 3 (2.3%) | 4 (4.7%) |
| $100,000+ | 3 (2.3%) | 0 (0.0%) |
| Total | 129 (100.0%) | 85 (100.0%) |
Earnings by Sex by Educational Attainment in Taylor
Average earnings in Taylor are $49,107 for men and $33,824 for women, a difference of 31.1%. Men with an educational attainment of college or associate's degree enjoy the highest average annual earnings of $51,118, while those with high school diploma education earn the least with $37,000. Women with an educational attainment of college or associate's degree earn the most with the average annual earnings of $37,917, while those with less than high school education have the smallest earnings of $4,750.
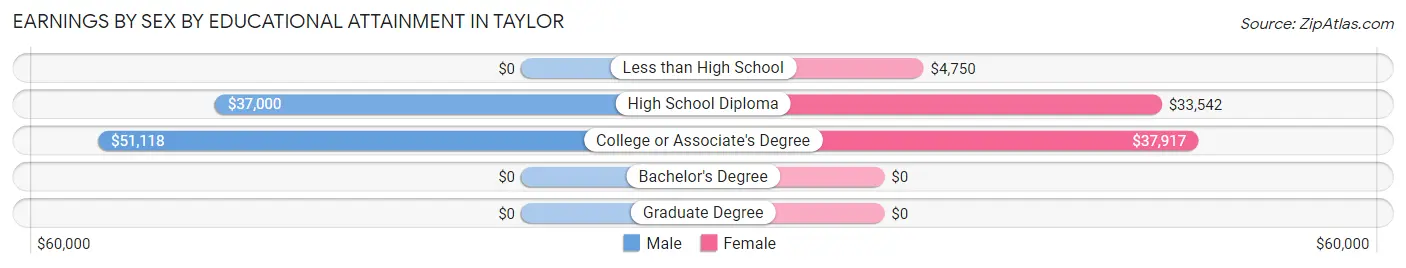
| Educational Attainment | Male Income | Female Income |
| Less than High School | - | - |
| High School Diploma | $37,000 | $33,542 |
| College or Associate's Degree | $51,118 | $37,917 |
| Bachelor's Degree | - | - |
| Graduate Degree | - | - |
| Total | $49,107 | $33,824 |
Family Income in Taylor
Family Income Brackets in Taylor
According to the Taylor family income data, there are 24 families falling into the $50,000 to $74,999 income range, which is the most common income bracket and makes up 25.3% of all families.
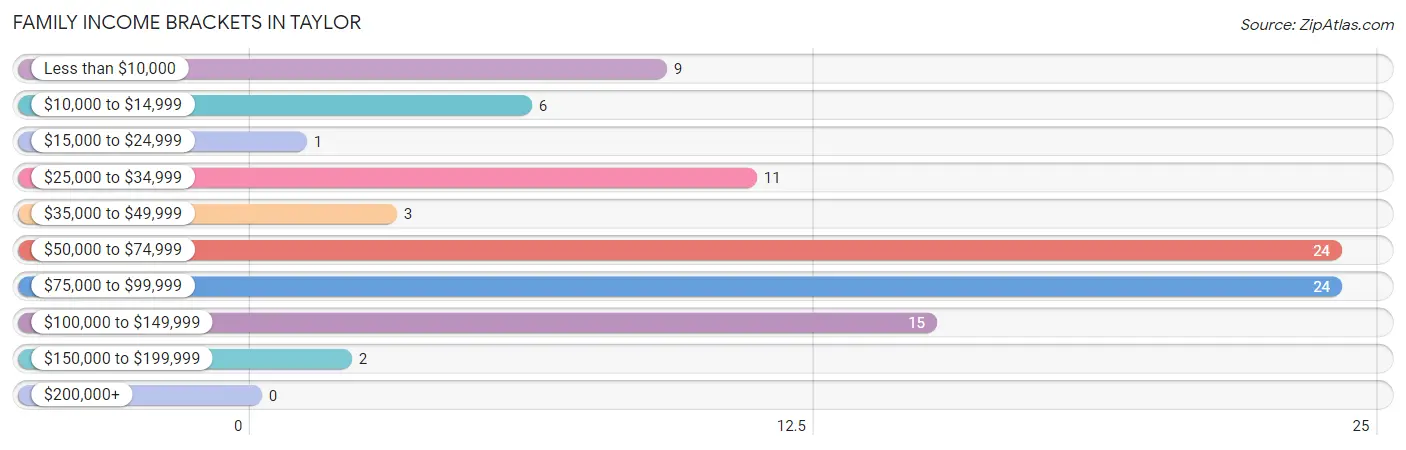
| Income Bracket | # Families | % Families |
| Less than $10,000 | 9 | 9.5% |
| $10,000 to $14,999 | 6 | 6.3% |
| $15,000 to $24,999 | 1 | 1.1% |
| $25,000 to $34,999 | 11 | 11.6% |
| $35,000 to $49,999 | 3 | 3.2% |
| $50,000 to $74,999 | 24 | 25.3% |
| $75,000 to $99,999 | 24 | 25.3% |
| $100,000 to $149,999 | 15 | 15.8% |
| $150,000 to $199,999 | 2 | 2.1% |
| $200,000+ | 0 | 0.0% |
Family Income by Famaliy Size in Taylor
4-person families (14 | 14.7%) account for the highest median family income in Taylor with $101,250 per family, while 2-person families (49 | 51.6%) have the highest median income of $27,054 per family member.
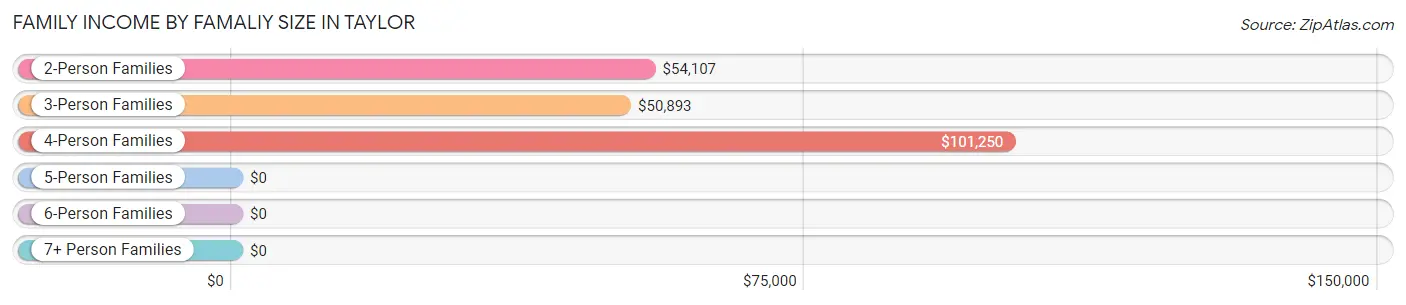
| Income Bracket | # Families | Median Income |
| 2-Person Families | 49 (51.6%) | $54,107 |
| 3-Person Families | 25 (26.3%) | $50,893 |
| 4-Person Families | 14 (14.7%) | $101,250 |
| 5-Person Families | 7 (7.4%) | $0 |
| 6-Person Families | 0 (0.0%) | $0 |
| 7+ Person Families | 0 (0.0%) | $0 |
| Total | 95 (100.0%) | $54,464 |
Family Income by Number of Earners in Taylor
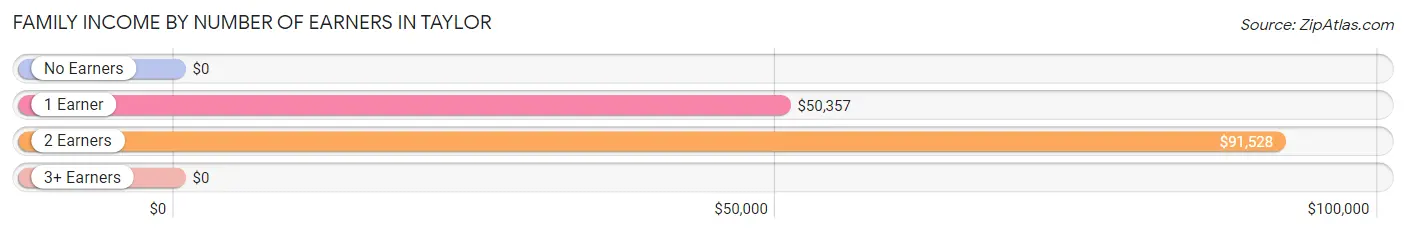
| Number of Earners | # Families | Median Income |
| No Earners | 11 (11.6%) | $0 |
| 1 Earner | 40 (42.1%) | $50,357 |
| 2 Earners | 39 (41.0%) | $91,528 |
| 3+ Earners | 5 (5.3%) | $0 |
| Total | 95 (100.0%) | $54,464 |
Household Income in Taylor
Household Income Brackets in Taylor
With 48 households falling in the category, the $50,000 to $74,999 income range is the most frequent in Taylor, accounting for 29.1% of all households.
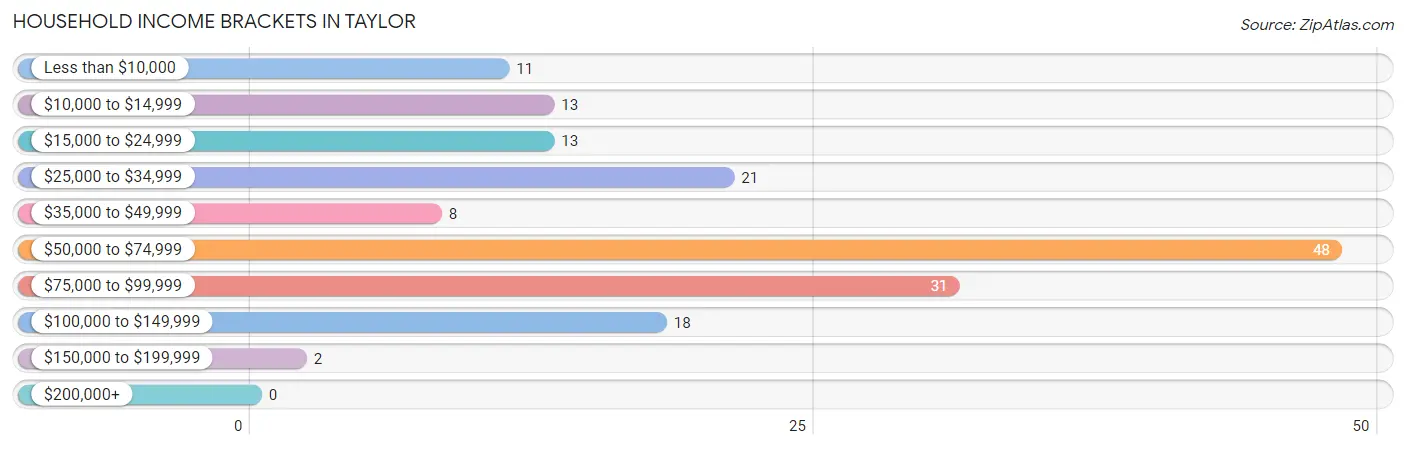
| Income Bracket | # Households | % Households |
| Less than $10,000 | 11 | 6.7% |
| $10,000 to $14,999 | 13 | 7.9% |
| $15,000 to $24,999 | 13 | 7.9% |
| $25,000 to $34,999 | 21 | 12.7% |
| $35,000 to $49,999 | 8 | 4.8% |
| $50,000 to $74,999 | 48 | 29.1% |
| $75,000 to $99,999 | 31 | 18.8% |
| $100,000 to $149,999 | 18 | 10.9% |
| $150,000 to $199,999 | 2 | 1.2% |
| $200,000+ | 0 | 0.0% |
Household Income by Householder Age in Taylor
The median household income in Taylor is $52,171, with the highest median household income of $68,333 found in the 15 to 24 years age bracket for the primary householder. A total of 8 households (4.9%) fall into this category. Meanwhile, the 65+ years age bracket for the primary householder has the lowest median household income of $31,250, with 18 households (10.9%) in this group.
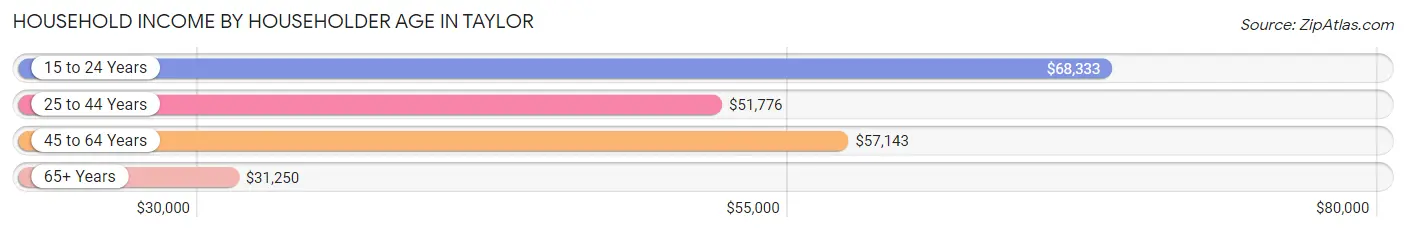
| Income Bracket | # Households | Median Income |
| 15 to 24 Years | 8 (4.9%) | $68,333 |
| 25 to 44 Years | 77 (46.7%) | $51,776 |
| 45 to 64 Years | 62 (37.6%) | $57,143 |
| 65+ Years | 18 (10.9%) | $31,250 |
| Total | 165 (100.0%) | $52,171 |
Poverty in Taylor
Income Below Poverty by Sex and Age in Taylor
With 8.5% poverty level for males and 26.3% for females among the residents of Taylor, 12 to 14 year old males and 35 to 44 year old females are the most vulnerable to poverty, with 6 males (100.0%) and 21 females (44.7%) in their respective age groups living below the poverty level.
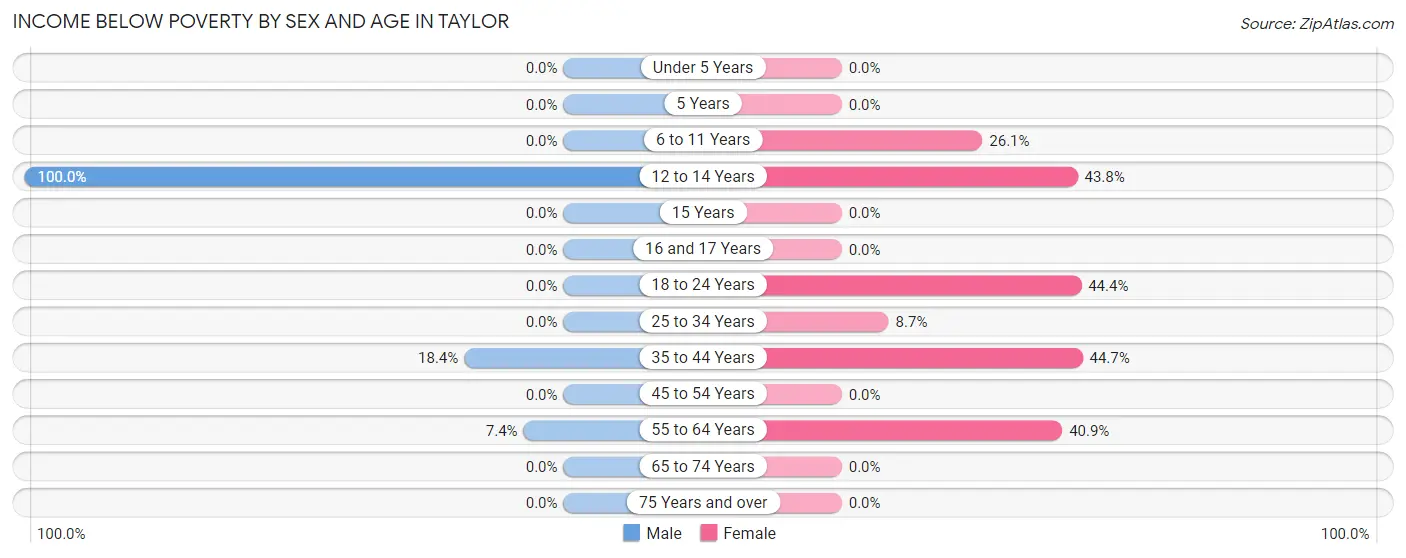
| Age Bracket | Male | Female |
| Under 5 Years | 0 (0.0%) | 0 (0.0%) |
| 5 Years | 0 (0.0%) | 0 (0.0%) |
| 6 to 11 Years | 0 (0.0%) | 6 (26.1%) |
| 12 to 14 Years | 6 (100.0%) | 7 (43.8%) |
| 15 Years | 0 (0.0%) | 0 (0.0%) |
| 16 and 17 Years | 0 (0.0%) | 0 (0.0%) |
| 18 to 24 Years | 0 (0.0%) | 4 (44.4%) |
| 25 to 34 Years | 0 (0.0%) | 2 (8.7%) |
| 35 to 44 Years | 7 (18.4%) | 21 (44.7%) |
| 45 to 54 Years | 0 (0.0%) | 0 (0.0%) |
| 55 to 64 Years | 2 (7.4%) | 9 (40.9%) |
| 65 to 74 Years | 0 (0.0%) | 0 (0.0%) |
| 75 Years and over | 0 (0.0%) | 0 (0.0%) |
| Total | 15 (8.5%) | 49 (26.3%) |
Income Above Poverty by Sex and Age in Taylor
According to the poverty statistics in Taylor, males aged under 5 years and females aged under 5 years are the age groups that are most secure financially, with 100.0% of males and 100.0% of females in these age groups living above the poverty line.
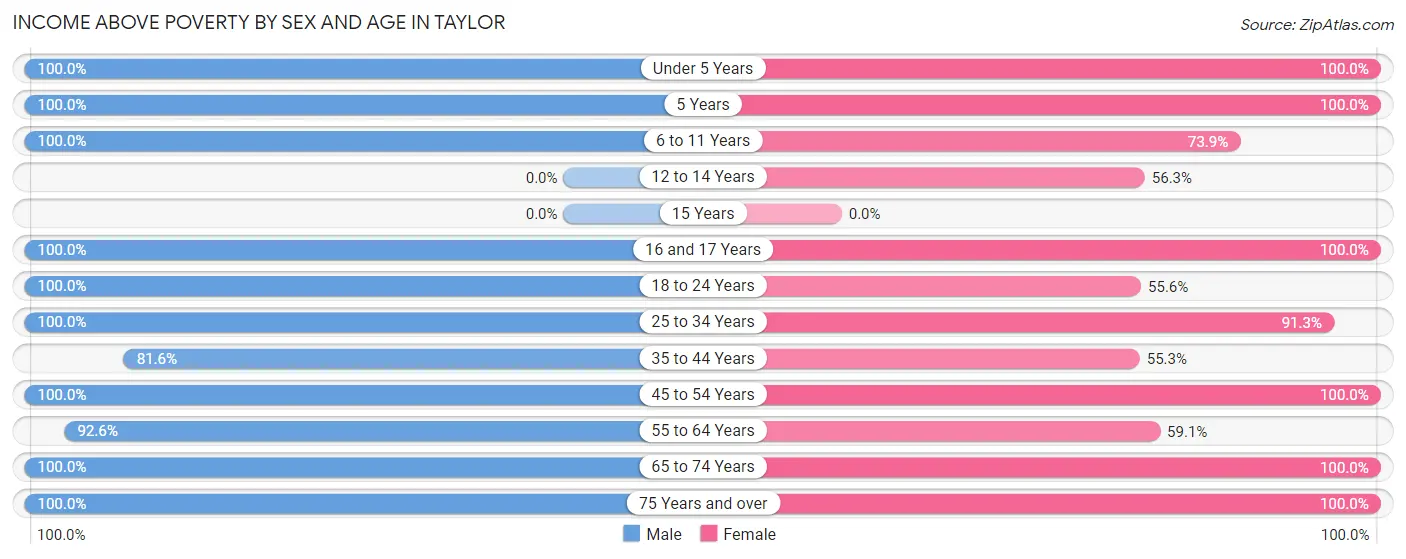
| Age Bracket | Male | Female |
| Under 5 Years | 13 (100.0%) | 10 (100.0%) |
| 5 Years | 2 (100.0%) | 4 (100.0%) |
| 6 to 11 Years | 15 (100.0%) | 17 (73.9%) |
| 12 to 14 Years | 0 (0.0%) | 9 (56.2%) |
| 15 Years | 0 (0.0%) | 0 (0.0%) |
| 16 and 17 Years | 4 (100.0%) | 5 (100.0%) |
| 18 to 24 Years | 8 (100.0%) | 5 (55.6%) |
| 25 to 34 Years | 28 (100.0%) | 21 (91.3%) |
| 35 to 44 Years | 31 (81.6%) | 26 (55.3%) |
| 45 to 54 Years | 24 (100.0%) | 17 (100.0%) |
| 55 to 64 Years | 25 (92.6%) | 13 (59.1%) |
| 65 to 74 Years | 6 (100.0%) | 6 (100.0%) |
| 75 Years and over | 6 (100.0%) | 4 (100.0%) |
| Total | 162 (91.5%) | 137 (73.7%) |
Income Below Poverty Among Married-Couple Families in Taylor
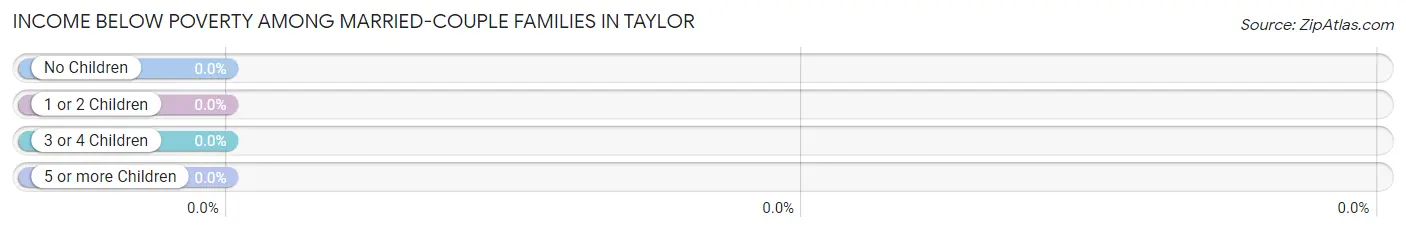
| Children | Above Poverty | Below Poverty |
| No Children | 26 (100.0%) | 0 (0.0%) |
| 1 or 2 Children | 21 (100.0%) | 0 (0.0%) |
| 3 or 4 Children | 2 (100.0%) | 0 (0.0%) |
| 5 or more Children | 0 (0.0%) | 0 (0.0%) |
| Total | 49 (100.0%) | 0 (0.0%) |
Income Below Poverty Among Single-Parent Households in Taylor
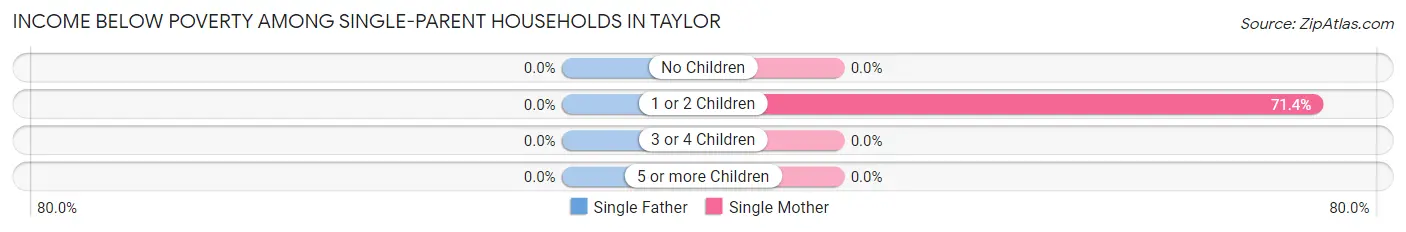
| Children | Single Father | Single Mother |
| No Children | 0 (0.0%) | 0 (0.0%) |
| 1 or 2 Children | 0 (0.0%) | 15 (71.4%) |
| 3 or 4 Children | 0 (0.0%) | 0 (0.0%) |
| 5 or more Children | 0 (0.0%) | 0 (0.0%) |
| Total | 0 (0.0%) | 15 (55.6%) |
Income Below Poverty Among Married-Couple vs Single-Parent Households in Taylor
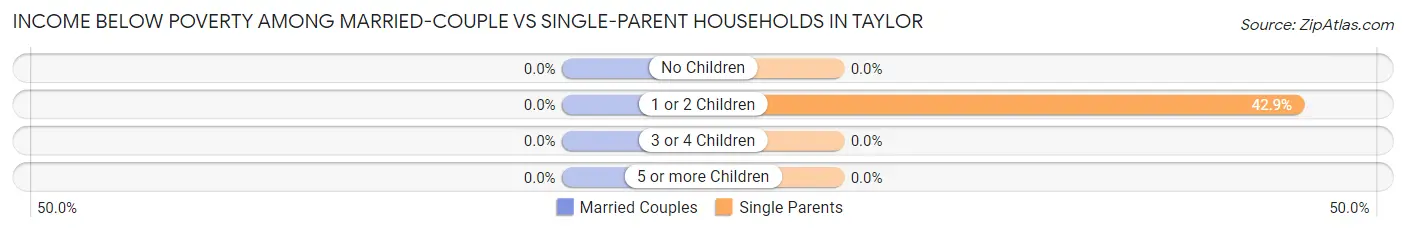
| Children | Married-Couple Families | Single-Parent Households |
| No Children | 0 (0.0%) | 0 (0.0%) |
| 1 or 2 Children | 0 (0.0%) | 15 (42.9%) |
| 3 or 4 Children | 0 (0.0%) | 0 (0.0%) |
| 5 or more Children | 0 (0.0%) | 0 (0.0%) |
| Total | 0 (0.0%) | 15 (32.6%) |
Race in Taylor
The most populous races in Taylor are White / Caucasian (359 | 98.9%), Hispanic or Latino (14 | 3.9%), and Two or more Races (4 | 1.1%).
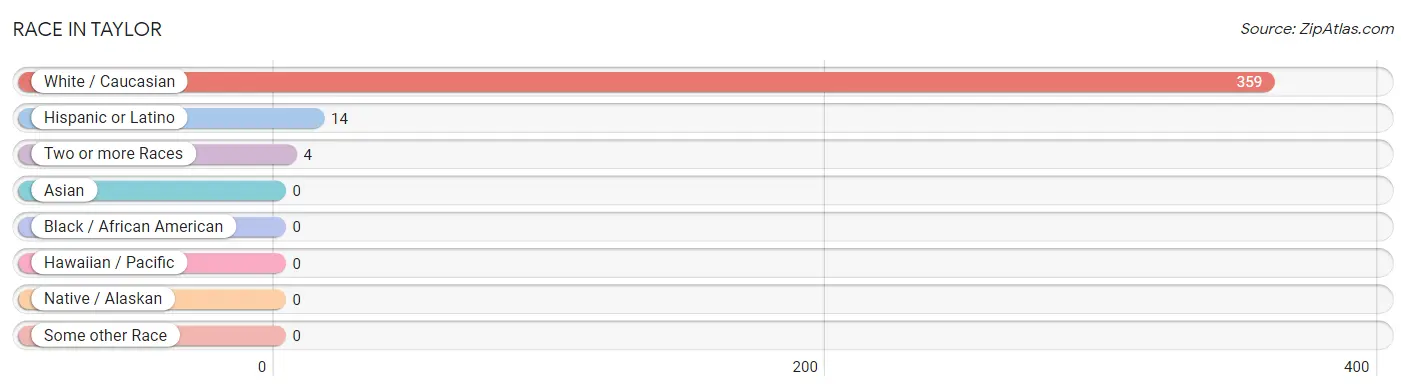
| Race | # Population | % Population |
| Asian | 0 | 0.0% |
| Black / African American | 0 | 0.0% |
| Hawaiian / Pacific | 0 | 0.0% |
| Hispanic or Latino | 14 | 3.9% |
| Native / Alaskan | 0 | 0.0% |
| White / Caucasian | 359 | 98.9% |
| Two or more Races | 4 | 1.1% |
| Some other Race | 0 | 0.0% |
| Total | 363 | 100.0% |
Ancestry in Taylor
The most populous ancestries reported in Taylor are German (125 | 34.4%), Norwegian (113 | 31.1%), Irish (24 | 6.6%), Polish (21 | 5.8%), and English (15 | 4.1%), together accounting for 82.1% of all Taylor residents.
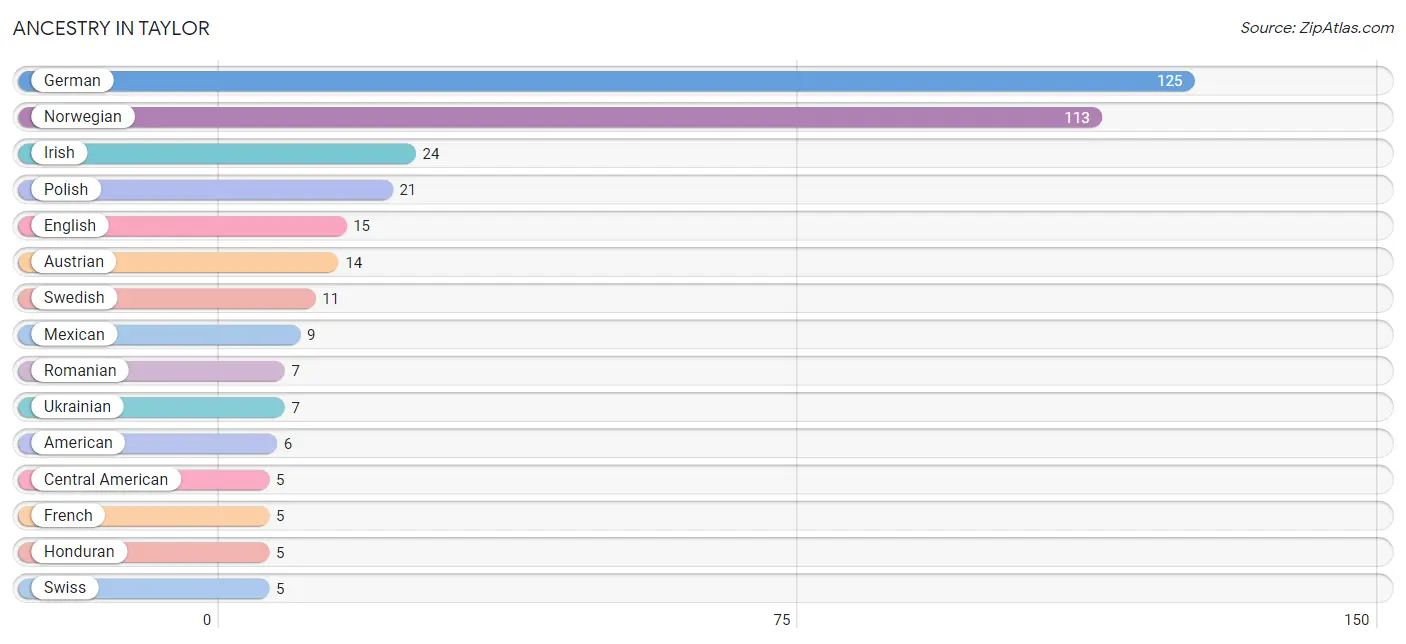
| Ancestry | # Population | % Population |
| American | 6 | 1.7% |
| Austrian | 14 | 3.9% |
| Central American | 5 | 1.4% |
| Czech | 2 | 0.5% |
| English | 15 | 4.1% |
| Finnish | 2 | 0.5% |
| French | 5 | 1.4% |
| German | 125 | 34.4% |
| Honduran | 5 | 1.4% |
| Irish | 24 | 6.6% |
| Italian | 2 | 0.5% |
| Mexican | 9 | 2.5% |
| Norwegian | 113 | 31.1% |
| Polish | 21 | 5.8% |
| Romanian | 7 | 1.9% |
| Russian | 3 | 0.8% |
| Scotch-Irish | 1 | 0.3% |
| Swedish | 11 | 3.0% |
| Swiss | 5 | 1.4% |
| Ukrainian | 7 | 1.9% | View All 20 Rows |
Immigrants in Taylor
The most numerous immigrant groups reported in Taylor came from Eastern Europe (5 | 1.4%), Europe (5 | 1.4%), and Russia (5 | 1.4%), together accounting for 4.1% of all Taylor residents.
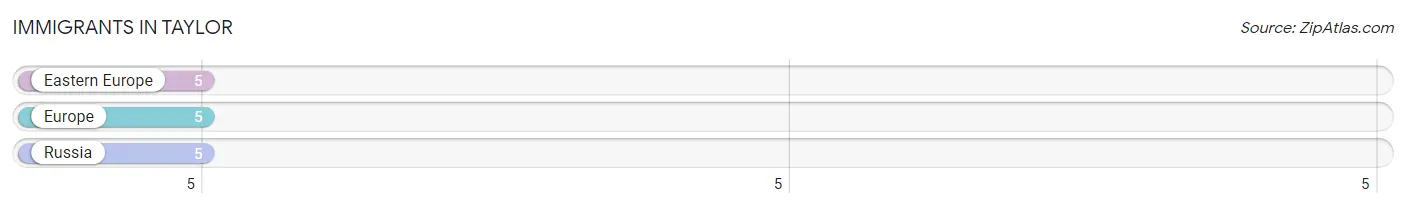
| Immigration Origin | # Population | % Population |
| Eastern Europe | 5 | 1.4% |
| Europe | 5 | 1.4% |
| Russia | 5 | 1.4% | View All 3 Rows |
Sex and Age in Taylor
Sex and Age in Taylor
The most populous age groups in Taylor are 35 to 39 Years (35 | 19.8%) for men and 35 to 39 Years (26 | 14.0%) for women.
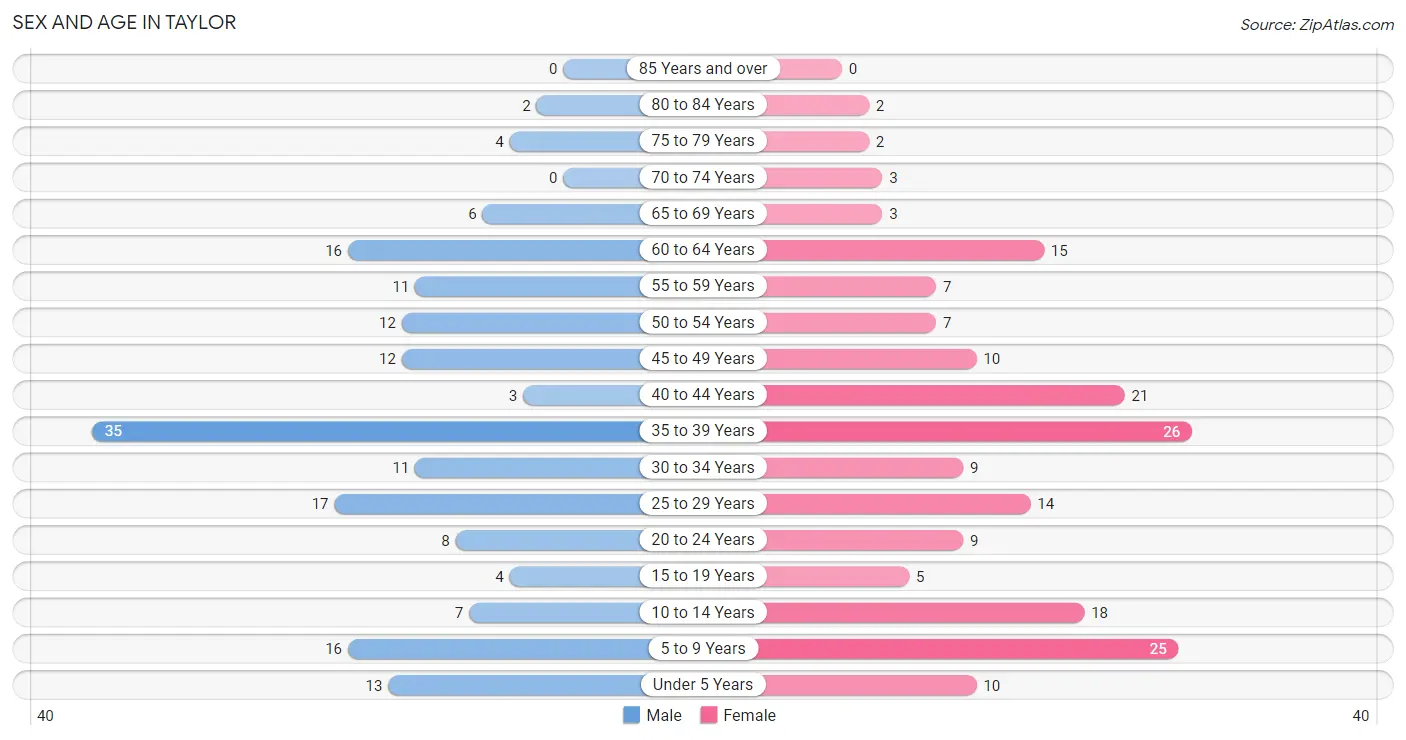
| Age Bracket | Male | Female |
| Under 5 Years | 13 (7.3%) | 10 (5.4%) |
| 5 to 9 Years | 16 (9.0%) | 25 (13.4%) |
| 10 to 14 Years | 7 (4.0%) | 18 (9.7%) |
| 15 to 19 Years | 4 (2.3%) | 5 (2.7%) |
| 20 to 24 Years | 8 (4.5%) | 9 (4.8%) |
| 25 to 29 Years | 17 (9.6%) | 14 (7.5%) |
| 30 to 34 Years | 11 (6.2%) | 9 (4.8%) |
| 35 to 39 Years | 35 (19.8%) | 26 (14.0%) |
| 40 to 44 Years | 3 (1.7%) | 21 (11.3%) |
| 45 to 49 Years | 12 (6.8%) | 10 (5.4%) |
| 50 to 54 Years | 12 (6.8%) | 7 (3.8%) |
| 55 to 59 Years | 11 (6.2%) | 7 (3.8%) |
| 60 to 64 Years | 16 (9.0%) | 15 (8.1%) |
| 65 to 69 Years | 6 (3.4%) | 3 (1.6%) |
| 70 to 74 Years | 0 (0.0%) | 3 (1.6%) |
| 75 to 79 Years | 4 (2.3%) | 2 (1.1%) |
| 80 to 84 Years | 2 (1.1%) | 2 (1.1%) |
| 85 Years and over | 0 (0.0%) | 0 (0.0%) |
| Total | 177 (100.0%) | 186 (100.0%) |
Families and Households in Taylor
Median Family Size in Taylor
The median family size in Taylor is 2.74 persons per family, with single male/father families (19 | 20.0%) accounting for the largest median family size of 2.95 persons per family. On the other hand, single female/mother families (27 | 28.4%) represent the smallest median family size with 2.37 persons per family.
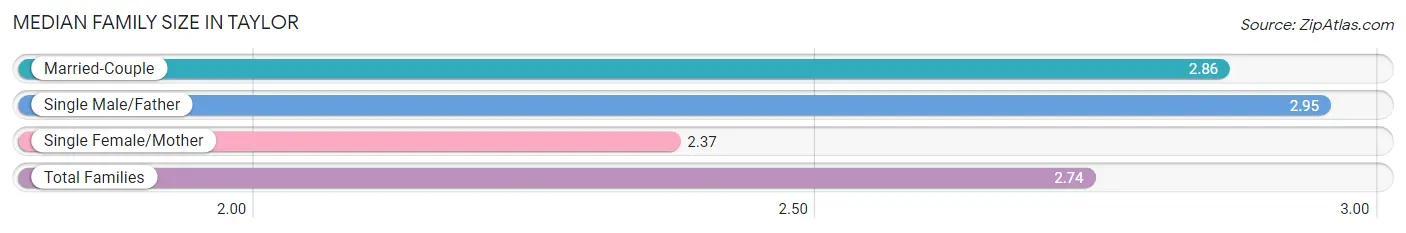
| Family Type | # Families | Family Size |
| Married-Couple | 49 (51.6%) | 2.86 |
| Single Male/Father | 19 (20.0%) | 2.95 |
| Single Female/Mother | 27 (28.4%) | 2.37 |
| Total Families | 95 (100.0%) | 2.74 |
Median Household Size in Taylor
The median household size in Taylor is 2.20 persons per household, with single male/father households (19 | 11.5%) accounting for the largest median household size of 3.68 persons per household. non-family households (70 | 42.4%) represent the smallest median household size with 1.10 persons per household.
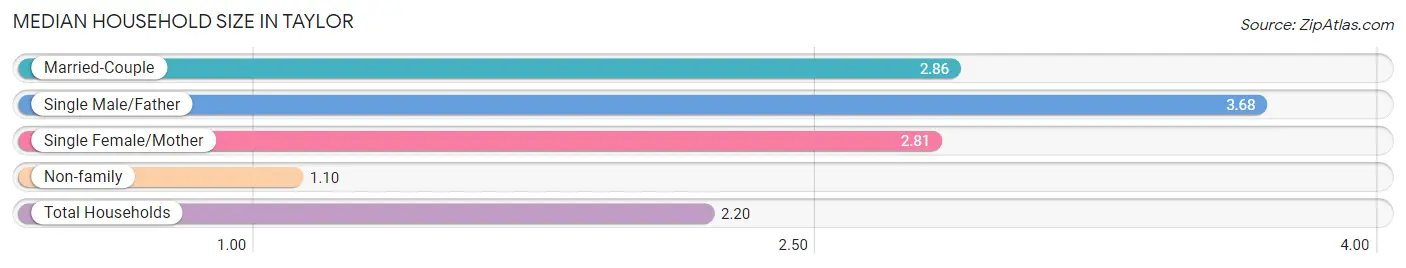
| Household Type | # Households | Household Size |
| Married-Couple | 49 (29.7%) | 2.86 |
| Single Male/Father | 19 (11.5%) | 3.68 |
| Single Female/Mother | 27 (16.4%) | 2.81 |
| Non-family | 70 (42.4%) | 1.10 |
| Total Households | 165 (100.0%) | 2.20 |
Household Size by Marriage Status in Taylor
Out of a total of 165 households in Taylor, 95 (57.6%) are family households, while 70 (42.4%) are nonfamily households. The most numerous type of family households are 2-person households, comprising 40, and the most common type of nonfamily households are 1-person households, comprising 64.
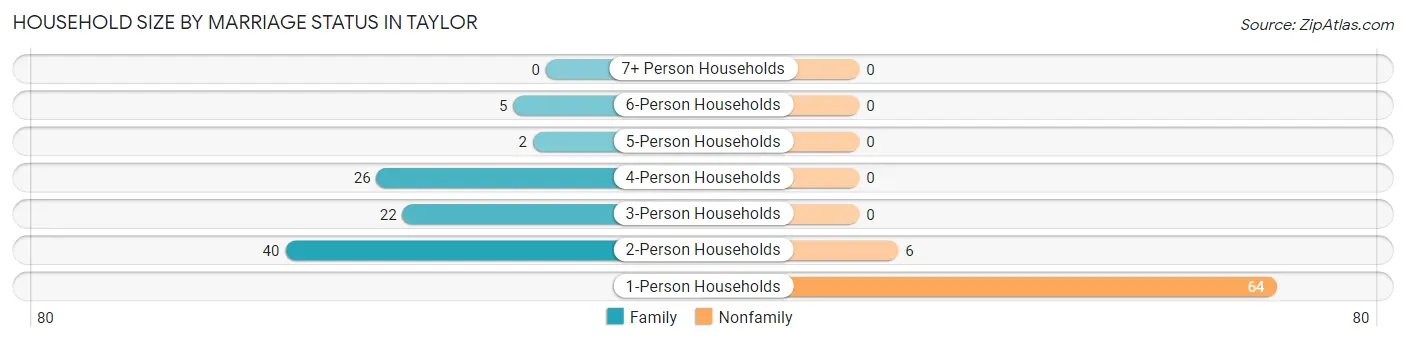
| Household Size | Family Households | Nonfamily Households |
| 1-Person Households | - | 64 (38.8%) |
| 2-Person Households | 40 (24.2%) | 6 (3.6%) |
| 3-Person Households | 22 (13.3%) | 0 (0.0%) |
| 4-Person Households | 26 (15.8%) | 0 (0.0%) |
| 5-Person Households | 2 (1.2%) | 0 (0.0%) |
| 6-Person Households | 5 (3.0%) | 0 (0.0%) |
| 7+ Person Households | 0 (0.0%) | 0 (0.0%) |
| Total | 95 (57.6%) | 70 (42.4%) |
Female Fertility in Taylor
Fertility by Age in Taylor
Average fertility rate in Taylor is 84.0 births per 1,000 women. Women in the age bracket of 20 to 34 years have the highest fertility rate with 250.0 births per 1,000 women. Women in the age bracket of 20 to 34 years acount for 100.0% of all women with births.
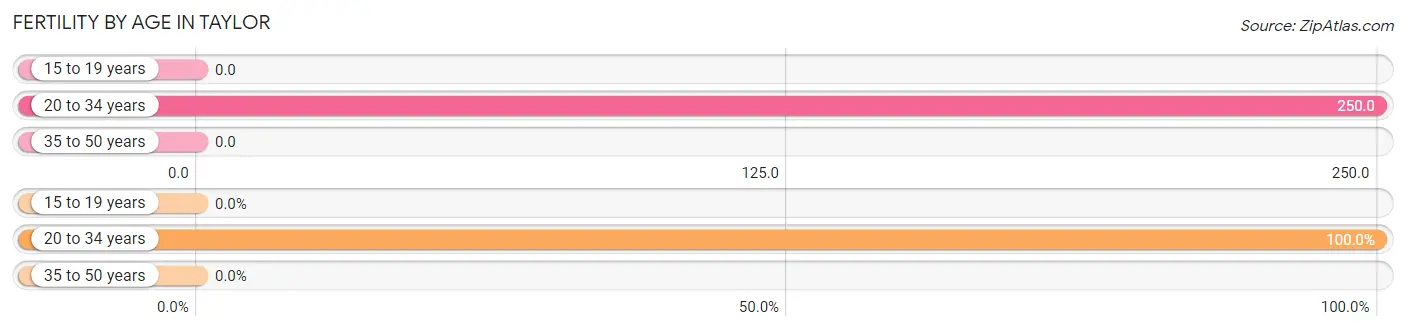
| Age Bracket | Women with Births | Births / 1,000 Women |
| 15 to 19 years | 0 (0.0%) | 0.0 |
| 20 to 34 years | 8 (100.0%) | 250.0 |
| 35 to 50 years | 0 (0.0%) | 0.0 |
| Total | 8 (100.0%) | 84.0 |
Fertility by Age by Marriage Status in Taylor
50.0% of women with births (8) in Taylor are married. The highest percentage of unmarried women with births falls into 20 to 34 years age bracket with 50.0% of them unmarried at the time of birth, while the lowest percentage of unmarried women with births belong to 20 to 34 years age bracket with 50.0% of them unmarried.
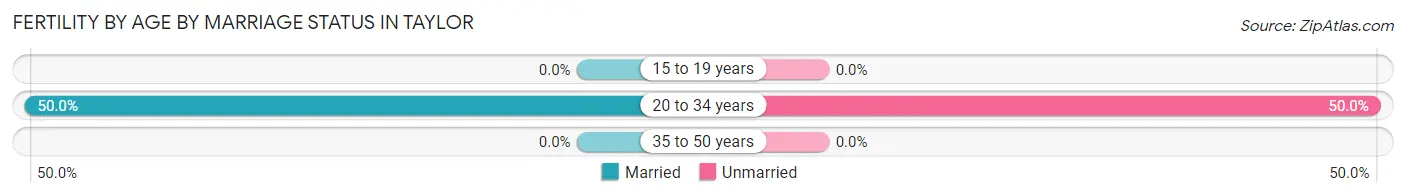
| Age Bracket | Married | Unmarried |
| 15 to 19 years | 0 (0.0%) | 0 (0.0%) |
| 20 to 34 years | 4 (50.0%) | 4 (50.0%) |
| 35 to 50 years | 0 (0.0%) | 0 (0.0%) |
| Total | 4 (50.0%) | 4 (50.0%) |
Fertility by Education in Taylor
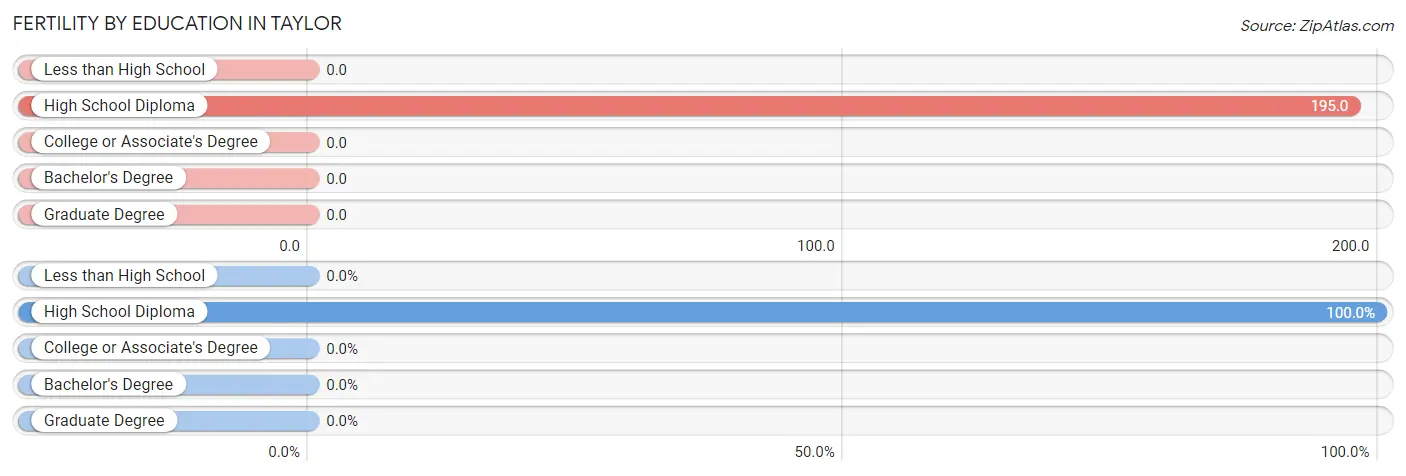
| Educational Attainment | Women with Births | Births / 1,000 Women |
| Less than High School | 0 (0.0%) | 0.0 |
| High School Diploma | 8 (100.0%) | 195.0 |
| College or Associate's Degree | 0 (0.0%) | 0.0 |
| Bachelor's Degree | 0 (0.0%) | 0.0 |
| Graduate Degree | 0 (0.0%) | 0.0 |
| Total | 8 (100.0%) | 84.0 |
Fertility by Education by Marriage Status in Taylor
50.0% of women with births in Taylor are unmarried. Women with the educational attainment of high school diploma are most likely to be married with 50.0% of them married at childbirth, while women with the educational attainment of high school diploma are least likely to be married with 50.0% of them unmarried at childbirth.
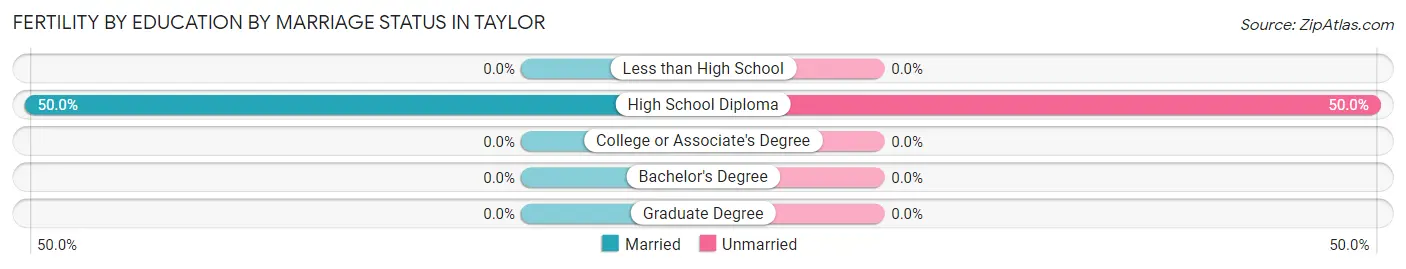
| Educational Attainment | Married | Unmarried |
| Less than High School | 0 (0.0%) | 0 (0.0%) |
| High School Diploma | 4 (50.0%) | 4 (50.0%) |
| College or Associate's Degree | 0 (0.0%) | 0 (0.0%) |
| Bachelor's Degree | 0 (0.0%) | 0 (0.0%) |
| Graduate Degree | 0 (0.0%) | 0 (0.0%) |
| Total | 4 (50.0%) | 4 (50.0%) |
Employment Characteristics in Taylor
Employment by Class of Employer in Taylor
Among the 188 employed individuals in Taylor, private company employees (151 | 80.3%), local government employees (23 | 12.2%), and self-employed (not incorporated) (8 | 4.3%) make up the most common classes of employment.
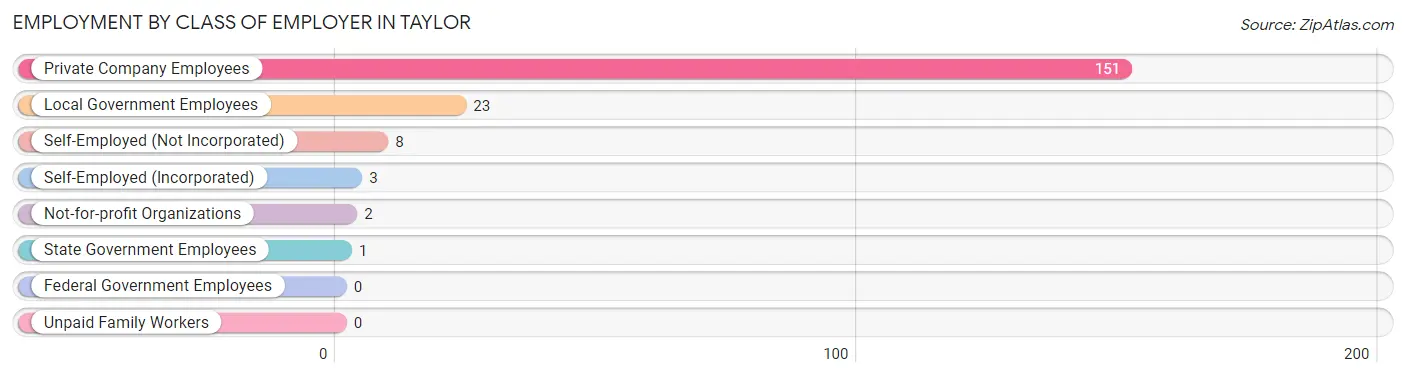
| Employer Class | # Employees | % Employees |
| Private Company Employees | 151 | 80.3% |
| Self-Employed (Incorporated) | 3 | 1.6% |
| Self-Employed (Not Incorporated) | 8 | 4.3% |
| Not-for-profit Organizations | 2 | 1.1% |
| Local Government Employees | 23 | 12.2% |
| State Government Employees | 1 | 0.5% |
| Federal Government Employees | 0 | 0.0% |
| Unpaid Family Workers | 0 | 0.0% |
| Total | 188 | 100.0% |
Employment Status by Age in Taylor
According to the labor force statistics for Taylor, out of the total population over 16 years of age (274), 75.2% or 206 individuals are in the labor force, with 4.4% or 9 of them unemployed. The age group with the highest labor force participation rate is 20 to 24 years, with 100.0% or 17 individuals in the labor force. Within the labor force, the 35 to 44 years age range has the highest percentage of unemployed individuals, with 10.3% or 7 of them being unemployed.
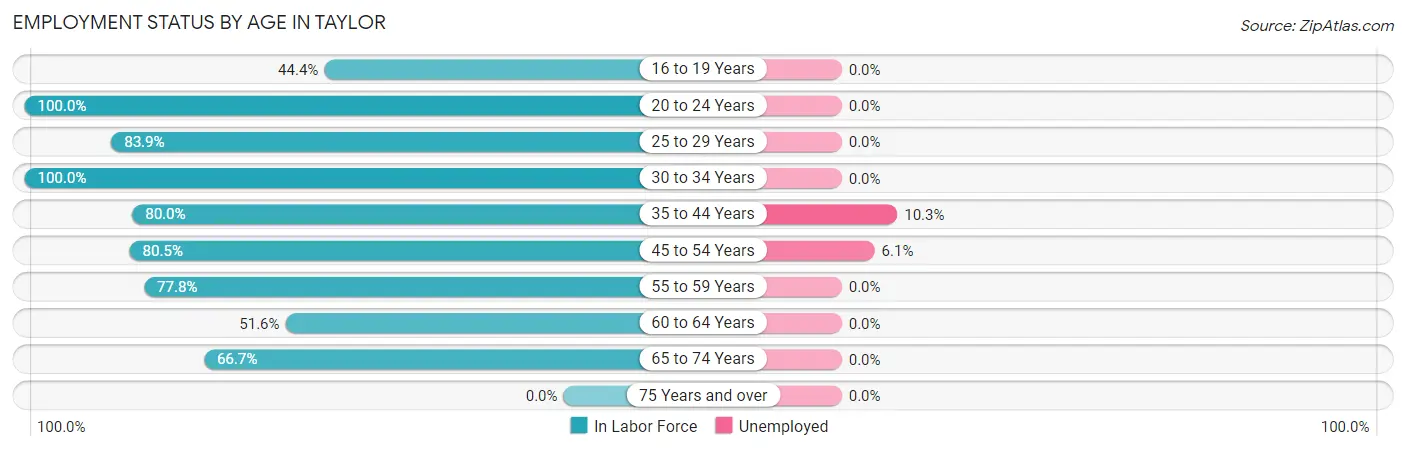
| Age Bracket | In Labor Force | Unemployed |
| 16 to 19 Years | 4 (44.4%) | 0 (0.0%) |
| 20 to 24 Years | 17 (100.0%) | 0 (0.0%) |
| 25 to 29 Years | 26 (83.9%) | 0 (0.0%) |
| 30 to 34 Years | 20 (100.0%) | 0 (0.0%) |
| 35 to 44 Years | 68 (80.0%) | 7 (10.3%) |
| 45 to 54 Years | 33 (80.5%) | 2 (6.1%) |
| 55 to 59 Years | 14 (77.8%) | 0 (0.0%) |
| 60 to 64 Years | 16 (51.6%) | 0 (0.0%) |
| 65 to 74 Years | 8 (66.7%) | 0 (0.0%) |
| 75 Years and over | 0 (0.0%) | 0 (0.0%) |
| Total | 206 (75.2%) | 9 (4.4%) |
Employment Status by Educational Attainment in Taylor
According to labor force statistics for Taylor, 78.3% of individuals (177) out of the total population between 25 and 64 years of age (226) are in the labor force, with 5.1% or 9 of them being unemployed. The group with the highest labor force participation rate are those with the educational attainment of college / associate degree, with 84.0% or 79 individuals in the labor force. Within the labor force, individuals with high school diploma education have the highest percentage of unemployment, with 8.0% or 7 of them being unemployed.
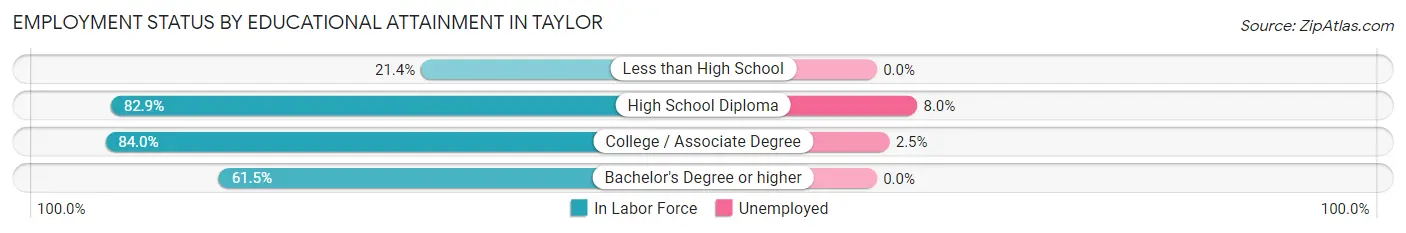
| Educational Attainment | In Labor Force | Unemployed |
| Less than High School | 3 (21.4%) | 0 (0.0%) |
| High School Diploma | 87 (82.9%) | 8 (8.0%) |
| College / Associate Degree | 79 (84.0%) | 2 (2.5%) |
| Bachelor's Degree or higher | 8 (61.5%) | 0 (0.0%) |
| Total | 177 (78.3%) | 12 (5.1%) |
Employment Occupations by Sex in Taylor
Management, Business, Science and Arts Occupations
The most common Management, Business, Science and Arts occupations in Taylor are Management (29 | 14.7%), Community & Social Service (8 | 4.1%), Education Instruction & Library (8 | 4.1%), Business & Financial (6 | 3.0%), and Health Diagnosing & Treating (5 | 2.5%).
Management, Business, Science and Arts Occupations by Sex
Within the Management, Business, Science and Arts occupations in Taylor, the most male-oriented occupations are Computers, Engineering & Science (100.0%), Computers & Mathematics (100.0%), and Architecture & Engineering (100.0%), while the most female-oriented occupations are Health Diagnosing & Treating (100.0%), Health Technologists (100.0%), and Community & Social Service (87.5%).
| Occupation | Male | Female |
| Management | 18 (62.1%) | 11 (37.9%) |
| Business & Financial | 2 (33.3%) | 4 (66.7%) |
| Computers, Engineering & Science | 3 (100.0%) | 0 (0.0%) |
| Computers & Mathematics | 1 (100.0%) | 0 (0.0%) |
| Architecture & Engineering | 2 (100.0%) | 0 (0.0%) |
| Life, Physical & Social Science | 0 (0.0%) | 0 (0.0%) |
| Community & Social Service | 1 (12.5%) | 7 (87.5%) |
| Education, Arts & Media | 0 (0.0%) | 0 (0.0%) |
| Legal Services & Support | 0 (0.0%) | 0 (0.0%) |
| Education Instruction & Library | 1 (12.5%) | 7 (87.5%) |
| Arts, Media & Entertainment | 0 (0.0%) | 0 (0.0%) |
| Health Diagnosing & Treating | 0 (0.0%) | 5 (100.0%) |
| Health Technologists | 0 (0.0%) | 4 (100.0%) |
| Total (Category) | 24 (47.1%) | 27 (52.9%) |
| Total (Overall) | 118 (59.9%) | 79 (40.1%) |
Services Occupations
The most common Services occupations in Taylor are Food Preparation & Serving (14 | 7.1%), Cleaning & Maintenance (8 | 4.1%), Healthcare Support (7 | 3.5%), Security & Protection (2 | 1.0%), and Firefighting & Prevention (2 | 1.0%).
Services Occupations by Sex
Within the Services occupations in Taylor, the most male-oriented occupations are Cleaning & Maintenance (75.0%), and Food Preparation & Serving (28.6%), while the most female-oriented occupations are Healthcare Support (100.0%), Security & Protection (100.0%), and Firefighting & Prevention (100.0%).
| Occupation | Male | Female |
| Healthcare Support | 0 (0.0%) | 7 (100.0%) |
| Security & Protection | 0 (0.0%) | 2 (100.0%) |
| Firefighting & Prevention | 0 (0.0%) | 2 (100.0%) |
| Law Enforcement | 0 (0.0%) | 0 (0.0%) |
| Food Preparation & Serving | 4 (28.6%) | 10 (71.4%) |
| Cleaning & Maintenance | 6 (75.0%) | 2 (25.0%) |
| Personal Care & Service | 0 (0.0%) | 0 (0.0%) |
| Total (Category) | 10 (32.3%) | 21 (67.7%) |
| Total (Overall) | 118 (59.9%) | 79 (40.1%) |
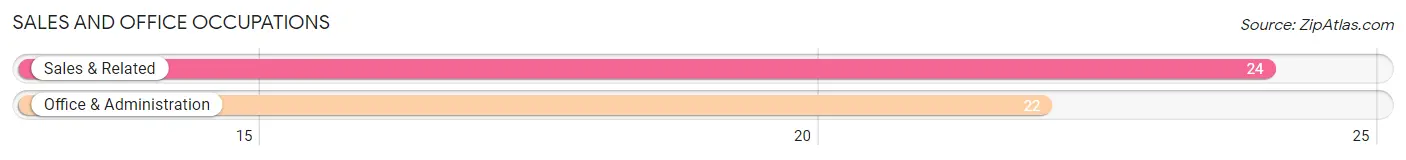
Sales and Office Occupations
The most common Sales and Office occupations in Taylor are Sales & Related (24 | 12.2%), and Office & Administration (22 | 11.2%).
Sales and Office Occupations by Sex
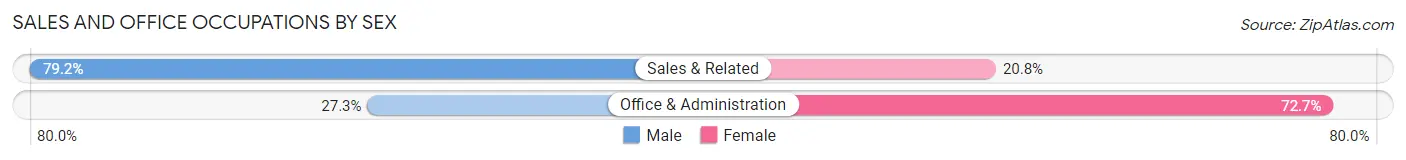
| Occupation | Male | Female |
| Sales & Related | 19 (79.2%) | 5 (20.8%) |
| Office & Administration | 6 (27.3%) | 16 (72.7%) |
| Total (Category) | 25 (54.3%) | 21 (45.7%) |
| Total (Overall) | 118 (59.9%) | 79 (40.1%) |
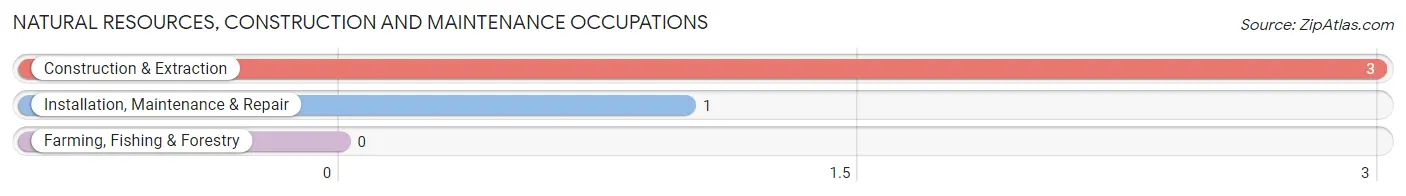
Natural Resources, Construction and Maintenance Occupations
The most common Natural Resources, Construction and Maintenance occupations in Taylor are Construction & Extraction (3 | 1.5%), and Installation, Maintenance & Repair (1 | 0.5%).
Natural Resources, Construction and Maintenance Occupations by Sex
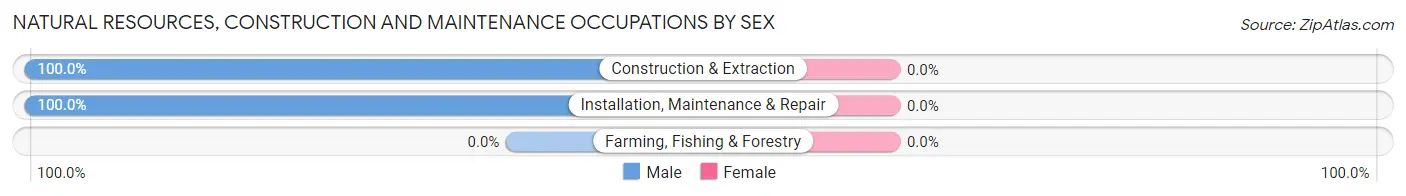
| Occupation | Male | Female |
| Farming, Fishing & Forestry | 0 (0.0%) | 0 (0.0%) |
| Construction & Extraction | 3 (100.0%) | 0 (0.0%) |
| Installation, Maintenance & Repair | 1 (100.0%) | 0 (0.0%) |
| Total (Category) | 4 (100.0%) | 0 (0.0%) |
| Total (Overall) | 118 (59.9%) | 79 (40.1%) |
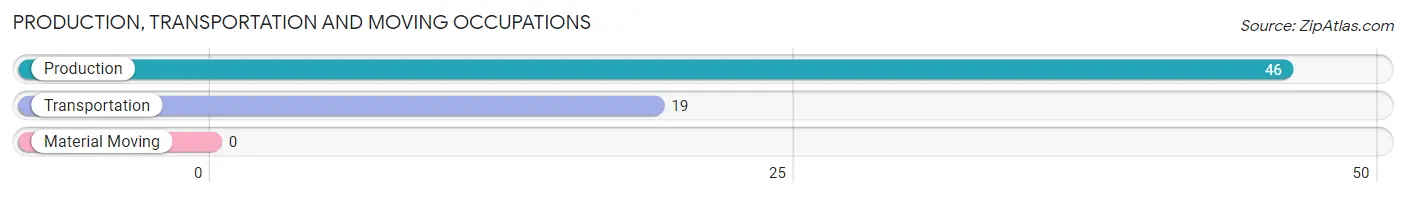
Production, Transportation and Moving Occupations
The most common Production, Transportation and Moving occupations in Taylor are Production (46 | 23.4%), and Transportation (19 | 9.6%).
Production, Transportation and Moving Occupations by Sex
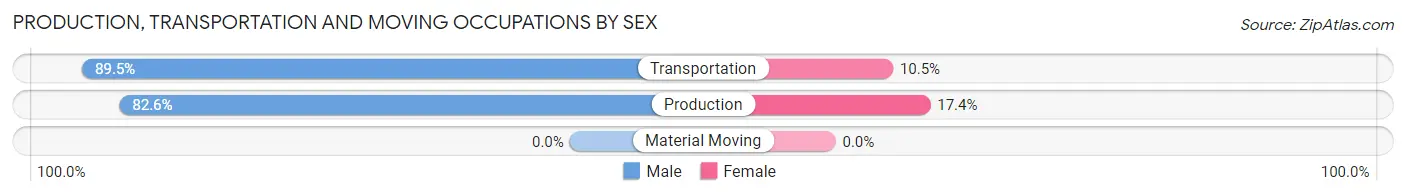
| Occupation | Male | Female |
| Production | 38 (82.6%) | 8 (17.4%) |
| Transportation | 17 (89.5%) | 2 (10.5%) |
| Material Moving | 0 (0.0%) | 0 (0.0%) |
| Total (Category) | 55 (84.6%) | 10 (15.4%) |
| Total (Overall) | 118 (59.9%) | 79 (40.1%) |
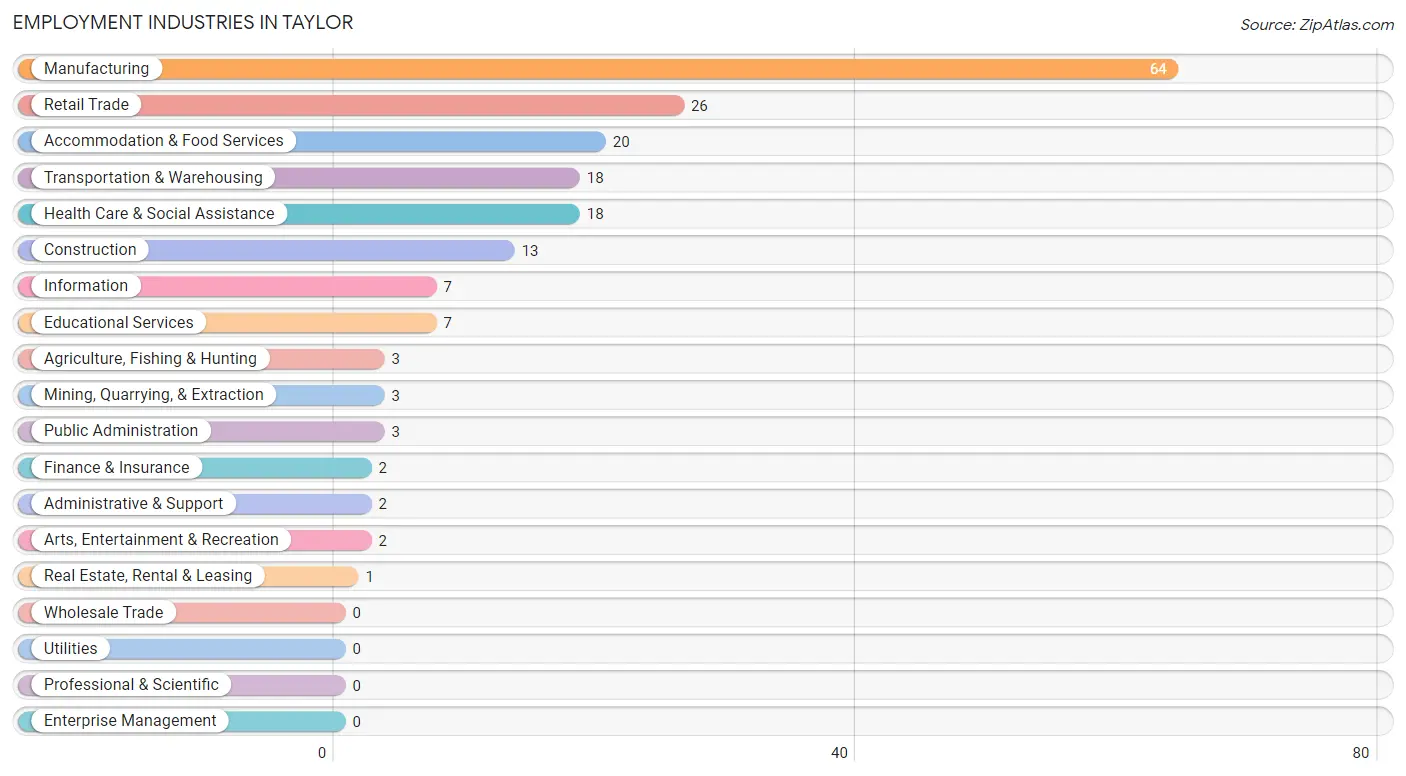
Employment Industries by Sex in Taylor
Employment Industries in Taylor
The major employment industries in Taylor include Manufacturing (64 | 32.5%), Retail Trade (26 | 13.2%), Accommodation & Food Services (20 | 10.2%), Transportation & Warehousing (18 | 9.1%), and Health Care & Social Assistance (18 | 9.1%).
Employment Industries by Sex in Taylor
The Taylor industries that see more men than women are Agriculture, Fishing & Hunting (100.0%), Mining, Quarrying, & Extraction (100.0%), and Construction (100.0%), whereas the industries that tend to have a higher number of women are Finance & Insurance (100.0%), Educational Services (100.0%), and Health Care & Social Assistance (100.0%).
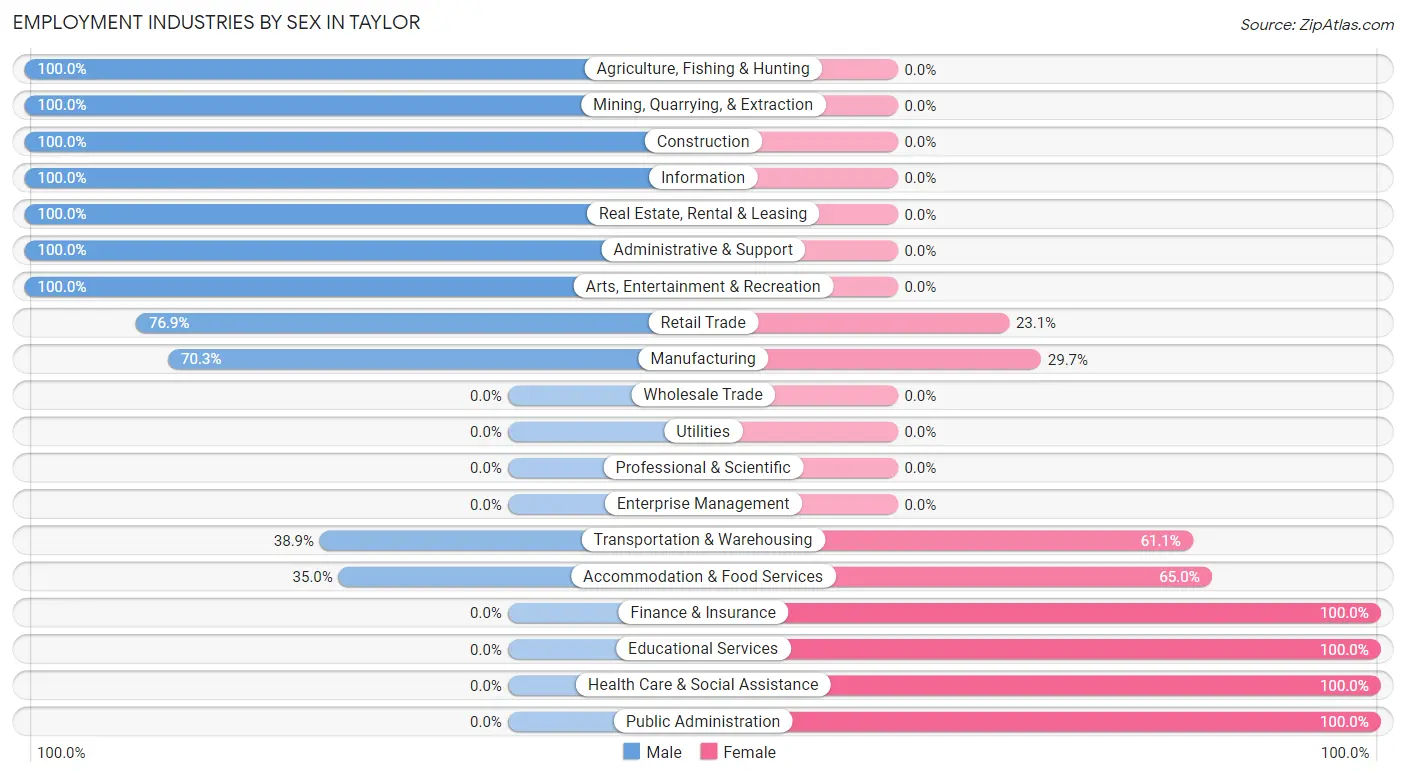
| Industry | Male | Female |
| Agriculture, Fishing & Hunting | 3 (100.0%) | 0 (0.0%) |
| Mining, Quarrying, & Extraction | 3 (100.0%) | 0 (0.0%) |
| Construction | 13 (100.0%) | 0 (0.0%) |
| Manufacturing | 45 (70.3%) | 19 (29.7%) |
| Wholesale Trade | 0 (0.0%) | 0 (0.0%) |
| Retail Trade | 20 (76.9%) | 6 (23.1%) |
| Transportation & Warehousing | 7 (38.9%) | 11 (61.1%) |
| Utilities | 0 (0.0%) | 0 (0.0%) |
| Information | 7 (100.0%) | 0 (0.0%) |
| Finance & Insurance | 0 (0.0%) | 2 (100.0%) |
| Real Estate, Rental & Leasing | 1 (100.0%) | 0 (0.0%) |
| Professional & Scientific | 0 (0.0%) | 0 (0.0%) |
| Enterprise Management | 0 (0.0%) | 0 (0.0%) |
| Administrative & Support | 2 (100.0%) | 0 (0.0%) |
| Educational Services | 0 (0.0%) | 7 (100.0%) |
| Health Care & Social Assistance | 0 (0.0%) | 18 (100.0%) |
| Arts, Entertainment & Recreation | 2 (100.0%) | 0 (0.0%) |
| Accommodation & Food Services | 7 (35.0%) | 13 (65.0%) |
| Public Administration | 0 (0.0%) | 3 (100.0%) |
| Total | 118 (59.9%) | 79 (40.1%) |
Education in Taylor
School Enrollment in Taylor
The most common levels of schooling among the 83 students in Taylor are elementary school (30 | 36.1%), middle school (19 | 22.9%), and high school (15 | 18.1%).
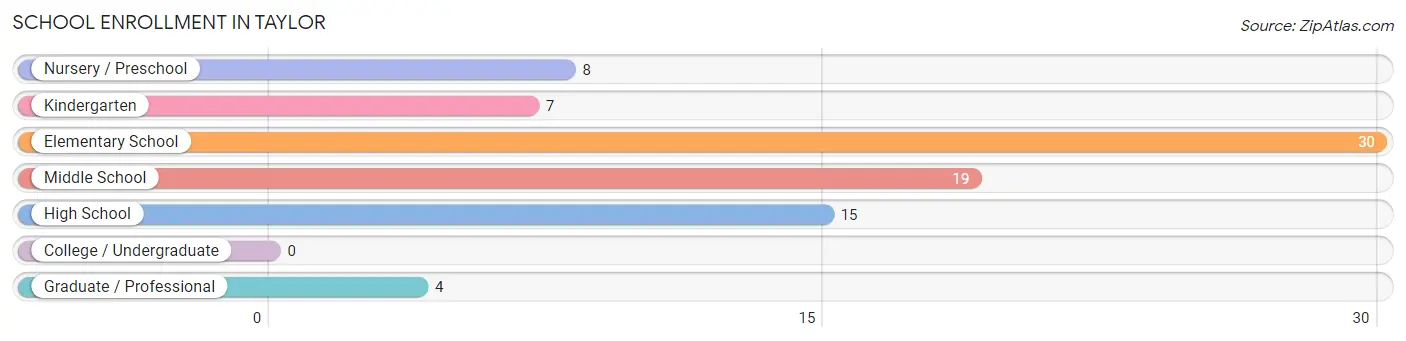
| School Level | # Students | % Students |
| Nursery / Preschool | 8 | 9.6% |
| Kindergarten | 7 | 8.4% |
| Elementary School | 30 | 36.1% |
| Middle School | 19 | 22.9% |
| High School | 15 | 18.1% |
| College / Undergraduate | 0 | 0.0% |
| Graduate / Professional | 4 | 4.8% |
| Total | 83 | 100.0% |
School Enrollment by Age by Funding Source in Taylor
Out of a total of 83 students who are enrolled in schools in Taylor, 2 (2.4%) attend a private institution, while the remaining 81 (97.6%) are enrolled in public schools. The age group of 3 to 4 year olds has the highest likelihood of being enrolled in private schools, with 2 (50.0% in the age bracket) enrolled. Conversely, the age group of 5 to 9 year old has the lowest likelihood of being enrolled in a private school, with 41 (100.0% in the age bracket) attending a public institution.
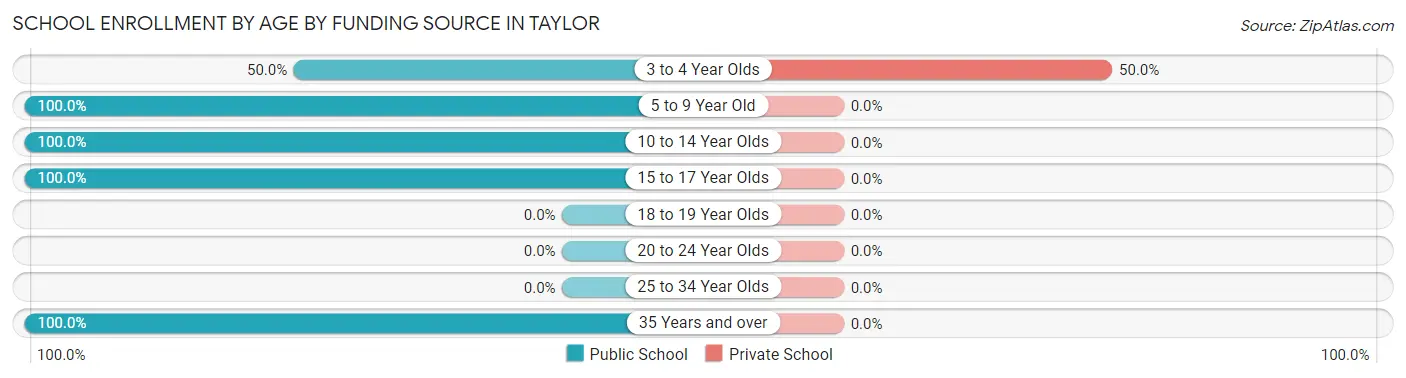
| Age Bracket | Public School | Private School |
| 3 to 4 Year Olds | 2 (50.0%) | 2 (50.0%) |
| 5 to 9 Year Old | 41 (100.0%) | 0 (0.0%) |
| 10 to 14 Year Olds | 25 (100.0%) | 0 (0.0%) |
| 15 to 17 Year Olds | 9 (100.0%) | 0 (0.0%) |
| 18 to 19 Year Olds | 0 (0.0%) | 0 (0.0%) |
| 20 to 24 Year Olds | 0 (0.0%) | 0 (0.0%) |
| 25 to 34 Year Olds | 0 (0.0%) | 0 (0.0%) |
| 35 Years and over | 4 (100.0%) | 0 (0.0%) |
| Total | 81 (97.6%) | 2 (2.4%) |
Educational Attainment by Field of Study in Taylor
Education (6 | 46.2%), business (5 | 38.5%), and science & technology (2 | 15.4%) are the most common fields of study among 13 individuals in Taylor who have obtained a bachelor's degree or higher.
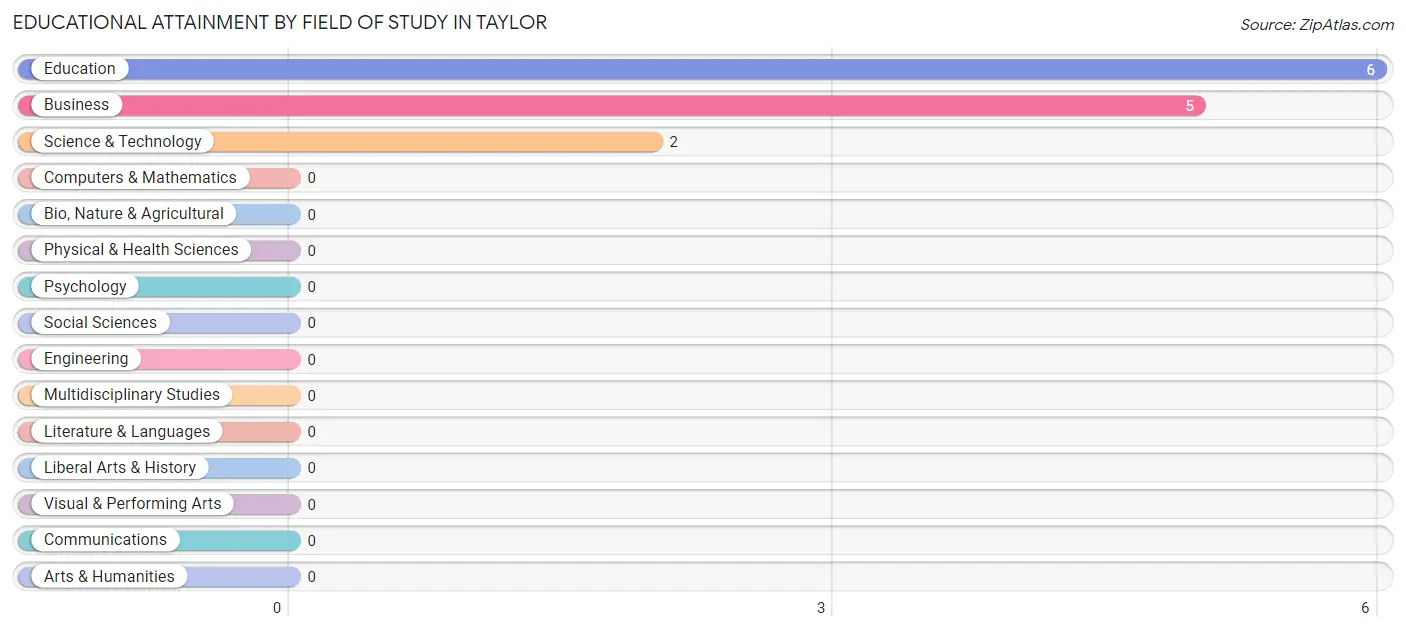
| Field of Study | # Graduates | % Graduates |
| Computers & Mathematics | 0 | 0.0% |
| Bio, Nature & Agricultural | 0 | 0.0% |
| Physical & Health Sciences | 0 | 0.0% |
| Psychology | 0 | 0.0% |
| Social Sciences | 0 | 0.0% |
| Engineering | 0 | 0.0% |
| Multidisciplinary Studies | 0 | 0.0% |
| Science & Technology | 2 | 15.4% |
| Business | 5 | 38.5% |
| Education | 6 | 46.2% |
| Literature & Languages | 0 | 0.0% |
| Liberal Arts & History | 0 | 0.0% |
| Visual & Performing Arts | 0 | 0.0% |
| Communications | 0 | 0.0% |
| Arts & Humanities | 0 | 0.0% |
| Total | 13 | 100.0% |
Transportation & Commute in Taylor
Vehicle Availability by Sex in Taylor
The most prevalent vehicle ownership categories in Taylor are males with 1 vehicle (36, accounting for 31.3%) and females with 1 vehicle (12, making up 49.3%).
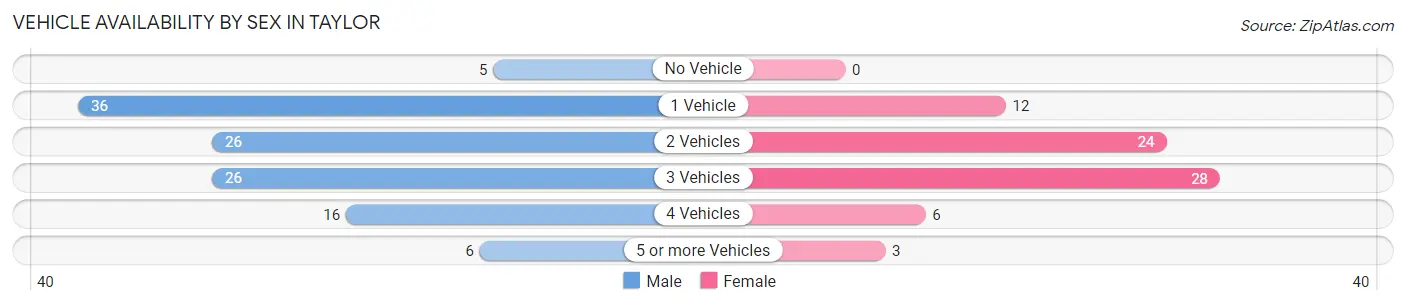
| Vehicles Available | Male | Female |
| No Vehicle | 5 (4.3%) | 0 (0.0%) |
| 1 Vehicle | 36 (31.3%) | 12 (16.4%) |
| 2 Vehicles | 26 (22.6%) | 24 (32.9%) |
| 3 Vehicles | 26 (22.6%) | 28 (38.4%) |
| 4 Vehicles | 16 (13.9%) | 6 (8.2%) |
| 5 or more Vehicles | 6 (5.2%) | 3 (4.1%) |
| Total | 115 (100.0%) | 73 (100.0%) |
Commute Time in Taylor
The most frequently occuring commute durations in Taylor are 30 to 34 minutes (38 commuters, 20.6%), less than 5 minutes (26 commuters, 14.1%), and 35 to 39 minutes (22 commuters, 12.0%).
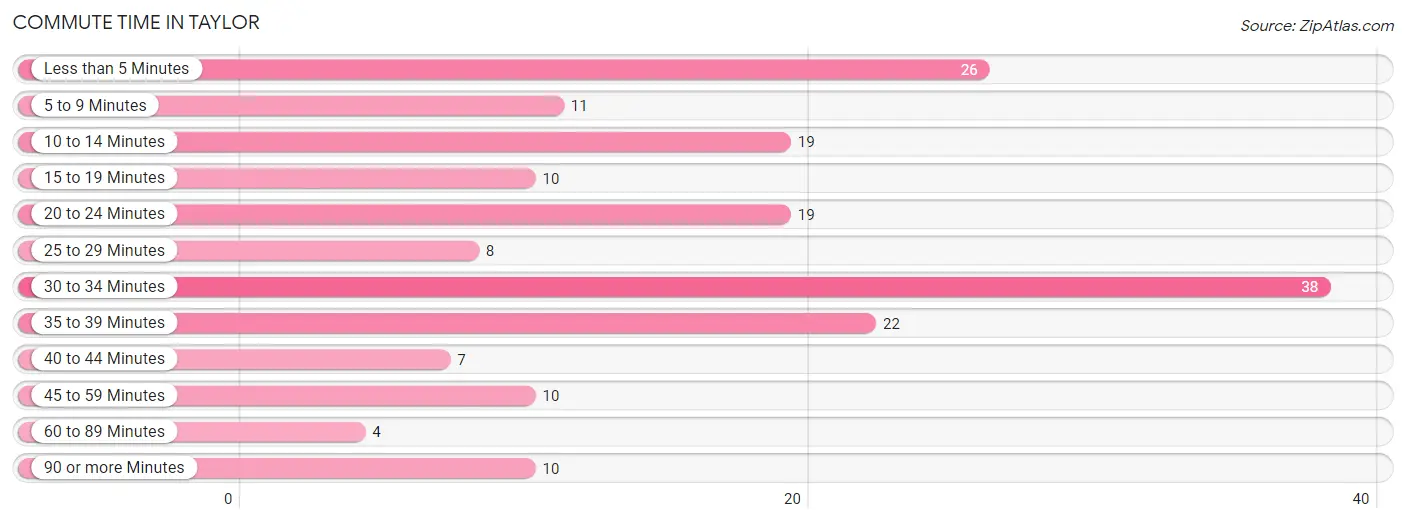
| Commute Time | # Commuters | % Commuters |
| Less than 5 Minutes | 26 | 14.1% |
| 5 to 9 Minutes | 11 | 6.0% |
| 10 to 14 Minutes | 19 | 10.3% |
| 15 to 19 Minutes | 10 | 5.4% |
| 20 to 24 Minutes | 19 | 10.3% |
| 25 to 29 Minutes | 8 | 4.3% |
| 30 to 34 Minutes | 38 | 20.6% |
| 35 to 39 Minutes | 22 | 12.0% |
| 40 to 44 Minutes | 7 | 3.8% |
| 45 to 59 Minutes | 10 | 5.4% |
| 60 to 89 Minutes | 4 | 2.2% |
| 90 or more Minutes | 10 | 5.4% |
Commute Time by Sex in Taylor
The most common commute times in Taylor are less than 5 minutes (23 commuters, 20.0%) for males and 30 to 34 minutes (15 commuters, 21.7%) for females.
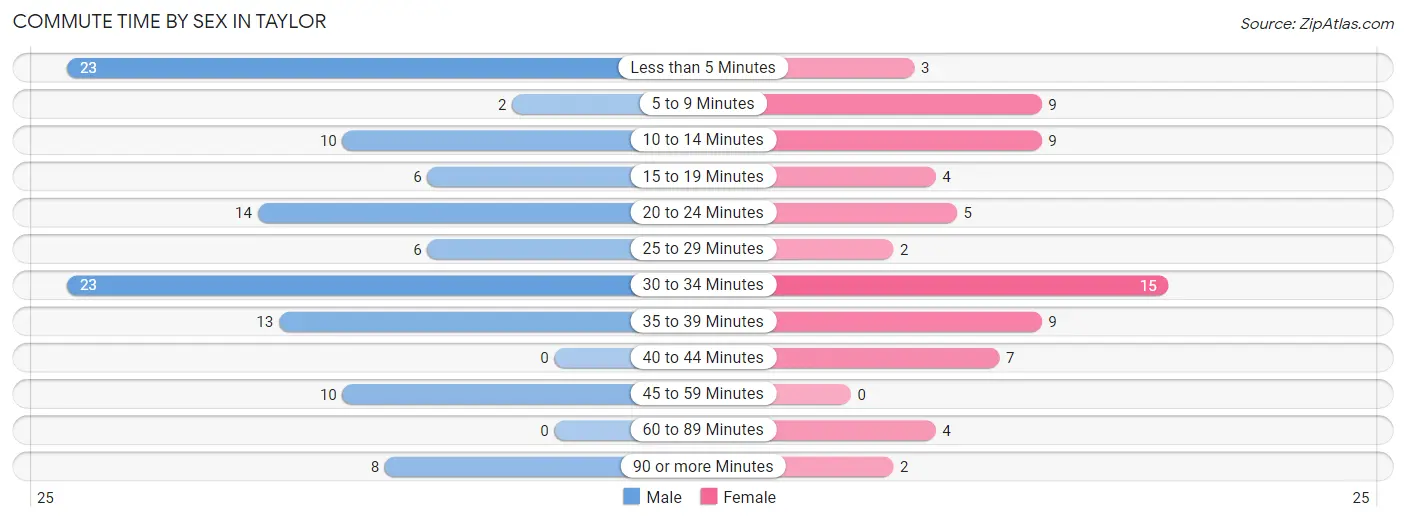
| Commute Time | Male | Female |
| Less than 5 Minutes | 23 (20.0%) | 3 (4.3%) |
| 5 to 9 Minutes | 2 (1.7%) | 9 (13.0%) |
| 10 to 14 Minutes | 10 (8.7%) | 9 (13.0%) |
| 15 to 19 Minutes | 6 (5.2%) | 4 (5.8%) |
| 20 to 24 Minutes | 14 (12.2%) | 5 (7.2%) |
| 25 to 29 Minutes | 6 (5.2%) | 2 (2.9%) |
| 30 to 34 Minutes | 23 (20.0%) | 15 (21.7%) |
| 35 to 39 Minutes | 13 (11.3%) | 9 (13.0%) |
| 40 to 44 Minutes | 0 (0.0%) | 7 (10.1%) |
| 45 to 59 Minutes | 10 (8.7%) | 0 (0.0%) |
| 60 to 89 Minutes | 0 (0.0%) | 4 (5.8%) |
| 90 or more Minutes | 8 (7.0%) | 2 (2.9%) |
Time of Departure to Work by Sex in Taylor
The most frequent times of departure to work in Taylor are 5:00 AM to 5:29 AM (25, 21.7%) for males and 7:00 AM to 7:29 AM (17, 24.6%) for females.
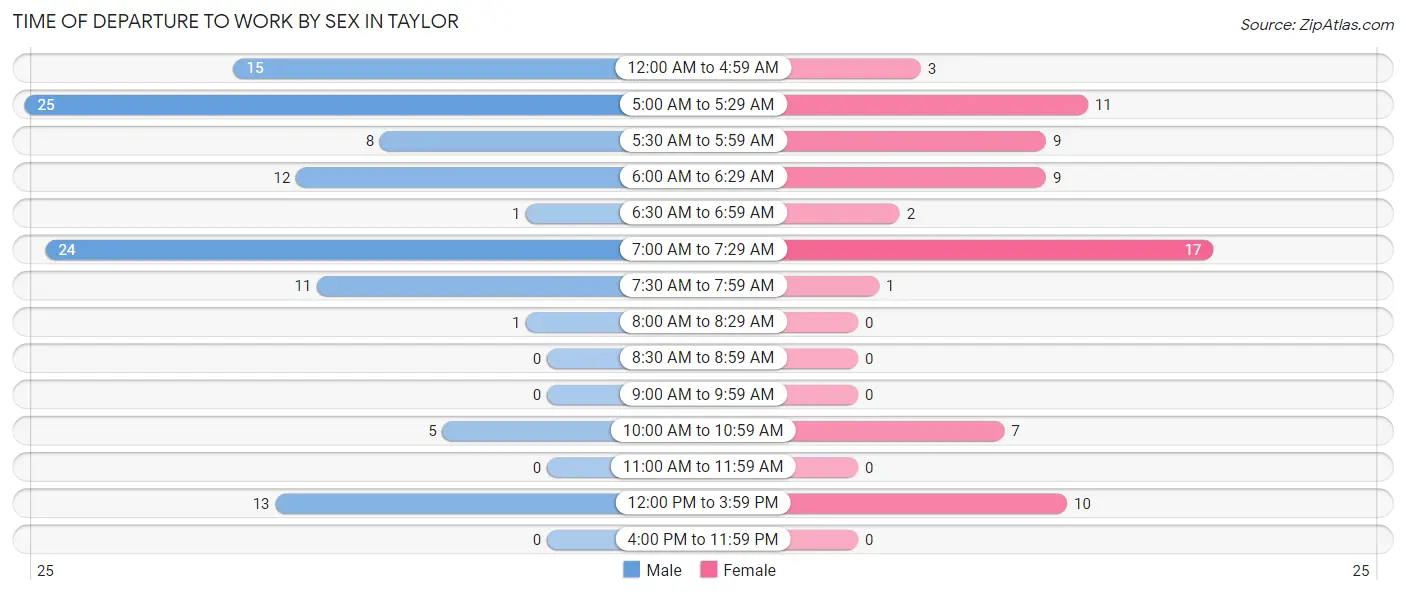
| Time of Departure | Male | Female |
| 12:00 AM to 4:59 AM | 15 (13.0%) | 3 (4.3%) |
| 5:00 AM to 5:29 AM | 25 (21.7%) | 11 (15.9%) |
| 5:30 AM to 5:59 AM | 8 (7.0%) | 9 (13.0%) |
| 6:00 AM to 6:29 AM | 12 (10.4%) | 9 (13.0%) |
| 6:30 AM to 6:59 AM | 1 (0.9%) | 2 (2.9%) |
| 7:00 AM to 7:29 AM | 24 (20.9%) | 17 (24.6%) |
| 7:30 AM to 7:59 AM | 11 (9.6%) | 1 (1.5%) |
| 8:00 AM to 8:29 AM | 1 (0.9%) | 0 (0.0%) |
| 8:30 AM to 8:59 AM | 0 (0.0%) | 0 (0.0%) |
| 9:00 AM to 9:59 AM | 0 (0.0%) | 0 (0.0%) |
| 10:00 AM to 10:59 AM | 5 (4.3%) | 7 (10.1%) |
| 11:00 AM to 11:59 AM | 0 (0.0%) | 0 (0.0%) |
| 12:00 PM to 3:59 PM | 13 (11.3%) | 10 (14.5%) |
| 4:00 PM to 11:59 PM | 0 (0.0%) | 0 (0.0%) |
| Total | 115 (100.0%) | 69 (100.0%) |
Housing Occupancy in Taylor
Occupancy by Ownership in Taylor
Of the total 165 dwellings in Taylor, owner-occupied units account for 109 (66.1%), while renter-occupied units make up 56 (33.9%).
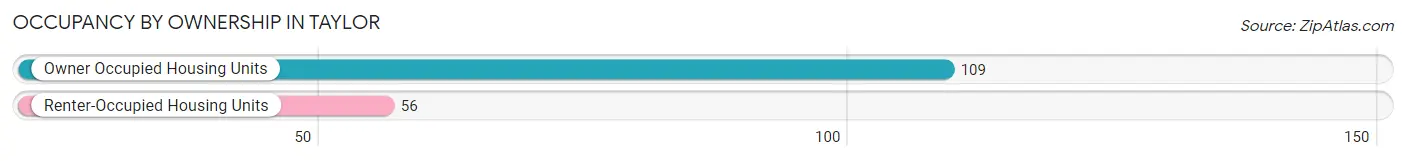
| Occupancy | # Housing Units | % Housing Units |
| Owner Occupied Housing Units | 109 | 66.1% |
| Renter-Occupied Housing Units | 56 | 33.9% |
| Total Occupied Housing Units | 165 | 100.0% |
Occupancy by Household Size in Taylor
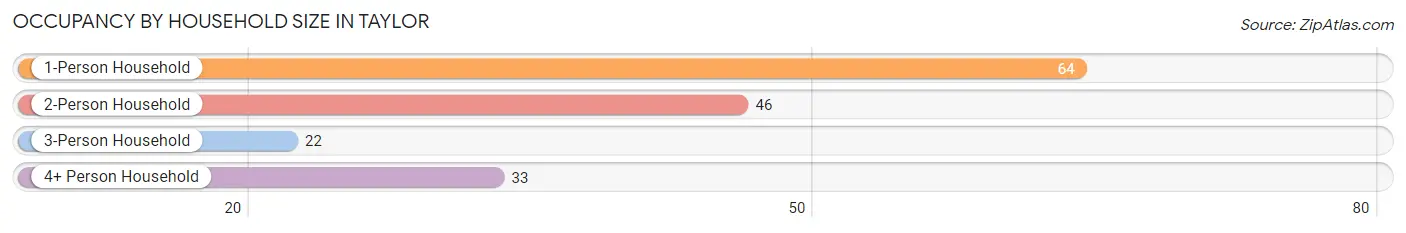
| Household Size | # Housing Units | % Housing Units |
| 1-Person Household | 64 | 38.8% |
| 2-Person Household | 46 | 27.9% |
| 3-Person Household | 22 | 13.3% |
| 4+ Person Household | 33 | 20.0% |
| Total Housing Units | 165 | 100.0% |
Occupancy by Ownership by Household Size in Taylor
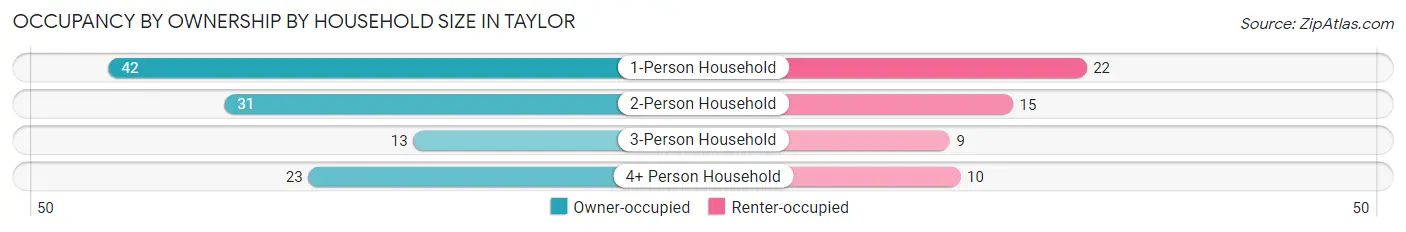
| Household Size | Owner-occupied | Renter-occupied |
| 1-Person Household | 42 (65.6%) | 22 (34.4%) |
| 2-Person Household | 31 (67.4%) | 15 (32.6%) |
| 3-Person Household | 13 (59.1%) | 9 (40.9%) |
| 4+ Person Household | 23 (69.7%) | 10 (30.3%) |
| Total Housing Units | 109 (66.1%) | 56 (33.9%) |
Occupancy by Educational Attainment in Taylor
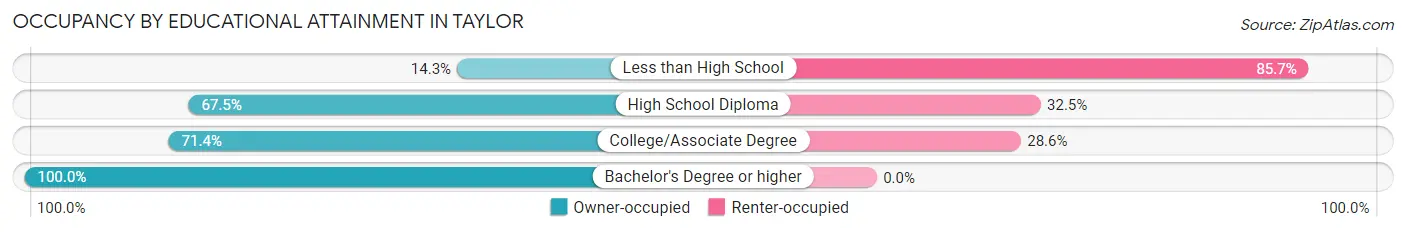
| Household Size | Owner-occupied | Renter-occupied |
| Less than High School | 2 (14.3%) | 12 (85.7%) |
| High School Diploma | 54 (67.5%) | 26 (32.5%) |
| College/Associate Degree | 45 (71.4%) | 18 (28.6%) |
| Bachelor's Degree or higher | 8 (100.0%) | 0 (0.0%) |
Occupancy by Age of Householder in Taylor
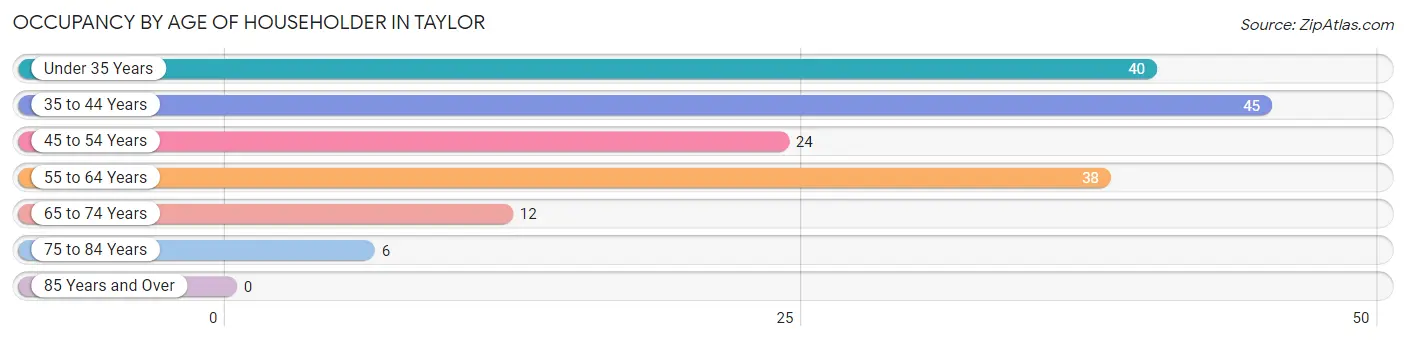
| Age Bracket | # Households | % Households |
| Under 35 Years | 40 | 24.2% |
| 35 to 44 Years | 45 | 27.3% |
| 45 to 54 Years | 24 | 14.5% |
| 55 to 64 Years | 38 | 23.0% |
| 65 to 74 Years | 12 | 7.3% |
| 75 to 84 Years | 6 | 3.6% |
| 85 Years and Over | 0 | 0.0% |
| Total | 165 | 100.0% |
Housing Finances in Taylor
Median Income by Occupancy in Taylor
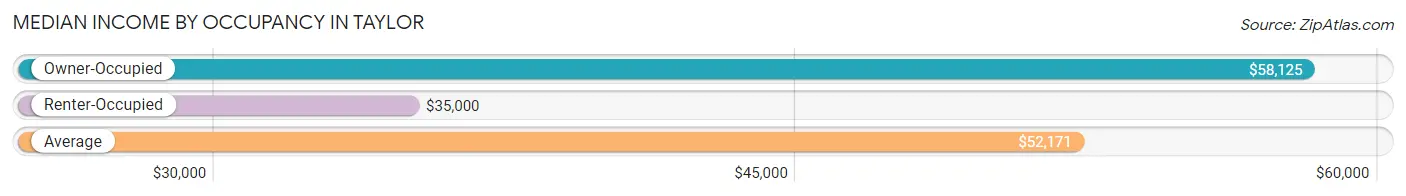
| Occupancy Type | # Households | Median Income |
| Owner-Occupied | 109 (66.1%) | $58,125 |
| Renter-Occupied | 56 (33.9%) | $35,000 |
| Average | 165 (100.0%) | $52,171 |
Occupancy by Householder Income Bracket in Taylor
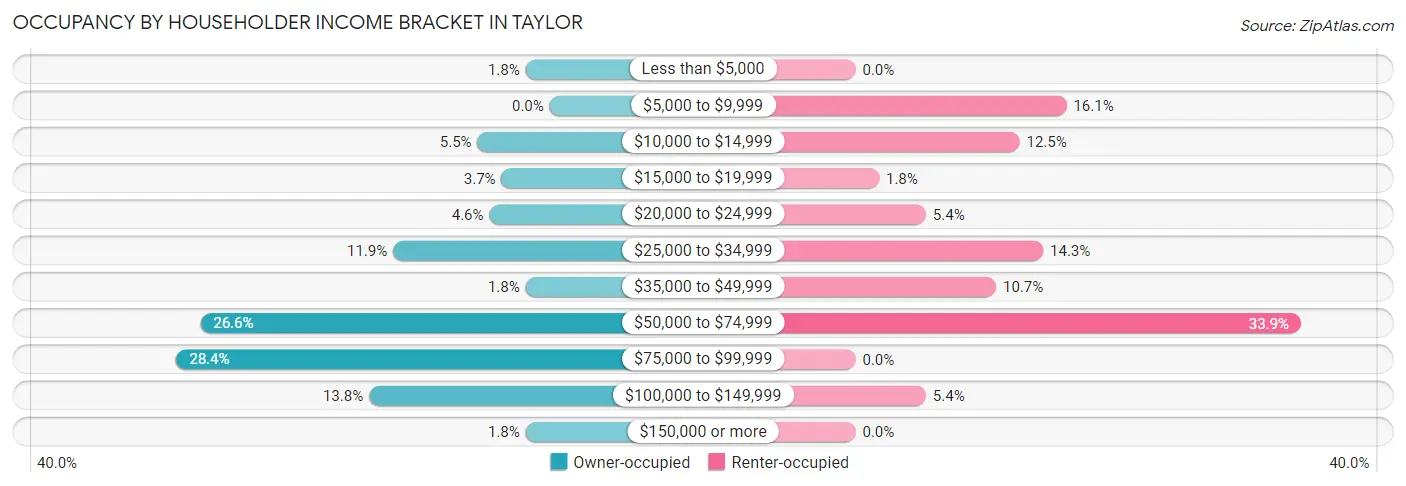
| Income Bracket | Owner-occupied | Renter-occupied |
| Less than $5,000 | 2 (1.8%) | 0 (0.0%) |
| $5,000 to $9,999 | 0 (0.0%) | 9 (16.1%) |
| $10,000 to $14,999 | 6 (5.5%) | 7 (12.5%) |
| $15,000 to $19,999 | 4 (3.7%) | 1 (1.8%) |
| $20,000 to $24,999 | 5 (4.6%) | 3 (5.4%) |
| $25,000 to $34,999 | 13 (11.9%) | 8 (14.3%) |
| $35,000 to $49,999 | 2 (1.8%) | 6 (10.7%) |
| $50,000 to $74,999 | 29 (26.6%) | 19 (33.9%) |
| $75,000 to $99,999 | 31 (28.4%) | 0 (0.0%) |
| $100,000 to $149,999 | 15 (13.8%) | 3 (5.4%) |
| $150,000 or more | 2 (1.8%) | 0 (0.0%) |
| Total | 109 (100.0%) | 56 (100.0%) |
Monthly Housing Cost Tiers in Taylor
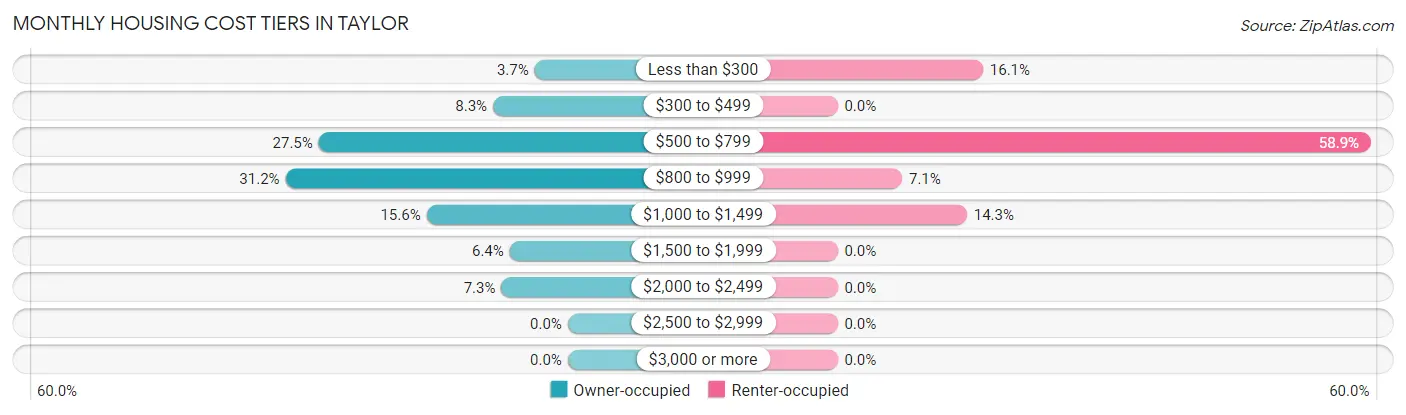
| Monthly Cost | Owner-occupied | Renter-occupied |
| Less than $300 | 4 (3.7%) | 9 (16.1%) |
| $300 to $499 | 9 (8.3%) | 0 (0.0%) |
| $500 to $799 | 30 (27.5%) | 33 (58.9%) |
| $800 to $999 | 34 (31.2%) | 4 (7.1%) |
| $1,000 to $1,499 | 17 (15.6%) | 8 (14.3%) |
| $1,500 to $1,999 | 7 (6.4%) | 0 (0.0%) |
| $2,000 to $2,499 | 8 (7.3%) | 0 (0.0%) |
| $2,500 to $2,999 | 0 (0.0%) | 0 (0.0%) |
| $3,000 or more | 0 (0.0%) | 0 (0.0%) |
| Total | 109 (100.0%) | 56 (100.0%) |
Physical Housing Characteristics in Taylor
Housing Structures in Taylor
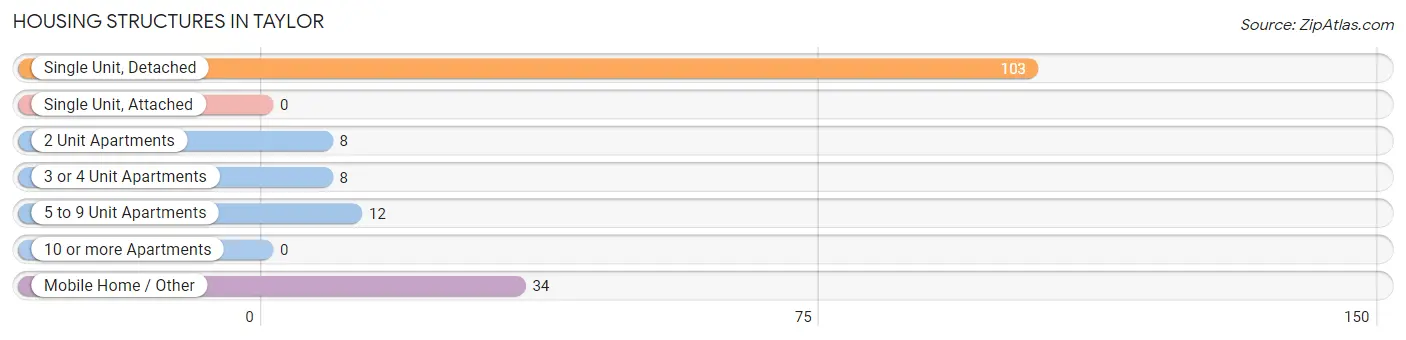
| Structure Type | # Housing Units | % Housing Units |
| Single Unit, Detached | 103 | 62.4% |
| Single Unit, Attached | 0 | 0.0% |
| 2 Unit Apartments | 8 | 4.9% |
| 3 or 4 Unit Apartments | 8 | 4.9% |
| 5 to 9 Unit Apartments | 12 | 7.3% |
| 10 or more Apartments | 0 | 0.0% |
| Mobile Home / Other | 34 | 20.6% |
| Total | 165 | 100.0% |
Housing Structures by Occupancy in Taylor
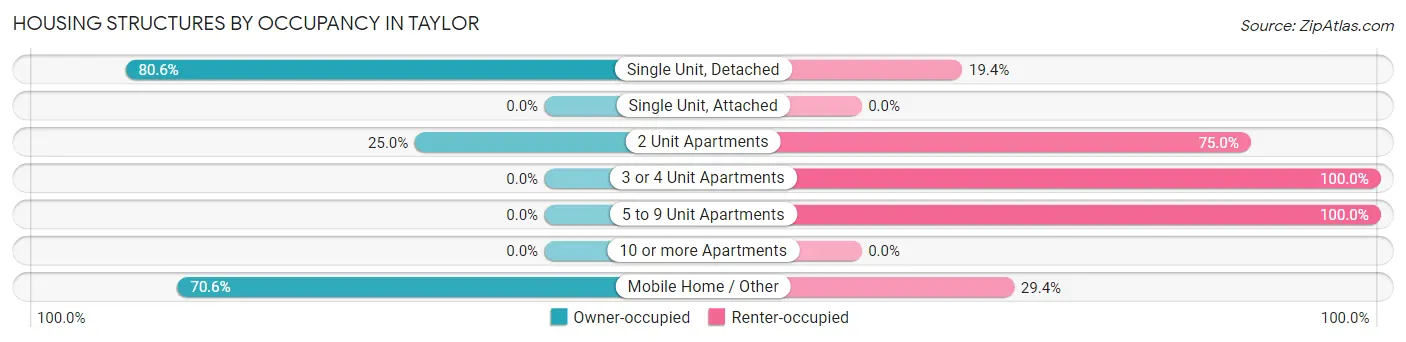
| Structure Type | Owner-occupied | Renter-occupied |
| Single Unit, Detached | 83 (80.6%) | 20 (19.4%) |
| Single Unit, Attached | 0 (0.0%) | 0 (0.0%) |
| 2 Unit Apartments | 2 (25.0%) | 6 (75.0%) |
| 3 or 4 Unit Apartments | 0 (0.0%) | 8 (100.0%) |
| 5 to 9 Unit Apartments | 0 (0.0%) | 12 (100.0%) |
| 10 or more Apartments | 0 (0.0%) | 0 (0.0%) |
| Mobile Home / Other | 24 (70.6%) | 10 (29.4%) |
| Total | 109 (66.1%) | 56 (33.9%) |
Housing Structures by Number of Rooms in Taylor
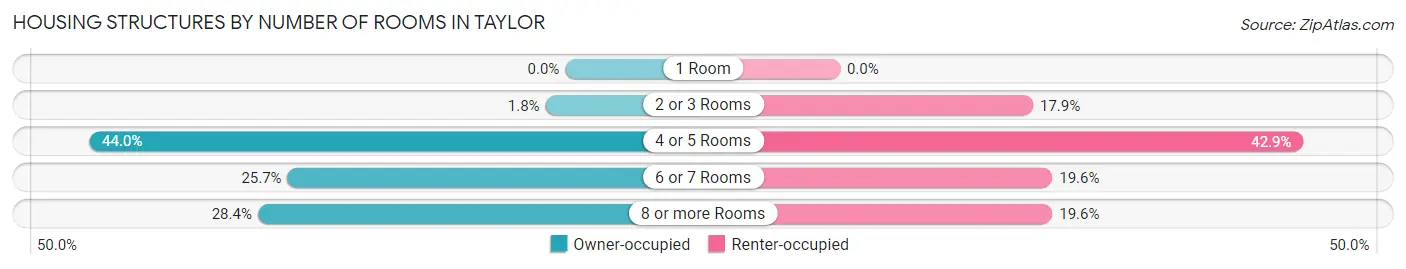
| Number of Rooms | Owner-occupied | Renter-occupied |
| 1 Room | 0 (0.0%) | 0 (0.0%) |
| 2 or 3 Rooms | 2 (1.8%) | 10 (17.9%) |
| 4 or 5 Rooms | 48 (44.0%) | 24 (42.9%) |
| 6 or 7 Rooms | 28 (25.7%) | 11 (19.6%) |
| 8 or more Rooms | 31 (28.4%) | 11 (19.6%) |
| Total | 109 (100.0%) | 56 (100.0%) |
Housing Structure by Heating Type in Taylor
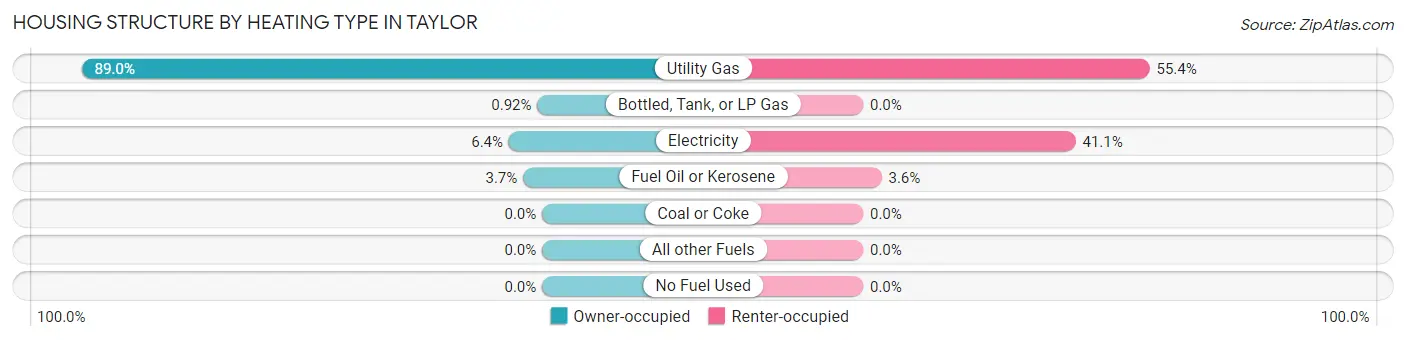
| Heating Type | Owner-occupied | Renter-occupied |
| Utility Gas | 97 (89.0%) | 31 (55.4%) |
| Bottled, Tank, or LP Gas | 1 (0.9%) | 0 (0.0%) |
| Electricity | 7 (6.4%) | 23 (41.1%) |
| Fuel Oil or Kerosene | 4 (3.7%) | 2 (3.6%) |
| Coal or Coke | 0 (0.0%) | 0 (0.0%) |
| All other Fuels | 0 (0.0%) | 0 (0.0%) |
| No Fuel Used | 0 (0.0%) | 0 (0.0%) |
| Total | 109 (100.0%) | 56 (100.0%) |
Household Vehicle Usage in Taylor
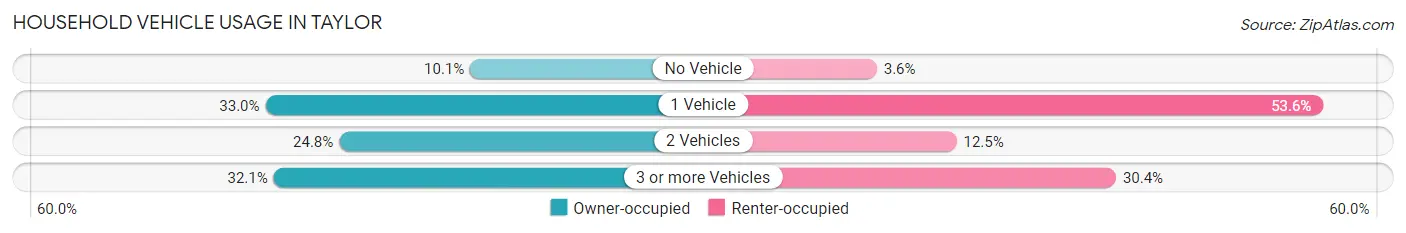
| Vehicles per Household | Owner-occupied | Renter-occupied |
| No Vehicle | 11 (10.1%) | 2 (3.6%) |
| 1 Vehicle | 36 (33.0%) | 30 (53.6%) |
| 2 Vehicles | 27 (24.8%) | 7 (12.5%) |
| 3 or more Vehicles | 35 (32.1%) | 17 (30.4%) |
| Total | 109 (100.0%) | 56 (100.0%) |
Real Estate & Mortgages in Taylor
Real Estate and Mortgage Overview in Taylor
| Characteristic | Without Mortgage | With Mortgage |
| Housing Units | 30 | 79 |
| Median Property Value | $110,000 | $105,100 |
| Median Household Income | $42,500 | $2 |
| Monthly Housing Costs | $525 | $0 |
| Real Estate Taxes | $2,188 | $0 |
Property Value by Mortgage Status in Taylor
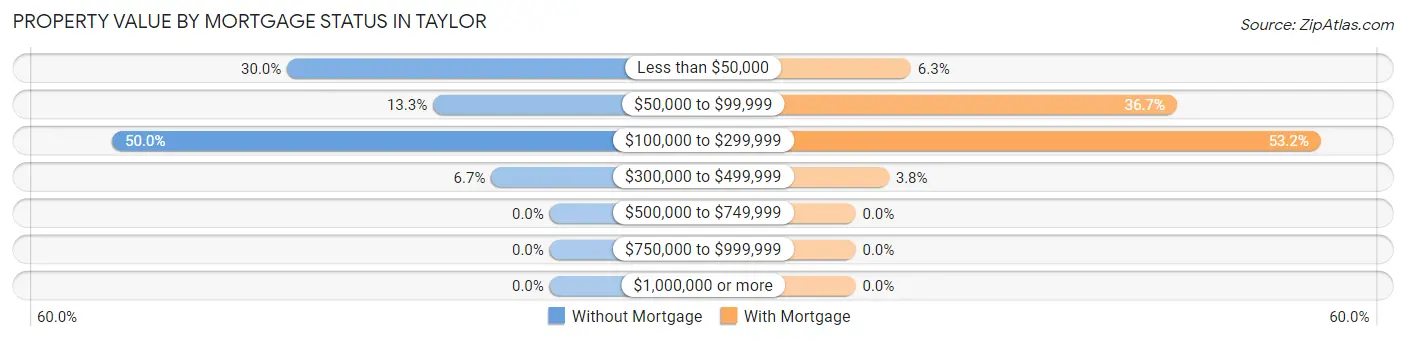
| Property Value | Without Mortgage | With Mortgage |
| Less than $50,000 | 9 (30.0%) | 5 (6.3%) |
| $50,000 to $99,999 | 4 (13.3%) | 29 (36.7%) |
| $100,000 to $299,999 | 15 (50.0%) | 42 (53.2%) |
| $300,000 to $499,999 | 2 (6.7%) | 3 (3.8%) |
| $500,000 to $749,999 | 0 (0.0%) | 0 (0.0%) |
| $750,000 to $999,999 | 0 (0.0%) | 0 (0.0%) |
| $1,000,000 or more | 0 (0.0%) | 0 (0.0%) |
| Total | 30 (100.0%) | 79 (100.0%) |
Household Income by Mortgage Status in Taylor
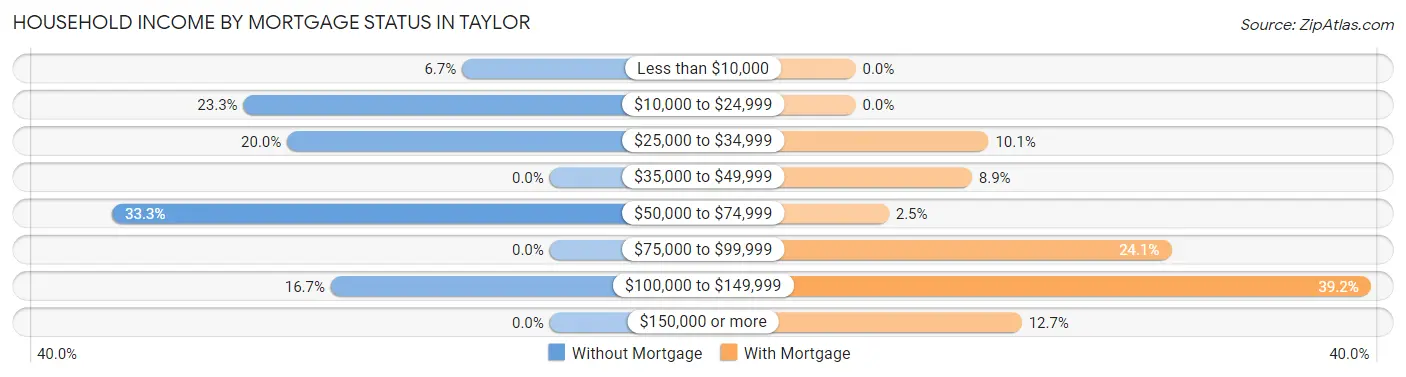
| Household Income | Without Mortgage | With Mortgage |
| Less than $10,000 | 2 (6.7%) | 0 (0.0%) |
| $10,000 to $24,999 | 7 (23.3%) | 0 (0.0%) |
| $25,000 to $34,999 | 6 (20.0%) | 8 (10.1%) |
| $35,000 to $49,999 | 0 (0.0%) | 7 (8.9%) |
| $50,000 to $74,999 | 10 (33.3%) | 2 (2.5%) |
| $75,000 to $99,999 | 0 (0.0%) | 19 (24.0%) |
| $100,000 to $149,999 | 5 (16.7%) | 31 (39.2%) |
| $150,000 or more | 0 (0.0%) | 10 (12.7%) |
| Total | 30 (100.0%) | 79 (100.0%) |
Property Value to Household Income Ratio in Taylor
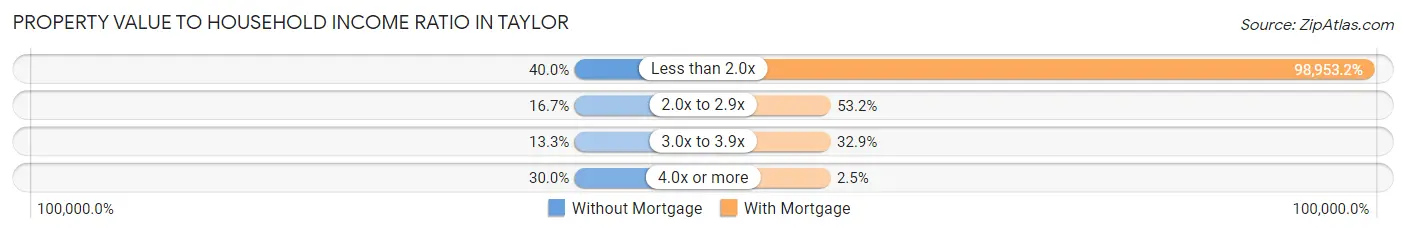
| Value-to-Income Ratio | Without Mortgage | With Mortgage |
| Less than 2.0x | 12 (40.0%) | 78,173 (98,953.2%) |
| 2.0x to 2.9x | 5 (16.7%) | 42 (53.2%) |
| 3.0x to 3.9x | 4 (13.3%) | 26 (32.9%) |
| 4.0x or more | 9 (30.0%) | 2 (2.5%) |
| Total | 30 (100.0%) | 79 (100.0%) |
Real Estate Taxes by Mortgage Status in Taylor
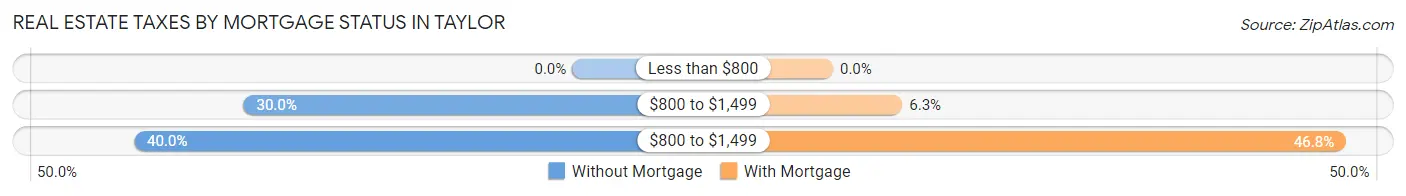
| Property Taxes | Without Mortgage | With Mortgage |
| Less than $800 | 0 (0.0%) | 0 (0.0%) |
| $800 to $1,499 | 9 (30.0%) | 5 (6.3%) |
| $800 to $1,499 | 12 (40.0%) | 37 (46.8%) |
| Total | 30 (100.0%) | 79 (100.0%) |
Health & Disability in Taylor
Health Insurance Coverage by Age in Taylor
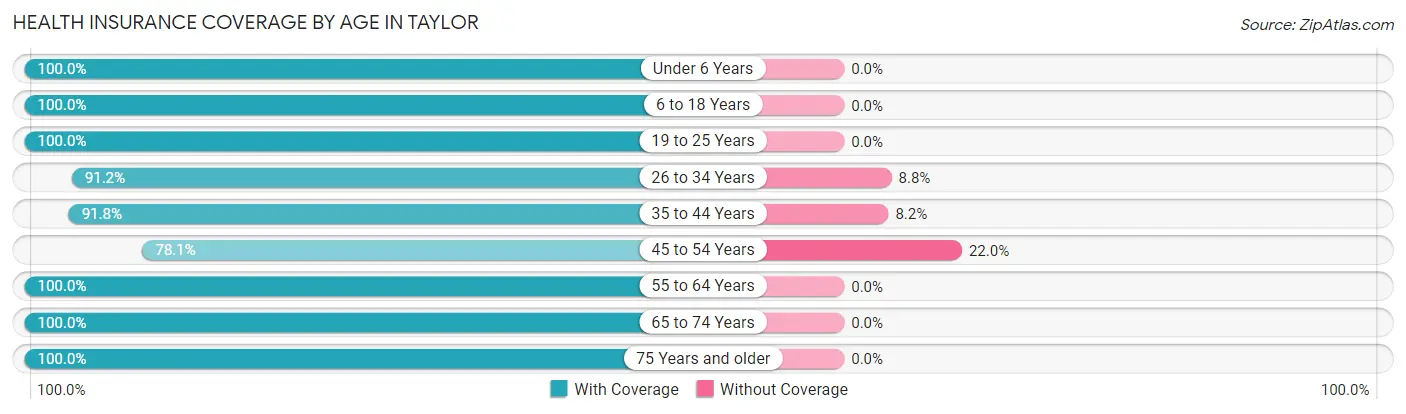
| Age Bracket | With Coverage | Without Coverage |
| Under 6 Years | 29 (100.0%) | 0 (0.0%) |
| 6 to 18 Years | 69 (100.0%) | 0 (0.0%) |
| 19 to 25 Years | 34 (100.0%) | 0 (0.0%) |
| 26 to 34 Years | 31 (91.2%) | 3 (8.8%) |
| 35 to 44 Years | 78 (91.8%) | 7 (8.2%) |
| 45 to 54 Years | 32 (78.0%) | 9 (22.0%) |
| 55 to 64 Years | 49 (100.0%) | 0 (0.0%) |
| 65 to 74 Years | 12 (100.0%) | 0 (0.0%) |
| 75 Years and older | 10 (100.0%) | 0 (0.0%) |
| Total | 344 (94.8%) | 19 (5.2%) |
Health Insurance Coverage by Citizenship Status in Taylor
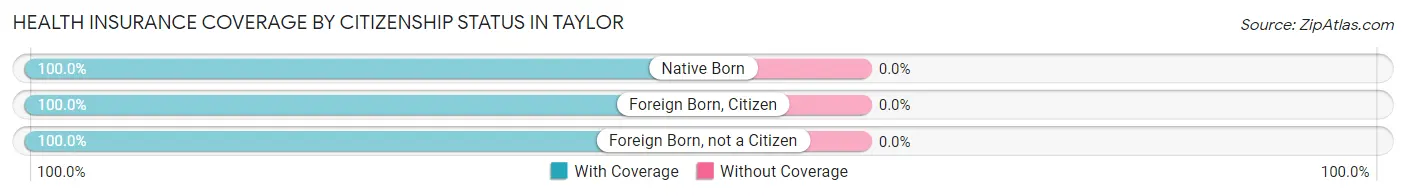
| Citizenship Status | With Coverage | Without Coverage |
| Native Born | 29 (100.0%) | 0 (0.0%) |
| Foreign Born, Citizen | 69 (100.0%) | 0 (0.0%) |
| Foreign Born, not a Citizen | 34 (100.0%) | 0 (0.0%) |
Health Insurance Coverage by Household Income in Taylor
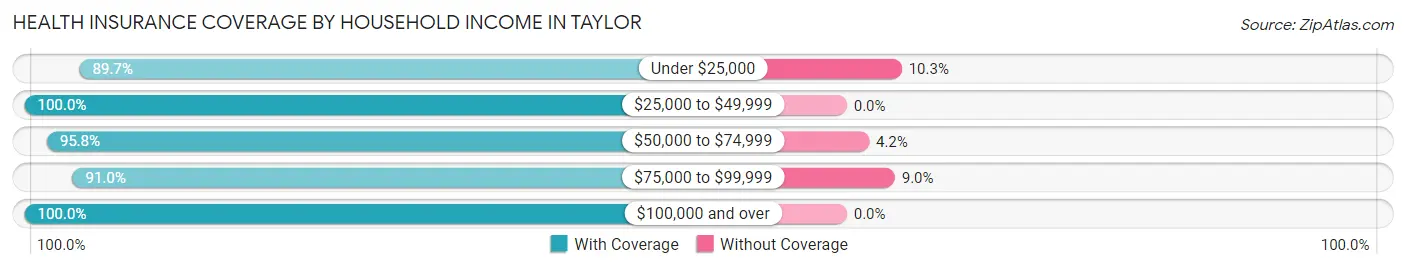
| Household Income | With Coverage | Without Coverage |
| Under $25,000 | 61 (89.7%) | 7 (10.3%) |
| $25,000 to $49,999 | 48 (100.0%) | 0 (0.0%) |
| $50,000 to $74,999 | 92 (95.8%) | 4 (4.2%) |
| $75,000 to $99,999 | 81 (91.0%) | 8 (9.0%) |
| $100,000 and over | 62 (100.0%) | 0 (0.0%) |
Public vs Private Health Insurance Coverage by Age in Taylor
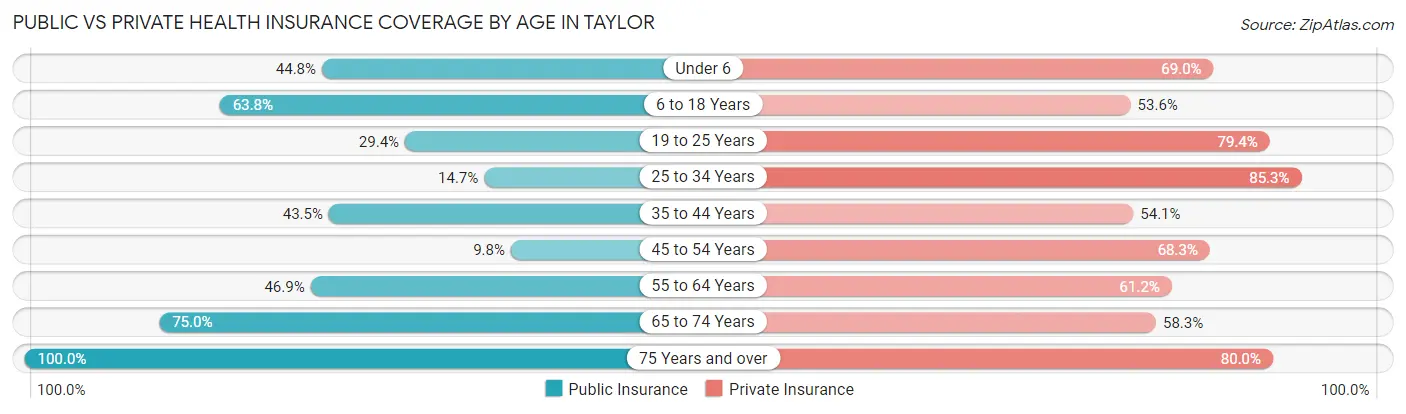
| Age Bracket | Public Insurance | Private Insurance |
| Under 6 | 13 (44.8%) | 20 (69.0%) |
| 6 to 18 Years | 44 (63.8%) | 37 (53.6%) |
| 19 to 25 Years | 10 (29.4%) | 27 (79.4%) |
| 25 to 34 Years | 5 (14.7%) | 29 (85.3%) |
| 35 to 44 Years | 37 (43.5%) | 46 (54.1%) |
| 45 to 54 Years | 4 (9.8%) | 28 (68.3%) |
| 55 to 64 Years | 23 (46.9%) | 30 (61.2%) |
| 65 to 74 Years | 9 (75.0%) | 7 (58.3%) |
| 75 Years and over | 10 (100.0%) | 8 (80.0%) |
| Total | 155 (42.7%) | 232 (63.9%) |
Disability Status by Sex by Age in Taylor
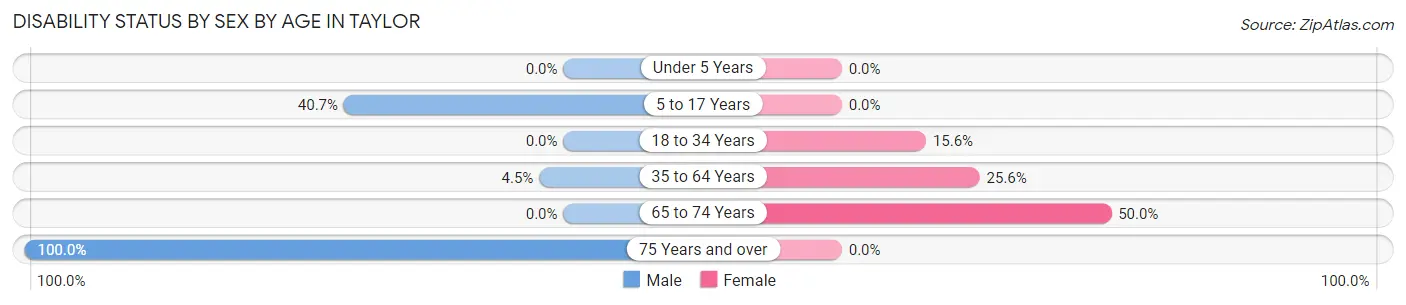
| Age Bracket | Male | Female |
| Under 5 Years | 0 (0.0%) | 0 (0.0%) |
| 5 to 17 Years | 11 (40.7%) | 0 (0.0%) |
| 18 to 34 Years | 0 (0.0%) | 5 (15.6%) |
| 35 to 64 Years | 4 (4.5%) | 22 (25.6%) |
| 65 to 74 Years | 0 (0.0%) | 3 (50.0%) |
| 75 Years and over | 6 (100.0%) | 0 (0.0%) |
Disability Class by Sex by Age in Taylor
Disability Class: Hearing Difficulty

| Age Bracket | Male | Female |
| Under 5 Years | 0 (0.0%) | 0 (0.0%) |
| 5 to 17 Years | 5 (18.5%) | 0 (0.0%) |
| 18 to 34 Years | 0 (0.0%) | 0 (0.0%) |
| 35 to 64 Years | 0 (0.0%) | 0 (0.0%) |
| 65 to 74 Years | 0 (0.0%) | 0 (0.0%) |
| 75 Years and over | 0 (0.0%) | 0 (0.0%) |
Disability Class: Vision Difficulty
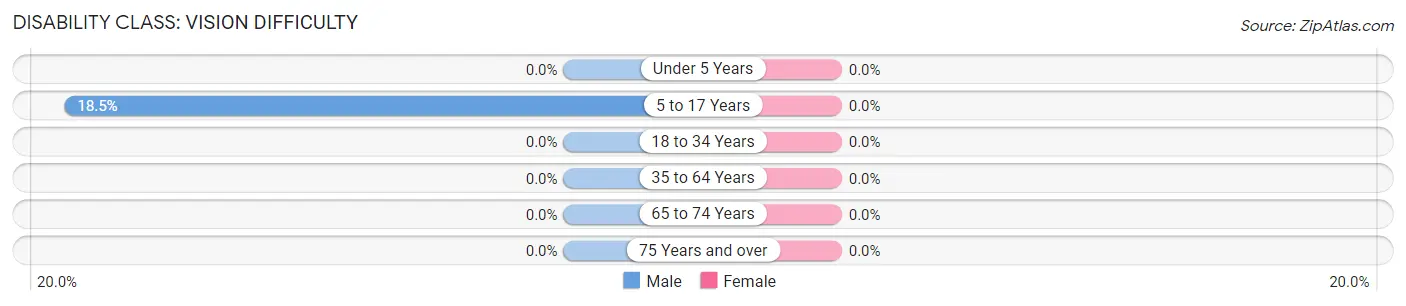
| Age Bracket | Male | Female |
| Under 5 Years | 0 (0.0%) | 0 (0.0%) |
| 5 to 17 Years | 5 (18.5%) | 0 (0.0%) |
| 18 to 34 Years | 0 (0.0%) | 0 (0.0%) |
| 35 to 64 Years | 0 (0.0%) | 0 (0.0%) |
| 65 to 74 Years | 0 (0.0%) | 0 (0.0%) |
| 75 Years and over | 0 (0.0%) | 0 (0.0%) |
Disability Class: Cognitive Difficulty
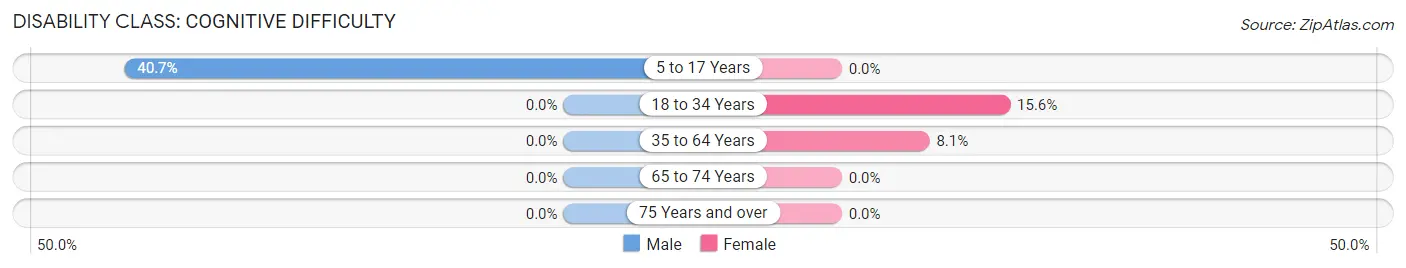
| Age Bracket | Male | Female |
| 5 to 17 Years | 11 (40.7%) | 0 (0.0%) |
| 18 to 34 Years | 0 (0.0%) | 5 (15.6%) |
| 35 to 64 Years | 0 (0.0%) | 7 (8.1%) |
| 65 to 74 Years | 0 (0.0%) | 0 (0.0%) |
| 75 Years and over | 0 (0.0%) | 0 (0.0%) |
Disability Class: Ambulatory Difficulty
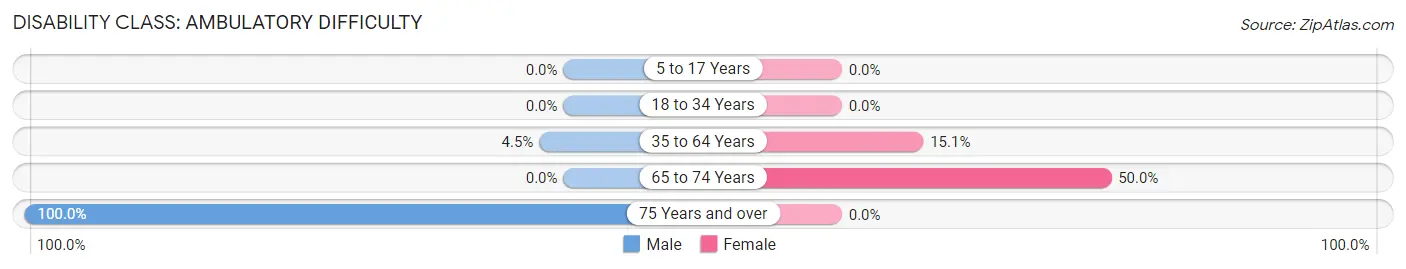
| Age Bracket | Male | Female |
| 5 to 17 Years | 0 (0.0%) | 0 (0.0%) |
| 18 to 34 Years | 0 (0.0%) | 0 (0.0%) |
| 35 to 64 Years | 4 (4.5%) | 13 (15.1%) |
| 65 to 74 Years | 0 (0.0%) | 3 (50.0%) |
| 75 Years and over | 6 (100.0%) | 0 (0.0%) |
Disability Class: Self-Care Difficulty
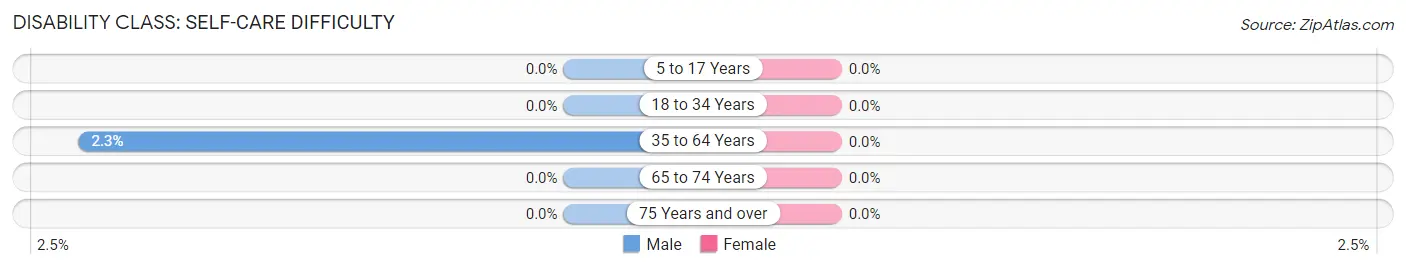
| Age Bracket | Male | Female |
| 5 to 17 Years | 0 (0.0%) | 0 (0.0%) |
| 18 to 34 Years | 0 (0.0%) | 0 (0.0%) |
| 35 to 64 Years | 2 (2.2%) | 0 (0.0%) |
| 65 to 74 Years | 0 (0.0%) | 0 (0.0%) |
| 75 Years and over | 0 (0.0%) | 0 (0.0%) |
Technology Access in Taylor
Computing Device Access in Taylor
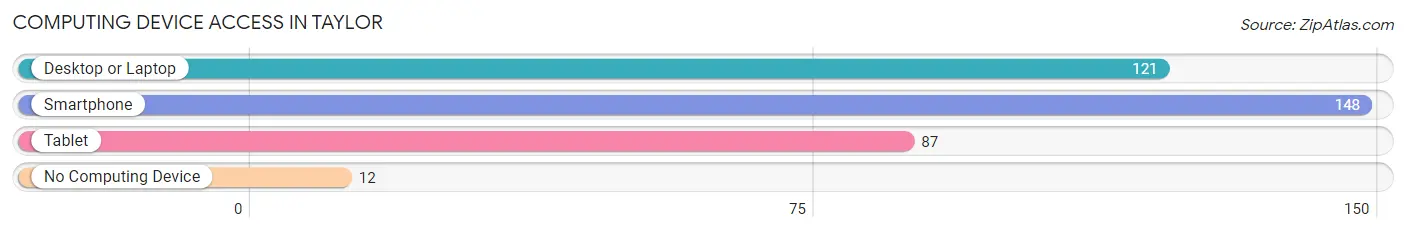
| Device Type | # Households | % Households |
| Desktop or Laptop | 121 | 73.3% |
| Smartphone | 148 | 89.7% |
| Tablet | 87 | 52.7% |
| No Computing Device | 12 | 7.3% |
| Total | 165 | 100.0% |
Internet Access in Taylor
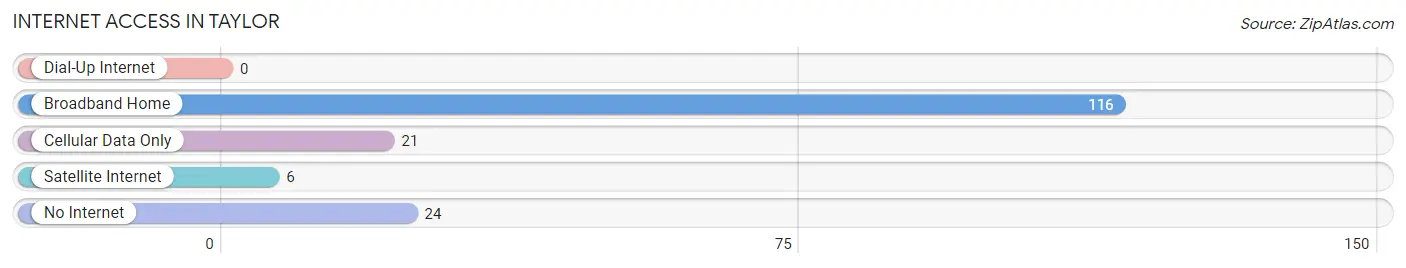
| Internet Type | # Households | % Households |
| Dial-Up Internet | 0 | 0.0% |
| Broadband Home | 116 | 70.3% |
| Cellular Data Only | 21 | 12.7% |
| Satellite Internet | 6 | 3.6% |
| No Internet | 24 | 14.5% |
| Total | 165 | 100.0% |
Taylor Summary
Taylor, Wisconsin is a small village located in the central part of the state, in the county of Taylor. It is situated on the banks of the Eau Claire River, and is surrounded by the towns of Gilman, Medford, and Rib Lake. The village has a population of approximately 1,000 people, and is part of the larger Taylor County.
History
The area that is now Taylor was first settled in the late 1800s by a group of German immigrants. The village was originally known as “New Berlin”, and was later renamed to Taylor in honor of the Taylor family, who were among the first settlers. The village was officially incorporated in 1891.
In the early 1900s, Taylor was a thriving agricultural community, with many of the residents working in the dairy and lumber industries. The village also had a number of small businesses, including a general store, a blacksmith shop, and a sawmill.
In the 1950s, the village began to experience a decline in population as many of the residents moved away in search of better job opportunities. However, in recent years, the village has seen a resurgence in population as people have moved back to the area to take advantage of the rural lifestyle and the close proximity to larger cities such as Eau Claire and Wausau.
Geography
Taylor is located in the central part of Wisconsin, in Taylor County. The village is situated on the banks of the Eau Claire River, and is surrounded by the towns of Gilman, Medford, and Rib Lake. The village is located approximately 30 miles east of Eau Claire, and is about an hour and a half drive from the state capital of Madison.
The village is situated in a rural area, and is surrounded by rolling hills and forests. The area is known for its abundance of wildlife, including deer, bear, and other small animals. The village is also home to a number of small lakes, which provide excellent fishing and recreational opportunities.
Economy
The economy of Taylor is largely based on agriculture and tourism. The village is home to a number of small farms, which produce a variety of crops, including corn, soybeans, and hay. The village also has a number of small businesses, including a general store, a hardware store, and a few restaurants.
In recent years, the village has seen an increase in tourism, as people have come to the area to take advantage of the rural lifestyle and the close proximity to larger cities such as Eau Claire and Wausau. The village is also home to a number of small lakes, which provide excellent fishing and recreational opportunities.
Demographics
As of the 2010 census, the population of Taylor was 1,000 people. The village is predominantly white, with approximately 95% of the population being of European descent. The median household income in the village is $41,000, and the median age is 44 years old. The village has a low unemployment rate, and the majority of the population is employed in the agricultural and tourism industries.
Common Questions
What is Per Capita Income in Taylor?
Per Capita income in Taylor is $25,591.
What is the Median Family Income in Taylor?
Median Family Income in Taylor is $54,464.
What is the Median Household income in Taylor?
Median Household Income in Taylor is $52,171.
What is Income or Wage Gap in Taylor?
Income or Wage Gap in Taylor is 24.0%.
Women in Taylor earn 76.0 cents for every dollar earned by a man.
What is Family Income Deficit in Taylor?
Family Income Deficit in Taylor is $12,367.
Families that are below poverty line in Taylor earn $12,367 less on average than the poverty threshold level.
What is Inequality or Gini Index in Taylor?
Inequality or Gini Index in Taylor is 0.36.
What is the Total Population of Taylor?
Total Population of Taylor is 363.
What is the Total Male Population of Taylor?
Total Male Population of Taylor is 177.
What is the Total Female Population of Taylor?
Total Female Population of Taylor is 186.
What is the Ratio of Males per 100 Females in Taylor?
There are 95.16 Males per 100 Females in Taylor.
What is the Ratio of Females per 100 Males in Taylor?
There are 105.08 Females per 100 Males in Taylor.
What is the Median Population Age in Taylor?
Median Population Age in Taylor is 35.8 Years.
What is the Average Family Size in Taylor
Average Family Size in Taylor is 2.7 People.
What is the Average Household Size in Taylor
Average Household Size in Taylor is 2.2 People.
How Large is the Labor Force in Taylor?
There are 206 People in the Labor Forcein in Taylor.
What is the Percentage of People in the Labor Force in Taylor?
75.2% of People are in the Labor Force in Taylor.
What is the Unemployment Rate in Taylor?
Unemployment Rate in Taylor is 4.4%.