Suring, WI Map & Demographics
Suring Map
Suring Overview
$26,998
PER CAPITA INCOME
$62,500
AVG FAMILY INCOME
$47,885
AVG HOUSEHOLD INCOME
0.42
INEQUALITY / GINI INDEX
399
TOTAL POPULATION
201
MALE POPULATION
198
FEMALE POPULATION
101.52
MALES / 100 FEMALES
98.51
FEMALES / 100 MALES
56.4
MEDIAN AGE
2.8
AVG FAMILY SIZE
2.1
AVG HOUSEHOLD SIZE
140
LABOR FORCE [ PEOPLE ]
39.9%
PERCENT IN LABOR FORCE
8.6%
UNEMPLOYMENT RATE
Suring Zip Codes
Suring Area Codes
Income in Suring
Income Overview in Suring
Per Capita Income in Suring is $26,998, while median incomes of families and households are $62,500 and $47,885 respectively.
| Characteristic | Number | Measure |
| Per Capita Income | 399 | $26,998 |
| Median Family Income | 96 | $62,500 |
| Mean Family Income | 96 | $77,761 |
| Median Household Income | 166 | $47,885 |
| Mean Household Income | 166 | $61,134 |
| Income Deficit | 96 | $0 |
| Wage / Income Gap (%) | 399 | 0.00% |
| Wage / Income Gap ($) | 399 | 100.00¢ per $1 |
| Gini / Inequality Index | 399 | 0.42 |
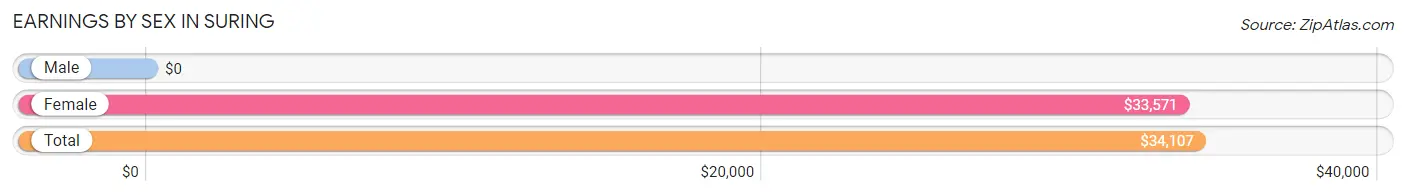
Earnings by Sex in Suring
| Sex | Number | Average Earnings |
| Male | 81 (55.9%) | $0 |
| Female | 64 (44.1%) | $33,571 |
| Total | 145 (100.0%) | $34,107 |
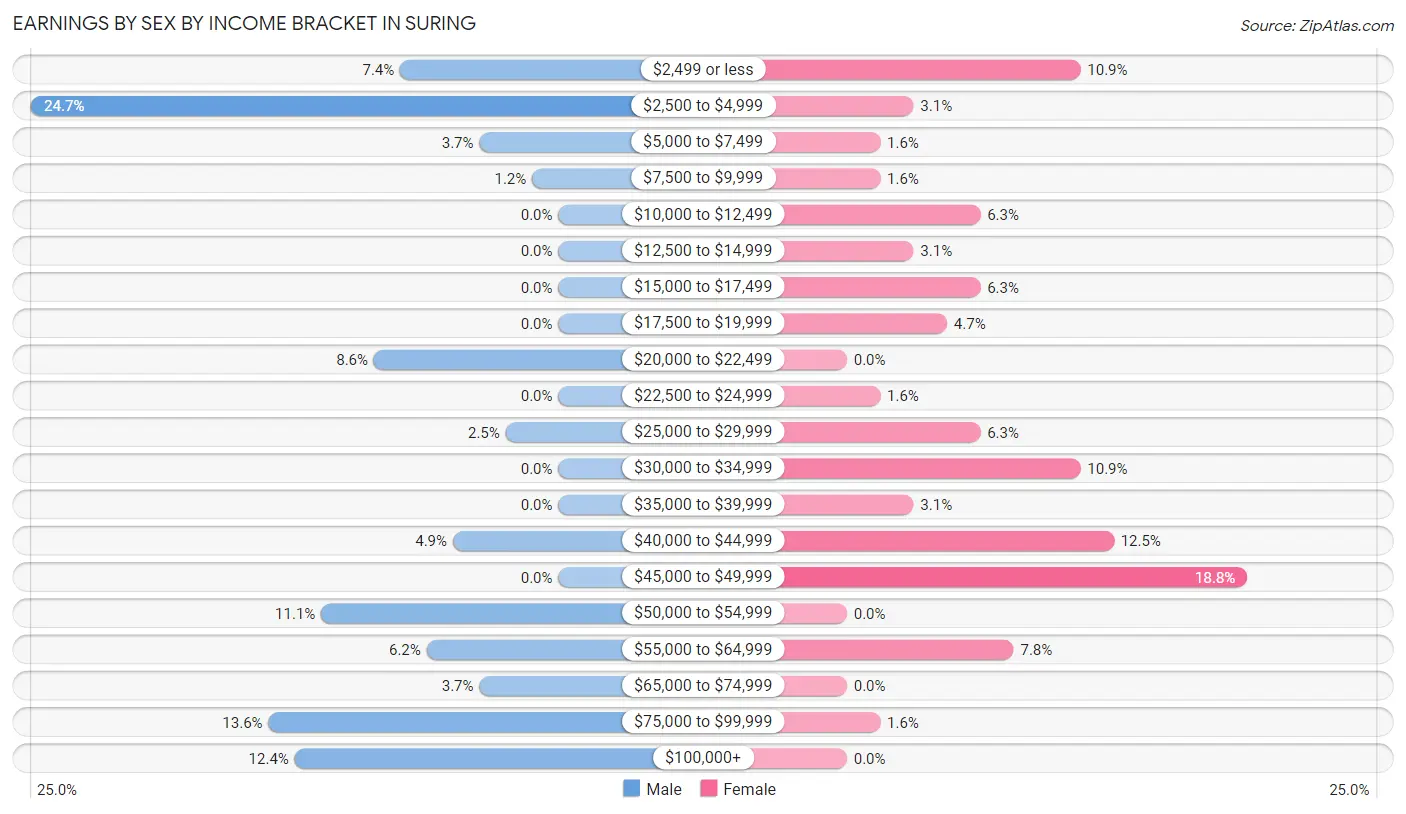
Earnings by Sex by Income Bracket in Suring
The most common earnings brackets in Suring are $2,500 to $4,999 for men (20 | 24.7%) and $45,000 to $49,999 for women (12 | 18.8%).
| Income | Male | Female |
| $2,499 or less | 6 (7.4%) | 7 (10.9%) |
| $2,500 to $4,999 | 20 (24.7%) | 2 (3.1%) |
| $5,000 to $7,499 | 3 (3.7%) | 1 (1.6%) |
| $7,500 to $9,999 | 1 (1.2%) | 1 (1.6%) |
| $10,000 to $12,499 | 0 (0.0%) | 4 (6.2%) |
| $12,500 to $14,999 | 0 (0.0%) | 2 (3.1%) |
| $15,000 to $17,499 | 0 (0.0%) | 4 (6.2%) |
| $17,500 to $19,999 | 0 (0.0%) | 3 (4.7%) |
| $20,000 to $22,499 | 7 (8.6%) | 0 (0.0%) |
| $22,500 to $24,999 | 0 (0.0%) | 1 (1.6%) |
| $25,000 to $29,999 | 2 (2.5%) | 4 (6.2%) |
| $30,000 to $34,999 | 0 (0.0%) | 7 (10.9%) |
| $35,000 to $39,999 | 0 (0.0%) | 2 (3.1%) |
| $40,000 to $44,999 | 4 (4.9%) | 8 (12.5%) |
| $45,000 to $49,999 | 0 (0.0%) | 12 (18.8%) |
| $50,000 to $54,999 | 9 (11.1%) | 0 (0.0%) |
| $55,000 to $64,999 | 5 (6.2%) | 5 (7.8%) |
| $65,000 to $74,999 | 3 (3.7%) | 0 (0.0%) |
| $75,000 to $99,999 | 11 (13.6%) | 1 (1.6%) |
| $100,000+ | 10 (12.3%) | 0 (0.0%) |
| Total | 81 (100.0%) | 64 (100.0%) |
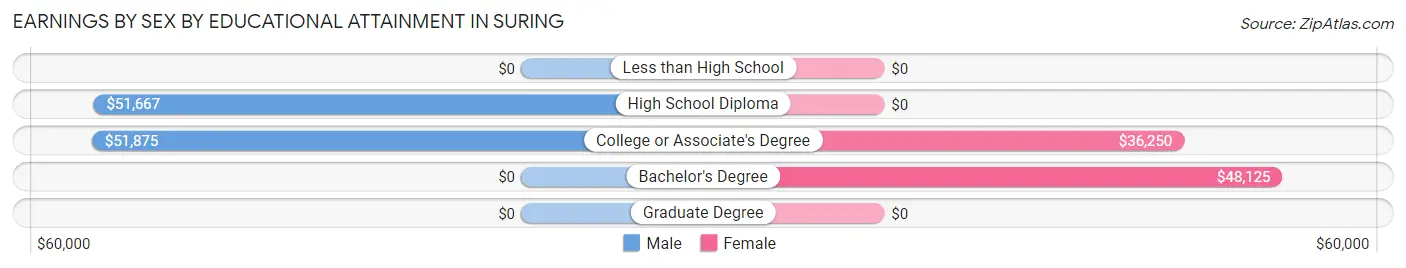
Earnings by Sex by Educational Attainment in Suring
Average earnings in Suring are $52,500 for men and $34,464 for women, a difference of 34.4%. Men with an educational attainment of college or associate's degree enjoy the highest average annual earnings of $51,875, while those with high school diploma education earn the least with $51,667. Women with an educational attainment of bachelor's degree earn the most with the average annual earnings of $48,125, while those with college or associate's degree education have the smallest earnings of $36,250.
| Educational Attainment | Male Income | Female Income |
| Less than High School | - | - |
| High School Diploma | $51,667 | $0 |
| College or Associate's Degree | $51,875 | $36,250 |
| Bachelor's Degree | - | - |
| Graduate Degree | - | - |
| Total | $52,500 | $34,464 |
Family Income in Suring
Family Income Brackets in Suring
According to the Suring family income data, there are 31 families falling into the $50,000 to $74,999 income range, which is the most common income bracket and makes up 32.3% of all families.
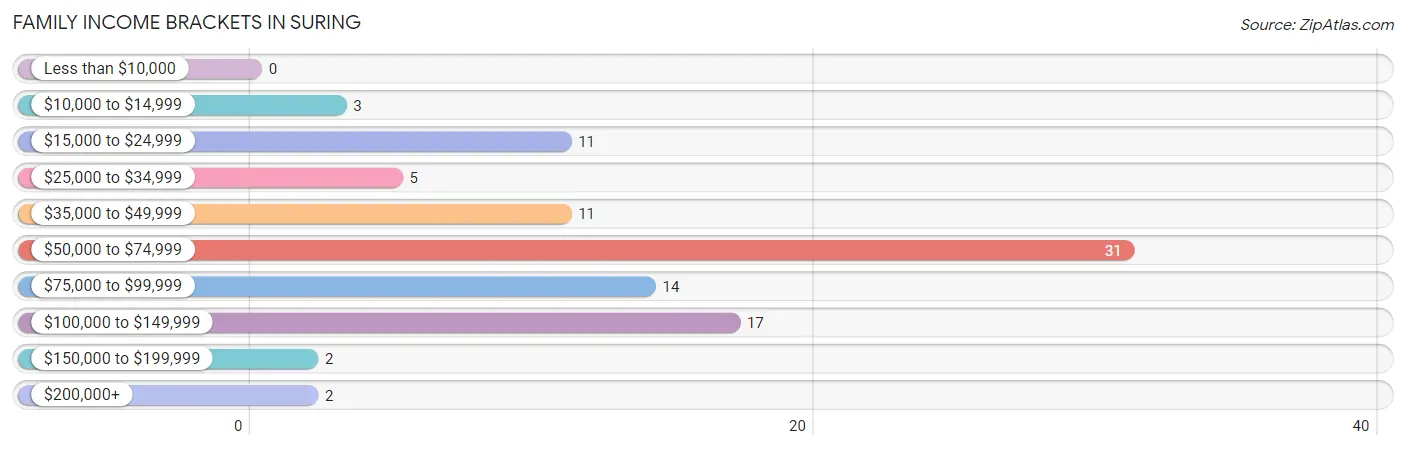
| Income Bracket | # Families | % Families |
| Less than $10,000 | 0 | 0.0% |
| $10,000 to $14,999 | 3 | 3.1% |
| $15,000 to $24,999 | 11 | 11.5% |
| $25,000 to $34,999 | 5 | 5.2% |
| $35,000 to $49,999 | 11 | 11.5% |
| $50,000 to $74,999 | 31 | 32.3% |
| $75,000 to $99,999 | 14 | 14.6% |
| $100,000 to $149,999 | 17 | 17.7% |
| $150,000 to $199,999 | 2 | 2.1% |
| $200,000+ | 2 | 2.1% |
Family Income by Famaliy Size in Suring
2-person families (67 | 69.8%) account for the highest median family income in Suring with $61,563 per family, while 2-person families (67 | 69.8%) have the highest median income of $30,782 per family member.
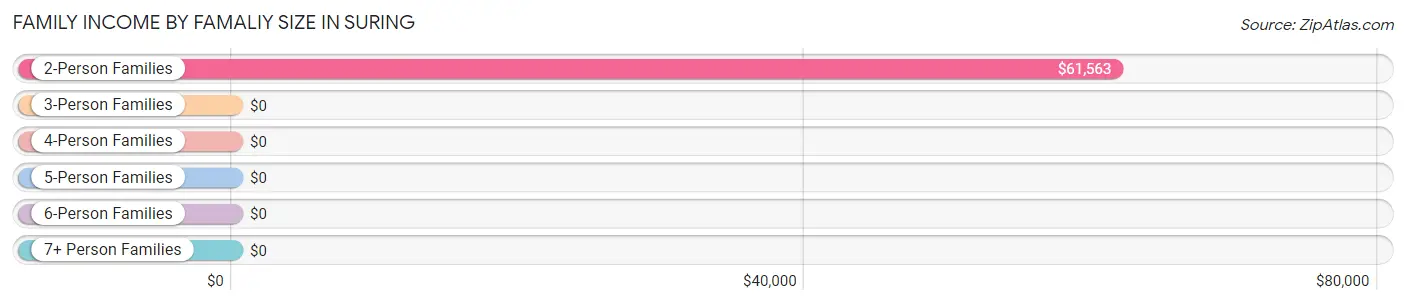
| Income Bracket | # Families | Median Income |
| 2-Person Families | 67 (69.8%) | $61,563 |
| 3-Person Families | 8 (8.3%) | $0 |
| 4-Person Families | 11 (11.5%) | $0 |
| 5-Person Families | 5 (5.2%) | $0 |
| 6-Person Families | 2 (2.1%) | $0 |
| 7+ Person Families | 3 (3.1%) | $0 |
| Total | 96 (100.0%) | $62,500 |
Family Income by Number of Earners in Suring
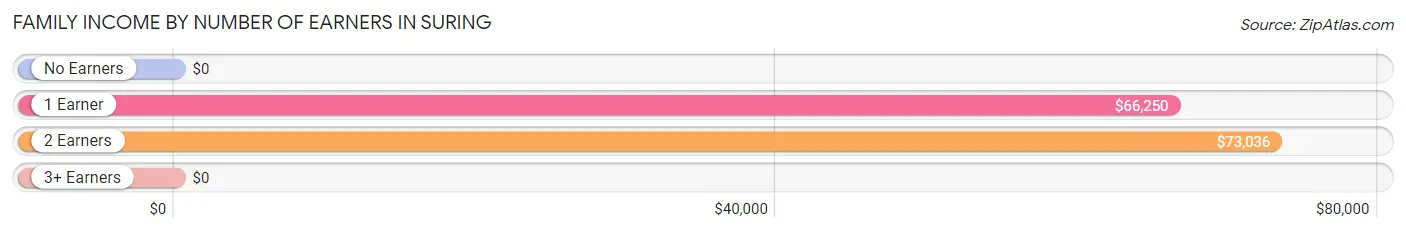
| Number of Earners | # Families | Median Income |
| No Earners | 21 (21.9%) | $0 |
| 1 Earner | 44 (45.8%) | $66,250 |
| 2 Earners | 31 (32.3%) | $73,036 |
| 3+ Earners | 0 (0.0%) | $0 |
| Total | 96 (100.0%) | $62,500 |
Household Income in Suring
Household Income Brackets in Suring
With 38 households falling in the category, the $15,000 to $24,999 income range is the most frequent in Suring, accounting for 22.9% of all households. In contrast, only 2 households (1.2%) fall into the less than $10,000 income bracket, making it the least populous group.
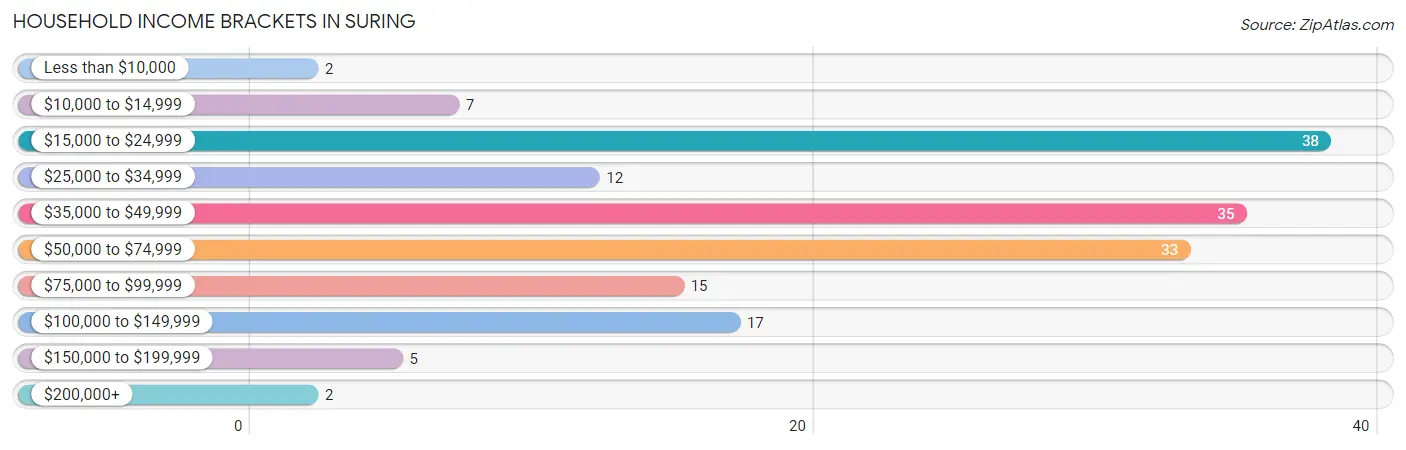
| Income Bracket | # Households | % Households |
| Less than $10,000 | 2 | 1.2% |
| $10,000 to $14,999 | 7 | 4.2% |
| $15,000 to $24,999 | 38 | 22.9% |
| $25,000 to $34,999 | 12 | 7.2% |
| $35,000 to $49,999 | 35 | 21.1% |
| $50,000 to $74,999 | 33 | 19.9% |
| $75,000 to $99,999 | 15 | 9.0% |
| $100,000 to $149,999 | 17 | 10.2% |
| $150,000 to $199,999 | 5 | 3.0% |
| $200,000+ | 2 | 1.2% |
Household Income by Householder Age in Suring
The median household income in Suring is $47,885, with the highest median household income of $80,833 found in the 25 to 44 years age bracket for the primary householder. A total of 22 households (13.3%) fall into this category.
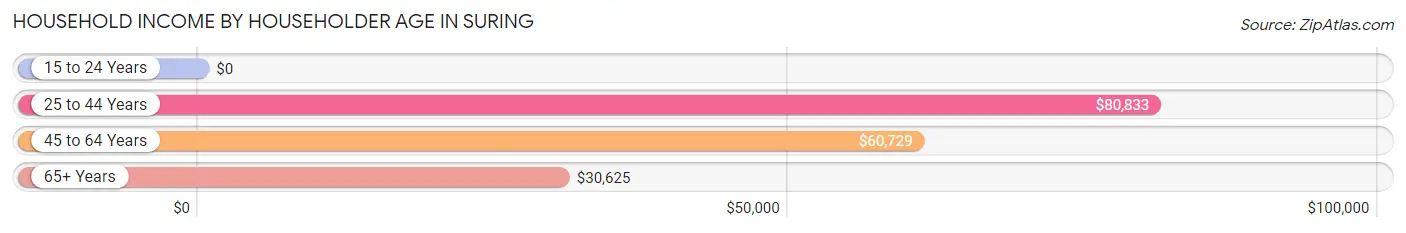
| Income Bracket | # Households | Median Income |
| 15 to 24 Years | 0 (0.0%) | $0 |
| 25 to 44 Years | 22 (13.3%) | $80,833 |
| 45 to 64 Years | 71 (42.8%) | $60,729 |
| 65+ Years | 73 (44.0%) | $30,625 |
| Total | 166 (100.0%) | $47,885 |
Poverty in Suring
Income Below Poverty by Sex and Age in Suring
With 18.8% poverty level for males and 16.5% for females among the residents of Suring, under 5 year old males and 6 to 11 year old females are the most vulnerable to poverty, with 5 males (100.0%) and 3 females (100.0%) in their respective age groups living below the poverty level.
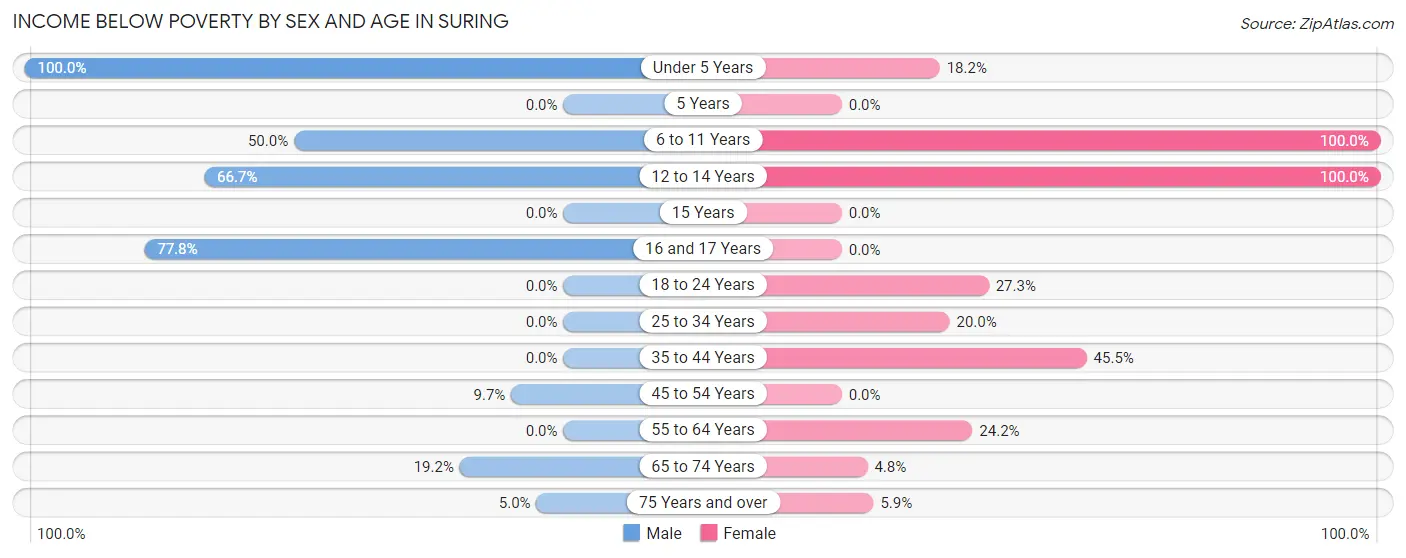
| Age Bracket | Male | Female |
| Under 5 Years | 5 (100.0%) | 2 (18.2%) |
| 5 Years | 0 (0.0%) | 0 (0.0%) |
| 6 to 11 Years | 9 (50.0%) | 3 (100.0%) |
| 12 to 14 Years | 4 (66.7%) | 2 (100.0%) |
| 15 Years | 0 (0.0%) | 0 (0.0%) |
| 16 and 17 Years | 7 (77.8%) | 0 (0.0%) |
| 18 to 24 Years | 0 (0.0%) | 3 (27.3%) |
| 25 to 34 Years | 0 (0.0%) | 2 (20.0%) |
| 35 to 44 Years | 0 (0.0%) | 5 (45.5%) |
| 45 to 54 Years | 3 (9.7%) | 0 (0.0%) |
| 55 to 64 Years | 0 (0.0%) | 8 (24.2%) |
| 65 to 74 Years | 5 (19.2%) | 1 (4.8%) |
| 75 Years and over | 1 (5.0%) | 2 (5.9%) |
| Total | 34 (18.8%) | 28 (16.5%) |
Income Above Poverty by Sex and Age in Suring
According to the poverty statistics in Suring, males aged 18 to 24 years and females aged 15 years are the age groups that are most secure financially, with 100.0% of males and 100.0% of females in these age groups living above the poverty line.
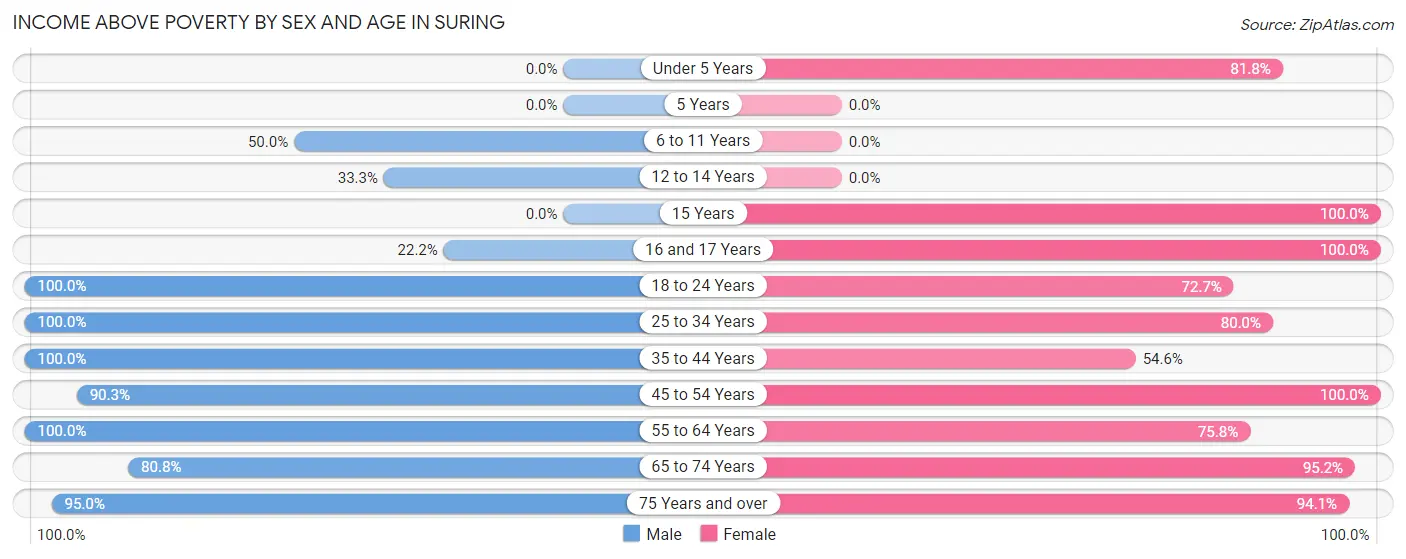
| Age Bracket | Male | Female |
| Under 5 Years | 0 (0.0%) | 9 (81.8%) |
| 5 Years | 0 (0.0%) | 0 (0.0%) |
| 6 to 11 Years | 9 (50.0%) | 0 (0.0%) |
| 12 to 14 Years | 2 (33.3%) | 0 (0.0%) |
| 15 Years | 0 (0.0%) | 3 (100.0%) |
| 16 and 17 Years | 2 (22.2%) | 2 (100.0%) |
| 18 to 24 Years | 25 (100.0%) | 8 (72.7%) |
| 25 to 34 Years | 11 (100.0%) | 8 (80.0%) |
| 35 to 44 Years | 4 (100.0%) | 6 (54.5%) |
| 45 to 54 Years | 28 (90.3%) | 29 (100.0%) |
| 55 to 64 Years | 26 (100.0%) | 25 (75.8%) |
| 65 to 74 Years | 21 (80.8%) | 20 (95.2%) |
| 75 Years and over | 19 (95.0%) | 32 (94.1%) |
| Total | 147 (81.2%) | 142 (83.5%) |
Income Below Poverty Among Married-Couple Families in Suring
The poverty statistics for married-couple families in Suring show that 4.2% or 3 of the total 72 families live below the poverty line. Families with no children have the highest poverty rate of 5.4%, comprising of 3 families. On the other hand, families with 1 or 2 children have the lowest poverty rate of 0.0%, which includes 0 families.
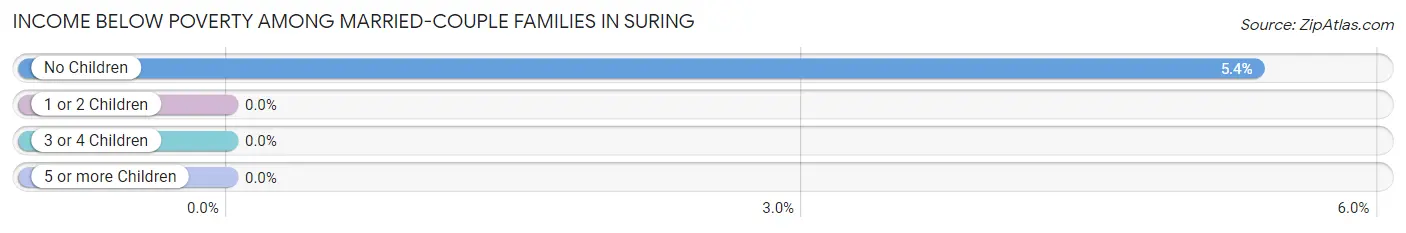
| Children | Above Poverty | Below Poverty |
| No Children | 53 (94.6%) | 3 (5.4%) |
| 1 or 2 Children | 16 (100.0%) | 0 (0.0%) |
| 3 or 4 Children | 0 (0.0%) | 0 (0.0%) |
| 5 or more Children | 0 (0.0%) | 0 (0.0%) |
| Total | 69 (95.8%) | 3 (4.2%) |
Income Below Poverty Among Single-Parent Households in Suring
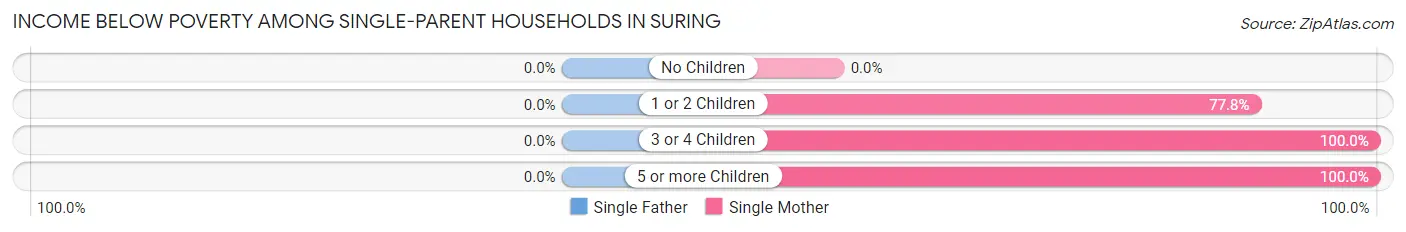
| Children | Single Father | Single Mother |
| No Children | 0 (0.0%) | 0 (0.0%) |
| 1 or 2 Children | 0 (0.0%) | 7 (77.8%) |
| 3 or 4 Children | 0 (0.0%) | 2 (100.0%) |
| 5 or more Children | 0 (0.0%) | 3 (100.0%) |
| Total | 0 (0.0%) | 12 (60.0%) |
Income Below Poverty Among Married-Couple vs Single-Parent Households in Suring
The poverty data for Suring shows that 3 of the married-couple family households (4.2%) and 12 of the single-parent households (50.0%) are living below the poverty level. Within the married-couple family households, those with no children have the highest poverty rate, with 3 households (5.4%) falling below the poverty line. Among the single-parent households, those with 3 or 4 children have the highest poverty rate, with 2 household (100.0%) living below poverty.
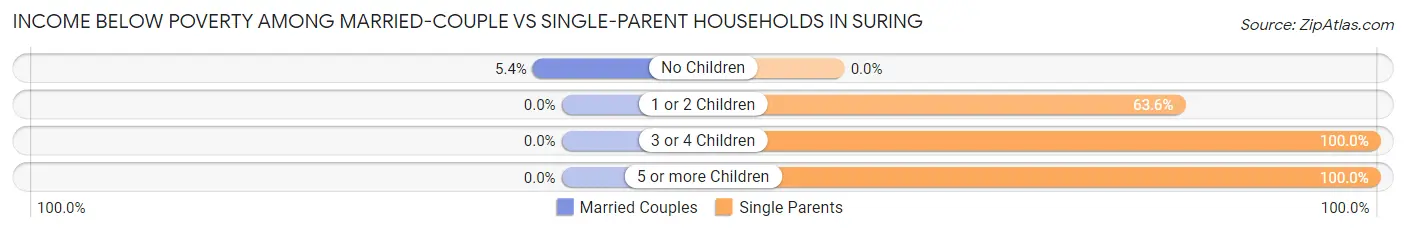
| Children | Married-Couple Families | Single-Parent Households |
| No Children | 3 (5.4%) | 0 (0.0%) |
| 1 or 2 Children | 0 (0.0%) | 7 (63.6%) |
| 3 or 4 Children | 0 (0.0%) | 2 (100.0%) |
| 5 or more Children | 0 (0.0%) | 3 (100.0%) |
| Total | 3 (4.2%) | 12 (50.0%) |
Race in Suring
The most populous races in Suring are White / Caucasian (329 | 82.5%), Native / Alaskan (29 | 7.3%), and Hispanic or Latino (28 | 7.0%).
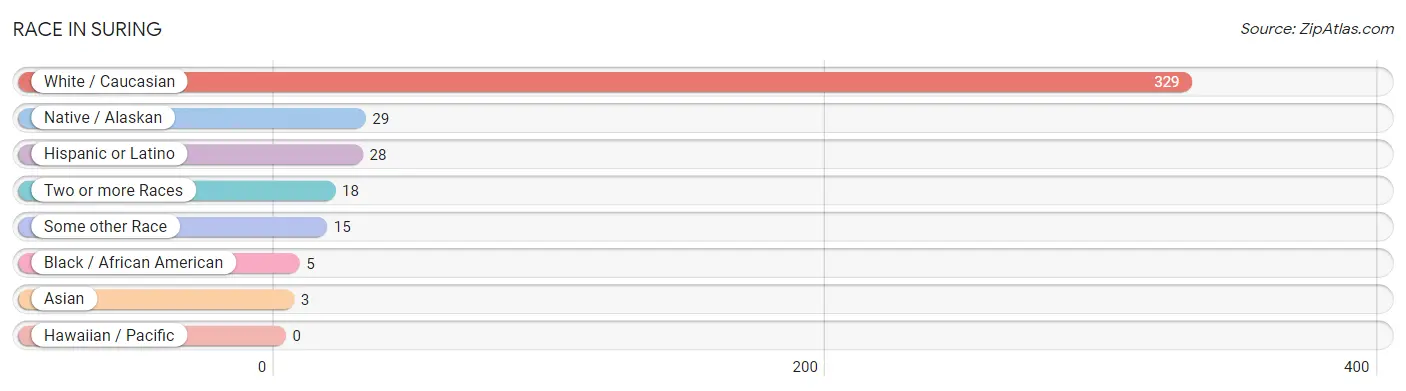
| Race | # Population | % Population |
| Asian | 3 | 0.7% |
| Black / African American | 5 | 1.3% |
| Hawaiian / Pacific | 0 | 0.0% |
| Hispanic or Latino | 28 | 7.0% |
| Native / Alaskan | 29 | 7.3% |
| White / Caucasian | 329 | 82.5% |
| Two or more Races | 18 | 4.5% |
| Some other Race | 15 | 3.8% |
| Total | 399 | 100.0% |
Ancestry in Suring
The most populous ancestries reported in Suring are German (136 | 34.1%), Norwegian (35 | 8.8%), American (30 | 7.5%), Polish (29 | 7.3%), and Mexican (26 | 6.5%), together accounting for 64.2% of all Suring residents.
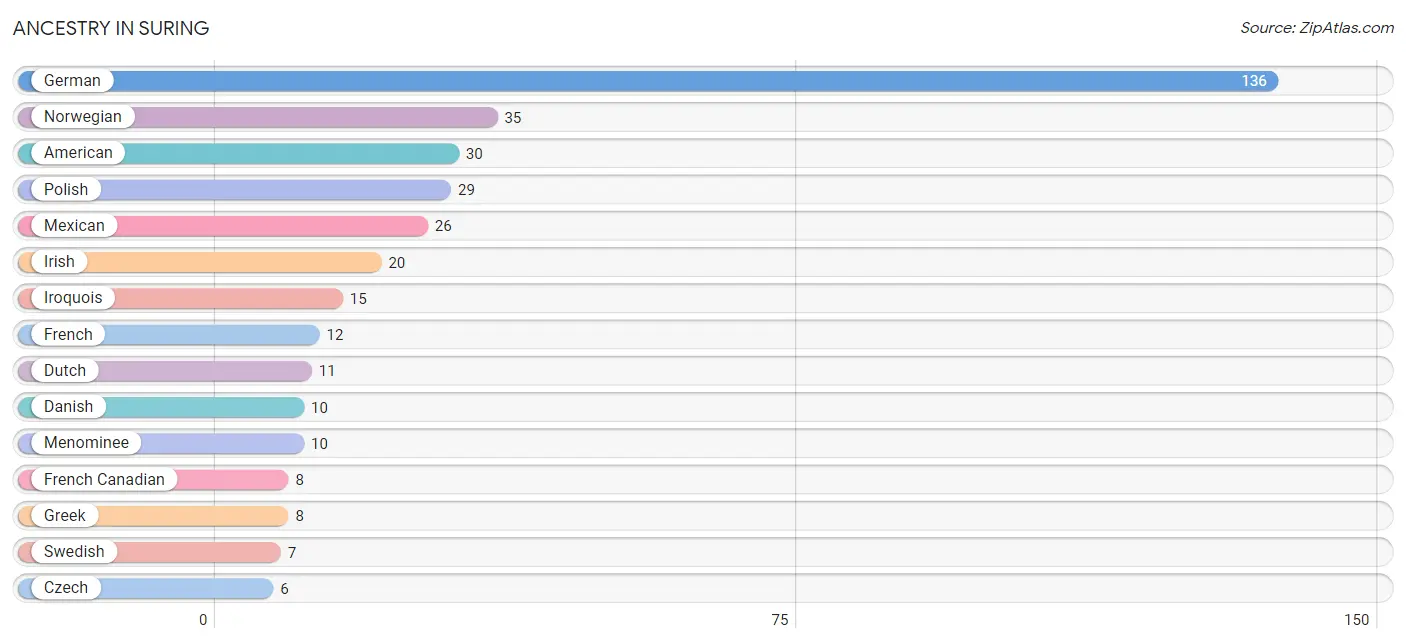
| Ancestry | # Population | % Population |
| American | 30 | 7.5% |
| Bangladeshi | 3 | 0.7% |
| Belgian | 5 | 1.3% |
| British | 2 | 0.5% |
| Cheyenne | 1 | 0.3% |
| Czech | 6 | 1.5% |
| Danish | 10 | 2.5% |
| Dutch | 11 | 2.8% |
| English | 1 | 0.3% |
| French | 12 | 3.0% |
| French Canadian | 8 | 2.0% |
| German | 136 | 34.1% |
| Greek | 8 | 2.0% |
| Indian (Asian) | 1 | 0.3% |
| Irish | 20 | 5.0% |
| Iroquois | 15 | 3.8% |
| Menominee | 10 | 2.5% |
| Mexican | 26 | 6.5% |
| Norwegian | 35 | 8.8% |
| Polish | 29 | 7.3% |
| Scotch-Irish | 2 | 0.5% |
| Sioux | 2 | 0.5% |
| Swedish | 7 | 1.8% |
| Yaqui | 6 | 1.5% | View All 24 Rows |
Immigrants in Suring
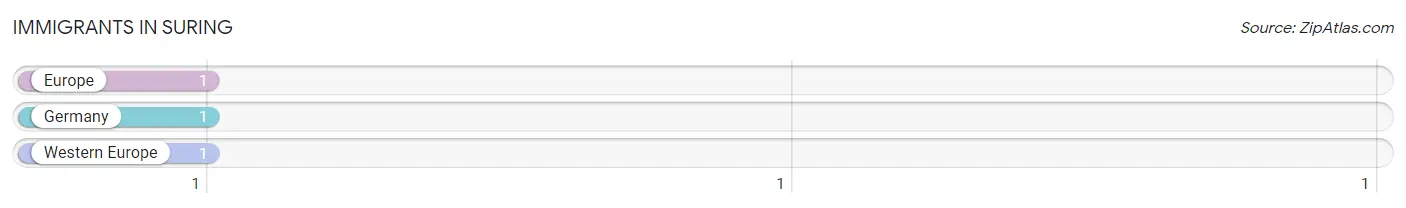
The most numerous immigrant groups reported in Suring came from Europe (1 | 0.3%), Germany (1 | 0.3%), and Western Europe (1 | 0.3%), together accounting for 0.7% of all Suring residents.
| Immigration Origin | # Population | % Population |
| Europe | 1 | 0.3% |
| Germany | 1 | 0.3% |
| Western Europe | 1 | 0.3% | View All 3 Rows |
Sex and Age in Suring
Sex and Age in Suring
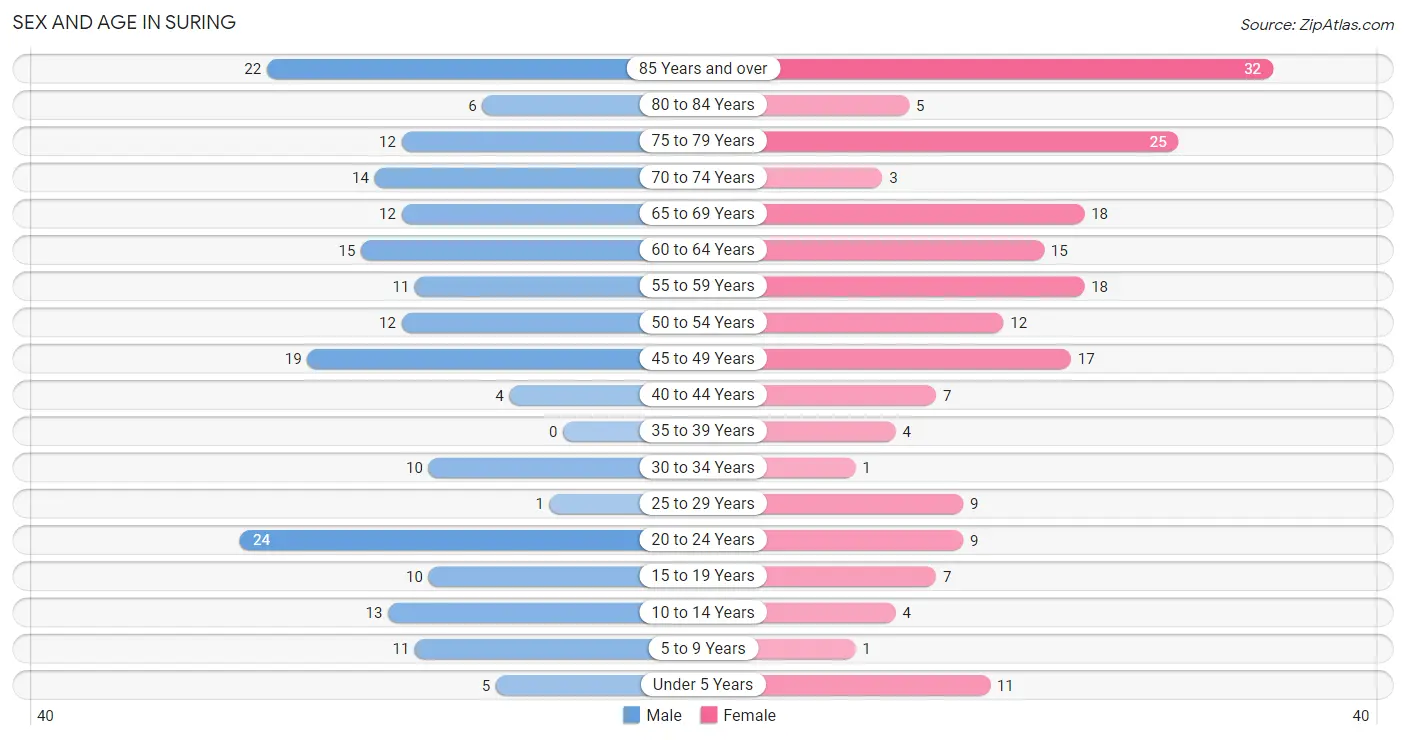
The most populous age groups in Suring are 20 to 24 Years (24 | 11.9%) for men and 85 Years and over (32 | 16.2%) for women.
| Age Bracket | Male | Female |
| Under 5 Years | 5 (2.5%) | 11 (5.6%) |
| 5 to 9 Years | 11 (5.5%) | 1 (0.5%) |
| 10 to 14 Years | 13 (6.5%) | 4 (2.0%) |
| 15 to 19 Years | 10 (5.0%) | 7 (3.5%) |
| 20 to 24 Years | 24 (11.9%) | 9 (4.5%) |
| 25 to 29 Years | 1 (0.5%) | 9 (4.5%) |
| 30 to 34 Years | 10 (5.0%) | 1 (0.5%) |
| 35 to 39 Years | 0 (0.0%) | 4 (2.0%) |
| 40 to 44 Years | 4 (2.0%) | 7 (3.5%) |
| 45 to 49 Years | 19 (9.5%) | 17 (8.6%) |
| 50 to 54 Years | 12 (6.0%) | 12 (6.1%) |
| 55 to 59 Years | 11 (5.5%) | 18 (9.1%) |
| 60 to 64 Years | 15 (7.5%) | 15 (7.6%) |
| 65 to 69 Years | 12 (6.0%) | 18 (9.1%) |
| 70 to 74 Years | 14 (7.0%) | 3 (1.5%) |
| 75 to 79 Years | 12 (6.0%) | 25 (12.6%) |
| 80 to 84 Years | 6 (3.0%) | 5 (2.5%) |
| 85 Years and over | 22 (11.0%) | 32 (16.2%) |
| Total | 201 (100.0%) | 198 (100.0%) |
Families and Households in Suring
Median Family Size in Suring
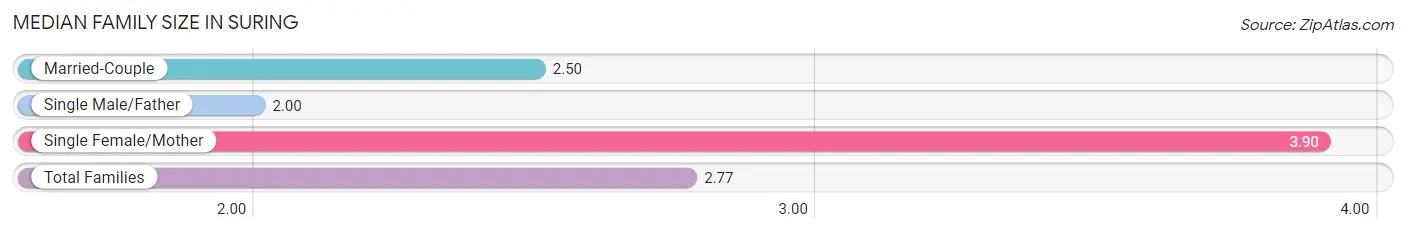
The median family size in Suring is 2.77 persons per family, with single female/mother families (20 | 20.8%) accounting for the largest median family size of 3.9 persons per family. On the other hand, single male/father families (4 | 4.2%) represent the smallest median family size with 2.00 persons per family.
| Family Type | # Families | Family Size |
| Married-Couple | 72 (75.0%) | 2.50 |
| Single Male/Father | 4 (4.2%) | 2.00 |
| Single Female/Mother | 20 (20.8%) | 3.90 |
| Total Families | 96 (100.0%) | 2.77 |
Median Household Size in Suring
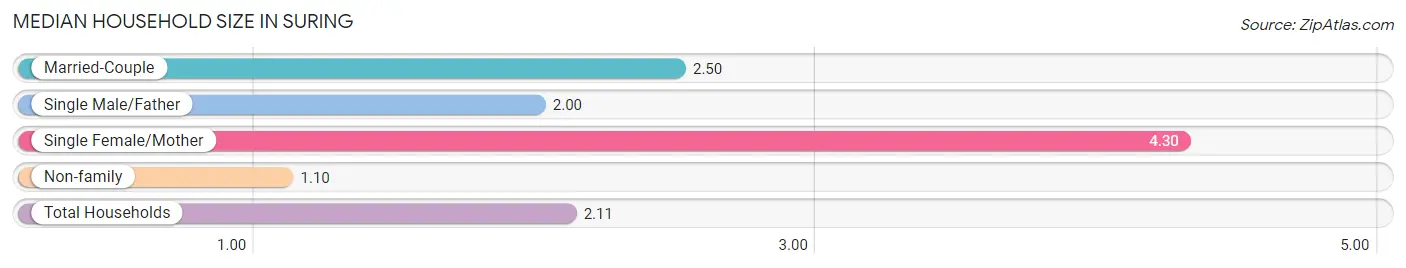
The median household size in Suring is 2.11 persons per household, with single female/mother households (20 | 12.0%) accounting for the largest median household size of 4.3 persons per household. non-family households (70 | 42.2%) represent the smallest median household size with 1.10 persons per household.
| Household Type | # Households | Household Size |
| Married-Couple | 72 (43.4%) | 2.50 |
| Single Male/Father | 4 (2.4%) | 2.00 |
| Single Female/Mother | 20 (12.0%) | 4.30 |
| Non-family | 70 (42.2%) | 1.10 |
| Total Households | 166 (100.0%) | 2.11 |
Household Size by Marriage Status in Suring
Out of a total of 166 households in Suring, 96 (57.8%) are family households, while 70 (42.2%) are nonfamily households. The most numerous type of family households are 2-person households, comprising 67, and the most common type of nonfamily households are 1-person households, comprising 64.
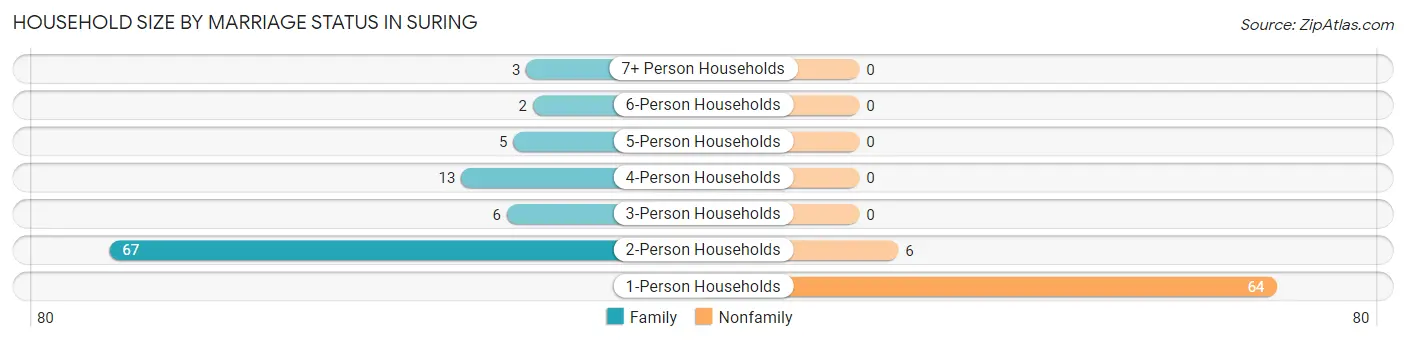
| Household Size | Family Households | Nonfamily Households |
| 1-Person Households | - | 64 (38.6%) |
| 2-Person Households | 67 (40.4%) | 6 (3.6%) |
| 3-Person Households | 6 (3.6%) | 0 (0.0%) |
| 4-Person Households | 13 (7.8%) | 0 (0.0%) |
| 5-Person Households | 5 (3.0%) | 0 (0.0%) |
| 6-Person Households | 2 (1.2%) | 0 (0.0%) |
| 7+ Person Households | 3 (1.8%) | 0 (0.0%) |
| Total | 96 (57.8%) | 70 (42.2%) |
Female Fertility in Suring
Fertility by Age in Suring
Average fertility rate in Suring is 74.0 births per 1,000 women. Women in the age bracket of 20 to 34 years have the highest fertility rate with 211.0 births per 1,000 women. Women in the age bracket of 20 to 34 years acount for 100.0% of all women with births.
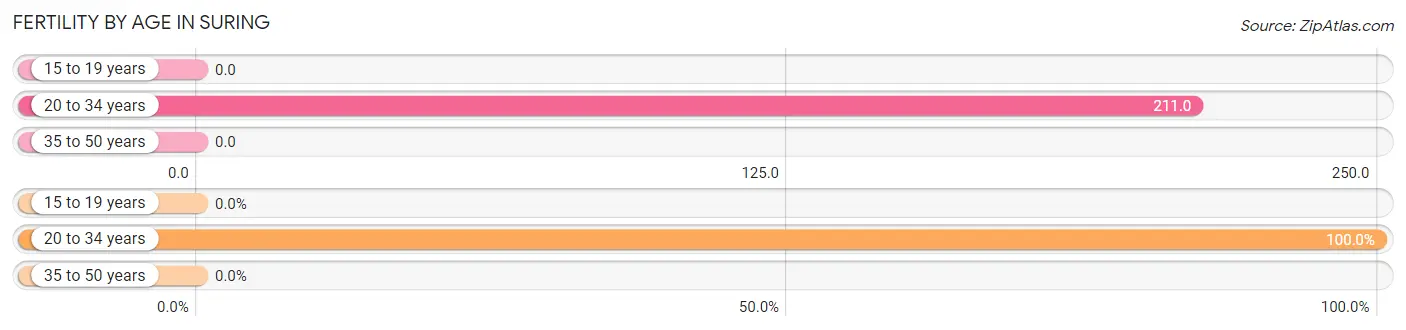
| Age Bracket | Women with Births | Births / 1,000 Women |
| 15 to 19 years | 0 (0.0%) | 0.0 |
| 20 to 34 years | 4 (100.0%) | 211.0 |
| 35 to 50 years | 0 (0.0%) | 0.0 |
| Total | 4 (100.0%) | 74.0 |
Fertility by Age by Marriage Status in Suring
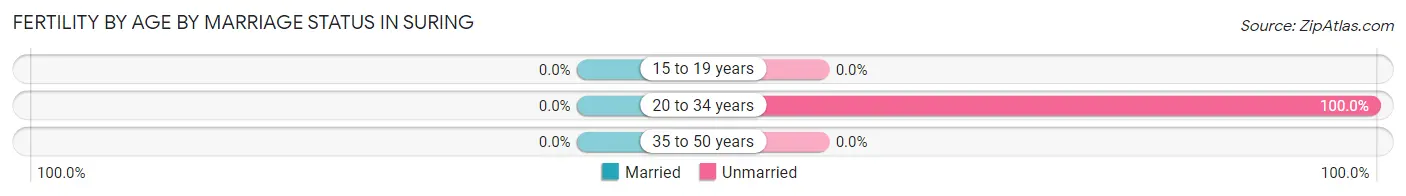
| Age Bracket | Married | Unmarried |
| 15 to 19 years | 0 (0.0%) | 0 (0.0%) |
| 20 to 34 years | 0 (0.0%) | 4 (100.0%) |
| 35 to 50 years | 0 (0.0%) | 0 (0.0%) |
| Total | 0 (0.0%) | 4 (100.0%) |
Fertility by Education in Suring
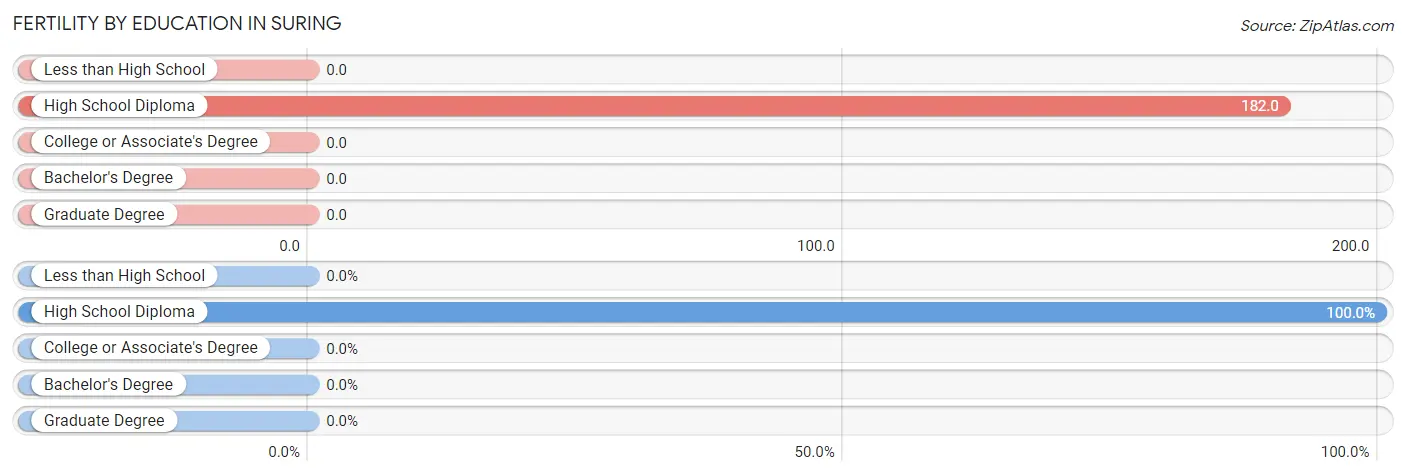
| Educational Attainment | Women with Births | Births / 1,000 Women |
| Less than High School | 0 (0.0%) | 0.0 |
| High School Diploma | 4 (100.0%) | 182.0 |
| College or Associate's Degree | 0 (0.0%) | 0.0 |
| Bachelor's Degree | 0 (0.0%) | 0.0 |
| Graduate Degree | 0 (0.0%) | 0.0 |
| Total | 4 (100.0%) | 74.0 |
Fertility by Education by Marriage Status in Suring
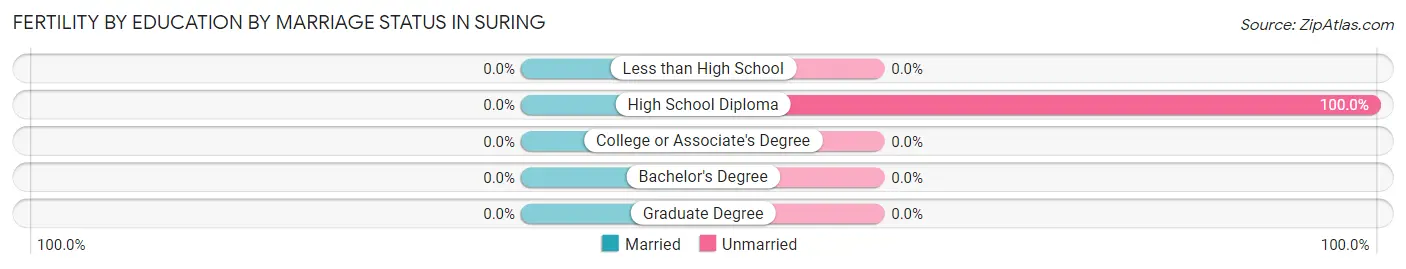
| Educational Attainment | Married | Unmarried |
| Less than High School | 0 (0.0%) | 0 (0.0%) |
| High School Diploma | 0 (0.0%) | 4 (100.0%) |
| College or Associate's Degree | 0 (0.0%) | 0 (0.0%) |
| Bachelor's Degree | 0 (0.0%) | 0 (0.0%) |
| Graduate Degree | 0 (0.0%) | 0 (0.0%) |
| Total | 0 (0.0%) | 4 (100.0%) |
Employment Characteristics in Suring
Employment by Class of Employer in Suring
Among the 125 employed individuals in Suring, private company employees (94 | 75.2%), local government employees (15 | 12.0%), and not-for-profit organizations (10 | 8.0%) make up the most common classes of employment.
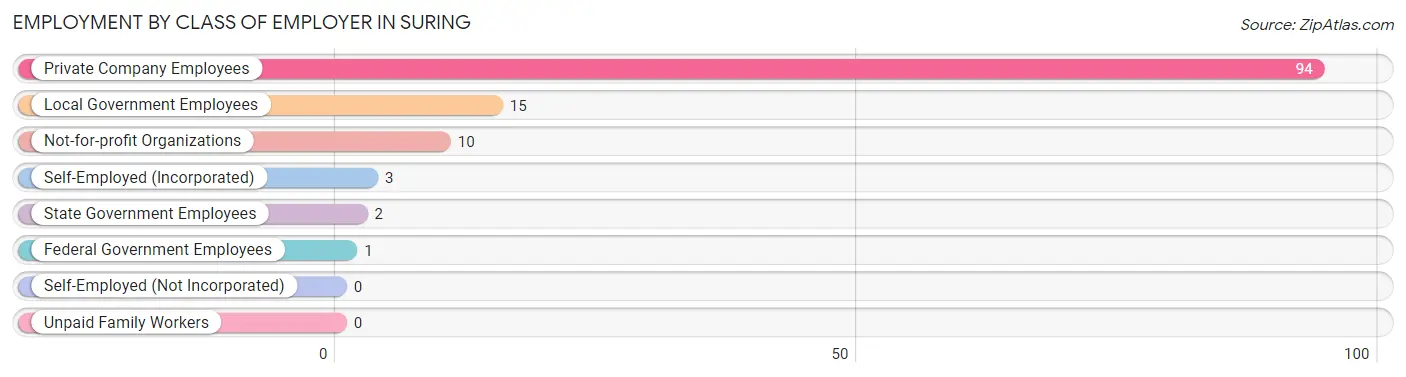
| Employer Class | # Employees | % Employees |
| Private Company Employees | 94 | 75.2% |
| Self-Employed (Incorporated) | 3 | 2.4% |
| Self-Employed (Not Incorporated) | 0 | 0.0% |
| Not-for-profit Organizations | 10 | 8.0% |
| Local Government Employees | 15 | 12.0% |
| State Government Employees | 2 | 1.6% |
| Federal Government Employees | 1 | 0.8% |
| Unpaid Family Workers | 0 | 0.0% |
| Total | 125 | 100.0% |
Employment Status by Age in Suring
According to the labor force statistics for Suring, out of the total population over 16 years of age (351), 39.9% or 140 individuals are in the labor force, with 8.6% or 12 of them unemployed. The age group with the highest labor force participation rate is 30 to 34 years, with 100.0% or 11 individuals in the labor force. Within the labor force, the 20 to 24 years age range has the highest percentage of unemployed individuals, with 25.9% or 7 of them being unemployed.
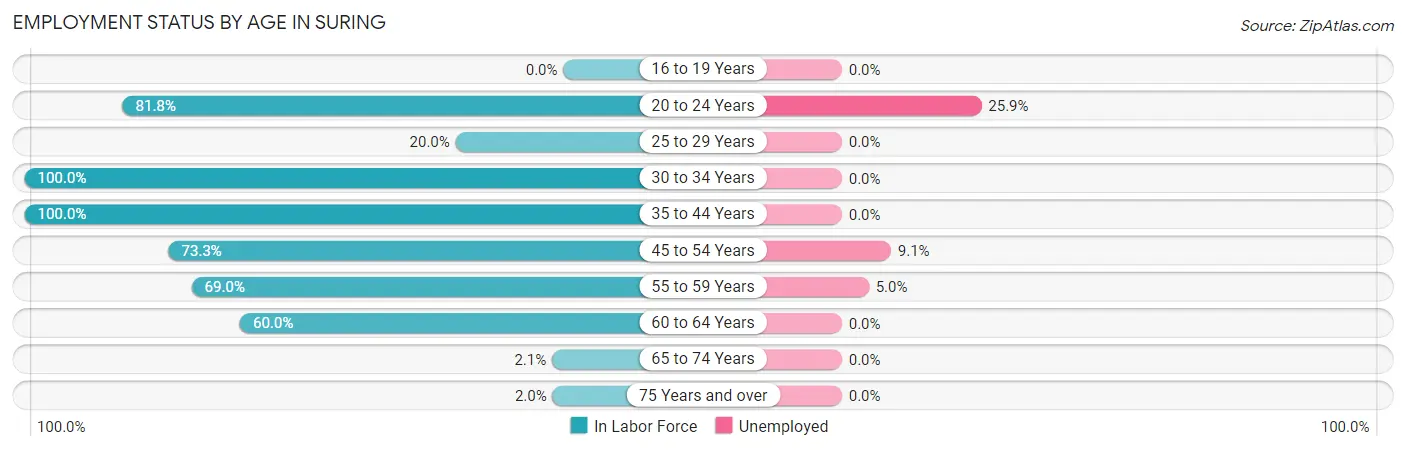
| Age Bracket | In Labor Force | Unemployed |
| 16 to 19 Years | 0 (0.0%) | 0 (0.0%) |
| 20 to 24 Years | 27 (81.8%) | 7 (25.9%) |
| 25 to 29 Years | 2 (20.0%) | 0 (0.0%) |
| 30 to 34 Years | 11 (100.0%) | 0 (0.0%) |
| 35 to 44 Years | 15 (100.0%) | 0 (0.0%) |
| 45 to 54 Years | 44 (73.3%) | 4 (9.1%) |
| 55 to 59 Years | 20 (69.0%) | 1 (5.0%) |
| 60 to 64 Years | 18 (60.0%) | 0 (0.0%) |
| 65 to 74 Years | 1 (2.1%) | 0 (0.0%) |
| 75 Years and over | 2 (2.0%) | 0 (0.0%) |
| Total | 140 (39.9%) | 12 (8.6%) |
Employment Status by Educational Attainment in Suring
According to labor force statistics for Suring, 71.0% of individuals (110) out of the total population between 25 and 64 years of age (155) are in the labor force, with 4.5% or 5 of them being unemployed. The group with the highest labor force participation rate are those with the educational attainment of less than high school, with 100.0% or 9 individuals in the labor force. Within the labor force, individuals with less than high school education have the highest percentage of unemployment, with 33.3% or 3 of them being unemployed.
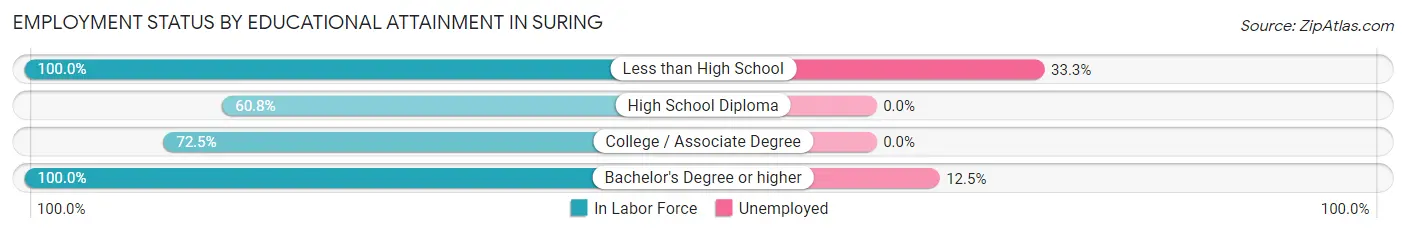
| Educational Attainment | In Labor Force | Unemployed |
| Less than High School | 9 (100.0%) | 3 (33.3%) |
| High School Diploma | 48 (60.8%) | 0 (0.0%) |
| College / Associate Degree | 37 (72.5%) | 0 (0.0%) |
| Bachelor's Degree or higher | 16 (100.0%) | 2 (12.5%) |
| Total | 110 (71.0%) | 7 (4.5%) |
Employment Occupations by Sex in Suring
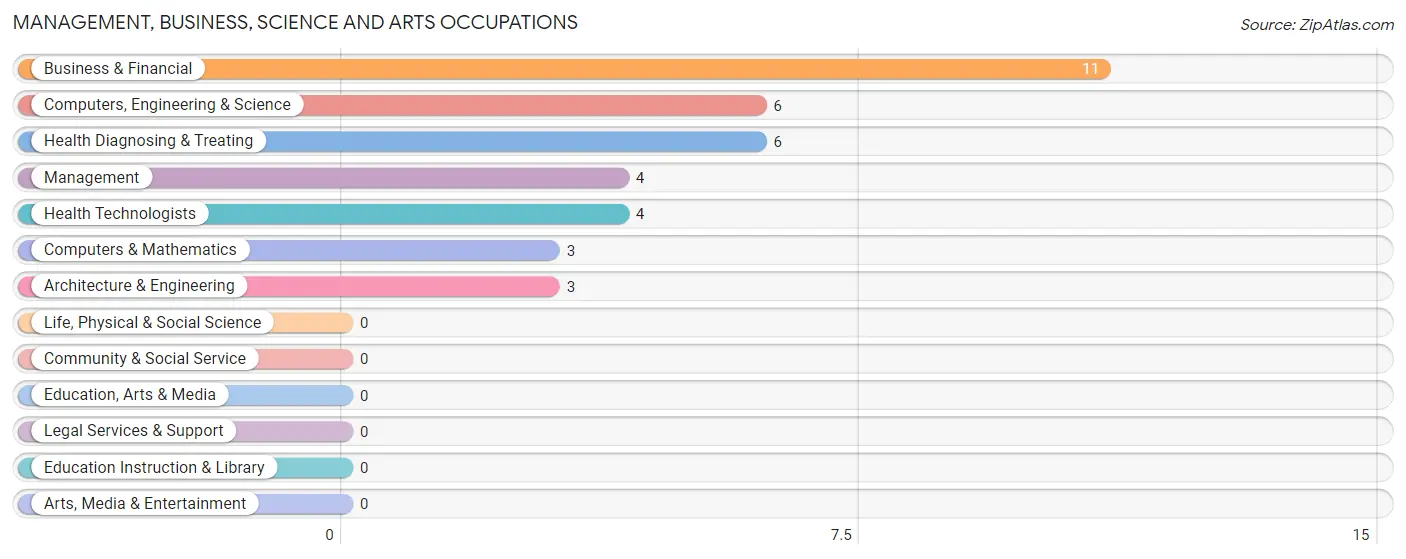
Management, Business, Science and Arts Occupations
The most common Management, Business, Science and Arts occupations in Suring are Business & Financial (11 | 8.6%), Computers, Engineering & Science (6 | 4.7%), Health Diagnosing & Treating (6 | 4.7%), Management (4 | 3.1%), and Health Technologists (4 | 3.1%).
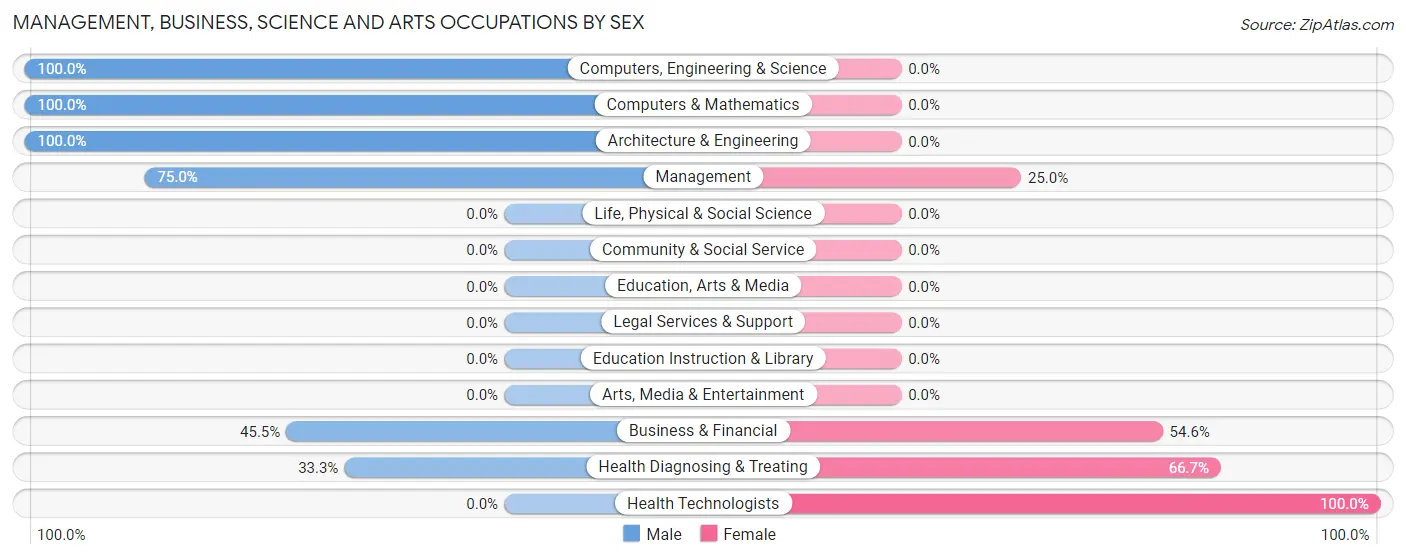
Management, Business, Science and Arts Occupations by Sex
Within the Management, Business, Science and Arts occupations in Suring, the most male-oriented occupations are Computers, Engineering & Science (100.0%), Computers & Mathematics (100.0%), and Architecture & Engineering (100.0%), while the most female-oriented occupations are Health Technologists (100.0%), Health Diagnosing & Treating (66.7%), and Business & Financial (54.5%).
| Occupation | Male | Female |
| Management | 3 (75.0%) | 1 (25.0%) |
| Business & Financial | 5 (45.5%) | 6 (54.5%) |
| Computers, Engineering & Science | 6 (100.0%) | 0 (0.0%) |
| Computers & Mathematics | 3 (100.0%) | 0 (0.0%) |
| Architecture & Engineering | 3 (100.0%) | 0 (0.0%) |
| Life, Physical & Social Science | 0 (0.0%) | 0 (0.0%) |
| Community & Social Service | 0 (0.0%) | 0 (0.0%) |
| Education, Arts & Media | 0 (0.0%) | 0 (0.0%) |
| Legal Services & Support | 0 (0.0%) | 0 (0.0%) |
| Education Instruction & Library | 0 (0.0%) | 0 (0.0%) |
| Arts, Media & Entertainment | 0 (0.0%) | 0 (0.0%) |
| Health Diagnosing & Treating | 2 (33.3%) | 4 (66.7%) |
| Health Technologists | 0 (0.0%) | 4 (100.0%) |
| Total (Category) | 16 (59.3%) | 11 (40.7%) |
| Total (Overall) | 70 (54.7%) | 58 (45.3%) |
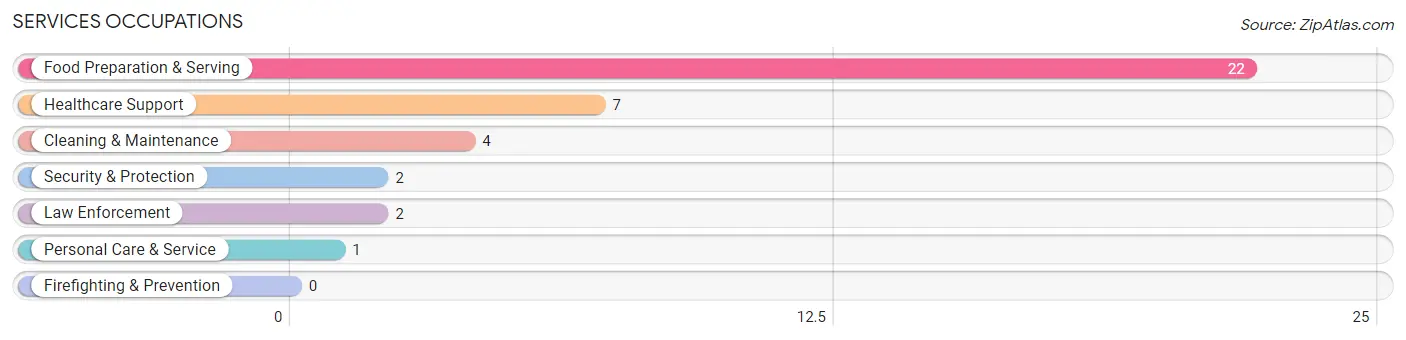
Services Occupations
The most common Services occupations in Suring are Food Preparation & Serving (22 | 17.2%), Healthcare Support (7 | 5.5%), Cleaning & Maintenance (4 | 3.1%), Security & Protection (2 | 1.6%), and Law Enforcement (2 | 1.6%).
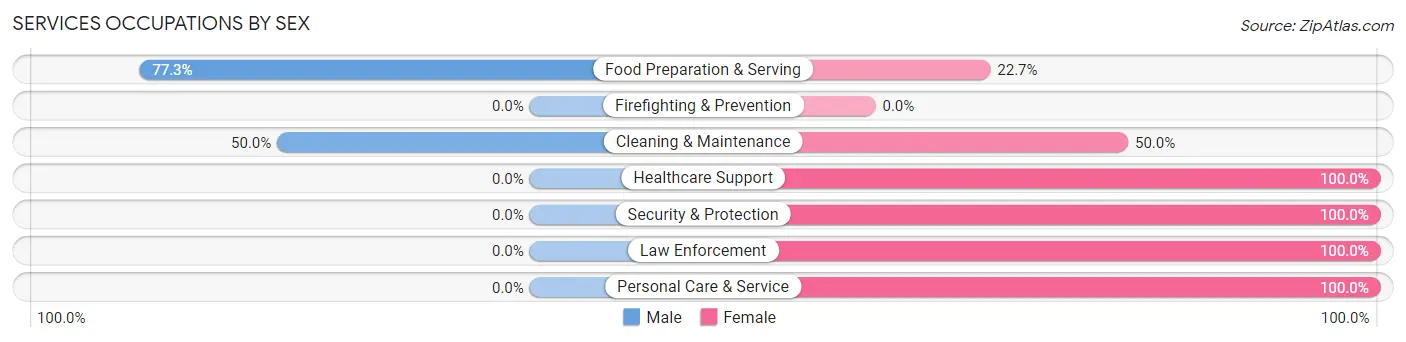
Services Occupations by Sex
Within the Services occupations in Suring, the most male-oriented occupations are Food Preparation & Serving (77.3%), and Cleaning & Maintenance (50.0%), while the most female-oriented occupations are Healthcare Support (100.0%), Security & Protection (100.0%), and Law Enforcement (100.0%).
| Occupation | Male | Female |
| Healthcare Support | 0 (0.0%) | 7 (100.0%) |
| Security & Protection | 0 (0.0%) | 2 (100.0%) |
| Firefighting & Prevention | 0 (0.0%) | 0 (0.0%) |
| Law Enforcement | 0 (0.0%) | 2 (100.0%) |
| Food Preparation & Serving | 17 (77.3%) | 5 (22.7%) |
| Cleaning & Maintenance | 2 (50.0%) | 2 (50.0%) |
| Personal Care & Service | 0 (0.0%) | 1 (100.0%) |
| Total (Category) | 19 (52.8%) | 17 (47.2%) |
| Total (Overall) | 70 (54.7%) | 58 (45.3%) |
Sales and Office Occupations
The most common Sales and Office occupations in Suring are Office & Administration (13 | 10.2%), and Sales & Related (5 | 3.9%).
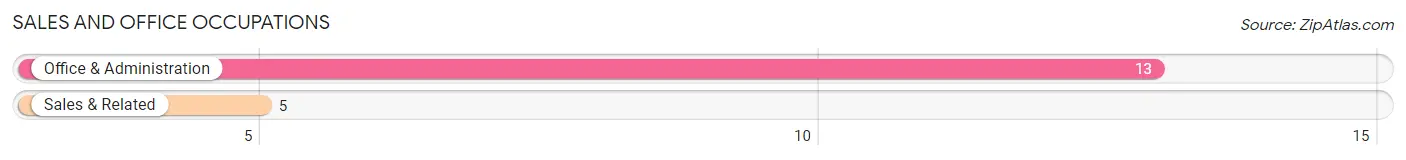
Sales and Office Occupations by Sex

| Occupation | Male | Female |
| Sales & Related | 0 (0.0%) | 5 (100.0%) |
| Office & Administration | 0 (0.0%) | 13 (100.0%) |
| Total (Category) | 0 (0.0%) | 18 (100.0%) |
| Total (Overall) | 70 (54.7%) | 58 (45.3%) |
Natural Resources, Construction and Maintenance Occupations
The most common Natural Resources, Construction and Maintenance occupations in Suring are , and Construction & Extraction (5 | 3.9%).
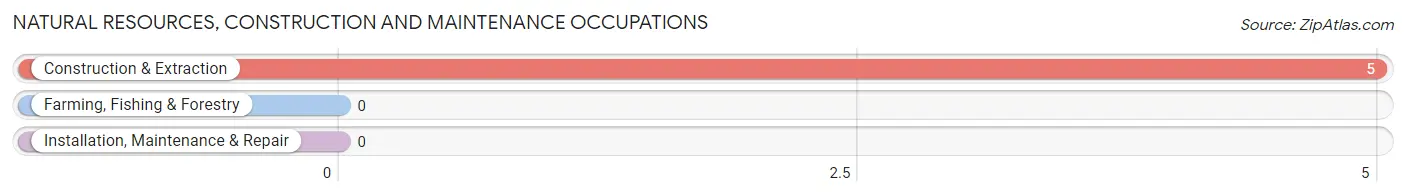
Natural Resources, Construction and Maintenance Occupations by Sex
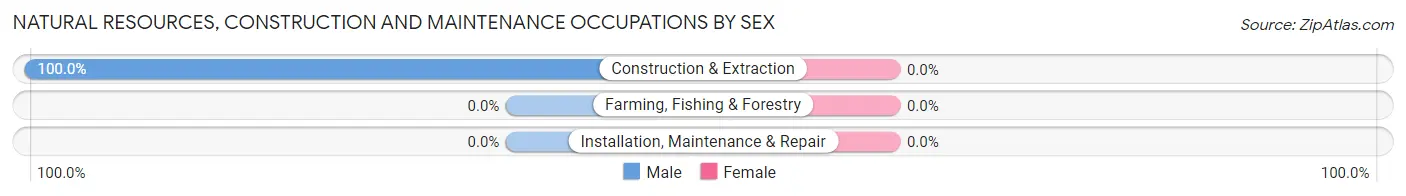
| Occupation | Male | Female |
| Farming, Fishing & Forestry | 0 (0.0%) | 0 (0.0%) |
| Construction & Extraction | 5 (100.0%) | 0 (0.0%) |
| Installation, Maintenance & Repair | 0 (0.0%) | 0 (0.0%) |
| Total (Category) | 5 (100.0%) | 0 (0.0%) |
| Total (Overall) | 70 (54.7%) | 58 (45.3%) |
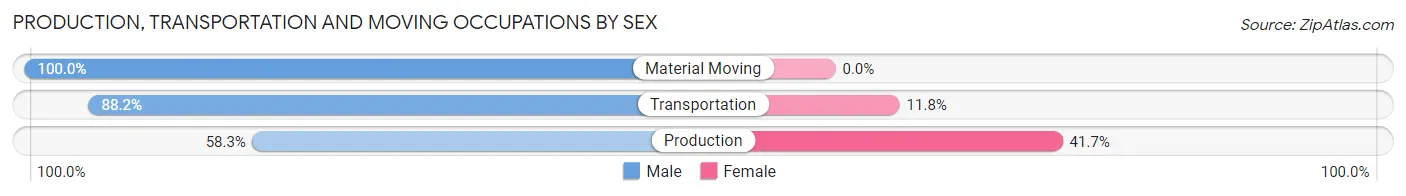
Production, Transportation and Moving Occupations
The most common Production, Transportation and Moving occupations in Suring are Production (24 | 18.8%), Transportation (17 | 13.3%), and Material Moving (1 | 0.8%).
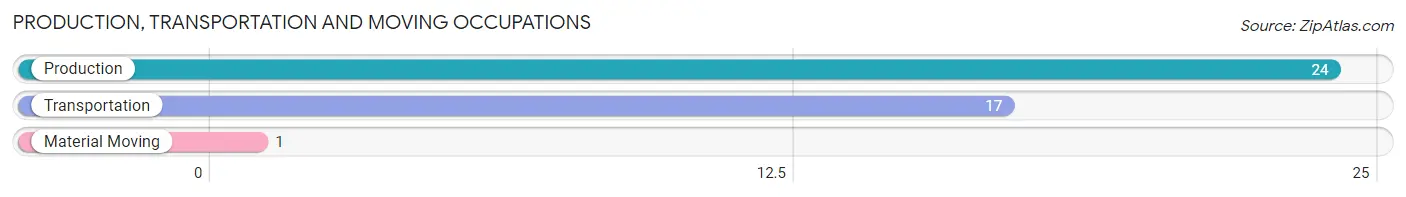
Production, Transportation and Moving Occupations by Sex
| Occupation | Male | Female |
| Production | 14 (58.3%) | 10 (41.7%) |
| Transportation | 15 (88.2%) | 2 (11.8%) |
| Material Moving | 1 (100.0%) | 0 (0.0%) |
| Total (Category) | 30 (71.4%) | 12 (28.6%) |
| Total (Overall) | 70 (54.7%) | 58 (45.3%) |
Employment Industries by Sex in Suring
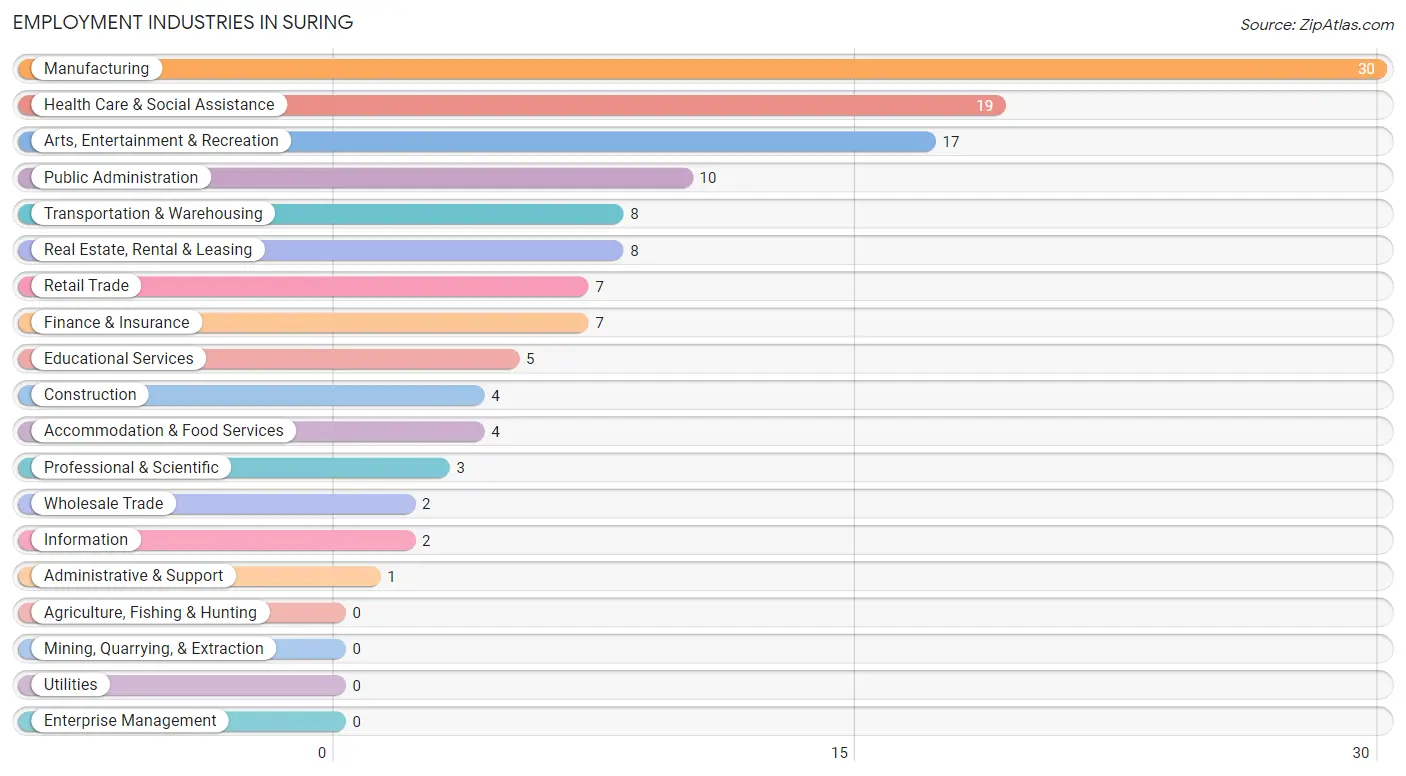
Employment Industries in Suring
The major employment industries in Suring include Manufacturing (30 | 23.4%), Health Care & Social Assistance (19 | 14.8%), Arts, Entertainment & Recreation (17 | 13.3%), Public Administration (10 | 7.8%), and Transportation & Warehousing (8 | 6.2%).
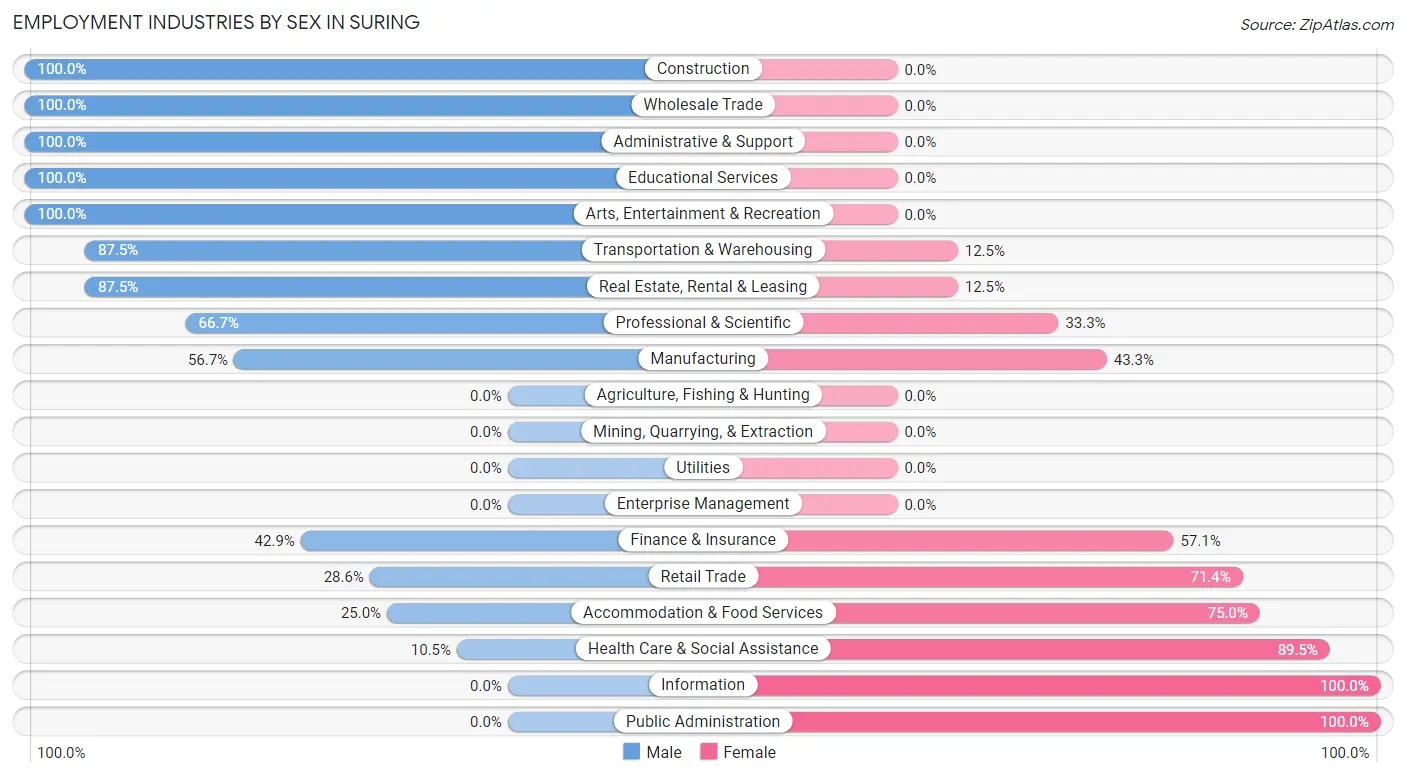
Employment Industries by Sex in Suring
The Suring industries that see more men than women are Construction (100.0%), Wholesale Trade (100.0%), and Administrative & Support (100.0%), whereas the industries that tend to have a higher number of women are Information (100.0%), Public Administration (100.0%), and Health Care & Social Assistance (89.5%).
| Industry | Male | Female |
| Agriculture, Fishing & Hunting | 0 (0.0%) | 0 (0.0%) |
| Mining, Quarrying, & Extraction | 0 (0.0%) | 0 (0.0%) |
| Construction | 4 (100.0%) | 0 (0.0%) |
| Manufacturing | 17 (56.7%) | 13 (43.3%) |
| Wholesale Trade | 2 (100.0%) | 0 (0.0%) |
| Retail Trade | 2 (28.6%) | 5 (71.4%) |
| Transportation & Warehousing | 7 (87.5%) | 1 (12.5%) |
| Utilities | 0 (0.0%) | 0 (0.0%) |
| Information | 0 (0.0%) | 2 (100.0%) |
| Finance & Insurance | 3 (42.9%) | 4 (57.1%) |
| Real Estate, Rental & Leasing | 7 (87.5%) | 1 (12.5%) |
| Professional & Scientific | 2 (66.7%) | 1 (33.3%) |
| Enterprise Management | 0 (0.0%) | 0 (0.0%) |
| Administrative & Support | 1 (100.0%) | 0 (0.0%) |
| Educational Services | 5 (100.0%) | 0 (0.0%) |
| Health Care & Social Assistance | 2 (10.5%) | 17 (89.5%) |
| Arts, Entertainment & Recreation | 17 (100.0%) | 0 (0.0%) |
| Accommodation & Food Services | 1 (25.0%) | 3 (75.0%) |
| Public Administration | 0 (0.0%) | 10 (100.0%) |
| Total | 70 (54.7%) | 58 (45.3%) |
Education in Suring
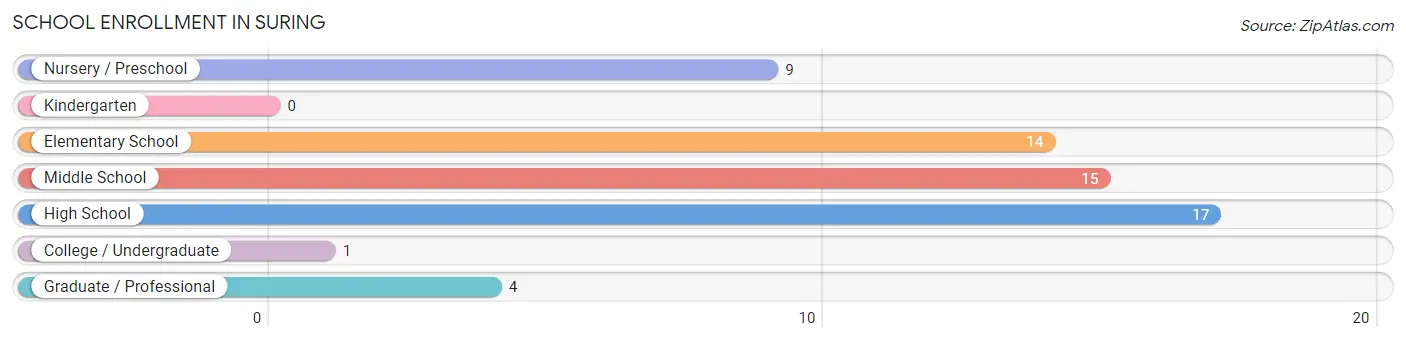
School Enrollment in Suring
The most common levels of schooling among the 60 students in Suring are high school (17 | 28.3%), middle school (15 | 25.0%), and elementary school (14 | 23.3%).
| School Level | # Students | % Students |
| Nursery / Preschool | 9 | 15.0% |
| Kindergarten | 0 | 0.0% |
| Elementary School | 14 | 23.3% |
| Middle School | 15 | 25.0% |
| High School | 17 | 28.3% |
| College / Undergraduate | 1 | 1.7% |
| Graduate / Professional | 4 | 6.7% |
| Total | 60 | 100.0% |
School Enrollment by Age by Funding Source in Suring
Out of a total of 60 students who are enrolled in schools in Suring, 10 (16.7%) attend a private institution, while the remaining 50 (83.3%) are enrolled in public schools. The age group of 3 to 4 year olds has the highest likelihood of being enrolled in private schools, with 9 (100.0% in the age bracket) enrolled. Conversely, the age group of 5 to 9 year old has the lowest likelihood of being enrolled in a private school, with 12 (100.0% in the age bracket) attending a public institution.
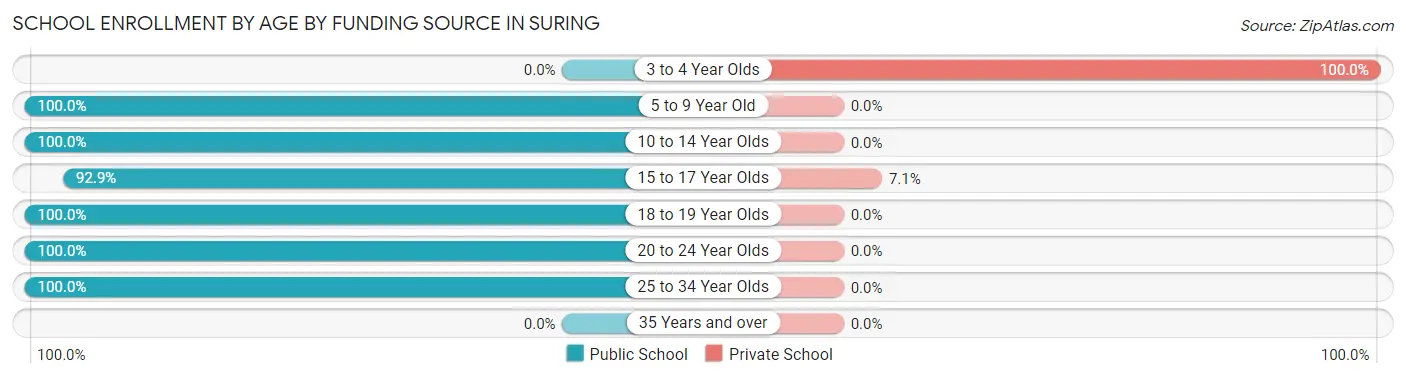
| Age Bracket | Public School | Private School |
| 3 to 4 Year Olds | 0 (0.0%) | 9 (100.0%) |
| 5 to 9 Year Old | 12 (100.0%) | 0 (0.0%) |
| 10 to 14 Year Olds | 17 (100.0%) | 0 (0.0%) |
| 15 to 17 Year Olds | 13 (92.9%) | 1 (7.1%) |
| 18 to 19 Year Olds | 3 (100.0%) | 0 (0.0%) |
| 20 to 24 Year Olds | 3 (100.0%) | 0 (0.0%) |
| 25 to 34 Year Olds | 2 (100.0%) | 0 (0.0%) |
| 35 Years and over | 0 (0.0%) | 0 (0.0%) |
| Total | 50 (83.3%) | 10 (16.7%) |
Educational Attainment by Field of Study in Suring
Business (9 | 30.0%), education (8 | 26.7%), literature & languages (3 | 10.0%), liberal arts & history (3 | 10.0%), and psychology (2 | 6.7%) are the most common fields of study among 30 individuals in Suring who have obtained a bachelor's degree or higher.
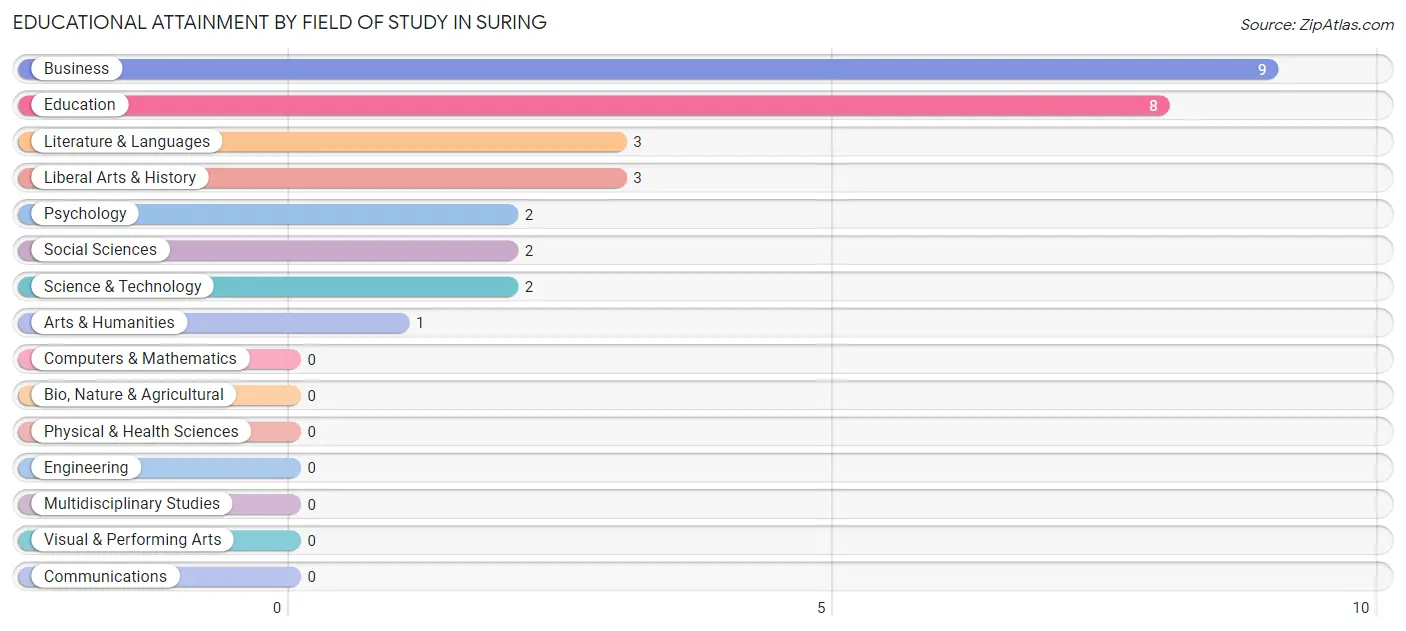
| Field of Study | # Graduates | % Graduates |
| Computers & Mathematics | 0 | 0.0% |
| Bio, Nature & Agricultural | 0 | 0.0% |
| Physical & Health Sciences | 0 | 0.0% |
| Psychology | 2 | 6.7% |
| Social Sciences | 2 | 6.7% |
| Engineering | 0 | 0.0% |
| Multidisciplinary Studies | 0 | 0.0% |
| Science & Technology | 2 | 6.7% |
| Business | 9 | 30.0% |
| Education | 8 | 26.7% |
| Literature & Languages | 3 | 10.0% |
| Liberal Arts & History | 3 | 10.0% |
| Visual & Performing Arts | 0 | 0.0% |
| Communications | 0 | 0.0% |
| Arts & Humanities | 1 | 3.3% |
| Total | 30 | 100.0% |
Transportation & Commute in Suring
Vehicle Availability by Sex in Suring
The most prevalent vehicle ownership categories in Suring are males with 2 vehicles (50, accounting for 71.4%) and females with 2 vehicles (36, making up 90.9%).
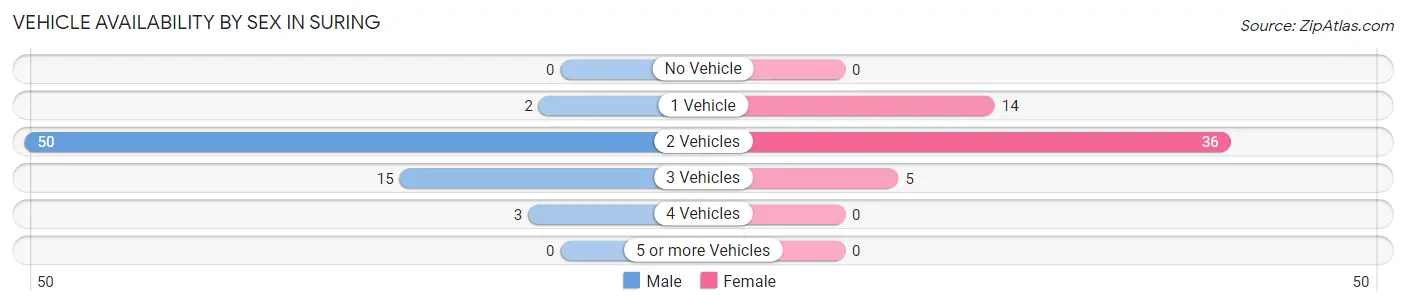
| Vehicles Available | Male | Female |
| No Vehicle | 0 (0.0%) | 0 (0.0%) |
| 1 Vehicle | 2 (2.9%) | 14 (25.5%) |
| 2 Vehicles | 50 (71.4%) | 36 (65.4%) |
| 3 Vehicles | 15 (21.4%) | 5 (9.1%) |
| 4 Vehicles | 3 (4.3%) | 0 (0.0%) |
| 5 or more Vehicles | 0 (0.0%) | 0 (0.0%) |
| Total | 70 (100.0%) | 55 (100.0%) |
Commute Time in Suring
The most frequently occuring commute durations in Suring are 45 to 59 minutes (26 commuters, 21.8%), 25 to 29 minutes (22 commuters, 18.5%), and 10 to 14 minutes (21 commuters, 17.6%).
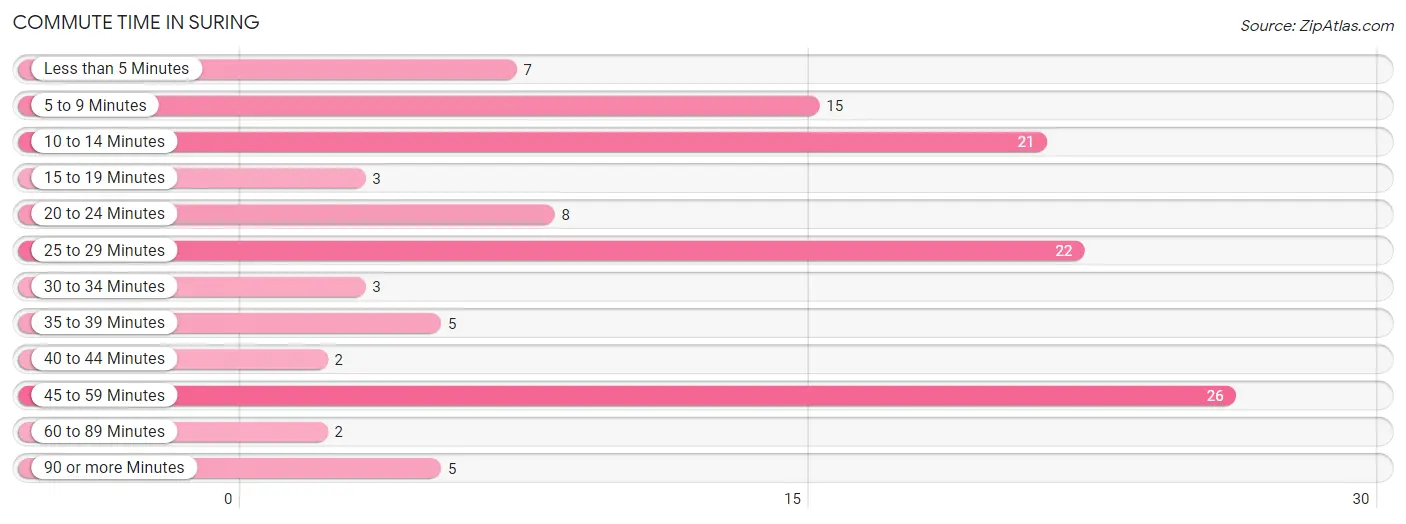
| Commute Time | # Commuters | % Commuters |
| Less than 5 Minutes | 7 | 5.9% |
| 5 to 9 Minutes | 15 | 12.6% |
| 10 to 14 Minutes | 21 | 17.6% |
| 15 to 19 Minutes | 3 | 2.5% |
| 20 to 24 Minutes | 8 | 6.7% |
| 25 to 29 Minutes | 22 | 18.5% |
| 30 to 34 Minutes | 3 | 2.5% |
| 35 to 39 Minutes | 5 | 4.2% |
| 40 to 44 Minutes | 2 | 1.7% |
| 45 to 59 Minutes | 26 | 21.8% |
| 60 to 89 Minutes | 2 | 1.7% |
| 90 or more Minutes | 5 | 4.2% |
Commute Time by Sex in Suring
The most common commute times in Suring are 10 to 14 minutes (19 commuters, 27.1%) for males and 5 to 9 minutes (9 commuters, 18.4%) for females.
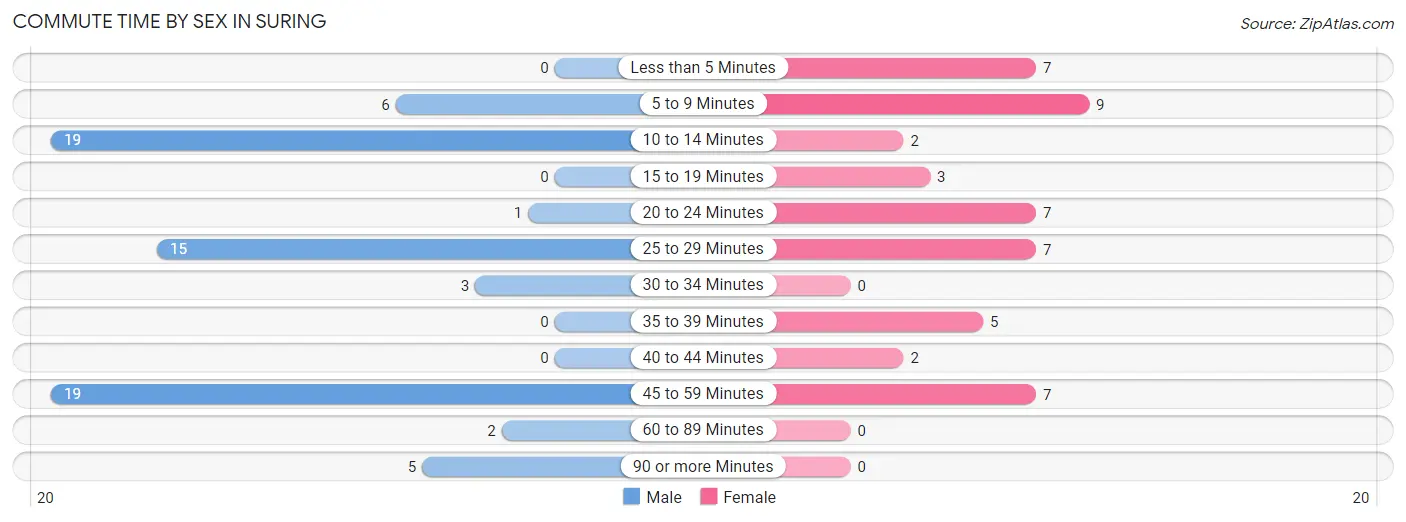
| Commute Time | Male | Female |
| Less than 5 Minutes | 0 (0.0%) | 7 (14.3%) |
| 5 to 9 Minutes | 6 (8.6%) | 9 (18.4%) |
| 10 to 14 Minutes | 19 (27.1%) | 2 (4.1%) |
| 15 to 19 Minutes | 0 (0.0%) | 3 (6.1%) |
| 20 to 24 Minutes | 1 (1.4%) | 7 (14.3%) |
| 25 to 29 Minutes | 15 (21.4%) | 7 (14.3%) |
| 30 to 34 Minutes | 3 (4.3%) | 0 (0.0%) |
| 35 to 39 Minutes | 0 (0.0%) | 5 (10.2%) |
| 40 to 44 Minutes | 0 (0.0%) | 2 (4.1%) |
| 45 to 59 Minutes | 19 (27.1%) | 7 (14.3%) |
| 60 to 89 Minutes | 2 (2.9%) | 0 (0.0%) |
| 90 or more Minutes | 5 (7.1%) | 0 (0.0%) |
Time of Departure to Work by Sex in Suring
The most frequent times of departure to work in Suring are 8:30 AM to 8:59 AM (17, 24.3%) for males and 7:30 AM to 7:59 AM (13, 26.5%) for females.
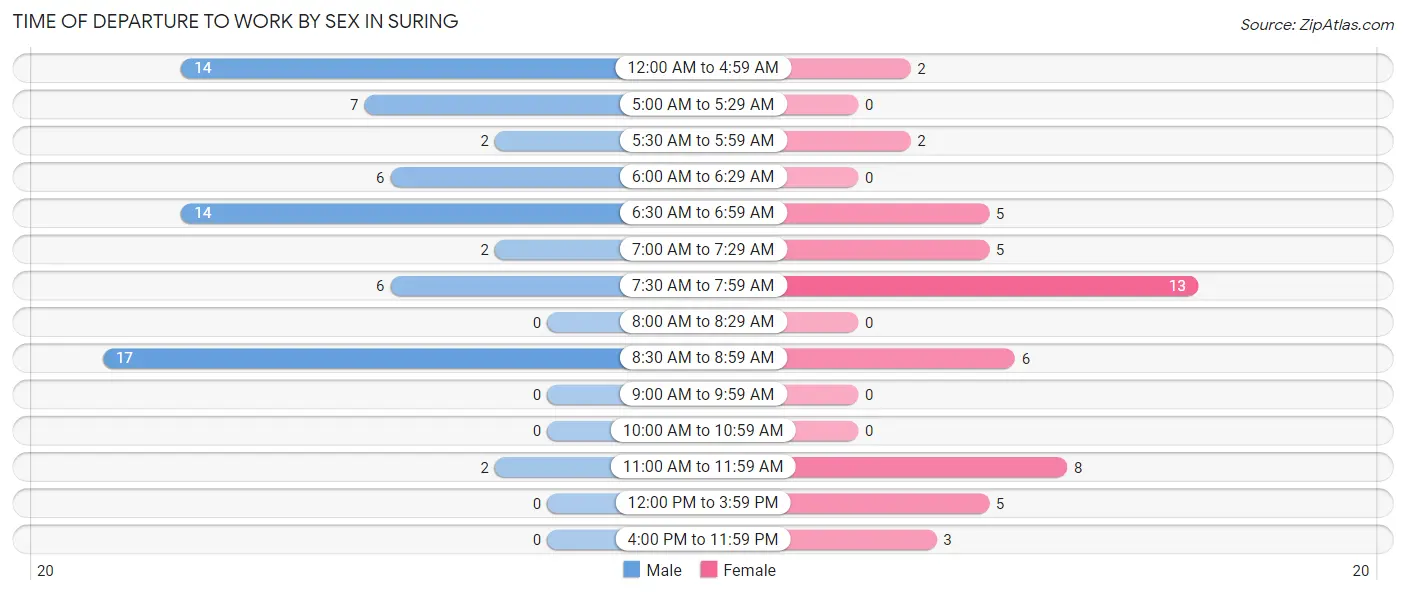
| Time of Departure | Male | Female |
| 12:00 AM to 4:59 AM | 14 (20.0%) | 2 (4.1%) |
| 5:00 AM to 5:29 AM | 7 (10.0%) | 0 (0.0%) |
| 5:30 AM to 5:59 AM | 2 (2.9%) | 2 (4.1%) |
| 6:00 AM to 6:29 AM | 6 (8.6%) | 0 (0.0%) |
| 6:30 AM to 6:59 AM | 14 (20.0%) | 5 (10.2%) |
| 7:00 AM to 7:29 AM | 2 (2.9%) | 5 (10.2%) |
| 7:30 AM to 7:59 AM | 6 (8.6%) | 13 (26.5%) |
| 8:00 AM to 8:29 AM | 0 (0.0%) | 0 (0.0%) |
| 8:30 AM to 8:59 AM | 17 (24.3%) | 6 (12.2%) |
| 9:00 AM to 9:59 AM | 0 (0.0%) | 0 (0.0%) |
| 10:00 AM to 10:59 AM | 0 (0.0%) | 0 (0.0%) |
| 11:00 AM to 11:59 AM | 2 (2.9%) | 8 (16.3%) |
| 12:00 PM to 3:59 PM | 0 (0.0%) | 5 (10.2%) |
| 4:00 PM to 11:59 PM | 0 (0.0%) | 3 (6.1%) |
| Total | 70 (100.0%) | 49 (100.0%) |
Housing Occupancy in Suring
Occupancy by Ownership in Suring
Of the total 166 dwellings in Suring, owner-occupied units account for 124 (74.7%), while renter-occupied units make up 42 (25.3%).
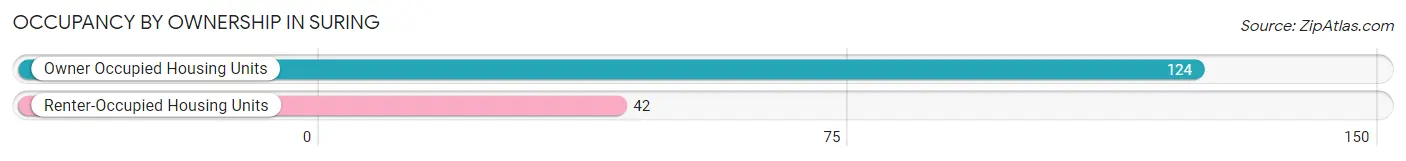
| Occupancy | # Housing Units | % Housing Units |
| Owner Occupied Housing Units | 124 | 74.7% |
| Renter-Occupied Housing Units | 42 | 25.3% |
| Total Occupied Housing Units | 166 | 100.0% |
Occupancy by Household Size in Suring
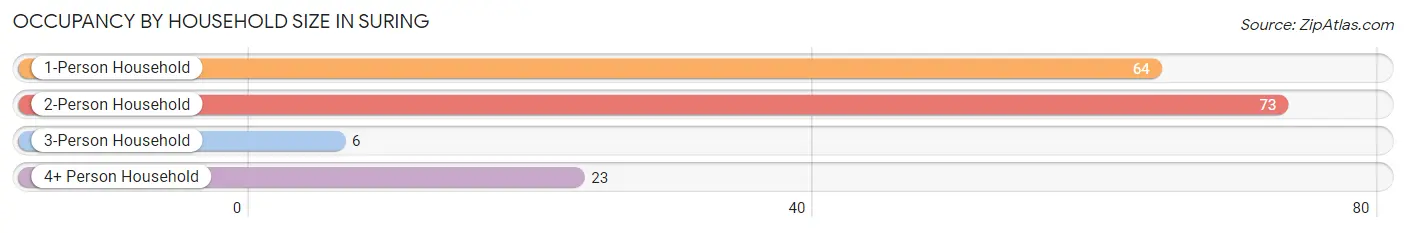
| Household Size | # Housing Units | % Housing Units |
| 1-Person Household | 64 | 38.6% |
| 2-Person Household | 73 | 44.0% |
| 3-Person Household | 6 | 3.6% |
| 4+ Person Household | 23 | 13.9% |
| Total Housing Units | 166 | 100.0% |
Occupancy by Ownership by Household Size in Suring
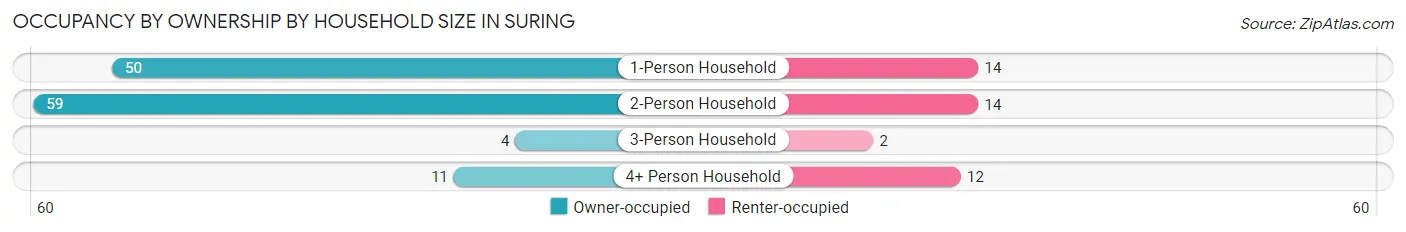
| Household Size | Owner-occupied | Renter-occupied |
| 1-Person Household | 50 (78.1%) | 14 (21.9%) |
| 2-Person Household | 59 (80.8%) | 14 (19.2%) |
| 3-Person Household | 4 (66.7%) | 2 (33.3%) |
| 4+ Person Household | 11 (47.8%) | 12 (52.2%) |
| Total Housing Units | 124 (74.7%) | 42 (25.3%) |
Occupancy by Educational Attainment in Suring
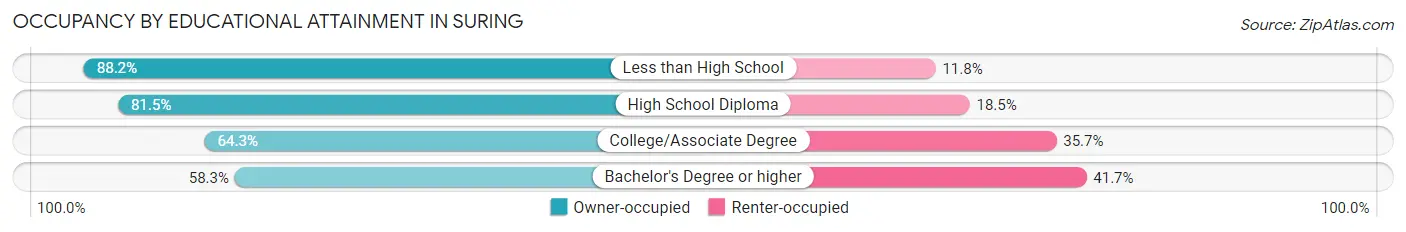
| Household Size | Owner-occupied | Renter-occupied |
| Less than High School | 15 (88.2%) | 2 (11.8%) |
| High School Diploma | 66 (81.5%) | 15 (18.5%) |
| College/Associate Degree | 36 (64.3%) | 20 (35.7%) |
| Bachelor's Degree or higher | 7 (58.3%) | 5 (41.7%) |
Occupancy by Age of Householder in Suring
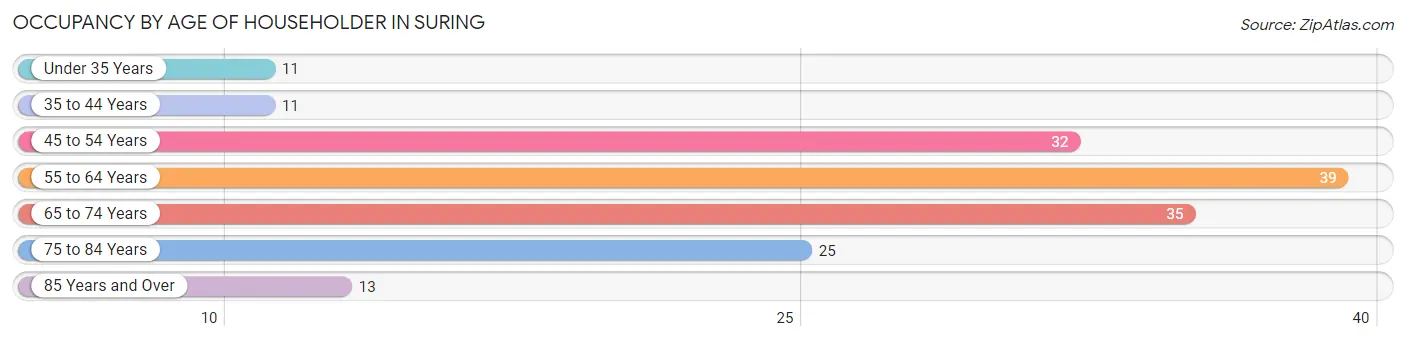
| Age Bracket | # Households | % Households |
| Under 35 Years | 11 | 6.6% |
| 35 to 44 Years | 11 | 6.6% |
| 45 to 54 Years | 32 | 19.3% |
| 55 to 64 Years | 39 | 23.5% |
| 65 to 74 Years | 35 | 21.1% |
| 75 to 84 Years | 25 | 15.1% |
| 85 Years and Over | 13 | 7.8% |
| Total | 166 | 100.0% |
Housing Finances in Suring
Median Income by Occupancy in Suring
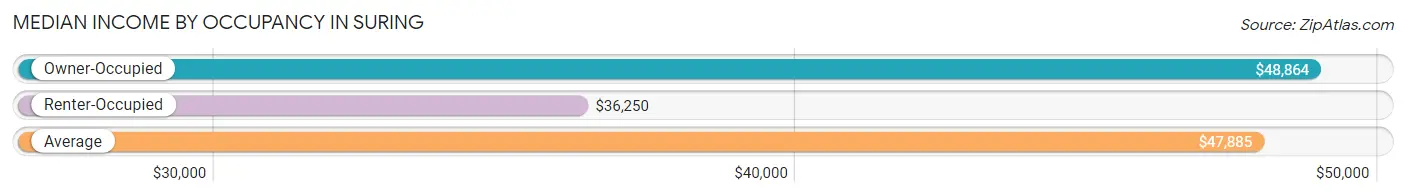
| Occupancy Type | # Households | Median Income |
| Owner-Occupied | 124 (74.7%) | $48,864 |
| Renter-Occupied | 42 (25.3%) | $36,250 |
| Average | 166 (100.0%) | $47,885 |
Occupancy by Householder Income Bracket in Suring
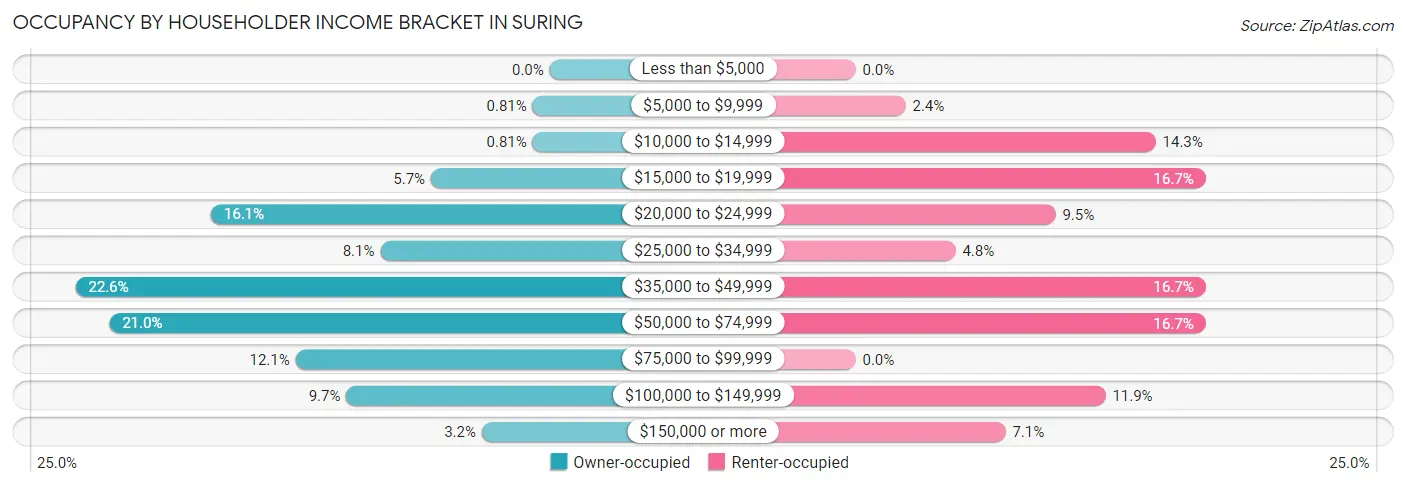
| Income Bracket | Owner-occupied | Renter-occupied |
| Less than $5,000 | 0 (0.0%) | 0 (0.0%) |
| $5,000 to $9,999 | 1 (0.8%) | 1 (2.4%) |
| $10,000 to $14,999 | 1 (0.8%) | 6 (14.3%) |
| $15,000 to $19,999 | 7 (5.7%) | 7 (16.7%) |
| $20,000 to $24,999 | 20 (16.1%) | 4 (9.5%) |
| $25,000 to $34,999 | 10 (8.1%) | 2 (4.8%) |
| $35,000 to $49,999 | 28 (22.6%) | 7 (16.7%) |
| $50,000 to $74,999 | 26 (21.0%) | 7 (16.7%) |
| $75,000 to $99,999 | 15 (12.1%) | 0 (0.0%) |
| $100,000 to $149,999 | 12 (9.7%) | 5 (11.9%) |
| $150,000 or more | 4 (3.2%) | 3 (7.1%) |
| Total | 124 (100.0%) | 42 (100.0%) |
Monthly Housing Cost Tiers in Suring
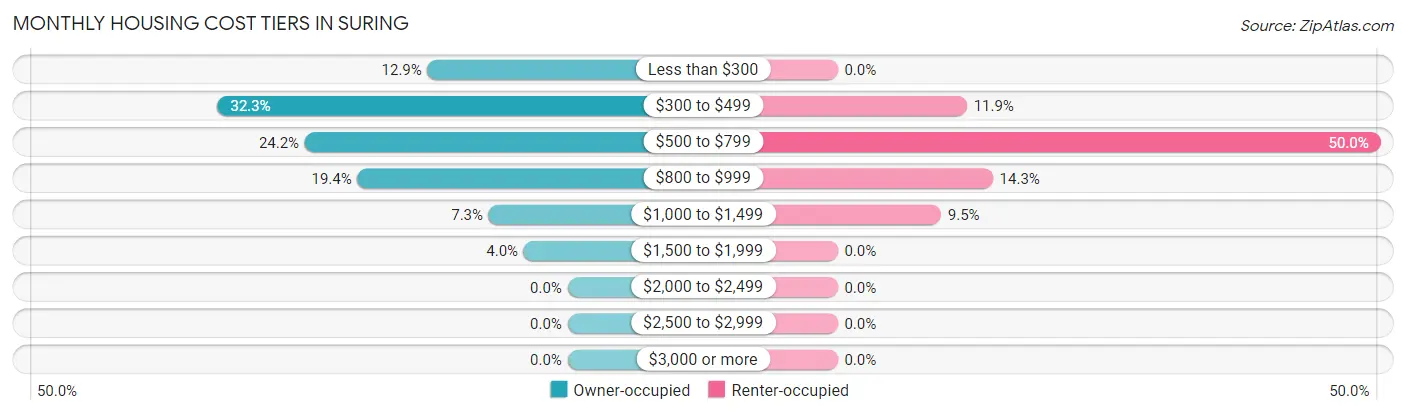
| Monthly Cost | Owner-occupied | Renter-occupied |
| Less than $300 | 16 (12.9%) | 0 (0.0%) |
| $300 to $499 | 40 (32.3%) | 5 (11.9%) |
| $500 to $799 | 30 (24.2%) | 21 (50.0%) |
| $800 to $999 | 24 (19.4%) | 6 (14.3%) |
| $1,000 to $1,499 | 9 (7.3%) | 4 (9.5%) |
| $1,500 to $1,999 | 5 (4.0%) | 0 (0.0%) |
| $2,000 to $2,499 | 0 (0.0%) | 0 (0.0%) |
| $2,500 to $2,999 | 0 (0.0%) | 0 (0.0%) |
| $3,000 or more | 0 (0.0%) | 0 (0.0%) |
| Total | 124 (100.0%) | 42 (100.0%) |
Physical Housing Characteristics in Suring
Housing Structures in Suring
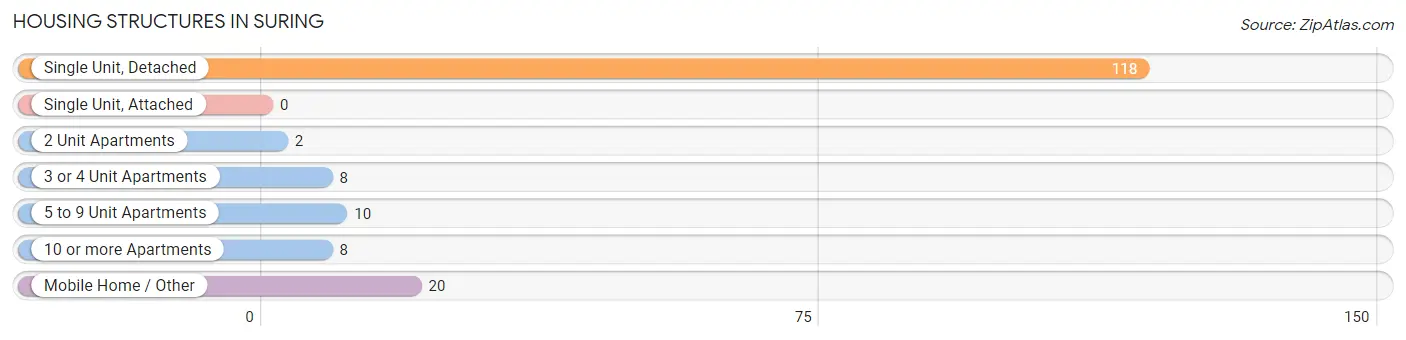
| Structure Type | # Housing Units | % Housing Units |
| Single Unit, Detached | 118 | 71.1% |
| Single Unit, Attached | 0 | 0.0% |
| 2 Unit Apartments | 2 | 1.2% |
| 3 or 4 Unit Apartments | 8 | 4.8% |
| 5 to 9 Unit Apartments | 10 | 6.0% |
| 10 or more Apartments | 8 | 4.8% |
| Mobile Home / Other | 20 | 12.0% |
| Total | 166 | 100.0% |
Housing Structures by Occupancy in Suring
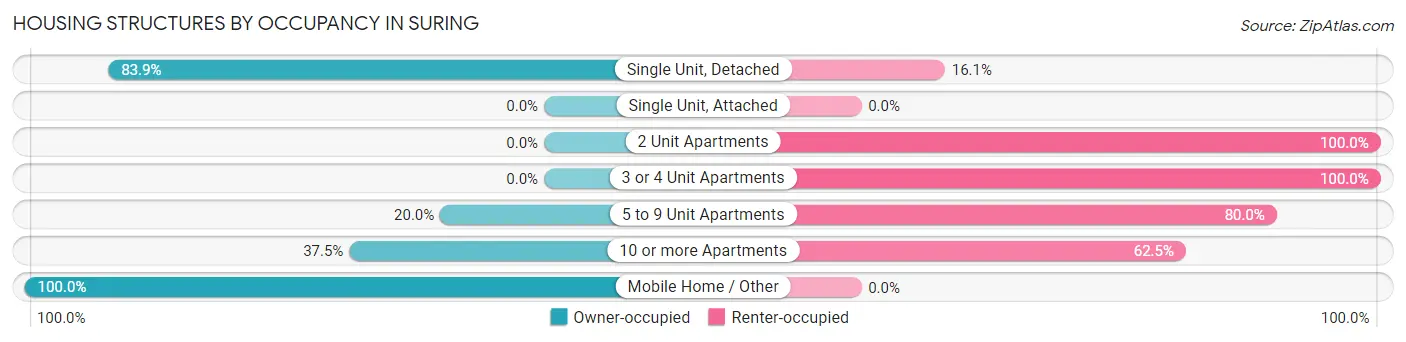
| Structure Type | Owner-occupied | Renter-occupied |
| Single Unit, Detached | 99 (83.9%) | 19 (16.1%) |
| Single Unit, Attached | 0 (0.0%) | 0 (0.0%) |
| 2 Unit Apartments | 0 (0.0%) | 2 (100.0%) |
| 3 or 4 Unit Apartments | 0 (0.0%) | 8 (100.0%) |
| 5 to 9 Unit Apartments | 2 (20.0%) | 8 (80.0%) |
| 10 or more Apartments | 3 (37.5%) | 5 (62.5%) |
| Mobile Home / Other | 20 (100.0%) | 0 (0.0%) |
| Total | 124 (74.7%) | 42 (25.3%) |
Housing Structures by Number of Rooms in Suring
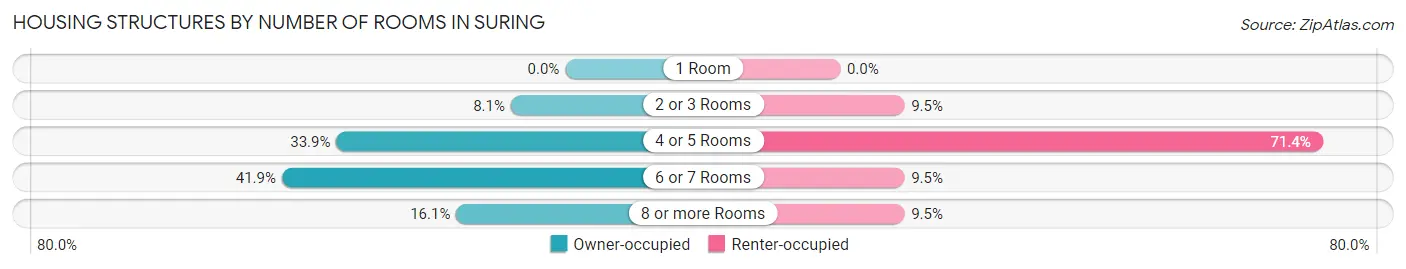
| Number of Rooms | Owner-occupied | Renter-occupied |
| 1 Room | 0 (0.0%) | 0 (0.0%) |
| 2 or 3 Rooms | 10 (8.1%) | 4 (9.5%) |
| 4 or 5 Rooms | 42 (33.9%) | 30 (71.4%) |
| 6 or 7 Rooms | 52 (41.9%) | 4 (9.5%) |
| 8 or more Rooms | 20 (16.1%) | 4 (9.5%) |
| Total | 124 (100.0%) | 42 (100.0%) |
Housing Structure by Heating Type in Suring
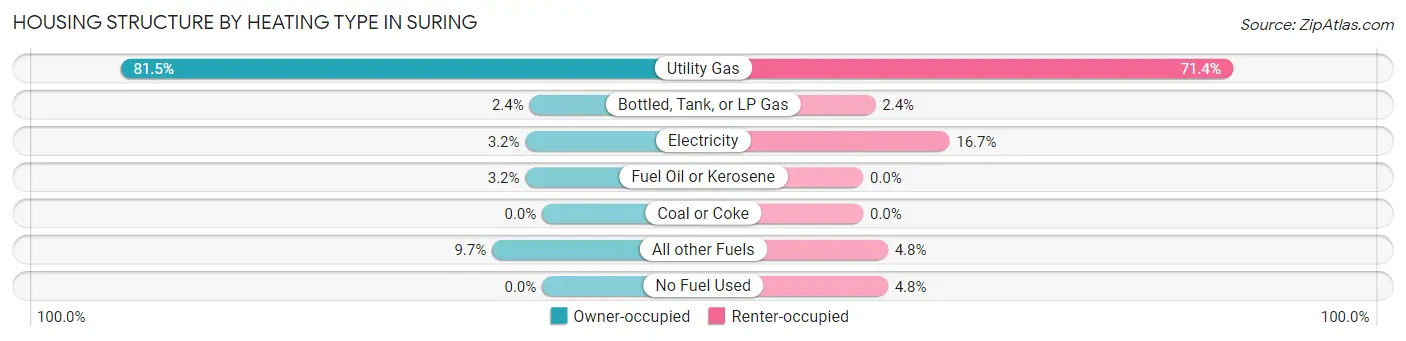
| Heating Type | Owner-occupied | Renter-occupied |
| Utility Gas | 101 (81.5%) | 30 (71.4%) |
| Bottled, Tank, or LP Gas | 3 (2.4%) | 1 (2.4%) |
| Electricity | 4 (3.2%) | 7 (16.7%) |
| Fuel Oil or Kerosene | 4 (3.2%) | 0 (0.0%) |
| Coal or Coke | 0 (0.0%) | 0 (0.0%) |
| All other Fuels | 12 (9.7%) | 2 (4.8%) |
| No Fuel Used | 0 (0.0%) | 2 (4.8%) |
| Total | 124 (100.0%) | 42 (100.0%) |
Household Vehicle Usage in Suring
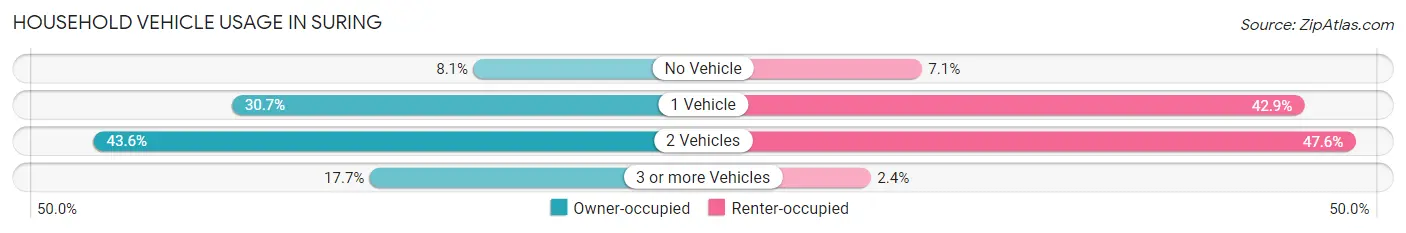
| Vehicles per Household | Owner-occupied | Renter-occupied |
| No Vehicle | 10 (8.1%) | 3 (7.1%) |
| 1 Vehicle | 38 (30.6%) | 18 (42.9%) |
| 2 Vehicles | 54 (43.5%) | 20 (47.6%) |
| 3 or more Vehicles | 22 (17.7%) | 1 (2.4%) |
| Total | 124 (100.0%) | 42 (100.0%) |
Real Estate & Mortgages in Suring
Real Estate and Mortgage Overview in Suring
| Characteristic | Without Mortgage | With Mortgage |
| Housing Units | 74 | 50 |
| Median Property Value | $66,200 | $85,900 |
| Median Household Income | $42,500 | $2 |
| Monthly Housing Costs | $372 | $0 |
| Real Estate Taxes | $1,355 | $0 |
Property Value by Mortgage Status in Suring
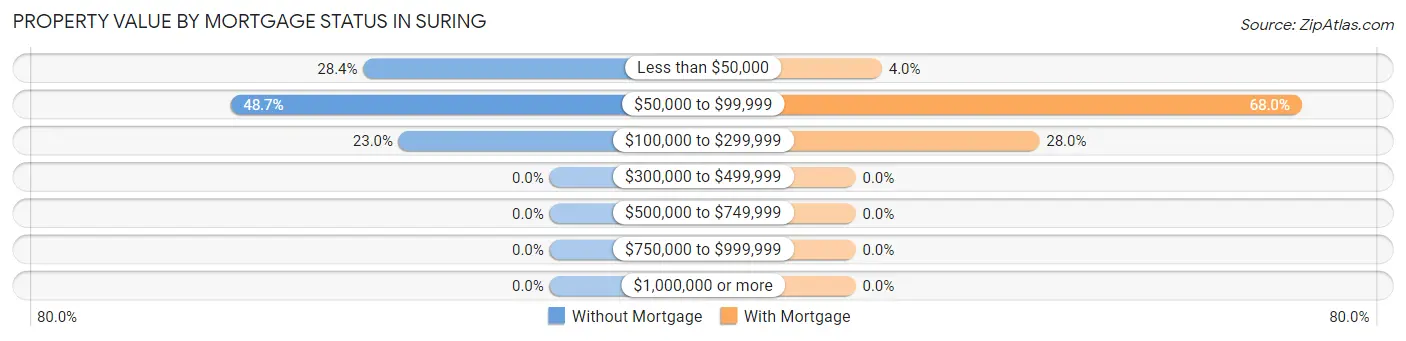
| Property Value | Without Mortgage | With Mortgage |
| Less than $50,000 | 21 (28.4%) | 2 (4.0%) |
| $50,000 to $99,999 | 36 (48.6%) | 34 (68.0%) |
| $100,000 to $299,999 | 17 (23.0%) | 14 (28.0%) |
| $300,000 to $499,999 | 0 (0.0%) | 0 (0.0%) |
| $500,000 to $749,999 | 0 (0.0%) | 0 (0.0%) |
| $750,000 to $999,999 | 0 (0.0%) | 0 (0.0%) |
| $1,000,000 or more | 0 (0.0%) | 0 (0.0%) |
| Total | 74 (100.0%) | 50 (100.0%) |
Household Income by Mortgage Status in Suring
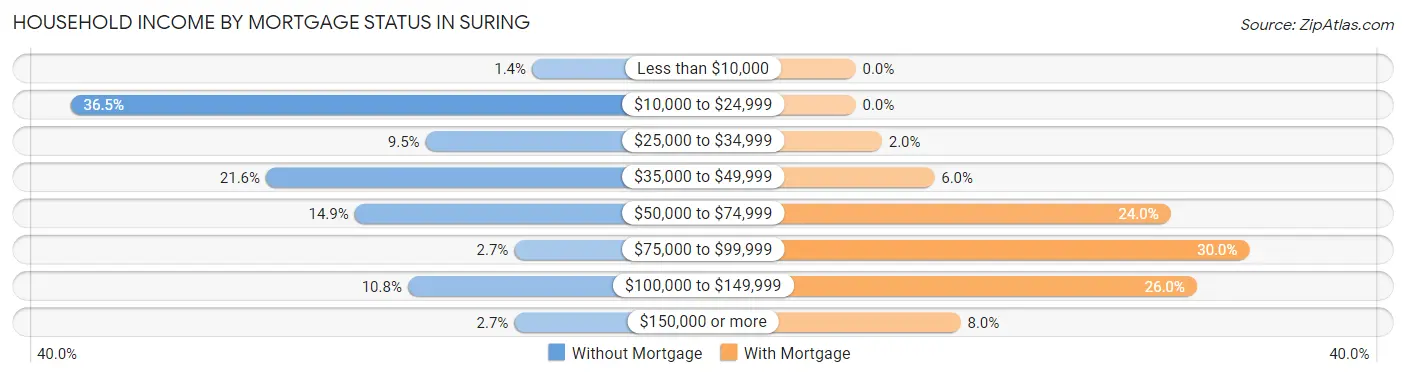
| Household Income | Without Mortgage | With Mortgage |
| Less than $10,000 | 1 (1.3%) | 0 (0.0%) |
| $10,000 to $24,999 | 27 (36.5%) | 0 (0.0%) |
| $25,000 to $34,999 | 7 (9.5%) | 1 (2.0%) |
| $35,000 to $49,999 | 16 (21.6%) | 3 (6.0%) |
| $50,000 to $74,999 | 11 (14.9%) | 12 (24.0%) |
| $75,000 to $99,999 | 2 (2.7%) | 15 (30.0%) |
| $100,000 to $149,999 | 8 (10.8%) | 13 (26.0%) |
| $150,000 or more | 2 (2.7%) | 4 (8.0%) |
| Total | 74 (100.0%) | 50 (100.0%) |
Property Value to Household Income Ratio in Suring
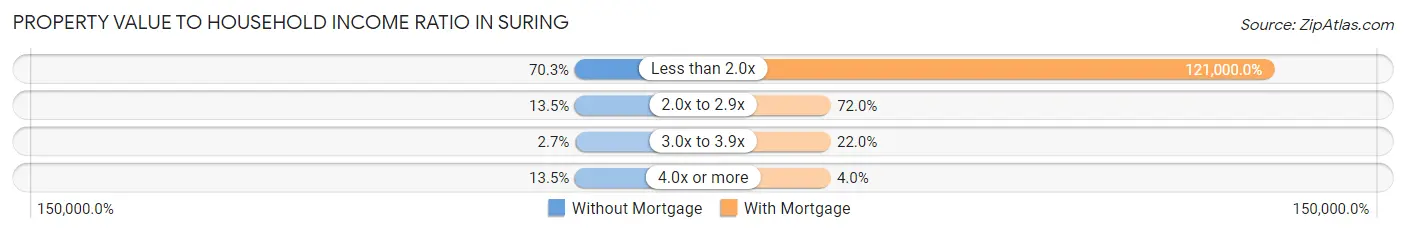
| Value-to-Income Ratio | Without Mortgage | With Mortgage |
| Less than 2.0x | 52 (70.3%) | 60,500 (121,000.0%) |
| 2.0x to 2.9x | 10 (13.5%) | 36 (72.0%) |
| 3.0x to 3.9x | 2 (2.7%) | 11 (22.0%) |
| 4.0x or more | 10 (13.5%) | 2 (4.0%) |
| Total | 74 (100.0%) | 50 (100.0%) |
Real Estate Taxes by Mortgage Status in Suring
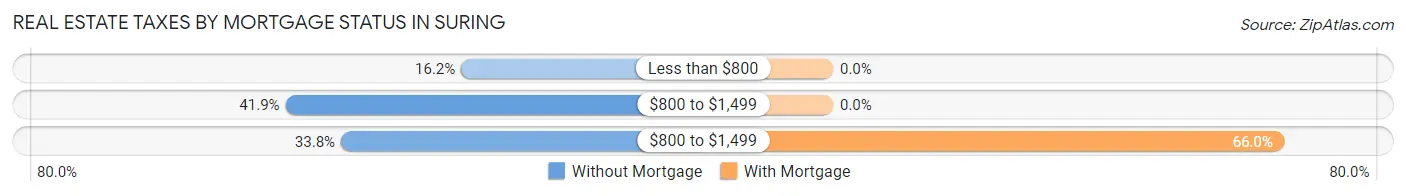
| Property Taxes | Without Mortgage | With Mortgage |
| Less than $800 | 12 (16.2%) | 0 (0.0%) |
| $800 to $1,499 | 31 (41.9%) | 0 (0.0%) |
| $800 to $1,499 | 25 (33.8%) | 33 (66.0%) |
| Total | 74 (100.0%) | 50 (100.0%) |
Health & Disability in Suring
Health Insurance Coverage by Age in Suring
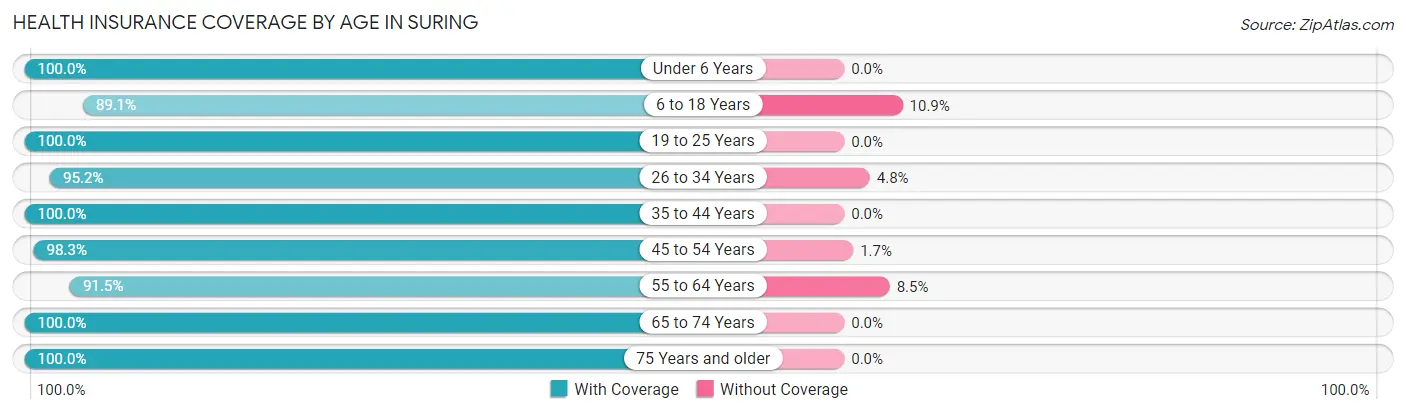
| Age Bracket | With Coverage | Without Coverage |
| Under 6 Years | 16 (100.0%) | 0 (0.0%) |
| 6 to 18 Years | 41 (89.1%) | 5 (10.9%) |
| 19 to 25 Years | 33 (100.0%) | 0 (0.0%) |
| 26 to 34 Years | 20 (95.2%) | 1 (4.8%) |
| 35 to 44 Years | 15 (100.0%) | 0 (0.0%) |
| 45 to 54 Years | 59 (98.3%) | 1 (1.7%) |
| 55 to 64 Years | 54 (91.5%) | 5 (8.5%) |
| 65 to 74 Years | 47 (100.0%) | 0 (0.0%) |
| 75 Years and older | 54 (100.0%) | 0 (0.0%) |
| Total | 339 (96.6%) | 12 (3.4%) |
Health Insurance Coverage by Citizenship Status in Suring
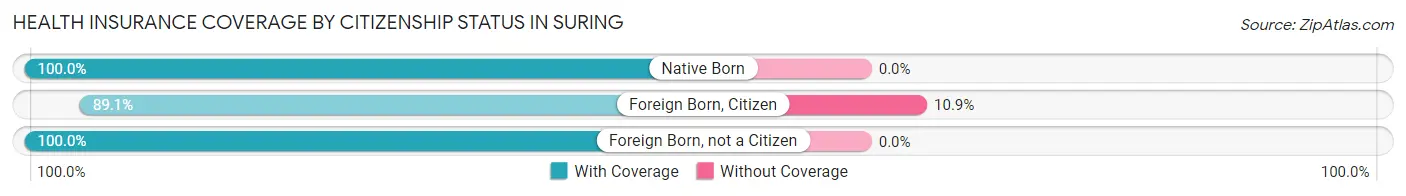
| Citizenship Status | With Coverage | Without Coverage |
| Native Born | 16 (100.0%) | 0 (0.0%) |
| Foreign Born, Citizen | 41 (89.1%) | 5 (10.9%) |
| Foreign Born, not a Citizen | 33 (100.0%) | 0 (0.0%) |
Health Insurance Coverage by Household Income in Suring
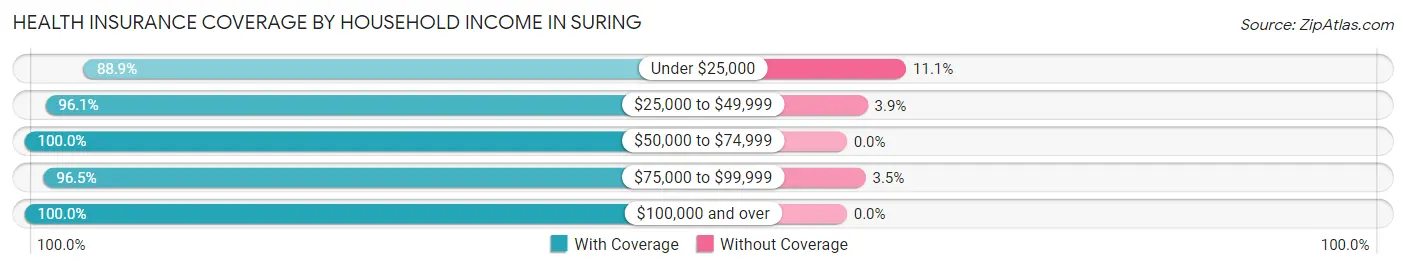
| Household Income | With Coverage | Without Coverage |
| Under $25,000 | 56 (88.9%) | 7 (11.1%) |
| $25,000 to $49,999 | 74 (96.1%) | 3 (3.9%) |
| $50,000 to $74,999 | 73 (100.0%) | 0 (0.0%) |
| $75,000 to $99,999 | 55 (96.5%) | 2 (3.5%) |
| $100,000 and over | 81 (100.0%) | 0 (0.0%) |
Public vs Private Health Insurance Coverage by Age in Suring
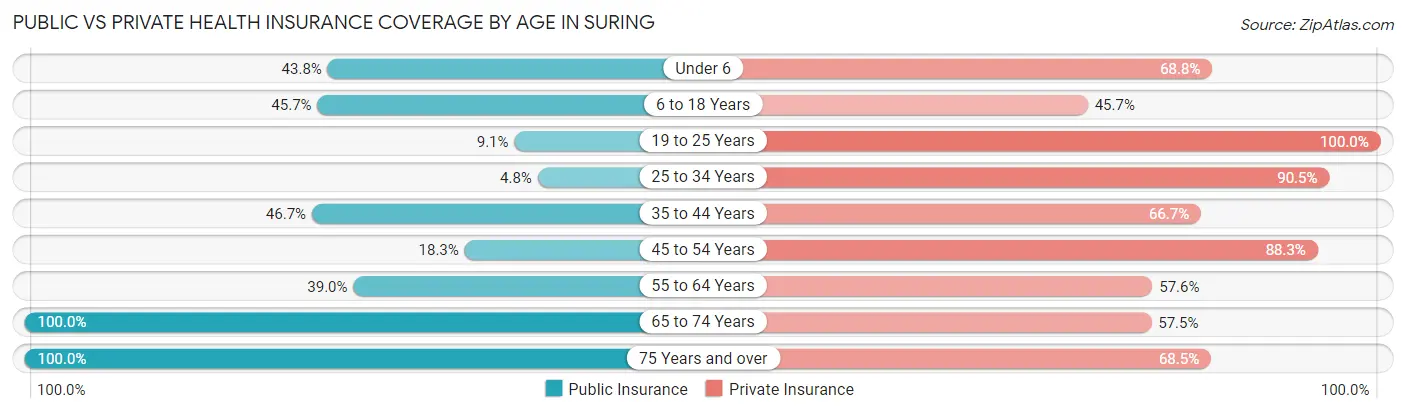
| Age Bracket | Public Insurance | Private Insurance |
| Under 6 | 7 (43.8%) | 11 (68.8%) |
| 6 to 18 Years | 21 (45.7%) | 21 (45.7%) |
| 19 to 25 Years | 3 (9.1%) | 33 (100.0%) |
| 25 to 34 Years | 1 (4.8%) | 19 (90.5%) |
| 35 to 44 Years | 7 (46.7%) | 10 (66.7%) |
| 45 to 54 Years | 11 (18.3%) | 53 (88.3%) |
| 55 to 64 Years | 23 (39.0%) | 34 (57.6%) |
| 65 to 74 Years | 47 (100.0%) | 27 (57.5%) |
| 75 Years and over | 54 (100.0%) | 37 (68.5%) |
| Total | 174 (49.6%) | 245 (69.8%) |
Disability Status by Sex by Age in Suring
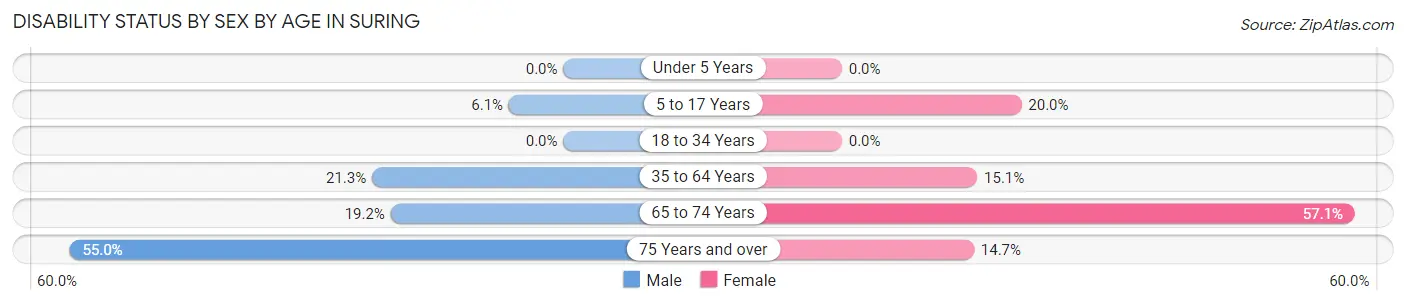
| Age Bracket | Male | Female |
| Under 5 Years | 0 (0.0%) | 0 (0.0%) |
| 5 to 17 Years | 2 (6.1%) | 2 (20.0%) |
| 18 to 34 Years | 0 (0.0%) | 0 (0.0%) |
| 35 to 64 Years | 13 (21.3%) | 11 (15.1%) |
| 65 to 74 Years | 5 (19.2%) | 12 (57.1%) |
| 75 Years and over | 11 (55.0%) | 5 (14.7%) |
Disability Class by Sex by Age in Suring
Disability Class: Hearing Difficulty
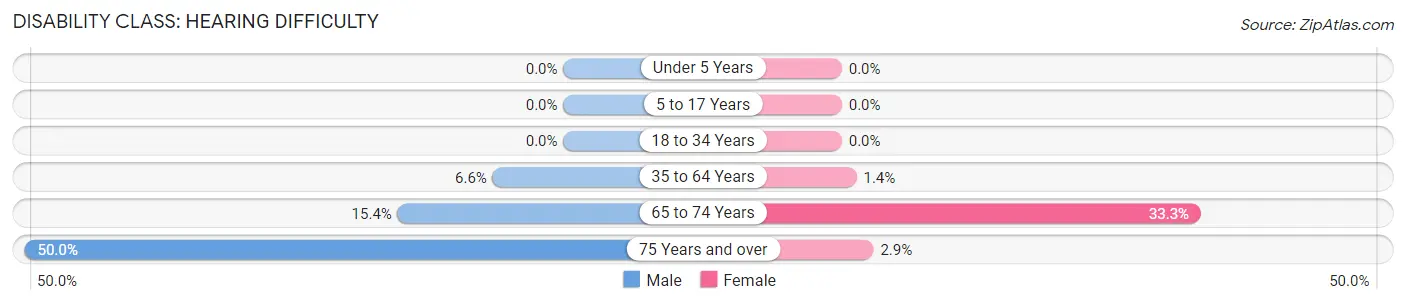
| Age Bracket | Male | Female |
| Under 5 Years | 0 (0.0%) | 0 (0.0%) |
| 5 to 17 Years | 0 (0.0%) | 0 (0.0%) |
| 18 to 34 Years | 0 (0.0%) | 0 (0.0%) |
| 35 to 64 Years | 4 (6.6%) | 1 (1.4%) |
| 65 to 74 Years | 4 (15.4%) | 7 (33.3%) |
| 75 Years and over | 10 (50.0%) | 1 (2.9%) |
Disability Class: Vision Difficulty
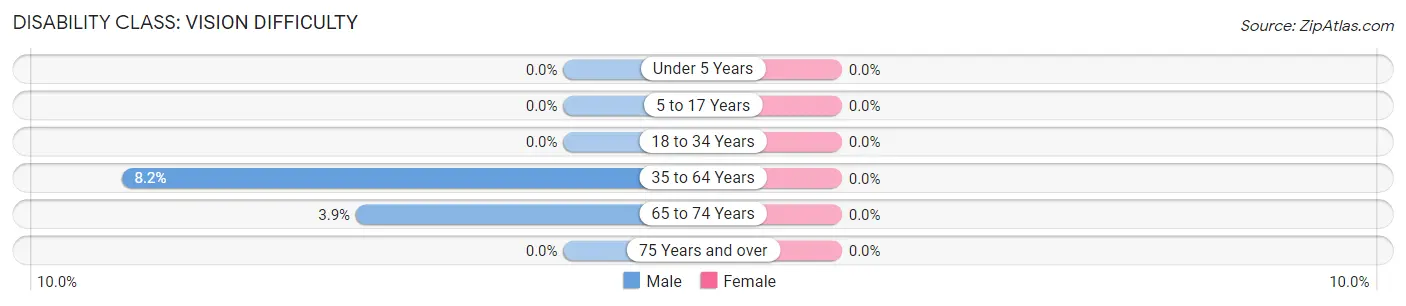
| Age Bracket | Male | Female |
| Under 5 Years | 0 (0.0%) | 0 (0.0%) |
| 5 to 17 Years | 0 (0.0%) | 0 (0.0%) |
| 18 to 34 Years | 0 (0.0%) | 0 (0.0%) |
| 35 to 64 Years | 5 (8.2%) | 0 (0.0%) |
| 65 to 74 Years | 1 (3.8%) | 0 (0.0%) |
| 75 Years and over | 0 (0.0%) | 0 (0.0%) |
Disability Class: Cognitive Difficulty
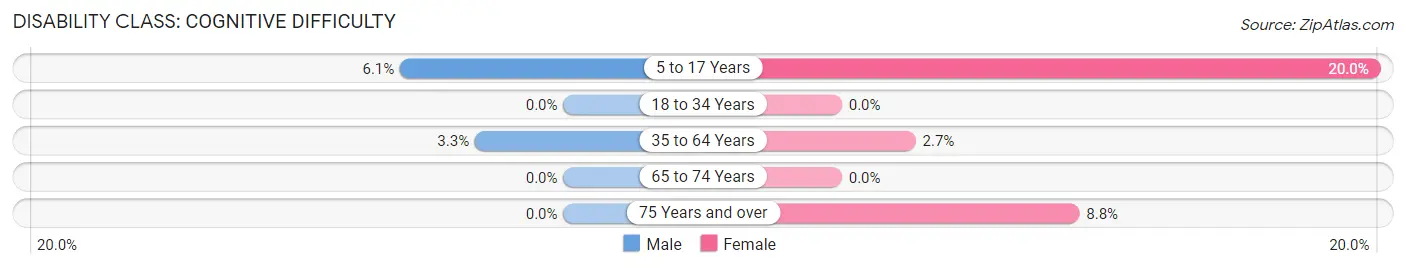
| Age Bracket | Male | Female |
| 5 to 17 Years | 2 (6.1%) | 2 (20.0%) |
| 18 to 34 Years | 0 (0.0%) | 0 (0.0%) |
| 35 to 64 Years | 2 (3.3%) | 2 (2.7%) |
| 65 to 74 Years | 0 (0.0%) | 0 (0.0%) |
| 75 Years and over | 0 (0.0%) | 3 (8.8%) |
Disability Class: Ambulatory Difficulty
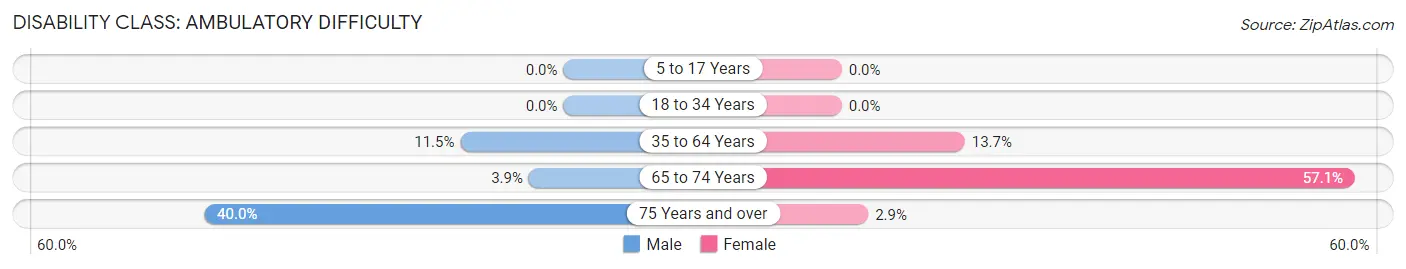
| Age Bracket | Male | Female |
| 5 to 17 Years | 0 (0.0%) | 0 (0.0%) |
| 18 to 34 Years | 0 (0.0%) | 0 (0.0%) |
| 35 to 64 Years | 7 (11.5%) | 10 (13.7%) |
| 65 to 74 Years | 1 (3.8%) | 12 (57.1%) |
| 75 Years and over | 8 (40.0%) | 1 (2.9%) |
Disability Class: Self-Care Difficulty
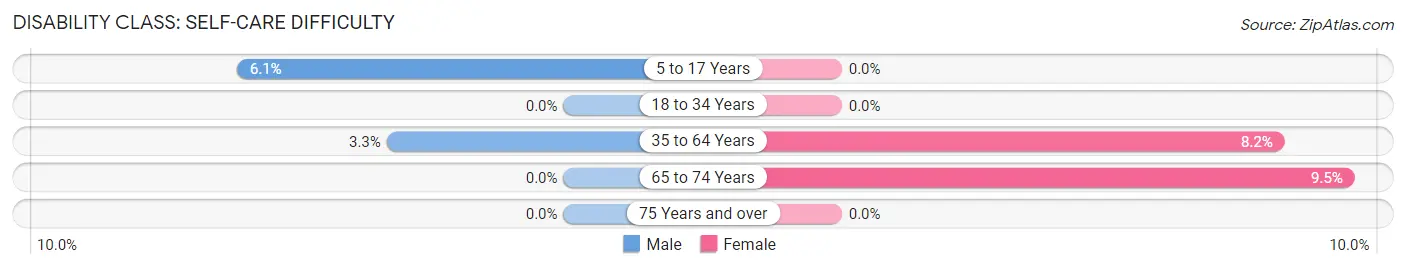
| Age Bracket | Male | Female |
| 5 to 17 Years | 2 (6.1%) | 0 (0.0%) |
| 18 to 34 Years | 0 (0.0%) | 0 (0.0%) |
| 35 to 64 Years | 2 (3.3%) | 6 (8.2%) |
| 65 to 74 Years | 0 (0.0%) | 2 (9.5%) |
| 75 Years and over | 0 (0.0%) | 0 (0.0%) |
Technology Access in Suring
Computing Device Access in Suring
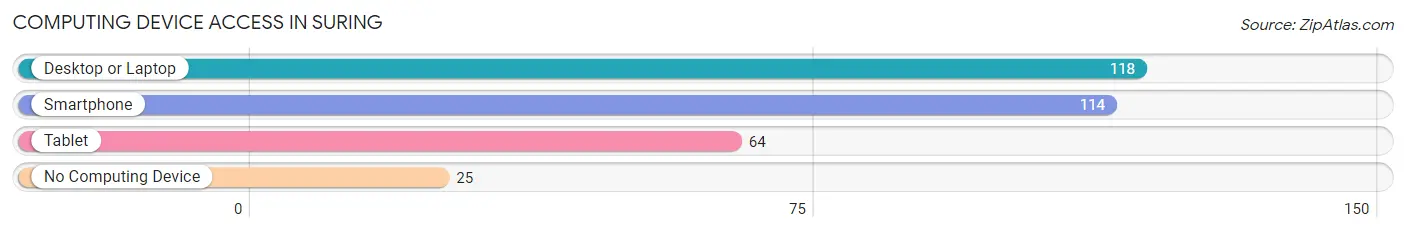
| Device Type | # Households | % Households |
| Desktop or Laptop | 118 | 71.1% |
| Smartphone | 114 | 68.7% |
| Tablet | 64 | 38.6% |
| No Computing Device | 25 | 15.1% |
| Total | 166 | 100.0% |
Internet Access in Suring
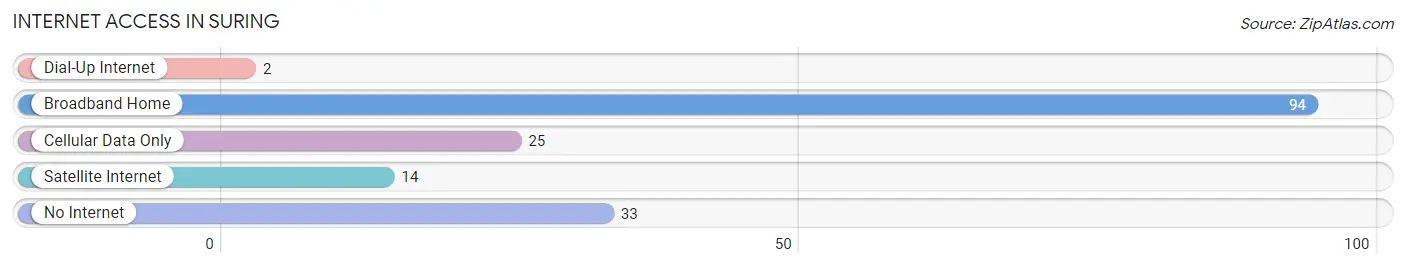
| Internet Type | # Households | % Households |
| Dial-Up Internet | 2 | 1.2% |
| Broadband Home | 94 | 56.6% |
| Cellular Data Only | 25 | 15.1% |
| Satellite Internet | 14 | 8.4% |
| No Internet | 33 | 19.9% |
| Total | 166 | 100.0% |
Suring Summary
Suring, Wisconsin is a small village located in Oconto County, Wisconsin. It is situated on the Wolf River, approximately 30 miles northeast of Green Bay. The village has a population of approximately 1,000 people and covers an area of 1.2 square miles.
History
Suring was first settled in 1876 by a group of German immigrants. The village was named after the Suring family, who were among the first settlers. The village was incorporated in 1891 and was originally a logging and farming community. In the early 1900s, the village began to grow and develop, with the construction of a railroad line and the establishment of a post office.
Geography
Suring is located in the northeastern part of Oconto County, Wisconsin. It is situated on the Wolf River, approximately 30 miles northeast of Green Bay. The village is surrounded by rolling hills and forests, and is home to several lakes, including Big Lake, Little Lake, and Lake Suring. The village is located in the Central Time Zone and has a humid continental climate, with cold winters and warm summers.
Economy
The economy of Suring is largely based on agriculture and tourism. The village is home to several farms, which produce a variety of crops, including corn, soybeans, and hay. The village also has several small businesses, including restaurants, shops, and a grocery store. Tourism is also an important part of the local economy, with visitors coming to the area to enjoy the natural beauty of the area, as well as the many recreational activities available.
Demographics
As of the 2010 census, the population of Suring was 1,000 people. The racial makeup of the village was 97.2% White, 0.3% African American, 0.2% Native American, 0.2% Asian, 0.1% Pacific Islander, 0.7% from other races, and 1.3% from two or more races. The median household income was $37,500, and the median family income was $45,000. The per capita income was $18,000.
Suring is a small village with a rich history and a vibrant economy. The village is home to a diverse population and offers a variety of recreational activities and natural beauty. The village is a great place to live, work, and play.
Common Questions
What is Per Capita Income in Suring?
Per Capita income in Suring is $26,998.
What is the Median Family Income in Suring?
Median Family Income in Suring is $62,500.
What is the Median Household income in Suring?
Median Household Income in Suring is $47,885.
What is Inequality or Gini Index in Suring?
Inequality or Gini Index in Suring is 0.42.
What is the Total Population of Suring?
Total Population of Suring is 399.
What is the Total Male Population of Suring?
Total Male Population of Suring is 201.
What is the Total Female Population of Suring?
Total Female Population of Suring is 198.
What is the Ratio of Males per 100 Females in Suring?
There are 101.52 Males per 100 Females in Suring.
What is the Ratio of Females per 100 Males in Suring?
There are 98.51 Females per 100 Males in Suring.
What is the Median Population Age in Suring?
Median Population Age in Suring is 56.4 Years.
What is the Average Family Size in Suring
Average Family Size in Suring is 2.8 People.
What is the Average Household Size in Suring
Average Household Size in Suring is 2.1 People.
How Large is the Labor Force in Suring?
There are 140 People in the Labor Forcein in Suring.
What is the Percentage of People in the Labor Force in Suring?
39.9% of People are in the Labor Force in Suring.
What is the Unemployment Rate in Suring?
Unemployment Rate in Suring is 8.6%.