Superior, WI Map & Demographics
Superior Map
Superior Overview
$42,108
PER CAPITA INCOME
$82,500
AVG FAMILY INCOME
$63,375
AVG HOUSEHOLD INCOME
35.4%
WAGE / INCOME GAP [ % ]
64.6¢/ $1
WAGE / INCOME GAP [ $ ]
0.45
INEQUALITY / GINI INDEX
638
TOTAL POPULATION
322
MALE POPULATION
316
FEMALE POPULATION
101.90
MALES / 100 FEMALES
98.14
FEMALES / 100 MALES
49.0
MEDIAN AGE
2.7
AVG FAMILY SIZE
2.0
AVG HOUSEHOLD SIZE
386
LABOR FORCE [ PEOPLE ]
67.1%
PERCENT IN LABOR FORCE
5.2%
UNEMPLOYMENT RATE
Superior Zip Codes
Superior Area Codes
Income in Superior
Income Overview in Superior
Per Capita Income in Superior is $42,108, while median incomes of families and households are $82,500 and $63,375 respectively.
| Characteristic | Number | Measure |
| Per Capita Income | 638 | $42,108 |
| Median Family Income | 150 | $82,500 |
| Mean Family Income | 150 | $102,473 |
| Median Household Income | 298 | $63,375 |
| Mean Household Income | 298 | $86,716 |
| Income Deficit | 150 | $0 |
| Wage / Income Gap (%) | 638 | 35.41% |
| Wage / Income Gap ($) | 638 | 64.59¢ per $1 |
| Gini / Inequality Index | 638 | 0.45 |
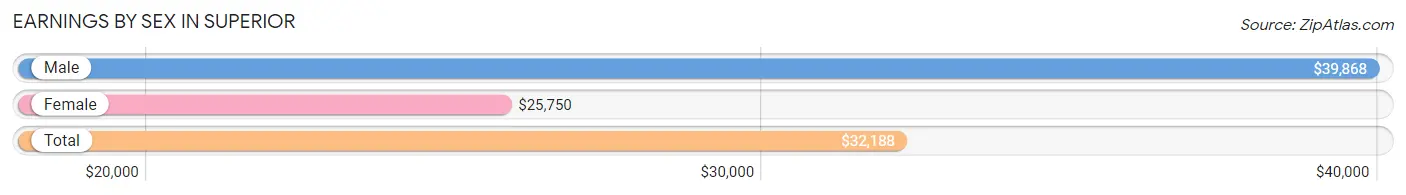
Earnings by Sex in Superior
Average Earnings in Superior are $32,188, $39,868 for men and $25,750 for women, a difference of 35.4%.
| Sex | Number | Average Earnings |
| Male | 190 (48.1%) | $39,868 |
| Female | 205 (51.9%) | $25,750 |
| Total | 395 (100.0%) | $32,188 |
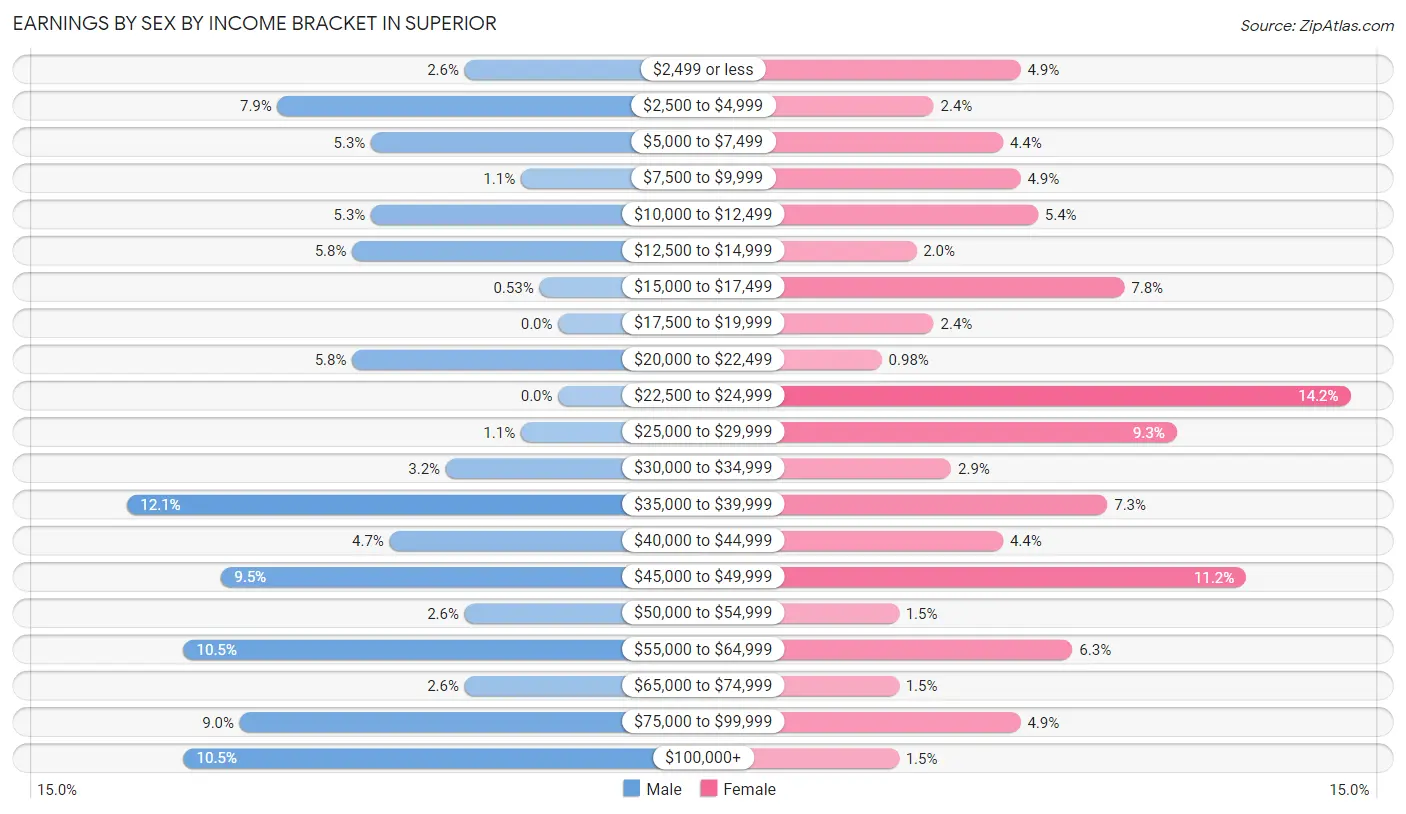
Earnings by Sex by Income Bracket in Superior
The most common earnings brackets in Superior are $35,000 to $39,999 for men (23 | 12.1%) and $22,500 to $24,999 for women (29 | 14.1%).
| Income | Male | Female |
| $2,499 or less | 5 (2.6%) | 10 (4.9%) |
| $2,500 to $4,999 | 15 (7.9%) | 5 (2.4%) |
| $5,000 to $7,499 | 10 (5.3%) | 9 (4.4%) |
| $7,500 to $9,999 | 2 (1.1%) | 10 (4.9%) |
| $10,000 to $12,499 | 10 (5.3%) | 11 (5.4%) |
| $12,500 to $14,999 | 11 (5.8%) | 4 (1.9%) |
| $15,000 to $17,499 | 1 (0.5%) | 16 (7.8%) |
| $17,500 to $19,999 | 0 (0.0%) | 5 (2.4%) |
| $20,000 to $22,499 | 11 (5.8%) | 2 (1.0%) |
| $22,500 to $24,999 | 0 (0.0%) | 29 (14.1%) |
| $25,000 to $29,999 | 2 (1.1%) | 19 (9.3%) |
| $30,000 to $34,999 | 6 (3.2%) | 6 (2.9%) |
| $35,000 to $39,999 | 23 (12.1%) | 15 (7.3%) |
| $40,000 to $44,999 | 9 (4.7%) | 9 (4.4%) |
| $45,000 to $49,999 | 18 (9.5%) | 23 (11.2%) |
| $50,000 to $54,999 | 5 (2.6%) | 3 (1.5%) |
| $55,000 to $64,999 | 20 (10.5%) | 13 (6.3%) |
| $65,000 to $74,999 | 5 (2.6%) | 3 (1.5%) |
| $75,000 to $99,999 | 17 (8.9%) | 10 (4.9%) |
| $100,000+ | 20 (10.5%) | 3 (1.5%) |
| Total | 190 (100.0%) | 205 (100.0%) |
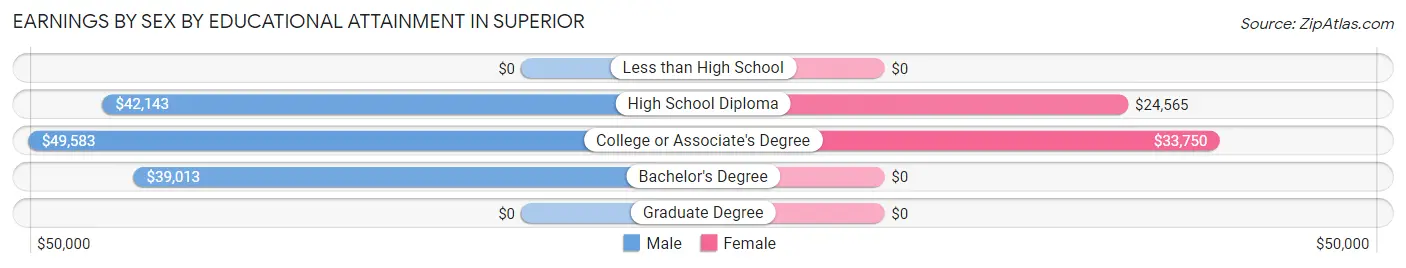
Earnings by Sex by Educational Attainment in Superior
Average earnings in Superior are $41,429 for men and $27,250 for women, a difference of 34.2%. Men with an educational attainment of college or associate's degree enjoy the highest average annual earnings of $49,583, while those with bachelor's degree education earn the least with $39,013. Women with an educational attainment of college or associate's degree earn the most with the average annual earnings of $33,750, while those with high school diploma education have the smallest earnings of $24,565.
| Educational Attainment | Male Income | Female Income |
| Less than High School | - | - |
| High School Diploma | $42,143 | $24,565 |
| College or Associate's Degree | $49,583 | $33,750 |
| Bachelor's Degree | $39,013 | $0 |
| Graduate Degree | - | - |
| Total | $41,429 | $27,250 |
Family Income in Superior
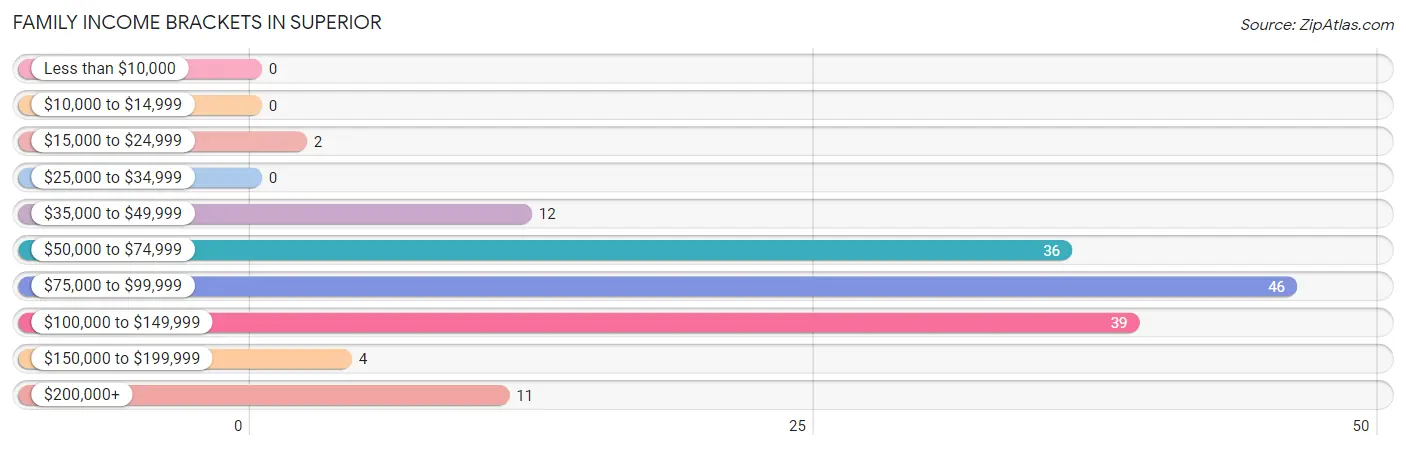
Family Income Brackets in Superior
According to the Superior family income data, there are 46 families falling into the $75,000 to $99,999 income range, which is the most common income bracket and makes up 30.7% of all families.
| Income Bracket | # Families | % Families |
| Less than $10,000 | 0 | 0.0% |
| $10,000 to $14,999 | 0 | 0.0% |
| $15,000 to $24,999 | 2 | 1.3% |
| $25,000 to $34,999 | 0 | 0.0% |
| $35,000 to $49,999 | 12 | 8.0% |
| $50,000 to $74,999 | 36 | 24.0% |
| $75,000 to $99,999 | 46 | 30.7% |
| $100,000 to $149,999 | 39 | 26.0% |
| $150,000 to $199,999 | 4 | 2.7% |
| $200,000+ | 11 | 7.3% |
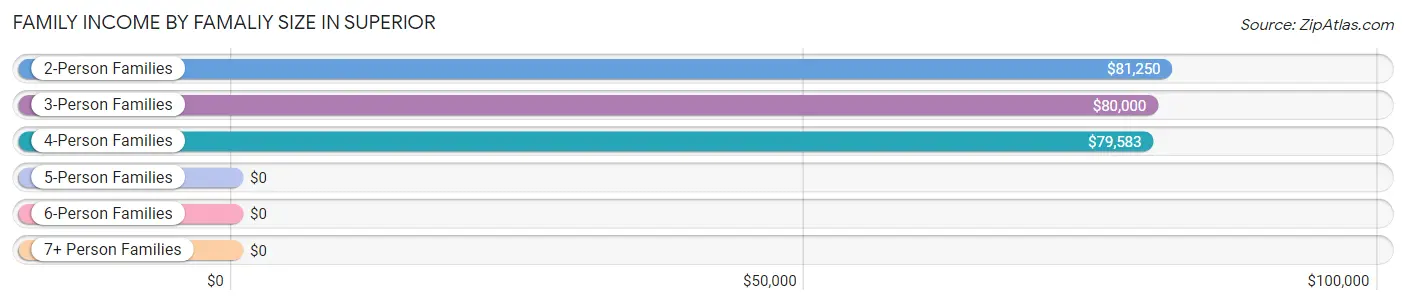
Family Income by Famaliy Size in Superior
2-person families (96 | 64.0%) account for the highest median family income in Superior with $81,250 per family, while 2-person families (96 | 64.0%) have the highest median income of $40,625 per family member.
| Income Bracket | # Families | Median Income |
| 2-Person Families | 96 (64.0%) | $81,250 |
| 3-Person Families | 22 (14.7%) | $80,000 |
| 4-Person Families | 25 (16.7%) | $79,583 |
| 5-Person Families | 4 (2.7%) | $0 |
| 6-Person Families | 3 (2.0%) | $0 |
| 7+ Person Families | 0 (0.0%) | $0 |
| Total | 150 (100.0%) | $82,500 |
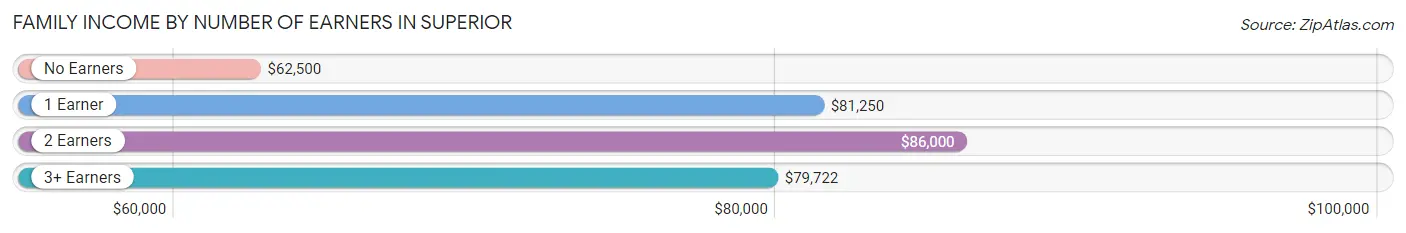
Family Income by Number of Earners in Superior
The median family income in Superior is $82,500, with families comprising 2 earners (56) having the highest median family income of $86,000, while families with no earners (24) have the lowest median family income of $62,500, accounting for 37.3% and 16.0% of families, respectively.
| Number of Earners | # Families | Median Income |
| No Earners | 24 (16.0%) | $62,500 |
| 1 Earner | 44 (29.3%) | $81,250 |
| 2 Earners | 56 (37.3%) | $86,000 |
| 3+ Earners | 26 (17.3%) | $79,722 |
| Total | 150 (100.0%) | $82,500 |
Household Income in Superior
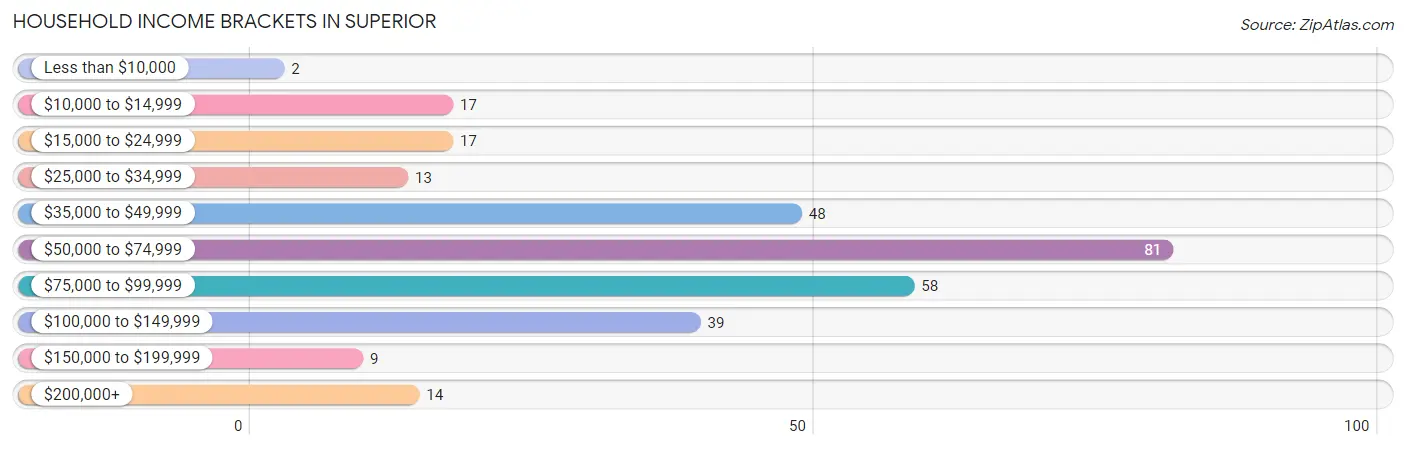
Household Income Brackets in Superior
With 81 households falling in the category, the $50,000 to $74,999 income range is the most frequent in Superior, accounting for 27.2% of all households. In contrast, only 2 households (0.7%) fall into the less than $10,000 income bracket, making it the least populous group.
| Income Bracket | # Households | % Households |
| Less than $10,000 | 2 | 0.7% |
| $10,000 to $14,999 | 17 | 5.7% |
| $15,000 to $24,999 | 17 | 5.7% |
| $25,000 to $34,999 | 13 | 4.4% |
| $35,000 to $49,999 | 48 | 16.1% |
| $50,000 to $74,999 | 81 | 27.2% |
| $75,000 to $99,999 | 58 | 19.5% |
| $100,000 to $149,999 | 39 | 13.1% |
| $150,000 to $199,999 | 9 | 3.0% |
| $200,000+ | 14 | 4.7% |
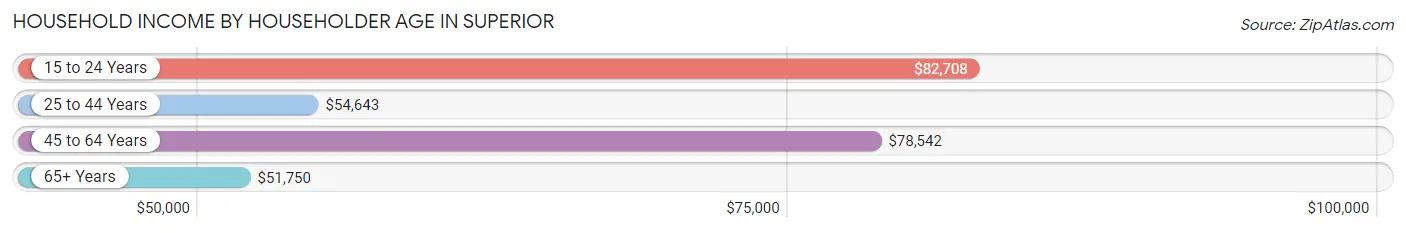
Household Income by Householder Age in Superior
The median household income in Superior is $63,375, with the highest median household income of $82,708 found in the 15 to 24 years age bracket for the primary householder. A total of 11 households (3.7%) fall into this category. Meanwhile, the 65+ years age bracket for the primary householder has the lowest median household income of $51,750, with 109 households (36.6%) in this group.
| Income Bracket | # Households | Median Income |
| 15 to 24 Years | 11 (3.7%) | $82,708 |
| 25 to 44 Years | 74 (24.8%) | $54,643 |
| 45 to 64 Years | 104 (34.9%) | $78,542 |
| 65+ Years | 109 (36.6%) | $51,750 |
| Total | 298 (100.0%) | $63,375 |
Poverty in Superior
Income Below Poverty by Sex and Age in Superior
With 6.4% poverty level for males and 7.1% for females among the residents of Superior, 65 to 74 year old males and 18 to 24 year old females are the most vulnerable to poverty, with 9 males (16.7%) and 8 females (33.3%) in their respective age groups living below the poverty level.
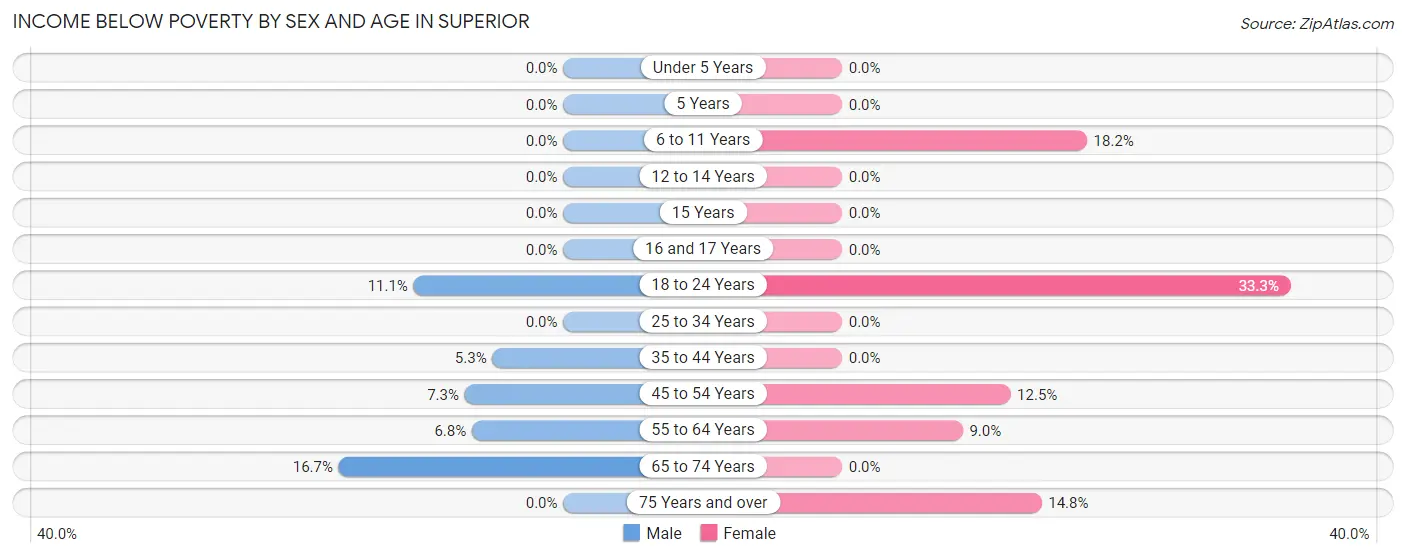
| Age Bracket | Male | Female |
| Under 5 Years | 0 (0.0%) | 0 (0.0%) |
| 5 Years | 0 (0.0%) | 0 (0.0%) |
| 6 to 11 Years | 0 (0.0%) | 2 (18.2%) |
| 12 to 14 Years | 0 (0.0%) | 0 (0.0%) |
| 15 Years | 0 (0.0%) | 0 (0.0%) |
| 16 and 17 Years | 0 (0.0%) | 0 (0.0%) |
| 18 to 24 Years | 3 (11.1%) | 8 (33.3%) |
| 25 to 34 Years | 0 (0.0%) | 0 (0.0%) |
| 35 to 44 Years | 1 (5.3%) | 0 (0.0%) |
| 45 to 54 Years | 3 (7.3%) | 2 (12.5%) |
| 55 to 64 Years | 4 (6.8%) | 6 (9.0%) |
| 65 to 74 Years | 9 (16.7%) | 0 (0.0%) |
| 75 Years and over | 0 (0.0%) | 4 (14.8%) |
| Total | 20 (6.4%) | 22 (7.1%) |
Income Above Poverty by Sex and Age in Superior
According to the poverty statistics in Superior, males aged under 5 years and females aged under 5 years are the age groups that are most secure financially, with 100.0% of males and 100.0% of females in these age groups living above the poverty line.
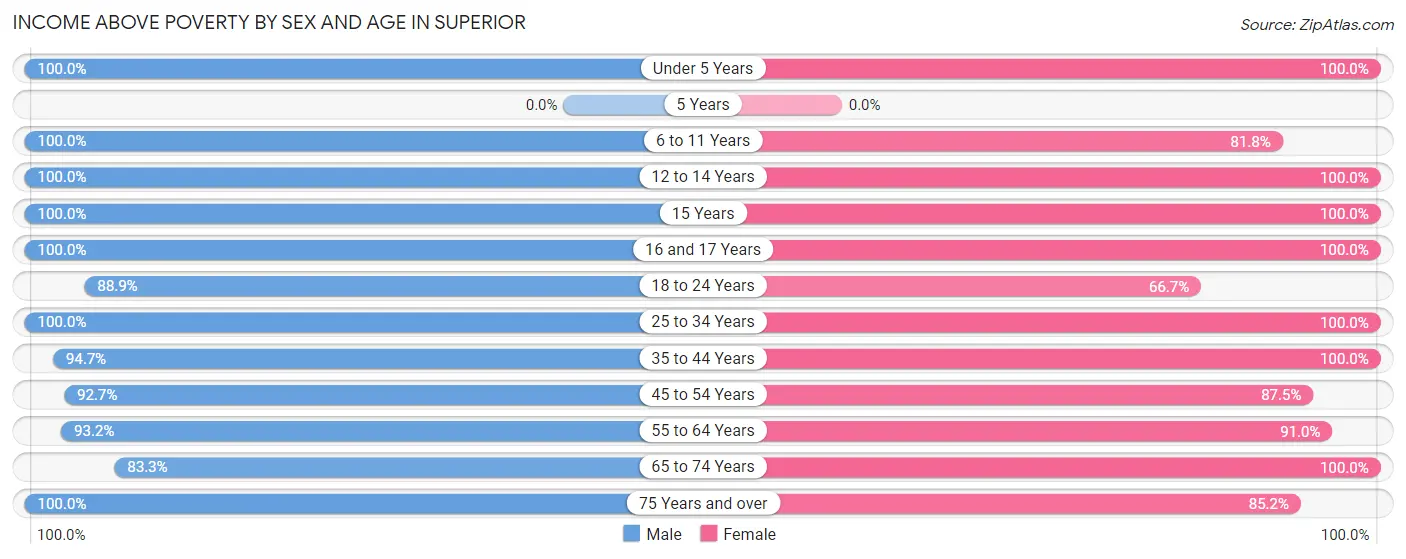
| Age Bracket | Male | Female |
| Under 5 Years | 16 (100.0%) | 2 (100.0%) |
| 5 Years | 0 (0.0%) | 0 (0.0%) |
| 6 to 11 Years | 14 (100.0%) | 9 (81.8%) |
| 12 to 14 Years | 5 (100.0%) | 3 (100.0%) |
| 15 Years | 5 (100.0%) | 3 (100.0%) |
| 16 and 17 Years | 9 (100.0%) | 15 (100.0%) |
| 18 to 24 Years | 24 (88.9%) | 16 (66.7%) |
| 25 to 34 Years | 47 (100.0%) | 45 (100.0%) |
| 35 to 44 Years | 18 (94.7%) | 48 (100.0%) |
| 45 to 54 Years | 38 (92.7%) | 14 (87.5%) |
| 55 to 64 Years | 55 (93.2%) | 61 (91.0%) |
| 65 to 74 Years | 45 (83.3%) | 50 (100.0%) |
| 75 Years and over | 17 (100.0%) | 23 (85.2%) |
| Total | 293 (93.6%) | 289 (92.9%) |
Income Below Poverty Among Married-Couple Families in Superior
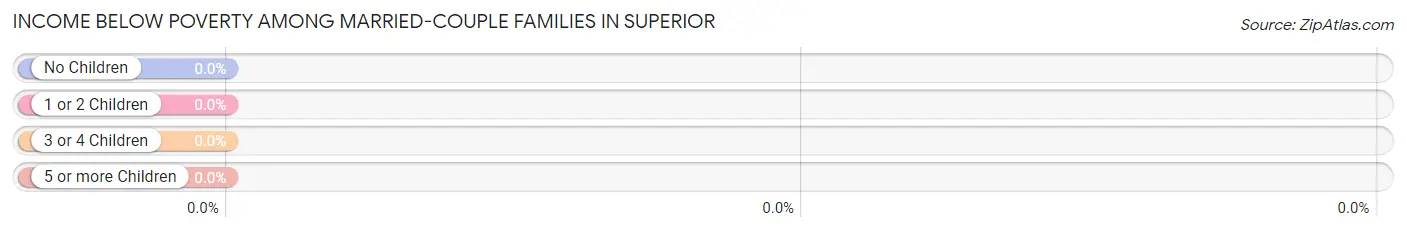
| Children | Above Poverty | Below Poverty |
| No Children | 83 (100.0%) | 0 (0.0%) |
| 1 or 2 Children | 32 (100.0%) | 0 (0.0%) |
| 3 or 4 Children | 3 (100.0%) | 0 (0.0%) |
| 5 or more Children | 0 (0.0%) | 0 (0.0%) |
| Total | 118 (100.0%) | 0 (0.0%) |
Income Below Poverty Among Single-Parent Households in Superior
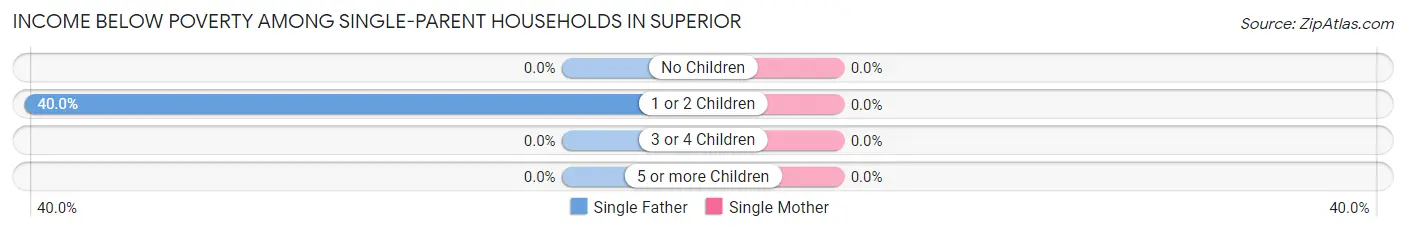
| Children | Single Father | Single Mother |
| No Children | 0 (0.0%) | 0 (0.0%) |
| 1 or 2 Children | 2 (40.0%) | 0 (0.0%) |
| 3 or 4 Children | 0 (0.0%) | 0 (0.0%) |
| 5 or more Children | 0 (0.0%) | 0 (0.0%) |
| Total | 2 (28.6%) | 0 (0.0%) |
Income Below Poverty Among Married-Couple vs Single-Parent Households in Superior
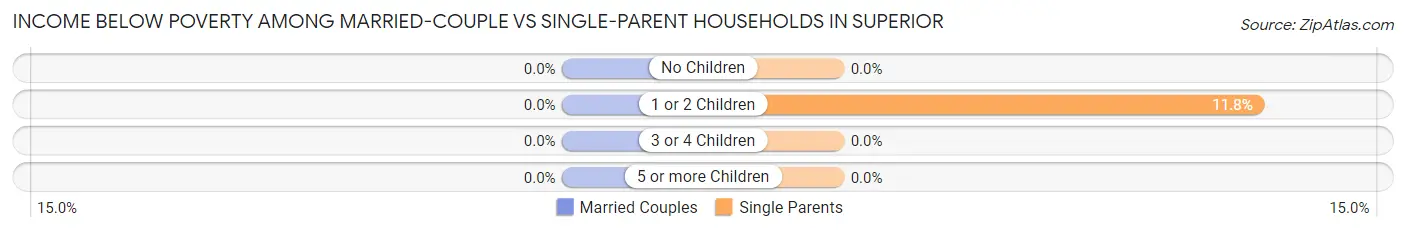
| Children | Married-Couple Families | Single-Parent Households |
| No Children | 0 (0.0%) | 0 (0.0%) |
| 1 or 2 Children | 0 (0.0%) | 2 (11.8%) |
| 3 or 4 Children | 0 (0.0%) | 0 (0.0%) |
| 5 or more Children | 0 (0.0%) | 0 (0.0%) |
| Total | 0 (0.0%) | 2 (6.2%) |
Race in Superior
The most populous races in Superior are White / Caucasian (617 | 96.7%), Two or more Races (20 | 3.1%), and Hispanic or Latino (12 | 1.9%).
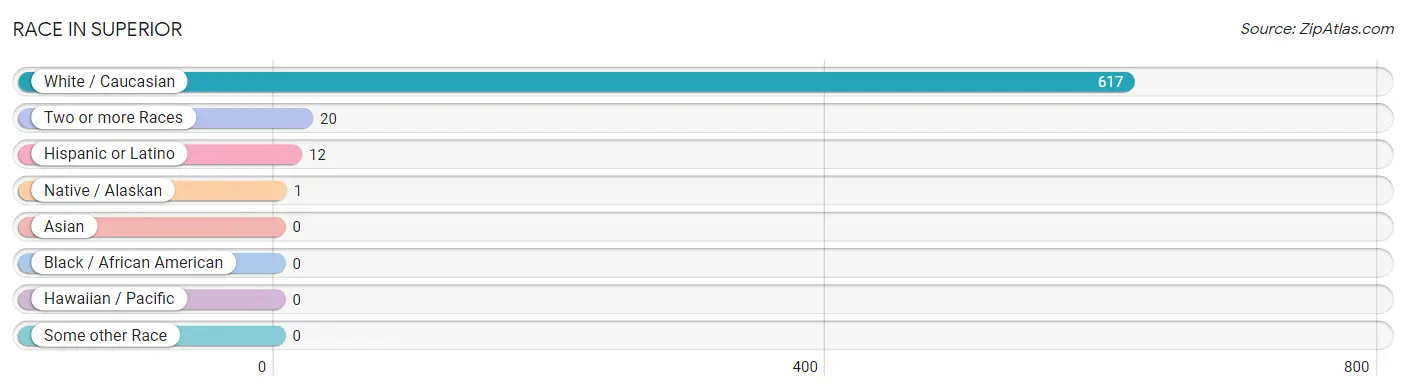
| Race | # Population | % Population |
| Asian | 0 | 0.0% |
| Black / African American | 0 | 0.0% |
| Hawaiian / Pacific | 0 | 0.0% |
| Hispanic or Latino | 12 | 1.9% |
| Native / Alaskan | 1 | 0.2% |
| White / Caucasian | 617 | 96.7% |
| Two or more Races | 20 | 3.1% |
| Some other Race | 0 | 0.0% |
| Total | 638 | 100.0% |
Ancestry in Superior
The most populous ancestries reported in Superior are German (168 | 26.3%), Irish (100 | 15.7%), Swedish (71 | 11.1%), Finnish (67 | 10.5%), and Scandinavian (47 | 7.4%), together accounting for 71.0% of all Superior residents.
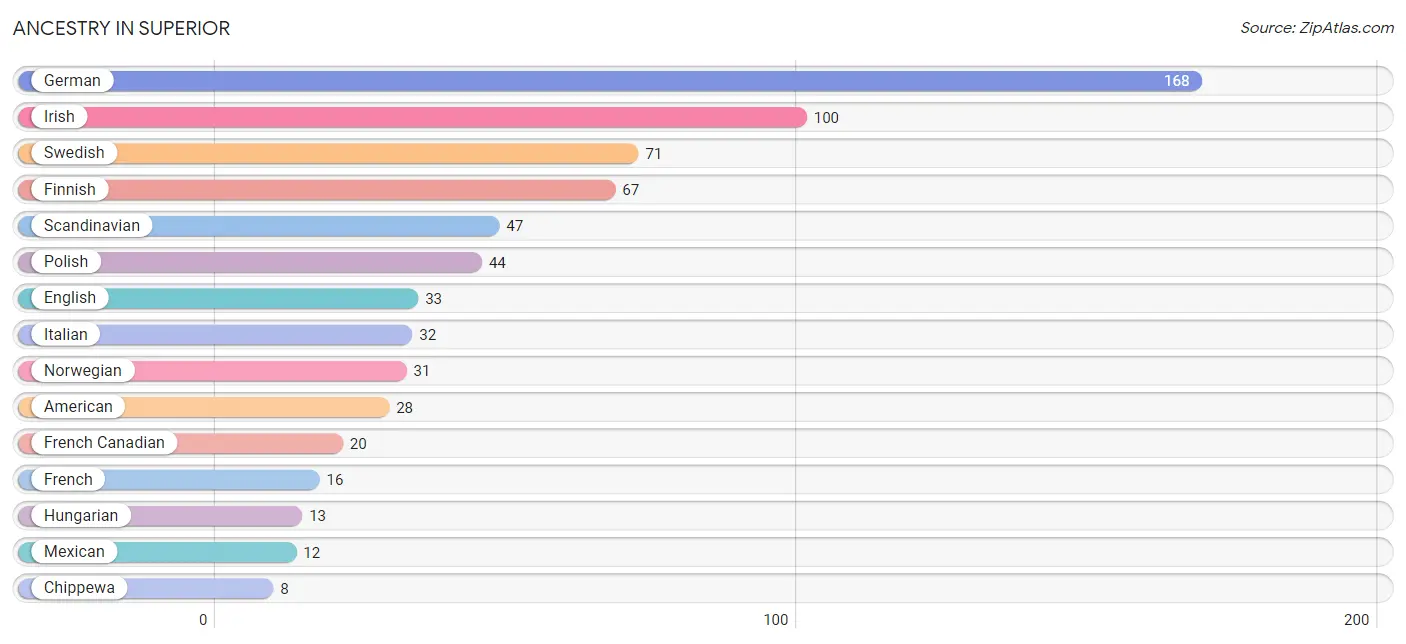
| Ancestry | # Population | % Population |
| American | 28 | 4.4% |
| Bangladeshi | 2 | 0.3% |
| Belgian | 3 | 0.5% |
| Chippewa | 8 | 1.3% |
| Czech | 4 | 0.6% |
| Danish | 2 | 0.3% |
| Dutch | 2 | 0.3% |
| English | 33 | 5.2% |
| European | 4 | 0.6% |
| Finnish | 67 | 10.5% |
| French | 16 | 2.5% |
| French Canadian | 20 | 3.1% |
| German | 168 | 26.3% |
| Greek | 6 | 0.9% |
| Hungarian | 13 | 2.0% |
| Irish | 100 | 15.7% |
| Italian | 32 | 5.0% |
| Mexican | 12 | 1.9% |
| Norwegian | 31 | 4.9% |
| Polish | 44 | 6.9% |
| Russian | 7 | 1.1% |
| Scandinavian | 47 | 7.4% |
| Slovene | 4 | 0.6% |
| Swedish | 71 | 11.1% |
| Ukrainian | 1 | 0.2% | View All 25 Rows |
Immigrants in Superior
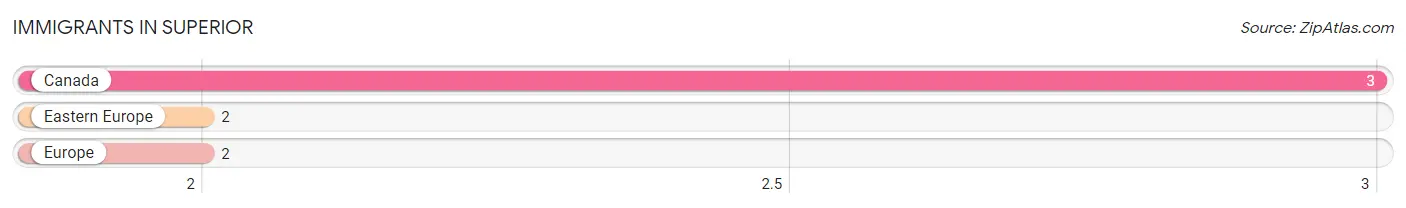
The most numerous immigrant groups reported in Superior came from Canada (3 | 0.5%), Eastern Europe (2 | 0.3%), and Europe (2 | 0.3%), together accounting for 1.1% of all Superior residents.
| Immigration Origin | # Population | % Population |
| Canada | 3 | 0.5% |
| Eastern Europe | 2 | 0.3% |
| Europe | 2 | 0.3% | View All 3 Rows |
Sex and Age in Superior
Sex and Age in Superior
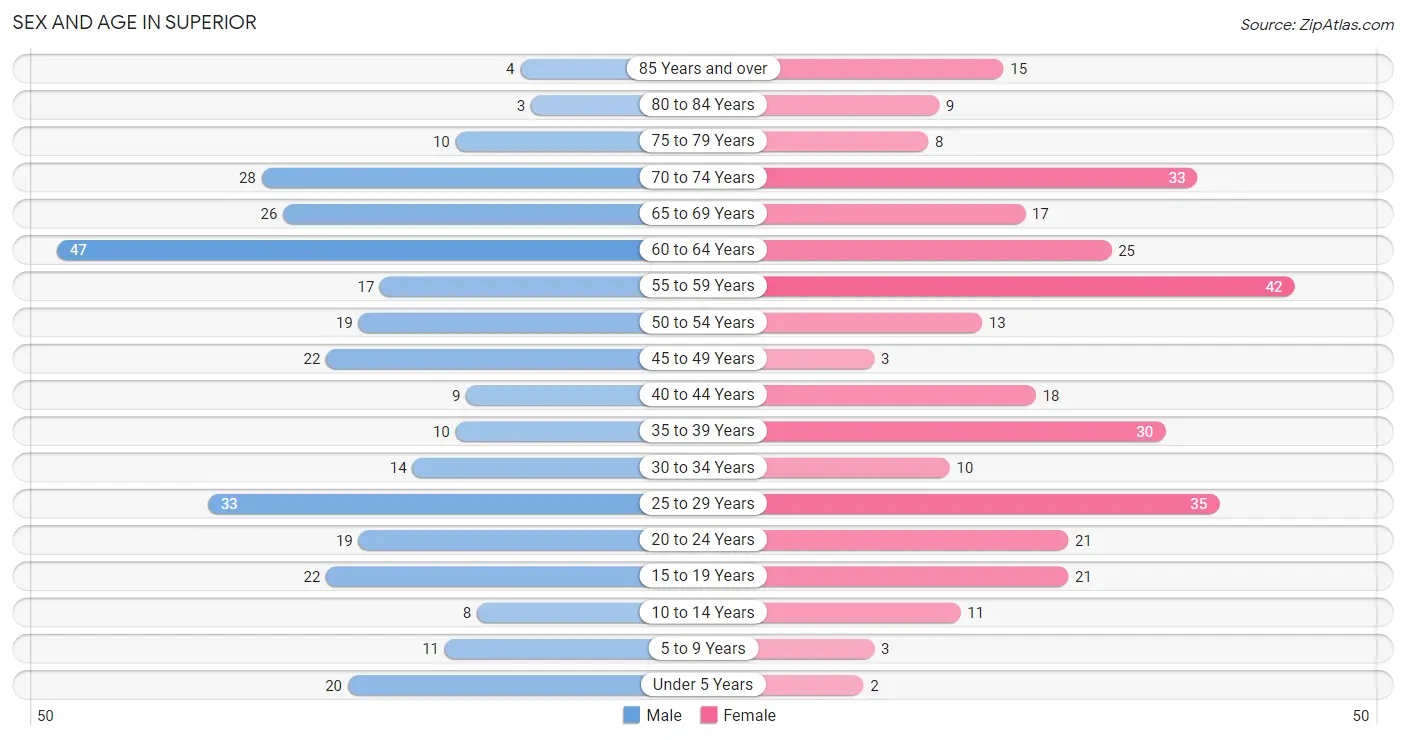
The most populous age groups in Superior are 60 to 64 Years (47 | 14.6%) for men and 55 to 59 Years (42 | 13.3%) for women.
| Age Bracket | Male | Female |
| Under 5 Years | 20 (6.2%) | 2 (0.6%) |
| 5 to 9 Years | 11 (3.4%) | 3 (0.9%) |
| 10 to 14 Years | 8 (2.5%) | 11 (3.5%) |
| 15 to 19 Years | 22 (6.8%) | 21 (6.7%) |
| 20 to 24 Years | 19 (5.9%) | 21 (6.7%) |
| 25 to 29 Years | 33 (10.2%) | 35 (11.1%) |
| 30 to 34 Years | 14 (4.3%) | 10 (3.2%) |
| 35 to 39 Years | 10 (3.1%) | 30 (9.5%) |
| 40 to 44 Years | 9 (2.8%) | 18 (5.7%) |
| 45 to 49 Years | 22 (6.8%) | 3 (0.9%) |
| 50 to 54 Years | 19 (5.9%) | 13 (4.1%) |
| 55 to 59 Years | 17 (5.3%) | 42 (13.3%) |
| 60 to 64 Years | 47 (14.6%) | 25 (7.9%) |
| 65 to 69 Years | 26 (8.1%) | 17 (5.4%) |
| 70 to 74 Years | 28 (8.7%) | 33 (10.4%) |
| 75 to 79 Years | 10 (3.1%) | 8 (2.5%) |
| 80 to 84 Years | 3 (0.9%) | 9 (2.9%) |
| 85 Years and over | 4 (1.2%) | 15 (4.8%) |
| Total | 322 (100.0%) | 316 (100.0%) |
Families and Households in Superior
Median Family Size in Superior
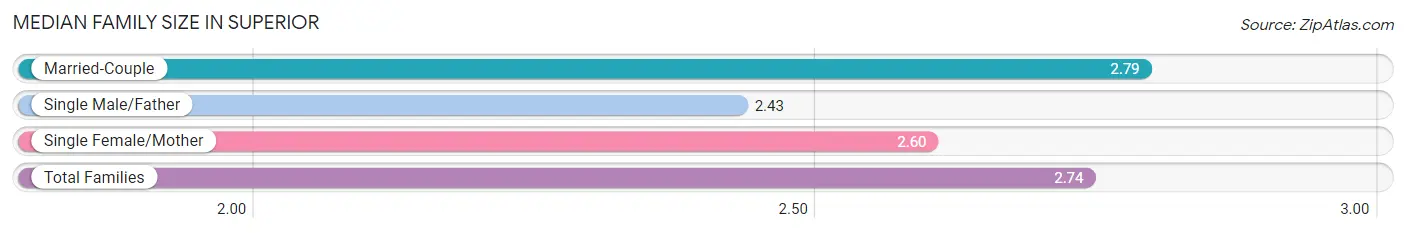
The median family size in Superior is 2.74 persons per family, with married-couple families (118 | 78.7%) accounting for the largest median family size of 2.79 persons per family. On the other hand, single male/father families (7 | 4.7%) represent the smallest median family size with 2.43 persons per family.
| Family Type | # Families | Family Size |
| Married-Couple | 118 (78.7%) | 2.79 |
| Single Male/Father | 7 (4.7%) | 2.43 |
| Single Female/Mother | 25 (16.7%) | 2.60 |
| Total Families | 150 (100.0%) | 2.74 |
Median Household Size in Superior
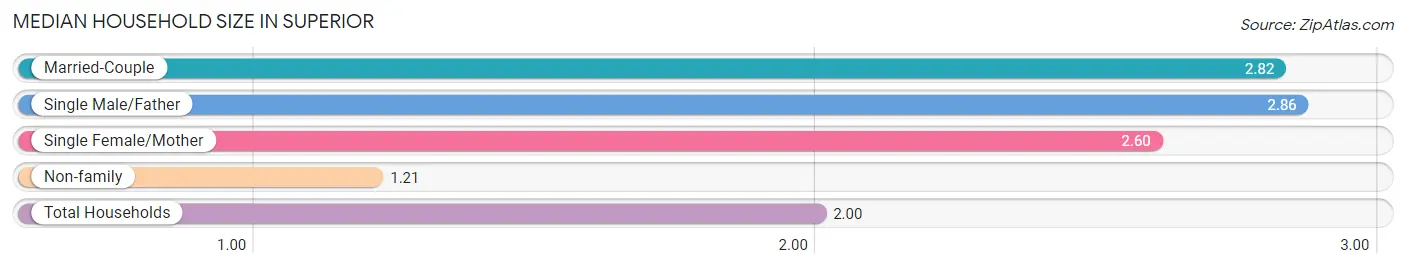
The median household size in Superior is 2.00 persons per household, with single male/father households (7 | 2.4%) accounting for the largest median household size of 2.86 persons per household. non-family households (148 | 49.7%) represent the smallest median household size with 1.21 persons per household.
| Household Type | # Households | Household Size |
| Married-Couple | 118 (39.6%) | 2.82 |
| Single Male/Father | 7 (2.4%) | 2.86 |
| Single Female/Mother | 25 (8.4%) | 2.60 |
| Non-family | 148 (49.7%) | 1.21 |
| Total Households | 298 (100.0%) | 2.00 |
Household Size by Marriage Status in Superior
Out of a total of 298 households in Superior, 150 (50.3%) are family households, while 148 (49.7%) are nonfamily households. The most numerous type of family households are 2-person households, comprising 96, and the most common type of nonfamily households are 1-person households, comprising 122.
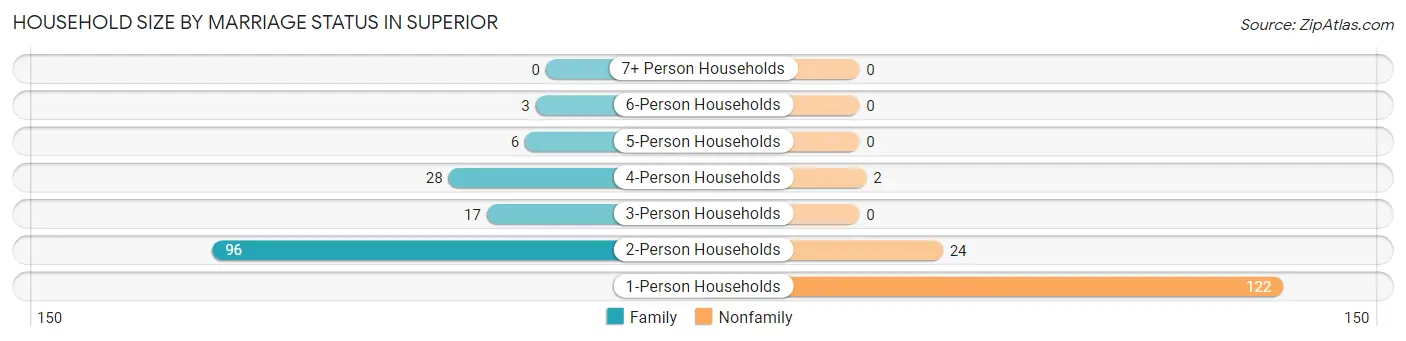
| Household Size | Family Households | Nonfamily Households |
| 1-Person Households | - | 122 (40.9%) |
| 2-Person Households | 96 (32.2%) | 24 (8.1%) |
| 3-Person Households | 17 (5.7%) | 0 (0.0%) |
| 4-Person Households | 28 (9.4%) | 2 (0.7%) |
| 5-Person Households | 6 (2.0%) | 0 (0.0%) |
| 6-Person Households | 3 (1.0%) | 0 (0.0%) |
| 7+ Person Households | 0 (0.0%) | 0 (0.0%) |
| Total | 150 (50.3%) | 148 (49.7%) |
Female Fertility in Superior
Fertility by Age in Superior
| Age Bracket | Women with Births | Births / 1,000 Women |
| 15 to 19 years | 0 (0.0%) | 0.0 |
| 20 to 34 years | 0 (0.0%) | 0.0 |
| 35 to 50 years | 0 (0.0%) | 0.0 |
| Total | 0 (0.0%) | 0.0 |
Fertility by Age by Marriage Status in Superior
| Age Bracket | Married | Unmarried |
| 15 to 19 years | 0 (0.0%) | 0 (0.0%) |
| 20 to 34 years | 0 (0.0%) | 0 (0.0%) |
| 35 to 50 years | 0 (0.0%) | 0 (0.0%) |
| Total | 0 (0.0%) | 0 (0.0%) |
Fertility by Education in Superior
| Educational Attainment | Women with Births | Births / 1,000 Women |
| Less than High School | 0 (0.0%) | 0.0 |
| High School Diploma | 0 (0.0%) | 0.0 |
| College or Associate's Degree | 0 (0.0%) | 0.0 |
| Bachelor's Degree | 0 (0.0%) | 0.0 |
| Graduate Degree | 0 (0.0%) | 0.0 |
| Total | 0 (0.0%) | 0.0 |
Fertility by Education by Marriage Status in Superior
| Educational Attainment | Married | Unmarried |
| Less than High School | 0 (0.0%) | 0 (0.0%) |
| High School Diploma | 0 (0.0%) | 0 (0.0%) |
| College or Associate's Degree | 0 (0.0%) | 0 (0.0%) |
| Bachelor's Degree | 0 (0.0%) | 0 (0.0%) |
| Graduate Degree | 0 (0.0%) | 0 (0.0%) |
| Total | 0 (0.0%) | 0 (0.0%) |
Employment Characteristics in Superior
Employment by Class of Employer in Superior
Among the 351 employed individuals in Superior, private company employees (228 | 65.0%), not-for-profit organizations (58 | 16.5%), and local government employees (23 | 6.6%) make up the most common classes of employment.
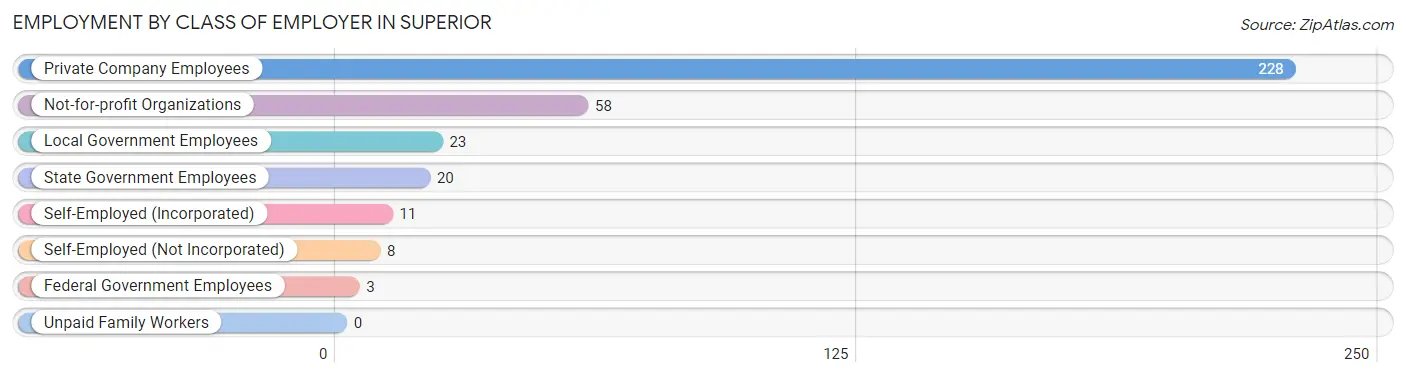
| Employer Class | # Employees | % Employees |
| Private Company Employees | 228 | 65.0% |
| Self-Employed (Incorporated) | 11 | 3.1% |
| Self-Employed (Not Incorporated) | 8 | 2.3% |
| Not-for-profit Organizations | 58 | 16.5% |
| Local Government Employees | 23 | 6.6% |
| State Government Employees | 20 | 5.7% |
| Federal Government Employees | 3 | 0.9% |
| Unpaid Family Workers | 0 | 0.0% |
| Total | 351 | 100.0% |
Employment Status by Age in Superior
According to the labor force statistics for Superior, out of the total population over 16 years of age (575), 67.1% or 386 individuals are in the labor force, with 5.2% or 20 of them unemployed. The age group with the highest labor force participation rate is 20 to 24 years, with 100.0% or 40 individuals in the labor force. Within the labor force, the 16 to 19 years age range has the highest percentage of unemployed individuals, with 48.1% or 13 of them being unemployed.
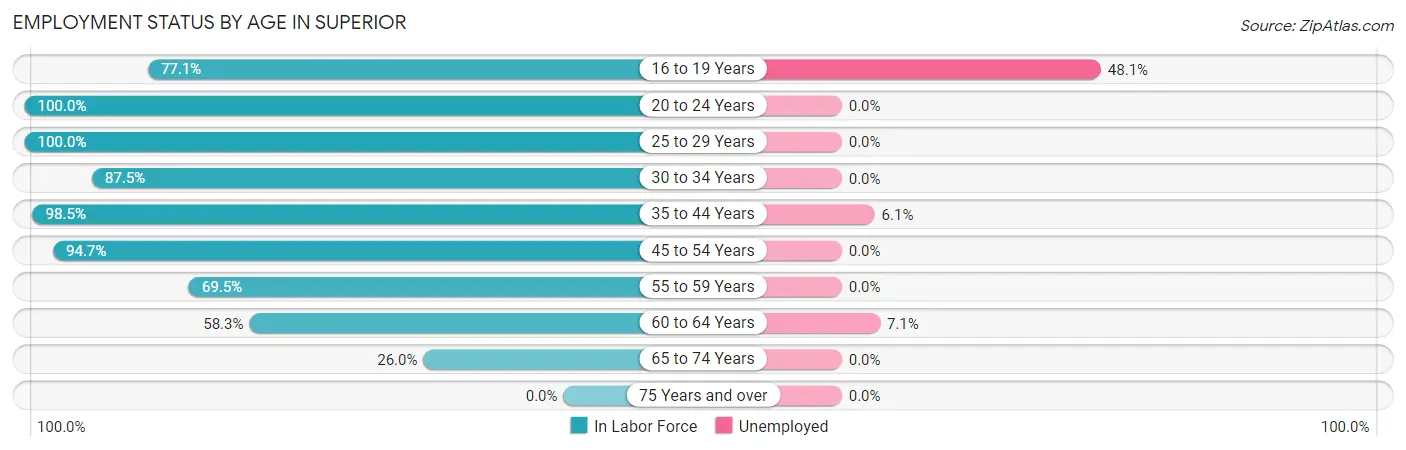
| Age Bracket | In Labor Force | Unemployed |
| 16 to 19 Years | 27 (77.1%) | 13 (48.1%) |
| 20 to 24 Years | 40 (100.0%) | 0 (0.0%) |
| 25 to 29 Years | 68 (100.0%) | 0 (0.0%) |
| 30 to 34 Years | 21 (87.5%) | 0 (0.0%) |
| 35 to 44 Years | 66 (98.5%) | 4 (6.1%) |
| 45 to 54 Years | 54 (94.7%) | 0 (0.0%) |
| 55 to 59 Years | 41 (69.5%) | 0 (0.0%) |
| 60 to 64 Years | 42 (58.3%) | 3 (7.1%) |
| 65 to 74 Years | 27 (26.0%) | 0 (0.0%) |
| 75 Years and over | 0 (0.0%) | 0 (0.0%) |
| Total | 386 (67.1%) | 20 (5.2%) |
Employment Status by Educational Attainment in Superior
According to labor force statistics for Superior, 84.1% of individuals (292) out of the total population between 25 and 64 years of age (347) are in the labor force, with 2.4% or 7 of them being unemployed. The group with the highest labor force participation rate are those with the educational attainment of college / associate degree, with 87.9% or 116 individuals in the labor force. Within the labor force, individuals with college / associate degree education have the highest percentage of unemployment, with 3.4% or 4 of them being unemployed.
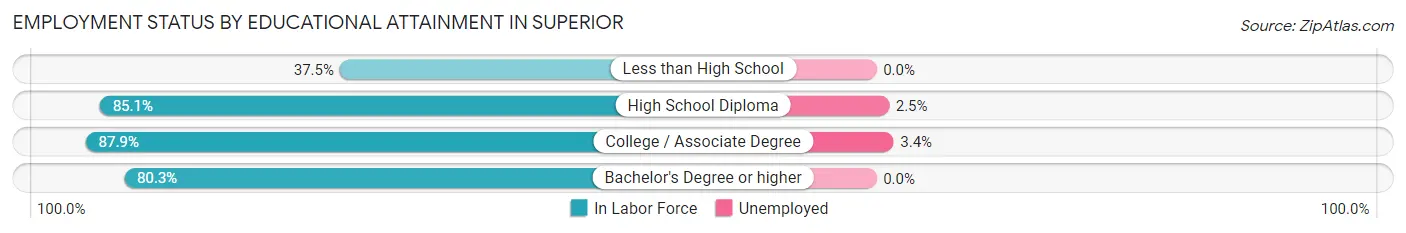
| Educational Attainment | In Labor Force | Unemployed |
| Less than High School | 3 (37.5%) | 0 (0.0%) |
| High School Diploma | 120 (85.1%) | 4 (2.5%) |
| College / Associate Degree | 116 (87.9%) | 4 (3.4%) |
| Bachelor's Degree or higher | 53 (80.3%) | 0 (0.0%) |
| Total | 292 (84.1%) | 8 (2.4%) |
Employment Occupations by Sex in Superior
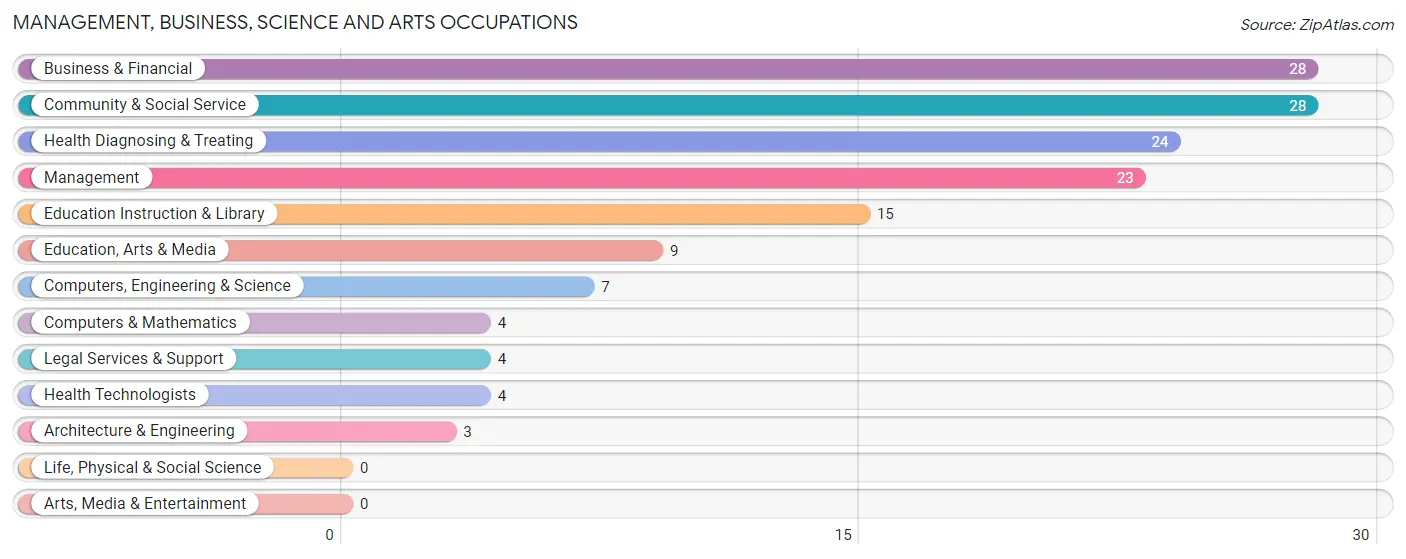
Management, Business, Science and Arts Occupations
The most common Management, Business, Science and Arts occupations in Superior are Business & Financial (28 | 7.7%), Community & Social Service (28 | 7.7%), Health Diagnosing & Treating (24 | 6.6%), Management (23 | 6.3%), and Education Instruction & Library (15 | 4.1%).
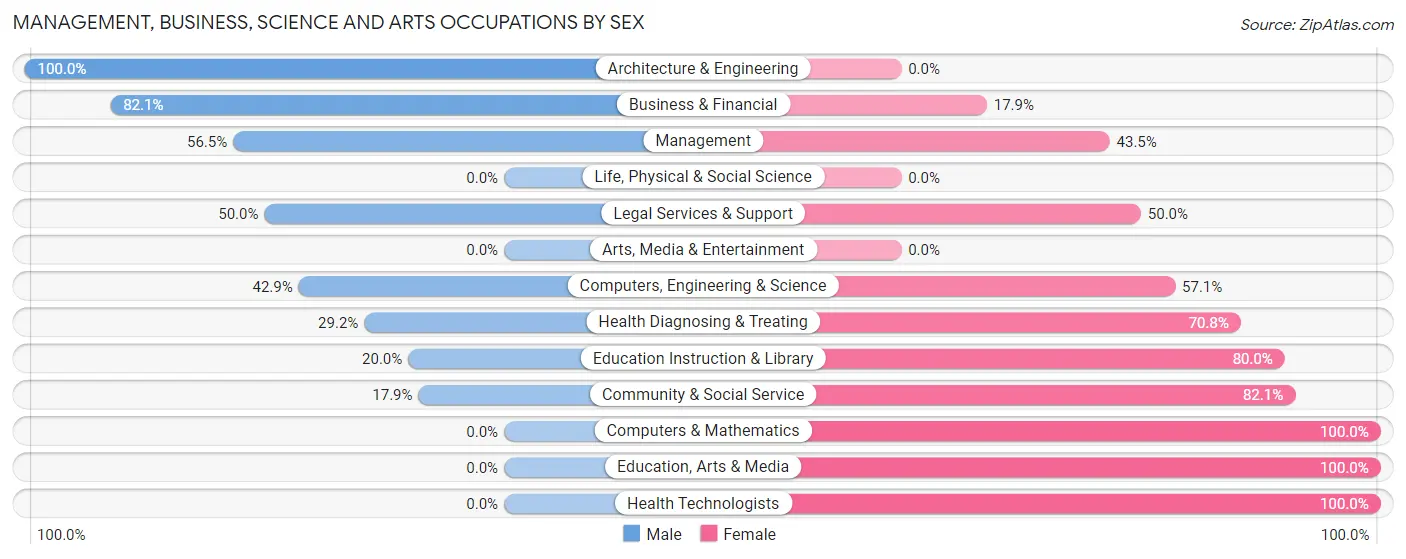
Management, Business, Science and Arts Occupations by Sex
Within the Management, Business, Science and Arts occupations in Superior, the most male-oriented occupations are Architecture & Engineering (100.0%), Business & Financial (82.1%), and Management (56.5%), while the most female-oriented occupations are Computers & Mathematics (100.0%), Education, Arts & Media (100.0%), and Health Technologists (100.0%).
| Occupation | Male | Female |
| Management | 13 (56.5%) | 10 (43.5%) |
| Business & Financial | 23 (82.1%) | 5 (17.9%) |
| Computers, Engineering & Science | 3 (42.9%) | 4 (57.1%) |
| Computers & Mathematics | 0 (0.0%) | 4 (100.0%) |
| Architecture & Engineering | 3 (100.0%) | 0 (0.0%) |
| Life, Physical & Social Science | 0 (0.0%) | 0 (0.0%) |
| Community & Social Service | 5 (17.9%) | 23 (82.1%) |
| Education, Arts & Media | 0 (0.0%) | 9 (100.0%) |
| Legal Services & Support | 2 (50.0%) | 2 (50.0%) |
| Education Instruction & Library | 3 (20.0%) | 12 (80.0%) |
| Arts, Media & Entertainment | 0 (0.0%) | 0 (0.0%) |
| Health Diagnosing & Treating | 7 (29.2%) | 17 (70.8%) |
| Health Technologists | 0 (0.0%) | 4 (100.0%) |
| Total (Category) | 51 (46.4%) | 59 (53.6%) |
| Total (Overall) | 176 (48.5%) | 187 (51.5%) |
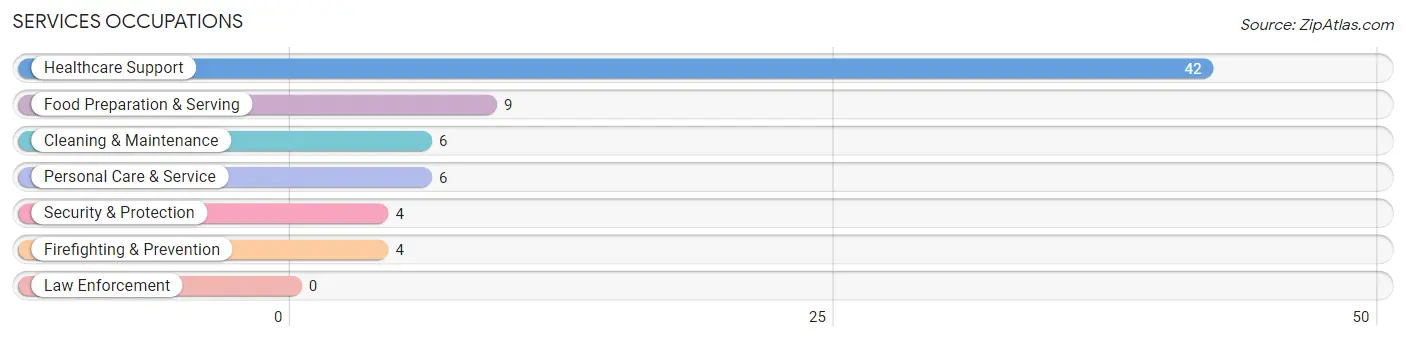
Services Occupations
The most common Services occupations in Superior are Healthcare Support (42 | 11.6%), Food Preparation & Serving (9 | 2.5%), Cleaning & Maintenance (6 | 1.7%), Personal Care & Service (6 | 1.7%), and Security & Protection (4 | 1.1%).
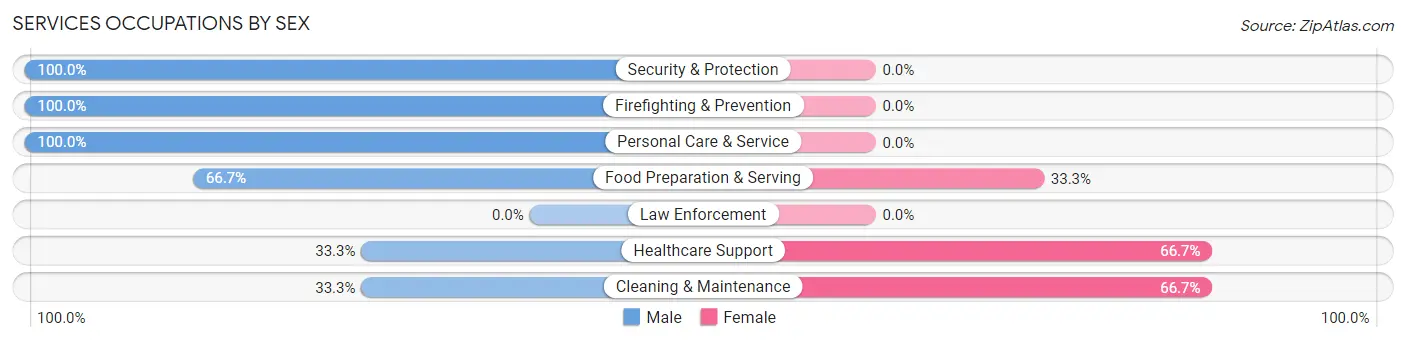
Services Occupations by Sex
Within the Services occupations in Superior, the most male-oriented occupations are Security & Protection (100.0%), Firefighting & Prevention (100.0%), and Personal Care & Service (100.0%), while the most female-oriented occupations are Healthcare Support (66.7%), Cleaning & Maintenance (66.7%), and Food Preparation & Serving (33.3%).
| Occupation | Male | Female |
| Healthcare Support | 14 (33.3%) | 28 (66.7%) |
| Security & Protection | 4 (100.0%) | 0 (0.0%) |
| Firefighting & Prevention | 4 (100.0%) | 0 (0.0%) |
| Law Enforcement | 0 (0.0%) | 0 (0.0%) |
| Food Preparation & Serving | 6 (66.7%) | 3 (33.3%) |
| Cleaning & Maintenance | 2 (33.3%) | 4 (66.7%) |
| Personal Care & Service | 6 (100.0%) | 0 (0.0%) |
| Total (Category) | 32 (47.8%) | 35 (52.2%) |
| Total (Overall) | 176 (48.5%) | 187 (51.5%) |
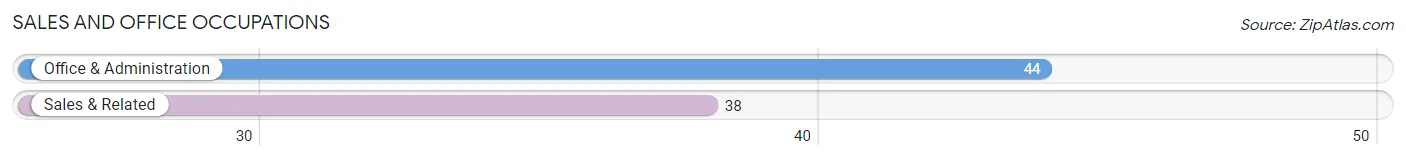
Sales and Office Occupations
The most common Sales and Office occupations in Superior are Office & Administration (44 | 12.1%), and Sales & Related (38 | 10.5%).
Sales and Office Occupations by Sex
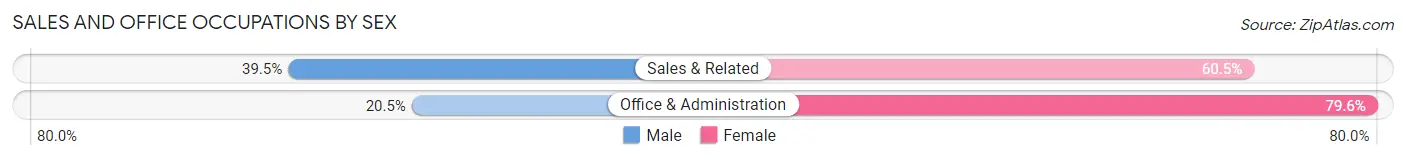
| Occupation | Male | Female |
| Sales & Related | 15 (39.5%) | 23 (60.5%) |
| Office & Administration | 9 (20.4%) | 35 (79.5%) |
| Total (Category) | 24 (29.3%) | 58 (70.7%) |
| Total (Overall) | 176 (48.5%) | 187 (51.5%) |
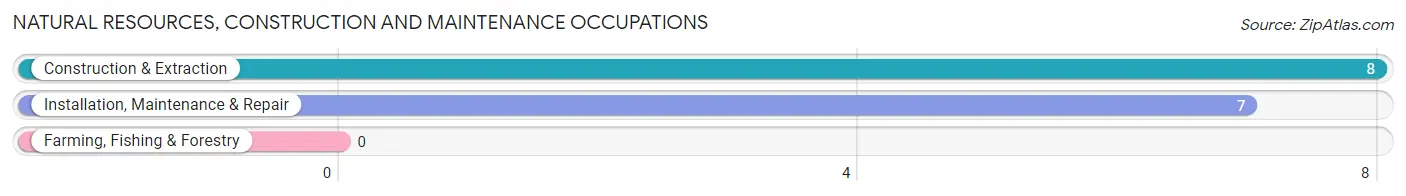
Natural Resources, Construction and Maintenance Occupations
The most common Natural Resources, Construction and Maintenance occupations in Superior are Construction & Extraction (8 | 2.2%), and Installation, Maintenance & Repair (7 | 1.9%).
Natural Resources, Construction and Maintenance Occupations by Sex
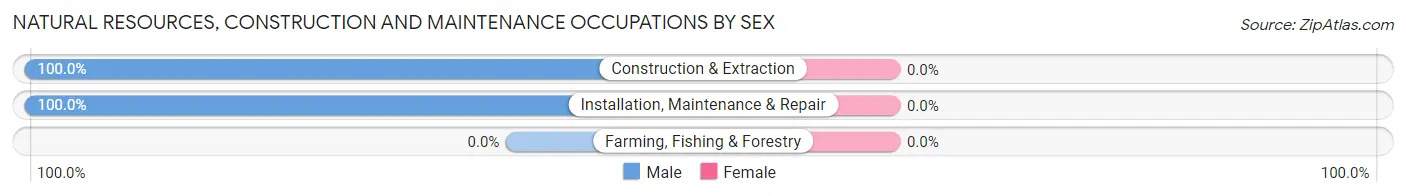
| Occupation | Male | Female |
| Farming, Fishing & Forestry | 0 (0.0%) | 0 (0.0%) |
| Construction & Extraction | 8 (100.0%) | 0 (0.0%) |
| Installation, Maintenance & Repair | 7 (100.0%) | 0 (0.0%) |
| Total (Category) | 15 (100.0%) | 0 (0.0%) |
| Total (Overall) | 176 (48.5%) | 187 (51.5%) |
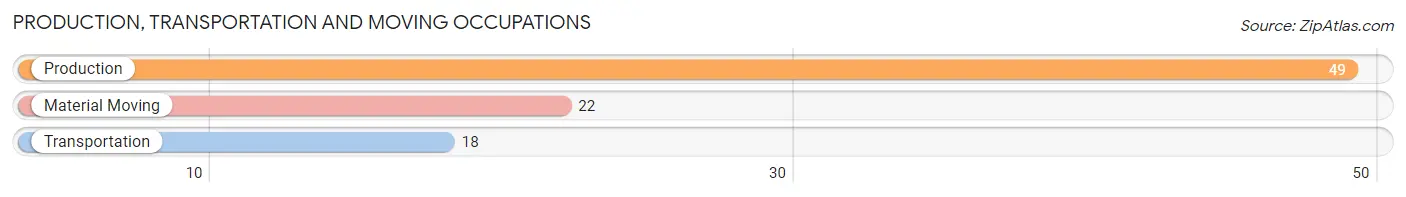
Production, Transportation and Moving Occupations
The most common Production, Transportation and Moving occupations in Superior are Production (49 | 13.5%), Material Moving (22 | 6.1%), and Transportation (18 | 5.0%).
Production, Transportation and Moving Occupations by Sex
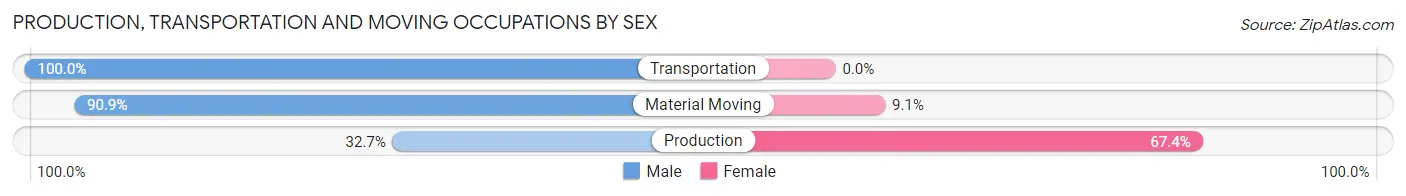
| Occupation | Male | Female |
| Production | 16 (32.7%) | 33 (67.3%) |
| Transportation | 18 (100.0%) | 0 (0.0%) |
| Material Moving | 20 (90.9%) | 2 (9.1%) |
| Total (Category) | 54 (60.7%) | 35 (39.3%) |
| Total (Overall) | 176 (48.5%) | 187 (51.5%) |
Employment Industries by Sex in Superior
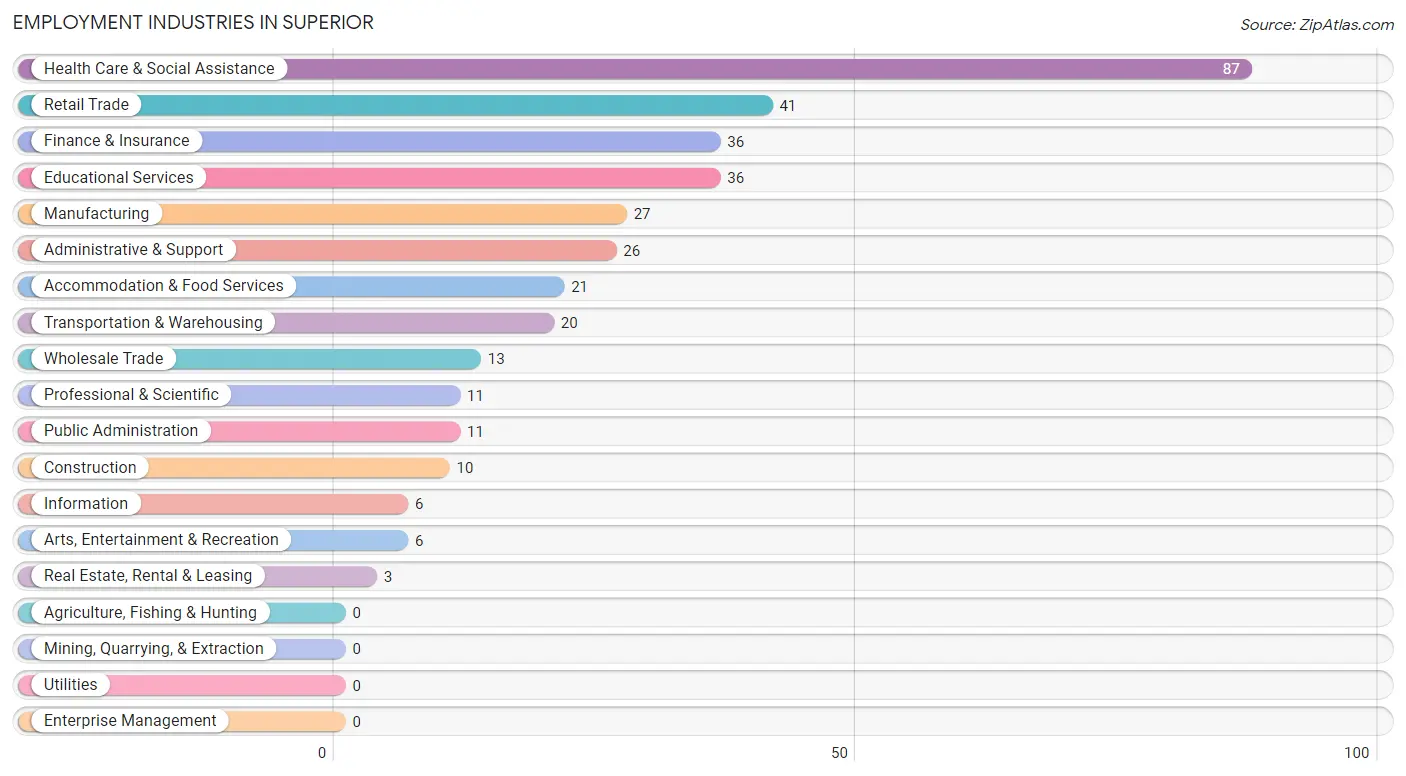
Employment Industries in Superior
The major employment industries in Superior include Health Care & Social Assistance (87 | 24.0%), Retail Trade (41 | 11.3%), Finance & Insurance (36 | 9.9%), Educational Services (36 | 9.9%), and Manufacturing (27 | 7.4%).
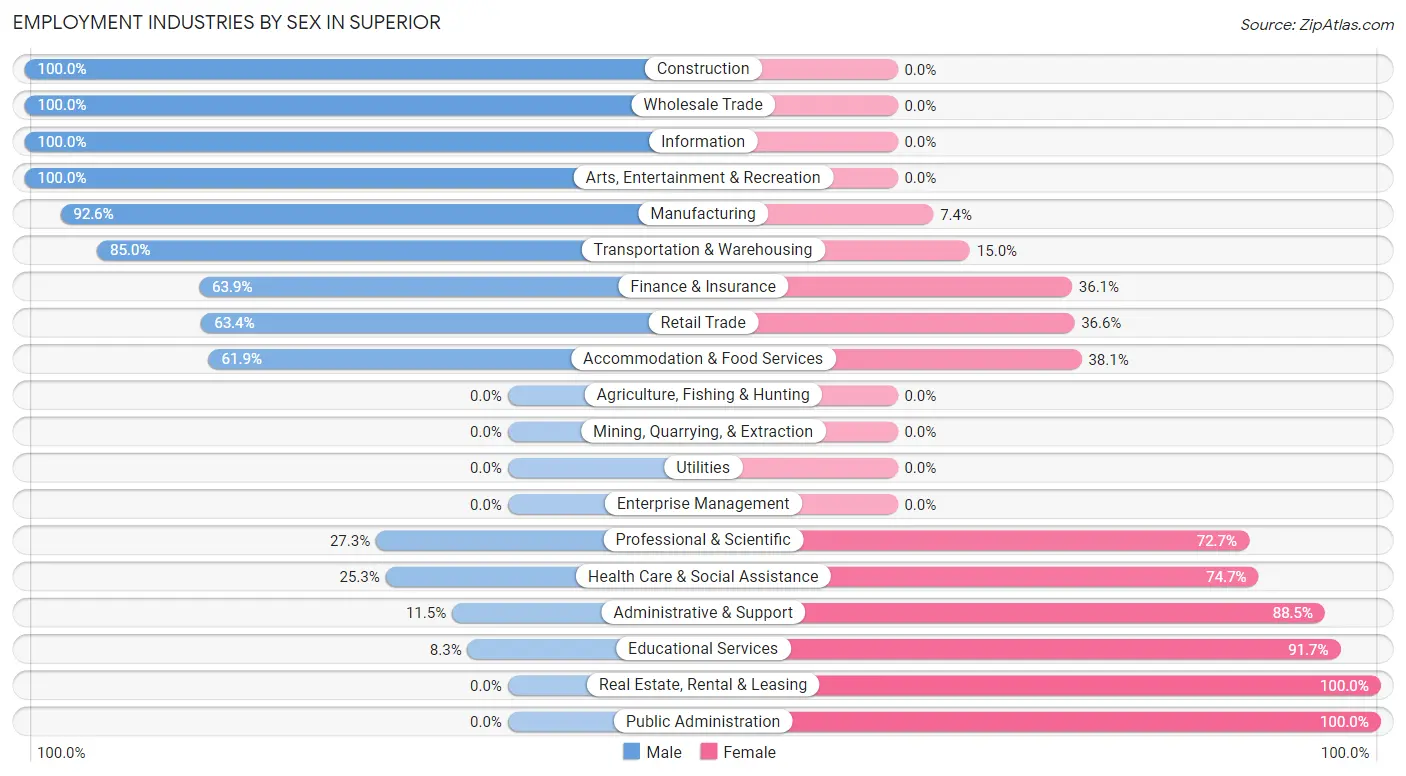
Employment Industries by Sex in Superior
The Superior industries that see more men than women are Construction (100.0%), Wholesale Trade (100.0%), and Information (100.0%), whereas the industries that tend to have a higher number of women are Real Estate, Rental & Leasing (100.0%), Public Administration (100.0%), and Educational Services (91.7%).
| Industry | Male | Female |
| Agriculture, Fishing & Hunting | 0 (0.0%) | 0 (0.0%) |
| Mining, Quarrying, & Extraction | 0 (0.0%) | 0 (0.0%) |
| Construction | 10 (100.0%) | 0 (0.0%) |
| Manufacturing | 25 (92.6%) | 2 (7.4%) |
| Wholesale Trade | 13 (100.0%) | 0 (0.0%) |
| Retail Trade | 26 (63.4%) | 15 (36.6%) |
| Transportation & Warehousing | 17 (85.0%) | 3 (15.0%) |
| Utilities | 0 (0.0%) | 0 (0.0%) |
| Information | 6 (100.0%) | 0 (0.0%) |
| Finance & Insurance | 23 (63.9%) | 13 (36.1%) |
| Real Estate, Rental & Leasing | 0 (0.0%) | 3 (100.0%) |
| Professional & Scientific | 3 (27.3%) | 8 (72.7%) |
| Enterprise Management | 0 (0.0%) | 0 (0.0%) |
| Administrative & Support | 3 (11.5%) | 23 (88.5%) |
| Educational Services | 3 (8.3%) | 33 (91.7%) |
| Health Care & Social Assistance | 22 (25.3%) | 65 (74.7%) |
| Arts, Entertainment & Recreation | 6 (100.0%) | 0 (0.0%) |
| Accommodation & Food Services | 13 (61.9%) | 8 (38.1%) |
| Public Administration | 0 (0.0%) | 11 (100.0%) |
| Total | 176 (48.5%) | 187 (51.5%) |
Education in Superior
School Enrollment in Superior
The most common levels of schooling among the 94 students in Superior are high school (42 | 44.7%), college / undergraduate (17 | 18.1%), and middle school (16 | 17.0%).
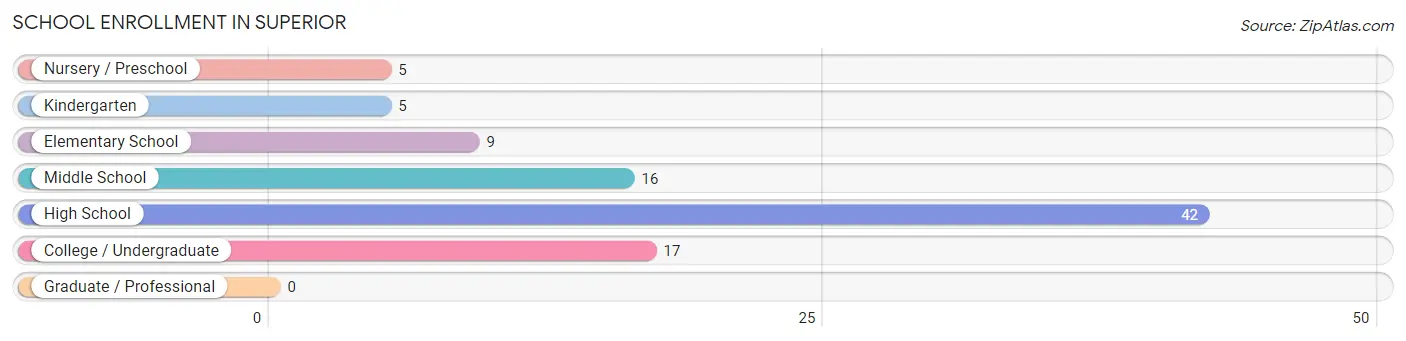
| School Level | # Students | % Students |
| Nursery / Preschool | 5 | 5.3% |
| Kindergarten | 5 | 5.3% |
| Elementary School | 9 | 9.6% |
| Middle School | 16 | 17.0% |
| High School | 42 | 44.7% |
| College / Undergraduate | 17 | 18.1% |
| Graduate / Professional | 0 | 0.0% |
| Total | 94 | 100.0% |
School Enrollment by Age by Funding Source in Superior
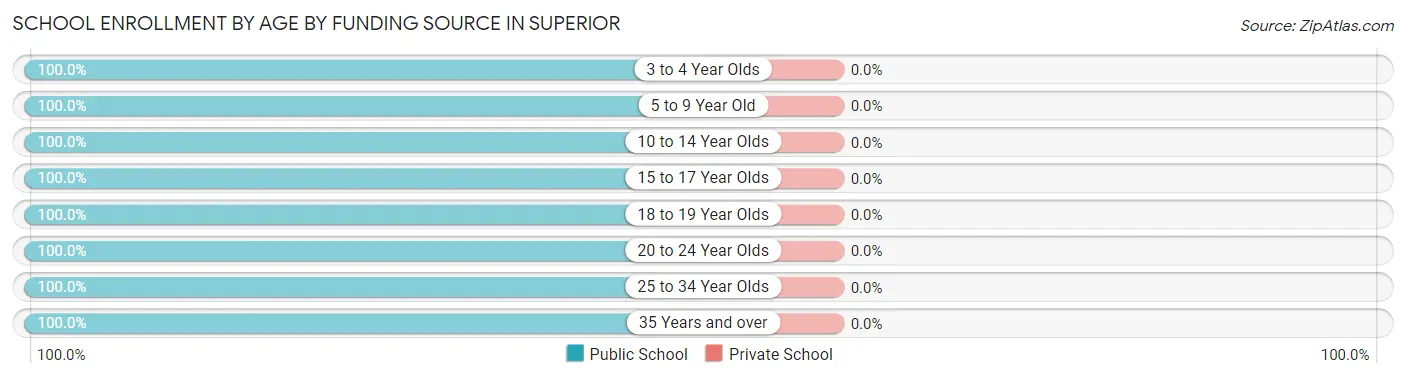
| Age Bracket | Public School | Private School |
| 3 to 4 Year Olds | 5 (100.0%) | 0 (0.0%) |
| 5 to 9 Year Old | 14 (100.0%) | 0 (0.0%) |
| 10 to 14 Year Olds | 19 (100.0%) | 0 (0.0%) |
| 15 to 17 Year Olds | 32 (100.0%) | 0 (0.0%) |
| 18 to 19 Year Olds | 7 (100.0%) | 0 (0.0%) |
| 20 to 24 Year Olds | 10 (100.0%) | 0 (0.0%) |
| 25 to 34 Year Olds | 5 (100.0%) | 0 (0.0%) |
| 35 Years and over | 2 (100.0%) | 0 (0.0%) |
| Total | 94 (100.0%) | 0 (0.0%) |
Educational Attainment by Field of Study in Superior
Arts & humanities (32 | 29.9%), science & technology (28 | 26.2%), education (19 | 17.8%), business (13 | 12.1%), and engineering (6 | 5.6%) are the most common fields of study among 107 individuals in Superior who have obtained a bachelor's degree or higher.
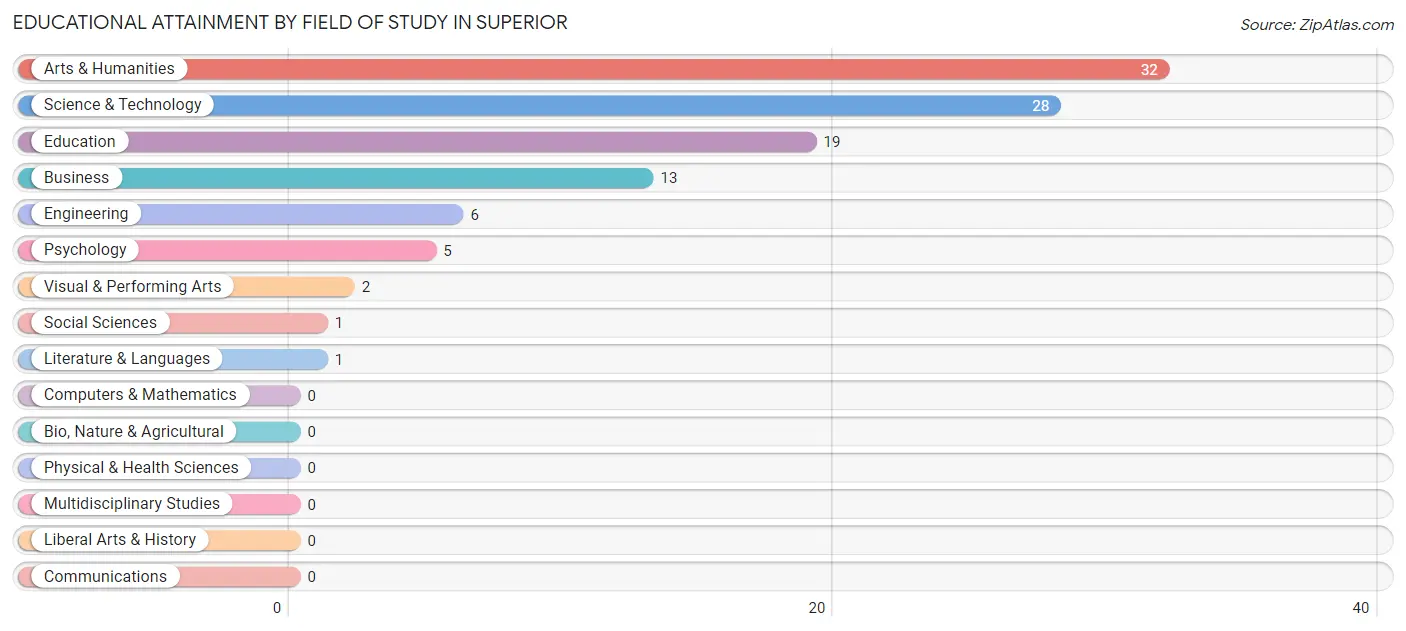
| Field of Study | # Graduates | % Graduates |
| Computers & Mathematics | 0 | 0.0% |
| Bio, Nature & Agricultural | 0 | 0.0% |
| Physical & Health Sciences | 0 | 0.0% |
| Psychology | 5 | 4.7% |
| Social Sciences | 1 | 0.9% |
| Engineering | 6 | 5.6% |
| Multidisciplinary Studies | 0 | 0.0% |
| Science & Technology | 28 | 26.2% |
| Business | 13 | 12.1% |
| Education | 19 | 17.8% |
| Literature & Languages | 1 | 0.9% |
| Liberal Arts & History | 0 | 0.0% |
| Visual & Performing Arts | 2 | 1.9% |
| Communications | 0 | 0.0% |
| Arts & Humanities | 32 | 29.9% |
| Total | 107 | 100.0% |
Transportation & Commute in Superior
Vehicle Availability by Sex in Superior
The most prevalent vehicle ownership categories in Superior are males with 2 vehicles (95, accounting for 58.3%) and females with 2 vehicles (111, making up 58.3%).
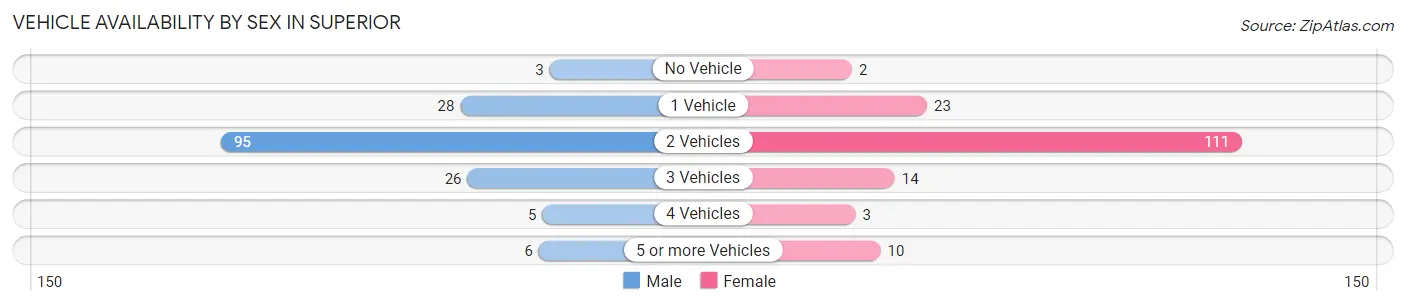
| Vehicles Available | Male | Female |
| No Vehicle | 3 (1.8%) | 2 (1.2%) |
| 1 Vehicle | 28 (17.2%) | 23 (14.1%) |
| 2 Vehicles | 95 (58.3%) | 111 (68.1%) |
| 3 Vehicles | 26 (16.0%) | 14 (8.6%) |
| 4 Vehicles | 5 (3.1%) | 3 (1.8%) |
| 5 or more Vehicles | 6 (3.7%) | 10 (6.1%) |
| Total | 163 (100.0%) | 163 (100.0%) |
Commute Time in Superior
The most frequently occuring commute durations in Superior are 10 to 14 minutes (98 commuters, 29.6%), 5 to 9 minutes (72 commuters, 21.7%), and 15 to 19 minutes (52 commuters, 15.7%).
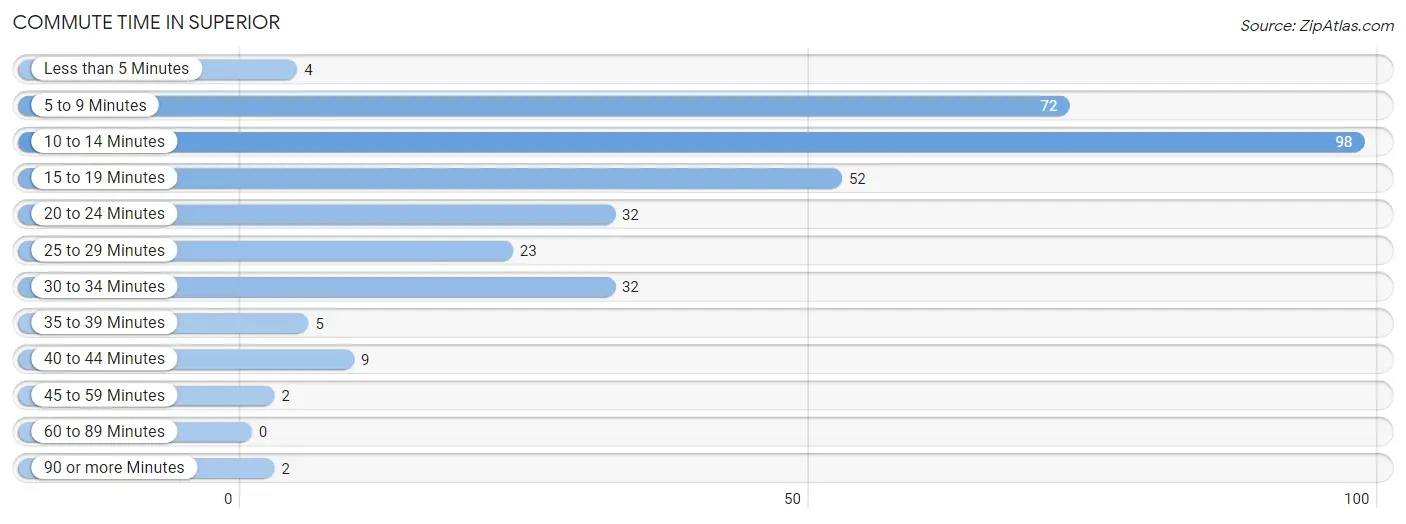
| Commute Time | # Commuters | % Commuters |
| Less than 5 Minutes | 4 | 1.2% |
| 5 to 9 Minutes | 72 | 21.7% |
| 10 to 14 Minutes | 98 | 29.6% |
| 15 to 19 Minutes | 52 | 15.7% |
| 20 to 24 Minutes | 32 | 9.7% |
| 25 to 29 Minutes | 23 | 7.0% |
| 30 to 34 Minutes | 32 | 9.7% |
| 35 to 39 Minutes | 5 | 1.5% |
| 40 to 44 Minutes | 9 | 2.7% |
| 45 to 59 Minutes | 2 | 0.6% |
| 60 to 89 Minutes | 0 | 0.0% |
| 90 or more Minutes | 2 | 0.6% |
Commute Time by Sex in Superior
The most common commute times in Superior are 5 to 9 minutes (49 commuters, 30.6%) for males and 10 to 14 minutes (64 commuters, 37.4%) for females.
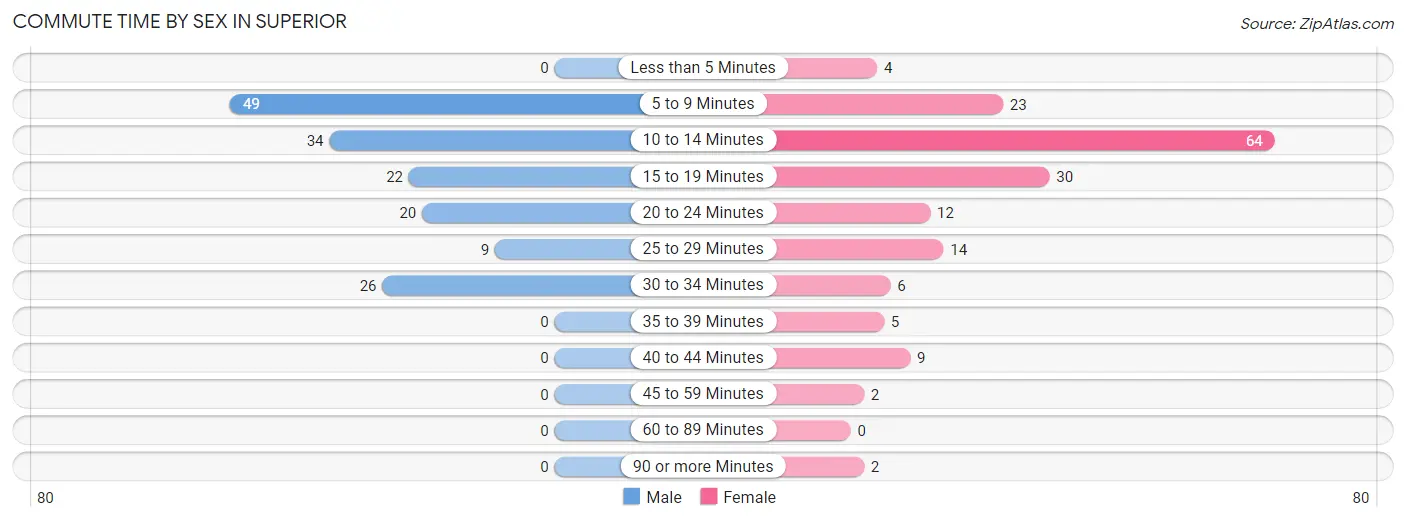
| Commute Time | Male | Female |
| Less than 5 Minutes | 0 (0.0%) | 4 (2.3%) |
| 5 to 9 Minutes | 49 (30.6%) | 23 (13.5%) |
| 10 to 14 Minutes | 34 (21.2%) | 64 (37.4%) |
| 15 to 19 Minutes | 22 (13.8%) | 30 (17.5%) |
| 20 to 24 Minutes | 20 (12.5%) | 12 (7.0%) |
| 25 to 29 Minutes | 9 (5.6%) | 14 (8.2%) |
| 30 to 34 Minutes | 26 (16.3%) | 6 (3.5%) |
| 35 to 39 Minutes | 0 (0.0%) | 5 (2.9%) |
| 40 to 44 Minutes | 0 (0.0%) | 9 (5.3%) |
| 45 to 59 Minutes | 0 (0.0%) | 2 (1.2%) |
| 60 to 89 Minutes | 0 (0.0%) | 0 (0.0%) |
| 90 or more Minutes | 0 (0.0%) | 2 (1.2%) |
Time of Departure to Work by Sex in Superior
The most frequent times of departure to work in Superior are 12:00 AM to 4:59 AM (35, 21.9%) for males and 8:30 AM to 8:59 AM (28, 16.4%) for females.
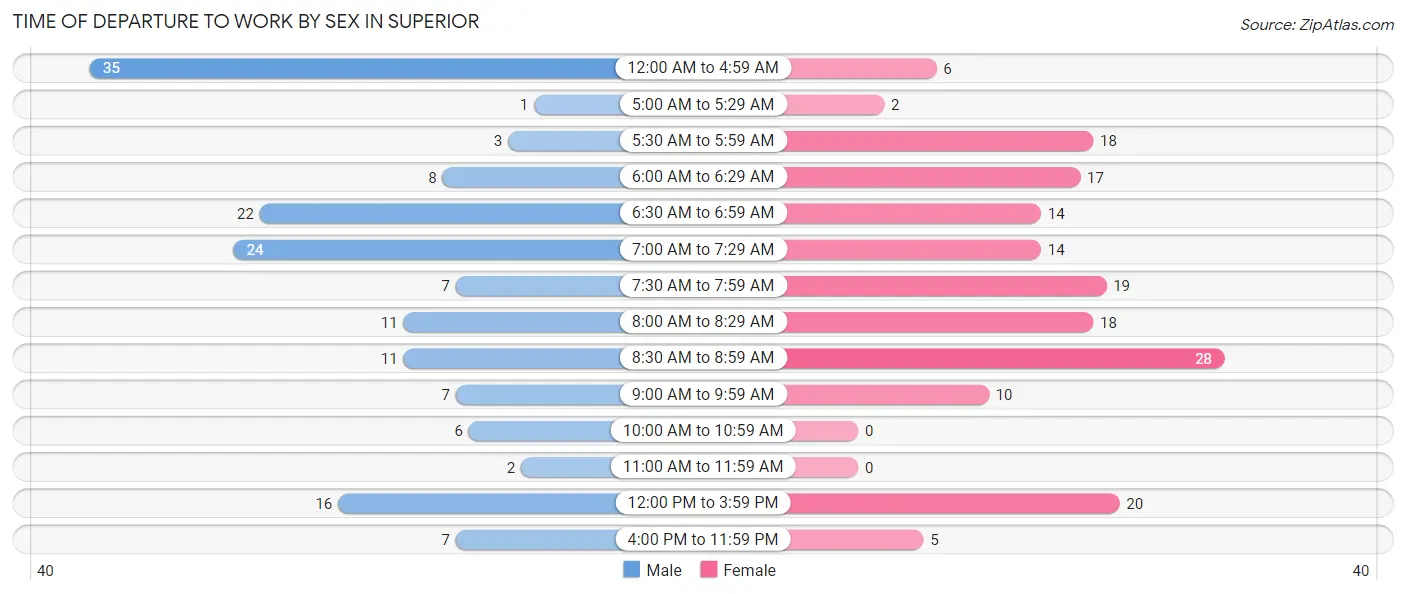
| Time of Departure | Male | Female |
| 12:00 AM to 4:59 AM | 35 (21.9%) | 6 (3.5%) |
| 5:00 AM to 5:29 AM | 1 (0.6%) | 2 (1.2%) |
| 5:30 AM to 5:59 AM | 3 (1.9%) | 18 (10.5%) |
| 6:00 AM to 6:29 AM | 8 (5.0%) | 17 (9.9%) |
| 6:30 AM to 6:59 AM | 22 (13.8%) | 14 (8.2%) |
| 7:00 AM to 7:29 AM | 24 (15.0%) | 14 (8.2%) |
| 7:30 AM to 7:59 AM | 7 (4.4%) | 19 (11.1%) |
| 8:00 AM to 8:29 AM | 11 (6.9%) | 18 (10.5%) |
| 8:30 AM to 8:59 AM | 11 (6.9%) | 28 (16.4%) |
| 9:00 AM to 9:59 AM | 7 (4.4%) | 10 (5.9%) |
| 10:00 AM to 10:59 AM | 6 (3.7%) | 0 (0.0%) |
| 11:00 AM to 11:59 AM | 2 (1.3%) | 0 (0.0%) |
| 12:00 PM to 3:59 PM | 16 (10.0%) | 20 (11.7%) |
| 4:00 PM to 11:59 PM | 7 (4.4%) | 5 (2.9%) |
| Total | 160 (100.0%) | 171 (100.0%) |
Housing Occupancy in Superior
Occupancy by Ownership in Superior
Of the total 11,661 dwellings in Superior, owner-occupied units account for 6,842 (58.7%), while renter-occupied units make up 4,819 (41.3%).
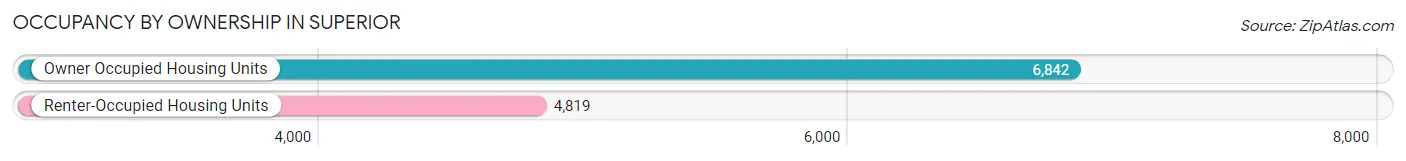
| Occupancy | # Housing Units | % Housing Units |
| Owner Occupied Housing Units | 6,842 | 58.7% |
| Renter-Occupied Housing Units | 4,819 | 41.3% |
| Total Occupied Housing Units | 11,661 | 100.0% |
Occupancy by Household Size in Superior
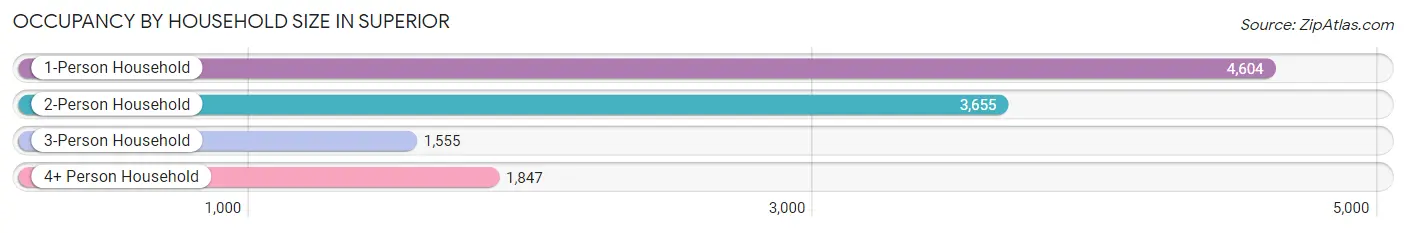
| Household Size | # Housing Units | % Housing Units |
| 1-Person Household | 4,604 | 39.5% |
| 2-Person Household | 3,655 | 31.3% |
| 3-Person Household | 1,555 | 13.3% |
| 4+ Person Household | 1,847 | 15.8% |
| Total Housing Units | 11,661 | 100.0% |
Occupancy by Ownership by Household Size in Superior
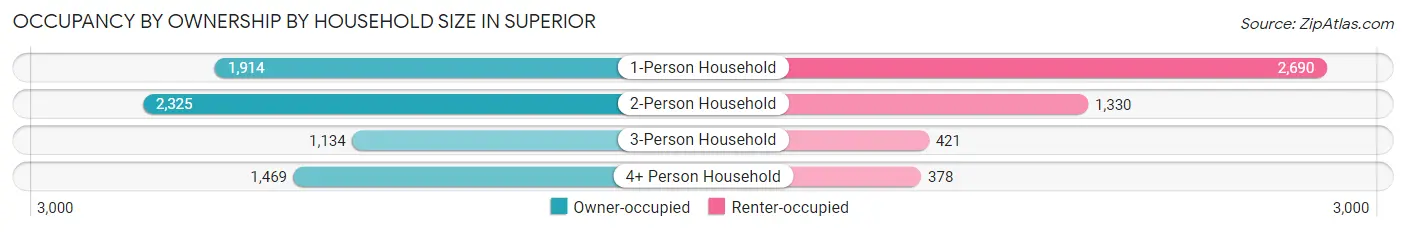
| Household Size | Owner-occupied | Renter-occupied |
| 1-Person Household | 1,914 (41.6%) | 2,690 (58.4%) |
| 2-Person Household | 2,325 (63.6%) | 1,330 (36.4%) |
| 3-Person Household | 1,134 (72.9%) | 421 (27.1%) |
| 4+ Person Household | 1,469 (79.5%) | 378 (20.5%) |
| Total Housing Units | 6,842 (58.7%) | 4,819 (41.3%) |
Occupancy by Educational Attainment in Superior
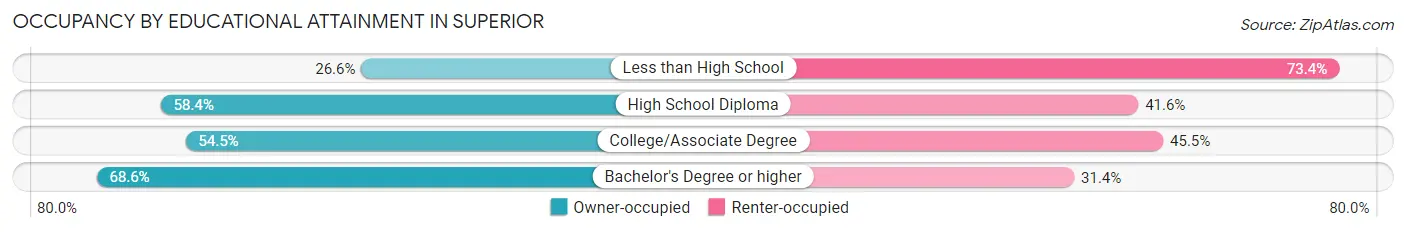
| Household Size | Owner-occupied | Renter-occupied |
| Less than High School | 133 (26.6%) | 367 (73.4%) |
| High School Diploma | 1,803 (58.4%) | 1,282 (41.6%) |
| College/Associate Degree | 2,450 (54.5%) | 2,046 (45.5%) |
| Bachelor's Degree or higher | 2,456 (68.6%) | 1,124 (31.4%) |
Occupancy by Age of Householder in Superior
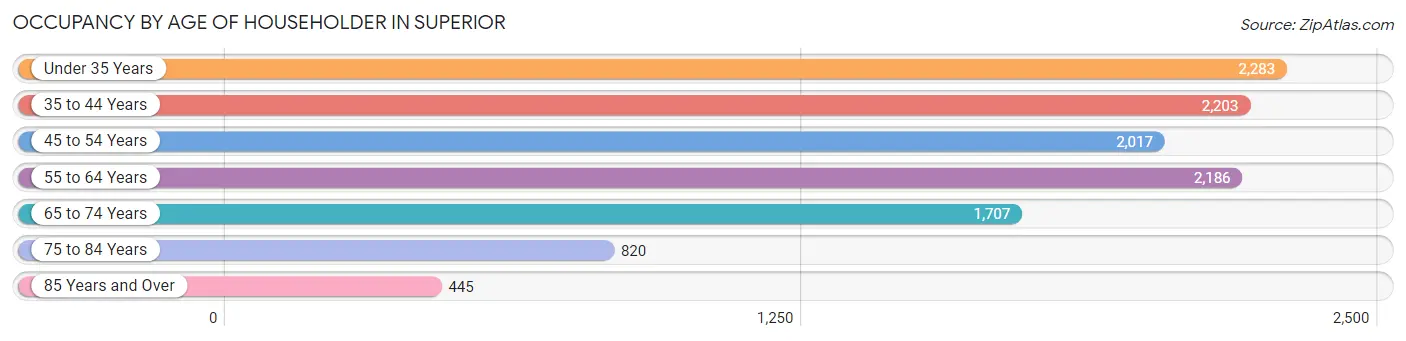
| Age Bracket | # Households | % Households |
| Under 35 Years | 2,283 | 19.6% |
| 35 to 44 Years | 2,203 | 18.9% |
| 45 to 54 Years | 2,017 | 17.3% |
| 55 to 64 Years | 2,186 | 18.8% |
| 65 to 74 Years | 1,707 | 14.6% |
| 75 to 84 Years | 820 | 7.0% |
| 85 Years and Over | 445 | 3.8% |
| Total | 11,661 | 100.0% |
Housing Finances in Superior
Median Income by Occupancy in Superior
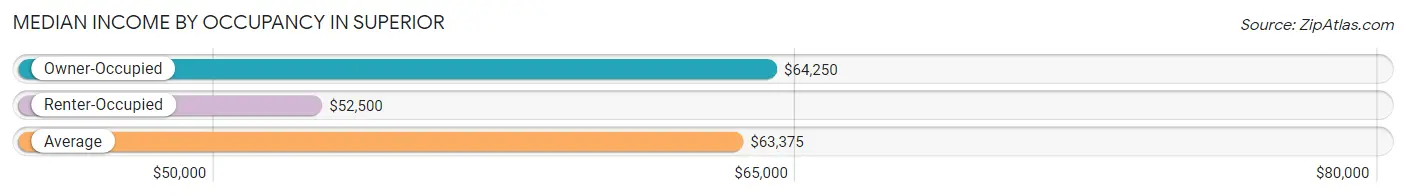
| Occupancy Type | # Households | Median Income |
| Owner-Occupied | 178 (59.7%) | $64,250 |
| Renter-Occupied | 120 (40.3%) | $52,500 |
| Average | 298 (100.0%) | $63,375 |
Occupancy by Householder Income Bracket in Superior
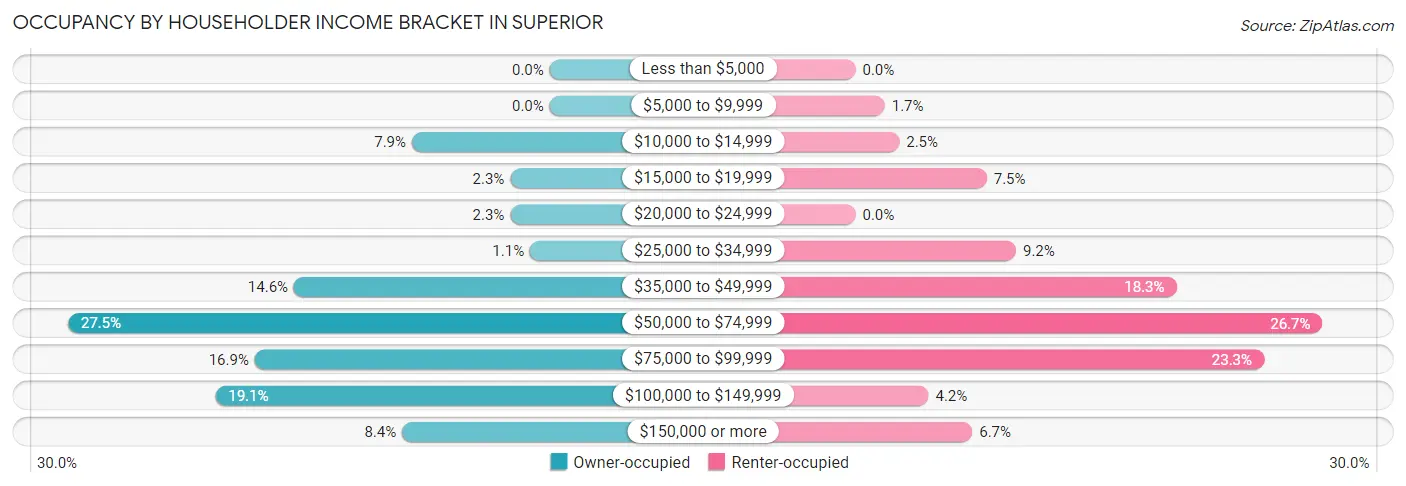
| Income Bracket | Owner-occupied | Renter-occupied |
| Less than $5,000 | 0 (0.0%) | 0 (0.0%) |
| $5,000 to $9,999 | 0 (0.0%) | 2 (1.7%) |
| $10,000 to $14,999 | 14 (7.9%) | 3 (2.5%) |
| $15,000 to $19,999 | 4 (2.2%) | 9 (7.5%) |
| $20,000 to $24,999 | 4 (2.2%) | 0 (0.0%) |
| $25,000 to $34,999 | 2 (1.1%) | 11 (9.2%) |
| $35,000 to $49,999 | 26 (14.6%) | 22 (18.3%) |
| $50,000 to $74,999 | 49 (27.5%) | 32 (26.7%) |
| $75,000 to $99,999 | 30 (16.9%) | 28 (23.3%) |
| $100,000 to $149,999 | 34 (19.1%) | 5 (4.2%) |
| $150,000 or more | 15 (8.4%) | 8 (6.7%) |
| Total | 178 (100.0%) | 120 (100.0%) |
Monthly Housing Cost Tiers in Superior
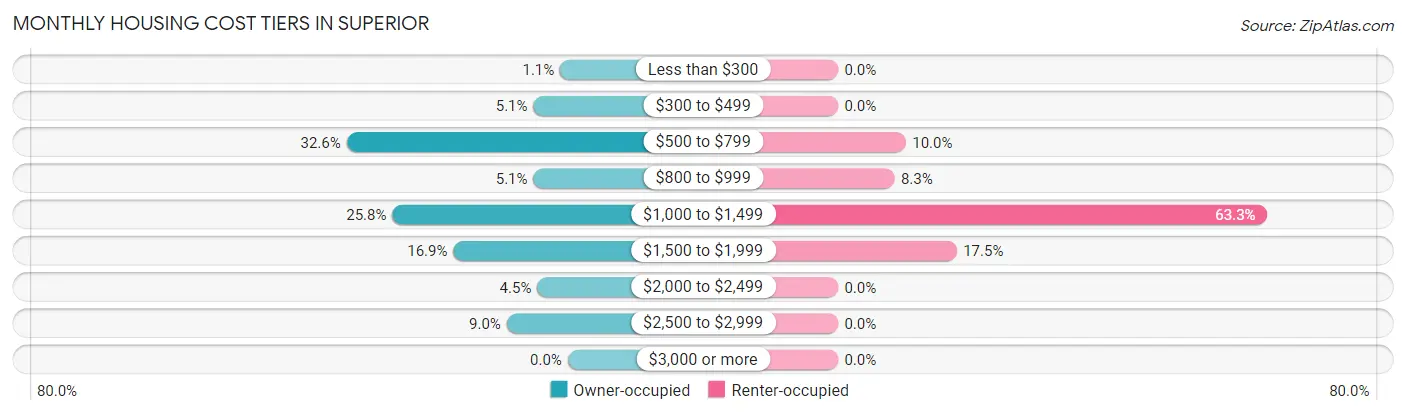
| Monthly Cost | Owner-occupied | Renter-occupied |
| Less than $300 | 2 (1.1%) | 0 (0.0%) |
| $300 to $499 | 9 (5.1%) | 0 (0.0%) |
| $500 to $799 | 58 (32.6%) | 12 (10.0%) |
| $800 to $999 | 9 (5.1%) | 10 (8.3%) |
| $1,000 to $1,499 | 46 (25.8%) | 76 (63.3%) |
| $1,500 to $1,999 | 30 (16.9%) | 21 (17.5%) |
| $2,000 to $2,499 | 8 (4.5%) | 0 (0.0%) |
| $2,500 to $2,999 | 16 (9.0%) | 0 (0.0%) |
| $3,000 or more | 0 (0.0%) | 0 (0.0%) |
| Total | 178 (100.0%) | 120 (100.0%) |
Physical Housing Characteristics in Superior
Housing Structures in Superior
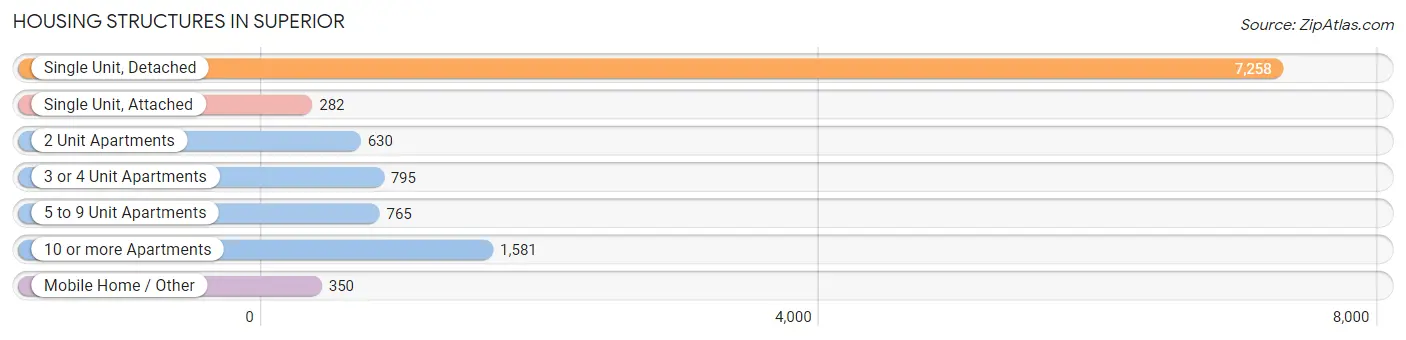
| Structure Type | # Housing Units | % Housing Units |
| Single Unit, Detached | 7,258 | 62.2% |
| Single Unit, Attached | 282 | 2.4% |
| 2 Unit Apartments | 630 | 5.4% |
| 3 or 4 Unit Apartments | 795 | 6.8% |
| 5 to 9 Unit Apartments | 765 | 6.6% |
| 10 or more Apartments | 1,581 | 13.6% |
| Mobile Home / Other | 350 | 3.0% |
| Total | 11,661 | 100.0% |
Housing Structures by Occupancy in Superior
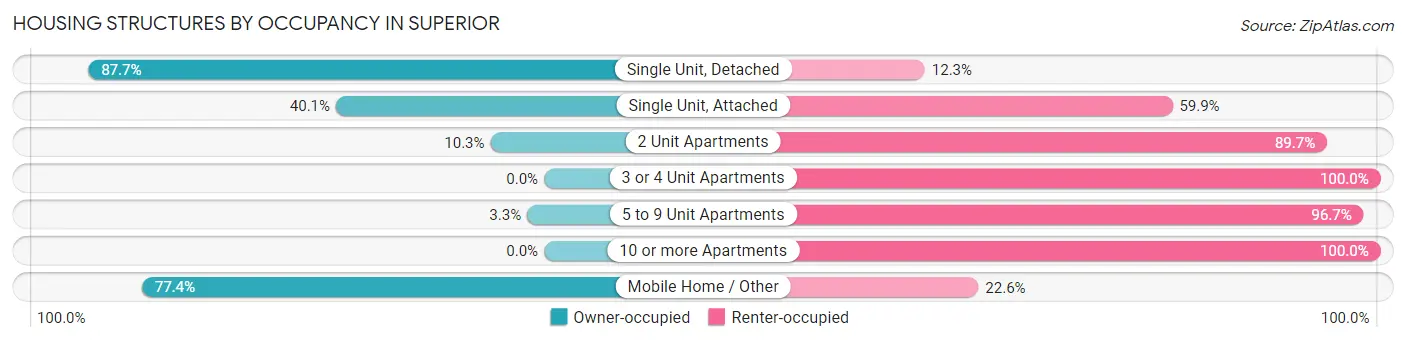
| Structure Type | Owner-occupied | Renter-occupied |
| Single Unit, Detached | 6,368 (87.7%) | 890 (12.3%) |
| Single Unit, Attached | 113 (40.1%) | 169 (59.9%) |
| 2 Unit Apartments | 65 (10.3%) | 565 (89.7%) |
| 3 or 4 Unit Apartments | 0 (0.0%) | 795 (100.0%) |
| 5 to 9 Unit Apartments | 25 (3.3%) | 740 (96.7%) |
| 10 or more Apartments | 0 (0.0%) | 1,581 (100.0%) |
| Mobile Home / Other | 271 (77.4%) | 79 (22.6%) |
| Total | 6,842 (58.7%) | 4,819 (41.3%) |
Housing Structures by Number of Rooms in Superior
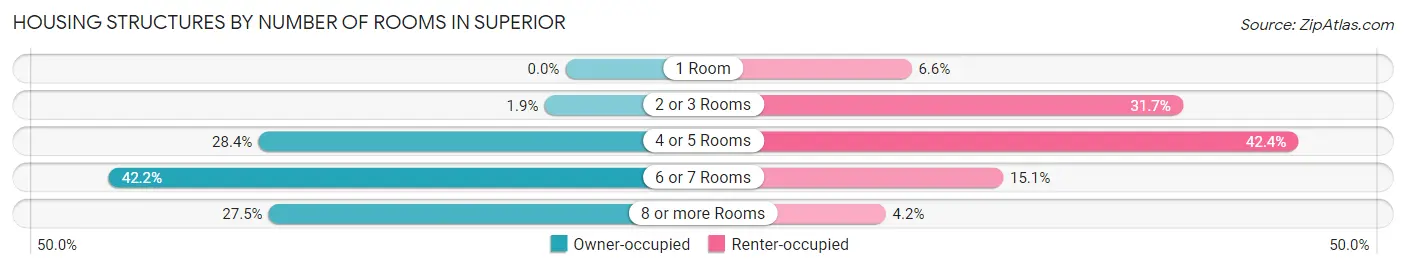
| Number of Rooms | Owner-occupied | Renter-occupied |
| 1 Room | 0 (0.0%) | 319 (6.6%) |
| 2 or 3 Rooms | 133 (1.9%) | 1,527 (31.7%) |
| 4 or 5 Rooms | 1,943 (28.4%) | 2,042 (42.4%) |
| 6 or 7 Rooms | 2,888 (42.2%) | 727 (15.1%) |
| 8 or more Rooms | 1,878 (27.5%) | 204 (4.2%) |
| Total | 6,842 (100.0%) | 4,819 (100.0%) |
Housing Structure by Heating Type in Superior
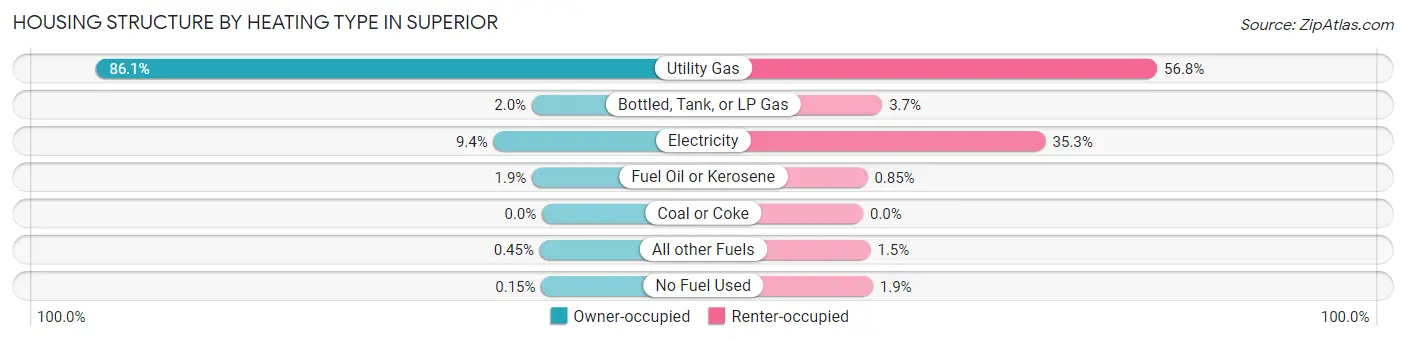
| Heating Type | Owner-occupied | Renter-occupied |
| Utility Gas | 5,894 (86.1%) | 2,738 (56.8%) |
| Bottled, Tank, or LP Gas | 134 (2.0%) | 179 (3.7%) |
| Electricity | 642 (9.4%) | 1,700 (35.3%) |
| Fuel Oil or Kerosene | 131 (1.9%) | 41 (0.9%) |
| Coal or Coke | 0 (0.0%) | 0 (0.0%) |
| All other Fuels | 31 (0.4%) | 70 (1.5%) |
| No Fuel Used | 10 (0.2%) | 91 (1.9%) |
| Total | 6,842 (100.0%) | 4,819 (100.0%) |
Household Vehicle Usage in Superior
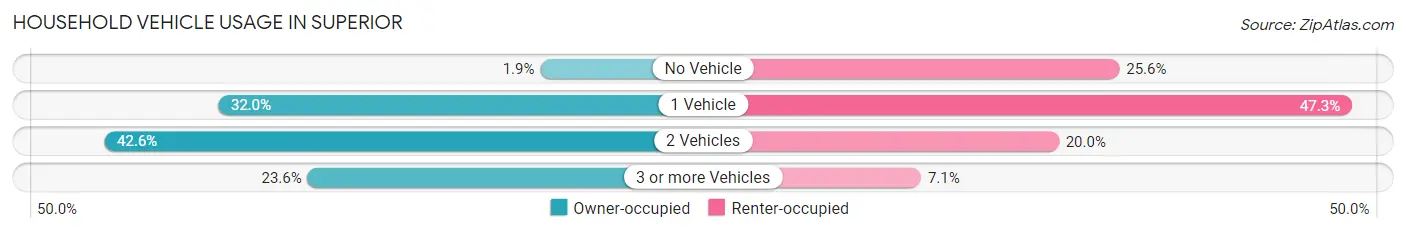
| Vehicles per Household | Owner-occupied | Renter-occupied |
| No Vehicle | 127 (1.9%) | 1,234 (25.6%) |
| 1 Vehicle | 2,187 (32.0%) | 2,281 (47.3%) |
| 2 Vehicles | 2,914 (42.6%) | 962 (20.0%) |
| 3 or more Vehicles | 1,614 (23.6%) | 342 (7.1%) |
| Total | 6,842 (100.0%) | 4,819 (100.0%) |
Real Estate & Mortgages in Superior
Real Estate and Mortgage Overview in Superior
| Characteristic | Without Mortgage | With Mortgage |
| Housing Units | 2,658 | 108 |
| Median Property Value | $138,800 | $240,000 |
| Median Household Income | $53,160 | $14 |
| Monthly Housing Costs | $584 | $0 |
| Real Estate Taxes | $2,524 | $0 |
Property Value by Mortgage Status in Superior
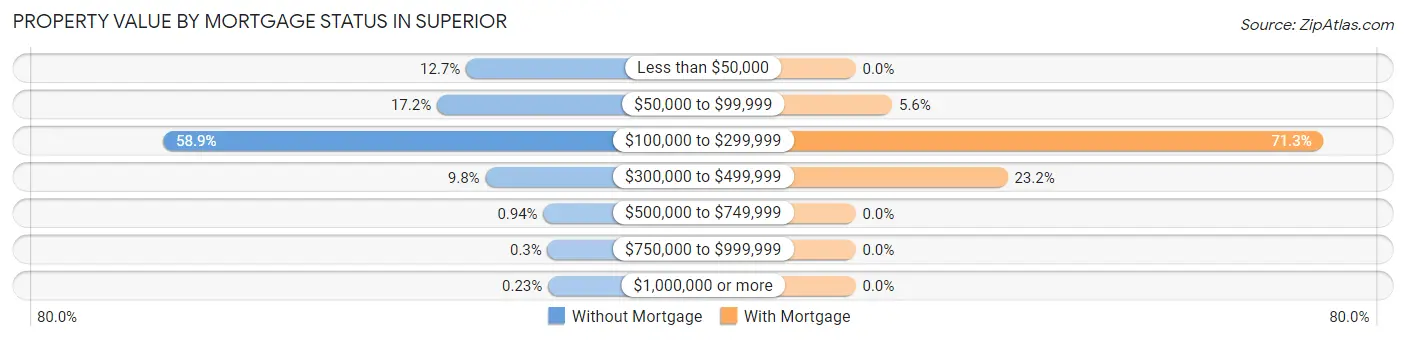
| Property Value | Without Mortgage | With Mortgage |
| Less than $50,000 | 338 (12.7%) | 0 (0.0%) |
| $50,000 to $99,999 | 456 (17.2%) | 6 (5.6%) |
| $100,000 to $299,999 | 1,565 (58.9%) | 77 (71.3%) |
| $300,000 to $499,999 | 260 (9.8%) | 25 (23.2%) |
| $500,000 to $749,999 | 25 (0.9%) | 0 (0.0%) |
| $750,000 to $999,999 | 8 (0.3%) | 0 (0.0%) |
| $1,000,000 or more | 6 (0.2%) | 0 (0.0%) |
| Total | 2,658 (100.0%) | 108 (100.0%) |
Household Income by Mortgage Status in Superior
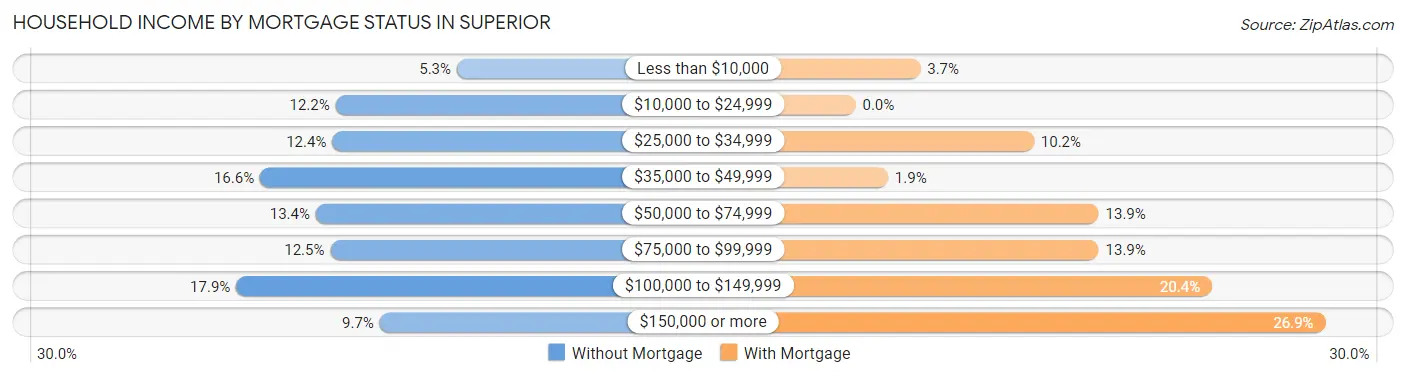
| Household Income | Without Mortgage | With Mortgage |
| Less than $10,000 | 141 (5.3%) | 4 (3.7%) |
| $10,000 to $24,999 | 325 (12.2%) | 0 (0.0%) |
| $25,000 to $34,999 | 330 (12.4%) | 11 (10.2%) |
| $35,000 to $49,999 | 440 (16.6%) | 2 (1.8%) |
| $50,000 to $74,999 | 355 (13.4%) | 15 (13.9%) |
| $75,000 to $99,999 | 333 (12.5%) | 15 (13.9%) |
| $100,000 to $149,999 | 476 (17.9%) | 22 (20.4%) |
| $150,000 or more | 258 (9.7%) | 29 (26.9%) |
| Total | 2,658 (100.0%) | 108 (100.0%) |
Property Value to Household Income Ratio in Superior
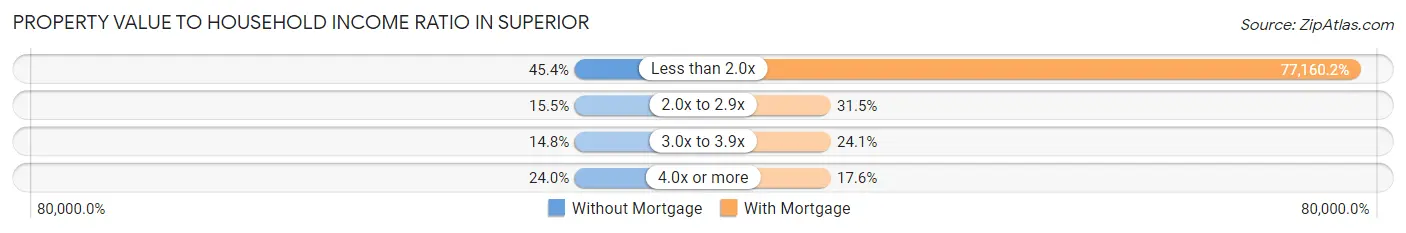
| Value-to-Income Ratio | Without Mortgage | With Mortgage |
| Less than 2.0x | 1,207 (45.4%) | 83,333 (77,160.2%) |
| 2.0x to 2.9x | 413 (15.5%) | 34 (31.5%) |
| 3.0x to 3.9x | 394 (14.8%) | 26 (24.1%) |
| 4.0x or more | 637 (24.0%) | 19 (17.6%) |
| Total | 2,658 (100.0%) | 108 (100.0%) |
Real Estate Taxes by Mortgage Status in Superior
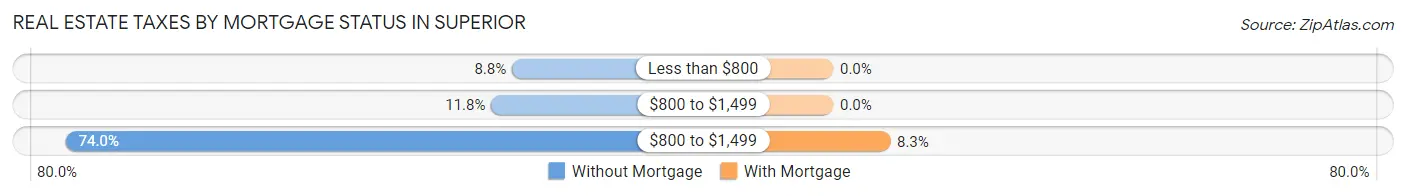
| Property Taxes | Without Mortgage | With Mortgage |
| Less than $800 | 233 (8.8%) | 0 (0.0%) |
| $800 to $1,499 | 314 (11.8%) | 0 (0.0%) |
| $800 to $1,499 | 1,967 (74.0%) | 9 (8.3%) |
| Total | 2,658 (100.0%) | 108 (100.0%) |
Health & Disability in Superior
Health Insurance Coverage by Age in Superior
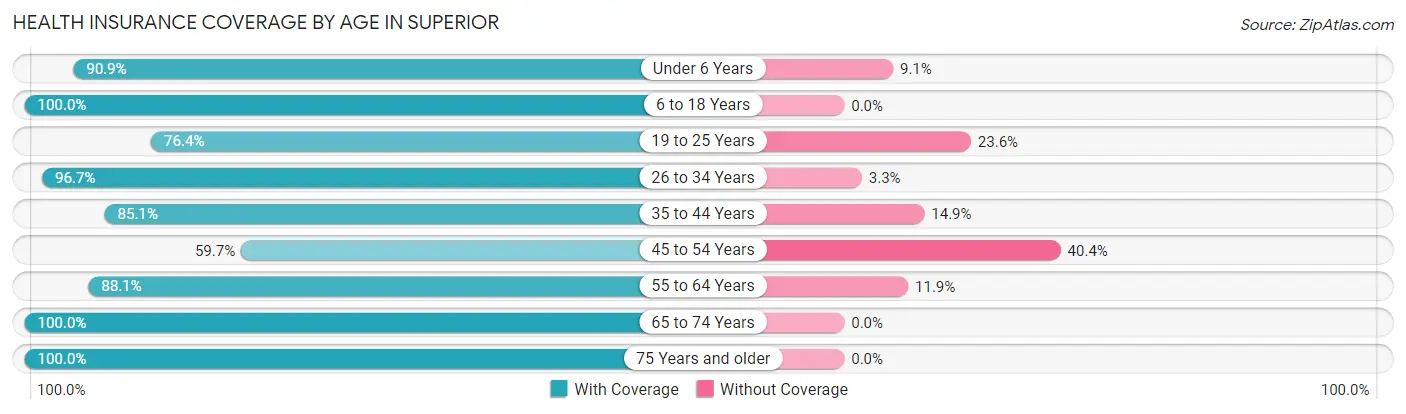
| Age Bracket | With Coverage | Without Coverage |
| Under 6 Years | 20 (90.9%) | 2 (9.1%) |
| 6 to 18 Years | 72 (100.0%) | 0 (0.0%) |
| 19 to 25 Years | 55 (76.4%) | 17 (23.6%) |
| 26 to 34 Years | 59 (96.7%) | 2 (3.3%) |
| 35 to 44 Years | 57 (85.1%) | 10 (14.9%) |
| 45 to 54 Years | 34 (59.7%) | 23 (40.4%) |
| 55 to 64 Years | 111 (88.1%) | 15 (11.9%) |
| 65 to 74 Years | 104 (100.0%) | 0 (0.0%) |
| 75 Years and older | 44 (100.0%) | 0 (0.0%) |
| Total | 556 (89.0%) | 69 (11.0%) |
Health Insurance Coverage by Citizenship Status in Superior
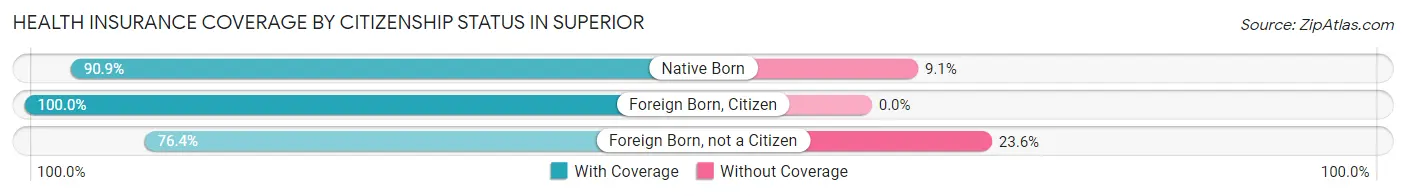
| Citizenship Status | With Coverage | Without Coverage |
| Native Born | 20 (90.9%) | 2 (9.1%) |
| Foreign Born, Citizen | 72 (100.0%) | 0 (0.0%) |
| Foreign Born, not a Citizen | 55 (76.4%) | 17 (23.6%) |
Health Insurance Coverage by Household Income in Superior
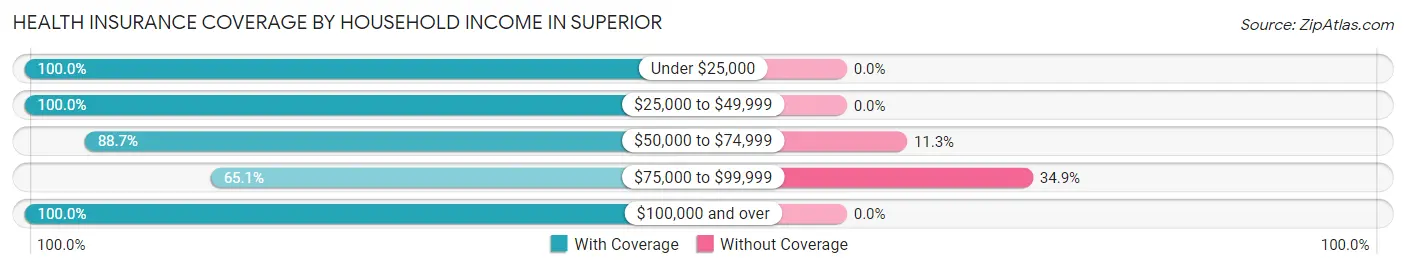
| Household Income | With Coverage | Without Coverage |
| Under $25,000 | 38 (100.0%) | 0 (0.0%) |
| $25,000 to $49,999 | 83 (100.0%) | 0 (0.0%) |
| $50,000 to $74,999 | 126 (88.7%) | 16 (11.3%) |
| $75,000 to $99,999 | 99 (65.1%) | 53 (34.9%) |
| $100,000 and over | 179 (100.0%) | 0 (0.0%) |
Public vs Private Health Insurance Coverage by Age in Superior
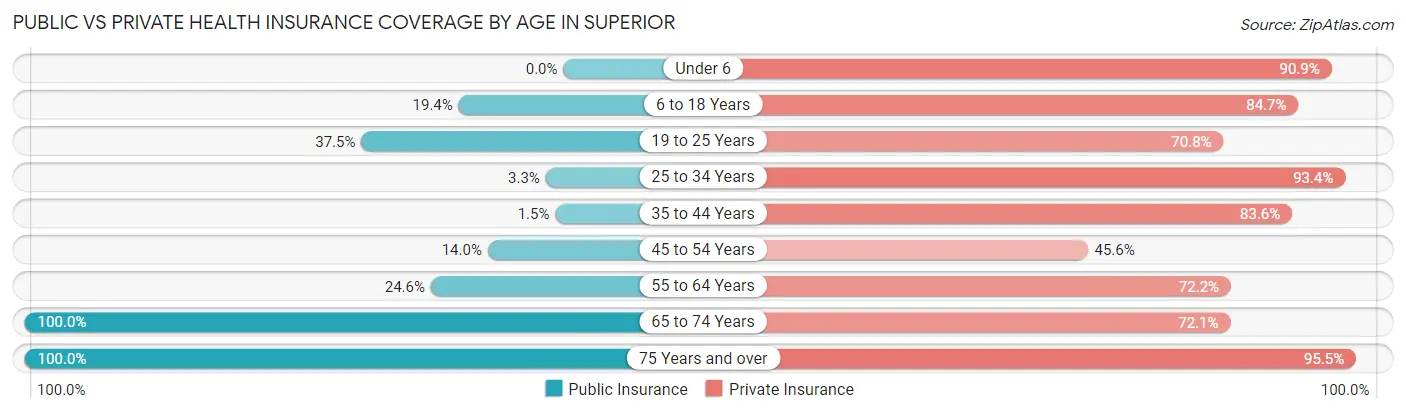
| Age Bracket | Public Insurance | Private Insurance |
| Under 6 | 0 (0.0%) | 20 (90.9%) |
| 6 to 18 Years | 14 (19.4%) | 61 (84.7%) |
| 19 to 25 Years | 27 (37.5%) | 51 (70.8%) |
| 25 to 34 Years | 2 (3.3%) | 57 (93.4%) |
| 35 to 44 Years | 1 (1.5%) | 56 (83.6%) |
| 45 to 54 Years | 8 (14.0%) | 26 (45.6%) |
| 55 to 64 Years | 31 (24.6%) | 91 (72.2%) |
| 65 to 74 Years | 104 (100.0%) | 75 (72.1%) |
| 75 Years and over | 44 (100.0%) | 42 (95.5%) |
| Total | 231 (37.0%) | 479 (76.6%) |
Disability Status by Sex by Age in Superior
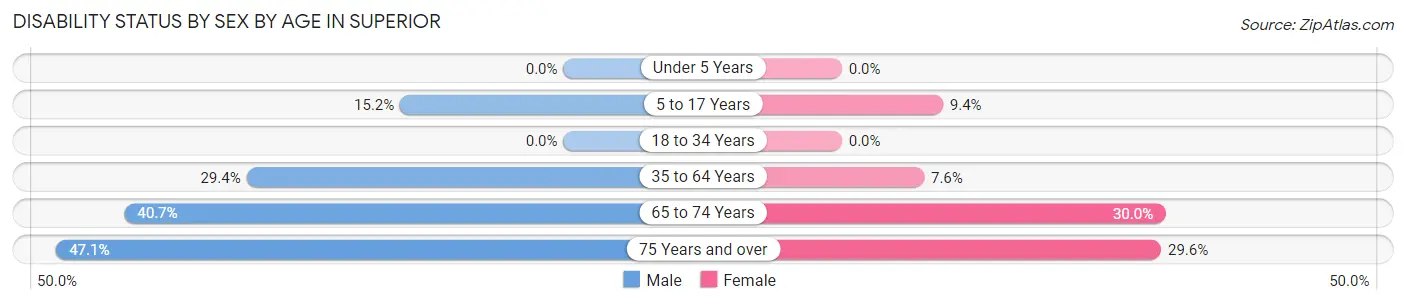
| Age Bracket | Male | Female |
| Under 5 Years | 0 (0.0%) | 0 (0.0%) |
| 5 to 17 Years | 5 (15.1%) | 3 (9.4%) |
| 18 to 34 Years | 0 (0.0%) | 0 (0.0%) |
| 35 to 64 Years | 35 (29.4%) | 10 (7.6%) |
| 65 to 74 Years | 22 (40.7%) | 15 (30.0%) |
| 75 Years and over | 8 (47.1%) | 8 (29.6%) |
Disability Class by Sex by Age in Superior
Disability Class: Hearing Difficulty
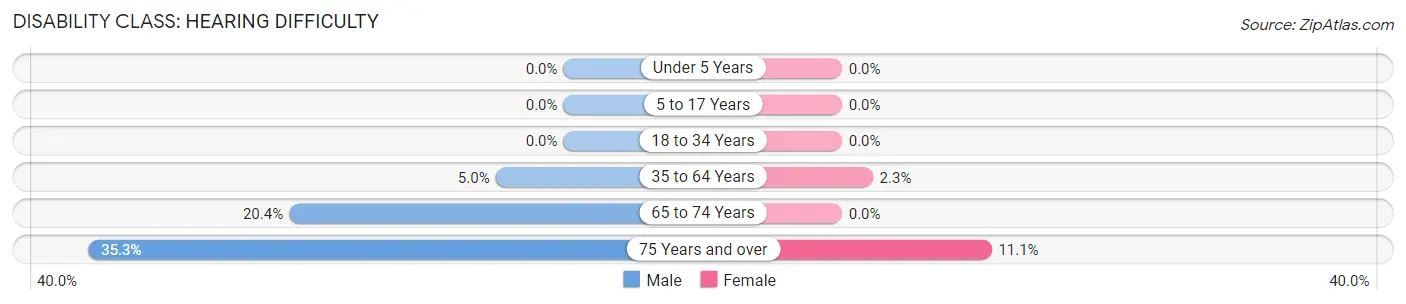
| Age Bracket | Male | Female |
| Under 5 Years | 0 (0.0%) | 0 (0.0%) |
| 5 to 17 Years | 0 (0.0%) | 0 (0.0%) |
| 18 to 34 Years | 0 (0.0%) | 0 (0.0%) |
| 35 to 64 Years | 6 (5.0%) | 3 (2.3%) |
| 65 to 74 Years | 11 (20.4%) | 0 (0.0%) |
| 75 Years and over | 6 (35.3%) | 3 (11.1%) |
Disability Class: Vision Difficulty
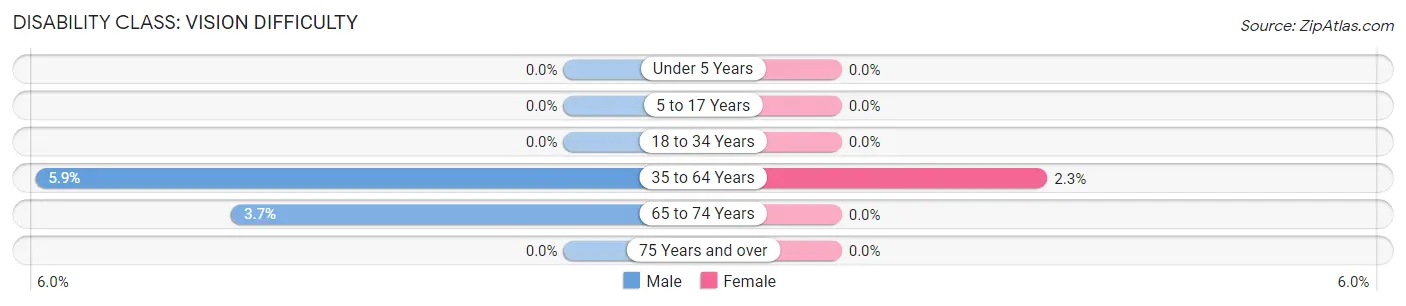
| Age Bracket | Male | Female |
| Under 5 Years | 0 (0.0%) | 0 (0.0%) |
| 5 to 17 Years | 0 (0.0%) | 0 (0.0%) |
| 18 to 34 Years | 0 (0.0%) | 0 (0.0%) |
| 35 to 64 Years | 7 (5.9%) | 3 (2.3%) |
| 65 to 74 Years | 2 (3.7%) | 0 (0.0%) |
| 75 Years and over | 0 (0.0%) | 0 (0.0%) |
Disability Class: Cognitive Difficulty
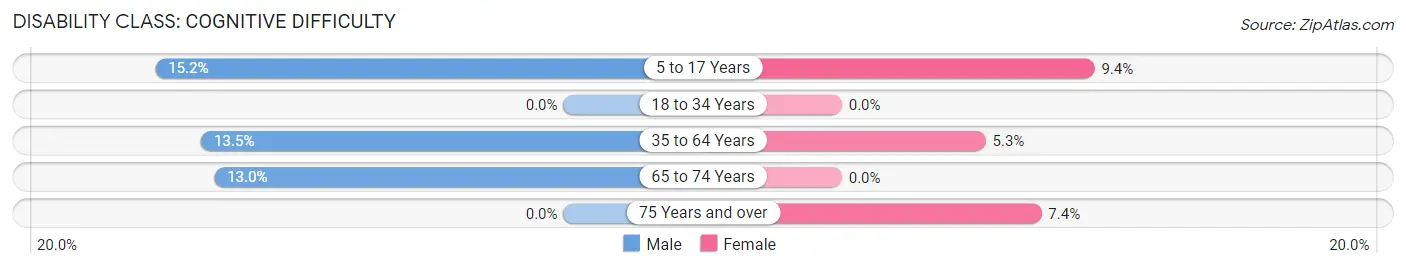
| Age Bracket | Male | Female |
| 5 to 17 Years | 5 (15.1%) | 3 (9.4%) |
| 18 to 34 Years | 0 (0.0%) | 0 (0.0%) |
| 35 to 64 Years | 16 (13.5%) | 7 (5.3%) |
| 65 to 74 Years | 7 (13.0%) | 0 (0.0%) |
| 75 Years and over | 0 (0.0%) | 2 (7.4%) |
Disability Class: Ambulatory Difficulty
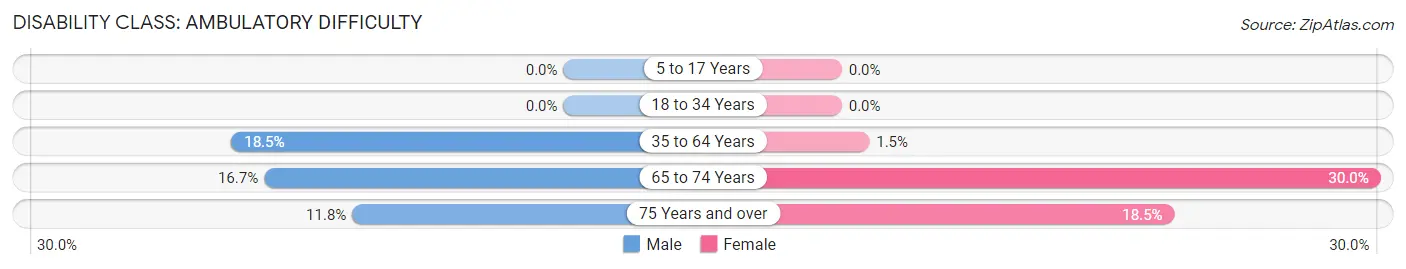
| Age Bracket | Male | Female |
| 5 to 17 Years | 0 (0.0%) | 0 (0.0%) |
| 18 to 34 Years | 0 (0.0%) | 0 (0.0%) |
| 35 to 64 Years | 22 (18.5%) | 2 (1.5%) |
| 65 to 74 Years | 9 (16.7%) | 15 (30.0%) |
| 75 Years and over | 2 (11.8%) | 5 (18.5%) |
Disability Class: Self-Care Difficulty
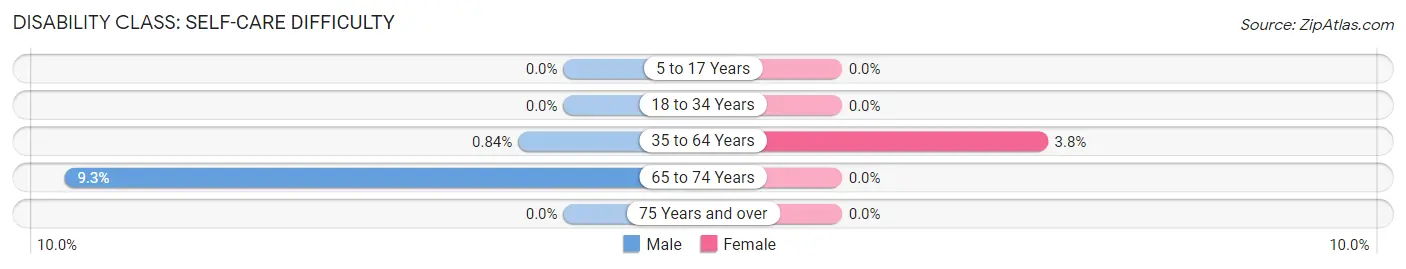
| Age Bracket | Male | Female |
| 5 to 17 Years | 0 (0.0%) | 0 (0.0%) |
| 18 to 34 Years | 0 (0.0%) | 0 (0.0%) |
| 35 to 64 Years | 1 (0.8%) | 5 (3.8%) |
| 65 to 74 Years | 5 (9.3%) | 0 (0.0%) |
| 75 Years and over | 0 (0.0%) | 0 (0.0%) |
Technology Access in Superior
Computing Device Access in Superior
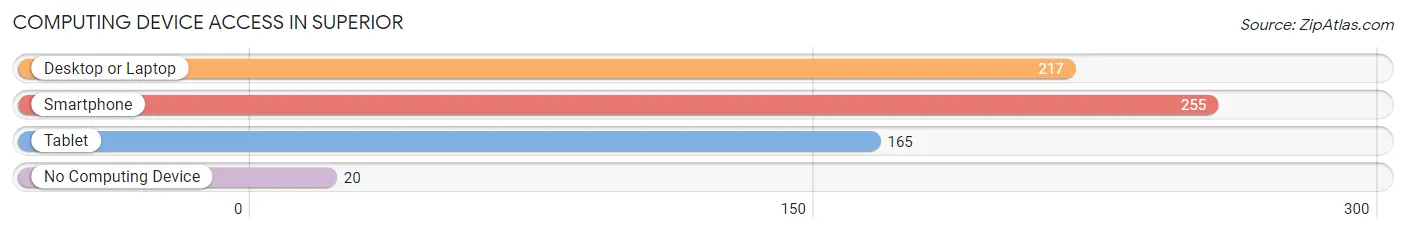
| Device Type | # Households | % Households |
| Desktop or Laptop | 217 | 72.8% |
| Smartphone | 255 | 85.6% |
| Tablet | 165 | 55.4% |
| No Computing Device | 20 | 6.7% |
| Total | 298 | 100.0% |
Internet Access in Superior
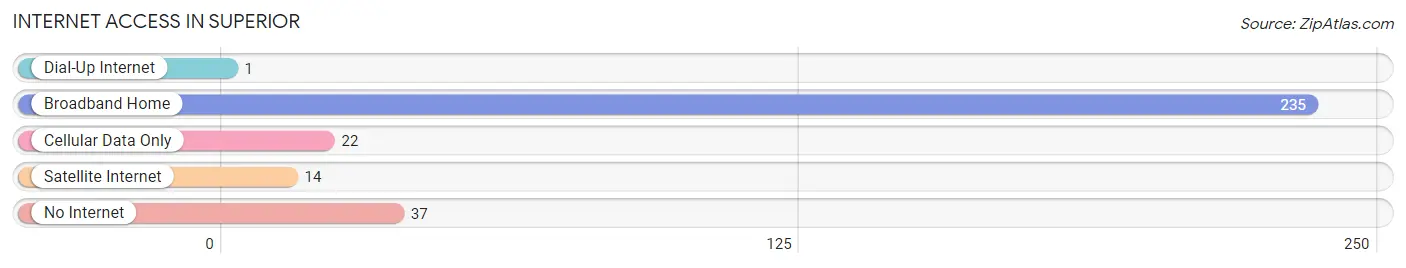
| Internet Type | # Households | % Households |
| Dial-Up Internet | 1 | 0.3% |
| Broadband Home | 235 | 78.9% |
| Cellular Data Only | 22 | 7.4% |
| Satellite Internet | 14 | 4.7% |
| No Internet | 37 | 12.4% |
| Total | 298 | 100.0% |
Superior Summary
History
Superior, Wisconsin is a city located in Douglas County, Wisconsin, United States. It is the county seat of Douglas County and is located on the western end of Lake Superior. The city was founded in 1854 by settlers from the nearby city of Superior, Minnesota. The city was named after the nearby lake, which was named by French explorers in 1622.
The city of Superior has a long and rich history. The first inhabitants of the area were the Ojibwe people, who lived in the area for centuries before the arrival of European settlers. The first Europeans to explore the area were French fur traders, who arrived in the late 1600s. The first permanent settlement in the area was established in 1854 by settlers from Superior, Minnesota. The city was incorporated in 1856 and was named after the nearby lake.
The city of Superior has played an important role in the history of the region. During the Civil War, the city was a major port for the Union Army, and it was also the site of the first iron ore shipment from the region. In the late 1800s, the city became a major center for the lumber industry, and it was also the site of the first pulp and paper mill in the United States.
The city of Superior has also been an important center for the shipping industry. The city is home to the Port of Superior, which is the largest port on Lake Superior. The port is a major hub for shipping goods to and from the Great Lakes region.
Geography
Superior is located in the northwest corner of Wisconsin, on the western end of Lake Superior. The city is situated on the banks of the Nemadji River, which flows into the lake. The city is surrounded by a number of small lakes and rivers, including the St. Louis River, the Nemadji River, and the Brule River. The city is also located near the Apostle Islands National Lakeshore, which is a popular tourist destination.
The city of Superior has a total area of 28.2 square miles, of which 26.2 square miles is land and 2.0 square miles is water. The city has a humid continental climate, with cold winters and warm summers. The average annual temperature is around 40 degrees Fahrenheit.
Economy
The economy of Superior is largely based on the shipping and transportation industries. The city is home to the Port of Superior, which is the largest port on Lake Superior. The port is a major hub for shipping goods to and from the Great Lakes region. The city is also home to a number of manufacturing companies, including paper mills, lumber mills, and food processing plants.
The city of Superior is also home to a number of educational institutions, including the University of Wisconsin-Superior, Wisconsin Indianhead Technical College, and the Superior School District. The city is also home to a number of healthcare facilities, including the Essentia Health-St. Mary's Medical Center and the St. Luke's Hospital.
Demographics
As of the 2010 census, the city of Superior had a population of 27,244. The racial makeup of the city was 90.2% White, 2.3% African American, 0.7% Native American, 2.2% Asian, 0.1% Pacific Islander, 2.3% from other races, and 2.2% from two or more races. Hispanic or Latino of any race were 5.2% of the population.
The median income for a household in the city was $41,945, and the median income for a family was $51,945. The per capita income for the city was $21,945. About 11.2% of families and 15.2% of the population were below the poverty line, including 22.2% of those under age 18 and 8.2% of those age 65 or over.
Common Questions
What is Per Capita Income in Superior?
Per Capita income in Superior is $42,108.
What is the Median Family Income in Superior?
Median Family Income in Superior is $82,500.
What is the Median Household income in Superior?
Median Household Income in Superior is $63,375.
What is Income or Wage Gap in Superior?
Income or Wage Gap in Superior is 35.4%.
Women in Superior earn 64.6 cents for every dollar earned by a man.
What is Inequality or Gini Index in Superior?
Inequality or Gini Index in Superior is 0.45.
What is the Total Population of Superior?
Total Population of Superior is 638.
What is the Total Male Population of Superior?
Total Male Population of Superior is 322.
What is the Total Female Population of Superior?
Total Female Population of Superior is 316.
What is the Ratio of Males per 100 Females in Superior?
There are 101.90 Males per 100 Females in Superior.
What is the Ratio of Females per 100 Males in Superior?
There are 98.14 Females per 100 Males in Superior.
What is the Median Population Age in Superior?
Median Population Age in Superior is 49.0 Years.
What is the Average Family Size in Superior
Average Family Size in Superior is 2.7 People.
What is the Average Household Size in Superior
Average Household Size in Superior is 2.0 People.
How Large is the Labor Force in Superior?
There are 386 People in the Labor Forcein in Superior.
What is the Percentage of People in the Labor Force in Superior?
67.1% of People are in the Labor Force in Superior.
What is the Unemployment Rate in Superior?
Unemployment Rate in Superior is 5.2%.