Strum, WI Map & Demographics
Strum Map
Strum Overview
$27,605
PER CAPITA INCOME
$73,750
AVG FAMILY INCOME
$64,911
AVG HOUSEHOLD INCOME
23.0%
WAGE / INCOME GAP [ % ]
77.0¢/ $1
WAGE / INCOME GAP [ $ ]
0.36
INEQUALITY / GINI INDEX
1,194
TOTAL POPULATION
558
MALE POPULATION
636
FEMALE POPULATION
87.74
MALES / 100 FEMALES
113.98
FEMALES / 100 MALES
33.7
MEDIAN AGE
3.3
AVG FAMILY SIZE
2.8
AVG HOUSEHOLD SIZE
530
LABOR FORCE [ PEOPLE ]
62.1%
PERCENT IN LABOR FORCE
1.9%
UNEMPLOYMENT RATE
Strum Zip Codes
Strum Area Codes
Income in Strum
Income Overview in Strum
Per Capita Income in Strum is $27,605, while median incomes of families and households are $73,750 and $64,911 respectively.
| Characteristic | Number | Measure |
| Per Capita Income | 1,194 | $27,605 |
| Median Family Income | 272 | $73,750 |
| Mean Family Income | 272 | $84,425 |
| Median Household Income | 409 | $64,911 |
| Mean Household Income | 409 | $74,756 |
| Income Deficit | 272 | $0 |
| Wage / Income Gap (%) | 1,194 | 23.04% |
| Wage / Income Gap ($) | 1,194 | 76.96¢ per $1 |
| Gini / Inequality Index | 1,194 | 0.36 |
Earnings by Sex in Strum
Average Earnings in Strum are $42,717, $47,917 for men and $36,875 for women, a difference of 23.0%.

| Sex | Number | Average Earnings |
| Male | 310 (53.1%) | $47,917 |
| Female | 274 (46.9%) | $36,875 |
| Total | 584 (100.0%) | $42,717 |
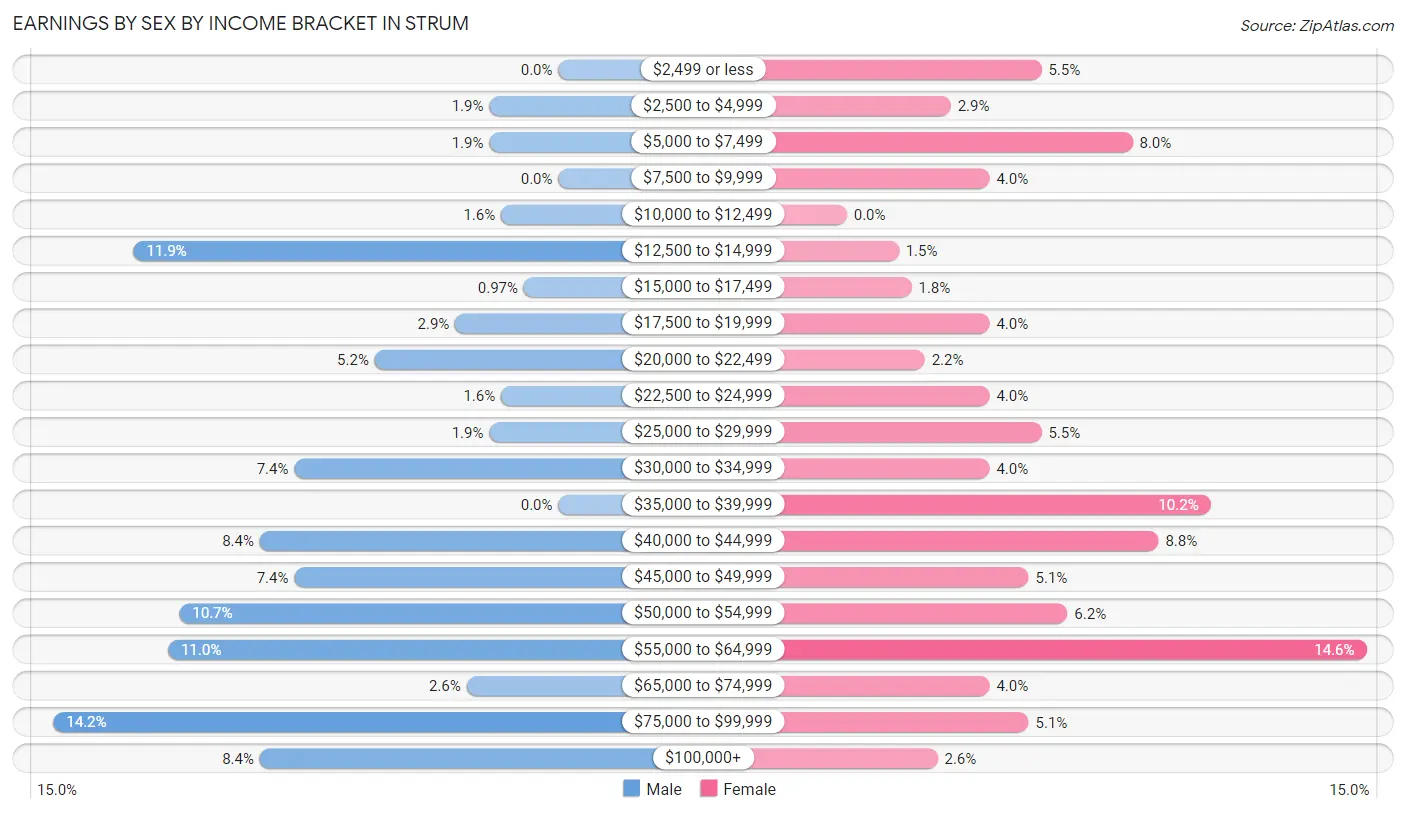
Earnings by Sex by Income Bracket in Strum
The most common earnings brackets in Strum are $75,000 to $99,999 for men (44 | 14.2%) and $55,000 to $64,999 for women (40 | 14.6%).
| Income | Male | Female |
| $2,499 or less | 0 (0.0%) | 15 (5.5%) |
| $2,500 to $4,999 | 6 (1.9%) | 8 (2.9%) |
| $5,000 to $7,499 | 6 (1.9%) | 22 (8.0%) |
| $7,500 to $9,999 | 0 (0.0%) | 11 (4.0%) |
| $10,000 to $12,499 | 5 (1.6%) | 0 (0.0%) |
| $12,500 to $14,999 | 37 (11.9%) | 4 (1.5%) |
| $15,000 to $17,499 | 3 (1.0%) | 5 (1.8%) |
| $17,500 to $19,999 | 9 (2.9%) | 11 (4.0%) |
| $20,000 to $22,499 | 16 (5.2%) | 6 (2.2%) |
| $22,500 to $24,999 | 5 (1.6%) | 11 (4.0%) |
| $25,000 to $29,999 | 6 (1.9%) | 15 (5.5%) |
| $30,000 to $34,999 | 23 (7.4%) | 11 (4.0%) |
| $35,000 to $39,999 | 0 (0.0%) | 28 (10.2%) |
| $40,000 to $44,999 | 26 (8.4%) | 24 (8.8%) |
| $45,000 to $49,999 | 23 (7.4%) | 14 (5.1%) |
| $50,000 to $54,999 | 33 (10.6%) | 17 (6.2%) |
| $55,000 to $64,999 | 34 (11.0%) | 40 (14.6%) |
| $65,000 to $74,999 | 8 (2.6%) | 11 (4.0%) |
| $75,000 to $99,999 | 44 (14.2%) | 14 (5.1%) |
| $100,000+ | 26 (8.4%) | 7 (2.5%) |
| Total | 310 (100.0%) | 274 (100.0%) |
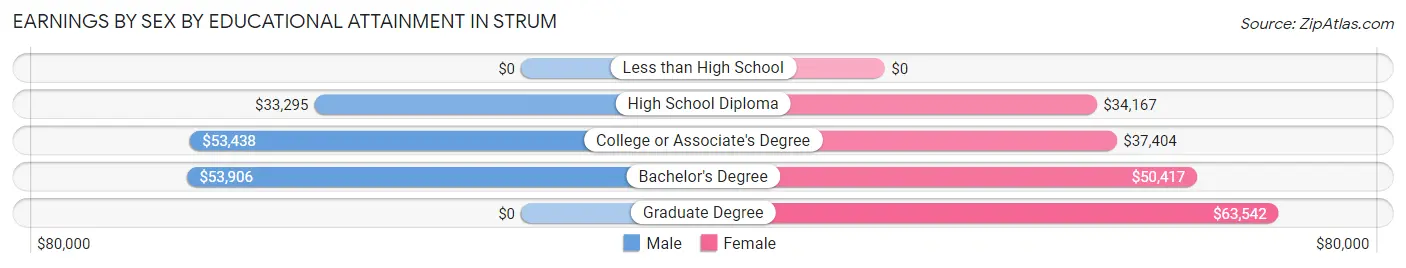
Earnings by Sex by Educational Attainment in Strum
Average earnings in Strum are $49,896 for men and $41,058 for women, a difference of 17.7%. Men with an educational attainment of bachelor's degree enjoy the highest average annual earnings of $53,906, while those with high school diploma education earn the least with $33,295. Women with an educational attainment of graduate degree earn the most with the average annual earnings of $63,542, while those with high school diploma education have the smallest earnings of $34,167.
| Educational Attainment | Male Income | Female Income |
| Less than High School | - | - |
| High School Diploma | $33,295 | $34,167 |
| College or Associate's Degree | $53,438 | $37,404 |
| Bachelor's Degree | $53,906 | $50,417 |
| Graduate Degree | - | - |
| Total | $49,896 | $41,058 |
Family Income in Strum
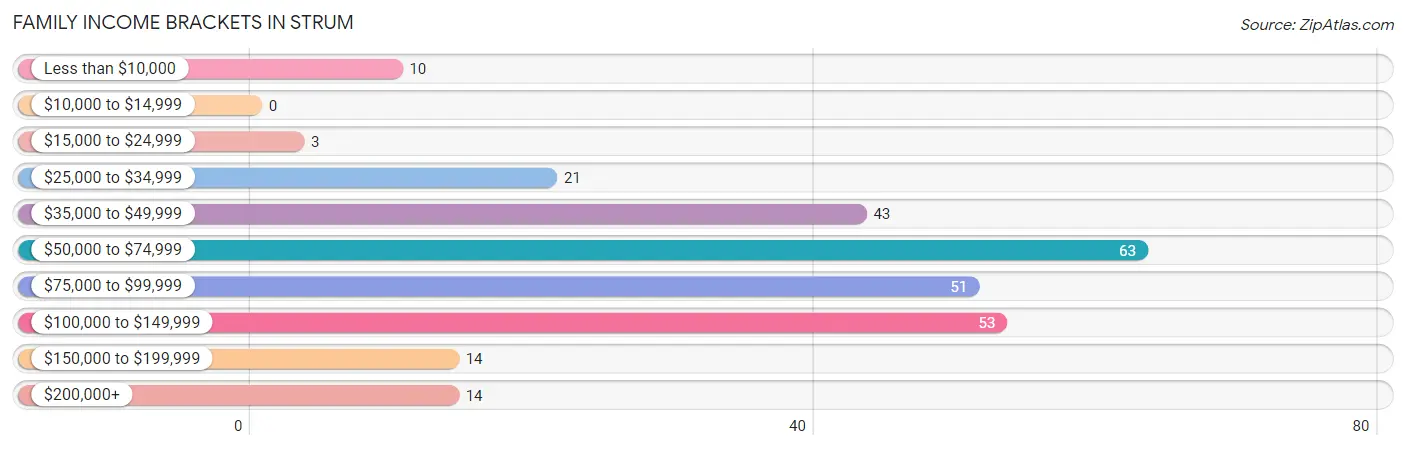
Family Income Brackets in Strum
According to the Strum family income data, there are 63 families falling into the $50,000 to $74,999 income range, which is the most common income bracket and makes up 23.2% of all families.
| Income Bracket | # Families | % Families |
| Less than $10,000 | 10 | 3.7% |
| $10,000 to $14,999 | 0 | 0.0% |
| $15,000 to $24,999 | 3 | 1.1% |
| $25,000 to $34,999 | 21 | 7.7% |
| $35,000 to $49,999 | 43 | 15.8% |
| $50,000 to $74,999 | 63 | 23.2% |
| $75,000 to $99,999 | 51 | 18.8% |
| $100,000 to $149,999 | 53 | 19.5% |
| $150,000 to $199,999 | 14 | 5.1% |
| $200,000+ | 14 | 5.1% |
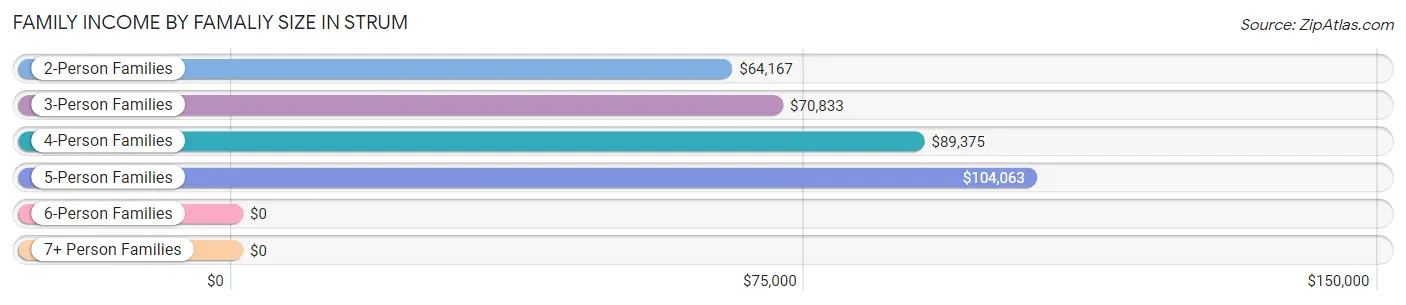
Family Income by Famaliy Size in Strum
5-person families (25 | 9.2%) account for the highest median family income in Strum with $104,063 per family, while 2-person families (110 | 40.4%) have the highest median income of $32,084 per family member.
| Income Bracket | # Families | Median Income |
| 2-Person Families | 110 (40.4%) | $64,167 |
| 3-Person Families | 86 (31.6%) | $70,833 |
| 4-Person Families | 36 (13.2%) | $89,375 |
| 5-Person Families | 25 (9.2%) | $104,063 |
| 6-Person Families | 15 (5.5%) | $0 |
| 7+ Person Families | 0 (0.0%) | $0 |
| Total | 272 (100.0%) | $73,750 |
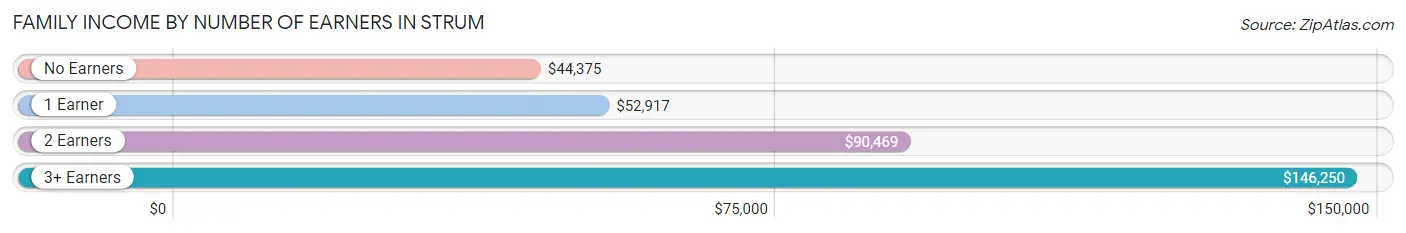
Family Income by Number of Earners in Strum
The median family income in Strum is $73,750, with families comprising 3+ earners (14) having the highest median family income of $146,250, while families with no earners (35) have the lowest median family income of $44,375, accounting for 5.1% and 12.9% of families, respectively.
| Number of Earners | # Families | Median Income |
| No Earners | 35 (12.9%) | $44,375 |
| 1 Earner | 86 (31.6%) | $52,917 |
| 2 Earners | 137 (50.4%) | $90,469 |
| 3+ Earners | 14 (5.1%) | $146,250 |
| Total | 272 (100.0%) | $73,750 |
Household Income in Strum
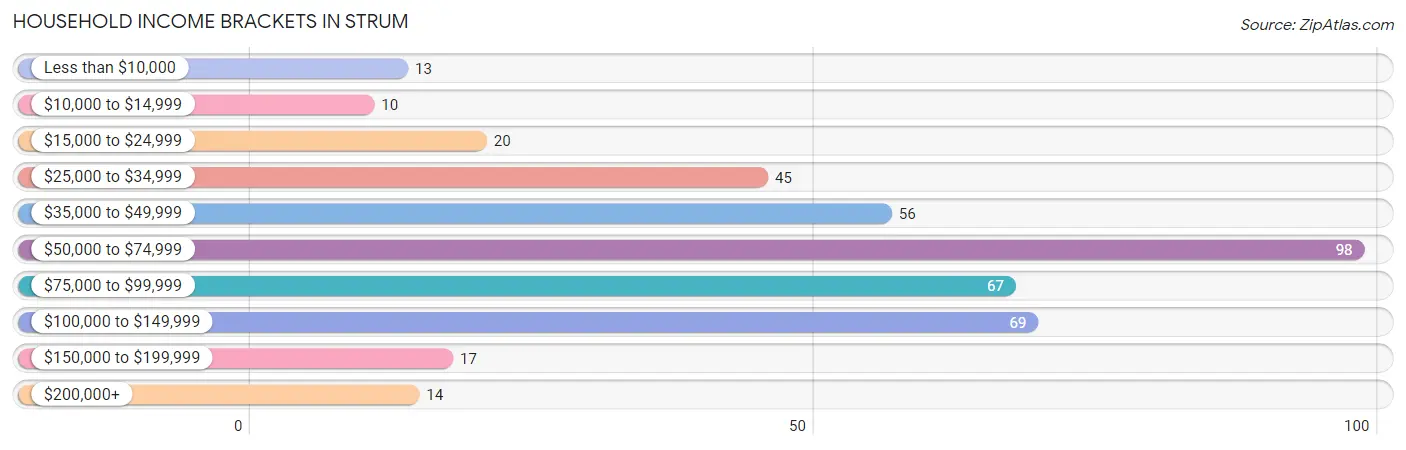
Household Income Brackets in Strum
With 98 households falling in the category, the $50,000 to $74,999 income range is the most frequent in Strum, accounting for 24.0% of all households. In contrast, only 10 households (2.4%) fall into the $10,000 to $14,999 income bracket, making it the least populous group.
| Income Bracket | # Households | % Households |
| Less than $10,000 | 13 | 3.2% |
| $10,000 to $14,999 | 10 | 2.4% |
| $15,000 to $24,999 | 20 | 4.9% |
| $25,000 to $34,999 | 45 | 11.0% |
| $35,000 to $49,999 | 56 | 13.7% |
| $50,000 to $74,999 | 98 | 24.0% |
| $75,000 to $99,999 | 67 | 16.4% |
| $100,000 to $149,999 | 69 | 16.9% |
| $150,000 to $199,999 | 17 | 4.2% |
| $200,000+ | 14 | 3.4% |
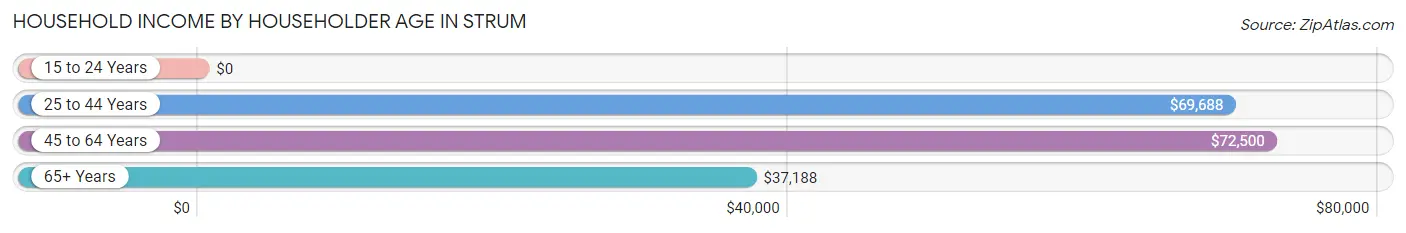
Household Income by Householder Age in Strum
The median household income in Strum is $64,911, with the highest median household income of $72,500 found in the 45 to 64 years age bracket for the primary householder. A total of 126 households (30.8%) fall into this category. Meanwhile, the 15 to 24 years age bracket for the primary householder has the lowest median household income of $0, with 9 households (2.2%) in this group.
| Income Bracket | # Households | Median Income |
| 15 to 24 Years | 9 (2.2%) | $0 |
| 25 to 44 Years | 183 (44.7%) | $69,688 |
| 45 to 64 Years | 126 (30.8%) | $72,500 |
| 65+ Years | 91 (22.3%) | $37,188 |
| Total | 409 (100.0%) | $64,911 |
Poverty in Strum
Income Below Poverty by Sex and Age in Strum
With 11.5% poverty level for males and 16.9% for females among the residents of Strum, 15 year old males and 6 to 11 year old females are the most vulnerable to poverty, with 3 males (50.0%) and 27 females (37.5%) in their respective age groups living below the poverty level.
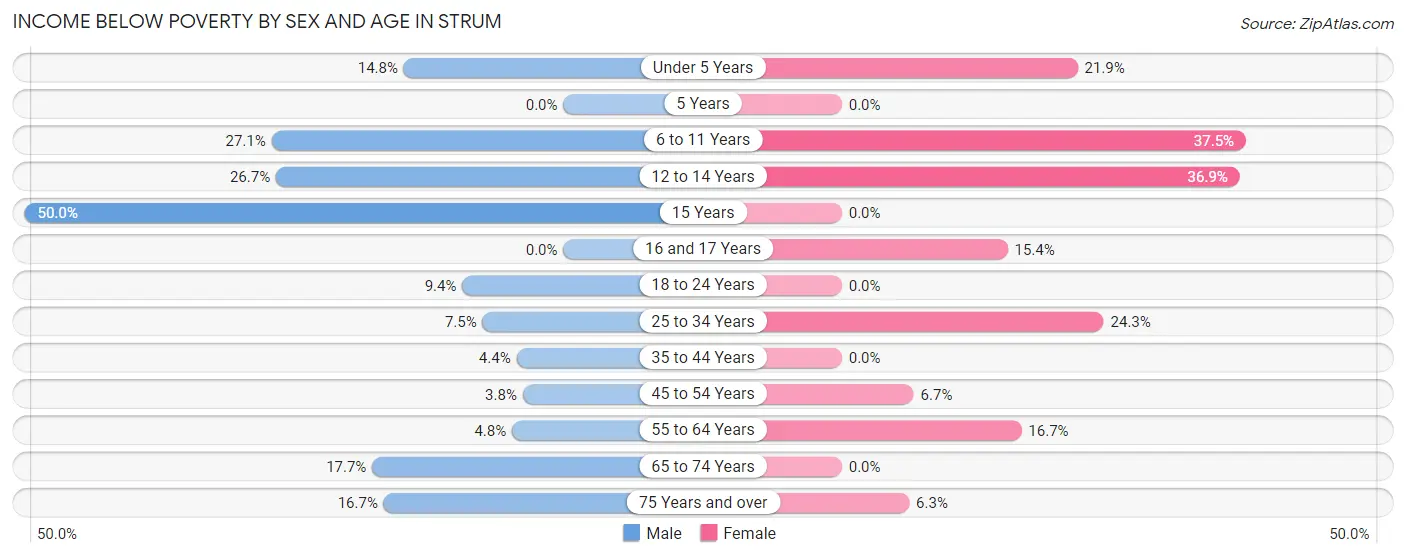
| Age Bracket | Male | Female |
| Under 5 Years | 8 (14.8%) | 7 (21.9%) |
| 5 Years | 0 (0.0%) | 0 (0.0%) |
| 6 to 11 Years | 13 (27.1%) | 27 (37.5%) |
| 12 to 14 Years | 4 (26.7%) | 24 (36.9%) |
| 15 Years | 3 (50.0%) | 0 (0.0%) |
| 16 and 17 Years | 0 (0.0%) | 4 (15.4%) |
| 18 to 24 Years | 3 (9.4%) | 0 (0.0%) |
| 25 to 34 Years | 6 (7.5%) | 26 (24.3%) |
| 35 to 44 Years | 3 (4.3%) | 0 (0.0%) |
| 45 to 54 Years | 2 (3.8%) | 3 (6.7%) |
| 55 to 64 Years | 3 (4.8%) | 8 (16.7%) |
| 65 to 74 Years | 11 (17.7%) | 0 (0.0%) |
| 75 Years and over | 6 (16.7%) | 3 (6.2%) |
| Total | 62 (11.5%) | 102 (16.9%) |
Income Above Poverty by Sex and Age in Strum
According to the poverty statistics in Strum, males aged 5 years and females aged 5 years are the age groups that are most secure financially, with 100.0% of males and 100.0% of females in these age groups living above the poverty line.
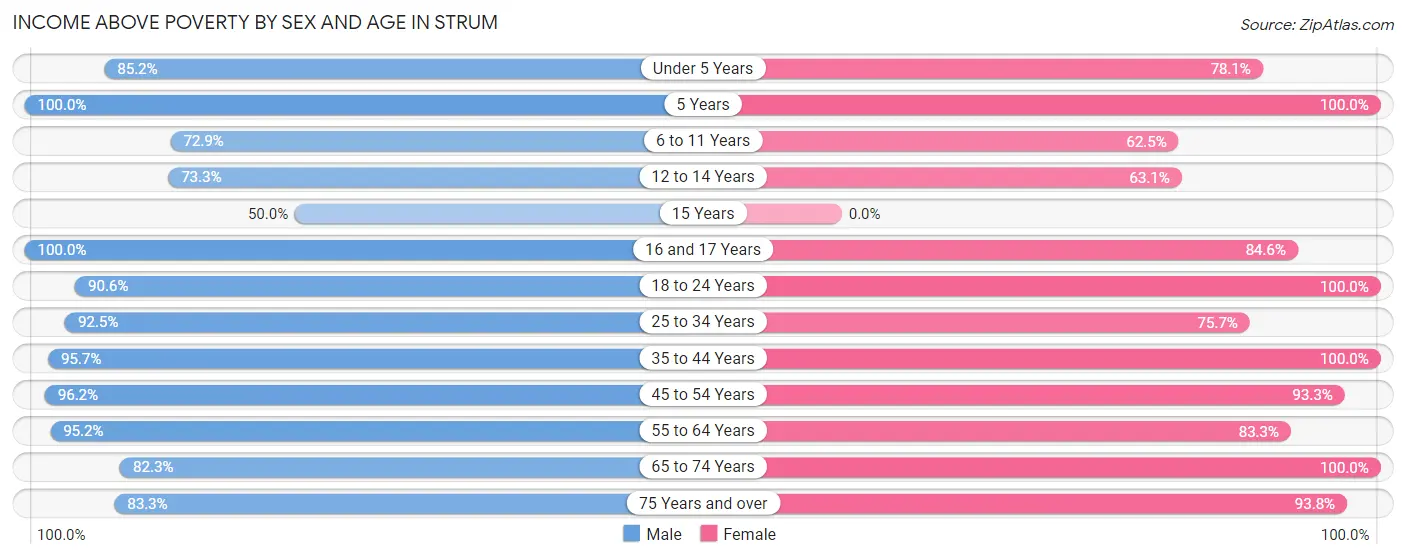
| Age Bracket | Male | Female |
| Under 5 Years | 46 (85.2%) | 25 (78.1%) |
| 5 Years | 8 (100.0%) | 14 (100.0%) |
| 6 to 11 Years | 35 (72.9%) | 45 (62.5%) |
| 12 to 14 Years | 11 (73.3%) | 41 (63.1%) |
| 15 Years | 3 (50.0%) | 0 (0.0%) |
| 16 and 17 Years | 14 (100.0%) | 22 (84.6%) |
| 18 to 24 Years | 29 (90.6%) | 37 (100.0%) |
| 25 to 34 Years | 74 (92.5%) | 81 (75.7%) |
| 35 to 44 Years | 66 (95.7%) | 78 (100.0%) |
| 45 to 54 Years | 51 (96.2%) | 42 (93.3%) |
| 55 to 64 Years | 60 (95.2%) | 40 (83.3%) |
| 65 to 74 Years | 51 (82.3%) | 30 (100.0%) |
| 75 Years and over | 30 (83.3%) | 45 (93.8%) |
| Total | 478 (88.5%) | 500 (83.1%) |
Income Below Poverty Among Married-Couple Families in Strum
The poverty statistics for married-couple families in Strum show that 2.0% or 4 of the total 197 families live below the poverty line. Families with 3 or 4 children have the highest poverty rate of 12.1%, comprising of 4 families. On the other hand, families with no children have the lowest poverty rate of 0.0%, which includes 0 families.
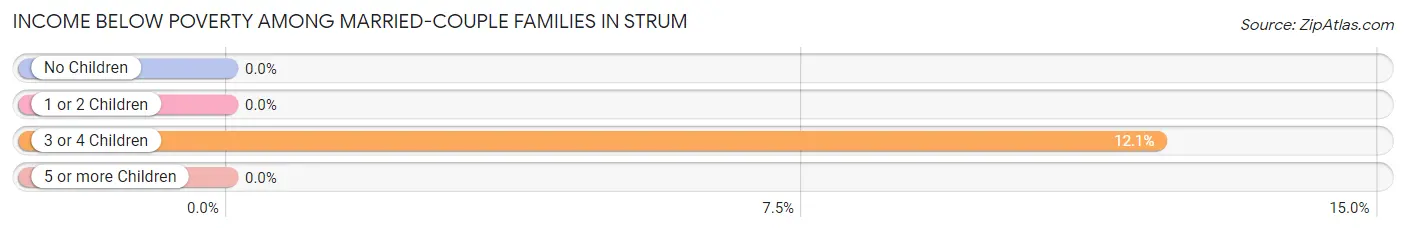
| Children | Above Poverty | Below Poverty |
| No Children | 87 (100.0%) | 0 (0.0%) |
| 1 or 2 Children | 77 (100.0%) | 0 (0.0%) |
| 3 or 4 Children | 29 (87.9%) | 4 (12.1%) |
| 5 or more Children | 0 (0.0%) | 0 (0.0%) |
| Total | 193 (98.0%) | 4 (2.0%) |
Income Below Poverty Among Single-Parent Households in Strum
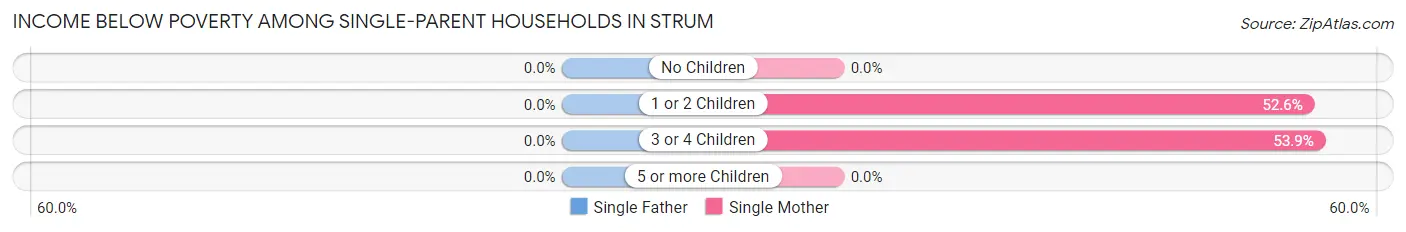
| Children | Single Father | Single Mother |
| No Children | 0 (0.0%) | 0 (0.0%) |
| 1 or 2 Children | 0 (0.0%) | 10 (52.6%) |
| 3 or 4 Children | 0 (0.0%) | 7 (53.8%) |
| 5 or more Children | 0 (0.0%) | 0 (0.0%) |
| Total | 0 (0.0%) | 17 (37.0%) |
Income Below Poverty Among Married-Couple vs Single-Parent Households in Strum
The poverty data for Strum shows that 4 of the married-couple family households (2.0%) and 17 of the single-parent households (22.7%) are living below the poverty level. Within the married-couple family households, those with 3 or 4 children have the highest poverty rate, with 4 households (12.1%) falling below the poverty line. Among the single-parent households, those with 3 or 4 children have the highest poverty rate, with 7 household (43.8%) living below poverty.
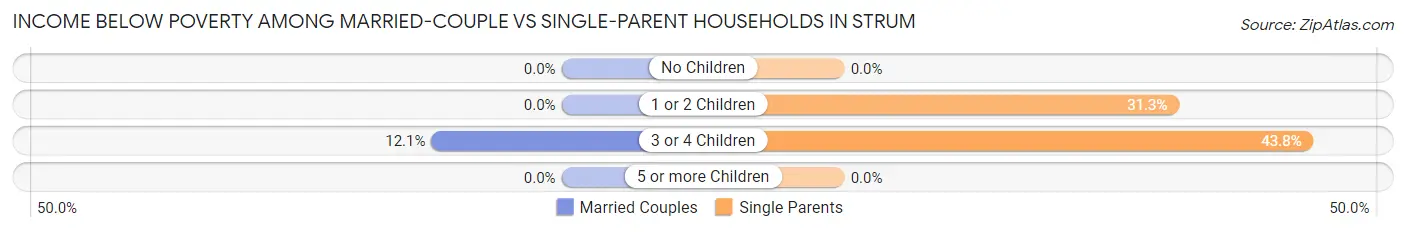
| Children | Married-Couple Families | Single-Parent Households |
| No Children | 0 (0.0%) | 0 (0.0%) |
| 1 or 2 Children | 0 (0.0%) | 10 (31.2%) |
| 3 or 4 Children | 4 (12.1%) | 7 (43.8%) |
| 5 or more Children | 0 (0.0%) | 0 (0.0%) |
| Total | 4 (2.0%) | 17 (22.7%) |
Race in Strum
The most populous races in Strum are White / Caucasian (1,098 | 92.0%), Hispanic or Latino (43 | 3.6%), and Two or more Races (37 | 3.1%).
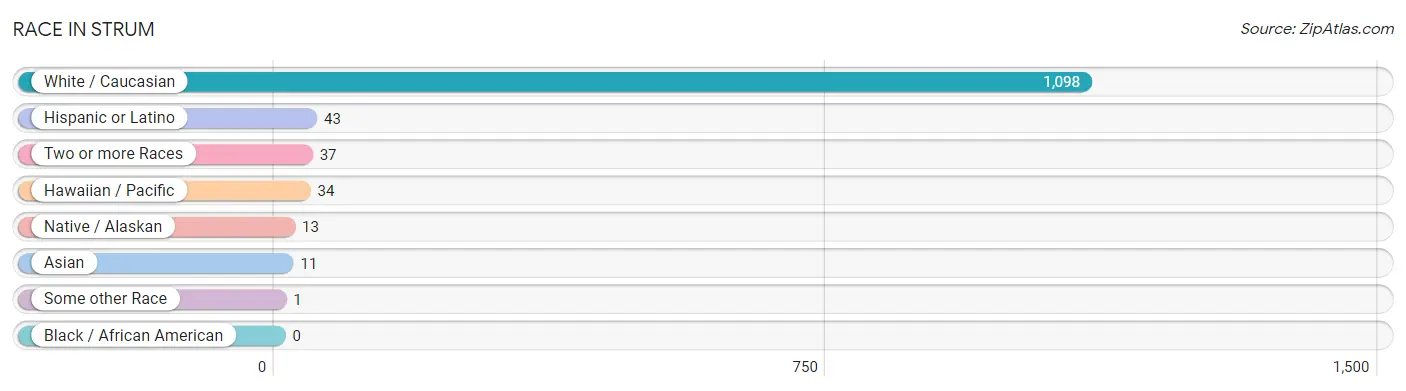
| Race | # Population | % Population |
| Asian | 11 | 0.9% |
| Black / African American | 0 | 0.0% |
| Hawaiian / Pacific | 34 | 2.9% |
| Hispanic or Latino | 43 | 3.6% |
| Native / Alaskan | 13 | 1.1% |
| White / Caucasian | 1,098 | 92.0% |
| Two or more Races | 37 | 3.1% |
| Some other Race | 1 | 0.1% |
| Total | 1,194 | 100.0% |
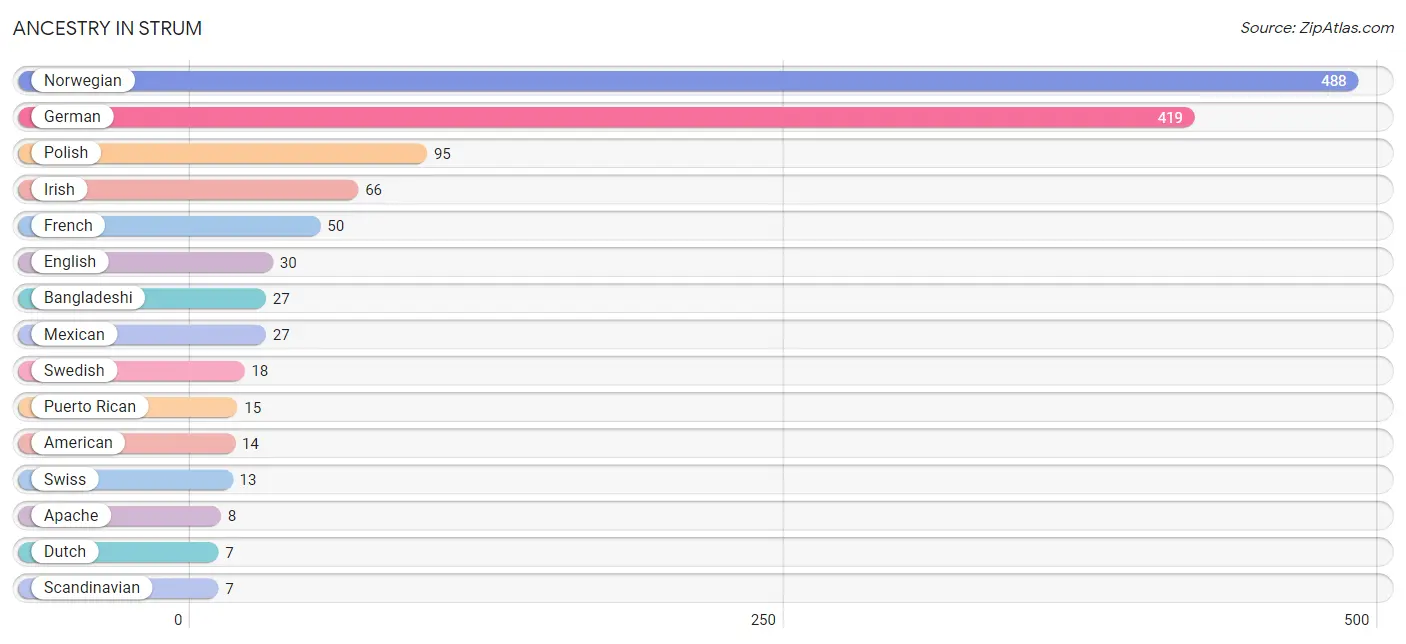
Ancestry in Strum
The most populous ancestries reported in Strum are Norwegian (488 | 40.9%), German (419 | 35.1%), Polish (95 | 8.0%), Irish (66 | 5.5%), and French (50 | 4.2%), together accounting for 93.6% of all Strum residents.
| Ancestry | # Population | % Population |
| American | 14 | 1.2% |
| Apache | 8 | 0.7% |
| Bangladeshi | 27 | 2.3% |
| Central American | 1 | 0.1% |
| Cherokee | 3 | 0.3% |
| Czechoslovakian | 6 | 0.5% |
| Dutch | 7 | 0.6% |
| English | 30 | 2.5% |
| European | 3 | 0.3% |
| French | 50 | 4.2% |
| French Canadian | 3 | 0.3% |
| German | 419 | 35.1% |
| Guatemalan | 1 | 0.1% |
| Irish | 66 | 5.5% |
| Iroquois | 2 | 0.2% |
| Italian | 2 | 0.2% |
| Mexican | 27 | 2.3% |
| Norwegian | 488 | 40.9% |
| Polish | 95 | 8.0% |
| Puerto Rican | 15 | 1.3% |
| Scandinavian | 7 | 0.6% |
| Slovak | 3 | 0.3% |
| Swedish | 18 | 1.5% |
| Swiss | 13 | 1.1% | View All 24 Rows |
Immigrants in Strum
The most numerous immigrant groups reported in Strum came from Central America (1 | 0.1%), Guatemala (1 | 0.1%), and Latin America (1 | 0.1%), together accounting for 0.2% of all Strum residents.
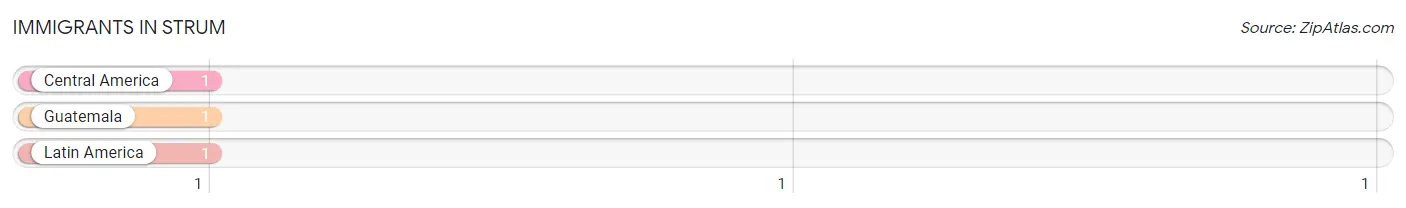
| Immigration Origin | # Population | % Population |
| Central America | 1 | 0.1% |
| Guatemala | 1 | 0.1% |
| Latin America | 1 | 0.1% | View All 3 Rows |
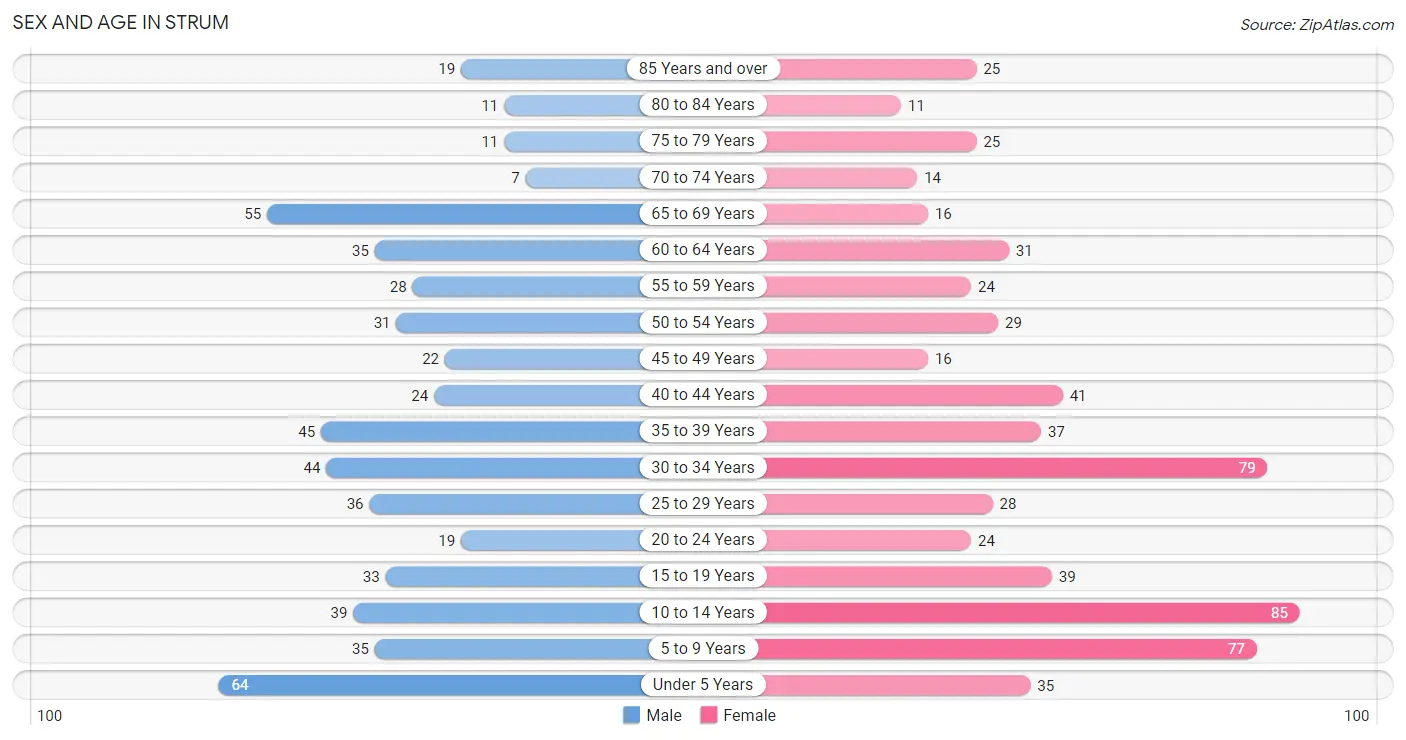
Sex and Age in Strum
Sex and Age in Strum
The most populous age groups in Strum are Under 5 Years (64 | 11.5%) for men and 10 to 14 Years (85 | 13.4%) for women.
| Age Bracket | Male | Female |
| Under 5 Years | 64 (11.5%) | 35 (5.5%) |
| 5 to 9 Years | 35 (6.3%) | 77 (12.1%) |
| 10 to 14 Years | 39 (7.0%) | 85 (13.4%) |
| 15 to 19 Years | 33 (5.9%) | 39 (6.1%) |
| 20 to 24 Years | 19 (3.4%) | 24 (3.8%) |
| 25 to 29 Years | 36 (6.5%) | 28 (4.4%) |
| 30 to 34 Years | 44 (7.9%) | 79 (12.4%) |
| 35 to 39 Years | 45 (8.1%) | 37 (5.8%) |
| 40 to 44 Years | 24 (4.3%) | 41 (6.5%) |
| 45 to 49 Years | 22 (3.9%) | 16 (2.5%) |
| 50 to 54 Years | 31 (5.6%) | 29 (4.6%) |
| 55 to 59 Years | 28 (5.0%) | 24 (3.8%) |
| 60 to 64 Years | 35 (6.3%) | 31 (4.9%) |
| 65 to 69 Years | 55 (9.9%) | 16 (2.5%) |
| 70 to 74 Years | 7 (1.3%) | 14 (2.2%) |
| 75 to 79 Years | 11 (2.0%) | 25 (3.9%) |
| 80 to 84 Years | 11 (2.0%) | 11 (1.7%) |
| 85 Years and over | 19 (3.4%) | 25 (3.9%) |
| Total | 558 (100.0%) | 636 (100.0%) |
Families and Households in Strum
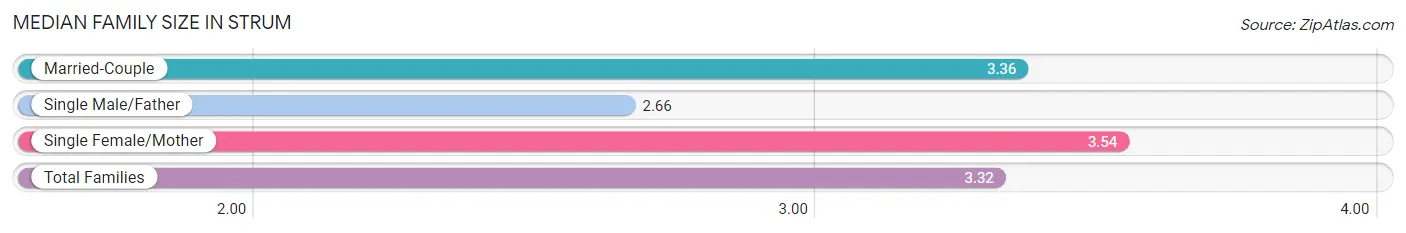
Median Family Size in Strum
The median family size in Strum is 3.32 persons per family, with single female/mother families (46 | 16.9%) accounting for the largest median family size of 3.54 persons per family. On the other hand, single male/father families (29 | 10.7%) represent the smallest median family size with 2.66 persons per family.
| Family Type | # Families | Family Size |
| Married-Couple | 197 (72.4%) | 3.36 |
| Single Male/Father | 29 (10.7%) | 2.66 |
| Single Female/Mother | 46 (16.9%) | 3.54 |
| Total Families | 272 (100.0%) | 3.32 |
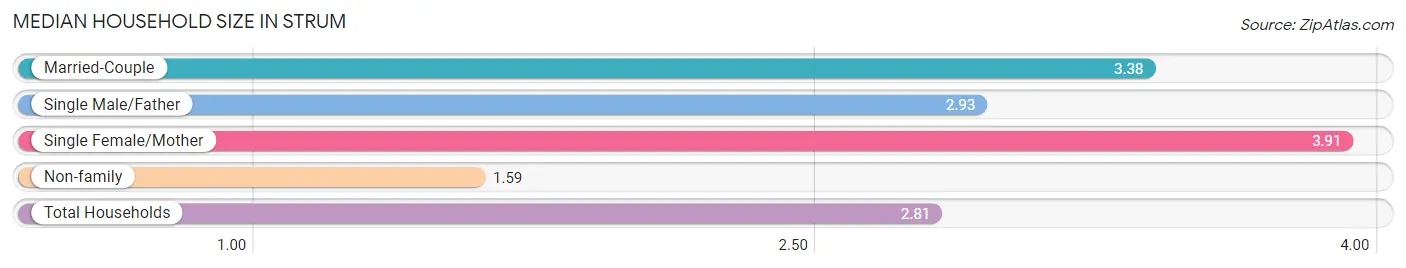
Median Household Size in Strum
The median household size in Strum is 2.81 persons per household, with single female/mother households (46 | 11.3%) accounting for the largest median household size of 3.91 persons per household. non-family households (137 | 33.5%) represent the smallest median household size with 1.59 persons per household.
| Household Type | # Households | Household Size |
| Married-Couple | 197 (48.2%) | 3.38 |
| Single Male/Father | 29 (7.1%) | 2.93 |
| Single Female/Mother | 46 (11.3%) | 3.91 |
| Non-family | 137 (33.5%) | 1.59 |
| Total Households | 409 (100.0%) | 2.81 |
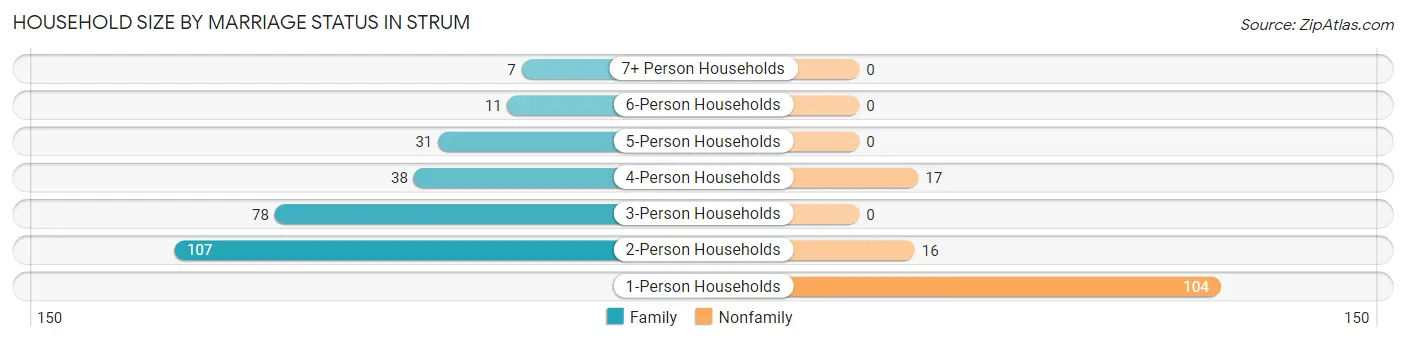
Household Size by Marriage Status in Strum
Out of a total of 409 households in Strum, 272 (66.5%) are family households, while 137 (33.5%) are nonfamily households. The most numerous type of family households are 2-person households, comprising 107, and the most common type of nonfamily households are 1-person households, comprising 104.
| Household Size | Family Households | Nonfamily Households |
| 1-Person Households | - | 104 (25.4%) |
| 2-Person Households | 107 (26.2%) | 16 (3.9%) |
| 3-Person Households | 78 (19.1%) | 0 (0.0%) |
| 4-Person Households | 38 (9.3%) | 17 (4.2%) |
| 5-Person Households | 31 (7.6%) | 0 (0.0%) |
| 6-Person Households | 11 (2.7%) | 0 (0.0%) |
| 7+ Person Households | 7 (1.7%) | 0 (0.0%) |
| Total | 272 (66.5%) | 137 (33.5%) |
Female Fertility in Strum
Fertility by Age in Strum
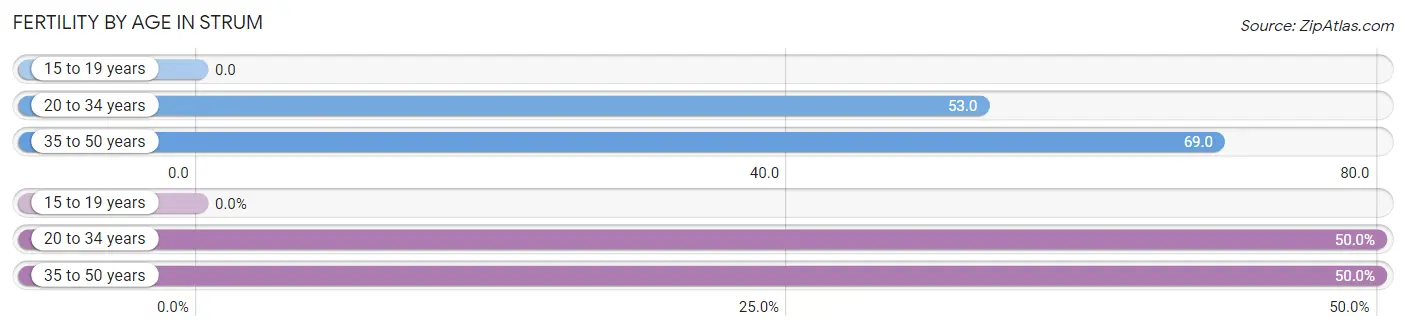
Average fertility rate in Strum is 52.0 births per 1,000 women. Women in the age bracket of 35 to 50 years have the highest fertility rate with 69.0 births per 1,000 women. Women in the age bracket of 20 to 34 years acount for 50.0% of all women with births.
| Age Bracket | Women with Births | Births / 1,000 Women |
| 15 to 19 years | 0 (0.0%) | 0.0 |
| 20 to 34 years | 7 (50.0%) | 53.0 |
| 35 to 50 years | 7 (50.0%) | 69.0 |
| Total | 14 (100.0%) | 52.0 |
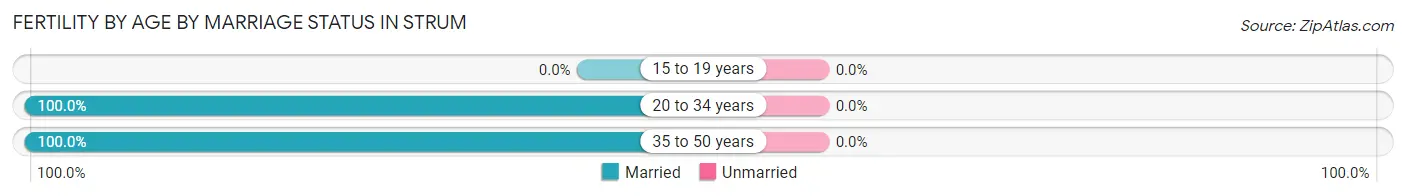
Fertility by Age by Marriage Status in Strum
| Age Bracket | Married | Unmarried |
| 15 to 19 years | 0 (0.0%) | 0 (0.0%) |
| 20 to 34 years | 7 (100.0%) | 0 (0.0%) |
| 35 to 50 years | 7 (100.0%) | 0 (0.0%) |
| Total | 14 (100.0%) | 0 (0.0%) |
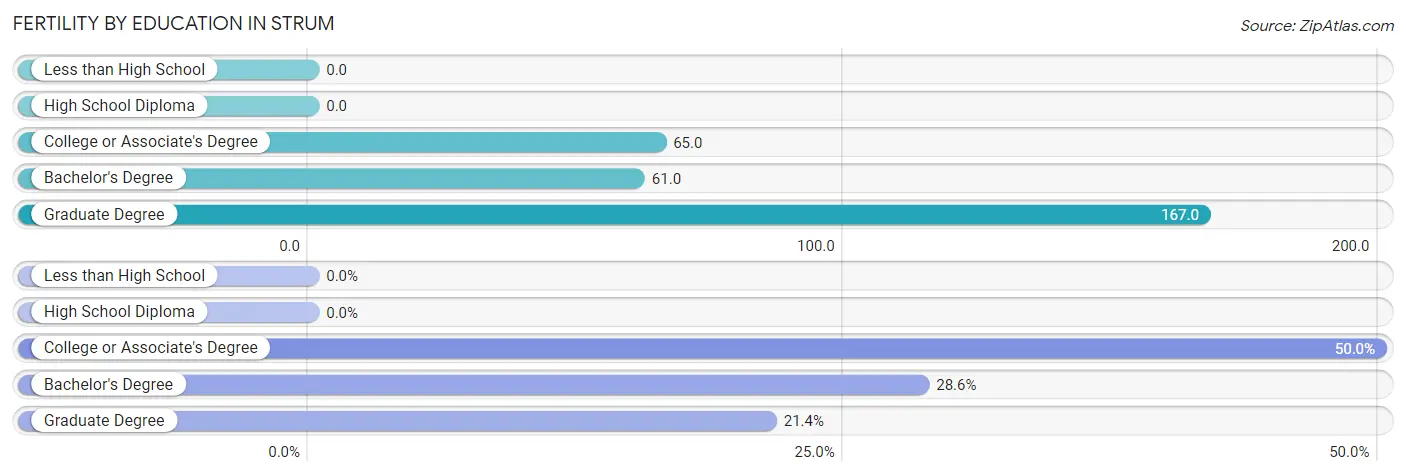
Fertility by Education in Strum
| Educational Attainment | Women with Births | Births / 1,000 Women |
| Less than High School | 0 (0.0%) | 0.0 |
| High School Diploma | 0 (0.0%) | 0.0 |
| College or Associate's Degree | 7 (50.0%) | 65.0 |
| Bachelor's Degree | 4 (28.6%) | 61.0 |
| Graduate Degree | 3 (21.4%) | 167.0 |
| Total | 14 (100.0%) | 52.0 |
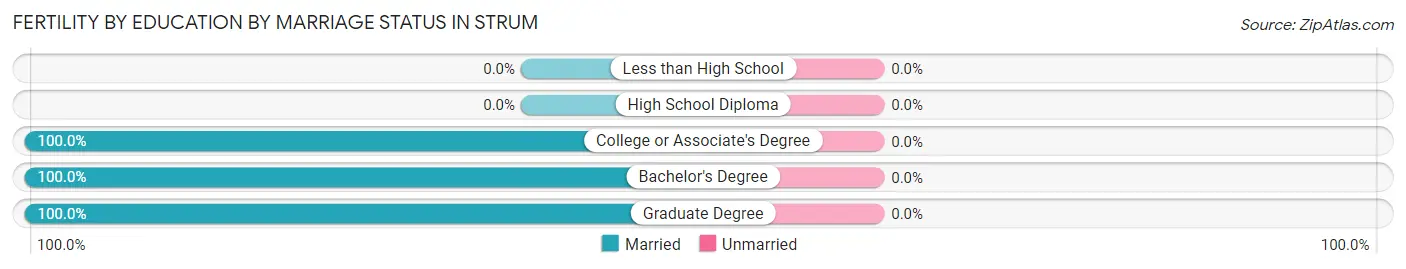
Fertility by Education by Marriage Status in Strum
| Educational Attainment | Married | Unmarried |
| Less than High School | 0 (0.0%) | 0 (0.0%) |
| High School Diploma | 0 (0.0%) | 0 (0.0%) |
| College or Associate's Degree | 7 (100.0%) | 0 (0.0%) |
| Bachelor's Degree | 4 (100.0%) | 0 (0.0%) |
| Graduate Degree | 3 (100.0%) | 0 (0.0%) |
| Total | 14 (100.0%) | 0 (0.0%) |
Employment Characteristics in Strum
Employment by Class of Employer in Strum
Among the 510 employed individuals in Strum, private company employees (405 | 79.4%), local government employees (36 | 7.1%), and not-for-profit organizations (34 | 6.7%) make up the most common classes of employment.
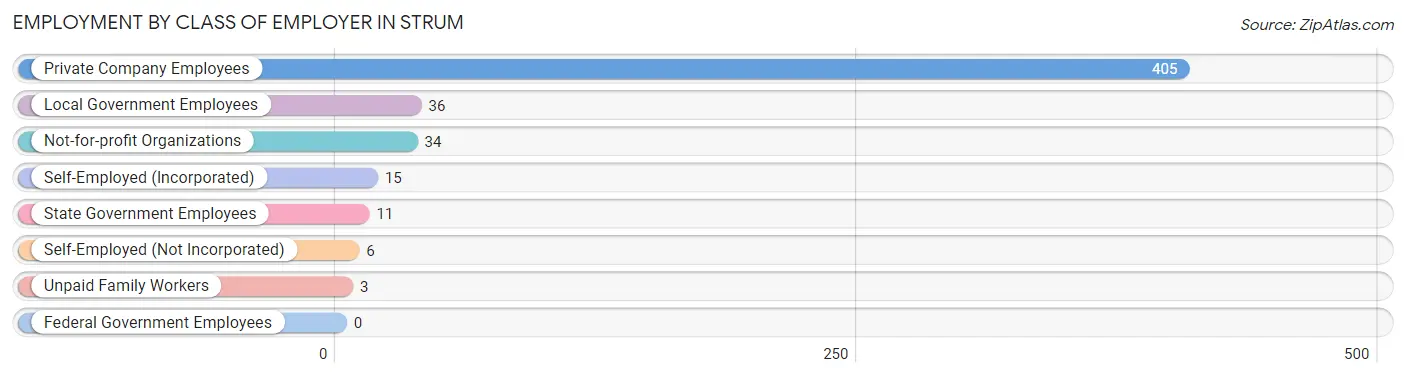
| Employer Class | # Employees | % Employees |
| Private Company Employees | 405 | 79.4% |
| Self-Employed (Incorporated) | 15 | 2.9% |
| Self-Employed (Not Incorporated) | 6 | 1.2% |
| Not-for-profit Organizations | 34 | 6.7% |
| Local Government Employees | 36 | 7.1% |
| State Government Employees | 11 | 2.2% |
| Federal Government Employees | 0 | 0.0% |
| Unpaid Family Workers | 3 | 0.6% |
| Total | 510 | 100.0% |
Employment Status by Age in Strum
According to the labor force statistics for Strum, out of the total population over 16 years of age (853), 62.1% or 530 individuals are in the labor force, with 1.9% or 10 of them unemployed. The age group with the highest labor force participation rate is 25 to 29 years, with 96.9% or 62 individuals in the labor force. Within the labor force, the 16 to 19 years age range has the highest percentage of unemployed individuals, with 10.0% or 3 of them being unemployed.
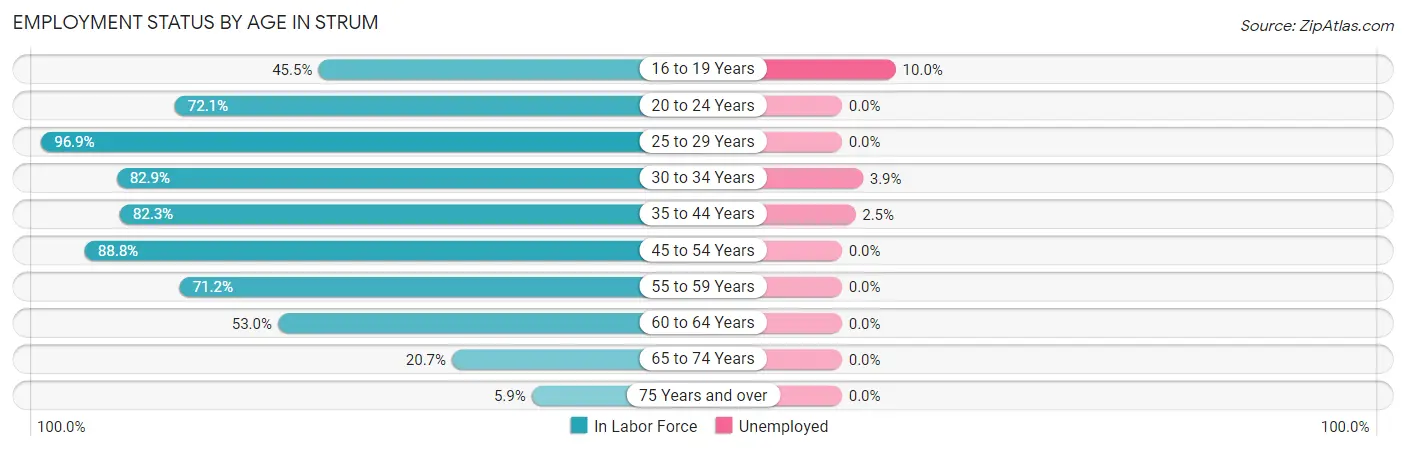
| Age Bracket | In Labor Force | Unemployed |
| 16 to 19 Years | 30 (45.5%) | 3 (10.0%) |
| 20 to 24 Years | 31 (72.1%) | 0 (0.0%) |
| 25 to 29 Years | 62 (96.9%) | 0 (0.0%) |
| 30 to 34 Years | 102 (82.9%) | 4 (3.9%) |
| 35 to 44 Years | 121 (82.3%) | 3 (2.5%) |
| 45 to 54 Years | 87 (88.8%) | 0 (0.0%) |
| 55 to 59 Years | 37 (71.2%) | 0 (0.0%) |
| 60 to 64 Years | 35 (53.0%) | 0 (0.0%) |
| 65 to 74 Years | 19 (20.7%) | 0 (0.0%) |
| 75 Years and over | 6 (5.9%) | 0 (0.0%) |
| Total | 530 (62.1%) | 10 (1.9%) |
Employment Status by Educational Attainment in Strum
According to labor force statistics for Strum, 80.7% of individuals (444) out of the total population between 25 and 64 years of age (550) are in the labor force, with 1.6% or 7 of them being unemployed. The group with the highest labor force participation rate are those with the educational attainment of college / associate degree, with 88.2% or 217 individuals in the labor force. Within the labor force, individuals with high school diploma education have the highest percentage of unemployment, with 2.5% or 3 of them being unemployed.
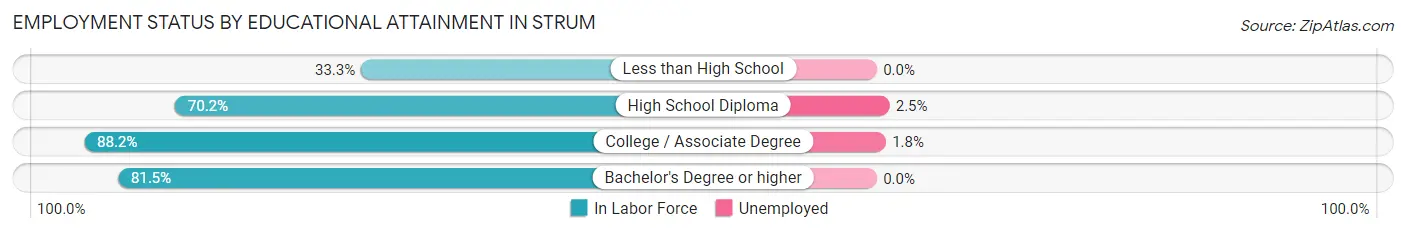
| Educational Attainment | In Labor Force | Unemployed |
| Less than High School | 1 (33.3%) | 0 (0.0%) |
| High School Diploma | 120 (70.2%) | 4 (2.5%) |
| College / Associate Degree | 217 (88.2%) | 4 (1.8%) |
| Bachelor's Degree or higher | 106 (81.5%) | 0 (0.0%) |
| Total | 444 (80.7%) | 9 (1.6%) |
Employment Occupations by Sex in Strum
Management, Business, Science and Arts Occupations
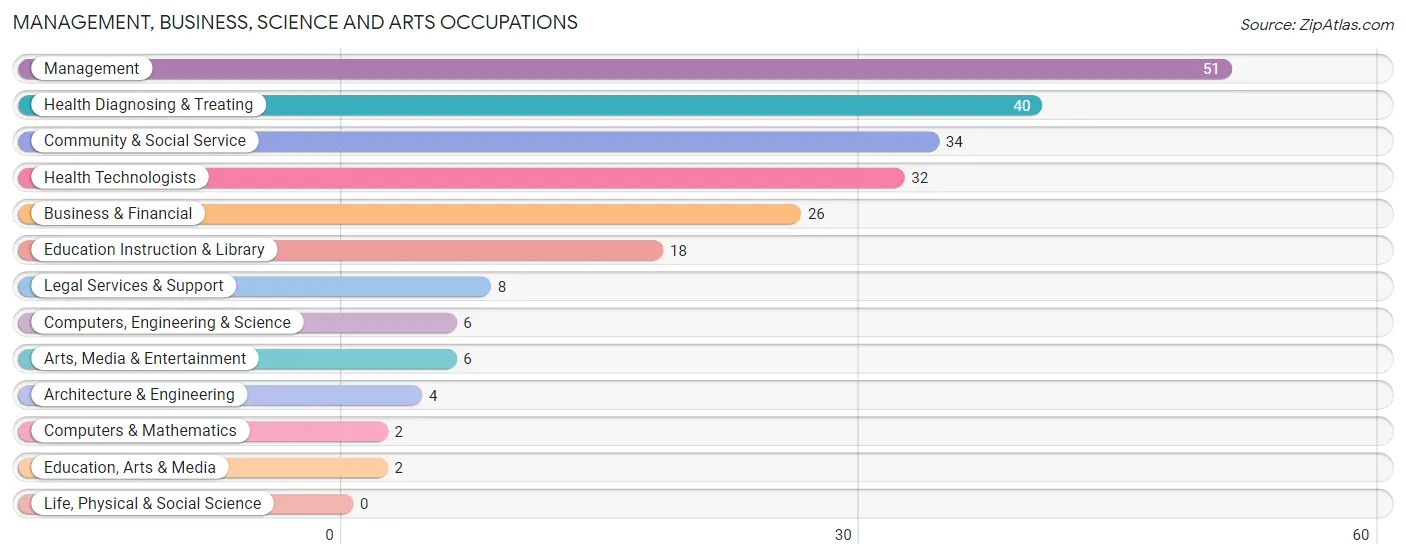
The most common Management, Business, Science and Arts occupations in Strum are Management (51 | 9.8%), Health Diagnosing & Treating (40 | 7.7%), Community & Social Service (34 | 6.5%), Health Technologists (32 | 6.1%), and Business & Financial (26 | 5.0%).
Management, Business, Science and Arts Occupations by Sex
Within the Management, Business, Science and Arts occupations in Strum, the most male-oriented occupations are Architecture & Engineering (100.0%), Arts, Media & Entertainment (100.0%), and Management (74.5%), while the most female-oriented occupations are Computers & Mathematics (100.0%), Education, Arts & Media (100.0%), and Health Diagnosing & Treating (85.0%).
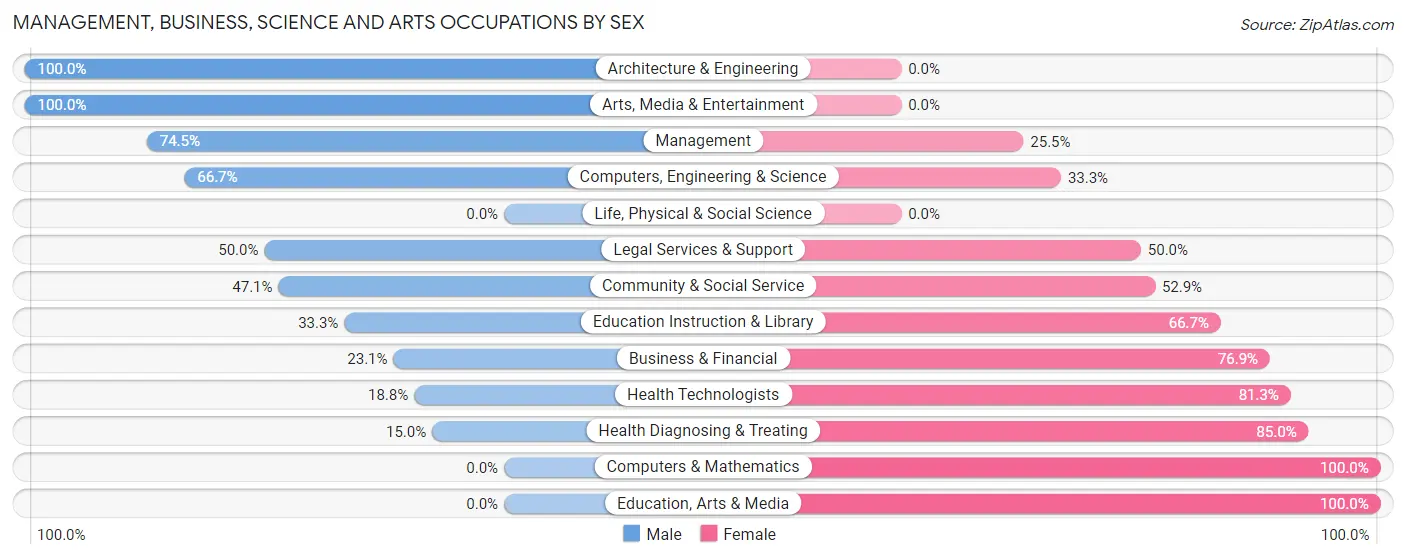
| Occupation | Male | Female |
| Management | 38 (74.5%) | 13 (25.5%) |
| Business & Financial | 6 (23.1%) | 20 (76.9%) |
| Computers, Engineering & Science | 4 (66.7%) | 2 (33.3%) |
| Computers & Mathematics | 0 (0.0%) | 2 (100.0%) |
| Architecture & Engineering | 4 (100.0%) | 0 (0.0%) |
| Life, Physical & Social Science | 0 (0.0%) | 0 (0.0%) |
| Community & Social Service | 16 (47.1%) | 18 (52.9%) |
| Education, Arts & Media | 0 (0.0%) | 2 (100.0%) |
| Legal Services & Support | 4 (50.0%) | 4 (50.0%) |
| Education Instruction & Library | 6 (33.3%) | 12 (66.7%) |
| Arts, Media & Entertainment | 6 (100.0%) | 0 (0.0%) |
| Health Diagnosing & Treating | 6 (15.0%) | 34 (85.0%) |
| Health Technologists | 6 (18.8%) | 26 (81.2%) |
| Total (Category) | 70 (44.6%) | 87 (55.4%) |
| Total (Overall) | 279 (53.6%) | 241 (46.4%) |
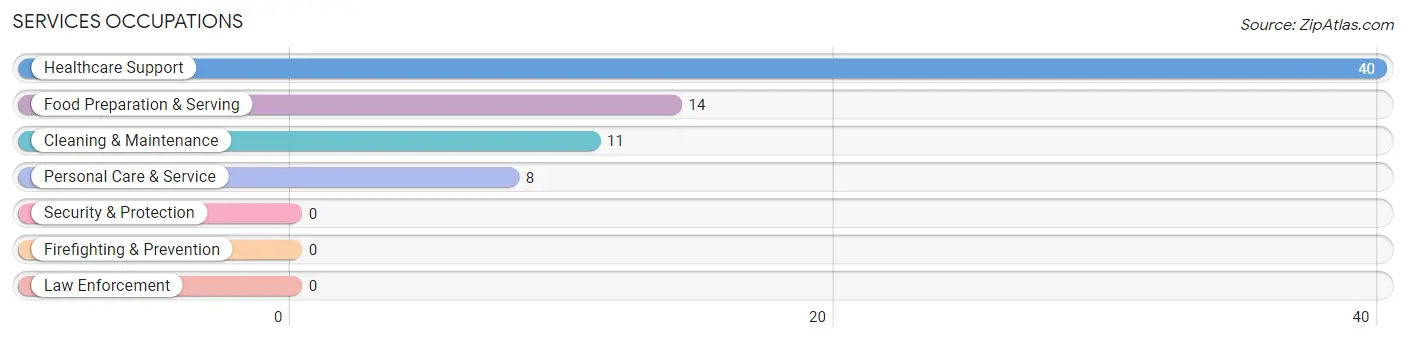
Services Occupations
The most common Services occupations in Strum are Healthcare Support (40 | 7.7%), Food Preparation & Serving (14 | 2.7%), Cleaning & Maintenance (11 | 2.1%), and Personal Care & Service (8 | 1.5%).
Services Occupations by Sex
Within the Services occupations in Strum, the most male-oriented occupations are Cleaning & Maintenance (45.5%), Personal Care & Service (37.5%), and Healthcare Support (25.0%), while the most female-oriented occupations are Food Preparation & Serving (100.0%), Healthcare Support (75.0%), and Personal Care & Service (62.5%).
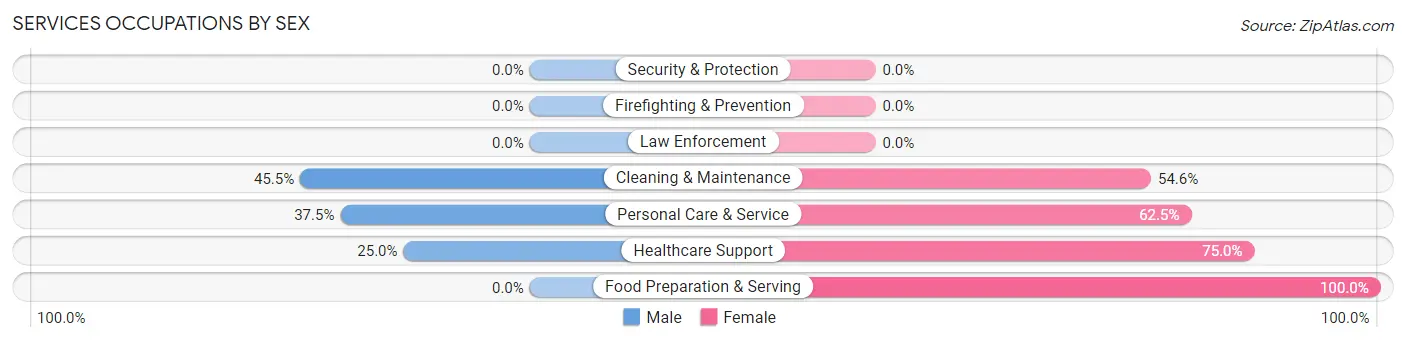
| Occupation | Male | Female |
| Healthcare Support | 10 (25.0%) | 30 (75.0%) |
| Security & Protection | 0 (0.0%) | 0 (0.0%) |
| Firefighting & Prevention | 0 (0.0%) | 0 (0.0%) |
| Law Enforcement | 0 (0.0%) | 0 (0.0%) |
| Food Preparation & Serving | 0 (0.0%) | 14 (100.0%) |
| Cleaning & Maintenance | 5 (45.5%) | 6 (54.5%) |
| Personal Care & Service | 3 (37.5%) | 5 (62.5%) |
| Total (Category) | 18 (24.7%) | 55 (75.3%) |
| Total (Overall) | 279 (53.6%) | 241 (46.4%) |
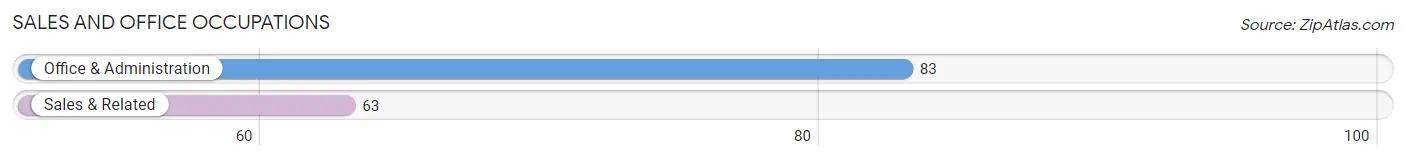
Sales and Office Occupations
The most common Sales and Office occupations in Strum are Office & Administration (83 | 16.0%), and Sales & Related (63 | 12.1%).
Sales and Office Occupations by Sex
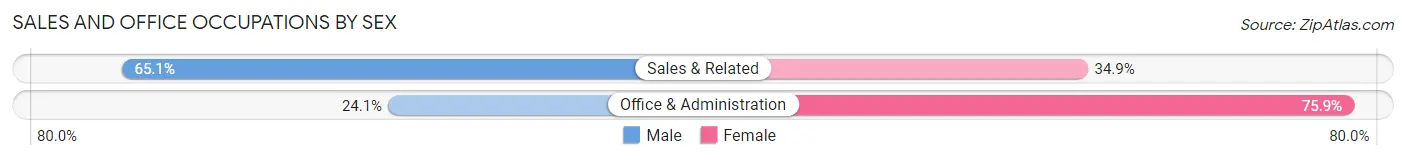
| Occupation | Male | Female |
| Sales & Related | 41 (65.1%) | 22 (34.9%) |
| Office & Administration | 20 (24.1%) | 63 (75.9%) |
| Total (Category) | 61 (41.8%) | 85 (58.2%) |
| Total (Overall) | 279 (53.6%) | 241 (46.4%) |
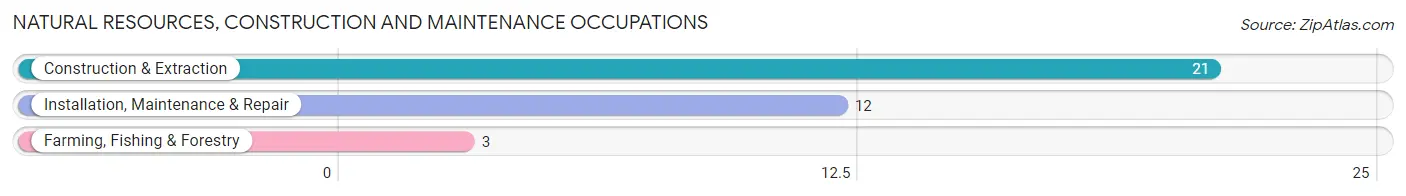
Natural Resources, Construction and Maintenance Occupations
The most common Natural Resources, Construction and Maintenance occupations in Strum are Construction & Extraction (21 | 4.0%), Installation, Maintenance & Repair (12 | 2.3%), and Farming, Fishing & Forestry (3 | 0.6%).
Natural Resources, Construction and Maintenance Occupations by Sex
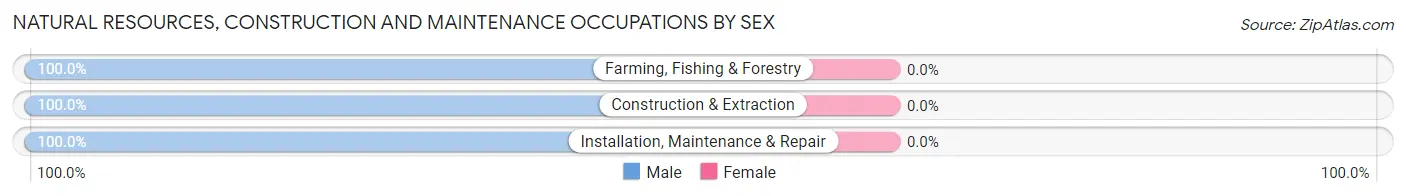
| Occupation | Male | Female |
| Farming, Fishing & Forestry | 3 (100.0%) | 0 (0.0%) |
| Construction & Extraction | 21 (100.0%) | 0 (0.0%) |
| Installation, Maintenance & Repair | 12 (100.0%) | 0 (0.0%) |
| Total (Category) | 36 (100.0%) | 0 (0.0%) |
| Total (Overall) | 279 (53.6%) | 241 (46.4%) |
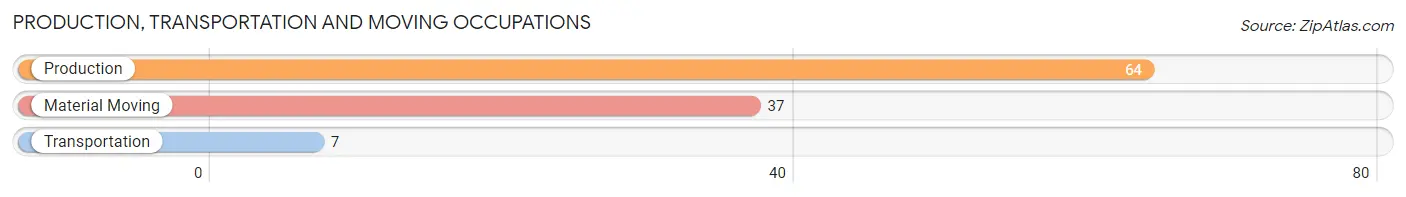
Production, Transportation and Moving Occupations
The most common Production, Transportation and Moving occupations in Strum are Production (64 | 12.3%), Material Moving (37 | 7.1%), and Transportation (7 | 1.3%).
Production, Transportation and Moving Occupations by Sex
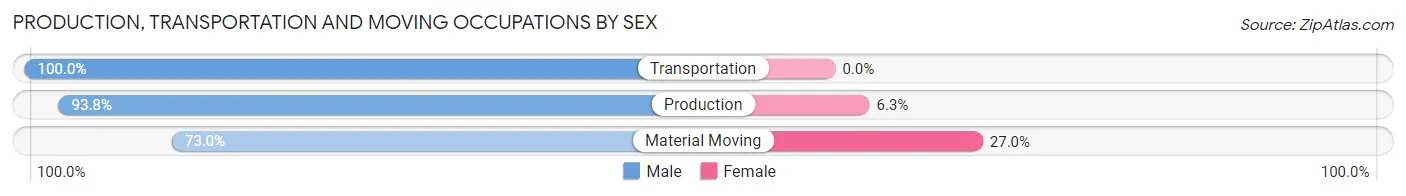
| Occupation | Male | Female |
| Production | 60 (93.8%) | 4 (6.2%) |
| Transportation | 7 (100.0%) | 0 (0.0%) |
| Material Moving | 27 (73.0%) | 10 (27.0%) |
| Total (Category) | 94 (87.0%) | 14 (13.0%) |
| Total (Overall) | 279 (53.6%) | 241 (46.4%) |
Employment Industries by Sex in Strum
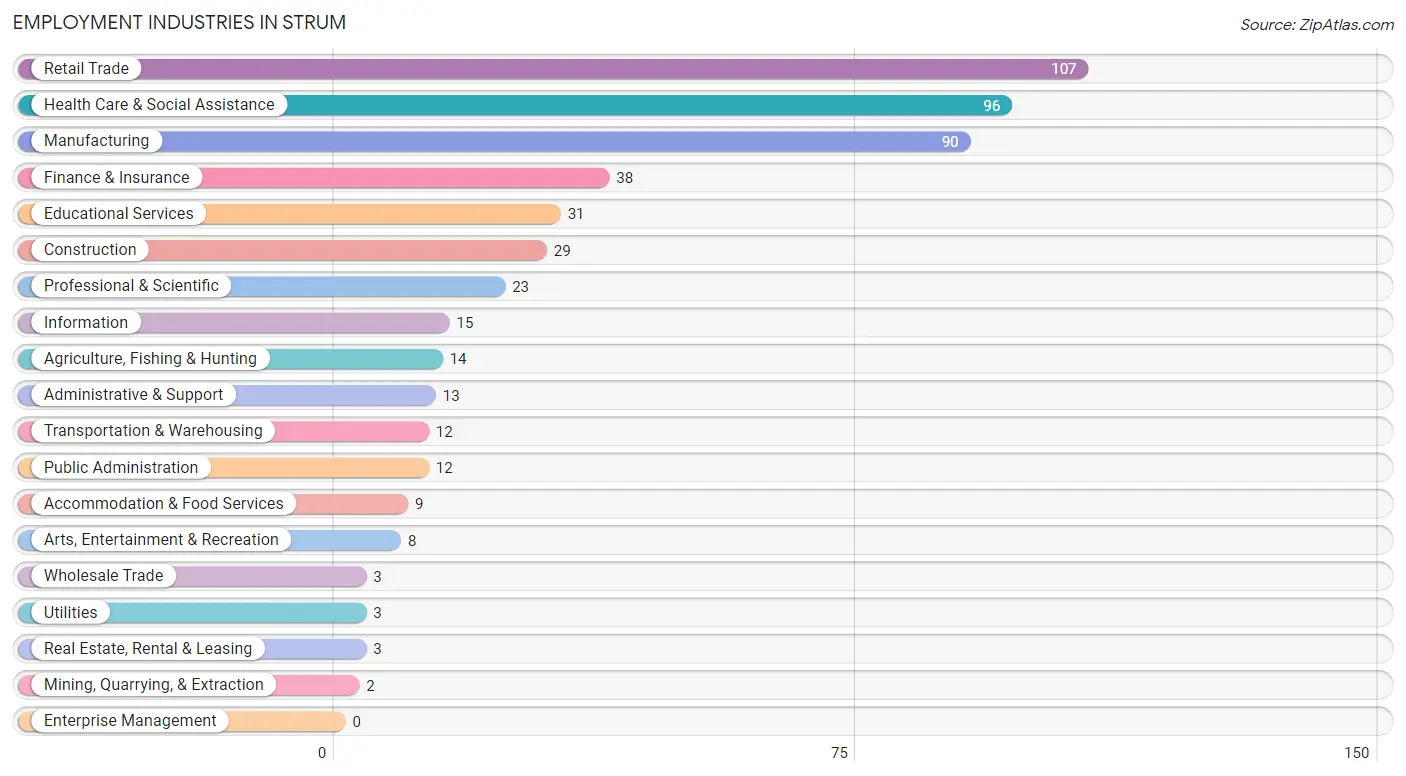
Employment Industries in Strum
The major employment industries in Strum include Retail Trade (107 | 20.6%), Health Care & Social Assistance (96 | 18.5%), Manufacturing (90 | 17.3%), Finance & Insurance (38 | 7.3%), and Educational Services (31 | 6.0%).
Employment Industries by Sex in Strum
The Strum industries that see more men than women are Agriculture, Fishing & Hunting (100.0%), Mining, Quarrying, & Extraction (100.0%), and Construction (100.0%), whereas the industries that tend to have a higher number of women are Transportation & Warehousing (100.0%), Real Estate, Rental & Leasing (100.0%), and Accommodation & Food Services (100.0%).
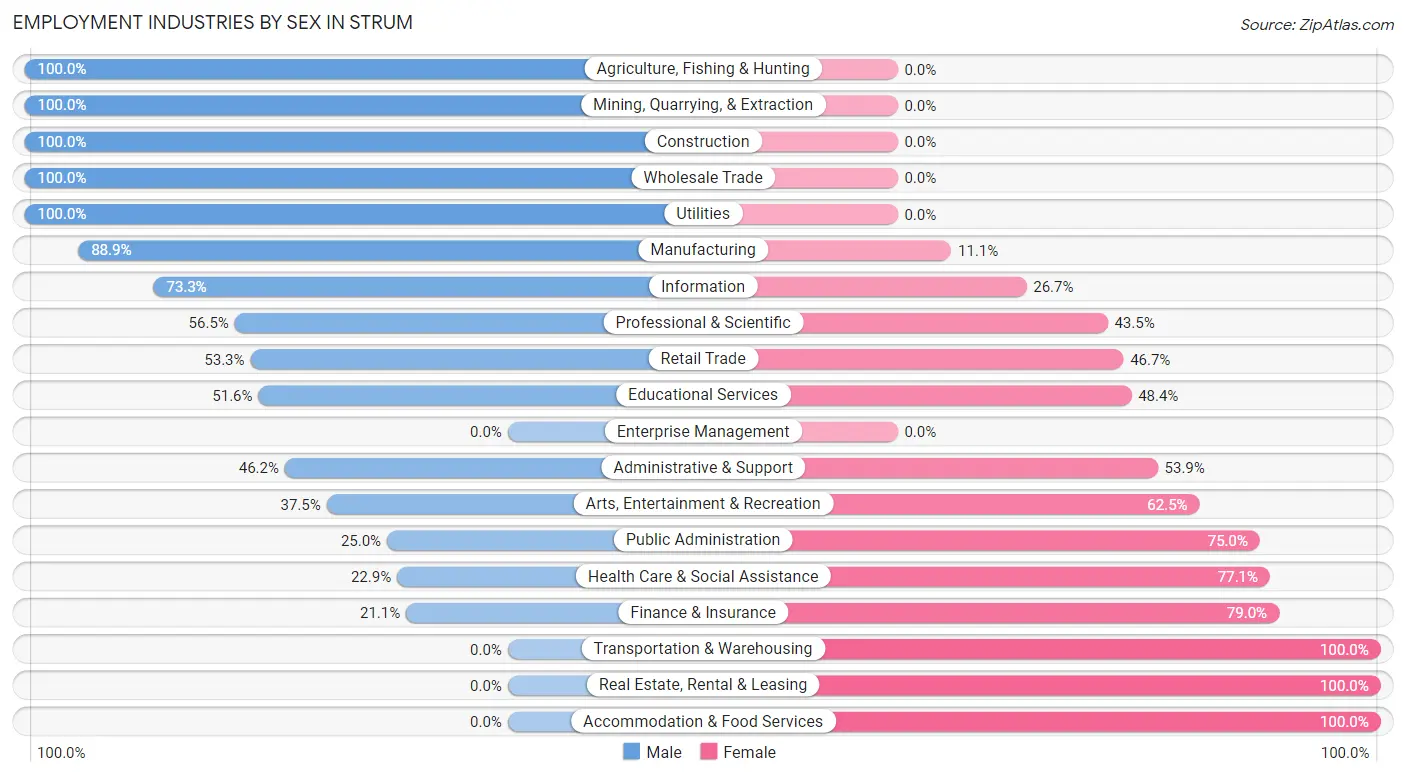
| Industry | Male | Female |
| Agriculture, Fishing & Hunting | 14 (100.0%) | 0 (0.0%) |
| Mining, Quarrying, & Extraction | 2 (100.0%) | 0 (0.0%) |
| Construction | 29 (100.0%) | 0 (0.0%) |
| Manufacturing | 80 (88.9%) | 10 (11.1%) |
| Wholesale Trade | 3 (100.0%) | 0 (0.0%) |
| Retail Trade | 57 (53.3%) | 50 (46.7%) |
| Transportation & Warehousing | 0 (0.0%) | 12 (100.0%) |
| Utilities | 3 (100.0%) | 0 (0.0%) |
| Information | 11 (73.3%) | 4 (26.7%) |
| Finance & Insurance | 8 (21.0%) | 30 (78.9%) |
| Real Estate, Rental & Leasing | 0 (0.0%) | 3 (100.0%) |
| Professional & Scientific | 13 (56.5%) | 10 (43.5%) |
| Enterprise Management | 0 (0.0%) | 0 (0.0%) |
| Administrative & Support | 6 (46.2%) | 7 (53.8%) |
| Educational Services | 16 (51.6%) | 15 (48.4%) |
| Health Care & Social Assistance | 22 (22.9%) | 74 (77.1%) |
| Arts, Entertainment & Recreation | 3 (37.5%) | 5 (62.5%) |
| Accommodation & Food Services | 0 (0.0%) | 9 (100.0%) |
| Public Administration | 3 (25.0%) | 9 (75.0%) |
| Total | 279 (53.6%) | 241 (46.4%) |
Education in Strum
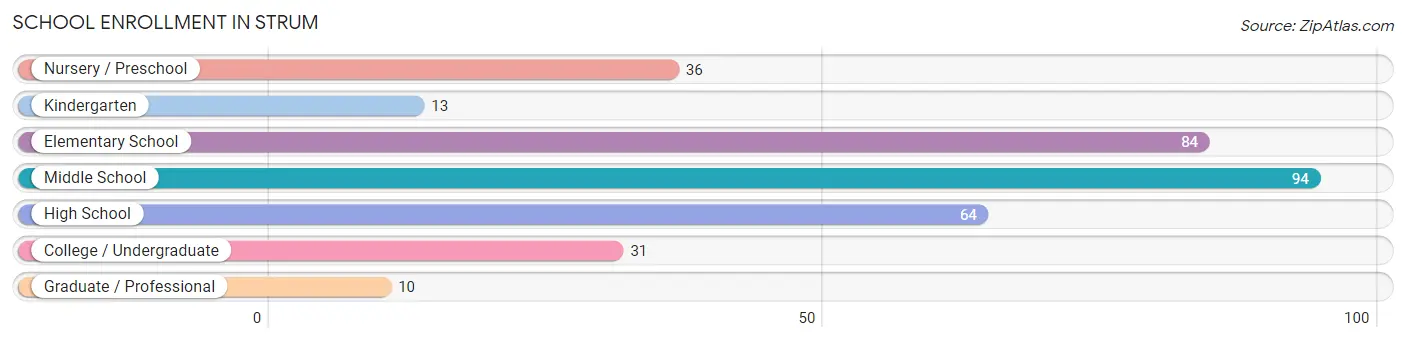
School Enrollment in Strum
The most common levels of schooling among the 332 students in Strum are middle school (94 | 28.3%), elementary school (84 | 25.3%), and high school (64 | 19.3%).
| School Level | # Students | % Students |
| Nursery / Preschool | 36 | 10.8% |
| Kindergarten | 13 | 3.9% |
| Elementary School | 84 | 25.3% |
| Middle School | 94 | 28.3% |
| High School | 64 | 19.3% |
| College / Undergraduate | 31 | 9.3% |
| Graduate / Professional | 10 | 3.0% |
| Total | 332 | 100.0% |
School Enrollment by Age by Funding Source in Strum
Out of a total of 332 students who are enrolled in schools in Strum, 41 (12.3%) attend a private institution, while the remaining 291 (87.7%) are enrolled in public schools. The age group of 25 to 34 year olds has the highest likelihood of being enrolled in private schools, with 5 (50.0% in the age bracket) enrolled. Conversely, the age group of 3 to 4 year olds has the lowest likelihood of being enrolled in a private school, with 15 (100.0% in the age bracket) attending a public institution.
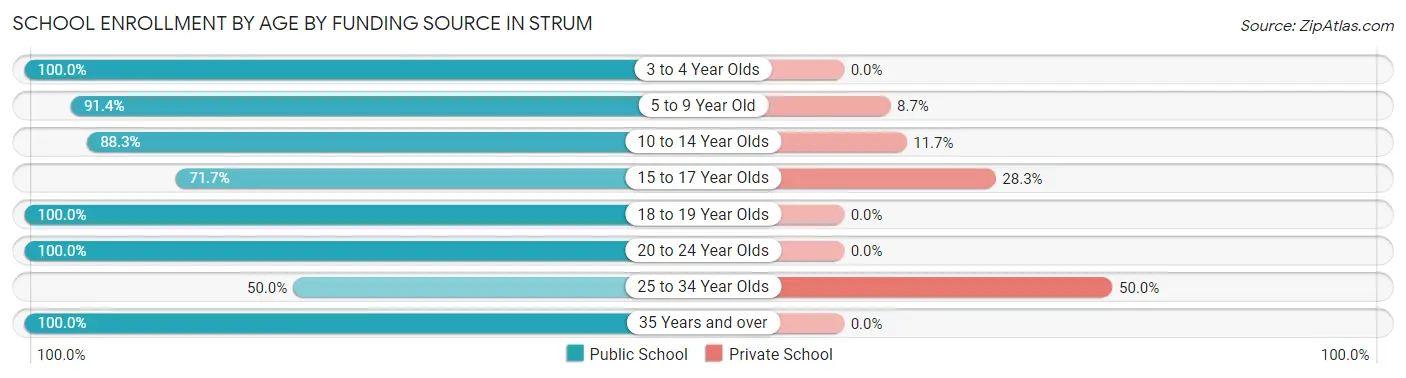
| Age Bracket | Public School | Private School |
| 3 to 4 Year Olds | 15 (100.0%) | 0 (0.0%) |
| 5 to 9 Year Old | 95 (91.3%) | 9 (8.6%) |
| 10 to 14 Year Olds | 106 (88.3%) | 14 (11.7%) |
| 15 to 17 Year Olds | 33 (71.7%) | 13 (28.3%) |
| 18 to 19 Year Olds | 13 (100.0%) | 0 (0.0%) |
| 20 to 24 Year Olds | 12 (100.0%) | 0 (0.0%) |
| 25 to 34 Year Olds | 5 (50.0%) | 5 (50.0%) |
| 35 Years and over | 12 (100.0%) | 0 (0.0%) |
| Total | 291 (87.7%) | 41 (12.3%) |
Educational Attainment by Field of Study in Strum
Business (36 | 21.8%), education (36 | 21.8%), arts & humanities (18 | 10.9%), bio, nature & agricultural (15 | 9.1%), and science & technology (14 | 8.5%) are the most common fields of study among 165 individuals in Strum who have obtained a bachelor's degree or higher.
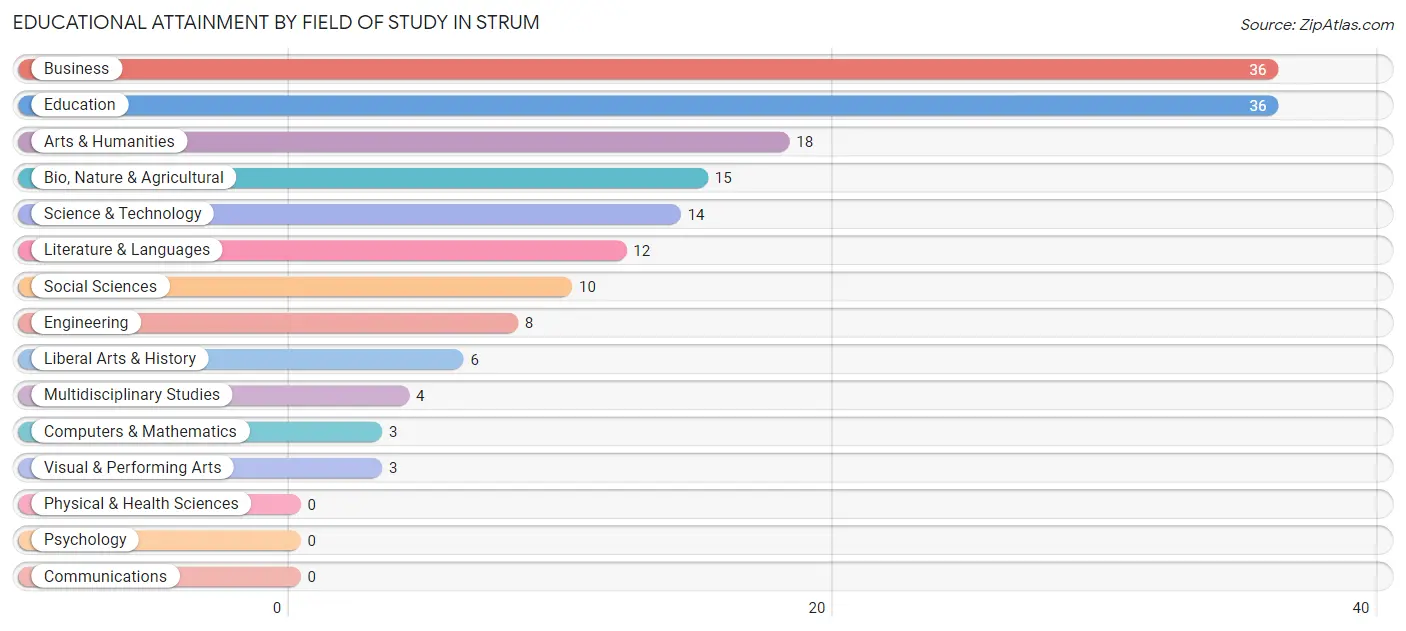
| Field of Study | # Graduates | % Graduates |
| Computers & Mathematics | 3 | 1.8% |
| Bio, Nature & Agricultural | 15 | 9.1% |
| Physical & Health Sciences | 0 | 0.0% |
| Psychology | 0 | 0.0% |
| Social Sciences | 10 | 6.1% |
| Engineering | 8 | 4.9% |
| Multidisciplinary Studies | 4 | 2.4% |
| Science & Technology | 14 | 8.5% |
| Business | 36 | 21.8% |
| Education | 36 | 21.8% |
| Literature & Languages | 12 | 7.3% |
| Liberal Arts & History | 6 | 3.6% |
| Visual & Performing Arts | 3 | 1.8% |
| Communications | 0 | 0.0% |
| Arts & Humanities | 18 | 10.9% |
| Total | 165 | 100.0% |
Transportation & Commute in Strum
Vehicle Availability by Sex in Strum
The most prevalent vehicle ownership categories in Strum are males with 2 vehicles (166, accounting for 61.3%) and females with 2 vehicles (105, making up 70.0%).
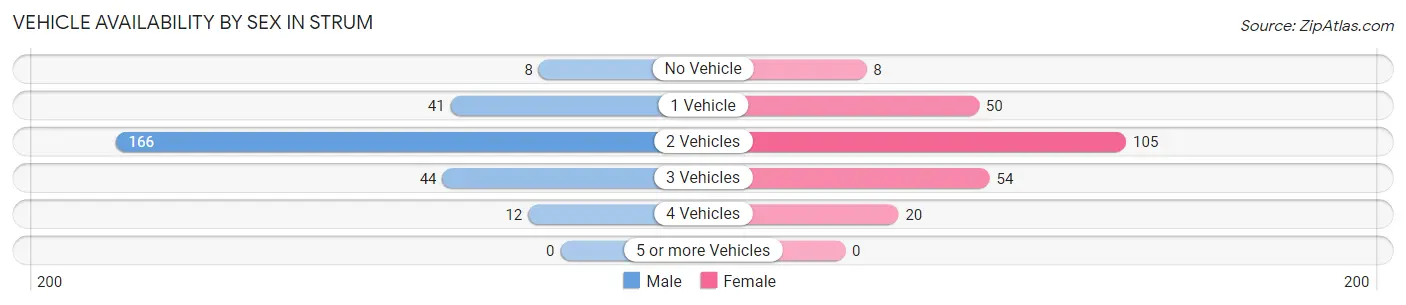
| Vehicles Available | Male | Female |
| No Vehicle | 8 (2.9%) | 8 (3.4%) |
| 1 Vehicle | 41 (15.1%) | 50 (21.1%) |
| 2 Vehicles | 166 (61.3%) | 105 (44.3%) |
| 3 Vehicles | 44 (16.2%) | 54 (22.8%) |
| 4 Vehicles | 12 (4.4%) | 20 (8.4%) |
| 5 or more Vehicles | 0 (0.0%) | 0 (0.0%) |
| Total | 271 (100.0%) | 237 (100.0%) |
Commute Time in Strum
The most frequently occuring commute durations in Strum are 30 to 34 minutes (66 commuters, 14.2%), 35 to 39 minutes (54 commuters, 11.6%), and 5 to 9 minutes (49 commuters, 10.6%).
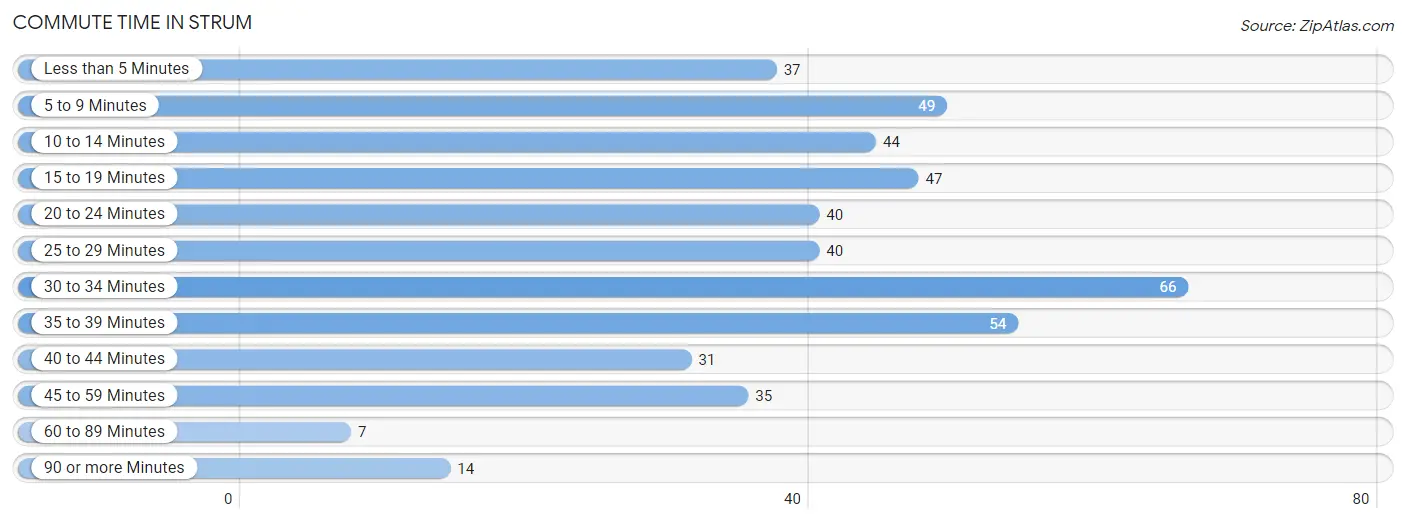
| Commute Time | # Commuters | % Commuters |
| Less than 5 Minutes | 37 | 8.0% |
| 5 to 9 Minutes | 49 | 10.6% |
| 10 to 14 Minutes | 44 | 9.5% |
| 15 to 19 Minutes | 47 | 10.1% |
| 20 to 24 Minutes | 40 | 8.6% |
| 25 to 29 Minutes | 40 | 8.6% |
| 30 to 34 Minutes | 66 | 14.2% |
| 35 to 39 Minutes | 54 | 11.6% |
| 40 to 44 Minutes | 31 | 6.7% |
| 45 to 59 Minutes | 35 | 7.5% |
| 60 to 89 Minutes | 7 | 1.5% |
| 90 or more Minutes | 14 | 3.0% |
Commute Time by Sex in Strum
The most common commute times in Strum are 30 to 34 minutes (38 commuters, 14.7%) for males and 20 to 24 minutes (30 commuters, 14.6%) for females.
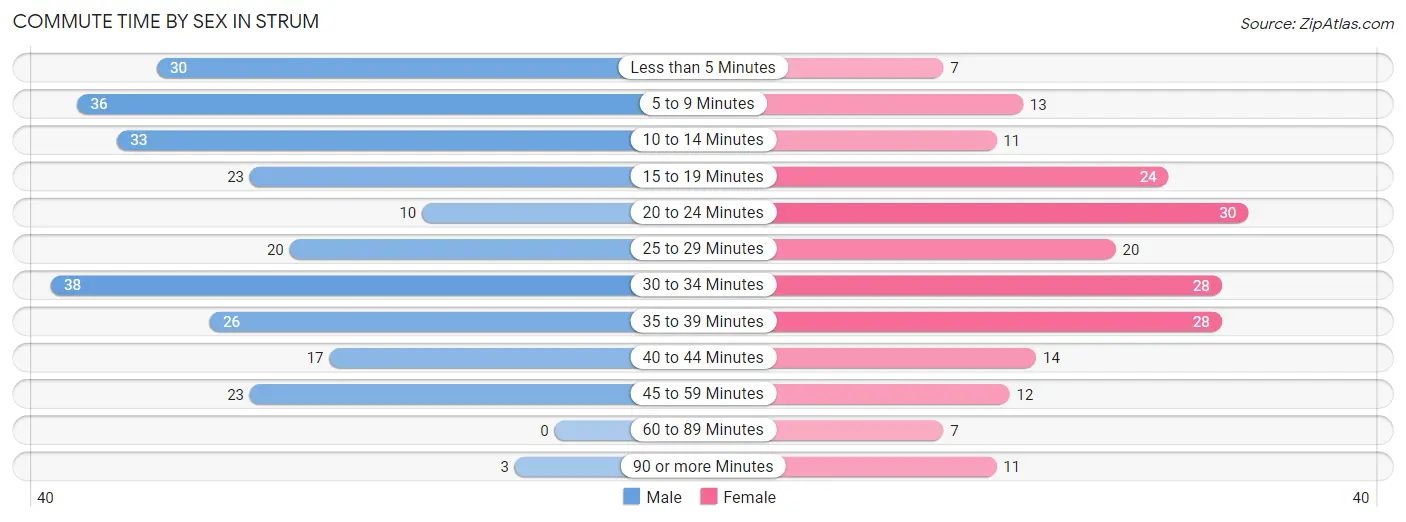
| Commute Time | Male | Female |
| Less than 5 Minutes | 30 (11.6%) | 7 (3.4%) |
| 5 to 9 Minutes | 36 (13.9%) | 13 (6.3%) |
| 10 to 14 Minutes | 33 (12.7%) | 11 (5.4%) |
| 15 to 19 Minutes | 23 (8.9%) | 24 (11.7%) |
| 20 to 24 Minutes | 10 (3.9%) | 30 (14.6%) |
| 25 to 29 Minutes | 20 (7.7%) | 20 (9.8%) |
| 30 to 34 Minutes | 38 (14.7%) | 28 (13.7%) |
| 35 to 39 Minutes | 26 (10.0%) | 28 (13.7%) |
| 40 to 44 Minutes | 17 (6.6%) | 14 (6.8%) |
| 45 to 59 Minutes | 23 (8.9%) | 12 (5.9%) |
| 60 to 89 Minutes | 0 (0.0%) | 7 (3.4%) |
| 90 or more Minutes | 3 (1.2%) | 11 (5.4%) |
Time of Departure to Work by Sex in Strum
The most frequent times of departure to work in Strum are 5:00 AM to 5:29 AM (42, 16.2%) for males and 7:00 AM to 7:29 AM (52, 25.4%) for females.
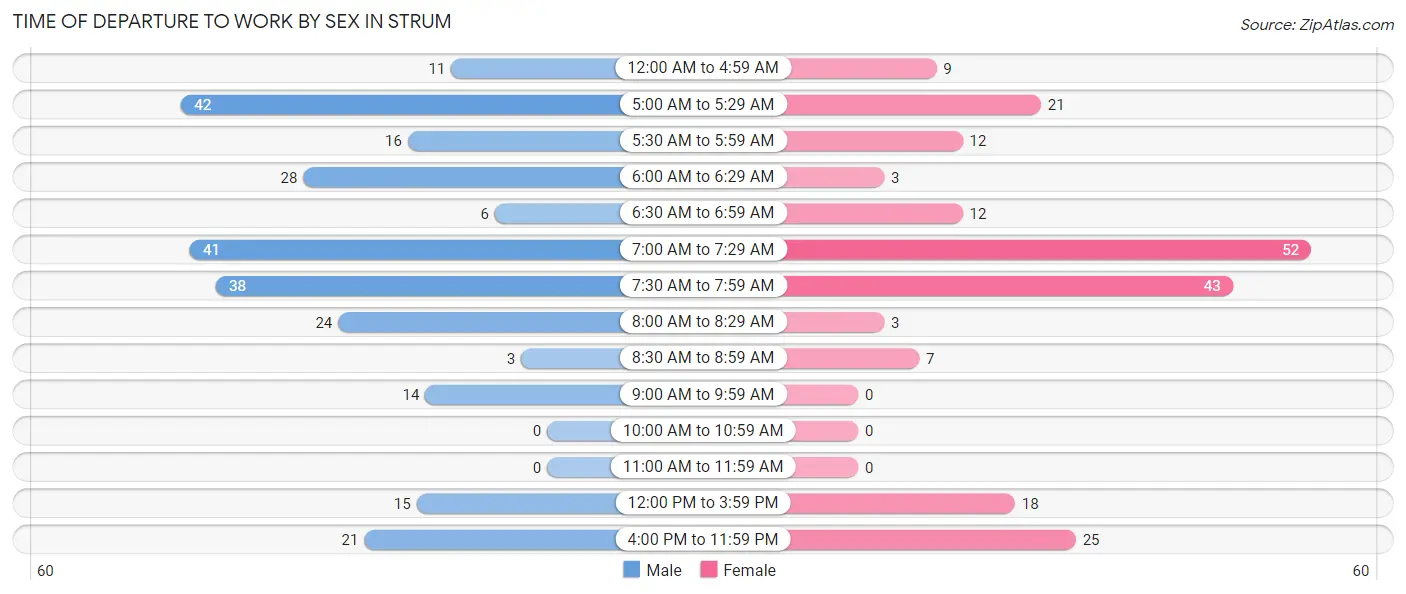
| Time of Departure | Male | Female |
| 12:00 AM to 4:59 AM | 11 (4.3%) | 9 (4.4%) |
| 5:00 AM to 5:29 AM | 42 (16.2%) | 21 (10.2%) |
| 5:30 AM to 5:59 AM | 16 (6.2%) | 12 (5.9%) |
| 6:00 AM to 6:29 AM | 28 (10.8%) | 3 (1.5%) |
| 6:30 AM to 6:59 AM | 6 (2.3%) | 12 (5.9%) |
| 7:00 AM to 7:29 AM | 41 (15.8%) | 52 (25.4%) |
| 7:30 AM to 7:59 AM | 38 (14.7%) | 43 (21.0%) |
| 8:00 AM to 8:29 AM | 24 (9.3%) | 3 (1.5%) |
| 8:30 AM to 8:59 AM | 3 (1.2%) | 7 (3.4%) |
| 9:00 AM to 9:59 AM | 14 (5.4%) | 0 (0.0%) |
| 10:00 AM to 10:59 AM | 0 (0.0%) | 0 (0.0%) |
| 11:00 AM to 11:59 AM | 0 (0.0%) | 0 (0.0%) |
| 12:00 PM to 3:59 PM | 15 (5.8%) | 18 (8.8%) |
| 4:00 PM to 11:59 PM | 21 (8.1%) | 25 (12.2%) |
| Total | 259 (100.0%) | 205 (100.0%) |
Housing Occupancy in Strum
Occupancy by Ownership in Strum
Of the total 409 dwellings in Strum, owner-occupied units account for 319 (78.0%), while renter-occupied units make up 90 (22.0%).
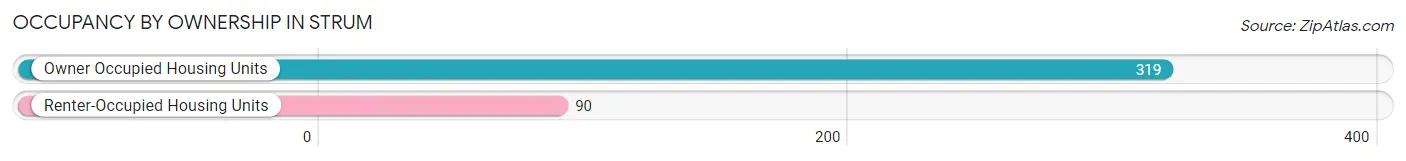
| Occupancy | # Housing Units | % Housing Units |
| Owner Occupied Housing Units | 319 | 78.0% |
| Renter-Occupied Housing Units | 90 | 22.0% |
| Total Occupied Housing Units | 409 | 100.0% |
Occupancy by Household Size in Strum
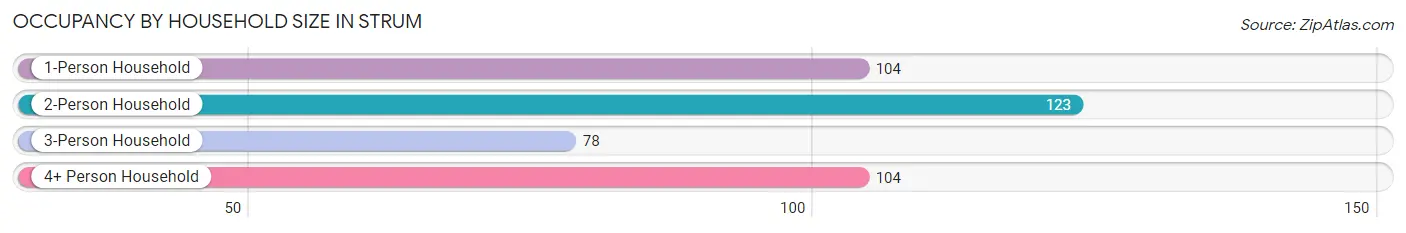
| Household Size | # Housing Units | % Housing Units |
| 1-Person Household | 104 | 25.4% |
| 2-Person Household | 123 | 30.1% |
| 3-Person Household | 78 | 19.1% |
| 4+ Person Household | 104 | 25.4% |
| Total Housing Units | 409 | 100.0% |
Occupancy by Ownership by Household Size in Strum
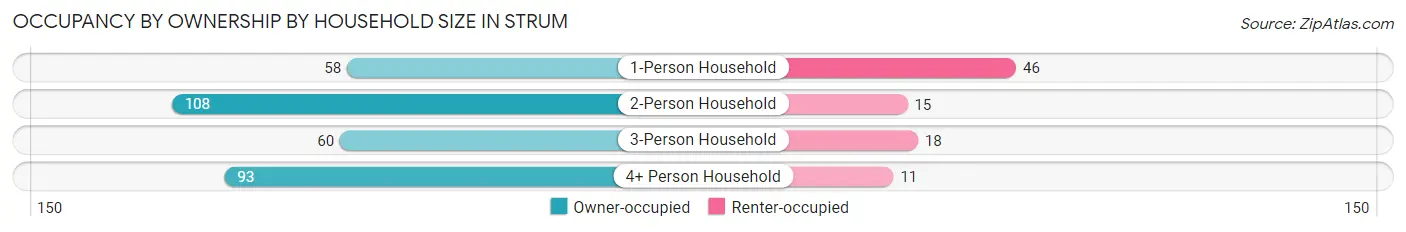
| Household Size | Owner-occupied | Renter-occupied |
| 1-Person Household | 58 (55.8%) | 46 (44.2%) |
| 2-Person Household | 108 (87.8%) | 15 (12.2%) |
| 3-Person Household | 60 (76.9%) | 18 (23.1%) |
| 4+ Person Household | 93 (89.4%) | 11 (10.6%) |
| Total Housing Units | 319 (78.0%) | 90 (22.0%) |
Occupancy by Educational Attainment in Strum
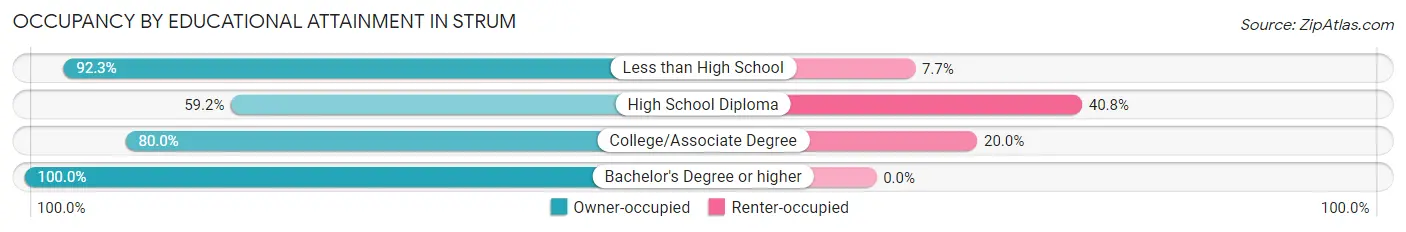
| Household Size | Owner-occupied | Renter-occupied |
| Less than High School | 12 (92.3%) | 1 (7.7%) |
| High School Diploma | 77 (59.2%) | 53 (40.8%) |
| College/Associate Degree | 144 (80.0%) | 36 (20.0%) |
| Bachelor's Degree or higher | 86 (100.0%) | 0 (0.0%) |
Occupancy by Age of Householder in Strum
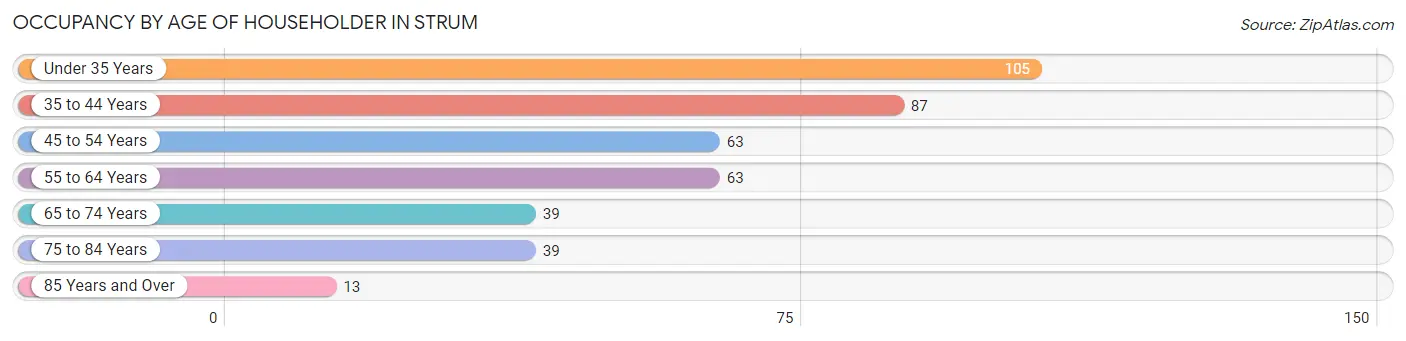
| Age Bracket | # Households | % Households |
| Under 35 Years | 105 | 25.7% |
| 35 to 44 Years | 87 | 21.3% |
| 45 to 54 Years | 63 | 15.4% |
| 55 to 64 Years | 63 | 15.4% |
| 65 to 74 Years | 39 | 9.5% |
| 75 to 84 Years | 39 | 9.5% |
| 85 Years and Over | 13 | 3.2% |
| Total | 409 | 100.0% |
Housing Finances in Strum
Median Income by Occupancy in Strum
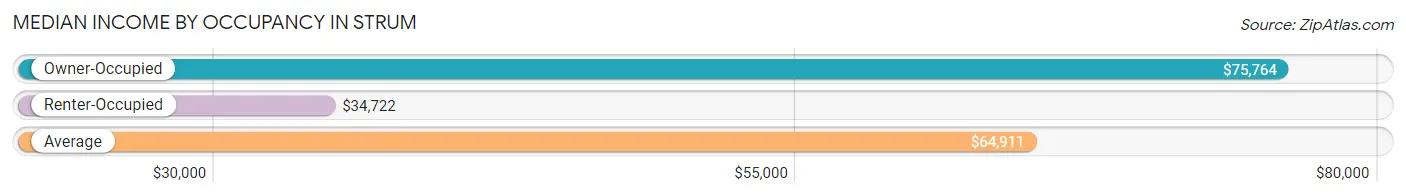
| Occupancy Type | # Households | Median Income |
| Owner-Occupied | 319 (78.0%) | $75,764 |
| Renter-Occupied | 90 (22.0%) | $34,722 |
| Average | 409 (100.0%) | $64,911 |
Occupancy by Householder Income Bracket in Strum
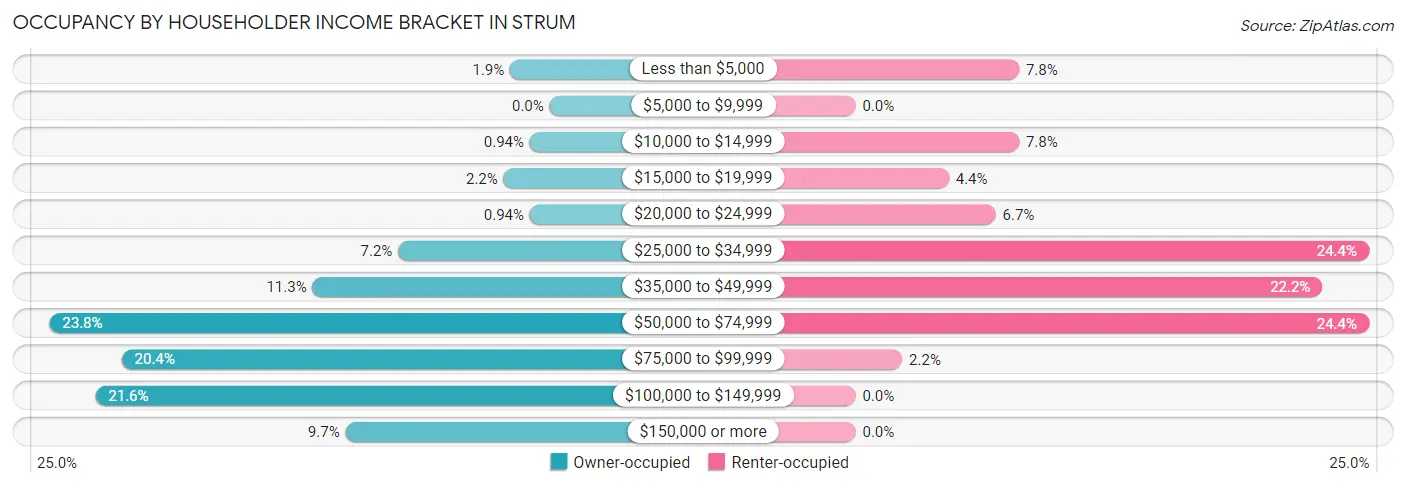
| Income Bracket | Owner-occupied | Renter-occupied |
| Less than $5,000 | 6 (1.9%) | 7 (7.8%) |
| $5,000 to $9,999 | 0 (0.0%) | 0 (0.0%) |
| $10,000 to $14,999 | 3 (0.9%) | 7 (7.8%) |
| $15,000 to $19,999 | 7 (2.2%) | 4 (4.4%) |
| $20,000 to $24,999 | 3 (0.9%) | 6 (6.7%) |
| $25,000 to $34,999 | 23 (7.2%) | 22 (24.4%) |
| $35,000 to $49,999 | 36 (11.3%) | 20 (22.2%) |
| $50,000 to $74,999 | 76 (23.8%) | 22 (24.4%) |
| $75,000 to $99,999 | 65 (20.4%) | 2 (2.2%) |
| $100,000 to $149,999 | 69 (21.6%) | 0 (0.0%) |
| $150,000 or more | 31 (9.7%) | 0 (0.0%) |
| Total | 319 (100.0%) | 90 (100.0%) |
Monthly Housing Cost Tiers in Strum
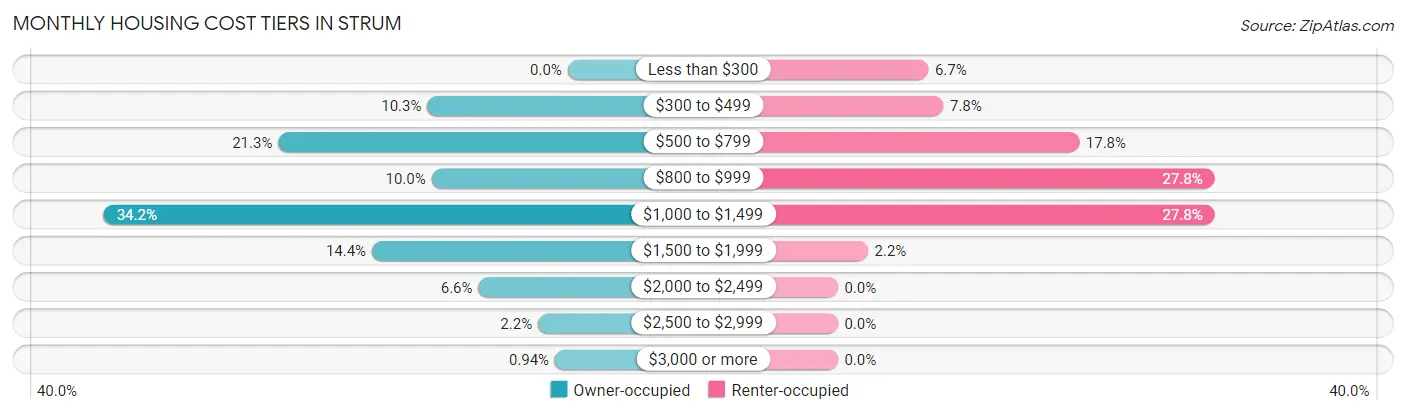
| Monthly Cost | Owner-occupied | Renter-occupied |
| Less than $300 | 0 (0.0%) | 6 (6.7%) |
| $300 to $499 | 33 (10.3%) | 7 (7.8%) |
| $500 to $799 | 68 (21.3%) | 16 (17.8%) |
| $800 to $999 | 32 (10.0%) | 25 (27.8%) |
| $1,000 to $1,499 | 109 (34.2%) | 25 (27.8%) |
| $1,500 to $1,999 | 46 (14.4%) | 2 (2.2%) |
| $2,000 to $2,499 | 21 (6.6%) | 0 (0.0%) |
| $2,500 to $2,999 | 7 (2.2%) | 0 (0.0%) |
| $3,000 or more | 3 (0.9%) | 0 (0.0%) |
| Total | 319 (100.0%) | 90 (100.0%) |
Physical Housing Characteristics in Strum
Housing Structures in Strum
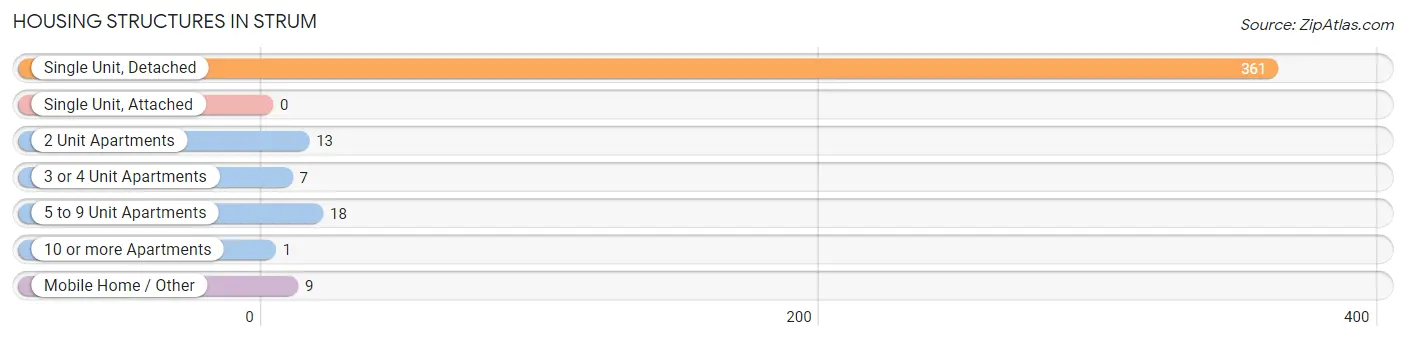
| Structure Type | # Housing Units | % Housing Units |
| Single Unit, Detached | 361 | 88.3% |
| Single Unit, Attached | 0 | 0.0% |
| 2 Unit Apartments | 13 | 3.2% |
| 3 or 4 Unit Apartments | 7 | 1.7% |
| 5 to 9 Unit Apartments | 18 | 4.4% |
| 10 or more Apartments | 1 | 0.2% |
| Mobile Home / Other | 9 | 2.2% |
| Total | 409 | 100.0% |
Housing Structures by Occupancy in Strum
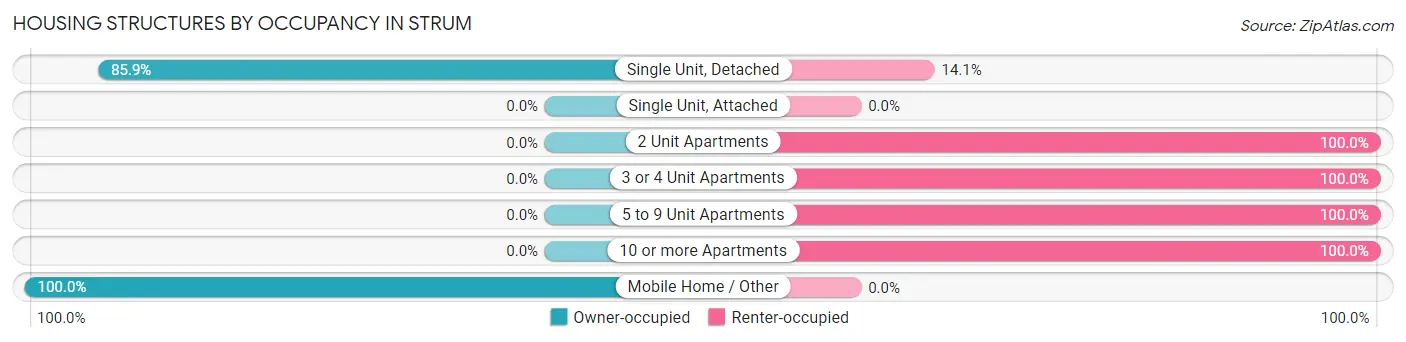
| Structure Type | Owner-occupied | Renter-occupied |
| Single Unit, Detached | 310 (85.9%) | 51 (14.1%) |
| Single Unit, Attached | 0 (0.0%) | 0 (0.0%) |
| 2 Unit Apartments | 0 (0.0%) | 13 (100.0%) |
| 3 or 4 Unit Apartments | 0 (0.0%) | 7 (100.0%) |
| 5 to 9 Unit Apartments | 0 (0.0%) | 18 (100.0%) |
| 10 or more Apartments | 0 (0.0%) | 1 (100.0%) |
| Mobile Home / Other | 9 (100.0%) | 0 (0.0%) |
| Total | 319 (78.0%) | 90 (22.0%) |
Housing Structures by Number of Rooms in Strum
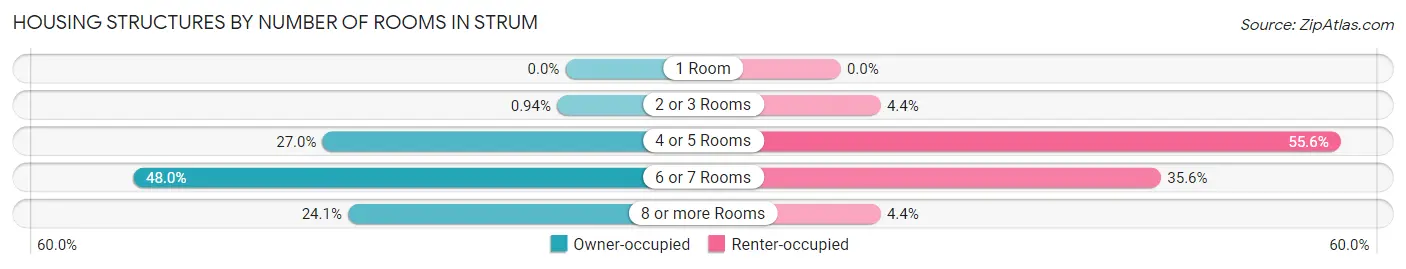
| Number of Rooms | Owner-occupied | Renter-occupied |
| 1 Room | 0 (0.0%) | 0 (0.0%) |
| 2 or 3 Rooms | 3 (0.9%) | 4 (4.4%) |
| 4 or 5 Rooms | 86 (27.0%) | 50 (55.6%) |
| 6 or 7 Rooms | 153 (48.0%) | 32 (35.6%) |
| 8 or more Rooms | 77 (24.1%) | 4 (4.4%) |
| Total | 319 (100.0%) | 90 (100.0%) |
Housing Structure by Heating Type in Strum
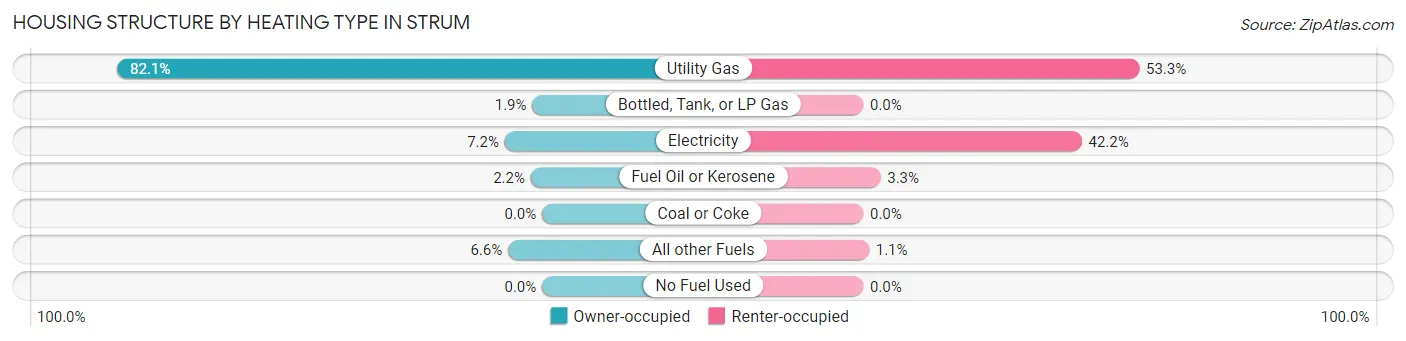
| Heating Type | Owner-occupied | Renter-occupied |
| Utility Gas | 262 (82.1%) | 48 (53.3%) |
| Bottled, Tank, or LP Gas | 6 (1.9%) | 0 (0.0%) |
| Electricity | 23 (7.2%) | 38 (42.2%) |
| Fuel Oil or Kerosene | 7 (2.2%) | 3 (3.3%) |
| Coal or Coke | 0 (0.0%) | 0 (0.0%) |
| All other Fuels | 21 (6.6%) | 1 (1.1%) |
| No Fuel Used | 0 (0.0%) | 0 (0.0%) |
| Total | 319 (100.0%) | 90 (100.0%) |
Household Vehicle Usage in Strum
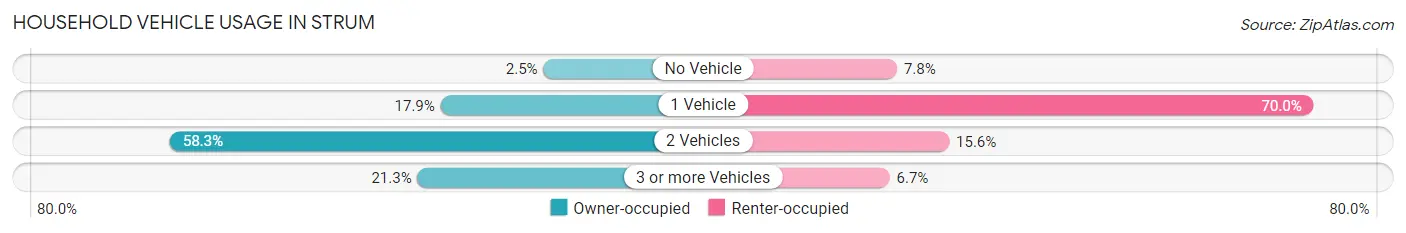
| Vehicles per Household | Owner-occupied | Renter-occupied |
| No Vehicle | 8 (2.5%) | 7 (7.8%) |
| 1 Vehicle | 57 (17.9%) | 63 (70.0%) |
| 2 Vehicles | 186 (58.3%) | 14 (15.6%) |
| 3 or more Vehicles | 68 (21.3%) | 6 (6.7%) |
| Total | 319 (100.0%) | 90 (100.0%) |
Real Estate & Mortgages in Strum
Real Estate and Mortgage Overview in Strum
| Characteristic | Without Mortgage | With Mortgage |
| Housing Units | 104 | 215 |
| Median Property Value | $190,600 | $171,200 |
| Median Household Income | $64,063 | $24 |
| Monthly Housing Costs | $596 | $3 |
| Real Estate Taxes | $3,152 | $0 |
Property Value by Mortgage Status in Strum
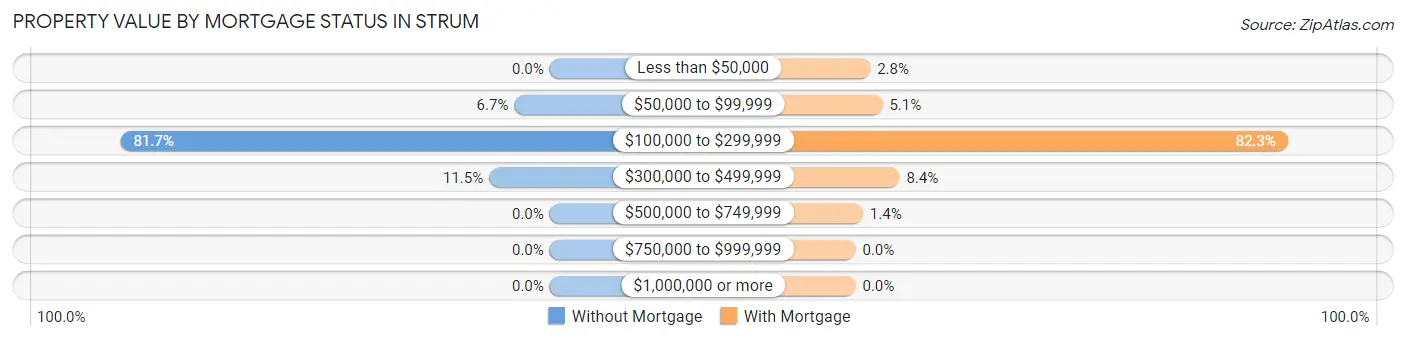
| Property Value | Without Mortgage | With Mortgage |
| Less than $50,000 | 0 (0.0%) | 6 (2.8%) |
| $50,000 to $99,999 | 7 (6.7%) | 11 (5.1%) |
| $100,000 to $299,999 | 85 (81.7%) | 177 (82.3%) |
| $300,000 to $499,999 | 12 (11.5%) | 18 (8.4%) |
| $500,000 to $749,999 | 0 (0.0%) | 3 (1.4%) |
| $750,000 to $999,999 | 0 (0.0%) | 0 (0.0%) |
| $1,000,000 or more | 0 (0.0%) | 0 (0.0%) |
| Total | 104 (100.0%) | 215 (100.0%) |
Household Income by Mortgage Status in Strum
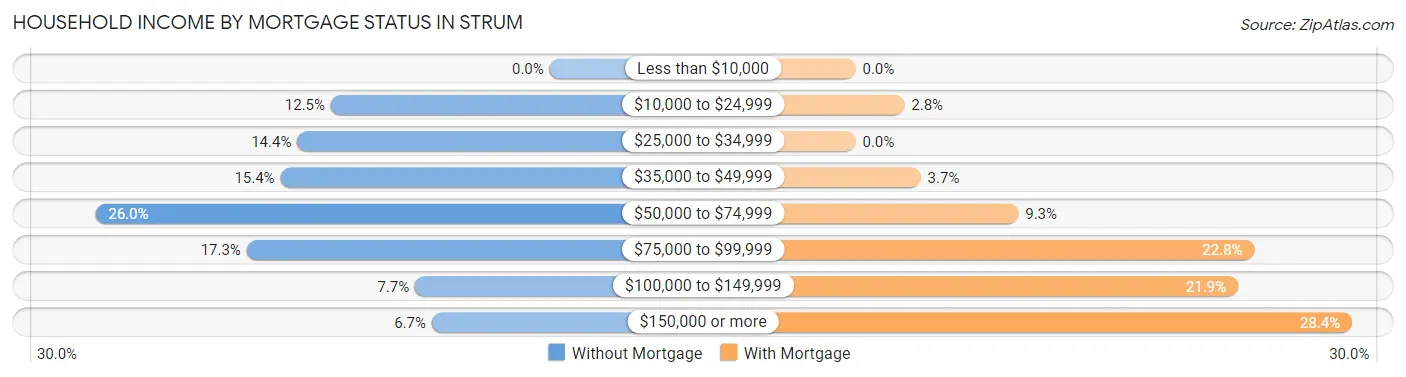
| Household Income | Without Mortgage | With Mortgage |
| Less than $10,000 | 0 (0.0%) | 0 (0.0%) |
| $10,000 to $24,999 | 13 (12.5%) | 6 (2.8%) |
| $25,000 to $34,999 | 15 (14.4%) | 0 (0.0%) |
| $35,000 to $49,999 | 16 (15.4%) | 8 (3.7%) |
| $50,000 to $74,999 | 27 (26.0%) | 20 (9.3%) |
| $75,000 to $99,999 | 18 (17.3%) | 49 (22.8%) |
| $100,000 to $149,999 | 8 (7.7%) | 47 (21.9%) |
| $150,000 or more | 7 (6.7%) | 61 (28.4%) |
| Total | 104 (100.0%) | 215 (100.0%) |
Property Value to Household Income Ratio in Strum
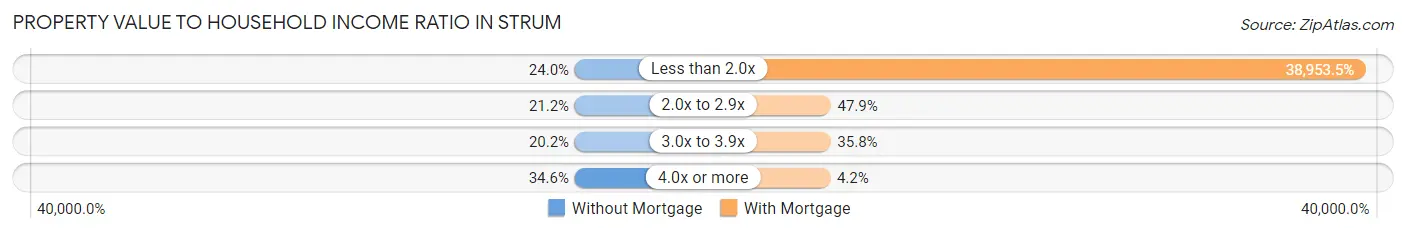
| Value-to-Income Ratio | Without Mortgage | With Mortgage |
| Less than 2.0x | 25 (24.0%) | 83,750 (38,953.5%) |
| 2.0x to 2.9x | 22 (21.1%) | 103 (47.9%) |
| 3.0x to 3.9x | 21 (20.2%) | 77 (35.8%) |
| 4.0x or more | 36 (34.6%) | 9 (4.2%) |
| Total | 104 (100.0%) | 215 (100.0%) |
Real Estate Taxes by Mortgage Status in Strum
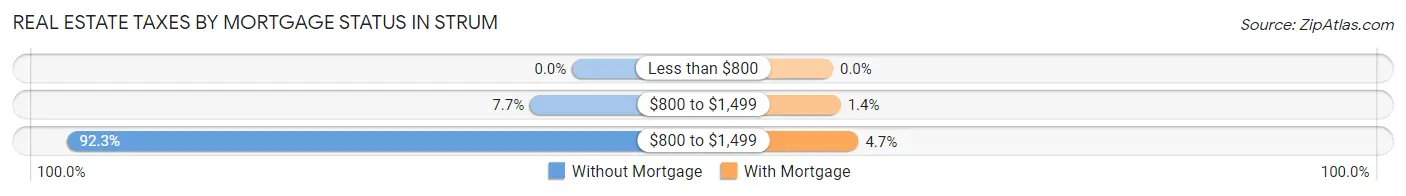
| Property Taxes | Without Mortgage | With Mortgage |
| Less than $800 | 0 (0.0%) | 0 (0.0%) |
| $800 to $1,499 | 8 (7.7%) | 3 (1.4%) |
| $800 to $1,499 | 96 (92.3%) | 10 (4.6%) |
| Total | 104 (100.0%) | 215 (100.0%) |
Health & Disability in Strum
Health Insurance Coverage by Age in Strum
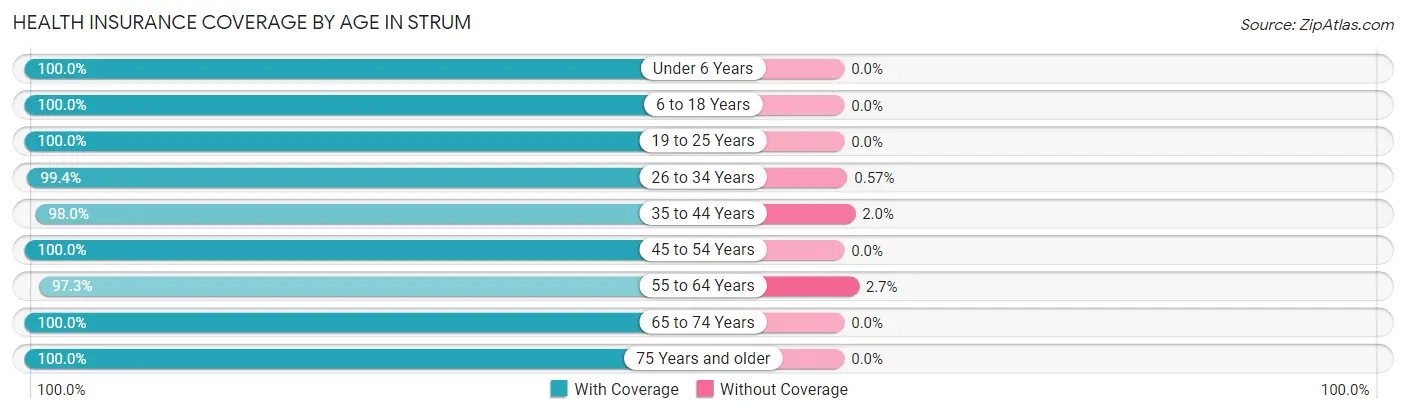
| Age Bracket | With Coverage | Without Coverage |
| Under 6 Years | 132 (100.0%) | 0 (0.0%) |
| 6 to 18 Years | 262 (100.0%) | 0 (0.0%) |
| 19 to 25 Years | 69 (100.0%) | 0 (0.0%) |
| 26 to 34 Years | 173 (99.4%) | 1 (0.6%) |
| 35 to 44 Years | 144 (98.0%) | 3 (2.0%) |
| 45 to 54 Years | 98 (100.0%) | 0 (0.0%) |
| 55 to 64 Years | 108 (97.3%) | 3 (2.7%) |
| 65 to 74 Years | 92 (100.0%) | 0 (0.0%) |
| 75 Years and older | 84 (100.0%) | 0 (0.0%) |
| Total | 1,162 (99.4%) | 7 (0.6%) |
Health Insurance Coverage by Citizenship Status in Strum
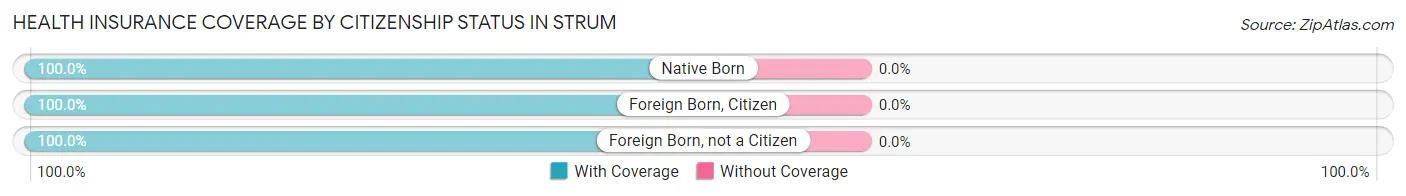
| Citizenship Status | With Coverage | Without Coverage |
| Native Born | 132 (100.0%) | 0 (0.0%) |
| Foreign Born, Citizen | 262 (100.0%) | 0 (0.0%) |
| Foreign Born, not a Citizen | 69 (100.0%) | 0 (0.0%) |
Health Insurance Coverage by Household Income in Strum
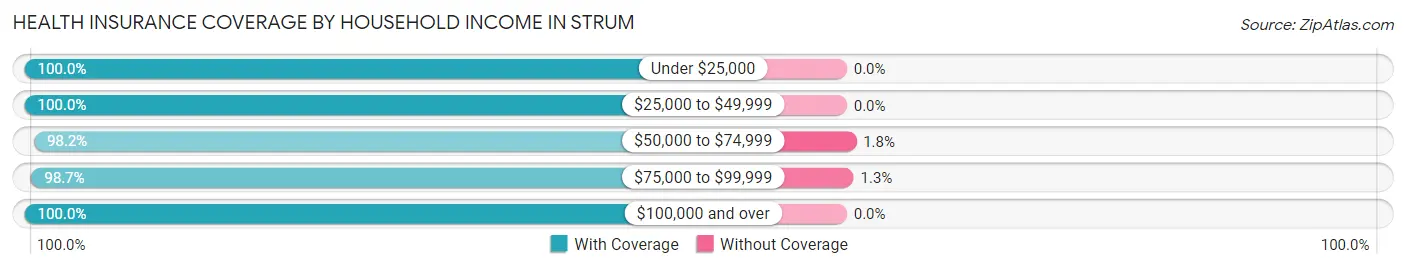
| Household Income | With Coverage | Without Coverage |
| Under $25,000 | 81 (100.0%) | 0 (0.0%) |
| $25,000 to $49,999 | 244 (100.0%) | 0 (0.0%) |
| $50,000 to $74,999 | 223 (98.2%) | 4 (1.8%) |
| $75,000 to $99,999 | 234 (98.7%) | 3 (1.3%) |
| $100,000 and over | 359 (100.0%) | 0 (0.0%) |
Public vs Private Health Insurance Coverage by Age in Strum
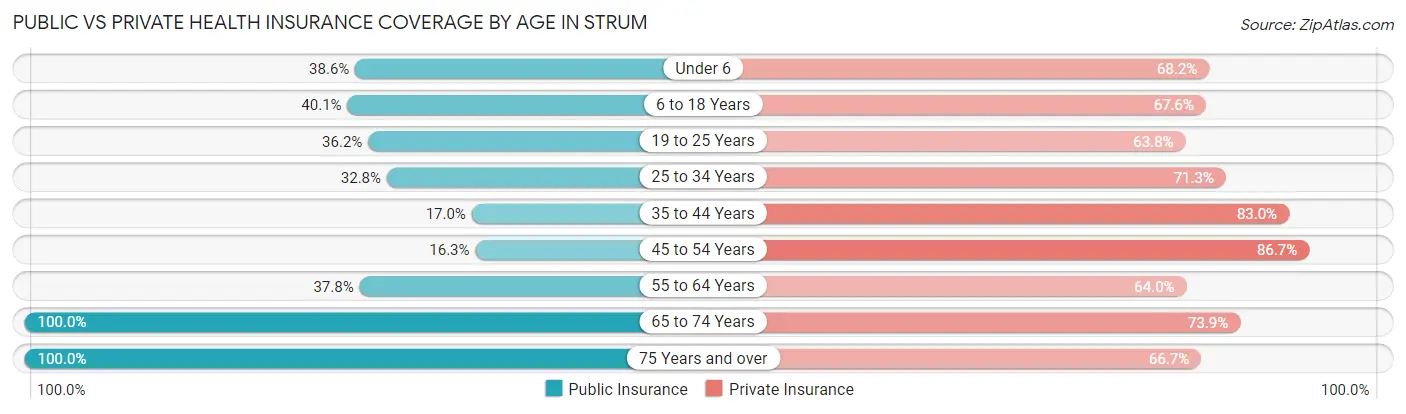
| Age Bracket | Public Insurance | Private Insurance |
| Under 6 | 51 (38.6%) | 90 (68.2%) |
| 6 to 18 Years | 105 (40.1%) | 177 (67.6%) |
| 19 to 25 Years | 25 (36.2%) | 44 (63.8%) |
| 25 to 34 Years | 57 (32.8%) | 124 (71.3%) |
| 35 to 44 Years | 25 (17.0%) | 122 (83.0%) |
| 45 to 54 Years | 16 (16.3%) | 85 (86.7%) |
| 55 to 64 Years | 42 (37.8%) | 71 (64.0%) |
| 65 to 74 Years | 92 (100.0%) | 68 (73.9%) |
| 75 Years and over | 84 (100.0%) | 56 (66.7%) |
| Total | 497 (42.5%) | 837 (71.6%) |
Disability Status by Sex by Age in Strum
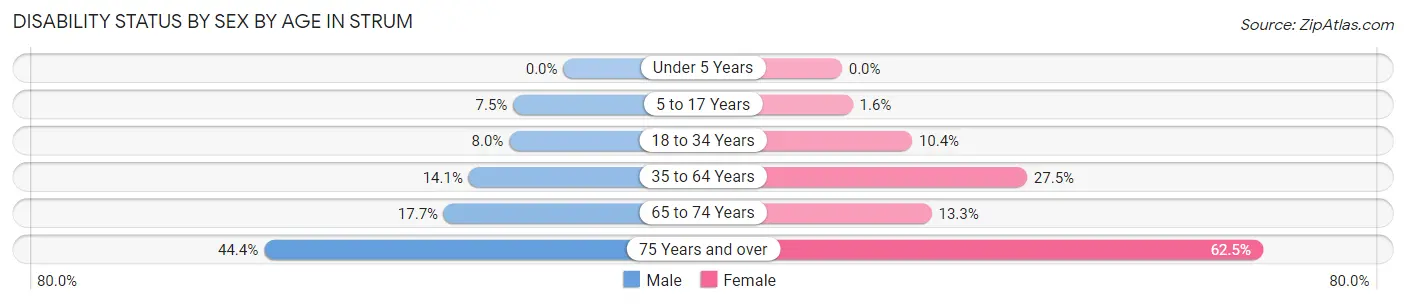
| Age Bracket | Male | Female |
| Under 5 Years | 0 (0.0%) | 0 (0.0%) |
| 5 to 17 Years | 7 (7.4%) | 3 (1.6%) |
| 18 to 34 Years | 9 (8.0%) | 15 (10.4%) |
| 35 to 64 Years | 26 (14.1%) | 47 (27.5%) |
| 65 to 74 Years | 11 (17.7%) | 4 (13.3%) |
| 75 Years and over | 16 (44.4%) | 30 (62.5%) |
Disability Class by Sex by Age in Strum
Disability Class: Hearing Difficulty
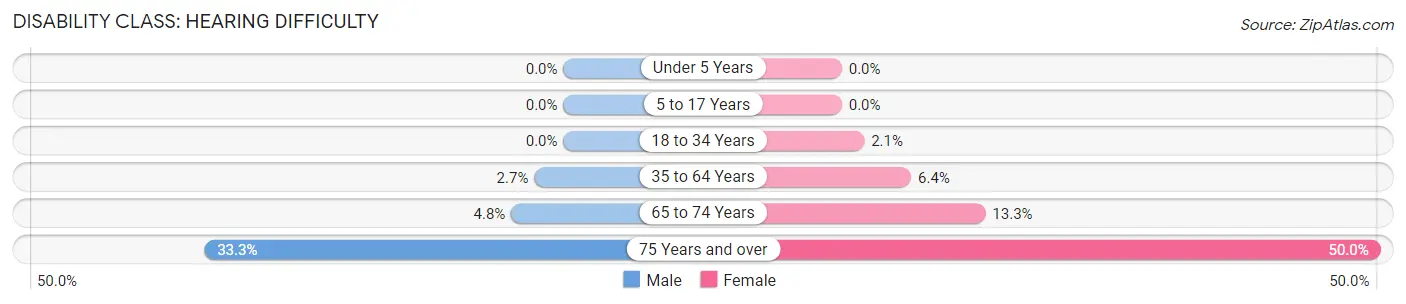
| Age Bracket | Male | Female |
| Under 5 Years | 0 (0.0%) | 0 (0.0%) |
| 5 to 17 Years | 0 (0.0%) | 0 (0.0%) |
| 18 to 34 Years | 0 (0.0%) | 3 (2.1%) |
| 35 to 64 Years | 5 (2.7%) | 11 (6.4%) |
| 65 to 74 Years | 3 (4.8%) | 4 (13.3%) |
| 75 Years and over | 12 (33.3%) | 24 (50.0%) |
Disability Class: Vision Difficulty
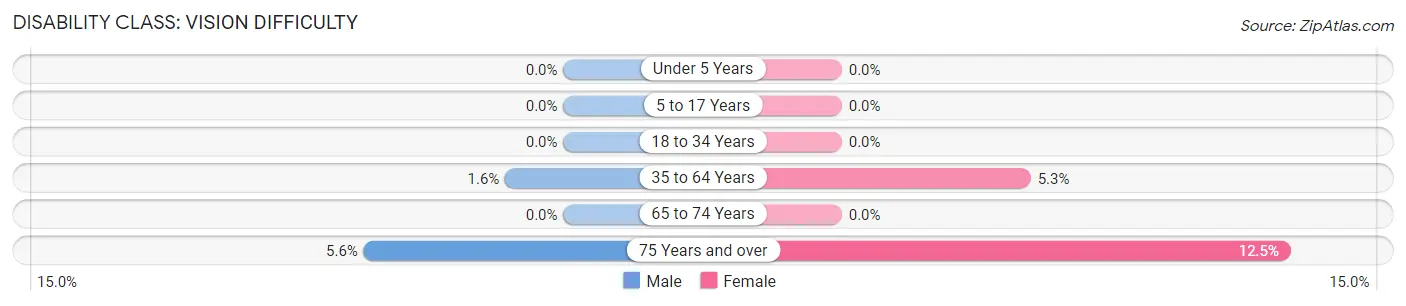
| Age Bracket | Male | Female |
| Under 5 Years | 0 (0.0%) | 0 (0.0%) |
| 5 to 17 Years | 0 (0.0%) | 0 (0.0%) |
| 18 to 34 Years | 0 (0.0%) | 0 (0.0%) |
| 35 to 64 Years | 3 (1.6%) | 9 (5.3%) |
| 65 to 74 Years | 0 (0.0%) | 0 (0.0%) |
| 75 Years and over | 2 (5.6%) | 6 (12.5%) |
Disability Class: Cognitive Difficulty
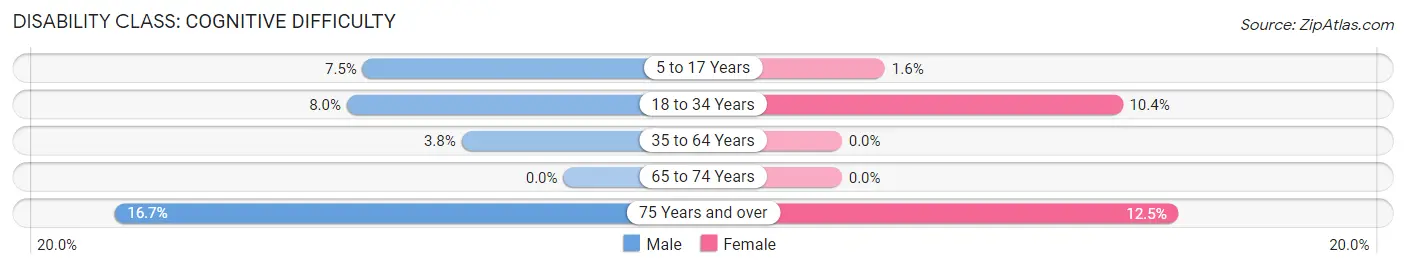
| Age Bracket | Male | Female |
| 5 to 17 Years | 7 (7.4%) | 3 (1.6%) |
| 18 to 34 Years | 9 (8.0%) | 15 (10.4%) |
| 35 to 64 Years | 7 (3.8%) | 0 (0.0%) |
| 65 to 74 Years | 0 (0.0%) | 0 (0.0%) |
| 75 Years and over | 6 (16.7%) | 6 (12.5%) |
Disability Class: Ambulatory Difficulty
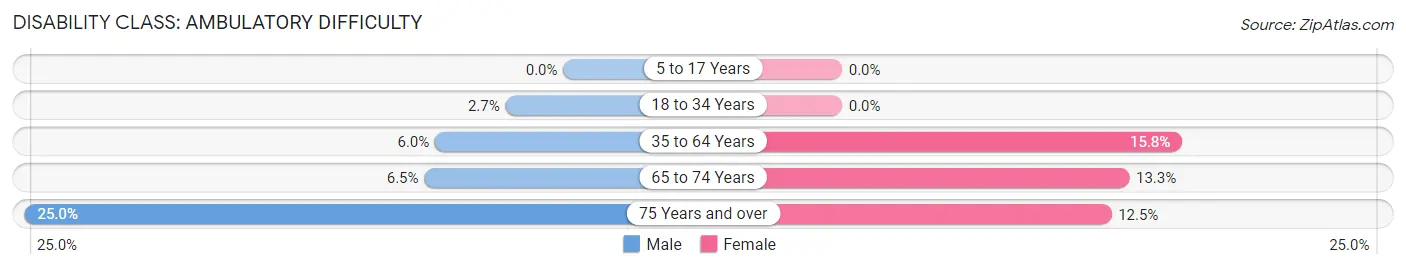
| Age Bracket | Male | Female |
| 5 to 17 Years | 0 (0.0%) | 0 (0.0%) |
| 18 to 34 Years | 3 (2.7%) | 0 (0.0%) |
| 35 to 64 Years | 11 (5.9%) | 27 (15.8%) |
| 65 to 74 Years | 4 (6.5%) | 4 (13.3%) |
| 75 Years and over | 9 (25.0%) | 6 (12.5%) |
Disability Class: Self-Care Difficulty
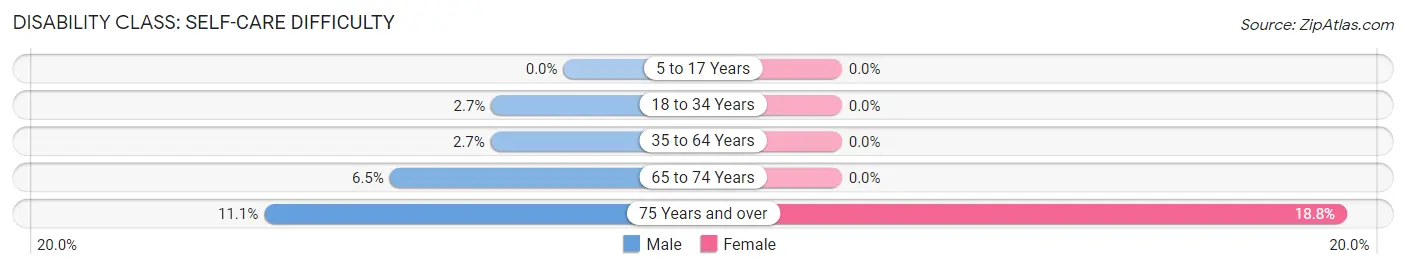
| Age Bracket | Male | Female |
| 5 to 17 Years | 0 (0.0%) | 0 (0.0%) |
| 18 to 34 Years | 3 (2.7%) | 0 (0.0%) |
| 35 to 64 Years | 5 (2.7%) | 0 (0.0%) |
| 65 to 74 Years | 4 (6.5%) | 0 (0.0%) |
| 75 Years and over | 4 (11.1%) | 9 (18.8%) |
Technology Access in Strum
Computing Device Access in Strum
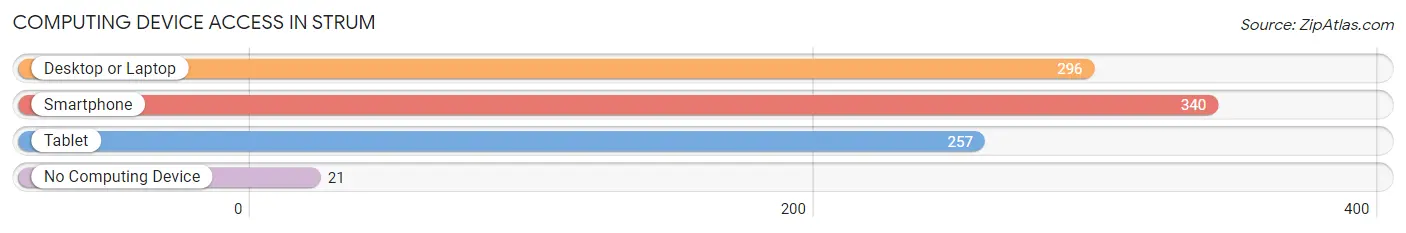
| Device Type | # Households | % Households |
| Desktop or Laptop | 296 | 72.4% |
| Smartphone | 340 | 83.1% |
| Tablet | 257 | 62.8% |
| No Computing Device | 21 | 5.1% |
| Total | 409 | 100.0% |
Internet Access in Strum
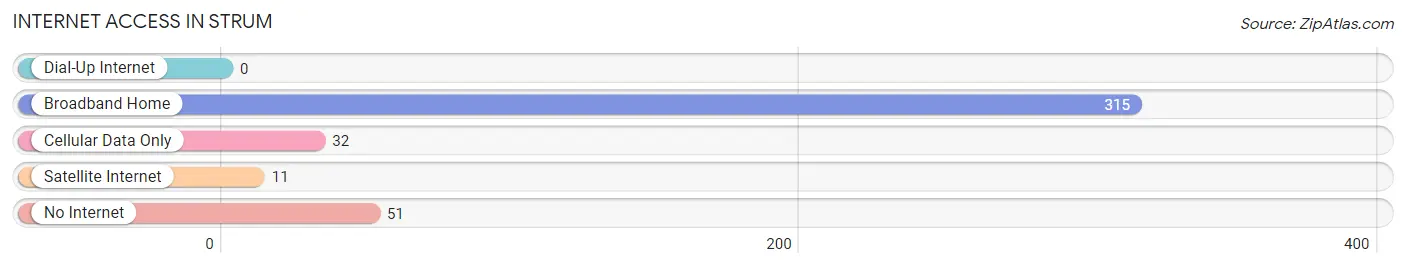
| Internet Type | # Households | % Households |
| Dial-Up Internet | 0 | 0.0% |
| Broadband Home | 315 | 77.0% |
| Cellular Data Only | 32 | 7.8% |
| Satellite Internet | 11 | 2.7% |
| No Internet | 51 | 12.5% |
| Total | 409 | 100.0% |
Strum Summary
Strum is a small village located in Trempealeau County, Wisconsin. It is situated on the banks of the Trempealeau River, about 25 miles south of Eau Claire. The village has a population of about 1,000 people and is part of the Eau Claire Metropolitan Statistical Area.
History
Strum was founded in 1856 by a group of settlers from Norway. The settlers were attracted to the area by the abundance of timber and the potential for farming. The village was named after the Norwegian word for “stream”, as the settlers were drawn to the area by the nearby river.
The village grew slowly over the years, and by the early 1900s, it had become a thriving community. The village was home to a variety of businesses, including a sawmill, a creamery, a cheese factory, and a general store.
In the early 1900s, the village was also home to a number of churches, including the Norwegian Lutheran Church, the Methodist Episcopal Church, and the Catholic Church.
Geography
Strum is located in the western part of Wisconsin, about 25 miles south of Eau Claire. The village is situated on the banks of the Trempealeau River, which flows through the village and provides a scenic backdrop.
The village is surrounded by rolling hills and farmland, and is located in the Driftless Area, an area of Wisconsin that was not glaciated during the last ice age. The area is known for its unique topography, which includes steep hills, deep valleys, and rugged terrain.
Economy
Strum’s economy is largely based on agriculture. The village is home to a number of dairy farms, as well as a number of other farms that produce a variety of crops, including corn, soybeans, and hay.
The village is also home to a number of small businesses, including a grocery store, a hardware store, and a few restaurants.
Demographics
As of the 2010 census, the population of Strum was 1,000 people. The racial makeup of the village was 97.2% White, 0.7% African American, 0.3% Native American, 0.2% Asian, and 1.6% from other races.
The median household income in Strum was $45,000, and the median family income was $50,000. The per capita income was $20,000.
Conclusion
Strum is a small village located in Trempealeau County, Wisconsin. It is situated on the banks of the Trempealeau River, about 25 miles south of Eau Claire. The village has a population of about 1,000 people and is part of the Eau Claire Metropolitan Statistical Area. The village’s economy is largely based on agriculture, and it is home to a number of small businesses. The racial makeup of the village is predominantly White, with a small percentage of African American, Native American, and Asian residents. The median household income in Strum is $45,000, and the median family income is $50,000.
Common Questions
What is Per Capita Income in Strum?
Per Capita income in Strum is $27,605.
What is the Median Family Income in Strum?
Median Family Income in Strum is $73,750.
What is the Median Household income in Strum?
Median Household Income in Strum is $64,911.
What is Income or Wage Gap in Strum?
Income or Wage Gap in Strum is 23.0%.
Women in Strum earn 77.0 cents for every dollar earned by a man.
What is Inequality or Gini Index in Strum?
Inequality or Gini Index in Strum is 0.36.
What is the Total Population of Strum?
Total Population of Strum is 1,194.
What is the Total Male Population of Strum?
Total Male Population of Strum is 558.
What is the Total Female Population of Strum?
Total Female Population of Strum is 636.
What is the Ratio of Males per 100 Females in Strum?
There are 87.74 Males per 100 Females in Strum.
What is the Ratio of Females per 100 Males in Strum?
There are 113.98 Females per 100 Males in Strum.
What is the Median Population Age in Strum?
Median Population Age in Strum is 33.7 Years.
What is the Average Family Size in Strum
Average Family Size in Strum is 3.3 People.
What is the Average Household Size in Strum
Average Household Size in Strum is 2.8 People.
How Large is the Labor Force in Strum?
There are 530 People in the Labor Forcein in Strum.
What is the Percentage of People in the Labor Force in Strum?
62.1% of People are in the Labor Force in Strum.
What is the Unemployment Rate in Strum?
Unemployment Rate in Strum is 1.9%.