Stockholm, WI Map & Demographics
Stockholm Map
Stockholm Overview
$62,962
PER CAPITA INCOME
$74,375
AVG FAMILY INCOME
$62,500
AVG HOUSEHOLD INCOME
0.38
INEQUALITY / GINI INDEX
91
TOTAL POPULATION
54
MALE POPULATION
37
FEMALE POPULATION
145.95
MALES / 100 FEMALES
68.52
FEMALES / 100 MALES
69.8
MEDIAN AGE
2.0
AVG FAMILY SIZE
1.7
AVG HOUSEHOLD SIZE
28
LABOR FORCE [ PEOPLE ]
30.8%
PERCENT IN LABOR FORCE
Stockholm Zip Codes
Income in Stockholm
Income Overview in Stockholm
Per Capita Income in Stockholm is $62,962, while median incomes of families and households are $74,375 and $62,500 respectively.
| Characteristic | Number | Measure |
| Per Capita Income | 91 | $62,962 |
| Median Family Income | 36 | $74,375 |
| Mean Family Income | 36 | $123,533 |
| Median Household Income | 54 | $62,500 |
| Mean Household Income | 54 | $101,617 |
| Income Deficit | 36 | $0 |
| Wage / Income Gap (%) | 91 | 0.00% |
| Wage / Income Gap ($) | 91 | 100.00¢ per $1 |
| Gini / Inequality Index | 91 | 0.38 |
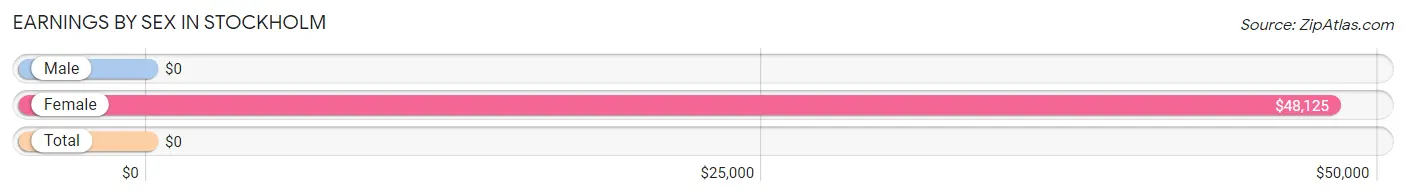
Earnings by Sex in Stockholm
| Sex | Number | Average Earnings |
| Male | 25 (64.1%) | $0 |
| Female | 14 (35.9%) | $48,125 |
| Total | 39 (100.0%) | $0 |
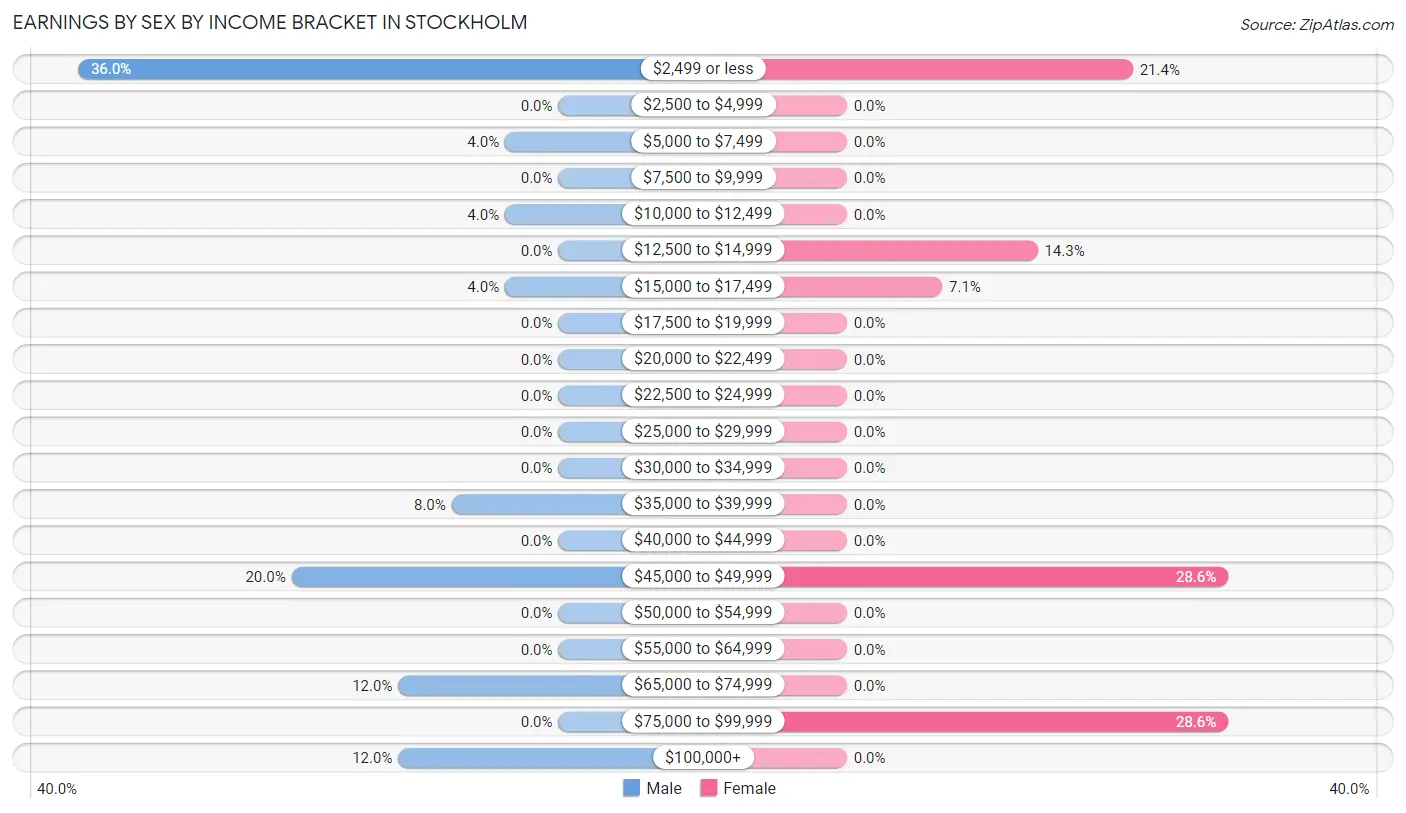
Earnings by Sex by Income Bracket in Stockholm
The most common earnings brackets in Stockholm are $2,499 or less for men (9 | 36.0%) and $45,000 to $49,999 for women (4 | 28.6%).
| Income | Male | Female |
| $2,499 or less | 9 (36.0%) | 3 (21.4%) |
| $2,500 to $4,999 | 0 (0.0%) | 0 (0.0%) |
| $5,000 to $7,499 | 1 (4.0%) | 0 (0.0%) |
| $7,500 to $9,999 | 0 (0.0%) | 0 (0.0%) |
| $10,000 to $12,499 | 1 (4.0%) | 0 (0.0%) |
| $12,500 to $14,999 | 0 (0.0%) | 2 (14.3%) |
| $15,000 to $17,499 | 1 (4.0%) | 1 (7.1%) |
| $17,500 to $19,999 | 0 (0.0%) | 0 (0.0%) |
| $20,000 to $22,499 | 0 (0.0%) | 0 (0.0%) |
| $22,500 to $24,999 | 0 (0.0%) | 0 (0.0%) |
| $25,000 to $29,999 | 0 (0.0%) | 0 (0.0%) |
| $30,000 to $34,999 | 0 (0.0%) | 0 (0.0%) |
| $35,000 to $39,999 | 2 (8.0%) | 0 (0.0%) |
| $40,000 to $44,999 | 0 (0.0%) | 0 (0.0%) |
| $45,000 to $49,999 | 5 (20.0%) | 4 (28.6%) |
| $50,000 to $54,999 | 0 (0.0%) | 0 (0.0%) |
| $55,000 to $64,999 | 0 (0.0%) | 0 (0.0%) |
| $65,000 to $74,999 | 3 (12.0%) | 0 (0.0%) |
| $75,000 to $99,999 | 0 (0.0%) | 4 (28.6%) |
| $100,000+ | 3 (12.0%) | 0 (0.0%) |
| Total | 25 (100.0%) | 14 (100.0%) |
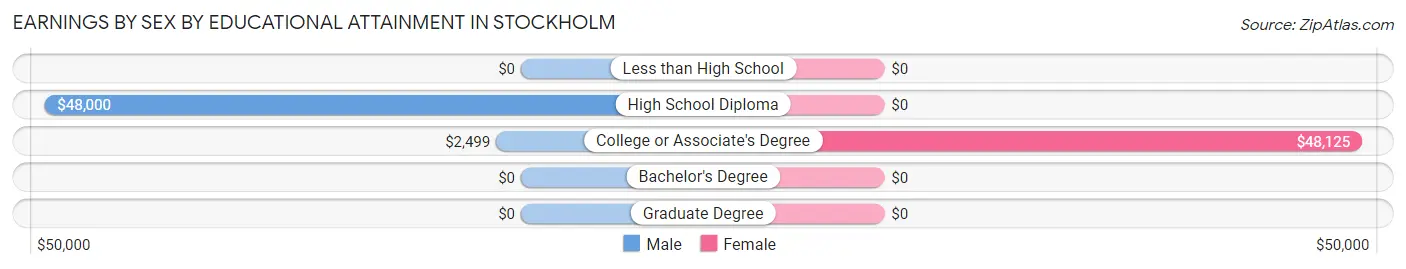
Earnings by Sex by Educational Attainment in Stockholm
| Educational Attainment | Male Income | Female Income |
| Less than High School | - | - |
| High School Diploma | $48,000 | $0 |
| College or Associate's Degree | $2,499 | $48,125 |
| Bachelor's Degree | - | - |
| Graduate Degree | - | - |
| Total | - | - |
Family Income in Stockholm
Family Income Brackets in Stockholm
According to the Stockholm family income data, there are 15 families falling into the $50,000 to $74,999 income range, which is the most common income bracket and makes up 41.7% of all families.
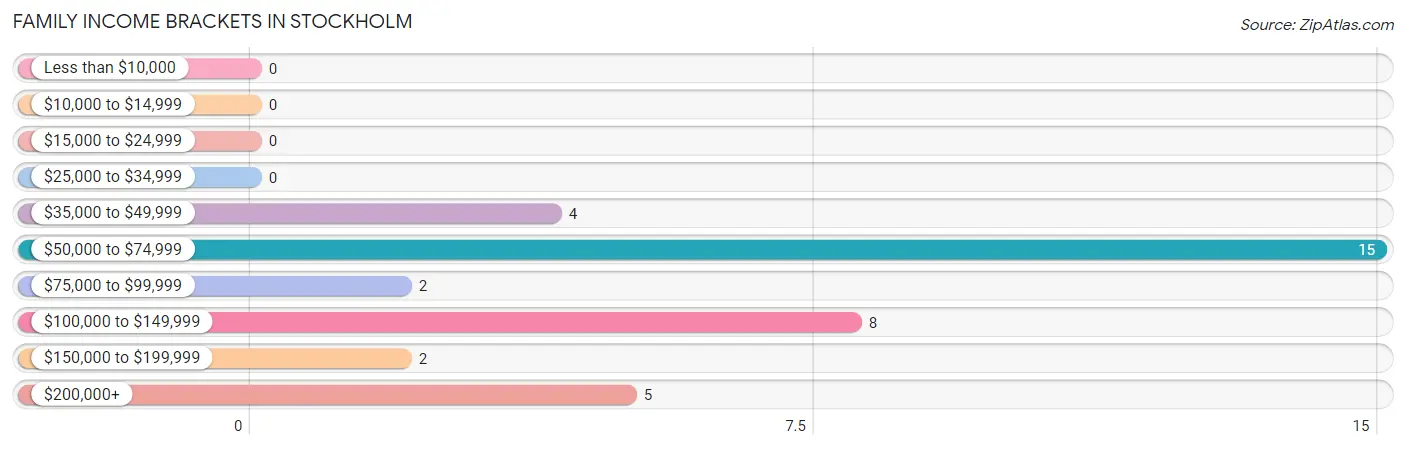
| Income Bracket | # Families | % Families |
| Less than $10,000 | 0 | 0.0% |
| $10,000 to $14,999 | 0 | 0.0% |
| $15,000 to $24,999 | 0 | 0.0% |
| $25,000 to $34,999 | 0 | 0.0% |
| $35,000 to $49,999 | 4 | 11.1% |
| $50,000 to $74,999 | 15 | 41.7% |
| $75,000 to $99,999 | 2 | 5.6% |
| $100,000 to $149,999 | 8 | 22.2% |
| $150,000 to $199,999 | 2 | 5.6% |
| $200,000+ | 5 | 13.9% |
Family Income by Famaliy Size in Stockholm
2-person families (32 | 88.9%) account for the highest median family income in Stockholm with $74,375 per family, while 2-person families (32 | 88.9%) have the highest median income of $37,188 per family member.
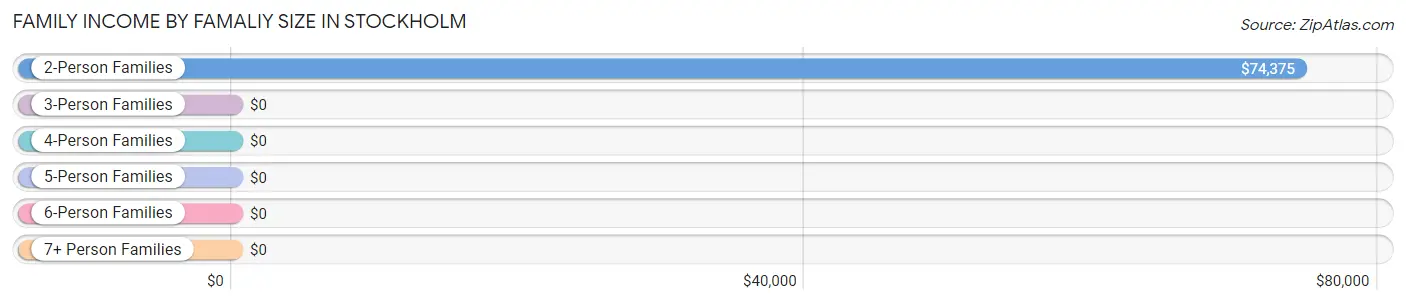
| Income Bracket | # Families | Median Income |
| 2-Person Families | 32 (88.9%) | $74,375 |
| 3-Person Families | 4 (11.1%) | $0 |
| 4-Person Families | 0 (0.0%) | $0 |
| 5-Person Families | 0 (0.0%) | $0 |
| 6-Person Families | 0 (0.0%) | $0 |
| 7+ Person Families | 0 (0.0%) | $0 |
| Total | 36 (100.0%) | $74,375 |
Family Income by Number of Earners in Stockholm
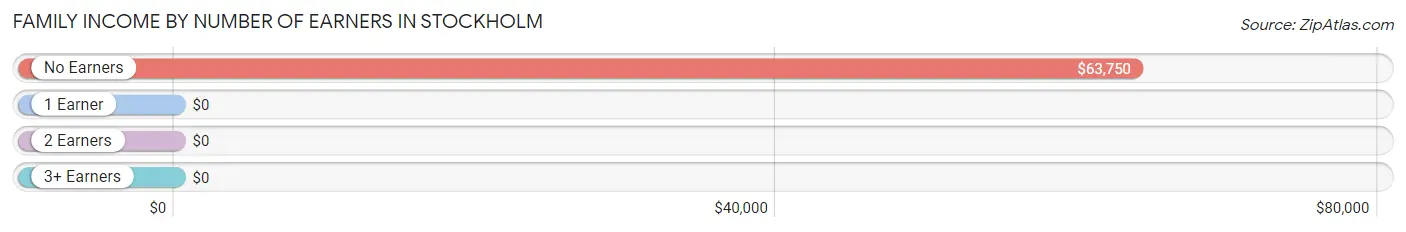
| Number of Earners | # Families | Median Income |
| No Earners | 10 (27.8%) | $63,750 |
| 1 Earner | 15 (41.7%) | $0 |
| 2 Earners | 7 (19.4%) | $0 |
| 3+ Earners | 4 (11.1%) | $0 |
| Total | 36 (100.0%) | $74,375 |
Household Income in Stockholm
Household Income Brackets in Stockholm
With 30 households falling in the category, the $50,000 to $74,999 income range is the most frequent in Stockholm, accounting for 55.6% of all households.
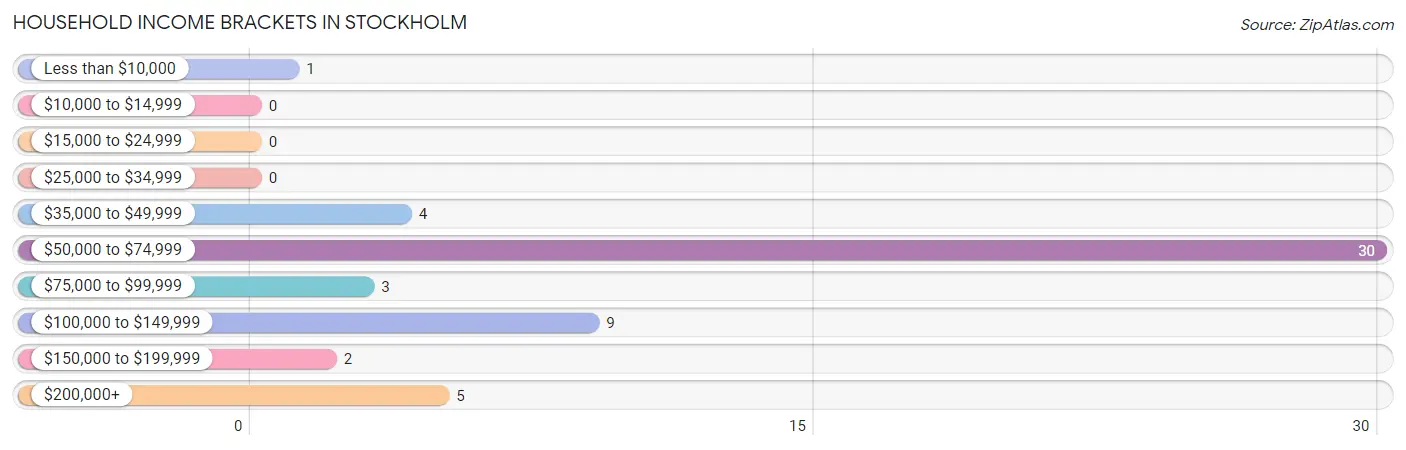
| Income Bracket | # Households | % Households |
| Less than $10,000 | 1 | 1.9% |
| $10,000 to $14,999 | 0 | 0.0% |
| $15,000 to $24,999 | 0 | 0.0% |
| $25,000 to $34,999 | 0 | 0.0% |
| $35,000 to $49,999 | 4 | 7.4% |
| $50,000 to $74,999 | 30 | 55.6% |
| $75,000 to $99,999 | 3 | 5.6% |
| $100,000 to $149,999 | 9 | 16.7% |
| $150,000 to $199,999 | 2 | 3.7% |
| $200,000+ | 5 | 9.3% |
Household Income by Householder Age in Stockholm
The median household income in Stockholm is $62,500, with the highest median household income of $128,000 found in the 45 to 64 years age bracket for the primary householder. A total of 12 households (22.2%) fall into this category.
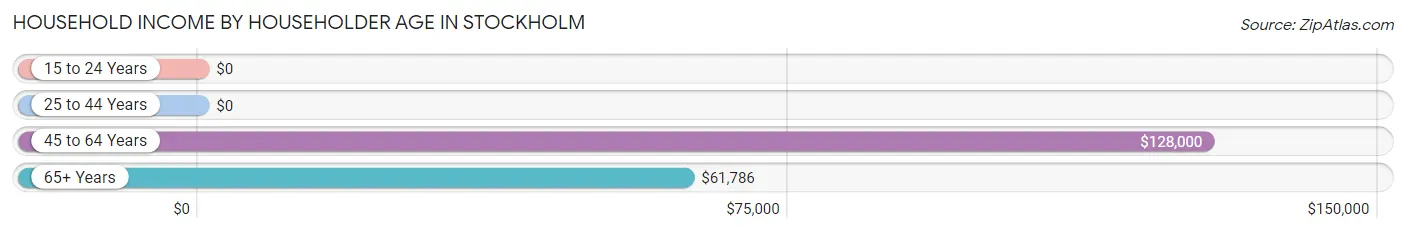
| Income Bracket | # Households | Median Income |
| 15 to 24 Years | 0 (0.0%) | $0 |
| 25 to 44 Years | 0 (0.0%) | $0 |
| 45 to 64 Years | 12 (22.2%) | $128,000 |
| 65+ Years | 42 (77.8%) | $61,786 |
| Total | 54 (100.0%) | $62,500 |
Poverty in Stockholm
Income Below Poverty by Sex and Age in Stockholm
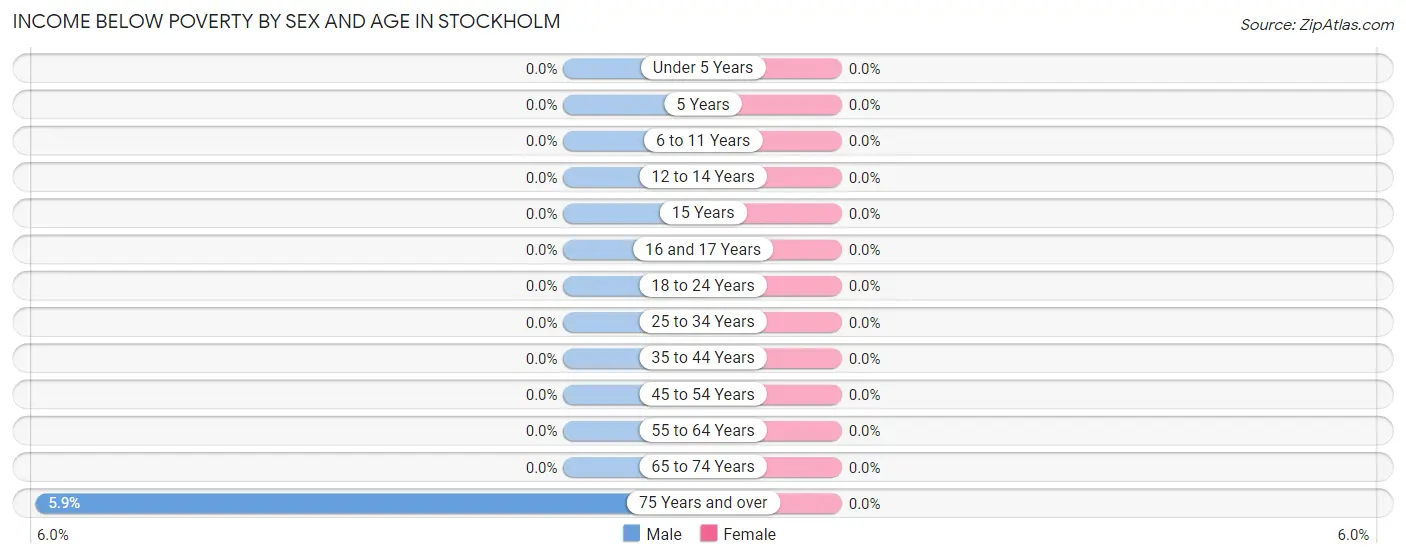
| Age Bracket | Male | Female |
| Under 5 Years | 0 (0.0%) | 0 (0.0%) |
| 5 Years | 0 (0.0%) | 0 (0.0%) |
| 6 to 11 Years | 0 (0.0%) | 0 (0.0%) |
| 12 to 14 Years | 0 (0.0%) | 0 (0.0%) |
| 15 Years | 0 (0.0%) | 0 (0.0%) |
| 16 and 17 Years | 0 (0.0%) | 0 (0.0%) |
| 18 to 24 Years | 0 (0.0%) | 0 (0.0%) |
| 25 to 34 Years | 0 (0.0%) | 0 (0.0%) |
| 35 to 44 Years | 0 (0.0%) | 0 (0.0%) |
| 45 to 54 Years | 0 (0.0%) | 0 (0.0%) |
| 55 to 64 Years | 0 (0.0%) | 0 (0.0%) |
| 65 to 74 Years | 0 (0.0%) | 0 (0.0%) |
| 75 Years and over | 1 (5.9%) | 0 (0.0%) |
| Total | 1 (1.8%) | 0 (0.0%) |
Income Above Poverty by Sex and Age in Stockholm
According to the poverty statistics in Stockholm, males aged 25 to 34 years and females aged 35 to 44 years are the age groups that are most secure financially, with 100.0% of males and 100.0% of females in these age groups living above the poverty line.
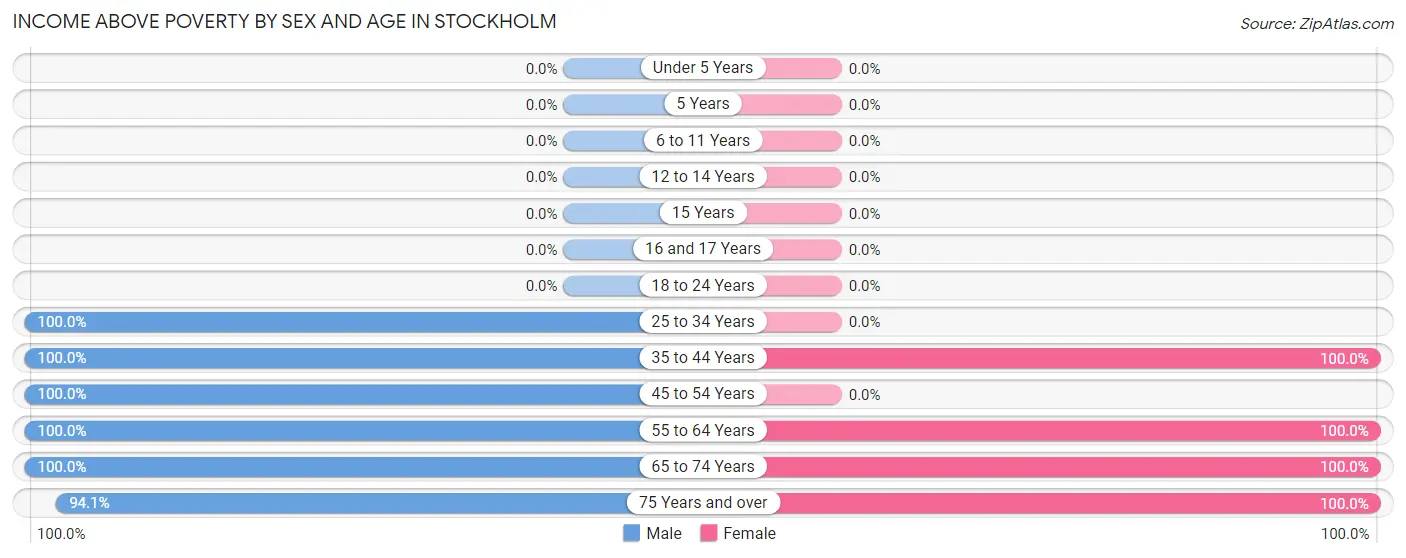
| Age Bracket | Male | Female |
| Under 5 Years | 0 (0.0%) | 0 (0.0%) |
| 5 Years | 0 (0.0%) | 0 (0.0%) |
| 6 to 11 Years | 0 (0.0%) | 0 (0.0%) |
| 12 to 14 Years | 0 (0.0%) | 0 (0.0%) |
| 15 Years | 0 (0.0%) | 0 (0.0%) |
| 16 and 17 Years | 0 (0.0%) | 0 (0.0%) |
| 18 to 24 Years | 0 (0.0%) | 0 (0.0%) |
| 25 to 34 Years | 1 (100.0%) | 0 (0.0%) |
| 35 to 44 Years | 2 (100.0%) | 4 (100.0%) |
| 45 to 54 Years | 5 (100.0%) | 0 (0.0%) |
| 55 to 64 Years | 1 (100.0%) | 16 (100.0%) |
| 65 to 74 Years | 28 (100.0%) | 13 (100.0%) |
| 75 Years and over | 16 (94.1%) | 4 (100.0%) |
| Total | 53 (98.2%) | 37 (100.0%) |
Income Below Poverty Among Married-Couple Families in Stockholm
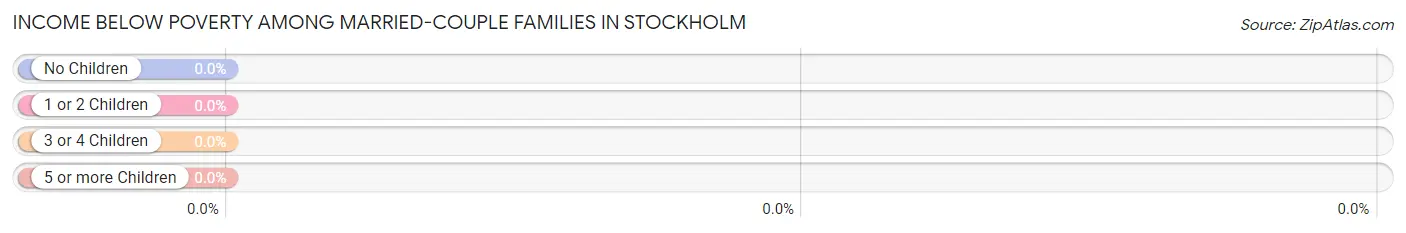
| Children | Above Poverty | Below Poverty |
| No Children | 36 (100.0%) | 0 (0.0%) |
| 1 or 2 Children | 0 (0.0%) | 0 (0.0%) |
| 3 or 4 Children | 0 (0.0%) | 0 (0.0%) |
| 5 or more Children | 0 (0.0%) | 0 (0.0%) |
| Total | 36 (100.0%) | 0 (0.0%) |
Income Below Poverty Among Single-Parent Households in Stockholm
| Children | Single Father | Single Mother |
| No Children | 0 (0.0%) | 0 (0.0%) |
| 1 or 2 Children | 0 (0.0%) | 0 (0.0%) |
| 3 or 4 Children | 0 (0.0%) | 0 (0.0%) |
| 5 or more Children | 0 (0.0%) | 0 (0.0%) |
| Total | 0 (0.0%) | 0 (0.0%) |
Income Below Poverty Among Married-Couple vs Single-Parent Households in Stockholm
| Children | Married-Couple Families | Single-Parent Households |
| No Children | 0 (0.0%) | 0 (0.0%) |
| 1 or 2 Children | 0 (0.0%) | 0 (0.0%) |
| 3 or 4 Children | 0 (0.0%) | 0 (0.0%) |
| 5 or more Children | 0 (0.0%) | 0 (0.0%) |
| Total | 0 (0.0%) | 0 (0.0%) |
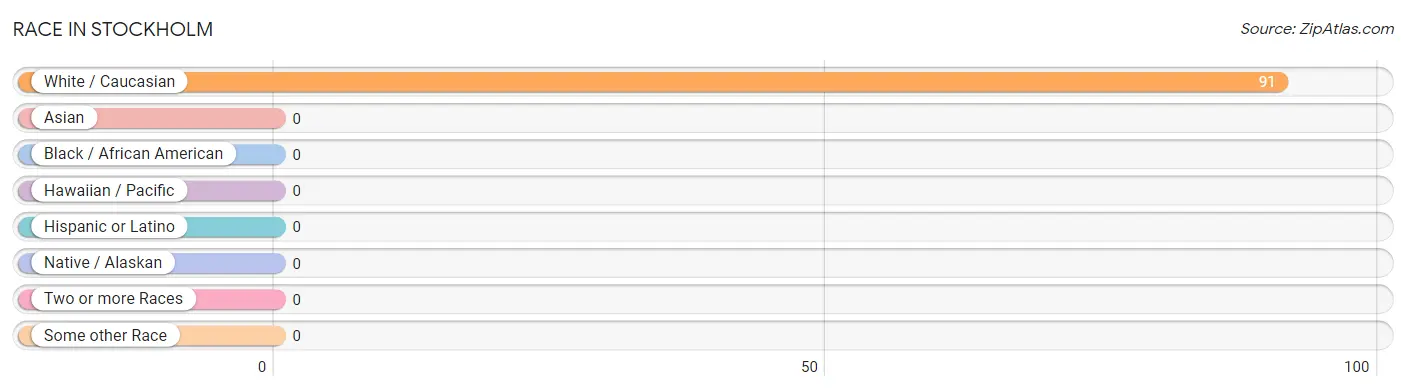
Race in Stockholm
The most populous races in Stockholm are , and White / Caucasian (91 | 100.0%).
| Race | # Population | % Population |
| Asian | 0 | 0.0% |
| Black / African American | 0 | 0.0% |
| Hawaiian / Pacific | 0 | 0.0% |
| Hispanic or Latino | 0 | 0.0% |
| Native / Alaskan | 0 | 0.0% |
| White / Caucasian | 91 | 100.0% |
| Two or more Races | 0 | 0.0% |
| Some other Race | 0 | 0.0% |
| Total | 91 | 100.0% |
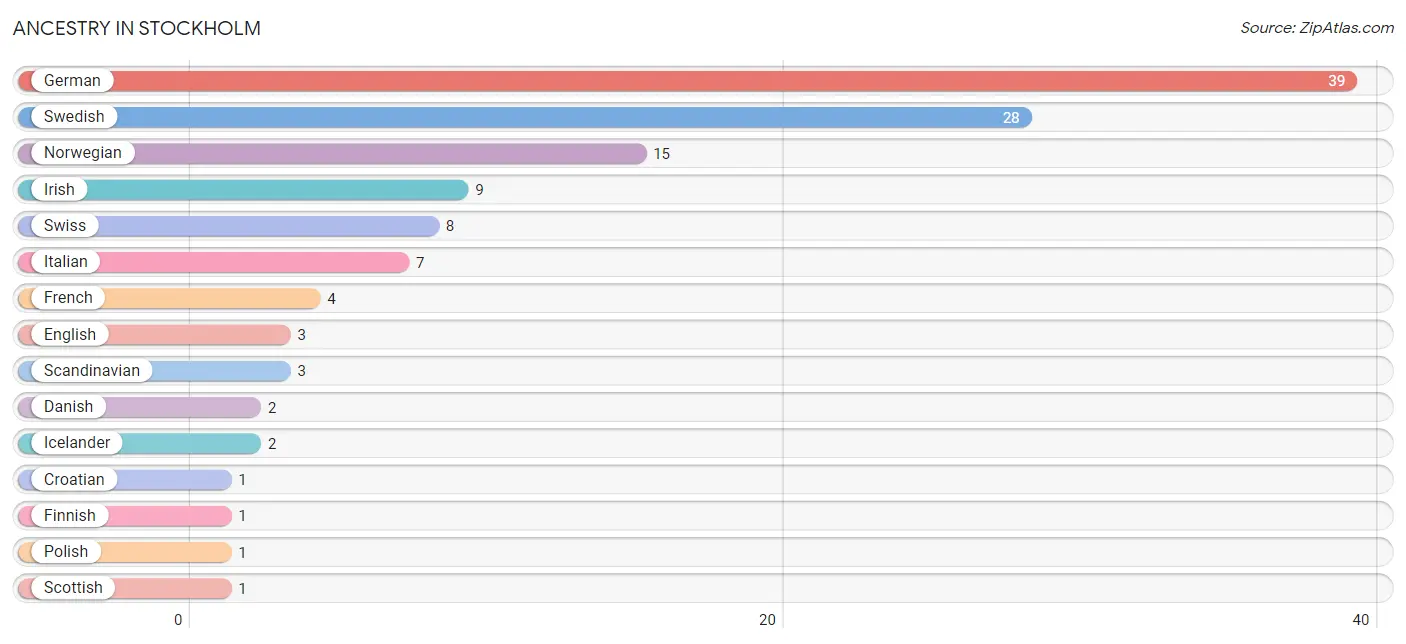
Ancestry in Stockholm
The most populous ancestries reported in Stockholm are German (39 | 42.9%), Swedish (28 | 30.8%), Norwegian (15 | 16.5%), Irish (9 | 9.9%), and Swiss (8 | 8.8%), together accounting for 108.8% of all Stockholm residents.
| Ancestry | # Population | % Population |
| Croatian | 1 | 1.1% |
| Danish | 2 | 2.2% |
| English | 3 | 3.3% |
| Finnish | 1 | 1.1% |
| French | 4 | 4.4% |
| German | 39 | 42.9% |
| Icelander | 2 | 2.2% |
| Irish | 9 | 9.9% |
| Italian | 7 | 7.7% |
| Norwegian | 15 | 16.5% |
| Polish | 1 | 1.1% |
| Scandinavian | 3 | 3.3% |
| Scottish | 1 | 1.1% |
| Swedish | 28 | 30.8% |
| Swiss | 8 | 8.8% | View All 15 Rows |
Immigrants in Stockholm

| Immigration Origin | # Population | % Population | View All 0 Rows |
Sex and Age in Stockholm
Sex and Age in Stockholm
The most populous age groups in Stockholm are 70 to 74 Years (15 | 27.8%) for men and 60 to 64 Years (15 | 40.5%) for women.
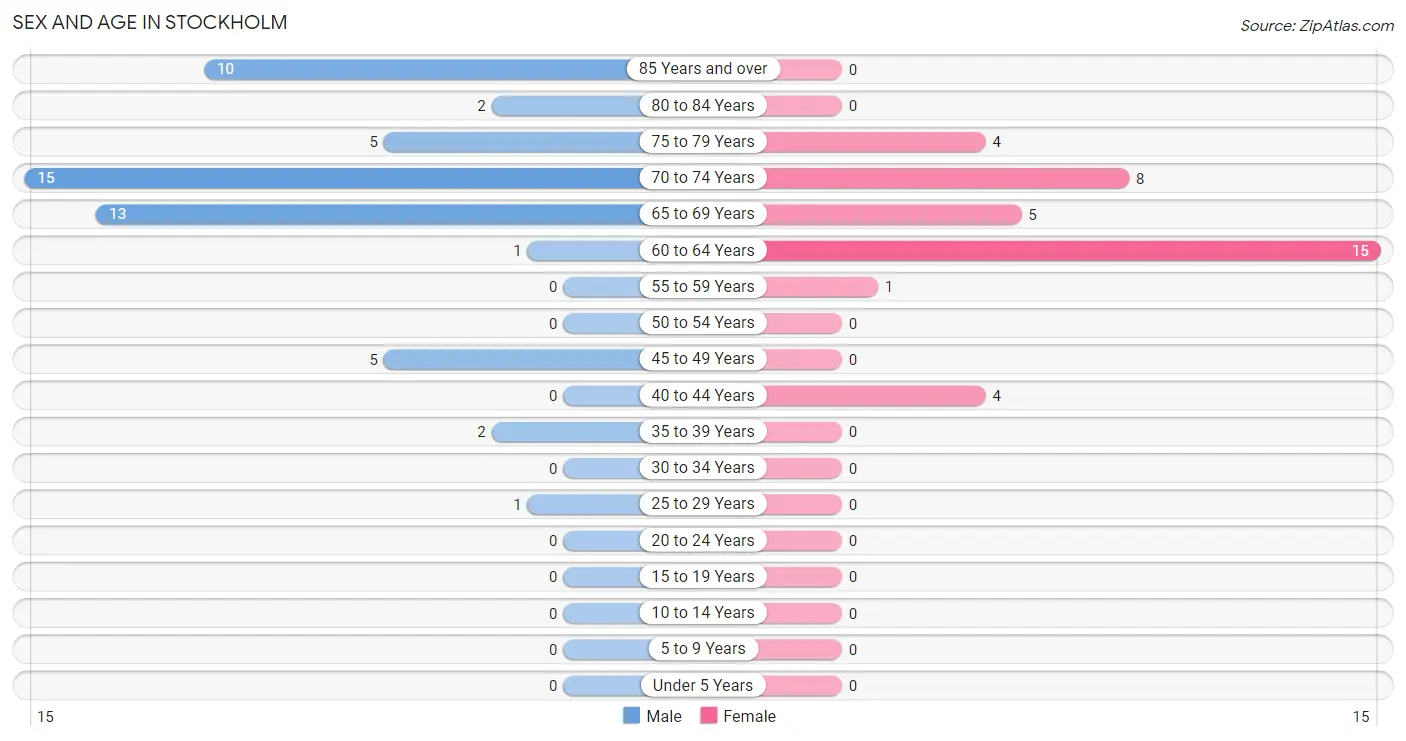
| Age Bracket | Male | Female |
| Under 5 Years | 0 (0.0%) | 0 (0.0%) |
| 5 to 9 Years | 0 (0.0%) | 0 (0.0%) |
| 10 to 14 Years | 0 (0.0%) | 0 (0.0%) |
| 15 to 19 Years | 0 (0.0%) | 0 (0.0%) |
| 20 to 24 Years | 0 (0.0%) | 0 (0.0%) |
| 25 to 29 Years | 1 (1.8%) | 0 (0.0%) |
| 30 to 34 Years | 0 (0.0%) | 0 (0.0%) |
| 35 to 39 Years | 2 (3.7%) | 0 (0.0%) |
| 40 to 44 Years | 0 (0.0%) | 4 (10.8%) |
| 45 to 49 Years | 5 (9.3%) | 0 (0.0%) |
| 50 to 54 Years | 0 (0.0%) | 0 (0.0%) |
| 55 to 59 Years | 0 (0.0%) | 1 (2.7%) |
| 60 to 64 Years | 1 (1.8%) | 15 (40.5%) |
| 65 to 69 Years | 13 (24.1%) | 5 (13.5%) |
| 70 to 74 Years | 15 (27.8%) | 8 (21.6%) |
| 75 to 79 Years | 5 (9.3%) | 4 (10.8%) |
| 80 to 84 Years | 2 (3.7%) | 0 (0.0%) |
| 85 Years and over | 10 (18.5%) | 0 (0.0%) |
| Total | 54 (100.0%) | 37 (100.0%) |
Families and Households in Stockholm
Median Family Size in Stockholm
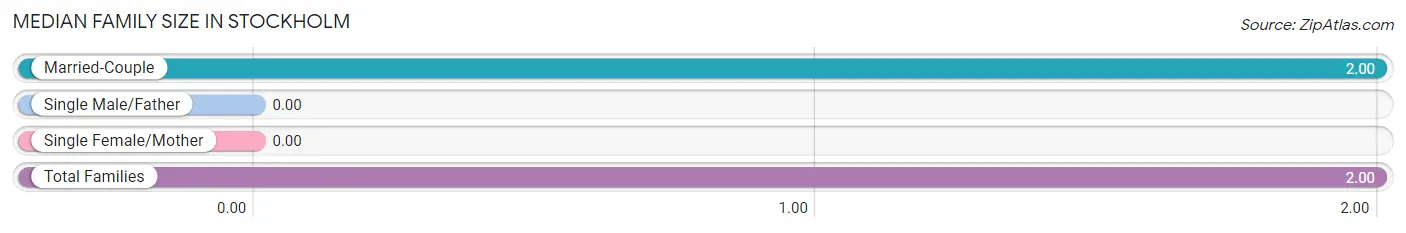
| Family Type | # Families | Family Size |
| Married-Couple | 36 (100.0%) | 2.00 |
| Single Male/Father | 0 (0.0%) | - |
| Single Female/Mother | 0 (0.0%) | - |
| Total Families | 36 (100.0%) | 2.00 |
Median Household Size in Stockholm
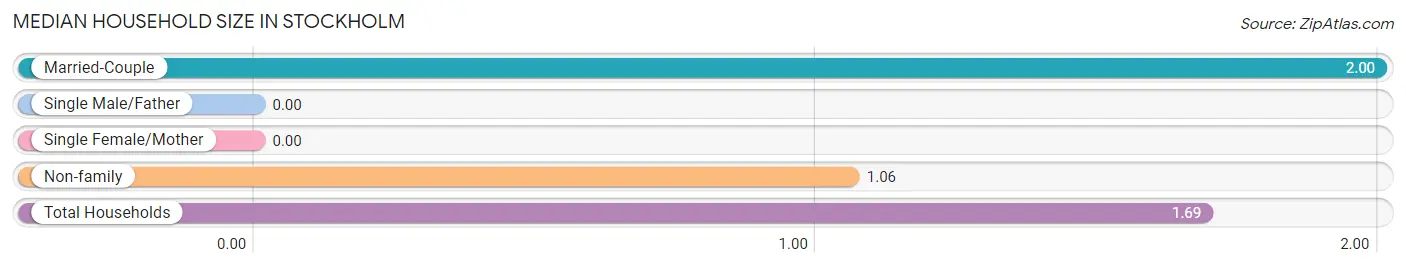
| Household Type | # Households | Household Size |
| Married-Couple | 36 (66.7%) | 2.00 |
| Single Male/Father | 0 (0.0%) | - |
| Single Female/Mother | 0 (0.0%) | - |
| Non-family | 18 (33.3%) | 1.06 |
| Total Households | 54 (100.0%) | 1.69 |
Household Size by Marriage Status in Stockholm
Out of a total of 54 households in Stockholm, 36 (66.7%) are family households, while 18 (33.3%) are nonfamily households. The most numerous type of family households are 2-person households, comprising 32, and the most common type of nonfamily households are 1-person households, comprising 17.
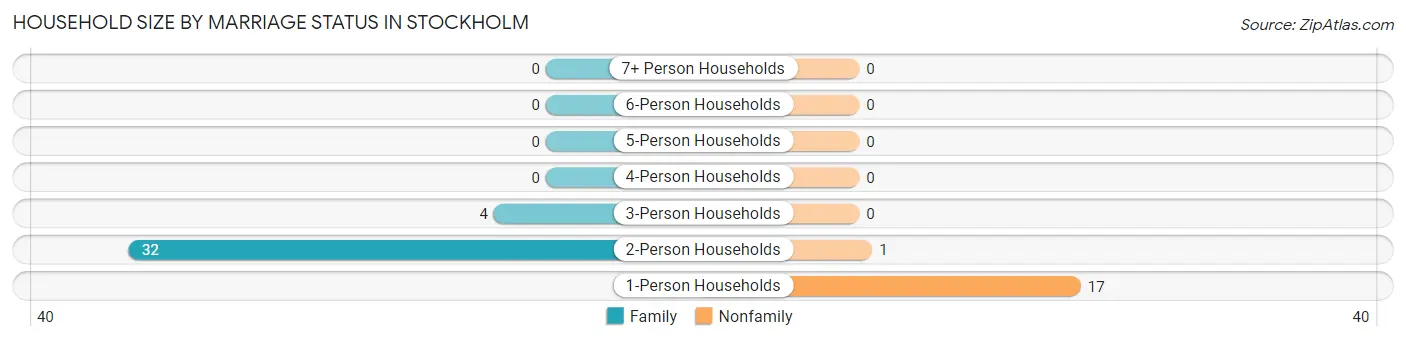
| Household Size | Family Households | Nonfamily Households |
| 1-Person Households | - | 17 (31.5%) |
| 2-Person Households | 32 (59.3%) | 1 (1.8%) |
| 3-Person Households | 4 (7.4%) | 0 (0.0%) |
| 4-Person Households | 0 (0.0%) | 0 (0.0%) |
| 5-Person Households | 0 (0.0%) | 0 (0.0%) |
| 6-Person Households | 0 (0.0%) | 0 (0.0%) |
| 7+ Person Households | 0 (0.0%) | 0 (0.0%) |
| Total | 36 (66.7%) | 18 (33.3%) |
Female Fertility in Stockholm
Fertility by Age in Stockholm
| Age Bracket | Women with Births | Births / 1,000 Women |
| 15 to 19 years | 0 (0.0%) | 0.0 |
| 20 to 34 years | 0 (0.0%) | 0.0 |
| 35 to 50 years | 0 (0.0%) | 0.0 |
| Total | 0 (0.0%) | 0.0 |
Fertility by Age by Marriage Status in Stockholm
| Age Bracket | Married | Unmarried |
| 15 to 19 years | 0 (0.0%) | 0 (0.0%) |
| 20 to 34 years | 0 (0.0%) | 0 (0.0%) |
| 35 to 50 years | 0 (0.0%) | 0 (0.0%) |
| Total | 0 (0.0%) | 0 (0.0%) |
Fertility by Education in Stockholm
| Educational Attainment | Women with Births | Births / 1,000 Women |
| Less than High School | 0 (0.0%) | 0.0 |
| High School Diploma | 0 (0.0%) | 0.0 |
| College or Associate's Degree | 0 (0.0%) | 0.0 |
| Bachelor's Degree | 0 (0.0%) | 0.0 |
| Graduate Degree | 0 (0.0%) | 0.0 |
| Total | 0 (0.0%) | 0.0 |
Fertility by Education by Marriage Status in Stockholm
| Educational Attainment | Married | Unmarried |
| Less than High School | 0 (0.0%) | 0 (0.0%) |
| High School Diploma | 0 (0.0%) | 0 (0.0%) |
| College or Associate's Degree | 0 (0.0%) | 0 (0.0%) |
| Bachelor's Degree | 0 (0.0%) | 0 (0.0%) |
| Graduate Degree | 0 (0.0%) | 0 (0.0%) |
| Total | 0 (0.0%) | 0 (0.0%) |
Employment Characteristics in Stockholm
Employment by Class of Employer in Stockholm
Among the 28 employed individuals in Stockholm, self-employed (not incorporated) (10 | 35.7%), private company employees (9 | 32.1%), and state government employees (6 | 21.4%) make up the most common classes of employment.
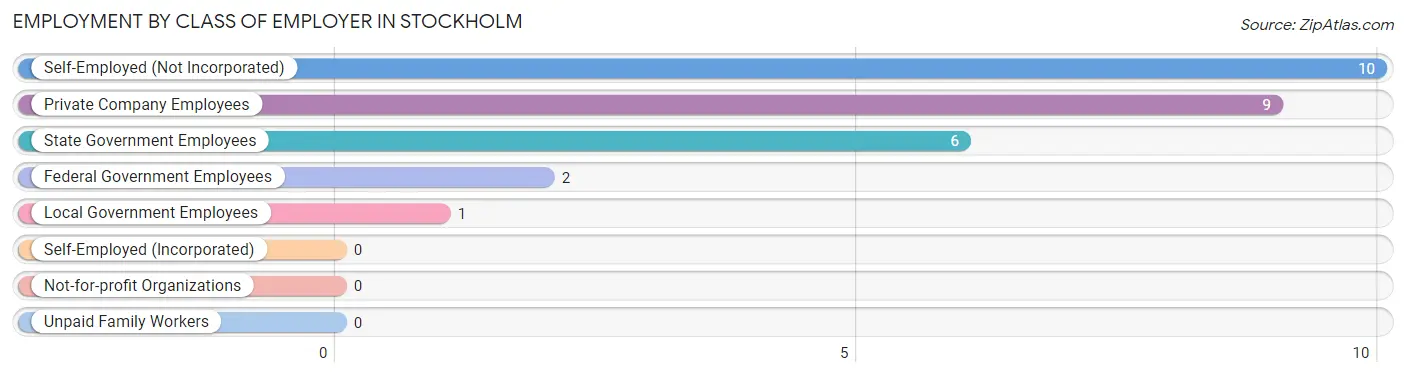
| Employer Class | # Employees | % Employees |
| Private Company Employees | 9 | 32.1% |
| Self-Employed (Incorporated) | 0 | 0.0% |
| Self-Employed (Not Incorporated) | 10 | 35.7% |
| Not-for-profit Organizations | 0 | 0.0% |
| Local Government Employees | 1 | 3.6% |
| State Government Employees | 6 | 21.4% |
| Federal Government Employees | 2 | 7.1% |
| Unpaid Family Workers | 0 | 0.0% |
| Total | 28 | 100.0% |
Employment Status by Age in Stockholm
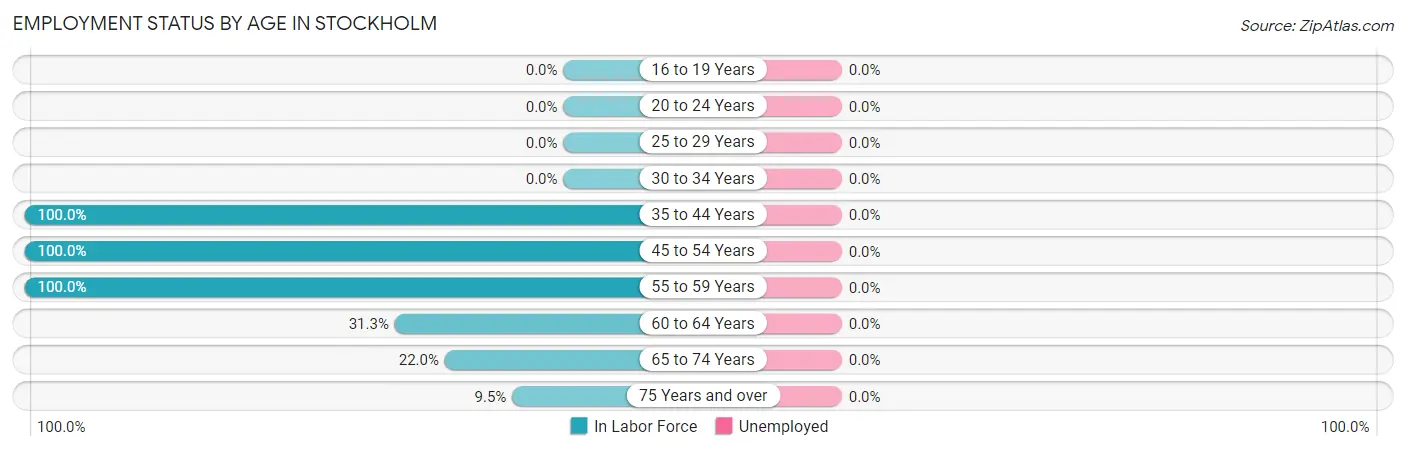
| Age Bracket | In Labor Force | Unemployed |
| 16 to 19 Years | 0 (0.0%) | 0 (0.0%) |
| 20 to 24 Years | 0 (0.0%) | 0 (0.0%) |
| 25 to 29 Years | 0 (0.0%) | 0 (0.0%) |
| 30 to 34 Years | 0 (0.0%) | 0 (0.0%) |
| 35 to 44 Years | 6 (100.0%) | 0 (0.0%) |
| 45 to 54 Years | 5 (100.0%) | 0 (0.0%) |
| 55 to 59 Years | 1 (100.0%) | 0 (0.0%) |
| 60 to 64 Years | 5 (31.3%) | 0 (0.0%) |
| 65 to 74 Years | 9 (22.0%) | 0 (0.0%) |
| 75 Years and over | 2 (9.5%) | 0 (0.0%) |
| Total | 28 (30.8%) | 0 (0.0%) |
Employment Status by Educational Attainment in Stockholm
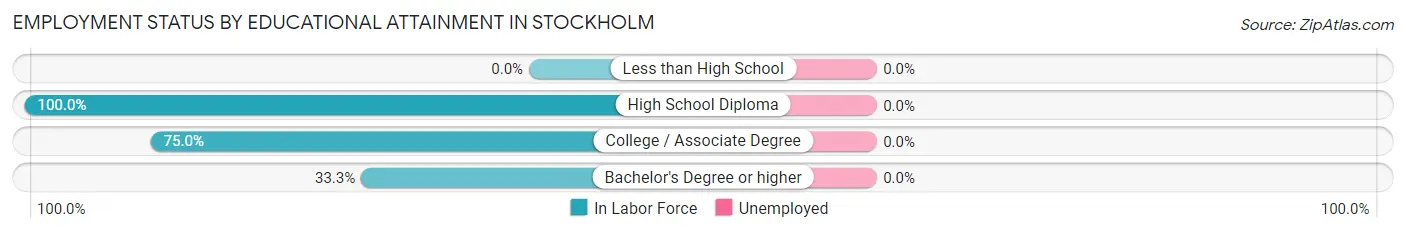
| Educational Attainment | In Labor Force | Unemployed |
| Less than High School | 0 (0.0%) | 0 (0.0%) |
| High School Diploma | 6 (100.0%) | 0 (0.0%) |
| College / Associate Degree | 6 (75.0%) | 0 (0.0%) |
| Bachelor's Degree or higher | 5 (33.3%) | 0 (0.0%) |
| Total | 17 (58.6%) | 0 (0.0%) |
Employment Occupations by Sex in Stockholm
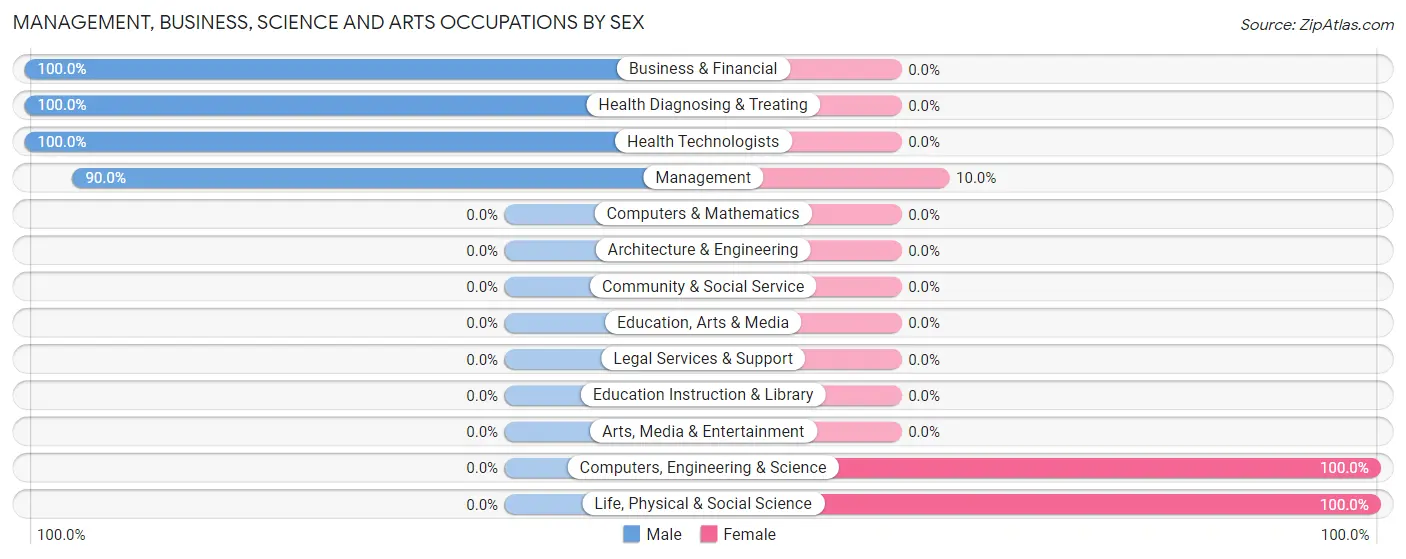
Management, Business, Science and Arts Occupations
The most common Management, Business, Science and Arts occupations in Stockholm are Management (10 | 35.7%), Computers, Engineering & Science (2 | 7.1%), Life, Physical & Social Science (2 | 7.1%), Business & Financial (1 | 3.6%), and Health Diagnosing & Treating (1 | 3.6%).
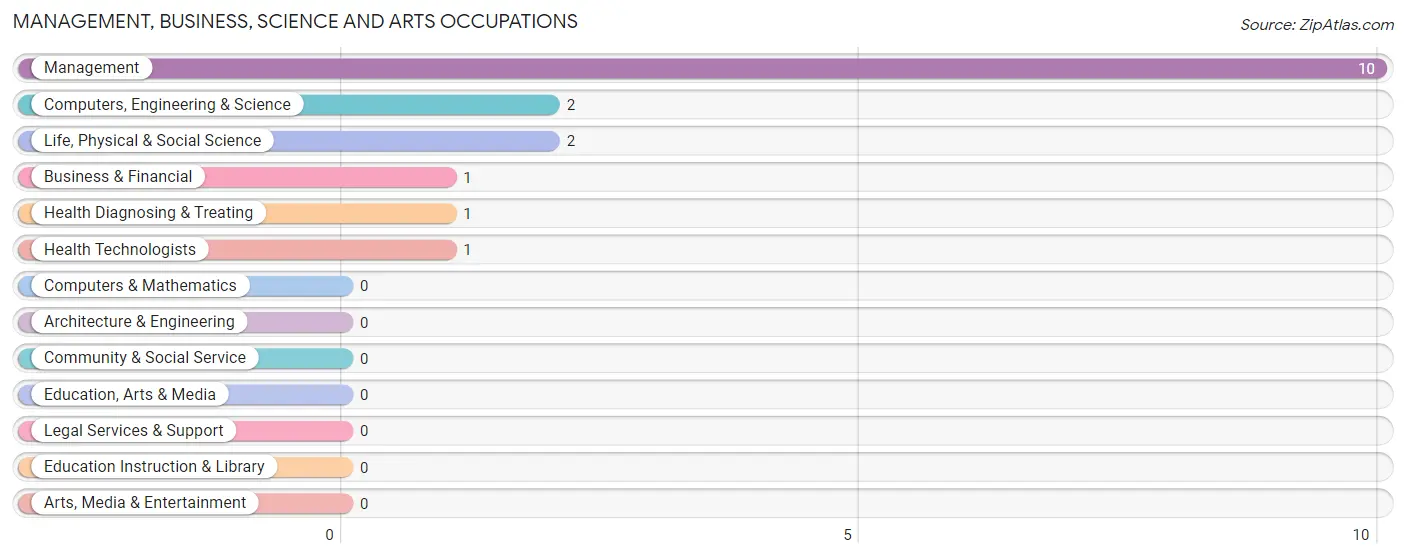
Management, Business, Science and Arts Occupations by Sex
Within the Management, Business, Science and Arts occupations in Stockholm, the most male-oriented occupations are Business & Financial (100.0%), Health Diagnosing & Treating (100.0%), and Health Technologists (100.0%), while the most female-oriented occupations are Computers, Engineering & Science (100.0%), Life, Physical & Social Science (100.0%), and Management (10.0%).
| Occupation | Male | Female |
| Management | 9 (90.0%) | 1 (10.0%) |
| Business & Financial | 1 (100.0%) | 0 (0.0%) |
| Computers, Engineering & Science | 0 (0.0%) | 2 (100.0%) |
| Computers & Mathematics | 0 (0.0%) | 0 (0.0%) |
| Architecture & Engineering | 0 (0.0%) | 0 (0.0%) |
| Life, Physical & Social Science | 0 (0.0%) | 2 (100.0%) |
| Community & Social Service | 0 (0.0%) | 0 (0.0%) |
| Education, Arts & Media | 0 (0.0%) | 0 (0.0%) |
| Legal Services & Support | 0 (0.0%) | 0 (0.0%) |
| Education Instruction & Library | 0 (0.0%) | 0 (0.0%) |
| Arts, Media & Entertainment | 0 (0.0%) | 0 (0.0%) |
| Health Diagnosing & Treating | 1 (100.0%) | 0 (0.0%) |
| Health Technologists | 1 (100.0%) | 0 (0.0%) |
| Total (Category) | 11 (78.6%) | 3 (21.4%) |
| Total (Overall) | 17 (60.7%) | 11 (39.3%) |
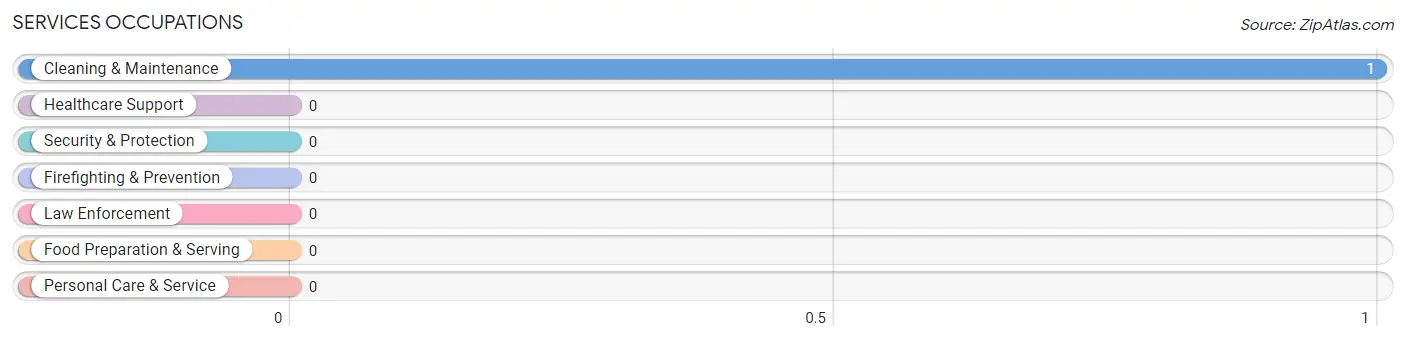
Services Occupations
The most common Services occupations in Stockholm are , and Cleaning & Maintenance (1 | 3.6%).
Services Occupations by Sex
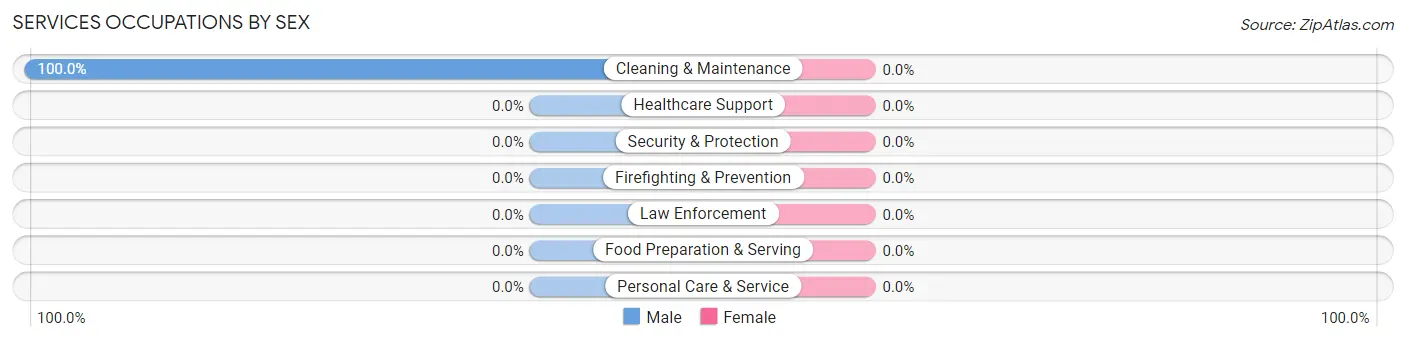
| Occupation | Male | Female |
| Healthcare Support | 0 (0.0%) | 0 (0.0%) |
| Security & Protection | 0 (0.0%) | 0 (0.0%) |
| Firefighting & Prevention | 0 (0.0%) | 0 (0.0%) |
| Law Enforcement | 0 (0.0%) | 0 (0.0%) |
| Food Preparation & Serving | 0 (0.0%) | 0 (0.0%) |
| Cleaning & Maintenance | 1 (100.0%) | 0 (0.0%) |
| Personal Care & Service | 0 (0.0%) | 0 (0.0%) |
| Total (Category) | 1 (100.0%) | 0 (0.0%) |
| Total (Overall) | 17 (60.7%) | 11 (39.3%) |
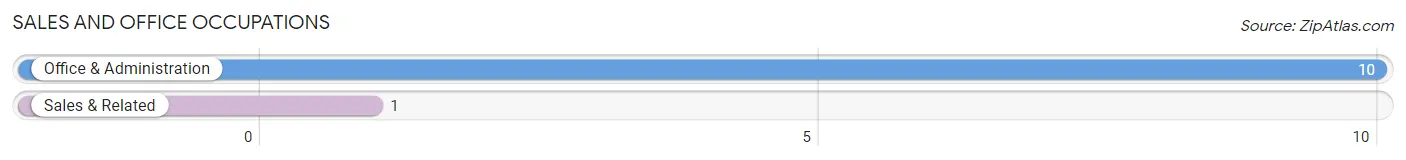
Sales and Office Occupations
The most common Sales and Office occupations in Stockholm are Office & Administration (10 | 35.7%), and Sales & Related (1 | 3.6%).
Sales and Office Occupations by Sex
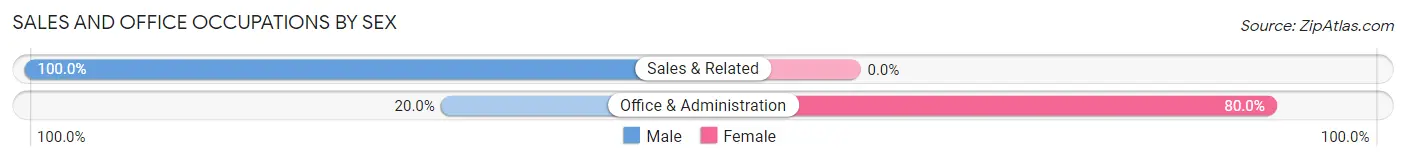
| Occupation | Male | Female |
| Sales & Related | 1 (100.0%) | 0 (0.0%) |
| Office & Administration | 2 (20.0%) | 8 (80.0%) |
| Total (Category) | 3 (27.3%) | 8 (72.7%) |
| Total (Overall) | 17 (60.7%) | 11 (39.3%) |
Natural Resources, Construction and Maintenance Occupations

Natural Resources, Construction and Maintenance Occupations by Sex
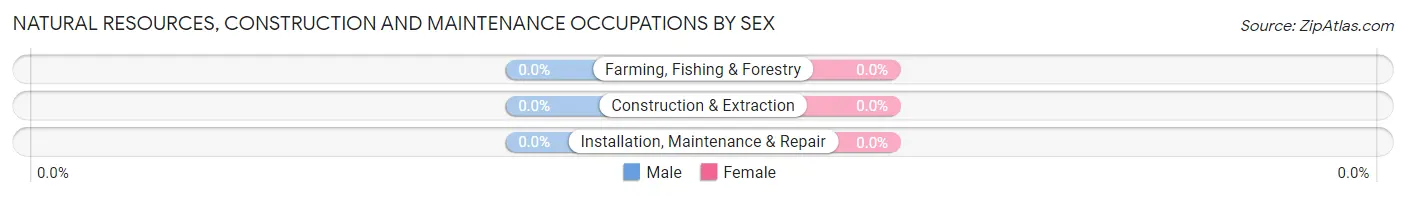
| Occupation | Male | Female |
| Farming, Fishing & Forestry | 0 (0.0%) | 0 (0.0%) |
| Construction & Extraction | 0 (0.0%) | 0 (0.0%) |
| Installation, Maintenance & Repair | 0 (0.0%) | 0 (0.0%) |
| Total (Category) | 0 (0.0%) | 0 (0.0%) |
| Total (Overall) | 17 (60.7%) | 11 (39.3%) |
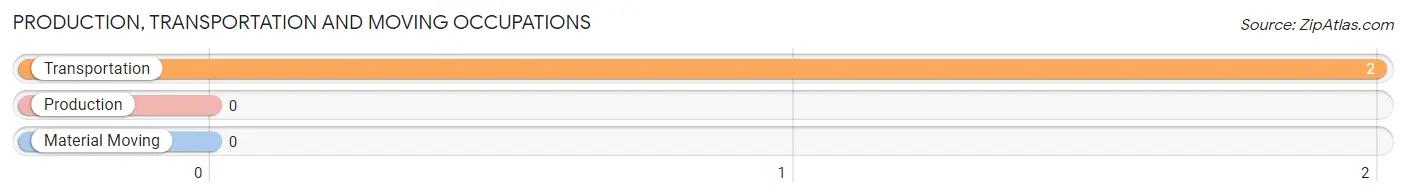
Production, Transportation and Moving Occupations
The most common Production, Transportation and Moving occupations in Stockholm are , and Transportation (2 | 7.1%).
Production, Transportation and Moving Occupations by Sex
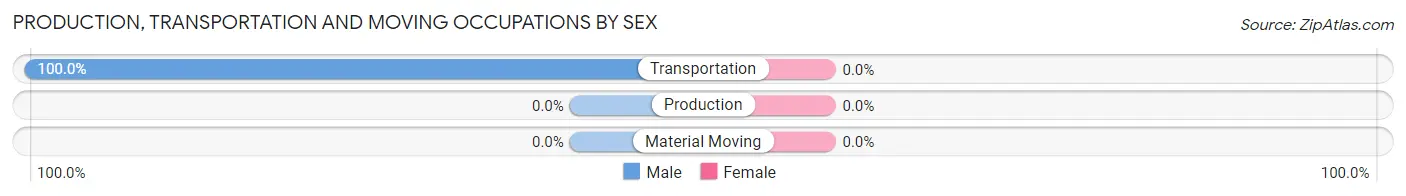
| Occupation | Male | Female |
| Production | 0 (0.0%) | 0 (0.0%) |
| Transportation | 2 (100.0%) | 0 (0.0%) |
| Material Moving | 0 (0.0%) | 0 (0.0%) |
| Total (Category) | 2 (100.0%) | 0 (0.0%) |
| Total (Overall) | 17 (60.7%) | 11 (39.3%) |
Employment Industries by Sex in Stockholm
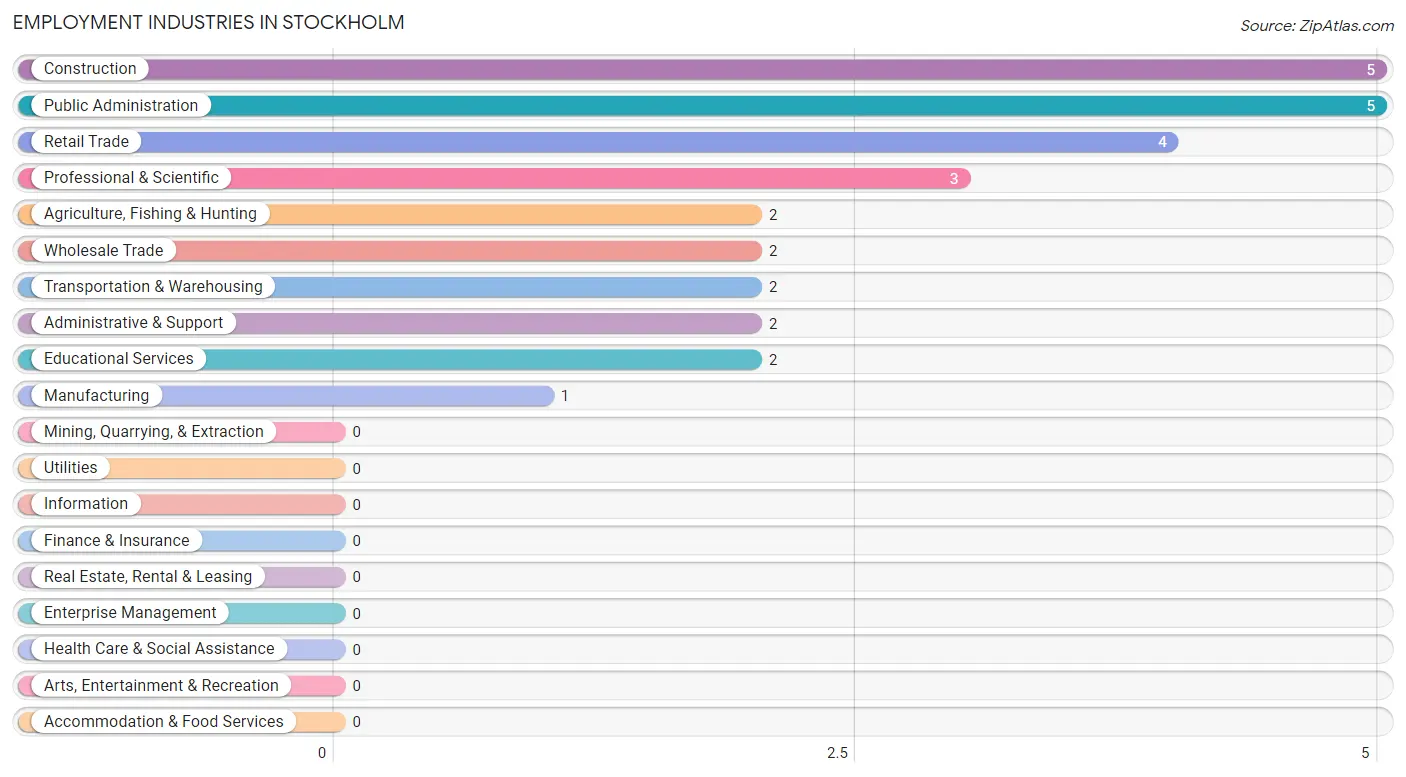
Employment Industries in Stockholm
The major employment industries in Stockholm include Construction (5 | 17.9%), Public Administration (5 | 17.9%), Retail Trade (4 | 14.3%), Professional & Scientific (3 | 10.7%), and Agriculture, Fishing & Hunting (2 | 7.1%).
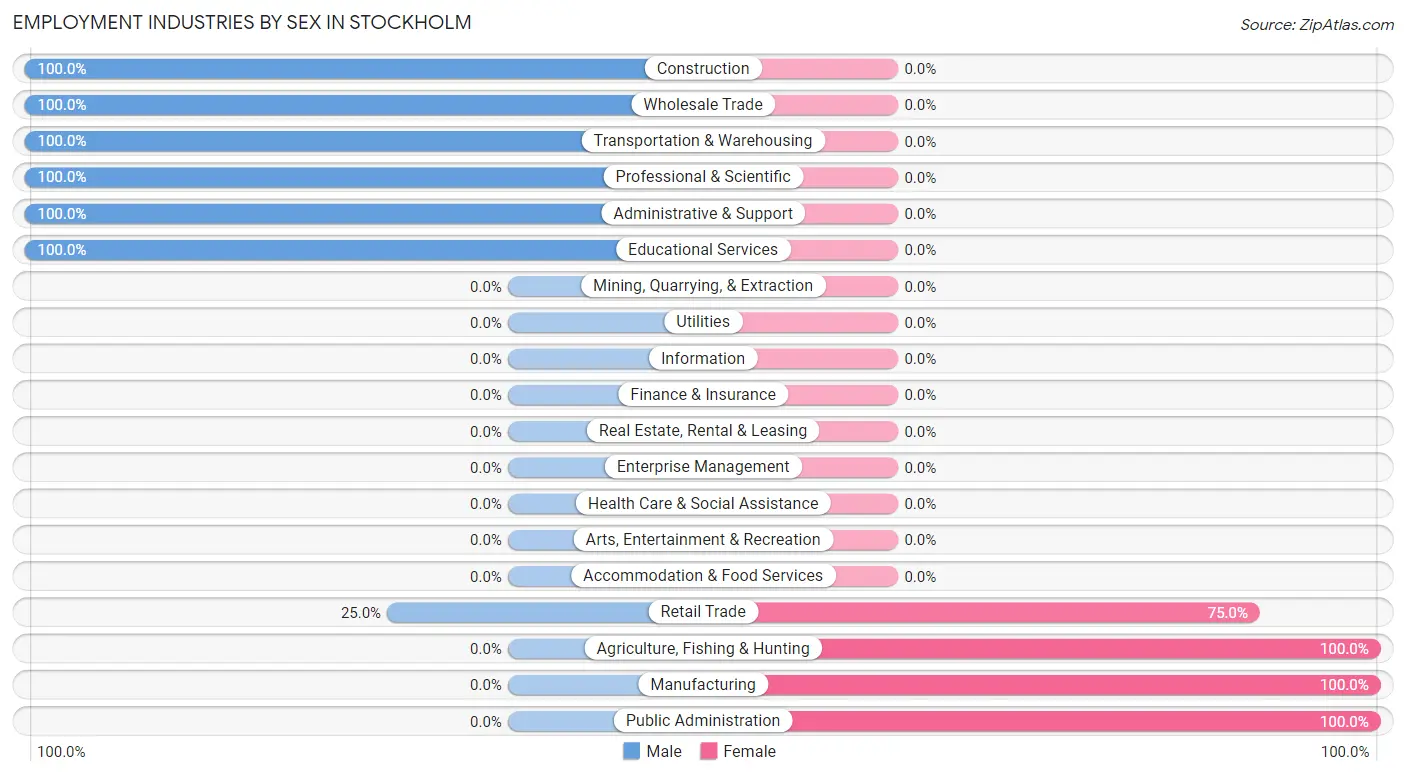
Employment Industries by Sex in Stockholm
The Stockholm industries that see more men than women are Construction (100.0%), Wholesale Trade (100.0%), and Transportation & Warehousing (100.0%), whereas the industries that tend to have a higher number of women are Agriculture, Fishing & Hunting (100.0%), Manufacturing (100.0%), and Public Administration (100.0%).
| Industry | Male | Female |
| Agriculture, Fishing & Hunting | 0 (0.0%) | 2 (100.0%) |
| Mining, Quarrying, & Extraction | 0 (0.0%) | 0 (0.0%) |
| Construction | 5 (100.0%) | 0 (0.0%) |
| Manufacturing | 0 (0.0%) | 1 (100.0%) |
| Wholesale Trade | 2 (100.0%) | 0 (0.0%) |
| Retail Trade | 1 (25.0%) | 3 (75.0%) |
| Transportation & Warehousing | 2 (100.0%) | 0 (0.0%) |
| Utilities | 0 (0.0%) | 0 (0.0%) |
| Information | 0 (0.0%) | 0 (0.0%) |
| Finance & Insurance | 0 (0.0%) | 0 (0.0%) |
| Real Estate, Rental & Leasing | 0 (0.0%) | 0 (0.0%) |
| Professional & Scientific | 3 (100.0%) | 0 (0.0%) |
| Enterprise Management | 0 (0.0%) | 0 (0.0%) |
| Administrative & Support | 2 (100.0%) | 0 (0.0%) |
| Educational Services | 2 (100.0%) | 0 (0.0%) |
| Health Care & Social Assistance | 0 (0.0%) | 0 (0.0%) |
| Arts, Entertainment & Recreation | 0 (0.0%) | 0 (0.0%) |
| Accommodation & Food Services | 0 (0.0%) | 0 (0.0%) |
| Public Administration | 0 (0.0%) | 5 (100.0%) |
| Total | 17 (60.7%) | 11 (39.3%) |
Education in Stockholm
School Enrollment in Stockholm
| School Level | # Students | % Students |
| Nursery / Preschool | 0 | 0.0% |
| Kindergarten | 0 | 0.0% |
| Elementary School | 0 | 0.0% |
| Middle School | 0 | 0.0% |
| High School | 0 | 0.0% |
| College / Undergraduate | 0 | 0.0% |
| Graduate / Professional | 0 | 0.0% |
| Total | 0 | 0.0% |
School Enrollment by Age by Funding Source in Stockholm
| Age Bracket | Public School | Private School |
| 3 to 4 Year Olds | 0 (0.0%) | 0 (0.0%) |
| 5 to 9 Year Old | 0 (0.0%) | 0 (0.0%) |
| 10 to 14 Year Olds | 0 (0.0%) | 0 (0.0%) |
| 15 to 17 Year Olds | 0 (0.0%) | 0 (0.0%) |
| 18 to 19 Year Olds | 0 (0.0%) | 0 (0.0%) |
| 20 to 24 Year Olds | 0 (0.0%) | 0 (0.0%) |
| 25 to 34 Year Olds | 0 (0.0%) | 0 (0.0%) |
| 35 Years and over | 0 (0.0%) | 0 (0.0%) |
| Total | 0 (0.0%) | 0 (0.0%) |
Educational Attainment by Field of Study in Stockholm
Social sciences (17 | 27.9%), literature & languages (13 | 21.3%), education (8 | 13.1%), computers & mathematics (5 | 8.2%), and physical & health sciences (5 | 8.2%) are the most common fields of study among 61 individuals in Stockholm who have obtained a bachelor's degree or higher.
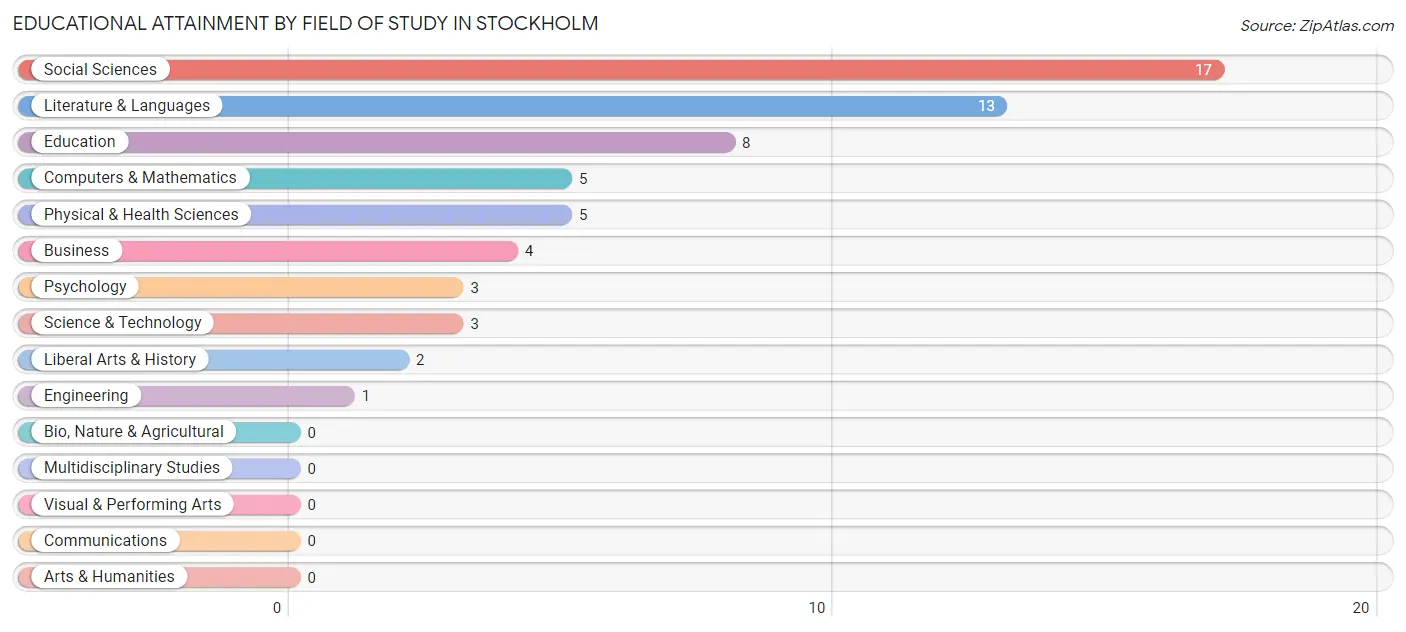
| Field of Study | # Graduates | % Graduates |
| Computers & Mathematics | 5 | 8.2% |
| Bio, Nature & Agricultural | 0 | 0.0% |
| Physical & Health Sciences | 5 | 8.2% |
| Psychology | 3 | 4.9% |
| Social Sciences | 17 | 27.9% |
| Engineering | 1 | 1.6% |
| Multidisciplinary Studies | 0 | 0.0% |
| Science & Technology | 3 | 4.9% |
| Business | 4 | 6.6% |
| Education | 8 | 13.1% |
| Literature & Languages | 13 | 21.3% |
| Liberal Arts & History | 2 | 3.3% |
| Visual & Performing Arts | 0 | 0.0% |
| Communications | 0 | 0.0% |
| Arts & Humanities | 0 | 0.0% |
| Total | 61 | 100.0% |
Transportation & Commute in Stockholm
Vehicle Availability by Sex in Stockholm
The most prevalent vehicle ownership categories in Stockholm are males with 2 vehicles (10, accounting for 58.8%) and females with 2 vehicles (8, making up 90.9%).
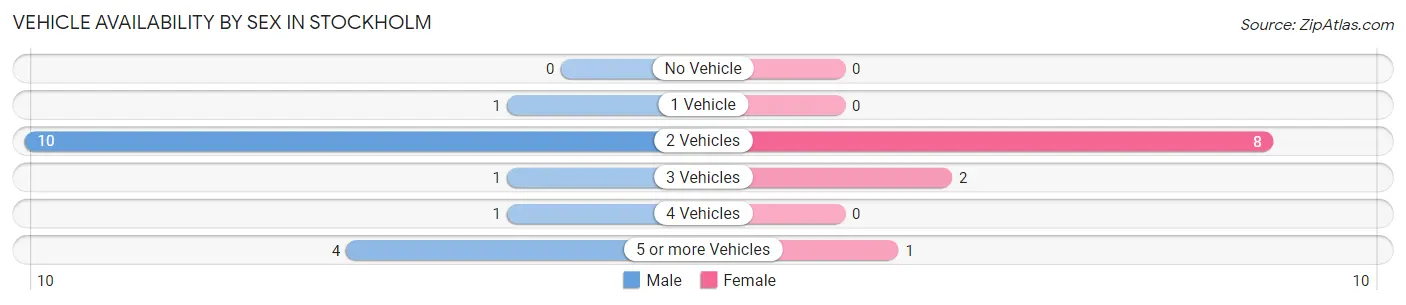
| Vehicles Available | Male | Female |
| No Vehicle | 0 (0.0%) | 0 (0.0%) |
| 1 Vehicle | 1 (5.9%) | 0 (0.0%) |
| 2 Vehicles | 10 (58.8%) | 8 (72.7%) |
| 3 Vehicles | 1 (5.9%) | 2 (18.2%) |
| 4 Vehicles | 1 (5.9%) | 0 (0.0%) |
| 5 or more Vehicles | 4 (23.5%) | 1 (9.1%) |
| Total | 17 (100.0%) | 11 (100.0%) |
Commute Time in Stockholm
The most frequently occuring commute durations in Stockholm are 30 to 34 minutes (5 commuters, 31.2%), 60 to 89 minutes (4 commuters, 25.0%), and 40 to 44 minutes (2 commuters, 12.5%).
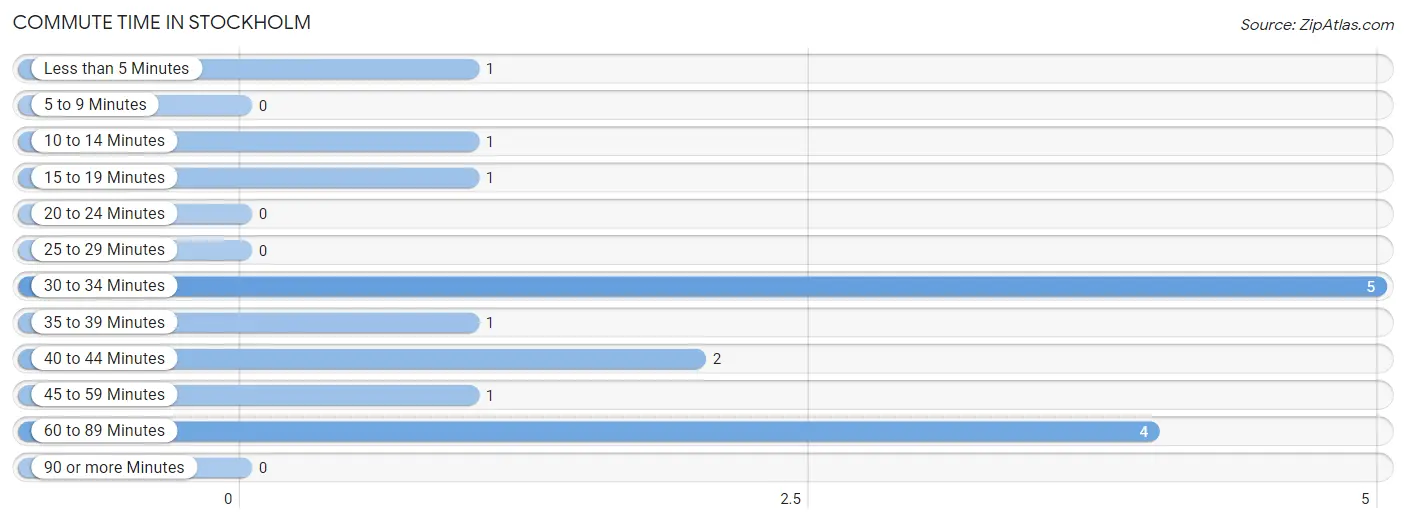
| Commute Time | # Commuters | % Commuters |
| Less than 5 Minutes | 1 | 6.2% |
| 5 to 9 Minutes | 0 | 0.0% |
| 10 to 14 Minutes | 1 | 6.2% |
| 15 to 19 Minutes | 1 | 6.2% |
| 20 to 24 Minutes | 0 | 0.0% |
| 25 to 29 Minutes | 0 | 0.0% |
| 30 to 34 Minutes | 5 | 31.2% |
| 35 to 39 Minutes | 1 | 6.2% |
| 40 to 44 Minutes | 2 | 12.5% |
| 45 to 59 Minutes | 1 | 6.2% |
| 60 to 89 Minutes | 4 | 25.0% |
| 90 or more Minutes | 0 | 0.0% |
Commute Time by Sex in Stockholm
The most common commute times in Stockholm are 30 to 34 minutes (2 commuters, 28.6%) for males and 60 to 89 minutes (4 commuters, 44.4%) for females.
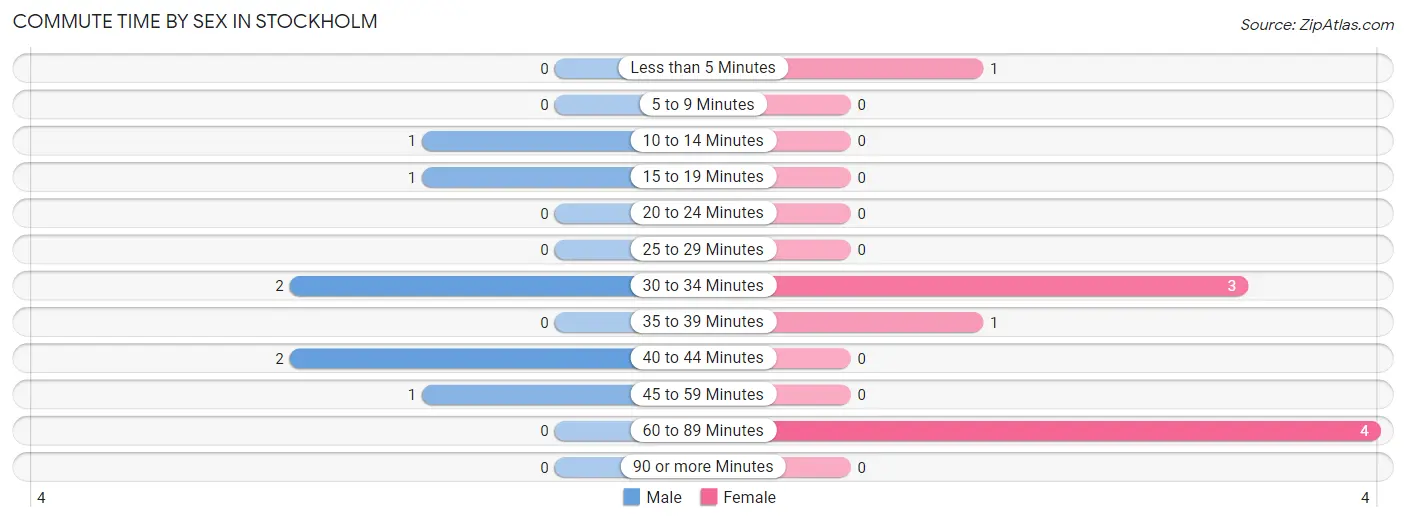
| Commute Time | Male | Female |
| Less than 5 Minutes | 0 (0.0%) | 1 (11.1%) |
| 5 to 9 Minutes | 0 (0.0%) | 0 (0.0%) |
| 10 to 14 Minutes | 1 (14.3%) | 0 (0.0%) |
| 15 to 19 Minutes | 1 (14.3%) | 0 (0.0%) |
| 20 to 24 Minutes | 0 (0.0%) | 0 (0.0%) |
| 25 to 29 Minutes | 0 (0.0%) | 0 (0.0%) |
| 30 to 34 Minutes | 2 (28.6%) | 3 (33.3%) |
| 35 to 39 Minutes | 0 (0.0%) | 1 (11.1%) |
| 40 to 44 Minutes | 2 (28.6%) | 0 (0.0%) |
| 45 to 59 Minutes | 1 (14.3%) | 0 (0.0%) |
| 60 to 89 Minutes | 0 (0.0%) | 4 (44.4%) |
| 90 or more Minutes | 0 (0.0%) | 0 (0.0%) |
Time of Departure to Work by Sex in Stockholm
The most frequent times of departure to work in Stockholm are 5:30 AM to 5:59 AM (3, 42.9%) for males and 6:00 AM to 6:29 AM (4, 44.4%) for females.
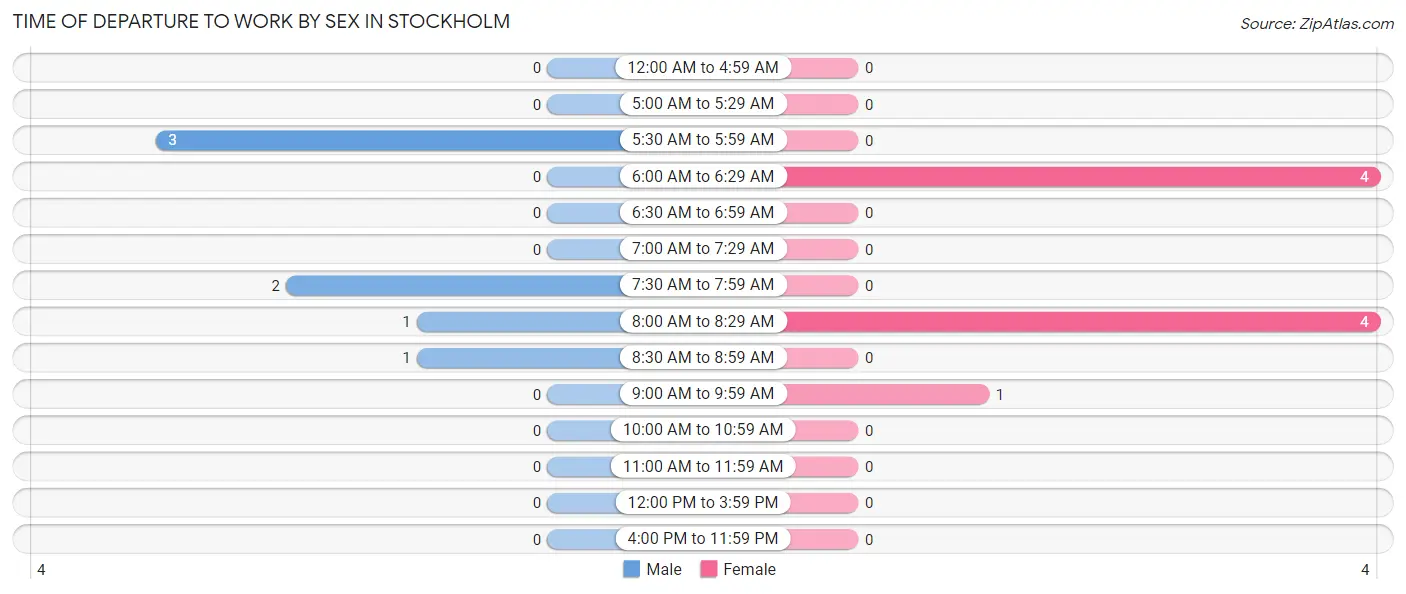
| Time of Departure | Male | Female |
| 12:00 AM to 4:59 AM | 0 (0.0%) | 0 (0.0%) |
| 5:00 AM to 5:29 AM | 0 (0.0%) | 0 (0.0%) |
| 5:30 AM to 5:59 AM | 3 (42.9%) | 0 (0.0%) |
| 6:00 AM to 6:29 AM | 0 (0.0%) | 4 (44.4%) |
| 6:30 AM to 6:59 AM | 0 (0.0%) | 0 (0.0%) |
| 7:00 AM to 7:29 AM | 0 (0.0%) | 0 (0.0%) |
| 7:30 AM to 7:59 AM | 2 (28.6%) | 0 (0.0%) |
| 8:00 AM to 8:29 AM | 1 (14.3%) | 4 (44.4%) |
| 8:30 AM to 8:59 AM | 1 (14.3%) | 0 (0.0%) |
| 9:00 AM to 9:59 AM | 0 (0.0%) | 1 (11.1%) |
| 10:00 AM to 10:59 AM | 0 (0.0%) | 0 (0.0%) |
| 11:00 AM to 11:59 AM | 0 (0.0%) | 0 (0.0%) |
| 12:00 PM to 3:59 PM | 0 (0.0%) | 0 (0.0%) |
| 4:00 PM to 11:59 PM | 0 (0.0%) | 0 (0.0%) |
| Total | 7 (100.0%) | 9 (100.0%) |
Housing Occupancy in Stockholm
Occupancy by Ownership in Stockholm
Of the total 54 dwellings in Stockholm, owner-occupied units account for 54 (100.0%), while renter-occupied units make up 0 (0.0%).
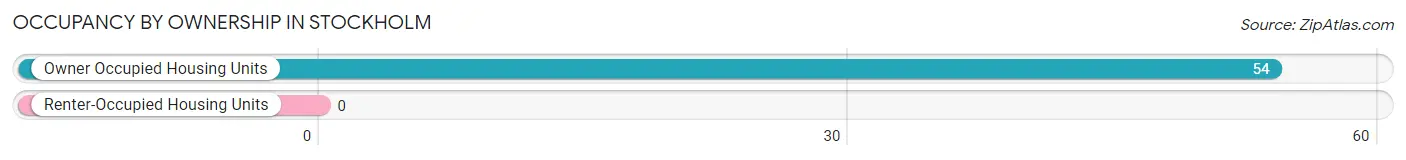
| Occupancy | # Housing Units | % Housing Units |
| Owner Occupied Housing Units | 54 | 100.0% |
| Renter-Occupied Housing Units | 0 | 0.0% |
| Total Occupied Housing Units | 54 | 100.0% |
Occupancy by Household Size in Stockholm
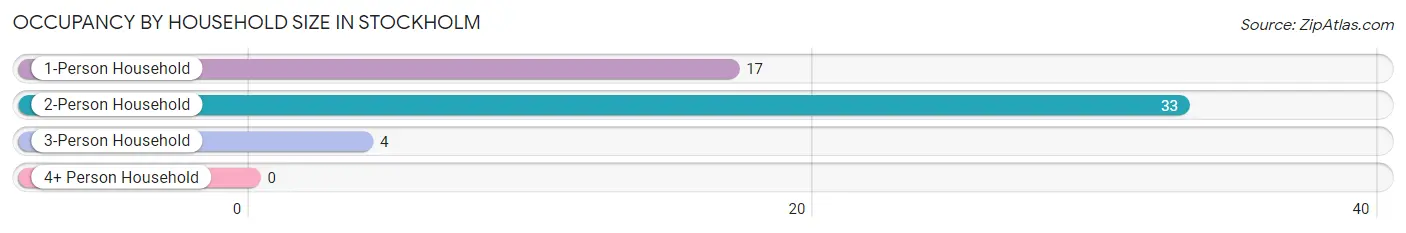
| Household Size | # Housing Units | % Housing Units |
| 1-Person Household | 17 | 31.5% |
| 2-Person Household | 33 | 61.1% |
| 3-Person Household | 4 | 7.4% |
| 4+ Person Household | 0 | 0.0% |
| Total Housing Units | 54 | 100.0% |
Occupancy by Ownership by Household Size in Stockholm
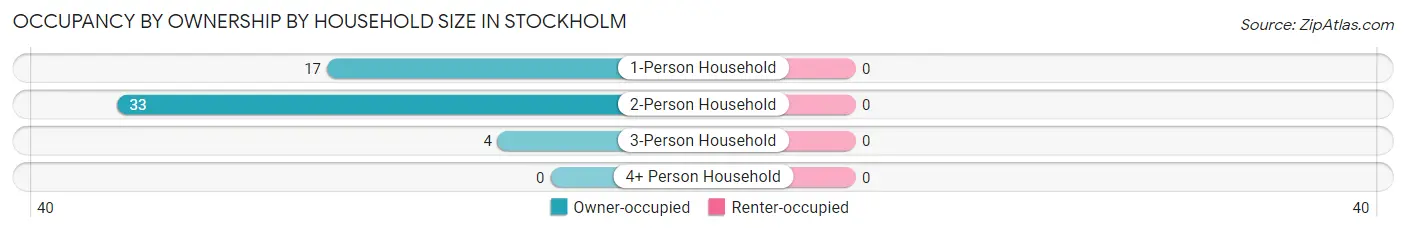
| Household Size | Owner-occupied | Renter-occupied |
| 1-Person Household | 17 (100.0%) | 0 (0.0%) |
| 2-Person Household | 33 (100.0%) | 0 (0.0%) |
| 3-Person Household | 4 (100.0%) | 0 (0.0%) |
| 4+ Person Household | 0 (0.0%) | 0 (0.0%) |
| Total Housing Units | 54 (100.0%) | 0 (0.0%) |
Occupancy by Educational Attainment in Stockholm
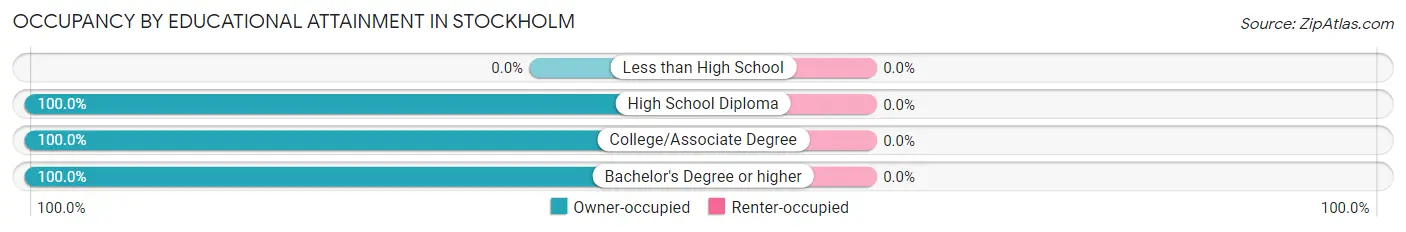
| Household Size | Owner-occupied | Renter-occupied |
| Less than High School | 0 (0.0%) | 0 (0.0%) |
| High School Diploma | 19 (100.0%) | 0 (0.0%) |
| College/Associate Degree | 5 (100.0%) | 0 (0.0%) |
| Bachelor's Degree or higher | 30 (100.0%) | 0 (0.0%) |
Occupancy by Age of Householder in Stockholm
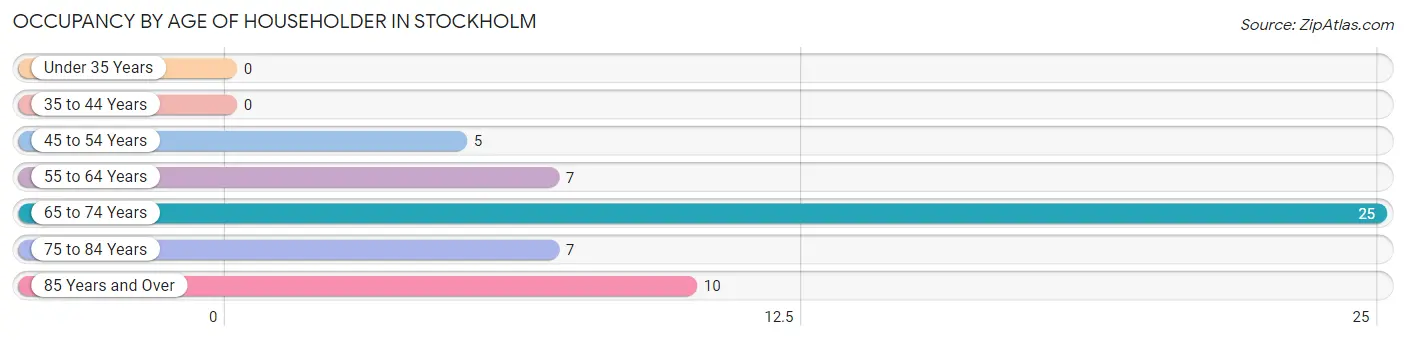
| Age Bracket | # Households | % Households |
| Under 35 Years | 0 | 0.0% |
| 35 to 44 Years | 0 | 0.0% |
| 45 to 54 Years | 5 | 9.3% |
| 55 to 64 Years | 7 | 13.0% |
| 65 to 74 Years | 25 | 46.3% |
| 75 to 84 Years | 7 | 13.0% |
| 85 Years and Over | 10 | 18.5% |
| Total | 54 | 100.0% |
Housing Finances in Stockholm
Median Income by Occupancy in Stockholm
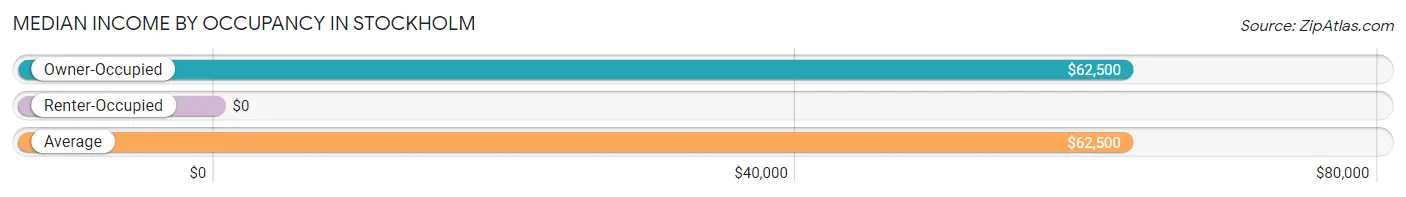
| Occupancy Type | # Households | Median Income |
| Owner-Occupied | 54 (100.0%) | $62,500 |
| Renter-Occupied | 0 (0.0%) | $0 |
| Average | 54 (100.0%) | $62,500 |
Occupancy by Householder Income Bracket in Stockholm
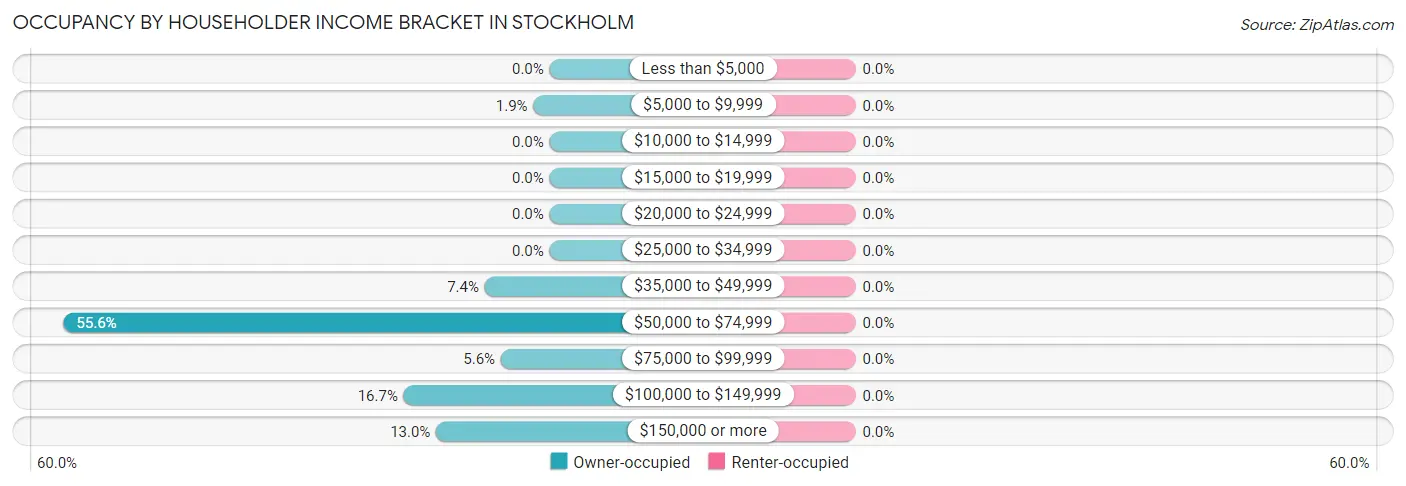
| Income Bracket | Owner-occupied | Renter-occupied |
| Less than $5,000 | 0 (0.0%) | 0 (0.0%) |
| $5,000 to $9,999 | 1 (1.8%) | 0 (0.0%) |
| $10,000 to $14,999 | 0 (0.0%) | 0 (0.0%) |
| $15,000 to $19,999 | 0 (0.0%) | 0 (0.0%) |
| $20,000 to $24,999 | 0 (0.0%) | 0 (0.0%) |
| $25,000 to $34,999 | 0 (0.0%) | 0 (0.0%) |
| $35,000 to $49,999 | 4 (7.4%) | 0 (0.0%) |
| $50,000 to $74,999 | 30 (55.6%) | 0 (0.0%) |
| $75,000 to $99,999 | 3 (5.6%) | 0 (0.0%) |
| $100,000 to $149,999 | 9 (16.7%) | 0 (0.0%) |
| $150,000 or more | 7 (13.0%) | 0 (0.0%) |
| Total | 54 (100.0%) | 0 (0.0%) |
Monthly Housing Cost Tiers in Stockholm
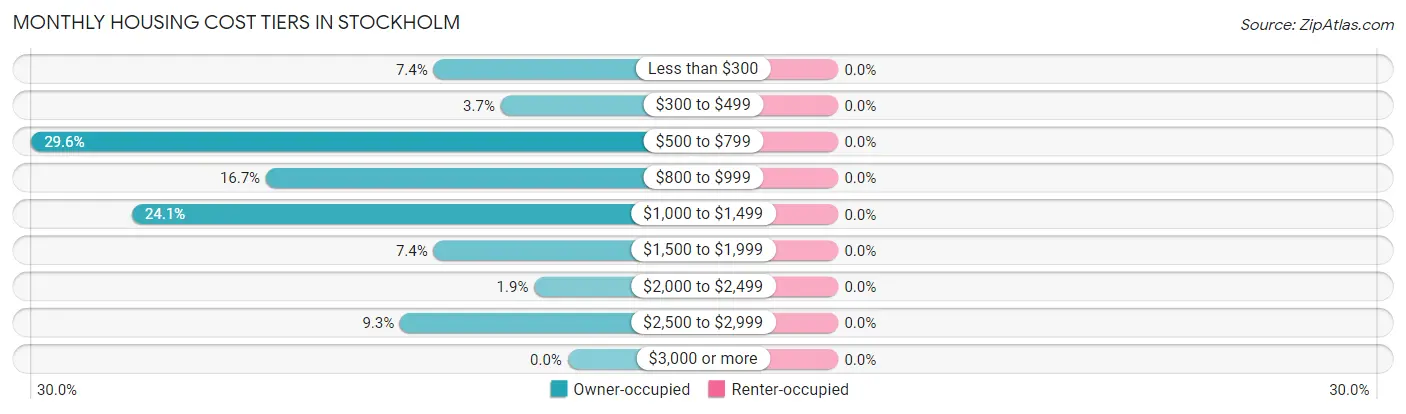
| Monthly Cost | Owner-occupied | Renter-occupied |
| Less than $300 | 4 (7.4%) | 0 (0.0%) |
| $300 to $499 | 2 (3.7%) | 0 (0.0%) |
| $500 to $799 | 16 (29.6%) | 0 (0.0%) |
| $800 to $999 | 9 (16.7%) | 0 (0.0%) |
| $1,000 to $1,499 | 13 (24.1%) | 0 (0.0%) |
| $1,500 to $1,999 | 4 (7.4%) | 0 (0.0%) |
| $2,000 to $2,499 | 1 (1.8%) | 0 (0.0%) |
| $2,500 to $2,999 | 5 (9.3%) | 0 (0.0%) |
| $3,000 or more | 0 (0.0%) | 0 (0.0%) |
| Total | 54 (100.0%) | 0 (0.0%) |
Physical Housing Characteristics in Stockholm
Housing Structures in Stockholm
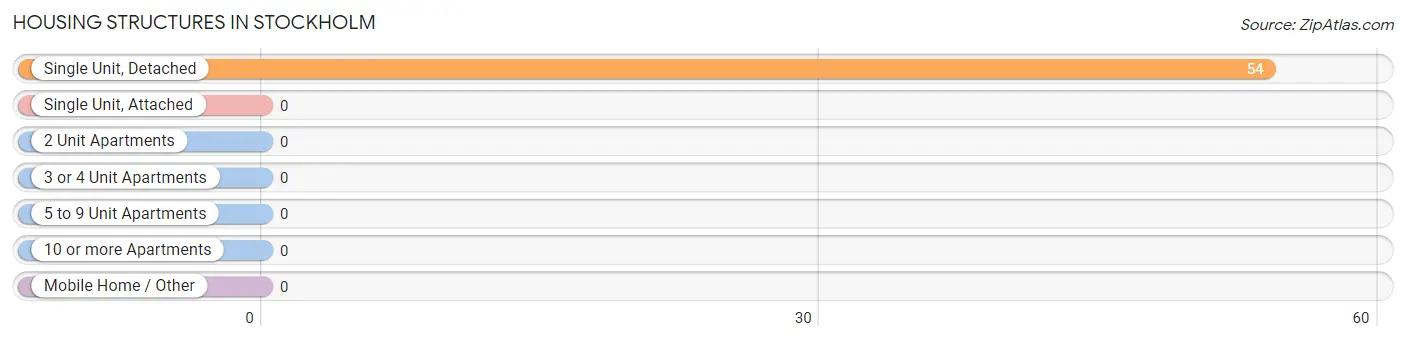
| Structure Type | # Housing Units | % Housing Units |
| Single Unit, Detached | 54 | 100.0% |
| Single Unit, Attached | 0 | 0.0% |
| 2 Unit Apartments | 0 | 0.0% |
| 3 or 4 Unit Apartments | 0 | 0.0% |
| 5 to 9 Unit Apartments | 0 | 0.0% |
| 10 or more Apartments | 0 | 0.0% |
| Mobile Home / Other | 0 | 0.0% |
| Total | 54 | 100.0% |
Housing Structures by Occupancy in Stockholm
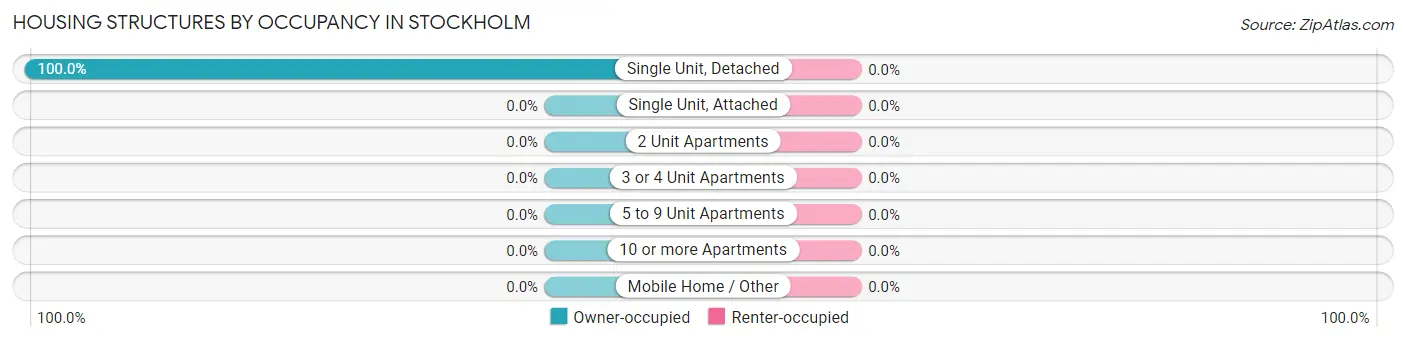
| Structure Type | Owner-occupied | Renter-occupied |
| Single Unit, Detached | 54 (100.0%) | 0 (0.0%) |
| Single Unit, Attached | 0 (0.0%) | 0 (0.0%) |
| 2 Unit Apartments | 0 (0.0%) | 0 (0.0%) |
| 3 or 4 Unit Apartments | 0 (0.0%) | 0 (0.0%) |
| 5 to 9 Unit Apartments | 0 (0.0%) | 0 (0.0%) |
| 10 or more Apartments | 0 (0.0%) | 0 (0.0%) |
| Mobile Home / Other | 0 (0.0%) | 0 (0.0%) |
| Total | 54 (100.0%) | 0 (0.0%) |
Housing Structures by Number of Rooms in Stockholm
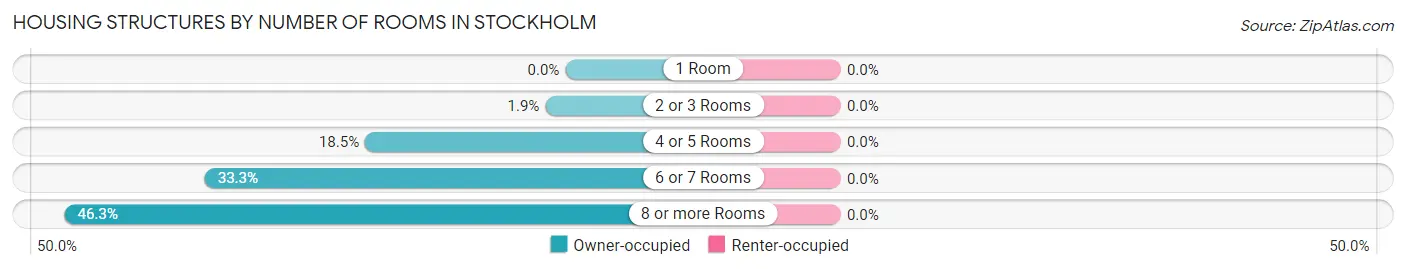
| Number of Rooms | Owner-occupied | Renter-occupied |
| 1 Room | 0 (0.0%) | 0 (0.0%) |
| 2 or 3 Rooms | 1 (1.8%) | 0 (0.0%) |
| 4 or 5 Rooms | 10 (18.5%) | 0 (0.0%) |
| 6 or 7 Rooms | 18 (33.3%) | 0 (0.0%) |
| 8 or more Rooms | 25 (46.3%) | 0 (0.0%) |
| Total | 54 (100.0%) | 0 (0.0%) |
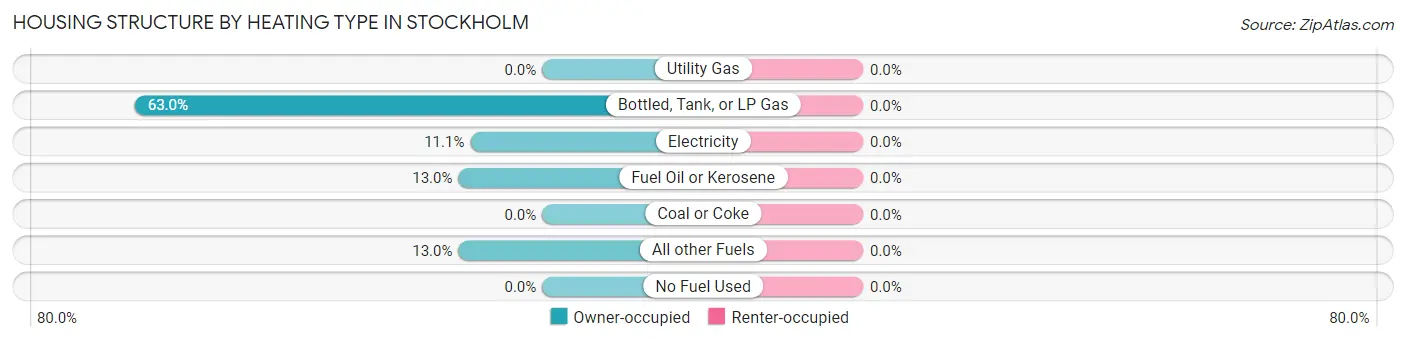
Housing Structure by Heating Type in Stockholm
| Heating Type | Owner-occupied | Renter-occupied |
| Utility Gas | 0 (0.0%) | 0 (0.0%) |
| Bottled, Tank, or LP Gas | 34 (63.0%) | 0 (0.0%) |
| Electricity | 6 (11.1%) | 0 (0.0%) |
| Fuel Oil or Kerosene | 7 (13.0%) | 0 (0.0%) |
| Coal or Coke | 0 (0.0%) | 0 (0.0%) |
| All other Fuels | 7 (13.0%) | 0 (0.0%) |
| No Fuel Used | 0 (0.0%) | 0 (0.0%) |
| Total | 54 (100.0%) | 0 (0.0%) |
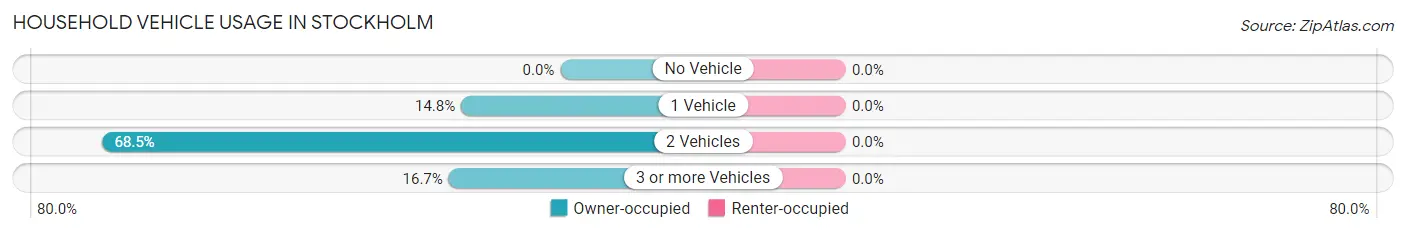
Household Vehicle Usage in Stockholm
| Vehicles per Household | Owner-occupied | Renter-occupied |
| No Vehicle | 0 (0.0%) | 0 (0.0%) |
| 1 Vehicle | 8 (14.8%) | 0 (0.0%) |
| 2 Vehicles | 37 (68.5%) | 0 (0.0%) |
| 3 or more Vehicles | 9 (16.7%) | 0 (0.0%) |
| Total | 54 (100.0%) | 0 (0.0%) |
Real Estate & Mortgages in Stockholm
Real Estate and Mortgage Overview in Stockholm
| Characteristic | Without Mortgage | With Mortgage |
| Housing Units | 39 | 15 |
| Median Property Value | $267,900 | $293,800 |
| Median Household Income | $61,250 | $2 |
| Monthly Housing Costs | $658 | $0 |
| Real Estate Taxes | $4,313 | $0 |
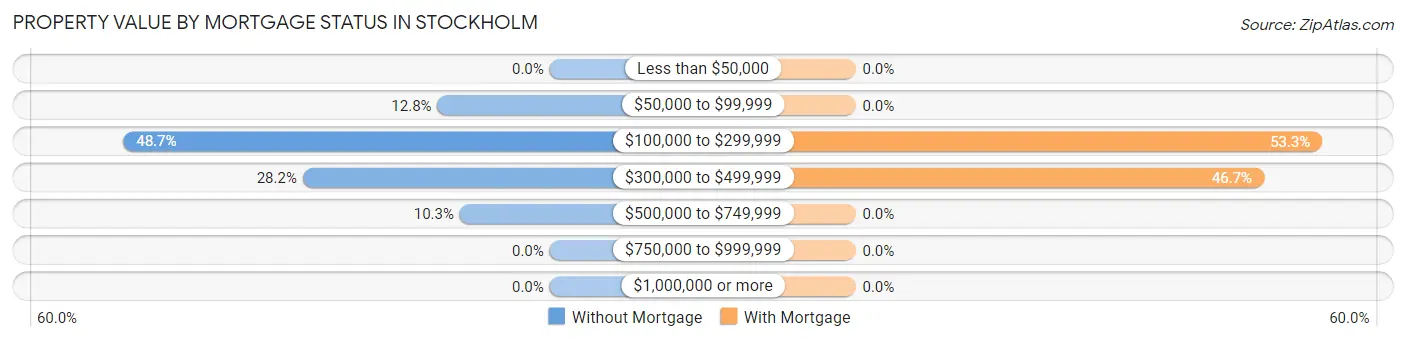
Property Value by Mortgage Status in Stockholm
| Property Value | Without Mortgage | With Mortgage |
| Less than $50,000 | 0 (0.0%) | 0 (0.0%) |
| $50,000 to $99,999 | 5 (12.8%) | 0 (0.0%) |
| $100,000 to $299,999 | 19 (48.7%) | 8 (53.3%) |
| $300,000 to $499,999 | 11 (28.2%) | 7 (46.7%) |
| $500,000 to $749,999 | 4 (10.3%) | 0 (0.0%) |
| $750,000 to $999,999 | 0 (0.0%) | 0 (0.0%) |
| $1,000,000 or more | 0 (0.0%) | 0 (0.0%) |
| Total | 39 (100.0%) | 15 (100.0%) |
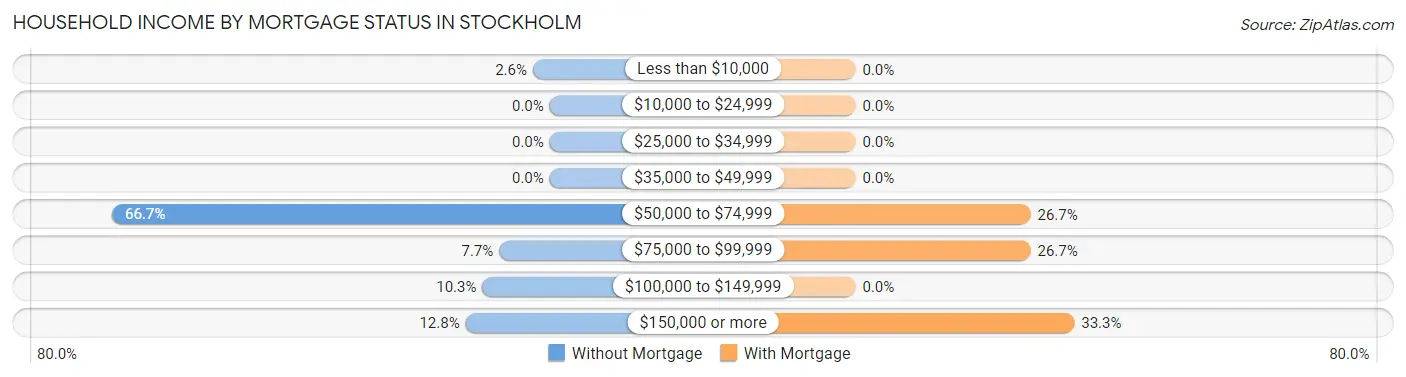
Household Income by Mortgage Status in Stockholm
| Household Income | Without Mortgage | With Mortgage |
| Less than $10,000 | 1 (2.6%) | 0 (0.0%) |
| $10,000 to $24,999 | 0 (0.0%) | 0 (0.0%) |
| $25,000 to $34,999 | 0 (0.0%) | 0 (0.0%) |
| $35,000 to $49,999 | 0 (0.0%) | 0 (0.0%) |
| $50,000 to $74,999 | 26 (66.7%) | 4 (26.7%) |
| $75,000 to $99,999 | 3 (7.7%) | 4 (26.7%) |
| $100,000 to $149,999 | 4 (10.3%) | 0 (0.0%) |
| $150,000 or more | 5 (12.8%) | 5 (33.3%) |
| Total | 39 (100.0%) | 15 (100.0%) |
Property Value to Household Income Ratio in Stockholm
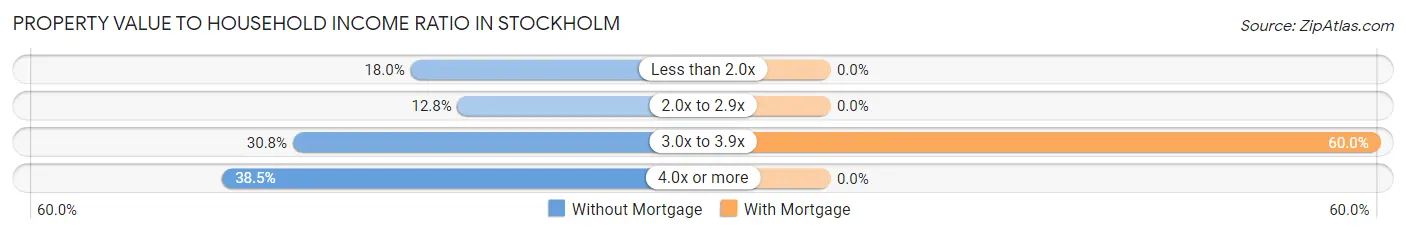
| Value-to-Income Ratio | Without Mortgage | With Mortgage |
| Less than 2.0x | 7 (17.9%) | 0 (0.0%) |
| 2.0x to 2.9x | 5 (12.8%) | 0 (0.0%) |
| 3.0x to 3.9x | 12 (30.8%) | 9 (60.0%) |
| 4.0x or more | 15 (38.5%) | 0 (0.0%) |
| Total | 39 (100.0%) | 15 (100.0%) |
Real Estate Taxes by Mortgage Status in Stockholm
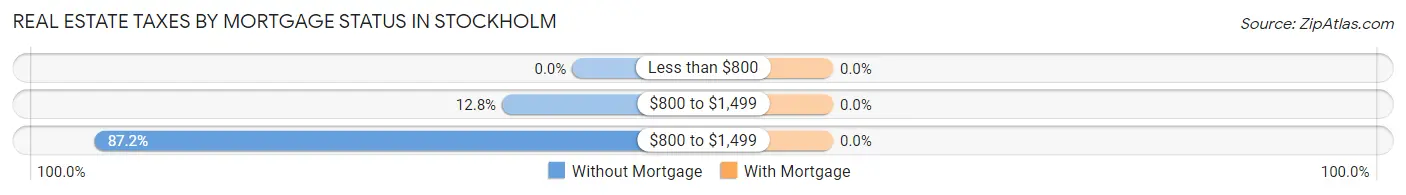
| Property Taxes | Without Mortgage | With Mortgage |
| Less than $800 | 0 (0.0%) | 0 (0.0%) |
| $800 to $1,499 | 5 (12.8%) | 0 (0.0%) |
| $800 to $1,499 | 34 (87.2%) | 0 (0.0%) |
| Total | 39 (100.0%) | 15 (100.0%) |
Health & Disability in Stockholm
Health Insurance Coverage by Age in Stockholm
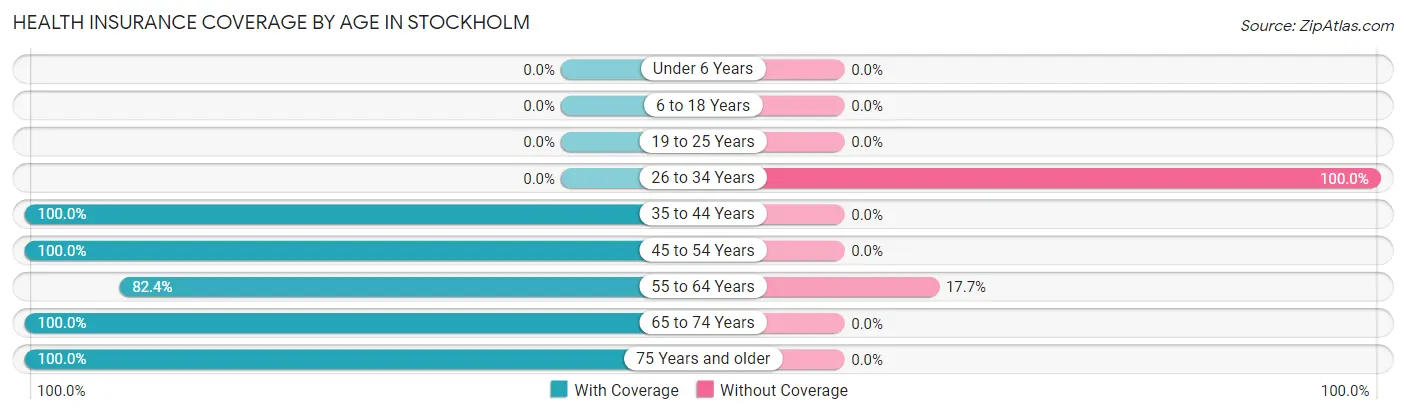
| Age Bracket | With Coverage | Without Coverage |
| Under 6 Years | 0 (0.0%) | 0 (0.0%) |
| 6 to 18 Years | 0 (0.0%) | 0 (0.0%) |
| 19 to 25 Years | 0 (0.0%) | 0 (0.0%) |
| 26 to 34 Years | 0 (0.0%) | 1 (100.0%) |
| 35 to 44 Years | 6 (100.0%) | 0 (0.0%) |
| 45 to 54 Years | 5 (100.0%) | 0 (0.0%) |
| 55 to 64 Years | 14 (82.4%) | 3 (17.6%) |
| 65 to 74 Years | 41 (100.0%) | 0 (0.0%) |
| 75 Years and older | 21 (100.0%) | 0 (0.0%) |
| Total | 87 (95.6%) | 4 (4.4%) |
Health Insurance Coverage by Citizenship Status in Stockholm

| Citizenship Status | With Coverage | Without Coverage |
| Native Born | 0 (0.0%) | 0 (0.0%) |
| Foreign Born, Citizen | 0 (0.0%) | 0 (0.0%) |
| Foreign Born, not a Citizen | 0 (0.0%) | 0 (0.0%) |
Health Insurance Coverage by Household Income in Stockholm
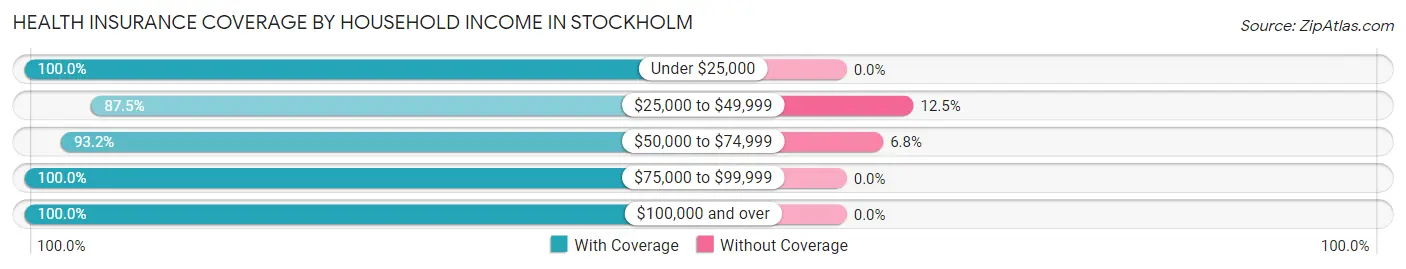
| Household Income | With Coverage | Without Coverage |
| Under $25,000 | 1 (100.0%) | 0 (0.0%) |
| $25,000 to $49,999 | 7 (87.5%) | 1 (12.5%) |
| $50,000 to $74,999 | 41 (93.2%) | 3 (6.8%) |
| $75,000 to $99,999 | 6 (100.0%) | 0 (0.0%) |
| $100,000 and over | 32 (100.0%) | 0 (0.0%) |
Public vs Private Health Insurance Coverage by Age in Stockholm
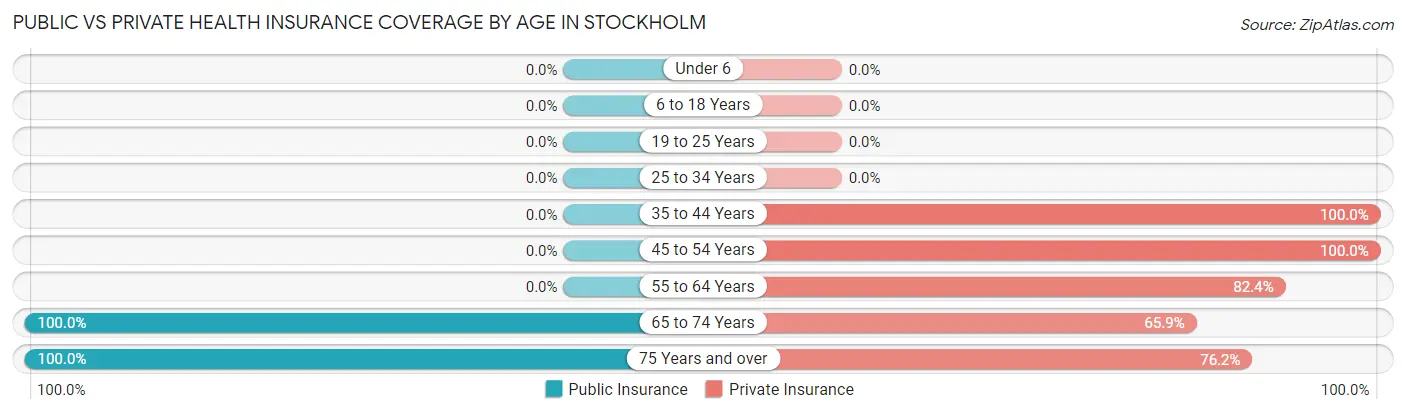
| Age Bracket | Public Insurance | Private Insurance |
| Under 6 | 0 (0.0%) | 0 (0.0%) |
| 6 to 18 Years | 0 (0.0%) | 0 (0.0%) |
| 19 to 25 Years | 0 (0.0%) | 0 (0.0%) |
| 25 to 34 Years | 0 (0.0%) | 0 (0.0%) |
| 35 to 44 Years | 0 (0.0%) | 6 (100.0%) |
| 45 to 54 Years | 0 (0.0%) | 5 (100.0%) |
| 55 to 64 Years | 0 (0.0%) | 14 (82.4%) |
| 65 to 74 Years | 41 (100.0%) | 27 (65.8%) |
| 75 Years and over | 21 (100.0%) | 16 (76.2%) |
| Total | 62 (68.1%) | 68 (74.7%) |
Disability Status by Sex by Age in Stockholm
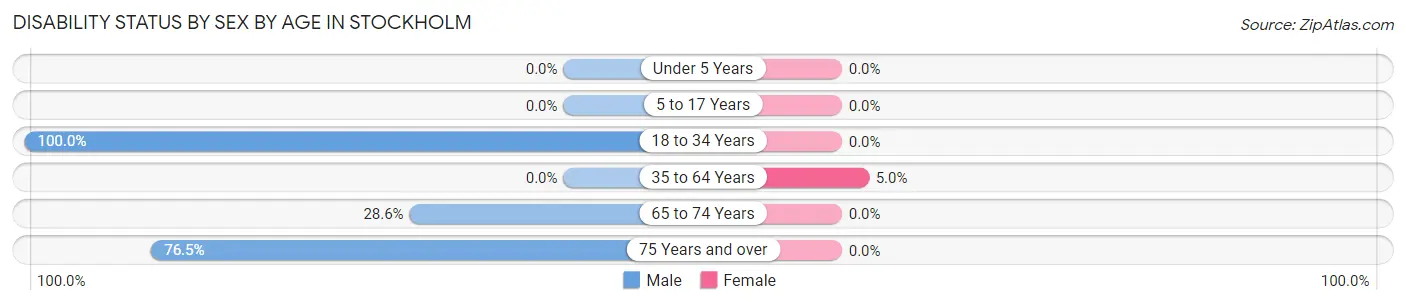
| Age Bracket | Male | Female |
| Under 5 Years | 0 (0.0%) | 0 (0.0%) |
| 5 to 17 Years | 0 (0.0%) | 0 (0.0%) |
| 18 to 34 Years | 1 (100.0%) | 0 (0.0%) |
| 35 to 64 Years | 0 (0.0%) | 1 (5.0%) |
| 65 to 74 Years | 8 (28.6%) | 0 (0.0%) |
| 75 Years and over | 13 (76.5%) | 0 (0.0%) |
Disability Class by Sex by Age in Stockholm
Disability Class: Hearing Difficulty
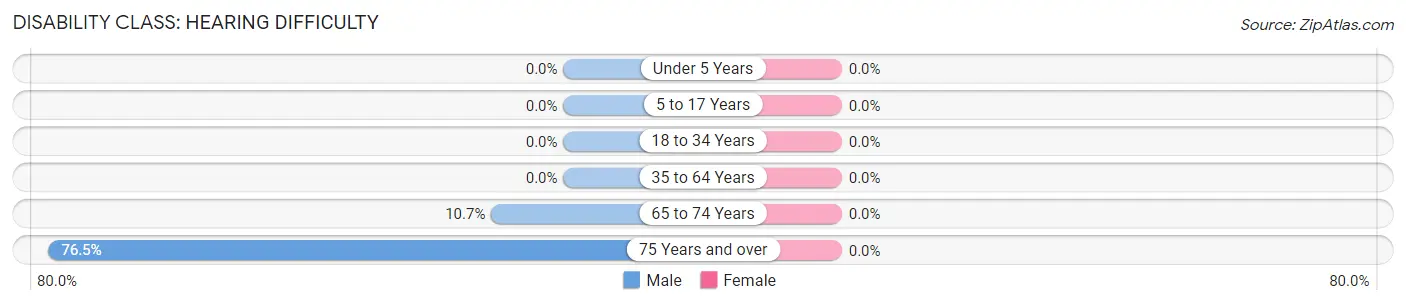
| Age Bracket | Male | Female |
| Under 5 Years | 0 (0.0%) | 0 (0.0%) |
| 5 to 17 Years | 0 (0.0%) | 0 (0.0%) |
| 18 to 34 Years | 0 (0.0%) | 0 (0.0%) |
| 35 to 64 Years | 0 (0.0%) | 0 (0.0%) |
| 65 to 74 Years | 3 (10.7%) | 0 (0.0%) |
| 75 Years and over | 13 (76.5%) | 0 (0.0%) |
Disability Class: Vision Difficulty
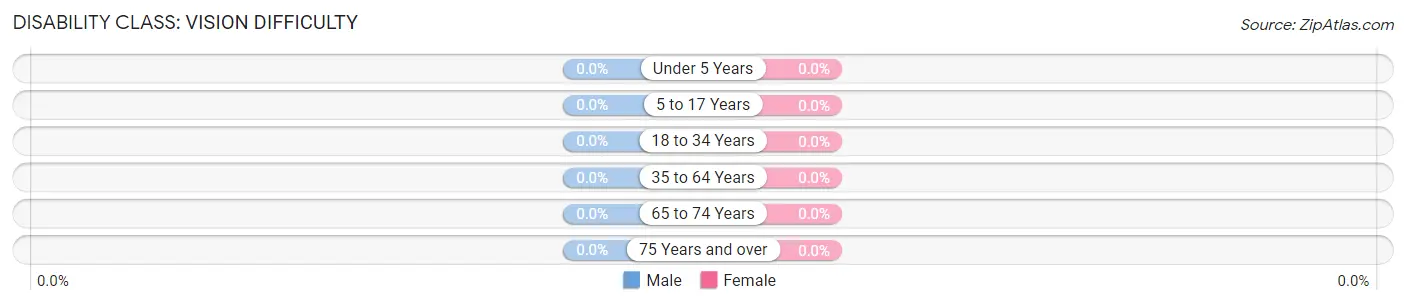
| Age Bracket | Male | Female |
| Under 5 Years | 0 (0.0%) | 0 (0.0%) |
| 5 to 17 Years | 0 (0.0%) | 0 (0.0%) |
| 18 to 34 Years | 0 (0.0%) | 0 (0.0%) |
| 35 to 64 Years | 0 (0.0%) | 0 (0.0%) |
| 65 to 74 Years | 0 (0.0%) | 0 (0.0%) |
| 75 Years and over | 0 (0.0%) | 0 (0.0%) |
Disability Class: Cognitive Difficulty
| Age Bracket | Male | Female |
| 5 to 17 Years | 0 (0.0%) | 0 (0.0%) |
| 18 to 34 Years | 0 (0.0%) | 0 (0.0%) |
| 35 to 64 Years | 0 (0.0%) | 0 (0.0%) |
| 65 to 74 Years | 0 (0.0%) | 0 (0.0%) |
| 75 Years and over | 0 (0.0%) | 0 (0.0%) |
Disability Class: Ambulatory Difficulty
| Age Bracket | Male | Female |
| 5 to 17 Years | 0 (0.0%) | 0 (0.0%) |
| 18 to 34 Years | 0 (0.0%) | 0 (0.0%) |
| 35 to 64 Years | 0 (0.0%) | 1 (5.0%) |
| 65 to 74 Years | 0 (0.0%) | 0 (0.0%) |
| 75 Years and over | 0 (0.0%) | 0 (0.0%) |
Disability Class: Self-Care Difficulty
| Age Bracket | Male | Female |
| 5 to 17 Years | 0 (0.0%) | 0 (0.0%) |
| 18 to 34 Years | 0 (0.0%) | 0 (0.0%) |
| 35 to 64 Years | 0 (0.0%) | 0 (0.0%) |
| 65 to 74 Years | 0 (0.0%) | 0 (0.0%) |
| 75 Years and over | 0 (0.0%) | 0 (0.0%) |
Technology Access in Stockholm
Computing Device Access in Stockholm
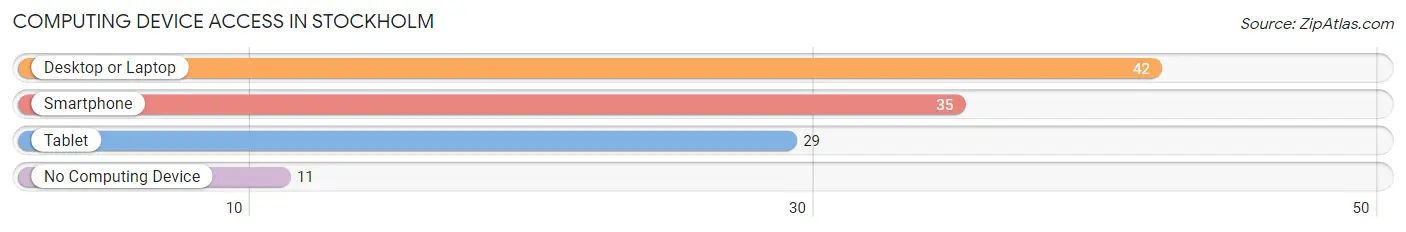
| Device Type | # Households | % Households |
| Desktop or Laptop | 42 | 77.8% |
| Smartphone | 35 | 64.8% |
| Tablet | 29 | 53.7% |
| No Computing Device | 11 | 20.4% |
| Total | 54 | 100.0% |
Internet Access in Stockholm
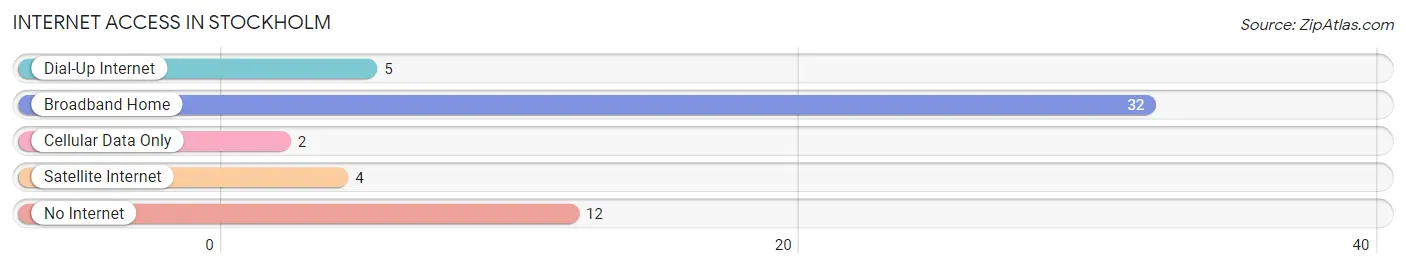
| Internet Type | # Households | % Households |
| Dial-Up Internet | 5 | 9.3% |
| Broadband Home | 32 | 59.3% |
| Cellular Data Only | 2 | 3.7% |
| Satellite Internet | 4 | 7.4% |
| No Internet | 12 | 22.2% |
| Total | 54 | 100.0% |
Stockholm Summary
Stockholm is a small town located in Pepin County, Wisconsin, United States. It is situated on the banks of the Mississippi River, approximately 40 miles east of the city of Eau Claire. The population of Stockholm was estimated to be around 545 in 2020.
History
Stockholm was founded in 1854 by Swedish immigrants who had come to the area in search of a better life. The town was named after the Swedish capital of Stockholm, and the settlers built a log cabin and a sawmill. The town grew quickly, and by 1856, it had a population of over 200.
In 1858, the first school was built in Stockholm, and the town was incorporated in 1859. The first post office was established in 1864, and the first newspaper, the Stockholm Times, was published in 1867.
In the late 19th century, Stockholm was a thriving community with a variety of businesses, including a flour mill, a sawmill, a blacksmith shop, a general store, and a hotel. The town also had a bank, a library, and a newspaper.
Geography
Stockholm is located in the western part of Pepin County, Wisconsin, on the banks of the Mississippi River. The town is situated on a bluff overlooking the river, and is surrounded by rolling hills and wooded areas. The town is located approximately 40 miles east of the city of Eau Claire.
The climate in Stockholm is typical of the Upper Midwest, with cold winters and warm summers. The average annual temperature is around 45 degrees Fahrenheit, and the average annual precipitation is around 30 inches.
Economy
The economy of Stockholm is largely based on agriculture and tourism. The town is home to several farms, which produce a variety of crops, including corn, soybeans, and hay. The town also has a number of small businesses, including restaurants, shops, and a winery.
Tourism is an important part of the economy of Stockholm. The town is home to several historic sites, including the Stockholm Historical Museum, the Stockholm Log Cabin, and the Stockholm Lutheran Church. The town also hosts a number of festivals and events throughout the year, including the Stockholm Summer Festival and the Stockholm Fall Festival.
Demographics
As of the 2020 census, the population of Stockholm was estimated to be 545. The racial makeup of the town was 97.3% White, 0.7% African American, 0.4% Native American, 0.2% Asian, and 1.4% from other races. The median household income was $45,000, and the median home value was $150,000.
Conclusion
Stockholm is a small town located in Pepin County, Wisconsin, on the banks of the Mississippi River. The town was founded in 1854 by Swedish immigrants, and has a population of around 545. The economy of Stockholm is largely based on agriculture and tourism, and the town is home to several historic sites and hosts a number of festivals and events throughout the year.
Common Questions
What is Per Capita Income in Stockholm?
Per Capita income in Stockholm is $62,962.
What is the Median Family Income in Stockholm?
Median Family Income in Stockholm is $74,375.
What is the Median Household income in Stockholm?
Median Household Income in Stockholm is $62,500.
What is Inequality or Gini Index in Stockholm?
Inequality or Gini Index in Stockholm is 0.38.
What is the Total Population of Stockholm?
Total Population of Stockholm is 91.
What is the Total Male Population of Stockholm?
Total Male Population of Stockholm is 54.
What is the Total Female Population of Stockholm?
Total Female Population of Stockholm is 37.
What is the Ratio of Males per 100 Females in Stockholm?
There are 145.95 Males per 100 Females in Stockholm.
What is the Ratio of Females per 100 Males in Stockholm?
There are 68.52 Females per 100 Males in Stockholm.
What is the Median Population Age in Stockholm?
Median Population Age in Stockholm is 69.8 Years.
What is the Average Family Size in Stockholm
Average Family Size in Stockholm is 2.0 People.
What is the Average Household Size in Stockholm
Average Household Size in Stockholm is 1.7 People.
How Large is the Labor Force in Stockholm?
There are 28 People in the Labor Forcein in Stockholm.
What is the Percentage of People in the Labor Force in Stockholm?
30.8% of People are in the Labor Force in Stockholm.