Stockbridge, WI Map & Demographics
Stockbridge Map
Stockbridge Overview
$47,986
PER CAPITA INCOME
$108,750
AVG FAMILY INCOME
$56,719
AVG HOUSEHOLD INCOME
20.9%
WAGE / INCOME GAP [ % ]
79.1¢/ $1
WAGE / INCOME GAP [ $ ]
0.42
INEQUALITY / GINI INDEX
857
TOTAL POPULATION
387
MALE POPULATION
470
FEMALE POPULATION
82.34
MALES / 100 FEMALES
121.45
FEMALES / 100 MALES
57.8
MEDIAN AGE
2.6
AVG FAMILY SIZE
1.7
AVG HOUSEHOLD SIZE
426
LABOR FORCE [ PEOPLE ]
54.1%
PERCENT IN LABOR FORCE
Stockbridge Zip Codes
Stockbridge Area Codes
Income in Stockbridge
Income Overview in Stockbridge
Per Capita Income in Stockbridge is $47,986, while median incomes of families and households are $108,750 and $56,719 respectively.
| Characteristic | Number | Measure |
| Per Capita Income | 857 | $47,986 |
| Median Family Income | 172 | $108,750 |
| Mean Family Income | 172 | $130,508 |
| Median Household Income | 511 | $56,719 |
| Mean Household Income | 511 | $80,513 |
| Income Deficit | 172 | $0 |
| Wage / Income Gap (%) | 857 | 20.94% |
| Wage / Income Gap ($) | 857 | 79.06¢ per $1 |
| Gini / Inequality Index | 857 | 0.42 |
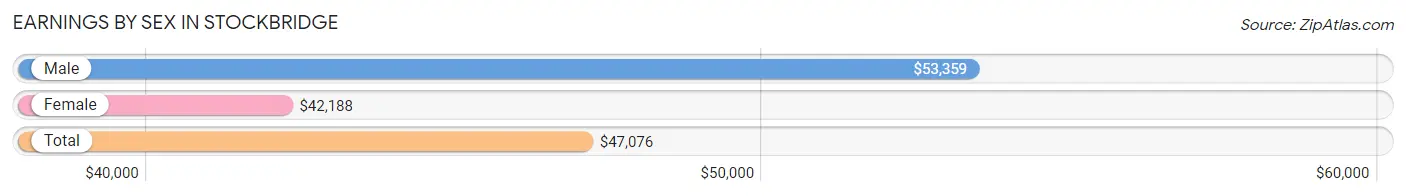
Earnings by Sex in Stockbridge
Average Earnings in Stockbridge are $47,076, $53,359 for men and $42,188 for women, a difference of 20.9%.
| Sex | Number | Average Earnings |
| Male | 227 (51.5%) | $53,359 |
| Female | 214 (48.5%) | $42,188 |
| Total | 441 (100.0%) | $47,076 |
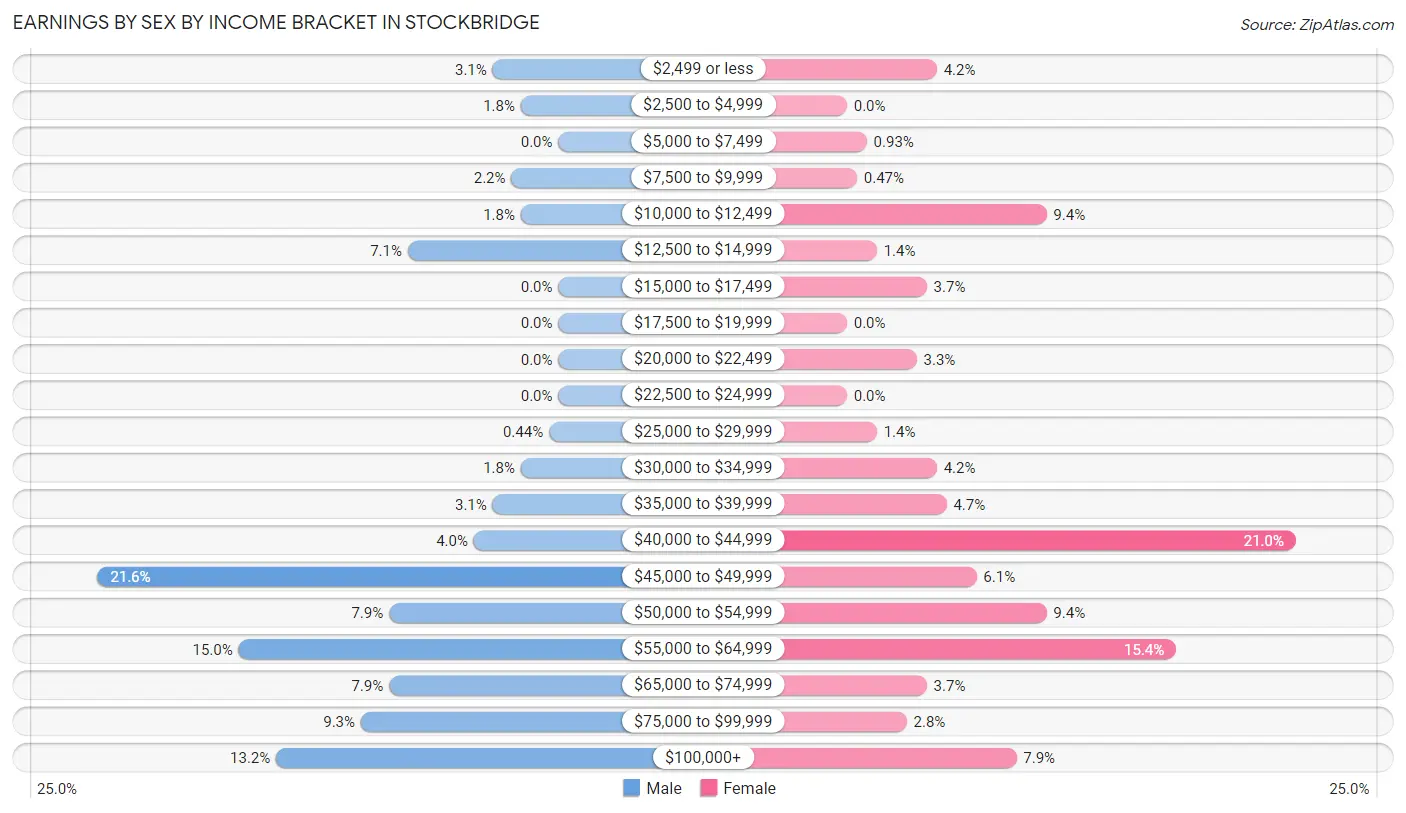
Earnings by Sex by Income Bracket in Stockbridge
The most common earnings brackets in Stockbridge are $45,000 to $49,999 for men (49 | 21.6%) and $40,000 to $44,999 for women (45 | 21.0%).
| Income | Male | Female |
| $2,499 or less | 7 (3.1%) | 9 (4.2%) |
| $2,500 to $4,999 | 4 (1.8%) | 0 (0.0%) |
| $5,000 to $7,499 | 0 (0.0%) | 2 (0.9%) |
| $7,500 to $9,999 | 5 (2.2%) | 1 (0.5%) |
| $10,000 to $12,499 | 4 (1.8%) | 20 (9.3%) |
| $12,500 to $14,999 | 16 (7.0%) | 3 (1.4%) |
| $15,000 to $17,499 | 0 (0.0%) | 8 (3.7%) |
| $17,500 to $19,999 | 0 (0.0%) | 0 (0.0%) |
| $20,000 to $22,499 | 0 (0.0%) | 7 (3.3%) |
| $22,500 to $24,999 | 0 (0.0%) | 0 (0.0%) |
| $25,000 to $29,999 | 1 (0.4%) | 3 (1.4%) |
| $30,000 to $34,999 | 4 (1.8%) | 9 (4.2%) |
| $35,000 to $39,999 | 7 (3.1%) | 10 (4.7%) |
| $40,000 to $44,999 | 9 (4.0%) | 45 (21.0%) |
| $45,000 to $49,999 | 49 (21.6%) | 13 (6.1%) |
| $50,000 to $54,999 | 18 (7.9%) | 20 (9.3%) |
| $55,000 to $64,999 | 34 (15.0%) | 33 (15.4%) |
| $65,000 to $74,999 | 18 (7.9%) | 8 (3.7%) |
| $75,000 to $99,999 | 21 (9.2%) | 6 (2.8%) |
| $100,000+ | 30 (13.2%) | 17 (7.9%) |
| Total | 227 (100.0%) | 214 (100.0%) |
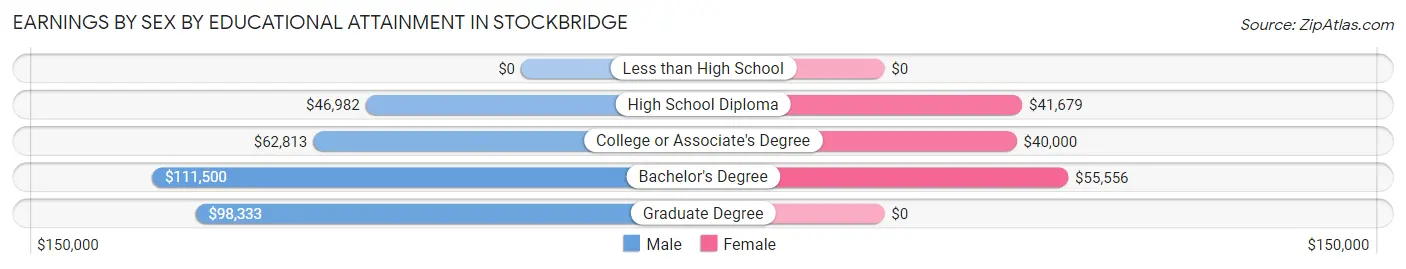
Earnings by Sex by Educational Attainment in Stockbridge
Average earnings in Stockbridge are $54,609 for men and $42,438 for women, a difference of 22.3%. Men with an educational attainment of bachelor's degree enjoy the highest average annual earnings of $111,500, while those with high school diploma education earn the least with $46,982. Women with an educational attainment of bachelor's degree earn the most with the average annual earnings of $55,556, while those with college or associate's degree education have the smallest earnings of $40,000.
| Educational Attainment | Male Income | Female Income |
| Less than High School | - | - |
| High School Diploma | $46,982 | $41,679 |
| College or Associate's Degree | $62,813 | $40,000 |
| Bachelor's Degree | $111,500 | $55,556 |
| Graduate Degree | $98,333 | $0 |
| Total | $54,609 | $42,438 |
Family Income in Stockbridge
Family Income Brackets in Stockbridge
According to the Stockbridge family income data, there are 64 families falling into the $100,000 to $149,999 income range, which is the most common income bracket and makes up 37.2% of all families.
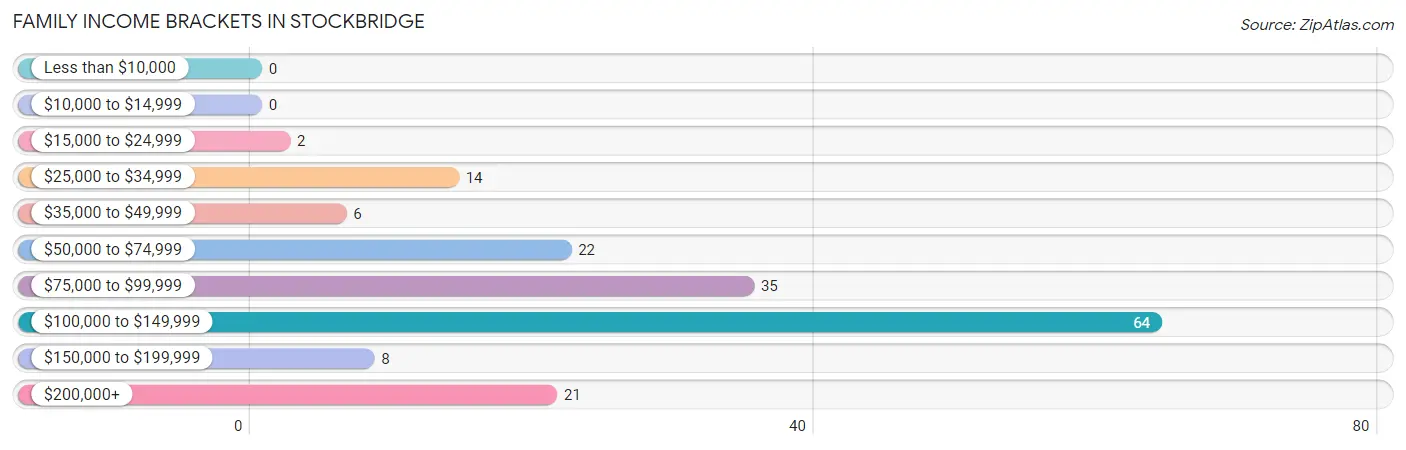
| Income Bracket | # Families | % Families |
| Less than $10,000 | 0 | 0.0% |
| $10,000 to $14,999 | 0 | 0.0% |
| $15,000 to $24,999 | 2 | 1.2% |
| $25,000 to $34,999 | 14 | 8.1% |
| $35,000 to $49,999 | 6 | 3.5% |
| $50,000 to $74,999 | 22 | 12.8% |
| $75,000 to $99,999 | 35 | 20.3% |
| $100,000 to $149,999 | 64 | 37.2% |
| $150,000 to $199,999 | 8 | 4.7% |
| $200,000+ | 21 | 12.2% |
Family Income by Famaliy Size in Stockbridge
4-person families (27 | 15.7%) account for the highest median family income in Stockbridge with $113,125 per family, while 2-person families (106 | 61.6%) have the highest median income of $48,500 per family member.
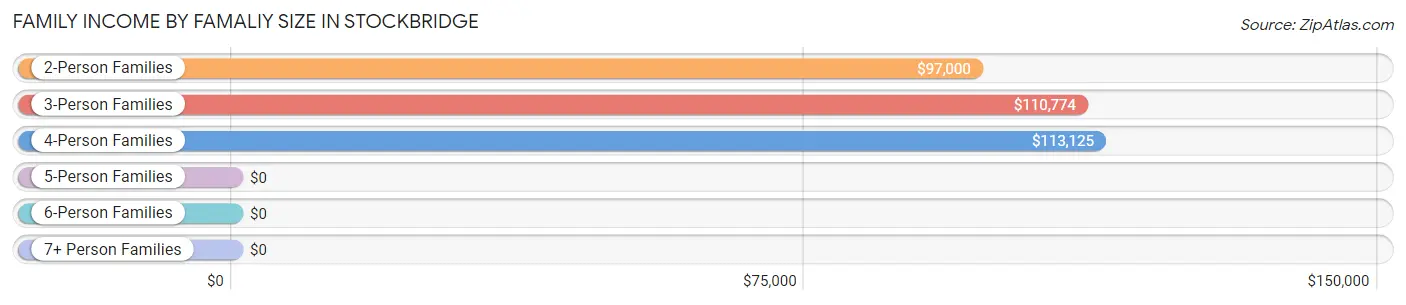
| Income Bracket | # Families | Median Income |
| 2-Person Families | 106 (61.6%) | $97,000 |
| 3-Person Families | 37 (21.5%) | $110,774 |
| 4-Person Families | 27 (15.7%) | $113,125 |
| 5-Person Families | 2 (1.2%) | $0 |
| 6-Person Families | 0 (0.0%) | $0 |
| 7+ Person Families | 0 (0.0%) | $0 |
| Total | 172 (100.0%) | $108,750 |
Family Income by Number of Earners in Stockbridge
The median family income in Stockbridge is $108,750, with families comprising 2 earners (79) having the highest median family income of $112,813, while families with no earners (33) have the lowest median family income of $73,125, accounting for 45.9% and 19.2% of families, respectively.
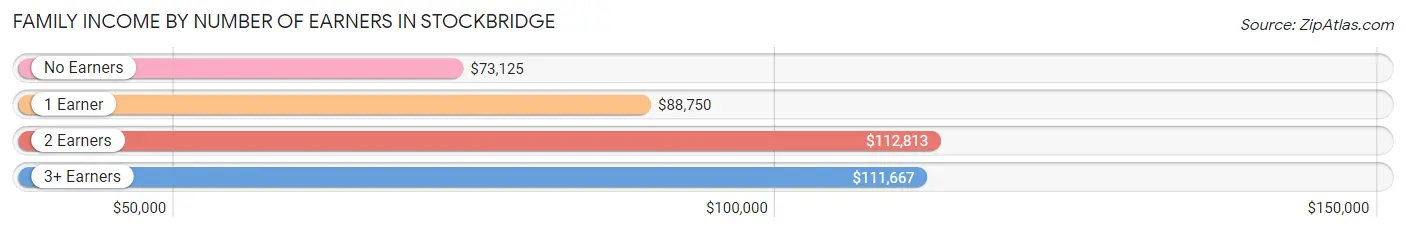
| Number of Earners | # Families | Median Income |
| No Earners | 33 (19.2%) | $73,125 |
| 1 Earner | 40 (23.3%) | $88,750 |
| 2 Earners | 79 (45.9%) | $112,813 |
| 3+ Earners | 20 (11.6%) | $111,667 |
| Total | 172 (100.0%) | $108,750 |
Household Income in Stockbridge
Household Income Brackets in Stockbridge
With 163 households falling in the category, the $25,000 to $34,999 income range is the most frequent in Stockbridge, accounting for 31.9% of all households. In contrast, only 2 households (0.4%) fall into the $10,000 to $14,999 income bracket, making it the least populous group.
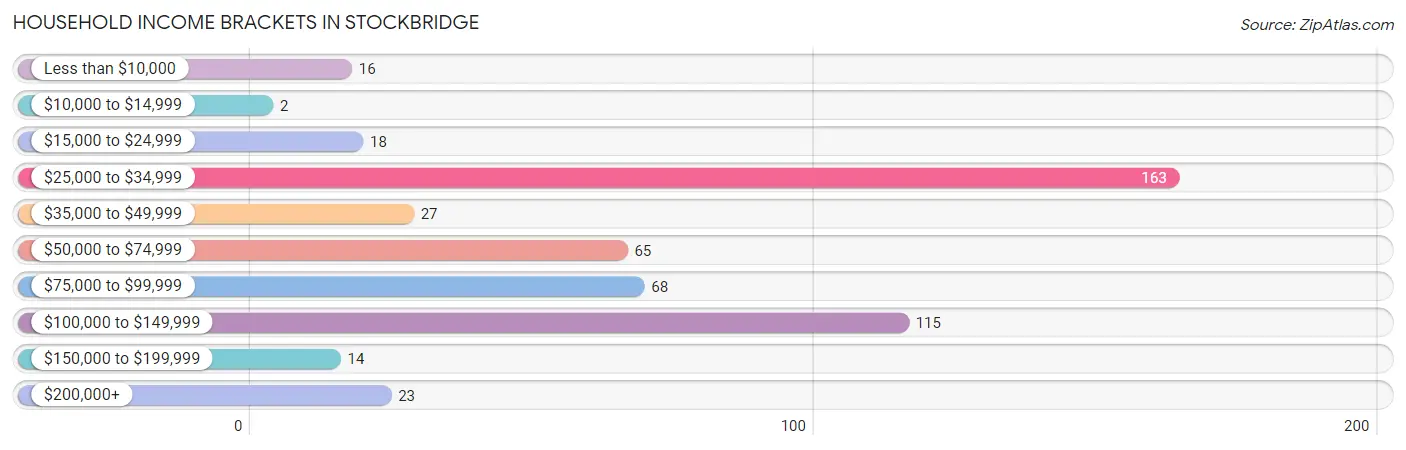
| Income Bracket | # Households | % Households |
| Less than $10,000 | 16 | 3.1% |
| $10,000 to $14,999 | 2 | 0.4% |
| $15,000 to $24,999 | 18 | 3.5% |
| $25,000 to $34,999 | 163 | 31.9% |
| $35,000 to $49,999 | 27 | 5.3% |
| $50,000 to $74,999 | 65 | 12.7% |
| $75,000 to $99,999 | 68 | 13.3% |
| $100,000 to $149,999 | 115 | 22.5% |
| $150,000 to $199,999 | 14 | 2.7% |
| $200,000+ | 23 | 4.5% |
Household Income by Householder Age in Stockbridge
The median household income in Stockbridge is $56,719, with the highest median household income of $99,375 found in the 25 to 44 years age bracket for the primary householder. A total of 79 households (15.5%) fall into this category. Meanwhile, the 15 to 24 years age bracket for the primary householder has the lowest median household income of $0, with 12 households (2.4%) in this group.
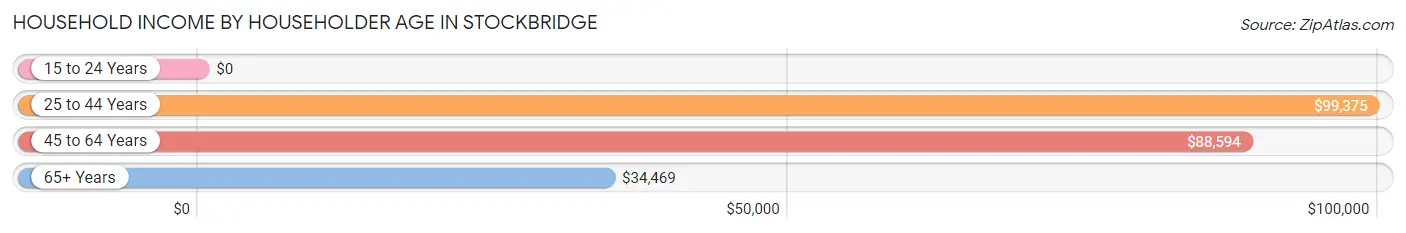
| Income Bracket | # Households | Median Income |
| 15 to 24 Years | 12 (2.4%) | $0 |
| 25 to 44 Years | 79 (15.5%) | $99,375 |
| 45 to 64 Years | 143 (28.0%) | $88,594 |
| 65+ Years | 277 (54.2%) | $34,469 |
| Total | 511 (100.0%) | $56,719 |
Poverty in Stockbridge
Income Below Poverty by Sex and Age in Stockbridge
With 8.0% poverty level for males and 1.7% for females among the residents of Stockbridge, under 5 year old males and 75 year old and over females are the most vulnerable to poverty, with 2 males (28.6%) and 4 females (17.4%) in their respective age groups living below the poverty level.
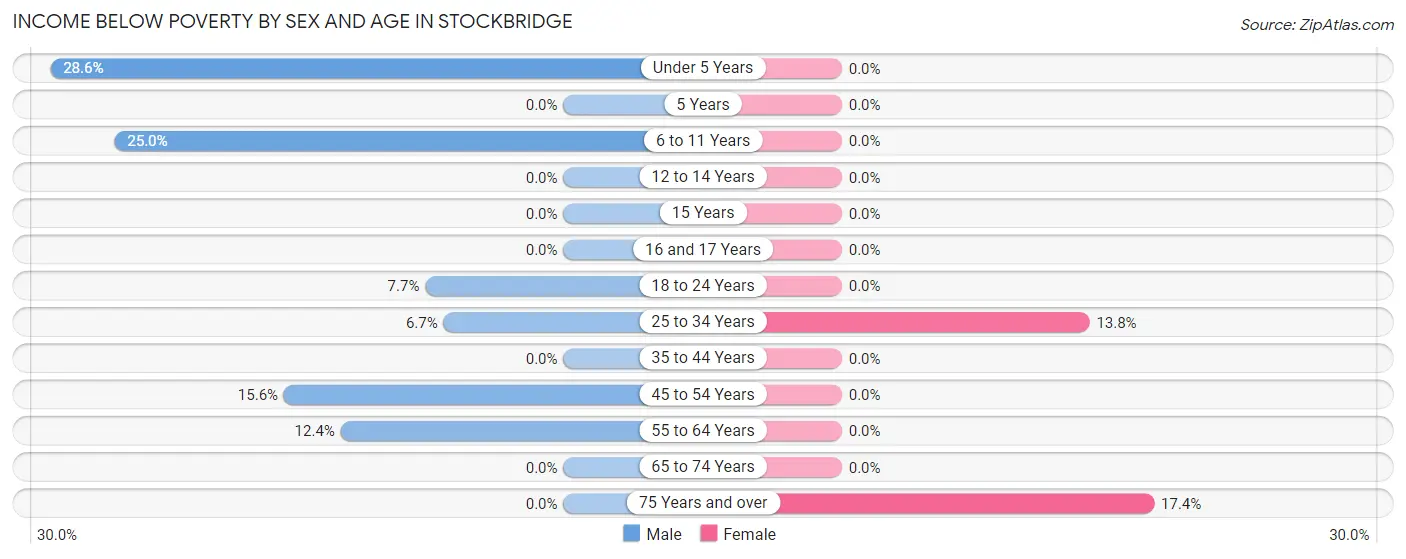
| Age Bracket | Male | Female |
| Under 5 Years | 2 (28.6%) | 0 (0.0%) |
| 5 Years | 0 (0.0%) | 0 (0.0%) |
| 6 to 11 Years | 4 (25.0%) | 0 (0.0%) |
| 12 to 14 Years | 0 (0.0%) | 0 (0.0%) |
| 15 Years | 0 (0.0%) | 0 (0.0%) |
| 16 and 17 Years | 0 (0.0%) | 0 (0.0%) |
| 18 to 24 Years | 1 (7.7%) | 0 (0.0%) |
| 25 to 34 Years | 2 (6.7%) | 4 (13.8%) |
| 35 to 44 Years | 0 (0.0%) | 0 (0.0%) |
| 45 to 54 Years | 7 (15.6%) | 0 (0.0%) |
| 55 to 64 Years | 15 (12.4%) | 0 (0.0%) |
| 65 to 74 Years | 0 (0.0%) | 0 (0.0%) |
| 75 Years and over | 0 (0.0%) | 4 (17.4%) |
| Total | 31 (8.0%) | 8 (1.7%) |
Income Above Poverty by Sex and Age in Stockbridge
According to the poverty statistics in Stockbridge, males aged 5 years and females aged under 5 years are the age groups that are most secure financially, with 100.0% of males and 100.0% of females in these age groups living above the poverty line.
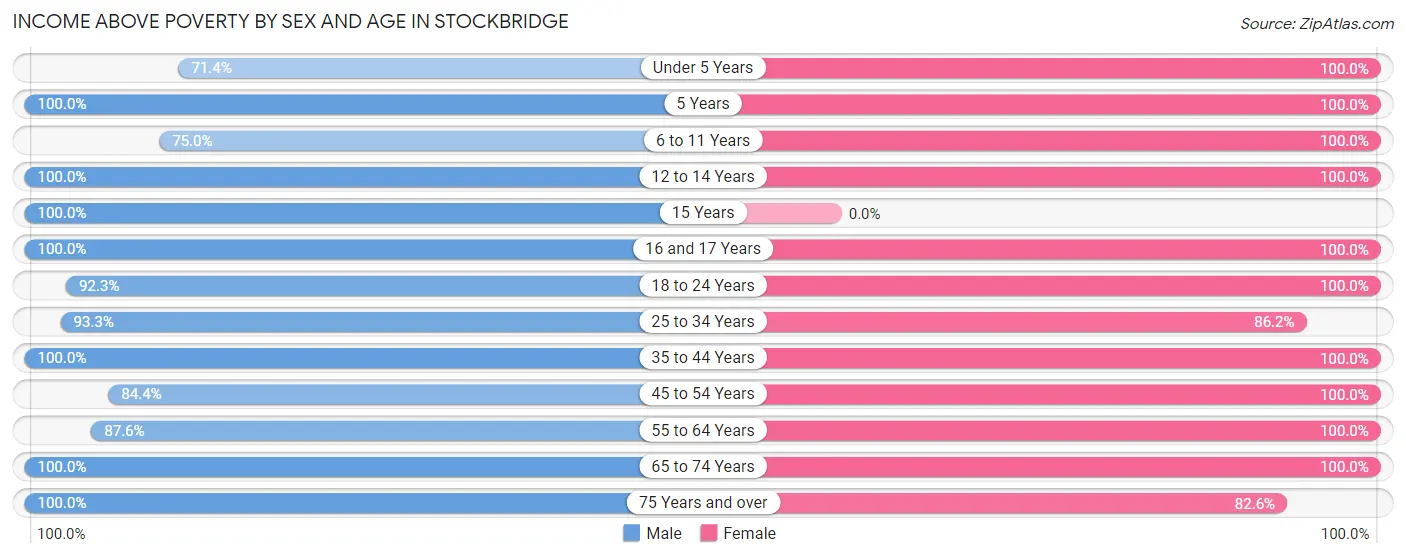
| Age Bracket | Male | Female |
| Under 5 Years | 5 (71.4%) | 9 (100.0%) |
| 5 Years | 8 (100.0%) | 2 (100.0%) |
| 6 to 11 Years | 12 (75.0%) | 11 (100.0%) |
| 12 to 14 Years | 2 (100.0%) | 8 (100.0%) |
| 15 Years | 5 (100.0%) | 0 (0.0%) |
| 16 and 17 Years | 3 (100.0%) | 3 (100.0%) |
| 18 to 24 Years | 12 (92.3%) | 39 (100.0%) |
| 25 to 34 Years | 28 (93.3%) | 25 (86.2%) |
| 35 to 44 Years | 45 (100.0%) | 29 (100.0%) |
| 45 to 54 Years | 38 (84.4%) | 64 (100.0%) |
| 55 to 64 Years | 106 (87.6%) | 46 (100.0%) |
| 65 to 74 Years | 66 (100.0%) | 205 (100.0%) |
| 75 Years and over | 26 (100.0%) | 19 (82.6%) |
| Total | 356 (92.0%) | 460 (98.3%) |
Income Below Poverty Among Married-Couple Families in Stockbridge
The poverty statistics for married-couple families in Stockbridge show that 1.3% or 2 of the total 158 families live below the poverty line. Families with 1 or 2 children have the highest poverty rate of 5.4%, comprising of 2 families. On the other hand, families with no children have the lowest poverty rate of 0.0%, which includes 0 families.
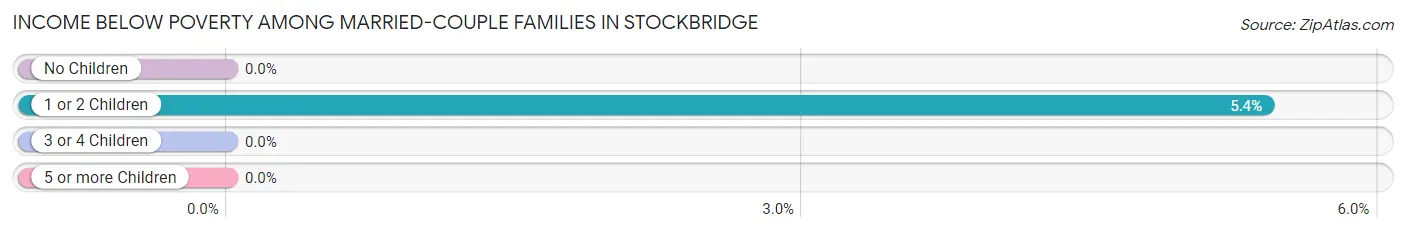
| Children | Above Poverty | Below Poverty |
| No Children | 119 (100.0%) | 0 (0.0%) |
| 1 or 2 Children | 35 (94.6%) | 2 (5.4%) |
| 3 or 4 Children | 2 (100.0%) | 0 (0.0%) |
| 5 or more Children | 0 (0.0%) | 0 (0.0%) |
| Total | 156 (98.7%) | 2 (1.3%) |
Income Below Poverty Among Single-Parent Households in Stockbridge
| Children | Single Father | Single Mother |
| No Children | 0 (0.0%) | 0 (0.0%) |
| 1 or 2 Children | 0 (0.0%) | 0 (0.0%) |
| 3 or 4 Children | 0 (0.0%) | 0 (0.0%) |
| 5 or more Children | 0 (0.0%) | 0 (0.0%) |
| Total | 0 (0.0%) | 0 (0.0%) |
Income Below Poverty Among Married-Couple vs Single-Parent Households in Stockbridge
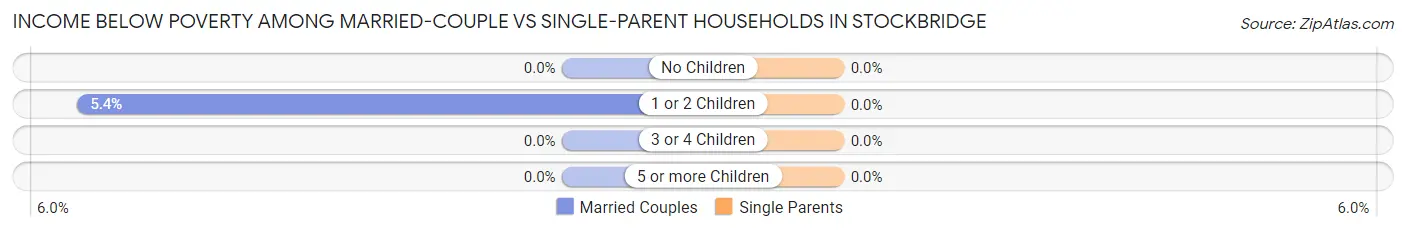
| Children | Married-Couple Families | Single-Parent Households |
| No Children | 0 (0.0%) | 0 (0.0%) |
| 1 or 2 Children | 2 (5.4%) | 0 (0.0%) |
| 3 or 4 Children | 0 (0.0%) | 0 (0.0%) |
| 5 or more Children | 0 (0.0%) | 0 (0.0%) |
| Total | 2 (1.3%) | 0 (0.0%) |
Race in Stockbridge
The most populous races in Stockbridge are White / Caucasian (842 | 98.3%), Hispanic or Latino (12 | 1.4%), and Native / Alaskan (6 | 0.7%).
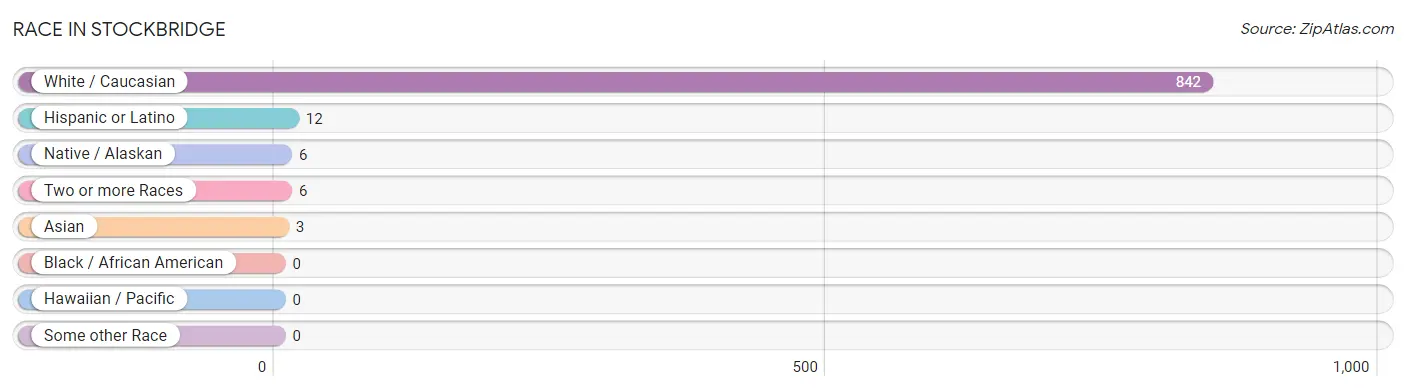
| Race | # Population | % Population |
| Asian | 3 | 0.4% |
| Black / African American | 0 | 0.0% |
| Hawaiian / Pacific | 0 | 0.0% |
| Hispanic or Latino | 12 | 1.4% |
| Native / Alaskan | 6 | 0.7% |
| White / Caucasian | 842 | 98.3% |
| Two or more Races | 6 | 0.7% |
| Some other Race | 0 | 0.0% |
| Total | 857 | 100.0% |
Ancestry in Stockbridge
The most populous ancestries reported in Stockbridge are German (542 | 63.2%), Irish (42 | 4.9%), Dutch (37 | 4.3%), French Canadian (36 | 4.2%), and American (29 | 3.4%), together accounting for 80.0% of all Stockbridge residents.
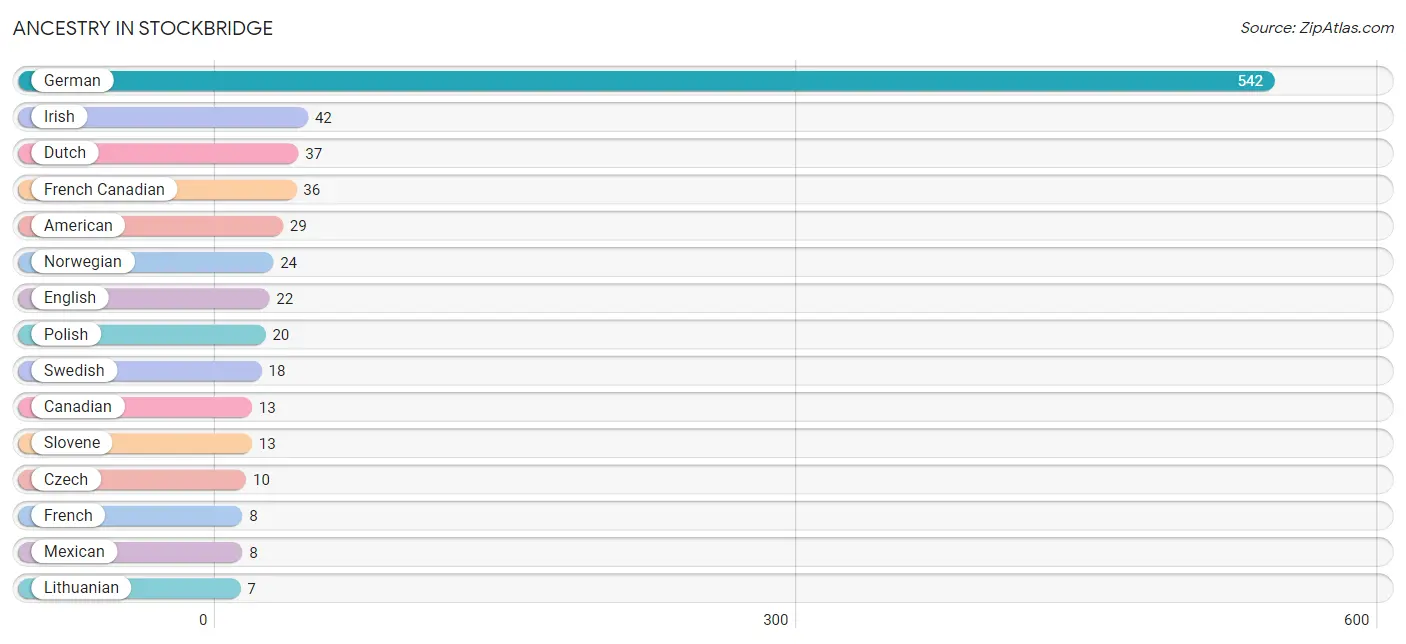
| Ancestry | # Population | % Population |
| American | 29 | 3.4% |
| Austrian | 3 | 0.4% |
| Belgian | 2 | 0.2% |
| British | 2 | 0.2% |
| Canadian | 13 | 1.5% |
| Central American | 4 | 0.5% |
| Central American Indian | 4 | 0.5% |
| Chippewa | 2 | 0.2% |
| Czech | 10 | 1.2% |
| Danish | 5 | 0.6% |
| Dutch | 37 | 4.3% |
| English | 22 | 2.6% |
| European | 4 | 0.5% |
| French | 8 | 0.9% |
| French Canadian | 36 | 4.2% |
| German | 542 | 63.2% |
| Guatemalan | 4 | 0.5% |
| Indian (Asian) | 3 | 0.4% |
| Irish | 42 | 4.9% |
| Iroquois | 1 | 0.1% |
| Italian | 2 | 0.2% |
| Lithuanian | 7 | 0.8% |
| Luxembourger | 2 | 0.2% |
| Mexican | 8 | 0.9% |
| Norwegian | 24 | 2.8% |
| Polish | 20 | 2.3% |
| Russian | 2 | 0.2% |
| Scottish | 5 | 0.6% |
| Slovene | 13 | 1.5% |
| Sri Lankan | 4 | 0.5% |
| Swedish | 18 | 2.1% |
| Swiss | 1 | 0.1% |
| Welsh | 2 | 0.2% | View All 33 Rows |
Immigrants in Stockbridge
The most numerous immigrant groups reported in Stockbridge came from Central America (4 | 0.5%), Guatemala (4 | 0.5%), Latin America (4 | 0.5%), Asia (3 | 0.4%), and China (3 | 0.4%), together accounting for 2.1% of all Stockbridge residents.
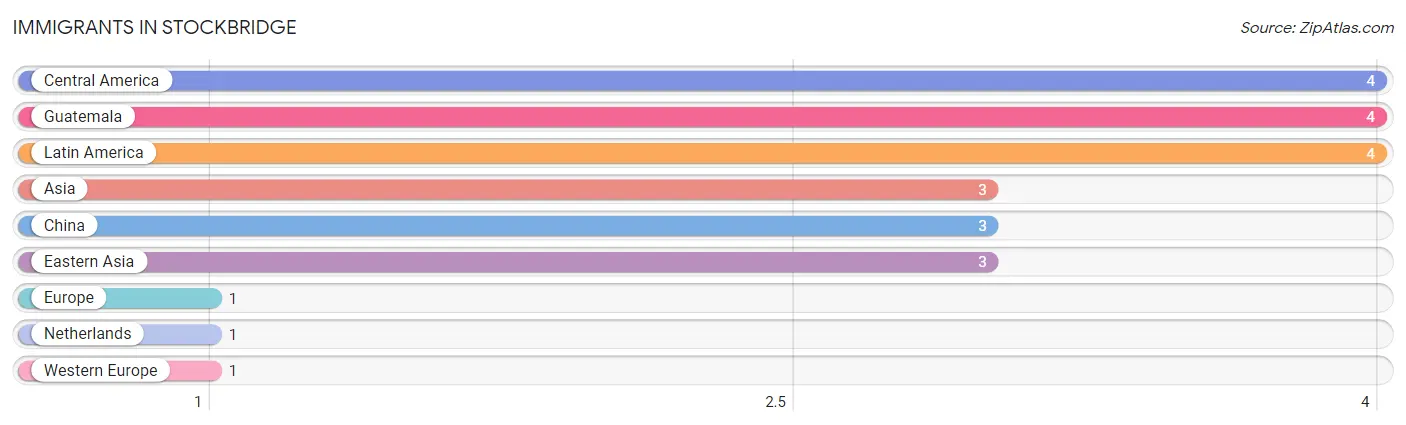
| Immigration Origin | # Population | % Population |
| Asia | 3 | 0.4% |
| Central America | 4 | 0.5% |
| China | 3 | 0.4% |
| Eastern Asia | 3 | 0.4% |
| Europe | 1 | 0.1% |
| Guatemala | 4 | 0.5% |
| Latin America | 4 | 0.5% |
| Netherlands | 1 | 0.1% |
| Western Europe | 1 | 0.1% | View All 9 Rows |
Sex and Age in Stockbridge
Sex and Age in Stockbridge
The most populous age groups in Stockbridge are 55 to 59 Years (68 | 17.6%) for men and 65 to 69 Years (196 | 41.7%) for women.
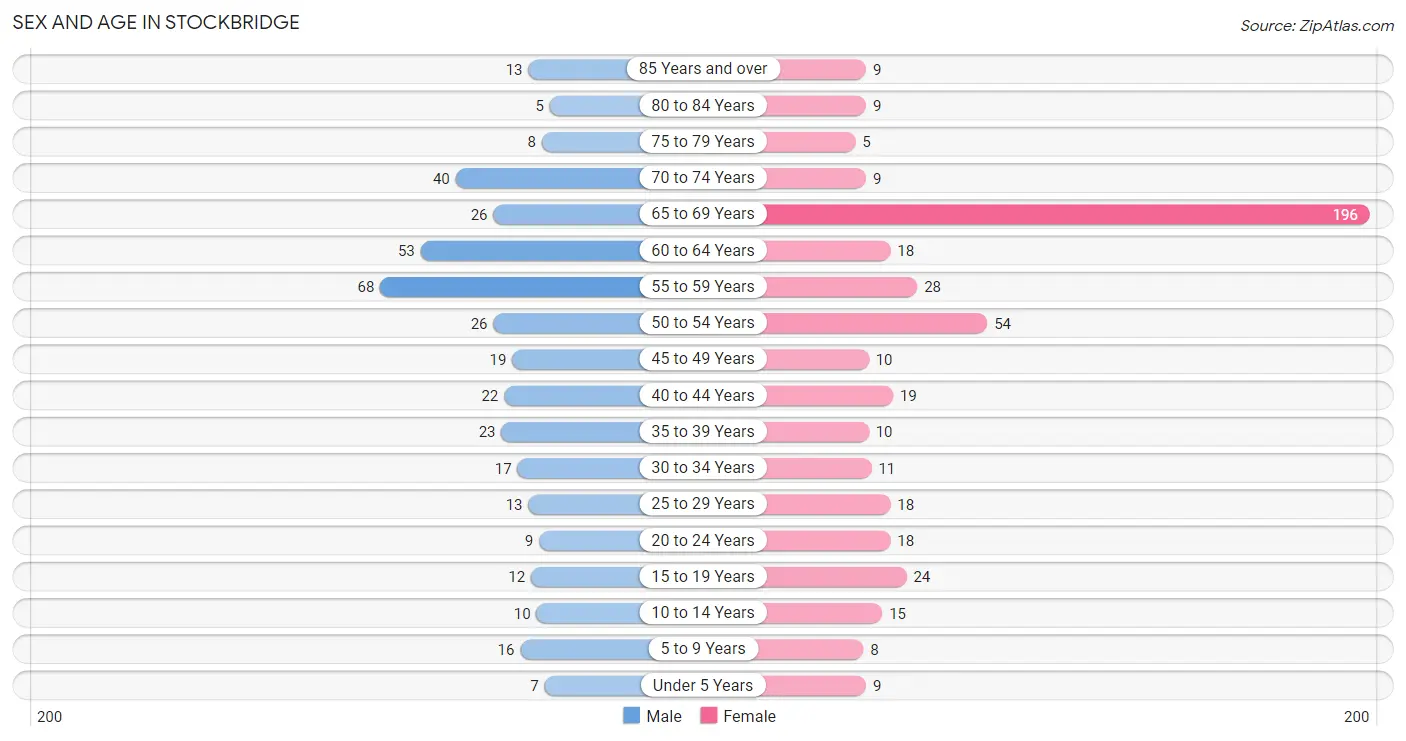
| Age Bracket | Male | Female |
| Under 5 Years | 7 (1.8%) | 9 (1.9%) |
| 5 to 9 Years | 16 (4.1%) | 8 (1.7%) |
| 10 to 14 Years | 10 (2.6%) | 15 (3.2%) |
| 15 to 19 Years | 12 (3.1%) | 24 (5.1%) |
| 20 to 24 Years | 9 (2.3%) | 18 (3.8%) |
| 25 to 29 Years | 13 (3.4%) | 18 (3.8%) |
| 30 to 34 Years | 17 (4.4%) | 11 (2.3%) |
| 35 to 39 Years | 23 (5.9%) | 10 (2.1%) |
| 40 to 44 Years | 22 (5.7%) | 19 (4.0%) |
| 45 to 49 Years | 19 (4.9%) | 10 (2.1%) |
| 50 to 54 Years | 26 (6.7%) | 54 (11.5%) |
| 55 to 59 Years | 68 (17.6%) | 28 (6.0%) |
| 60 to 64 Years | 53 (13.7%) | 18 (3.8%) |
| 65 to 69 Years | 26 (6.7%) | 196 (41.7%) |
| 70 to 74 Years | 40 (10.3%) | 9 (1.9%) |
| 75 to 79 Years | 8 (2.1%) | 5 (1.1%) |
| 80 to 84 Years | 5 (1.3%) | 9 (1.9%) |
| 85 Years and over | 13 (3.4%) | 9 (1.9%) |
| Total | 387 (100.0%) | 470 (100.0%) |
Families and Households in Stockbridge
Median Family Size in Stockbridge
The median family size in Stockbridge is 2.58 persons per family, with single female/mother families (9 | 5.2%) accounting for the largest median family size of 3.78 persons per family. On the other hand, married-couple families (158 | 91.9%) represent the smallest median family size with 2.51 persons per family.
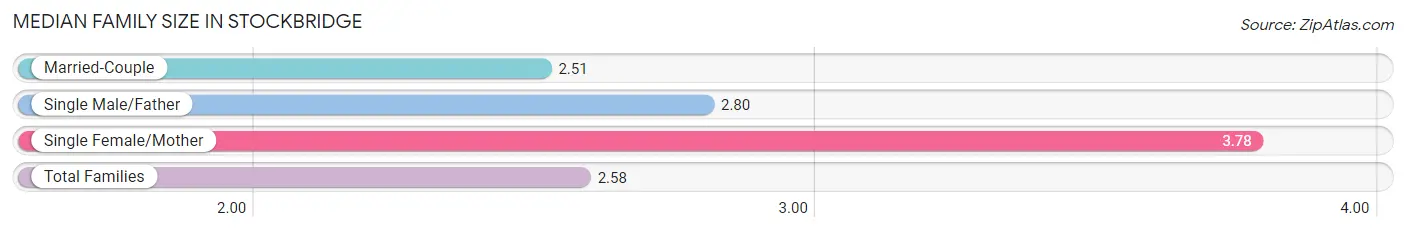
| Family Type | # Families | Family Size |
| Married-Couple | 158 (91.9%) | 2.51 |
| Single Male/Father | 5 (2.9%) | 2.80 |
| Single Female/Mother | 9 (5.2%) | 3.78 |
| Total Families | 172 (100.0%) | 2.58 |
Median Household Size in Stockbridge
The median household size in Stockbridge is 1.68 persons per household, with single female/mother households (9 | 1.8%) accounting for the largest median household size of 3.89 persons per household. non-family households (339 | 66.3%) represent the smallest median household size with 1.20 persons per household.
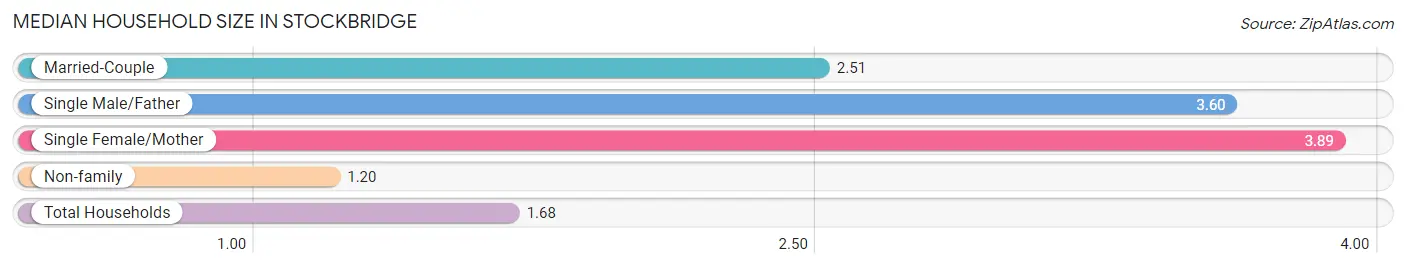
| Household Type | # Households | Household Size |
| Married-Couple | 158 (30.9%) | 2.51 |
| Single Male/Father | 5 (1.0%) | 3.60 |
| Single Female/Mother | 9 (1.8%) | 3.89 |
| Non-family | 339 (66.3%) | 1.20 |
| Total Households | 511 (100.0%) | 1.68 |
Household Size by Marriage Status in Stockbridge
Out of a total of 511 households in Stockbridge, 172 (33.7%) are family households, while 339 (66.3%) are nonfamily households. The most numerous type of family households are 2-person households, comprising 103, and the most common type of nonfamily households are 2-person households, comprising 187.
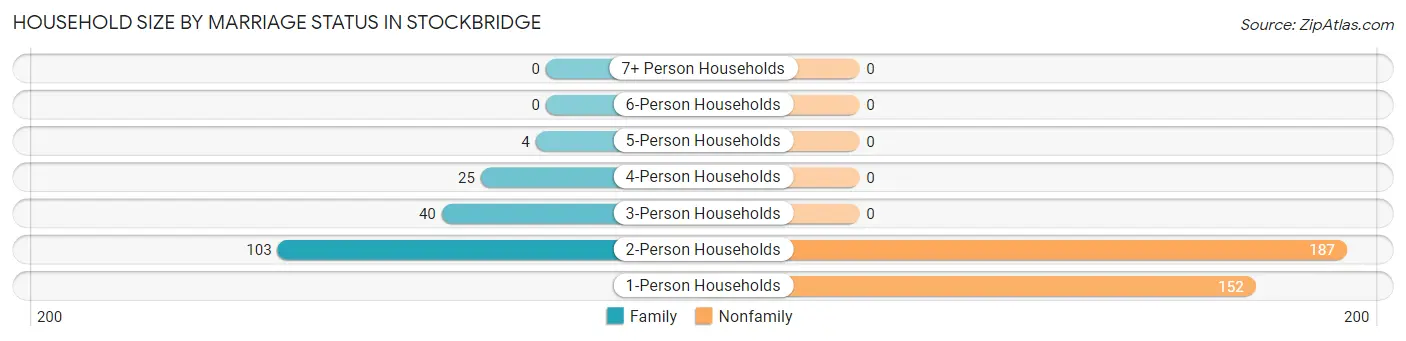
| Household Size | Family Households | Nonfamily Households |
| 1-Person Households | - | 152 (29.7%) |
| 2-Person Households | 103 (20.2%) | 187 (36.6%) |
| 3-Person Households | 40 (7.8%) | 0 (0.0%) |
| 4-Person Households | 25 (4.9%) | 0 (0.0%) |
| 5-Person Households | 4 (0.8%) | 0 (0.0%) |
| 6-Person Households | 0 (0.0%) | 0 (0.0%) |
| 7+ Person Households | 0 (0.0%) | 0 (0.0%) |
| Total | 172 (33.7%) | 339 (66.3%) |
Female Fertility in Stockbridge
Fertility by Age in Stockbridge
Average fertility rate in Stockbridge is 54.0 births per 1,000 women. Women in the age bracket of 20 to 34 years have the highest fertility rate with 170.0 births per 1,000 women. Women in the age bracket of 20 to 34 years acount for 100.0% of all women with births.
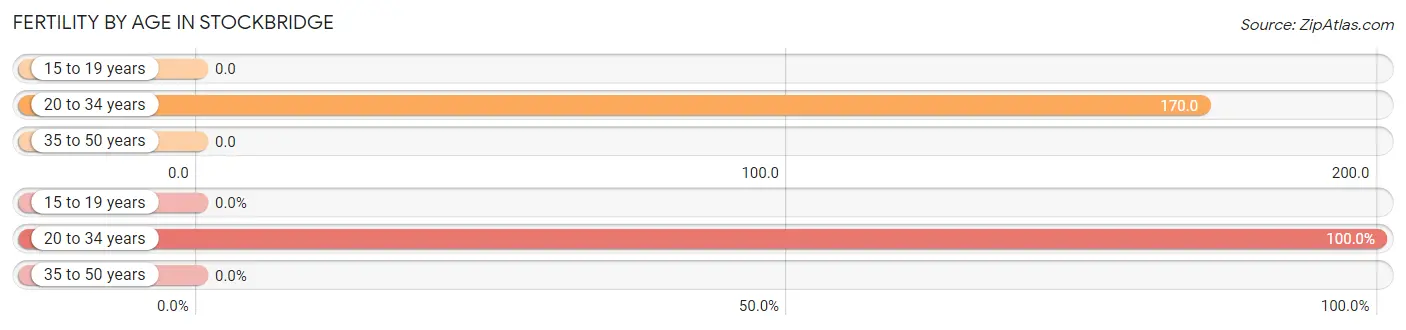
| Age Bracket | Women with Births | Births / 1,000 Women |
| 15 to 19 years | 0 (0.0%) | 0.0 |
| 20 to 34 years | 8 (100.0%) | 170.0 |
| 35 to 50 years | 0 (0.0%) | 0.0 |
| Total | 8 (100.0%) | 54.0 |
Fertility by Age by Marriage Status in Stockbridge
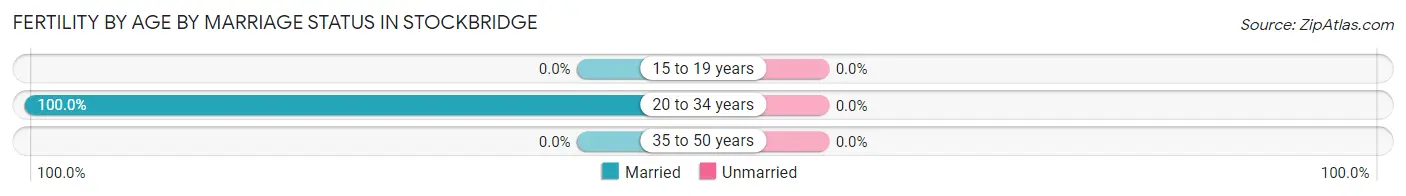
| Age Bracket | Married | Unmarried |
| 15 to 19 years | 0 (0.0%) | 0 (0.0%) |
| 20 to 34 years | 8 (100.0%) | 0 (0.0%) |
| 35 to 50 years | 0 (0.0%) | 0 (0.0%) |
| Total | 8 (100.0%) | 0 (0.0%) |
Fertility by Education in Stockbridge
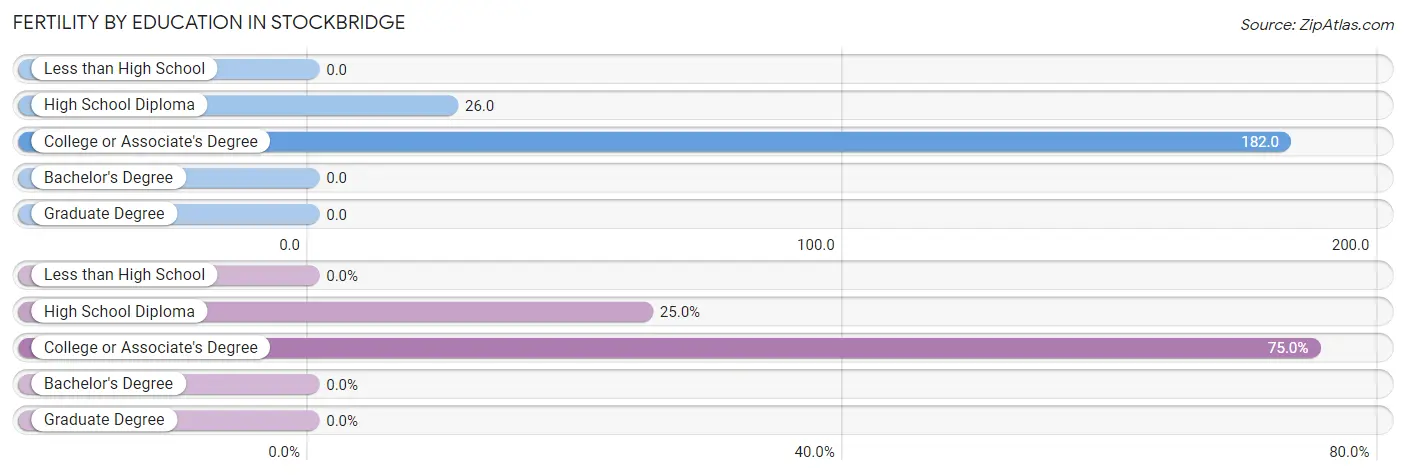
| Educational Attainment | Women with Births | Births / 1,000 Women |
| Less than High School | 0 (0.0%) | 0.0 |
| High School Diploma | 2 (25.0%) | 26.0 |
| College or Associate's Degree | 6 (75.0%) | 182.0 |
| Bachelor's Degree | 0 (0.0%) | 0.0 |
| Graduate Degree | 0 (0.0%) | 0.0 |
| Total | 8 (100.0%) | 54.0 |
Fertility by Education by Marriage Status in Stockbridge
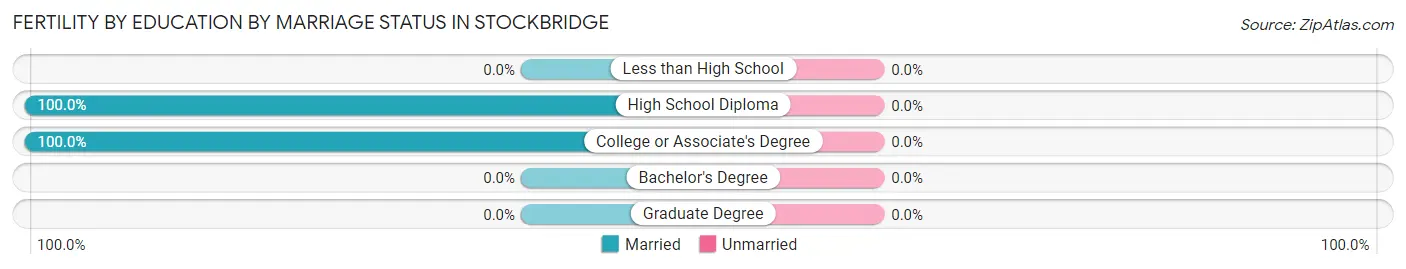
| Educational Attainment | Married | Unmarried |
| Less than High School | 0 (0.0%) | 0 (0.0%) |
| High School Diploma | 2 (100.0%) | 0 (0.0%) |
| College or Associate's Degree | 6 (100.0%) | 0 (0.0%) |
| Bachelor's Degree | 0 (0.0%) | 0 (0.0%) |
| Graduate Degree | 0 (0.0%) | 0 (0.0%) |
| Total | 8 (100.0%) | 0 (0.0%) |
Employment Characteristics in Stockbridge
Employment by Class of Employer in Stockbridge
Among the 426 employed individuals in Stockbridge, private company employees (276 | 64.8%), self-employed (not incorporated) (62 | 14.5%), and local government employees (44 | 10.3%) make up the most common classes of employment.
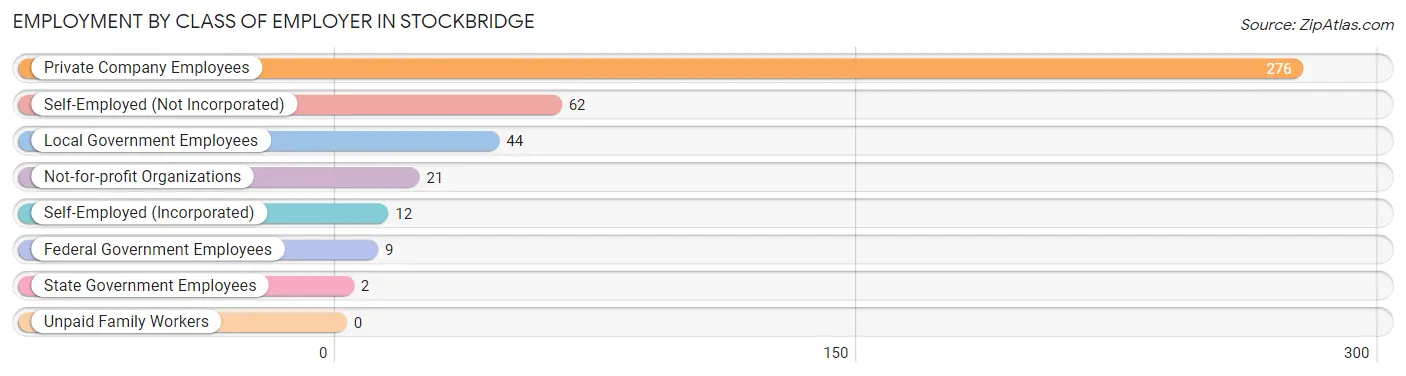
| Employer Class | # Employees | % Employees |
| Private Company Employees | 276 | 64.8% |
| Self-Employed (Incorporated) | 12 | 2.8% |
| Self-Employed (Not Incorporated) | 62 | 14.5% |
| Not-for-profit Organizations | 21 | 4.9% |
| Local Government Employees | 44 | 10.3% |
| State Government Employees | 2 | 0.5% |
| Federal Government Employees | 9 | 2.1% |
| Unpaid Family Workers | 0 | 0.0% |
| Total | 426 | 100.0% |
Employment Status by Age in Stockbridge
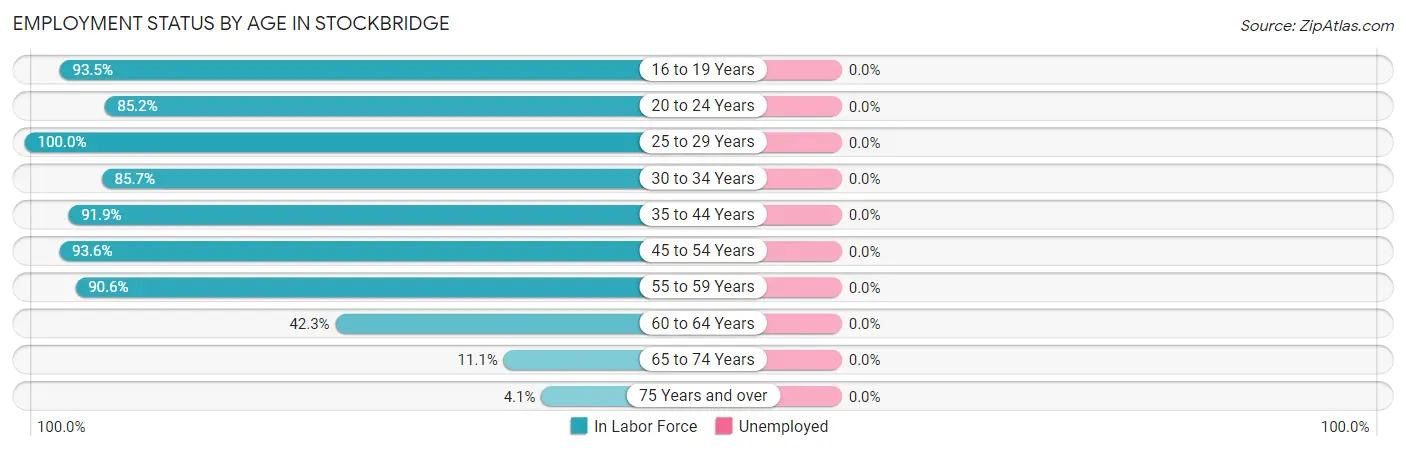
| Age Bracket | In Labor Force | Unemployed |
| 16 to 19 Years | 29 (93.5%) | 0 (0.0%) |
| 20 to 24 Years | 23 (85.2%) | 0 (0.0%) |
| 25 to 29 Years | 31 (100.0%) | 0 (0.0%) |
| 30 to 34 Years | 24 (85.7%) | 0 (0.0%) |
| 35 to 44 Years | 68 (91.9%) | 0 (0.0%) |
| 45 to 54 Years | 102 (93.6%) | 0 (0.0%) |
| 55 to 59 Years | 87 (90.6%) | 0 (0.0%) |
| 60 to 64 Years | 30 (42.3%) | 0 (0.0%) |
| 65 to 74 Years | 30 (11.1%) | 0 (0.0%) |
| 75 Years and over | 2 (4.1%) | 0 (0.0%) |
| Total | 426 (54.1%) | 0 (0.0%) |
Employment Status by Educational Attainment in Stockbridge
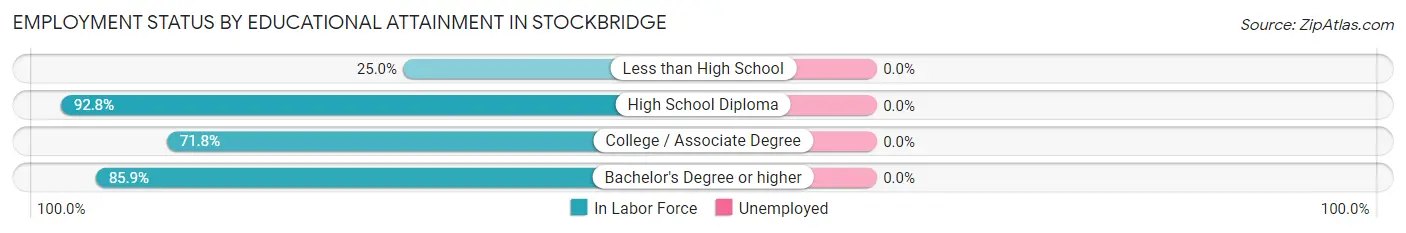
| Educational Attainment | In Labor Force | Unemployed |
| Less than High School | 3 (25.0%) | 0 (0.0%) |
| High School Diploma | 194 (92.8%) | 0 (0.0%) |
| College / Associate Degree | 84 (71.8%) | 0 (0.0%) |
| Bachelor's Degree or higher | 61 (85.9%) | 0 (0.0%) |
| Total | 342 (83.6%) | 0 (0.0%) |
Employment Occupations by Sex in Stockbridge
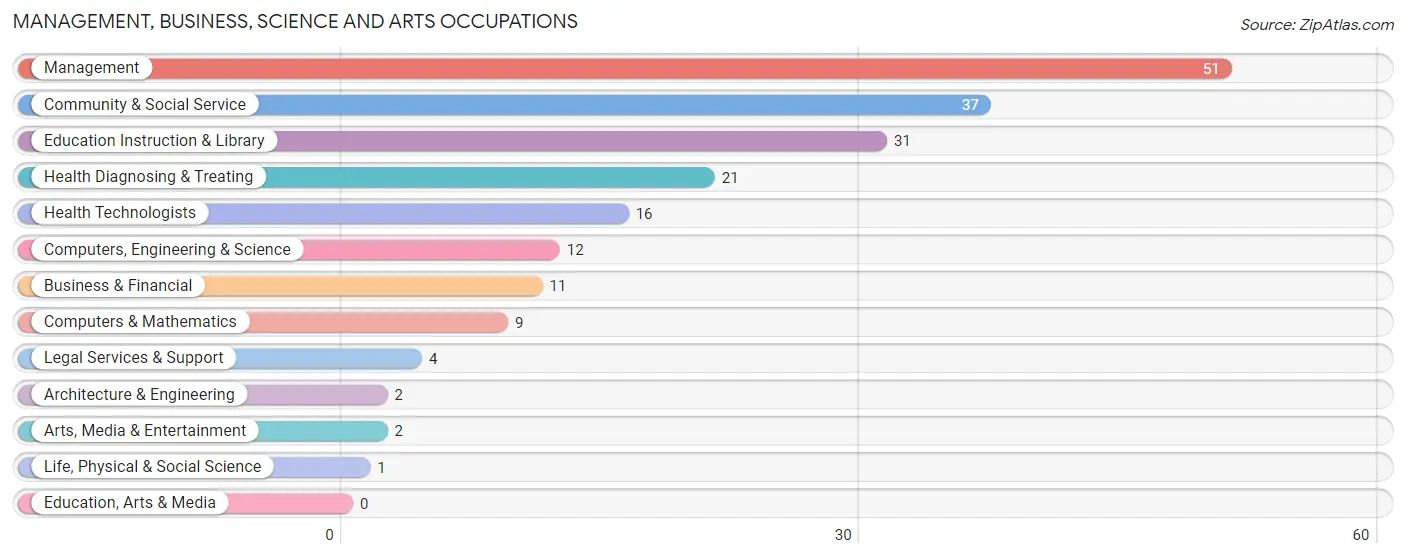
Management, Business, Science and Arts Occupations
The most common Management, Business, Science and Arts occupations in Stockbridge are Management (51 | 12.0%), Community & Social Service (37 | 8.7%), Education Instruction & Library (31 | 7.3%), Health Diagnosing & Treating (21 | 4.9%), and Health Technologists (16 | 3.8%).
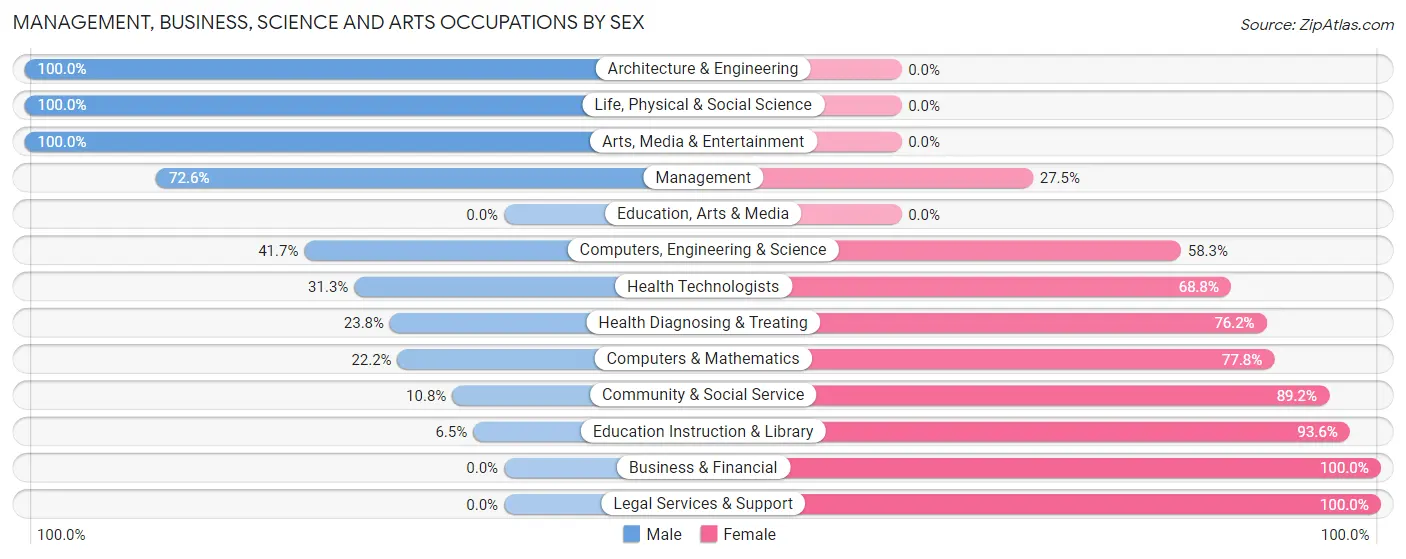
Management, Business, Science and Arts Occupations by Sex
Within the Management, Business, Science and Arts occupations in Stockbridge, the most male-oriented occupations are Architecture & Engineering (100.0%), Life, Physical & Social Science (100.0%), and Arts, Media & Entertainment (100.0%), while the most female-oriented occupations are Business & Financial (100.0%), Legal Services & Support (100.0%), and Education Instruction & Library (93.5%).
| Occupation | Male | Female |
| Management | 37 (72.6%) | 14 (27.5%) |
| Business & Financial | 0 (0.0%) | 11 (100.0%) |
| Computers, Engineering & Science | 5 (41.7%) | 7 (58.3%) |
| Computers & Mathematics | 2 (22.2%) | 7 (77.8%) |
| Architecture & Engineering | 2 (100.0%) | 0 (0.0%) |
| Life, Physical & Social Science | 1 (100.0%) | 0 (0.0%) |
| Community & Social Service | 4 (10.8%) | 33 (89.2%) |
| Education, Arts & Media | 0 (0.0%) | 0 (0.0%) |
| Legal Services & Support | 0 (0.0%) | 4 (100.0%) |
| Education Instruction & Library | 2 (6.5%) | 29 (93.5%) |
| Arts, Media & Entertainment | 2 (100.0%) | 0 (0.0%) |
| Health Diagnosing & Treating | 5 (23.8%) | 16 (76.2%) |
| Health Technologists | 5 (31.2%) | 11 (68.8%) |
| Total (Category) | 51 (38.6%) | 81 (61.4%) |
| Total (Overall) | 219 (51.4%) | 207 (48.6%) |
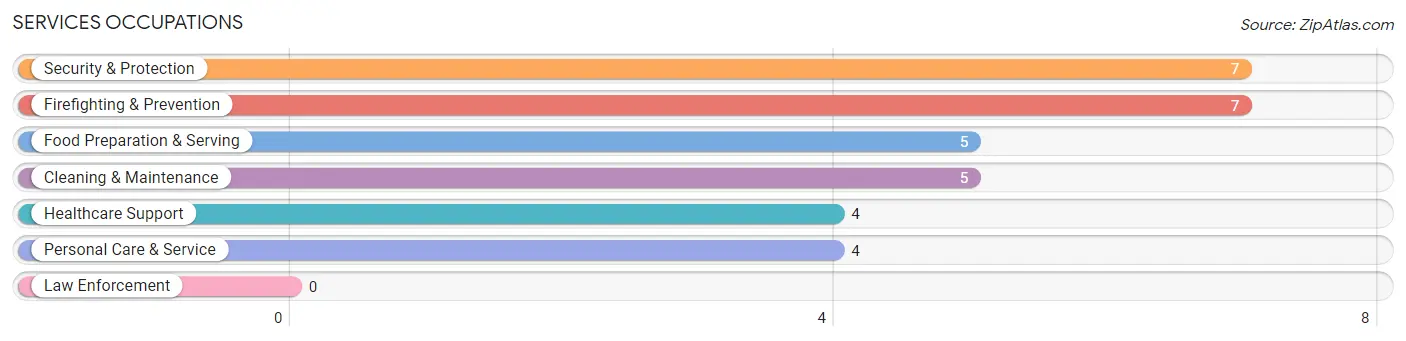
Services Occupations
The most common Services occupations in Stockbridge are Security & Protection (7 | 1.6%), Firefighting & Prevention (7 | 1.6%), Food Preparation & Serving (5 | 1.2%), Cleaning & Maintenance (5 | 1.2%), and Healthcare Support (4 | 0.9%).
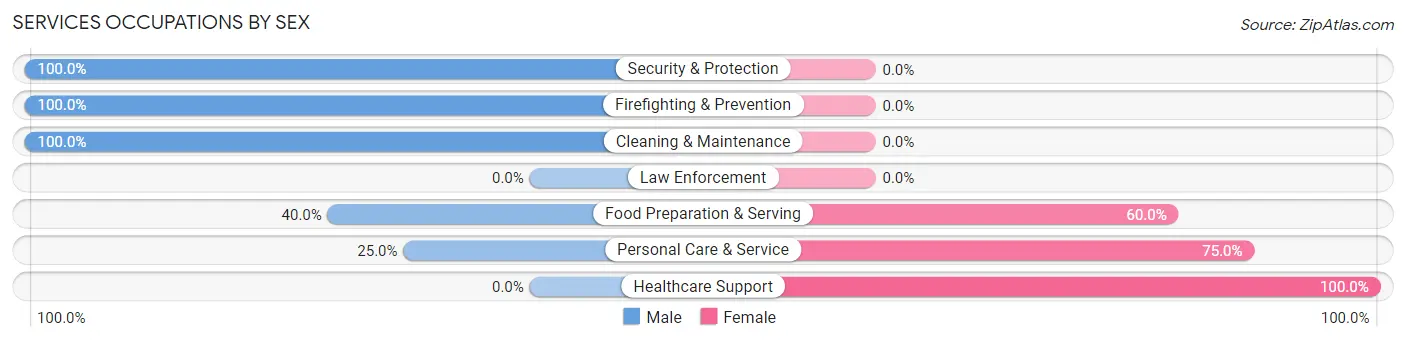
Services Occupations by Sex
Within the Services occupations in Stockbridge, the most male-oriented occupations are Security & Protection (100.0%), Firefighting & Prevention (100.0%), and Cleaning & Maintenance (100.0%), while the most female-oriented occupations are Healthcare Support (100.0%), Personal Care & Service (75.0%), and Food Preparation & Serving (60.0%).
| Occupation | Male | Female |
| Healthcare Support | 0 (0.0%) | 4 (100.0%) |
| Security & Protection | 7 (100.0%) | 0 (0.0%) |
| Firefighting & Prevention | 7 (100.0%) | 0 (0.0%) |
| Law Enforcement | 0 (0.0%) | 0 (0.0%) |
| Food Preparation & Serving | 2 (40.0%) | 3 (60.0%) |
| Cleaning & Maintenance | 5 (100.0%) | 0 (0.0%) |
| Personal Care & Service | 1 (25.0%) | 3 (75.0%) |
| Total (Category) | 15 (60.0%) | 10 (40.0%) |
| Total (Overall) | 219 (51.4%) | 207 (48.6%) |
Sales and Office Occupations
The most common Sales and Office occupations in Stockbridge are Sales & Related (49 | 11.5%), and Office & Administration (48 | 11.3%).
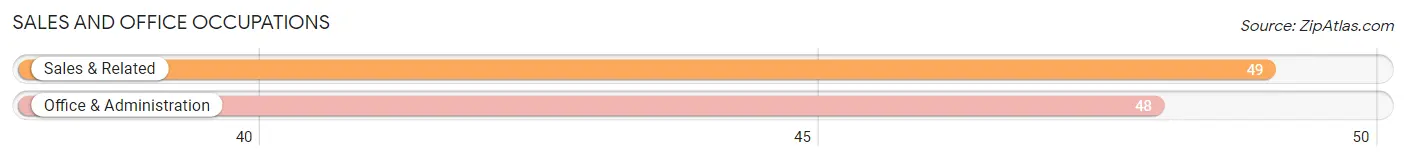
Sales and Office Occupations by Sex
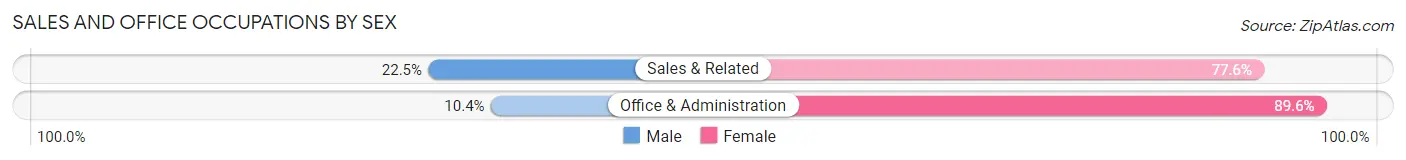
| Occupation | Male | Female |
| Sales & Related | 11 (22.5%) | 38 (77.5%) |
| Office & Administration | 5 (10.4%) | 43 (89.6%) |
| Total (Category) | 16 (16.5%) | 81 (83.5%) |
| Total (Overall) | 219 (51.4%) | 207 (48.6%) |
Natural Resources, Construction and Maintenance Occupations
The most common Natural Resources, Construction and Maintenance occupations in Stockbridge are Construction & Extraction (77 | 18.1%), Farming, Fishing & Forestry (13 | 3.0%), and Installation, Maintenance & Repair (11 | 2.6%).
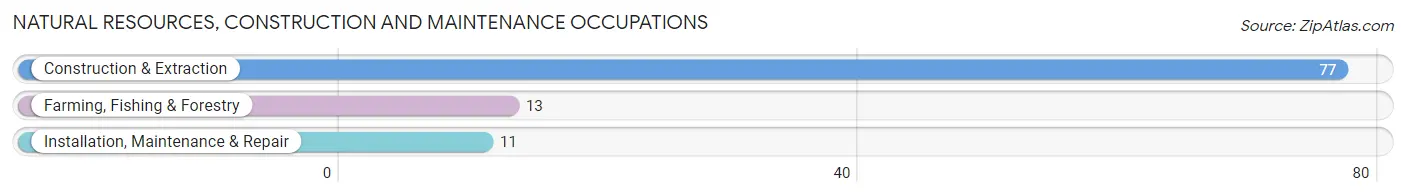
Natural Resources, Construction and Maintenance Occupations by Sex
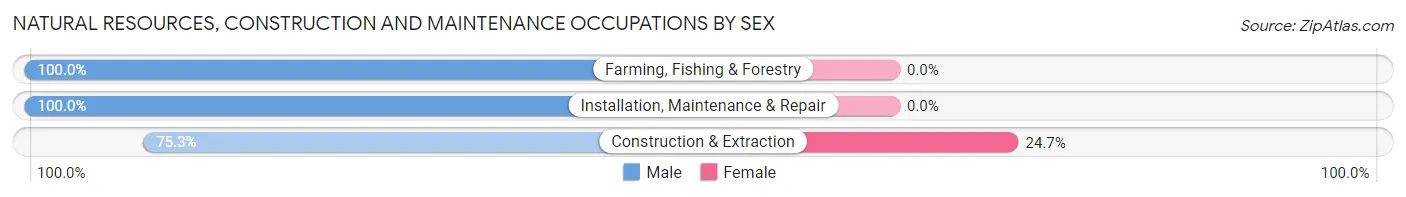
| Occupation | Male | Female |
| Farming, Fishing & Forestry | 13 (100.0%) | 0 (0.0%) |
| Construction & Extraction | 58 (75.3%) | 19 (24.7%) |
| Installation, Maintenance & Repair | 11 (100.0%) | 0 (0.0%) |
| Total (Category) | 82 (81.2%) | 19 (18.8%) |
| Total (Overall) | 219 (51.4%) | 207 (48.6%) |
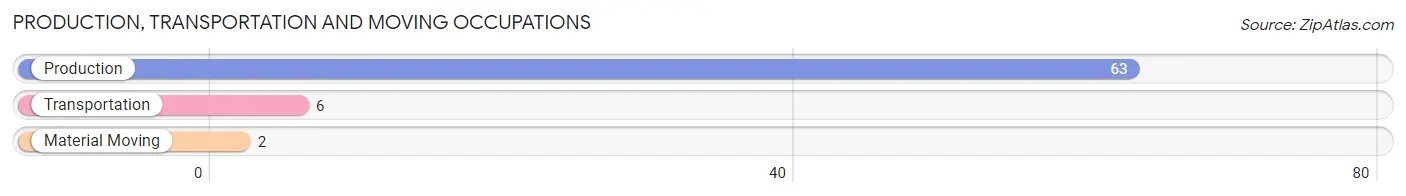
Production, Transportation and Moving Occupations
The most common Production, Transportation and Moving occupations in Stockbridge are Production (63 | 14.8%), Transportation (6 | 1.4%), and Material Moving (2 | 0.5%).
Production, Transportation and Moving Occupations by Sex
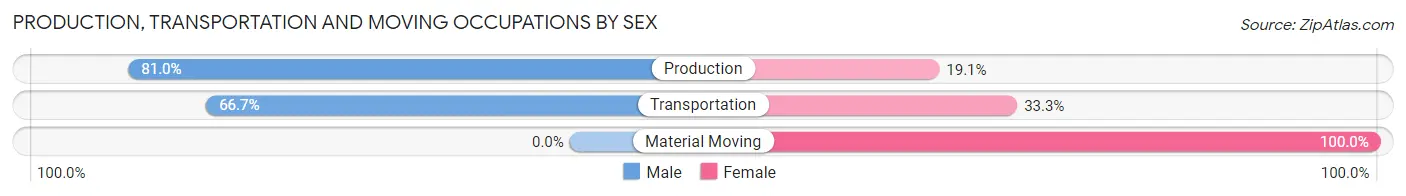
| Occupation | Male | Female |
| Production | 51 (80.9%) | 12 (19.1%) |
| Transportation | 4 (66.7%) | 2 (33.3%) |
| Material Moving | 0 (0.0%) | 2 (100.0%) |
| Total (Category) | 55 (77.5%) | 16 (22.5%) |
| Total (Overall) | 219 (51.4%) | 207 (48.6%) |
Employment Industries by Sex in Stockbridge
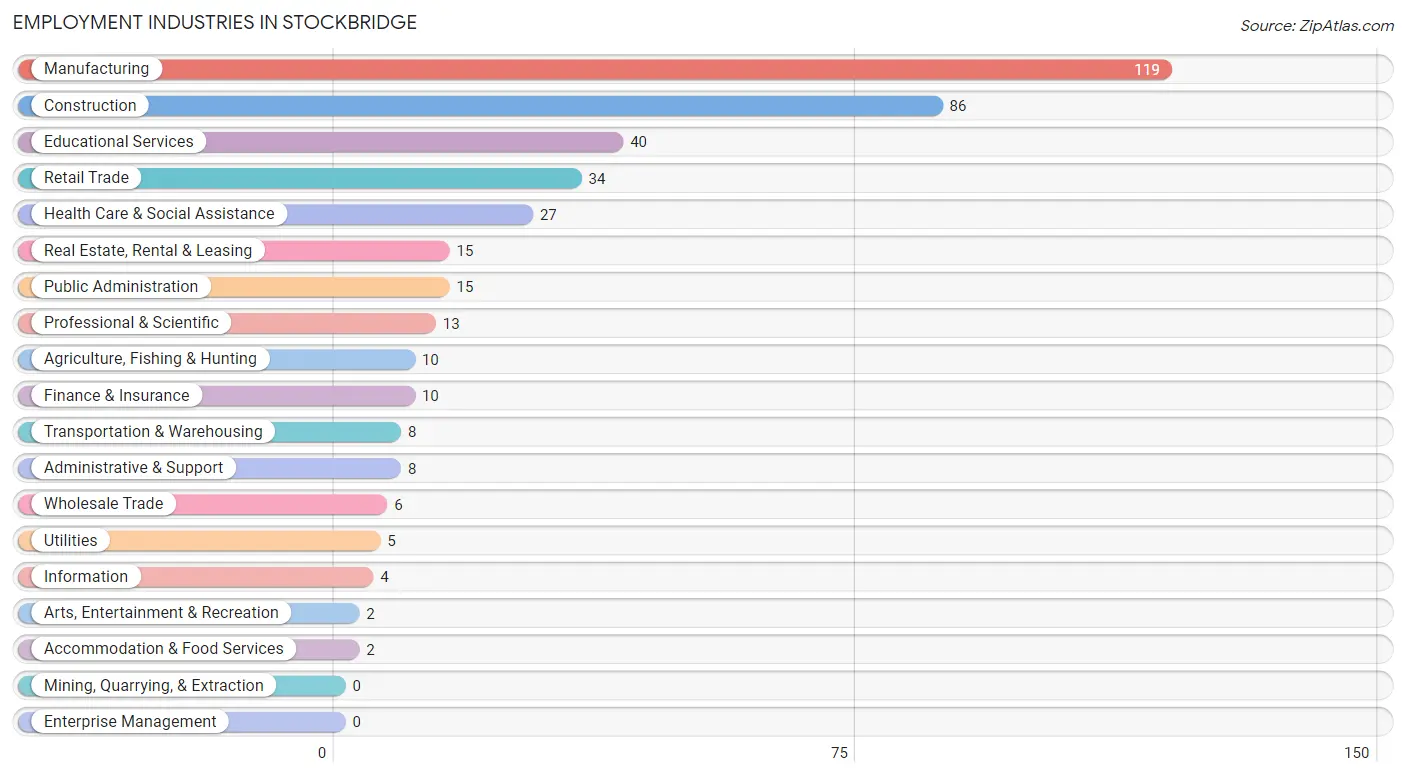
Employment Industries in Stockbridge
The major employment industries in Stockbridge include Manufacturing (119 | 27.9%), Construction (86 | 20.2%), Educational Services (40 | 9.4%), Retail Trade (34 | 8.0%), and Health Care & Social Assistance (27 | 6.3%).
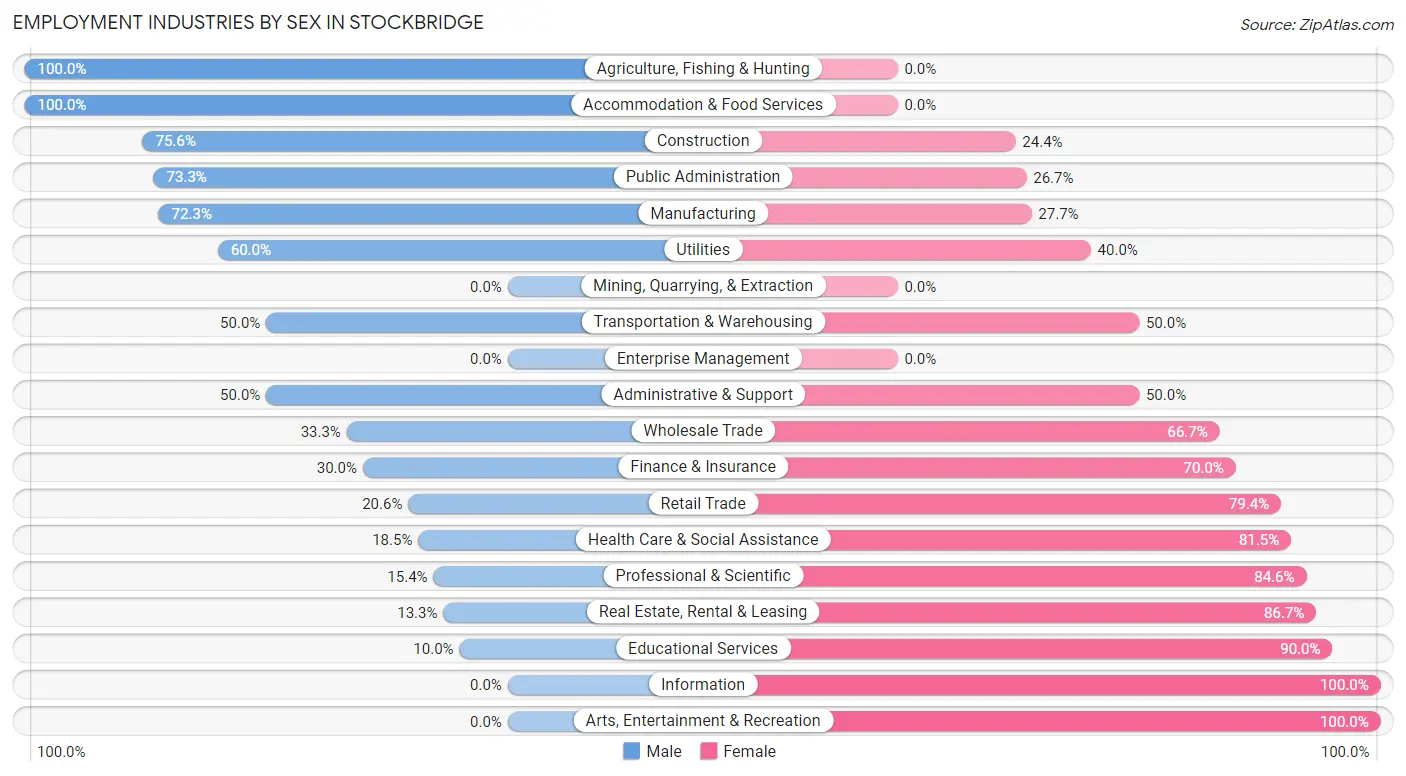
Employment Industries by Sex in Stockbridge
The Stockbridge industries that see more men than women are Agriculture, Fishing & Hunting (100.0%), Accommodation & Food Services (100.0%), and Construction (75.6%), whereas the industries that tend to have a higher number of women are Information (100.0%), Arts, Entertainment & Recreation (100.0%), and Educational Services (90.0%).
| Industry | Male | Female |
| Agriculture, Fishing & Hunting | 10 (100.0%) | 0 (0.0%) |
| Mining, Quarrying, & Extraction | 0 (0.0%) | 0 (0.0%) |
| Construction | 65 (75.6%) | 21 (24.4%) |
| Manufacturing | 86 (72.3%) | 33 (27.7%) |
| Wholesale Trade | 2 (33.3%) | 4 (66.7%) |
| Retail Trade | 7 (20.6%) | 27 (79.4%) |
| Transportation & Warehousing | 4 (50.0%) | 4 (50.0%) |
| Utilities | 3 (60.0%) | 2 (40.0%) |
| Information | 0 (0.0%) | 4 (100.0%) |
| Finance & Insurance | 3 (30.0%) | 7 (70.0%) |
| Real Estate, Rental & Leasing | 2 (13.3%) | 13 (86.7%) |
| Professional & Scientific | 2 (15.4%) | 11 (84.6%) |
| Enterprise Management | 0 (0.0%) | 0 (0.0%) |
| Administrative & Support | 4 (50.0%) | 4 (50.0%) |
| Educational Services | 4 (10.0%) | 36 (90.0%) |
| Health Care & Social Assistance | 5 (18.5%) | 22 (81.5%) |
| Arts, Entertainment & Recreation | 0 (0.0%) | 2 (100.0%) |
| Accommodation & Food Services | 2 (100.0%) | 0 (0.0%) |
| Public Administration | 11 (73.3%) | 4 (26.7%) |
| Total | 219 (51.4%) | 207 (48.6%) |
Education in Stockbridge
School Enrollment in Stockbridge
The most common levels of schooling among the 88 students in Stockbridge are elementary school (19 | 21.6%), middle school (18 | 20.4%), and graduate / professional (16 | 18.2%).
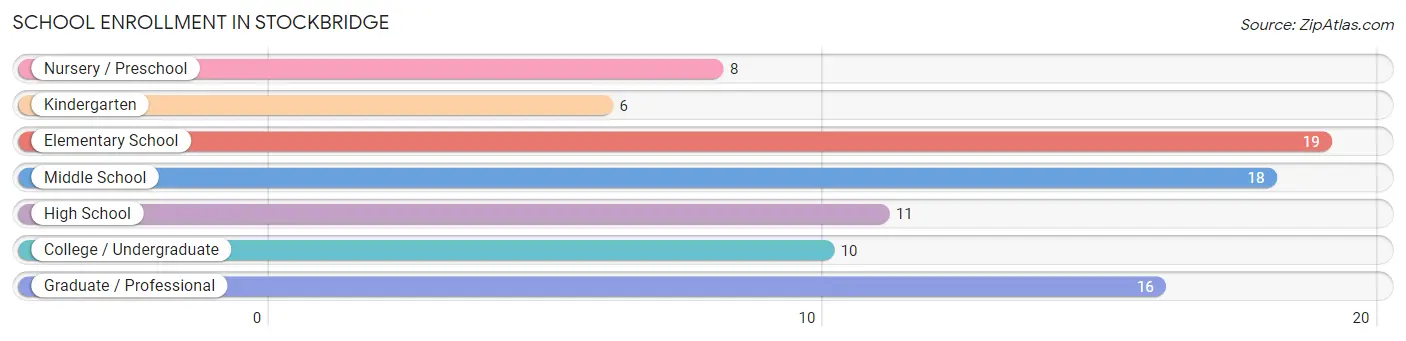
| School Level | # Students | % Students |
| Nursery / Preschool | 8 | 9.1% |
| Kindergarten | 6 | 6.8% |
| Elementary School | 19 | 21.6% |
| Middle School | 18 | 20.4% |
| High School | 11 | 12.5% |
| College / Undergraduate | 10 | 11.4% |
| Graduate / Professional | 16 | 18.2% |
| Total | 88 | 100.0% |
School Enrollment by Age by Funding Source in Stockbridge
Out of a total of 88 students who are enrolled in schools in Stockbridge, 7 (8.0%) attend a private institution, while the remaining 81 (92.0%) are enrolled in public schools. The age group of 35 years and over has the highest likelihood of being enrolled in private schools, with 6 (60.0% in the age bracket) enrolled. Conversely, the age group of 5 to 9 year old has the lowest likelihood of being enrolled in a private school, with 24 (100.0% in the age bracket) attending a public institution.
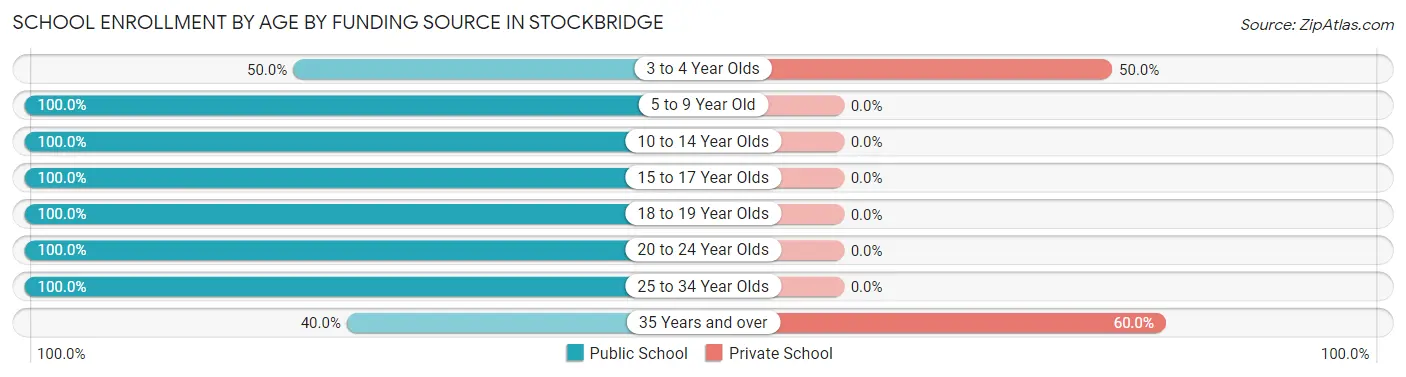
| Age Bracket | Public School | Private School |
| 3 to 4 Year Olds | 1 (50.0%) | 1 (50.0%) |
| 5 to 9 Year Old | 24 (100.0%) | 0 (0.0%) |
| 10 to 14 Year Olds | 25 (100.0%) | 0 (0.0%) |
| 15 to 17 Year Olds | 11 (100.0%) | 0 (0.0%) |
| 18 to 19 Year Olds | 2 (100.0%) | 0 (0.0%) |
| 20 to 24 Year Olds | 10 (100.0%) | 0 (0.0%) |
| 25 to 34 Year Olds | 4 (100.0%) | 0 (0.0%) |
| 35 Years and over | 4 (40.0%) | 6 (60.0%) |
| Total | 81 (92.0%) | 7 (8.0%) |
Educational Attainment by Field of Study in Stockbridge
Education (38 | 26.0%), science & technology (32 | 21.9%), business (23 | 15.8%), arts & humanities (18 | 12.3%), and computers & mathematics (8 | 5.5%) are the most common fields of study among 146 individuals in Stockbridge who have obtained a bachelor's degree or higher.
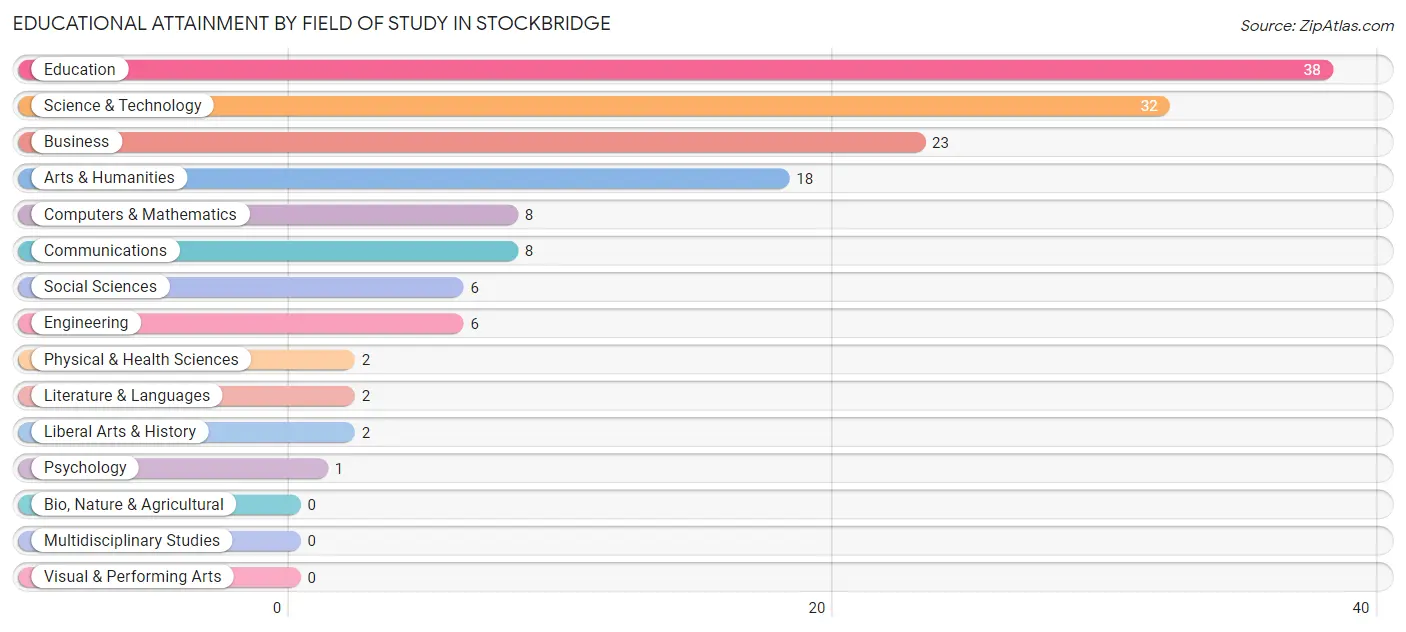
| Field of Study | # Graduates | % Graduates |
| Computers & Mathematics | 8 | 5.5% |
| Bio, Nature & Agricultural | 0 | 0.0% |
| Physical & Health Sciences | 2 | 1.4% |
| Psychology | 1 | 0.7% |
| Social Sciences | 6 | 4.1% |
| Engineering | 6 | 4.1% |
| Multidisciplinary Studies | 0 | 0.0% |
| Science & Technology | 32 | 21.9% |
| Business | 23 | 15.8% |
| Education | 38 | 26.0% |
| Literature & Languages | 2 | 1.4% |
| Liberal Arts & History | 2 | 1.4% |
| Visual & Performing Arts | 0 | 0.0% |
| Communications | 8 | 5.5% |
| Arts & Humanities | 18 | 12.3% |
| Total | 146 | 100.0% |
Transportation & Commute in Stockbridge
Vehicle Availability by Sex in Stockbridge
The most prevalent vehicle ownership categories in Stockbridge are males with 2 vehicles (84, accounting for 38.4%) and females with 2 vehicles (51, making up 40.6%).
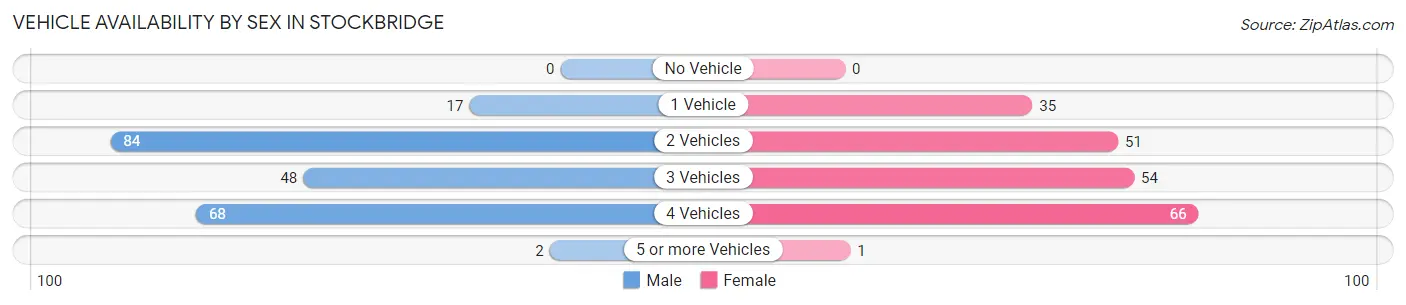
| Vehicles Available | Male | Female |
| No Vehicle | 0 (0.0%) | 0 (0.0%) |
| 1 Vehicle | 17 (7.8%) | 35 (16.9%) |
| 2 Vehicles | 84 (38.4%) | 51 (24.6%) |
| 3 Vehicles | 48 (21.9%) | 54 (26.1%) |
| 4 Vehicles | 68 (31.0%) | 66 (31.9%) |
| 5 or more Vehicles | 2 (0.9%) | 1 (0.5%) |
| Total | 219 (100.0%) | 207 (100.0%) |
Commute Time in Stockbridge
The most frequently occuring commute durations in Stockbridge are 30 to 34 minutes (55 commuters, 13.6%), 60 to 89 minutes (49 commuters, 12.1%), and 15 to 19 minutes (44 commuters, 10.8%).
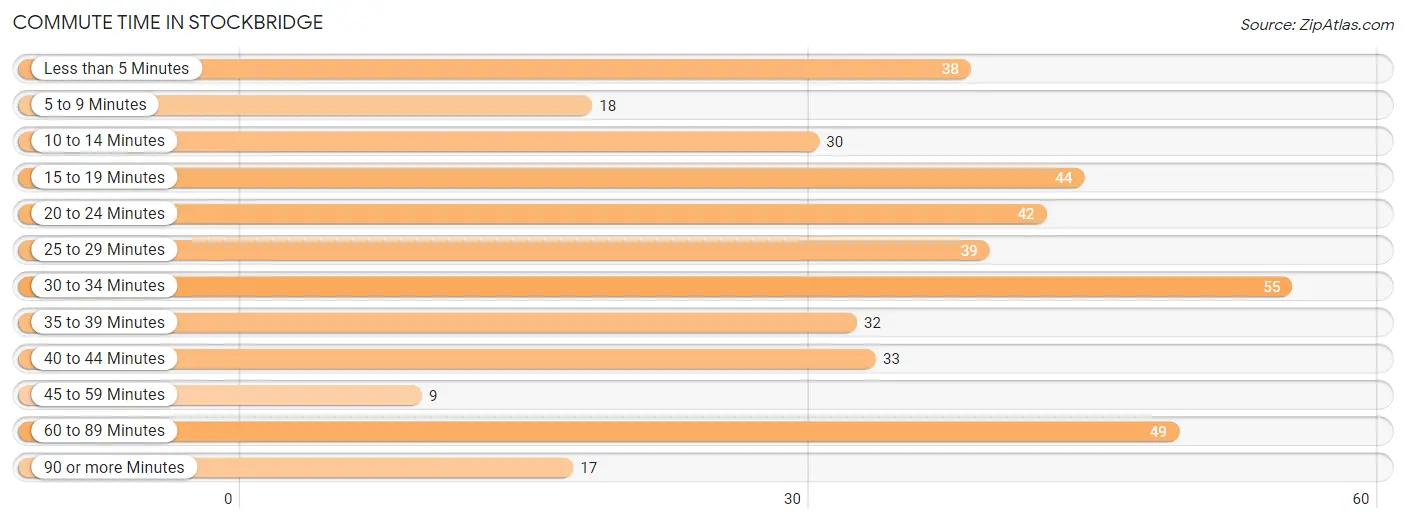
| Commute Time | # Commuters | % Commuters |
| Less than 5 Minutes | 38 | 9.4% |
| 5 to 9 Minutes | 18 | 4.4% |
| 10 to 14 Minutes | 30 | 7.4% |
| 15 to 19 Minutes | 44 | 10.8% |
| 20 to 24 Minutes | 42 | 10.3% |
| 25 to 29 Minutes | 39 | 9.6% |
| 30 to 34 Minutes | 55 | 13.6% |
| 35 to 39 Minutes | 32 | 7.9% |
| 40 to 44 Minutes | 33 | 8.1% |
| 45 to 59 Minutes | 9 | 2.2% |
| 60 to 89 Minutes | 49 | 12.1% |
| 90 or more Minutes | 17 | 4.2% |
Commute Time by Sex in Stockbridge
The most common commute times in Stockbridge are 60 to 89 minutes (45 commuters, 21.0%) for males and 30 to 34 minutes (33 commuters, 17.2%) for females.
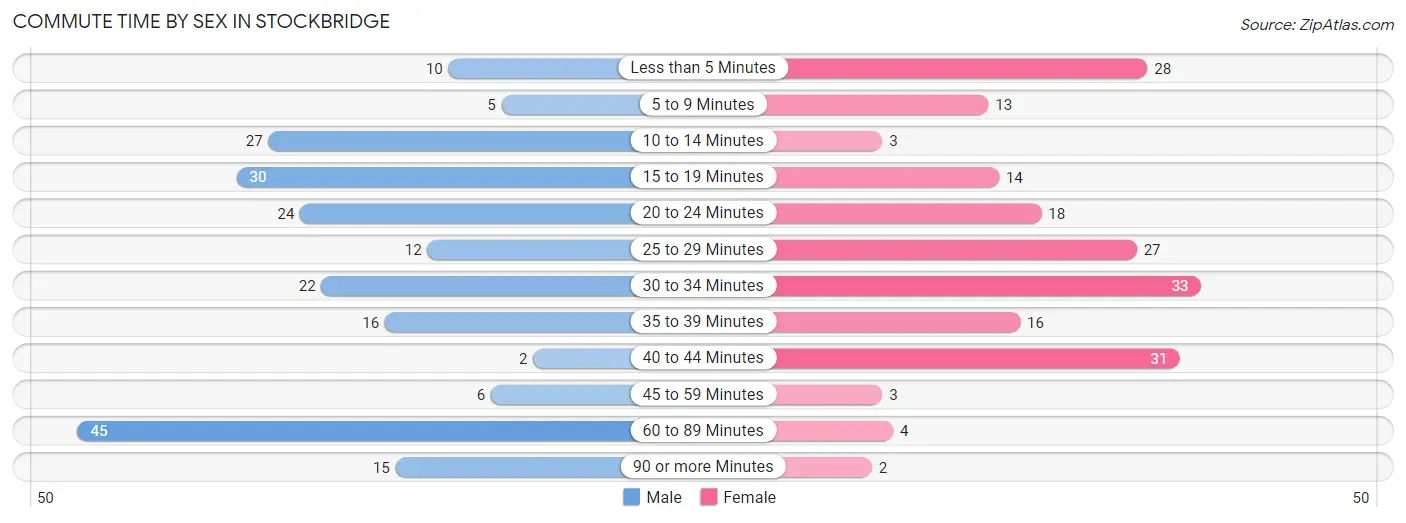
| Commute Time | Male | Female |
| Less than 5 Minutes | 10 (4.7%) | 28 (14.6%) |
| 5 to 9 Minutes | 5 (2.3%) | 13 (6.8%) |
| 10 to 14 Minutes | 27 (12.6%) | 3 (1.6%) |
| 15 to 19 Minutes | 30 (14.0%) | 14 (7.3%) |
| 20 to 24 Minutes | 24 (11.2%) | 18 (9.4%) |
| 25 to 29 Minutes | 12 (5.6%) | 27 (14.1%) |
| 30 to 34 Minutes | 22 (10.3%) | 33 (17.2%) |
| 35 to 39 Minutes | 16 (7.5%) | 16 (8.3%) |
| 40 to 44 Minutes | 2 (0.9%) | 31 (16.2%) |
| 45 to 59 Minutes | 6 (2.8%) | 3 (1.6%) |
| 60 to 89 Minutes | 45 (21.0%) | 4 (2.1%) |
| 90 or more Minutes | 15 (7.0%) | 2 (1.0%) |
Time of Departure to Work by Sex in Stockbridge
The most frequent times of departure to work in Stockbridge are 5:30 AM to 5:59 AM (64, 29.9%) for males and 6:30 AM to 6:59 AM (46, 24.0%) for females.
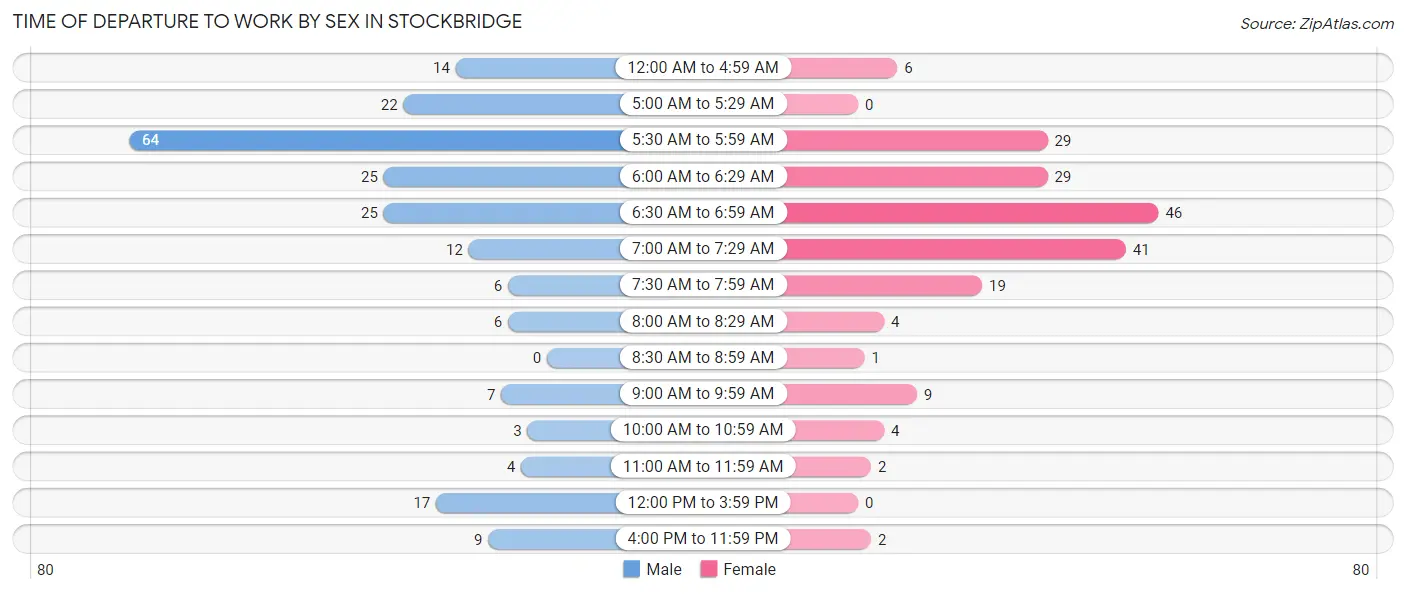
| Time of Departure | Male | Female |
| 12:00 AM to 4:59 AM | 14 (6.5%) | 6 (3.1%) |
| 5:00 AM to 5:29 AM | 22 (10.3%) | 0 (0.0%) |
| 5:30 AM to 5:59 AM | 64 (29.9%) | 29 (15.1%) |
| 6:00 AM to 6:29 AM | 25 (11.7%) | 29 (15.1%) |
| 6:30 AM to 6:59 AM | 25 (11.7%) | 46 (24.0%) |
| 7:00 AM to 7:29 AM | 12 (5.6%) | 41 (21.3%) |
| 7:30 AM to 7:59 AM | 6 (2.8%) | 19 (9.9%) |
| 8:00 AM to 8:29 AM | 6 (2.8%) | 4 (2.1%) |
| 8:30 AM to 8:59 AM | 0 (0.0%) | 1 (0.5%) |
| 9:00 AM to 9:59 AM | 7 (3.3%) | 9 (4.7%) |
| 10:00 AM to 10:59 AM | 3 (1.4%) | 4 (2.1%) |
| 11:00 AM to 11:59 AM | 4 (1.9%) | 2 (1.0%) |
| 12:00 PM to 3:59 PM | 17 (7.9%) | 0 (0.0%) |
| 4:00 PM to 11:59 PM | 9 (4.2%) | 2 (1.0%) |
| Total | 214 (100.0%) | 192 (100.0%) |
Housing Occupancy in Stockbridge
Occupancy by Ownership in Stockbridge
Of the total 511 dwellings in Stockbridge, owner-occupied units account for 449 (87.9%), while renter-occupied units make up 62 (12.1%).
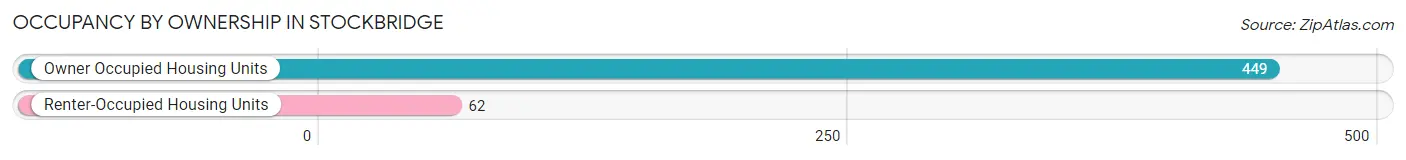
| Occupancy | # Housing Units | % Housing Units |
| Owner Occupied Housing Units | 449 | 87.9% |
| Renter-Occupied Housing Units | 62 | 12.1% |
| Total Occupied Housing Units | 511 | 100.0% |
Occupancy by Household Size in Stockbridge
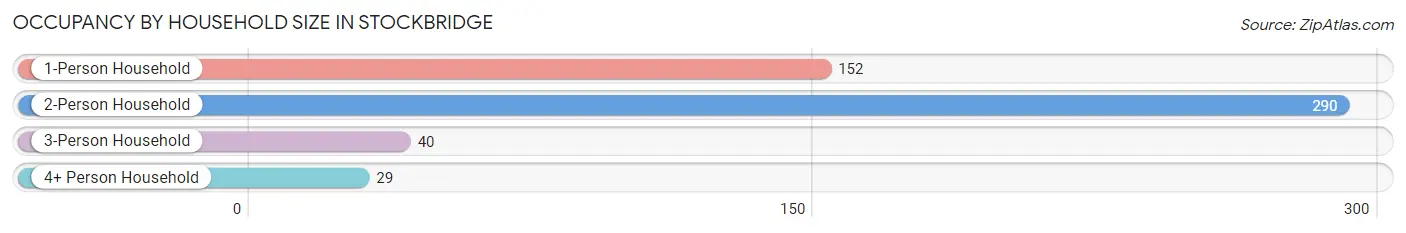
| Household Size | # Housing Units | % Housing Units |
| 1-Person Household | 152 | 29.7% |
| 2-Person Household | 290 | 56.8% |
| 3-Person Household | 40 | 7.8% |
| 4+ Person Household | 29 | 5.7% |
| Total Housing Units | 511 | 100.0% |
Occupancy by Ownership by Household Size in Stockbridge
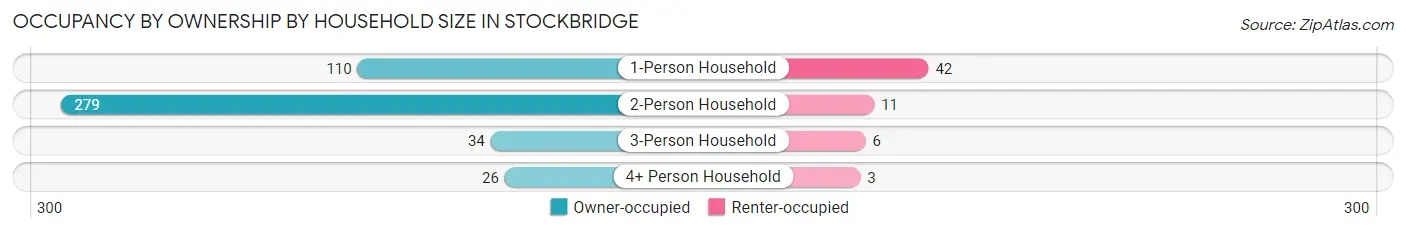
| Household Size | Owner-occupied | Renter-occupied |
| 1-Person Household | 110 (72.4%) | 42 (27.6%) |
| 2-Person Household | 279 (96.2%) | 11 (3.8%) |
| 3-Person Household | 34 (85.0%) | 6 (15.0%) |
| 4+ Person Household | 26 (89.7%) | 3 (10.3%) |
| Total Housing Units | 449 (87.9%) | 62 (12.1%) |
Occupancy by Educational Attainment in Stockbridge
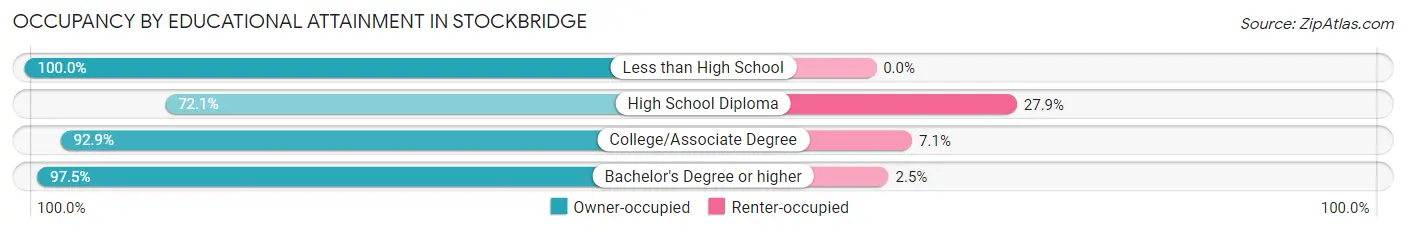
| Household Size | Owner-occupied | Renter-occupied |
| Less than High School | 17 (100.0%) | 0 (0.0%) |
| High School Diploma | 106 (72.1%) | 41 (27.9%) |
| College/Associate Degree | 247 (92.9%) | 19 (7.1%) |
| Bachelor's Degree or higher | 79 (97.5%) | 2 (2.5%) |
Occupancy by Age of Householder in Stockbridge
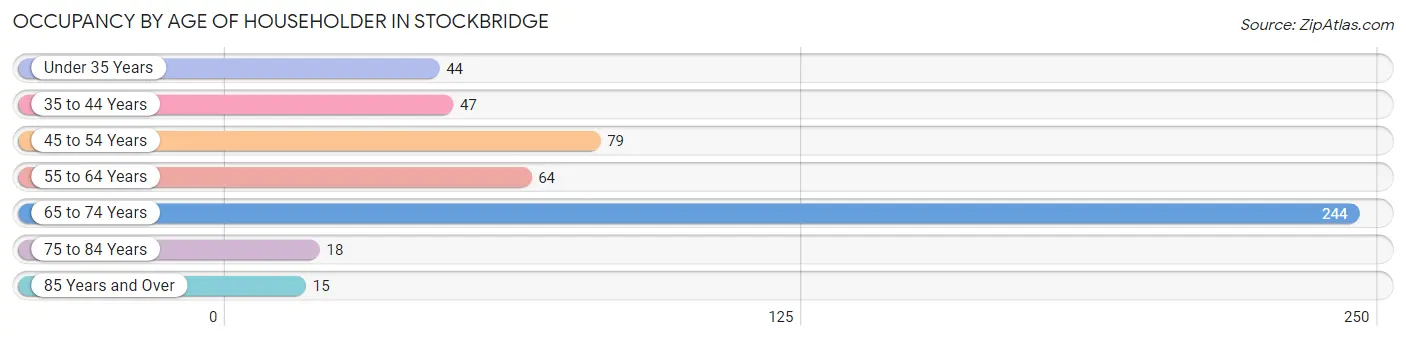
| Age Bracket | # Households | % Households |
| Under 35 Years | 44 | 8.6% |
| 35 to 44 Years | 47 | 9.2% |
| 45 to 54 Years | 79 | 15.5% |
| 55 to 64 Years | 64 | 12.5% |
| 65 to 74 Years | 244 | 47.7% |
| 75 to 84 Years | 18 | 3.5% |
| 85 Years and Over | 15 | 2.9% |
| Total | 511 | 100.0% |
Housing Finances in Stockbridge
Median Income by Occupancy in Stockbridge
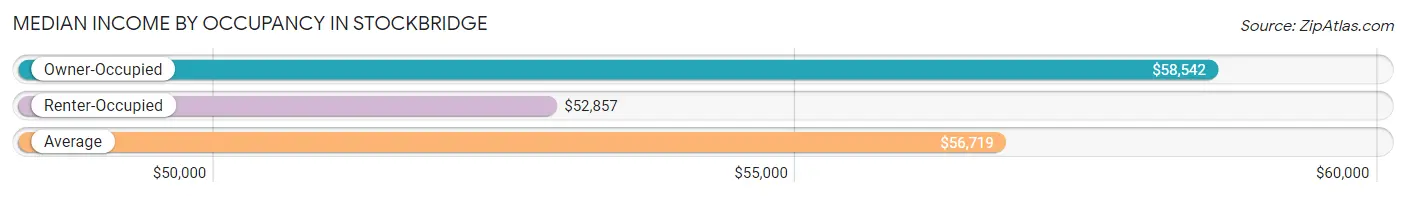
| Occupancy Type | # Households | Median Income |
| Owner-Occupied | 449 (87.9%) | $58,542 |
| Renter-Occupied | 62 (12.1%) | $52,857 |
| Average | 511 (100.0%) | $56,719 |
Occupancy by Householder Income Bracket in Stockbridge
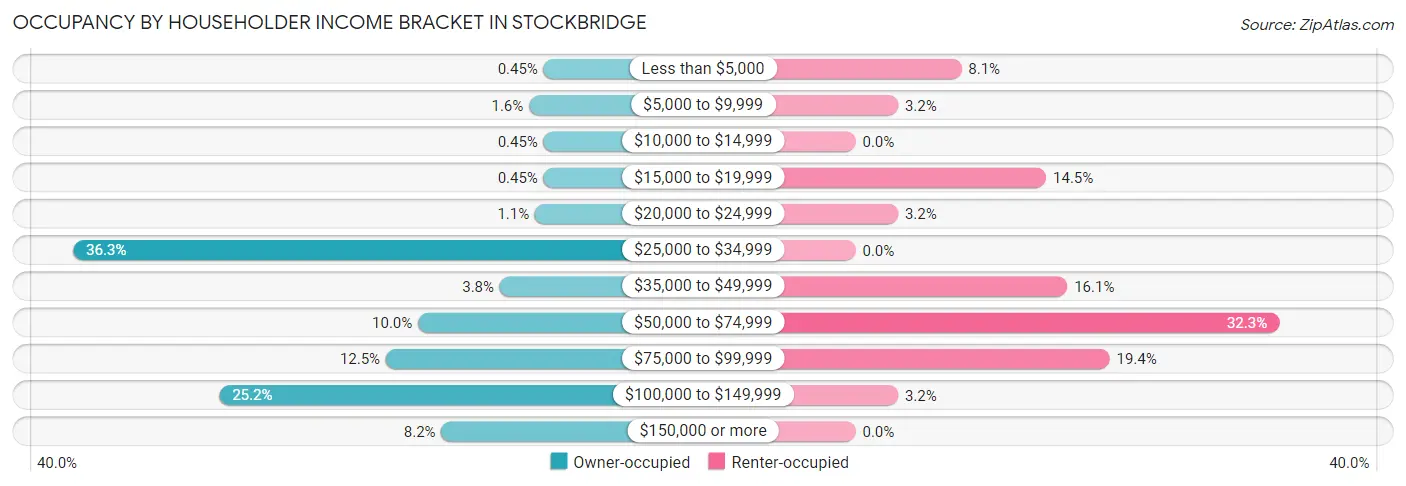
| Income Bracket | Owner-occupied | Renter-occupied |
| Less than $5,000 | 2 (0.4%) | 5 (8.1%) |
| $5,000 to $9,999 | 7 (1.6%) | 2 (3.2%) |
| $10,000 to $14,999 | 2 (0.4%) | 0 (0.0%) |
| $15,000 to $19,999 | 2 (0.4%) | 9 (14.5%) |
| $20,000 to $24,999 | 5 (1.1%) | 2 (3.2%) |
| $25,000 to $34,999 | 163 (36.3%) | 0 (0.0%) |
| $35,000 to $49,999 | 17 (3.8%) | 10 (16.1%) |
| $50,000 to $74,999 | 45 (10.0%) | 20 (32.3%) |
| $75,000 to $99,999 | 56 (12.5%) | 12 (19.4%) |
| $100,000 to $149,999 | 113 (25.2%) | 2 (3.2%) |
| $150,000 or more | 37 (8.2%) | 0 (0.0%) |
| Total | 449 (100.0%) | 62 (100.0%) |
Monthly Housing Cost Tiers in Stockbridge
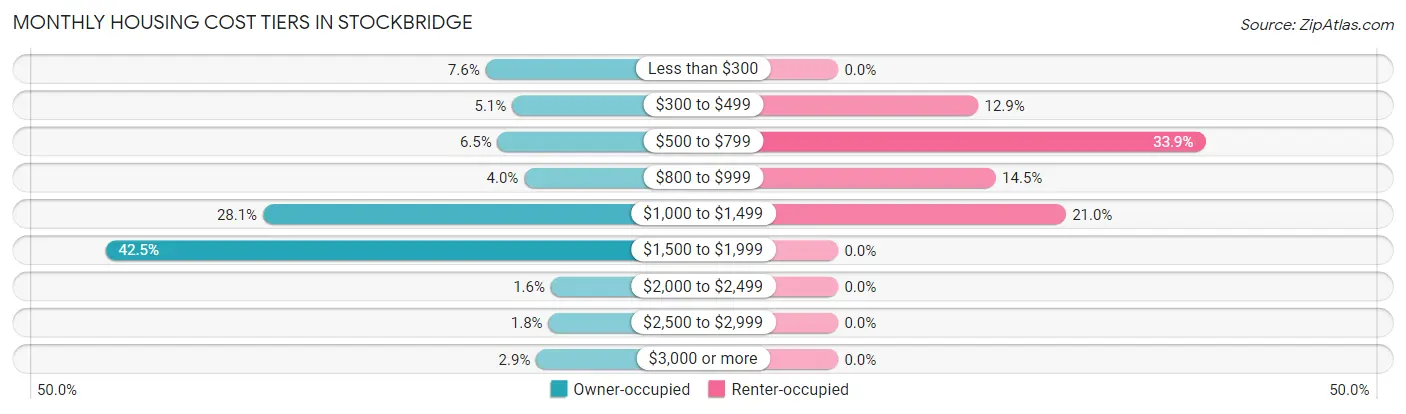
| Monthly Cost | Owner-occupied | Renter-occupied |
| Less than $300 | 34 (7.6%) | 0 (0.0%) |
| $300 to $499 | 23 (5.1%) | 8 (12.9%) |
| $500 to $799 | 29 (6.5%) | 21 (33.9%) |
| $800 to $999 | 18 (4.0%) | 9 (14.5%) |
| $1,000 to $1,499 | 126 (28.1%) | 13 (21.0%) |
| $1,500 to $1,999 | 191 (42.5%) | 0 (0.0%) |
| $2,000 to $2,499 | 7 (1.6%) | 0 (0.0%) |
| $2,500 to $2,999 | 8 (1.8%) | 0 (0.0%) |
| $3,000 or more | 13 (2.9%) | 0 (0.0%) |
| Total | 449 (100.0%) | 62 (100.0%) |
Physical Housing Characteristics in Stockbridge
Housing Structures in Stockbridge
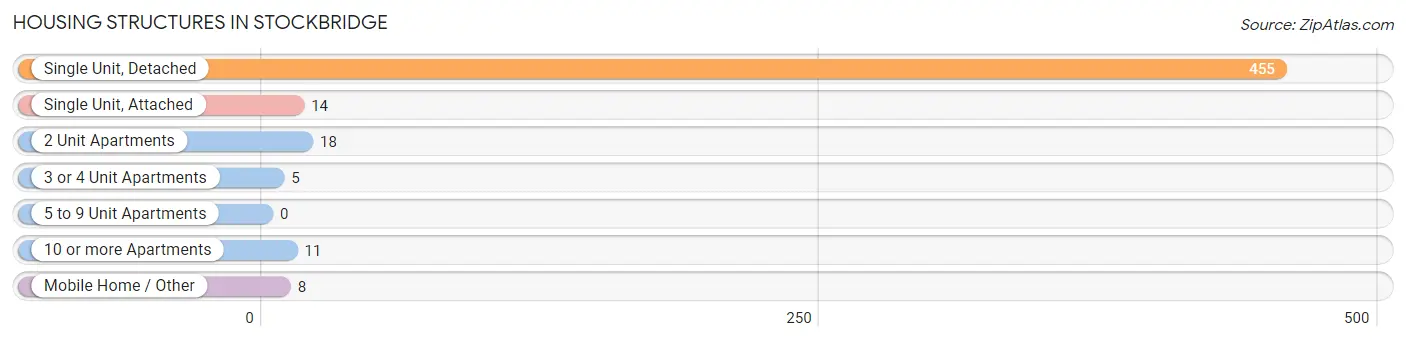
| Structure Type | # Housing Units | % Housing Units |
| Single Unit, Detached | 455 | 89.0% |
| Single Unit, Attached | 14 | 2.7% |
| 2 Unit Apartments | 18 | 3.5% |
| 3 or 4 Unit Apartments | 5 | 1.0% |
| 5 to 9 Unit Apartments | 0 | 0.0% |
| 10 or more Apartments | 11 | 2.1% |
| Mobile Home / Other | 8 | 1.6% |
| Total | 511 | 100.0% |
Housing Structures by Occupancy in Stockbridge
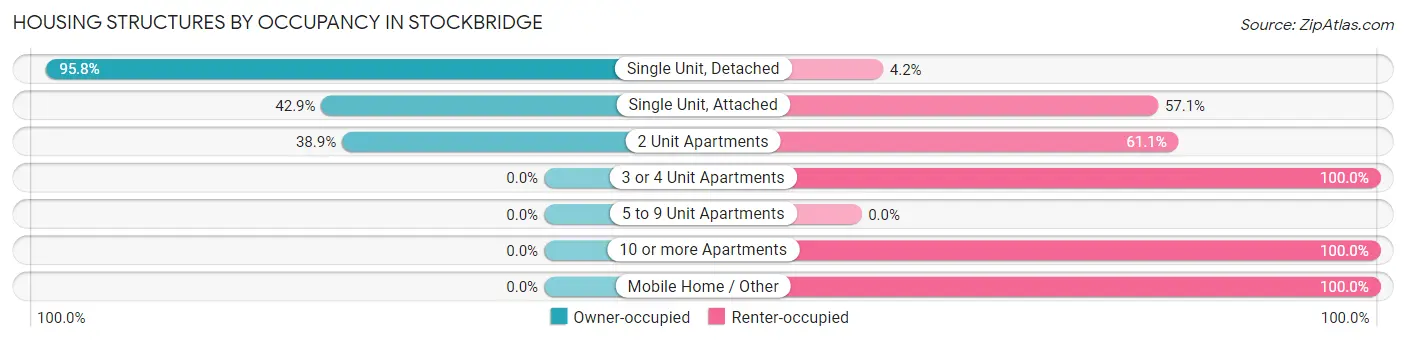
| Structure Type | Owner-occupied | Renter-occupied |
| Single Unit, Detached | 436 (95.8%) | 19 (4.2%) |
| Single Unit, Attached | 6 (42.9%) | 8 (57.1%) |
| 2 Unit Apartments | 7 (38.9%) | 11 (61.1%) |
| 3 or 4 Unit Apartments | 0 (0.0%) | 5 (100.0%) |
| 5 to 9 Unit Apartments | 0 (0.0%) | 0 (0.0%) |
| 10 or more Apartments | 0 (0.0%) | 11 (100.0%) |
| Mobile Home / Other | 0 (0.0%) | 8 (100.0%) |
| Total | 449 (87.9%) | 62 (12.1%) |
Housing Structures by Number of Rooms in Stockbridge
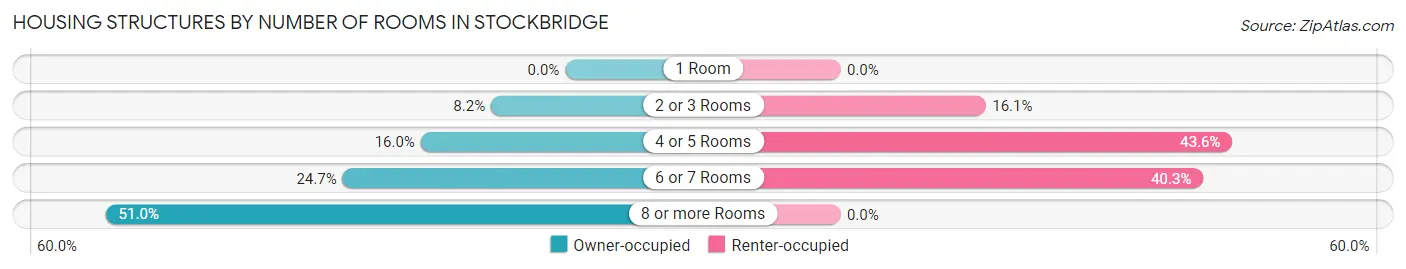
| Number of Rooms | Owner-occupied | Renter-occupied |
| 1 Room | 0 (0.0%) | 0 (0.0%) |
| 2 or 3 Rooms | 37 (8.2%) | 10 (16.1%) |
| 4 or 5 Rooms | 72 (16.0%) | 27 (43.5%) |
| 6 or 7 Rooms | 111 (24.7%) | 25 (40.3%) |
| 8 or more Rooms | 229 (51.0%) | 0 (0.0%) |
| Total | 449 (100.0%) | 62 (100.0%) |
Housing Structure by Heating Type in Stockbridge
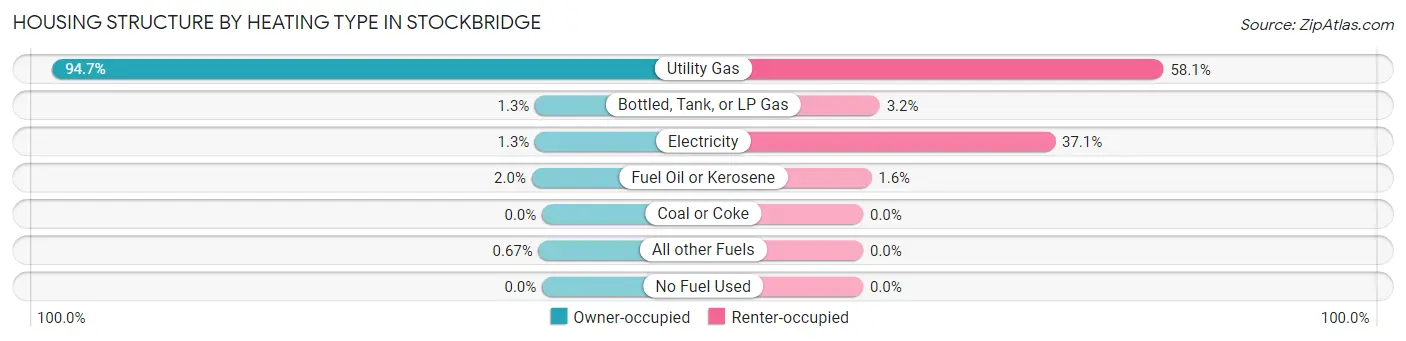
| Heating Type | Owner-occupied | Renter-occupied |
| Utility Gas | 425 (94.7%) | 36 (58.1%) |
| Bottled, Tank, or LP Gas | 6 (1.3%) | 2 (3.2%) |
| Electricity | 6 (1.3%) | 23 (37.1%) |
| Fuel Oil or Kerosene | 9 (2.0%) | 1 (1.6%) |
| Coal or Coke | 0 (0.0%) | 0 (0.0%) |
| All other Fuels | 3 (0.7%) | 0 (0.0%) |
| No Fuel Used | 0 (0.0%) | 0 (0.0%) |
| Total | 449 (100.0%) | 62 (100.0%) |
Household Vehicle Usage in Stockbridge
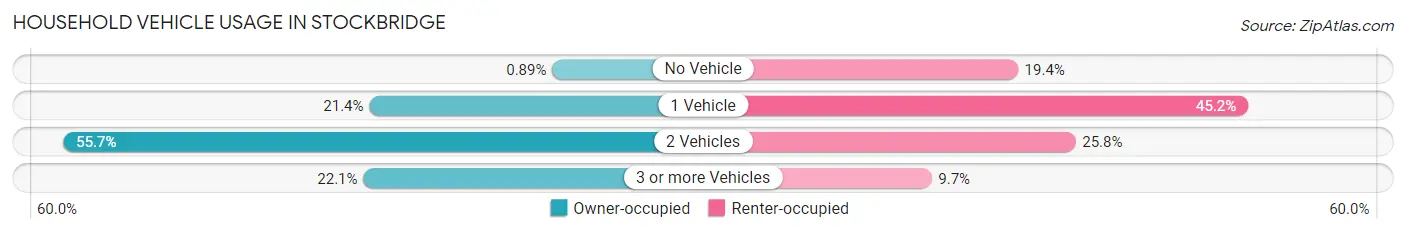
| Vehicles per Household | Owner-occupied | Renter-occupied |
| No Vehicle | 4 (0.9%) | 12 (19.4%) |
| 1 Vehicle | 96 (21.4%) | 28 (45.2%) |
| 2 Vehicles | 250 (55.7%) | 16 (25.8%) |
| 3 or more Vehicles | 99 (22.1%) | 6 (9.7%) |
| Total | 449 (100.0%) | 62 (100.0%) |
Real Estate & Mortgages in Stockbridge
Real Estate and Mortgage Overview in Stockbridge
| Characteristic | Without Mortgage | With Mortgage |
| Housing Units | 112 | 337 |
| Median Property Value | - | - |
| Median Household Income | $96,667 | $30 |
| Monthly Housing Costs | $490 | $13 |
| Real Estate Taxes | $2,190 | $2 |
Property Value by Mortgage Status in Stockbridge
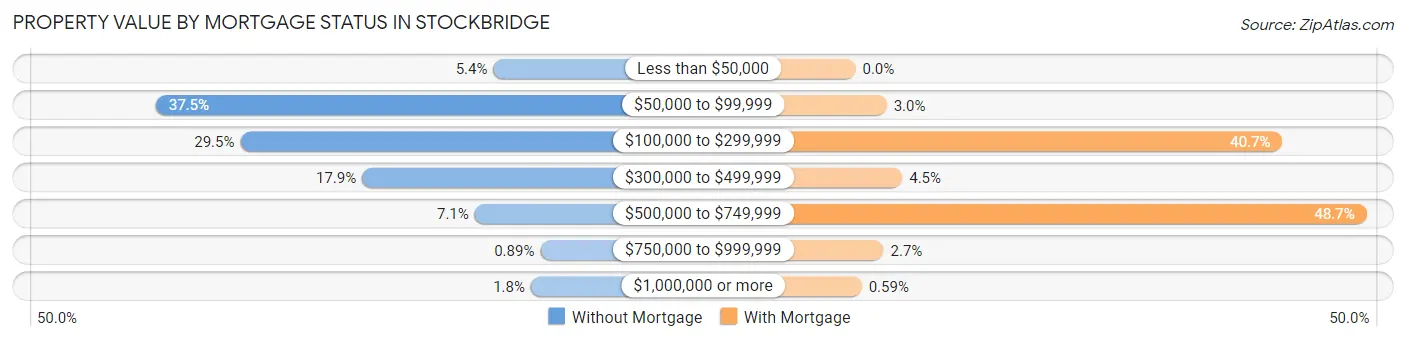
| Property Value | Without Mortgage | With Mortgage |
| Less than $50,000 | 6 (5.4%) | 0 (0.0%) |
| $50,000 to $99,999 | 42 (37.5%) | 10 (3.0%) |
| $100,000 to $299,999 | 33 (29.5%) | 137 (40.6%) |
| $300,000 to $499,999 | 20 (17.9%) | 15 (4.4%) |
| $500,000 to $749,999 | 8 (7.1%) | 164 (48.7%) |
| $750,000 to $999,999 | 1 (0.9%) | 9 (2.7%) |
| $1,000,000 or more | 2 (1.8%) | 2 (0.6%) |
| Total | 112 (100.0%) | 337 (100.0%) |
Household Income by Mortgage Status in Stockbridge
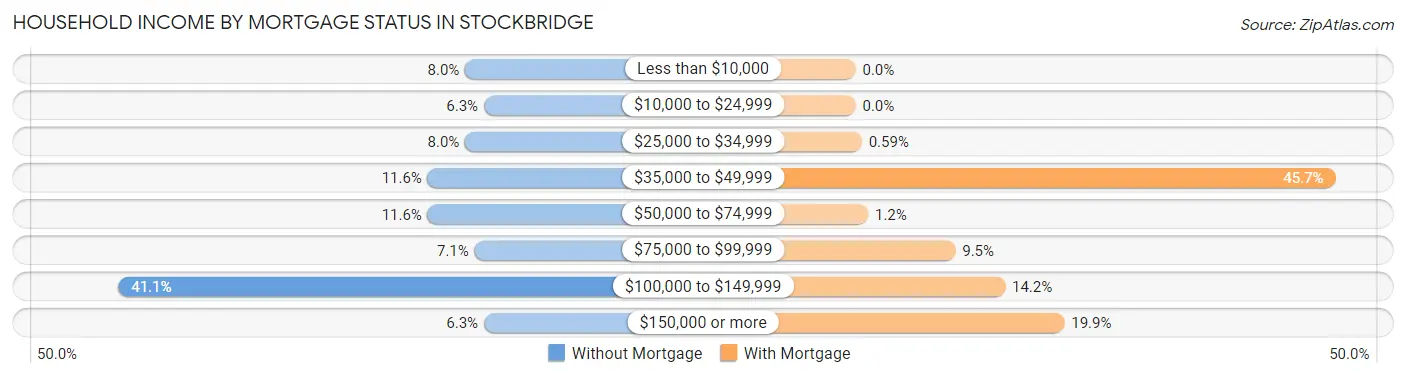
| Household Income | Without Mortgage | With Mortgage |
| Less than $10,000 | 9 (8.0%) | 0 (0.0%) |
| $10,000 to $24,999 | 7 (6.2%) | 0 (0.0%) |
| $25,000 to $34,999 | 9 (8.0%) | 2 (0.6%) |
| $35,000 to $49,999 | 13 (11.6%) | 154 (45.7%) |
| $50,000 to $74,999 | 13 (11.6%) | 4 (1.2%) |
| $75,000 to $99,999 | 8 (7.1%) | 32 (9.5%) |
| $100,000 to $149,999 | 46 (41.1%) | 48 (14.2%) |
| $150,000 or more | 7 (6.2%) | 67 (19.9%) |
| Total | 112 (100.0%) | 337 (100.0%) |
Property Value to Household Income Ratio in Stockbridge
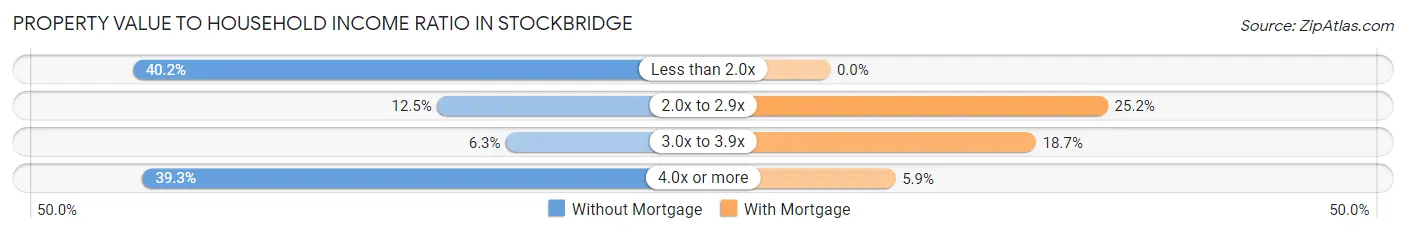
| Value-to-Income Ratio | Without Mortgage | With Mortgage |
| Less than 2.0x | 45 (40.2%) | 0 (0.0%) |
| 2.0x to 2.9x | 14 (12.5%) | 85 (25.2%) |
| 3.0x to 3.9x | 7 (6.2%) | 63 (18.7%) |
| 4.0x or more | 44 (39.3%) | 20 (5.9%) |
| Total | 112 (100.0%) | 337 (100.0%) |
Real Estate Taxes by Mortgage Status in Stockbridge
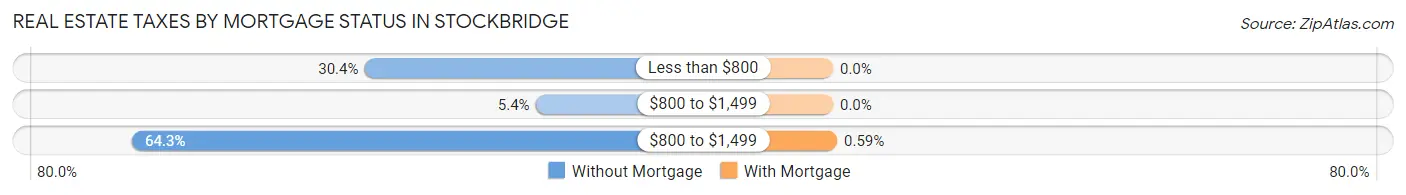
| Property Taxes | Without Mortgage | With Mortgage |
| Less than $800 | 34 (30.4%) | 0 (0.0%) |
| $800 to $1,499 | 6 (5.4%) | 0 (0.0%) |
| $800 to $1,499 | 72 (64.3%) | 2 (0.6%) |
| Total | 112 (100.0%) | 337 (100.0%) |
Health & Disability in Stockbridge
Health Insurance Coverage by Age in Stockbridge
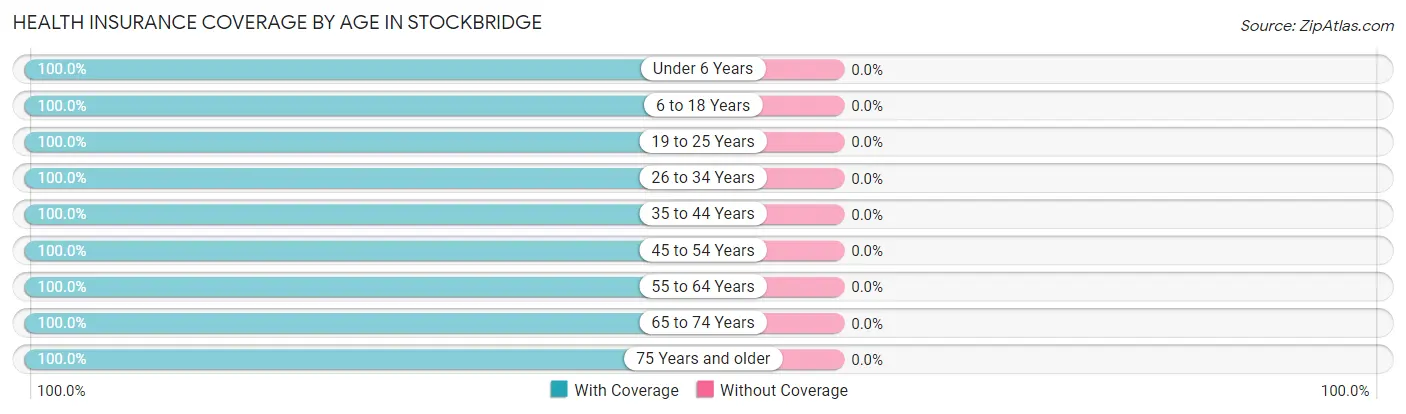
| Age Bracket | With Coverage | Without Coverage |
| Under 6 Years | 26 (100.0%) | 0 (0.0%) |
| 6 to 18 Years | 50 (100.0%) | 0 (0.0%) |
| 19 to 25 Years | 60 (100.0%) | 0 (0.0%) |
| 26 to 34 Years | 51 (100.0%) | 0 (0.0%) |
| 35 to 44 Years | 74 (100.0%) | 0 (0.0%) |
| 45 to 54 Years | 109 (100.0%) | 0 (0.0%) |
| 55 to 64 Years | 167 (100.0%) | 0 (0.0%) |
| 65 to 74 Years | 271 (100.0%) | 0 (0.0%) |
| 75 Years and older | 49 (100.0%) | 0 (0.0%) |
| Total | 857 (100.0%) | 0 (0.0%) |
Health Insurance Coverage by Citizenship Status in Stockbridge
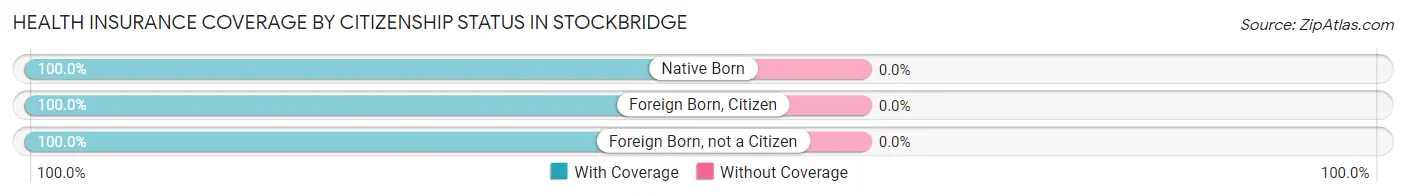
| Citizenship Status | With Coverage | Without Coverage |
| Native Born | 26 (100.0%) | 0 (0.0%) |
| Foreign Born, Citizen | 50 (100.0%) | 0 (0.0%) |
| Foreign Born, not a Citizen | 60 (100.0%) | 0 (0.0%) |
Health Insurance Coverage by Household Income in Stockbridge
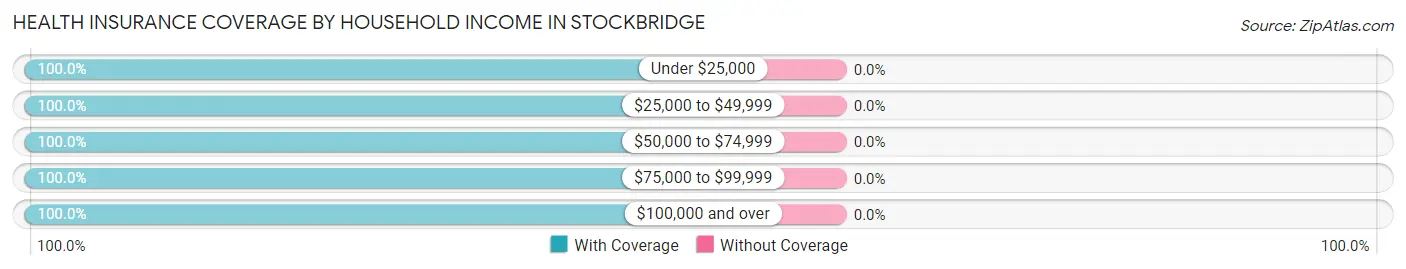
| Household Income | With Coverage | Without Coverage |
| Under $25,000 | 44 (100.0%) | 0 (0.0%) |
| $25,000 to $49,999 | 219 (100.0%) | 0 (0.0%) |
| $50,000 to $74,999 | 99 (100.0%) | 0 (0.0%) |
| $75,000 to $99,999 | 170 (100.0%) | 0 (0.0%) |
| $100,000 and over | 325 (100.0%) | 0 (0.0%) |
Public vs Private Health Insurance Coverage by Age in Stockbridge
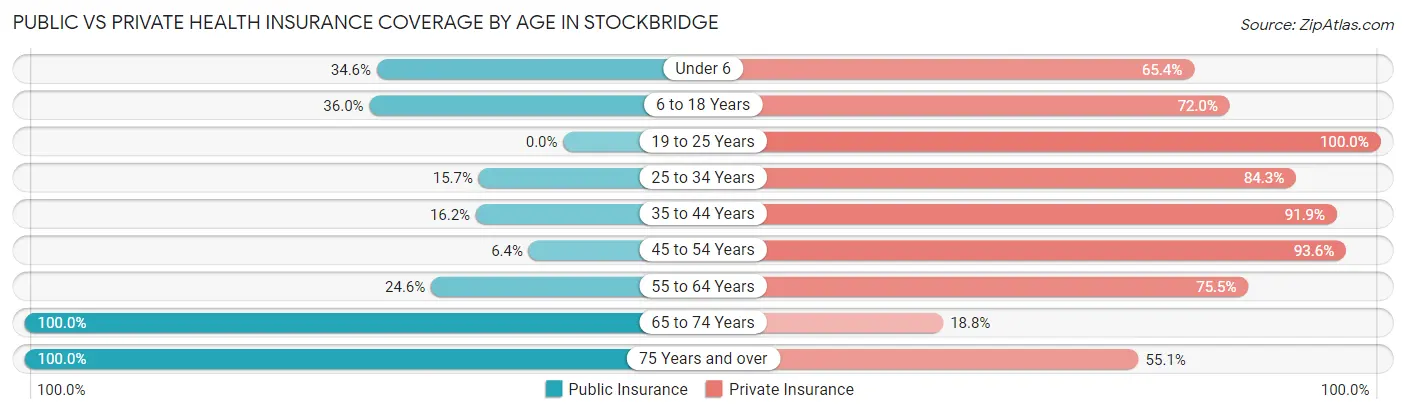
| Age Bracket | Public Insurance | Private Insurance |
| Under 6 | 9 (34.6%) | 17 (65.4%) |
| 6 to 18 Years | 18 (36.0%) | 36 (72.0%) |
| 19 to 25 Years | 0 (0.0%) | 60 (100.0%) |
| 25 to 34 Years | 8 (15.7%) | 43 (84.3%) |
| 35 to 44 Years | 12 (16.2%) | 68 (91.9%) |
| 45 to 54 Years | 7 (6.4%) | 102 (93.6%) |
| 55 to 64 Years | 41 (24.5%) | 126 (75.4%) |
| 65 to 74 Years | 271 (100.0%) | 51 (18.8%) |
| 75 Years and over | 49 (100.0%) | 27 (55.1%) |
| Total | 415 (48.4%) | 530 (61.8%) |
Disability Status by Sex by Age in Stockbridge
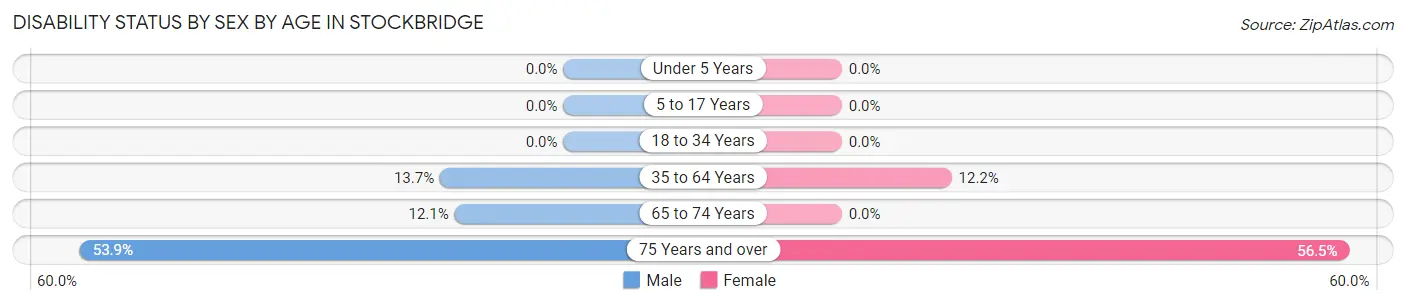
| Age Bracket | Male | Female |
| Under 5 Years | 0 (0.0%) | 0 (0.0%) |
| 5 to 17 Years | 0 (0.0%) | 0 (0.0%) |
| 18 to 34 Years | 0 (0.0%) | 0 (0.0%) |
| 35 to 64 Years | 29 (13.7%) | 17 (12.2%) |
| 65 to 74 Years | 8 (12.1%) | 0 (0.0%) |
| 75 Years and over | 14 (53.8%) | 13 (56.5%) |
Disability Class by Sex by Age in Stockbridge
Disability Class: Hearing Difficulty
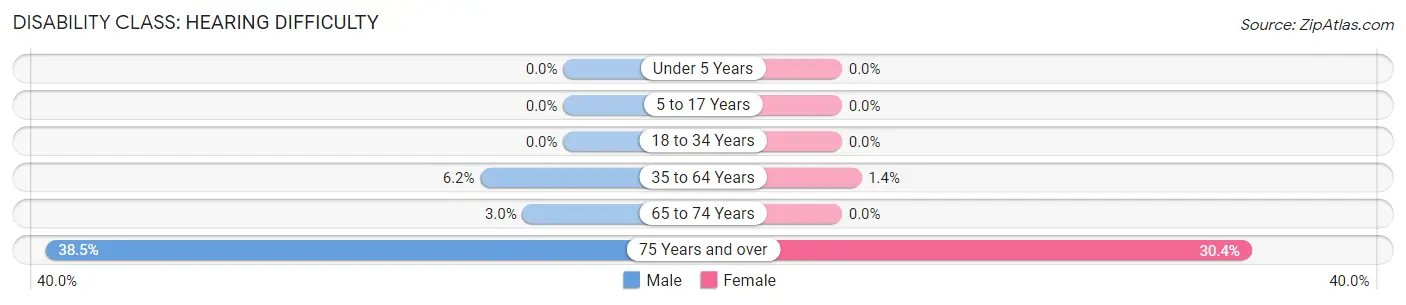
| Age Bracket | Male | Female |
| Under 5 Years | 0 (0.0%) | 0 (0.0%) |
| 5 to 17 Years | 0 (0.0%) | 0 (0.0%) |
| 18 to 34 Years | 0 (0.0%) | 0 (0.0%) |
| 35 to 64 Years | 13 (6.2%) | 2 (1.4%) |
| 65 to 74 Years | 2 (3.0%) | 0 (0.0%) |
| 75 Years and over | 10 (38.5%) | 7 (30.4%) |
Disability Class: Vision Difficulty
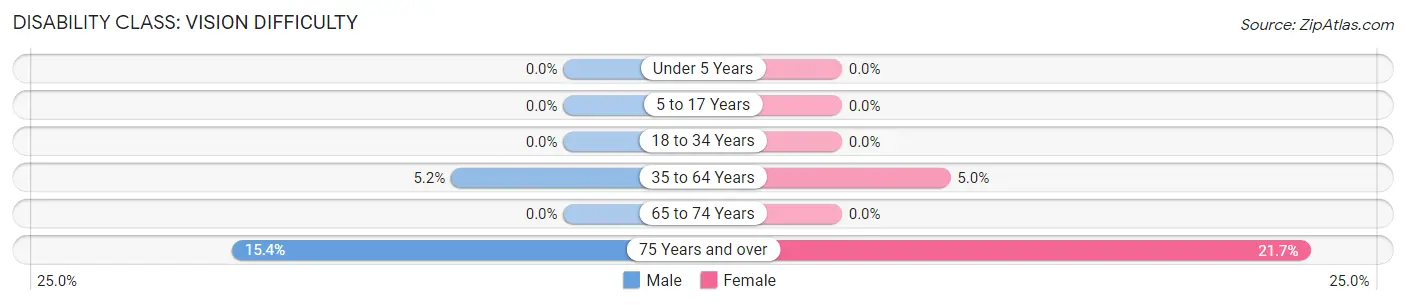
| Age Bracket | Male | Female |
| Under 5 Years | 0 (0.0%) | 0 (0.0%) |
| 5 to 17 Years | 0 (0.0%) | 0 (0.0%) |
| 18 to 34 Years | 0 (0.0%) | 0 (0.0%) |
| 35 to 64 Years | 11 (5.2%) | 7 (5.0%) |
| 65 to 74 Years | 0 (0.0%) | 0 (0.0%) |
| 75 Years and over | 4 (15.4%) | 5 (21.7%) |
Disability Class: Cognitive Difficulty
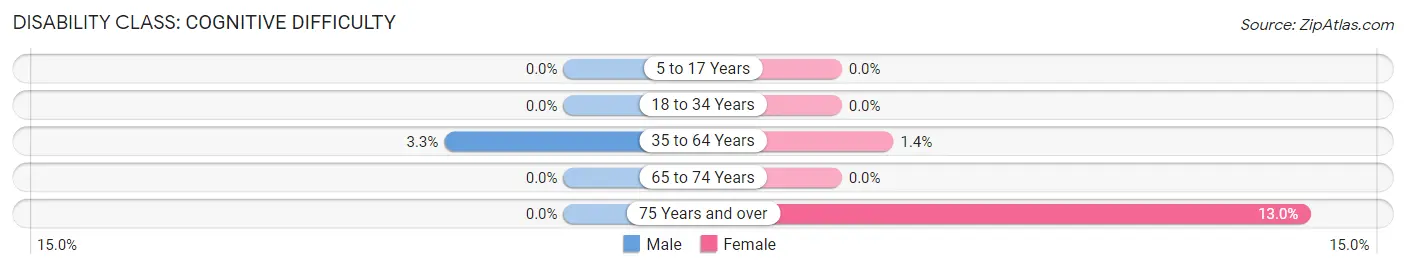
| Age Bracket | Male | Female |
| 5 to 17 Years | 0 (0.0%) | 0 (0.0%) |
| 18 to 34 Years | 0 (0.0%) | 0 (0.0%) |
| 35 to 64 Years | 7 (3.3%) | 2 (1.4%) |
| 65 to 74 Years | 0 (0.0%) | 0 (0.0%) |
| 75 Years and over | 0 (0.0%) | 3 (13.0%) |
Disability Class: Ambulatory Difficulty
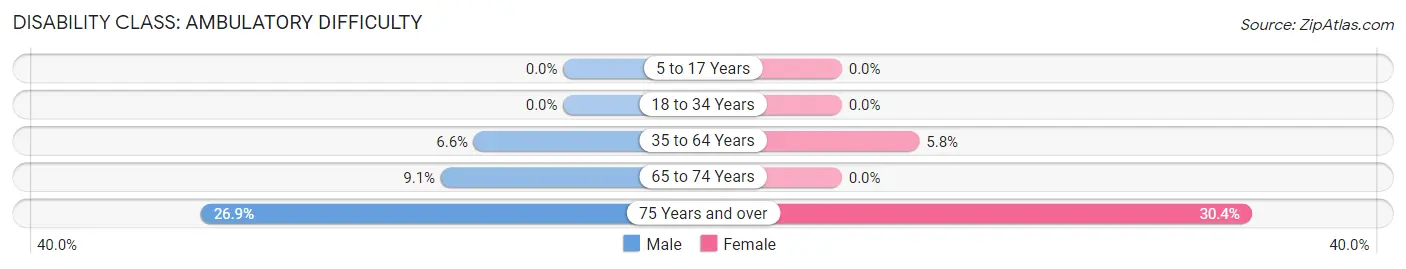
| Age Bracket | Male | Female |
| 5 to 17 Years | 0 (0.0%) | 0 (0.0%) |
| 18 to 34 Years | 0 (0.0%) | 0 (0.0%) |
| 35 to 64 Years | 14 (6.6%) | 8 (5.8%) |
| 65 to 74 Years | 6 (9.1%) | 0 (0.0%) |
| 75 Years and over | 7 (26.9%) | 7 (30.4%) |
Disability Class: Self-Care Difficulty
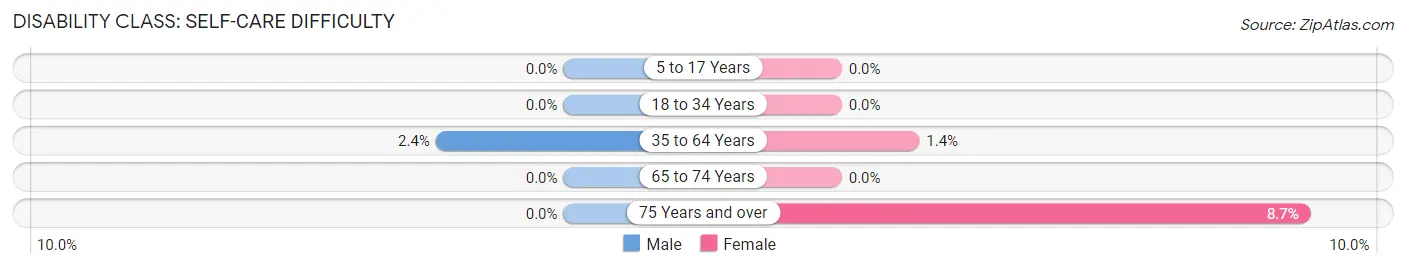
| Age Bracket | Male | Female |
| 5 to 17 Years | 0 (0.0%) | 0 (0.0%) |
| 18 to 34 Years | 0 (0.0%) | 0 (0.0%) |
| 35 to 64 Years | 5 (2.4%) | 2 (1.4%) |
| 65 to 74 Years | 0 (0.0%) | 0 (0.0%) |
| 75 Years and over | 0 (0.0%) | 2 (8.7%) |
Technology Access in Stockbridge
Computing Device Access in Stockbridge
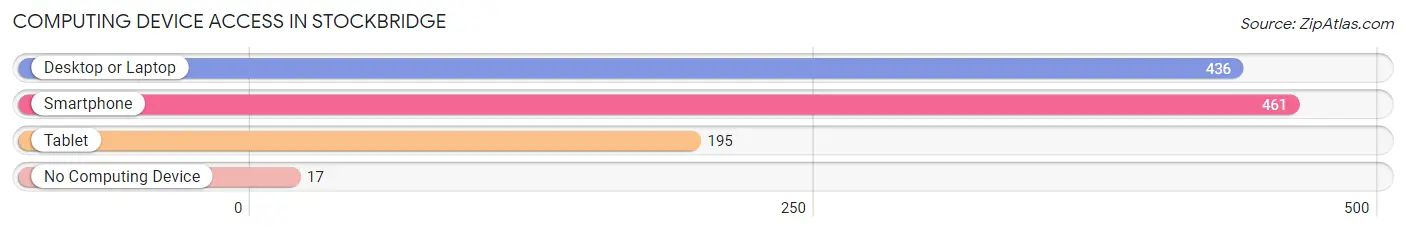
| Device Type | # Households | % Households |
| Desktop or Laptop | 436 | 85.3% |
| Smartphone | 461 | 90.2% |
| Tablet | 195 | 38.2% |
| No Computing Device | 17 | 3.3% |
| Total | 511 | 100.0% |
Internet Access in Stockbridge
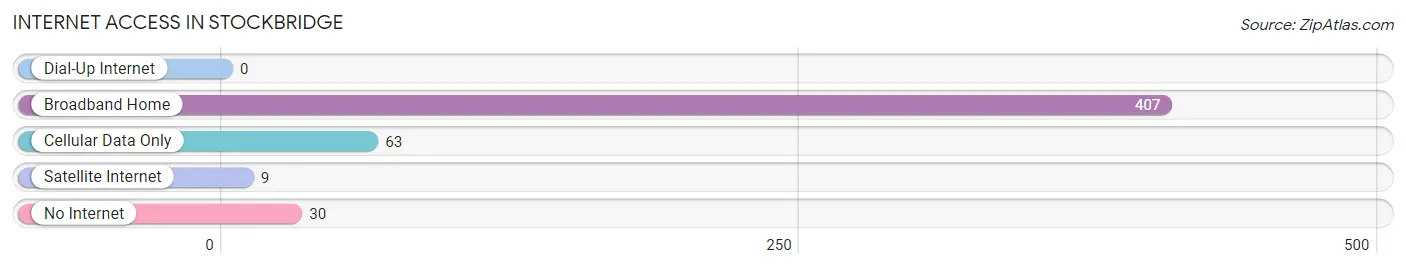
| Internet Type | # Households | % Households |
| Dial-Up Internet | 0 | 0.0% |
| Broadband Home | 407 | 79.6% |
| Cellular Data Only | 63 | 12.3% |
| Satellite Internet | 9 | 1.8% |
| No Internet | 30 | 5.9% |
| Total | 511 | 100.0% |
Stockbridge Summary
Stockbridge, Wisconsin is a small village located in Calumet County, Wisconsin. It is situated on the banks of the Fox River, about 25 miles north of Appleton. The village has a population of about 1,000 people and is part of the Appleton-Oshkosh-Neenah Metropolitan Statistical Area.
History
The area that is now Stockbridge was first settled in the early 1800s by German immigrants. The village was originally known as “Stockbrücke”, which means “bridge of stocks” in German. The name was derived from the wooden bridge that was built across the Fox River in 1845. The bridge was used to transport goods and people between the two sides of the river.
In 1848, the village was officially incorporated as Stockbridge. The village grew slowly over the years, and by the early 1900s, it had a population of about 500 people. The village was primarily an agricultural community, with many of the residents working on nearby farms.
Geography
Stockbridge is located in Calumet County, Wisconsin. It is situated on the banks of the Fox River, about 25 miles north of Appleton. The village is surrounded by rolling hills and farmland. The Fox River runs through the village, providing a scenic backdrop.
The village has a total area of 1.2 square miles, all of which is land. The elevation of the village is 845 feet above sea level.
Economy
The economy of Stockbridge is largely based on agriculture. The village is home to several farms, which produce a variety of crops, including corn, soybeans, and hay. The village also has a few small businesses, including a grocery store, a hardware store, and a few restaurants.
Demographics
As of the 2010 census, the population of Stockbridge was 1,000 people. The racial makeup of the village was 97.2% White, 0.7% African American, 0.3% Native American, 0.3% Asian, 0.1% Pacific Islander, and 1.5% from other races. The median household income was $45,000, and the median family income was $50,000.
Conclusion
Stockbridge, Wisconsin is a small village located in Calumet County, Wisconsin. It is situated on the banks of the Fox River, about 25 miles north of Appleton. The village has a population of about 1,000 people and is part of the Appleton-Oshkosh-Neenah Metropolitan Statistical Area. The village was originally settled in the early 1800s by German immigrants and has since grown into a primarily agricultural community. The economy of Stockbridge is largely based on agriculture, with many of the residents working on nearby farms. The racial makeup of the village is predominantly White, with a small percentage of African American, Native American, Asian, and Pacific Islander residents.
Common Questions
What is Per Capita Income in Stockbridge?
Per Capita income in Stockbridge is $47,986.
What is the Median Family Income in Stockbridge?
Median Family Income in Stockbridge is $108,750.
What is the Median Household income in Stockbridge?
Median Household Income in Stockbridge is $56,719.
What is Income or Wage Gap in Stockbridge?
Income or Wage Gap in Stockbridge is 20.9%.
Women in Stockbridge earn 79.1 cents for every dollar earned by a man.
What is Inequality or Gini Index in Stockbridge?
Inequality or Gini Index in Stockbridge is 0.42.
What is the Total Population of Stockbridge?
Total Population of Stockbridge is 857.
What is the Total Male Population of Stockbridge?
Total Male Population of Stockbridge is 387.
What is the Total Female Population of Stockbridge?
Total Female Population of Stockbridge is 470.
What is the Ratio of Males per 100 Females in Stockbridge?
There are 82.34 Males per 100 Females in Stockbridge.
What is the Ratio of Females per 100 Males in Stockbridge?
There are 121.45 Females per 100 Males in Stockbridge.
What is the Median Population Age in Stockbridge?
Median Population Age in Stockbridge is 57.8 Years.
What is the Average Family Size in Stockbridge
Average Family Size in Stockbridge is 2.6 People.
What is the Average Household Size in Stockbridge
Average Household Size in Stockbridge is 1.7 People.
How Large is the Labor Force in Stockbridge?
There are 426 People in the Labor Forcein in Stockbridge.
What is the Percentage of People in the Labor Force in Stockbridge?
54.1% of People are in the Labor Force in Stockbridge.