Stanley, WI Map & Demographics
Stanley Map
Stanley Overview
$17,747
PER CAPITA INCOME
$66,250
AVG FAMILY INCOME
$55,919
AVG HOUSEHOLD INCOME
6.9%
WAGE / INCOME GAP [ % ]
93.1¢/ $1
WAGE / INCOME GAP [ $ ]
0.38
INEQUALITY / GINI INDEX
3,772
TOTAL POPULATION
2,629
MALE POPULATION
1,143
FEMALE POPULATION
230.01
MALES / 100 FEMALES
43.48
FEMALES / 100 MALES
38.0
MEDIAN AGE
3.2
AVG FAMILY SIZE
2.5
AVG HOUSEHOLD SIZE
1,025
LABOR FORCE [ PEOPLE ]
32.0%
PERCENT IN LABOR FORCE
2.5%
UNEMPLOYMENT RATE
Stanley Zip Codes
Stanley Area Codes
Income in Stanley
Income Overview in Stanley
Per Capita Income in Stanley is $17,747, while median incomes of families and households are $66,250 and $55,919 respectively.
| Characteristic | Number | Measure |
| Per Capita Income | 3,772 | $17,747 |
| Median Family Income | 545 | $66,250 |
| Mean Family Income | 545 | $79,751 |
| Median Household Income | 933 | $55,919 |
| Mean Household Income | 933 | $63,173 |
| Income Deficit | 545 | $0 |
| Wage / Income Gap (%) | 3,772 | 6.90% |
| Wage / Income Gap ($) | 3,772 | 93.10¢ per $1 |
| Gini / Inequality Index | 3,772 | 0.38 |
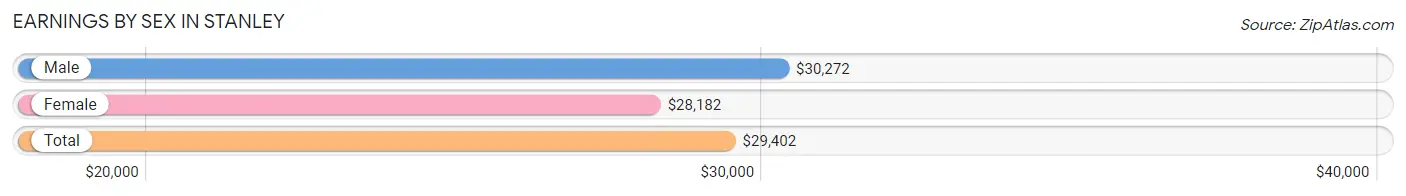
Earnings by Sex in Stanley
Average Earnings in Stanley are $29,402, $30,272 for men and $28,182 for women, a difference of 6.9%.
| Sex | Number | Average Earnings |
| Male | 1,003 (61.7%) | $30,272 |
| Female | 624 (38.4%) | $28,182 |
| Total | 1,627 (100.0%) | $29,402 |
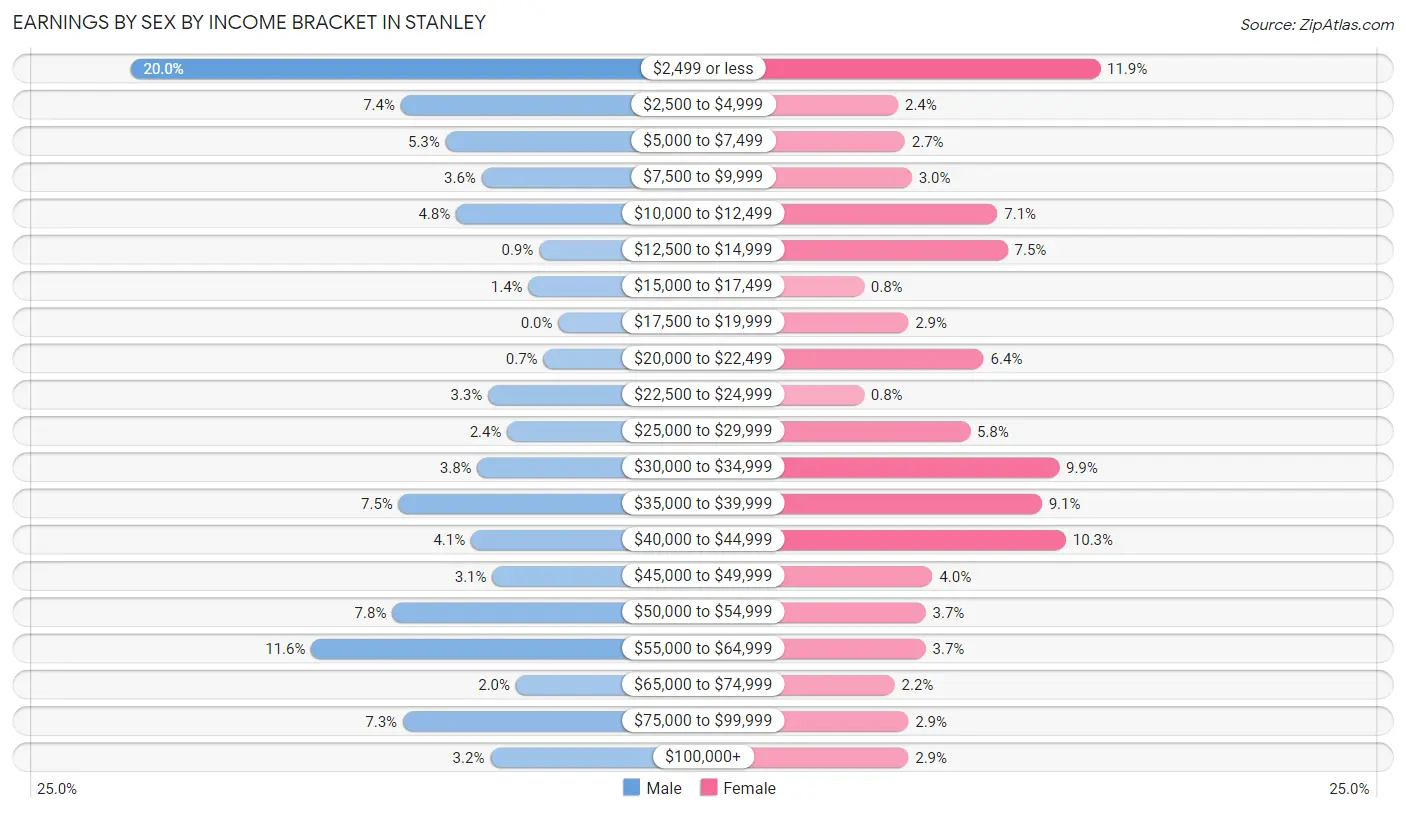
Earnings by Sex by Income Bracket in Stanley
The most common earnings brackets in Stanley are $2,499 or less for men (201 | 20.0%) and $2,499 or less for women (74 | 11.9%).
| Income | Male | Female |
| $2,499 or less | 201 (20.0%) | 74 (11.9%) |
| $2,500 to $4,999 | 74 (7.4%) | 15 (2.4%) |
| $5,000 to $7,499 | 53 (5.3%) | 17 (2.7%) |
| $7,500 to $9,999 | 36 (3.6%) | 19 (3.0%) |
| $10,000 to $12,499 | 48 (4.8%) | 44 (7.0%) |
| $12,500 to $14,999 | 9 (0.9%) | 47 (7.5%) |
| $15,000 to $17,499 | 14 (1.4%) | 5 (0.8%) |
| $17,500 to $19,999 | 0 (0.0%) | 18 (2.9%) |
| $20,000 to $22,499 | 7 (0.7%) | 40 (6.4%) |
| $22,500 to $24,999 | 33 (3.3%) | 5 (0.8%) |
| $25,000 to $29,999 | 24 (2.4%) | 36 (5.8%) |
| $30,000 to $34,999 | 38 (3.8%) | 62 (9.9%) |
| $35,000 to $39,999 | 75 (7.5%) | 57 (9.1%) |
| $40,000 to $44,999 | 41 (4.1%) | 64 (10.3%) |
| $45,000 to $49,999 | 31 (3.1%) | 25 (4.0%) |
| $50,000 to $54,999 | 78 (7.8%) | 23 (3.7%) |
| $55,000 to $64,999 | 116 (11.6%) | 23 (3.7%) |
| $65,000 to $74,999 | 20 (2.0%) | 14 (2.2%) |
| $75,000 to $99,999 | 73 (7.3%) | 18 (2.9%) |
| $100,000+ | 32 (3.2%) | 18 (2.9%) |
| Total | 1,003 (100.0%) | 624 (100.0%) |
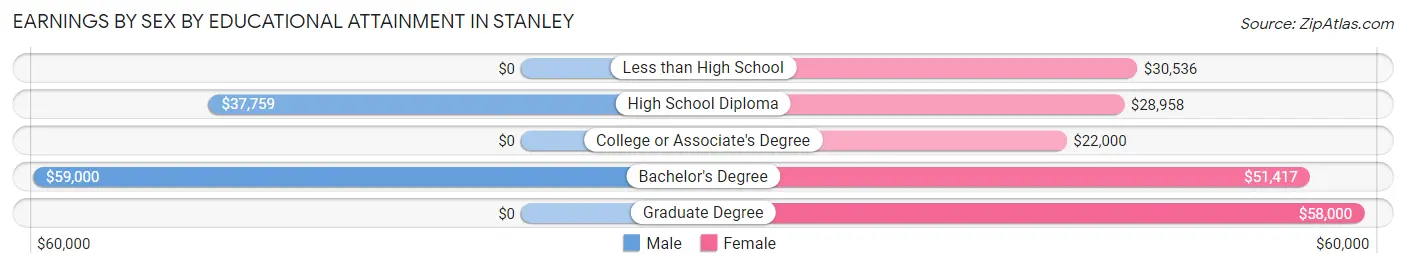
Earnings by Sex by Educational Attainment in Stanley
Average earnings in Stanley are $37,059 for men and $31,781 for women, a difference of 14.2%. Men with an educational attainment of bachelor's degree enjoy the highest average annual earnings of $59,000, while those with high school diploma education earn the least with $37,759. Women with an educational attainment of graduate degree earn the most with the average annual earnings of $58,000, while those with college or associate's degree education have the smallest earnings of $22,000.
| Educational Attainment | Male Income | Female Income |
| Less than High School | - | - |
| High School Diploma | $37,759 | $28,958 |
| College or Associate's Degree | - | - |
| Bachelor's Degree | $59,000 | $51,417 |
| Graduate Degree | - | - |
| Total | $37,059 | $31,781 |
Family Income in Stanley
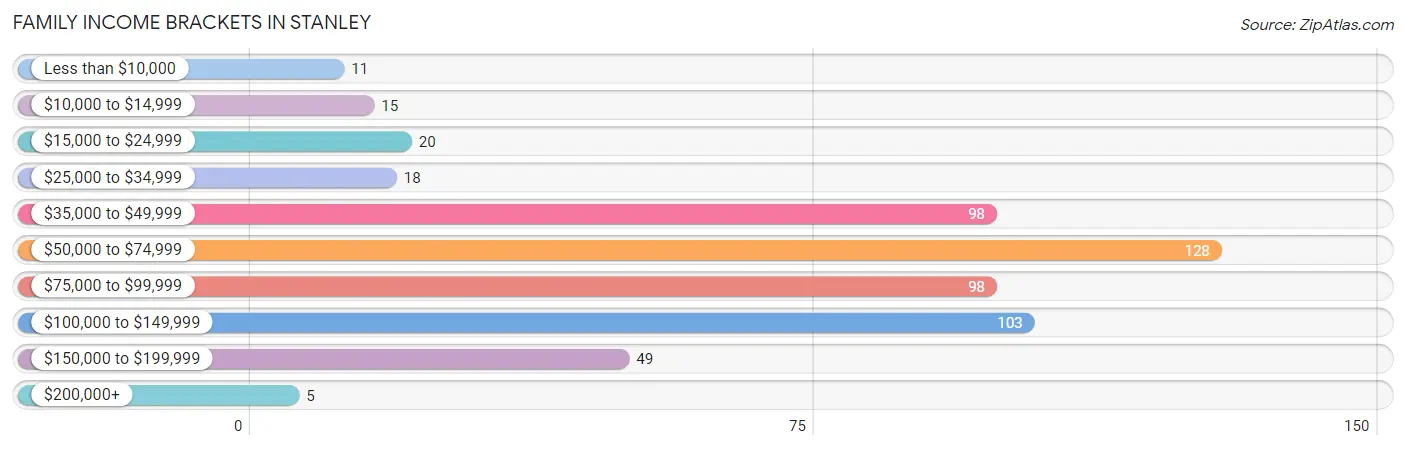
Family Income Brackets in Stanley
According to the Stanley family income data, there are 128 families falling into the $50,000 to $74,999 income range, which is the most common income bracket and makes up 23.5% of all families. Conversely, the $200,000+ income bracket is the least frequent group with only 5 families (0.9%) belonging to this category.
| Income Bracket | # Families | % Families |
| Less than $10,000 | 11 | 2.0% |
| $10,000 to $14,999 | 15 | 2.8% |
| $15,000 to $24,999 | 20 | 3.7% |
| $25,000 to $34,999 | 18 | 3.3% |
| $35,000 to $49,999 | 98 | 18.0% |
| $50,000 to $74,999 | 128 | 23.5% |
| $75,000 to $99,999 | 98 | 18.0% |
| $100,000 to $149,999 | 103 | 18.9% |
| $150,000 to $199,999 | 49 | 9.0% |
| $200,000+ | 5 | 0.9% |
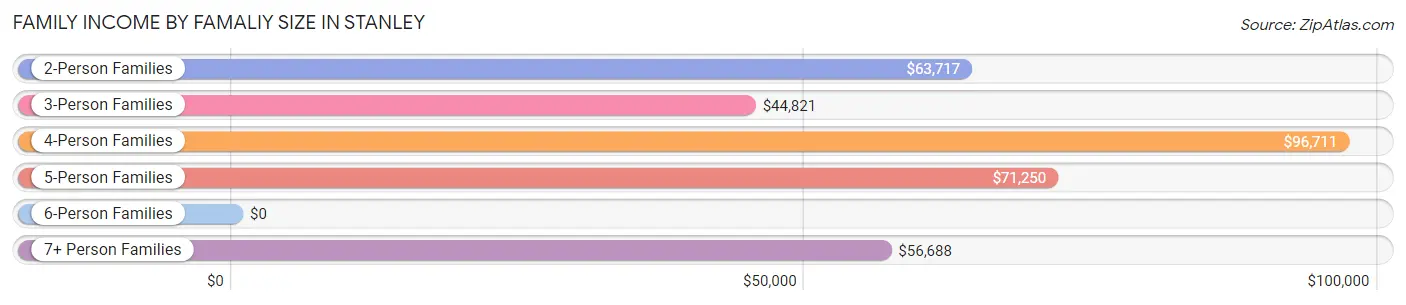
Family Income by Famaliy Size in Stanley
4-person families (76 | 13.9%) account for the highest median family income in Stanley with $96,711 per family, while 2-person families (275 | 50.5%) have the highest median income of $31,858 per family member.
| Income Bracket | # Families | Median Income |
| 2-Person Families | 275 (50.5%) | $63,717 |
| 3-Person Families | 99 (18.2%) | $44,821 |
| 4-Person Families | 76 (13.9%) | $96,711 |
| 5-Person Families | 49 (9.0%) | $71,250 |
| 6-Person Families | 9 (1.7%) | $0 |
| 7+ Person Families | 37 (6.8%) | $56,688 |
| Total | 545 (100.0%) | $66,250 |
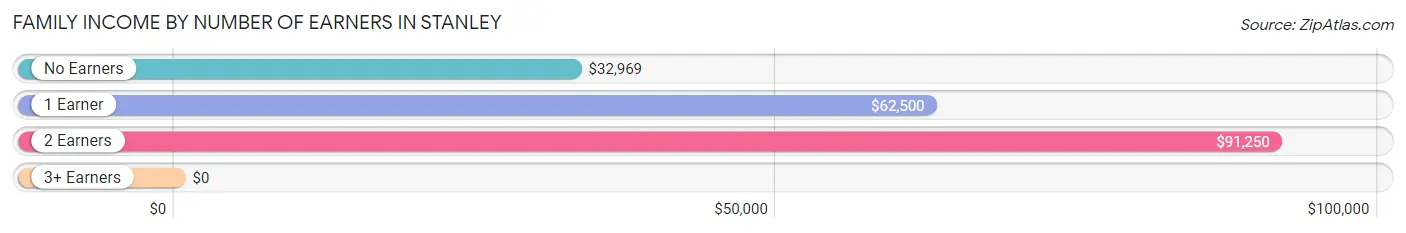
Family Income by Number of Earners in Stanley
| Number of Earners | # Families | Median Income |
| No Earners | 59 (10.8%) | $32,969 |
| 1 Earner | 158 (29.0%) | $62,500 |
| 2 Earners | 257 (47.2%) | $91,250 |
| 3+ Earners | 71 (13.0%) | $0 |
| Total | 545 (100.0%) | $66,250 |
Household Income in Stanley
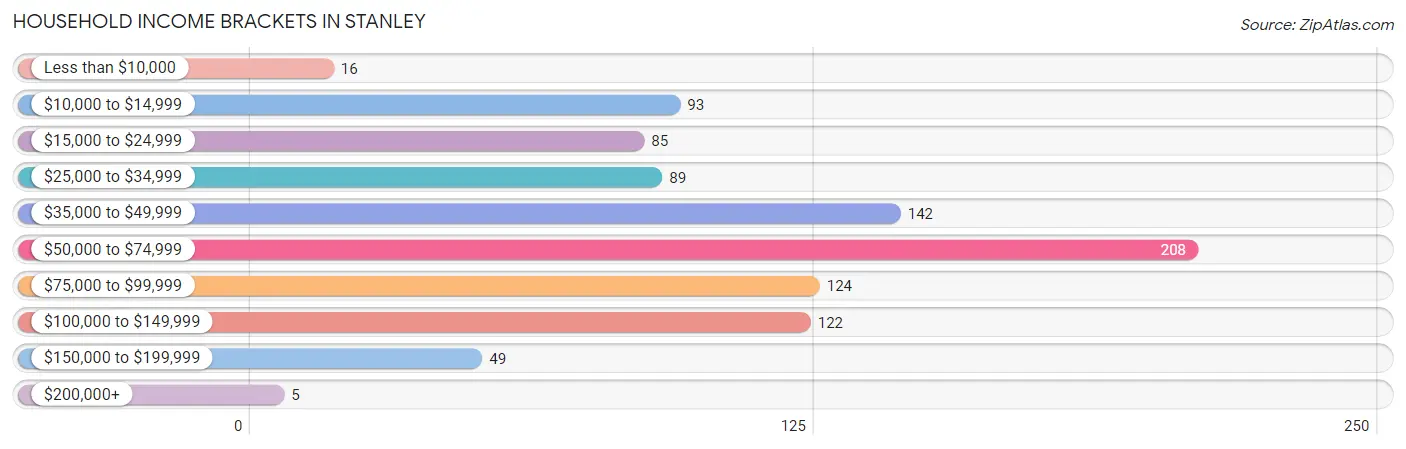
Household Income Brackets in Stanley
With 208 households falling in the category, the $50,000 to $74,999 income range is the most frequent in Stanley, accounting for 22.3% of all households. In contrast, only 5 households (0.5%) fall into the $200,000+ income bracket, making it the least populous group.
| Income Bracket | # Households | % Households |
| Less than $10,000 | 16 | 1.7% |
| $10,000 to $14,999 | 93 | 10.0% |
| $15,000 to $24,999 | 85 | 9.1% |
| $25,000 to $34,999 | 89 | 9.5% |
| $35,000 to $49,999 | 142 | 15.2% |
| $50,000 to $74,999 | 208 | 22.3% |
| $75,000 to $99,999 | 124 | 13.3% |
| $100,000 to $149,999 | 122 | 13.1% |
| $150,000 to $199,999 | 49 | 5.3% |
| $200,000+ | 5 | 0.5% |
Household Income by Householder Age in Stanley
The median household income in Stanley is $55,919, with the highest median household income of $80,192 found in the 45 to 64 years age bracket for the primary householder. A total of 226 households (24.2%) fall into this category. Meanwhile, the 65+ years age bracket for the primary householder has the lowest median household income of $25,854, with 334 households (35.8%) in this group.
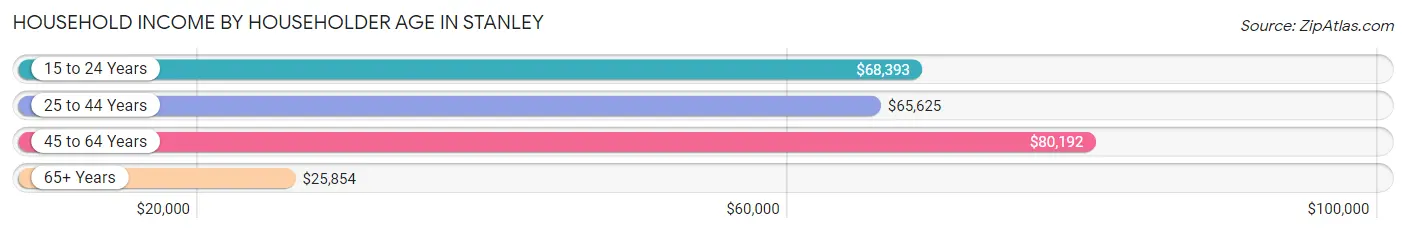
| Income Bracket | # Households | Median Income |
| 15 to 24 Years | 25 (2.7%) | $68,393 |
| 25 to 44 Years | 348 (37.3%) | $65,625 |
| 45 to 64 Years | 226 (24.2%) | $80,192 |
| 65+ Years | 334 (35.8%) | $25,854 |
| Total | 933 (100.0%) | $55,919 |
Poverty in Stanley
Income Below Poverty by Sex and Age in Stanley
With 15.2% poverty level for males and 11.0% for females among the residents of Stanley, 75 year old and over males and 15 year old females are the most vulnerable to poverty, with 67 males (39.0%) and 3 females (37.5%) in their respective age groups living below the poverty level.
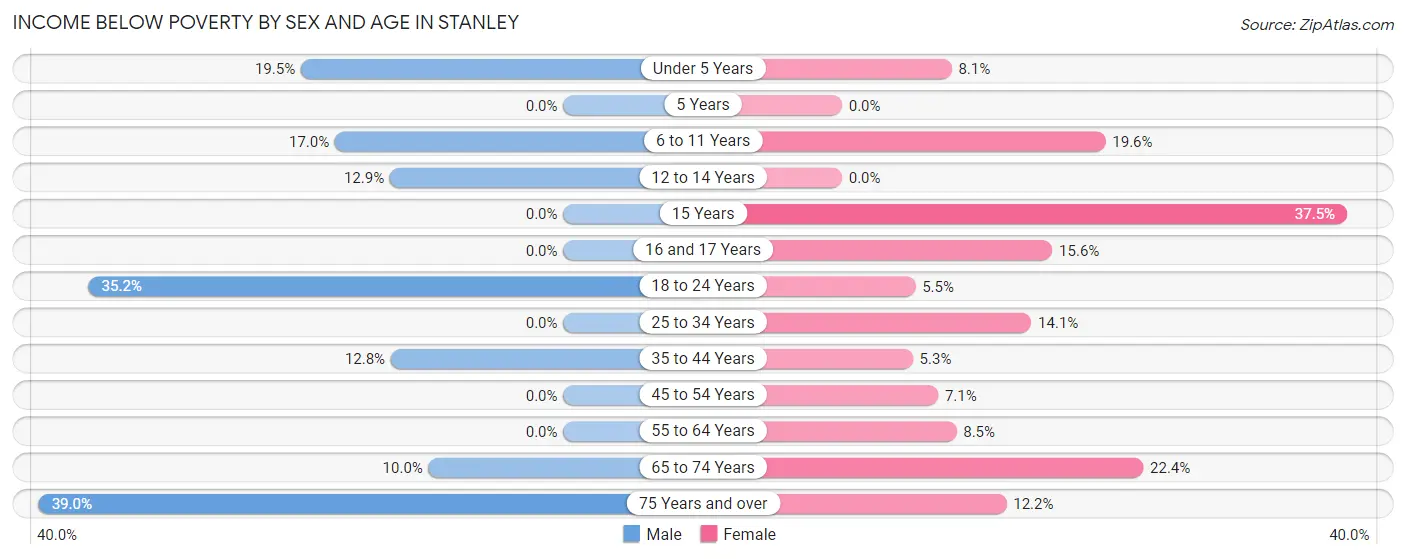
| Age Bracket | Male | Female |
| Under 5 Years | 15 (19.5%) | 7 (8.1%) |
| 5 Years | 0 (0.0%) | 0 (0.0%) |
| 6 to 11 Years | 20 (17.0%) | 18 (19.6%) |
| 12 to 14 Years | 13 (12.9%) | 0 (0.0%) |
| 15 Years | 0 (0.0%) | 3 (37.5%) |
| 16 and 17 Years | 0 (0.0%) | 5 (15.6%) |
| 18 to 24 Years | 37 (35.2%) | 6 (5.4%) |
| 25 to 34 Years | 0 (0.0%) | 27 (14.1%) |
| 35 to 44 Years | 21 (12.8%) | 8 (5.3%) |
| 45 to 54 Years | 0 (0.0%) | 4 (7.1%) |
| 55 to 64 Years | 0 (0.0%) | 13 (8.5%) |
| 65 to 74 Years | 7 (10.0%) | 17 (22.4%) |
| 75 Years and over | 67 (39.0%) | 16 (12.2%) |
| Total | 180 (15.2%) | 124 (11.0%) |
Income Above Poverty by Sex and Age in Stanley
According to the poverty statistics in Stanley, males aged 5 years and females aged 5 years are the age groups that are most secure financially, with 100.0% of males and 100.0% of females in these age groups living above the poverty line.
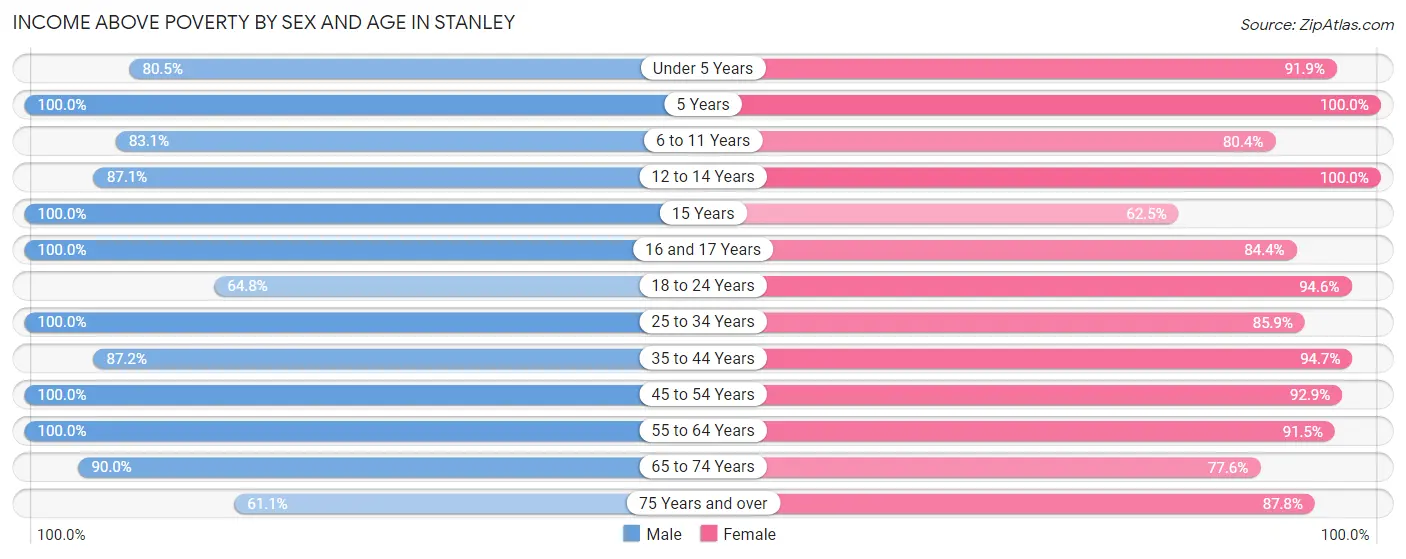
| Age Bracket | Male | Female |
| Under 5 Years | 62 (80.5%) | 79 (91.9%) |
| 5 Years | 16 (100.0%) | 10 (100.0%) |
| 6 to 11 Years | 98 (83.1%) | 74 (80.4%) |
| 12 to 14 Years | 88 (87.1%) | 34 (100.0%) |
| 15 Years | 8 (100.0%) | 5 (62.5%) |
| 16 and 17 Years | 41 (100.0%) | 27 (84.4%) |
| 18 to 24 Years | 68 (64.8%) | 104 (94.6%) |
| 25 to 34 Years | 142 (100.0%) | 165 (85.9%) |
| 35 to 44 Years | 143 (87.2%) | 144 (94.7%) |
| 45 to 54 Years | 94 (100.0%) | 52 (92.9%) |
| 55 to 64 Years | 73 (100.0%) | 140 (91.5%) |
| 65 to 74 Years | 63 (90.0%) | 59 (77.6%) |
| 75 Years and over | 105 (61.1%) | 115 (87.8%) |
| Total | 1,001 (84.8%) | 1,008 (89.0%) |
Income Below Poverty Among Married-Couple Families in Stanley
The poverty statistics for married-couple families in Stanley show that 1.4% or 5 of the total 358 families live below the poverty line. Families with no children have the highest poverty rate of 3.1%, comprising of 5 families. On the other hand, families with 1 or 2 children have the lowest poverty rate of 0.0%, which includes 0 families.
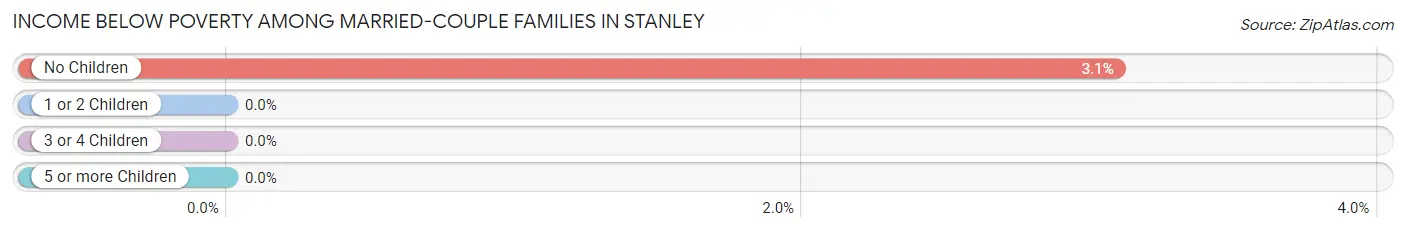
| Children | Above Poverty | Below Poverty |
| No Children | 157 (96.9%) | 5 (3.1%) |
| 1 or 2 Children | 112 (100.0%) | 0 (0.0%) |
| 3 or 4 Children | 67 (100.0%) | 0 (0.0%) |
| 5 or more Children | 17 (100.0%) | 0 (0.0%) |
| Total | 353 (98.6%) | 5 (1.4%) |
Income Below Poverty Among Single-Parent Households in Stanley
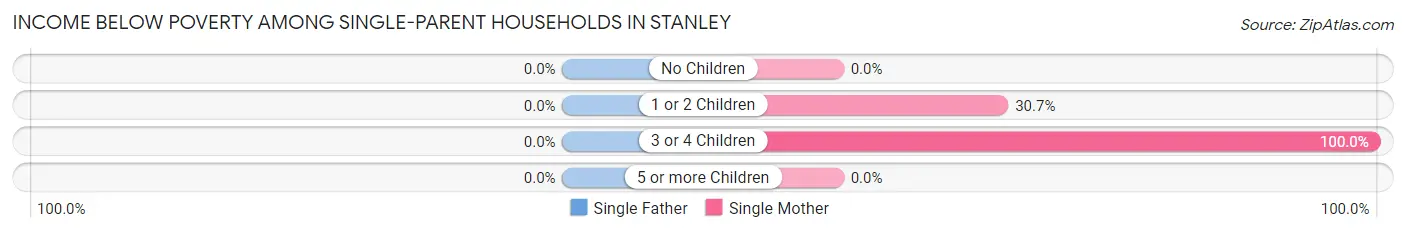
| Children | Single Father | Single Mother |
| No Children | 0 (0.0%) | 0 (0.0%) |
| 1 or 2 Children | 0 (0.0%) | 19 (30.6%) |
| 3 or 4 Children | 0 (0.0%) | 6 (100.0%) |
| 5 or more Children | 0 (0.0%) | 0 (0.0%) |
| Total | 0 (0.0%) | 25 (21.9%) |
Income Below Poverty Among Married-Couple vs Single-Parent Households in Stanley
The poverty data for Stanley shows that 5 of the married-couple family households (1.4%) and 25 of the single-parent households (13.4%) are living below the poverty level. Within the married-couple family households, those with no children have the highest poverty rate, with 5 households (3.1%) falling below the poverty line. Among the single-parent households, those with 3 or 4 children have the highest poverty rate, with 6 household (54.5%) living below poverty.
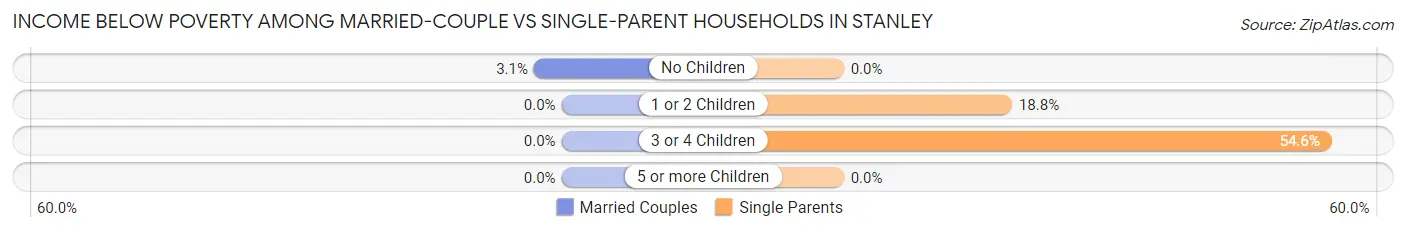
| Children | Married-Couple Families | Single-Parent Households |
| No Children | 5 (3.1%) | 0 (0.0%) |
| 1 or 2 Children | 0 (0.0%) | 19 (18.8%) |
| 3 or 4 Children | 0 (0.0%) | 6 (54.5%) |
| 5 or more Children | 0 (0.0%) | 0 (0.0%) |
| Total | 5 (1.4%) | 25 (13.4%) |
Race in Stanley
The most populous races in Stanley are White / Caucasian (2,786 | 73.9%), Black / African American (543 | 14.4%), and Hispanic or Latino (347 | 9.2%).
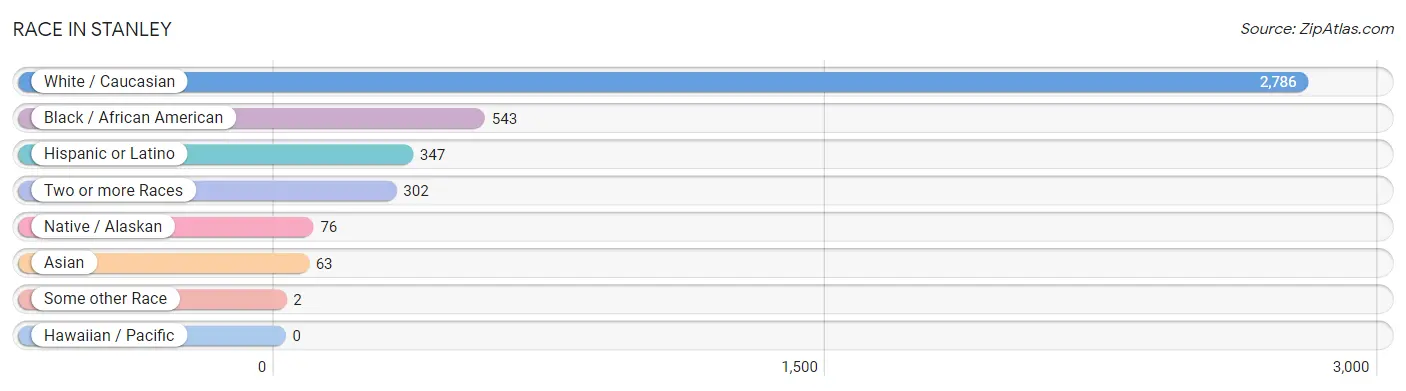
| Race | # Population | % Population |
| Asian | 63 | 1.7% |
| Black / African American | 543 | 14.4% |
| Hawaiian / Pacific | 0 | 0.0% |
| Hispanic or Latino | 347 | 9.2% |
| Native / Alaskan | 76 | 2.0% |
| White / Caucasian | 2,786 | 73.9% |
| Two or more Races | 302 | 8.0% |
| Some other Race | 2 | 0.1% |
| Total | 3,772 | 100.0% |
Ancestry in Stanley
The most populous ancestries reported in Stanley are German (956 | 25.3%), Norwegian (314 | 8.3%), Irish (253 | 6.7%), Polish (233 | 6.2%), and Mexican (212 | 5.6%), together accounting for 52.2% of all Stanley residents.
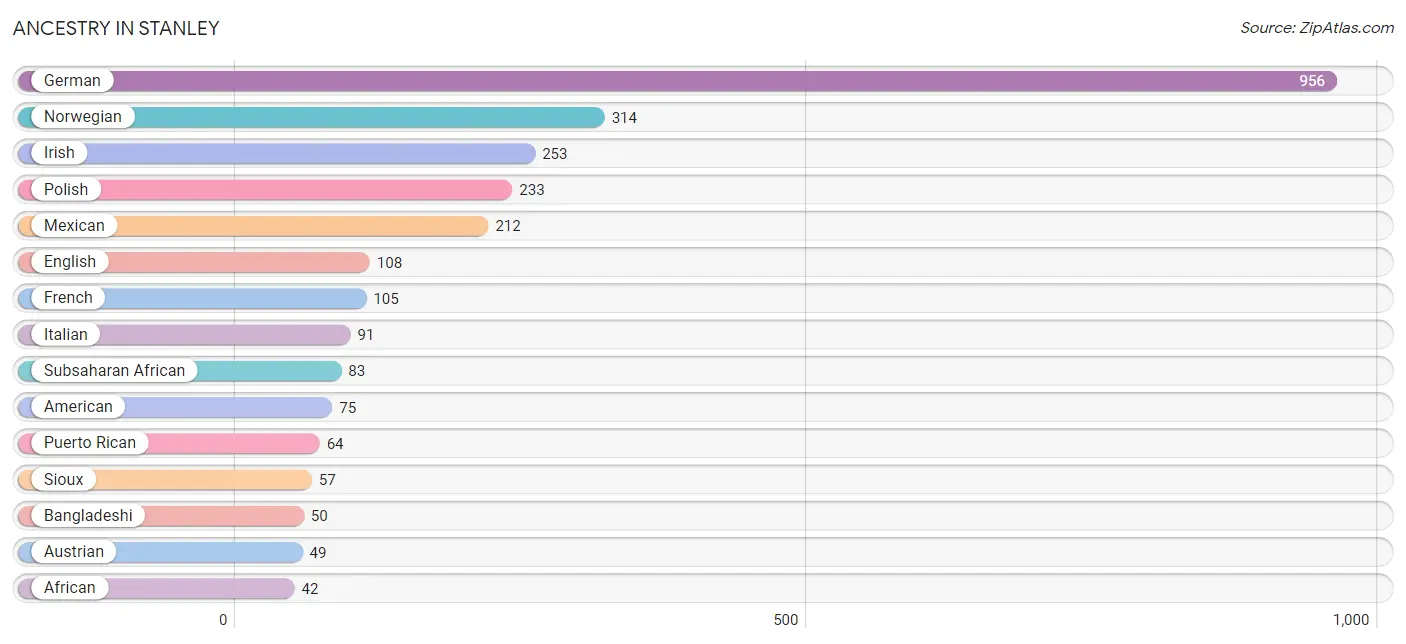
| Ancestry | # Population | % Population |
| African | 42 | 1.1% |
| Alaska Native | 26 | 0.7% |
| American | 75 | 2.0% |
| Austrian | 49 | 1.3% |
| Bangladeshi | 50 | 1.3% |
| Belgian | 5 | 0.1% |
| Blackfeet | 17 | 0.4% |
| Burmese | 24 | 0.6% |
| Canadian | 2 | 0.1% |
| Cherokee | 20 | 0.5% |
| Cheyenne | 2 | 0.1% |
| Chippewa | 33 | 0.9% |
| Cree | 2 | 0.1% |
| Cuban | 17 | 0.4% |
| Czech | 8 | 0.2% |
| Danish | 9 | 0.2% |
| Dutch | 22 | 0.6% |
| Eastern European | 10 | 0.3% |
| English | 108 | 2.9% |
| Ethiopian | 2 | 0.1% |
| European | 21 | 0.6% |
| Finnish | 2 | 0.1% |
| French | 105 | 2.8% |
| French Canadian | 34 | 0.9% |
| German | 956 | 25.3% |
| Hungarian | 8 | 0.2% |
| Indian (Asian) | 2 | 0.1% |
| Irish | 253 | 6.7% |
| Italian | 91 | 2.4% |
| Kiowa | 2 | 0.1% |
| Korean | 7 | 0.2% |
| Latvian | 9 | 0.2% |
| Malaysian | 3 | 0.1% |
| Menominee | 27 | 0.7% |
| Mexican | 212 | 5.6% |
| Mexican American Indian | 1 | 0.0% |
| Nigerian | 39 | 1.0% |
| Norwegian | 314 | 8.3% |
| Pakistani | 3 | 0.1% |
| Pennsylvania German | 5 | 0.1% |
| Polish | 233 | 6.2% |
| Puerto Rican | 64 | 1.7% |
| Russian | 33 | 0.9% |
| Scandinavian | 7 | 0.2% |
| Scotch-Irish | 12 | 0.3% |
| Scottish | 16 | 0.4% |
| Sioux | 57 | 1.5% |
| Slavic | 2 | 0.1% |
| Slovene | 16 | 0.4% |
| South American | 21 | 0.6% |
| Spanish | 2 | 0.1% |
| Subsaharan African | 83 | 2.2% |
| Swedish | 31 | 0.8% |
| Swiss | 9 | 0.2% |
| Ukrainian | 30 | 0.8% |
| Uruguayan | 21 | 0.6% |
| Welsh | 5 | 0.1% | View All 57 Rows |
Immigrants in Stanley
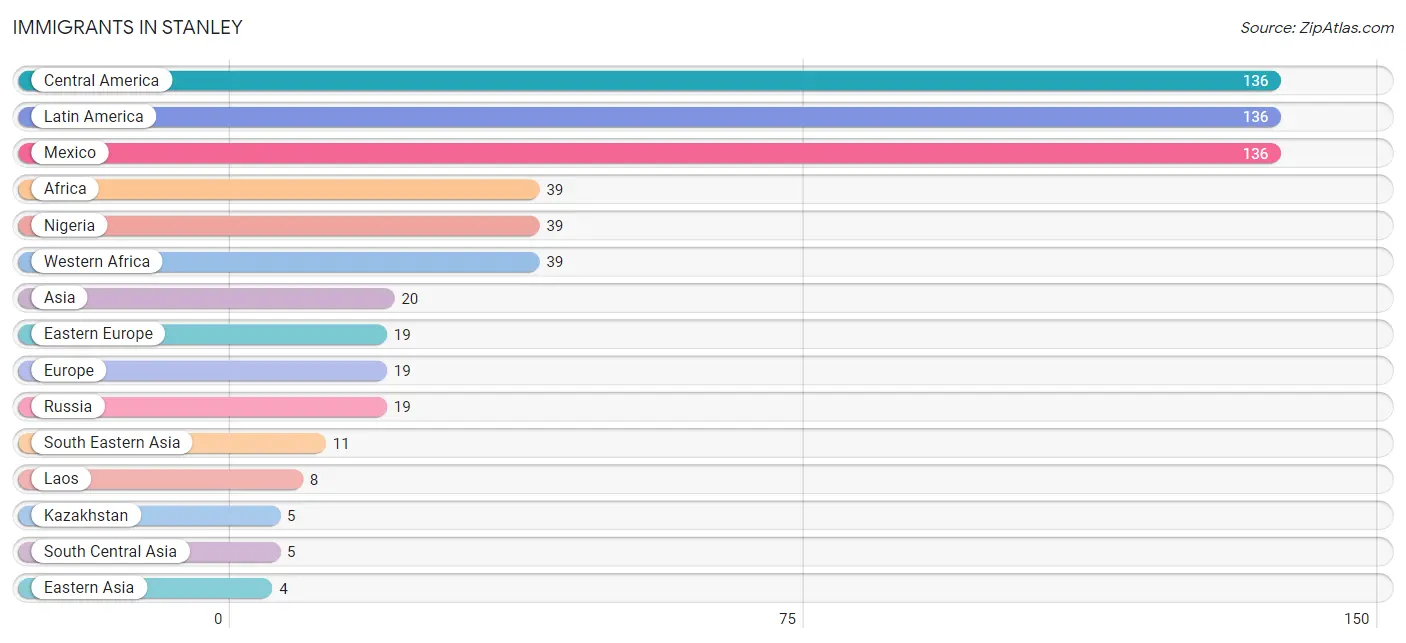
The most numerous immigrant groups reported in Stanley came from Central America (136 | 3.6%), Latin America (136 | 3.6%), Mexico (136 | 3.6%), Africa (39 | 1.0%), and Nigeria (39 | 1.0%), together accounting for 12.9% of all Stanley residents.
| Immigration Origin | # Population | % Population |
| Africa | 39 | 1.0% |
| Asia | 20 | 0.5% |
| Central America | 136 | 3.6% |
| Eastern Asia | 4 | 0.1% |
| Eastern Europe | 19 | 0.5% |
| Europe | 19 | 0.5% |
| Kazakhstan | 5 | 0.1% |
| Korea | 4 | 0.1% |
| Laos | 8 | 0.2% |
| Latin America | 136 | 3.6% |
| Mexico | 136 | 3.6% |
| Nigeria | 39 | 1.0% |
| Russia | 19 | 0.5% |
| South Central Asia | 5 | 0.1% |
| South Eastern Asia | 11 | 0.3% |
| Thailand | 3 | 0.1% |
| Western Africa | 39 | 1.0% | View All 17 Rows |
Sex and Age in Stanley
Sex and Age in Stanley
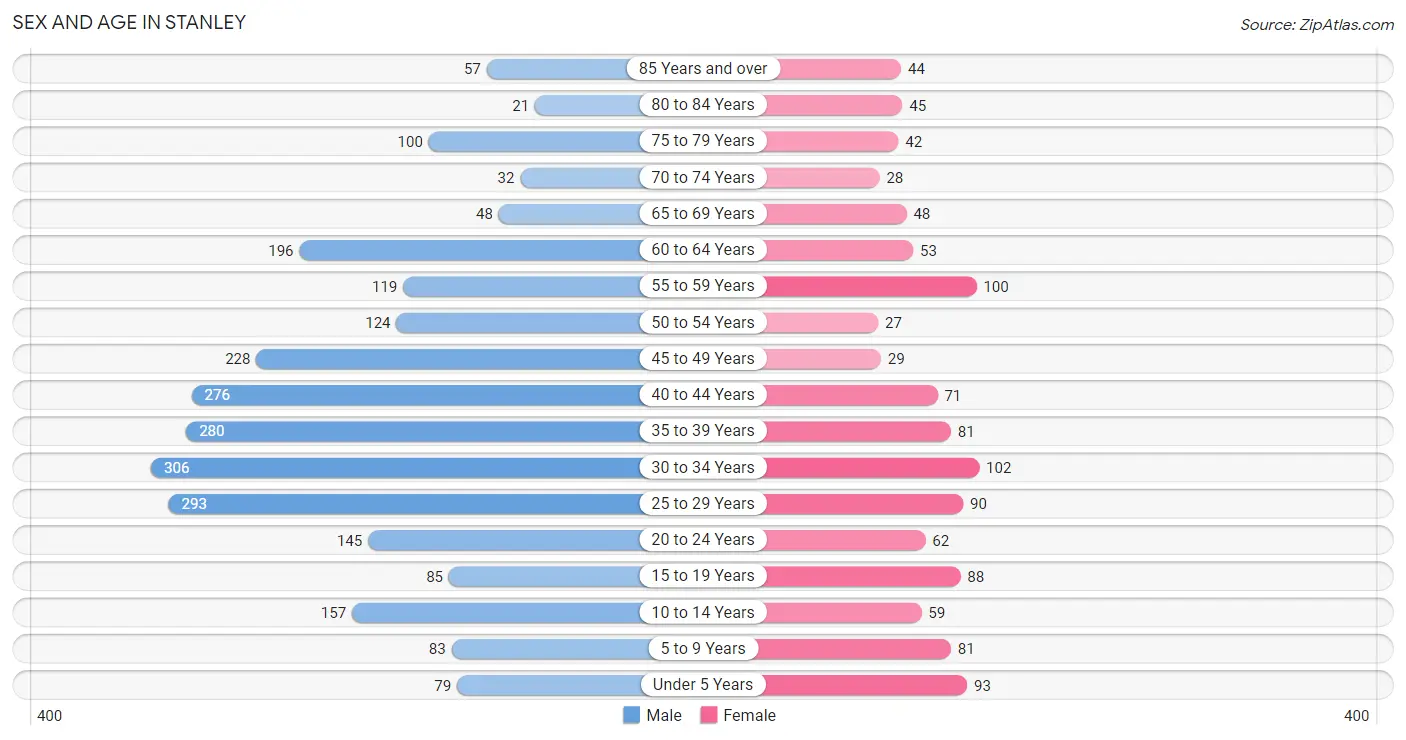
The most populous age groups in Stanley are 30 to 34 Years (306 | 11.6%) for men and 30 to 34 Years (102 | 8.9%) for women.
| Age Bracket | Male | Female |
| Under 5 Years | 79 (3.0%) | 93 (8.1%) |
| 5 to 9 Years | 83 (3.2%) | 81 (7.1%) |
| 10 to 14 Years | 157 (6.0%) | 59 (5.2%) |
| 15 to 19 Years | 85 (3.2%) | 88 (7.7%) |
| 20 to 24 Years | 145 (5.5%) | 62 (5.4%) |
| 25 to 29 Years | 293 (11.1%) | 90 (7.9%) |
| 30 to 34 Years | 306 (11.6%) | 102 (8.9%) |
| 35 to 39 Years | 280 (10.6%) | 81 (7.1%) |
| 40 to 44 Years | 276 (10.5%) | 71 (6.2%) |
| 45 to 49 Years | 228 (8.7%) | 29 (2.5%) |
| 50 to 54 Years | 124 (4.7%) | 27 (2.4%) |
| 55 to 59 Years | 119 (4.5%) | 100 (8.7%) |
| 60 to 64 Years | 196 (7.5%) | 53 (4.6%) |
| 65 to 69 Years | 48 (1.8%) | 48 (4.2%) |
| 70 to 74 Years | 32 (1.2%) | 28 (2.5%) |
| 75 to 79 Years | 100 (3.8%) | 42 (3.7%) |
| 80 to 84 Years | 21 (0.8%) | 45 (3.9%) |
| 85 Years and over | 57 (2.2%) | 44 (3.8%) |
| Total | 2,629 (100.0%) | 1,143 (100.0%) |
Families and Households in Stanley
Median Family Size in Stanley
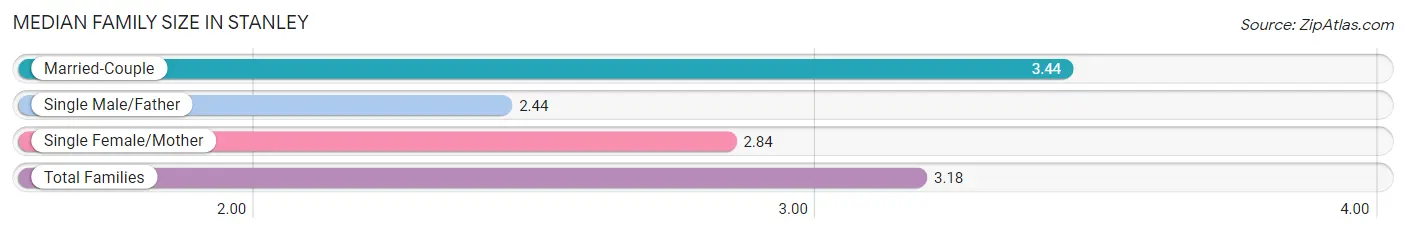
The median family size in Stanley is 3.18 persons per family, with married-couple families (358 | 65.7%) accounting for the largest median family size of 3.44 persons per family. On the other hand, single male/father families (73 | 13.4%) represent the smallest median family size with 2.44 persons per family.
| Family Type | # Families | Family Size |
| Married-Couple | 358 (65.7%) | 3.44 |
| Single Male/Father | 73 (13.4%) | 2.44 |
| Single Female/Mother | 114 (20.9%) | 2.84 |
| Total Families | 545 (100.0%) | 3.18 |
Median Household Size in Stanley
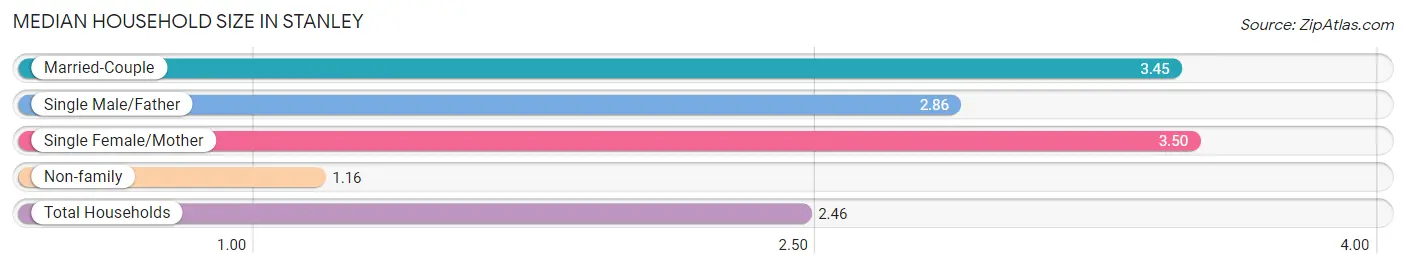
The median household size in Stanley is 2.46 persons per household, with single female/mother households (114 | 12.2%) accounting for the largest median household size of 3.5 persons per household. non-family households (388 | 41.6%) represent the smallest median household size with 1.16 persons per household.
| Household Type | # Households | Household Size |
| Married-Couple | 358 (38.4%) | 3.45 |
| Single Male/Father | 73 (7.8%) | 2.86 |
| Single Female/Mother | 114 (12.2%) | 3.50 |
| Non-family | 388 (41.6%) | 1.16 |
| Total Households | 933 (100.0%) | 2.46 |
Household Size by Marriage Status in Stanley
Out of a total of 933 households in Stanley, 545 (58.4%) are family households, while 388 (41.6%) are nonfamily households. The most numerous type of family households are 2-person households, comprising 242, and the most common type of nonfamily households are 1-person households, comprising 326.
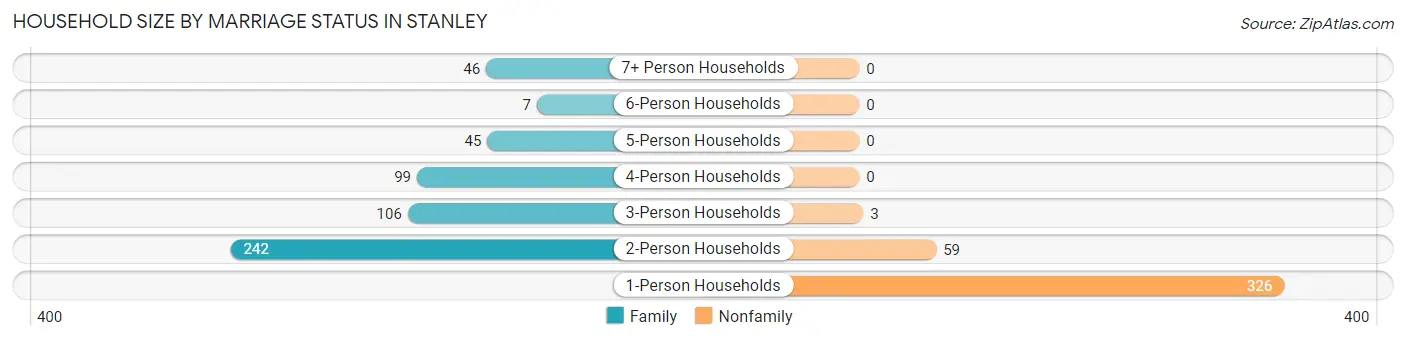
| Household Size | Family Households | Nonfamily Households |
| 1-Person Households | - | 326 (34.9%) |
| 2-Person Households | 242 (25.9%) | 59 (6.3%) |
| 3-Person Households | 106 (11.4%) | 3 (0.3%) |
| 4-Person Households | 99 (10.6%) | 0 (0.0%) |
| 5-Person Households | 45 (4.8%) | 0 (0.0%) |
| 6-Person Households | 7 (0.7%) | 0 (0.0%) |
| 7+ Person Households | 46 (4.9%) | 0 (0.0%) |
| Total | 545 (58.4%) | 388 (41.6%) |
Female Fertility in Stanley
Fertility by Age in Stanley
Average fertility rate in Stanley is 80.0 births per 1,000 women. Women in the age bracket of 20 to 34 years have the highest fertility rate with 150.0 births per 1,000 women. Women in the age bracket of 20 to 34 years acount for 90.5% of all women with births.
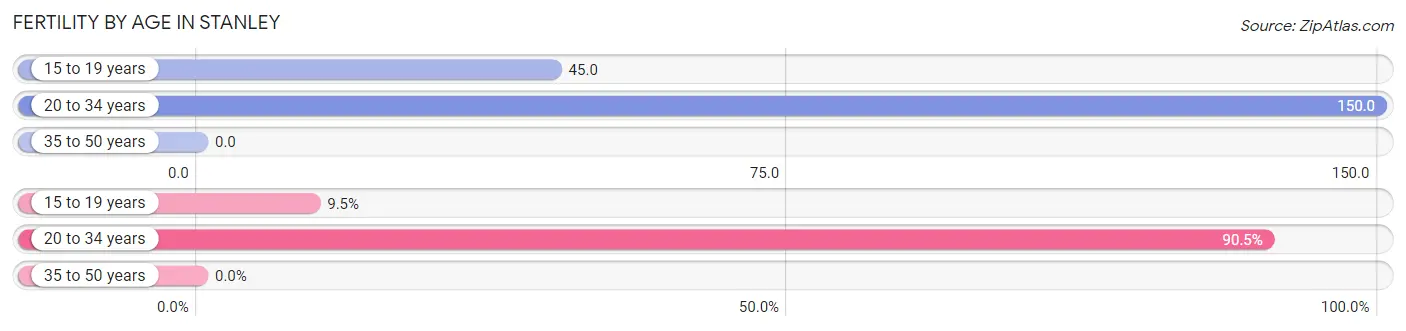
| Age Bracket | Women with Births | Births / 1,000 Women |
| 15 to 19 years | 4 (9.5%) | 45.0 |
| 20 to 34 years | 38 (90.5%) | 150.0 |
| 35 to 50 years | 0 (0.0%) | 0.0 |
| Total | 42 (100.0%) | 80.0 |
Fertility by Age by Marriage Status in Stanley
61.9% of women with births (42) in Stanley are married. The highest percentage of unmarried women with births falls into 15 to 19 years age bracket with 100.0% of them unmarried at the time of birth, while the lowest percentage of unmarried women with births belong to 20 to 34 years age bracket with 31.6% of them unmarried.
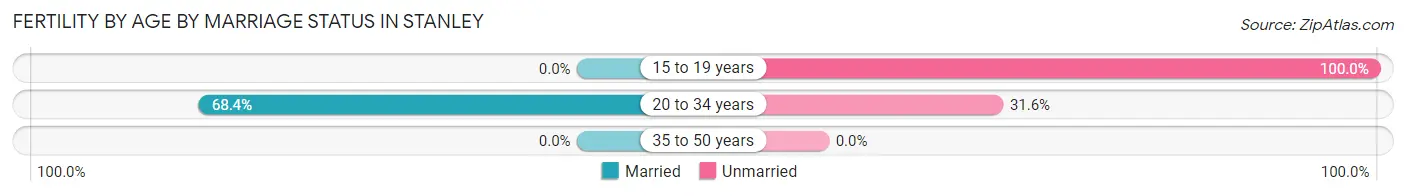
| Age Bracket | Married | Unmarried |
| 15 to 19 years | 0 (0.0%) | 4 (100.0%) |
| 20 to 34 years | 26 (68.4%) | 12 (31.6%) |
| 35 to 50 years | 0 (0.0%) | 0 (0.0%) |
| Total | 26 (61.9%) | 16 (38.1%) |
Fertility by Education in Stanley
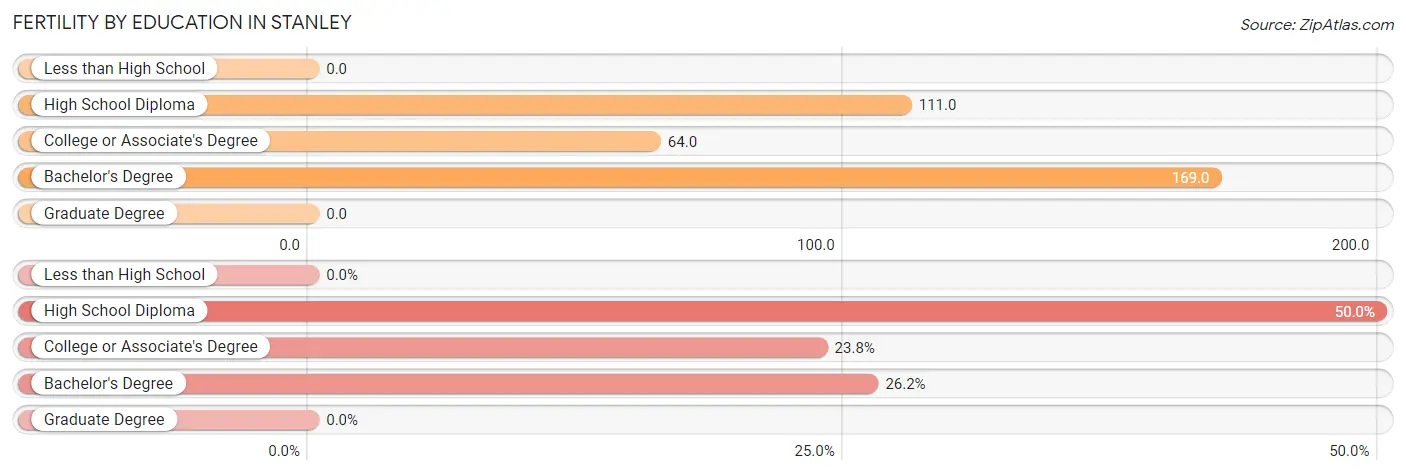
| Educational Attainment | Women with Births | Births / 1,000 Women |
| Less than High School | 0 (0.0%) | 0.0 |
| High School Diploma | 21 (50.0%) | 111.0 |
| College or Associate's Degree | 10 (23.8%) | 64.0 |
| Bachelor's Degree | 11 (26.2%) | 169.0 |
| Graduate Degree | 0 (0.0%) | 0.0 |
| Total | 42 (100.0%) | 80.0 |
Fertility by Education by Marriage Status in Stanley
38.1% of women with births in Stanley are unmarried. Women with the educational attainment of bachelor's degree are most likely to be married with 100.0% of them married at childbirth, while women with the educational attainment of college or associate's degree are least likely to be married with 60.0% of them unmarried at childbirth.
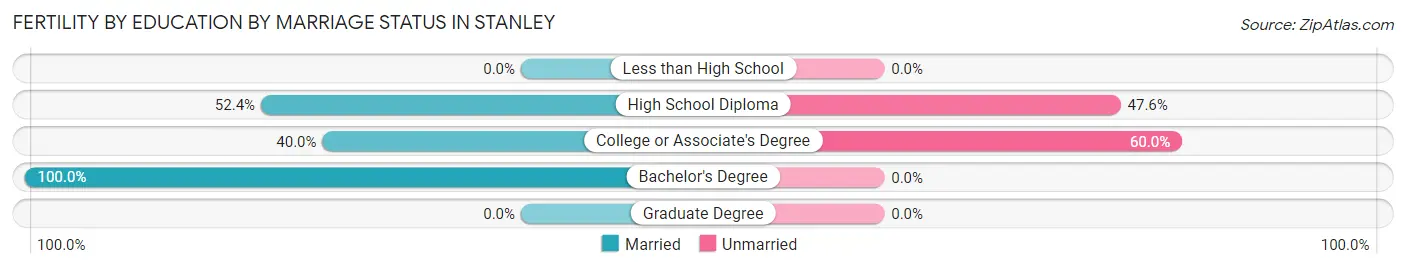
| Educational Attainment | Married | Unmarried |
| Less than High School | 0 (0.0%) | 0 (0.0%) |
| High School Diploma | 11 (52.4%) | 10 (47.6%) |
| College or Associate's Degree | 4 (40.0%) | 6 (60.0%) |
| Bachelor's Degree | 11 (100.0%) | 0 (0.0%) |
| Graduate Degree | 0 (0.0%) | 0 (0.0%) |
| Total | 26 (61.9%) | 16 (38.1%) |
Employment Characteristics in Stanley
Employment by Class of Employer in Stanley
Among the 978 employed individuals in Stanley, private company employees (646 | 66.0%), not-for-profit organizations (96 | 9.8%), and local government employees (81 | 8.3%) make up the most common classes of employment.
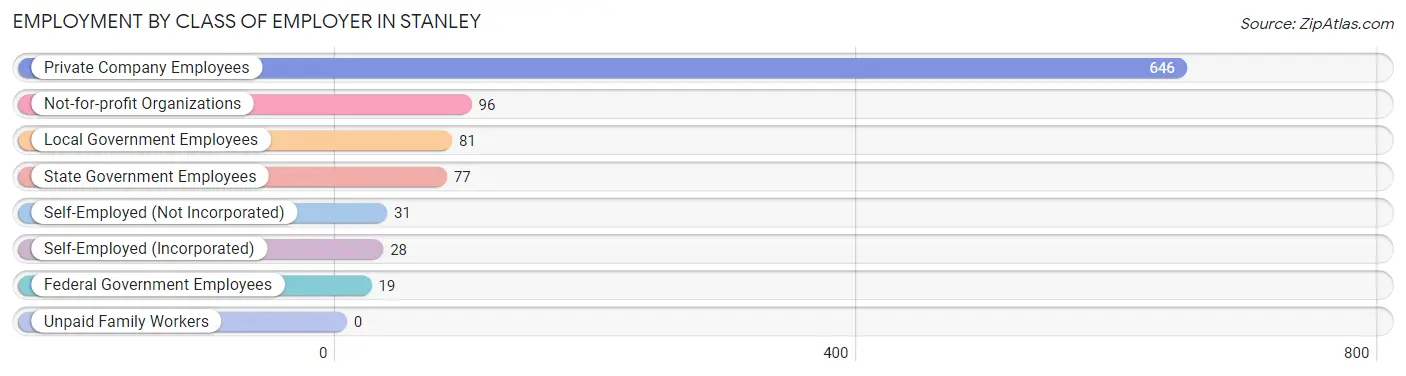
| Employer Class | # Employees | % Employees |
| Private Company Employees | 646 | 66.0% |
| Self-Employed (Incorporated) | 28 | 2.9% |
| Self-Employed (Not Incorporated) | 31 | 3.2% |
| Not-for-profit Organizations | 96 | 9.8% |
| Local Government Employees | 81 | 8.3% |
| State Government Employees | 77 | 7.9% |
| Federal Government Employees | 19 | 1.9% |
| Unpaid Family Workers | 0 | 0.0% |
| Total | 978 | 100.0% |
Employment Status by Age in Stanley
According to the labor force statistics for Stanley, out of the total population over 16 years of age (3,204), 32.0% or 1,025 individuals are in the labor force, with 2.5% or 26 of them unemployed. The age group with the highest labor force participation rate is 55 to 59 years, with 58.9% or 129 individuals in the labor force. Within the labor force, the 16 to 19 years age range has the highest percentage of unemployed individuals, with 6.9% or 4 of them being unemployed.
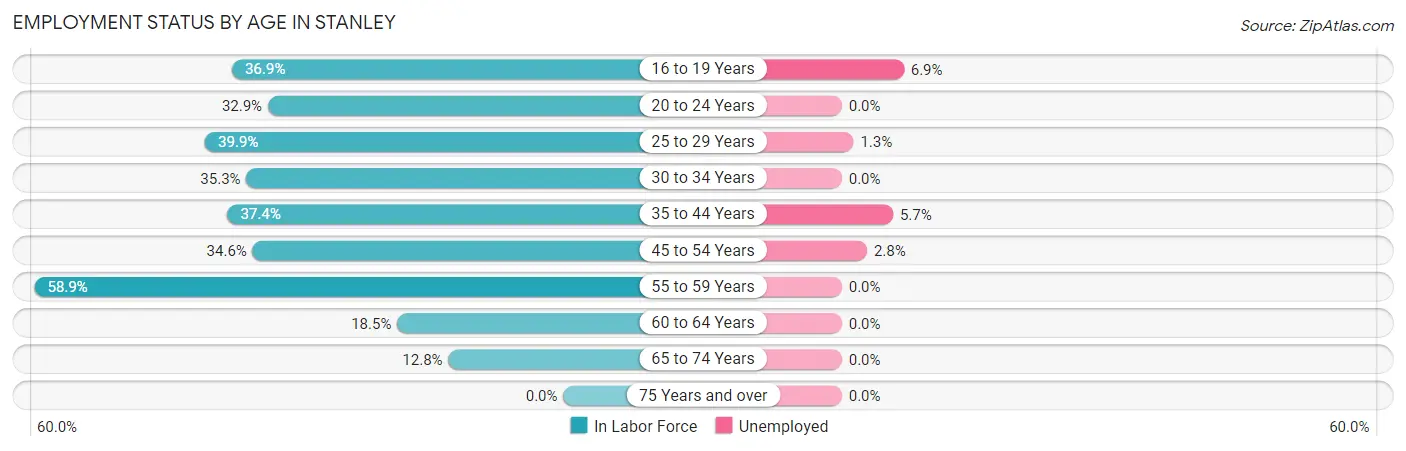
| Age Bracket | In Labor Force | Unemployed |
| 16 to 19 Years | 58 (36.9%) | 4 (6.9%) |
| 20 to 24 Years | 68 (32.9%) | 0 (0.0%) |
| 25 to 29 Years | 153 (39.9%) | 2 (1.3%) |
| 30 to 34 Years | 144 (35.3%) | 0 (0.0%) |
| 35 to 44 Years | 265 (37.4%) | 15 (5.7%) |
| 45 to 54 Years | 141 (34.6%) | 4 (2.8%) |
| 55 to 59 Years | 129 (58.9%) | 0 (0.0%) |
| 60 to 64 Years | 46 (18.5%) | 0 (0.0%) |
| 65 to 74 Years | 20 (12.8%) | 0 (0.0%) |
| 75 Years and over | 0 (0.0%) | 0 (0.0%) |
| Total | 1,025 (32.0%) | 26 (2.5%) |
Employment Status by Educational Attainment in Stanley
According to labor force statistics for Stanley, 37.0% of individuals (879) out of the total population between 25 and 64 years of age (2,375) are in the labor force, with 2.4% or 21 of them being unemployed. The group with the highest labor force participation rate are those with the educational attainment of bachelor's degree or higher, with 73.7% or 193 individuals in the labor force. Within the labor force, individuals with less than high school education have the highest percentage of unemployment, with 19.7% or 15 of them being unemployed.
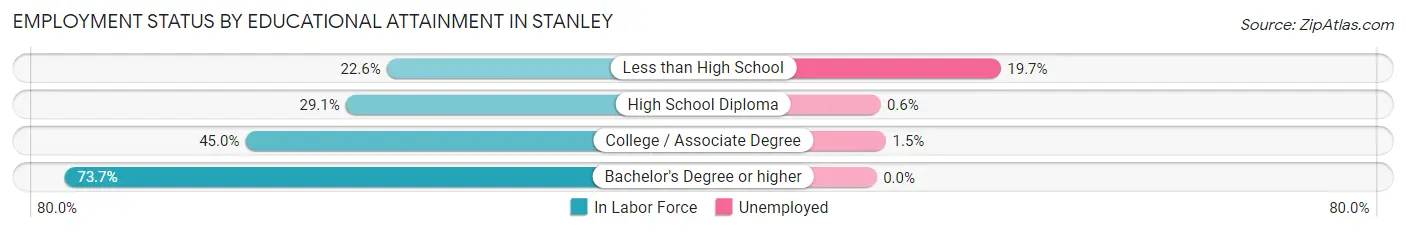
| Educational Attainment | In Labor Force | Unemployed |
| Less than High School | 76 (22.6%) | 66 (19.7%) |
| High School Diploma | 347 (29.1%) | 7 (0.6%) |
| College / Associate Degree | 262 (45.0%) | 9 (1.5%) |
| Bachelor's Degree or higher | 193 (73.7%) | 0 (0.0%) |
| Total | 879 (37.0%) | 57 (2.4%) |
Employment Occupations by Sex in Stanley
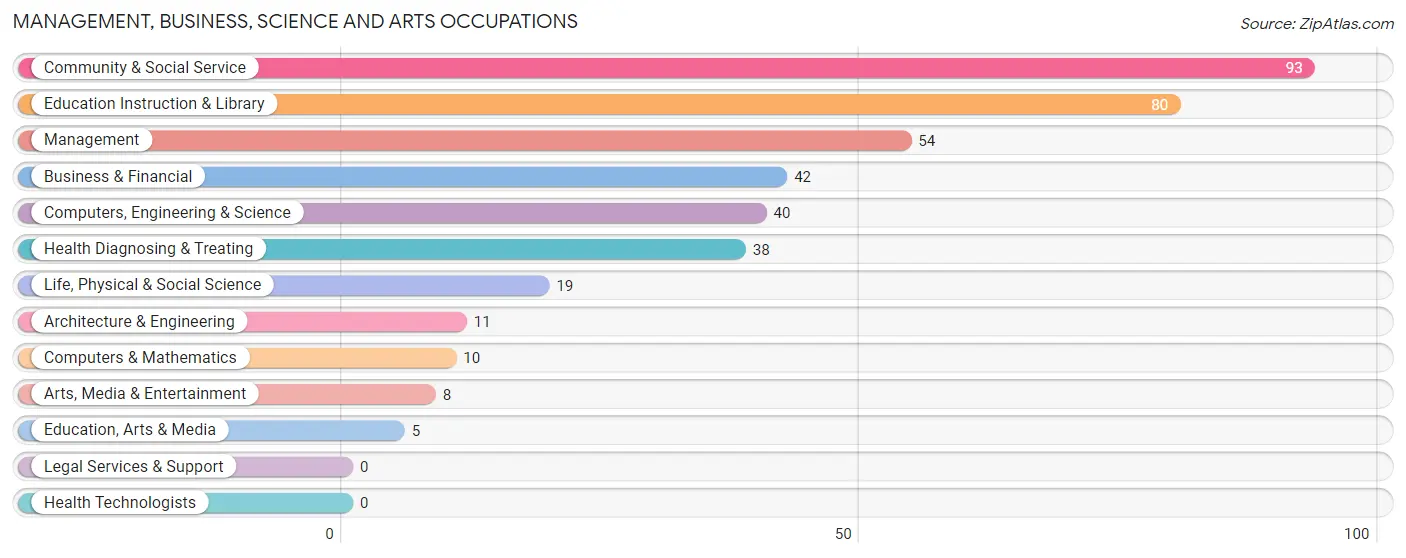
Management, Business, Science and Arts Occupations
The most common Management, Business, Science and Arts occupations in Stanley are Community & Social Service (93 | 9.4%), Education Instruction & Library (80 | 8.1%), Management (54 | 5.4%), Business & Financial (42 | 4.2%), and Computers, Engineering & Science (40 | 4.0%).
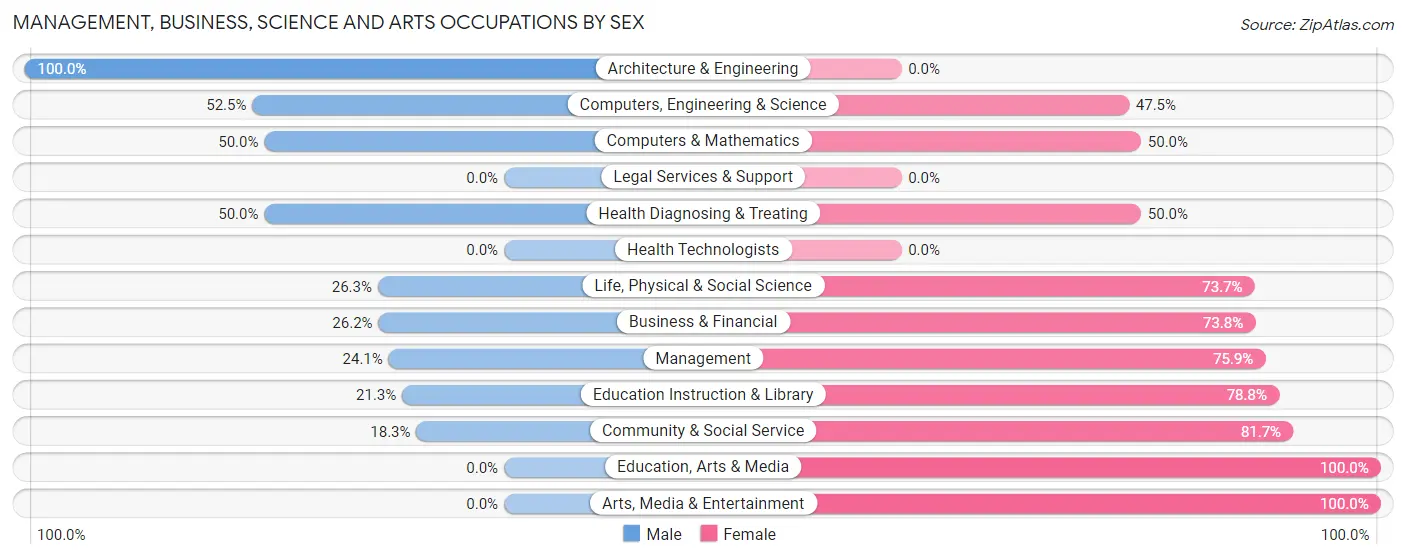
Management, Business, Science and Arts Occupations by Sex
Within the Management, Business, Science and Arts occupations in Stanley, the most male-oriented occupations are Architecture & Engineering (100.0%), Computers, Engineering & Science (52.5%), and Computers & Mathematics (50.0%), while the most female-oriented occupations are Education, Arts & Media (100.0%), Arts, Media & Entertainment (100.0%), and Community & Social Service (81.7%).
| Occupation | Male | Female |
| Management | 13 (24.1%) | 41 (75.9%) |
| Business & Financial | 11 (26.2%) | 31 (73.8%) |
| Computers, Engineering & Science | 21 (52.5%) | 19 (47.5%) |
| Computers & Mathematics | 5 (50.0%) | 5 (50.0%) |
| Architecture & Engineering | 11 (100.0%) | 0 (0.0%) |
| Life, Physical & Social Science | 5 (26.3%) | 14 (73.7%) |
| Community & Social Service | 17 (18.3%) | 76 (81.7%) |
| Education, Arts & Media | 0 (0.0%) | 5 (100.0%) |
| Legal Services & Support | 0 (0.0%) | 0 (0.0%) |
| Education Instruction & Library | 17 (21.2%) | 63 (78.7%) |
| Arts, Media & Entertainment | 0 (0.0%) | 8 (100.0%) |
| Health Diagnosing & Treating | 19 (50.0%) | 19 (50.0%) |
| Health Technologists | 0 (0.0%) | 0 (0.0%) |
| Total (Category) | 81 (30.3%) | 186 (69.7%) |
| Total (Overall) | 465 (47.0%) | 525 (53.0%) |
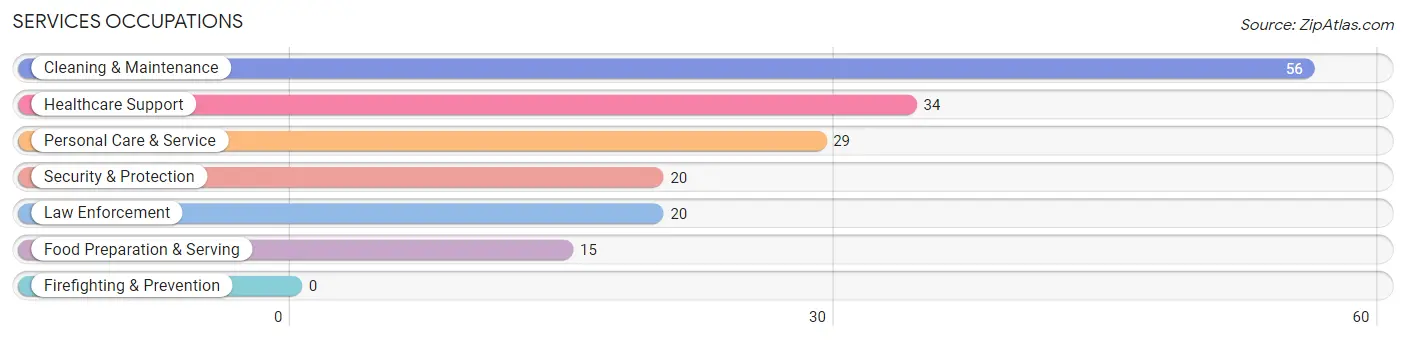
Services Occupations
The most common Services occupations in Stanley are Cleaning & Maintenance (56 | 5.7%), Healthcare Support (34 | 3.4%), Personal Care & Service (29 | 2.9%), Security & Protection (20 | 2.0%), and Law Enforcement (20 | 2.0%).
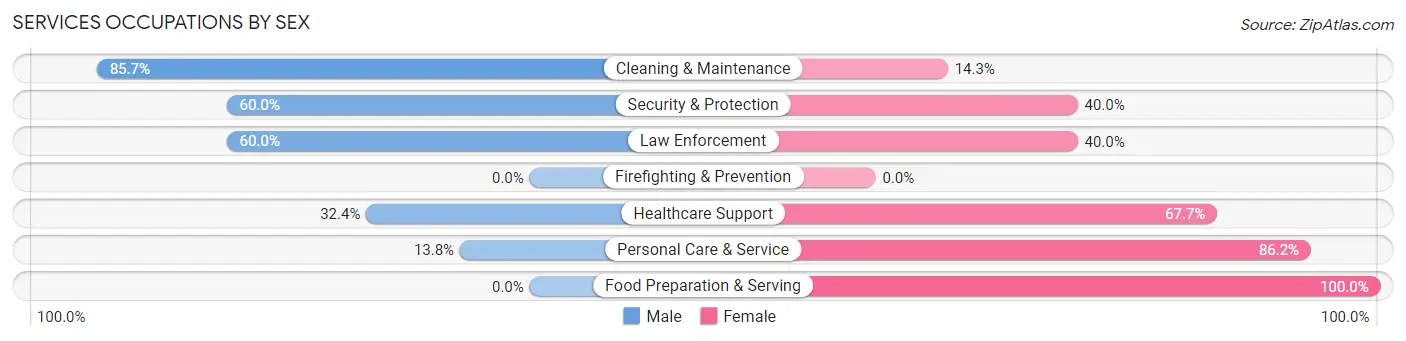
Services Occupations by Sex
Within the Services occupations in Stanley, the most male-oriented occupations are Cleaning & Maintenance (85.7%), Security & Protection (60.0%), and Law Enforcement (60.0%), while the most female-oriented occupations are Food Preparation & Serving (100.0%), Personal Care & Service (86.2%), and Healthcare Support (67.6%).
| Occupation | Male | Female |
| Healthcare Support | 11 (32.4%) | 23 (67.6%) |
| Security & Protection | 12 (60.0%) | 8 (40.0%) |
| Firefighting & Prevention | 0 (0.0%) | 0 (0.0%) |
| Law Enforcement | 12 (60.0%) | 8 (40.0%) |
| Food Preparation & Serving | 0 (0.0%) | 15 (100.0%) |
| Cleaning & Maintenance | 48 (85.7%) | 8 (14.3%) |
| Personal Care & Service | 4 (13.8%) | 25 (86.2%) |
| Total (Category) | 75 (48.7%) | 79 (51.3%) |
| Total (Overall) | 465 (47.0%) | 525 (53.0%) |
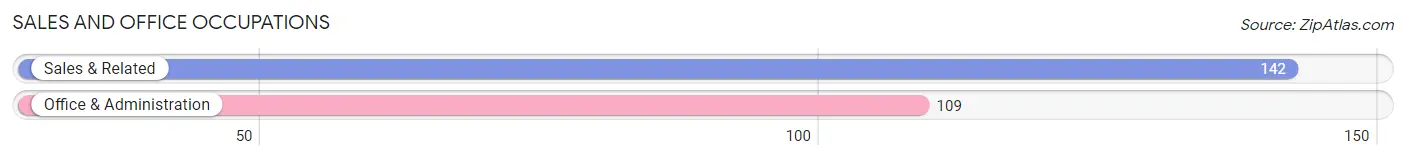
Sales and Office Occupations
The most common Sales and Office occupations in Stanley are Sales & Related (142 | 14.3%), and Office & Administration (109 | 11.0%).
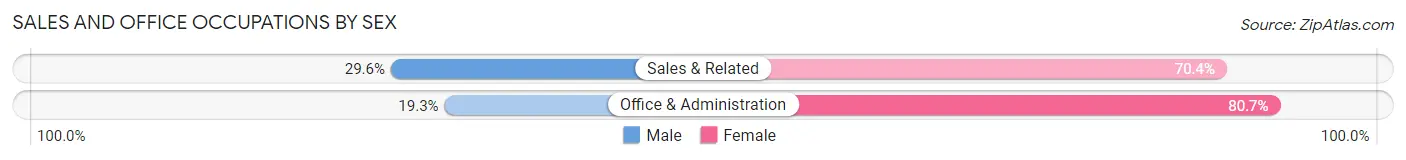
Sales and Office Occupations by Sex
| Occupation | Male | Female |
| Sales & Related | 42 (29.6%) | 100 (70.4%) |
| Office & Administration | 21 (19.3%) | 88 (80.7%) |
| Total (Category) | 63 (25.1%) | 188 (74.9%) |
| Total (Overall) | 465 (47.0%) | 525 (53.0%) |
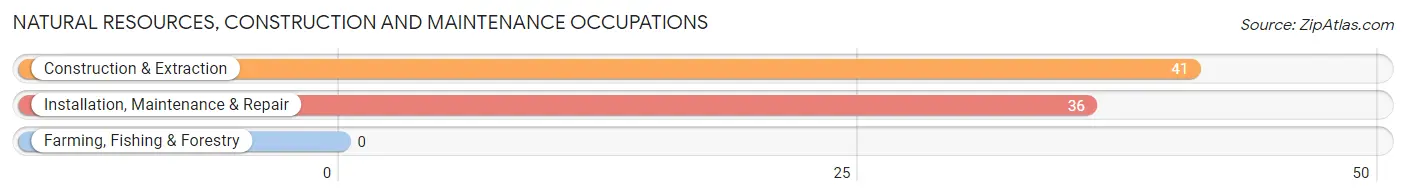
Natural Resources, Construction and Maintenance Occupations
The most common Natural Resources, Construction and Maintenance occupations in Stanley are Construction & Extraction (41 | 4.1%), and Installation, Maintenance & Repair (36 | 3.6%).
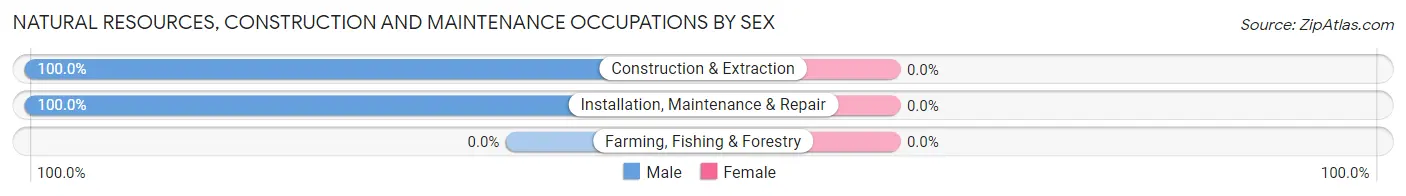
Natural Resources, Construction and Maintenance Occupations by Sex
| Occupation | Male | Female |
| Farming, Fishing & Forestry | 0 (0.0%) | 0 (0.0%) |
| Construction & Extraction | 41 (100.0%) | 0 (0.0%) |
| Installation, Maintenance & Repair | 36 (100.0%) | 0 (0.0%) |
| Total (Category) | 77 (100.0%) | 0 (0.0%) |
| Total (Overall) | 465 (47.0%) | 525 (53.0%) |
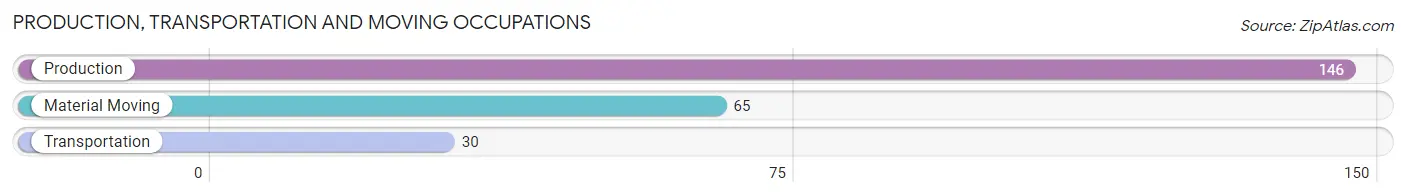
Production, Transportation and Moving Occupations
The most common Production, Transportation and Moving occupations in Stanley are Production (146 | 14.7%), Material Moving (65 | 6.6%), and Transportation (30 | 3.0%).
Production, Transportation and Moving Occupations by Sex
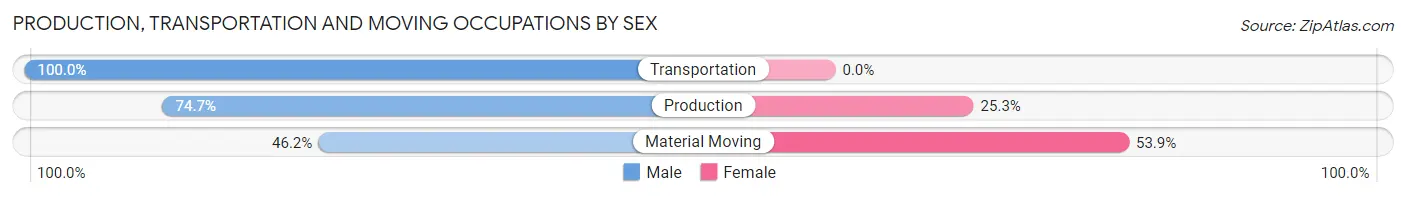
| Occupation | Male | Female |
| Production | 109 (74.7%) | 37 (25.3%) |
| Transportation | 30 (100.0%) | 0 (0.0%) |
| Material Moving | 30 (46.2%) | 35 (53.8%) |
| Total (Category) | 169 (70.1%) | 72 (29.9%) |
| Total (Overall) | 465 (47.0%) | 525 (53.0%) |
Employment Industries by Sex in Stanley
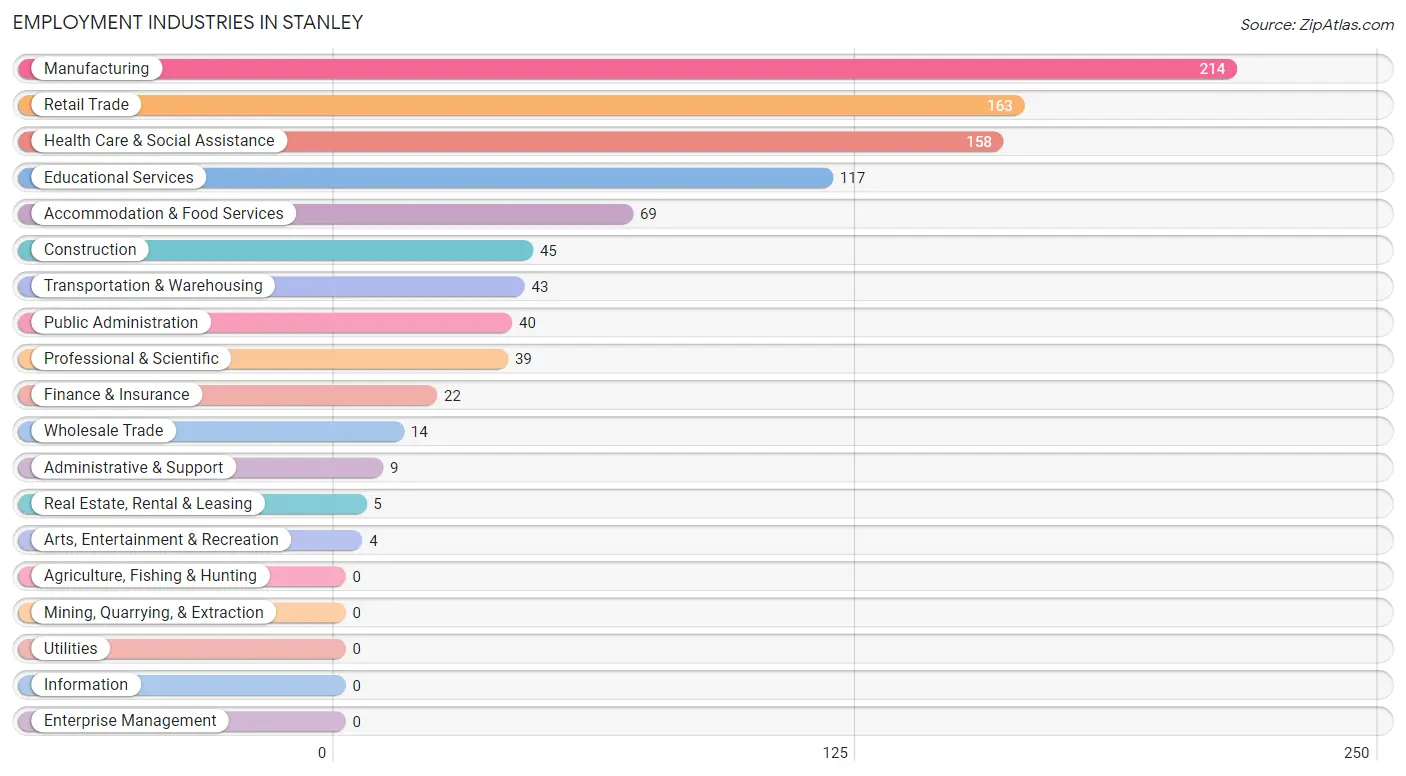
Employment Industries in Stanley
The major employment industries in Stanley include Manufacturing (214 | 21.6%), Retail Trade (163 | 16.5%), Health Care & Social Assistance (158 | 16.0%), Educational Services (117 | 11.8%), and Accommodation & Food Services (69 | 7.0%).
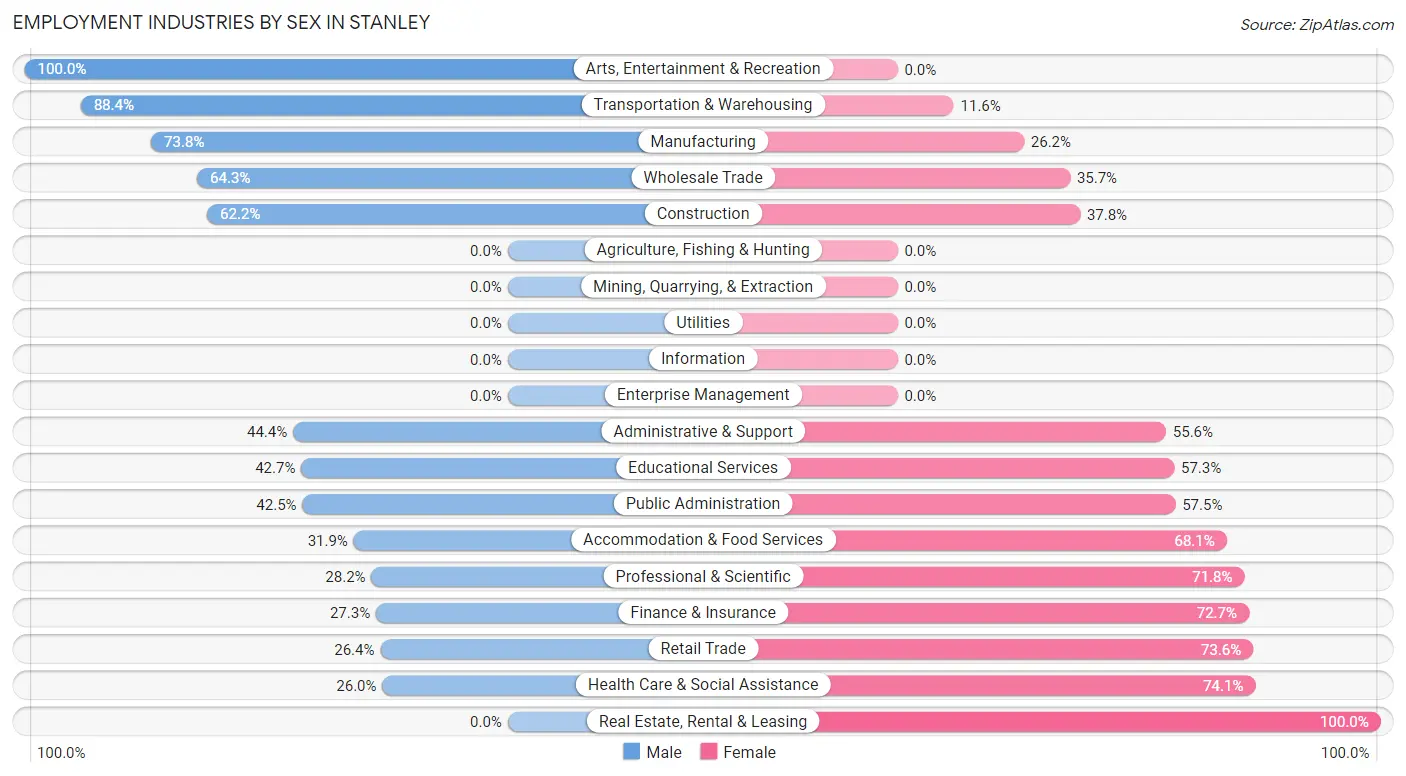
Employment Industries by Sex in Stanley
The Stanley industries that see more men than women are Arts, Entertainment & Recreation (100.0%), Transportation & Warehousing (88.4%), and Manufacturing (73.8%), whereas the industries that tend to have a higher number of women are Real Estate, Rental & Leasing (100.0%), Health Care & Social Assistance (74.1%), and Retail Trade (73.6%).
| Industry | Male | Female |
| Agriculture, Fishing & Hunting | 0 (0.0%) | 0 (0.0%) |
| Mining, Quarrying, & Extraction | 0 (0.0%) | 0 (0.0%) |
| Construction | 28 (62.2%) | 17 (37.8%) |
| Manufacturing | 158 (73.8%) | 56 (26.2%) |
| Wholesale Trade | 9 (64.3%) | 5 (35.7%) |
| Retail Trade | 43 (26.4%) | 120 (73.6%) |
| Transportation & Warehousing | 38 (88.4%) | 5 (11.6%) |
| Utilities | 0 (0.0%) | 0 (0.0%) |
| Information | 0 (0.0%) | 0 (0.0%) |
| Finance & Insurance | 6 (27.3%) | 16 (72.7%) |
| Real Estate, Rental & Leasing | 0 (0.0%) | 5 (100.0%) |
| Professional & Scientific | 11 (28.2%) | 28 (71.8%) |
| Enterprise Management | 0 (0.0%) | 0 (0.0%) |
| Administrative & Support | 4 (44.4%) | 5 (55.6%) |
| Educational Services | 50 (42.7%) | 67 (57.3%) |
| Health Care & Social Assistance | 41 (26.0%) | 117 (74.1%) |
| Arts, Entertainment & Recreation | 4 (100.0%) | 0 (0.0%) |
| Accommodation & Food Services | 22 (31.9%) | 47 (68.1%) |
| Public Administration | 17 (42.5%) | 23 (57.5%) |
| Total | 465 (47.0%) | 525 (53.0%) |
Education in Stanley
School Enrollment in Stanley
The most common levels of schooling among the 714 students in Stanley are high school (207 | 29.0%), middle school (159 | 22.3%), and elementary school (150 | 21.0%).
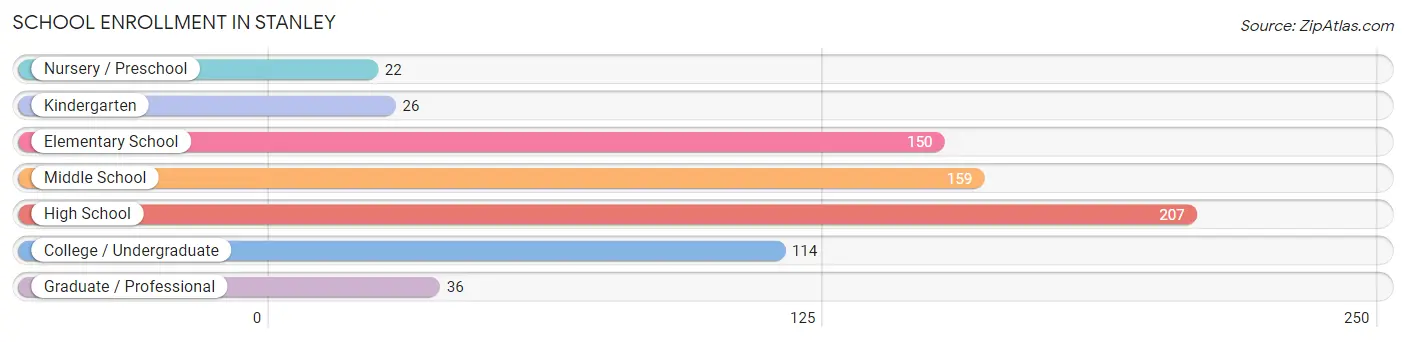
| School Level | # Students | % Students |
| Nursery / Preschool | 22 | 3.1% |
| Kindergarten | 26 | 3.6% |
| Elementary School | 150 | 21.0% |
| Middle School | 159 | 22.3% |
| High School | 207 | 29.0% |
| College / Undergraduate | 114 | 16.0% |
| Graduate / Professional | 36 | 5.0% |
| Total | 714 | 100.0% |
School Enrollment by Age by Funding Source in Stanley
Out of a total of 714 students who are enrolled in schools in Stanley, 117 (16.4%) attend a private institution, while the remaining 597 (83.6%) are enrolled in public schools. The age group of 35 years and over has the highest likelihood of being enrolled in private schools, with 36 (38.3% in the age bracket) enrolled. Conversely, the age group of 20 to 24 year olds has the lowest likelihood of being enrolled in a private school, with 31 (100.0% in the age bracket) attending a public institution.
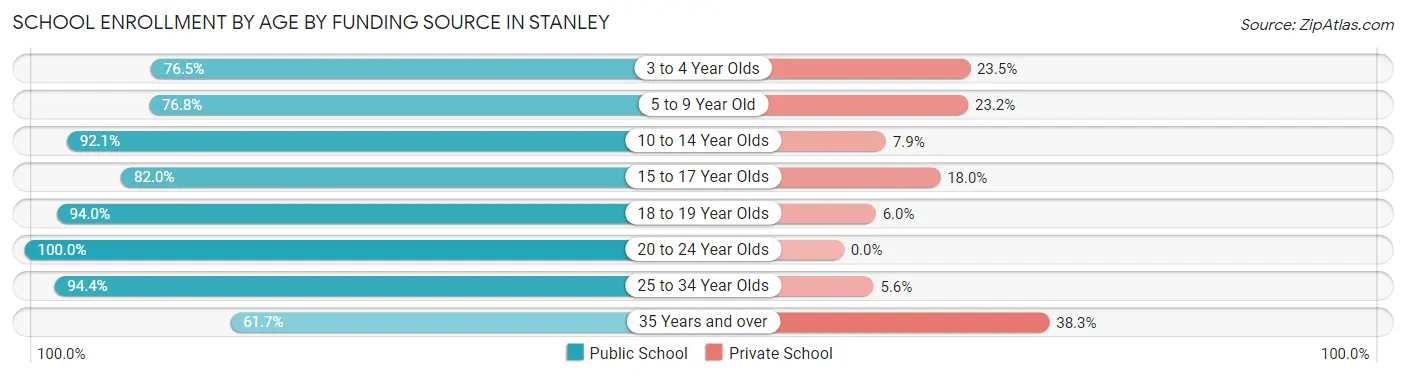
| Age Bracket | Public School | Private School |
| 3 to 4 Year Olds | 13 (76.5%) | 4 (23.5%) |
| 5 to 9 Year Old | 126 (76.8%) | 38 (23.2%) |
| 10 to 14 Year Olds | 199 (92.1%) | 17 (7.9%) |
| 15 to 17 Year Olds | 73 (82.0%) | 16 (18.0%) |
| 18 to 19 Year Olds | 63 (94.0%) | 4 (6.0%) |
| 20 to 24 Year Olds | 31 (100.0%) | 0 (0.0%) |
| 25 to 34 Year Olds | 34 (94.4%) | 2 (5.6%) |
| 35 Years and over | 58 (61.7%) | 36 (38.3%) |
| Total | 597 (83.6%) | 117 (16.4%) |
Educational Attainment by Field of Study in Stanley
Education (72 | 19.3%), bio, nature & agricultural (60 | 16.0%), social sciences (50 | 13.4%), business (46 | 12.3%), and science & technology (43 | 11.5%) are the most common fields of study among 374 individuals in Stanley who have obtained a bachelor's degree or higher.
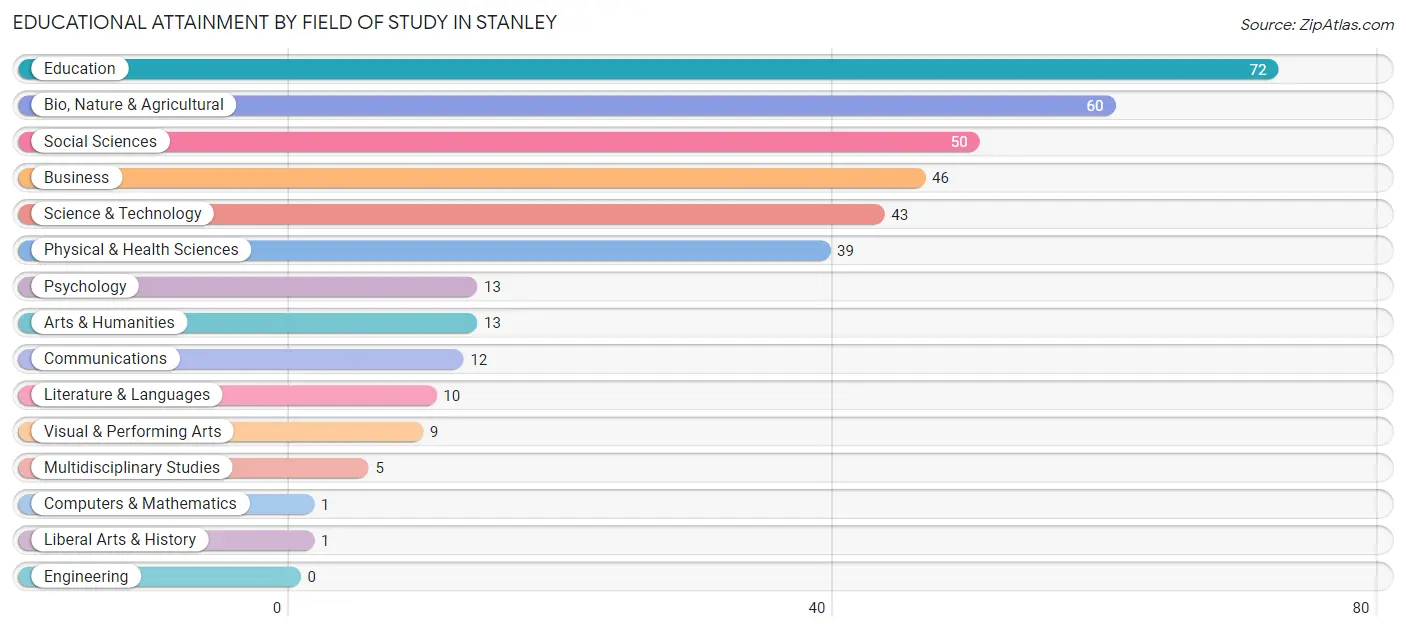
| Field of Study | # Graduates | % Graduates |
| Computers & Mathematics | 1 | 0.3% |
| Bio, Nature & Agricultural | 60 | 16.0% |
| Physical & Health Sciences | 39 | 10.4% |
| Psychology | 13 | 3.5% |
| Social Sciences | 50 | 13.4% |
| Engineering | 0 | 0.0% |
| Multidisciplinary Studies | 5 | 1.3% |
| Science & Technology | 43 | 11.5% |
| Business | 46 | 12.3% |
| Education | 72 | 19.3% |
| Literature & Languages | 10 | 2.7% |
| Liberal Arts & History | 1 | 0.3% |
| Visual & Performing Arts | 9 | 2.4% |
| Communications | 12 | 3.2% |
| Arts & Humanities | 13 | 3.5% |
| Total | 374 | 100.0% |
Transportation & Commute in Stanley
Vehicle Availability by Sex in Stanley
The most prevalent vehicle ownership categories in Stanley are males with 2 vehicles (179, accounting for 39.6%) and females with 2 vehicles (158, making up 34.0%).
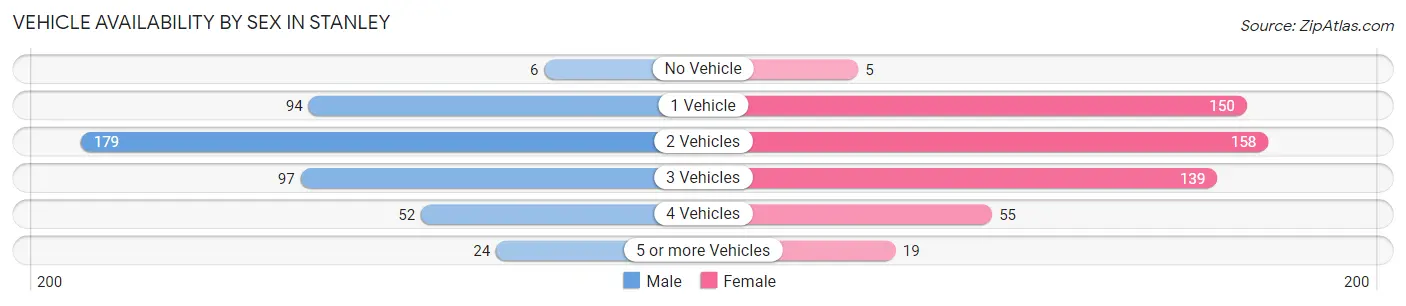
| Vehicles Available | Male | Female |
| No Vehicle | 6 (1.3%) | 5 (0.9%) |
| 1 Vehicle | 94 (20.8%) | 150 (28.5%) |
| 2 Vehicles | 179 (39.6%) | 158 (30.0%) |
| 3 Vehicles | 97 (21.5%) | 139 (26.4%) |
| 4 Vehicles | 52 (11.5%) | 55 (10.5%) |
| 5 or more Vehicles | 24 (5.3%) | 19 (3.6%) |
| Total | 452 (100.0%) | 526 (100.0%) |
Commute Time in Stanley
The most frequently occuring commute durations in Stanley are 30 to 34 minutes (211 commuters, 23.2%), less than 5 minutes (124 commuters, 13.6%), and 5 to 9 minutes (113 commuters, 12.4%).
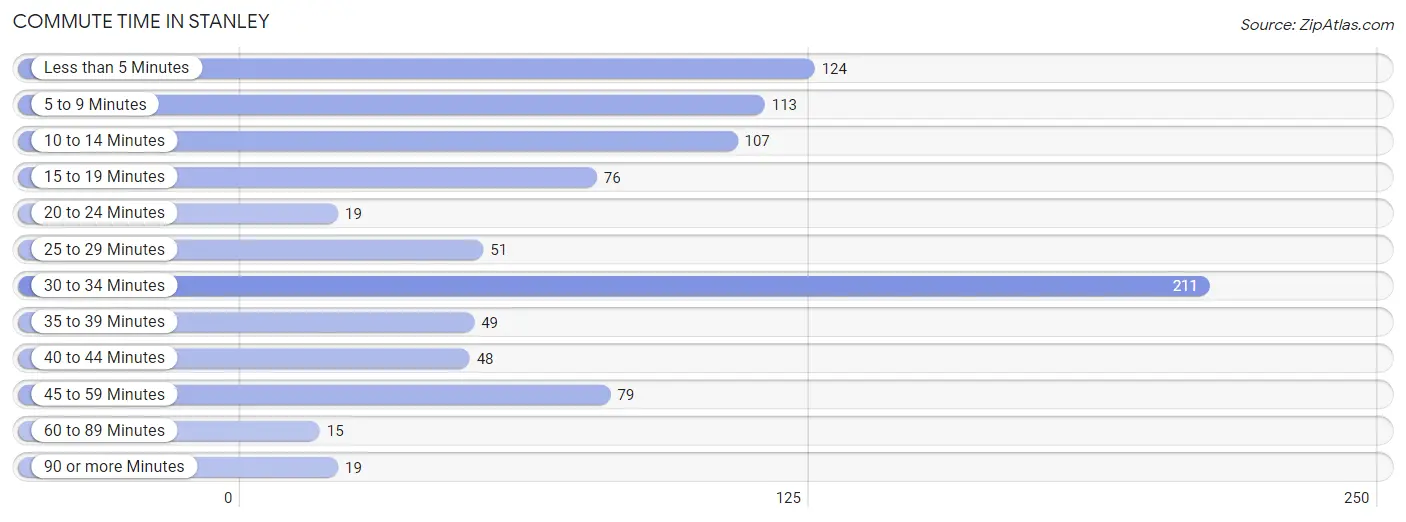
| Commute Time | # Commuters | % Commuters |
| Less than 5 Minutes | 124 | 13.6% |
| 5 to 9 Minutes | 113 | 12.4% |
| 10 to 14 Minutes | 107 | 11.7% |
| 15 to 19 Minutes | 76 | 8.3% |
| 20 to 24 Minutes | 19 | 2.1% |
| 25 to 29 Minutes | 51 | 5.6% |
| 30 to 34 Minutes | 211 | 23.2% |
| 35 to 39 Minutes | 49 | 5.4% |
| 40 to 44 Minutes | 48 | 5.3% |
| 45 to 59 Minutes | 79 | 8.7% |
| 60 to 89 Minutes | 15 | 1.7% |
| 90 or more Minutes | 19 | 2.1% |
Commute Time by Sex in Stanley
The most common commute times in Stanley are 30 to 34 minutes (140 commuters, 31.0%) for males and less than 5 minutes (110 commuters, 24.0%) for females.
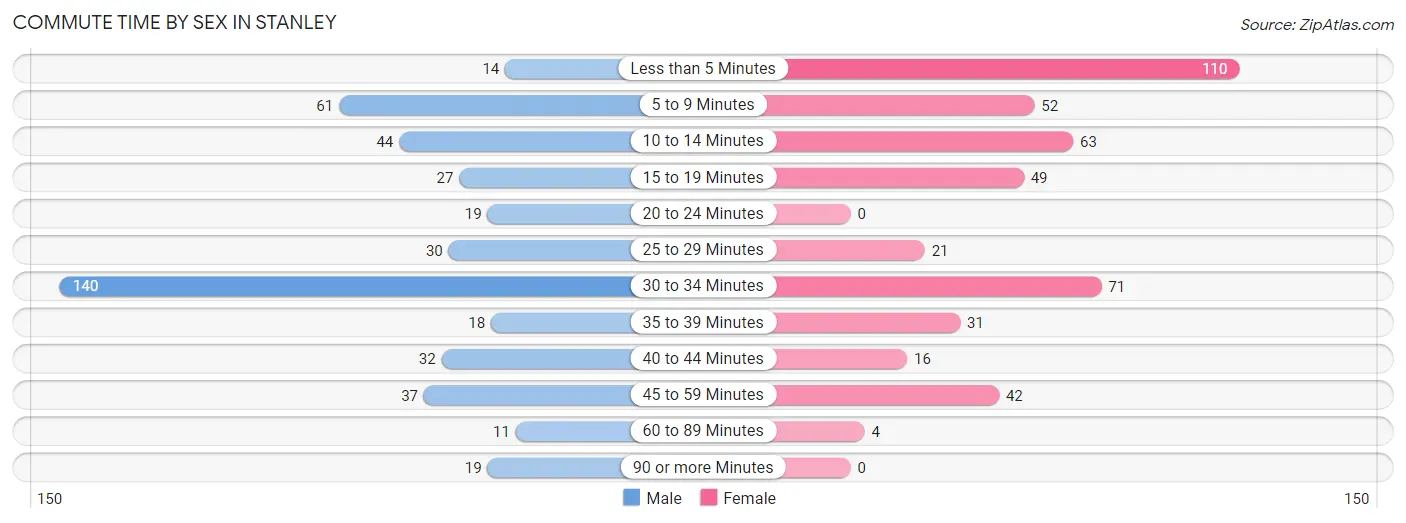
| Commute Time | Male | Female |
| Less than 5 Minutes | 14 (3.1%) | 110 (24.0%) |
| 5 to 9 Minutes | 61 (13.5%) | 52 (11.3%) |
| 10 to 14 Minutes | 44 (9.7%) | 63 (13.7%) |
| 15 to 19 Minutes | 27 (6.0%) | 49 (10.7%) |
| 20 to 24 Minutes | 19 (4.2%) | 0 (0.0%) |
| 25 to 29 Minutes | 30 (6.6%) | 21 (4.6%) |
| 30 to 34 Minutes | 140 (31.0%) | 71 (15.5%) |
| 35 to 39 Minutes | 18 (4.0%) | 31 (6.8%) |
| 40 to 44 Minutes | 32 (7.1%) | 16 (3.5%) |
| 45 to 59 Minutes | 37 (8.2%) | 42 (9.1%) |
| 60 to 89 Minutes | 11 (2.4%) | 4 (0.9%) |
| 90 or more Minutes | 19 (4.2%) | 0 (0.0%) |
Time of Departure to Work by Sex in Stanley
The most frequent times of departure to work in Stanley are 5:30 AM to 5:59 AM (66, 14.6%) for males and 7:00 AM to 7:29 AM (115, 25.1%) for females.
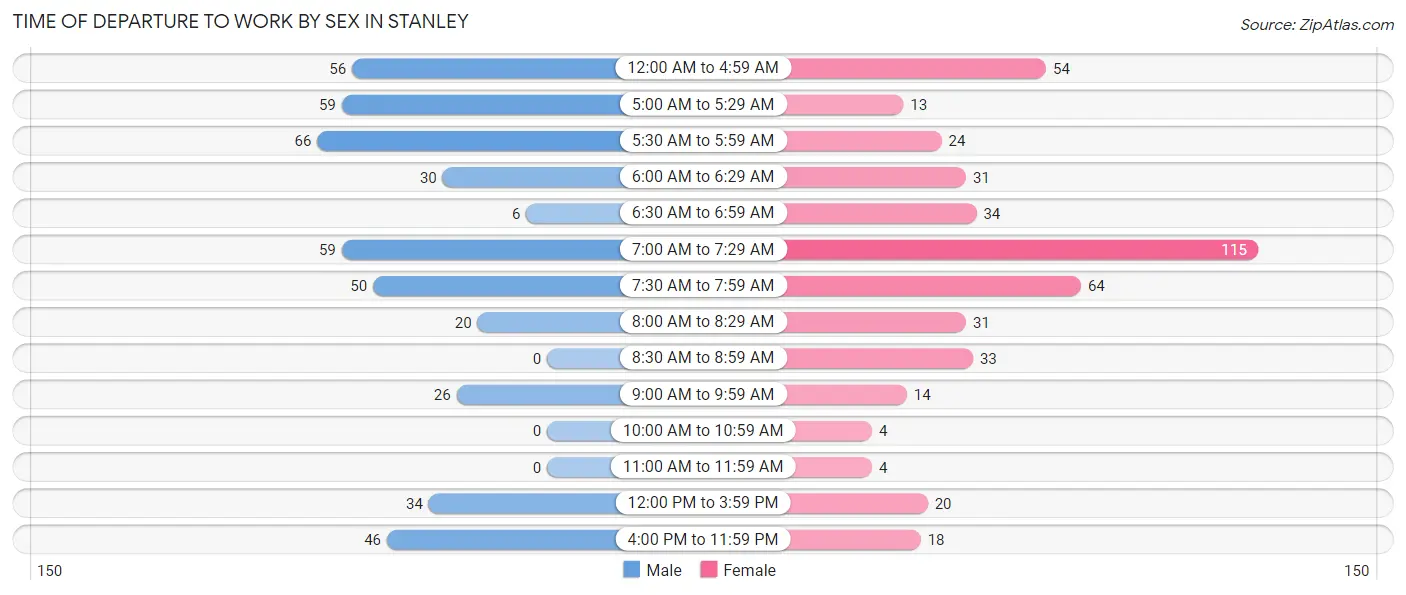
| Time of Departure | Male | Female |
| 12:00 AM to 4:59 AM | 56 (12.4%) | 54 (11.8%) |
| 5:00 AM to 5:29 AM | 59 (13.1%) | 13 (2.8%) |
| 5:30 AM to 5:59 AM | 66 (14.6%) | 24 (5.2%) |
| 6:00 AM to 6:29 AM | 30 (6.6%) | 31 (6.8%) |
| 6:30 AM to 6:59 AM | 6 (1.3%) | 34 (7.4%) |
| 7:00 AM to 7:29 AM | 59 (13.1%) | 115 (25.1%) |
| 7:30 AM to 7:59 AM | 50 (11.1%) | 64 (13.9%) |
| 8:00 AM to 8:29 AM | 20 (4.4%) | 31 (6.8%) |
| 8:30 AM to 8:59 AM | 0 (0.0%) | 33 (7.2%) |
| 9:00 AM to 9:59 AM | 26 (5.8%) | 14 (3.0%) |
| 10:00 AM to 10:59 AM | 0 (0.0%) | 4 (0.9%) |
| 11:00 AM to 11:59 AM | 0 (0.0%) | 4 (0.9%) |
| 12:00 PM to 3:59 PM | 34 (7.5%) | 20 (4.4%) |
| 4:00 PM to 11:59 PM | 46 (10.2%) | 18 (3.9%) |
| Total | 452 (100.0%) | 459 (100.0%) |
Housing Occupancy in Stanley
Occupancy by Ownership in Stanley
Of the total 933 dwellings in Stanley, owner-occupied units account for 498 (53.4%), while renter-occupied units make up 435 (46.6%).
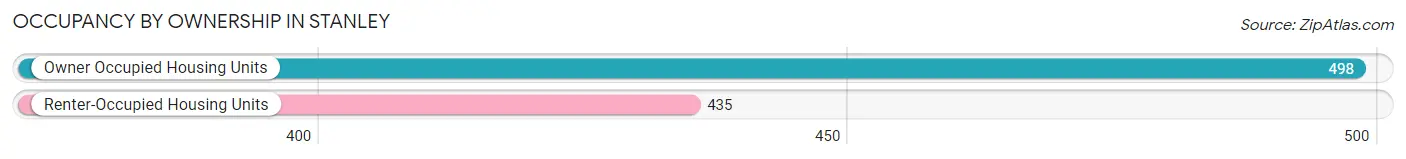
| Occupancy | # Housing Units | % Housing Units |
| Owner Occupied Housing Units | 498 | 53.4% |
| Renter-Occupied Housing Units | 435 | 46.6% |
| Total Occupied Housing Units | 933 | 100.0% |
Occupancy by Household Size in Stanley
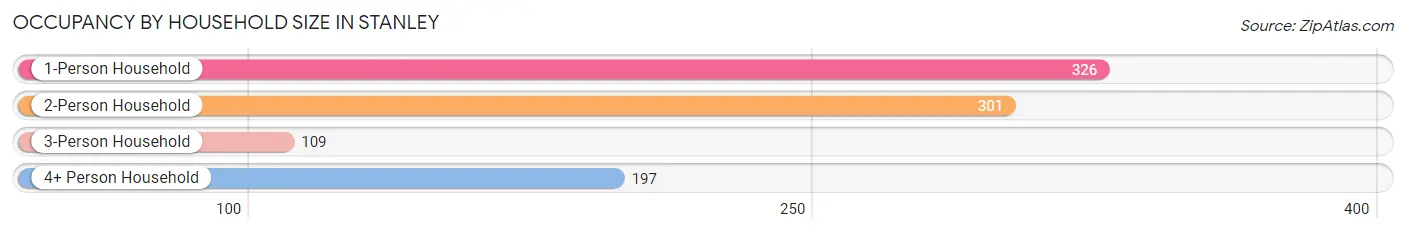
| Household Size | # Housing Units | % Housing Units |
| 1-Person Household | 326 | 34.9% |
| 2-Person Household | 301 | 32.3% |
| 3-Person Household | 109 | 11.7% |
| 4+ Person Household | 197 | 21.1% |
| Total Housing Units | 933 | 100.0% |
Occupancy by Ownership by Household Size in Stanley
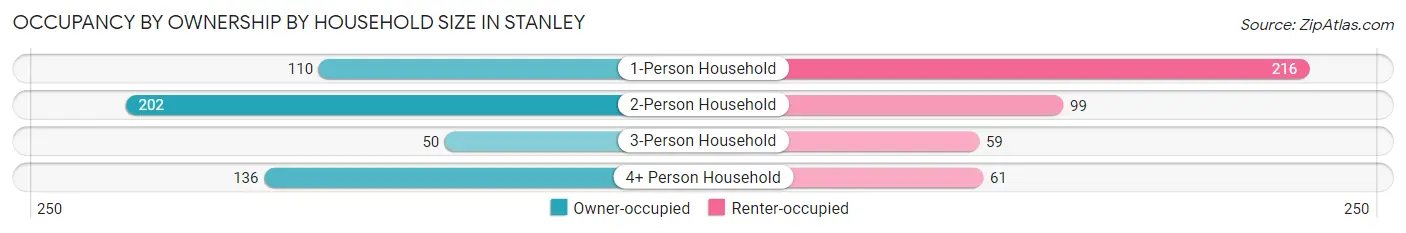
| Household Size | Owner-occupied | Renter-occupied |
| 1-Person Household | 110 (33.7%) | 216 (66.3%) |
| 2-Person Household | 202 (67.1%) | 99 (32.9%) |
| 3-Person Household | 50 (45.9%) | 59 (54.1%) |
| 4+ Person Household | 136 (69.0%) | 61 (31.0%) |
| Total Housing Units | 498 (53.4%) | 435 (46.6%) |
Occupancy by Educational Attainment in Stanley
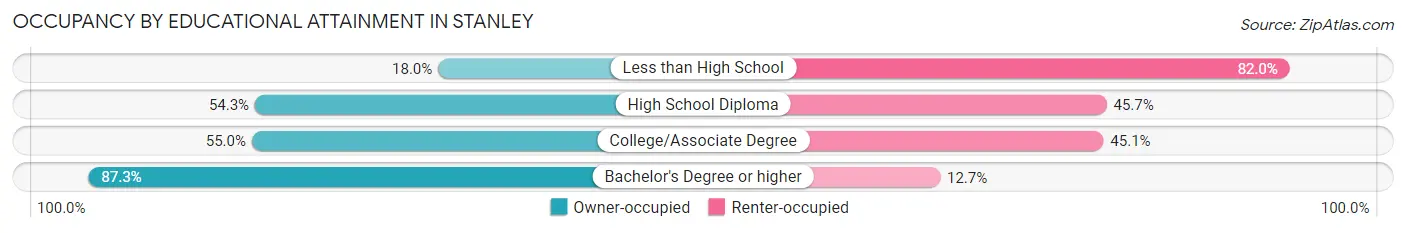
| Household Size | Owner-occupied | Renter-occupied |
| Less than High School | 31 (18.0%) | 141 (82.0%) |
| High School Diploma | 207 (54.3%) | 174 (45.7%) |
| College/Associate Degree | 122 (54.9%) | 100 (45.1%) |
| Bachelor's Degree or higher | 138 (87.3%) | 20 (12.7%) |
Occupancy by Age of Householder in Stanley
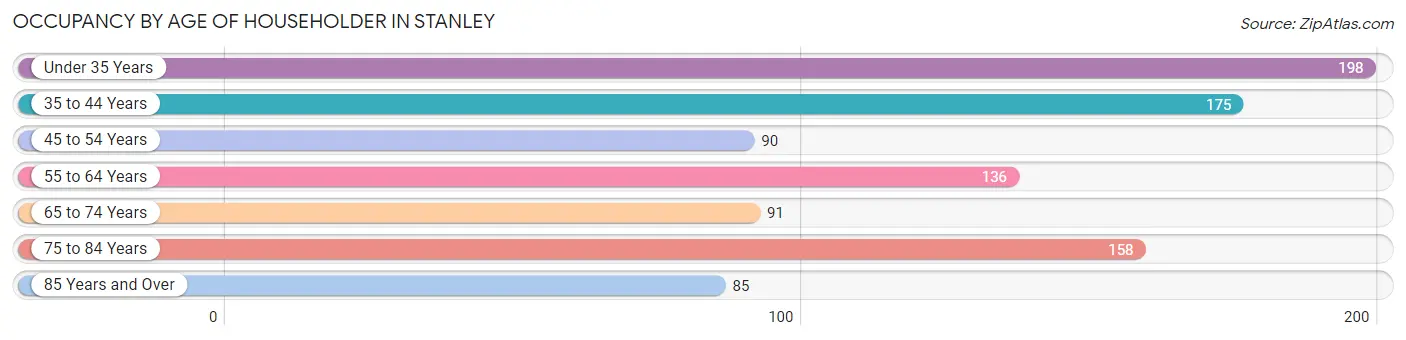
| Age Bracket | # Households | % Households |
| Under 35 Years | 198 | 21.2% |
| 35 to 44 Years | 175 | 18.8% |
| 45 to 54 Years | 90 | 9.7% |
| 55 to 64 Years | 136 | 14.6% |
| 65 to 74 Years | 91 | 9.8% |
| 75 to 84 Years | 158 | 16.9% |
| 85 Years and Over | 85 | 9.1% |
| Total | 933 | 100.0% |
Housing Finances in Stanley
Median Income by Occupancy in Stanley
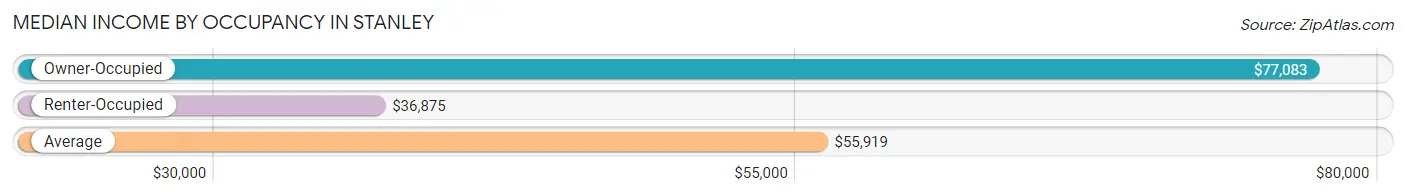
| Occupancy Type | # Households | Median Income |
| Owner-Occupied | 498 (53.4%) | $77,083 |
| Renter-Occupied | 435 (46.6%) | $36,875 |
| Average | 933 (100.0%) | $55,919 |
Occupancy by Householder Income Bracket in Stanley
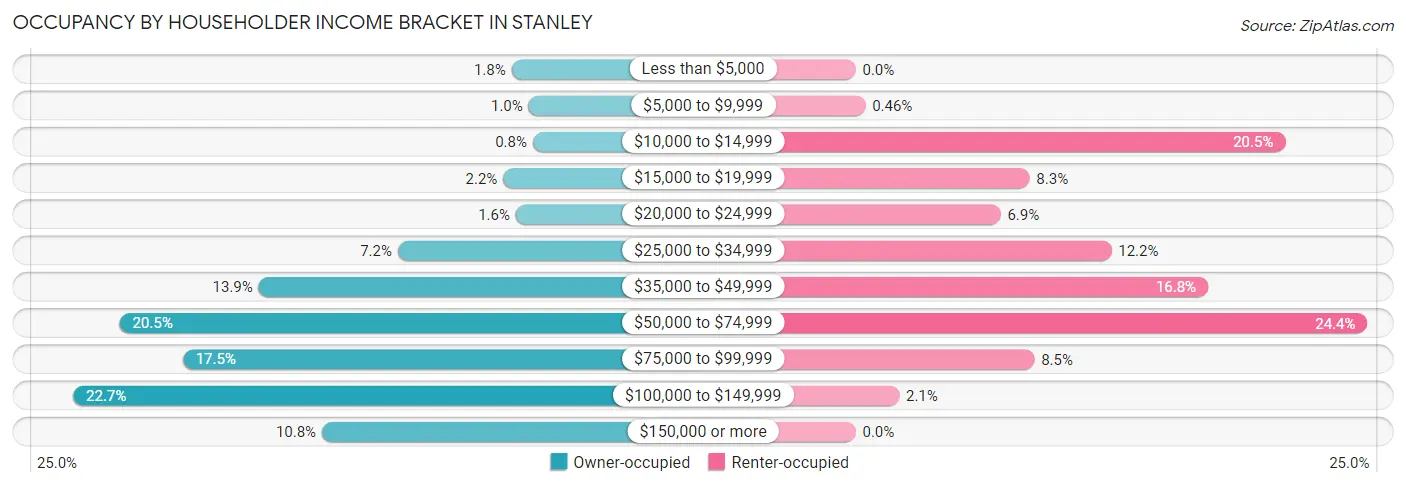
| Income Bracket | Owner-occupied | Renter-occupied |
| Less than $5,000 | 9 (1.8%) | 0 (0.0%) |
| $5,000 to $9,999 | 5 (1.0%) | 2 (0.5%) |
| $10,000 to $14,999 | 4 (0.8%) | 89 (20.5%) |
| $15,000 to $19,999 | 11 (2.2%) | 36 (8.3%) |
| $20,000 to $24,999 | 8 (1.6%) | 30 (6.9%) |
| $25,000 to $34,999 | 36 (7.2%) | 53 (12.2%) |
| $35,000 to $49,999 | 69 (13.9%) | 73 (16.8%) |
| $50,000 to $74,999 | 102 (20.5%) | 106 (24.4%) |
| $75,000 to $99,999 | 87 (17.5%) | 37 (8.5%) |
| $100,000 to $149,999 | 113 (22.7%) | 9 (2.1%) |
| $150,000 or more | 54 (10.8%) | 0 (0.0%) |
| Total | 498 (100.0%) | 435 (100.0%) |
Monthly Housing Cost Tiers in Stanley
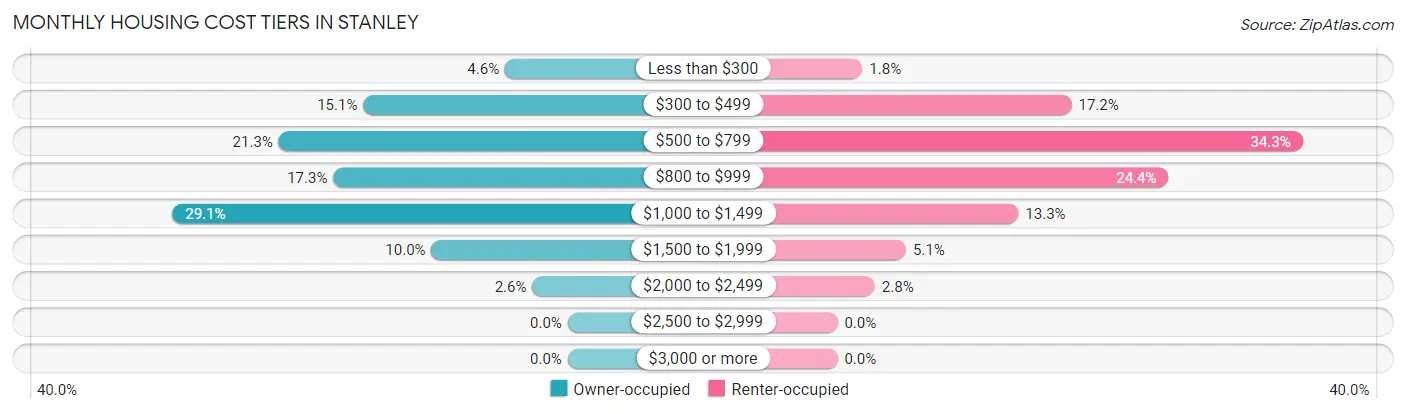
| Monthly Cost | Owner-occupied | Renter-occupied |
| Less than $300 | 23 (4.6%) | 8 (1.8%) |
| $300 to $499 | 75 (15.1%) | 75 (17.2%) |
| $500 to $799 | 106 (21.3%) | 149 (34.3%) |
| $800 to $999 | 86 (17.3%) | 106 (24.4%) |
| $1,000 to $1,499 | 145 (29.1%) | 58 (13.3%) |
| $1,500 to $1,999 | 50 (10.0%) | 22 (5.1%) |
| $2,000 to $2,499 | 13 (2.6%) | 12 (2.8%) |
| $2,500 to $2,999 | 0 (0.0%) | 0 (0.0%) |
| $3,000 or more | 0 (0.0%) | 0 (0.0%) |
| Total | 498 (100.0%) | 435 (100.0%) |
Physical Housing Characteristics in Stanley
Housing Structures in Stanley
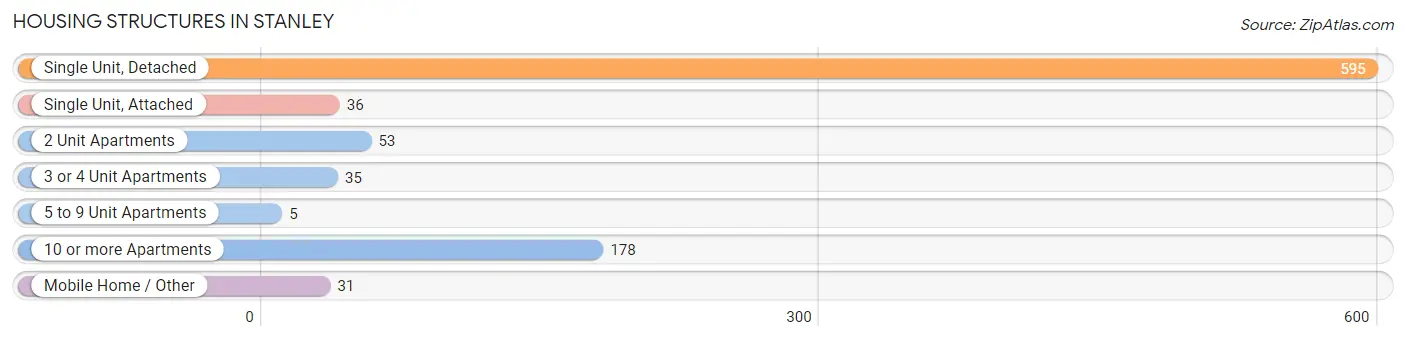
| Structure Type | # Housing Units | % Housing Units |
| Single Unit, Detached | 595 | 63.8% |
| Single Unit, Attached | 36 | 3.9% |
| 2 Unit Apartments | 53 | 5.7% |
| 3 or 4 Unit Apartments | 35 | 3.7% |
| 5 to 9 Unit Apartments | 5 | 0.5% |
| 10 or more Apartments | 178 | 19.1% |
| Mobile Home / Other | 31 | 3.3% |
| Total | 933 | 100.0% |
Housing Structures by Occupancy in Stanley
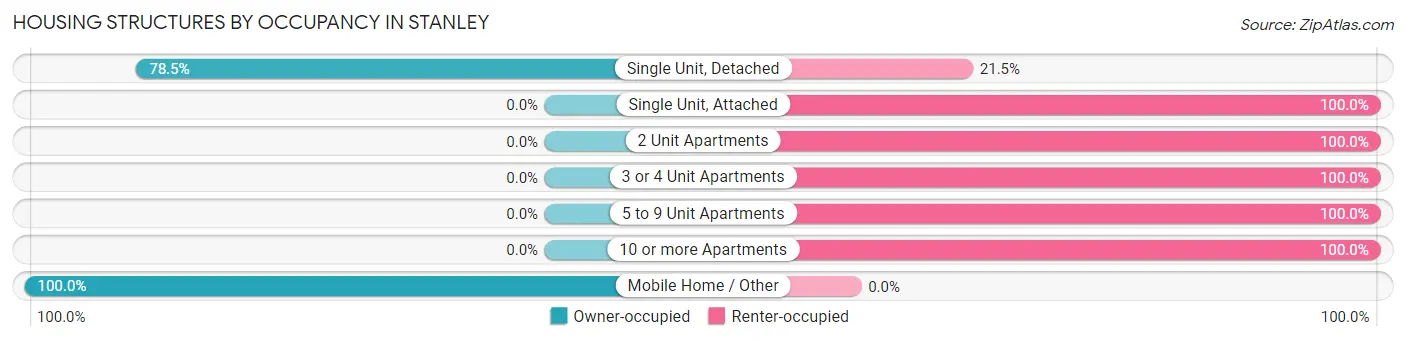
| Structure Type | Owner-occupied | Renter-occupied |
| Single Unit, Detached | 467 (78.5%) | 128 (21.5%) |
| Single Unit, Attached | 0 (0.0%) | 36 (100.0%) |
| 2 Unit Apartments | 0 (0.0%) | 53 (100.0%) |
| 3 or 4 Unit Apartments | 0 (0.0%) | 35 (100.0%) |
| 5 to 9 Unit Apartments | 0 (0.0%) | 5 (100.0%) |
| 10 or more Apartments | 0 (0.0%) | 178 (100.0%) |
| Mobile Home / Other | 31 (100.0%) | 0 (0.0%) |
| Total | 498 (53.4%) | 435 (46.6%) |
Housing Structures by Number of Rooms in Stanley
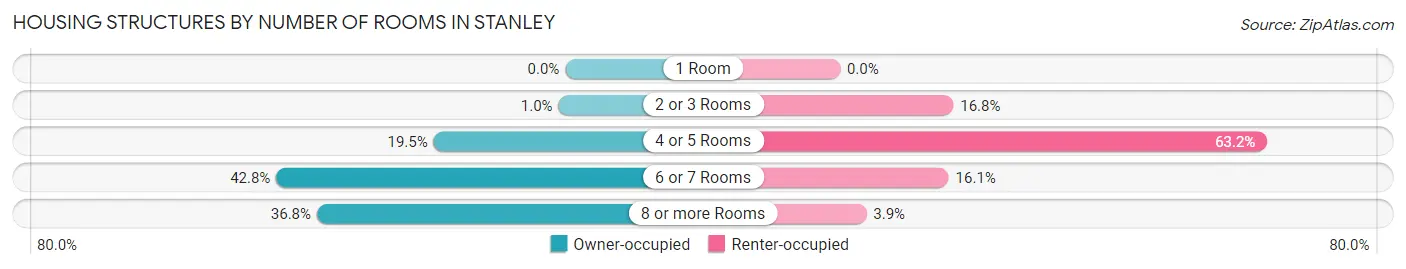
| Number of Rooms | Owner-occupied | Renter-occupied |
| 1 Room | 0 (0.0%) | 0 (0.0%) |
| 2 or 3 Rooms | 5 (1.0%) | 73 (16.8%) |
| 4 or 5 Rooms | 97 (19.5%) | 275 (63.2%) |
| 6 or 7 Rooms | 213 (42.8%) | 70 (16.1%) |
| 8 or more Rooms | 183 (36.7%) | 17 (3.9%) |
| Total | 498 (100.0%) | 435 (100.0%) |
Housing Structure by Heating Type in Stanley
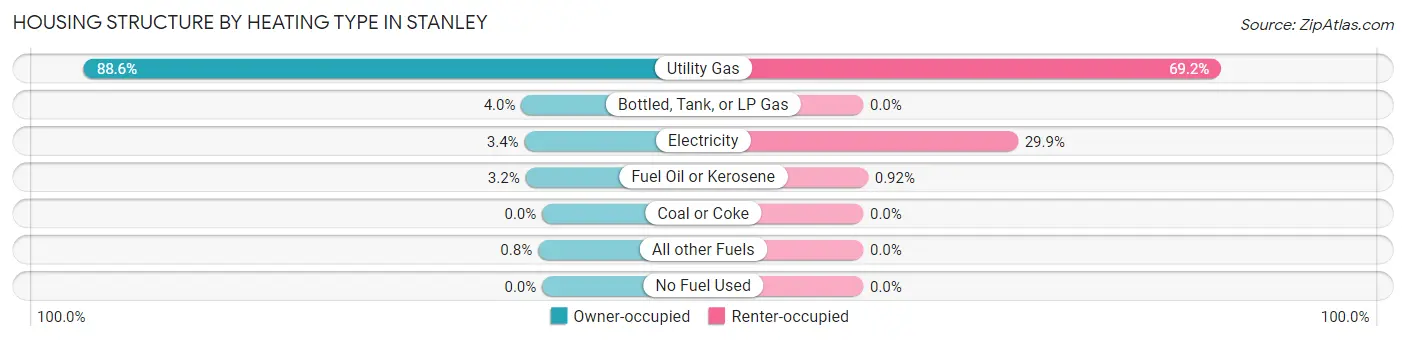
| Heating Type | Owner-occupied | Renter-occupied |
| Utility Gas | 441 (88.5%) | 301 (69.2%) |
| Bottled, Tank, or LP Gas | 20 (4.0%) | 0 (0.0%) |
| Electricity | 17 (3.4%) | 130 (29.9%) |
| Fuel Oil or Kerosene | 16 (3.2%) | 4 (0.9%) |
| Coal or Coke | 0 (0.0%) | 0 (0.0%) |
| All other Fuels | 4 (0.8%) | 0 (0.0%) |
| No Fuel Used | 0 (0.0%) | 0 (0.0%) |
| Total | 498 (100.0%) | 435 (100.0%) |
Household Vehicle Usage in Stanley
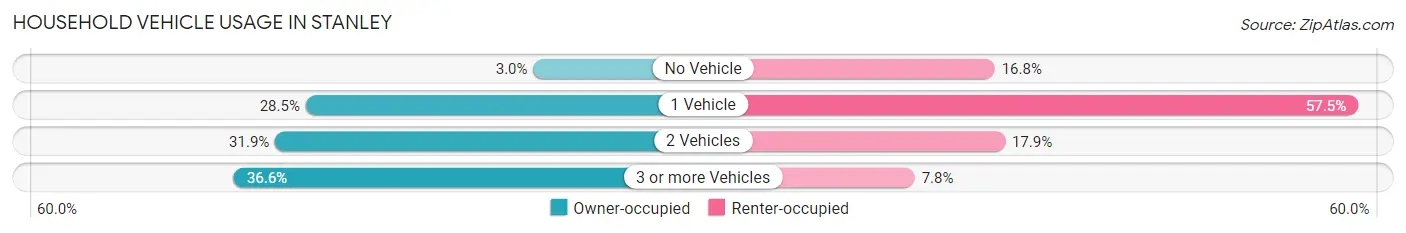
| Vehicles per Household | Owner-occupied | Renter-occupied |
| No Vehicle | 15 (3.0%) | 73 (16.8%) |
| 1 Vehicle | 142 (28.5%) | 250 (57.5%) |
| 2 Vehicles | 159 (31.9%) | 78 (17.9%) |
| 3 or more Vehicles | 182 (36.5%) | 34 (7.8%) |
| Total | 498 (100.0%) | 435 (100.0%) |
Real Estate & Mortgages in Stanley
Real Estate and Mortgage Overview in Stanley
| Characteristic | Without Mortgage | With Mortgage |
| Housing Units | 146 | 352 |
| Median Property Value | $92,200 | $151,300 |
| Median Household Income | $48,750 | $36 |
| Monthly Housing Costs | $419 | $0 |
| Real Estate Taxes | $1,254 | $9 |
Property Value by Mortgage Status in Stanley
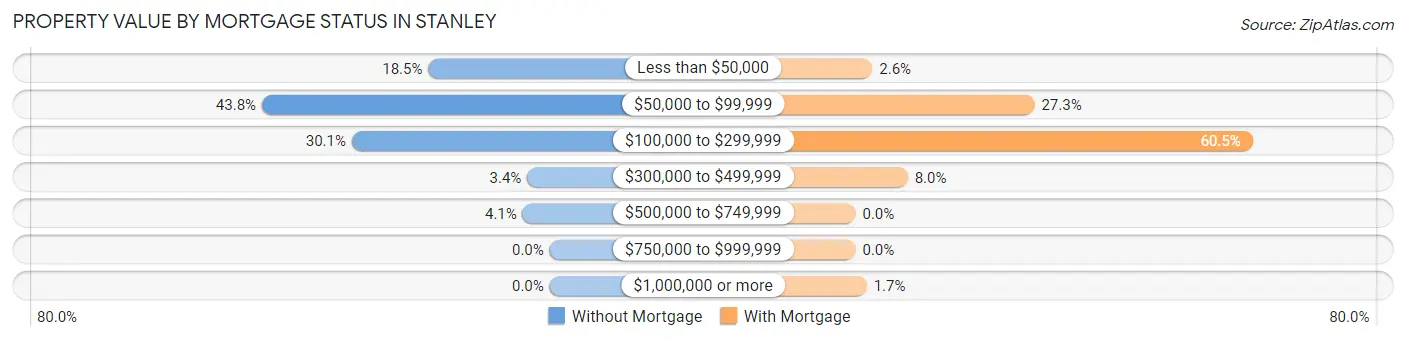
| Property Value | Without Mortgage | With Mortgage |
| Less than $50,000 | 27 (18.5%) | 9 (2.6%) |
| $50,000 to $99,999 | 64 (43.8%) | 96 (27.3%) |
| $100,000 to $299,999 | 44 (30.1%) | 213 (60.5%) |
| $300,000 to $499,999 | 5 (3.4%) | 28 (8.0%) |
| $500,000 to $749,999 | 6 (4.1%) | 0 (0.0%) |
| $750,000 to $999,999 | 0 (0.0%) | 0 (0.0%) |
| $1,000,000 or more | 0 (0.0%) | 6 (1.7%) |
| Total | 146 (100.0%) | 352 (100.0%) |
Household Income by Mortgage Status in Stanley
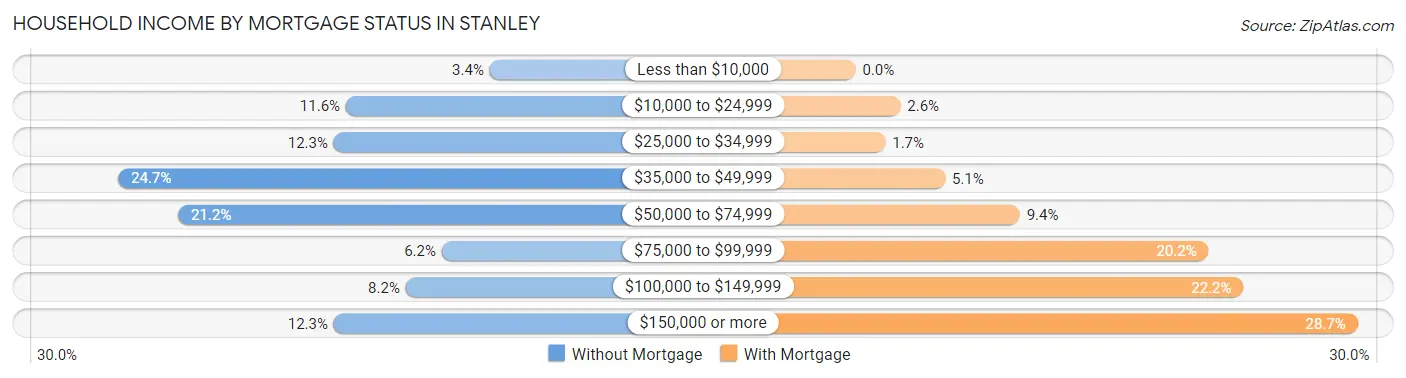
| Household Income | Without Mortgage | With Mortgage |
| Less than $10,000 | 5 (3.4%) | 0 (0.0%) |
| $10,000 to $24,999 | 17 (11.6%) | 9 (2.6%) |
| $25,000 to $34,999 | 18 (12.3%) | 6 (1.7%) |
| $35,000 to $49,999 | 36 (24.7%) | 18 (5.1%) |
| $50,000 to $74,999 | 31 (21.2%) | 33 (9.4%) |
| $75,000 to $99,999 | 9 (6.2%) | 71 (20.2%) |
| $100,000 to $149,999 | 12 (8.2%) | 78 (22.2%) |
| $150,000 or more | 18 (12.3%) | 101 (28.7%) |
| Total | 146 (100.0%) | 352 (100.0%) |
Property Value to Household Income Ratio in Stanley
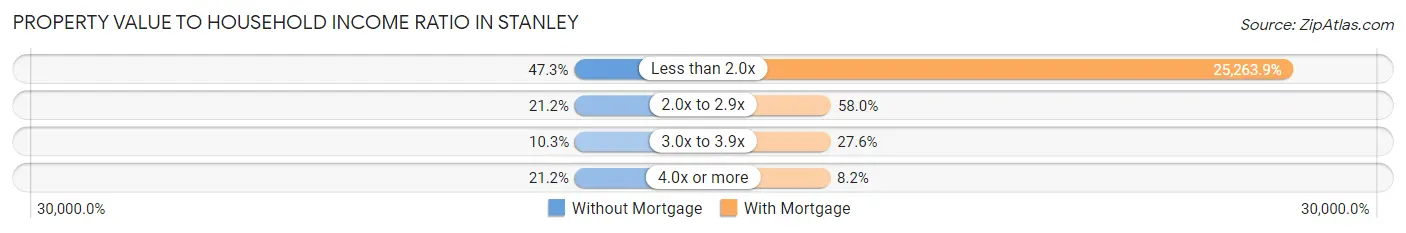
| Value-to-Income Ratio | Without Mortgage | With Mortgage |
| Less than 2.0x | 69 (47.3%) | 88,929 (25,263.9%) |
| 2.0x to 2.9x | 31 (21.2%) | 204 (58.0%) |
| 3.0x to 3.9x | 15 (10.3%) | 97 (27.6%) |
| 4.0x or more | 31 (21.2%) | 29 (8.2%) |
| Total | 146 (100.0%) | 352 (100.0%) |
Real Estate Taxes by Mortgage Status in Stanley
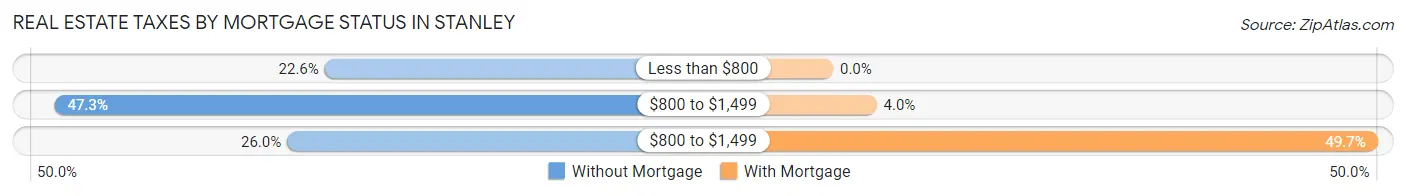
| Property Taxes | Without Mortgage | With Mortgage |
| Less than $800 | 33 (22.6%) | 0 (0.0%) |
| $800 to $1,499 | 69 (47.3%) | 14 (4.0%) |
| $800 to $1,499 | 38 (26.0%) | 175 (49.7%) |
| Total | 146 (100.0%) | 352 (100.0%) |
Health & Disability in Stanley
Health Insurance Coverage by Age in Stanley
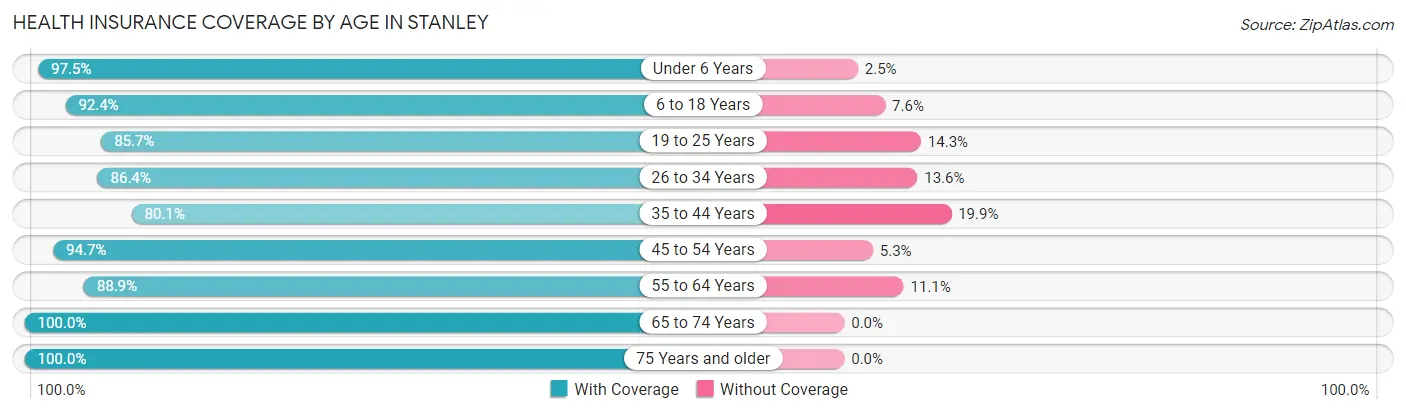
| Age Bracket | With Coverage | Without Coverage |
| Under 6 Years | 193 (97.5%) | 5 (2.5%) |
| 6 to 18 Years | 461 (92.4%) | 38 (7.6%) |
| 19 to 25 Years | 138 (85.7%) | 23 (14.3%) |
| 26 to 34 Years | 279 (86.4%) | 44 (13.6%) |
| 35 to 44 Years | 253 (80.1%) | 63 (19.9%) |
| 45 to 54 Years | 142 (94.7%) | 8 (5.3%) |
| 55 to 64 Years | 201 (88.9%) | 25 (11.1%) |
| 65 to 74 Years | 146 (100.0%) | 0 (0.0%) |
| 75 Years and older | 303 (100.0%) | 0 (0.0%) |
| Total | 2,116 (91.1%) | 206 (8.9%) |
Health Insurance Coverage by Citizenship Status in Stanley
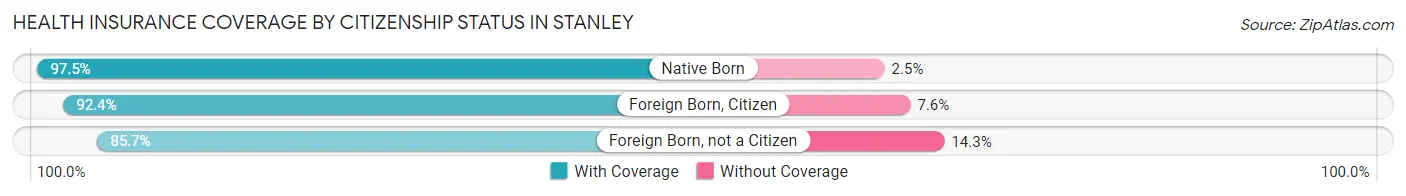
| Citizenship Status | With Coverage | Without Coverage |
| Native Born | 193 (97.5%) | 5 (2.5%) |
| Foreign Born, Citizen | 461 (92.4%) | 38 (7.6%) |
| Foreign Born, not a Citizen | 138 (85.7%) | 23 (14.3%) |
Health Insurance Coverage by Household Income in Stanley
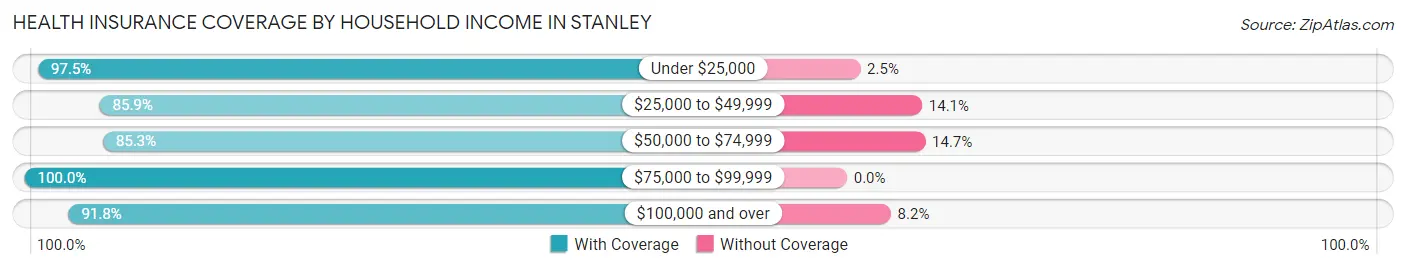
| Household Income | With Coverage | Without Coverage |
| Under $25,000 | 273 (97.5%) | 7 (2.5%) |
| $25,000 to $49,999 | 379 (85.9%) | 62 (14.1%) |
| $50,000 to $74,999 | 541 (85.3%) | 93 (14.7%) |
| $75,000 to $99,999 | 396 (100.0%) | 0 (0.0%) |
| $100,000 and over | 491 (91.8%) | 44 (8.2%) |
Public vs Private Health Insurance Coverage by Age in Stanley
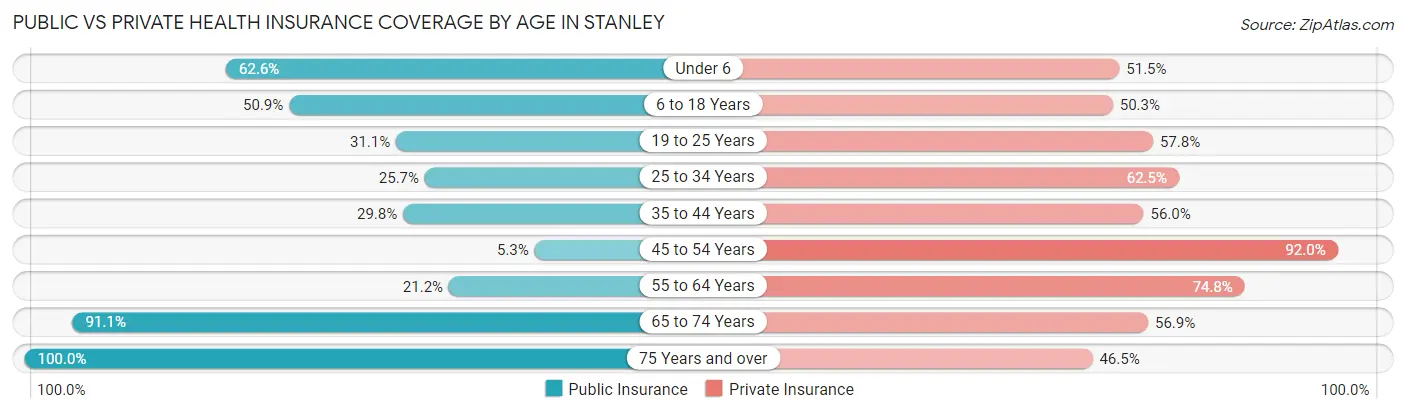
| Age Bracket | Public Insurance | Private Insurance |
| Under 6 | 124 (62.6%) | 102 (51.5%) |
| 6 to 18 Years | 254 (50.9%) | 251 (50.3%) |
| 19 to 25 Years | 50 (31.1%) | 93 (57.8%) |
| 25 to 34 Years | 83 (25.7%) | 202 (62.5%) |
| 35 to 44 Years | 94 (29.7%) | 177 (56.0%) |
| 45 to 54 Years | 8 (5.3%) | 138 (92.0%) |
| 55 to 64 Years | 48 (21.2%) | 169 (74.8%) |
| 65 to 74 Years | 133 (91.1%) | 83 (56.9%) |
| 75 Years and over | 303 (100.0%) | 141 (46.5%) |
| Total | 1,097 (47.2%) | 1,356 (58.4%) |
Disability Status by Sex by Age in Stanley
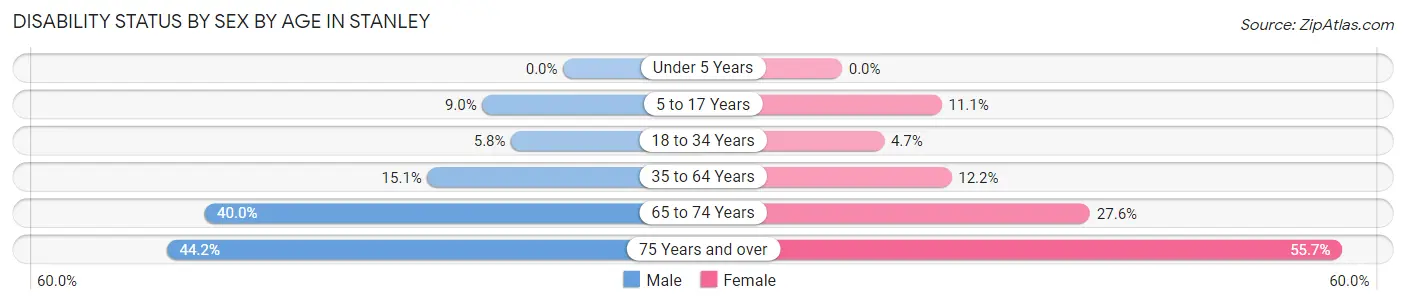
| Age Bracket | Male | Female |
| Under 5 Years | 0 (0.0%) | 0 (0.0%) |
| 5 to 17 Years | 26 (9.0%) | 20 (11.1%) |
| 18 to 34 Years | 14 (5.8%) | 14 (4.7%) |
| 35 to 64 Years | 50 (15.1%) | 44 (12.2%) |
| 65 to 74 Years | 28 (40.0%) | 21 (27.6%) |
| 75 Years and over | 76 (44.2%) | 73 (55.7%) |
Disability Class by Sex by Age in Stanley
Disability Class: Hearing Difficulty
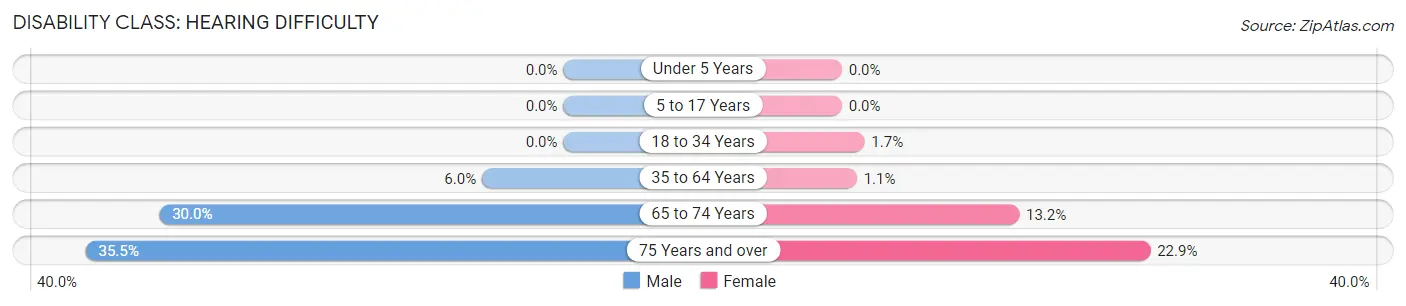
| Age Bracket | Male | Female |
| Under 5 Years | 0 (0.0%) | 0 (0.0%) |
| 5 to 17 Years | 0 (0.0%) | 0 (0.0%) |
| 18 to 34 Years | 0 (0.0%) | 5 (1.7%) |
| 35 to 64 Years | 20 (6.0%) | 4 (1.1%) |
| 65 to 74 Years | 21 (30.0%) | 10 (13.2%) |
| 75 Years and over | 61 (35.5%) | 30 (22.9%) |
Disability Class: Vision Difficulty
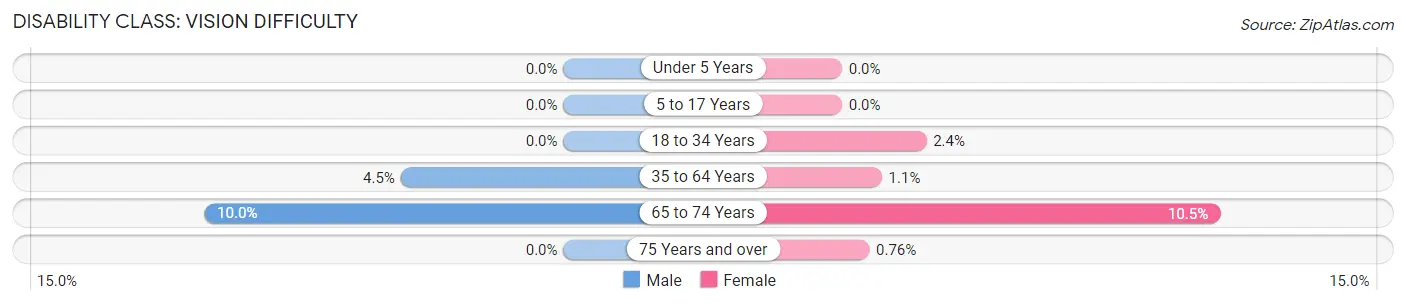
| Age Bracket | Male | Female |
| Under 5 Years | 0 (0.0%) | 0 (0.0%) |
| 5 to 17 Years | 0 (0.0%) | 0 (0.0%) |
| 18 to 34 Years | 0 (0.0%) | 7 (2.4%) |
| 35 to 64 Years | 15 (4.5%) | 4 (1.1%) |
| 65 to 74 Years | 7 (10.0%) | 8 (10.5%) |
| 75 Years and over | 0 (0.0%) | 1 (0.8%) |
Disability Class: Cognitive Difficulty
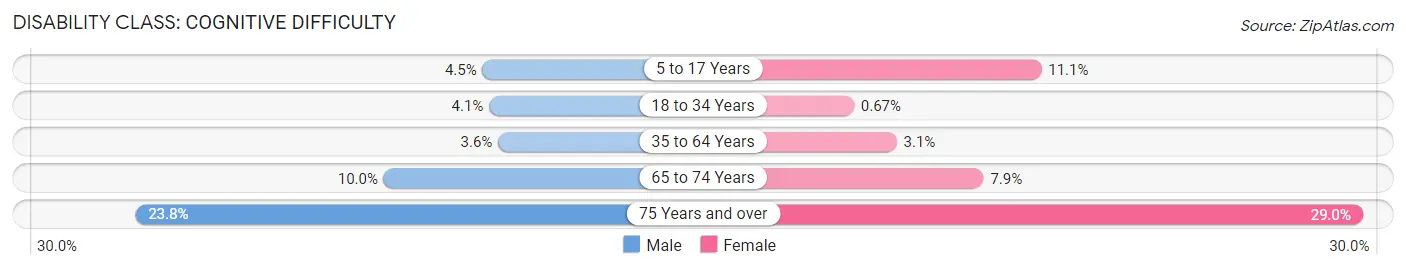
| Age Bracket | Male | Female |
| 5 to 17 Years | 13 (4.5%) | 20 (11.1%) |
| 18 to 34 Years | 10 (4.1%) | 2 (0.7%) |
| 35 to 64 Years | 12 (3.6%) | 11 (3.0%) |
| 65 to 74 Years | 7 (10.0%) | 6 (7.9%) |
| 75 Years and over | 41 (23.8%) | 38 (29.0%) |
Disability Class: Ambulatory Difficulty
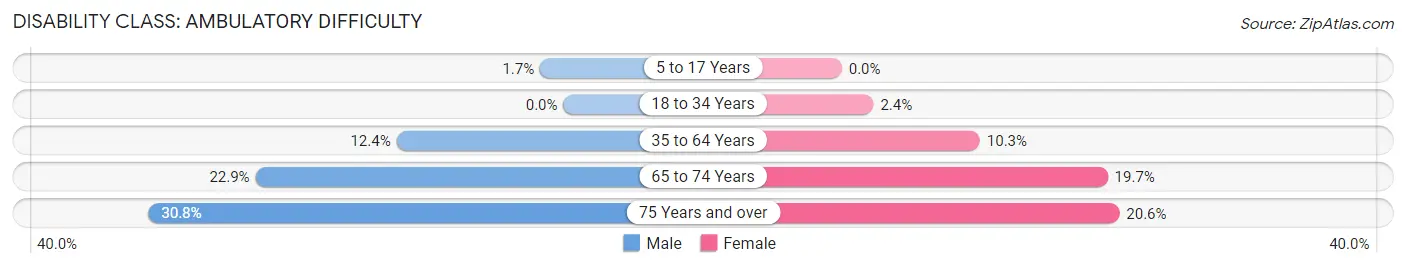
| Age Bracket | Male | Female |
| 5 to 17 Years | 5 (1.7%) | 0 (0.0%) |
| 18 to 34 Years | 0 (0.0%) | 7 (2.4%) |
| 35 to 64 Years | 41 (12.4%) | 37 (10.2%) |
| 65 to 74 Years | 16 (22.9%) | 15 (19.7%) |
| 75 Years and over | 53 (30.8%) | 27 (20.6%) |
Disability Class: Self-Care Difficulty
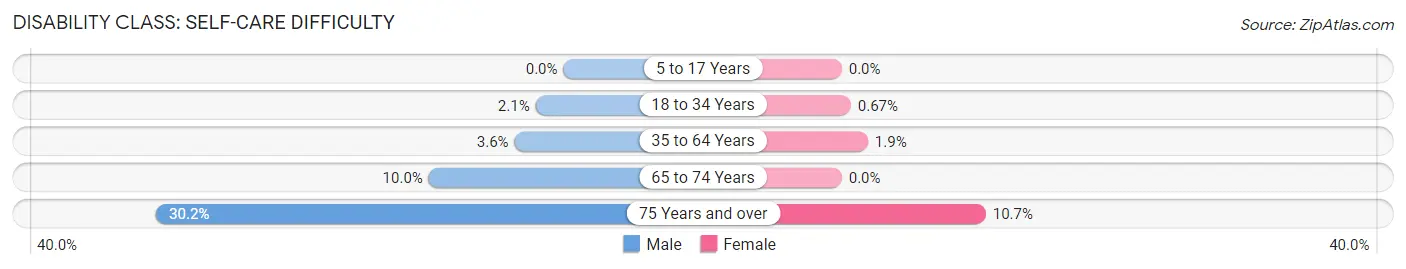
| Age Bracket | Male | Female |
| 5 to 17 Years | 0 (0.0%) | 0 (0.0%) |
| 18 to 34 Years | 5 (2.1%) | 2 (0.7%) |
| 35 to 64 Years | 12 (3.6%) | 7 (1.9%) |
| 65 to 74 Years | 7 (10.0%) | 0 (0.0%) |
| 75 Years and over | 52 (30.2%) | 14 (10.7%) |
Technology Access in Stanley
Computing Device Access in Stanley
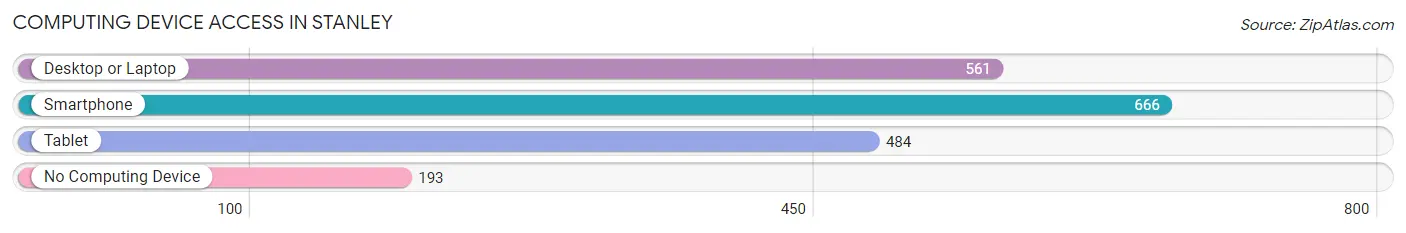
| Device Type | # Households | % Households |
| Desktop or Laptop | 561 | 60.1% |
| Smartphone | 666 | 71.4% |
| Tablet | 484 | 51.9% |
| No Computing Device | 193 | 20.7% |
| Total | 933 | 100.0% |
Internet Access in Stanley
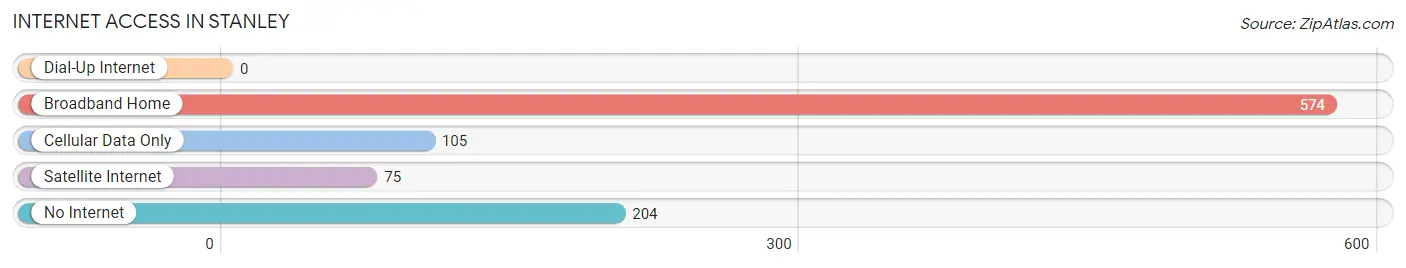
| Internet Type | # Households | % Households |
| Dial-Up Internet | 0 | 0.0% |
| Broadband Home | 574 | 61.5% |
| Cellular Data Only | 105 | 11.3% |
| Satellite Internet | 75 | 8.0% |
| No Internet | 204 | 21.9% |
| Total | 933 | 100.0% |
Stanley Summary
Stanley, Wisconsin is a small city located in the northwestern part of the state, in Chippewa County. It is situated on the banks of the Chippewa River, and is home to a population of approximately 2,500 people. The city is known for its strong sense of community and its commitment to preserving its rural character.
History
The area that is now Stanley was first settled in the late 1800s by a group of Norwegian immigrants. The city was officially incorporated in 1891, and was named after Stanley, Wisconsin, a nearby town. The city quickly grew, and by the early 1900s, it had become a thriving agricultural and industrial center. The city was home to several factories, including a sawmill, a flour mill, and a brickyard.
In the early 1900s, the city also became a popular tourist destination. The Chippewa River was a popular spot for fishing and boating, and the city was home to several resorts and hotels. The city also had a thriving entertainment scene, with several theaters, dance halls, and other attractions.
Geography
Stanley is located in the northwestern part of Wisconsin, in Chippewa County. It is situated on the banks of the Chippewa River, and is surrounded by rolling hills and forests. The city is located about 30 miles from Eau Claire, Wisconsin, and about 90 miles from Minneapolis, Minnesota.
The city has a total area of 2.2 square miles, all of which is land. The city has a humid continental climate, with cold winters and warm summers. The average annual temperature is around 40 degrees Fahrenheit.
Economy
The economy of Stanley is largely based on agriculture and tourism. The city is home to several farms, and the surrounding area is known for its dairy and beef production. The city is also home to several small businesses, including restaurants, retail stores, and service providers.
The city is also a popular tourist destination. The Chippewa River is a popular spot for fishing and boating, and the city is home to several resorts and hotels. The city also has several attractions, including a museum, a theater, and a golf course.
Demographics
As of the 2010 census, the population of Stanley was 2,500. The racial makeup of the city was 97.2% White, 0.4% African American, 0.4% Native American, 0.4% Asian, 0.2% from other races, and 1.4% from two or more races. Hispanic or Latino of any race were 1.2% of the population.
The median household income in Stanley was $41,250, and the median family income was $50,000. The per capita income was $20,000. About 10.2% of families and 13.2% of the population were below the poverty line.
Stanley is a small city with a strong sense of community and a commitment to preserving its rural character. The city is home to several farms and businesses, and is a popular tourist destination. The city has a diverse population, and a strong economy. Stanley is a great place to live, work, and visit.
Common Questions
What is Per Capita Income in Stanley?
Per Capita income in Stanley is $17,747.
What is the Median Family Income in Stanley?
Median Family Income in Stanley is $66,250.
What is the Median Household income in Stanley?
Median Household Income in Stanley is $55,919.
What is Income or Wage Gap in Stanley?
Income or Wage Gap in Stanley is 6.9%.
Women in Stanley earn 93.1 cents for every dollar earned by a man.
What is Inequality or Gini Index in Stanley?
Inequality or Gini Index in Stanley is 0.38.
What is the Total Population of Stanley?
Total Population of Stanley is 3,772.
What is the Total Male Population of Stanley?
Total Male Population of Stanley is 2,629.
What is the Total Female Population of Stanley?
Total Female Population of Stanley is 1,143.
What is the Ratio of Males per 100 Females in Stanley?
There are 230.01 Males per 100 Females in Stanley.
What is the Ratio of Females per 100 Males in Stanley?
There are 43.48 Females per 100 Males in Stanley.
What is the Median Population Age in Stanley?
Median Population Age in Stanley is 38.0 Years.
What is the Average Family Size in Stanley
Average Family Size in Stanley is 3.2 People.
What is the Average Household Size in Stanley
Average Household Size in Stanley is 2.5 People.
How Large is the Labor Force in Stanley?
There are 1,025 People in the Labor Forcein in Stanley.
What is the Percentage of People in the Labor Force in Stanley?
32.0% of People are in the Labor Force in Stanley.
What is the Unemployment Rate in Stanley?
Unemployment Rate in Stanley is 2.5%.