Spooner, WI Map & Demographics
Spooner Map
Spooner Overview
$28,562
PER CAPITA INCOME
$57,946
AVG FAMILY INCOME
$49,628
AVG HOUSEHOLD INCOME
34.9%
WAGE / INCOME GAP [ % ]
65.1¢/ $1
WAGE / INCOME GAP [ $ ]
0.40
INEQUALITY / GINI INDEX
2,062
TOTAL POPULATION
1,056
MALE POPULATION
1,006
FEMALE POPULATION
104.97
MALES / 100 FEMALES
95.27
FEMALES / 100 MALES
54.7
MEDIAN AGE
2.5
AVG FAMILY SIZE
1.9
AVG HOUSEHOLD SIZE
902
LABOR FORCE [ PEOPLE ]
50.7%
PERCENT IN LABOR FORCE
6.1%
UNEMPLOYMENT RATE
Spooner Zip Codes
Spooner Area Codes
Income in Spooner
Income Overview in Spooner
Per Capita Income in Spooner is $28,562, while median incomes of families and households are $57,946 and $49,628 respectively.
| Characteristic | Number | Measure |
| Per Capita Income | 2,062 | $28,562 |
| Median Family Income | 505 | $57,946 |
| Mean Family Income | 505 | $74,042 |
| Median Household Income | 1,041 | $49,628 |
| Mean Household Income | 1,041 | $55,052 |
| Income Deficit | 505 | $0 |
| Wage / Income Gap (%) | 2,062 | 34.91% |
| Wage / Income Gap ($) | 2,062 | 65.09¢ per $1 |
| Gini / Inequality Index | 2,062 | 0.40 |
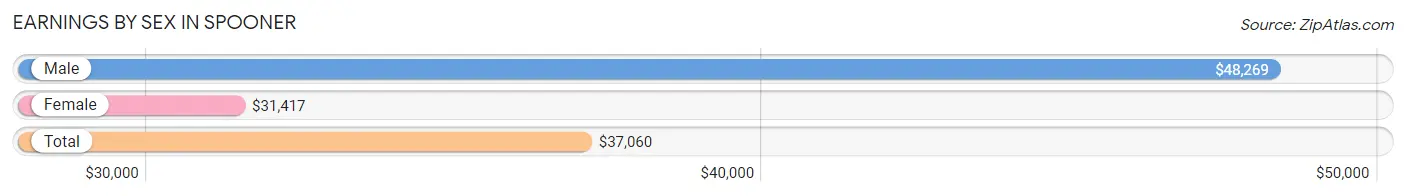
Earnings by Sex in Spooner
Average Earnings in Spooner are $37,060, $48,269 for men and $31,417 for women, a difference of 34.9%.
| Sex | Number | Average Earnings |
| Male | 464 (48.0%) | $48,269 |
| Female | 503 (52.0%) | $31,417 |
| Total | 967 (100.0%) | $37,060 |
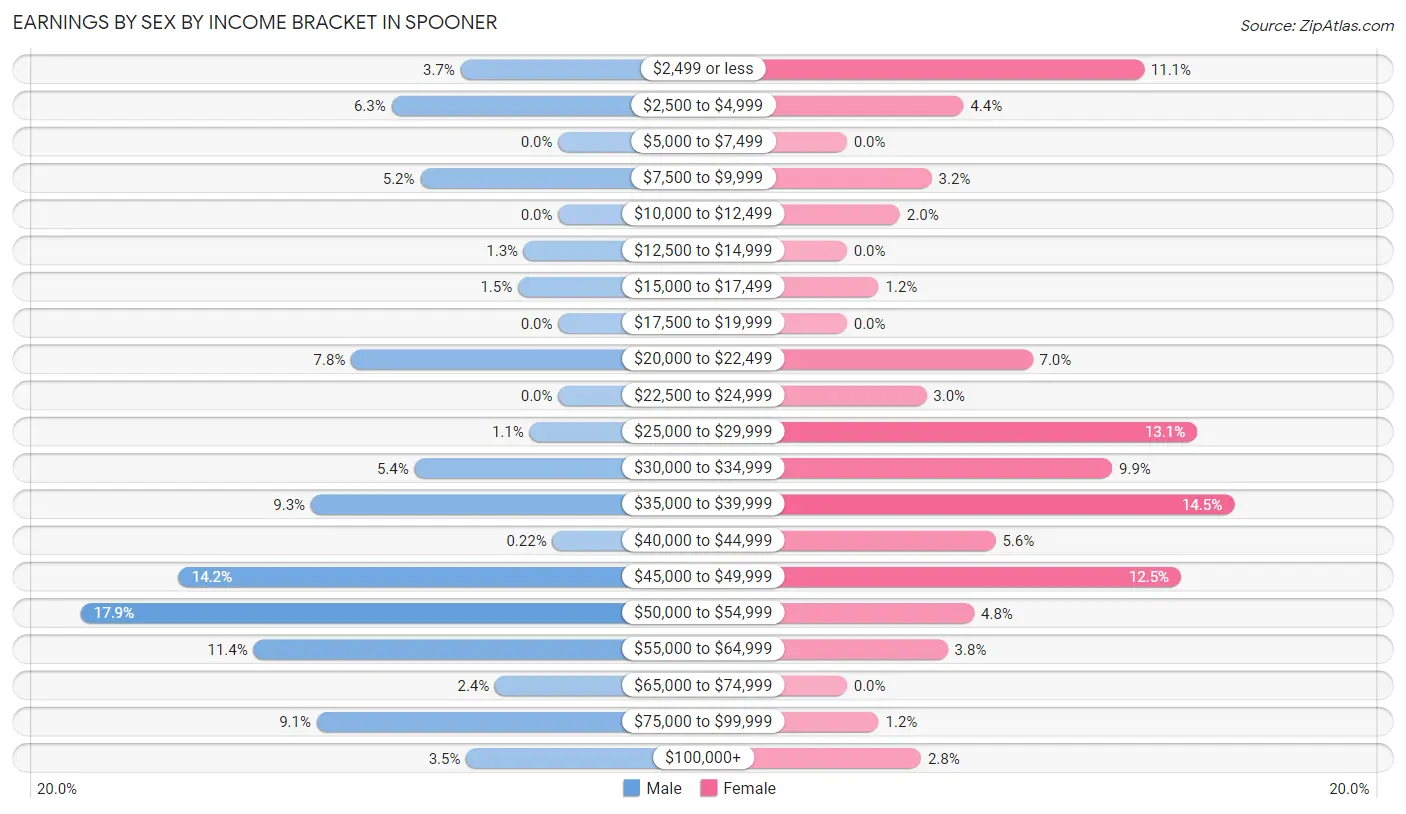
Earnings by Sex by Income Bracket in Spooner
The most common earnings brackets in Spooner are $50,000 to $54,999 for men (83 | 17.9%) and $35,000 to $39,999 for women (73 | 14.5%).
| Income | Male | Female |
| $2,499 or less | 17 (3.7%) | 56 (11.1%) |
| $2,500 to $4,999 | 29 (6.2%) | 22 (4.4%) |
| $5,000 to $7,499 | 0 (0.0%) | 0 (0.0%) |
| $7,500 to $9,999 | 24 (5.2%) | 16 (3.2%) |
| $10,000 to $12,499 | 0 (0.0%) | 10 (2.0%) |
| $12,500 to $14,999 | 6 (1.3%) | 0 (0.0%) |
| $15,000 to $17,499 | 7 (1.5%) | 6 (1.2%) |
| $17,500 to $19,999 | 0 (0.0%) | 0 (0.0%) |
| $20,000 to $22,499 | 36 (7.8%) | 35 (7.0%) |
| $22,500 to $24,999 | 0 (0.0%) | 15 (3.0%) |
| $25,000 to $29,999 | 5 (1.1%) | 66 (13.1%) |
| $30,000 to $34,999 | 25 (5.4%) | 50 (9.9%) |
| $35,000 to $39,999 | 43 (9.3%) | 73 (14.5%) |
| $40,000 to $44,999 | 1 (0.2%) | 28 (5.6%) |
| $45,000 to $49,999 | 66 (14.2%) | 63 (12.5%) |
| $50,000 to $54,999 | 83 (17.9%) | 24 (4.8%) |
| $55,000 to $64,999 | 53 (11.4%) | 19 (3.8%) |
| $65,000 to $74,999 | 11 (2.4%) | 0 (0.0%) |
| $75,000 to $99,999 | 42 (9.0%) | 6 (1.2%) |
| $100,000+ | 16 (3.5%) | 14 (2.8%) |
| Total | 464 (100.0%) | 503 (100.0%) |
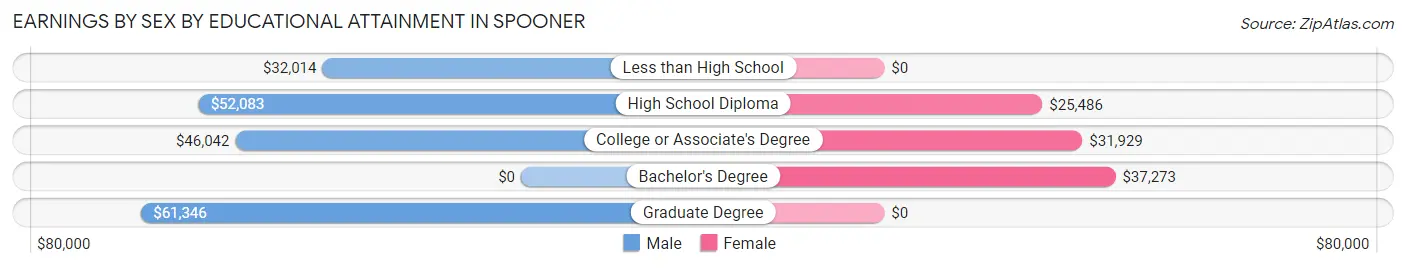
Earnings by Sex by Educational Attainment in Spooner
Average earnings in Spooner are $47,564 for men and $31,714 for women, a difference of 33.3%. Men with an educational attainment of graduate degree enjoy the highest average annual earnings of $61,346, while those with less than high school education earn the least with $32,014. Women with an educational attainment of bachelor's degree earn the most with the average annual earnings of $37,273, while those with high school diploma education have the smallest earnings of $25,486.
| Educational Attainment | Male Income | Female Income |
| Less than High School | $32,014 | $0 |
| High School Diploma | $52,083 | $25,486 |
| College or Associate's Degree | $46,042 | $31,929 |
| Bachelor's Degree | - | - |
| Graduate Degree | $61,346 | $0 |
| Total | $47,564 | $31,714 |
Family Income in Spooner
Family Income Brackets in Spooner
According to the Spooner family income data, there are 132 families falling into the $100,000 to $149,999 income range, which is the most common income bracket and makes up 26.1% of all families.
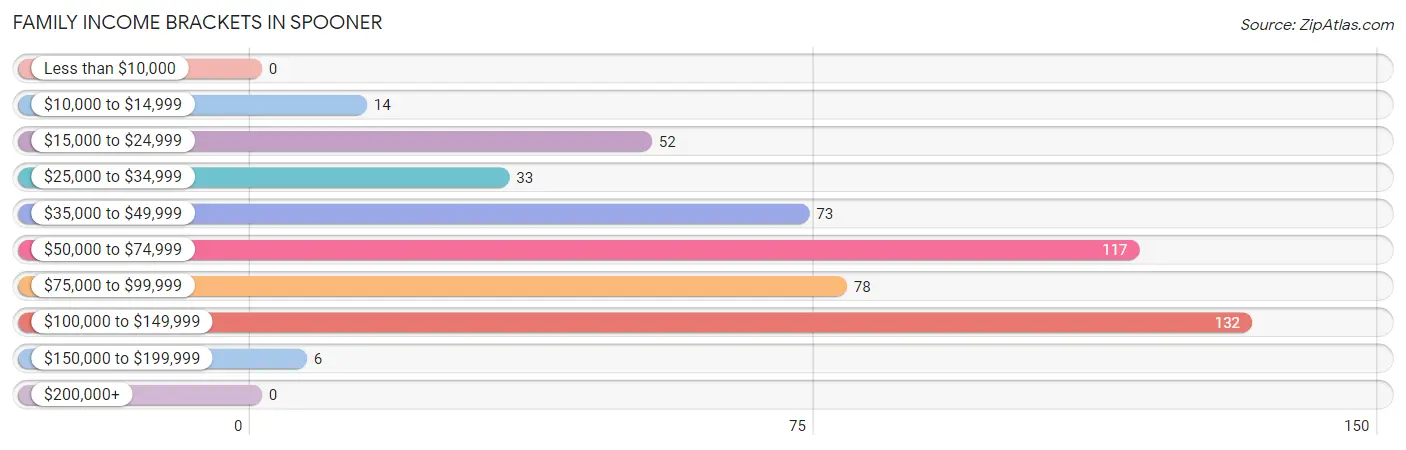
| Income Bracket | # Families | % Families |
| Less than $10,000 | 0 | 0.0% |
| $10,000 to $14,999 | 14 | 2.8% |
| $15,000 to $24,999 | 52 | 10.3% |
| $25,000 to $34,999 | 33 | 6.5% |
| $35,000 to $49,999 | 73 | 14.5% |
| $50,000 to $74,999 | 117 | 23.2% |
| $75,000 to $99,999 | 78 | 15.4% |
| $100,000 to $149,999 | 132 | 26.1% |
| $150,000 to $199,999 | 6 | 1.2% |
| $200,000+ | 0 | 0.0% |
Family Income by Famaliy Size in Spooner
4-person families (75 | 14.8%) account for the highest median family income in Spooner with $93,523 per family, while 2-person families (328 | 64.9%) have the highest median income of $33,250 per family member.
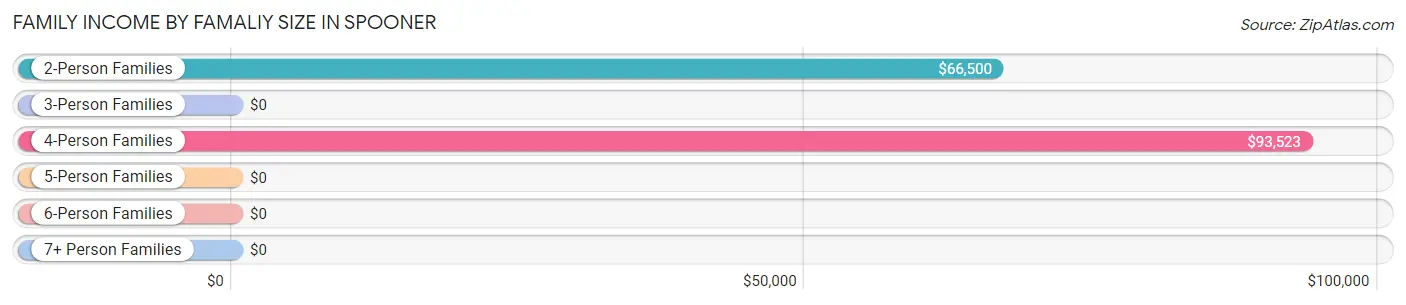
| Income Bracket | # Families | Median Income |
| 2-Person Families | 328 (64.9%) | $66,500 |
| 3-Person Families | 22 (4.4%) | $0 |
| 4-Person Families | 75 (14.8%) | $93,523 |
| 5-Person Families | 50 (9.9%) | $0 |
| 6-Person Families | 30 (5.9%) | $0 |
| 7+ Person Families | 0 (0.0%) | $0 |
| Total | 505 (100.0%) | $57,946 |
Family Income by Number of Earners in Spooner
The median family income in Spooner is $57,946, with families comprising 3+ earners (37) having the highest median family income of $99,844, while families with 1 earner (175) have the lowest median family income of $48,007, accounting for 7.3% and 34.6% of families, respectively.
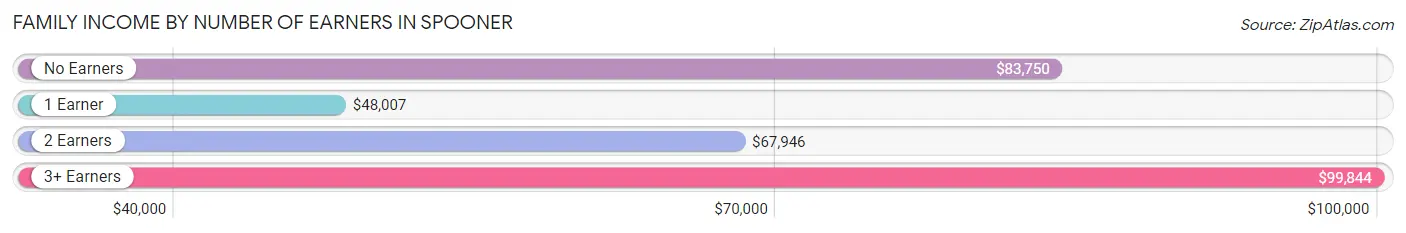
| Number of Earners | # Families | Median Income |
| No Earners | 118 (23.4%) | $83,750 |
| 1 Earner | 175 (34.6%) | $48,007 |
| 2 Earners | 175 (34.6%) | $67,946 |
| 3+ Earners | 37 (7.3%) | $99,844 |
| Total | 505 (100.0%) | $57,946 |
Household Income in Spooner
Household Income Brackets in Spooner
With 245 households falling in the category, the $50,000 to $74,999 income range is the most frequent in Spooner, accounting for 23.5% of all households.
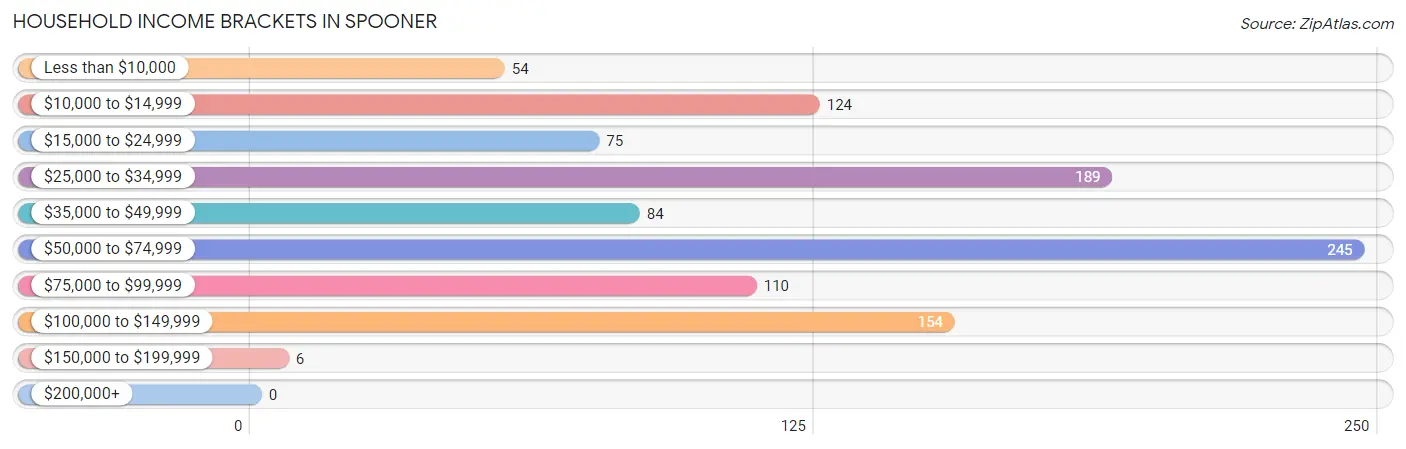
| Income Bracket | # Households | % Households |
| Less than $10,000 | 54 | 5.2% |
| $10,000 to $14,999 | 124 | 11.9% |
| $15,000 to $24,999 | 75 | 7.2% |
| $25,000 to $34,999 | 189 | 18.2% |
| $35,000 to $49,999 | 84 | 8.1% |
| $50,000 to $74,999 | 245 | 23.5% |
| $75,000 to $99,999 | 110 | 10.6% |
| $100,000 to $149,999 | 154 | 14.8% |
| $150,000 to $199,999 | 6 | 0.6% |
| $200,000+ | 0 | 0.0% |
Household Income by Householder Age in Spooner
The median household income in Spooner is $49,628, with the highest median household income of $56,406 found in the 25 to 44 years age bracket for the primary householder. A total of 240 households (23.1%) fall into this category. Meanwhile, the 15 to 24 years age bracket for the primary householder has the lowest median household income of $0, with 37 households (3.5%) in this group.
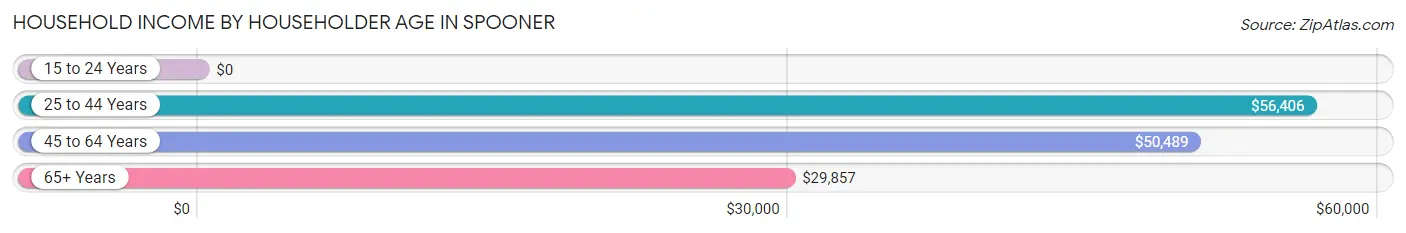
| Income Bracket | # Households | Median Income |
| 15 to 24 Years | 37 (3.5%) | $0 |
| 25 to 44 Years | 240 (23.1%) | $56,406 |
| 45 to 64 Years | 422 (40.5%) | $50,489 |
| 65+ Years | 342 (32.9%) | $29,857 |
| Total | 1,041 (100.0%) | $49,628 |
Poverty in Spooner
Income Below Poverty by Sex and Age in Spooner
With 20.2% poverty level for males and 17.6% for females among the residents of Spooner, 12 to 14 year old males and 35 to 44 year old females are the most vulnerable to poverty, with 33 males (94.3%) and 57 females (40.4%) in their respective age groups living below the poverty level.
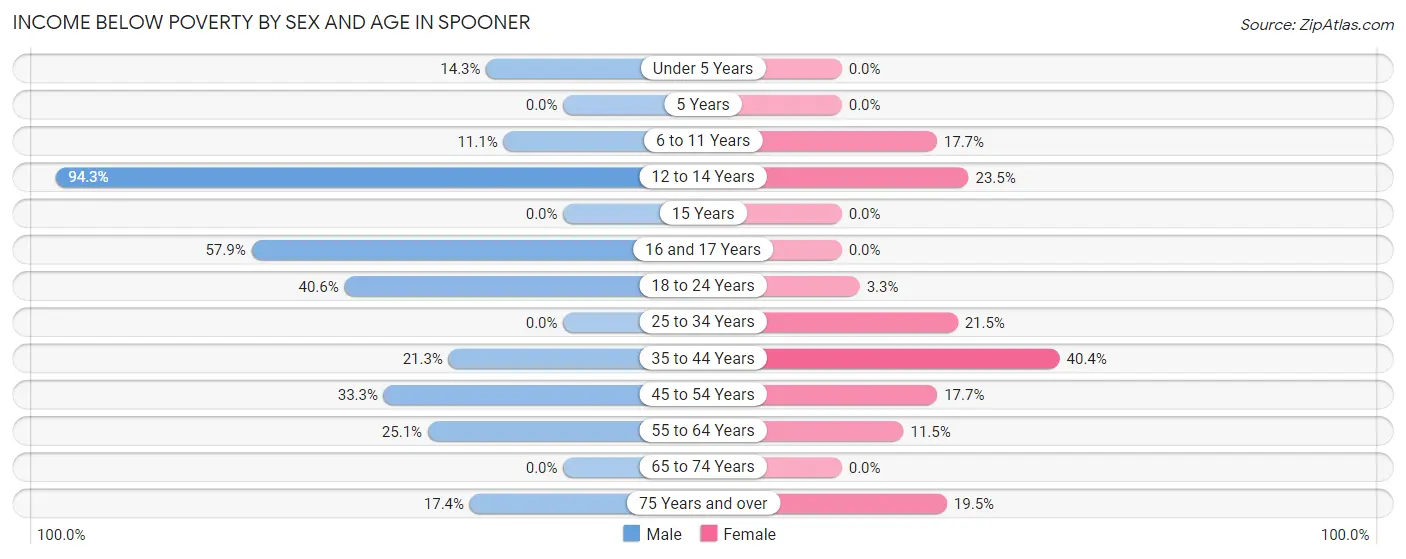
| Age Bracket | Male | Female |
| Under 5 Years | 1 (14.3%) | 0 (0.0%) |
| 5 Years | 0 (0.0%) | 0 (0.0%) |
| 6 to 11 Years | 7 (11.1%) | 6 (17.6%) |
| 12 to 14 Years | 33 (94.3%) | 12 (23.5%) |
| 15 Years | 0 (0.0%) | 0 (0.0%) |
| 16 and 17 Years | 11 (57.9%) | 0 (0.0%) |
| 18 to 24 Years | 26 (40.6%) | 1 (3.3%) |
| 25 to 34 Years | 0 (0.0%) | 20 (21.5%) |
| 35 to 44 Years | 20 (21.3%) | 57 (40.4%) |
| 45 to 54 Years | 45 (33.3%) | 14 (17.7%) |
| 55 to 64 Years | 46 (25.1%) | 25 (11.5%) |
| 65 to 74 Years | 0 (0.0%) | 0 (0.0%) |
| 75 Years and over | 17 (17.3%) | 32 (19.5%) |
| Total | 206 (20.2%) | 167 (17.6%) |
Income Above Poverty by Sex and Age in Spooner
According to the poverty statistics in Spooner, males aged 5 years and females aged under 5 years are the age groups that are most secure financially, with 100.0% of males and 100.0% of females in these age groups living above the poverty line.
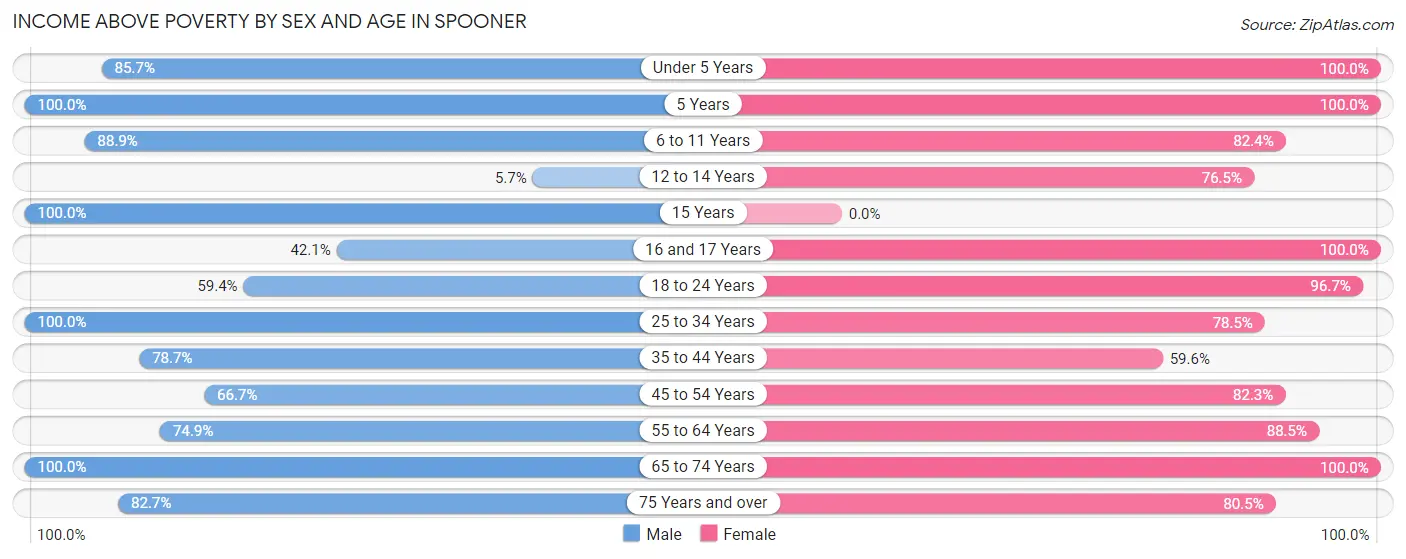
| Age Bracket | Male | Female |
| Under 5 Years | 6 (85.7%) | 5 (100.0%) |
| 5 Years | 47 (100.0%) | 15 (100.0%) |
| 6 to 11 Years | 56 (88.9%) | 28 (82.4%) |
| 12 to 14 Years | 2 (5.7%) | 39 (76.5%) |
| 15 Years | 10 (100.0%) | 0 (0.0%) |
| 16 and 17 Years | 8 (42.1%) | 6 (100.0%) |
| 18 to 24 Years | 38 (59.4%) | 29 (96.7%) |
| 25 to 34 Years | 100 (100.0%) | 73 (78.5%) |
| 35 to 44 Years | 74 (78.7%) | 84 (59.6%) |
| 45 to 54 Years | 90 (66.7%) | 65 (82.3%) |
| 55 to 64 Years | 137 (74.9%) | 193 (88.5%) |
| 65 to 74 Years | 166 (100.0%) | 110 (100.0%) |
| 75 Years and over | 81 (82.7%) | 132 (80.5%) |
| Total | 815 (79.8%) | 779 (82.4%) |
Income Below Poverty Among Married-Couple Families in Spooner
The poverty statistics for married-couple families in Spooner show that 3.6% or 14 of the total 393 families live below the poverty line. Families with 1 or 2 children have the highest poverty rate of 16.5%, comprising of 14 families. On the other hand, families with no children have the lowest poverty rate of 0.0%, which includes 0 families.
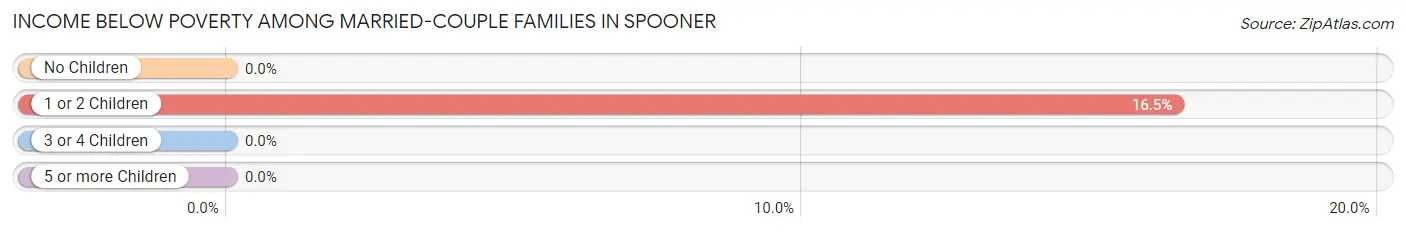
| Children | Above Poverty | Below Poverty |
| No Children | 308 (100.0%) | 0 (0.0%) |
| 1 or 2 Children | 71 (83.5%) | 14 (16.5%) |
| 3 or 4 Children | 0 (0.0%) | 0 (0.0%) |
| 5 or more Children | 0 (0.0%) | 0 (0.0%) |
| Total | 379 (96.4%) | 14 (3.6%) |
Income Below Poverty Among Single-Parent Households in Spooner
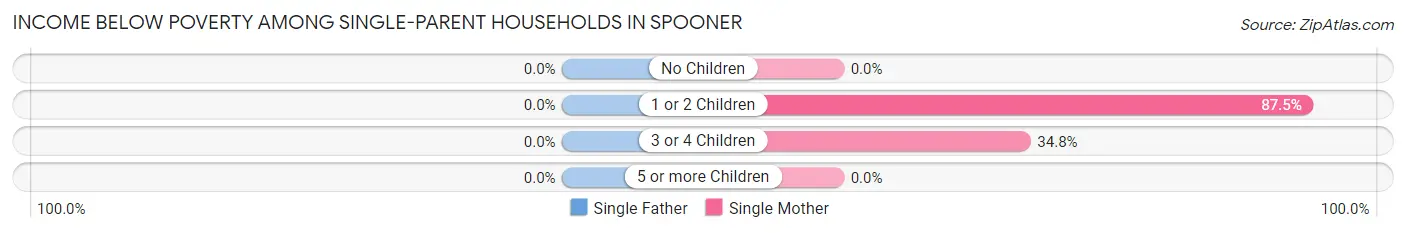
| Children | Single Father | Single Mother |
| No Children | 0 (0.0%) | 0 (0.0%) |
| 1 or 2 Children | 0 (0.0%) | 14 (87.5%) |
| 3 or 4 Children | 0 (0.0%) | 16 (34.8%) |
| 5 or more Children | 0 (0.0%) | 0 (0.0%) |
| Total | 0 (0.0%) | 30 (36.1%) |
Income Below Poverty Among Married-Couple vs Single-Parent Households in Spooner
The poverty data for Spooner shows that 14 of the married-couple family households (3.6%) and 30 of the single-parent households (26.8%) are living below the poverty level. Within the married-couple family households, those with 1 or 2 children have the highest poverty rate, with 14 households (16.5%) falling below the poverty line. Among the single-parent households, those with 1 or 2 children have the highest poverty rate, with 14 household (53.8%) living below poverty.
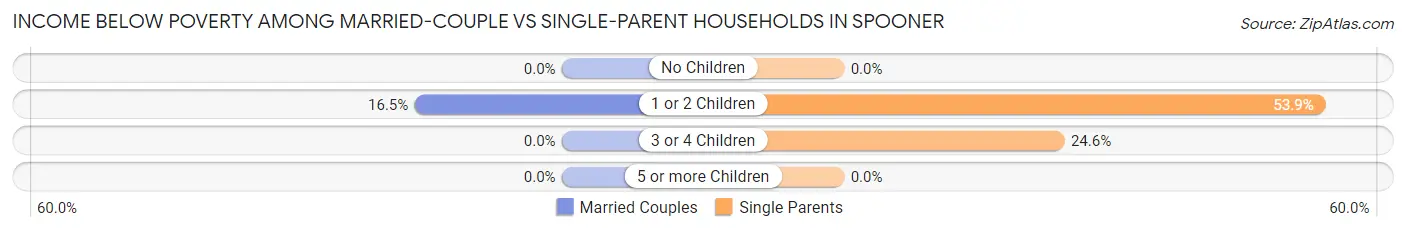
| Children | Married-Couple Families | Single-Parent Households |
| No Children | 0 (0.0%) | 0 (0.0%) |
| 1 or 2 Children | 14 (16.5%) | 14 (53.8%) |
| 3 or 4 Children | 0 (0.0%) | 16 (24.6%) |
| 5 or more Children | 0 (0.0%) | 0 (0.0%) |
| Total | 14 (3.6%) | 30 (26.8%) |
Race in Spooner
The most populous races in Spooner are White / Caucasian (1,798 | 87.2%), Hispanic or Latino (188 | 9.1%), and Two or more Races (91 | 4.4%).
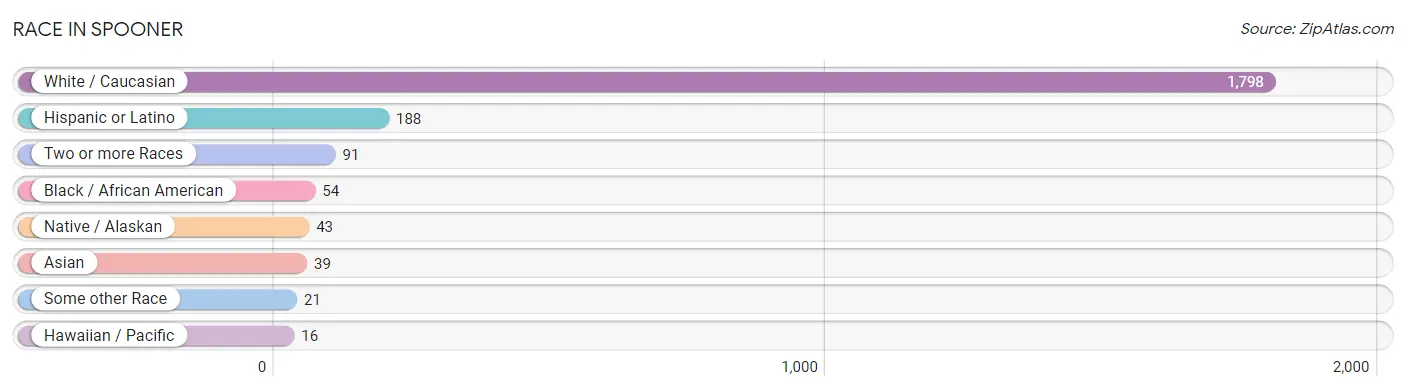
| Race | # Population | % Population |
| Asian | 39 | 1.9% |
| Black / African American | 54 | 2.6% |
| Hawaiian / Pacific | 16 | 0.8% |
| Hispanic or Latino | 188 | 9.1% |
| Native / Alaskan | 43 | 2.1% |
| White / Caucasian | 1,798 | 87.2% |
| Two or more Races | 91 | 4.4% |
| Some other Race | 21 | 1.0% |
| Total | 2,062 | 100.0% |
Ancestry in Spooner
The most populous ancestries reported in Spooner are German (634 | 30.7%), English (163 | 7.9%), Mexican (137 | 6.6%), Norwegian (136 | 6.6%), and American (126 | 6.1%), together accounting for 58.0% of all Spooner residents.
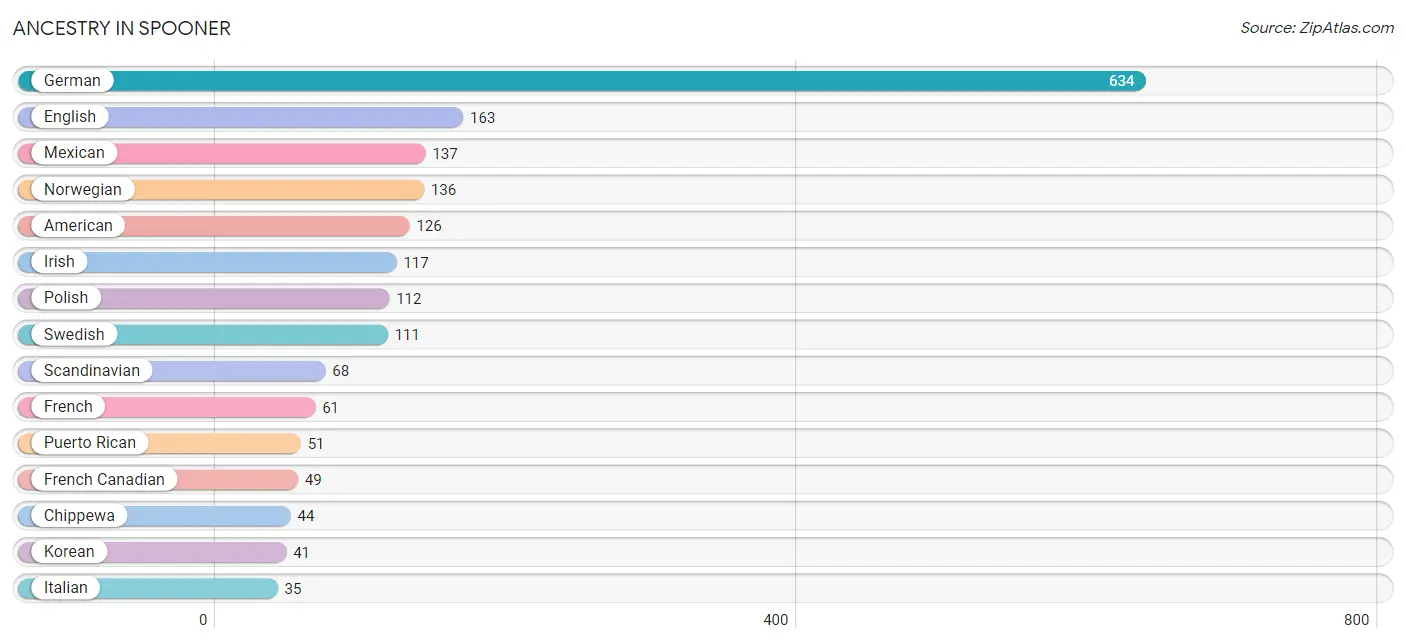
| Ancestry | # Population | % Population |
| American | 126 | 6.1% |
| British | 5 | 0.2% |
| Chippewa | 44 | 2.1% |
| Croatian | 11 | 0.5% |
| Czechoslovakian | 11 | 0.5% |
| Danish | 8 | 0.4% |
| Dutch | 4 | 0.2% |
| English | 163 | 7.9% |
| European | 25 | 1.2% |
| Finnish | 5 | 0.2% |
| French | 61 | 3.0% |
| French Canadian | 49 | 2.4% |
| German | 634 | 30.7% |
| German Russian | 9 | 0.4% |
| Greek | 16 | 0.8% |
| Irish | 117 | 5.7% |
| Italian | 35 | 1.7% |
| Korean | 41 | 2.0% |
| Mexican | 137 | 6.6% |
| Mexican American Indian | 8 | 0.4% |
| Nigerian | 10 | 0.5% |
| Norwegian | 136 | 6.6% |
| Polish | 112 | 5.4% |
| Portuguese | 19 | 0.9% |
| Puerto Rican | 51 | 2.5% |
| Russian | 20 | 1.0% |
| Scandinavian | 68 | 3.3% |
| Scottish | 19 | 0.9% |
| Slovak | 18 | 0.9% |
| Subsaharan African | 10 | 0.5% |
| Swedish | 111 | 5.4% |
| Swiss | 23 | 1.1% |
| Welsh | 20 | 1.0% | View All 33 Rows |
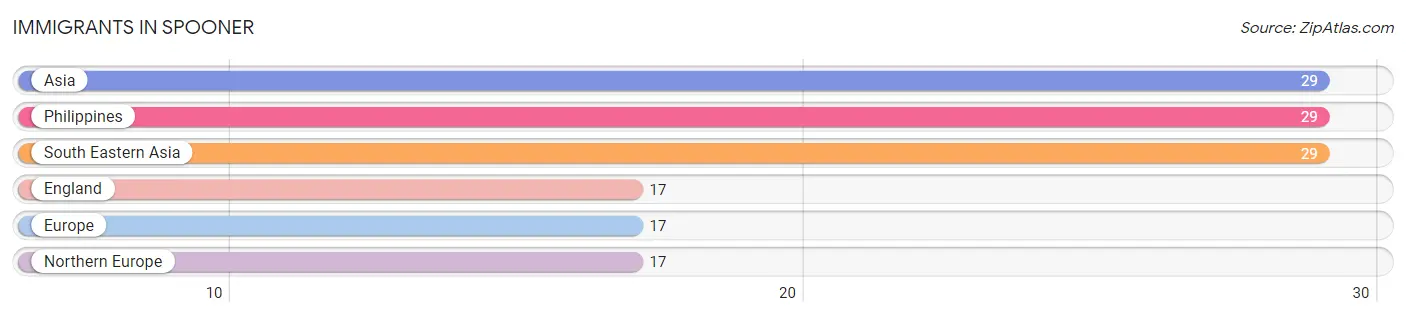
Immigrants in Spooner
The most numerous immigrant groups reported in Spooner came from Asia (29 | 1.4%), Philippines (29 | 1.4%), South Eastern Asia (29 | 1.4%), England (17 | 0.8%), and Europe (17 | 0.8%), together accounting for 5.9% of all Spooner residents.
| Immigration Origin | # Population | % Population |
| Asia | 29 | 1.4% |
| England | 17 | 0.8% |
| Europe | 17 | 0.8% |
| Northern Europe | 17 | 0.8% |
| Philippines | 29 | 1.4% |
| South Eastern Asia | 29 | 1.4% | View All 6 Rows |
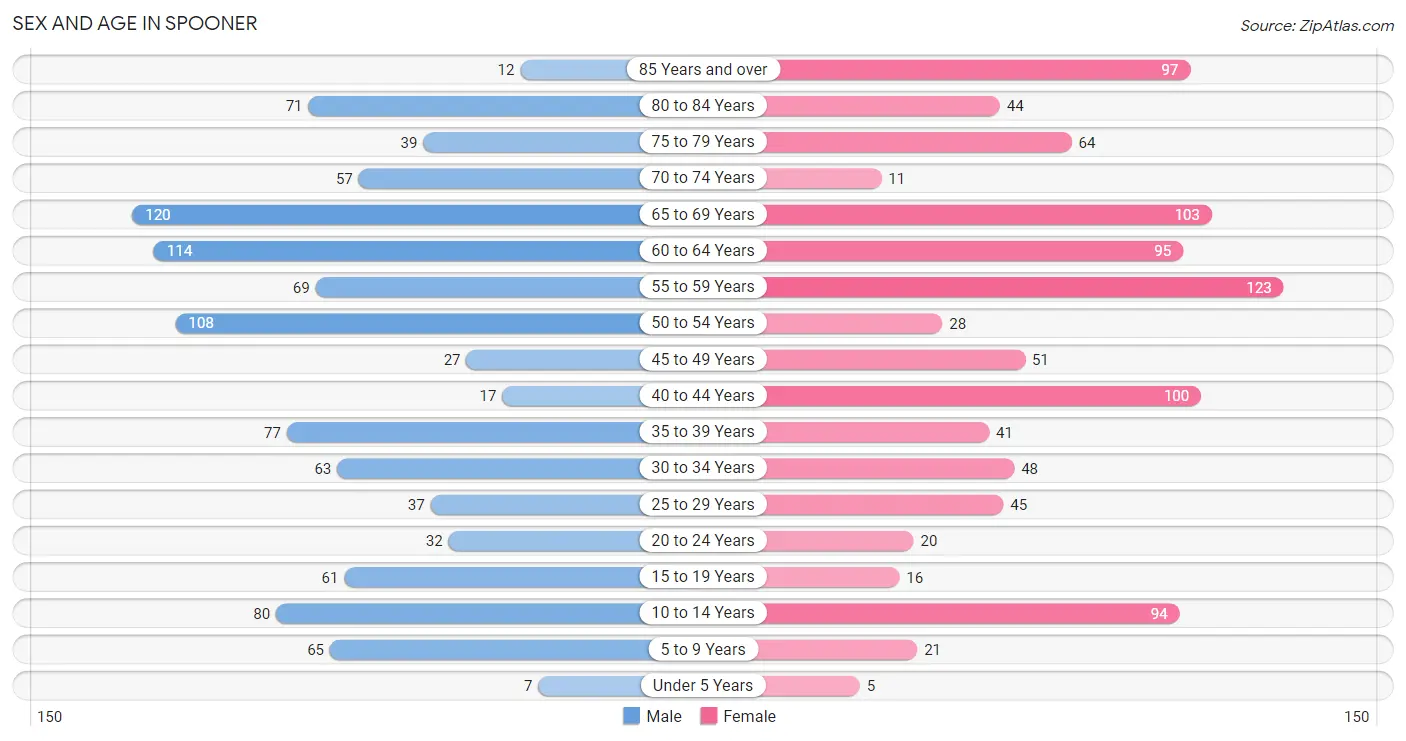
Sex and Age in Spooner
Sex and Age in Spooner
The most populous age groups in Spooner are 65 to 69 Years (120 | 11.4%) for men and 55 to 59 Years (123 | 12.2%) for women.
| Age Bracket | Male | Female |
| Under 5 Years | 7 (0.7%) | 5 (0.5%) |
| 5 to 9 Years | 65 (6.2%) | 21 (2.1%) |
| 10 to 14 Years | 80 (7.6%) | 94 (9.3%) |
| 15 to 19 Years | 61 (5.8%) | 16 (1.6%) |
| 20 to 24 Years | 32 (3.0%) | 20 (2.0%) |
| 25 to 29 Years | 37 (3.5%) | 45 (4.5%) |
| 30 to 34 Years | 63 (6.0%) | 48 (4.8%) |
| 35 to 39 Years | 77 (7.3%) | 41 (4.1%) |
| 40 to 44 Years | 17 (1.6%) | 100 (9.9%) |
| 45 to 49 Years | 27 (2.6%) | 51 (5.1%) |
| 50 to 54 Years | 108 (10.2%) | 28 (2.8%) |
| 55 to 59 Years | 69 (6.5%) | 123 (12.2%) |
| 60 to 64 Years | 114 (10.8%) | 95 (9.4%) |
| 65 to 69 Years | 120 (11.4%) | 103 (10.2%) |
| 70 to 74 Years | 57 (5.4%) | 11 (1.1%) |
| 75 to 79 Years | 39 (3.7%) | 64 (6.4%) |
| 80 to 84 Years | 71 (6.7%) | 44 (4.4%) |
| 85 Years and over | 12 (1.1%) | 97 (9.6%) |
| Total | 1,056 (100.0%) | 1,006 (100.0%) |
Families and Households in Spooner
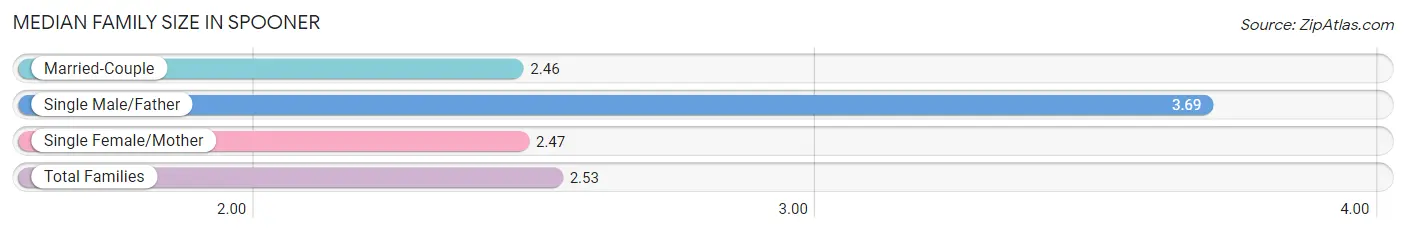
Median Family Size in Spooner
The median family size in Spooner is 2.53 persons per family, with single male/father families (29 | 5.7%) accounting for the largest median family size of 3.69 persons per family. On the other hand, married-couple families (393 | 77.8%) represent the smallest median family size with 2.46 persons per family.
| Family Type | # Families | Family Size |
| Married-Couple | 393 (77.8%) | 2.46 |
| Single Male/Father | 29 (5.7%) | 3.69 |
| Single Female/Mother | 83 (16.4%) | 2.47 |
| Total Families | 505 (100.0%) | 2.53 |
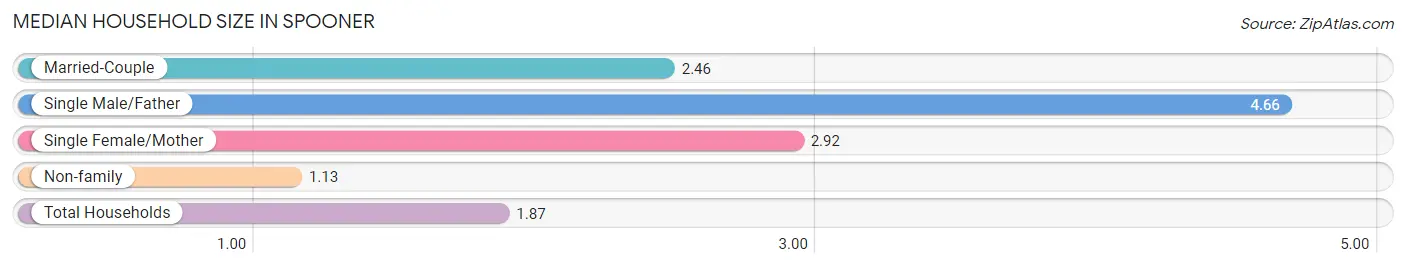
Median Household Size in Spooner
The median household size in Spooner is 1.87 persons per household, with single male/father households (29 | 2.8%) accounting for the largest median household size of 4.66 persons per household. non-family households (536 | 51.5%) represent the smallest median household size with 1.13 persons per household.
| Household Type | # Households | Household Size |
| Married-Couple | 393 (37.8%) | 2.46 |
| Single Male/Father | 29 (2.8%) | 4.66 |
| Single Female/Mother | 83 (8.0%) | 2.92 |
| Non-family | 536 (51.5%) | 1.13 |
| Total Households | 1,041 (100.0%) | 1.87 |
Household Size by Marriage Status in Spooner
Out of a total of 1,041 households in Spooner, 505 (48.5%) are family households, while 536 (51.5%) are nonfamily households. The most numerous type of family households are 2-person households, comprising 318, and the most common type of nonfamily households are 1-person households, comprising 470.
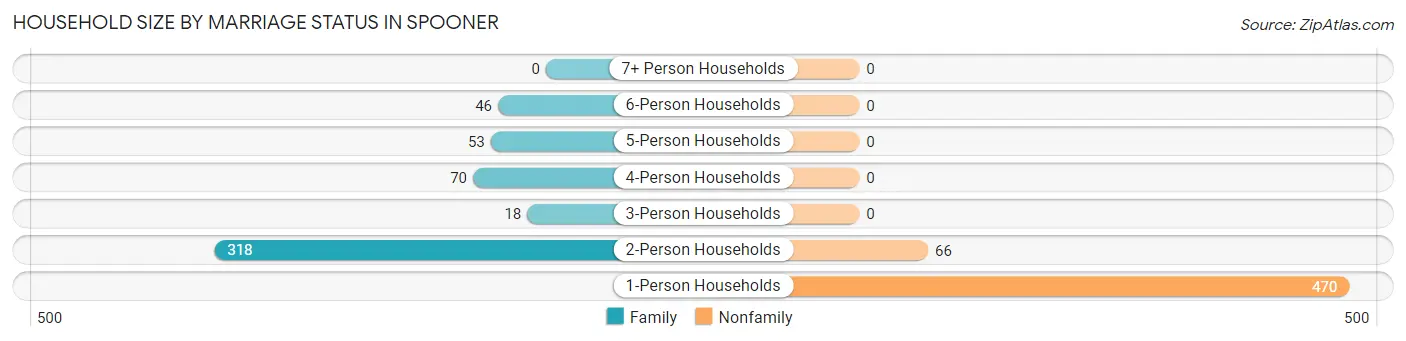
| Household Size | Family Households | Nonfamily Households |
| 1-Person Households | - | 470 (45.2%) |
| 2-Person Households | 318 (30.5%) | 66 (6.3%) |
| 3-Person Households | 18 (1.7%) | 0 (0.0%) |
| 4-Person Households | 70 (6.7%) | 0 (0.0%) |
| 5-Person Households | 53 (5.1%) | 0 (0.0%) |
| 6-Person Households | 46 (4.4%) | 0 (0.0%) |
| 7+ Person Households | 0 (0.0%) | 0 (0.0%) |
| Total | 505 (48.5%) | 536 (51.5%) |
Female Fertility in Spooner
Fertility by Age in Spooner
Average fertility rate in Spooner is 45.0 births per 1,000 women. Women in the age bracket of 35 to 50 years have the highest fertility rate with 69.0 births per 1,000 women. Women in the age bracket of 35 to 50 years acount for 93.3% of all women with births.
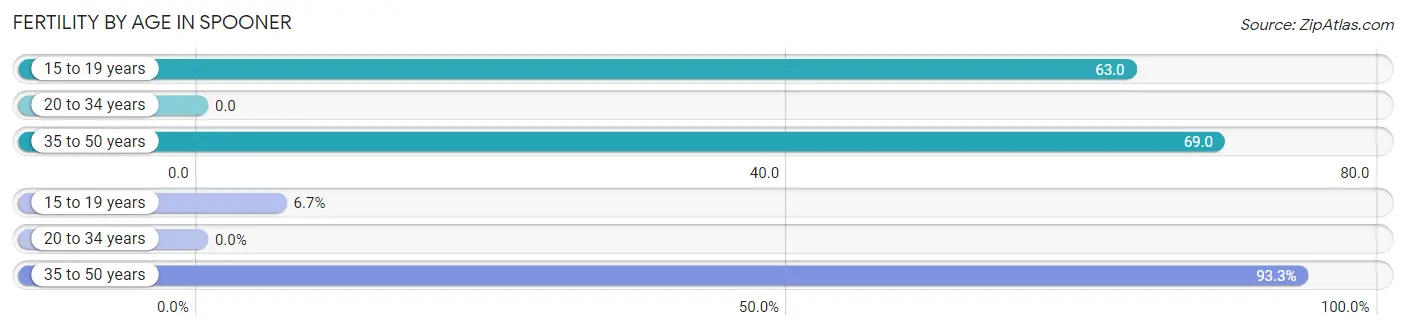
| Age Bracket | Women with Births | Births / 1,000 Women |
| 15 to 19 years | 1 (6.7%) | 63.0 |
| 20 to 34 years | 0 (0.0%) | 0.0 |
| 35 to 50 years | 14 (93.3%) | 69.0 |
| Total | 15 (100.0%) | 45.0 |
Fertility by Age by Marriage Status in Spooner
93.3% of women with births (15) in Spooner are married. The highest percentage of unmarried women with births falls into 15 to 19 years age bracket with 100.0% of them unmarried at the time of birth, while the lowest percentage of unmarried women with births belong to 35 to 50 years age bracket with 0.0% of them unmarried.
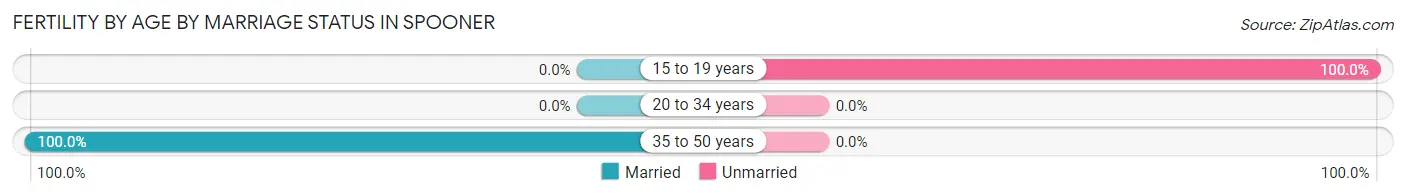
| Age Bracket | Married | Unmarried |
| 15 to 19 years | 0 (0.0%) | 1 (100.0%) |
| 20 to 34 years | 0 (0.0%) | 0 (0.0%) |
| 35 to 50 years | 14 (100.0%) | 0 (0.0%) |
| Total | 14 (93.3%) | 1 (6.7%) |
Fertility by Education in Spooner
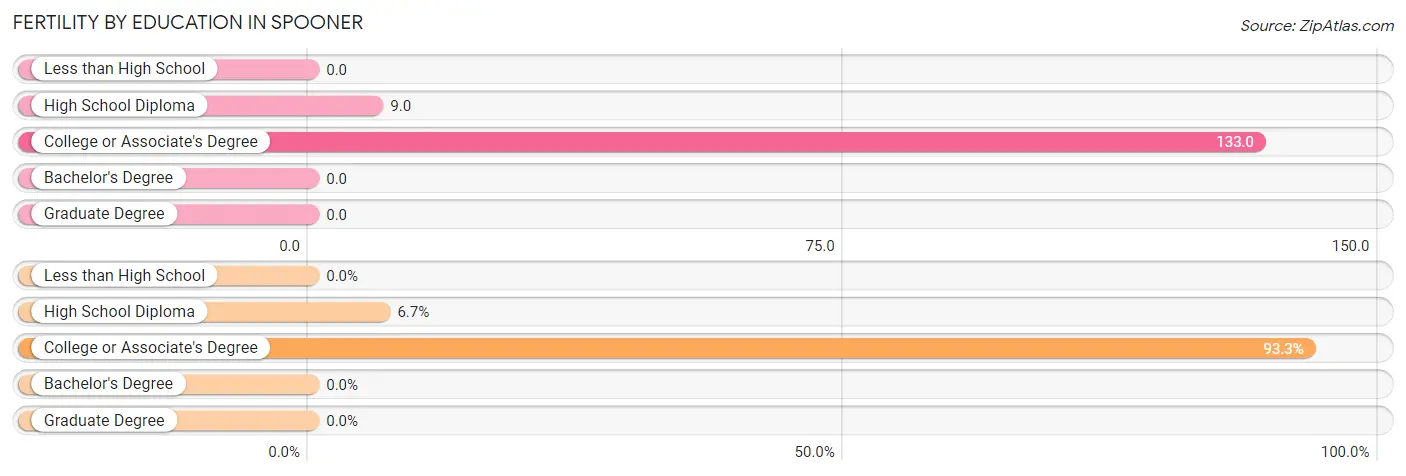
| Educational Attainment | Women with Births | Births / 1,000 Women |
| Less than High School | 0 (0.0%) | 0.0 |
| High School Diploma | 1 (6.7%) | 9.0 |
| College or Associate's Degree | 14 (93.3%) | 133.0 |
| Bachelor's Degree | 0 (0.0%) | 0.0 |
| Graduate Degree | 0 (0.0%) | 0.0 |
| Total | 15 (100.0%) | 45.0 |
Fertility by Education by Marriage Status in Spooner
6.7% of women with births in Spooner are unmarried. Women with the educational attainment of college or associate's degree are most likely to be married with 100.0% of them married at childbirth, while women with the educational attainment of high school diploma are least likely to be married with 100.0% of them unmarried at childbirth.
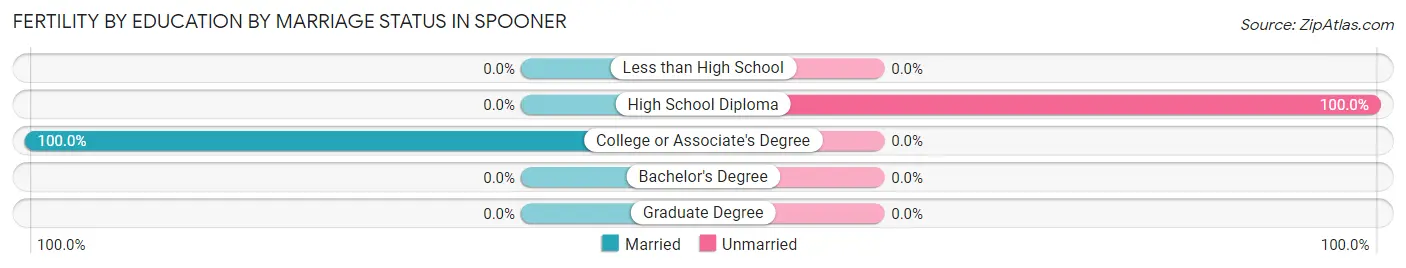
| Educational Attainment | Married | Unmarried |
| Less than High School | 0 (0.0%) | 0 (0.0%) |
| High School Diploma | 0 (0.0%) | 1 (100.0%) |
| College or Associate's Degree | 14 (100.0%) | 0 (0.0%) |
| Bachelor's Degree | 0 (0.0%) | 0 (0.0%) |
| Graduate Degree | 0 (0.0%) | 0 (0.0%) |
| Total | 14 (93.3%) | 1 (6.7%) |
Employment Characteristics in Spooner
Employment by Class of Employer in Spooner
Among the 847 employed individuals in Spooner, private company employees (538 | 63.5%), not-for-profit organizations (190 | 22.4%), and state government employees (85 | 10.0%) make up the most common classes of employment.
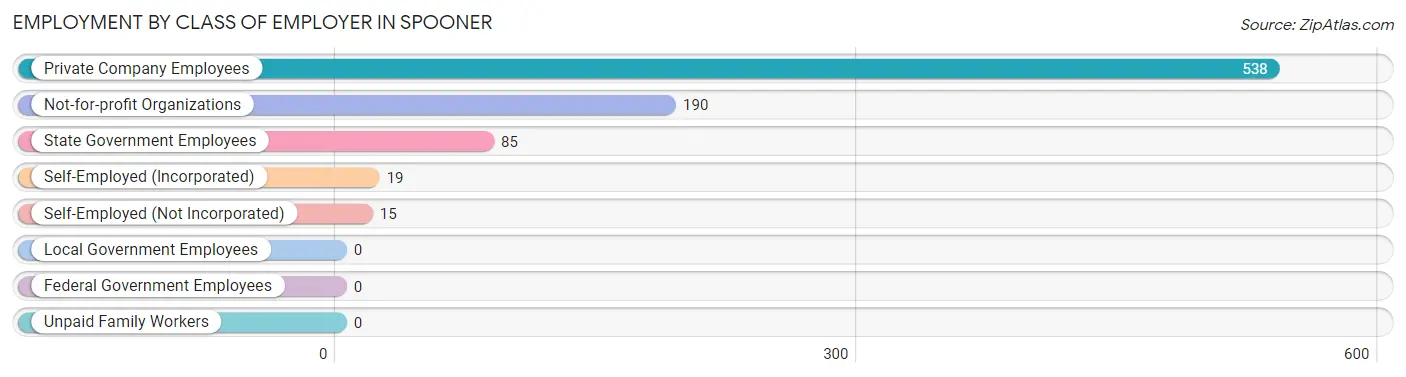
| Employer Class | # Employees | % Employees |
| Private Company Employees | 538 | 63.5% |
| Self-Employed (Incorporated) | 19 | 2.2% |
| Self-Employed (Not Incorporated) | 15 | 1.8% |
| Not-for-profit Organizations | 190 | 22.4% |
| Local Government Employees | 0 | 0.0% |
| State Government Employees | 85 | 10.0% |
| Federal Government Employees | 0 | 0.0% |
| Unpaid Family Workers | 0 | 0.0% |
| Total | 847 | 100.0% |
Employment Status by Age in Spooner
According to the labor force statistics for Spooner, out of the total population over 16 years of age (1,780), 50.7% or 902 individuals are in the labor force, with 6.1% or 55 of them unemployed. The age group with the highest labor force participation rate is 20 to 24 years, with 100.0% or 52 individuals in the labor force. Within the labor force, the 16 to 19 years age range has the highest percentage of unemployed individuals, with 46.4% or 13 of them being unemployed.
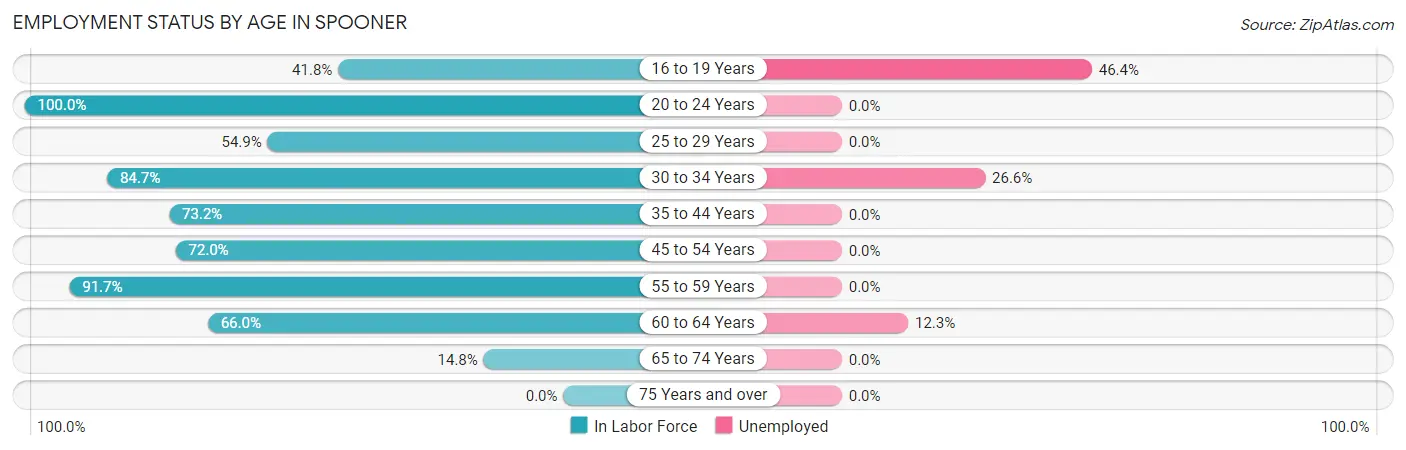
| Age Bracket | In Labor Force | Unemployed |
| 16 to 19 Years | 28 (41.8%) | 13 (46.4%) |
| 20 to 24 Years | 52 (100.0%) | 0 (0.0%) |
| 25 to 29 Years | 45 (54.9%) | 0 (0.0%) |
| 30 to 34 Years | 94 (84.7%) | 25 (26.6%) |
| 35 to 44 Years | 172 (73.2%) | 0 (0.0%) |
| 45 to 54 Years | 154 (72.0%) | 0 (0.0%) |
| 55 to 59 Years | 176 (91.7%) | 0 (0.0%) |
| 60 to 64 Years | 138 (66.0%) | 17 (12.3%) |
| 65 to 74 Years | 43 (14.8%) | 0 (0.0%) |
| 75 Years and over | 0 (0.0%) | 0 (0.0%) |
| Total | 902 (50.7%) | 55 (6.1%) |
Employment Status by Educational Attainment in Spooner
According to labor force statistics for Spooner, 74.7% of individuals (779) out of the total population between 25 and 64 years of age (1,043) are in the labor force, with 5.4% or 42 of them being unemployed. The group with the highest labor force participation rate are those with the educational attainment of bachelor's degree or higher, with 91.2% or 177 individuals in the labor force. Within the labor force, individuals with high school diploma education have the highest percentage of unemployment, with 15.0% or 37 of them being unemployed.
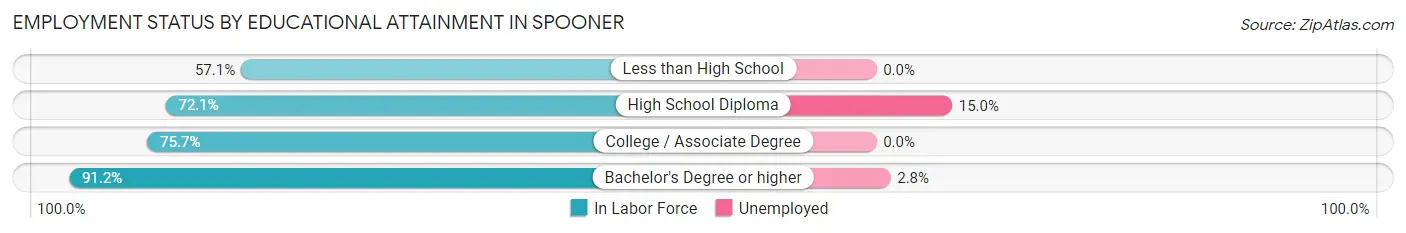
| Educational Attainment | In Labor Force | Unemployed |
| Less than High School | 88 (57.1%) | 0 (0.0%) |
| High School Diploma | 246 (72.1%) | 51 (15.0%) |
| College / Associate Degree | 268 (75.7%) | 0 (0.0%) |
| Bachelor's Degree or higher | 177 (91.2%) | 5 (2.8%) |
| Total | 779 (74.7%) | 56 (5.4%) |
Employment Occupations by Sex in Spooner
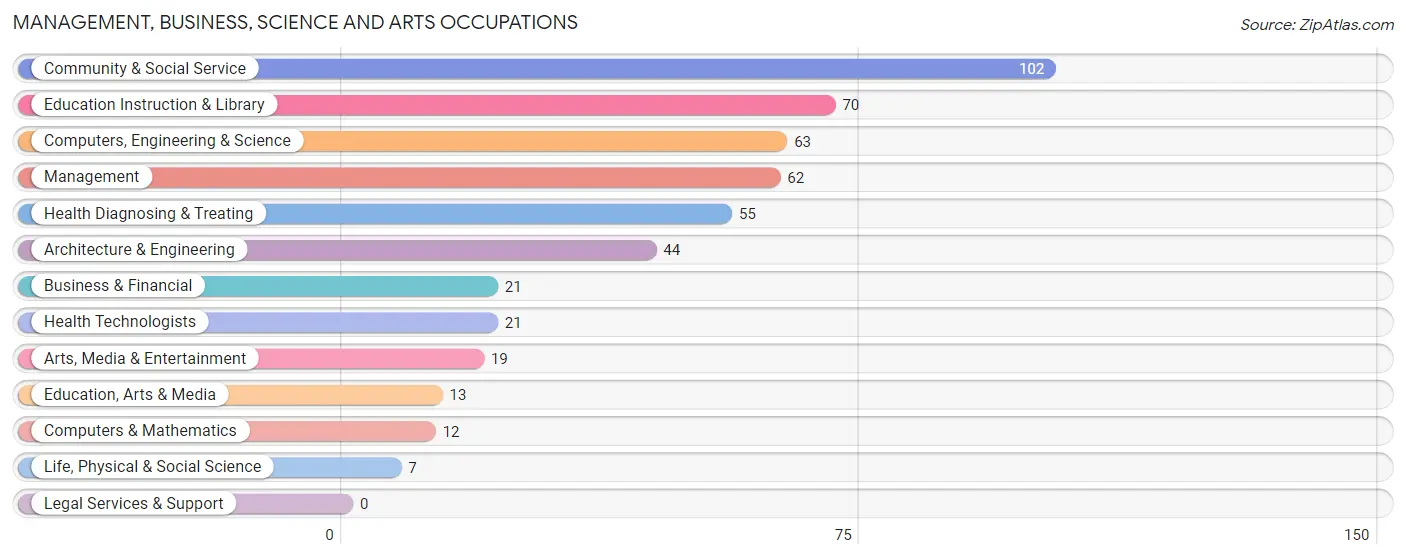
Management, Business, Science and Arts Occupations
The most common Management, Business, Science and Arts occupations in Spooner are Community & Social Service (102 | 12.0%), Education Instruction & Library (70 | 8.3%), Computers, Engineering & Science (63 | 7.4%), Management (62 | 7.3%), and Health Diagnosing & Treating (55 | 6.5%).
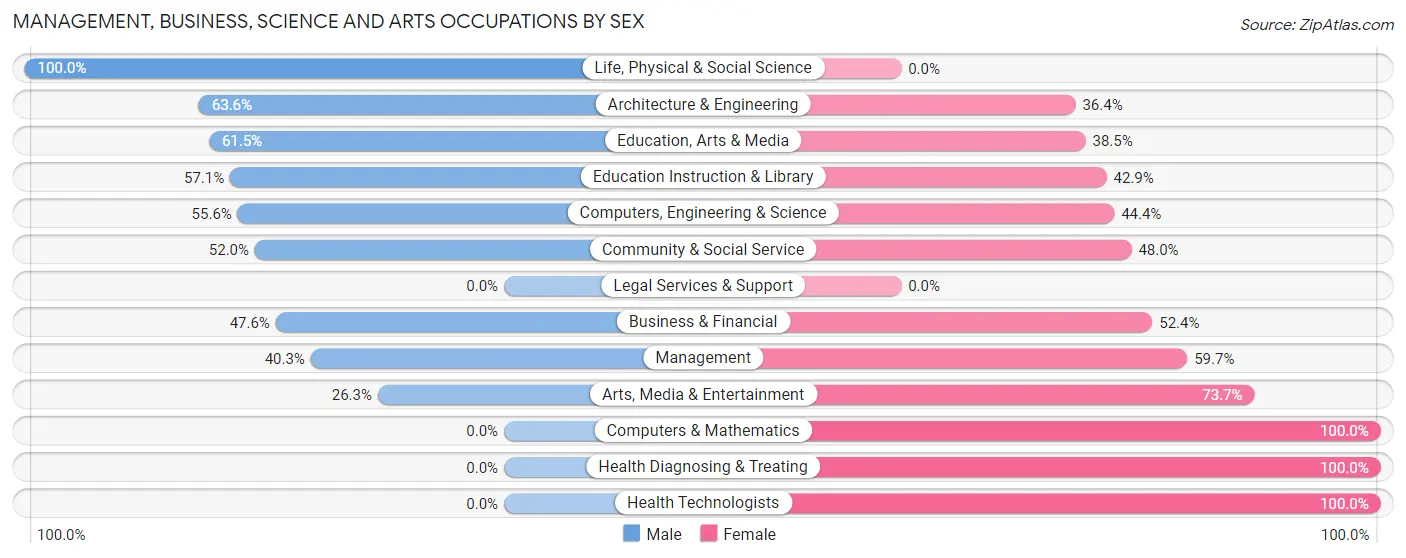
Management, Business, Science and Arts Occupations by Sex
Within the Management, Business, Science and Arts occupations in Spooner, the most male-oriented occupations are Life, Physical & Social Science (100.0%), Architecture & Engineering (63.6%), and Education, Arts & Media (61.5%), while the most female-oriented occupations are Computers & Mathematics (100.0%), Health Diagnosing & Treating (100.0%), and Health Technologists (100.0%).
| Occupation | Male | Female |
| Management | 25 (40.3%) | 37 (59.7%) |
| Business & Financial | 10 (47.6%) | 11 (52.4%) |
| Computers, Engineering & Science | 35 (55.6%) | 28 (44.4%) |
| Computers & Mathematics | 0 (0.0%) | 12 (100.0%) |
| Architecture & Engineering | 28 (63.6%) | 16 (36.4%) |
| Life, Physical & Social Science | 7 (100.0%) | 0 (0.0%) |
| Community & Social Service | 53 (52.0%) | 49 (48.0%) |
| Education, Arts & Media | 8 (61.5%) | 5 (38.5%) |
| Legal Services & Support | 0 (0.0%) | 0 (0.0%) |
| Education Instruction & Library | 40 (57.1%) | 30 (42.9%) |
| Arts, Media & Entertainment | 5 (26.3%) | 14 (73.7%) |
| Health Diagnosing & Treating | 0 (0.0%) | 55 (100.0%) |
| Health Technologists | 0 (0.0%) | 21 (100.0%) |
| Total (Category) | 123 (40.6%) | 180 (59.4%) |
| Total (Overall) | 432 (51.0%) | 415 (49.0%) |
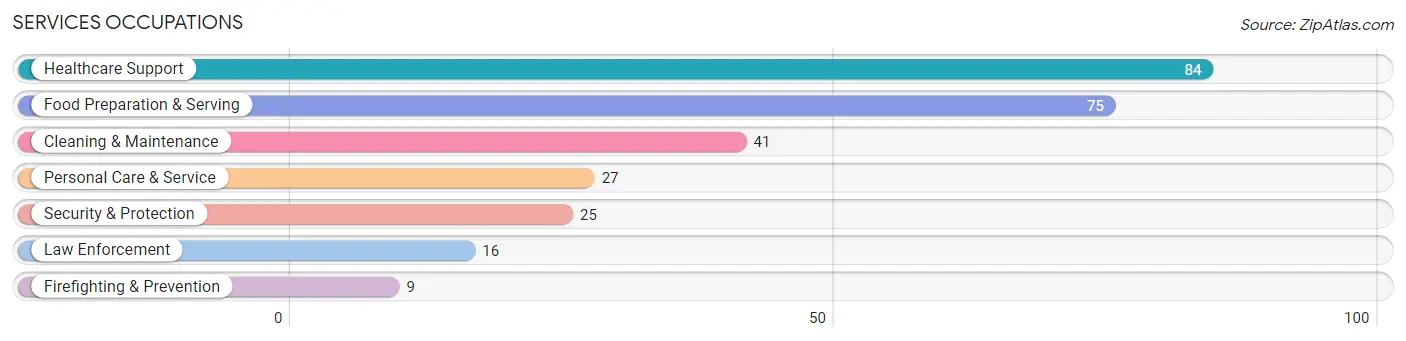
Services Occupations
The most common Services occupations in Spooner are Healthcare Support (84 | 9.9%), Food Preparation & Serving (75 | 8.8%), Cleaning & Maintenance (41 | 4.8%), Personal Care & Service (27 | 3.2%), and Security & Protection (25 | 2.9%).
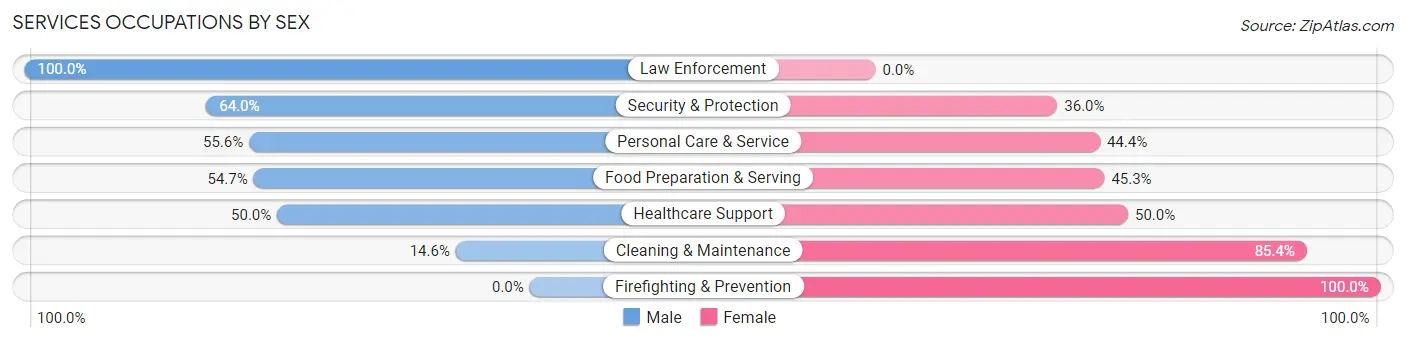
Services Occupations by Sex
Within the Services occupations in Spooner, the most male-oriented occupations are Law Enforcement (100.0%), Security & Protection (64.0%), and Personal Care & Service (55.6%), while the most female-oriented occupations are Firefighting & Prevention (100.0%), Cleaning & Maintenance (85.4%), and Healthcare Support (50.0%).
| Occupation | Male | Female |
| Healthcare Support | 42 (50.0%) | 42 (50.0%) |
| Security & Protection | 16 (64.0%) | 9 (36.0%) |
| Firefighting & Prevention | 0 (0.0%) | 9 (100.0%) |
| Law Enforcement | 16 (100.0%) | 0 (0.0%) |
| Food Preparation & Serving | 41 (54.7%) | 34 (45.3%) |
| Cleaning & Maintenance | 6 (14.6%) | 35 (85.4%) |
| Personal Care & Service | 15 (55.6%) | 12 (44.4%) |
| Total (Category) | 120 (47.6%) | 132 (52.4%) |
| Total (Overall) | 432 (51.0%) | 415 (49.0%) |
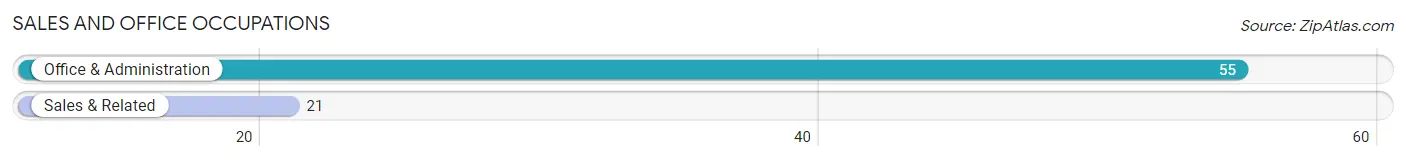
Sales and Office Occupations
The most common Sales and Office occupations in Spooner are Office & Administration (55 | 6.5%), and Sales & Related (21 | 2.5%).
Sales and Office Occupations by Sex
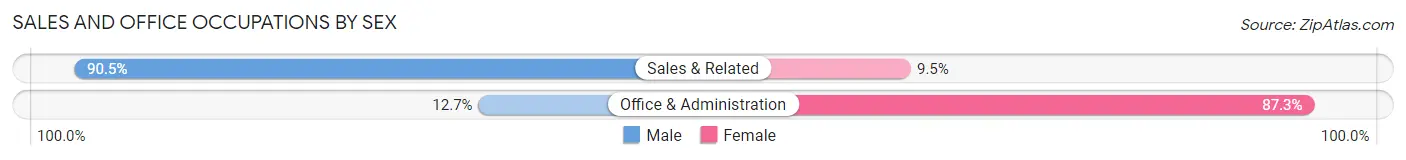
| Occupation | Male | Female |
| Sales & Related | 19 (90.5%) | 2 (9.5%) |
| Office & Administration | 7 (12.7%) | 48 (87.3%) |
| Total (Category) | 26 (34.2%) | 50 (65.8%) |
| Total (Overall) | 432 (51.0%) | 415 (49.0%) |
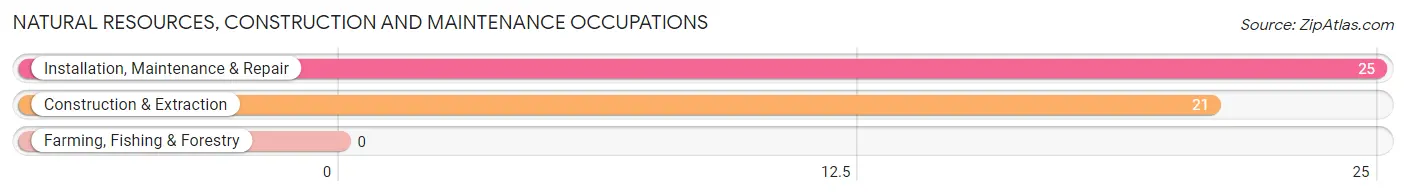
Natural Resources, Construction and Maintenance Occupations
The most common Natural Resources, Construction and Maintenance occupations in Spooner are Installation, Maintenance & Repair (25 | 2.9%), and Construction & Extraction (21 | 2.5%).
Natural Resources, Construction and Maintenance Occupations by Sex
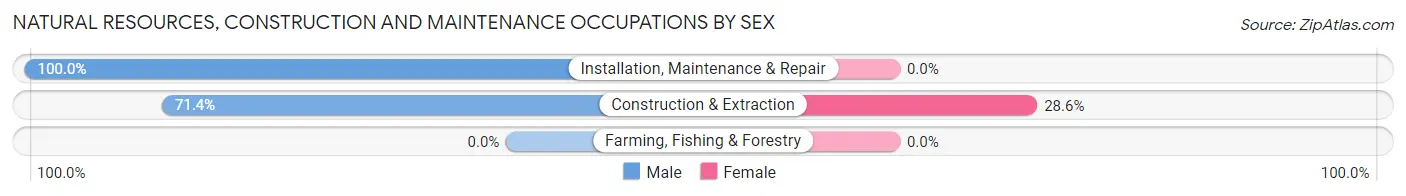
| Occupation | Male | Female |
| Farming, Fishing & Forestry | 0 (0.0%) | 0 (0.0%) |
| Construction & Extraction | 15 (71.4%) | 6 (28.6%) |
| Installation, Maintenance & Repair | 25 (100.0%) | 0 (0.0%) |
| Total (Category) | 40 (87.0%) | 6 (13.0%) |
| Total (Overall) | 432 (51.0%) | 415 (49.0%) |
Production, Transportation and Moving Occupations
The most common Production, Transportation and Moving occupations in Spooner are Production (119 | 14.1%), and Material Moving (51 | 6.0%).
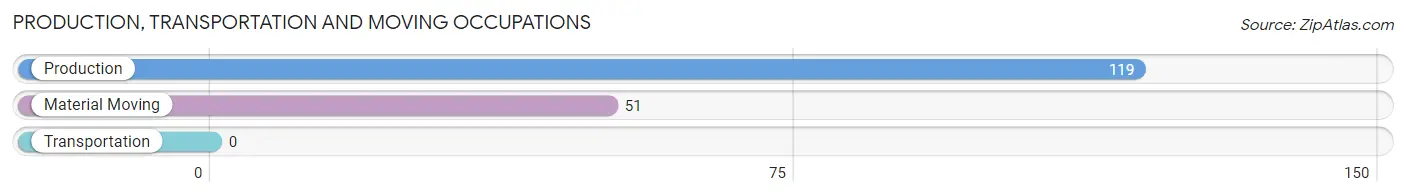
Production, Transportation and Moving Occupations by Sex
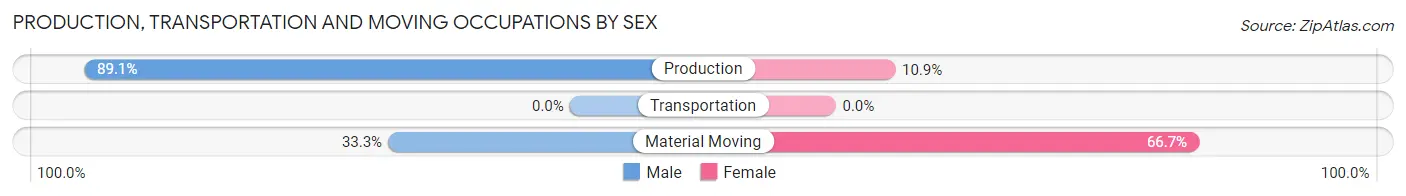
| Occupation | Male | Female |
| Production | 106 (89.1%) | 13 (10.9%) |
| Transportation | 0 (0.0%) | 0 (0.0%) |
| Material Moving | 17 (33.3%) | 34 (66.7%) |
| Total (Category) | 123 (72.4%) | 47 (27.7%) |
| Total (Overall) | 432 (51.0%) | 415 (49.0%) |
Employment Industries by Sex in Spooner
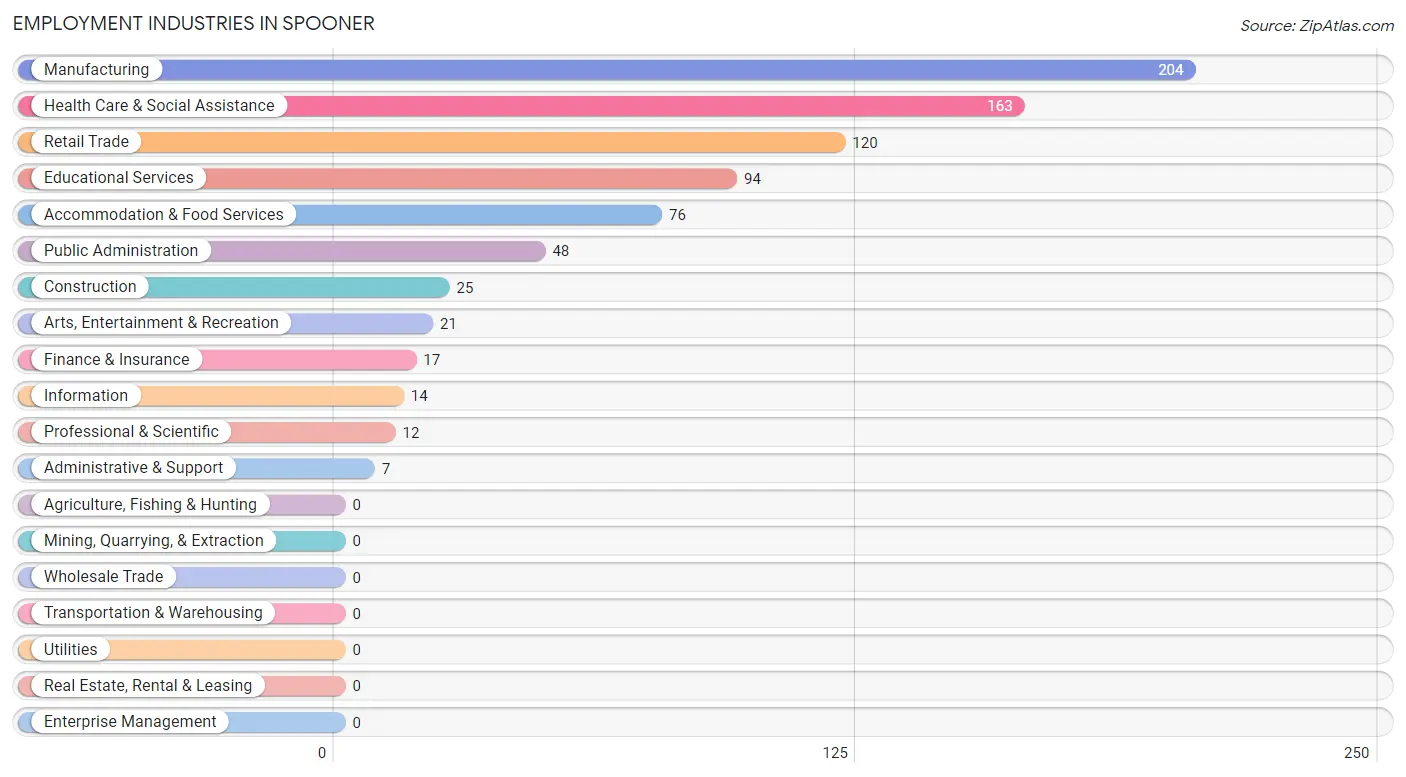
Employment Industries in Spooner
The major employment industries in Spooner include Manufacturing (204 | 24.1%), Health Care & Social Assistance (163 | 19.2%), Retail Trade (120 | 14.2%), Educational Services (94 | 11.1%), and Accommodation & Food Services (76 | 9.0%).
Employment Industries by Sex in Spooner
The Spooner industries that see more men than women are Arts, Entertainment & Recreation (100.0%), Public Administration (81.2%), and Manufacturing (76.5%), whereas the industries that tend to have a higher number of women are Information (100.0%), Professional & Scientific (100.0%), and Administrative & Support (100.0%).
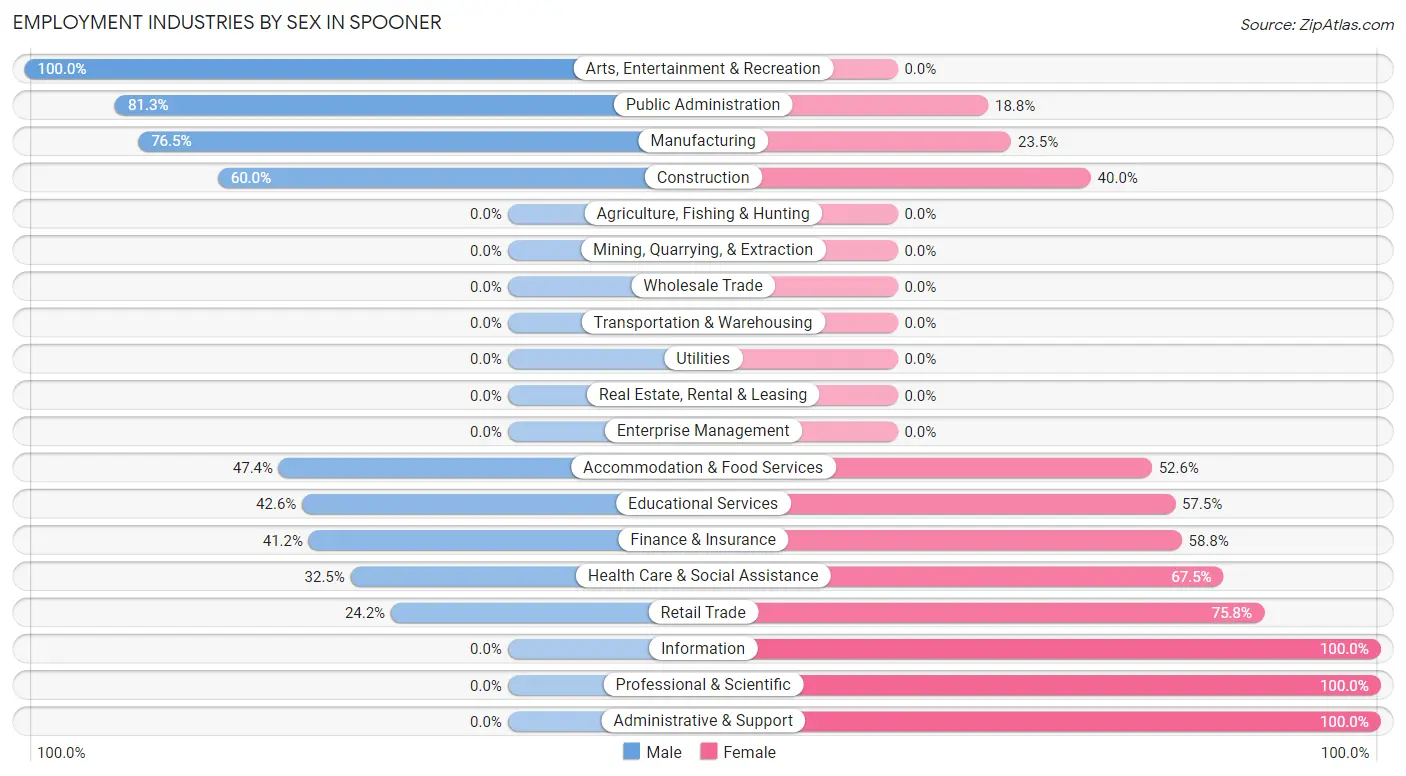
| Industry | Male | Female |
| Agriculture, Fishing & Hunting | 0 (0.0%) | 0 (0.0%) |
| Mining, Quarrying, & Extraction | 0 (0.0%) | 0 (0.0%) |
| Construction | 15 (60.0%) | 10 (40.0%) |
| Manufacturing | 156 (76.5%) | 48 (23.5%) |
| Wholesale Trade | 0 (0.0%) | 0 (0.0%) |
| Retail Trade | 29 (24.2%) | 91 (75.8%) |
| Transportation & Warehousing | 0 (0.0%) | 0 (0.0%) |
| Utilities | 0 (0.0%) | 0 (0.0%) |
| Information | 0 (0.0%) | 14 (100.0%) |
| Finance & Insurance | 7 (41.2%) | 10 (58.8%) |
| Real Estate, Rental & Leasing | 0 (0.0%) | 0 (0.0%) |
| Professional & Scientific | 0 (0.0%) | 12 (100.0%) |
| Enterprise Management | 0 (0.0%) | 0 (0.0%) |
| Administrative & Support | 0 (0.0%) | 7 (100.0%) |
| Educational Services | 40 (42.5%) | 54 (57.5%) |
| Health Care & Social Assistance | 53 (32.5%) | 110 (67.5%) |
| Arts, Entertainment & Recreation | 21 (100.0%) | 0 (0.0%) |
| Accommodation & Food Services | 36 (47.4%) | 40 (52.6%) |
| Public Administration | 39 (81.2%) | 9 (18.8%) |
| Total | 432 (51.0%) | 415 (49.0%) |
Education in Spooner
School Enrollment in Spooner
The most common levels of schooling among the 320 students in Spooner are middle school (152 | 47.5%), college / undergraduate (61 | 19.1%), and high school (41 | 12.8%).
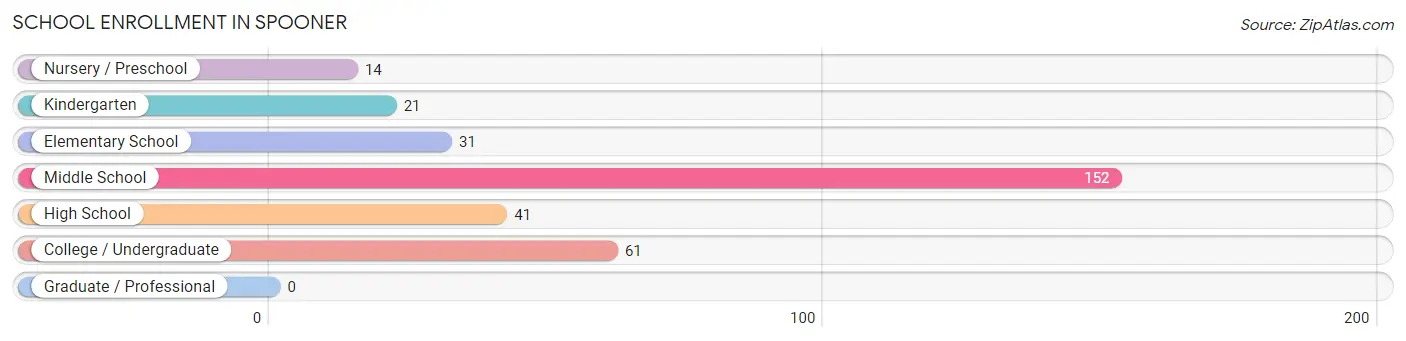
| School Level | # Students | % Students |
| Nursery / Preschool | 14 | 4.4% |
| Kindergarten | 21 | 6.6% |
| Elementary School | 31 | 9.7% |
| Middle School | 152 | 47.5% |
| High School | 41 | 12.8% |
| College / Undergraduate | 61 | 19.1% |
| Graduate / Professional | 0 | 0.0% |
| Total | 320 | 100.0% |
School Enrollment by Age by Funding Source in Spooner
Out of a total of 320 students who are enrolled in schools in Spooner, 99 (30.9%) attend a private institution, while the remaining 221 (69.1%) are enrolled in public schools. The age group of 35 years and over has the highest likelihood of being enrolled in private schools, with 48 (94.1% in the age bracket) enrolled. Conversely, the age group of 18 to 19 year olds has the lowest likelihood of being enrolled in a private school, with 6 (100.0% in the age bracket) attending a public institution.
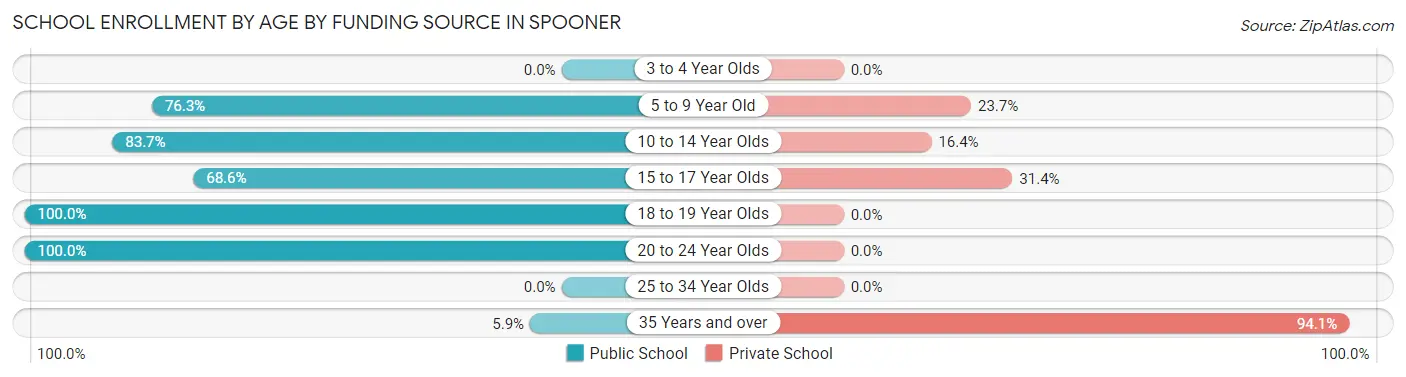
| Age Bracket | Public School | Private School |
| 3 to 4 Year Olds | 0 (0.0%) | 0 (0.0%) |
| 5 to 9 Year Old | 45 (76.3%) | 14 (23.7%) |
| 10 to 14 Year Olds | 133 (83.7%) | 26 (16.4%) |
| 15 to 17 Year Olds | 24 (68.6%) | 11 (31.4%) |
| 18 to 19 Year Olds | 6 (100.0%) | 0 (0.0%) |
| 20 to 24 Year Olds | 10 (100.0%) | 0 (0.0%) |
| 25 to 34 Year Olds | 0 (0.0%) | 0 (0.0%) |
| 35 Years and over | 3 (5.9%) | 48 (94.1%) |
| Total | 221 (69.1%) | 99 (30.9%) |
Educational Attainment by Field of Study in Spooner
Education (87 | 26.5%), science & technology (51 | 15.5%), bio, nature & agricultural (37 | 11.3%), engineering (34 | 10.4%), and visual & performing arts (33 | 10.1%) are the most common fields of study among 328 individuals in Spooner who have obtained a bachelor's degree or higher.
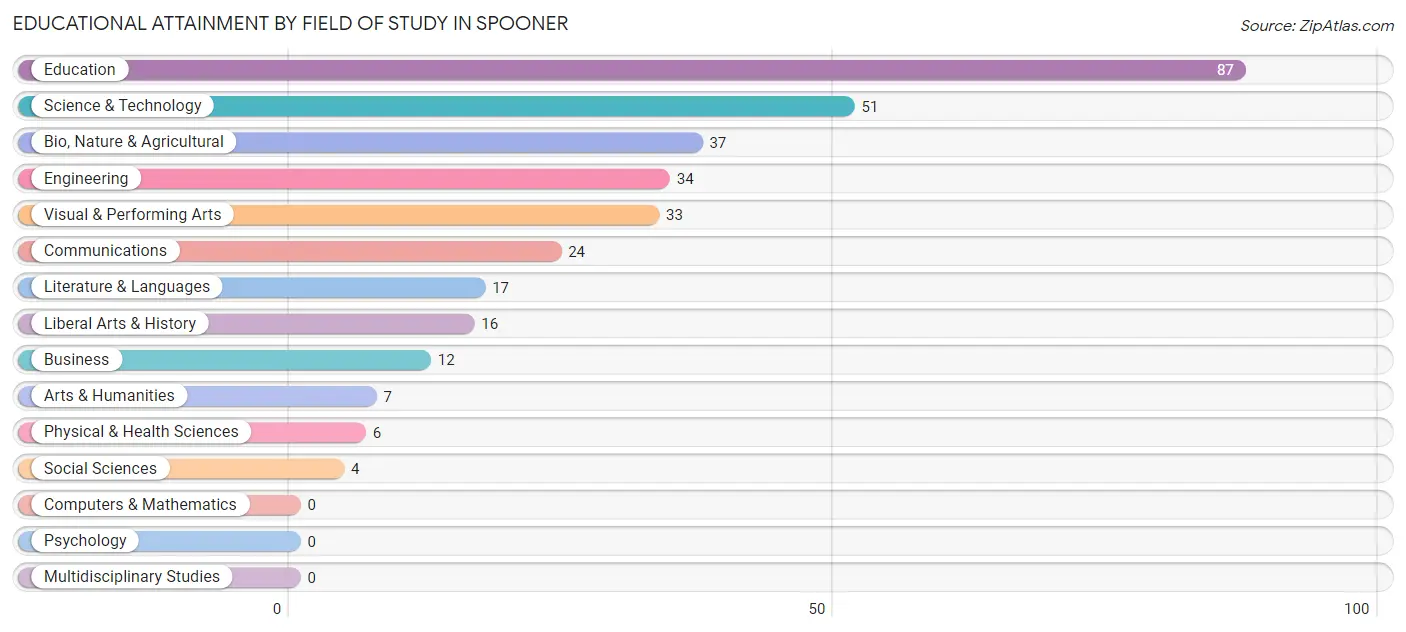
| Field of Study | # Graduates | % Graduates |
| Computers & Mathematics | 0 | 0.0% |
| Bio, Nature & Agricultural | 37 | 11.3% |
| Physical & Health Sciences | 6 | 1.8% |
| Psychology | 0 | 0.0% |
| Social Sciences | 4 | 1.2% |
| Engineering | 34 | 10.4% |
| Multidisciplinary Studies | 0 | 0.0% |
| Science & Technology | 51 | 15.5% |
| Business | 12 | 3.7% |
| Education | 87 | 26.5% |
| Literature & Languages | 17 | 5.2% |
| Liberal Arts & History | 16 | 4.9% |
| Visual & Performing Arts | 33 | 10.1% |
| Communications | 24 | 7.3% |
| Arts & Humanities | 7 | 2.1% |
| Total | 328 | 100.0% |
Transportation & Commute in Spooner
Vehicle Availability by Sex in Spooner
The most prevalent vehicle ownership categories in Spooner are males with 1 vehicle (180, accounting for 41.7%) and females with 1 vehicle (132, making up 43.4%).
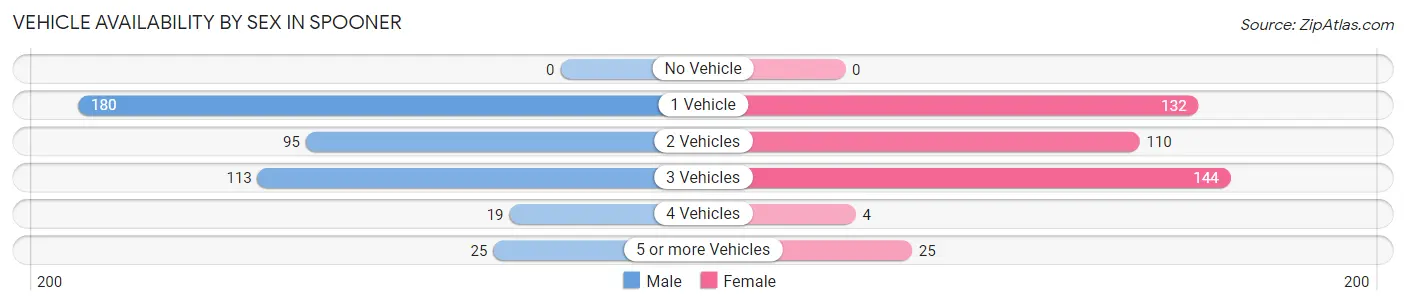
| Vehicles Available | Male | Female |
| No Vehicle | 0 (0.0%) | 0 (0.0%) |
| 1 Vehicle | 180 (41.7%) | 132 (31.8%) |
| 2 Vehicles | 95 (22.0%) | 110 (26.5%) |
| 3 Vehicles | 113 (26.2%) | 144 (34.7%) |
| 4 Vehicles | 19 (4.4%) | 4 (1.0%) |
| 5 or more Vehicles | 25 (5.8%) | 25 (6.0%) |
| Total | 432 (100.0%) | 415 (100.0%) |
Commute Time in Spooner
The most frequently occuring commute durations in Spooner are 30 to 34 minutes (177 commuters, 24.4%), less than 5 minutes (118 commuters, 16.3%), and 5 to 9 minutes (113 commuters, 15.6%).
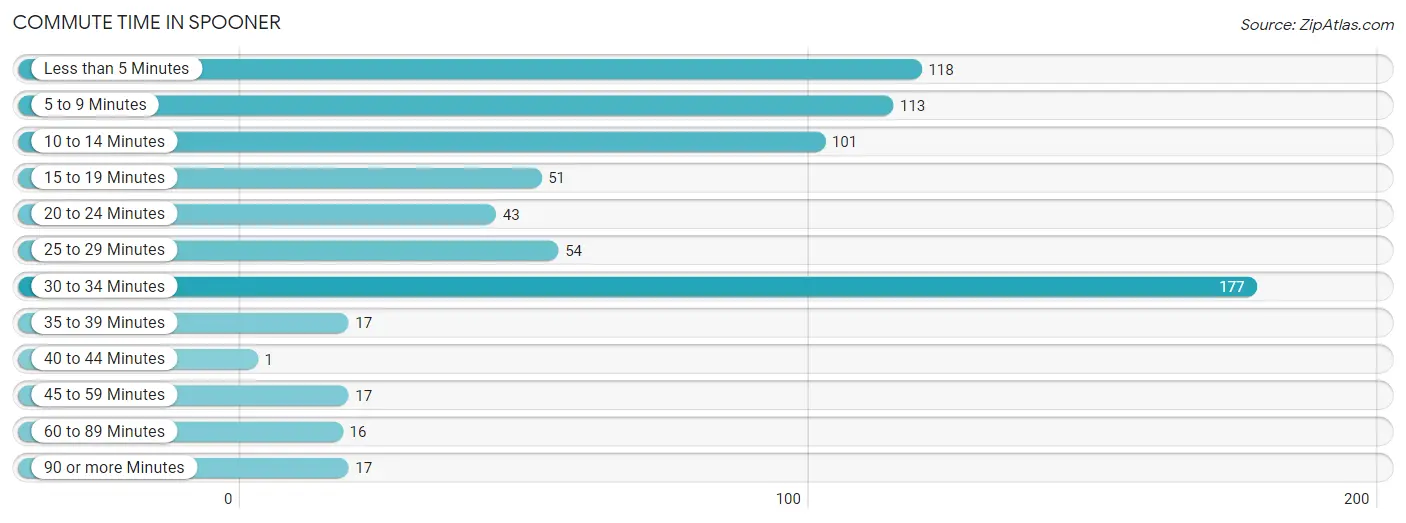
| Commute Time | # Commuters | % Commuters |
| Less than 5 Minutes | 118 | 16.3% |
| 5 to 9 Minutes | 113 | 15.6% |
| 10 to 14 Minutes | 101 | 13.9% |
| 15 to 19 Minutes | 51 | 7.0% |
| 20 to 24 Minutes | 43 | 5.9% |
| 25 to 29 Minutes | 54 | 7.4% |
| 30 to 34 Minutes | 177 | 24.4% |
| 35 to 39 Minutes | 17 | 2.3% |
| 40 to 44 Minutes | 1 | 0.1% |
| 45 to 59 Minutes | 17 | 2.3% |
| 60 to 89 Minutes | 16 | 2.2% |
| 90 or more Minutes | 17 | 2.3% |
Commute Time by Sex in Spooner
The most common commute times in Spooner are 30 to 34 minutes (68 commuters, 19.8%) for males and 30 to 34 minutes (109 commuters, 28.6%) for females.
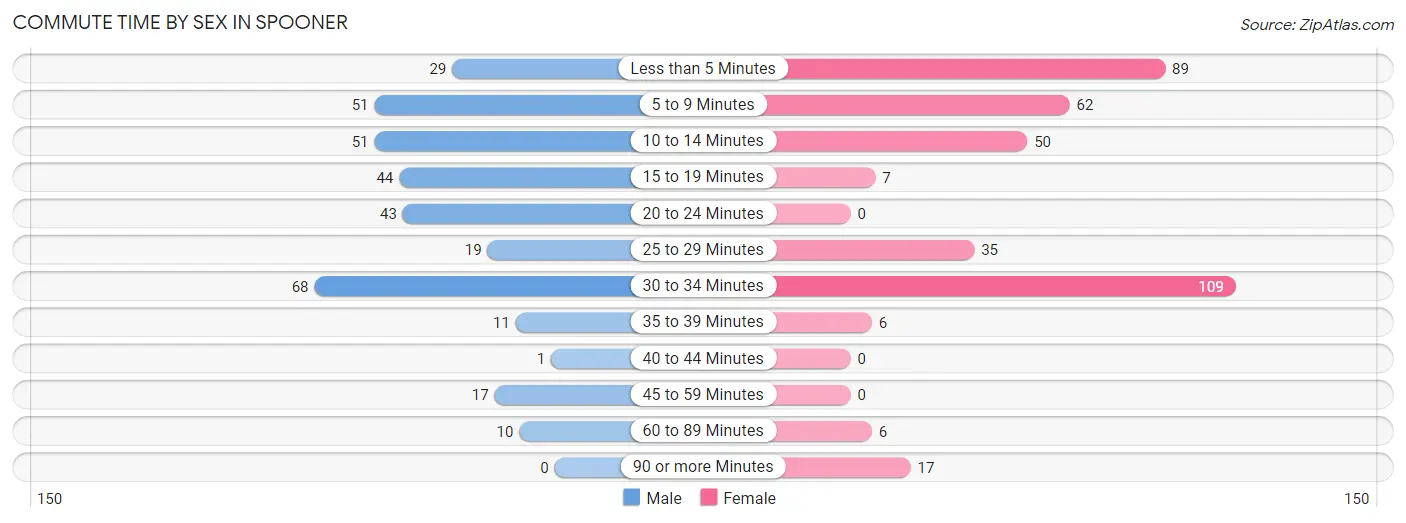
| Commute Time | Male | Female |
| Less than 5 Minutes | 29 (8.4%) | 89 (23.4%) |
| 5 to 9 Minutes | 51 (14.8%) | 62 (16.3%) |
| 10 to 14 Minutes | 51 (14.8%) | 50 (13.1%) |
| 15 to 19 Minutes | 44 (12.8%) | 7 (1.8%) |
| 20 to 24 Minutes | 43 (12.5%) | 0 (0.0%) |
| 25 to 29 Minutes | 19 (5.5%) | 35 (9.2%) |
| 30 to 34 Minutes | 68 (19.8%) | 109 (28.6%) |
| 35 to 39 Minutes | 11 (3.2%) | 6 (1.6%) |
| 40 to 44 Minutes | 1 (0.3%) | 0 (0.0%) |
| 45 to 59 Minutes | 17 (4.9%) | 0 (0.0%) |
| 60 to 89 Minutes | 10 (2.9%) | 6 (1.6%) |
| 90 or more Minutes | 0 (0.0%) | 17 (4.5%) |
Time of Departure to Work by Sex in Spooner
The most frequent times of departure to work in Spooner are 6:30 AM to 6:59 AM (81, 23.5%) for males and 7:00 AM to 7:29 AM (83, 21.8%) for females.
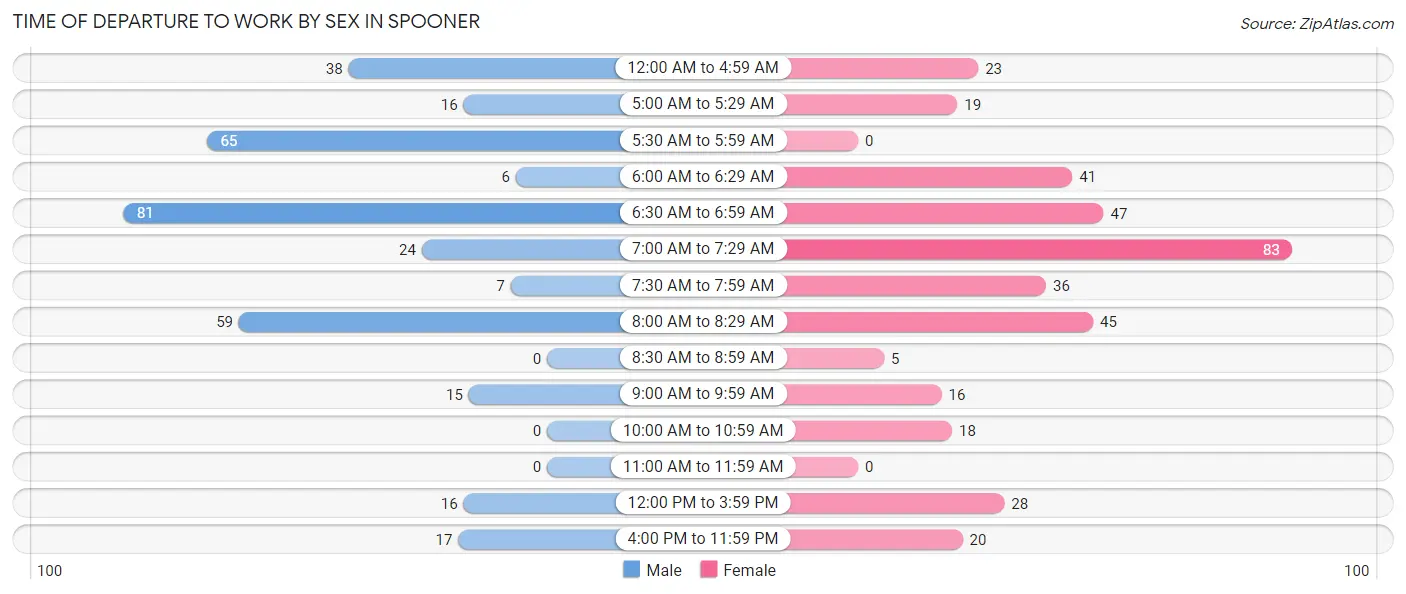
| Time of Departure | Male | Female |
| 12:00 AM to 4:59 AM | 38 (11.1%) | 23 (6.0%) |
| 5:00 AM to 5:29 AM | 16 (4.6%) | 19 (5.0%) |
| 5:30 AM to 5:59 AM | 65 (18.9%) | 0 (0.0%) |
| 6:00 AM to 6:29 AM | 6 (1.7%) | 41 (10.8%) |
| 6:30 AM to 6:59 AM | 81 (23.5%) | 47 (12.3%) |
| 7:00 AM to 7:29 AM | 24 (7.0%) | 83 (21.8%) |
| 7:30 AM to 7:59 AM | 7 (2.0%) | 36 (9.5%) |
| 8:00 AM to 8:29 AM | 59 (17.2%) | 45 (11.8%) |
| 8:30 AM to 8:59 AM | 0 (0.0%) | 5 (1.3%) |
| 9:00 AM to 9:59 AM | 15 (4.4%) | 16 (4.2%) |
| 10:00 AM to 10:59 AM | 0 (0.0%) | 18 (4.7%) |
| 11:00 AM to 11:59 AM | 0 (0.0%) | 0 (0.0%) |
| 12:00 PM to 3:59 PM | 16 (4.6%) | 28 (7.3%) |
| 4:00 PM to 11:59 PM | 17 (4.9%) | 20 (5.2%) |
| Total | 344 (100.0%) | 381 (100.0%) |
Housing Occupancy in Spooner
Occupancy by Ownership in Spooner
Of the total 1,041 dwellings in Spooner, owner-occupied units account for 591 (56.8%), while renter-occupied units make up 450 (43.2%).
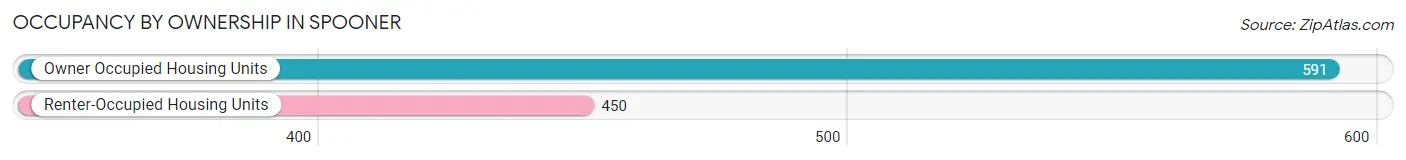
| Occupancy | # Housing Units | % Housing Units |
| Owner Occupied Housing Units | 591 | 56.8% |
| Renter-Occupied Housing Units | 450 | 43.2% |
| Total Occupied Housing Units | 1,041 | 100.0% |
Occupancy by Household Size in Spooner
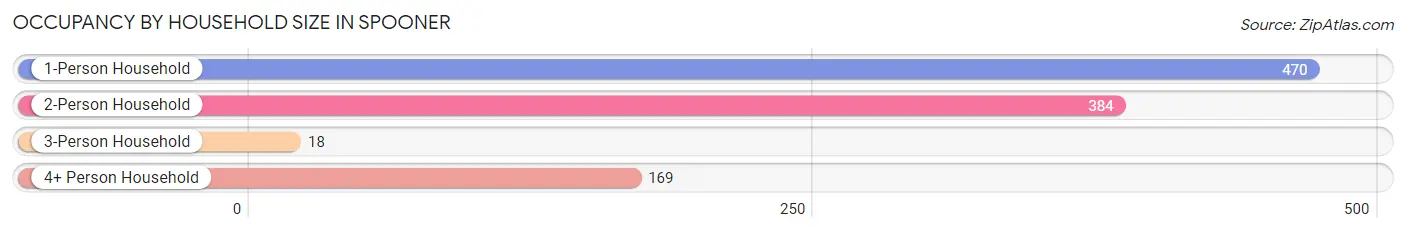
| Household Size | # Housing Units | % Housing Units |
| 1-Person Household | 470 | 45.2% |
| 2-Person Household | 384 | 36.9% |
| 3-Person Household | 18 | 1.7% |
| 4+ Person Household | 169 | 16.2% |
| Total Housing Units | 1,041 | 100.0% |
Occupancy by Ownership by Household Size in Spooner
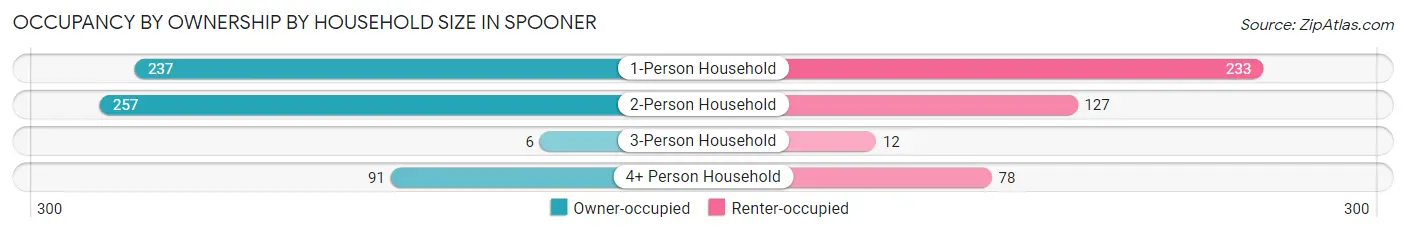
| Household Size | Owner-occupied | Renter-occupied |
| 1-Person Household | 237 (50.4%) | 233 (49.6%) |
| 2-Person Household | 257 (66.9%) | 127 (33.1%) |
| 3-Person Household | 6 (33.3%) | 12 (66.7%) |
| 4+ Person Household | 91 (53.8%) | 78 (46.2%) |
| Total Housing Units | 591 (56.8%) | 450 (43.2%) |
Occupancy by Educational Attainment in Spooner
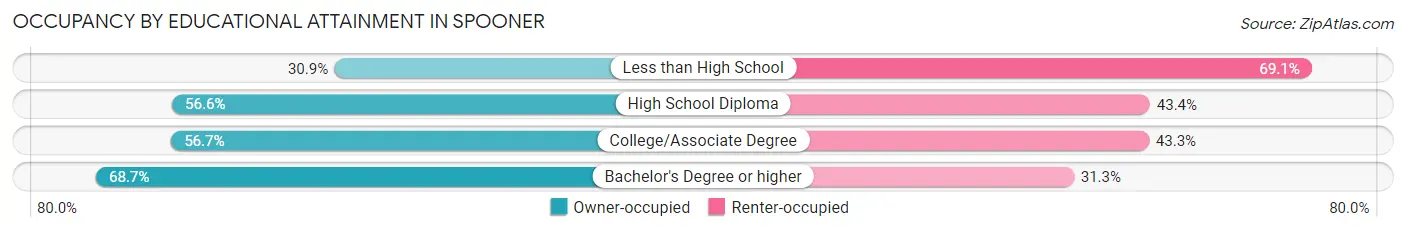
| Household Size | Owner-occupied | Renter-occupied |
| Less than High School | 30 (30.9%) | 67 (69.1%) |
| High School Diploma | 189 (56.6%) | 145 (43.4%) |
| College/Associate Degree | 223 (56.7%) | 170 (43.3%) |
| Bachelor's Degree or higher | 149 (68.7%) | 68 (31.3%) |
Occupancy by Age of Householder in Spooner
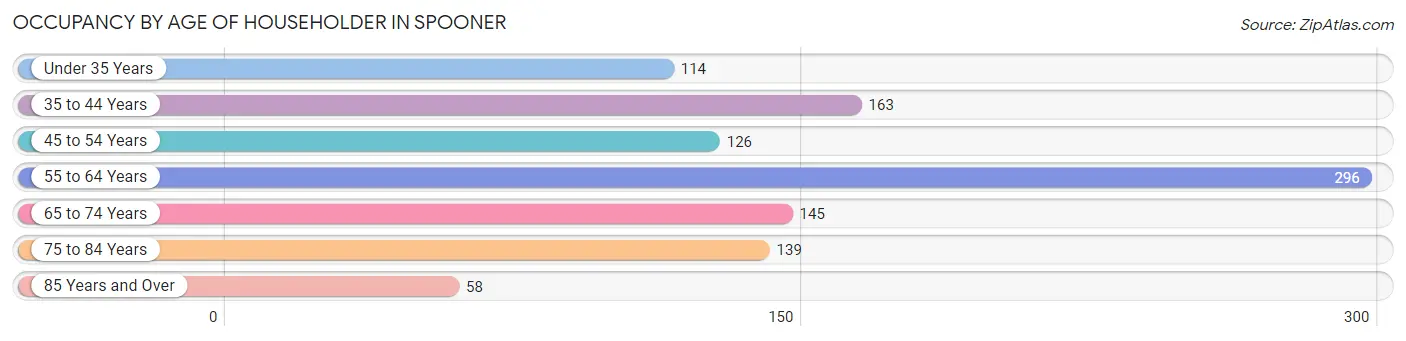
| Age Bracket | # Households | % Households |
| Under 35 Years | 114 | 11.0% |
| 35 to 44 Years | 163 | 15.7% |
| 45 to 54 Years | 126 | 12.1% |
| 55 to 64 Years | 296 | 28.4% |
| 65 to 74 Years | 145 | 13.9% |
| 75 to 84 Years | 139 | 13.4% |
| 85 Years and Over | 58 | 5.6% |
| Total | 1,041 | 100.0% |
Housing Finances in Spooner
Median Income by Occupancy in Spooner
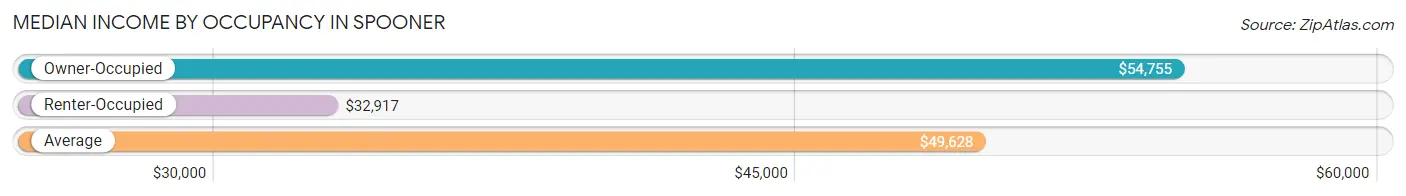
| Occupancy Type | # Households | Median Income |
| Owner-Occupied | 591 (56.8%) | $54,755 |
| Renter-Occupied | 450 (43.2%) | $32,917 |
| Average | 1,041 (100.0%) | $49,628 |
Occupancy by Householder Income Bracket in Spooner
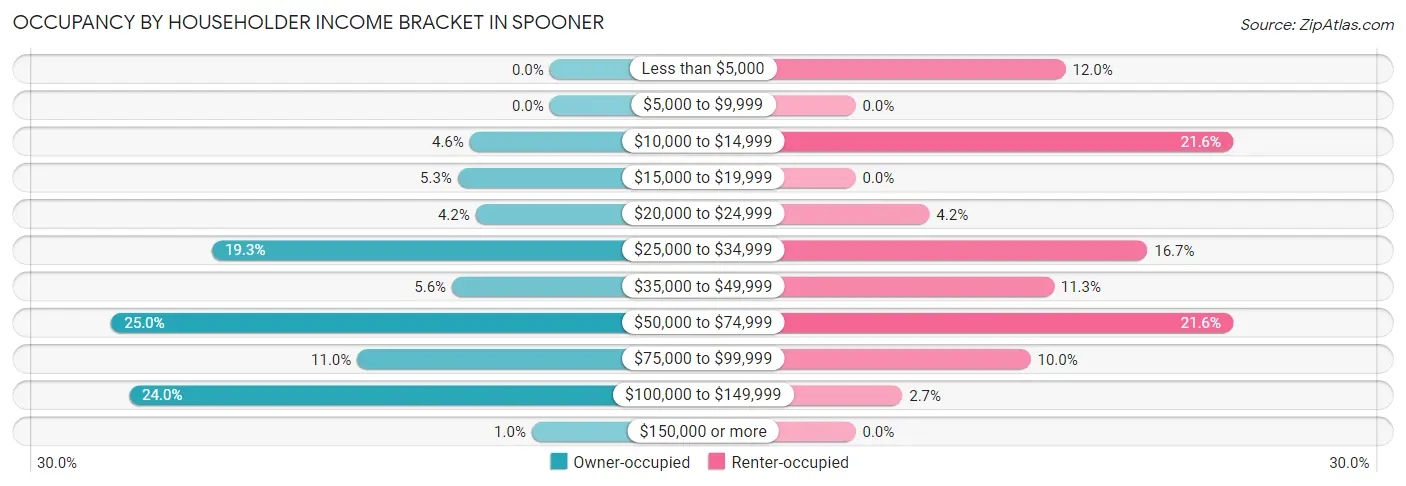
| Income Bracket | Owner-occupied | Renter-occupied |
| Less than $5,000 | 0 (0.0%) | 54 (12.0%) |
| $5,000 to $9,999 | 0 (0.0%) | 0 (0.0%) |
| $10,000 to $14,999 | 27 (4.6%) | 97 (21.6%) |
| $15,000 to $19,999 | 31 (5.2%) | 0 (0.0%) |
| $20,000 to $24,999 | 25 (4.2%) | 19 (4.2%) |
| $25,000 to $34,999 | 114 (19.3%) | 75 (16.7%) |
| $35,000 to $49,999 | 33 (5.6%) | 51 (11.3%) |
| $50,000 to $74,999 | 148 (25.0%) | 97 (21.6%) |
| $75,000 to $99,999 | 65 (11.0%) | 45 (10.0%) |
| $100,000 to $149,999 | 142 (24.0%) | 12 (2.7%) |
| $150,000 or more | 6 (1.0%) | 0 (0.0%) |
| Total | 591 (100.0%) | 450 (100.0%) |
Monthly Housing Cost Tiers in Spooner
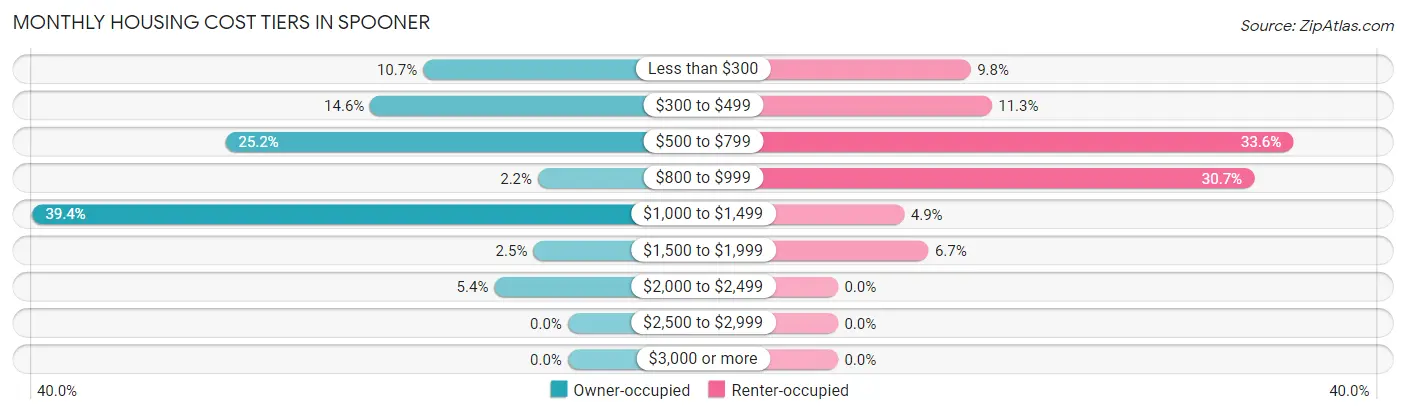
| Monthly Cost | Owner-occupied | Renter-occupied |
| Less than $300 | 63 (10.7%) | 44 (9.8%) |
| $300 to $499 | 86 (14.5%) | 51 (11.3%) |
| $500 to $799 | 149 (25.2%) | 151 (33.6%) |
| $800 to $999 | 13 (2.2%) | 138 (30.7%) |
| $1,000 to $1,499 | 233 (39.4%) | 22 (4.9%) |
| $1,500 to $1,999 | 15 (2.5%) | 30 (6.7%) |
| $2,000 to $2,499 | 32 (5.4%) | 0 (0.0%) |
| $2,500 to $2,999 | 0 (0.0%) | 0 (0.0%) |
| $3,000 or more | 0 (0.0%) | 0 (0.0%) |
| Total | 591 (100.0%) | 450 (100.0%) |
Physical Housing Characteristics in Spooner
Housing Structures in Spooner
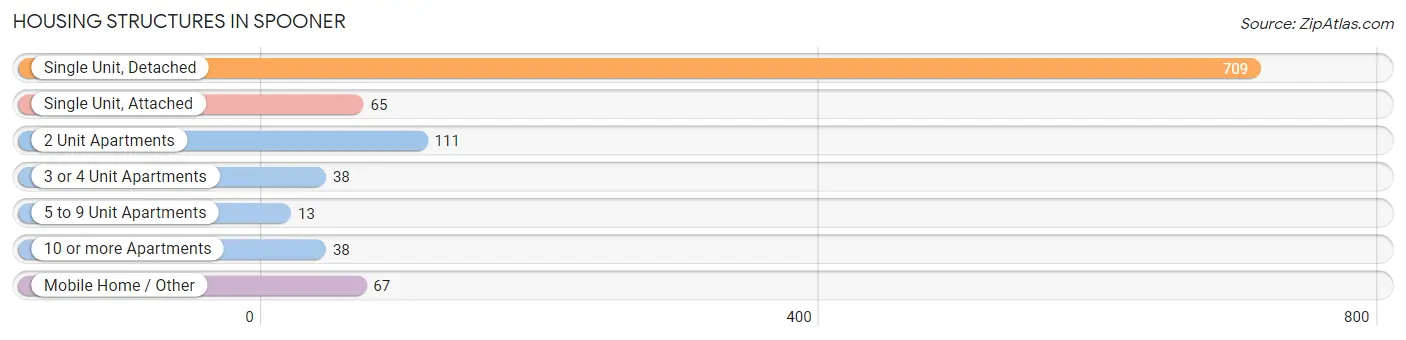
| Structure Type | # Housing Units | % Housing Units |
| Single Unit, Detached | 709 | 68.1% |
| Single Unit, Attached | 65 | 6.2% |
| 2 Unit Apartments | 111 | 10.7% |
| 3 or 4 Unit Apartments | 38 | 3.6% |
| 5 to 9 Unit Apartments | 13 | 1.3% |
| 10 or more Apartments | 38 | 3.6% |
| Mobile Home / Other | 67 | 6.4% |
| Total | 1,041 | 100.0% |
Housing Structures by Occupancy in Spooner
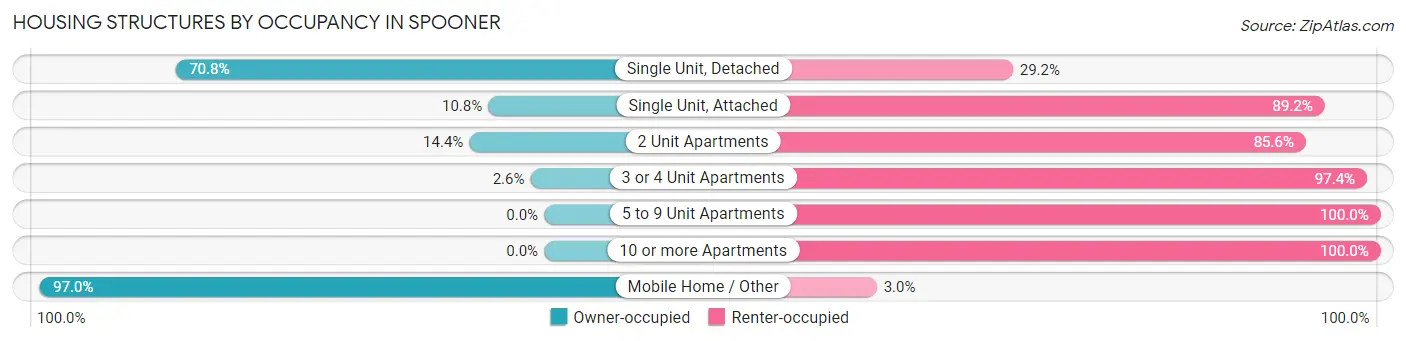
| Structure Type | Owner-occupied | Renter-occupied |
| Single Unit, Detached | 502 (70.8%) | 207 (29.2%) |
| Single Unit, Attached | 7 (10.8%) | 58 (89.2%) |
| 2 Unit Apartments | 16 (14.4%) | 95 (85.6%) |
| 3 or 4 Unit Apartments | 1 (2.6%) | 37 (97.4%) |
| 5 to 9 Unit Apartments | 0 (0.0%) | 13 (100.0%) |
| 10 or more Apartments | 0 (0.0%) | 38 (100.0%) |
| Mobile Home / Other | 65 (97.0%) | 2 (3.0%) |
| Total | 591 (56.8%) | 450 (43.2%) |
Housing Structures by Number of Rooms in Spooner
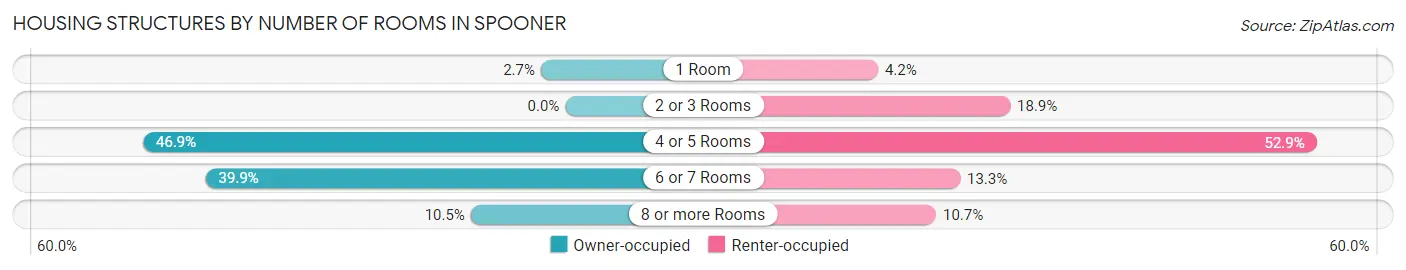
| Number of Rooms | Owner-occupied | Renter-occupied |
| 1 Room | 16 (2.7%) | 19 (4.2%) |
| 2 or 3 Rooms | 0 (0.0%) | 85 (18.9%) |
| 4 or 5 Rooms | 277 (46.9%) | 238 (52.9%) |
| 6 or 7 Rooms | 236 (39.9%) | 60 (13.3%) |
| 8 or more Rooms | 62 (10.5%) | 48 (10.7%) |
| Total | 591 (100.0%) | 450 (100.0%) |
Housing Structure by Heating Type in Spooner
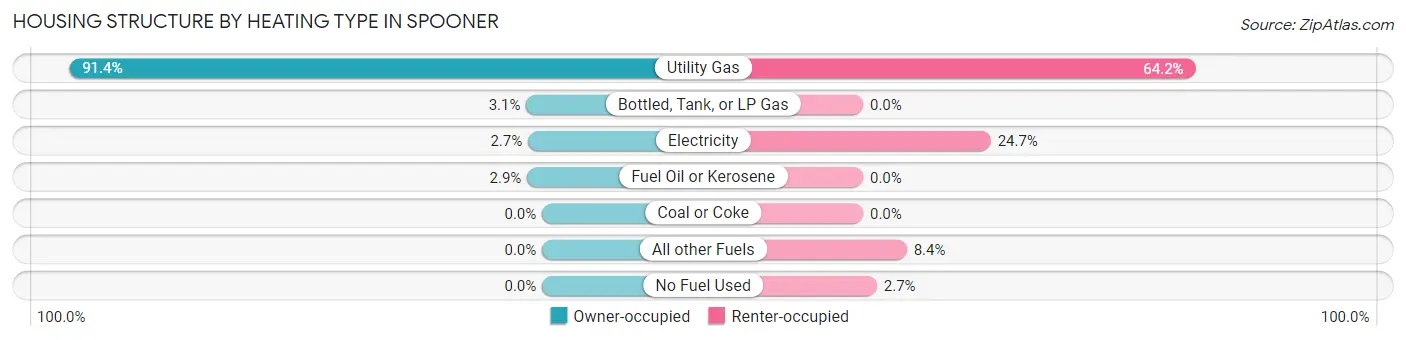
| Heating Type | Owner-occupied | Renter-occupied |
| Utility Gas | 540 (91.4%) | 289 (64.2%) |
| Bottled, Tank, or LP Gas | 18 (3.0%) | 0 (0.0%) |
| Electricity | 16 (2.7%) | 111 (24.7%) |
| Fuel Oil or Kerosene | 17 (2.9%) | 0 (0.0%) |
| Coal or Coke | 0 (0.0%) | 0 (0.0%) |
| All other Fuels | 0 (0.0%) | 38 (8.4%) |
| No Fuel Used | 0 (0.0%) | 12 (2.7%) |
| Total | 591 (100.0%) | 450 (100.0%) |
Household Vehicle Usage in Spooner
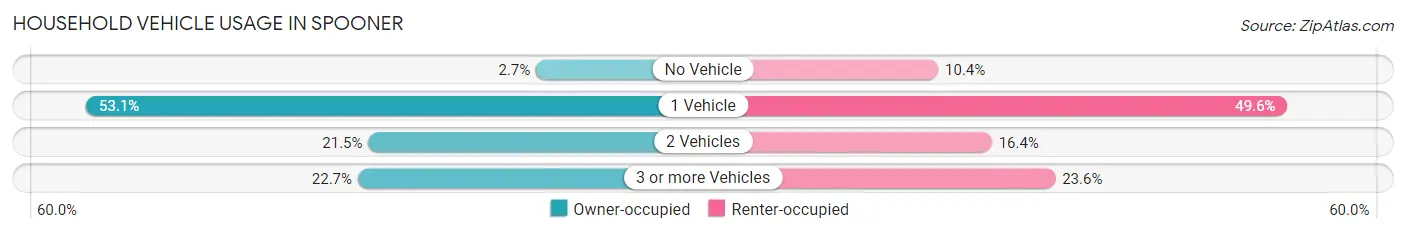
| Vehicles per Household | Owner-occupied | Renter-occupied |
| No Vehicle | 16 (2.7%) | 47 (10.4%) |
| 1 Vehicle | 314 (53.1%) | 223 (49.6%) |
| 2 Vehicles | 127 (21.5%) | 74 (16.4%) |
| 3 or more Vehicles | 134 (22.7%) | 106 (23.6%) |
| Total | 591 (100.0%) | 450 (100.0%) |
Real Estate & Mortgages in Spooner
Real Estate and Mortgage Overview in Spooner
| Characteristic | Without Mortgage | With Mortgage |
| Housing Units | 260 | 331 |
| Median Property Value | $135,000 | $126,400 |
| Median Household Income | - | - |
| Monthly Housing Costs | $500 | $0 |
| Real Estate Taxes | $2,740 | $0 |
Property Value by Mortgage Status in Spooner
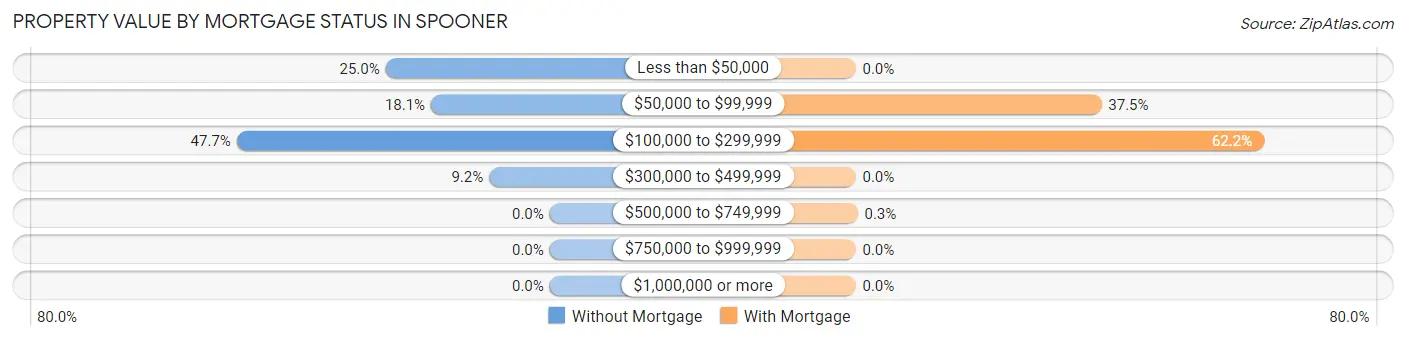
| Property Value | Without Mortgage | With Mortgage |
| Less than $50,000 | 65 (25.0%) | 0 (0.0%) |
| $50,000 to $99,999 | 47 (18.1%) | 124 (37.5%) |
| $100,000 to $299,999 | 124 (47.7%) | 206 (62.2%) |
| $300,000 to $499,999 | 24 (9.2%) | 0 (0.0%) |
| $500,000 to $749,999 | 0 (0.0%) | 1 (0.3%) |
| $750,000 to $999,999 | 0 (0.0%) | 0 (0.0%) |
| $1,000,000 or more | 0 (0.0%) | 0 (0.0%) |
| Total | 260 (100.0%) | 331 (100.0%) |
Household Income by Mortgage Status in Spooner
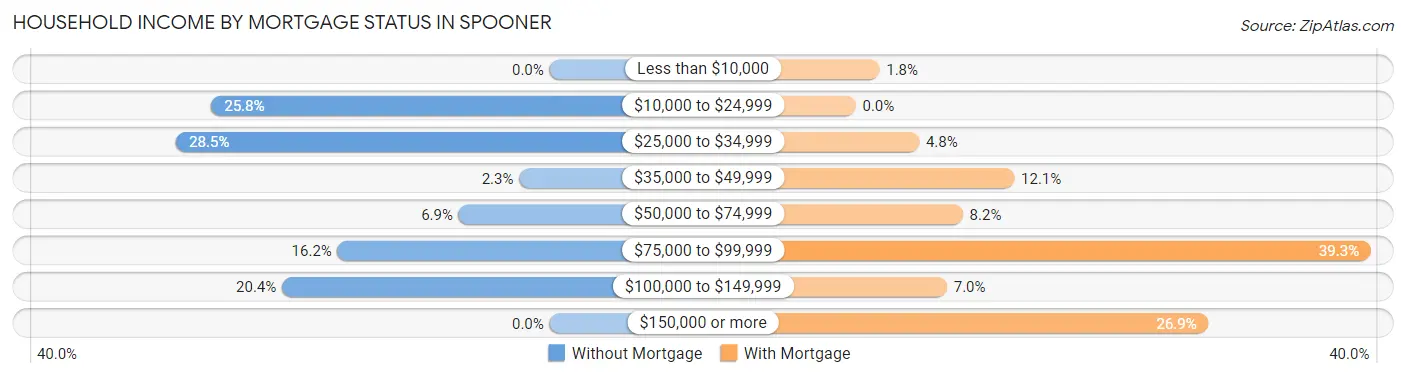
| Household Income | Without Mortgage | With Mortgage |
| Less than $10,000 | 0 (0.0%) | 6 (1.8%) |
| $10,000 to $24,999 | 67 (25.8%) | 0 (0.0%) |
| $25,000 to $34,999 | 74 (28.5%) | 16 (4.8%) |
| $35,000 to $49,999 | 6 (2.3%) | 40 (12.1%) |
| $50,000 to $74,999 | 18 (6.9%) | 27 (8.2%) |
| $75,000 to $99,999 | 42 (16.2%) | 130 (39.3%) |
| $100,000 to $149,999 | 53 (20.4%) | 23 (7.0%) |
| $150,000 or more | 0 (0.0%) | 89 (26.9%) |
| Total | 260 (100.0%) | 331 (100.0%) |
Property Value to Household Income Ratio in Spooner
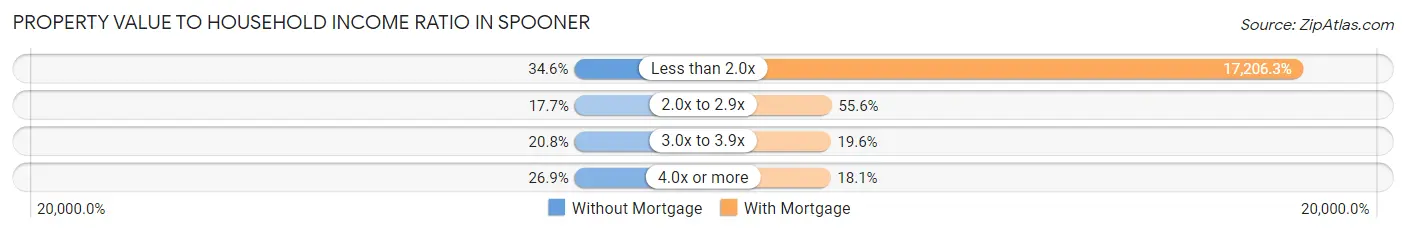
| Value-to-Income Ratio | Without Mortgage | With Mortgage |
| Less than 2.0x | 90 (34.6%) | 56,953 (17,206.3%) |
| 2.0x to 2.9x | 46 (17.7%) | 184 (55.6%) |
| 3.0x to 3.9x | 54 (20.8%) | 65 (19.6%) |
| 4.0x or more | 70 (26.9%) | 60 (18.1%) |
| Total | 260 (100.0%) | 331 (100.0%) |
Real Estate Taxes by Mortgage Status in Spooner
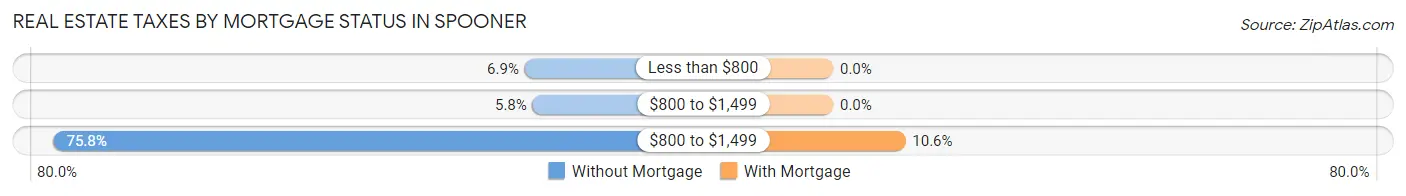
| Property Taxes | Without Mortgage | With Mortgage |
| Less than $800 | 18 (6.9%) | 0 (0.0%) |
| $800 to $1,499 | 15 (5.8%) | 0 (0.0%) |
| $800 to $1,499 | 197 (75.8%) | 35 (10.6%) |
| Total | 260 (100.0%) | 331 (100.0%) |
Health & Disability in Spooner
Health Insurance Coverage by Age in Spooner
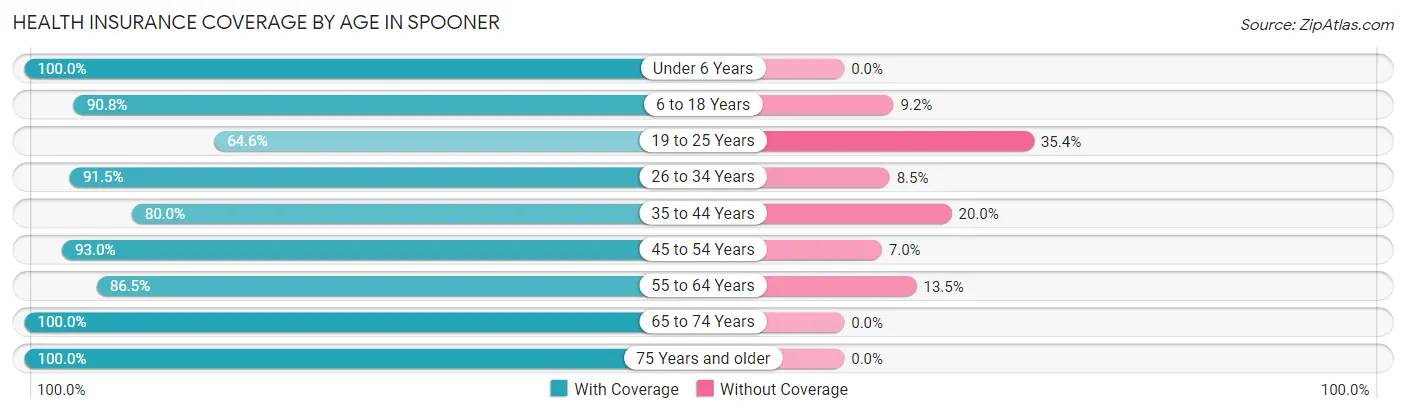
| Age Bracket | With Coverage | Without Coverage |
| Under 6 Years | 74 (100.0%) | 0 (0.0%) |
| 6 to 18 Years | 237 (90.8%) | 24 (9.2%) |
| 19 to 25 Years | 53 (64.6%) | 29 (35.4%) |
| 26 to 34 Years | 162 (91.5%) | 15 (8.5%) |
| 35 to 44 Years | 188 (80.0%) | 47 (20.0%) |
| 45 to 54 Years | 199 (93.0%) | 15 (7.0%) |
| 55 to 64 Years | 347 (86.5%) | 54 (13.5%) |
| 65 to 74 Years | 276 (100.0%) | 0 (0.0%) |
| 75 Years and older | 262 (100.0%) | 0 (0.0%) |
| Total | 1,798 (90.7%) | 184 (9.3%) |
Health Insurance Coverage by Citizenship Status in Spooner
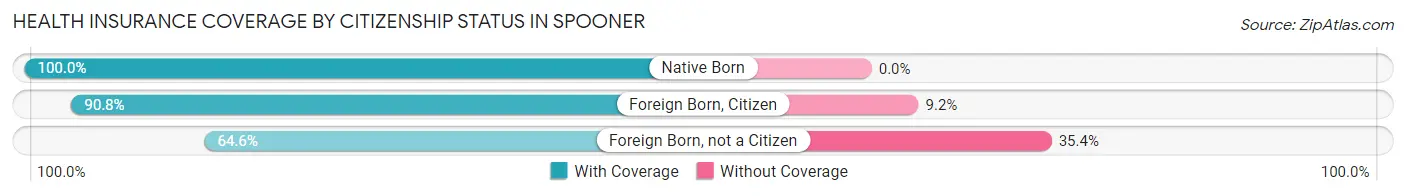
| Citizenship Status | With Coverage | Without Coverage |
| Native Born | 74 (100.0%) | 0 (0.0%) |
| Foreign Born, Citizen | 237 (90.8%) | 24 (9.2%) |
| Foreign Born, not a Citizen | 53 (64.6%) | 29 (35.4%) |
Health Insurance Coverage by Household Income in Spooner
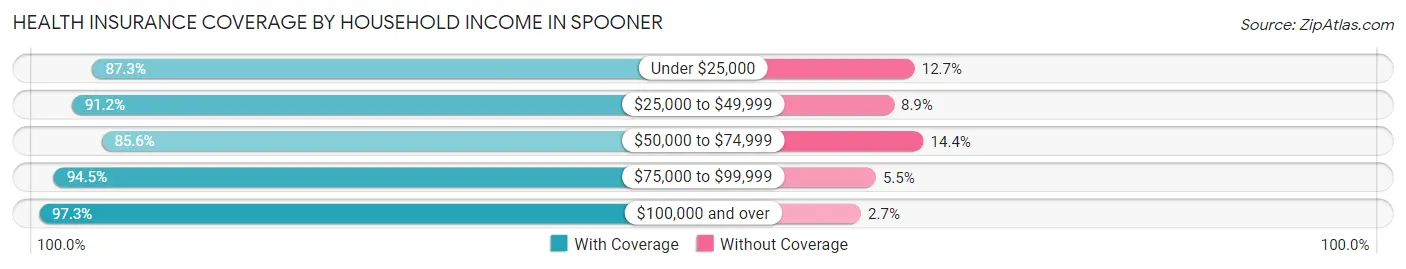
| Household Income | With Coverage | Without Coverage |
| Under $25,000 | 322 (87.3%) | 47 (12.7%) |
| $25,000 to $49,999 | 443 (91.1%) | 43 (8.8%) |
| $50,000 to $74,999 | 416 (85.6%) | 70 (14.4%) |
| $75,000 to $99,999 | 259 (94.5%) | 15 (5.5%) |
| $100,000 and over | 325 (97.3%) | 9 (2.7%) |
Public vs Private Health Insurance Coverage by Age in Spooner
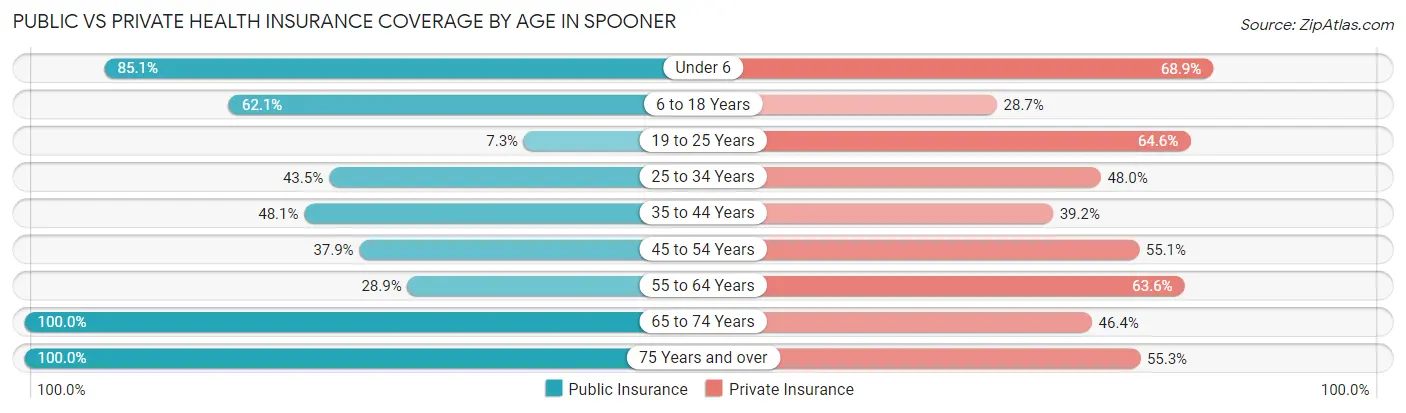
| Age Bracket | Public Insurance | Private Insurance |
| Under 6 | 63 (85.1%) | 51 (68.9%) |
| 6 to 18 Years | 162 (62.1%) | 75 (28.7%) |
| 19 to 25 Years | 6 (7.3%) | 53 (64.6%) |
| 25 to 34 Years | 77 (43.5%) | 85 (48.0%) |
| 35 to 44 Years | 113 (48.1%) | 92 (39.2%) |
| 45 to 54 Years | 81 (37.9%) | 118 (55.1%) |
| 55 to 64 Years | 116 (28.9%) | 255 (63.6%) |
| 65 to 74 Years | 276 (100.0%) | 128 (46.4%) |
| 75 Years and over | 262 (100.0%) | 145 (55.3%) |
| Total | 1,156 (58.3%) | 1,002 (50.5%) |
Disability Status by Sex by Age in Spooner
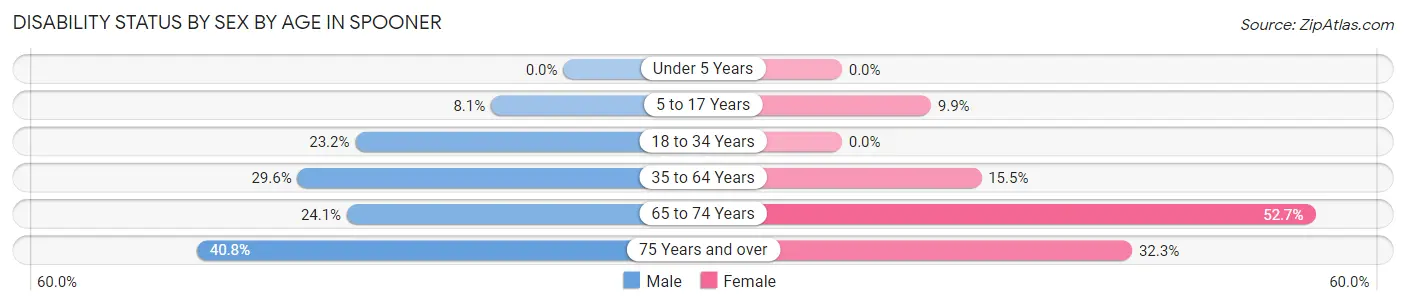
| Age Bracket | Male | Female |
| Under 5 Years | 0 (0.0%) | 0 (0.0%) |
| 5 to 17 Years | 14 (8.1%) | 12 (9.9%) |
| 18 to 34 Years | 38 (23.2%) | 0 (0.0%) |
| 35 to 64 Years | 122 (29.6%) | 68 (15.5%) |
| 65 to 74 Years | 40 (24.1%) | 58 (52.7%) |
| 75 Years and over | 40 (40.8%) | 53 (32.3%) |
Disability Class by Sex by Age in Spooner
Disability Class: Hearing Difficulty
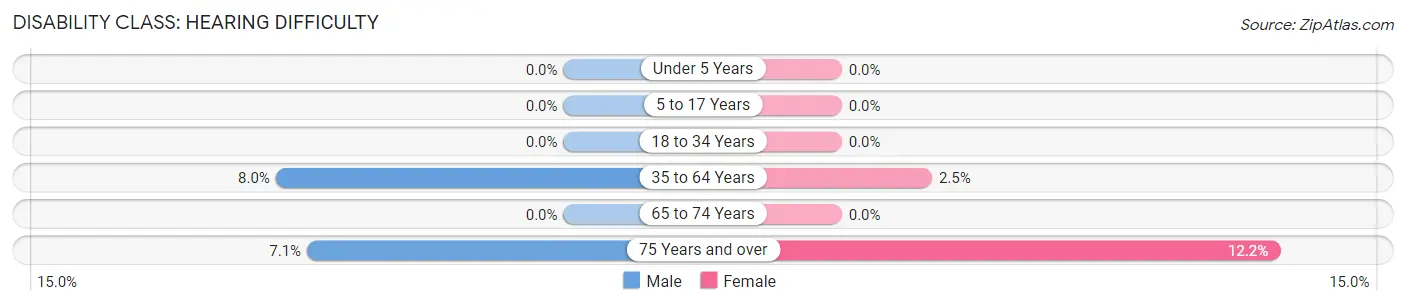
| Age Bracket | Male | Female |
| Under 5 Years | 0 (0.0%) | 0 (0.0%) |
| 5 to 17 Years | 0 (0.0%) | 0 (0.0%) |
| 18 to 34 Years | 0 (0.0%) | 0 (0.0%) |
| 35 to 64 Years | 33 (8.0%) | 11 (2.5%) |
| 65 to 74 Years | 0 (0.0%) | 0 (0.0%) |
| 75 Years and over | 7 (7.1%) | 20 (12.2%) |
Disability Class: Vision Difficulty
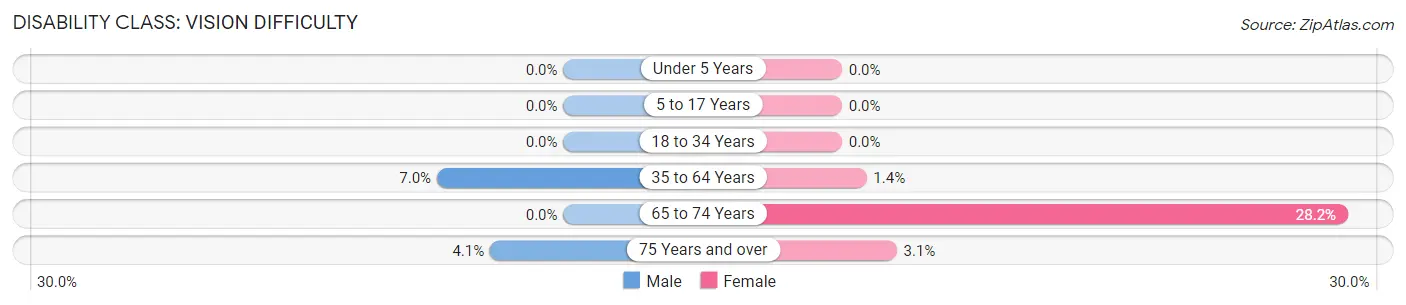
| Age Bracket | Male | Female |
| Under 5 Years | 0 (0.0%) | 0 (0.0%) |
| 5 to 17 Years | 0 (0.0%) | 0 (0.0%) |
| 18 to 34 Years | 0 (0.0%) | 0 (0.0%) |
| 35 to 64 Years | 29 (7.0%) | 6 (1.4%) |
| 65 to 74 Years | 0 (0.0%) | 31 (28.2%) |
| 75 Years and over | 4 (4.1%) | 5 (3.0%) |
Disability Class: Cognitive Difficulty
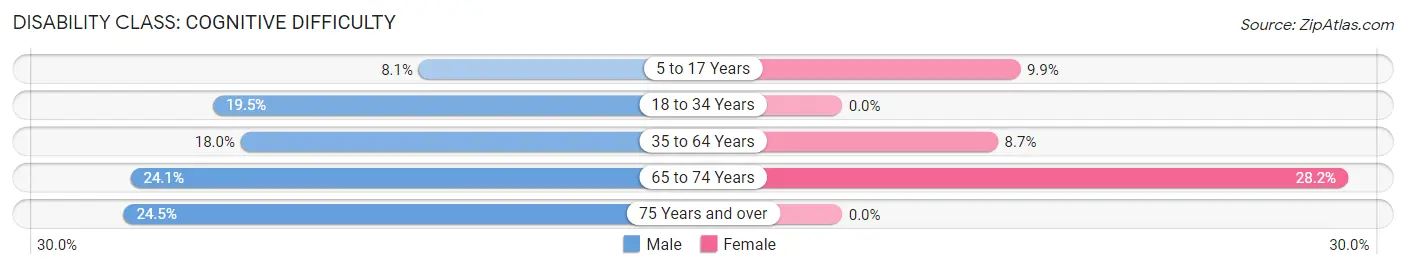
| Age Bracket | Male | Female |
| 5 to 17 Years | 14 (8.1%) | 12 (9.9%) |
| 18 to 34 Years | 32 (19.5%) | 0 (0.0%) |
| 35 to 64 Years | 74 (18.0%) | 38 (8.7%) |
| 65 to 74 Years | 40 (24.1%) | 31 (28.2%) |
| 75 Years and over | 24 (24.5%) | 0 (0.0%) |
Disability Class: Ambulatory Difficulty
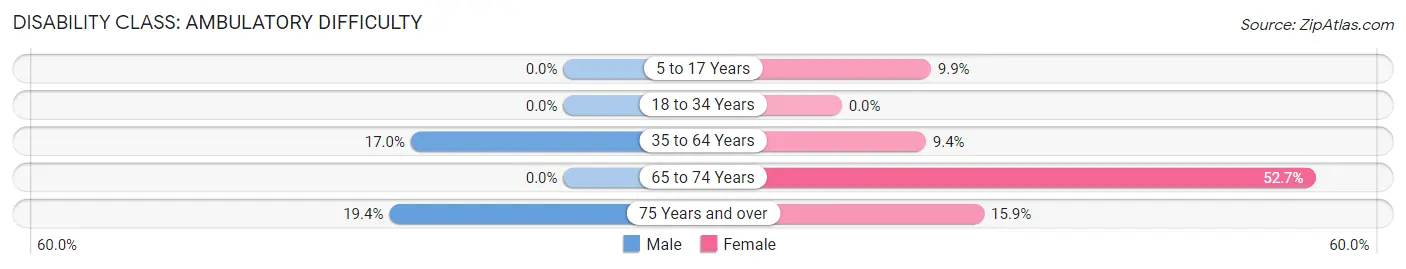
| Age Bracket | Male | Female |
| 5 to 17 Years | 0 (0.0%) | 12 (9.9%) |
| 18 to 34 Years | 0 (0.0%) | 0 (0.0%) |
| 35 to 64 Years | 70 (17.0%) | 41 (9.4%) |
| 65 to 74 Years | 0 (0.0%) | 58 (52.7%) |
| 75 Years and over | 19 (19.4%) | 26 (15.9%) |
Disability Class: Self-Care Difficulty
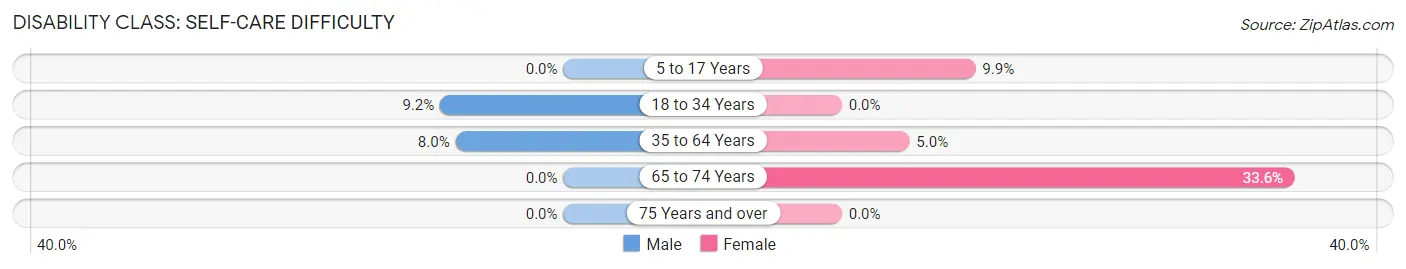
| Age Bracket | Male | Female |
| 5 to 17 Years | 0 (0.0%) | 12 (9.9%) |
| 18 to 34 Years | 15 (9.1%) | 0 (0.0%) |
| 35 to 64 Years | 33 (8.0%) | 22 (5.0%) |
| 65 to 74 Years | 0 (0.0%) | 37 (33.6%) |
| 75 Years and over | 0 (0.0%) | 0 (0.0%) |
Technology Access in Spooner
Computing Device Access in Spooner
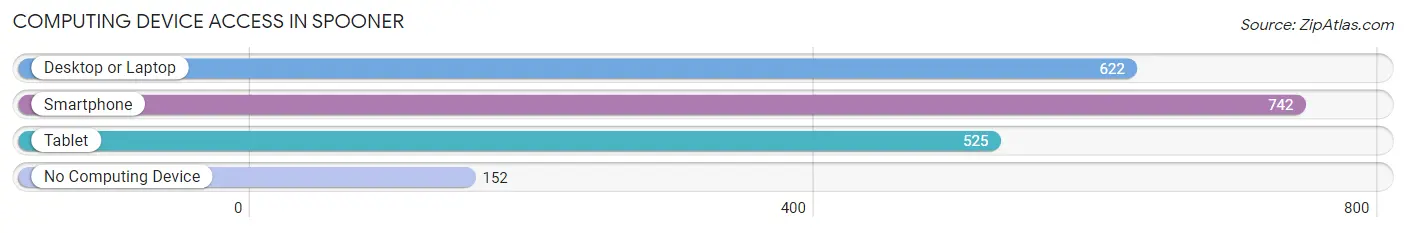
| Device Type | # Households | % Households |
| Desktop or Laptop | 622 | 59.8% |
| Smartphone | 742 | 71.3% |
| Tablet | 525 | 50.4% |
| No Computing Device | 152 | 14.6% |
| Total | 1,041 | 100.0% |
Internet Access in Spooner
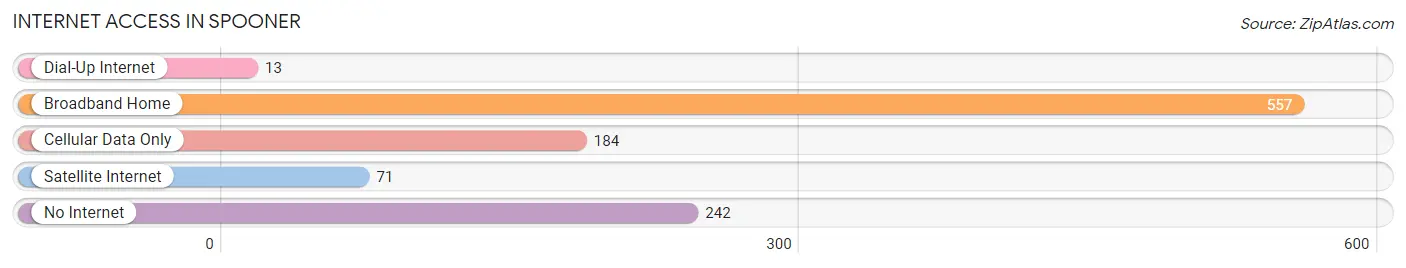
| Internet Type | # Households | % Households |
| Dial-Up Internet | 13 | 1.3% |
| Broadband Home | 557 | 53.5% |
| Cellular Data Only | 184 | 17.7% |
| Satellite Internet | 71 | 6.8% |
| No Internet | 242 | 23.3% |
| Total | 1,041 | 100.0% |
Spooner Summary
Spooner, Wisconsin is a small city located in Washburn County in the northwestern part of the state. It is situated on the banks of the Namekagon River, and is the county seat of Washburn County. The city has a population of 2,682 as of the 2010 census, and is part of the Spooner Micropolitan Statistical Area.
History
The area that is now Spooner was first settled in the late 1840s by a group of settlers from New York. The town was originally known as “Spooner’s Grove” after the first settler, William Spooner. The town was officially incorporated in 1883, and the name was changed to Spooner in 1885.
The city was an important stop on the Chicago, St. Paul, Minneapolis and Omaha Railway, which was built in 1883. This railway was a major factor in the growth of the city, as it allowed for the transportation of goods and people to and from Spooner.
The city was also an important center for the lumber industry in the late 19th and early 20th centuries. The city was home to several sawmills, and the lumber industry was a major source of employment for the city’s residents.
Geography
Spooner is located at 45°51'N 91°37'W (45.851, -91.619). According to the United States Census Bureau, the city has a total area of 2.2 square miles (5.7 km2), all of it land.
The city is located in the northwest corner of Wisconsin, and is bordered by the Namekagon River to the east and the Red Cedar River to the west. The city is located in a heavily forested area, and is surrounded by numerous lakes and rivers.
Economy
The economy of Spooner is largely based on tourism and agriculture. The city is home to several tourist attractions, including the Spooner Railroad Museum, the Spooner Aquarium, and the Spooner State Park. The city is also home to several farms, which produce a variety of crops, including corn, soybeans, and hay.
The city is also home to several manufacturing companies, including a paper mill, a furniture factory, and a plastics factory. The city is also home to several retail stores, restaurants, and other businesses.
Demographics
As of the 2010 census, there were 2,682 people, 1,093 households, and 690 families residing in the city. The population density was 1,204.2 people per square mile (464.7/km2). There were 1,183 housing units at an average density of 531.2 per square mile (204.9/km2). The racial makeup of the city was 97.2% White, 0.3% African American, 0.4% Native American, 0.3% Asian, 0.2% from other races, and 1.6% from two or more races. Hispanic or Latino of any race were 1.2% of the population.
There were 1,093 households, out of which 28.2% had children under the age of 18 living with them, 48.2% were married couples living together, 10.7% had a female householder with no husband present, and 36.2% were non-families. 30.7% of all households were made up of individuals, and 14.2% had someone living alone who was 65 years of age or older. The average household size was 2.41 and the average family size was 3.00.
In the city, the population was spread out, with 24.7% under the age of 18, 8.2% from 18 to 24, 25.2% from 25 to 44, 24.2% from 45 to 64, and 17.7% who were 65 years of age or older. The median age was 39 years. For every 100 females, there were 94.2 males. For every 100 females age 18 and over, there were 91.2 males.
The median income for a household in the city was $35,938, and the median income for a family was $45,000. Males had a median income of $31,964 versus $21,964 for females. The per capita income for the city was $17,945. About 8.2% of families and 11.2% of the population were below the poverty line, including 14.2% of those under age 18 and 8.2% of those age 65 or over.
Common Questions
What is Per Capita Income in Spooner?
Per Capita income in Spooner is $28,562.
What is the Median Family Income in Spooner?
Median Family Income in Spooner is $57,946.
What is the Median Household income in Spooner?
Median Household Income in Spooner is $49,628.
What is Income or Wage Gap in Spooner?
Income or Wage Gap in Spooner is 34.9%.
Women in Spooner earn 65.1 cents for every dollar earned by a man.
What is Inequality or Gini Index in Spooner?
Inequality or Gini Index in Spooner is 0.40.
What is the Total Population of Spooner?
Total Population of Spooner is 2,062.
What is the Total Male Population of Spooner?
Total Male Population of Spooner is 1,056.
What is the Total Female Population of Spooner?
Total Female Population of Spooner is 1,006.
What is the Ratio of Males per 100 Females in Spooner?
There are 104.97 Males per 100 Females in Spooner.
What is the Ratio of Females per 100 Males in Spooner?
There are 95.27 Females per 100 Males in Spooner.
What is the Median Population Age in Spooner?
Median Population Age in Spooner is 54.7 Years.
What is the Average Family Size in Spooner
Average Family Size in Spooner is 2.5 People.
What is the Average Household Size in Spooner
Average Household Size in Spooner is 1.9 People.
How Large is the Labor Force in Spooner?
There are 902 People in the Labor Forcein in Spooner.
What is the Percentage of People in the Labor Force in Spooner?
50.7% of People are in the Labor Force in Spooner.
What is the Unemployment Rate in Spooner?
Unemployment Rate in Spooner is 6.1%.