Sparta, WI Map & Demographics
Sparta Map
Sparta Overview
$31,009
PER CAPITA INCOME
$73,420
AVG FAMILY INCOME
$55,308
AVG HOUSEHOLD INCOME
37.4%
WAGE / INCOME GAP [ % ]
62.6¢/ $1
WAGE / INCOME GAP [ $ ]
0.41
INEQUALITY / GINI INDEX
9,943
TOTAL POPULATION
4,948
MALE POPULATION
4,995
FEMALE POPULATION
99.06
MALES / 100 FEMALES
100.95
FEMALES / 100 MALES
37.3
MEDIAN AGE
3.0
AVG FAMILY SIZE
2.3
AVG HOUSEHOLD SIZE
5,367
LABOR FORCE [ PEOPLE ]
66.8%
PERCENT IN LABOR FORCE
3.6%
UNEMPLOYMENT RATE
Sparta Zip Codes
Sparta Area Codes
Income in Sparta
Income Overview in Sparta
Per Capita Income in Sparta is $31,009, while median incomes of families and households are $73,420 and $55,308 respectively.
| Characteristic | Number | Measure |
| Per Capita Income | 9,943 | $31,009 |
| Median Family Income | 2,309 | $73,420 |
| Mean Family Income | 2,309 | $91,611 |
| Median Household Income | 4,214 | $55,308 |
| Mean Household Income | 4,214 | $71,141 |
| Income Deficit | 2,309 | $0 |
| Wage / Income Gap (%) | 9,943 | 37.44% |
| Wage / Income Gap ($) | 9,943 | 62.56¢ per $1 |
| Gini / Inequality Index | 9,943 | 0.41 |
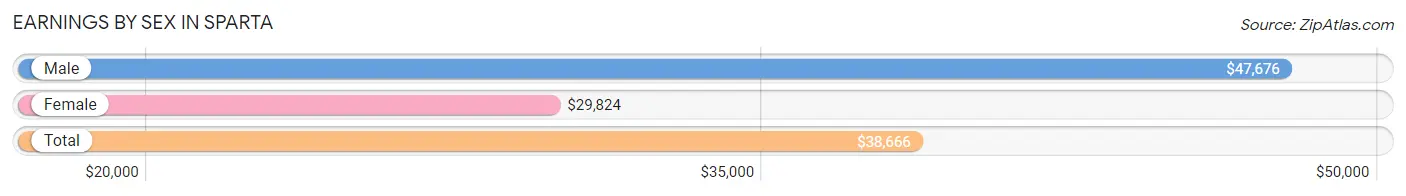
Earnings by Sex in Sparta
Average Earnings in Sparta are $38,666, $47,676 for men and $29,824 for women, a difference of 37.4%.
| Sex | Number | Average Earnings |
| Male | 2,884 (51.6%) | $47,676 |
| Female | 2,702 (48.4%) | $29,824 |
| Total | 5,586 (100.0%) | $38,666 |
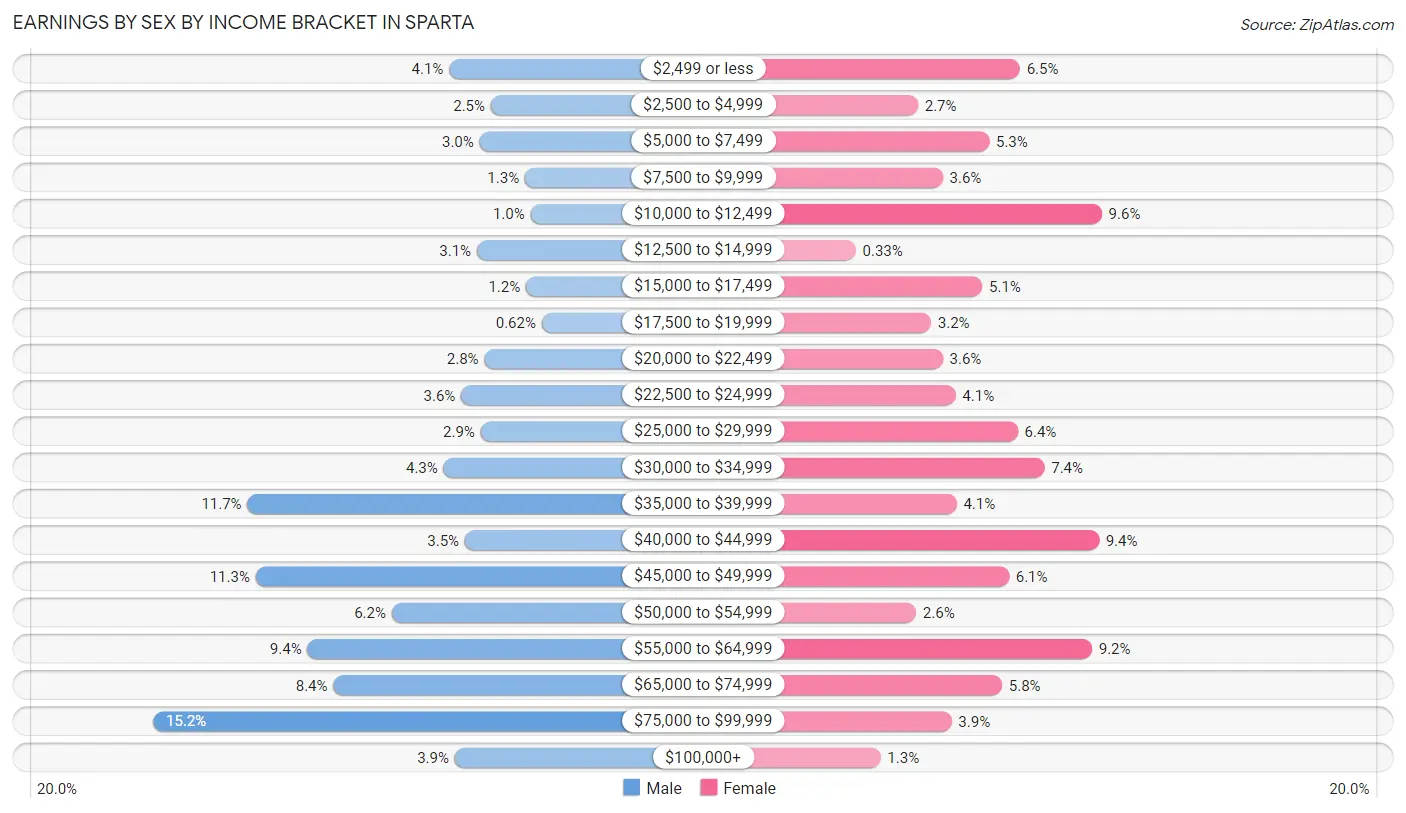
Earnings by Sex by Income Bracket in Sparta
The most common earnings brackets in Sparta are $75,000 to $99,999 for men (438 | 15.2%) and $10,000 to $12,499 for women (258 | 9.6%).
| Income | Male | Female |
| $2,499 or less | 118 (4.1%) | 175 (6.5%) |
| $2,500 to $4,999 | 73 (2.5%) | 72 (2.7%) |
| $5,000 to $7,499 | 85 (2.9%) | 144 (5.3%) |
| $7,500 to $9,999 | 36 (1.3%) | 97 (3.6%) |
| $10,000 to $12,499 | 30 (1.0%) | 258 (9.6%) |
| $12,500 to $14,999 | 88 (3.0%) | 9 (0.3%) |
| $15,000 to $17,499 | 35 (1.2%) | 137 (5.1%) |
| $17,500 to $19,999 | 18 (0.6%) | 85 (3.2%) |
| $20,000 to $22,499 | 80 (2.8%) | 97 (3.6%) |
| $22,500 to $24,999 | 105 (3.6%) | 110 (4.1%) |
| $25,000 to $29,999 | 84 (2.9%) | 173 (6.4%) |
| $30,000 to $34,999 | 124 (4.3%) | 200 (7.4%) |
| $35,000 to $39,999 | 336 (11.7%) | 111 (4.1%) |
| $40,000 to $44,999 | 101 (3.5%) | 255 (9.4%) |
| $45,000 to $49,999 | 327 (11.3%) | 164 (6.1%) |
| $50,000 to $54,999 | 180 (6.2%) | 70 (2.6%) |
| $55,000 to $64,999 | 271 (9.4%) | 248 (9.2%) |
| $65,000 to $74,999 | 243 (8.4%) | 157 (5.8%) |
| $75,000 to $99,999 | 438 (15.2%) | 106 (3.9%) |
| $100,000+ | 112 (3.9%) | 34 (1.3%) |
| Total | 2,884 (100.0%) | 2,702 (100.0%) |
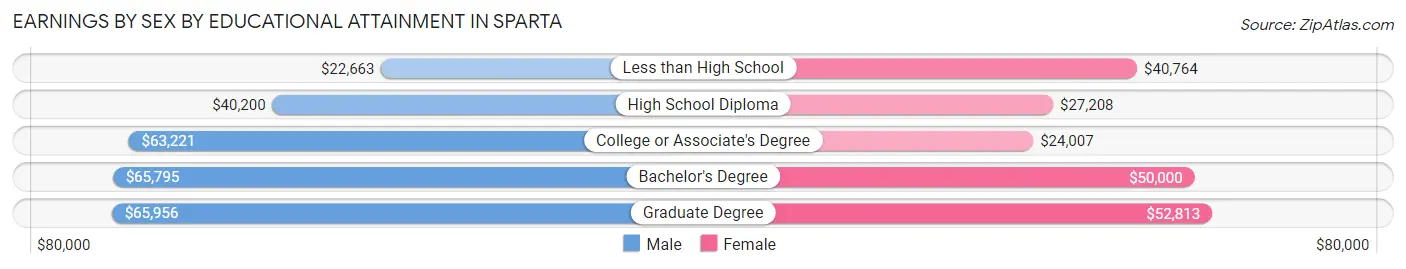
Earnings by Sex by Educational Attainment in Sparta
Average earnings in Sparta are $49,403 for men and $32,262 for women, a difference of 34.7%. Men with an educational attainment of graduate degree enjoy the highest average annual earnings of $65,956, while those with less than high school education earn the least with $22,663. Women with an educational attainment of graduate degree earn the most with the average annual earnings of $52,813, while those with college or associate's degree education have the smallest earnings of $24,007.
| Educational Attainment | Male Income | Female Income |
| Less than High School | $22,663 | $40,764 |
| High School Diploma | $40,200 | $27,208 |
| College or Associate's Degree | $63,221 | $24,007 |
| Bachelor's Degree | $65,795 | $50,000 |
| Graduate Degree | $65,956 | $52,813 |
| Total | $49,403 | $32,262 |
Family Income in Sparta
Family Income Brackets in Sparta
According to the Sparta family income data, there are 522 families falling into the $50,000 to $74,999 income range, which is the most common income bracket and makes up 22.6% of all families.
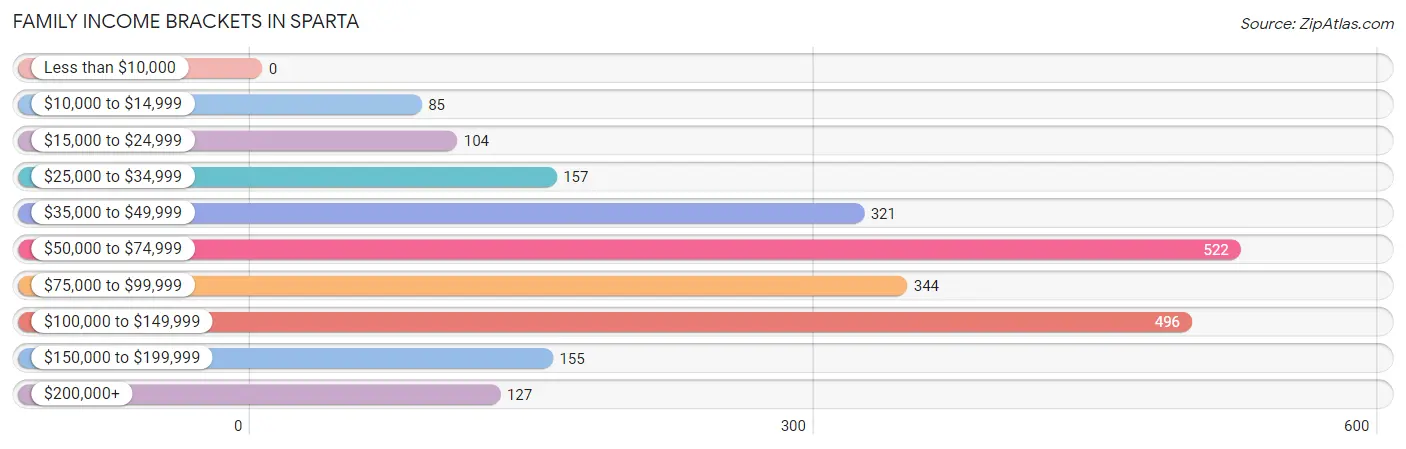
| Income Bracket | # Families | % Families |
| Less than $10,000 | 0 | 0.0% |
| $10,000 to $14,999 | 85 | 3.7% |
| $15,000 to $24,999 | 104 | 4.5% |
| $25,000 to $34,999 | 157 | 6.8% |
| $35,000 to $49,999 | 321 | 13.9% |
| $50,000 to $74,999 | 522 | 22.6% |
| $75,000 to $99,999 | 344 | 14.9% |
| $100,000 to $149,999 | 496 | 21.5% |
| $150,000 to $199,999 | 155 | 6.7% |
| $200,000+ | 127 | 5.5% |
Family Income by Famaliy Size in Sparta
4-person families (410 | 17.8%) account for the highest median family income in Sparta with $106,538 per family, while 2-person families (1,242 | 53.8%) have the highest median income of $34,364 per family member.
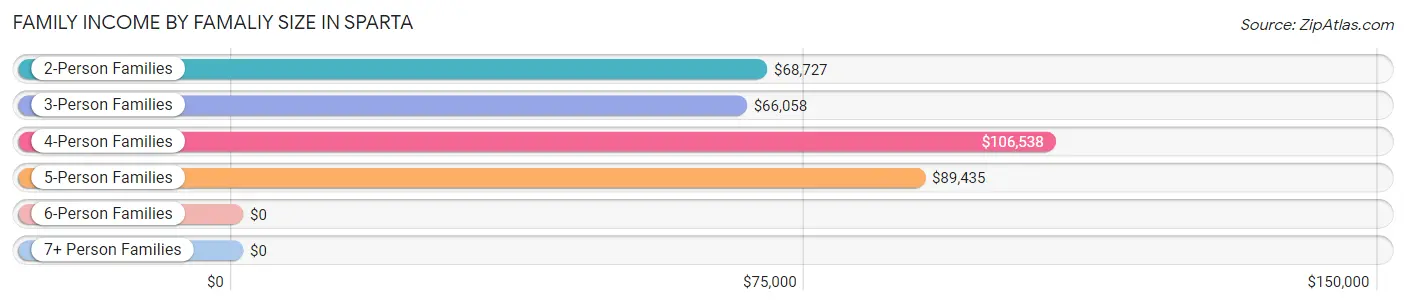
| Income Bracket | # Families | Median Income |
| 2-Person Families | 1,242 (53.8%) | $68,727 |
| 3-Person Families | 435 (18.8%) | $66,058 |
| 4-Person Families | 410 (17.8%) | $106,538 |
| 5-Person Families | 192 (8.3%) | $89,435 |
| 6-Person Families | 30 (1.3%) | $0 |
| 7+ Person Families | 0 (0.0%) | $0 |
| Total | 2,309 (100.0%) | $73,420 |
Family Income by Number of Earners in Sparta
The median family income in Sparta is $73,420, with families comprising 3+ earners (232) having the highest median family income of $179,833, while families with no earners (263) have the lowest median family income of $47,841, accounting for 10.1% and 11.4% of families, respectively.
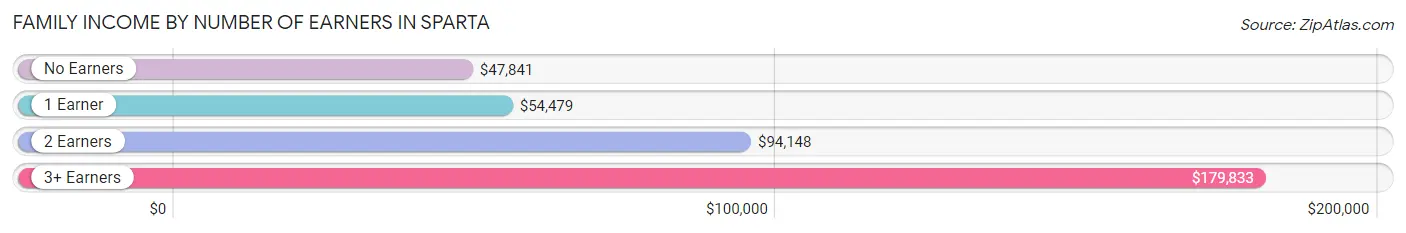
| Number of Earners | # Families | Median Income |
| No Earners | 263 (11.4%) | $47,841 |
| 1 Earner | 775 (33.6%) | $54,479 |
| 2 Earners | 1,039 (45.0%) | $94,148 |
| 3+ Earners | 232 (10.1%) | $179,833 |
| Total | 2,309 (100.0%) | $73,420 |
Household Income in Sparta
Household Income Brackets in Sparta
With 742 households falling in the category, the $50,000 to $74,999 income range is the most frequent in Sparta, accounting for 17.6% of all households. In contrast, only 46 households (1.1%) fall into the less than $10,000 income bracket, making it the least populous group.
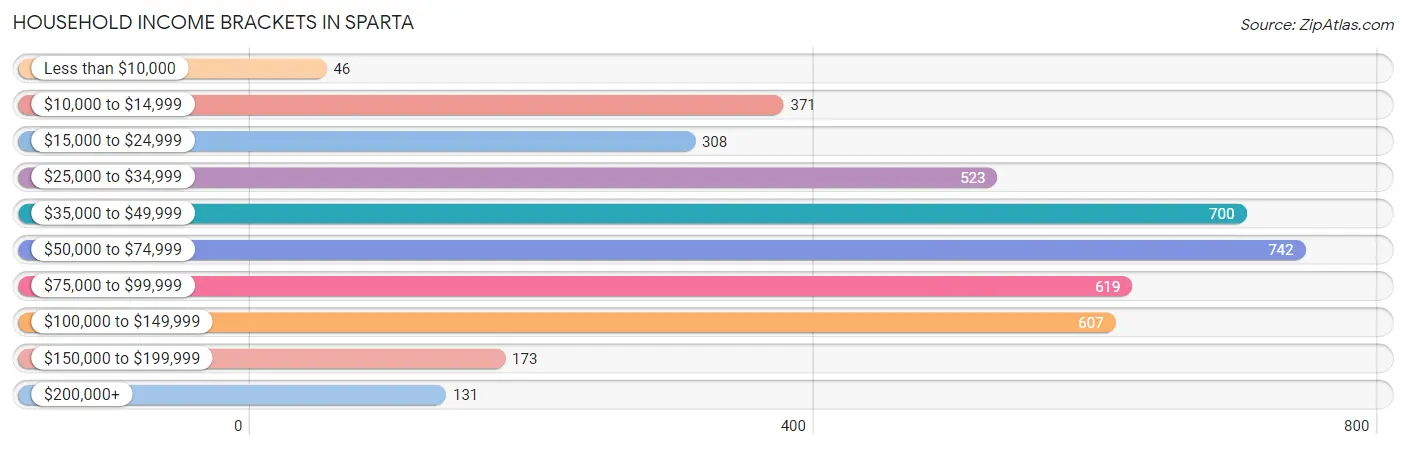
| Income Bracket | # Households | % Households |
| Less than $10,000 | 46 | 1.1% |
| $10,000 to $14,999 | 371 | 8.8% |
| $15,000 to $24,999 | 308 | 7.3% |
| $25,000 to $34,999 | 523 | 12.4% |
| $35,000 to $49,999 | 700 | 16.6% |
| $50,000 to $74,999 | 742 | 17.6% |
| $75,000 to $99,999 | 619 | 14.7% |
| $100,000 to $149,999 | 607 | 14.4% |
| $150,000 to $199,999 | 173 | 4.1% |
| $200,000+ | 131 | 3.1% |
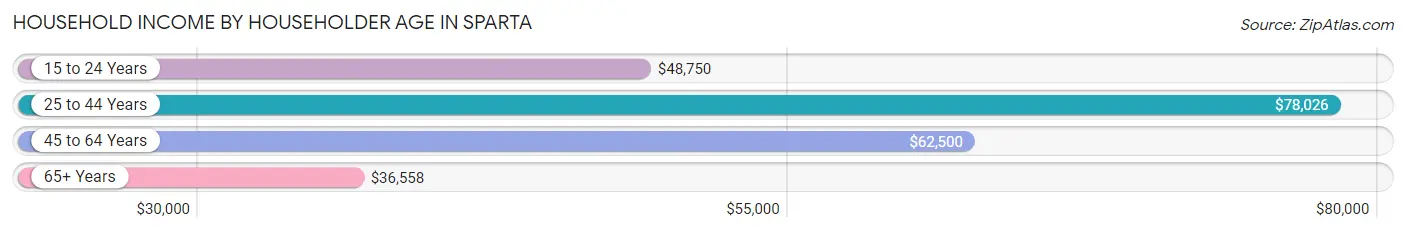
Household Income by Householder Age in Sparta
The median household income in Sparta is $55,308, with the highest median household income of $78,026 found in the 25 to 44 years age bracket for the primary householder. A total of 1,450 households (34.4%) fall into this category. Meanwhile, the 65+ years age bracket for the primary householder has the lowest median household income of $36,558, with 1,028 households (24.4%) in this group.
| Income Bracket | # Households | Median Income |
| 15 to 24 Years | 150 (3.6%) | $48,750 |
| 25 to 44 Years | 1,450 (34.4%) | $78,026 |
| 45 to 64 Years | 1,586 (37.6%) | $62,500 |
| 65+ Years | 1,028 (24.4%) | $36,558 |
| Total | 4,214 (100.0%) | $55,308 |
Poverty in Sparta
Income Below Poverty by Sex and Age in Sparta
With 9.4% poverty level for males and 12.7% for females among the residents of Sparta, 16 and 17 year old males and 35 to 44 year old females are the most vulnerable to poverty, with 38 males (36.2%) and 189 females (25.2%) in their respective age groups living below the poverty level.
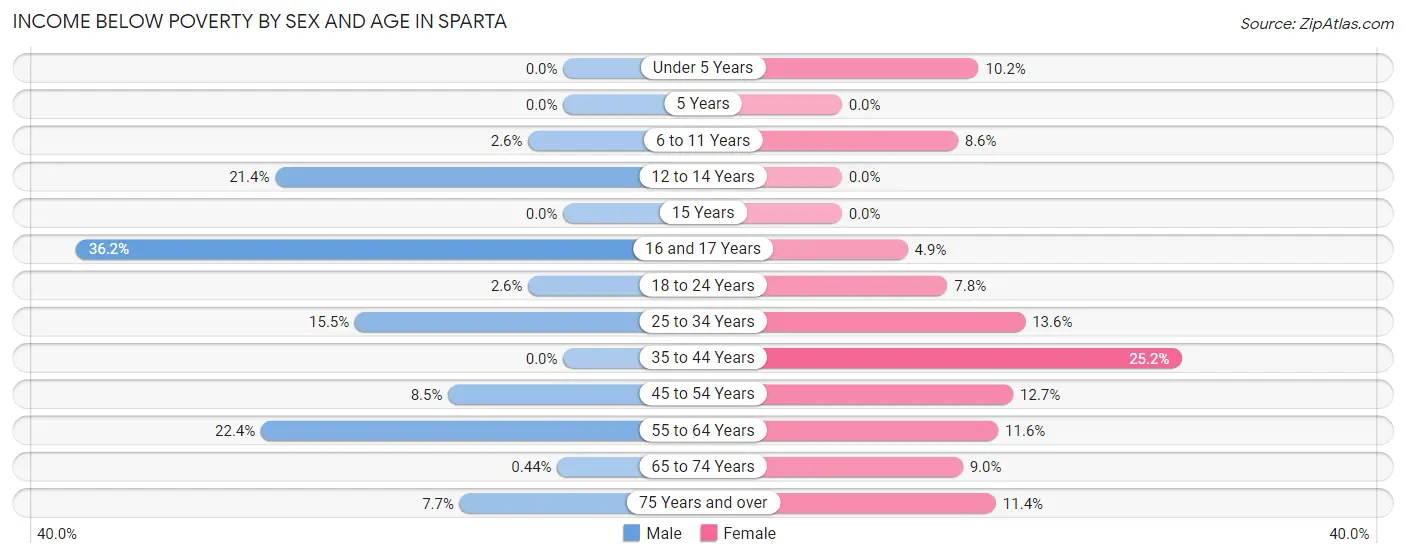
| Age Bracket | Male | Female |
| Under 5 Years | 0 (0.0%) | 31 (10.2%) |
| 5 Years | 0 (0.0%) | 0 (0.0%) |
| 6 to 11 Years | 11 (2.6%) | 39 (8.6%) |
| 12 to 14 Years | 43 (21.4%) | 0 (0.0%) |
| 15 Years | 0 (0.0%) | 0 (0.0%) |
| 16 and 17 Years | 38 (36.2%) | 9 (4.9%) |
| 18 to 24 Years | 11 (2.6%) | 12 (7.8%) |
| 25 to 34 Years | 120 (15.5%) | 105 (13.6%) |
| 35 to 44 Years | 0 (0.0%) | 189 (25.2%) |
| 45 to 54 Years | 51 (8.5%) | 71 (12.7%) |
| 55 to 64 Years | 164 (22.4%) | 83 (11.6%) |
| 65 to 74 Years | 2 (0.4%) | 52 (9.0%) |
| 75 Years and over | 13 (7.7%) | 31 (11.4%) |
| Total | 453 (9.4%) | 622 (12.7%) |
Income Above Poverty by Sex and Age in Sparta
According to the poverty statistics in Sparta, males aged under 5 years and females aged 12 to 14 years are the age groups that are most secure financially, with 100.0% of males and 100.0% of females in these age groups living above the poverty line.
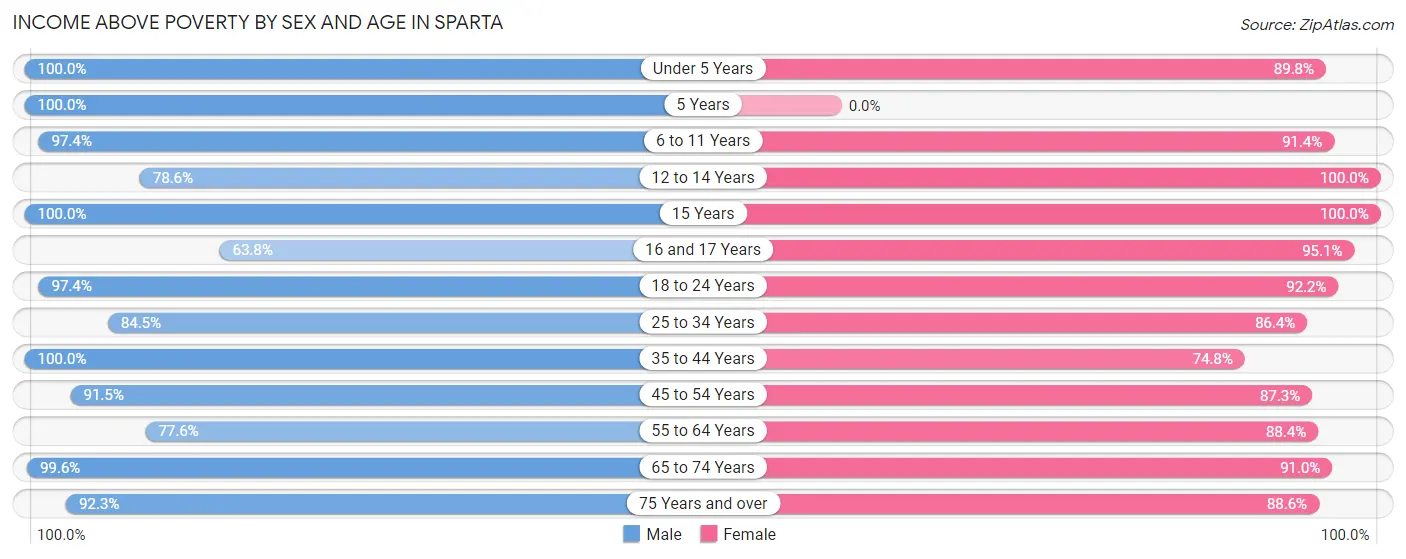
| Age Bracket | Male | Female |
| Under 5 Years | 198 (100.0%) | 274 (89.8%) |
| 5 Years | 111 (100.0%) | 0 (0.0%) |
| 6 to 11 Years | 412 (97.4%) | 414 (91.4%) |
| 12 to 14 Years | 158 (78.6%) | 117 (100.0%) |
| 15 Years | 13 (100.0%) | 50 (100.0%) |
| 16 and 17 Years | 67 (63.8%) | 175 (95.1%) |
| 18 to 24 Years | 412 (97.4%) | 141 (92.2%) |
| 25 to 34 Years | 656 (84.5%) | 666 (86.4%) |
| 35 to 44 Years | 617 (100.0%) | 561 (74.8%) |
| 45 to 54 Years | 546 (91.5%) | 487 (87.3%) |
| 55 to 64 Years | 567 (77.6%) | 632 (88.4%) |
| 65 to 74 Years | 449 (99.6%) | 527 (91.0%) |
| 75 Years and over | 156 (92.3%) | 240 (88.6%) |
| Total | 4,362 (90.6%) | 4,284 (87.3%) |
Income Below Poverty Among Married-Couple Families in Sparta
The poverty statistics for married-couple families in Sparta show that 5.7% or 90 of the total 1,587 families live below the poverty line. Families with 1 or 2 children have the highest poverty rate of 14.7%, comprising of 56 families. On the other hand, families with 3 or 4 children have the lowest poverty rate of 0.0%, which includes 0 families.
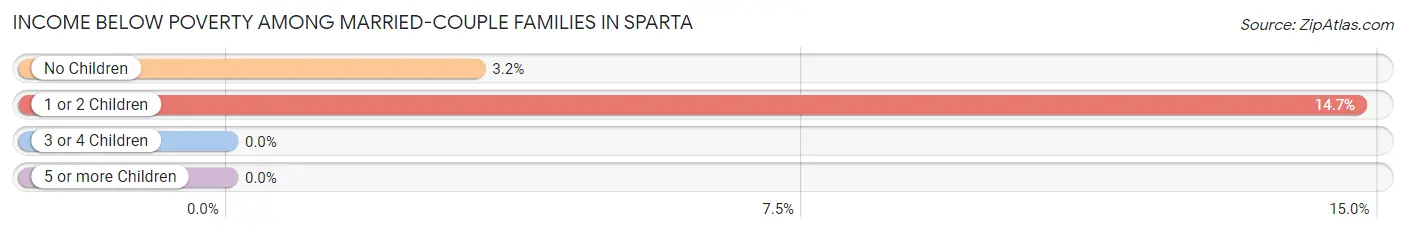
| Children | Above Poverty | Below Poverty |
| No Children | 1,020 (96.8%) | 34 (3.2%) |
| 1 or 2 Children | 324 (85.3%) | 56 (14.7%) |
| 3 or 4 Children | 153 (100.0%) | 0 (0.0%) |
| 5 or more Children | 0 (0.0%) | 0 (0.0%) |
| Total | 1,497 (94.3%) | 90 (5.7%) |
Income Below Poverty Among Single-Parent Households in Sparta
According to the poverty data in Sparta, 10.4% or 34 single-father households and 6.1% or 24 single-mother households are living below the poverty line. Among single-father households, those with 3 or 4 children have the highest poverty rate, with 34 households (100.0%) experiencing poverty. Likewise, among single-mother households, those with 3 or 4 children have the highest poverty rate, with 8 households (33.3%) falling below the poverty line.
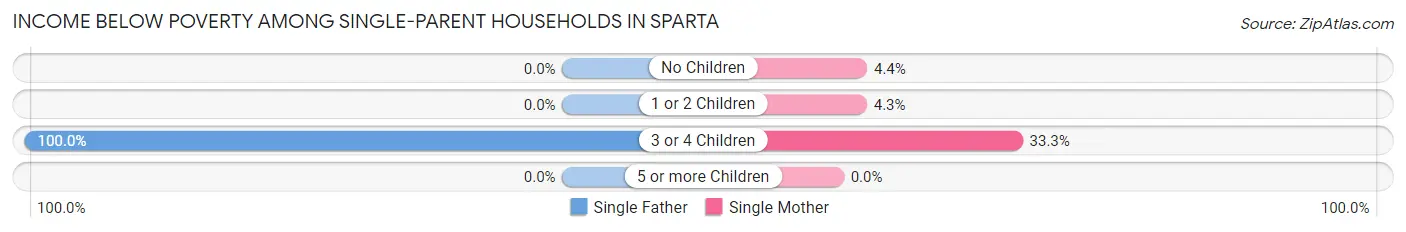
| Children | Single Father | Single Mother |
| No Children | 0 (0.0%) | 7 (4.3%) |
| 1 or 2 Children | 0 (0.0%) | 9 (4.3%) |
| 3 or 4 Children | 34 (100.0%) | 8 (33.3%) |
| 5 or more Children | 0 (0.0%) | 0 (0.0%) |
| Total | 34 (10.4%) | 24 (6.1%) |
Income Below Poverty Among Married-Couple vs Single-Parent Households in Sparta
The poverty data for Sparta shows that 90 of the married-couple family households (5.7%) and 58 of the single-parent households (8.0%) are living below the poverty level. Within the married-couple family households, those with 1 or 2 children have the highest poverty rate, with 56 households (14.7%) falling below the poverty line. Among the single-parent households, those with 3 or 4 children have the highest poverty rate, with 42 household (72.4%) living below poverty.
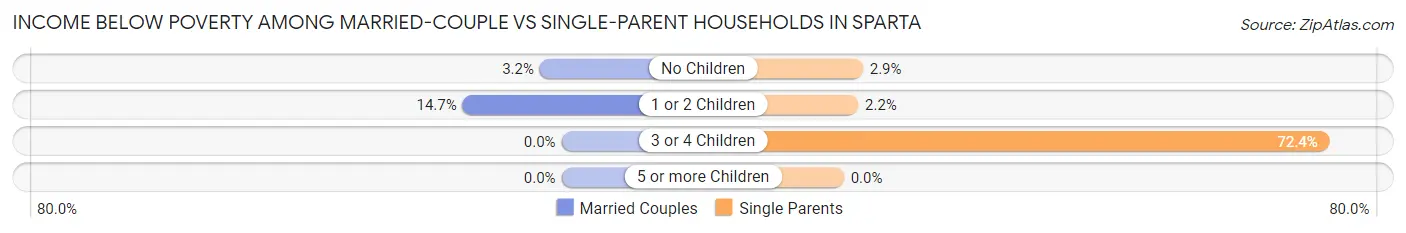
| Children | Married-Couple Families | Single-Parent Households |
| No Children | 34 (3.2%) | 7 (2.9%) |
| 1 or 2 Children | 56 (14.7%) | 9 (2.1%) |
| 3 or 4 Children | 0 (0.0%) | 42 (72.4%) |
| 5 or more Children | 0 (0.0%) | 0 (0.0%) |
| Total | 90 (5.7%) | 58 (8.0%) |
Race in Sparta
The most populous races in Sparta are White / Caucasian (8,862 | 89.1%), Hispanic or Latino (634 | 6.4%), and Two or more Races (428 | 4.3%).
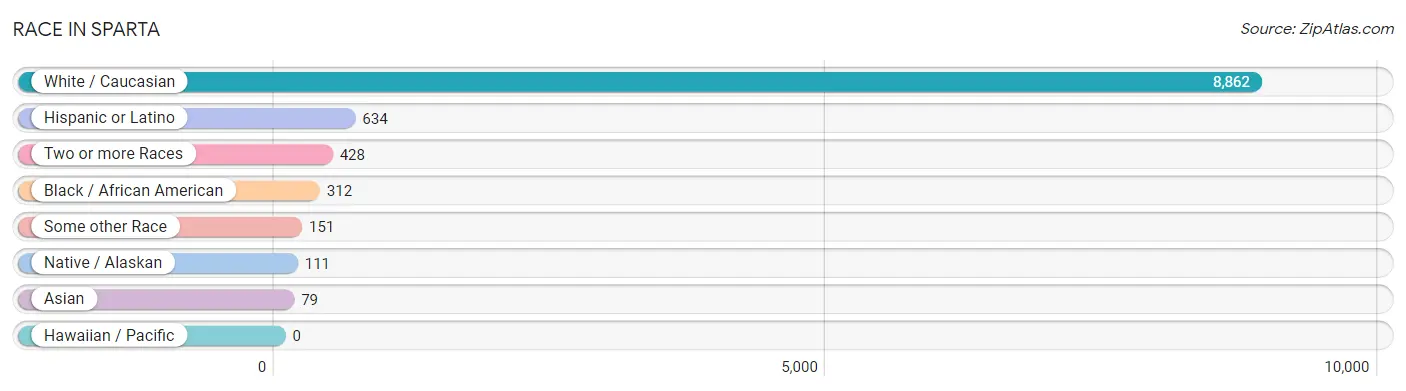
| Race | # Population | % Population |
| Asian | 79 | 0.8% |
| Black / African American | 312 | 3.1% |
| Hawaiian / Pacific | 0 | 0.0% |
| Hispanic or Latino | 634 | 6.4% |
| Native / Alaskan | 111 | 1.1% |
| White / Caucasian | 8,862 | 89.1% |
| Two or more Races | 428 | 4.3% |
| Some other Race | 151 | 1.5% |
| Total | 9,943 | 100.0% |
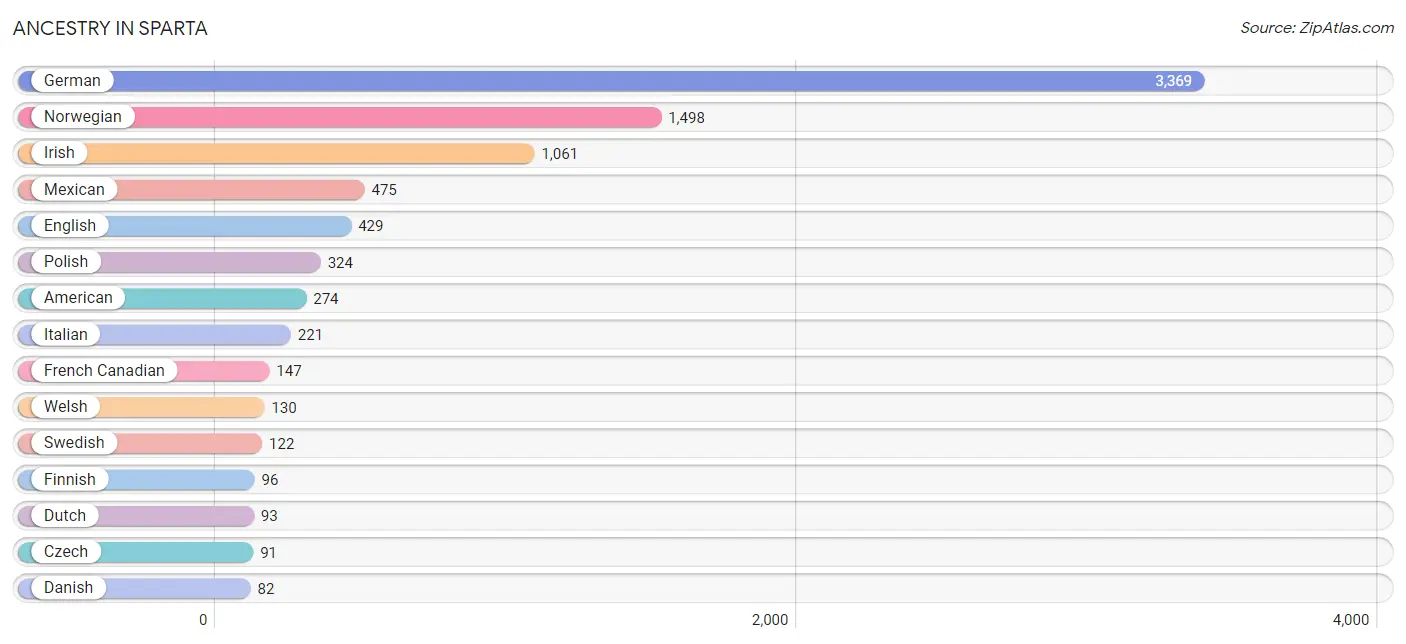
Ancestry in Sparta
The most populous ancestries reported in Sparta are German (3,369 | 33.9%), Norwegian (1,498 | 15.1%), Irish (1,061 | 10.7%), Mexican (475 | 4.8%), and English (429 | 4.3%), together accounting for 68.7% of all Sparta residents.
| Ancestry | # Population | % Population |
| African | 43 | 0.4% |
| American | 274 | 2.8% |
| Austrian | 28 | 0.3% |
| Belgian | 47 | 0.5% |
| Bhutanese | 13 | 0.1% |
| British | 30 | 0.3% |
| Central American Indian | 13 | 0.1% |
| Cherokee | 44 | 0.4% |
| Chippewa | 35 | 0.4% |
| Cuban | 16 | 0.2% |
| Czech | 91 | 0.9% |
| Czechoslovakian | 41 | 0.4% |
| Danish | 82 | 0.8% |
| Dutch | 93 | 0.9% |
| Eastern European | 30 | 0.3% |
| English | 429 | 4.3% |
| European | 59 | 0.6% |
| Finnish | 96 | 1.0% |
| French | 61 | 0.6% |
| French Canadian | 147 | 1.5% |
| German | 3,369 | 33.9% |
| Greek | 12 | 0.1% |
| Hungarian | 24 | 0.2% |
| Irish | 1,061 | 10.7% |
| Italian | 221 | 2.2% |
| Mexican | 475 | 4.8% |
| Mexican American Indian | 13 | 0.1% |
| Norwegian | 1,498 | 15.1% |
| Pakistani | 79 | 0.8% |
| Polish | 324 | 3.3% |
| Puerto Rican | 80 | 0.8% |
| Scotch-Irish | 41 | 0.4% |
| Scottish | 80 | 0.8% |
| Sioux | 5 | 0.1% |
| Subsaharan African | 43 | 0.4% |
| Swedish | 122 | 1.2% |
| Swiss | 48 | 0.5% |
| Welsh | 130 | 1.3% | View All 38 Rows |
Immigrants in Sparta
The most numerous immigrant groups reported in Sparta came from Latin America (113 | 1.1%), Central America (105 | 1.1%), Mexico (99 | 1.0%), Europe (44 | 0.4%), and Northern Europe (25 | 0.3%), together accounting for 3.9% of all Sparta residents.
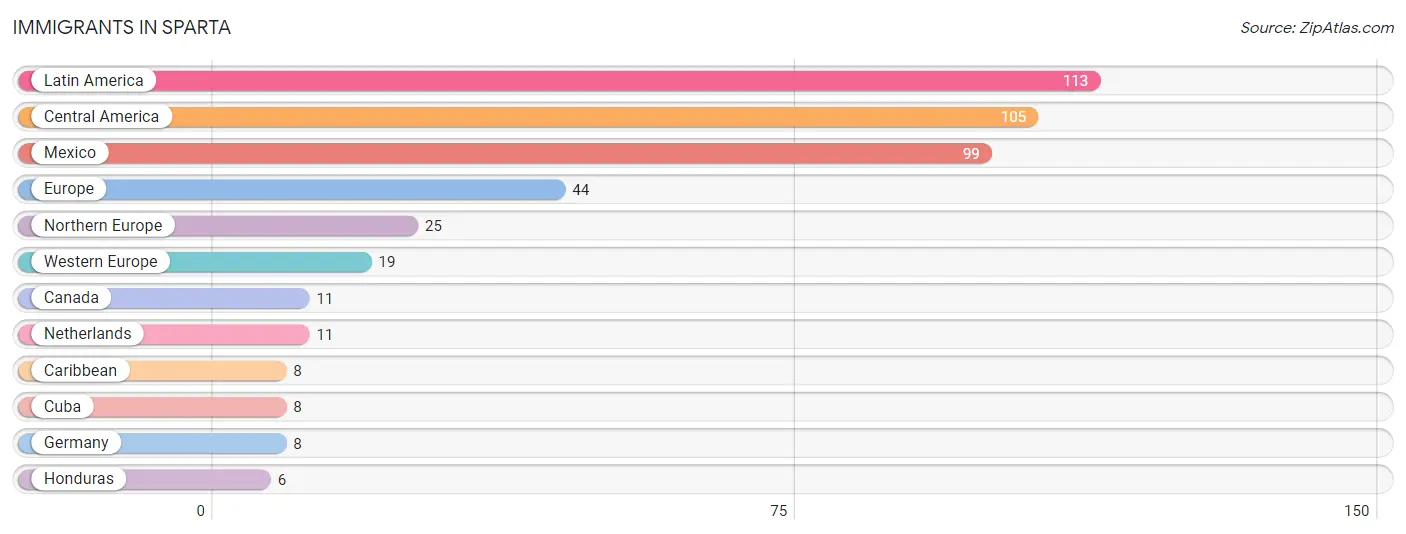
| Immigration Origin | # Population | % Population |
| Canada | 11 | 0.1% |
| Caribbean | 8 | 0.1% |
| Central America | 105 | 1.1% |
| Cuba | 8 | 0.1% |
| Europe | 44 | 0.4% |
| Germany | 8 | 0.1% |
| Honduras | 6 | 0.1% |
| Latin America | 113 | 1.1% |
| Mexico | 99 | 1.0% |
| Netherlands | 11 | 0.1% |
| Northern Europe | 25 | 0.3% |
| Western Europe | 19 | 0.2% | View All 12 Rows |
Sex and Age in Sparta
Sex and Age in Sparta
The most populous age groups in Sparta are 55 to 59 Years (436 | 8.8%) for men and 35 to 39 Years (551 | 11.0%) for women.
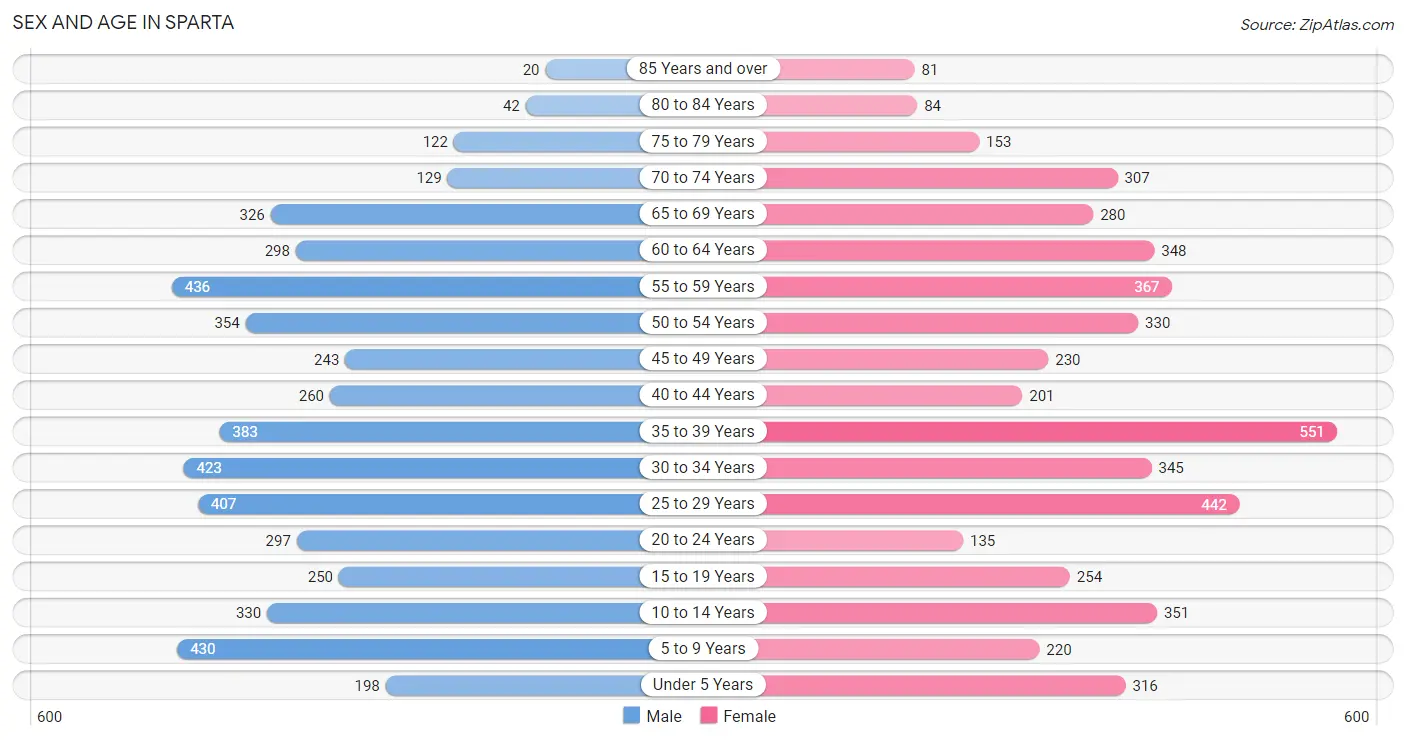
| Age Bracket | Male | Female |
| Under 5 Years | 198 (4.0%) | 316 (6.3%) |
| 5 to 9 Years | 430 (8.7%) | 220 (4.4%) |
| 10 to 14 Years | 330 (6.7%) | 351 (7.0%) |
| 15 to 19 Years | 250 (5.1%) | 254 (5.1%) |
| 20 to 24 Years | 297 (6.0%) | 135 (2.7%) |
| 25 to 29 Years | 407 (8.2%) | 442 (8.8%) |
| 30 to 34 Years | 423 (8.6%) | 345 (6.9%) |
| 35 to 39 Years | 383 (7.7%) | 551 (11.0%) |
| 40 to 44 Years | 260 (5.2%) | 201 (4.0%) |
| 45 to 49 Years | 243 (4.9%) | 230 (4.6%) |
| 50 to 54 Years | 354 (7.1%) | 330 (6.6%) |
| 55 to 59 Years | 436 (8.8%) | 367 (7.3%) |
| 60 to 64 Years | 298 (6.0%) | 348 (7.0%) |
| 65 to 69 Years | 326 (6.6%) | 280 (5.6%) |
| 70 to 74 Years | 129 (2.6%) | 307 (6.1%) |
| 75 to 79 Years | 122 (2.5%) | 153 (3.1%) |
| 80 to 84 Years | 42 (0.9%) | 84 (1.7%) |
| 85 Years and over | 20 (0.4%) | 81 (1.6%) |
| Total | 4,948 (100.0%) | 4,995 (100.0%) |
Families and Households in Sparta
Median Family Size in Sparta
The median family size in Sparta is 3.01 persons per family, with single female/mother families (394 | 17.1%) accounting for the largest median family size of 3.06 persons per family. On the other hand, married-couple families (1,587 | 68.7%) represent the smallest median family size with 3.00 persons per family.
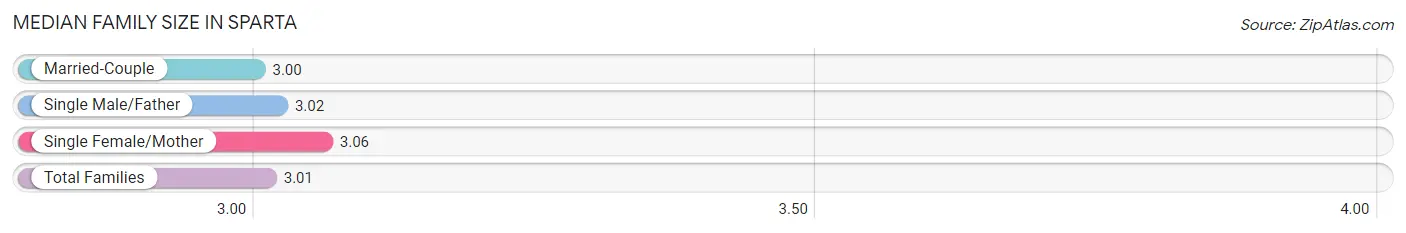
| Family Type | # Families | Family Size |
| Married-Couple | 1,587 (68.7%) | 3.00 |
| Single Male/Father | 328 (14.2%) | 3.02 |
| Single Female/Mother | 394 (17.1%) | 3.06 |
| Total Families | 2,309 (100.0%) | 3.01 |
Median Household Size in Sparta
The median household size in Sparta is 2.30 persons per household, with single male/father households (328 | 7.8%) accounting for the largest median household size of 3.6 persons per household. non-family households (1,905 | 45.2%) represent the smallest median household size with 1.27 persons per household.
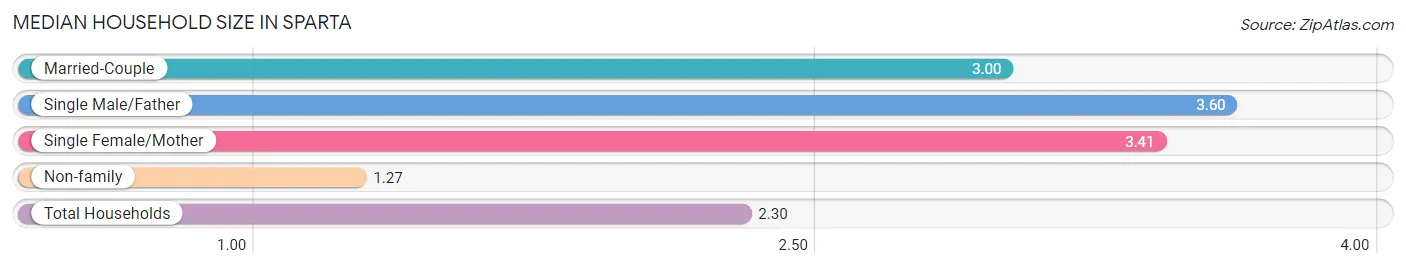
| Household Type | # Households | Household Size |
| Married-Couple | 1,587 (37.7%) | 3.00 |
| Single Male/Father | 328 (7.8%) | 3.60 |
| Single Female/Mother | 394 (9.3%) | 3.41 |
| Non-family | 1,905 (45.2%) | 1.27 |
| Total Households | 4,214 (100.0%) | 2.30 |
Household Size by Marriage Status in Sparta
Out of a total of 4,214 households in Sparta, 2,309 (54.8%) are family households, while 1,905 (45.2%) are nonfamily households. The most numerous type of family households are 2-person households, comprising 1,067, and the most common type of nonfamily households are 1-person households, comprising 1,541.
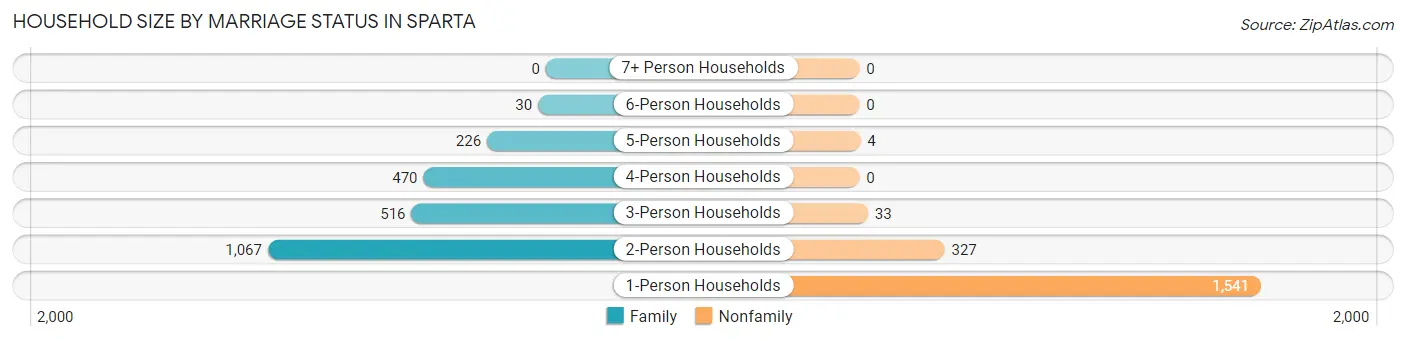
| Household Size | Family Households | Nonfamily Households |
| 1-Person Households | - | 1,541 (36.6%) |
| 2-Person Households | 1,067 (25.3%) | 327 (7.8%) |
| 3-Person Households | 516 (12.2%) | 33 (0.8%) |
| 4-Person Households | 470 (11.2%) | 0 (0.0%) |
| 5-Person Households | 226 (5.4%) | 4 (0.1%) |
| 6-Person Households | 30 (0.7%) | 0 (0.0%) |
| 7+ Person Households | 0 (0.0%) | 0 (0.0%) |
| Total | 2,309 (54.8%) | 1,905 (45.2%) |
Female Fertility in Sparta
Fertility by Age in Sparta
Average fertility rate in Sparta is 44.0 births per 1,000 women. Women in the age bracket of 20 to 34 years have the highest fertility rate with 97.0 births per 1,000 women. Women in the age bracket of 20 to 34 years acount for 89.9% of all women with births.
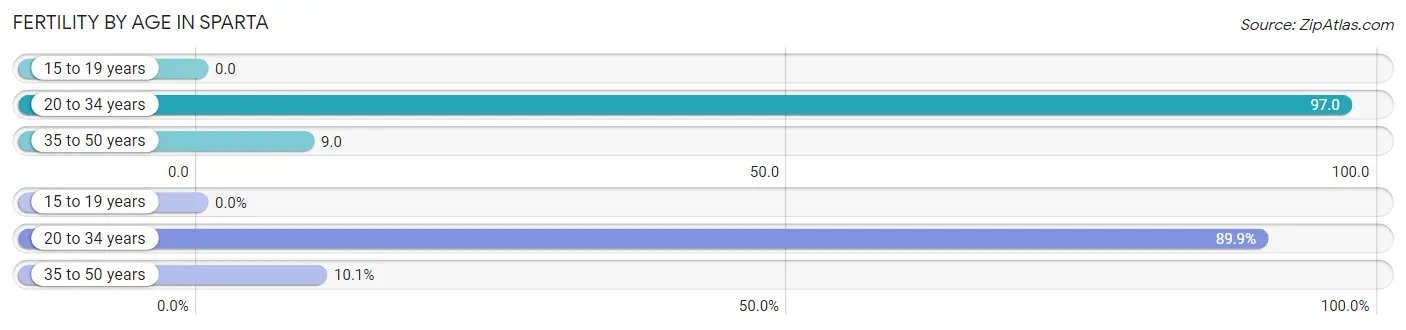
| Age Bracket | Women with Births | Births / 1,000 Women |
| 15 to 19 years | 0 (0.0%) | 0.0 |
| 20 to 34 years | 89 (89.9%) | 97.0 |
| 35 to 50 years | 10 (10.1%) | 9.0 |
| Total | 99 (100.0%) | 44.0 |
Fertility by Age by Marriage Status in Sparta
58.6% of women with births (99) in Sparta are married. The highest percentage of unmarried women with births falls into 20 to 34 years age bracket with 46.1% of them unmarried at the time of birth, while the lowest percentage of unmarried women with births belong to 35 to 50 years age bracket with 0.0% of them unmarried.
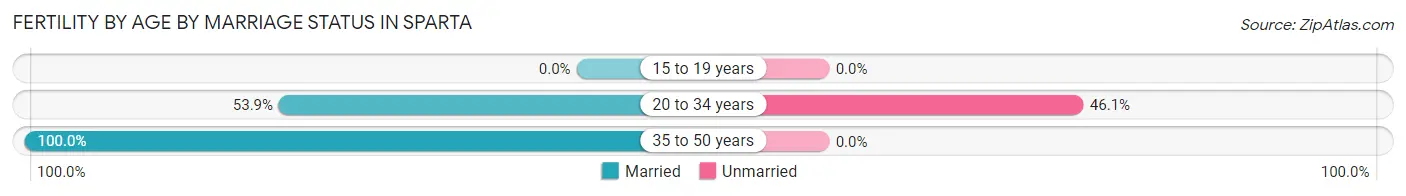
| Age Bracket | Married | Unmarried |
| 15 to 19 years | 0 (0.0%) | 0 (0.0%) |
| 20 to 34 years | 48 (53.9%) | 41 (46.1%) |
| 35 to 50 years | 10 (100.0%) | 0 (0.0%) |
| Total | 58 (58.6%) | 41 (41.4%) |
Fertility by Education in Sparta
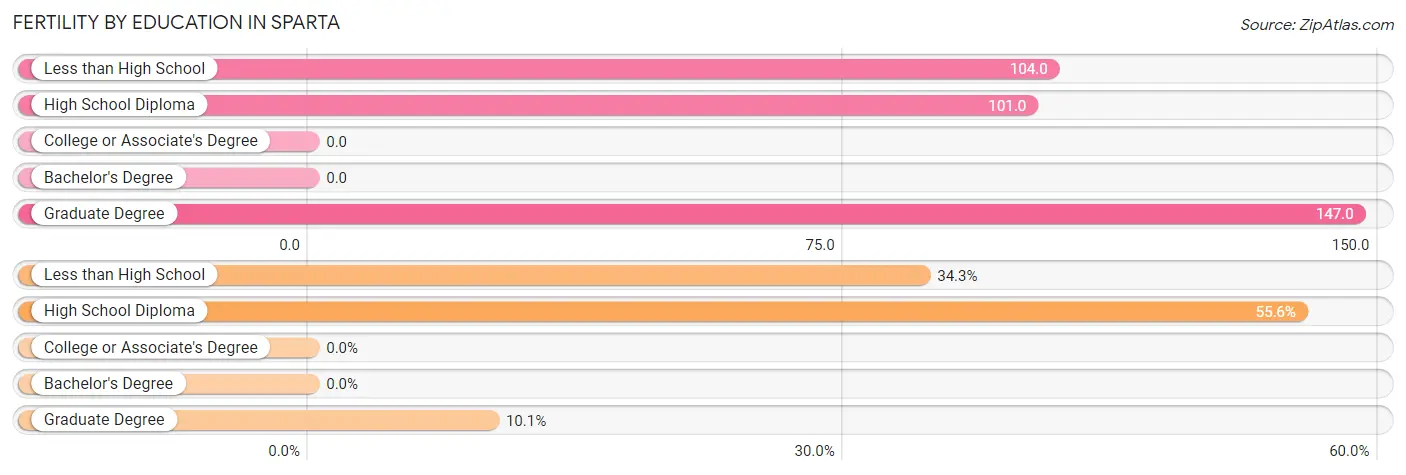
| Educational Attainment | Women with Births | Births / 1,000 Women |
| Less than High School | 34 (34.3%) | 104.0 |
| High School Diploma | 55 (55.6%) | 101.0 |
| College or Associate's Degree | 0 (0.0%) | 0.0 |
| Bachelor's Degree | 0 (0.0%) | 0.0 |
| Graduate Degree | 10 (10.1%) | 147.0 |
| Total | 99 (100.0%) | 44.0 |
Fertility by Education by Marriage Status in Sparta
41.4% of women with births in Sparta are unmarried. Women with the educational attainment of less than high school are most likely to be married with 100.0% of them married at childbirth, while women with the educational attainment of high school diploma are least likely to be married with 74.6% of them unmarried at childbirth.
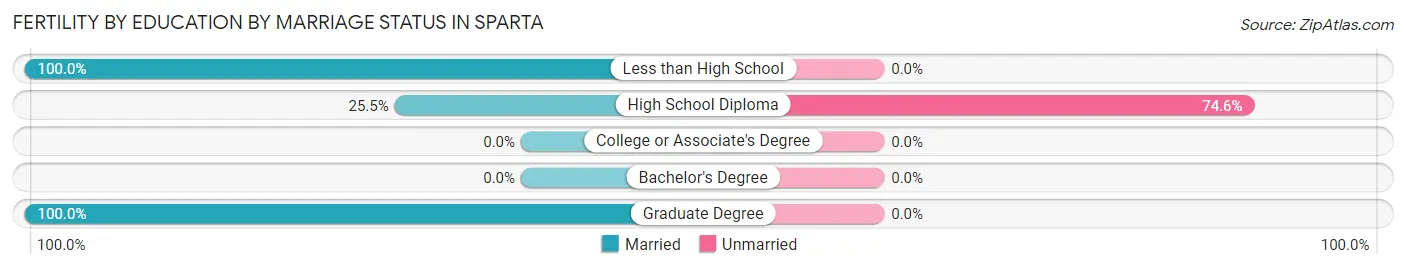
| Educational Attainment | Married | Unmarried |
| Less than High School | 34 (100.0%) | 0 (0.0%) |
| High School Diploma | 14 (25.5%) | 41 (74.6%) |
| College or Associate's Degree | 0 (0.0%) | 0 (0.0%) |
| Bachelor's Degree | 0 (0.0%) | 0 (0.0%) |
| Graduate Degree | 10 (100.0%) | 0 (0.0%) |
| Total | 58 (58.6%) | 41 (41.4%) |
Employment Characteristics in Sparta
Employment by Class of Employer in Sparta
Among the 5,104 employed individuals in Sparta, private company employees (3,629 | 71.1%), local government employees (428 | 8.4%), and not-for-profit organizations (358 | 7.0%) make up the most common classes of employment.
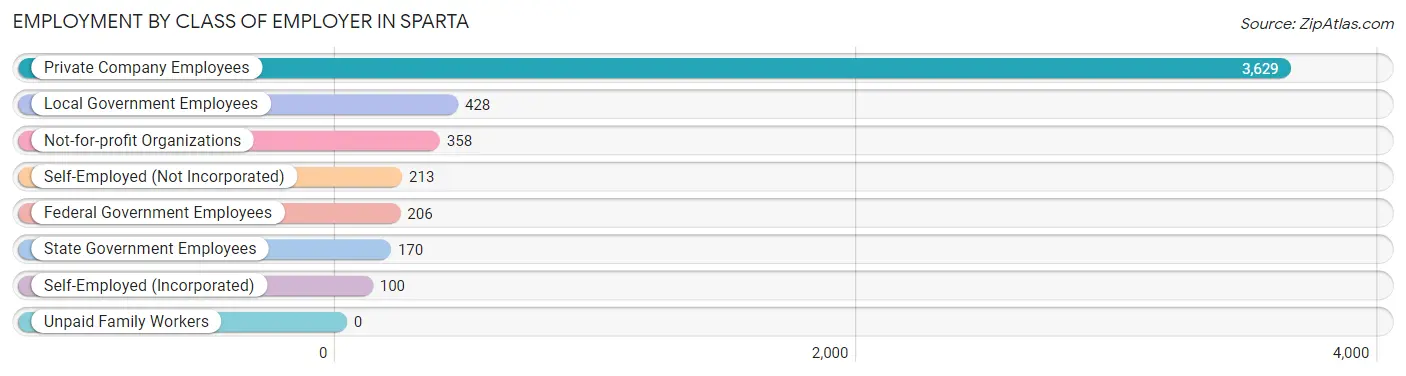
| Employer Class | # Employees | % Employees |
| Private Company Employees | 3,629 | 71.1% |
| Self-Employed (Incorporated) | 100 | 2.0% |
| Self-Employed (Not Incorporated) | 213 | 4.2% |
| Not-for-profit Organizations | 358 | 7.0% |
| Local Government Employees | 428 | 8.4% |
| State Government Employees | 170 | 3.3% |
| Federal Government Employees | 206 | 4.0% |
| Unpaid Family Workers | 0 | 0.0% |
| Total | 5,104 | 100.0% |
Employment Status by Age in Sparta
According to the labor force statistics for Sparta, out of the total population over 16 years of age (8,035), 66.8% or 5,367 individuals are in the labor force, with 3.6% or 193 of them unemployed. The age group with the highest labor force participation rate is 20 to 24 years, with 96.3% or 416 individuals in the labor force. Within the labor force, the 30 to 34 years age range has the highest percentage of unemployed individuals, with 9.4% or 60 of them being unemployed.
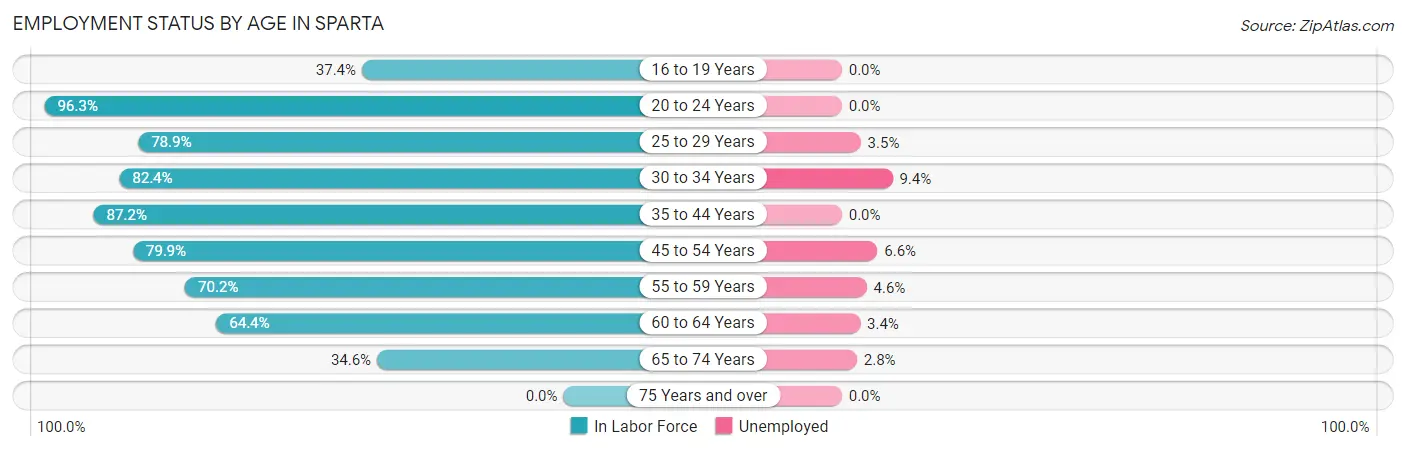
| Age Bracket | In Labor Force | Unemployed |
| 16 to 19 Years | 165 (37.4%) | 0 (0.0%) |
| 20 to 24 Years | 416 (96.3%) | 0 (0.0%) |
| 25 to 29 Years | 670 (78.9%) | 23 (3.5%) |
| 30 to 34 Years | 633 (82.4%) | 60 (9.4%) |
| 35 to 44 Years | 1,216 (87.2%) | 0 (0.0%) |
| 45 to 54 Years | 924 (79.9%) | 61 (6.6%) |
| 55 to 59 Years | 564 (70.2%) | 26 (4.6%) |
| 60 to 64 Years | 416 (64.4%) | 14 (3.4%) |
| 65 to 74 Years | 361 (34.6%) | 10 (2.8%) |
| 75 Years and over | 0 (0.0%) | 0 (0.0%) |
| Total | 5,367 (66.8%) | 193 (3.6%) |
Employment Status by Educational Attainment in Sparta
According to labor force statistics for Sparta, 78.7% of individuals (4,421) out of the total population between 25 and 64 years of age (5,618) are in the labor force, with 4.2% or 186 of them being unemployed. The group with the highest labor force participation rate are those with the educational attainment of college / associate degree, with 89.5% or 1,861 individuals in the labor force. Within the labor force, individuals with bachelor's degree or higher education have the highest percentage of unemployment, with 7.0% or 58 of them being unemployed.
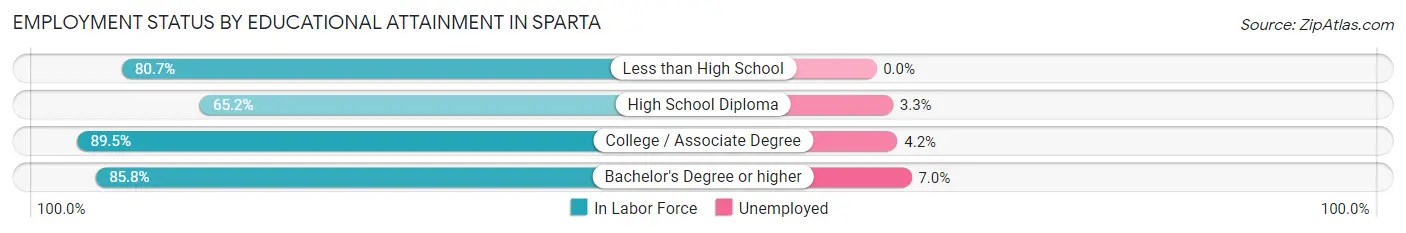
| Educational Attainment | In Labor Force | Unemployed |
| Less than High School | 297 (80.7%) | 0 (0.0%) |
| High School Diploma | 1,438 (65.2%) | 73 (3.3%) |
| College / Associate Degree | 1,861 (89.5%) | 87 (4.2%) |
| Bachelor's Degree or higher | 828 (85.8%) | 68 (7.0%) |
| Total | 4,421 (78.7%) | 236 (4.2%) |
Employment Occupations by Sex in Sparta
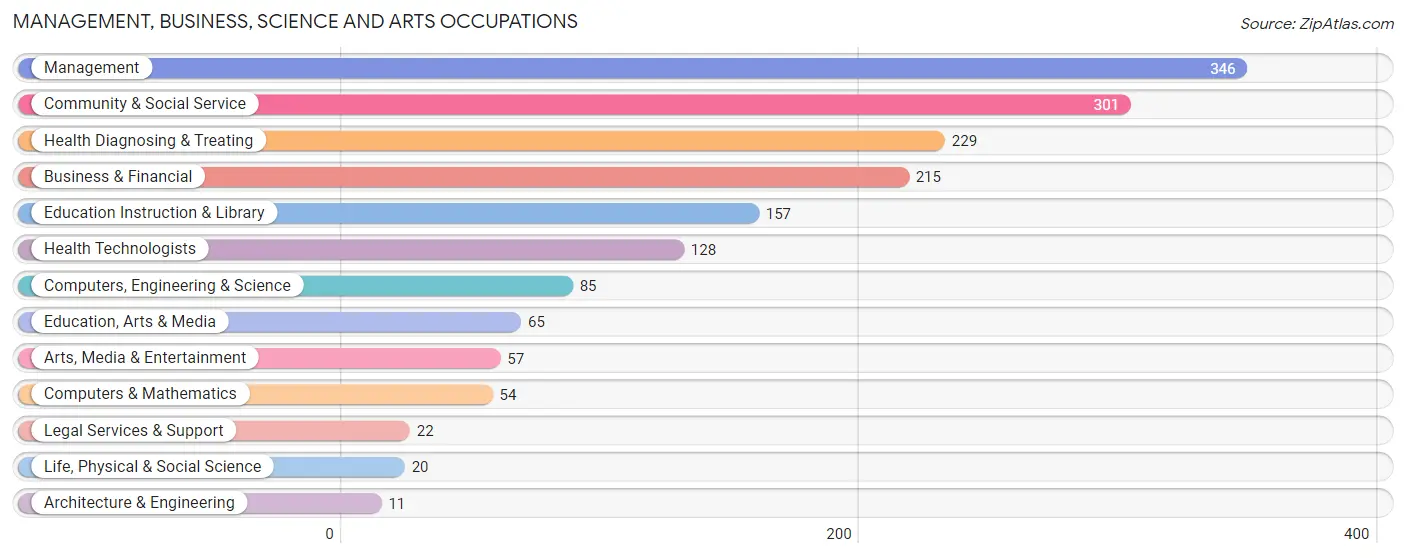
Management, Business, Science and Arts Occupations
The most common Management, Business, Science and Arts occupations in Sparta are Management (346 | 6.7%), Community & Social Service (301 | 5.9%), Health Diagnosing & Treating (229 | 4.5%), Business & Financial (215 | 4.2%), and Education Instruction & Library (157 | 3.1%).
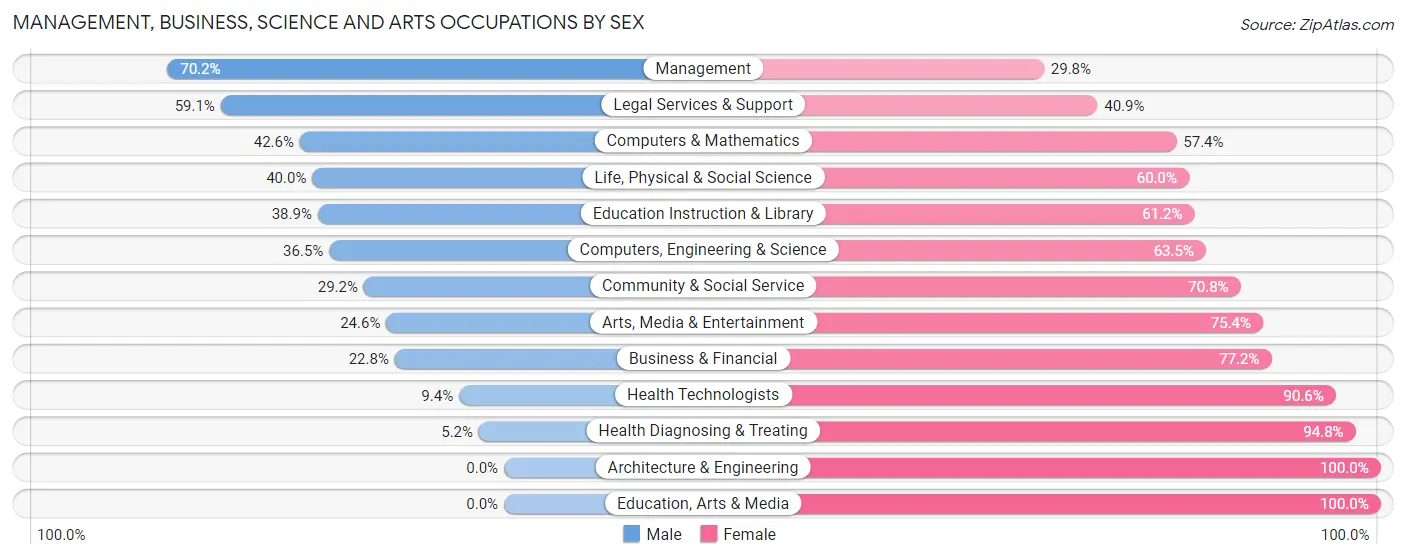
Management, Business, Science and Arts Occupations by Sex
Within the Management, Business, Science and Arts occupations in Sparta, the most male-oriented occupations are Management (70.2%), Legal Services & Support (59.1%), and Computers & Mathematics (42.6%), while the most female-oriented occupations are Architecture & Engineering (100.0%), Education, Arts & Media (100.0%), and Health Diagnosing & Treating (94.8%).
| Occupation | Male | Female |
| Management | 243 (70.2%) | 103 (29.8%) |
| Business & Financial | 49 (22.8%) | 166 (77.2%) |
| Computers, Engineering & Science | 31 (36.5%) | 54 (63.5%) |
| Computers & Mathematics | 23 (42.6%) | 31 (57.4%) |
| Architecture & Engineering | 0 (0.0%) | 11 (100.0%) |
| Life, Physical & Social Science | 8 (40.0%) | 12 (60.0%) |
| Community & Social Service | 88 (29.2%) | 213 (70.8%) |
| Education, Arts & Media | 0 (0.0%) | 65 (100.0%) |
| Legal Services & Support | 13 (59.1%) | 9 (40.9%) |
| Education Instruction & Library | 61 (38.9%) | 96 (61.2%) |
| Arts, Media & Entertainment | 14 (24.6%) | 43 (75.4%) |
| Health Diagnosing & Treating | 12 (5.2%) | 217 (94.8%) |
| Health Technologists | 12 (9.4%) | 116 (90.6%) |
| Total (Category) | 423 (36.0%) | 753 (64.0%) |
| Total (Overall) | 2,664 (51.9%) | 2,470 (48.1%) |
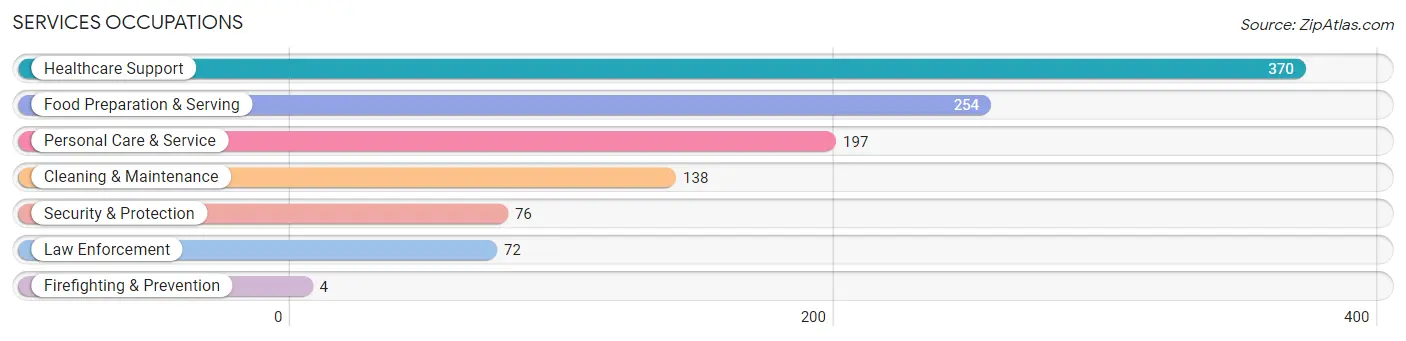
Services Occupations
The most common Services occupations in Sparta are Healthcare Support (370 | 7.2%), Food Preparation & Serving (254 | 5.0%), Personal Care & Service (197 | 3.8%), Cleaning & Maintenance (138 | 2.7%), and Security & Protection (76 | 1.5%).
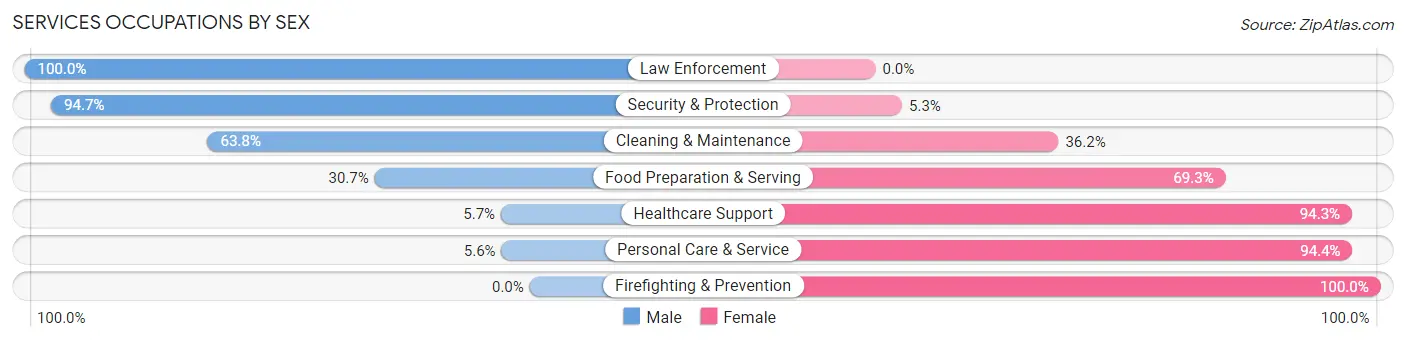
Services Occupations by Sex
Within the Services occupations in Sparta, the most male-oriented occupations are Law Enforcement (100.0%), Security & Protection (94.7%), and Cleaning & Maintenance (63.8%), while the most female-oriented occupations are Firefighting & Prevention (100.0%), Personal Care & Service (94.4%), and Healthcare Support (94.3%).
| Occupation | Male | Female |
| Healthcare Support | 21 (5.7%) | 349 (94.3%) |
| Security & Protection | 72 (94.7%) | 4 (5.3%) |
| Firefighting & Prevention | 0 (0.0%) | 4 (100.0%) |
| Law Enforcement | 72 (100.0%) | 0 (0.0%) |
| Food Preparation & Serving | 78 (30.7%) | 176 (69.3%) |
| Cleaning & Maintenance | 88 (63.8%) | 50 (36.2%) |
| Personal Care & Service | 11 (5.6%) | 186 (94.4%) |
| Total (Category) | 270 (26.1%) | 765 (73.9%) |
| Total (Overall) | 2,664 (51.9%) | 2,470 (48.1%) |
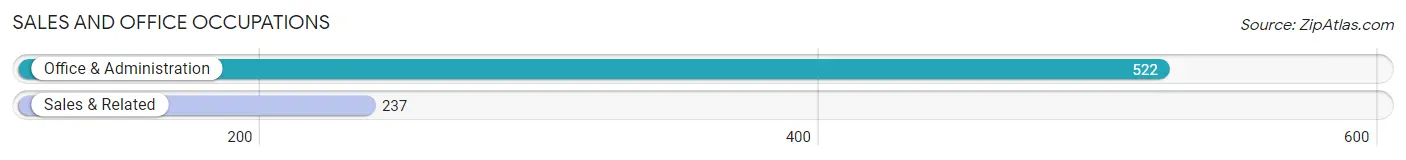
Sales and Office Occupations
The most common Sales and Office occupations in Sparta are Office & Administration (522 | 10.2%), and Sales & Related (237 | 4.6%).
Sales and Office Occupations by Sex

| Occupation | Male | Female |
| Sales & Related | 155 (65.4%) | 82 (34.6%) |
| Office & Administration | 73 (14.0%) | 449 (86.0%) |
| Total (Category) | 228 (30.0%) | 531 (70.0%) |
| Total (Overall) | 2,664 (51.9%) | 2,470 (48.1%) |
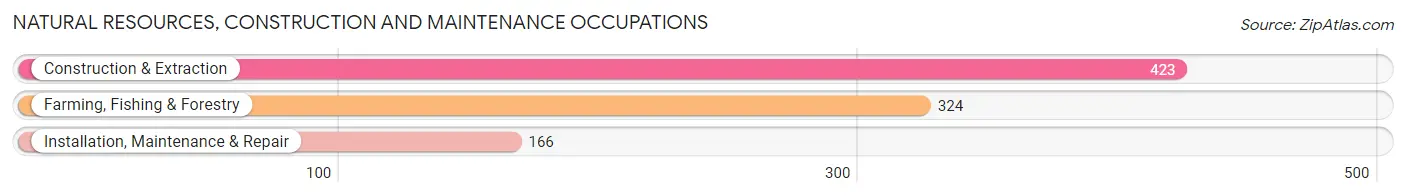
Natural Resources, Construction and Maintenance Occupations
The most common Natural Resources, Construction and Maintenance occupations in Sparta are Construction & Extraction (423 | 8.2%), Farming, Fishing & Forestry (324 | 6.3%), and Installation, Maintenance & Repair (166 | 3.2%).
Natural Resources, Construction and Maintenance Occupations by Sex

| Occupation | Male | Female |
| Farming, Fishing & Forestry | 169 (52.2%) | 155 (47.8%) |
| Construction & Extraction | 423 (100.0%) | 0 (0.0%) |
| Installation, Maintenance & Repair | 166 (100.0%) | 0 (0.0%) |
| Total (Category) | 758 (83.0%) | 155 (17.0%) |
| Total (Overall) | 2,664 (51.9%) | 2,470 (48.1%) |
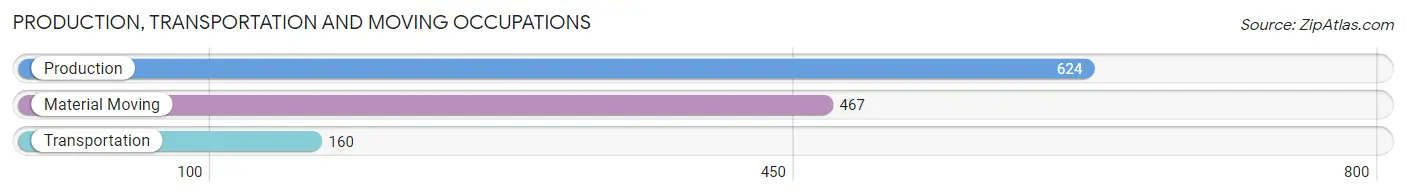
Production, Transportation and Moving Occupations
The most common Production, Transportation and Moving occupations in Sparta are Production (624 | 12.1%), Material Moving (467 | 9.1%), and Transportation (160 | 3.1%).
Production, Transportation and Moving Occupations by Sex
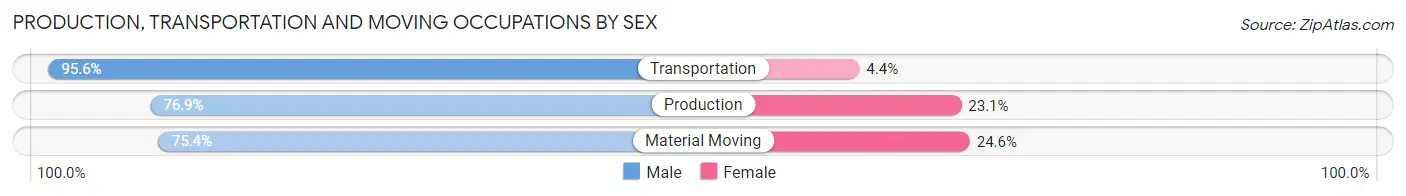
| Occupation | Male | Female |
| Production | 480 (76.9%) | 144 (23.1%) |
| Transportation | 153 (95.6%) | 7 (4.4%) |
| Material Moving | 352 (75.4%) | 115 (24.6%) |
| Total (Category) | 985 (78.7%) | 266 (21.3%) |
| Total (Overall) | 2,664 (51.9%) | 2,470 (48.1%) |
Employment Industries by Sex in Sparta
Employment Industries in Sparta
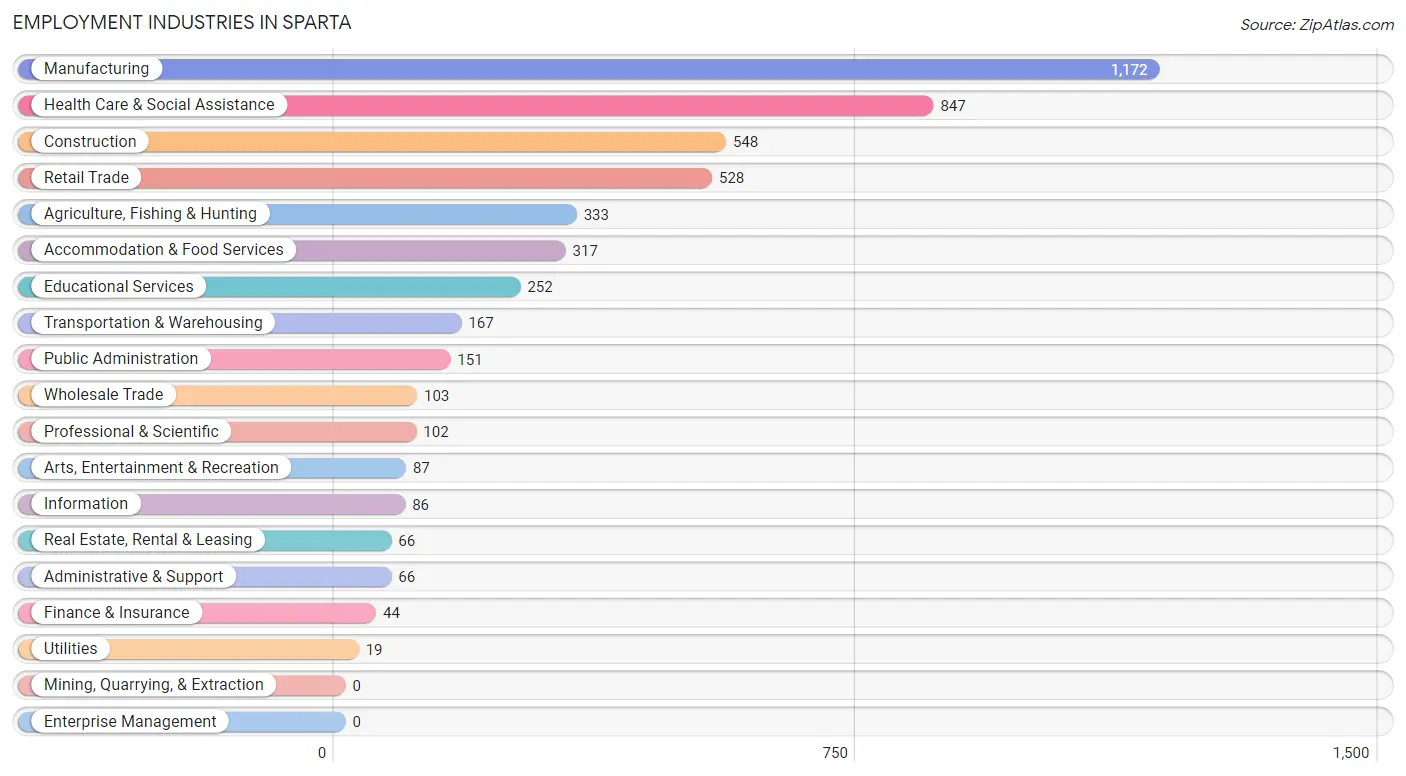
The major employment industries in Sparta include Manufacturing (1,172 | 22.8%), Health Care & Social Assistance (847 | 16.5%), Construction (548 | 10.7%), Retail Trade (528 | 10.3%), and Agriculture, Fishing & Hunting (333 | 6.5%).
Employment Industries by Sex in Sparta
The Sparta industries that see more men than women are Construction (100.0%), Utilities (100.0%), and Administrative & Support (100.0%), whereas the industries that tend to have a higher number of women are Health Care & Social Assistance (91.5%), Information (81.4%), and Professional & Scientific (77.4%).
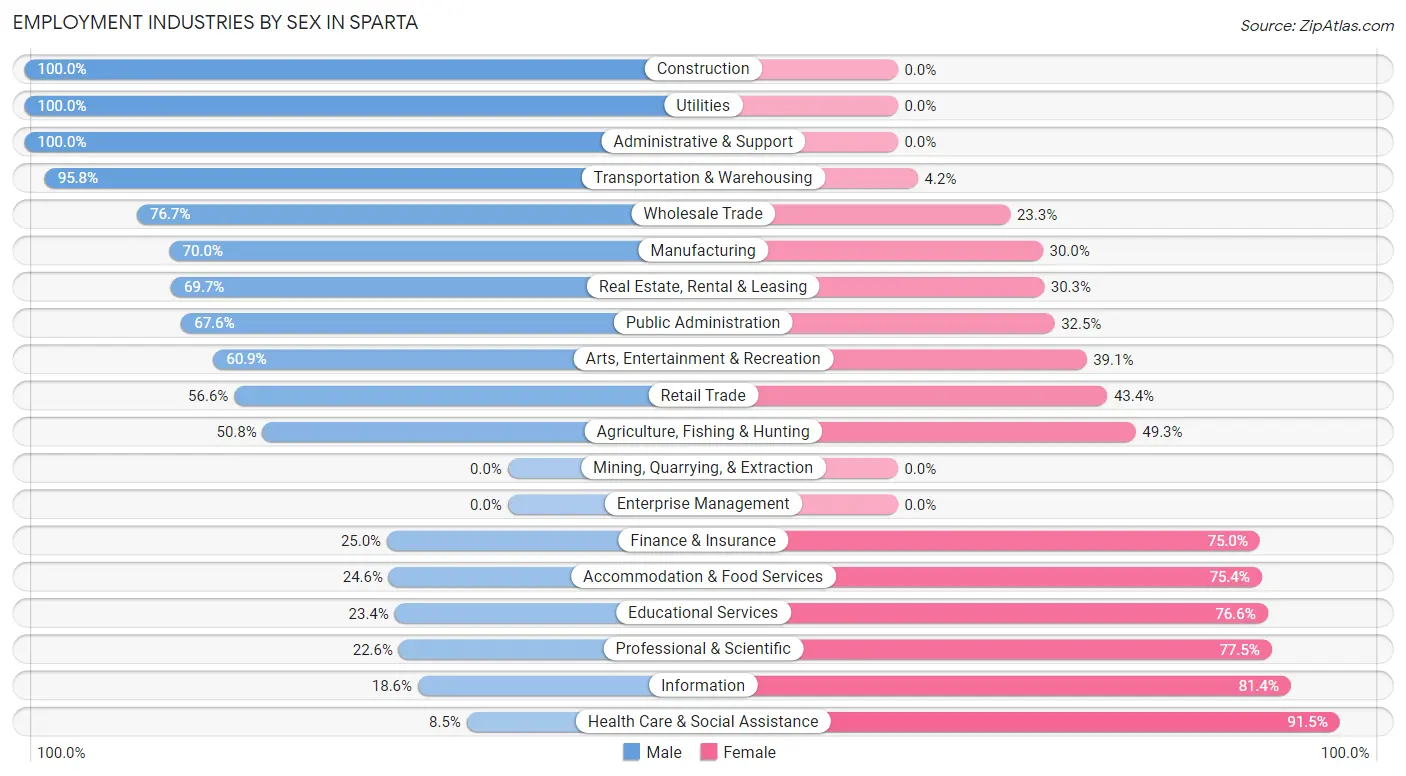
| Industry | Male | Female |
| Agriculture, Fishing & Hunting | 169 (50.7%) | 164 (49.2%) |
| Mining, Quarrying, & Extraction | 0 (0.0%) | 0 (0.0%) |
| Construction | 548 (100.0%) | 0 (0.0%) |
| Manufacturing | 820 (70.0%) | 352 (30.0%) |
| Wholesale Trade | 79 (76.7%) | 24 (23.3%) |
| Retail Trade | 299 (56.6%) | 229 (43.4%) |
| Transportation & Warehousing | 160 (95.8%) | 7 (4.2%) |
| Utilities | 19 (100.0%) | 0 (0.0%) |
| Information | 16 (18.6%) | 70 (81.4%) |
| Finance & Insurance | 11 (25.0%) | 33 (75.0%) |
| Real Estate, Rental & Leasing | 46 (69.7%) | 20 (30.3%) |
| Professional & Scientific | 23 (22.6%) | 79 (77.4%) |
| Enterprise Management | 0 (0.0%) | 0 (0.0%) |
| Administrative & Support | 66 (100.0%) | 0 (0.0%) |
| Educational Services | 59 (23.4%) | 193 (76.6%) |
| Health Care & Social Assistance | 72 (8.5%) | 775 (91.5%) |
| Arts, Entertainment & Recreation | 53 (60.9%) | 34 (39.1%) |
| Accommodation & Food Services | 78 (24.6%) | 239 (75.4%) |
| Public Administration | 102 (67.5%) | 49 (32.5%) |
| Total | 2,664 (51.9%) | 2,470 (48.1%) |
Education in Sparta
School Enrollment in Sparta
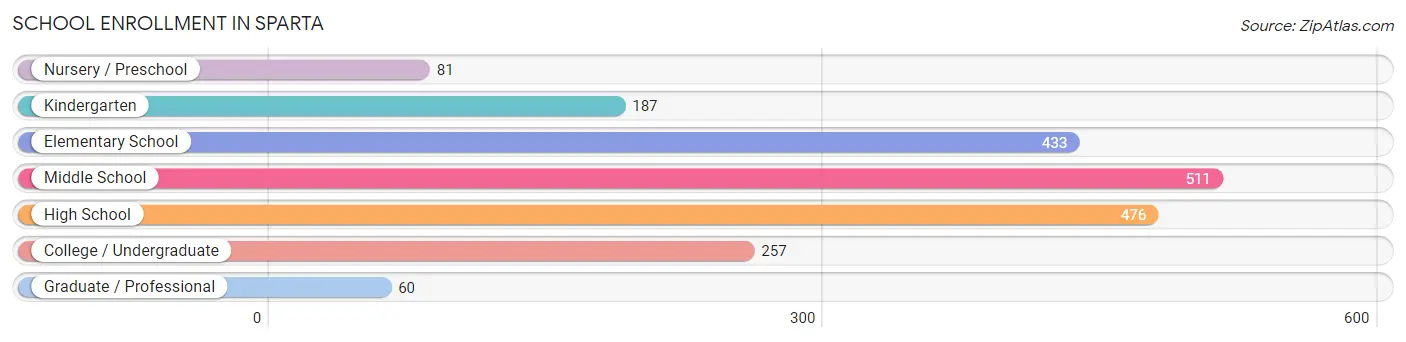
The most common levels of schooling among the 2,005 students in Sparta are middle school (511 | 25.5%), high school (476 | 23.7%), and elementary school (433 | 21.6%).
| School Level | # Students | % Students |
| Nursery / Preschool | 81 | 4.0% |
| Kindergarten | 187 | 9.3% |
| Elementary School | 433 | 21.6% |
| Middle School | 511 | 25.5% |
| High School | 476 | 23.7% |
| College / Undergraduate | 257 | 12.8% |
| Graduate / Professional | 60 | 3.0% |
| Total | 2,005 | 100.0% |
School Enrollment by Age by Funding Source in Sparta
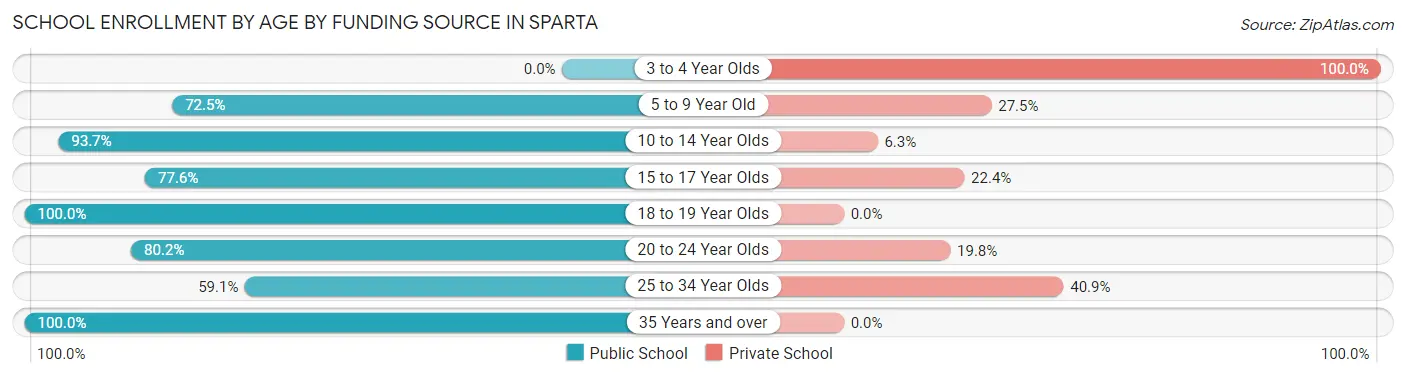
Out of a total of 2,005 students who are enrolled in schools in Sparta, 371 (18.5%) attend a private institution, while the remaining 1,634 (81.5%) are enrolled in public schools. The age group of 3 to 4 year olds has the highest likelihood of being enrolled in private schools, with 28 (100.0% in the age bracket) enrolled. Conversely, the age group of 18 to 19 year olds has the lowest likelihood of being enrolled in a private school, with 122 (100.0% in the age bracket) attending a public institution.
| Age Bracket | Public School | Private School |
| 3 to 4 Year Olds | 0 (0.0%) | 28 (100.0%) |
| 5 to 9 Year Old | 443 (72.5%) | 168 (27.5%) |
| 10 to 14 Year Olds | 550 (93.7%) | 37 (6.3%) |
| 15 to 17 Year Olds | 273 (77.6%) | 79 (22.4%) |
| 18 to 19 Year Olds | 122 (100.0%) | 0 (0.0%) |
| 20 to 24 Year Olds | 93 (80.2%) | 23 (19.8%) |
| 25 to 34 Year Olds | 52 (59.1%) | 36 (40.9%) |
| 35 Years and over | 101 (100.0%) | 0 (0.0%) |
| Total | 1,634 (81.5%) | 371 (18.5%) |
Educational Attainment by Field of Study in Sparta
Business (324 | 26.9%), arts & humanities (201 | 16.7%), education (171 | 14.2%), science & technology (161 | 13.4%), and communications (59 | 4.9%) are the most common fields of study among 1,206 individuals in Sparta who have obtained a bachelor's degree or higher.
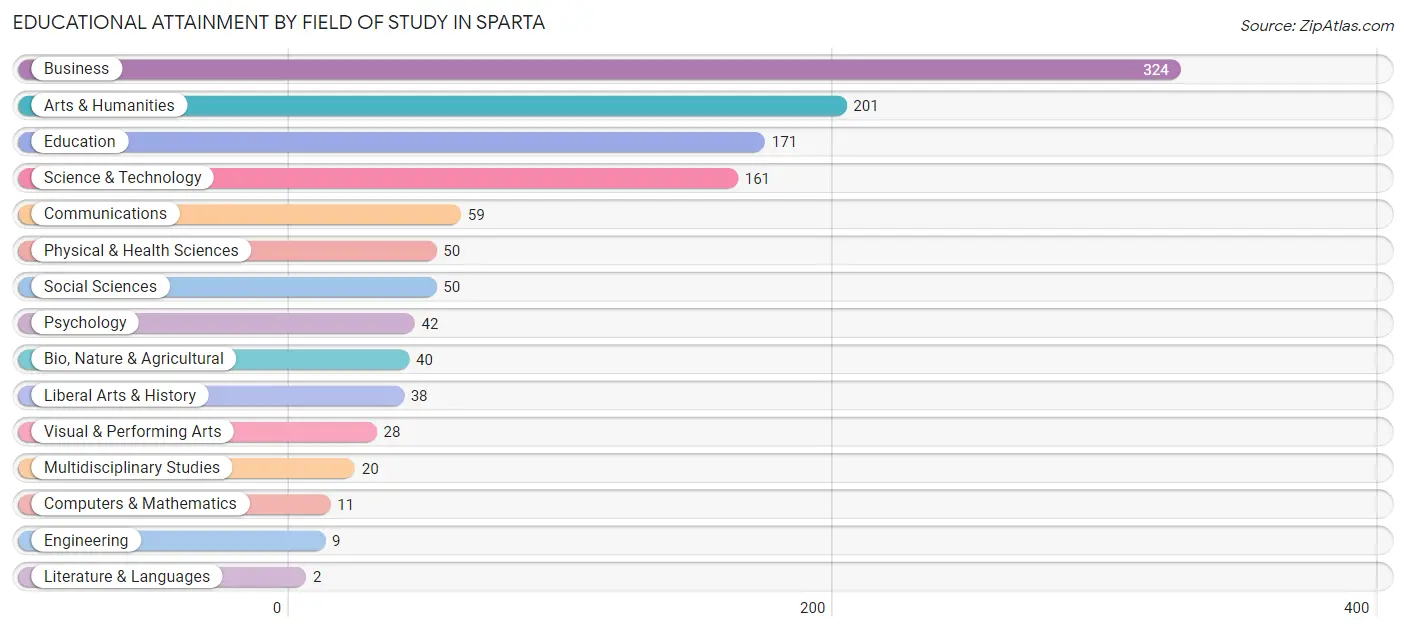
| Field of Study | # Graduates | % Graduates |
| Computers & Mathematics | 11 | 0.9% |
| Bio, Nature & Agricultural | 40 | 3.3% |
| Physical & Health Sciences | 50 | 4.2% |
| Psychology | 42 | 3.5% |
| Social Sciences | 50 | 4.2% |
| Engineering | 9 | 0.7% |
| Multidisciplinary Studies | 20 | 1.7% |
| Science & Technology | 161 | 13.4% |
| Business | 324 | 26.9% |
| Education | 171 | 14.2% |
| Literature & Languages | 2 | 0.2% |
| Liberal Arts & History | 38 | 3.2% |
| Visual & Performing Arts | 28 | 2.3% |
| Communications | 59 | 4.9% |
| Arts & Humanities | 201 | 16.7% |
| Total | 1,206 | 100.0% |
Transportation & Commute in Sparta
Vehicle Availability by Sex in Sparta
The most prevalent vehicle ownership categories in Sparta are males with 2 vehicles (1,352, accounting for 51.3%) and females with 2 vehicles (1,068, making up 54.7%).
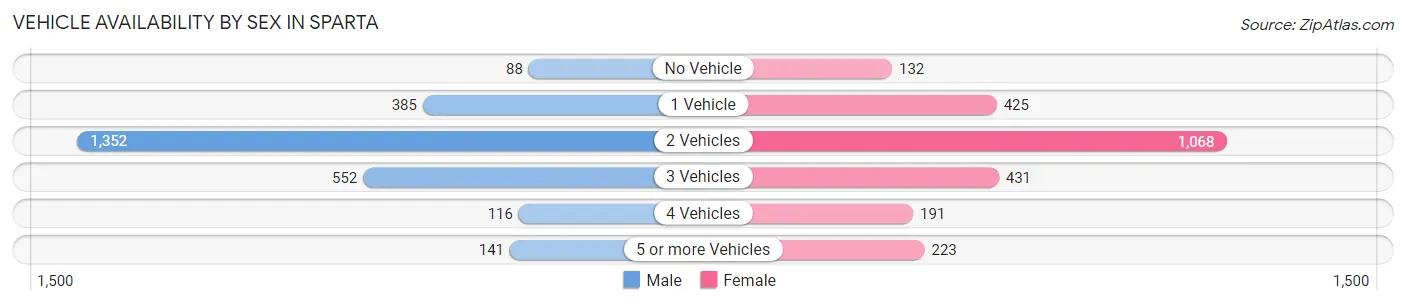
| Vehicles Available | Male | Female |
| No Vehicle | 88 (3.3%) | 132 (5.3%) |
| 1 Vehicle | 385 (14.6%) | 425 (17.2%) |
| 2 Vehicles | 1,352 (51.3%) | 1,068 (43.2%) |
| 3 Vehicles | 552 (21.0%) | 431 (17.4%) |
| 4 Vehicles | 116 (4.4%) | 191 (7.7%) |
| 5 or more Vehicles | 141 (5.3%) | 223 (9.0%) |
| Total | 2,634 (100.0%) | 2,470 (100.0%) |
Commute Time in Sparta
The most frequently occuring commute durations in Sparta are 5 to 9 minutes (1,264 commuters, 27.1%), 30 to 34 minutes (595 commuters, 12.7%), and 10 to 14 minutes (593 commuters, 12.7%).
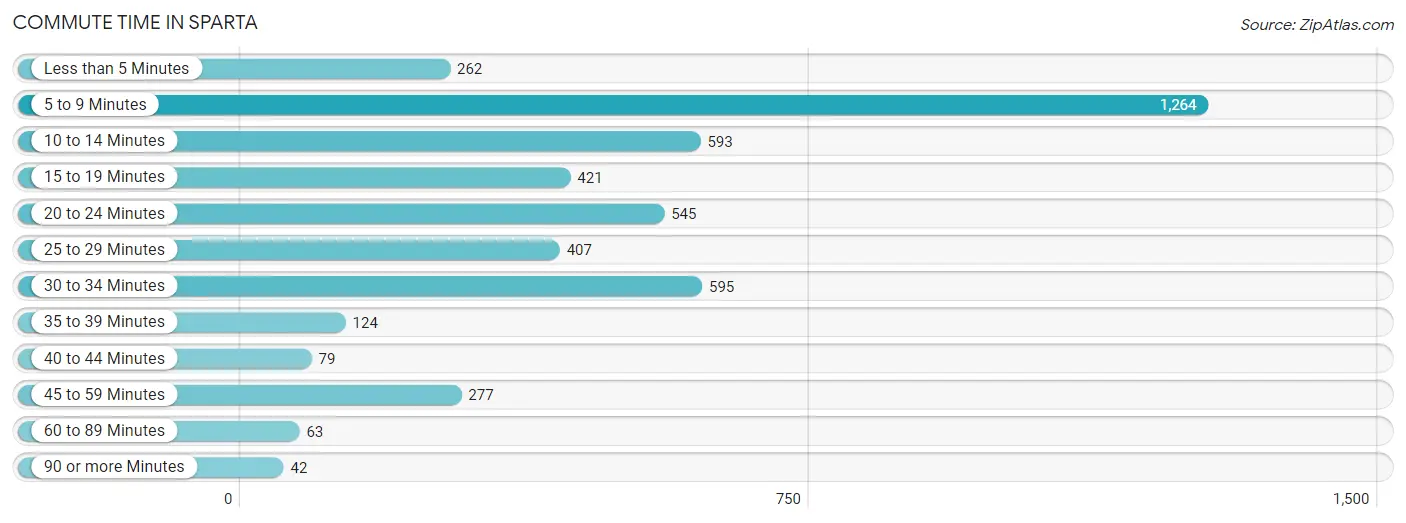
| Commute Time | # Commuters | % Commuters |
| Less than 5 Minutes | 262 | 5.6% |
| 5 to 9 Minutes | 1,264 | 27.1% |
| 10 to 14 Minutes | 593 | 12.7% |
| 15 to 19 Minutes | 421 | 9.0% |
| 20 to 24 Minutes | 545 | 11.7% |
| 25 to 29 Minutes | 407 | 8.7% |
| 30 to 34 Minutes | 595 | 12.7% |
| 35 to 39 Minutes | 124 | 2.6% |
| 40 to 44 Minutes | 79 | 1.7% |
| 45 to 59 Minutes | 277 | 5.9% |
| 60 to 89 Minutes | 63 | 1.3% |
| 90 or more Minutes | 42 | 0.9% |
Commute Time by Sex in Sparta
The most common commute times in Sparta are 5 to 9 minutes (715 commuters, 30.0%) for males and 5 to 9 minutes (549 commuters, 24.0%) for females.
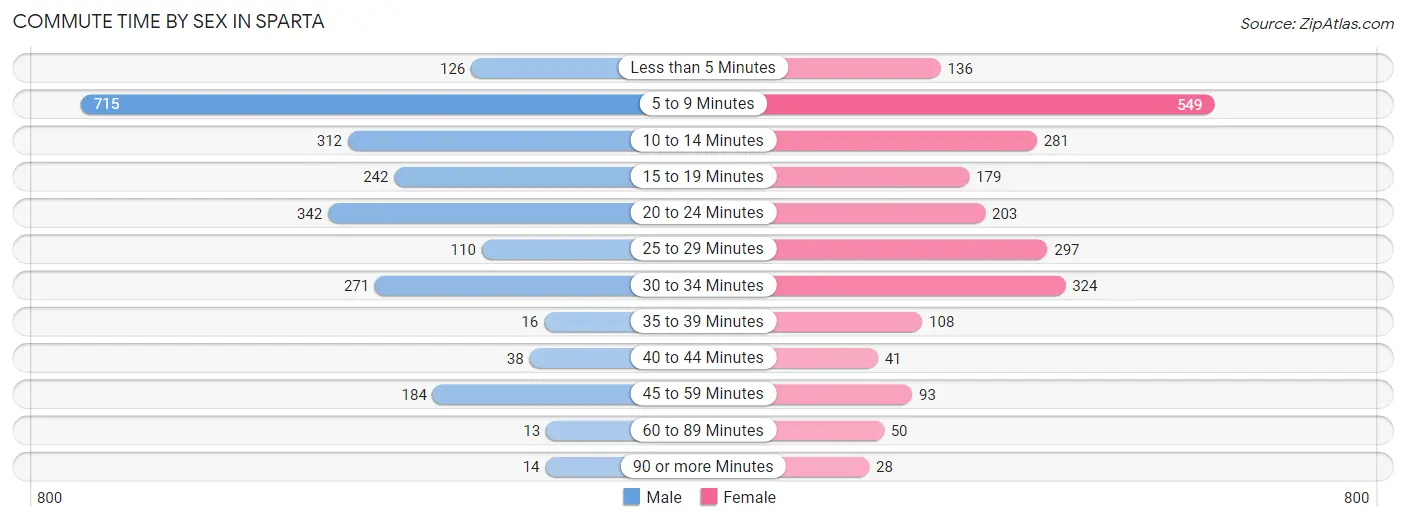
| Commute Time | Male | Female |
| Less than 5 Minutes | 126 (5.3%) | 136 (5.9%) |
| 5 to 9 Minutes | 715 (30.0%) | 549 (24.0%) |
| 10 to 14 Minutes | 312 (13.1%) | 281 (12.3%) |
| 15 to 19 Minutes | 242 (10.2%) | 179 (7.8%) |
| 20 to 24 Minutes | 342 (14.3%) | 203 (8.9%) |
| 25 to 29 Minutes | 110 (4.6%) | 297 (13.0%) |
| 30 to 34 Minutes | 271 (11.4%) | 324 (14.1%) |
| 35 to 39 Minutes | 16 (0.7%) | 108 (4.7%) |
| 40 to 44 Minutes | 38 (1.6%) | 41 (1.8%) |
| 45 to 59 Minutes | 184 (7.7%) | 93 (4.1%) |
| 60 to 89 Minutes | 13 (0.5%) | 50 (2.2%) |
| 90 or more Minutes | 14 (0.6%) | 28 (1.2%) |
Time of Departure to Work by Sex in Sparta
The most frequent times of departure to work in Sparta are 12:00 AM to 4:59 AM (363, 15.2%) for males and 7:00 AM to 7:29 AM (547, 23.9%) for females.
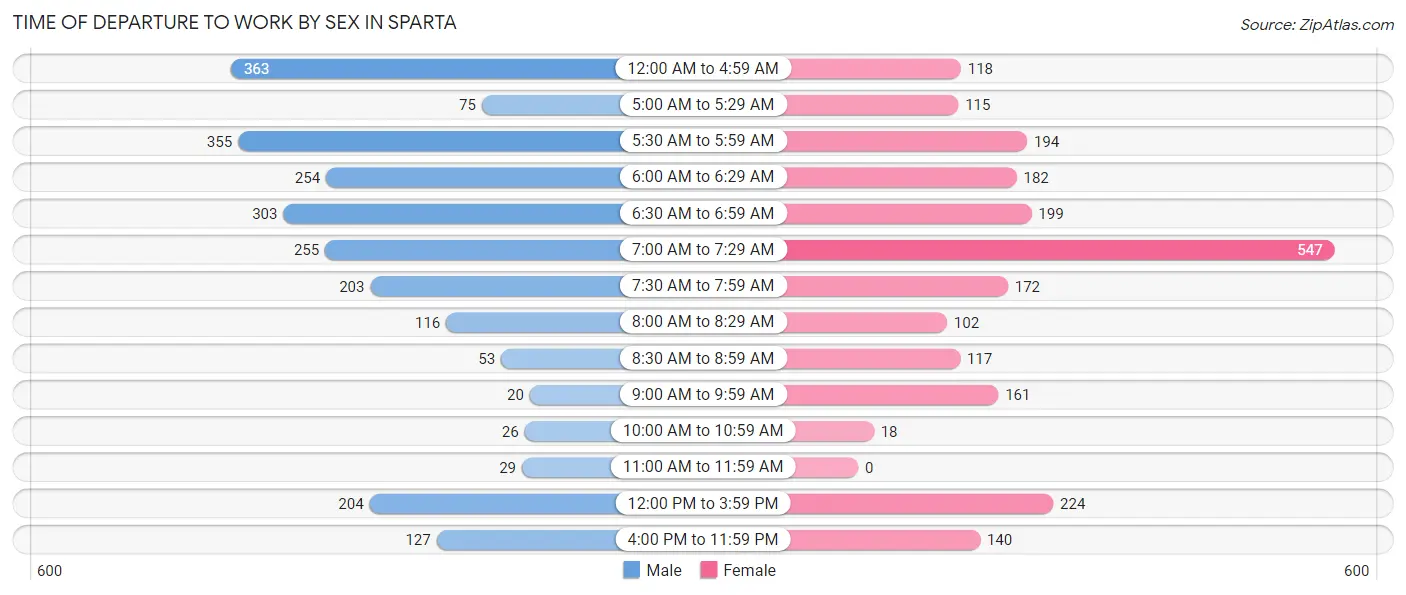
| Time of Departure | Male | Female |
| 12:00 AM to 4:59 AM | 363 (15.2%) | 118 (5.2%) |
| 5:00 AM to 5:29 AM | 75 (3.2%) | 115 (5.0%) |
| 5:30 AM to 5:59 AM | 355 (14.9%) | 194 (8.5%) |
| 6:00 AM to 6:29 AM | 254 (10.7%) | 182 (8.0%) |
| 6:30 AM to 6:59 AM | 303 (12.7%) | 199 (8.7%) |
| 7:00 AM to 7:29 AM | 255 (10.7%) | 547 (23.9%) |
| 7:30 AM to 7:59 AM | 203 (8.5%) | 172 (7.5%) |
| 8:00 AM to 8:29 AM | 116 (4.9%) | 102 (4.5%) |
| 8:30 AM to 8:59 AM | 53 (2.2%) | 117 (5.1%) |
| 9:00 AM to 9:59 AM | 20 (0.8%) | 161 (7.0%) |
| 10:00 AM to 10:59 AM | 26 (1.1%) | 18 (0.8%) |
| 11:00 AM to 11:59 AM | 29 (1.2%) | 0 (0.0%) |
| 12:00 PM to 3:59 PM | 204 (8.6%) | 224 (9.8%) |
| 4:00 PM to 11:59 PM | 127 (5.3%) | 140 (6.1%) |
| Total | 2,383 (100.0%) | 2,289 (100.0%) |
Housing Occupancy in Sparta
Occupancy by Ownership in Sparta
Of the total 4,214 dwellings in Sparta, owner-occupied units account for 2,605 (61.8%), while renter-occupied units make up 1,609 (38.2%).
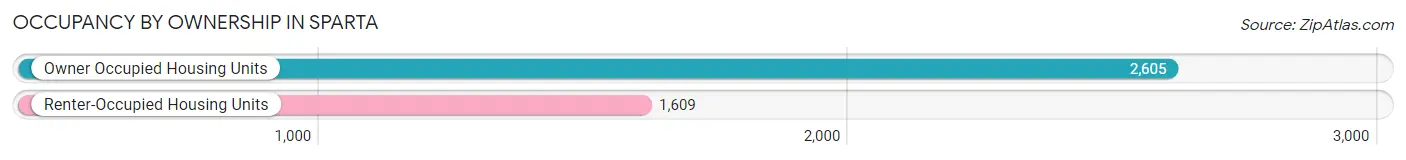
| Occupancy | # Housing Units | % Housing Units |
| Owner Occupied Housing Units | 2,605 | 61.8% |
| Renter-Occupied Housing Units | 1,609 | 38.2% |
| Total Occupied Housing Units | 4,214 | 100.0% |
Occupancy by Household Size in Sparta
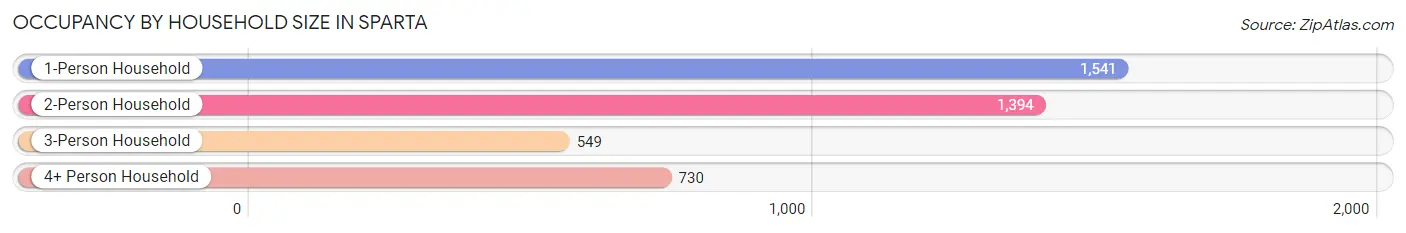
| Household Size | # Housing Units | % Housing Units |
| 1-Person Household | 1,541 | 36.6% |
| 2-Person Household | 1,394 | 33.1% |
| 3-Person Household | 549 | 13.0% |
| 4+ Person Household | 730 | 17.3% |
| Total Housing Units | 4,214 | 100.0% |
Occupancy by Ownership by Household Size in Sparta
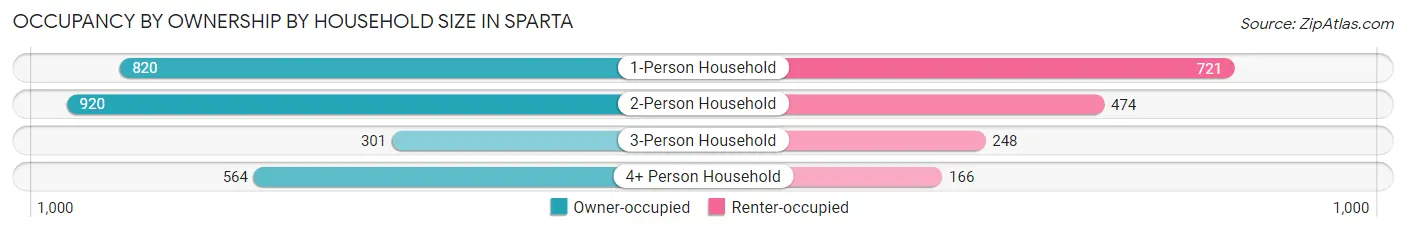
| Household Size | Owner-occupied | Renter-occupied |
| 1-Person Household | 820 (53.2%) | 721 (46.8%) |
| 2-Person Household | 920 (66.0%) | 474 (34.0%) |
| 3-Person Household | 301 (54.8%) | 248 (45.2%) |
| 4+ Person Household | 564 (77.3%) | 166 (22.7%) |
| Total Housing Units | 2,605 (61.8%) | 1,609 (38.2%) |
Occupancy by Educational Attainment in Sparta
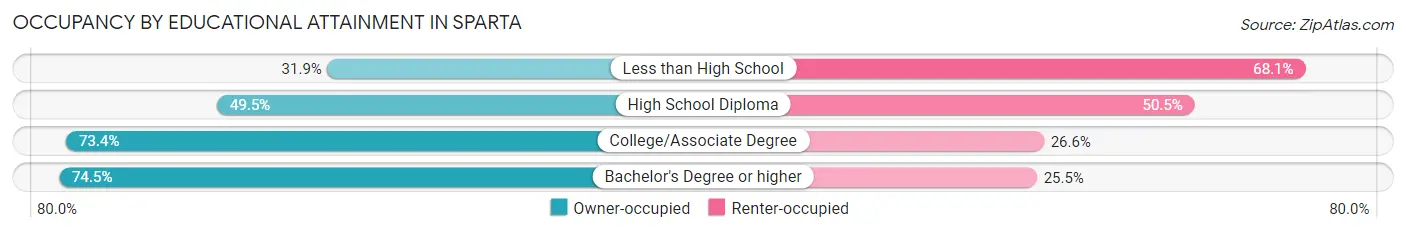
| Household Size | Owner-occupied | Renter-occupied |
| Less than High School | 91 (31.9%) | 194 (68.1%) |
| High School Diploma | 782 (49.5%) | 798 (50.5%) |
| College/Associate Degree | 1,249 (73.4%) | 452 (26.6%) |
| Bachelor's Degree or higher | 483 (74.5%) | 165 (25.5%) |
Occupancy by Age of Householder in Sparta
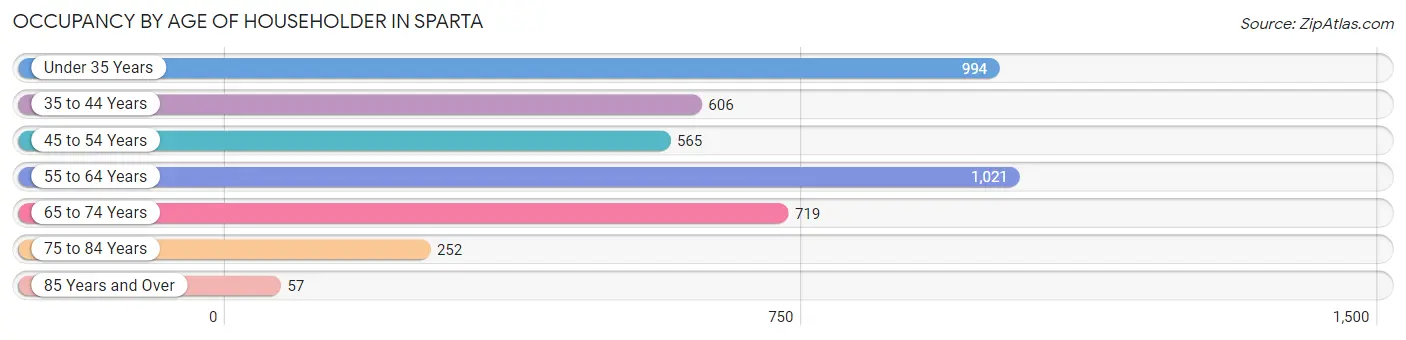
| Age Bracket | # Households | % Households |
| Under 35 Years | 994 | 23.6% |
| 35 to 44 Years | 606 | 14.4% |
| 45 to 54 Years | 565 | 13.4% |
| 55 to 64 Years | 1,021 | 24.2% |
| 65 to 74 Years | 719 | 17.1% |
| 75 to 84 Years | 252 | 6.0% |
| 85 Years and Over | 57 | 1.3% |
| Total | 4,214 | 100.0% |
Housing Finances in Sparta
Median Income by Occupancy in Sparta
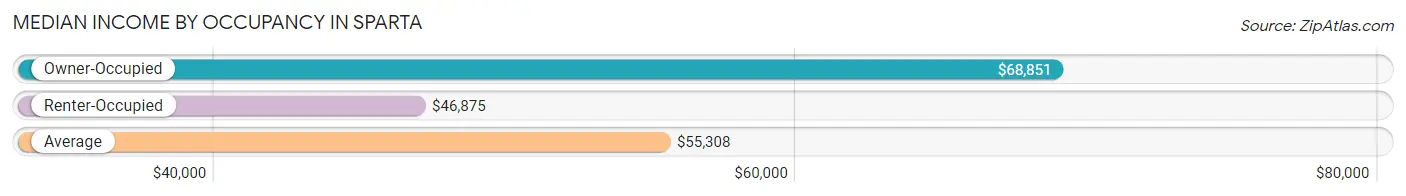
| Occupancy Type | # Households | Median Income |
| Owner-Occupied | 2,605 (61.8%) | $68,851 |
| Renter-Occupied | 1,609 (38.2%) | $46,875 |
| Average | 4,214 (100.0%) | $55,308 |
Occupancy by Householder Income Bracket in Sparta
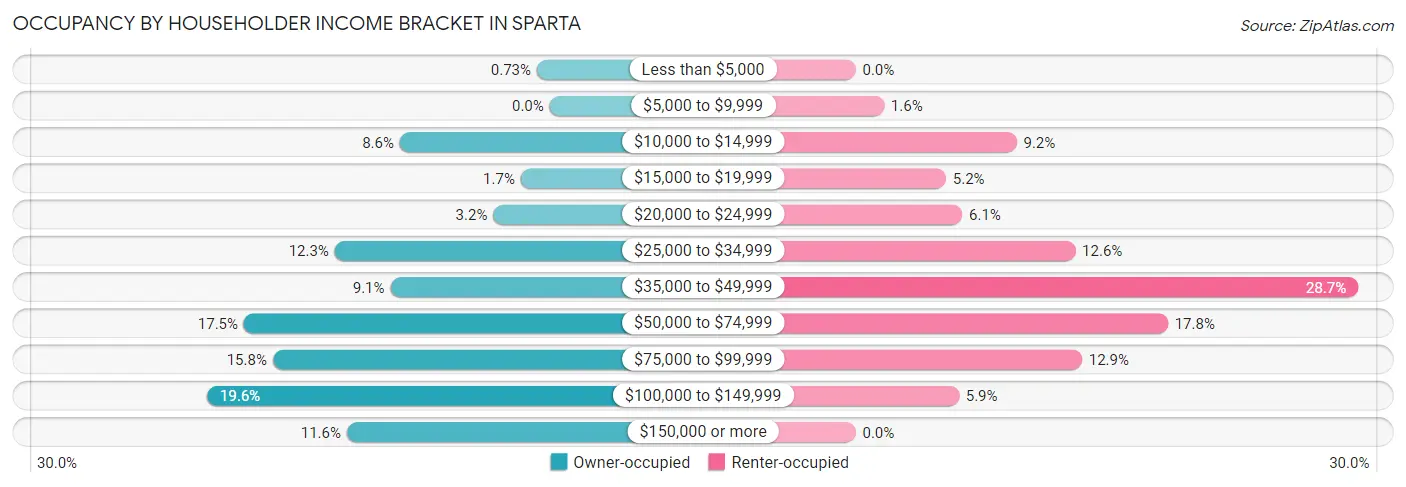
| Income Bracket | Owner-occupied | Renter-occupied |
| Less than $5,000 | 19 (0.7%) | 0 (0.0%) |
| $5,000 to $9,999 | 0 (0.0%) | 26 (1.6%) |
| $10,000 to $14,999 | 223 (8.6%) | 148 (9.2%) |
| $15,000 to $19,999 | 43 (1.7%) | 83 (5.2%) |
| $20,000 to $24,999 | 84 (3.2%) | 98 (6.1%) |
| $25,000 to $34,999 | 320 (12.3%) | 202 (12.6%) |
| $35,000 to $49,999 | 237 (9.1%) | 462 (28.7%) |
| $50,000 to $74,999 | 455 (17.5%) | 287 (17.8%) |
| $75,000 to $99,999 | 412 (15.8%) | 208 (12.9%) |
| $100,000 to $149,999 | 510 (19.6%) | 95 (5.9%) |
| $150,000 or more | 302 (11.6%) | 0 (0.0%) |
| Total | 2,605 (100.0%) | 1,609 (100.0%) |
Monthly Housing Cost Tiers in Sparta
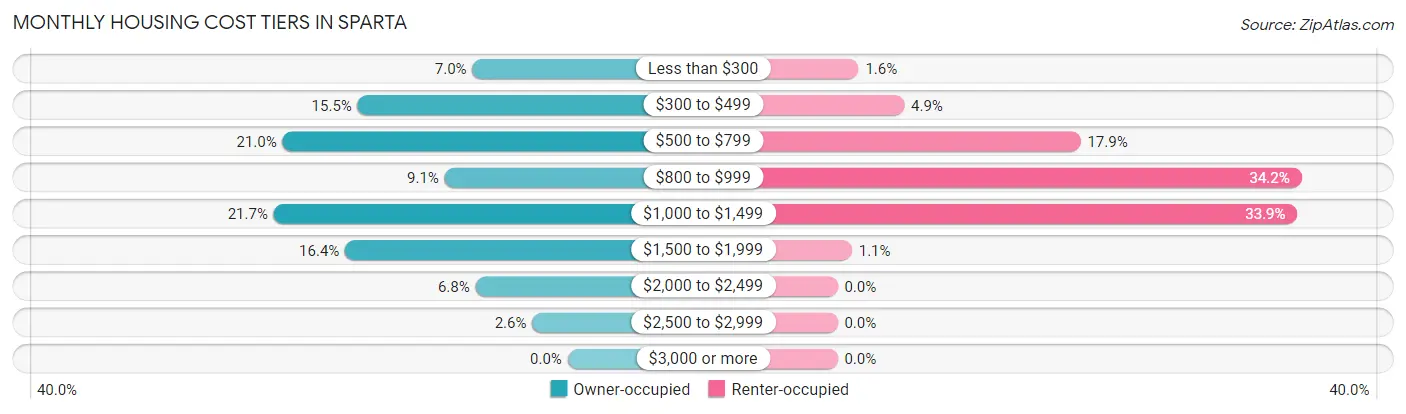
| Monthly Cost | Owner-occupied | Renter-occupied |
| Less than $300 | 183 (7.0%) | 25 (1.5%) |
| $300 to $499 | 403 (15.5%) | 79 (4.9%) |
| $500 to $799 | 547 (21.0%) | 288 (17.9%) |
| $800 to $999 | 236 (9.1%) | 550 (34.2%) |
| $1,000 to $1,499 | 564 (21.6%) | 545 (33.9%) |
| $1,500 to $1,999 | 427 (16.4%) | 17 (1.1%) |
| $2,000 to $2,499 | 177 (6.8%) | 0 (0.0%) |
| $2,500 to $2,999 | 68 (2.6%) | 0 (0.0%) |
| $3,000 or more | 0 (0.0%) | 0 (0.0%) |
| Total | 2,605 (100.0%) | 1,609 (100.0%) |
Physical Housing Characteristics in Sparta
Housing Structures in Sparta

| Structure Type | # Housing Units | % Housing Units |
| Single Unit, Detached | 2,409 | 57.2% |
| Single Unit, Attached | 291 | 6.9% |
| 2 Unit Apartments | 475 | 11.3% |
| 3 or 4 Unit Apartments | 225 | 5.3% |
| 5 to 9 Unit Apartments | 249 | 5.9% |
| 10 or more Apartments | 135 | 3.2% |
| Mobile Home / Other | 430 | 10.2% |
| Total | 4,214 | 100.0% |
Housing Structures by Occupancy in Sparta
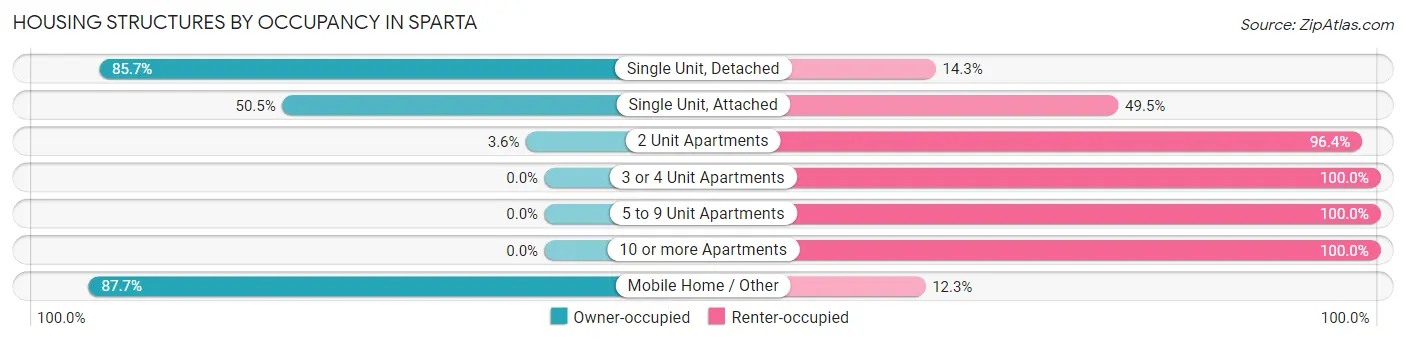
| Structure Type | Owner-occupied | Renter-occupied |
| Single Unit, Detached | 2,064 (85.7%) | 345 (14.3%) |
| Single Unit, Attached | 147 (50.5%) | 144 (49.5%) |
| 2 Unit Apartments | 17 (3.6%) | 458 (96.4%) |
| 3 or 4 Unit Apartments | 0 (0.0%) | 225 (100.0%) |
| 5 to 9 Unit Apartments | 0 (0.0%) | 249 (100.0%) |
| 10 or more Apartments | 0 (0.0%) | 135 (100.0%) |
| Mobile Home / Other | 377 (87.7%) | 53 (12.3%) |
| Total | 2,605 (61.8%) | 1,609 (38.2%) |
Housing Structures by Number of Rooms in Sparta
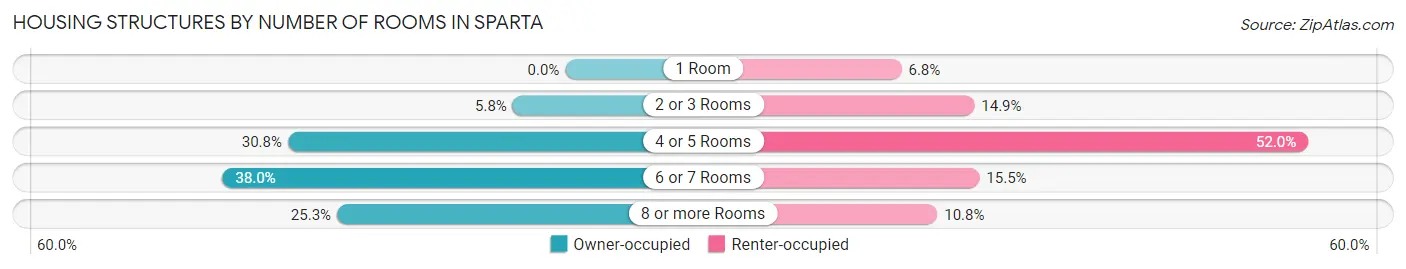
| Number of Rooms | Owner-occupied | Renter-occupied |
| 1 Room | 0 (0.0%) | 110 (6.8%) |
| 2 or 3 Rooms | 152 (5.8%) | 240 (14.9%) |
| 4 or 5 Rooms | 802 (30.8%) | 836 (52.0%) |
| 6 or 7 Rooms | 991 (38.0%) | 249 (15.5%) |
| 8 or more Rooms | 660 (25.3%) | 174 (10.8%) |
| Total | 2,605 (100.0%) | 1,609 (100.0%) |
Housing Structure by Heating Type in Sparta
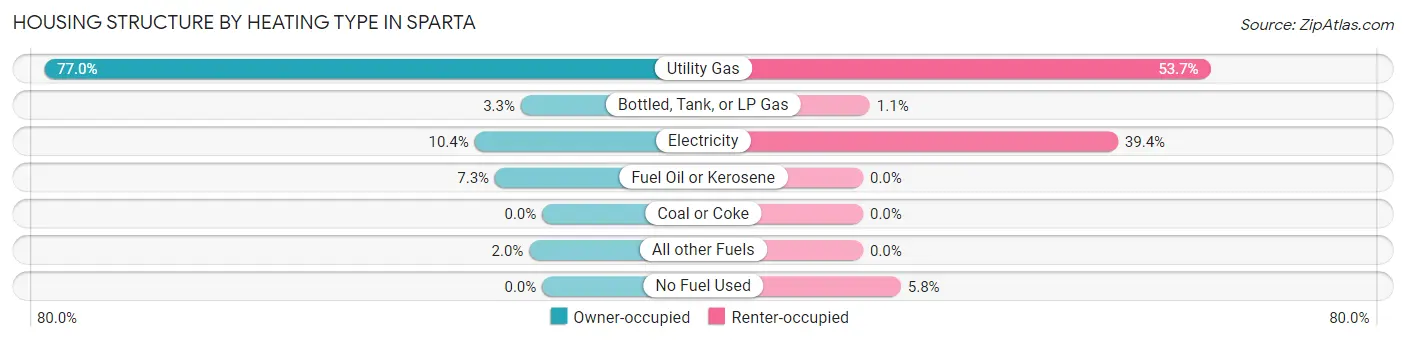
| Heating Type | Owner-occupied | Renter-occupied |
| Utility Gas | 2,005 (77.0%) | 864 (53.7%) |
| Bottled, Tank, or LP Gas | 86 (3.3%) | 17 (1.1%) |
| Electricity | 272 (10.4%) | 634 (39.4%) |
| Fuel Oil or Kerosene | 190 (7.3%) | 0 (0.0%) |
| Coal or Coke | 0 (0.0%) | 0 (0.0%) |
| All other Fuels | 52 (2.0%) | 0 (0.0%) |
| No Fuel Used | 0 (0.0%) | 94 (5.8%) |
| Total | 2,605 (100.0%) | 1,609 (100.0%) |
Household Vehicle Usage in Sparta
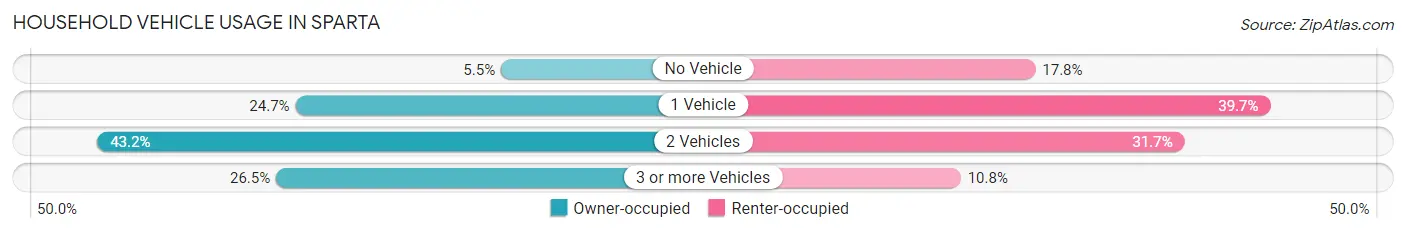
| Vehicles per Household | Owner-occupied | Renter-occupied |
| No Vehicle | 144 (5.5%) | 286 (17.8%) |
| 1 Vehicle | 644 (24.7%) | 639 (39.7%) |
| 2 Vehicles | 1,126 (43.2%) | 510 (31.7%) |
| 3 or more Vehicles | 691 (26.5%) | 174 (10.8%) |
| Total | 2,605 (100.0%) | 1,609 (100.0%) |
Real Estate & Mortgages in Sparta
Real Estate and Mortgage Overview in Sparta
| Characteristic | Without Mortgage | With Mortgage |
| Housing Units | 1,065 | 1,540 |
| Median Property Value | $110,100 | $181,800 |
| Median Household Income | $62,926 | $234 |
| Monthly Housing Costs | $484 | $0 |
| Real Estate Taxes | $2,381 | $27 |
Property Value by Mortgage Status in Sparta
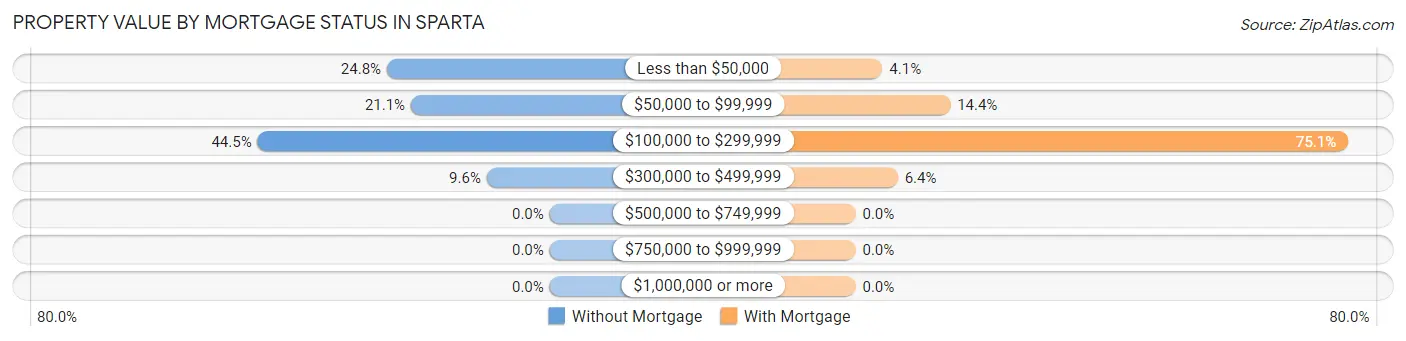
| Property Value | Without Mortgage | With Mortgage |
| Less than $50,000 | 264 (24.8%) | 63 (4.1%) |
| $50,000 to $99,999 | 225 (21.1%) | 222 (14.4%) |
| $100,000 to $299,999 | 474 (44.5%) | 1,156 (75.1%) |
| $300,000 to $499,999 | 102 (9.6%) | 99 (6.4%) |
| $500,000 to $749,999 | 0 (0.0%) | 0 (0.0%) |
| $750,000 to $999,999 | 0 (0.0%) | 0 (0.0%) |
| $1,000,000 or more | 0 (0.0%) | 0 (0.0%) |
| Total | 1,065 (100.0%) | 1,540 (100.0%) |
Household Income by Mortgage Status in Sparta
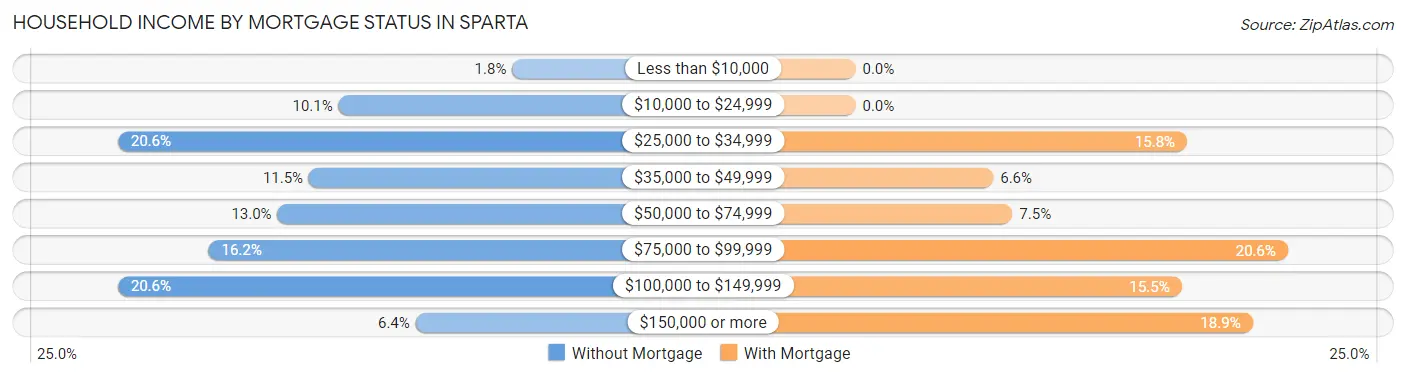
| Household Income | Without Mortgage | With Mortgage |
| Less than $10,000 | 19 (1.8%) | 0 (0.0%) |
| $10,000 to $24,999 | 107 (10.1%) | 0 (0.0%) |
| $25,000 to $34,999 | 219 (20.6%) | 243 (15.8%) |
| $35,000 to $49,999 | 122 (11.5%) | 101 (6.6%) |
| $50,000 to $74,999 | 138 (13.0%) | 115 (7.5%) |
| $75,000 to $99,999 | 173 (16.2%) | 317 (20.6%) |
| $100,000 to $149,999 | 219 (20.6%) | 239 (15.5%) |
| $150,000 or more | 68 (6.4%) | 291 (18.9%) |
| Total | 1,065 (100.0%) | 1,540 (100.0%) |
Property Value to Household Income Ratio in Sparta
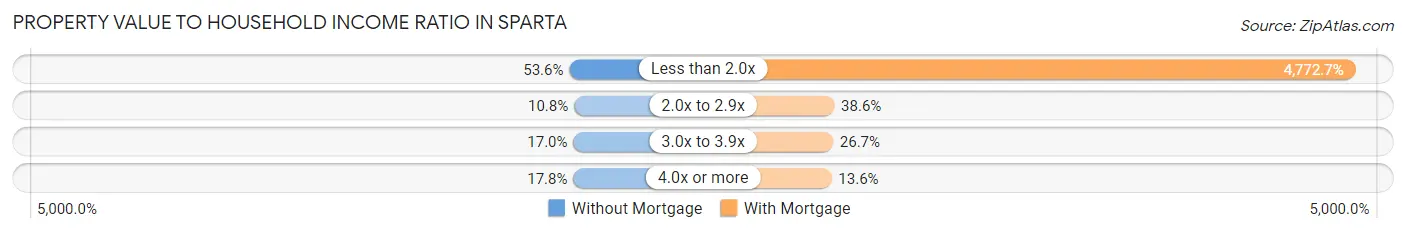
| Value-to-Income Ratio | Without Mortgage | With Mortgage |
| Less than 2.0x | 571 (53.6%) | 73,500 (4,772.7%) |
| 2.0x to 2.9x | 115 (10.8%) | 595 (38.6%) |
| 3.0x to 3.9x | 181 (17.0%) | 411 (26.7%) |
| 4.0x or more | 189 (17.7%) | 210 (13.6%) |
| Total | 1,065 (100.0%) | 1,540 (100.0%) |
Real Estate Taxes by Mortgage Status in Sparta
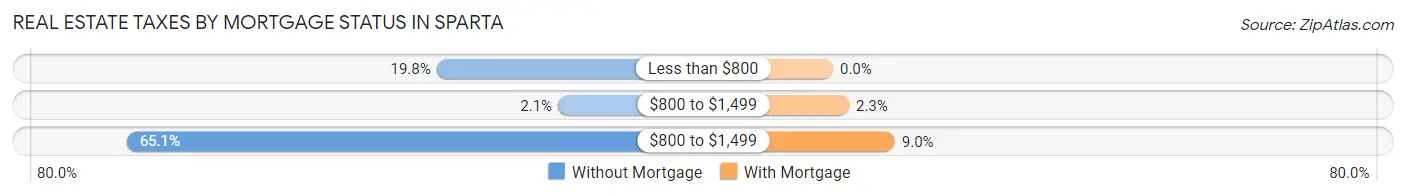
| Property Taxes | Without Mortgage | With Mortgage |
| Less than $800 | 211 (19.8%) | 0 (0.0%) |
| $800 to $1,499 | 22 (2.1%) | 36 (2.3%) |
| $800 to $1,499 | 693 (65.1%) | 139 (9.0%) |
| Total | 1,065 (100.0%) | 1,540 (100.0%) |
Health & Disability in Sparta
Health Insurance Coverage by Age in Sparta
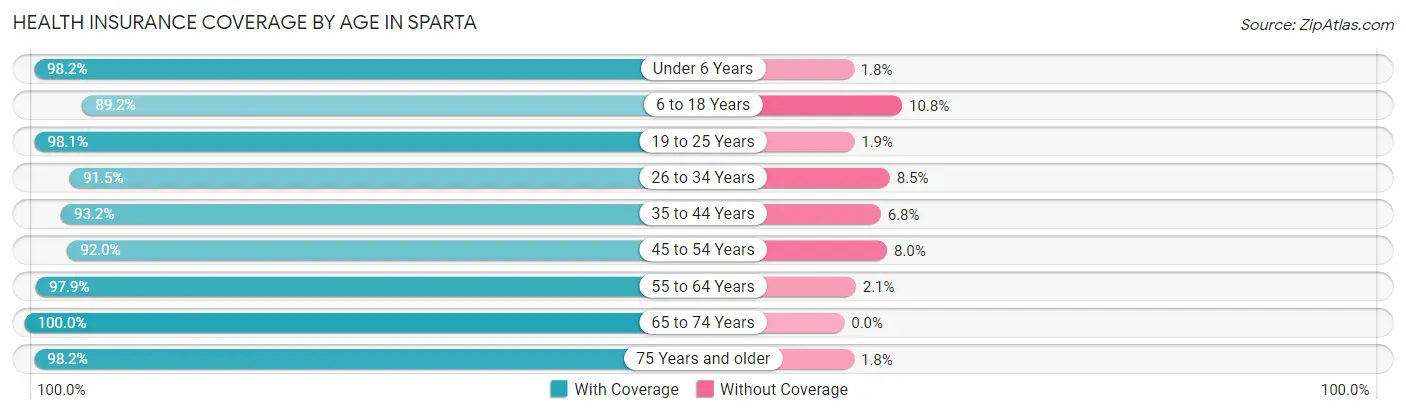
| Age Bracket | With Coverage | Without Coverage |
| Under 6 Years | 614 (98.2%) | 11 (1.8%) |
| 6 to 18 Years | 1,500 (89.2%) | 181 (10.8%) |
| 19 to 25 Years | 632 (98.1%) | 12 (1.9%) |
| 26 to 34 Years | 1,230 (91.5%) | 114 (8.5%) |
| 35 to 44 Years | 1,258 (93.2%) | 92 (6.8%) |
| 45 to 54 Years | 1,063 (92.0%) | 92 (8.0%) |
| 55 to 64 Years | 1,415 (97.9%) | 31 (2.1%) |
| 65 to 74 Years | 1,030 (100.0%) | 0 (0.0%) |
| 75 Years and older | 432 (98.2%) | 8 (1.8%) |
| Total | 9,174 (94.4%) | 541 (5.6%) |
Health Insurance Coverage by Citizenship Status in Sparta
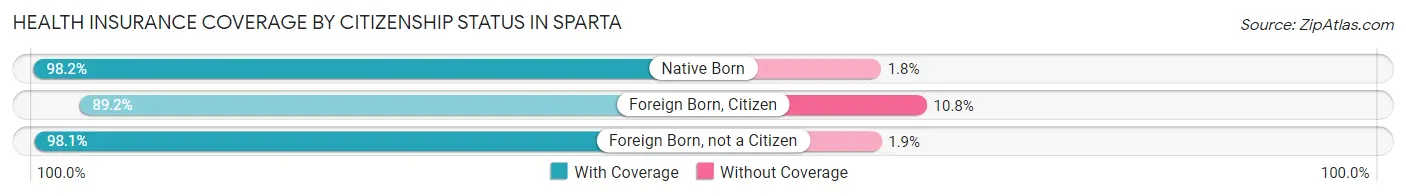
| Citizenship Status | With Coverage | Without Coverage |
| Native Born | 614 (98.2%) | 11 (1.8%) |
| Foreign Born, Citizen | 1,500 (89.2%) | 181 (10.8%) |
| Foreign Born, not a Citizen | 632 (98.1%) | 12 (1.9%) |
Health Insurance Coverage by Household Income in Sparta
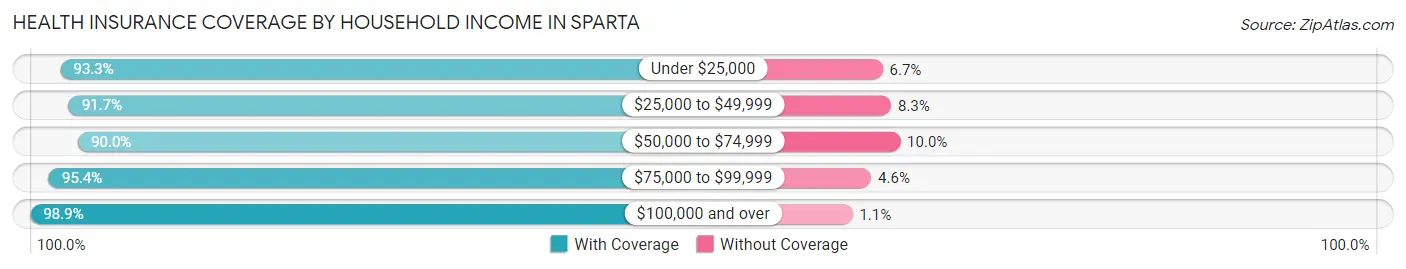
| Household Income | With Coverage | Without Coverage |
| Under $25,000 | 903 (93.3%) | 65 (6.7%) |
| $25,000 to $49,999 | 2,082 (91.7%) | 188 (8.3%) |
| $50,000 to $74,999 | 1,503 (90.0%) | 167 (10.0%) |
| $75,000 to $99,999 | 1,927 (95.4%) | 92 (4.6%) |
| $100,000 and over | 2,704 (98.9%) | 29 (1.1%) |
Public vs Private Health Insurance Coverage by Age in Sparta
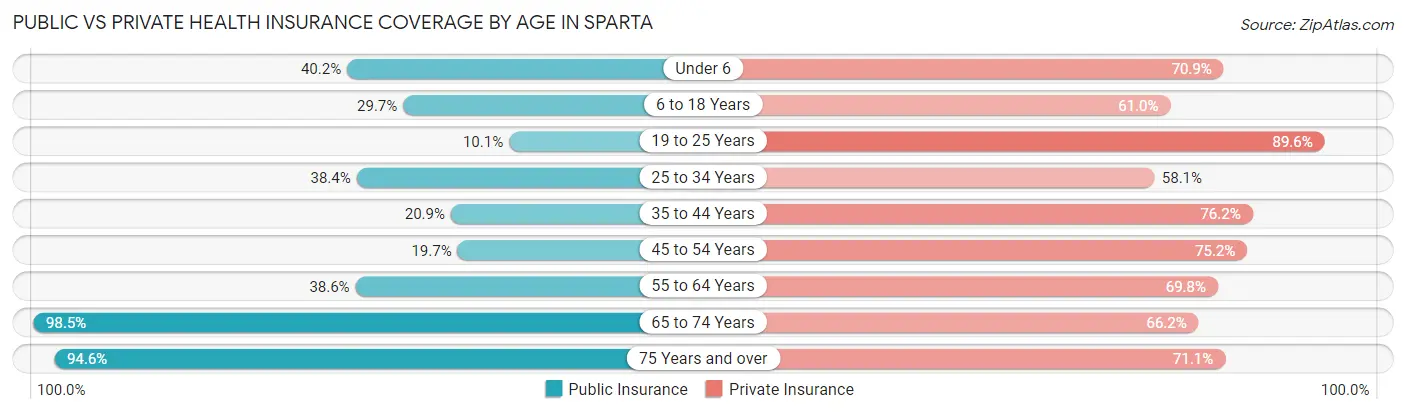
| Age Bracket | Public Insurance | Private Insurance |
| Under 6 | 251 (40.2%) | 443 (70.9%) |
| 6 to 18 Years | 500 (29.7%) | 1,025 (61.0%) |
| 19 to 25 Years | 65 (10.1%) | 577 (89.6%) |
| 25 to 34 Years | 516 (38.4%) | 781 (58.1%) |
| 35 to 44 Years | 282 (20.9%) | 1,029 (76.2%) |
| 45 to 54 Years | 227 (19.7%) | 869 (75.2%) |
| 55 to 64 Years | 558 (38.6%) | 1,009 (69.8%) |
| 65 to 74 Years | 1,014 (98.5%) | 682 (66.2%) |
| 75 Years and over | 416 (94.6%) | 313 (71.1%) |
| Total | 3,829 (39.4%) | 6,728 (69.3%) |
Disability Status by Sex by Age in Sparta
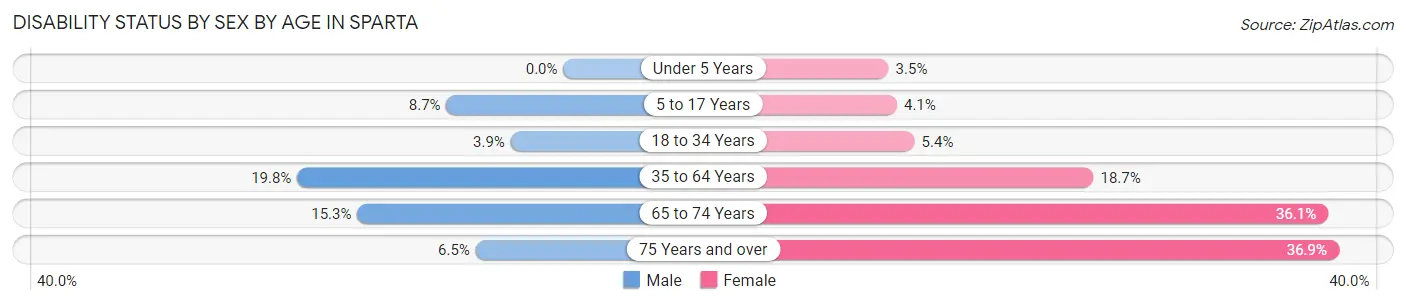
| Age Bracket | Male | Female |
| Under 5 Years | 0 (0.0%) | 11 (3.5%) |
| 5 to 17 Years | 76 (8.7%) | 33 (4.1%) |
| 18 to 34 Years | 46 (3.9%) | 50 (5.4%) |
| 35 to 64 Years | 381 (19.8%) | 378 (18.7%) |
| 65 to 74 Years | 69 (15.3%) | 209 (36.1%) |
| 75 Years and over | 11 (6.5%) | 100 (36.9%) |
Disability Class by Sex by Age in Sparta
Disability Class: Hearing Difficulty
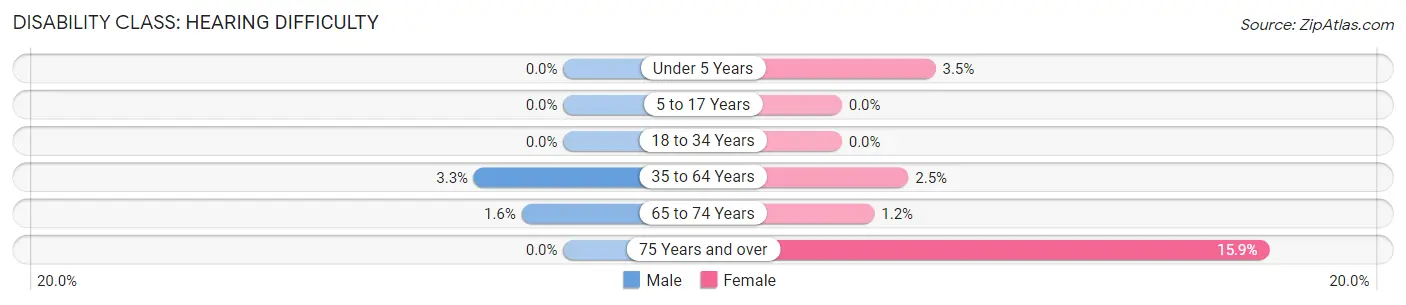
| Age Bracket | Male | Female |
| Under 5 Years | 0 (0.0%) | 11 (3.5%) |
| 5 to 17 Years | 0 (0.0%) | 0 (0.0%) |
| 18 to 34 Years | 0 (0.0%) | 0 (0.0%) |
| 35 to 64 Years | 64 (3.3%) | 50 (2.5%) |
| 65 to 74 Years | 7 (1.5%) | 7 (1.2%) |
| 75 Years and over | 0 (0.0%) | 43 (15.9%) |
Disability Class: Vision Difficulty
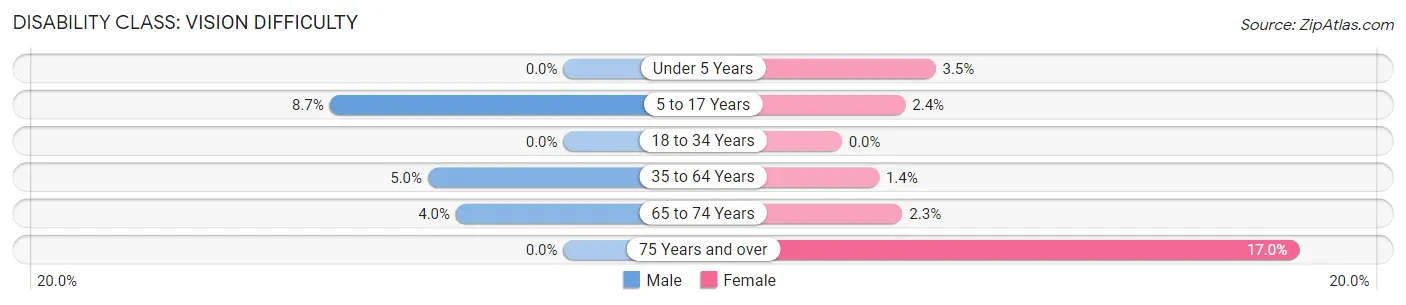
| Age Bracket | Male | Female |
| Under 5 Years | 0 (0.0%) | 11 (3.5%) |
| 5 to 17 Years | 76 (8.7%) | 19 (2.4%) |
| 18 to 34 Years | 0 (0.0%) | 0 (0.0%) |
| 35 to 64 Years | 97 (5.0%) | 28 (1.4%) |
| 65 to 74 Years | 18 (4.0%) | 13 (2.2%) |
| 75 Years and over | 0 (0.0%) | 46 (17.0%) |
Disability Class: Cognitive Difficulty
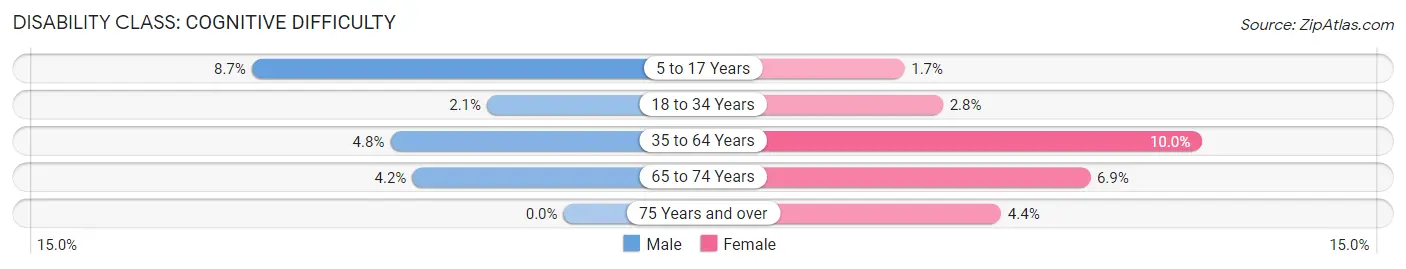
| Age Bracket | Male | Female |
| 5 to 17 Years | 76 (8.7%) | 14 (1.7%) |
| 18 to 34 Years | 25 (2.1%) | 26 (2.8%) |
| 35 to 64 Years | 93 (4.8%) | 203 (10.0%) |
| 65 to 74 Years | 19 (4.2%) | 40 (6.9%) |
| 75 Years and over | 0 (0.0%) | 12 (4.4%) |
Disability Class: Ambulatory Difficulty
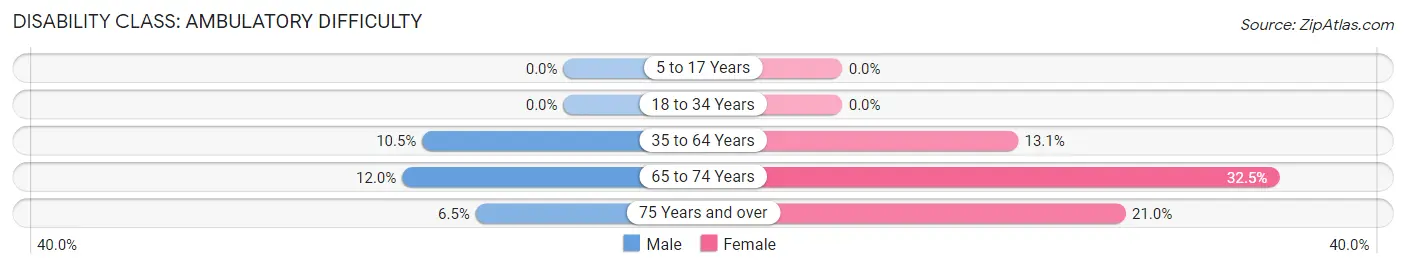
| Age Bracket | Male | Female |
| 5 to 17 Years | 0 (0.0%) | 0 (0.0%) |
| 18 to 34 Years | 0 (0.0%) | 0 (0.0%) |
| 35 to 64 Years | 202 (10.5%) | 264 (13.1%) |
| 65 to 74 Years | 54 (12.0%) | 188 (32.5%) |
| 75 Years and over | 11 (6.5%) | 57 (21.0%) |
Disability Class: Self-Care Difficulty

| Age Bracket | Male | Female |
| 5 to 17 Years | 0 (0.0%) | 0 (0.0%) |
| 18 to 34 Years | 10 (0.9%) | 0 (0.0%) |
| 35 to 64 Years | 157 (8.1%) | 79 (3.9%) |
| 65 to 74 Years | 26 (5.8%) | 44 (7.6%) |
| 75 Years and over | 0 (0.0%) | 17 (6.3%) |
Technology Access in Sparta
Computing Device Access in Sparta
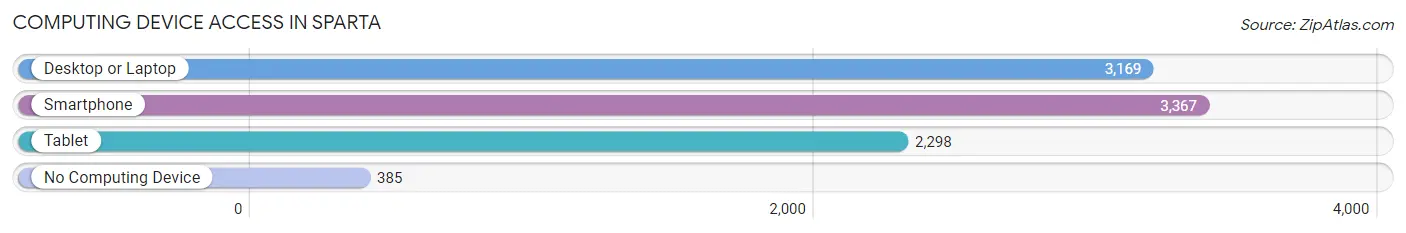
| Device Type | # Households | % Households |
| Desktop or Laptop | 3,169 | 75.2% |
| Smartphone | 3,367 | 79.9% |
| Tablet | 2,298 | 54.5% |
| No Computing Device | 385 | 9.1% |
| Total | 4,214 | 100.0% |
Internet Access in Sparta
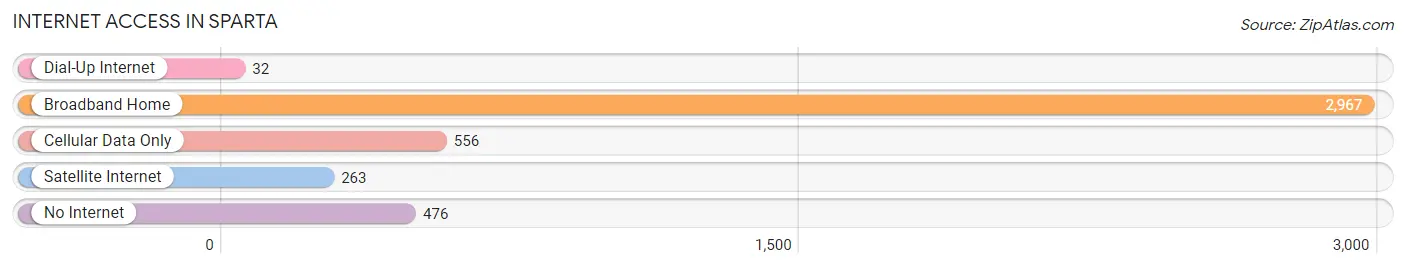
| Internet Type | # Households | % Households |
| Dial-Up Internet | 32 | 0.8% |
| Broadband Home | 2,967 | 70.4% |
| Cellular Data Only | 556 | 13.2% |
| Satellite Internet | 263 | 6.2% |
| No Internet | 476 | 11.3% |
| Total | 4,214 | 100.0% |
Sparta Summary
Sparta, Wisconsin is a city located in Monroe County, Wisconsin, United States. The population was 9,522 at the 2010 census. It is the county seat of Monroe County. Sparta is located in the heart of the Driftless Area, a region of the United States that escaped the flattening effects of glaciation during the last ice age. The city is known for its hilly terrain, and is home to the Elroy-Sparta State Trail, a 32-mile long recreational trail that follows an abandoned railroad corridor.
History
Sparta was first settled in 1845 by a group of settlers from New York. The city was named after the ancient Greek city-state of Sparta. The first post office was established in 1848, and the city was officially incorporated in 1856.
In the late 19th century, Sparta was a major center for the lumber industry. The city was home to several sawmills and lumberyards, and the surrounding area was heavily logged. The city also had a thriving brick-making industry, and several brickyards were located in the city.
In the early 20th century, Sparta was a major center for the dairy industry. The city was home to several cheese factories, and the surrounding area was home to many dairy farms.
Geography
Sparta is located at 43°56′N 90°48′W (43.937, -90.800). According to the United States Census Bureau, the city has a total area of 5.90 square miles (15.27 km2), of which 5.89 square miles (15.24 km2) is land and 0.01 square miles (0.03 km2) is water.
Economy
Sparta’s economy is largely based on agriculture and manufacturing. The city is home to several food processing plants, including a cheese factory and a meat packing plant. The city is also home to several manufacturing companies, including a plastics manufacturer and a metal fabrication plant.
The city is also home to several retail stores, including a Walmart Supercenter and several smaller stores. The city is also home to several restaurants, including several fast food restaurants and several locally owned restaurants.
Demographics
As of the census of 2010, there were 9,522 people, 3,845 households, and 2,521 families residing in the city. The population density was 1,619.2 inhabitants per square mile (625.2/km2). There were 4,093 housing units at an average density of 693.3 per square mile (267.7/km2). The racial makeup of the city was 97.2% White, 0.4% African American, 0.3% Native American, 0.4% Asian, 0.2% from other races, and 1.5% from two or more races. Hispanic or Latino of any race were 1.3% of the population.
There were 3,845 households, of which 32.2% had children under the age of 18 living with them, 47.2% were married couples living together, 12.2% had a female householder with no husband present, 5.2% had a male householder with no wife present, and 35.4% were non-families. 29.7% of all households were made up of individuals, and 12.3% had someone living alone who was 65 years of age or older. The average household size was 2.44 and the average family size was 3.02.
The median age in the city was 37.7 years. 25.2% of residents were under the age of 18; 8.2% were between the ages of 18 and 24; 25.2% were from 25 to 44; 25.2% were from 45 to 64; and 16.2% were 65 years of age or older. The gender makeup of the city was 48.7% male and 51.3% female.
Conclusion
Sparta, Wisconsin is a city located in Monroe County, Wisconsin, United States. The city is known for its hilly terrain, and is home to the Elroy-Sparta State Trail, a 32-mile long recreational trail that follows an abandoned railroad corridor. Sparta was first settled in 1845 by a group of settlers from New York, and the city was officially incorporated in 1856. The city’s economy is largely based on agriculture and manufacturing, and the city is home to several food processing plants, manufacturing companies, retail stores, and restaurants. As of the 2010 census, the population of Sparta was 9,522.
Common Questions
What is Per Capita Income in Sparta?
Per Capita income in Sparta is $31,009.
What is the Median Family Income in Sparta?
Median Family Income in Sparta is $73,420.
What is the Median Household income in Sparta?
Median Household Income in Sparta is $55,308.
What is Income or Wage Gap in Sparta?
Income or Wage Gap in Sparta is 37.4%.
Women in Sparta earn 62.6 cents for every dollar earned by a man.
What is Inequality or Gini Index in Sparta?
Inequality or Gini Index in Sparta is 0.41.
What is the Total Population of Sparta?
Total Population of Sparta is 9,943.
What is the Total Male Population of Sparta?
Total Male Population of Sparta is 4,948.
What is the Total Female Population of Sparta?
Total Female Population of Sparta is 4,995.
What is the Ratio of Males per 100 Females in Sparta?
There are 99.06 Males per 100 Females in Sparta.
What is the Ratio of Females per 100 Males in Sparta?
There are 100.95 Females per 100 Males in Sparta.
What is the Median Population Age in Sparta?
Median Population Age in Sparta is 37.3 Years.
What is the Average Family Size in Sparta
Average Family Size in Sparta is 3.0 People.
What is the Average Household Size in Sparta
Average Household Size in Sparta is 2.3 People.
How Large is the Labor Force in Sparta?
There are 5,367 People in the Labor Forcein in Sparta.
What is the Percentage of People in the Labor Force in Sparta?
66.8% of People are in the Labor Force in Sparta.
What is the Unemployment Rate in Sparta?
Unemployment Rate in Sparta is 3.6%.