Soldiers Grove, WI Map & Demographics
Soldiers Grove Map
Soldiers Grove Overview
$20,424
PER CAPITA INCOME
$49,250
AVG FAMILY INCOME
$39,485
AVG HOUSEHOLD INCOME
5.6%
WAGE / INCOME GAP [ % ]
94.4¢/ $1
WAGE / INCOME GAP [ $ ]
0.41
INEQUALITY / GINI INDEX
547
TOTAL POPULATION
257
MALE POPULATION
290
FEMALE POPULATION
88.62
MALES / 100 FEMALES
112.84
FEMALES / 100 MALES
40.4
MEDIAN AGE
3.5
AVG FAMILY SIZE
2.6
AVG HOUSEHOLD SIZE
215
LABOR FORCE [ PEOPLE ]
50.8%
PERCENT IN LABOR FORCE
2.3%
UNEMPLOYMENT RATE
Soldiers Grove Zip Codes
Soldiers Grove Area Codes
Income in Soldiers Grove
Income Overview in Soldiers Grove
Per Capita Income in Soldiers Grove is $20,424, while median incomes of families and households are $49,250 and $39,485 respectively.
| Characteristic | Number | Measure |
| Per Capita Income | 547 | $20,424 |
| Median Family Income | 111 | $49,250 |
| Mean Family Income | 111 | $63,335 |
| Median Household Income | 191 | $39,485 |
| Mean Household Income | 191 | $51,222 |
| Income Deficit | 111 | $0 |
| Wage / Income Gap (%) | 547 | 5.59% |
| Wage / Income Gap ($) | 547 | 94.41¢ per $1 |
| Gini / Inequality Index | 547 | 0.41 |
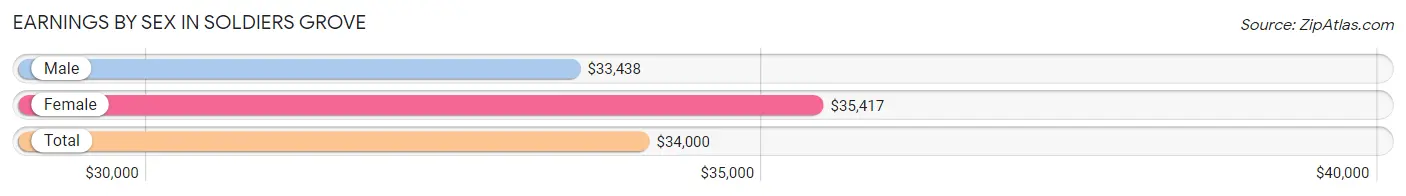
Earnings by Sex in Soldiers Grove
Average Earnings in Soldiers Grove are $34,000, $33,438 for men and $35,417 for women, a difference of 5.6%.
| Sex | Number | Average Earnings |
| Male | 135 (58.7%) | $33,438 |
| Female | 95 (41.3%) | $35,417 |
| Total | 230 (100.0%) | $34,000 |
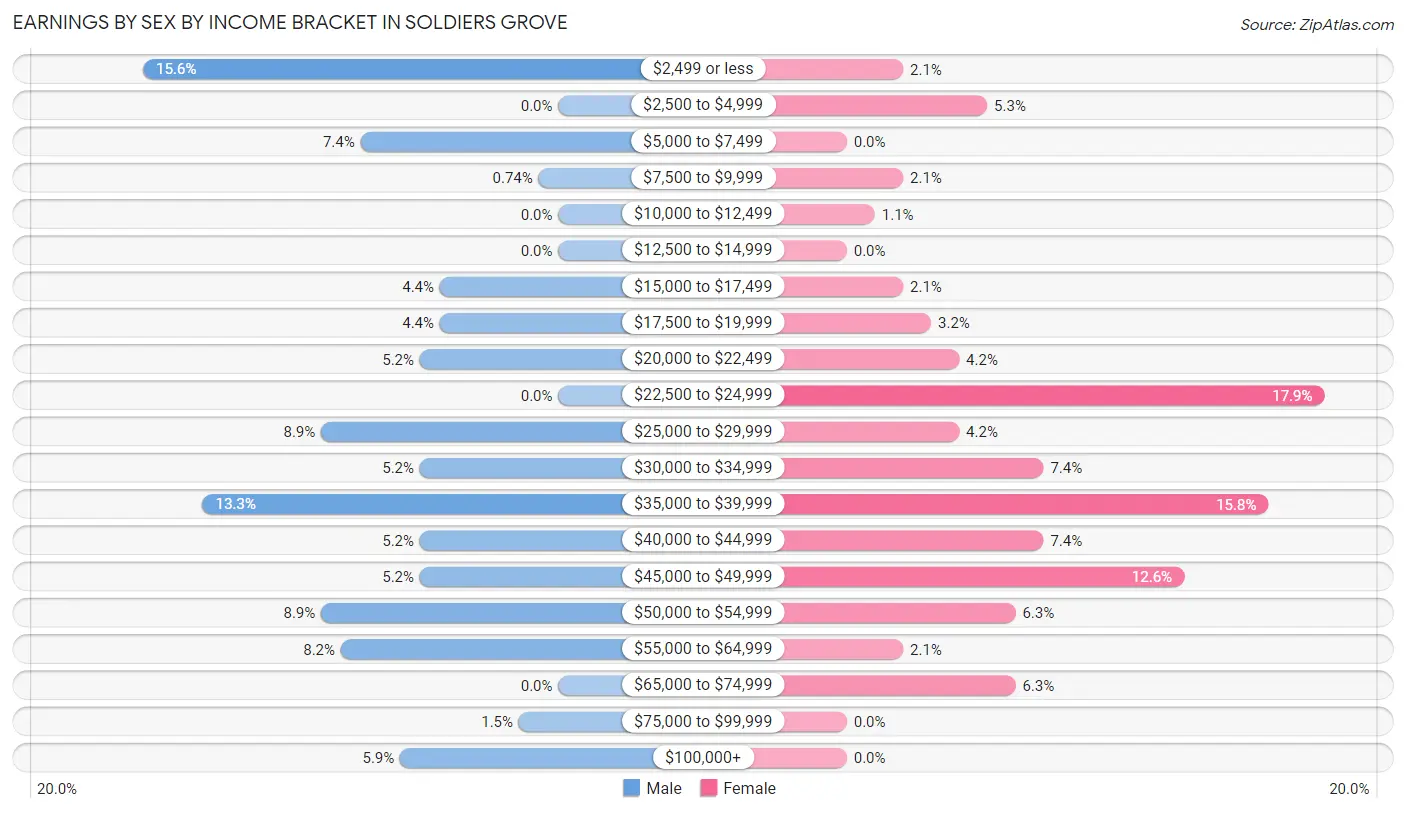
Earnings by Sex by Income Bracket in Soldiers Grove
The most common earnings brackets in Soldiers Grove are $2,499 or less for men (21 | 15.6%) and $22,500 to $24,999 for women (17 | 17.9%).
| Income | Male | Female |
| $2,499 or less | 21 (15.6%) | 2 (2.1%) |
| $2,500 to $4,999 | 0 (0.0%) | 5 (5.3%) |
| $5,000 to $7,499 | 10 (7.4%) | 0 (0.0%) |
| $7,500 to $9,999 | 1 (0.7%) | 2 (2.1%) |
| $10,000 to $12,499 | 0 (0.0%) | 1 (1.1%) |
| $12,500 to $14,999 | 0 (0.0%) | 0 (0.0%) |
| $15,000 to $17,499 | 6 (4.4%) | 2 (2.1%) |
| $17,500 to $19,999 | 6 (4.4%) | 3 (3.2%) |
| $20,000 to $22,499 | 7 (5.2%) | 4 (4.2%) |
| $22,500 to $24,999 | 0 (0.0%) | 17 (17.9%) |
| $25,000 to $29,999 | 12 (8.9%) | 4 (4.2%) |
| $30,000 to $34,999 | 7 (5.2%) | 7 (7.4%) |
| $35,000 to $39,999 | 18 (13.3%) | 15 (15.8%) |
| $40,000 to $44,999 | 7 (5.2%) | 7 (7.4%) |
| $45,000 to $49,999 | 7 (5.2%) | 12 (12.6%) |
| $50,000 to $54,999 | 12 (8.9%) | 6 (6.3%) |
| $55,000 to $64,999 | 11 (8.2%) | 2 (2.1%) |
| $65,000 to $74,999 | 0 (0.0%) | 6 (6.3%) |
| $75,000 to $99,999 | 2 (1.5%) | 0 (0.0%) |
| $100,000+ | 8 (5.9%) | 0 (0.0%) |
| Total | 135 (100.0%) | 95 (100.0%) |
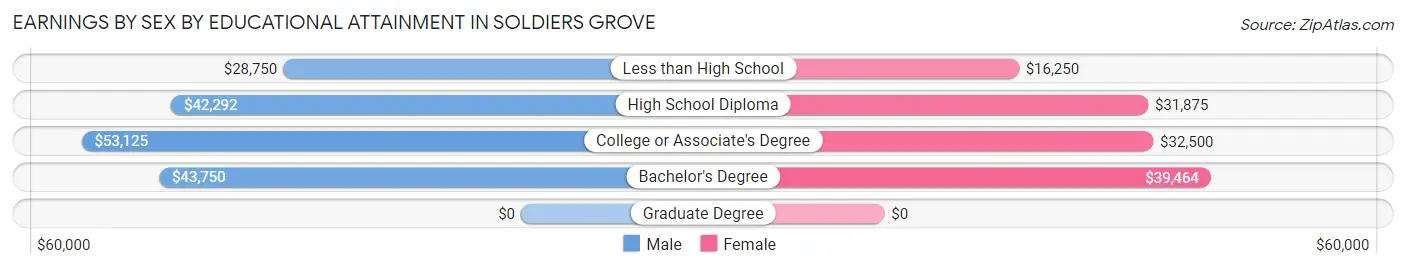
Earnings by Sex by Educational Attainment in Soldiers Grove
Average earnings in Soldiers Grove are $41,458 for men and $36,250 for women, a difference of 12.6%. Men with an educational attainment of college or associate's degree enjoy the highest average annual earnings of $53,125, while those with less than high school education earn the least with $28,750. Women with an educational attainment of bachelor's degree earn the most with the average annual earnings of $39,464, while those with less than high school education have the smallest earnings of $16,250.
| Educational Attainment | Male Income | Female Income |
| Less than High School | $28,750 | $16,250 |
| High School Diploma | $42,292 | $31,875 |
| College or Associate's Degree | $53,125 | $32,500 |
| Bachelor's Degree | $43,750 | $39,464 |
| Graduate Degree | - | - |
| Total | $41,458 | $36,250 |
Family Income in Soldiers Grove
Family Income Brackets in Soldiers Grove
According to the Soldiers Grove family income data, there are 24 families falling into the $50,000 to $74,999 income range, which is the most common income bracket and makes up 21.6% of all families.
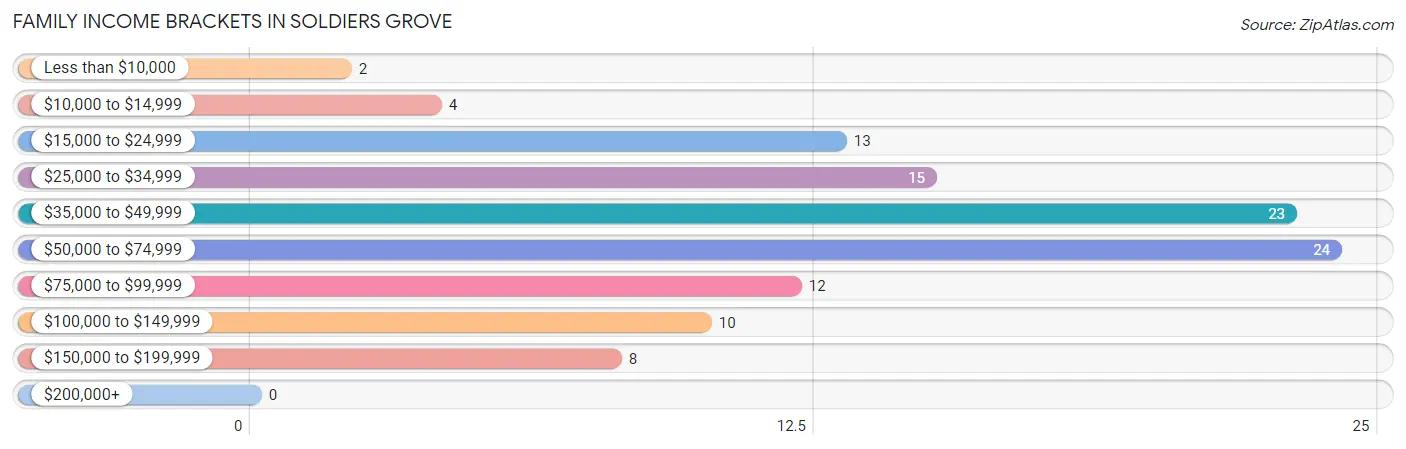
| Income Bracket | # Families | % Families |
| Less than $10,000 | 2 | 1.8% |
| $10,000 to $14,999 | 4 | 3.6% |
| $15,000 to $24,999 | 13 | 11.7% |
| $25,000 to $34,999 | 15 | 13.5% |
| $35,000 to $49,999 | 23 | 20.7% |
| $50,000 to $74,999 | 24 | 21.6% |
| $75,000 to $99,999 | 12 | 10.8% |
| $100,000 to $149,999 | 10 | 9.0% |
| $150,000 to $199,999 | 8 | 7.2% |
| $200,000+ | 0 | 0.0% |
Family Income by Famaliy Size in Soldiers Grove
5-person families (11 | 9.9%) account for the highest median family income in Soldiers Grove with $198,036 per family, while 5-person families (11 | 9.9%) have the highest median income of $39,607 per family member.
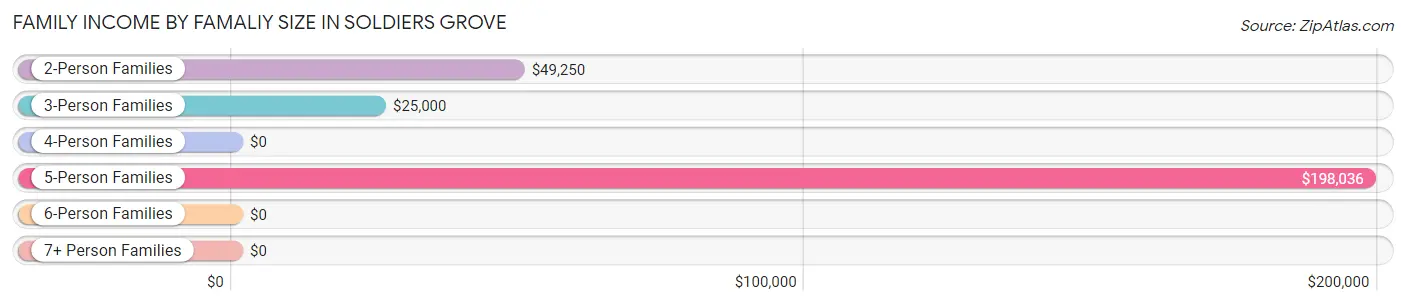
| Income Bracket | # Families | Median Income |
| 2-Person Families | 69 (62.2%) | $49,250 |
| 3-Person Families | 14 (12.6%) | $25,000 |
| 4-Person Families | 13 (11.7%) | $0 |
| 5-Person Families | 11 (9.9%) | $198,036 |
| 6-Person Families | 2 (1.8%) | $0 |
| 7+ Person Families | 2 (1.8%) | $0 |
| Total | 111 (100.0%) | $49,250 |
Family Income by Number of Earners in Soldiers Grove
The median family income in Soldiers Grove is $49,250, with families comprising 3+ earners (12) having the highest median family income of $197,857, while families with no earners (24) have the lowest median family income of $33,750, accounting for 10.8% and 21.6% of families, respectively.
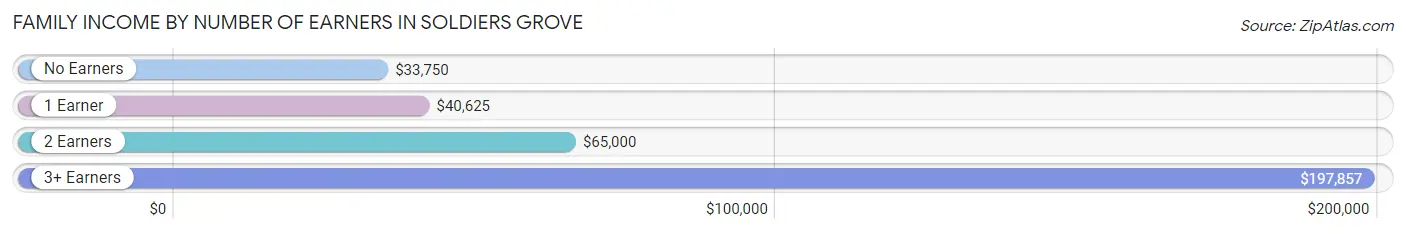
| Number of Earners | # Families | Median Income |
| No Earners | 24 (21.6%) | $33,750 |
| 1 Earner | 41 (36.9%) | $40,625 |
| 2 Earners | 34 (30.6%) | $65,000 |
| 3+ Earners | 12 (10.8%) | $197,857 |
| Total | 111 (100.0%) | $49,250 |
Household Income in Soldiers Grove
Household Income Brackets in Soldiers Grove
With 41 households falling in the category, the $50,000 to $74,999 income range is the most frequent in Soldiers Grove, accounting for 21.5% of all households.
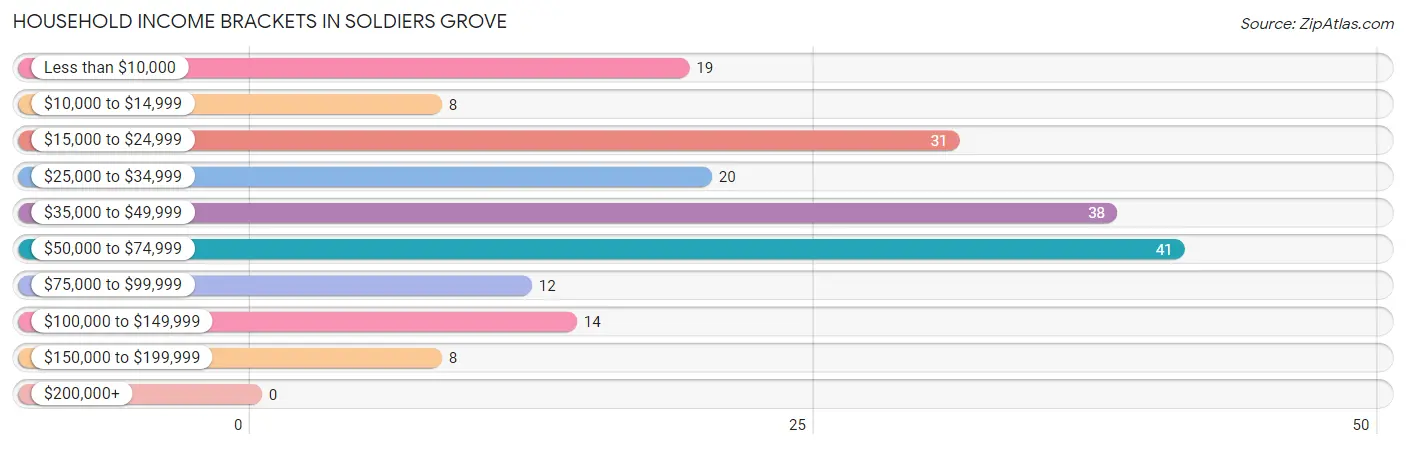
| Income Bracket | # Households | % Households |
| Less than $10,000 | 19 | 9.9% |
| $10,000 to $14,999 | 8 | 4.2% |
| $15,000 to $24,999 | 31 | 16.2% |
| $25,000 to $34,999 | 20 | 10.5% |
| $35,000 to $49,999 | 38 | 19.9% |
| $50,000 to $74,999 | 41 | 21.5% |
| $75,000 to $99,999 | 12 | 6.3% |
| $100,000 to $149,999 | 14 | 7.3% |
| $150,000 to $199,999 | 8 | 4.2% |
| $200,000+ | 0 | 0.0% |
Household Income by Householder Age in Soldiers Grove
The median household income in Soldiers Grove is $39,485, with the highest median household income of $60,000 found in the 45 to 64 years age bracket for the primary householder. A total of 70 households (36.6%) fall into this category. Meanwhile, the 65+ years age bracket for the primary householder has the lowest median household income of $29,286, with 62 households (32.5%) in this group.
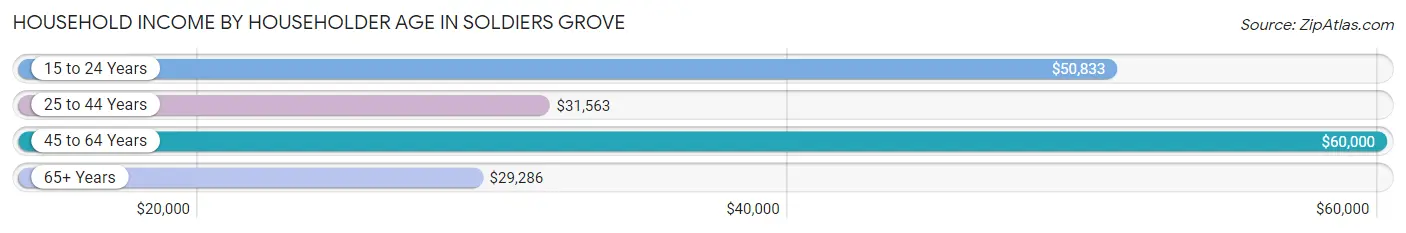
| Income Bracket | # Households | Median Income |
| 15 to 24 Years | 10 (5.2%) | $50,833 |
| 25 to 44 Years | 49 (25.7%) | $31,563 |
| 45 to 64 Years | 70 (36.6%) | $60,000 |
| 65+ Years | 62 (32.5%) | $29,286 |
| Total | 191 (100.0%) | $39,485 |
Poverty in Soldiers Grove
Income Below Poverty by Sex and Age in Soldiers Grove
With 17.3% poverty level for males and 39.2% for females among the residents of Soldiers Grove, 6 to 11 year old males and 12 to 14 year old females are the most vulnerable to poverty, with 17 males (63.0%) and 25 females (71.4%) in their respective age groups living below the poverty level.
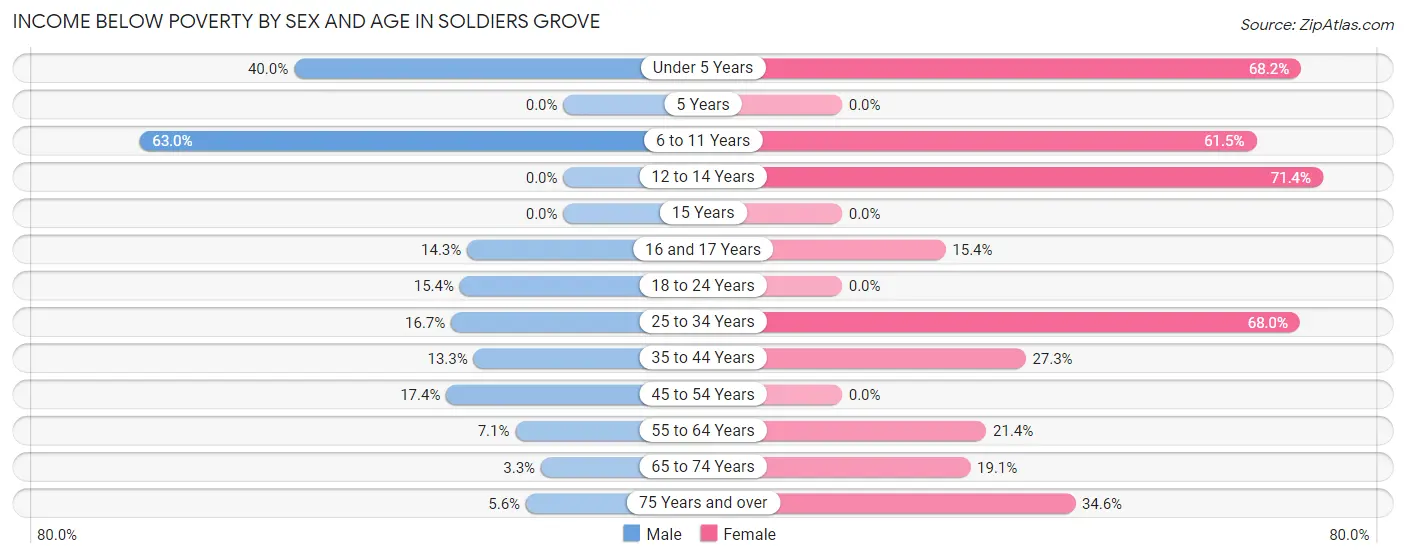
| Age Bracket | Male | Female |
| Under 5 Years | 2 (40.0%) | 15 (68.2%) |
| 5 Years | 0 (0.0%) | 0 (0.0%) |
| 6 to 11 Years | 17 (63.0%) | 8 (61.5%) |
| 12 to 14 Years | 0 (0.0%) | 25 (71.4%) |
| 15 Years | 0 (0.0%) | 0 (0.0%) |
| 16 and 17 Years | 2 (14.3%) | 2 (15.4%) |
| 18 to 24 Years | 6 (15.4%) | 0 (0.0%) |
| 25 to 34 Years | 3 (16.7%) | 17 (68.0%) |
| 35 to 44 Years | 2 (13.3%) | 12 (27.3%) |
| 45 to 54 Years | 8 (17.4%) | 0 (0.0%) |
| 55 to 64 Years | 1 (7.1%) | 9 (21.4%) |
| 65 to 74 Years | 1 (3.3%) | 4 (19.1%) |
| 75 Years and over | 1 (5.6%) | 9 (34.6%) |
| Total | 43 (17.3%) | 101 (39.2%) |
Income Above Poverty by Sex and Age in Soldiers Grove
According to the poverty statistics in Soldiers Grove, males aged 12 to 14 years and females aged 18 to 24 years are the age groups that are most secure financially, with 100.0% of males and 100.0% of females in these age groups living above the poverty line.
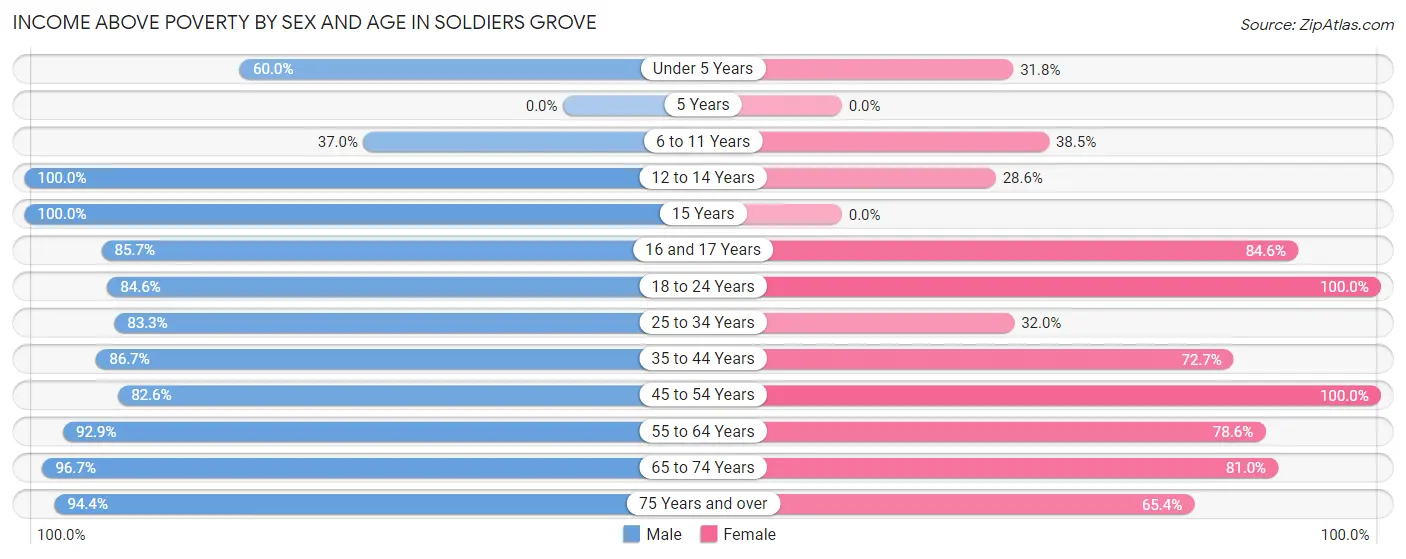
| Age Bracket | Male | Female |
| Under 5 Years | 3 (60.0%) | 7 (31.8%) |
| 5 Years | 0 (0.0%) | 0 (0.0%) |
| 6 to 11 Years | 10 (37.0%) | 5 (38.5%) |
| 12 to 14 Years | 13 (100.0%) | 10 (28.6%) |
| 15 Years | 9 (100.0%) | 0 (0.0%) |
| 16 and 17 Years | 12 (85.7%) | 11 (84.6%) |
| 18 to 24 Years | 33 (84.6%) | 6 (100.0%) |
| 25 to 34 Years | 15 (83.3%) | 8 (32.0%) |
| 35 to 44 Years | 13 (86.7%) | 32 (72.7%) |
| 45 to 54 Years | 38 (82.6%) | 11 (100.0%) |
| 55 to 64 Years | 13 (92.9%) | 33 (78.6%) |
| 65 to 74 Years | 29 (96.7%) | 17 (80.9%) |
| 75 Years and over | 17 (94.4%) | 17 (65.4%) |
| Total | 205 (82.7%) | 157 (60.9%) |
Income Below Poverty Among Married-Couple Families in Soldiers Grove
The poverty statistics for married-couple families in Soldiers Grove show that 1.5% or 1 of the total 66 families live below the poverty line. Families with no children have the highest poverty rate of 2.0%, comprising of 1 families. On the other hand, families with 1 or 2 children have the lowest poverty rate of 0.0%, which includes 0 families.
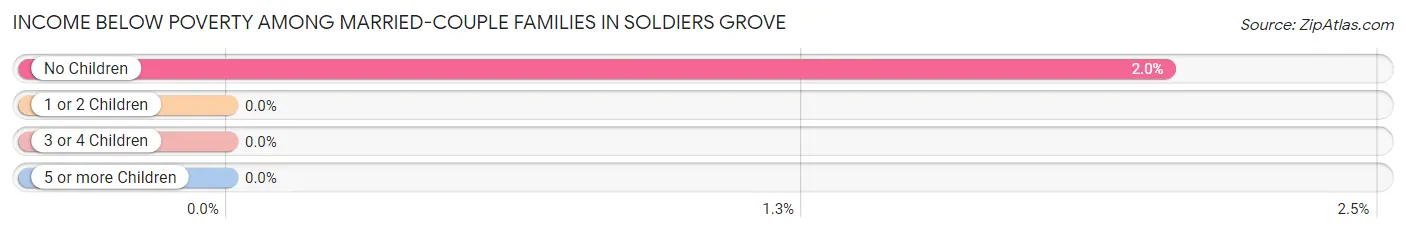
| Children | Above Poverty | Below Poverty |
| No Children | 48 (98.0%) | 1 (2.0%) |
| 1 or 2 Children | 6 (100.0%) | 0 (0.0%) |
| 3 or 4 Children | 9 (100.0%) | 0 (0.0%) |
| 5 or more Children | 2 (100.0%) | 0 (0.0%) |
| Total | 65 (98.5%) | 1 (1.5%) |
Income Below Poverty Among Single-Parent Households in Soldiers Grove
According to the poverty data in Soldiers Grove, 28.6% or 2 single-father households and 23.7% or 9 single-mother households are living below the poverty line. Among single-father households, those with no children have the highest poverty rate, with 1 households (33.3%) experiencing poverty. Likewise, among single-mother households, those with 3 or 4 children have the highest poverty rate, with 4 households (57.1%) falling below the poverty line.
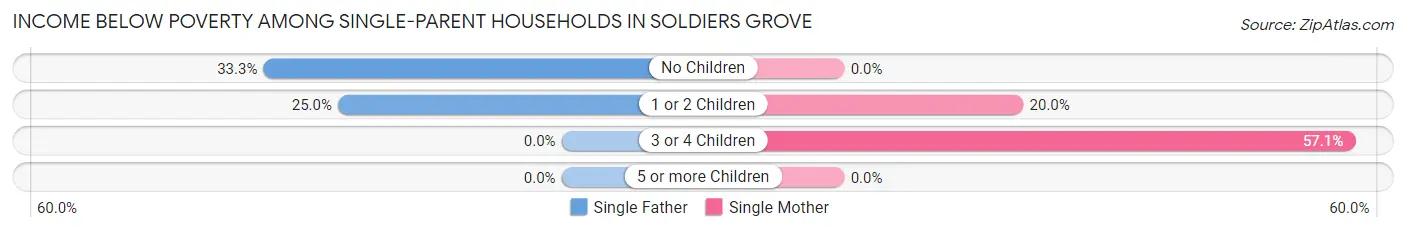
| Children | Single Father | Single Mother |
| No Children | 1 (33.3%) | 0 (0.0%) |
| 1 or 2 Children | 1 (25.0%) | 5 (20.0%) |
| 3 or 4 Children | 0 (0.0%) | 4 (57.1%) |
| 5 or more Children | 0 (0.0%) | 0 (0.0%) |
| Total | 2 (28.6%) | 9 (23.7%) |
Income Below Poverty Among Married-Couple vs Single-Parent Households in Soldiers Grove
The poverty data for Soldiers Grove shows that 1 of the married-couple family households (1.5%) and 11 of the single-parent households (24.4%) are living below the poverty level. Within the married-couple family households, those with no children have the highest poverty rate, with 1 households (2.0%) falling below the poverty line. Among the single-parent households, those with 3 or 4 children have the highest poverty rate, with 4 household (57.1%) living below poverty.
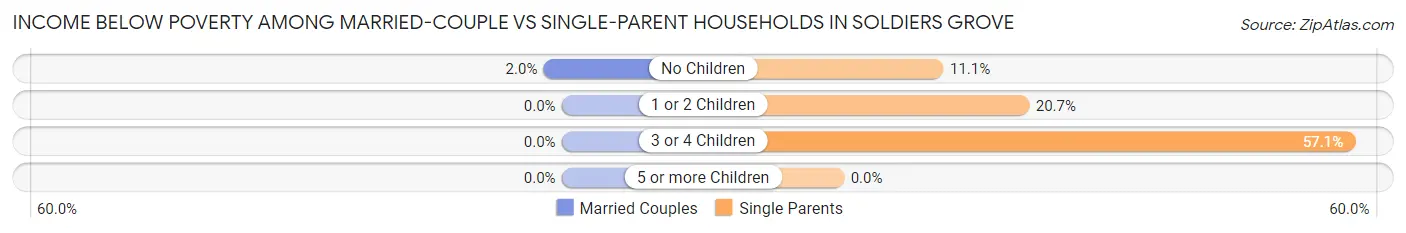
| Children | Married-Couple Families | Single-Parent Households |
| No Children | 1 (2.0%) | 1 (11.1%) |
| 1 or 2 Children | 0 (0.0%) | 6 (20.7%) |
| 3 or 4 Children | 0 (0.0%) | 4 (57.1%) |
| 5 or more Children | 0 (0.0%) | 0 (0.0%) |
| Total | 1 (1.5%) | 11 (24.4%) |
Race in Soldiers Grove
The most populous races in Soldiers Grove are White / Caucasian (503 | 92.0%), Two or more Races (19 | 3.5%), and Hispanic or Latino (11 | 2.0%).
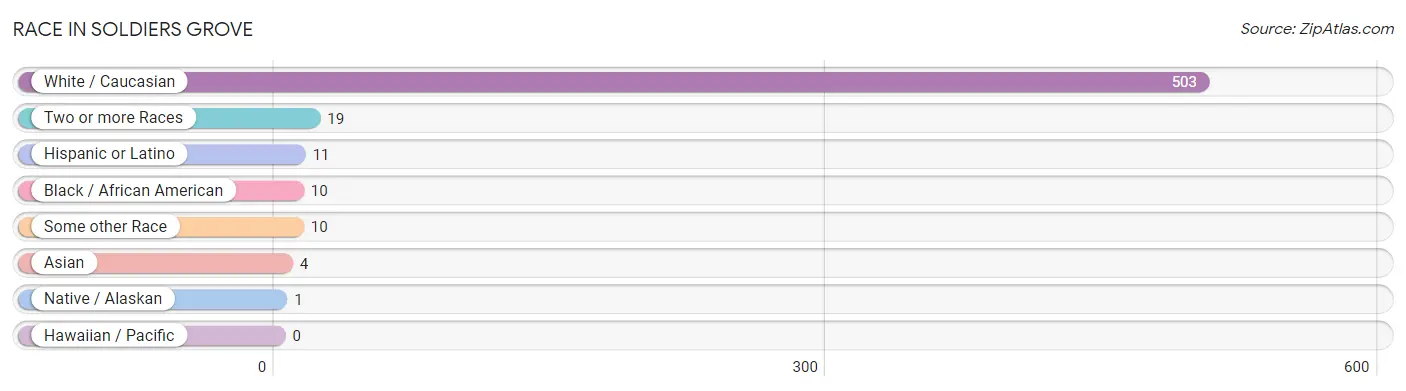
| Race | # Population | % Population |
| Asian | 4 | 0.7% |
| Black / African American | 10 | 1.8% |
| Hawaiian / Pacific | 0 | 0.0% |
| Hispanic or Latino | 11 | 2.0% |
| Native / Alaskan | 1 | 0.2% |
| White / Caucasian | 503 | 92.0% |
| Two or more Races | 19 | 3.5% |
| Some other Race | 10 | 1.8% |
| Total | 547 | 100.0% |
Ancestry in Soldiers Grove
The most populous ancestries reported in Soldiers Grove are Norwegian (201 | 36.7%), German (111 | 20.3%), Irish (48 | 8.8%), English (33 | 6.0%), and American (22 | 4.0%), together accounting for 75.9% of all Soldiers Grove residents.
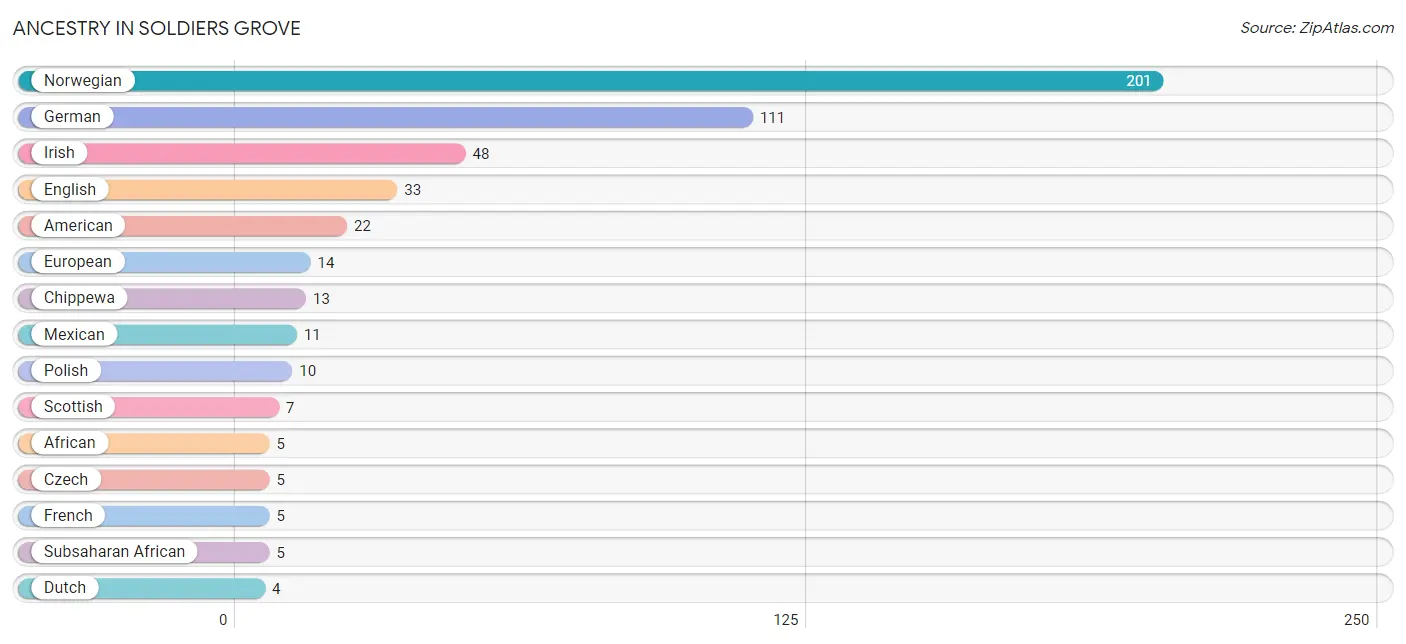
| Ancestry | # Population | % Population |
| African | 5 | 0.9% |
| American | 22 | 4.0% |
| Bhutanese | 1 | 0.2% |
| Burmese | 3 | 0.5% |
| Chippewa | 13 | 2.4% |
| Czech | 5 | 0.9% |
| Dutch | 4 | 0.7% |
| English | 33 | 6.0% |
| European | 14 | 2.6% |
| Finnish | 1 | 0.2% |
| French | 5 | 0.9% |
| German | 111 | 20.3% |
| Irish | 48 | 8.8% |
| Italian | 4 | 0.7% |
| Korean | 1 | 0.2% |
| Mexican | 11 | 2.0% |
| Norwegian | 201 | 36.7% |
| Polish | 10 | 1.8% |
| Russian | 1 | 0.2% |
| Scottish | 7 | 1.3% |
| Subsaharan African | 5 | 0.9% |
| Swedish | 2 | 0.4% | View All 22 Rows |
Immigrants in Soldiers Grove
The most numerous immigrant groups reported in Soldiers Grove came from Asia (4 | 0.7%), Eastern Asia (3 | 0.5%), Korea (3 | 0.5%), Philippines (1 | 0.2%), and South Eastern Asia (1 | 0.2%), together accounting for 2.2% of all Soldiers Grove residents.
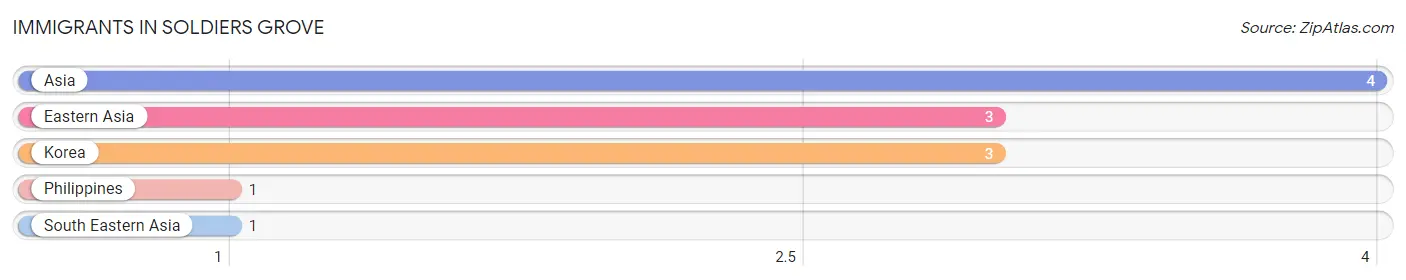
| Immigration Origin | # Population | % Population |
| Asia | 4 | 0.7% |
| Eastern Asia | 3 | 0.5% |
| Korea | 3 | 0.5% |
| Philippines | 1 | 0.2% |
| South Eastern Asia | 1 | 0.2% | View All 5 Rows |
Sex and Age in Soldiers Grove
Sex and Age in Soldiers Grove
The most populous age groups in Soldiers Grove are 15 to 19 Years (39 | 15.2%) for men and 10 to 14 Years (45 | 15.5%) for women.
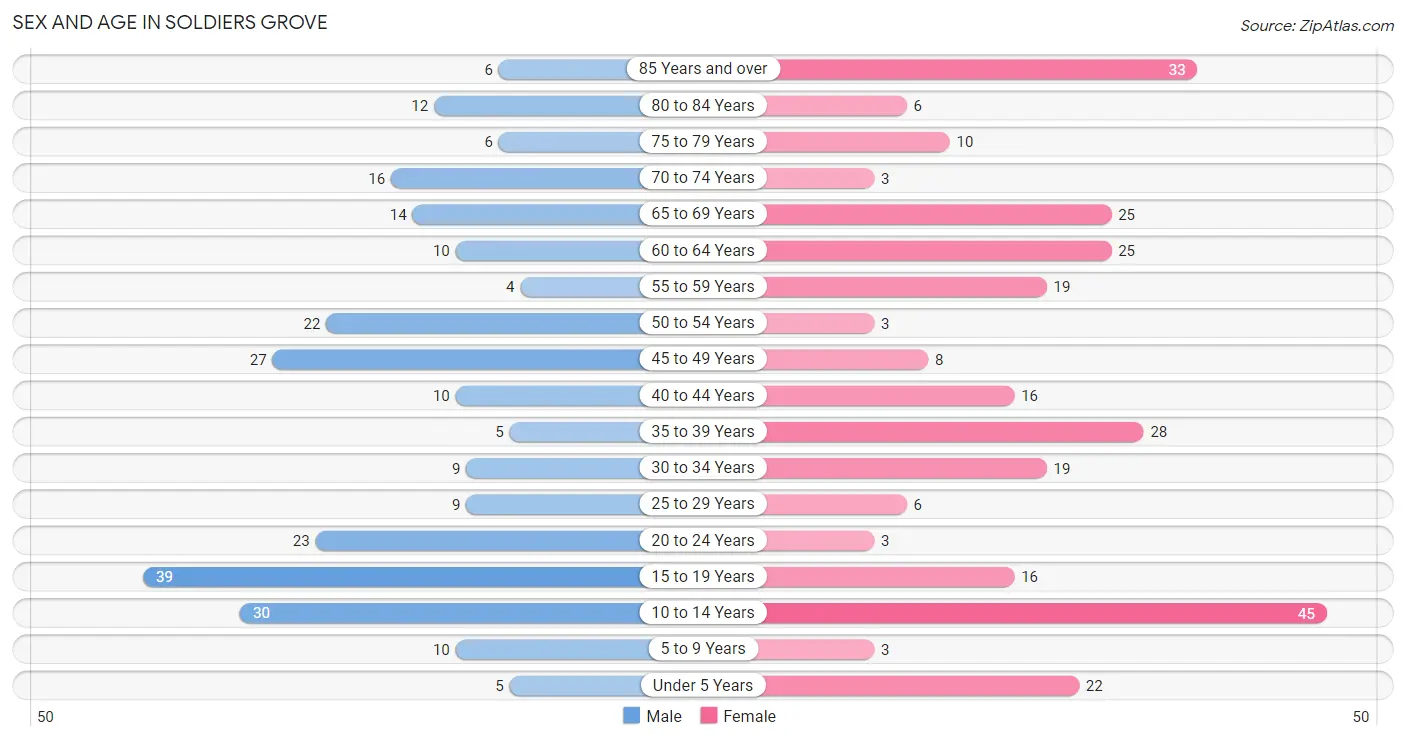
| Age Bracket | Male | Female |
| Under 5 Years | 5 (1.9%) | 22 (7.6%) |
| 5 to 9 Years | 10 (3.9%) | 3 (1.0%) |
| 10 to 14 Years | 30 (11.7%) | 45 (15.5%) |
| 15 to 19 Years | 39 (15.2%) | 16 (5.5%) |
| 20 to 24 Years | 23 (8.9%) | 3 (1.0%) |
| 25 to 29 Years | 9 (3.5%) | 6 (2.1%) |
| 30 to 34 Years | 9 (3.5%) | 19 (6.6%) |
| 35 to 39 Years | 5 (1.9%) | 28 (9.7%) |
| 40 to 44 Years | 10 (3.9%) | 16 (5.5%) |
| 45 to 49 Years | 27 (10.5%) | 8 (2.8%) |
| 50 to 54 Years | 22 (8.6%) | 3 (1.0%) |
| 55 to 59 Years | 4 (1.6%) | 19 (6.6%) |
| 60 to 64 Years | 10 (3.9%) | 25 (8.6%) |
| 65 to 69 Years | 14 (5.4%) | 25 (8.6%) |
| 70 to 74 Years | 16 (6.2%) | 3 (1.0%) |
| 75 to 79 Years | 6 (2.3%) | 10 (3.5%) |
| 80 to 84 Years | 12 (4.7%) | 6 (2.1%) |
| 85 Years and over | 6 (2.3%) | 33 (11.4%) |
| Total | 257 (100.0%) | 290 (100.0%) |
Families and Households in Soldiers Grove
Median Family Size in Soldiers Grove
The median family size in Soldiers Grove is 3.47 persons per family, with single female/mother families (38 | 34.2%) accounting for the largest median family size of 4.76 persons per family. On the other hand, single male/father families (7 | 6.3%) represent the smallest median family size with 2.14 persons per family.
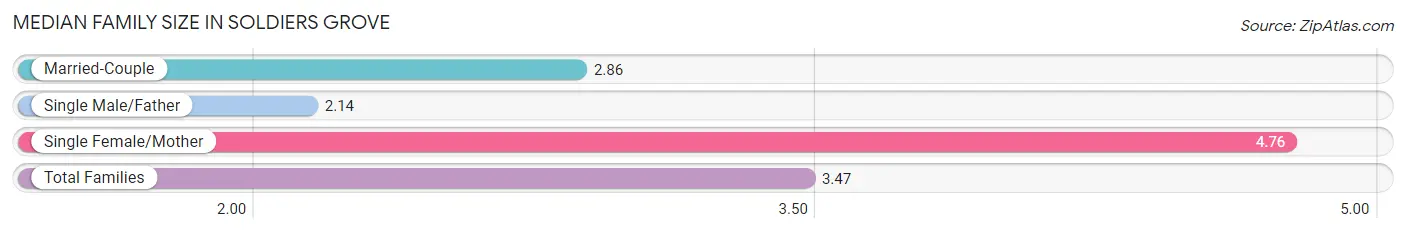
| Family Type | # Families | Family Size |
| Married-Couple | 66 (59.5%) | 2.86 |
| Single Male/Father | 7 (6.3%) | 2.14 |
| Single Female/Mother | 38 (34.2%) | 4.76 |
| Total Families | 111 (100.0%) | 3.47 |
Median Household Size in Soldiers Grove
The median household size in Soldiers Grove is 2.60 persons per household, with single female/mother households (38 | 19.9%) accounting for the largest median household size of 5.24 persons per household. non-family households (80 | 41.9%) represent the smallest median household size with 1.11 persons per household.
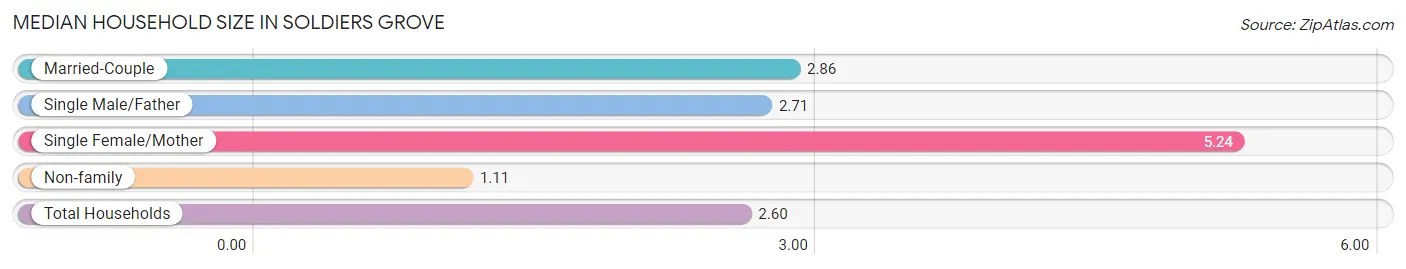
| Household Type | # Households | Household Size |
| Married-Couple | 66 (34.5%) | 2.86 |
| Single Male/Father | 7 (3.7%) | 2.71 |
| Single Female/Mother | 38 (19.9%) | 5.24 |
| Non-family | 80 (41.9%) | 1.11 |
| Total Households | 191 (100.0%) | 2.60 |
Household Size by Marriage Status in Soldiers Grove
Out of a total of 191 households in Soldiers Grove, 111 (58.1%) are family households, while 80 (41.9%) are nonfamily households. The most numerous type of family households are 2-person households, comprising 66, and the most common type of nonfamily households are 1-person households, comprising 71.
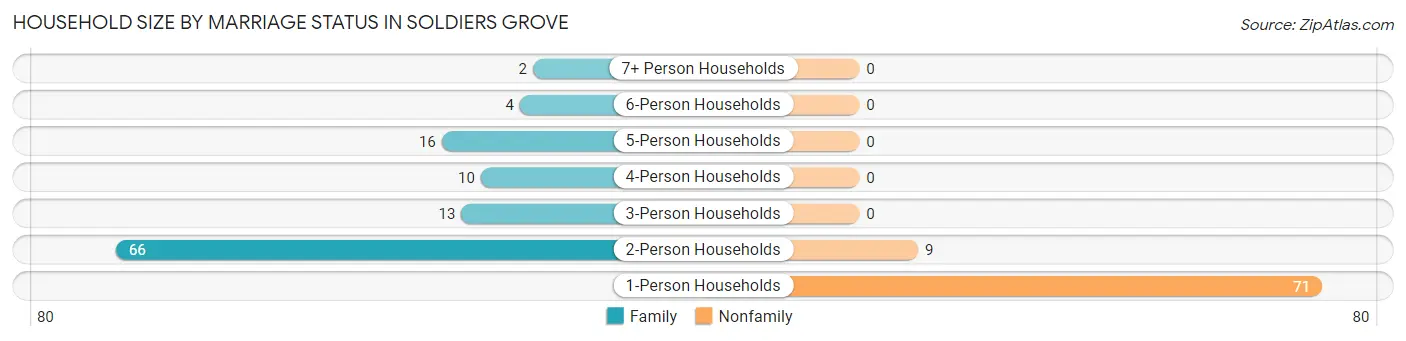
| Household Size | Family Households | Nonfamily Households |
| 1-Person Households | - | 71 (37.2%) |
| 2-Person Households | 66 (34.5%) | 9 (4.7%) |
| 3-Person Households | 13 (6.8%) | 0 (0.0%) |
| 4-Person Households | 10 (5.2%) | 0 (0.0%) |
| 5-Person Households | 16 (8.4%) | 0 (0.0%) |
| 6-Person Households | 4 (2.1%) | 0 (0.0%) |
| 7+ Person Households | 2 (1.1%) | 0 (0.0%) |
| Total | 111 (58.1%) | 80 (41.9%) |
Female Fertility in Soldiers Grove
Fertility by Age in Soldiers Grove
Average fertility rate in Soldiers Grove is 222.0 births per 1,000 women. Women in the age bracket of 20 to 34 years have the highest fertility rate with 714.0 births per 1,000 women. Women in the age bracket of 20 to 34 years acount for 90.9% of all women with births.
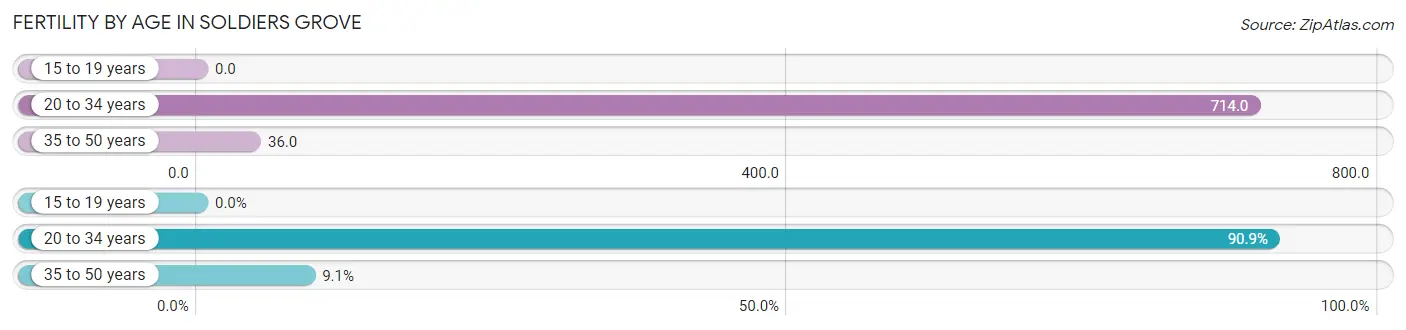
| Age Bracket | Women with Births | Births / 1,000 Women |
| 15 to 19 years | 0 (0.0%) | 0.0 |
| 20 to 34 years | 20 (90.9%) | 714.0 |
| 35 to 50 years | 2 (9.1%) | 36.0 |
| Total | 22 (100.0%) | 222.0 |
Fertility by Age by Marriage Status in Soldiers Grove
9.1% of women with births (22) in Soldiers Grove are married. The highest percentage of unmarried women with births falls into 20 to 34 years age bracket with 100.0% of them unmarried at the time of birth, while the lowest percentage of unmarried women with births belong to 35 to 50 years age bracket with 0.0% of them unmarried.
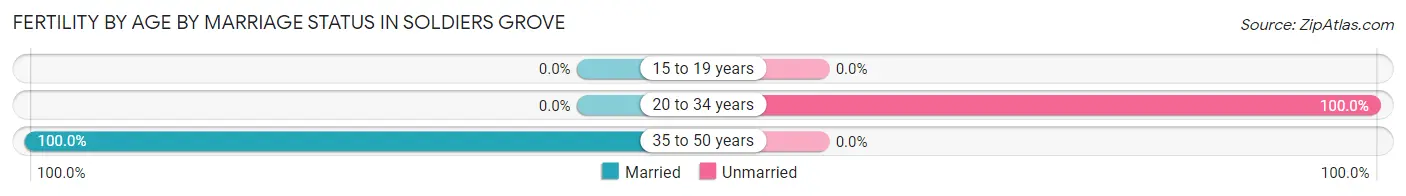
| Age Bracket | Married | Unmarried |
| 15 to 19 years | 0 (0.0%) | 0 (0.0%) |
| 20 to 34 years | 0 (0.0%) | 20 (100.0%) |
| 35 to 50 years | 2 (100.0%) | 0 (0.0%) |
| Total | 2 (9.1%) | 20 (90.9%) |
Fertility by Education in Soldiers Grove
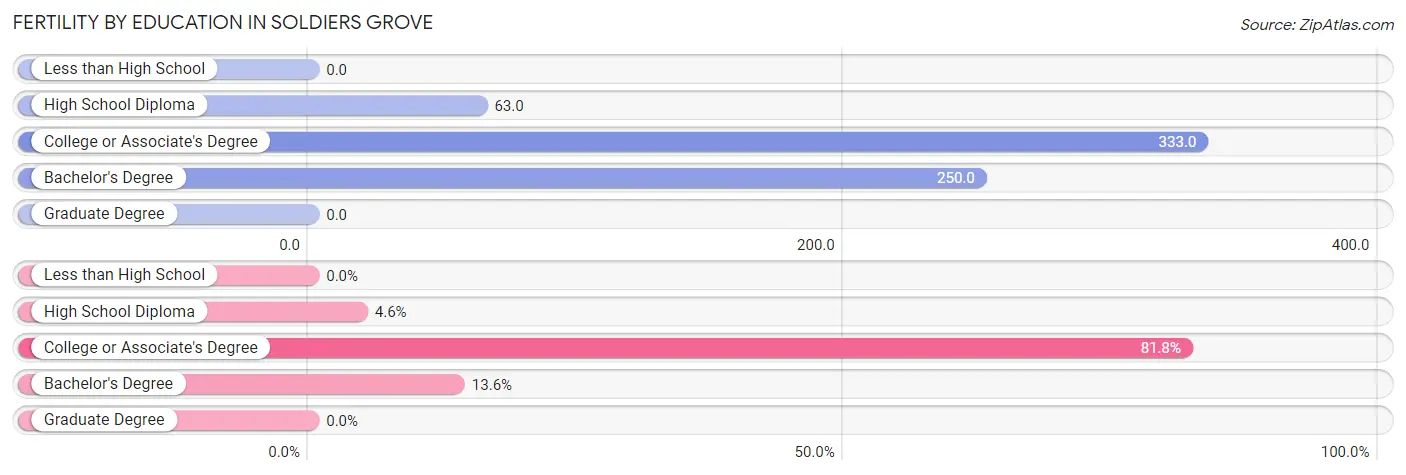
| Educational Attainment | Women with Births | Births / 1,000 Women |
| Less than High School | 0 (0.0%) | 0.0 |
| High School Diploma | 1 (4.5%) | 63.0 |
| College or Associate's Degree | 18 (81.8%) | 333.0 |
| Bachelor's Degree | 3 (13.6%) | 250.0 |
| Graduate Degree | 0 (0.0%) | 0.0 |
| Total | 22 (100.0%) | 222.0 |
Fertility by Education by Marriage Status in Soldiers Grove
90.9% of women with births in Soldiers Grove are unmarried. Women with the educational attainment of college or associate's degree are most likely to be married with 11.1% of them married at childbirth, while women with the educational attainment of high school diploma are least likely to be married with 100.0% of them unmarried at childbirth.
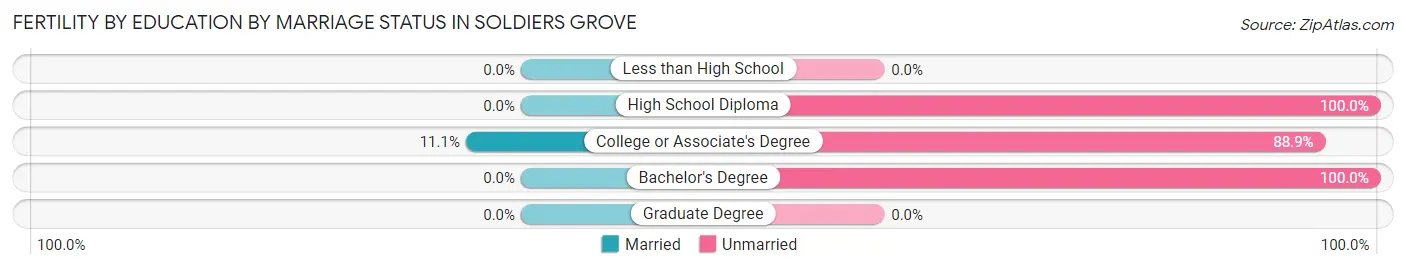
| Educational Attainment | Married | Unmarried |
| Less than High School | 0 (0.0%) | 0 (0.0%) |
| High School Diploma | 0 (0.0%) | 1 (100.0%) |
| College or Associate's Degree | 2 (11.1%) | 16 (88.9%) |
| Bachelor's Degree | 0 (0.0%) | 3 (100.0%) |
| Graduate Degree | 0 (0.0%) | 0 (0.0%) |
| Total | 2 (9.1%) | 20 (90.9%) |
Employment Characteristics in Soldiers Grove
Employment by Class of Employer in Soldiers Grove
Among the 210 employed individuals in Soldiers Grove, private company employees (158 | 75.2%), local government employees (32 | 15.2%), and self-employed (not incorporated) (6 | 2.9%) make up the most common classes of employment.
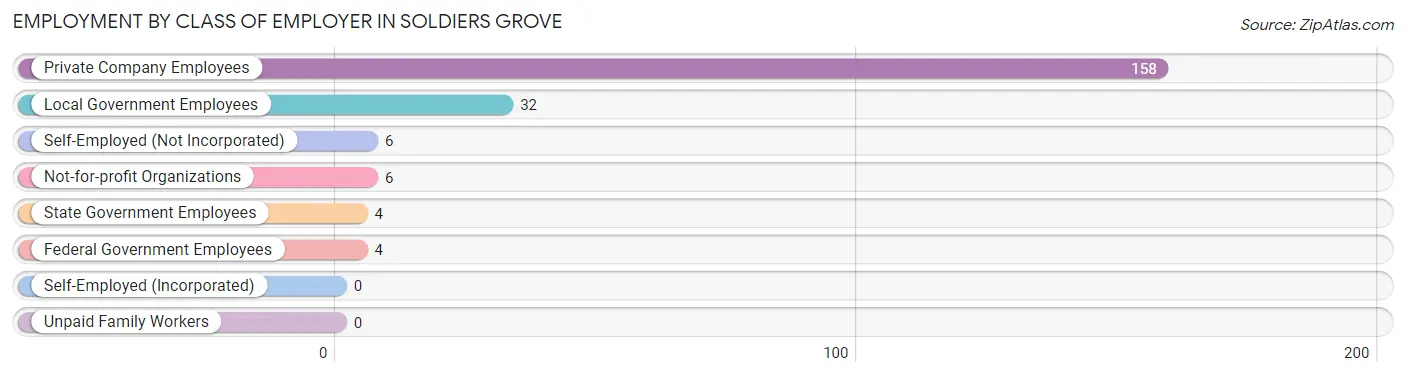
| Employer Class | # Employees | % Employees |
| Private Company Employees | 158 | 75.2% |
| Self-Employed (Incorporated) | 0 | 0.0% |
| Self-Employed (Not Incorporated) | 6 | 2.9% |
| Not-for-profit Organizations | 6 | 2.9% |
| Local Government Employees | 32 | 15.2% |
| State Government Employees | 4 | 1.9% |
| Federal Government Employees | 4 | 1.9% |
| Unpaid Family Workers | 0 | 0.0% |
| Total | 210 | 100.0% |
Employment Status by Age in Soldiers Grove
According to the labor force statistics for Soldiers Grove, out of the total population over 16 years of age (423), 50.8% or 215 individuals are in the labor force, with 2.3% or 5 of them unemployed. The age group with the highest labor force participation rate is 20 to 24 years, with 100.0% or 26 individuals in the labor force. Within the labor force, the 30 to 34 years age range has the highest percentage of unemployed individuals, with 9.1% or 1 of them being unemployed.
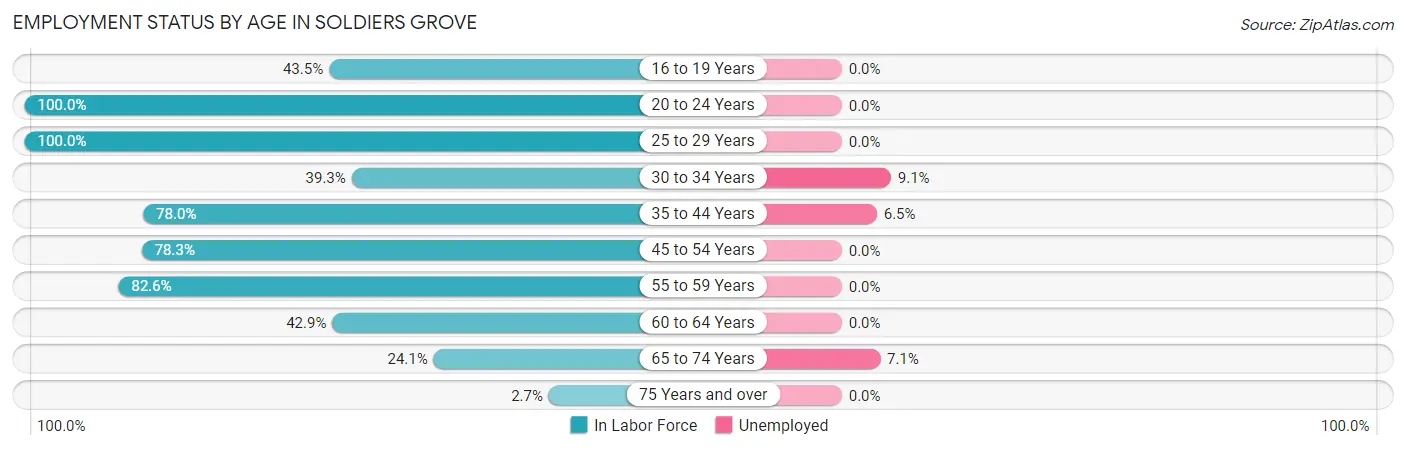
| Age Bracket | In Labor Force | Unemployed |
| 16 to 19 Years | 20 (43.5%) | 0 (0.0%) |
| 20 to 24 Years | 26 (100.0%) | 0 (0.0%) |
| 25 to 29 Years | 15 (100.0%) | 0 (0.0%) |
| 30 to 34 Years | 11 (39.3%) | 1 (9.1%) |
| 35 to 44 Years | 46 (78.0%) | 3 (6.5%) |
| 45 to 54 Years | 47 (78.3%) | 0 (0.0%) |
| 55 to 59 Years | 19 (82.6%) | 0 (0.0%) |
| 60 to 64 Years | 15 (42.9%) | 0 (0.0%) |
| 65 to 74 Years | 14 (24.1%) | 1 (7.1%) |
| 75 Years and over | 2 (2.7%) | 0 (0.0%) |
| Total | 215 (50.8%) | 5 (2.3%) |
Employment Status by Educational Attainment in Soldiers Grove
According to labor force statistics for Soldiers Grove, 69.5% of individuals (153) out of the total population between 25 and 64 years of age (220) are in the labor force, with 2.6% or 4 of them being unemployed. The group with the highest labor force participation rate are those with the educational attainment of bachelor's degree or higher, with 86.8% or 33 individuals in the labor force. Within the labor force, individuals with high school diploma education have the highest percentage of unemployment, with 7.1% or 4 of them being unemployed.
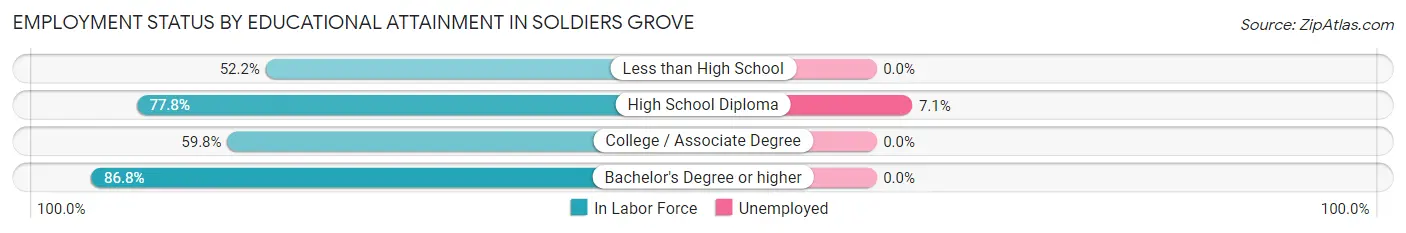
| Educational Attainment | In Labor Force | Unemployed |
| Less than High School | 12 (52.2%) | 0 (0.0%) |
| High School Diploma | 56 (77.8%) | 5 (7.1%) |
| College / Associate Degree | 52 (59.8%) | 0 (0.0%) |
| Bachelor's Degree or higher | 33 (86.8%) | 0 (0.0%) |
| Total | 153 (69.5%) | 6 (2.6%) |
Employment Occupations by Sex in Soldiers Grove
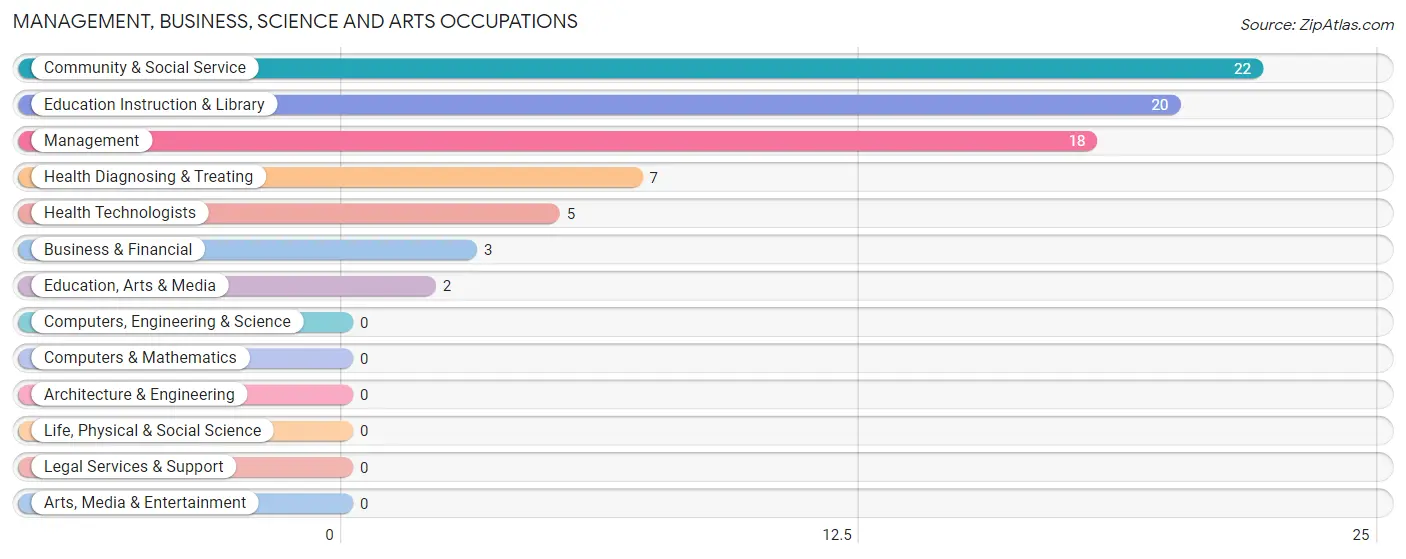
Management, Business, Science and Arts Occupations
The most common Management, Business, Science and Arts occupations in Soldiers Grove are Community & Social Service (22 | 10.5%), Education Instruction & Library (20 | 9.5%), Management (18 | 8.6%), Health Diagnosing & Treating (7 | 3.3%), and Health Technologists (5 | 2.4%).
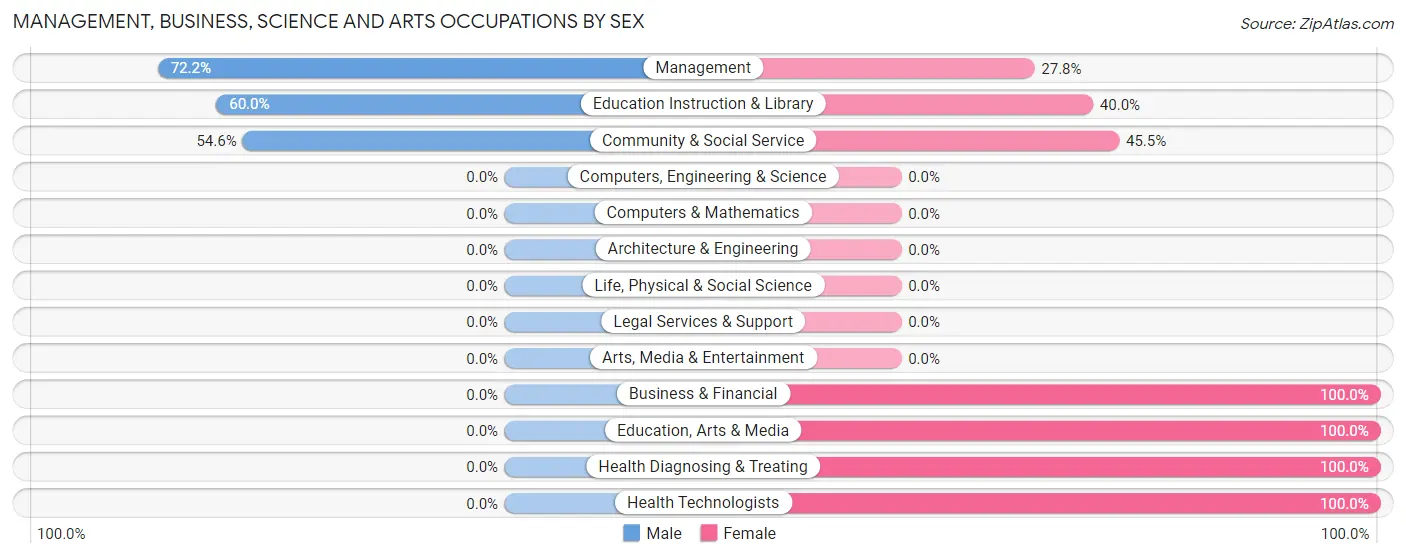
Management, Business, Science and Arts Occupations by Sex
Within the Management, Business, Science and Arts occupations in Soldiers Grove, the most male-oriented occupations are Management (72.2%), Education Instruction & Library (60.0%), and Community & Social Service (54.5%), while the most female-oriented occupations are Business & Financial (100.0%), Education, Arts & Media (100.0%), and Health Diagnosing & Treating (100.0%).
| Occupation | Male | Female |
| Management | 13 (72.2%) | 5 (27.8%) |
| Business & Financial | 0 (0.0%) | 3 (100.0%) |
| Computers, Engineering & Science | 0 (0.0%) | 0 (0.0%) |
| Computers & Mathematics | 0 (0.0%) | 0 (0.0%) |
| Architecture & Engineering | 0 (0.0%) | 0 (0.0%) |
| Life, Physical & Social Science | 0 (0.0%) | 0 (0.0%) |
| Community & Social Service | 12 (54.5%) | 10 (45.5%) |
| Education, Arts & Media | 0 (0.0%) | 2 (100.0%) |
| Legal Services & Support | 0 (0.0%) | 0 (0.0%) |
| Education Instruction & Library | 12 (60.0%) | 8 (40.0%) |
| Arts, Media & Entertainment | 0 (0.0%) | 0 (0.0%) |
| Health Diagnosing & Treating | 0 (0.0%) | 7 (100.0%) |
| Health Technologists | 0 (0.0%) | 5 (100.0%) |
| Total (Category) | 25 (50.0%) | 25 (50.0%) |
| Total (Overall) | 123 (58.6%) | 87 (41.4%) |
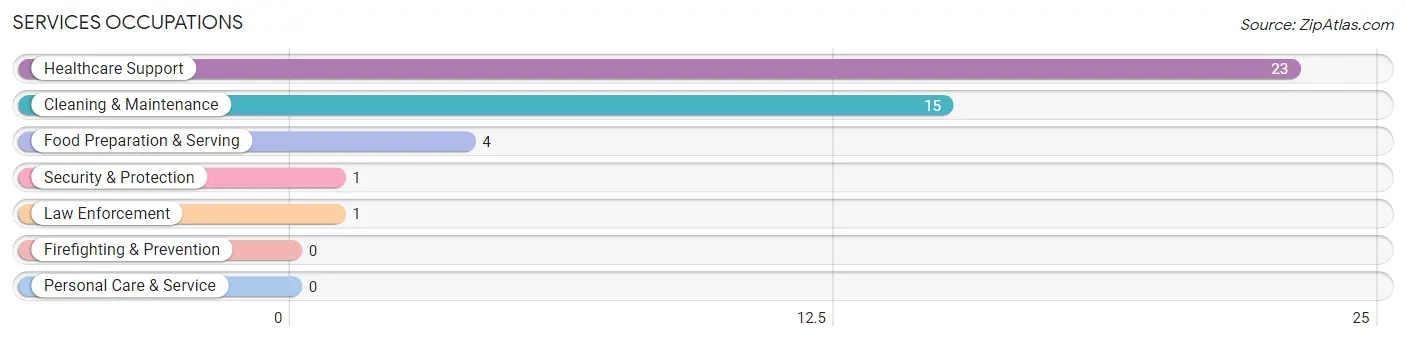
Services Occupations
The most common Services occupations in Soldiers Grove are Healthcare Support (23 | 11.0%), Cleaning & Maintenance (15 | 7.1%), Food Preparation & Serving (4 | 1.9%), Security & Protection (1 | 0.5%), and Law Enforcement (1 | 0.5%).
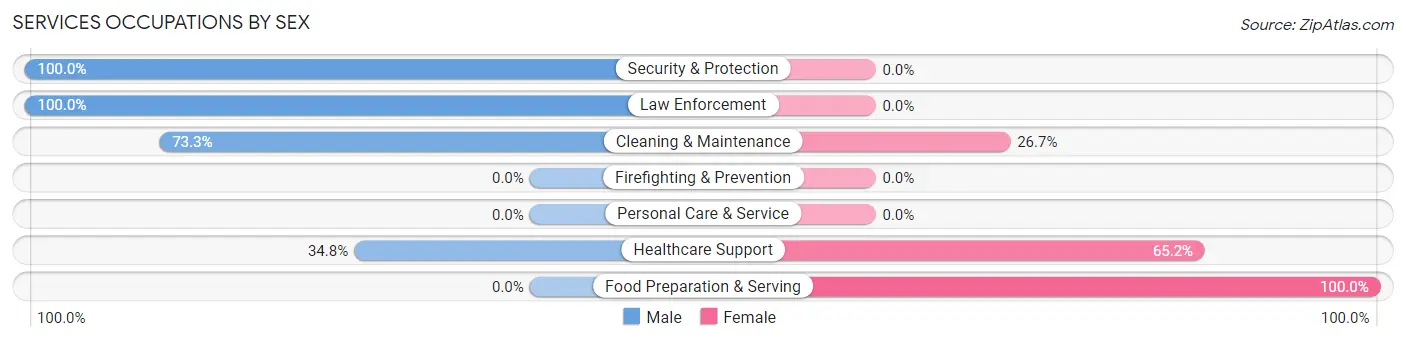
Services Occupations by Sex
Within the Services occupations in Soldiers Grove, the most male-oriented occupations are Security & Protection (100.0%), Law Enforcement (100.0%), and Cleaning & Maintenance (73.3%), while the most female-oriented occupations are Food Preparation & Serving (100.0%), Healthcare Support (65.2%), and Cleaning & Maintenance (26.7%).
| Occupation | Male | Female |
| Healthcare Support | 8 (34.8%) | 15 (65.2%) |
| Security & Protection | 1 (100.0%) | 0 (0.0%) |
| Firefighting & Prevention | 0 (0.0%) | 0 (0.0%) |
| Law Enforcement | 1 (100.0%) | 0 (0.0%) |
| Food Preparation & Serving | 0 (0.0%) | 4 (100.0%) |
| Cleaning & Maintenance | 11 (73.3%) | 4 (26.7%) |
| Personal Care & Service | 0 (0.0%) | 0 (0.0%) |
| Total (Category) | 20 (46.5%) | 23 (53.5%) |
| Total (Overall) | 123 (58.6%) | 87 (41.4%) |
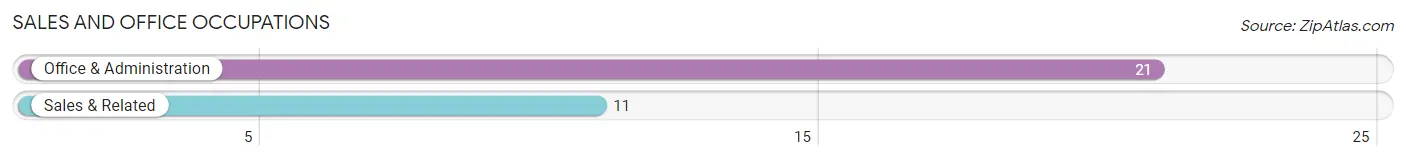
Sales and Office Occupations
The most common Sales and Office occupations in Soldiers Grove are Office & Administration (21 | 10.0%), and Sales & Related (11 | 5.2%).
Sales and Office Occupations by Sex
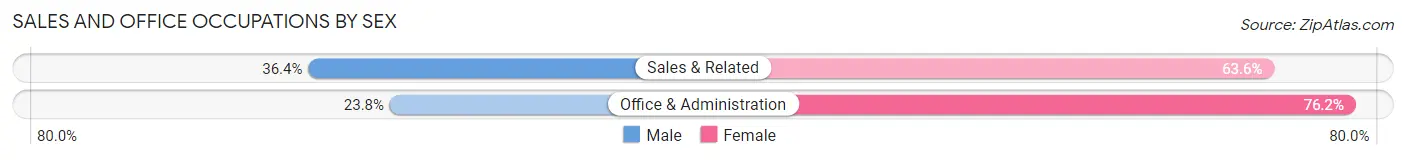
| Occupation | Male | Female |
| Sales & Related | 4 (36.4%) | 7 (63.6%) |
| Office & Administration | 5 (23.8%) | 16 (76.2%) |
| Total (Category) | 9 (28.1%) | 23 (71.9%) |
| Total (Overall) | 123 (58.6%) | 87 (41.4%) |
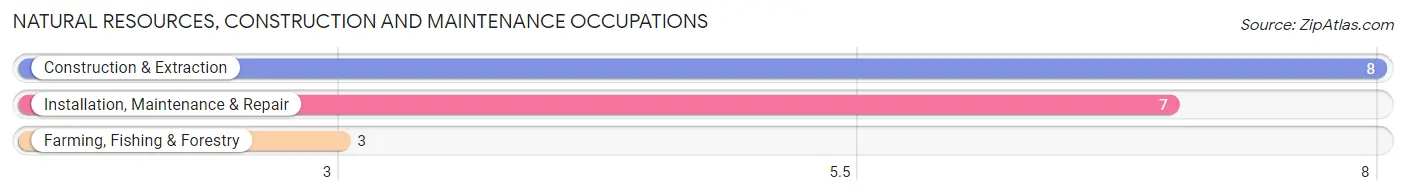
Natural Resources, Construction and Maintenance Occupations
The most common Natural Resources, Construction and Maintenance occupations in Soldiers Grove are Construction & Extraction (8 | 3.8%), Installation, Maintenance & Repair (7 | 3.3%), and Farming, Fishing & Forestry (3 | 1.4%).
Natural Resources, Construction and Maintenance Occupations by Sex
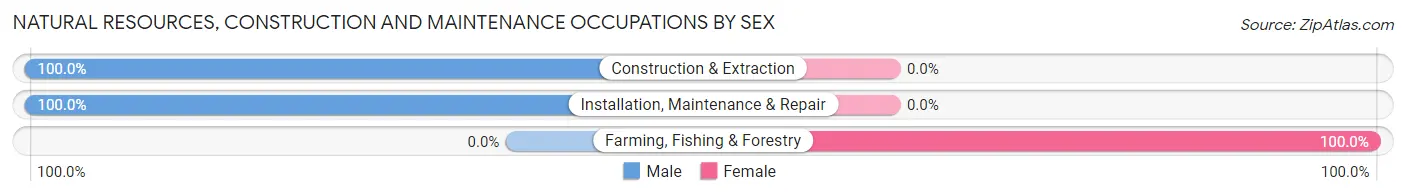
| Occupation | Male | Female |
| Farming, Fishing & Forestry | 0 (0.0%) | 3 (100.0%) |
| Construction & Extraction | 8 (100.0%) | 0 (0.0%) |
| Installation, Maintenance & Repair | 7 (100.0%) | 0 (0.0%) |
| Total (Category) | 15 (83.3%) | 3 (16.7%) |
| Total (Overall) | 123 (58.6%) | 87 (41.4%) |
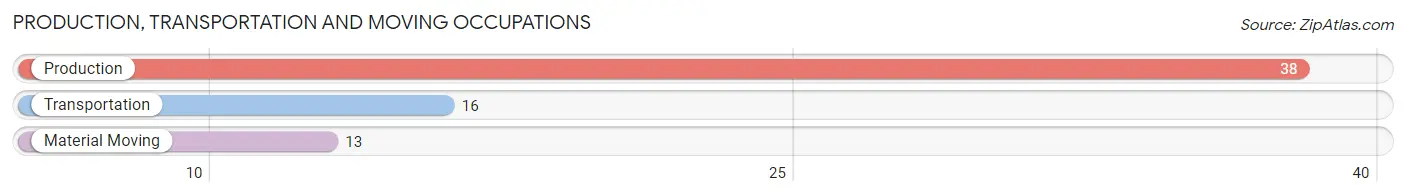
Production, Transportation and Moving Occupations
The most common Production, Transportation and Moving occupations in Soldiers Grove are Production (38 | 18.1%), Transportation (16 | 7.6%), and Material Moving (13 | 6.2%).
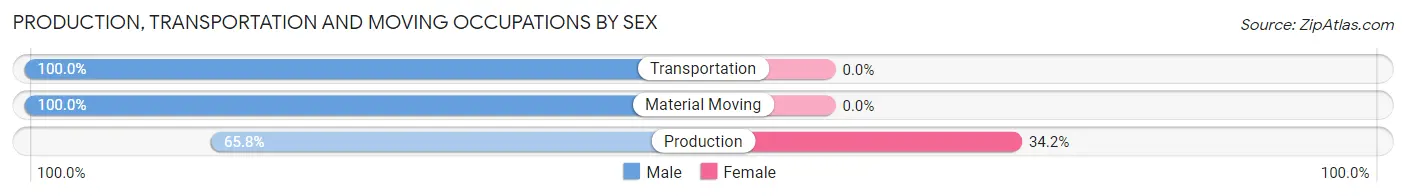
Production, Transportation and Moving Occupations by Sex
| Occupation | Male | Female |
| Production | 25 (65.8%) | 13 (34.2%) |
| Transportation | 16 (100.0%) | 0 (0.0%) |
| Material Moving | 13 (100.0%) | 0 (0.0%) |
| Total (Category) | 54 (80.6%) | 13 (19.4%) |
| Total (Overall) | 123 (58.6%) | 87 (41.4%) |
Employment Industries by Sex in Soldiers Grove
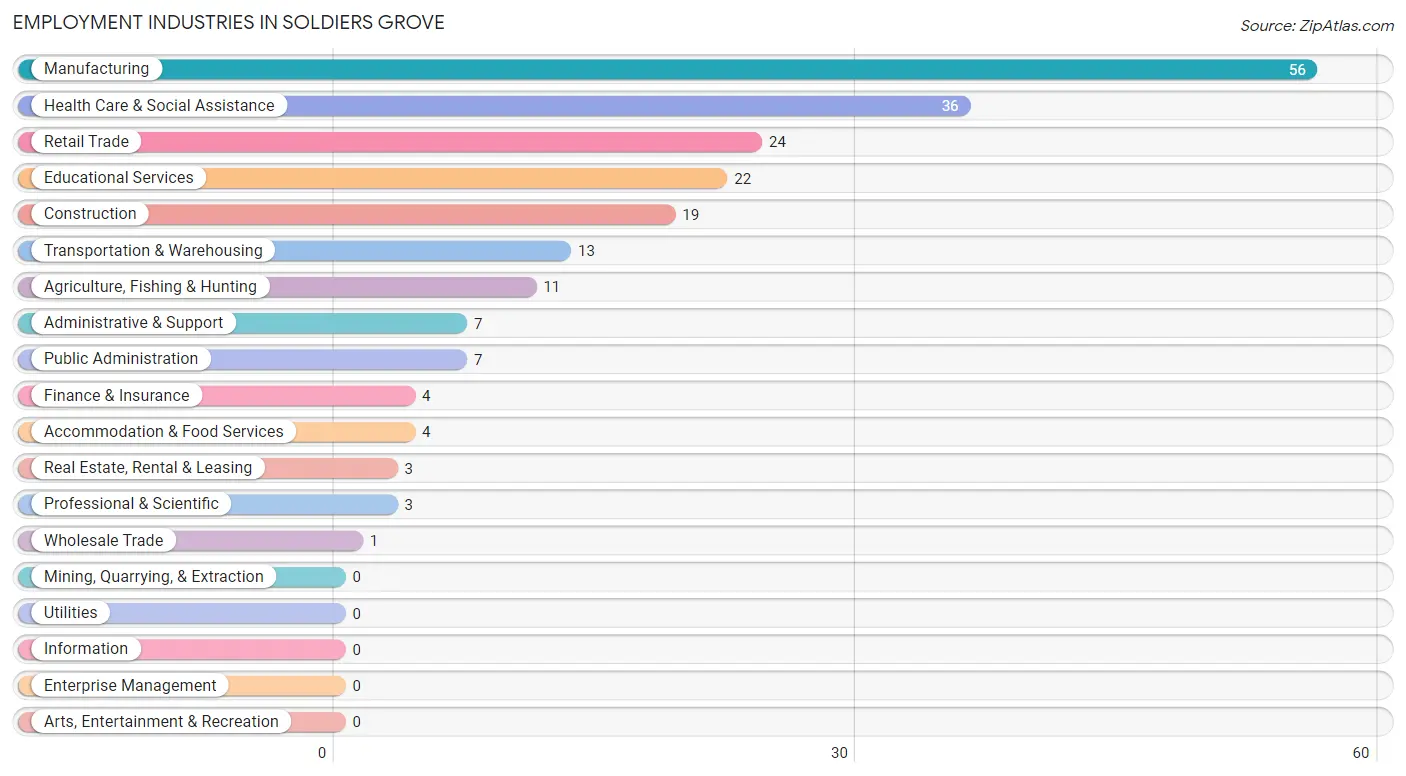
Employment Industries in Soldiers Grove
The major employment industries in Soldiers Grove include Manufacturing (56 | 26.7%), Health Care & Social Assistance (36 | 17.1%), Retail Trade (24 | 11.4%), Educational Services (22 | 10.5%), and Construction (19 | 9.0%).
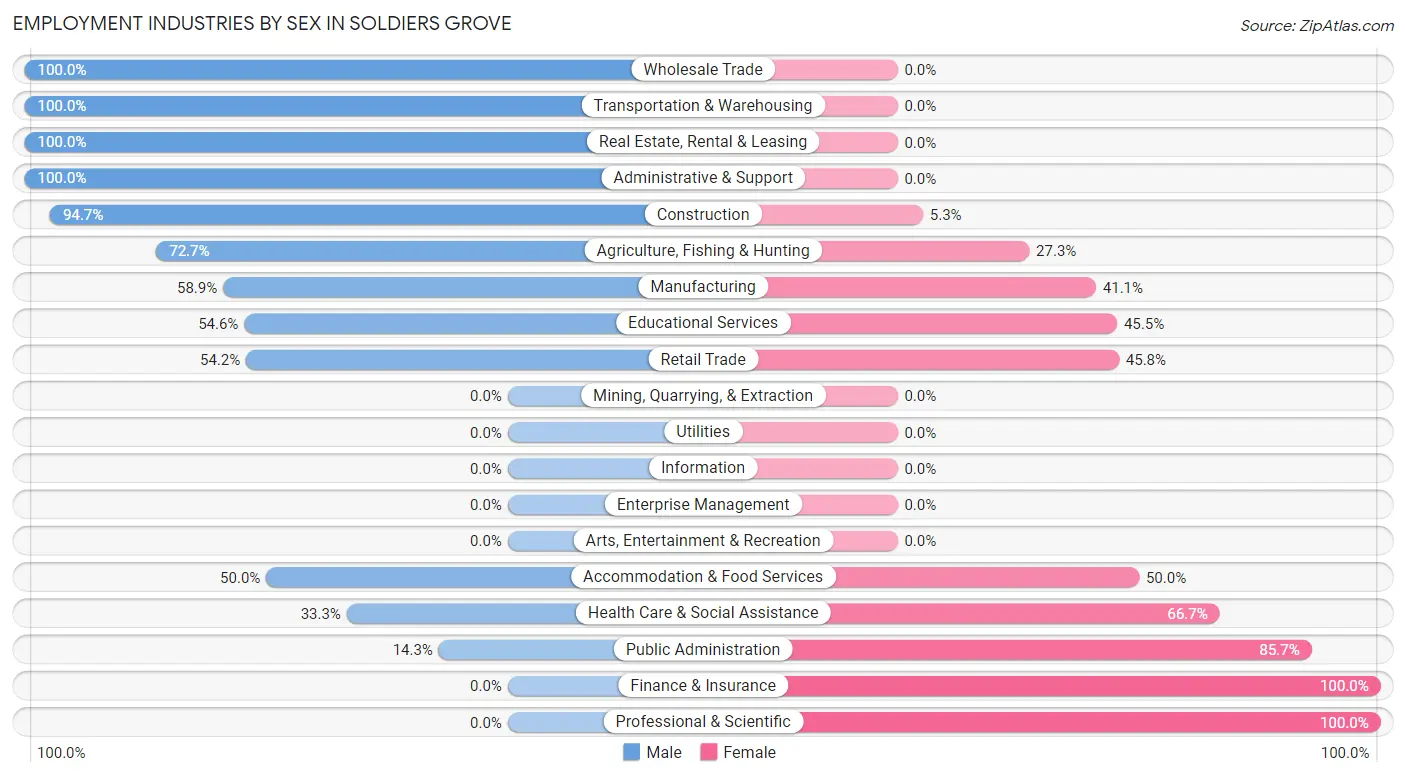
Employment Industries by Sex in Soldiers Grove
The Soldiers Grove industries that see more men than women are Wholesale Trade (100.0%), Transportation & Warehousing (100.0%), and Real Estate, Rental & Leasing (100.0%), whereas the industries that tend to have a higher number of women are Finance & Insurance (100.0%), Professional & Scientific (100.0%), and Public Administration (85.7%).
| Industry | Male | Female |
| Agriculture, Fishing & Hunting | 8 (72.7%) | 3 (27.3%) |
| Mining, Quarrying, & Extraction | 0 (0.0%) | 0 (0.0%) |
| Construction | 18 (94.7%) | 1 (5.3%) |
| Manufacturing | 33 (58.9%) | 23 (41.1%) |
| Wholesale Trade | 1 (100.0%) | 0 (0.0%) |
| Retail Trade | 13 (54.2%) | 11 (45.8%) |
| Transportation & Warehousing | 13 (100.0%) | 0 (0.0%) |
| Utilities | 0 (0.0%) | 0 (0.0%) |
| Information | 0 (0.0%) | 0 (0.0%) |
| Finance & Insurance | 0 (0.0%) | 4 (100.0%) |
| Real Estate, Rental & Leasing | 3 (100.0%) | 0 (0.0%) |
| Professional & Scientific | 0 (0.0%) | 3 (100.0%) |
| Enterprise Management | 0 (0.0%) | 0 (0.0%) |
| Administrative & Support | 7 (100.0%) | 0 (0.0%) |
| Educational Services | 12 (54.5%) | 10 (45.5%) |
| Health Care & Social Assistance | 12 (33.3%) | 24 (66.7%) |
| Arts, Entertainment & Recreation | 0 (0.0%) | 0 (0.0%) |
| Accommodation & Food Services | 2 (50.0%) | 2 (50.0%) |
| Public Administration | 1 (14.3%) | 6 (85.7%) |
| Total | 123 (58.6%) | 87 (41.4%) |
Education in Soldiers Grove
School Enrollment in Soldiers Grove
The most common levels of schooling among the 122 students in Soldiers Grove are high school (50 | 41.0%), middle school (34 | 27.9%), and college / undergraduate (22 | 18.0%).
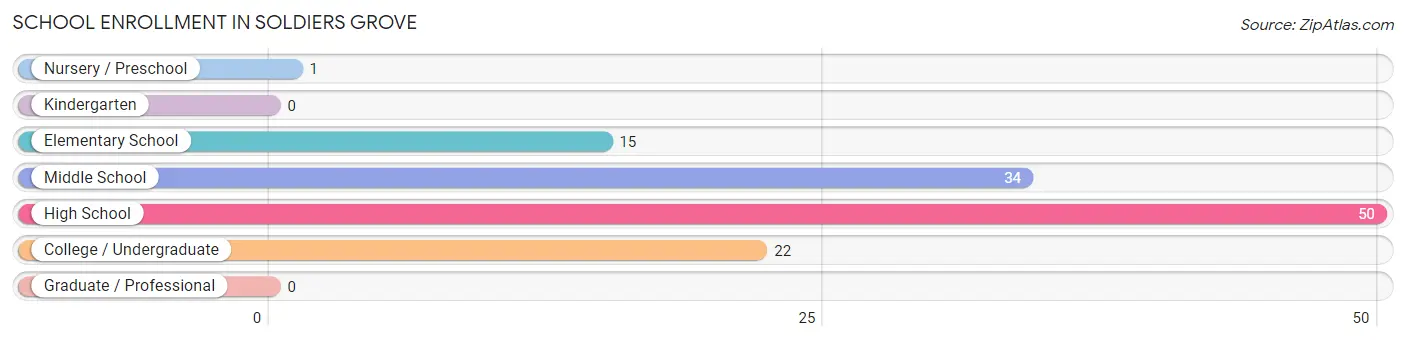
| School Level | # Students | % Students |
| Nursery / Preschool | 1 | 0.8% |
| Kindergarten | 0 | 0.0% |
| Elementary School | 15 | 12.3% |
| Middle School | 34 | 27.9% |
| High School | 50 | 41.0% |
| College / Undergraduate | 22 | 18.0% |
| Graduate / Professional | 0 | 0.0% |
| Total | 122 | 100.0% |
School Enrollment by Age by Funding Source in Soldiers Grove
Out of a total of 122 students who are enrolled in schools in Soldiers Grove, 10 (8.2%) attend a private institution, while the remaining 112 (91.8%) are enrolled in public schools. The age group of 3 to 4 year olds has the highest likelihood of being enrolled in private schools, with 1 (100.0% in the age bracket) enrolled. Conversely, the age group of 18 to 19 year olds has the lowest likelihood of being enrolled in a private school, with 10 (100.0% in the age bracket) attending a public institution.
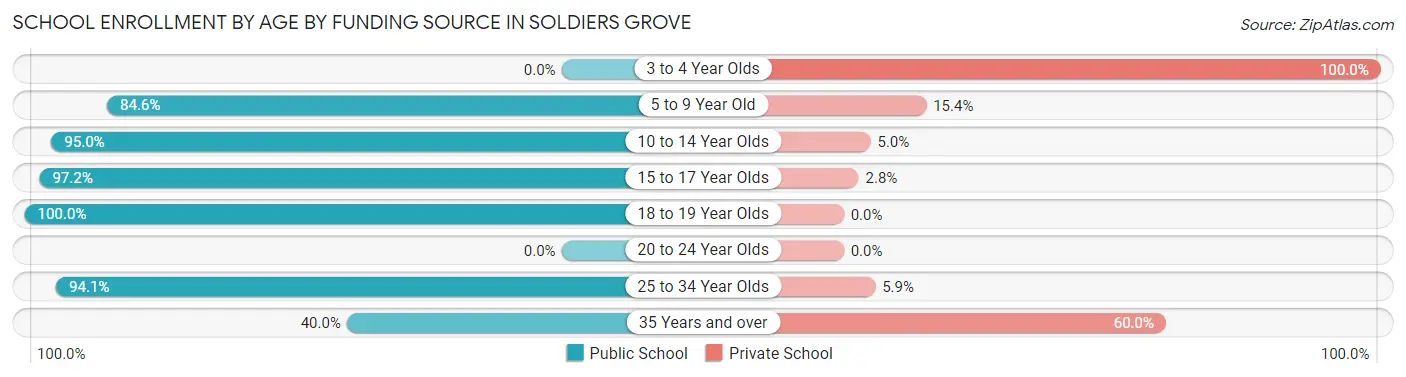
| Age Bracket | Public School | Private School |
| 3 to 4 Year Olds | 0 (0.0%) | 1 (100.0%) |
| 5 to 9 Year Old | 11 (84.6%) | 2 (15.4%) |
| 10 to 14 Year Olds | 38 (95.0%) | 2 (5.0%) |
| 15 to 17 Year Olds | 35 (97.2%) | 1 (2.8%) |
| 18 to 19 Year Olds | 10 (100.0%) | 0 (0.0%) |
| 20 to 24 Year Olds | 0 (0.0%) | 0 (0.0%) |
| 25 to 34 Year Olds | 16 (94.1%) | 1 (5.9%) |
| 35 Years and over | 2 (40.0%) | 3 (60.0%) |
| Total | 112 (91.8%) | 10 (8.2%) |
Educational Attainment by Field of Study in Soldiers Grove
Education (25 | 46.3%), social sciences (9 | 16.7%), business (8 | 14.8%), arts & humanities (4 | 7.4%), and bio, nature & agricultural (3 | 5.6%) are the most common fields of study among 54 individuals in Soldiers Grove who have obtained a bachelor's degree or higher.
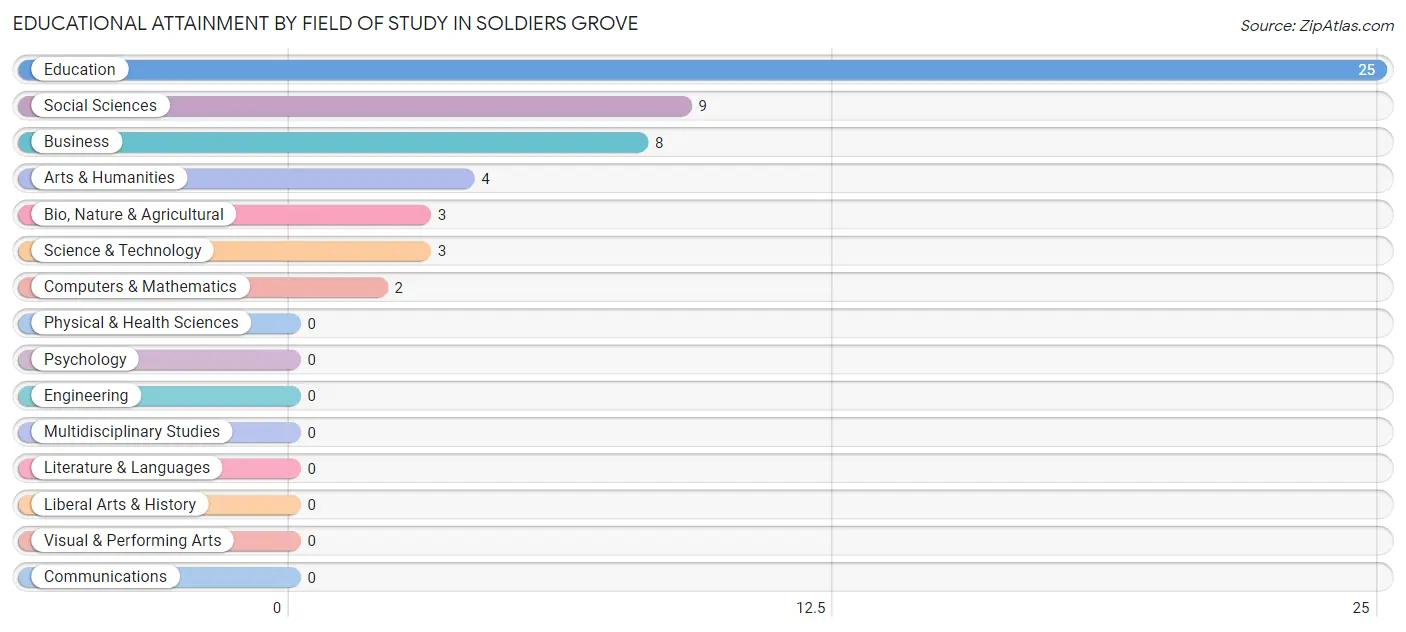
| Field of Study | # Graduates | % Graduates |
| Computers & Mathematics | 2 | 3.7% |
| Bio, Nature & Agricultural | 3 | 5.6% |
| Physical & Health Sciences | 0 | 0.0% |
| Psychology | 0 | 0.0% |
| Social Sciences | 9 | 16.7% |
| Engineering | 0 | 0.0% |
| Multidisciplinary Studies | 0 | 0.0% |
| Science & Technology | 3 | 5.6% |
| Business | 8 | 14.8% |
| Education | 25 | 46.3% |
| Literature & Languages | 0 | 0.0% |
| Liberal Arts & History | 0 | 0.0% |
| Visual & Performing Arts | 0 | 0.0% |
| Communications | 0 | 0.0% |
| Arts & Humanities | 4 | 7.4% |
| Total | 54 | 100.0% |
Transportation & Commute in Soldiers Grove
Vehicle Availability by Sex in Soldiers Grove
The most prevalent vehicle ownership categories in Soldiers Grove are males with 2 vehicles (33, accounting for 28.0%) and females with 2 vehicles (28, making up 37.9%).
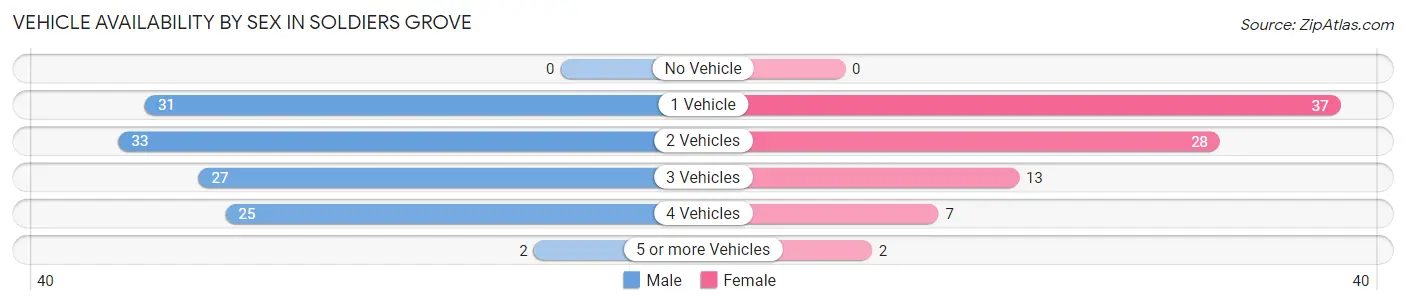
| Vehicles Available | Male | Female |
| No Vehicle | 0 (0.0%) | 0 (0.0%) |
| 1 Vehicle | 31 (26.3%) | 37 (42.5%) |
| 2 Vehicles | 33 (28.0%) | 28 (32.2%) |
| 3 Vehicles | 27 (22.9%) | 13 (14.9%) |
| 4 Vehicles | 25 (21.2%) | 7 (8.1%) |
| 5 or more Vehicles | 2 (1.7%) | 2 (2.3%) |
| Total | 118 (100.0%) | 87 (100.0%) |
Commute Time in Soldiers Grove
The most frequently occuring commute durations in Soldiers Grove are 20 to 24 minutes (53 commuters, 25.6%), 30 to 34 minutes (37 commuters, 17.9%), and 5 to 9 minutes (22 commuters, 10.6%).
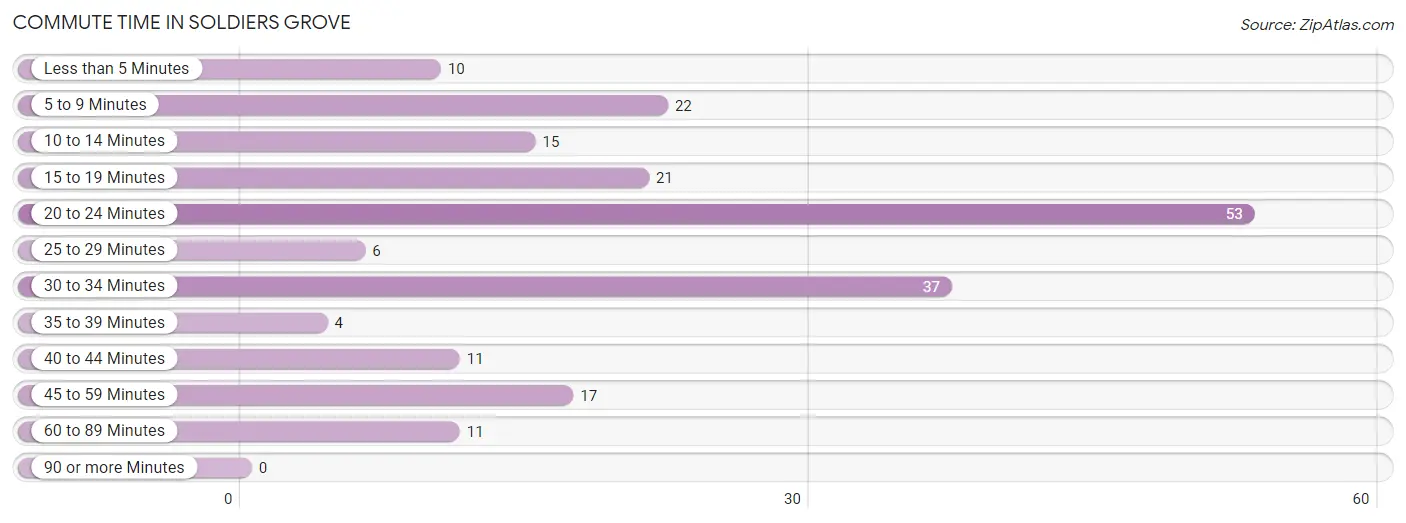
| Commute Time | # Commuters | % Commuters |
| Less than 5 Minutes | 10 | 4.8% |
| 5 to 9 Minutes | 22 | 10.6% |
| 10 to 14 Minutes | 15 | 7.2% |
| 15 to 19 Minutes | 21 | 10.1% |
| 20 to 24 Minutes | 53 | 25.6% |
| 25 to 29 Minutes | 6 | 2.9% |
| 30 to 34 Minutes | 37 | 17.9% |
| 35 to 39 Minutes | 4 | 1.9% |
| 40 to 44 Minutes | 11 | 5.3% |
| 45 to 59 Minutes | 17 | 8.2% |
| 60 to 89 Minutes | 11 | 5.3% |
| 90 or more Minutes | 0 | 0.0% |
Commute Time by Sex in Soldiers Grove
The most common commute times in Soldiers Grove are 20 to 24 minutes (25 commuters, 20.3%) for males and 20 to 24 minutes (28 commuters, 33.3%) for females.
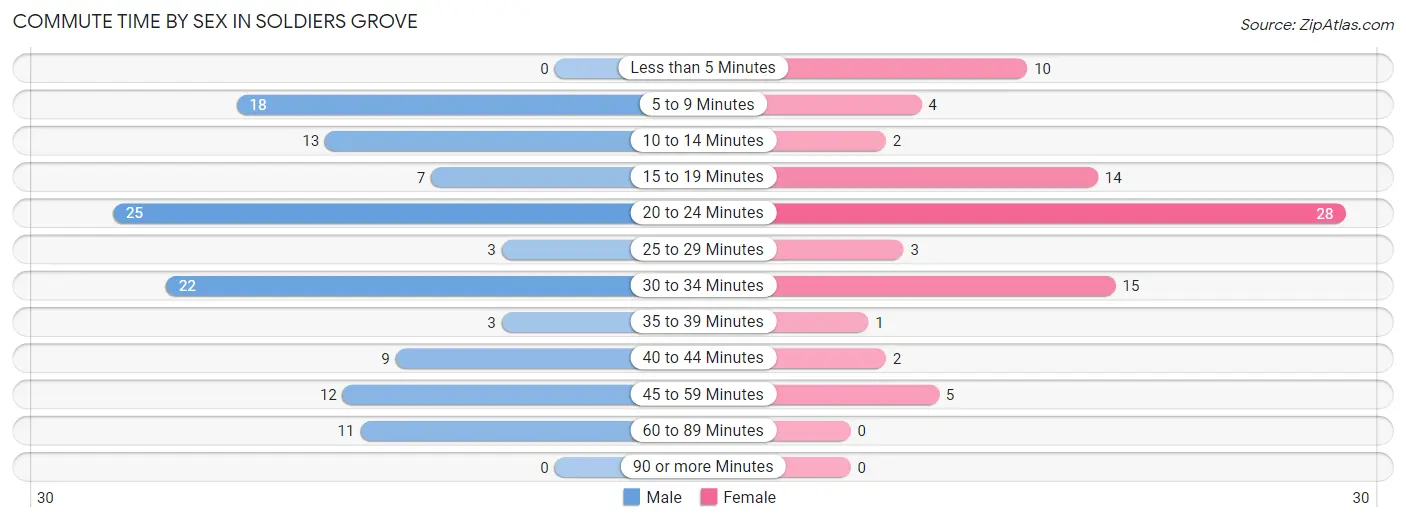
| Commute Time | Male | Female |
| Less than 5 Minutes | 0 (0.0%) | 10 (11.9%) |
| 5 to 9 Minutes | 18 (14.6%) | 4 (4.8%) |
| 10 to 14 Minutes | 13 (10.6%) | 2 (2.4%) |
| 15 to 19 Minutes | 7 (5.7%) | 14 (16.7%) |
| 20 to 24 Minutes | 25 (20.3%) | 28 (33.3%) |
| 25 to 29 Minutes | 3 (2.4%) | 3 (3.6%) |
| 30 to 34 Minutes | 22 (17.9%) | 15 (17.9%) |
| 35 to 39 Minutes | 3 (2.4%) | 1 (1.2%) |
| 40 to 44 Minutes | 9 (7.3%) | 2 (2.4%) |
| 45 to 59 Minutes | 12 (9.8%) | 5 (5.9%) |
| 60 to 89 Minutes | 11 (8.9%) | 0 (0.0%) |
| 90 or more Minutes | 0 (0.0%) | 0 (0.0%) |
Time of Departure to Work by Sex in Soldiers Grove
The most frequent times of departure to work in Soldiers Grove are 7:00 AM to 7:29 AM (32, 26.0%) for males and 7:30 AM to 7:59 AM (21, 25.0%) for females.
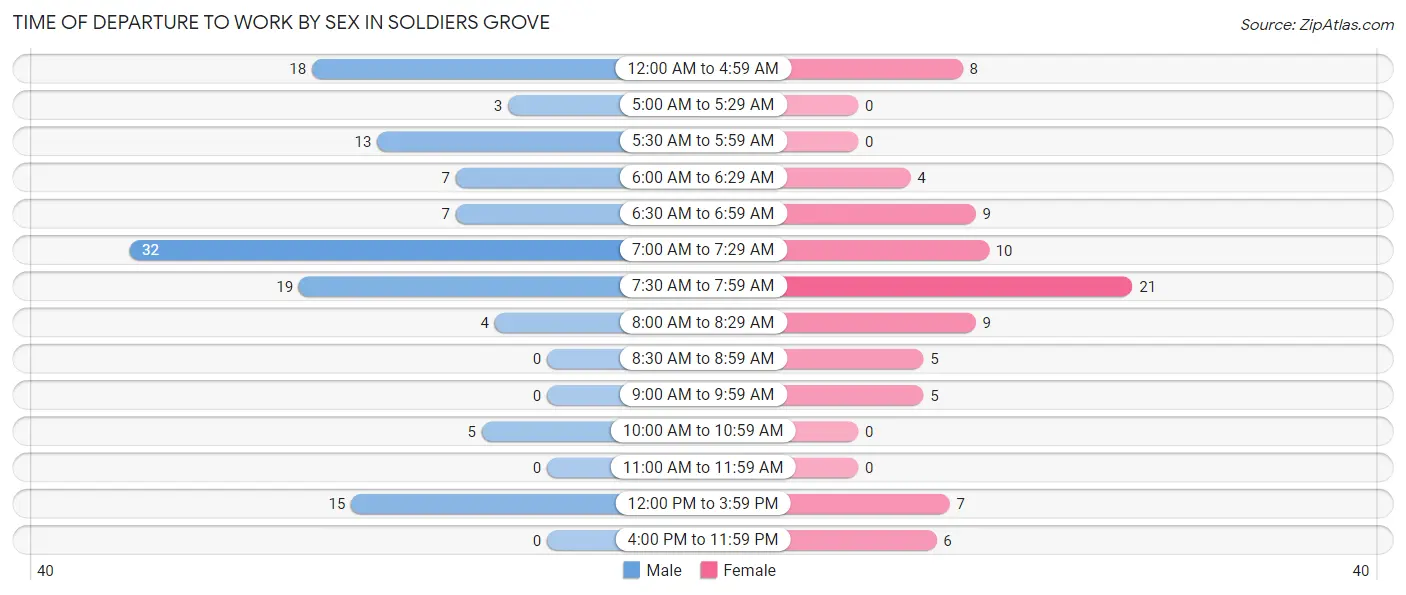
| Time of Departure | Male | Female |
| 12:00 AM to 4:59 AM | 18 (14.6%) | 8 (9.5%) |
| 5:00 AM to 5:29 AM | 3 (2.4%) | 0 (0.0%) |
| 5:30 AM to 5:59 AM | 13 (10.6%) | 0 (0.0%) |
| 6:00 AM to 6:29 AM | 7 (5.7%) | 4 (4.8%) |
| 6:30 AM to 6:59 AM | 7 (5.7%) | 9 (10.7%) |
| 7:00 AM to 7:29 AM | 32 (26.0%) | 10 (11.9%) |
| 7:30 AM to 7:59 AM | 19 (15.4%) | 21 (25.0%) |
| 8:00 AM to 8:29 AM | 4 (3.3%) | 9 (10.7%) |
| 8:30 AM to 8:59 AM | 0 (0.0%) | 5 (5.9%) |
| 9:00 AM to 9:59 AM | 0 (0.0%) | 5 (5.9%) |
| 10:00 AM to 10:59 AM | 5 (4.1%) | 0 (0.0%) |
| 11:00 AM to 11:59 AM | 0 (0.0%) | 0 (0.0%) |
| 12:00 PM to 3:59 PM | 15 (12.2%) | 7 (8.3%) |
| 4:00 PM to 11:59 PM | 0 (0.0%) | 6 (7.1%) |
| Total | 123 (100.0%) | 84 (100.0%) |
Housing Occupancy in Soldiers Grove
Occupancy by Ownership in Soldiers Grove
Of the total 191 dwellings in Soldiers Grove, owner-occupied units account for 120 (62.8%), while renter-occupied units make up 71 (37.2%).
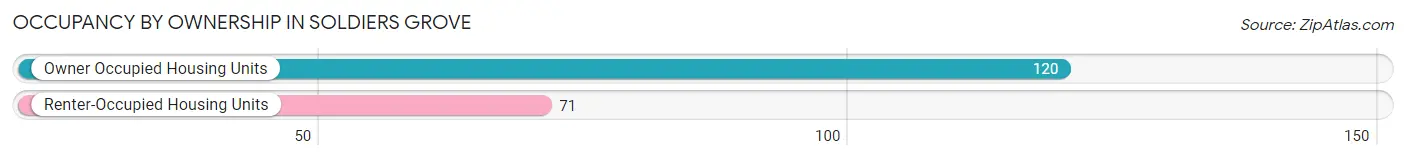
| Occupancy | # Housing Units | % Housing Units |
| Owner Occupied Housing Units | 120 | 62.8% |
| Renter-Occupied Housing Units | 71 | 37.2% |
| Total Occupied Housing Units | 191 | 100.0% |
Occupancy by Household Size in Soldiers Grove
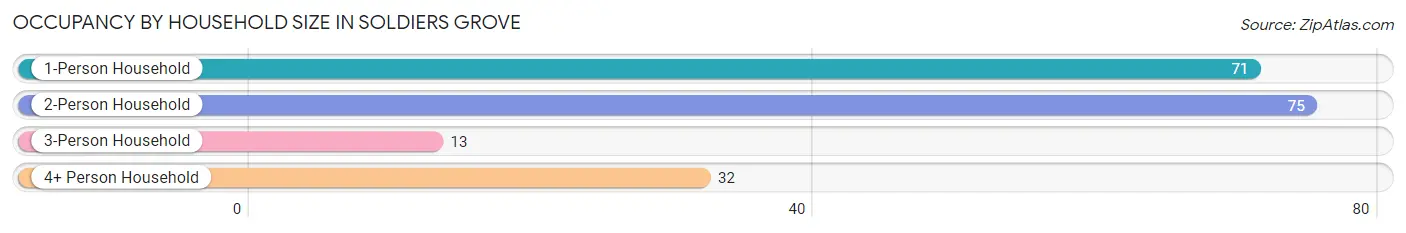
| Household Size | # Housing Units | % Housing Units |
| 1-Person Household | 71 | 37.2% |
| 2-Person Household | 75 | 39.3% |
| 3-Person Household | 13 | 6.8% |
| 4+ Person Household | 32 | 16.8% |
| Total Housing Units | 191 | 100.0% |
Occupancy by Ownership by Household Size in Soldiers Grove
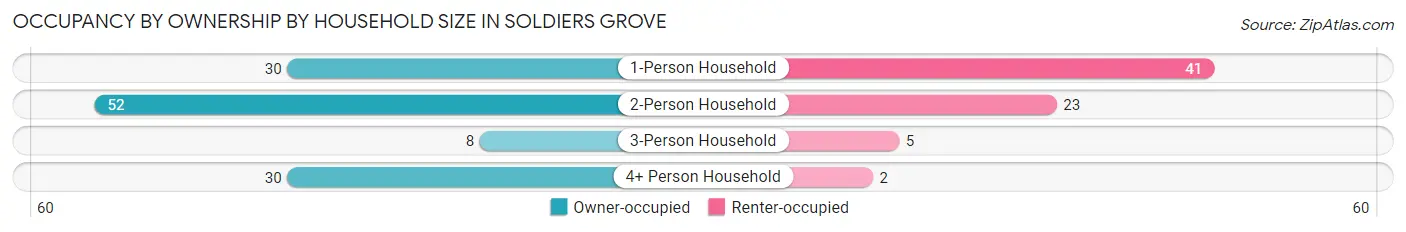
| Household Size | Owner-occupied | Renter-occupied |
| 1-Person Household | 30 (42.2%) | 41 (57.8%) |
| 2-Person Household | 52 (69.3%) | 23 (30.7%) |
| 3-Person Household | 8 (61.5%) | 5 (38.5%) |
| 4+ Person Household | 30 (93.8%) | 2 (6.2%) |
| Total Housing Units | 120 (62.8%) | 71 (37.2%) |
Occupancy by Educational Attainment in Soldiers Grove
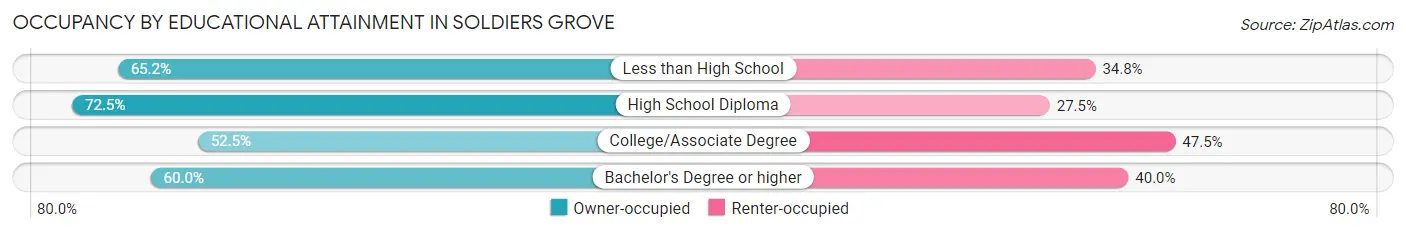
| Household Size | Owner-occupied | Renter-occupied |
| Less than High School | 15 (65.2%) | 8 (34.8%) |
| High School Diploma | 50 (72.5%) | 19 (27.5%) |
| College/Associate Degree | 31 (52.5%) | 28 (47.5%) |
| Bachelor's Degree or higher | 24 (60.0%) | 16 (40.0%) |
Occupancy by Age of Householder in Soldiers Grove
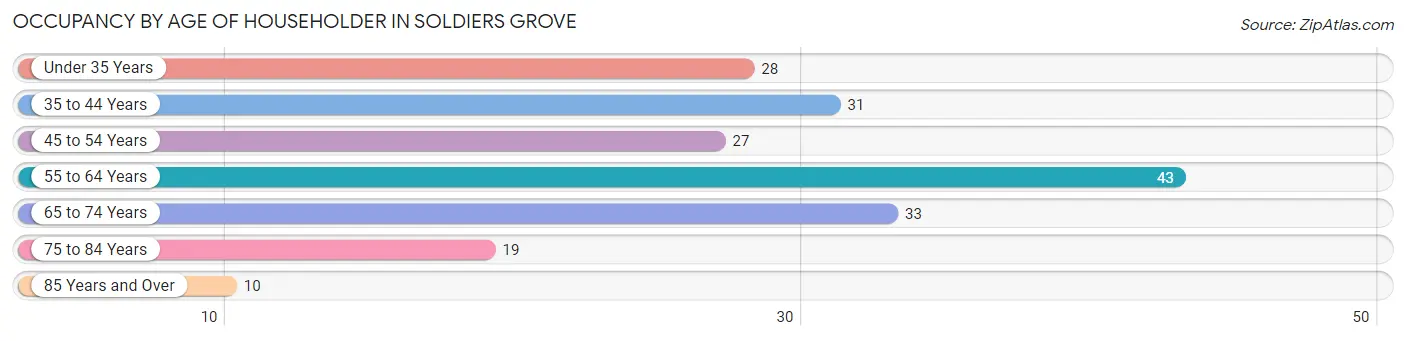
| Age Bracket | # Households | % Households |
| Under 35 Years | 28 | 14.7% |
| 35 to 44 Years | 31 | 16.2% |
| 45 to 54 Years | 27 | 14.1% |
| 55 to 64 Years | 43 | 22.5% |
| 65 to 74 Years | 33 | 17.3% |
| 75 to 84 Years | 19 | 10.0% |
| 85 Years and Over | 10 | 5.2% |
| Total | 191 | 100.0% |
Housing Finances in Soldiers Grove
Median Income by Occupancy in Soldiers Grove
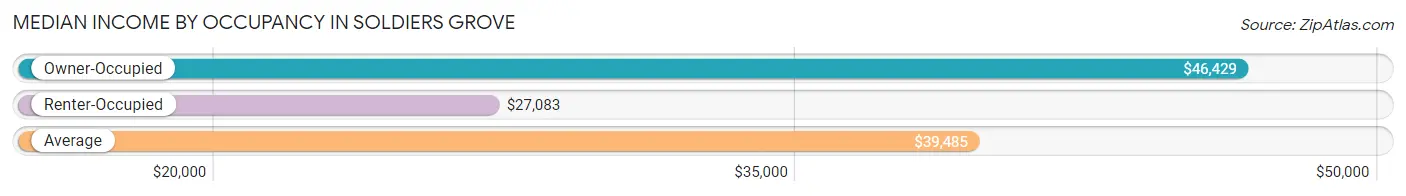
| Occupancy Type | # Households | Median Income |
| Owner-Occupied | 120 (62.8%) | $46,429 |
| Renter-Occupied | 71 (37.2%) | $27,083 |
| Average | 191 (100.0%) | $39,485 |
Occupancy by Householder Income Bracket in Soldiers Grove
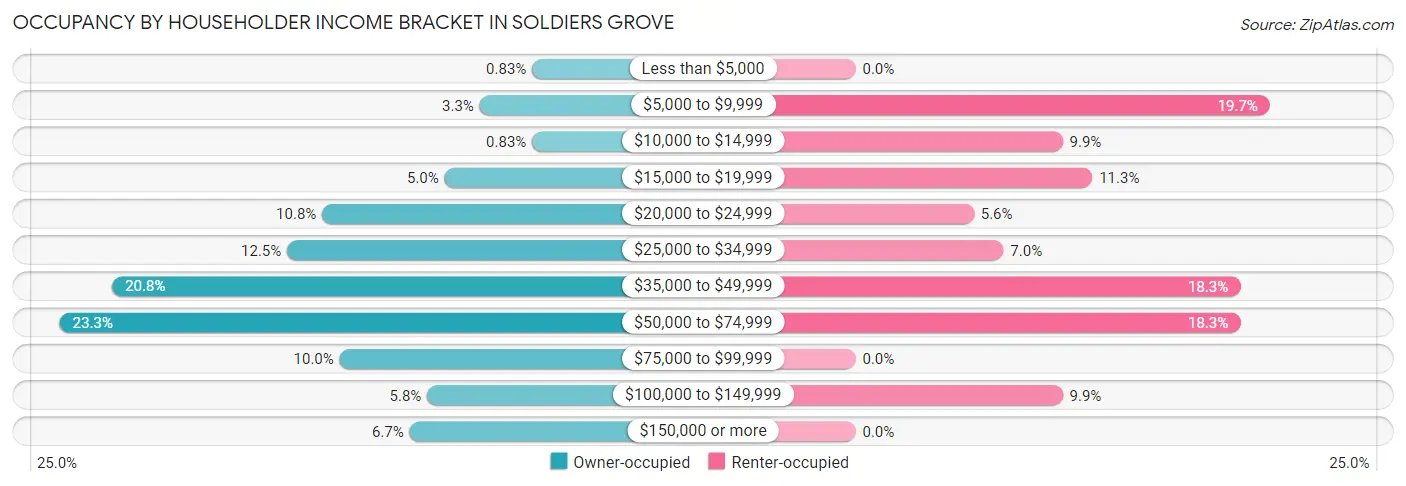
| Income Bracket | Owner-occupied | Renter-occupied |
| Less than $5,000 | 1 (0.8%) | 0 (0.0%) |
| $5,000 to $9,999 | 4 (3.3%) | 14 (19.7%) |
| $10,000 to $14,999 | 1 (0.8%) | 7 (9.9%) |
| $15,000 to $19,999 | 6 (5.0%) | 8 (11.3%) |
| $20,000 to $24,999 | 13 (10.8%) | 4 (5.6%) |
| $25,000 to $34,999 | 15 (12.5%) | 5 (7.0%) |
| $35,000 to $49,999 | 25 (20.8%) | 13 (18.3%) |
| $50,000 to $74,999 | 28 (23.3%) | 13 (18.3%) |
| $75,000 to $99,999 | 12 (10.0%) | 0 (0.0%) |
| $100,000 to $149,999 | 7 (5.8%) | 7 (9.9%) |
| $150,000 or more | 8 (6.7%) | 0 (0.0%) |
| Total | 120 (100.0%) | 71 (100.0%) |
Monthly Housing Cost Tiers in Soldiers Grove
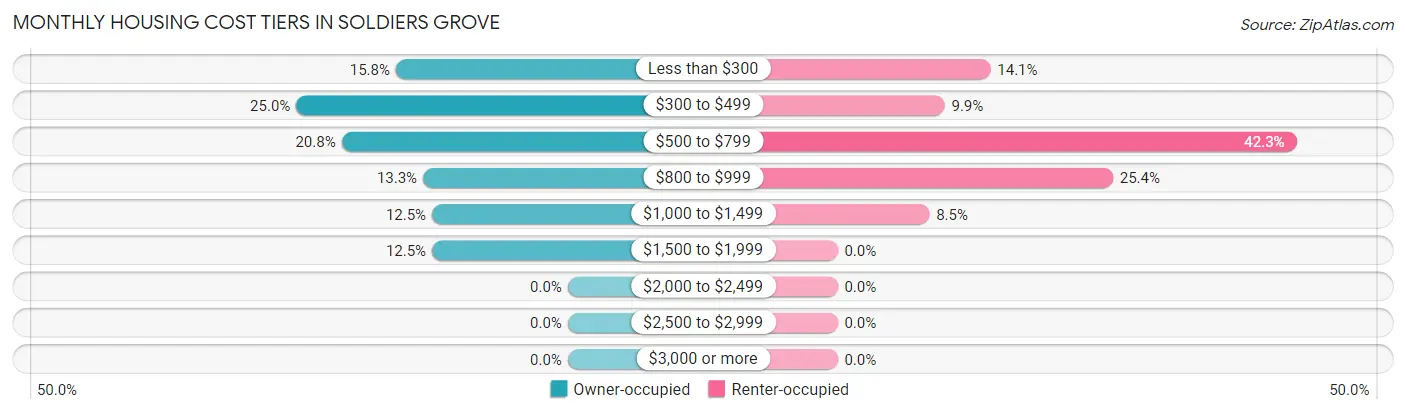
| Monthly Cost | Owner-occupied | Renter-occupied |
| Less than $300 | 19 (15.8%) | 10 (14.1%) |
| $300 to $499 | 30 (25.0%) | 7 (9.9%) |
| $500 to $799 | 25 (20.8%) | 30 (42.2%) |
| $800 to $999 | 16 (13.3%) | 18 (25.4%) |
| $1,000 to $1,499 | 15 (12.5%) | 6 (8.5%) |
| $1,500 to $1,999 | 15 (12.5%) | 0 (0.0%) |
| $2,000 to $2,499 | 0 (0.0%) | 0 (0.0%) |
| $2,500 to $2,999 | 0 (0.0%) | 0 (0.0%) |
| $3,000 or more | 0 (0.0%) | 0 (0.0%) |
| Total | 120 (100.0%) | 71 (100.0%) |
Physical Housing Characteristics in Soldiers Grove
Housing Structures in Soldiers Grove
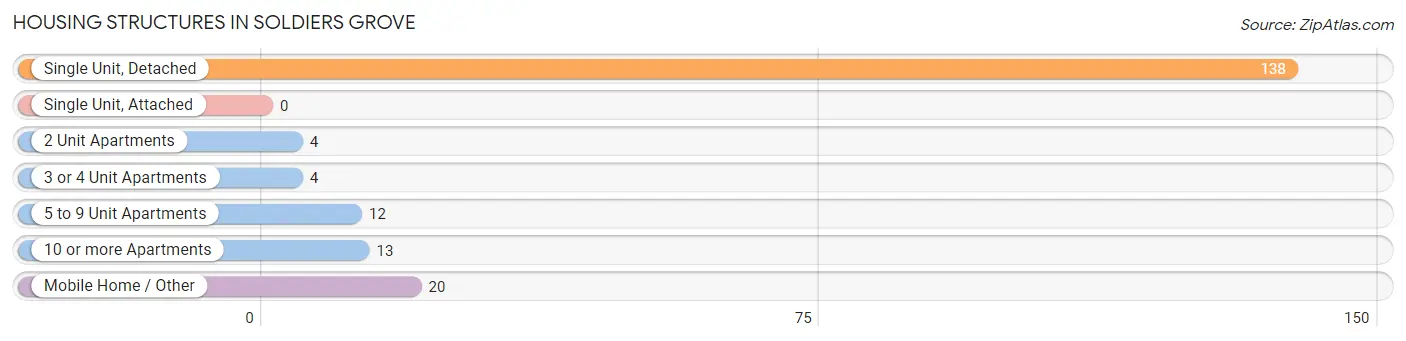
| Structure Type | # Housing Units | % Housing Units |
| Single Unit, Detached | 138 | 72.3% |
| Single Unit, Attached | 0 | 0.0% |
| 2 Unit Apartments | 4 | 2.1% |
| 3 or 4 Unit Apartments | 4 | 2.1% |
| 5 to 9 Unit Apartments | 12 | 6.3% |
| 10 or more Apartments | 13 | 6.8% |
| Mobile Home / Other | 20 | 10.5% |
| Total | 191 | 100.0% |
Housing Structures by Occupancy in Soldiers Grove
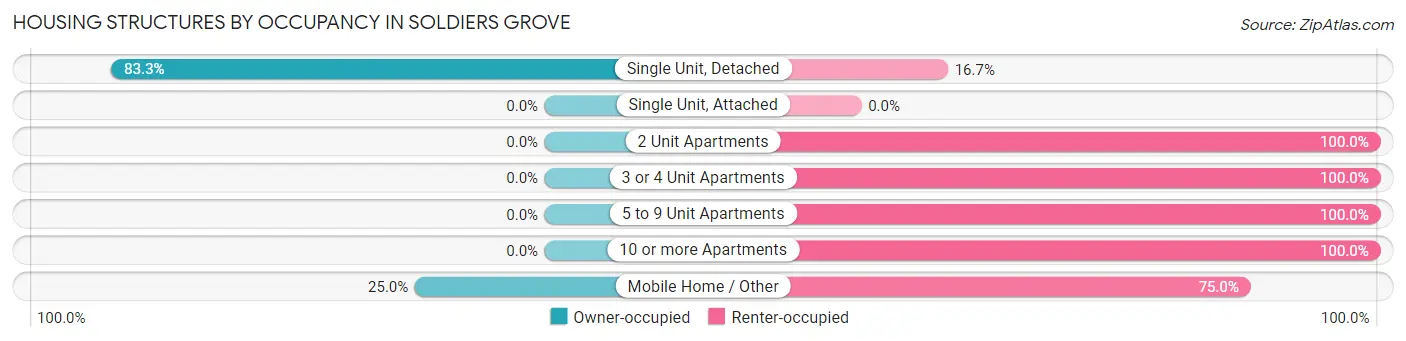
| Structure Type | Owner-occupied | Renter-occupied |
| Single Unit, Detached | 115 (83.3%) | 23 (16.7%) |
| Single Unit, Attached | 0 (0.0%) | 0 (0.0%) |
| 2 Unit Apartments | 0 (0.0%) | 4 (100.0%) |
| 3 or 4 Unit Apartments | 0 (0.0%) | 4 (100.0%) |
| 5 to 9 Unit Apartments | 0 (0.0%) | 12 (100.0%) |
| 10 or more Apartments | 0 (0.0%) | 13 (100.0%) |
| Mobile Home / Other | 5 (25.0%) | 15 (75.0%) |
| Total | 120 (62.8%) | 71 (37.2%) |
Housing Structures by Number of Rooms in Soldiers Grove
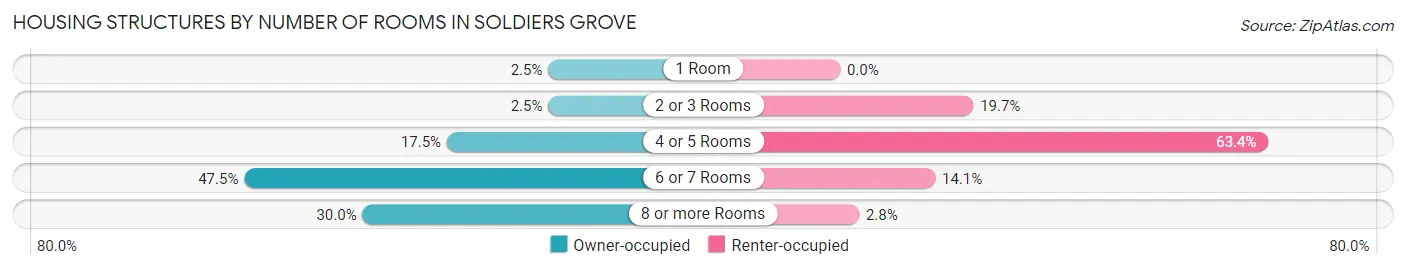
| Number of Rooms | Owner-occupied | Renter-occupied |
| 1 Room | 3 (2.5%) | 0 (0.0%) |
| 2 or 3 Rooms | 3 (2.5%) | 14 (19.7%) |
| 4 or 5 Rooms | 21 (17.5%) | 45 (63.4%) |
| 6 or 7 Rooms | 57 (47.5%) | 10 (14.1%) |
| 8 or more Rooms | 36 (30.0%) | 2 (2.8%) |
| Total | 120 (100.0%) | 71 (100.0%) |
Housing Structure by Heating Type in Soldiers Grove
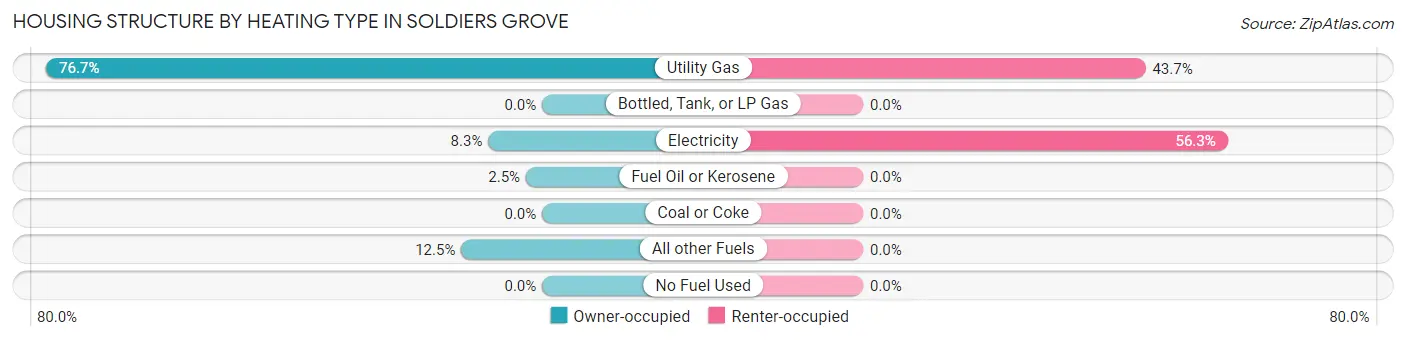
| Heating Type | Owner-occupied | Renter-occupied |
| Utility Gas | 92 (76.7%) | 31 (43.7%) |
| Bottled, Tank, or LP Gas | 0 (0.0%) | 0 (0.0%) |
| Electricity | 10 (8.3%) | 40 (56.3%) |
| Fuel Oil or Kerosene | 3 (2.5%) | 0 (0.0%) |
| Coal or Coke | 0 (0.0%) | 0 (0.0%) |
| All other Fuels | 15 (12.5%) | 0 (0.0%) |
| No Fuel Used | 0 (0.0%) | 0 (0.0%) |
| Total | 120 (100.0%) | 71 (100.0%) |
Household Vehicle Usage in Soldiers Grove
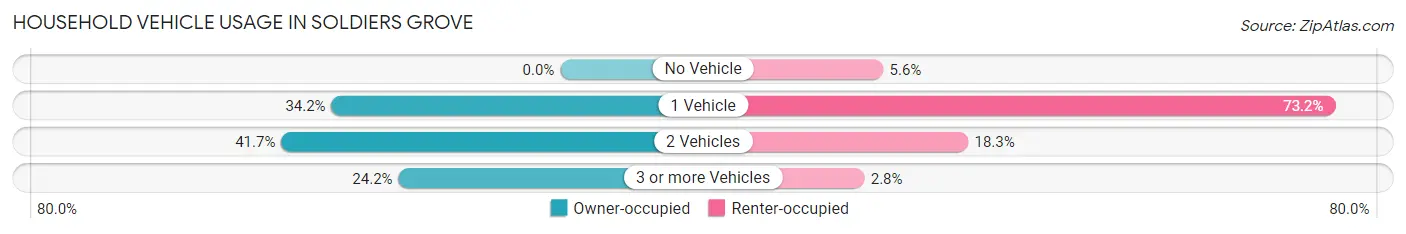
| Vehicles per Household | Owner-occupied | Renter-occupied |
| No Vehicle | 0 (0.0%) | 4 (5.6%) |
| 1 Vehicle | 41 (34.2%) | 52 (73.2%) |
| 2 Vehicles | 50 (41.7%) | 13 (18.3%) |
| 3 or more Vehicles | 29 (24.2%) | 2 (2.8%) |
| Total | 120 (100.0%) | 71 (100.0%) |
Real Estate & Mortgages in Soldiers Grove
Real Estate and Mortgage Overview in Soldiers Grove
| Characteristic | Without Mortgage | With Mortgage |
| Housing Units | 58 | 62 |
| Median Property Value | $75,000 | $137,500 |
| Median Household Income | $38,929 | $7 |
| Monthly Housing Costs | $411 | $0 |
| Real Estate Taxes | $738 | $0 |
Property Value by Mortgage Status in Soldiers Grove
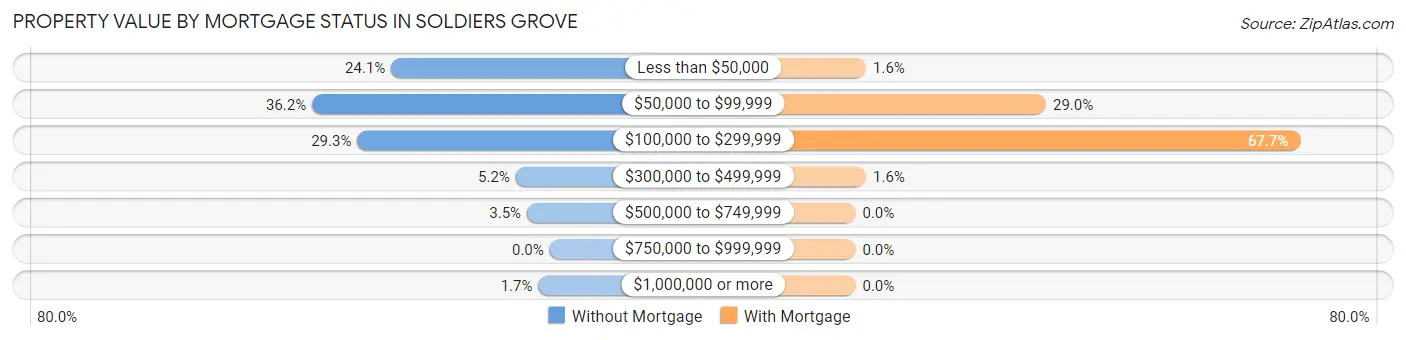
| Property Value | Without Mortgage | With Mortgage |
| Less than $50,000 | 14 (24.1%) | 1 (1.6%) |
| $50,000 to $99,999 | 21 (36.2%) | 18 (29.0%) |
| $100,000 to $299,999 | 17 (29.3%) | 42 (67.7%) |
| $300,000 to $499,999 | 3 (5.2%) | 1 (1.6%) |
| $500,000 to $749,999 | 2 (3.5%) | 0 (0.0%) |
| $750,000 to $999,999 | 0 (0.0%) | 0 (0.0%) |
| $1,000,000 or more | 1 (1.7%) | 0 (0.0%) |
| Total | 58 (100.0%) | 62 (100.0%) |
Household Income by Mortgage Status in Soldiers Grove
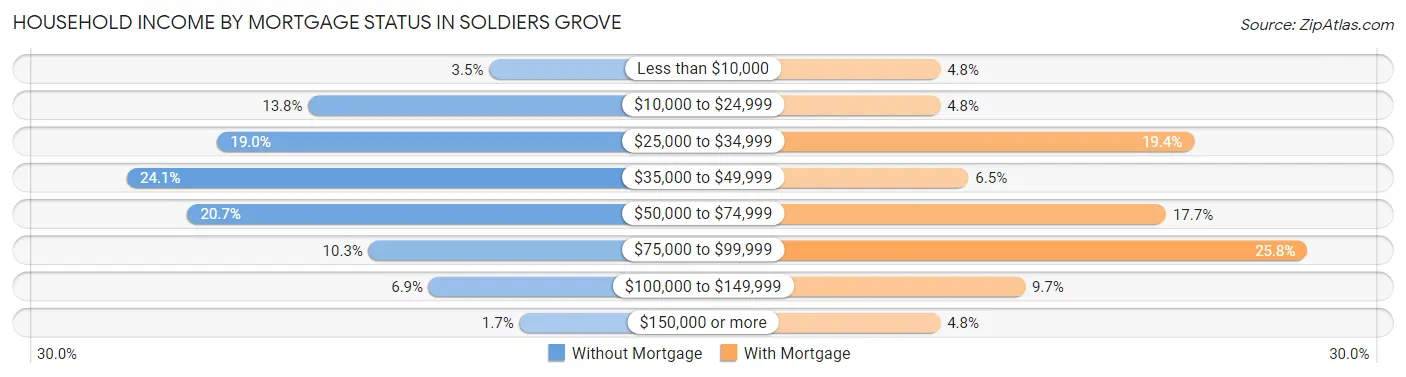
| Household Income | Without Mortgage | With Mortgage |
| Less than $10,000 | 2 (3.5%) | 3 (4.8%) |
| $10,000 to $24,999 | 8 (13.8%) | 3 (4.8%) |
| $25,000 to $34,999 | 11 (19.0%) | 12 (19.4%) |
| $35,000 to $49,999 | 14 (24.1%) | 4 (6.5%) |
| $50,000 to $74,999 | 12 (20.7%) | 11 (17.7%) |
| $75,000 to $99,999 | 6 (10.3%) | 16 (25.8%) |
| $100,000 to $149,999 | 4 (6.9%) | 6 (9.7%) |
| $150,000 or more | 1 (1.7%) | 3 (4.8%) |
| Total | 58 (100.0%) | 62 (100.0%) |
Property Value to Household Income Ratio in Soldiers Grove
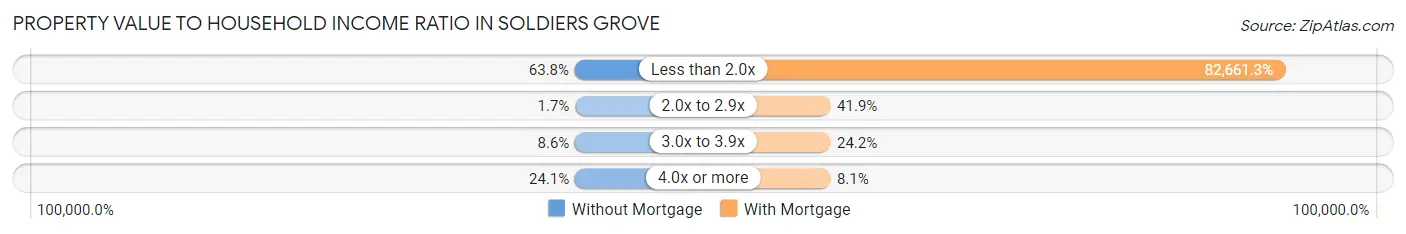
| Value-to-Income Ratio | Without Mortgage | With Mortgage |
| Less than 2.0x | 37 (63.8%) | 51,250 (82,661.3%) |
| 2.0x to 2.9x | 1 (1.7%) | 26 (41.9%) |
| 3.0x to 3.9x | 5 (8.6%) | 15 (24.2%) |
| 4.0x or more | 14 (24.1%) | 5 (8.1%) |
| Total | 58 (100.0%) | 62 (100.0%) |
Real Estate Taxes by Mortgage Status in Soldiers Grove
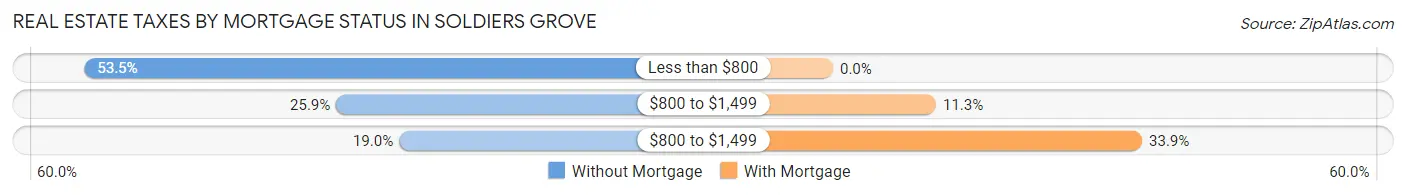
| Property Taxes | Without Mortgage | With Mortgage |
| Less than $800 | 31 (53.4%) | 0 (0.0%) |
| $800 to $1,499 | 15 (25.9%) | 7 (11.3%) |
| $800 to $1,499 | 11 (19.0%) | 21 (33.9%) |
| Total | 58 (100.0%) | 62 (100.0%) |
Health & Disability in Soldiers Grove
Health Insurance Coverage by Age in Soldiers Grove
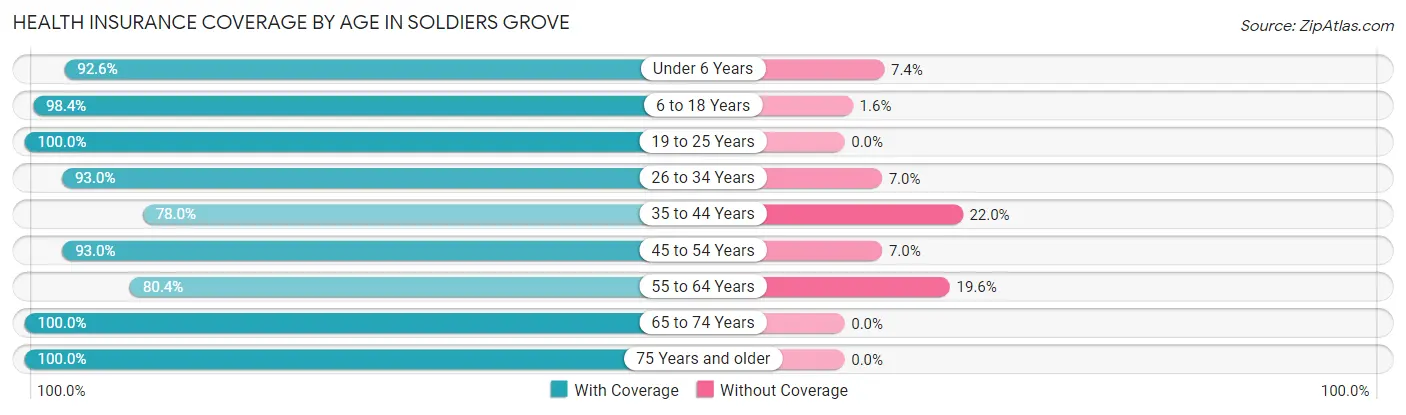
| Age Bracket | With Coverage | Without Coverage |
| Under 6 Years | 25 (92.6%) | 2 (7.4%) |
| 6 to 18 Years | 126 (98.4%) | 2 (1.6%) |
| 19 to 25 Years | 41 (100.0%) | 0 (0.0%) |
| 26 to 34 Years | 40 (93.0%) | 3 (7.0%) |
| 35 to 44 Years | 46 (78.0%) | 13 (22.0%) |
| 45 to 54 Years | 53 (93.0%) | 4 (7.0%) |
| 55 to 64 Years | 45 (80.4%) | 11 (19.6%) |
| 65 to 74 Years | 51 (100.0%) | 0 (0.0%) |
| 75 Years and older | 44 (100.0%) | 0 (0.0%) |
| Total | 471 (93.1%) | 35 (6.9%) |
Health Insurance Coverage by Citizenship Status in Soldiers Grove
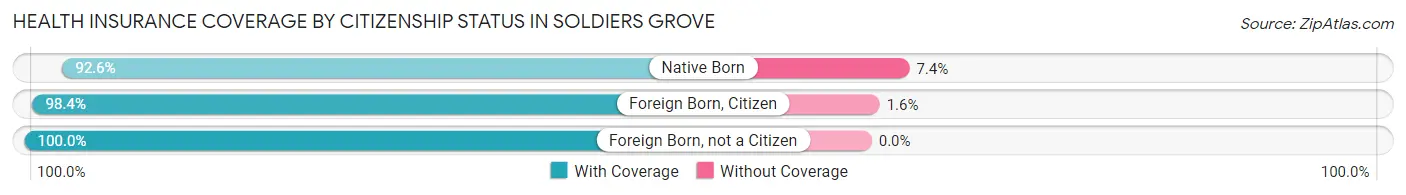
| Citizenship Status | With Coverage | Without Coverage |
| Native Born | 25 (92.6%) | 2 (7.4%) |
| Foreign Born, Citizen | 126 (98.4%) | 2 (1.6%) |
| Foreign Born, not a Citizen | 41 (100.0%) | 0 (0.0%) |
Health Insurance Coverage by Household Income in Soldiers Grove
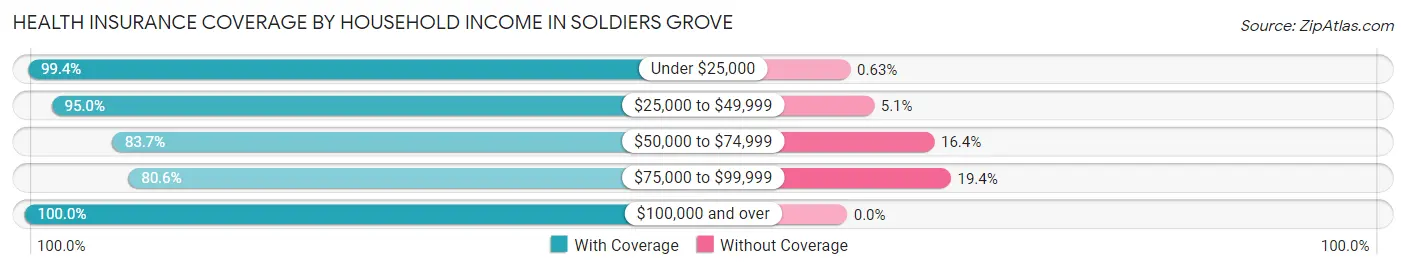
| Household Income | With Coverage | Without Coverage |
| Under $25,000 | 157 (99.4%) | 1 (0.6%) |
| $25,000 to $49,999 | 94 (95.0%) | 5 (5.1%) |
| $50,000 to $74,999 | 87 (83.7%) | 17 (16.4%) |
| $75,000 to $99,999 | 29 (80.6%) | 7 (19.4%) |
| $100,000 and over | 99 (100.0%) | 0 (0.0%) |
Public vs Private Health Insurance Coverage by Age in Soldiers Grove
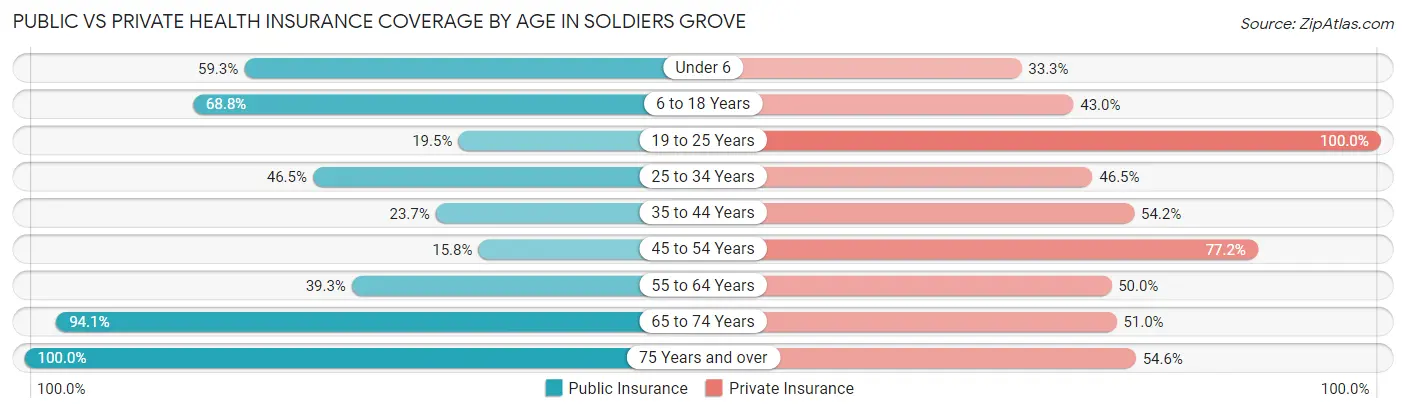
| Age Bracket | Public Insurance | Private Insurance |
| Under 6 | 16 (59.3%) | 9 (33.3%) |
| 6 to 18 Years | 88 (68.8%) | 55 (43.0%) |
| 19 to 25 Years | 8 (19.5%) | 41 (100.0%) |
| 25 to 34 Years | 20 (46.5%) | 20 (46.5%) |
| 35 to 44 Years | 14 (23.7%) | 32 (54.2%) |
| 45 to 54 Years | 9 (15.8%) | 44 (77.2%) |
| 55 to 64 Years | 22 (39.3%) | 28 (50.0%) |
| 65 to 74 Years | 48 (94.1%) | 26 (51.0%) |
| 75 Years and over | 44 (100.0%) | 24 (54.5%) |
| Total | 269 (53.2%) | 279 (55.1%) |
Disability Status by Sex by Age in Soldiers Grove
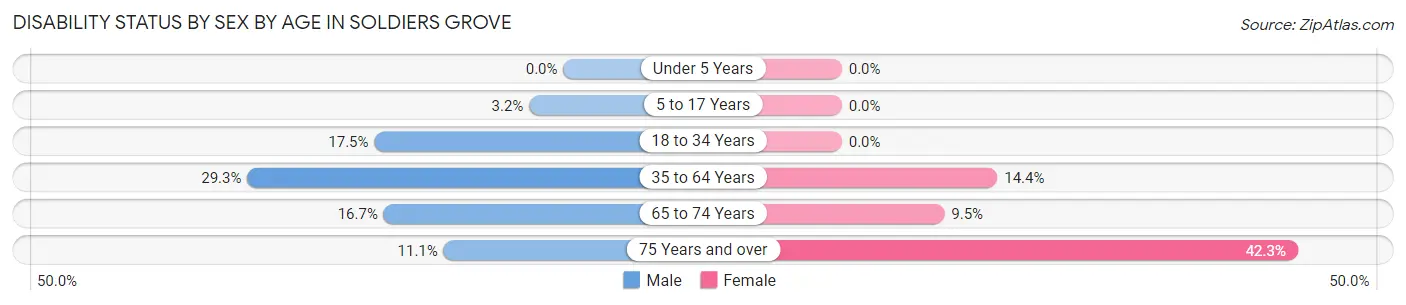
| Age Bracket | Male | Female |
| Under 5 Years | 0 (0.0%) | 0 (0.0%) |
| 5 to 17 Years | 2 (3.2%) | 0 (0.0%) |
| 18 to 34 Years | 10 (17.5%) | 0 (0.0%) |
| 35 to 64 Years | 22 (29.3%) | 14 (14.4%) |
| 65 to 74 Years | 5 (16.7%) | 2 (9.5%) |
| 75 Years and over | 2 (11.1%) | 11 (42.3%) |
Disability Class by Sex by Age in Soldiers Grove
Disability Class: Hearing Difficulty
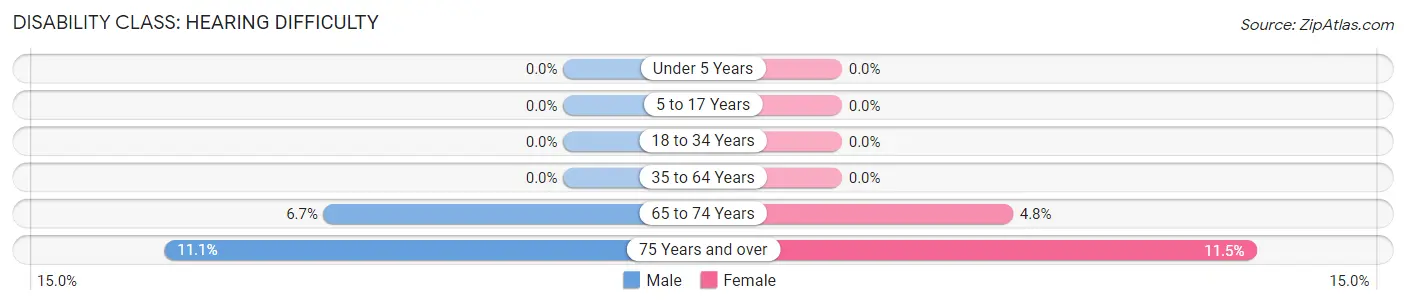
| Age Bracket | Male | Female |
| Under 5 Years | 0 (0.0%) | 0 (0.0%) |
| 5 to 17 Years | 0 (0.0%) | 0 (0.0%) |
| 18 to 34 Years | 0 (0.0%) | 0 (0.0%) |
| 35 to 64 Years | 0 (0.0%) | 0 (0.0%) |
| 65 to 74 Years | 2 (6.7%) | 1 (4.8%) |
| 75 Years and over | 2 (11.1%) | 3 (11.5%) |
Disability Class: Vision Difficulty
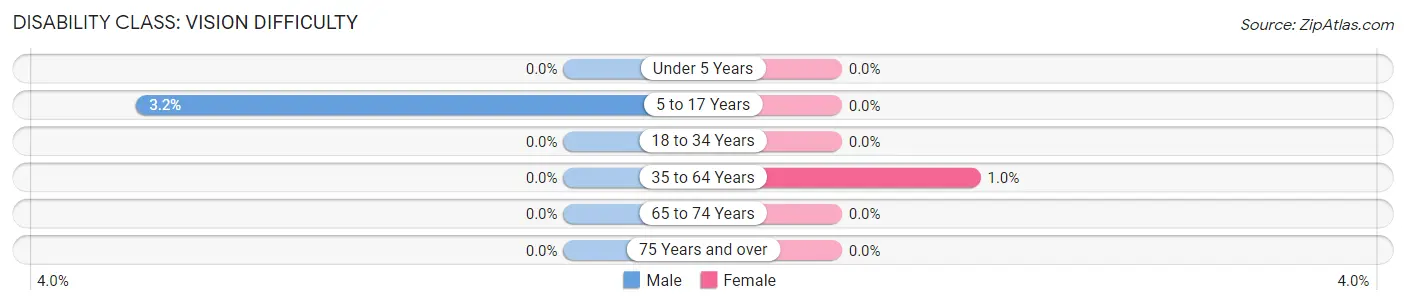
| Age Bracket | Male | Female |
| Under 5 Years | 0 (0.0%) | 0 (0.0%) |
| 5 to 17 Years | 2 (3.2%) | 0 (0.0%) |
| 18 to 34 Years | 0 (0.0%) | 0 (0.0%) |
| 35 to 64 Years | 0 (0.0%) | 1 (1.0%) |
| 65 to 74 Years | 0 (0.0%) | 0 (0.0%) |
| 75 Years and over | 0 (0.0%) | 0 (0.0%) |
Disability Class: Cognitive Difficulty
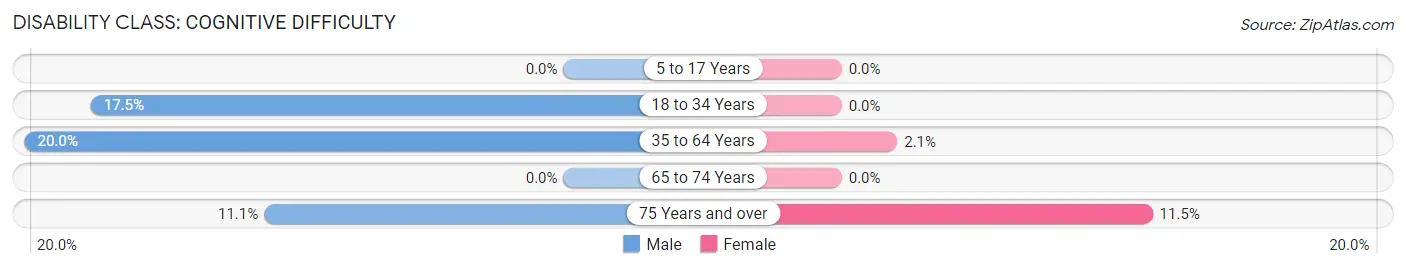
| Age Bracket | Male | Female |
| 5 to 17 Years | 0 (0.0%) | 0 (0.0%) |
| 18 to 34 Years | 10 (17.5%) | 0 (0.0%) |
| 35 to 64 Years | 15 (20.0%) | 2 (2.1%) |
| 65 to 74 Years | 0 (0.0%) | 0 (0.0%) |
| 75 Years and over | 2 (11.1%) | 3 (11.5%) |
Disability Class: Ambulatory Difficulty
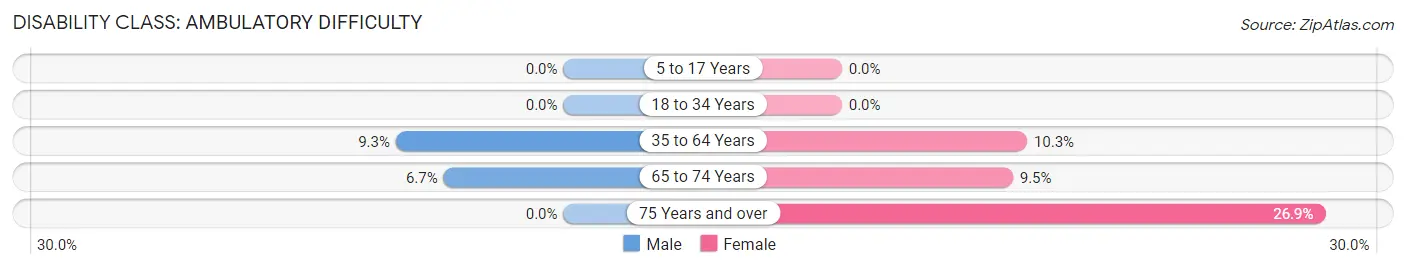
| Age Bracket | Male | Female |
| 5 to 17 Years | 0 (0.0%) | 0 (0.0%) |
| 18 to 34 Years | 0 (0.0%) | 0 (0.0%) |
| 35 to 64 Years | 7 (9.3%) | 10 (10.3%) |
| 65 to 74 Years | 2 (6.7%) | 2 (9.5%) |
| 75 Years and over | 0 (0.0%) | 7 (26.9%) |
Disability Class: Self-Care Difficulty
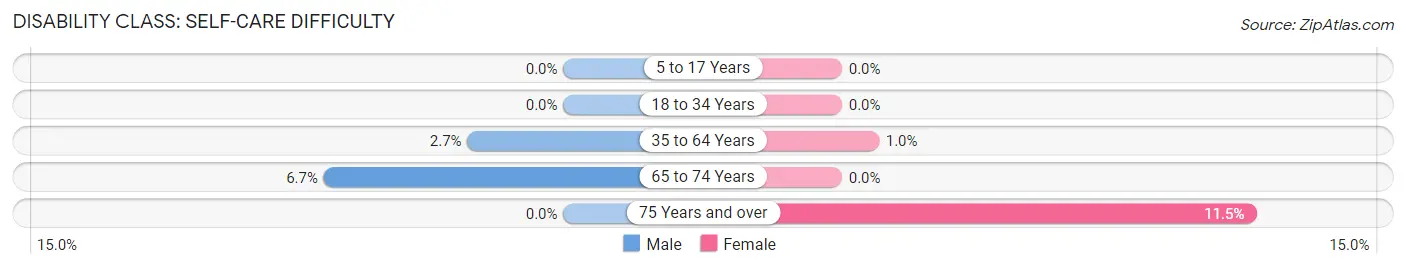
| Age Bracket | Male | Female |
| 5 to 17 Years | 0 (0.0%) | 0 (0.0%) |
| 18 to 34 Years | 0 (0.0%) | 0 (0.0%) |
| 35 to 64 Years | 2 (2.7%) | 1 (1.0%) |
| 65 to 74 Years | 2 (6.7%) | 0 (0.0%) |
| 75 Years and over | 0 (0.0%) | 3 (11.5%) |
Technology Access in Soldiers Grove
Computing Device Access in Soldiers Grove
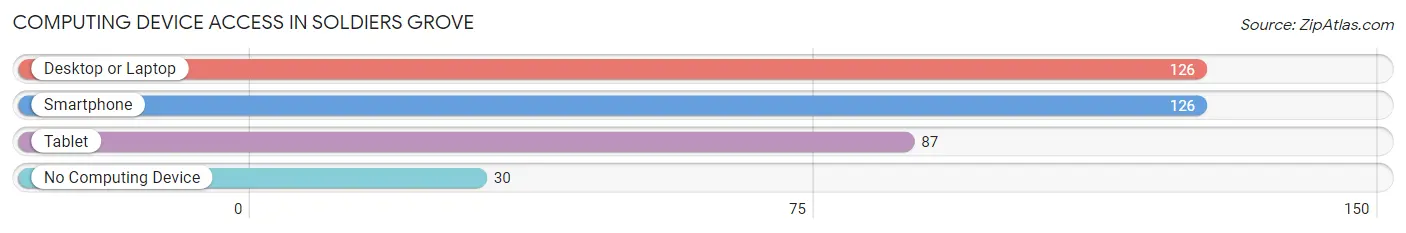
| Device Type | # Households | % Households |
| Desktop or Laptop | 126 | 66.0% |
| Smartphone | 126 | 66.0% |
| Tablet | 87 | 45.6% |
| No Computing Device | 30 | 15.7% |
| Total | 191 | 100.0% |
Internet Access in Soldiers Grove
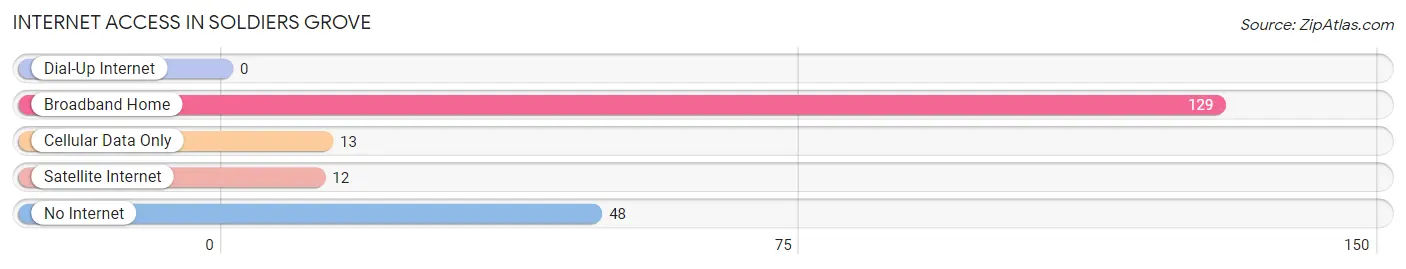
| Internet Type | # Households | % Households |
| Dial-Up Internet | 0 | 0.0% |
| Broadband Home | 129 | 67.5% |
| Cellular Data Only | 13 | 6.8% |
| Satellite Internet | 12 | 6.3% |
| No Internet | 48 | 25.1% |
| Total | 191 | 100.0% |
Soldiers Grove Summary
Soldiers Grove is a small village located in Crawford County, Wisconsin, United States. It is situated along the Kickapoo River, and is part of the La Crosse-Onalaska, WI-MN Metropolitan Statistical Area. The population was 590 at the 2010 census.
History
Soldiers Grove was founded in 1856 by a group of settlers from New York. The village was named after the nearby Soldiers Grove, which was a grove of trees planted by soldiers from the nearby Fort Crawford. The village was incorporated in 1876.
In the late 19th century, Soldiers Grove was a thriving lumber town. The village was home to several sawmills, a grist mill, and a shingle mill. The lumber industry declined in the early 20th century, and the village began to focus on agriculture and tourism.
Geography
Soldiers Grove is located at 43°25'17" North, 91°2'17" West (43.4214, -91.0381). According to the United States Census Bureau, the village has a total area of 0.7 square miles (1.8 km2), all of it land.
Economy
The economy of Soldiers Grove is largely based on agriculture and tourism. The village is home to several small businesses, including a grocery store, a hardware store, and a restaurant. The village also has a farmers' market, which is held every Saturday from May to October.
Tourism is an important part of the local economy. The village is home to several bed and breakfasts, as well as a campground. The Kickapoo River is a popular destination for canoeing and kayaking.
Demographics
As of the census of 2010, there were 590 people, 248 households, and 156 families residing in the village. The population density was 843.3 people per square mile (325.3/km2). There were 270 housing units at an average density of 382.9 per square mile (147.7/km2). The racial makeup of the village was 97.3% White, 0.2% African American, 0.2% Native American, 0.2% Asian, 0.2% from other races, and 1.9% from two or more races. Hispanic or Latino of any race were 1.7% of the population.
There were 248 households, out of which 28.2% had children under the age of 18 living with them, 48.4% were married couples living together, 9.7% had a female householder with no husband present, and 37.5% were non-families. 32.3% of all households were made up of individuals, and 15.7% had someone living alone who was 65 years of age or older. The average household size was 2.38 and the average family size was 3.02.
In the village, the population was spread out, with 24.6% under the age of 18, 6.9% from 18 to 24, 24.6% from 25 to 44, 25.3% from 45 to 64, and 18.6% who were 65 years of age or older. The median age was 40 years. For every 100 females, there were 97.9 males. For every 100 females age 18 and over, there were 94.3 males.
The median income for a household in the village was $35,000, and the median income for a family was $41,250. Males had a median income of $30,000 versus $21,250 for females. The per capita income for the village was $17,845. About 8.3% of families and 10.3% of the population were below the poverty line, including 14.3% of those under age 18 and 8.3% of those age 65 or over.
Common Questions
What is Per Capita Income in Soldiers Grove?
Per Capita income in Soldiers Grove is $20,424.
What is the Median Family Income in Soldiers Grove?
Median Family Income in Soldiers Grove is $49,250.
What is the Median Household income in Soldiers Grove?
Median Household Income in Soldiers Grove is $39,485.
What is Income or Wage Gap in Soldiers Grove?
Income or Wage Gap in Soldiers Grove is 5.6%.
Women in Soldiers Grove earn 94.4 cents for every dollar earned by a man.
What is Inequality or Gini Index in Soldiers Grove?
Inequality or Gini Index in Soldiers Grove is 0.41.
What is the Total Population of Soldiers Grove?
Total Population of Soldiers Grove is 547.
What is the Total Male Population of Soldiers Grove?
Total Male Population of Soldiers Grove is 257.
What is the Total Female Population of Soldiers Grove?
Total Female Population of Soldiers Grove is 290.
What is the Ratio of Males per 100 Females in Soldiers Grove?
There are 88.62 Males per 100 Females in Soldiers Grove.
What is the Ratio of Females per 100 Males in Soldiers Grove?
There are 112.84 Females per 100 Males in Soldiers Grove.
What is the Median Population Age in Soldiers Grove?
Median Population Age in Soldiers Grove is 40.4 Years.
What is the Average Family Size in Soldiers Grove
Average Family Size in Soldiers Grove is 3.5 People.
What is the Average Household Size in Soldiers Grove
Average Household Size in Soldiers Grove is 2.6 People.
How Large is the Labor Force in Soldiers Grove?
There are 215 People in the Labor Forcein in Soldiers Grove.
What is the Percentage of People in the Labor Force in Soldiers Grove?
50.8% of People are in the Labor Force in Soldiers Grove.
What is the Unemployment Rate in Soldiers Grove?
Unemployment Rate in Soldiers Grove is 2.3%.