Siren, WI Map & Demographics
Siren Map
Siren Overview
$25,659
PER CAPITA INCOME
$57,647
AVG FAMILY INCOME
$39,375
AVG HOUSEHOLD INCOME
37.1%
WAGE / INCOME GAP [ % ]
62.9¢/ $1
WAGE / INCOME GAP [ $ ]
0.43
INEQUALITY / GINI INDEX
710
TOTAL POPULATION
324
MALE POPULATION
386
FEMALE POPULATION
83.94
MALES / 100 FEMALES
119.14
FEMALES / 100 MALES
53.7
MEDIAN AGE
3.0
AVG FAMILY SIZE
2.0
AVG HOUSEHOLD SIZE
276
LABOR FORCE [ PEOPLE ]
43.0%
PERCENT IN LABOR FORCE
8.7%
UNEMPLOYMENT RATE
Siren Zip Codes
Siren Area Codes
Income in Siren
Income Overview in Siren
Per Capita Income in Siren is $25,659, while median incomes of families and households are $57,647 and $39,375 respectively.
| Characteristic | Number | Measure |
| Per Capita Income | 710 | $25,659 |
| Median Family Income | 146 | $57,647 |
| Mean Family Income | 146 | $71,417 |
| Median Household Income | 340 | $39,375 |
| Mean Household Income | 340 | $49,165 |
| Income Deficit | 146 | $0 |
| Wage / Income Gap (%) | 710 | 37.09% |
| Wage / Income Gap ($) | 710 | 62.91¢ per $1 |
| Gini / Inequality Index | 710 | 0.43 |
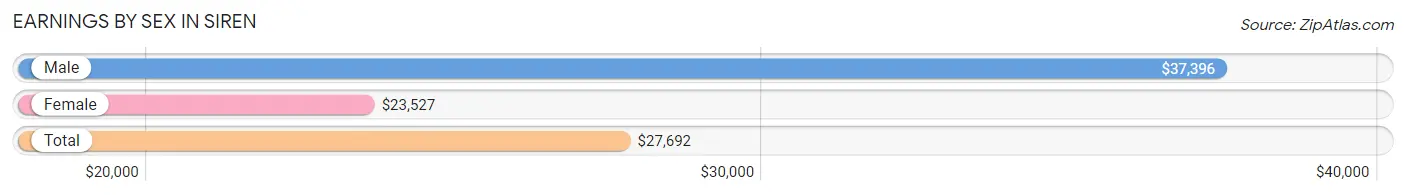
Earnings by Sex in Siren
Average Earnings in Siren are $27,692, $37,396 for men and $23,527 for women, a difference of 37.1%.
| Sex | Number | Average Earnings |
| Male | 101 (35.8%) | $37,396 |
| Female | 181 (64.2%) | $23,527 |
| Total | 282 (100.0%) | $27,692 |
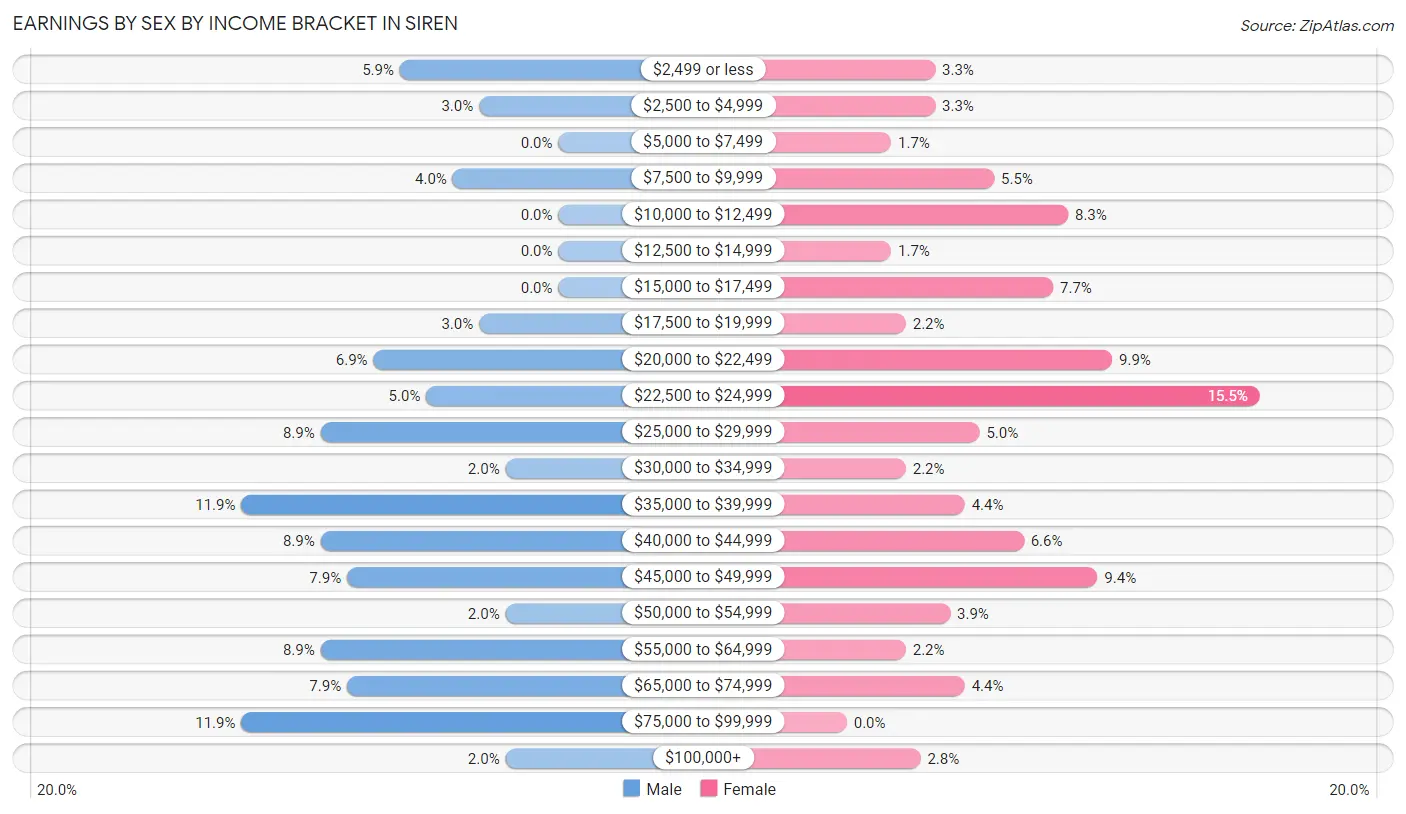
Earnings by Sex by Income Bracket in Siren
The most common earnings brackets in Siren are $35,000 to $39,999 for men (12 | 11.9%) and $22,500 to $24,999 for women (28 | 15.5%).
| Income | Male | Female |
| $2,499 or less | 6 (5.9%) | 6 (3.3%) |
| $2,500 to $4,999 | 3 (3.0%) | 6 (3.3%) |
| $5,000 to $7,499 | 0 (0.0%) | 3 (1.7%) |
| $7,500 to $9,999 | 4 (4.0%) | 10 (5.5%) |
| $10,000 to $12,499 | 0 (0.0%) | 15 (8.3%) |
| $12,500 to $14,999 | 0 (0.0%) | 3 (1.7%) |
| $15,000 to $17,499 | 0 (0.0%) | 14 (7.7%) |
| $17,500 to $19,999 | 3 (3.0%) | 4 (2.2%) |
| $20,000 to $22,499 | 7 (6.9%) | 18 (9.9%) |
| $22,500 to $24,999 | 5 (5.0%) | 28 (15.5%) |
| $25,000 to $29,999 | 9 (8.9%) | 9 (5.0%) |
| $30,000 to $34,999 | 2 (2.0%) | 4 (2.2%) |
| $35,000 to $39,999 | 12 (11.9%) | 8 (4.4%) |
| $40,000 to $44,999 | 9 (8.9%) | 12 (6.6%) |
| $45,000 to $49,999 | 8 (7.9%) | 17 (9.4%) |
| $50,000 to $54,999 | 2 (2.0%) | 7 (3.9%) |
| $55,000 to $64,999 | 9 (8.9%) | 4 (2.2%) |
| $65,000 to $74,999 | 8 (7.9%) | 8 (4.4%) |
| $75,000 to $99,999 | 12 (11.9%) | 0 (0.0%) |
| $100,000+ | 2 (2.0%) | 5 (2.8%) |
| Total | 101 (100.0%) | 181 (100.0%) |
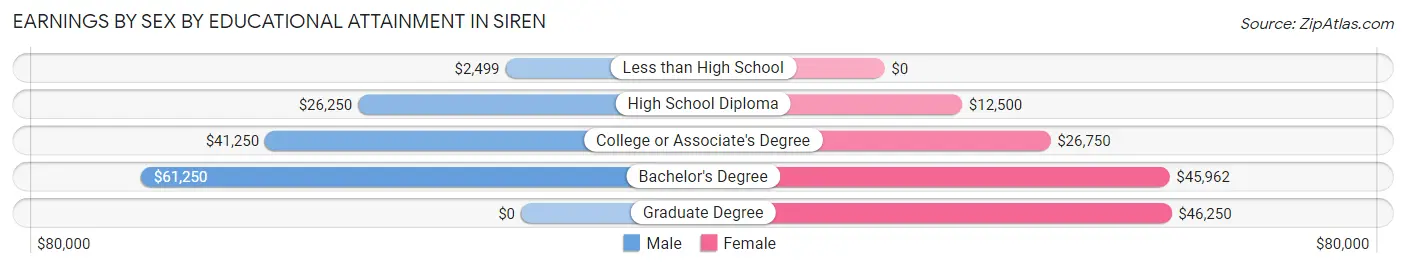
Earnings by Sex by Educational Attainment in Siren
Average earnings in Siren are $40,972 for men and $24,417 for women, a difference of 40.4%. Men with an educational attainment of bachelor's degree enjoy the highest average annual earnings of $61,250, while those with less than high school education earn the least with $2,499. Women with an educational attainment of graduate degree earn the most with the average annual earnings of $46,250, while those with high school diploma education have the smallest earnings of $12,500.
| Educational Attainment | Male Income | Female Income |
| Less than High School | $2,499 | $0 |
| High School Diploma | $26,250 | $12,500 |
| College or Associate's Degree | $41,250 | $26,750 |
| Bachelor's Degree | $61,250 | $45,962 |
| Graduate Degree | - | - |
| Total | $40,972 | $24,417 |
Family Income in Siren
Family Income Brackets in Siren
According to the Siren family income data, there are 44 families falling into the $50,000 to $74,999 income range, which is the most common income bracket and makes up 30.1% of all families.
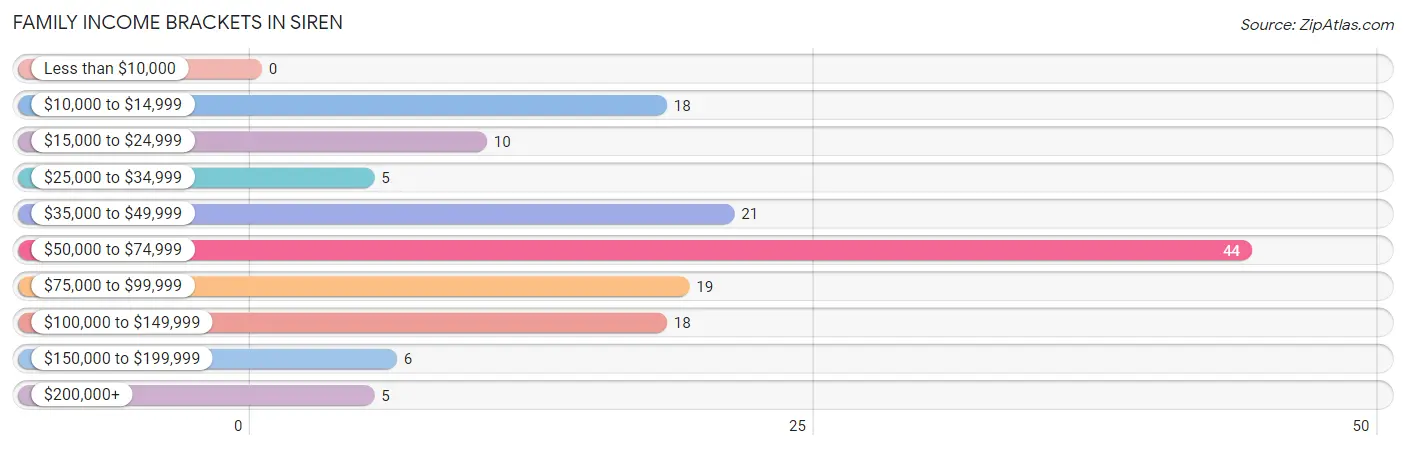
| Income Bracket | # Families | % Families |
| Less than $10,000 | 0 | 0.0% |
| $10,000 to $14,999 | 18 | 12.3% |
| $15,000 to $24,999 | 10 | 6.8% |
| $25,000 to $34,999 | 5 | 3.4% |
| $35,000 to $49,999 | 21 | 14.4% |
| $50,000 to $74,999 | 44 | 30.1% |
| $75,000 to $99,999 | 19 | 13.0% |
| $100,000 to $149,999 | 18 | 12.3% |
| $150,000 to $199,999 | 6 | 4.1% |
| $200,000+ | 5 | 3.4% |
Family Income by Famaliy Size in Siren
4-person families (12 | 8.2%) account for the highest median family income in Siren with $125,000 per family, while 4-person families (12 | 8.2%) have the highest median income of $31,250 per family member.
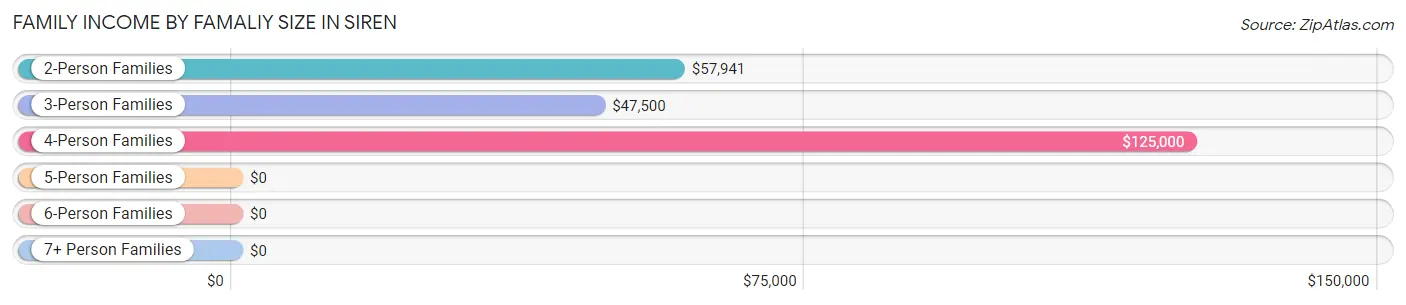
| Income Bracket | # Families | Median Income |
| 2-Person Families | 108 (74.0%) | $57,941 |
| 3-Person Families | 20 (13.7%) | $47,500 |
| 4-Person Families | 12 (8.2%) | $125,000 |
| 5-Person Families | 6 (4.1%) | $0 |
| 6-Person Families | 0 (0.0%) | $0 |
| 7+ Person Families | 0 (0.0%) | $0 |
| Total | 146 (100.0%) | $57,647 |
Family Income by Number of Earners in Siren
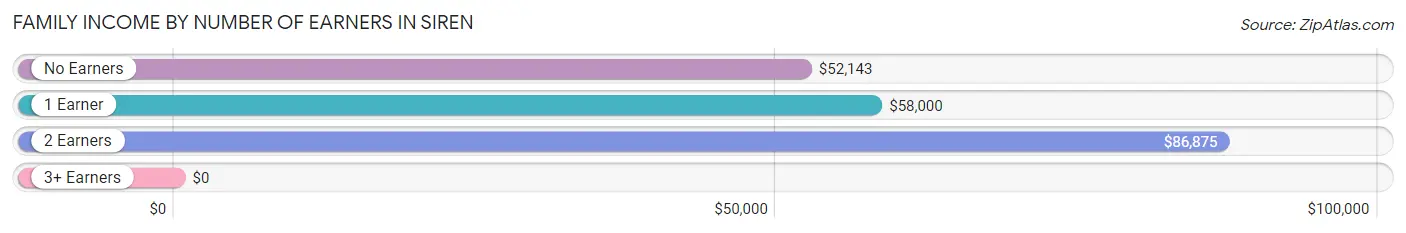
| Number of Earners | # Families | Median Income |
| No Earners | 52 (35.6%) | $52,143 |
| 1 Earner | 40 (27.4%) | $58,000 |
| 2 Earners | 51 (34.9%) | $86,875 |
| 3+ Earners | 3 (2.1%) | $0 |
| Total | 146 (100.0%) | $57,647 |
Household Income in Siren
Household Income Brackets in Siren
With 75 households falling in the category, the $50,000 to $74,999 income range is the most frequent in Siren, accounting for 22.1% of all households. In contrast, only 5 households (1.5%) fall into the $200,000+ income bracket, making it the least populous group.
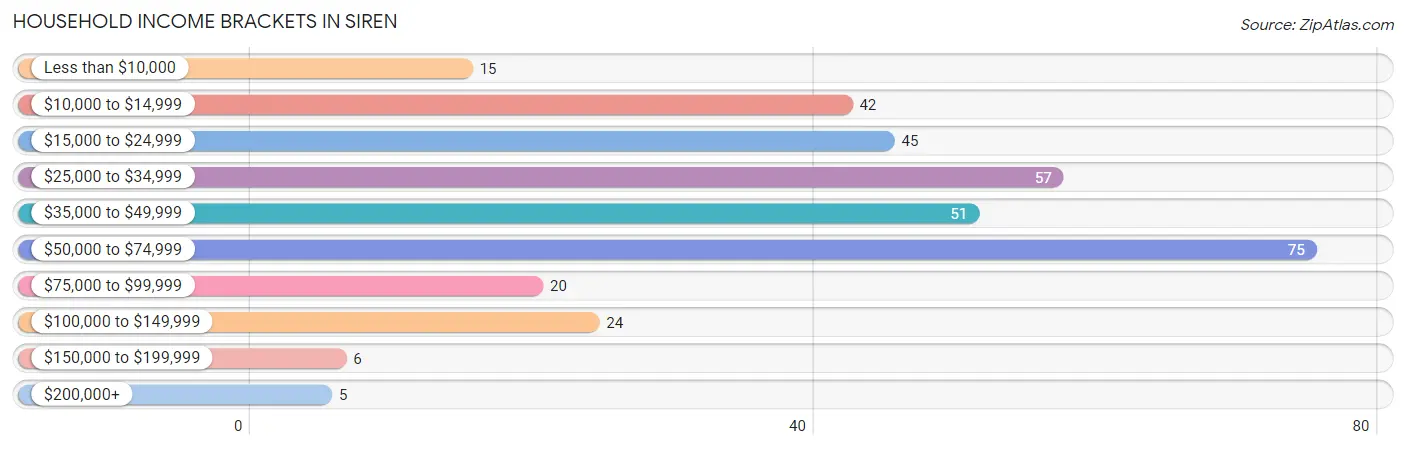
| Income Bracket | # Households | % Households |
| Less than $10,000 | 15 | 4.4% |
| $10,000 to $14,999 | 42 | 12.4% |
| $15,000 to $24,999 | 45 | 13.2% |
| $25,000 to $34,999 | 57 | 16.8% |
| $35,000 to $49,999 | 51 | 15.0% |
| $50,000 to $74,999 | 75 | 22.1% |
| $75,000 to $99,999 | 20 | 5.9% |
| $100,000 to $149,999 | 24 | 7.1% |
| $150,000 to $199,999 | 6 | 1.8% |
| $200,000+ | 5 | 1.5% |
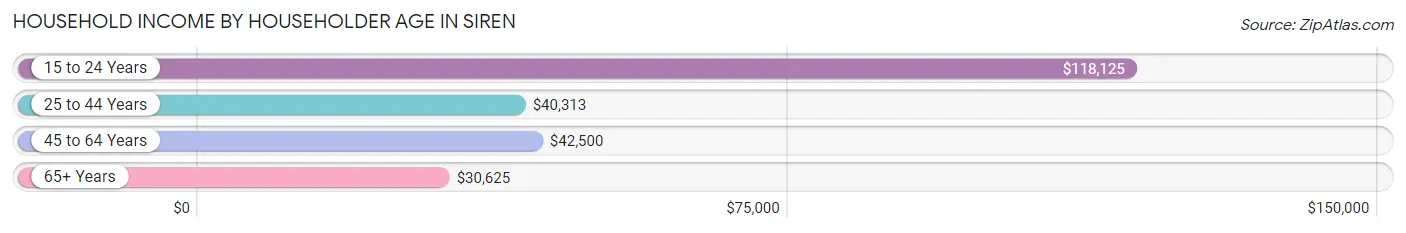
Household Income by Householder Age in Siren
The median household income in Siren is $39,375, with the highest median household income of $118,125 found in the 15 to 24 years age bracket for the primary householder. A total of 9 households (2.6%) fall into this category. Meanwhile, the 65+ years age bracket for the primary householder has the lowest median household income of $30,625, with 160 households (47.1%) in this group.
| Income Bracket | # Households | Median Income |
| 15 to 24 Years | 9 (2.6%) | $118,125 |
| 25 to 44 Years | 41 (12.1%) | $40,313 |
| 45 to 64 Years | 130 (38.2%) | $42,500 |
| 65+ Years | 160 (47.1%) | $30,625 |
| Total | 340 (100.0%) | $39,375 |
Poverty in Siren
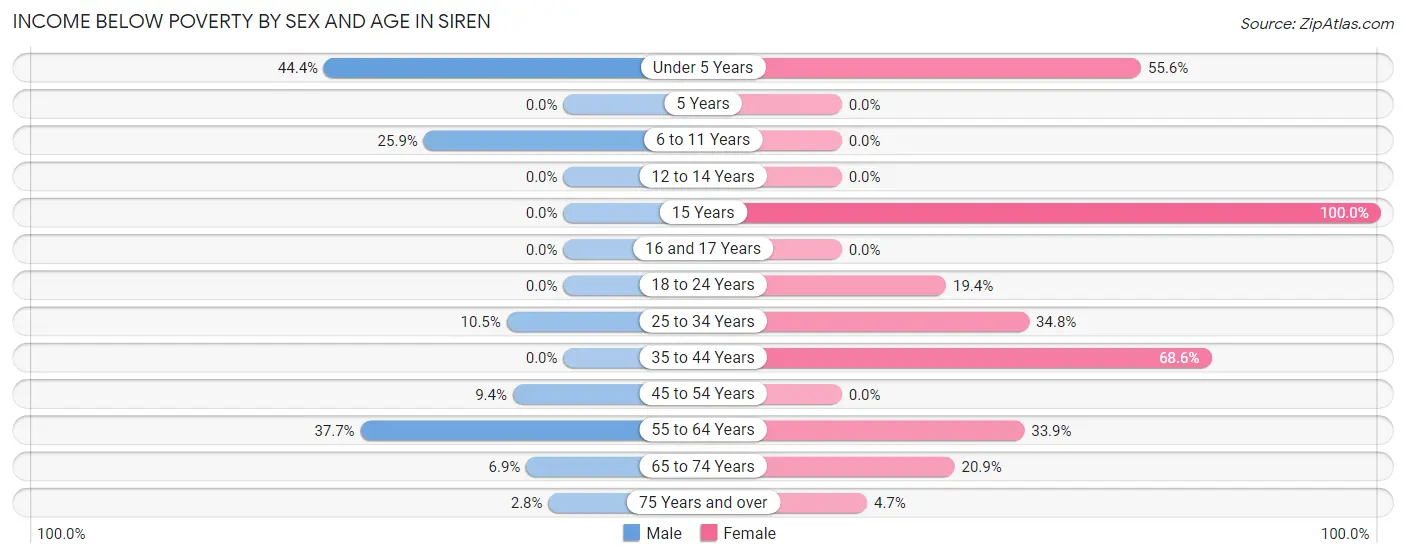
Income Below Poverty by Sex and Age in Siren
With 16.5% poverty level for males and 28.6% for females among the residents of Siren, under 5 year old males and 15 year old females are the most vulnerable to poverty, with 8 males (44.4%) and 2 females (100.0%) in their respective age groups living below the poverty level.
| Age Bracket | Male | Female |
| Under 5 Years | 8 (44.4%) | 5 (55.6%) |
| 5 Years | 0 (0.0%) | 0 (0.0%) |
| 6 to 11 Years | 7 (25.9%) | 0 (0.0%) |
| 12 to 14 Years | 0 (0.0%) | 0 (0.0%) |
| 15 Years | 0 (0.0%) | 2 (100.0%) |
| 16 and 17 Years | 0 (0.0%) | 0 (0.0%) |
| 18 to 24 Years | 0 (0.0%) | 6 (19.4%) |
| 25 to 34 Years | 2 (10.5%) | 16 (34.8%) |
| 35 to 44 Years | 0 (0.0%) | 48 (68.6%) |
| 45 to 54 Years | 3 (9.4%) | 0 (0.0%) |
| 55 to 64 Years | 29 (37.7%) | 21 (33.9%) |
| 65 to 74 Years | 2 (6.9%) | 9 (20.9%) |
| 75 Years and over | 2 (2.8%) | 3 (4.7%) |
| Total | 53 (16.5%) | 110 (28.6%) |
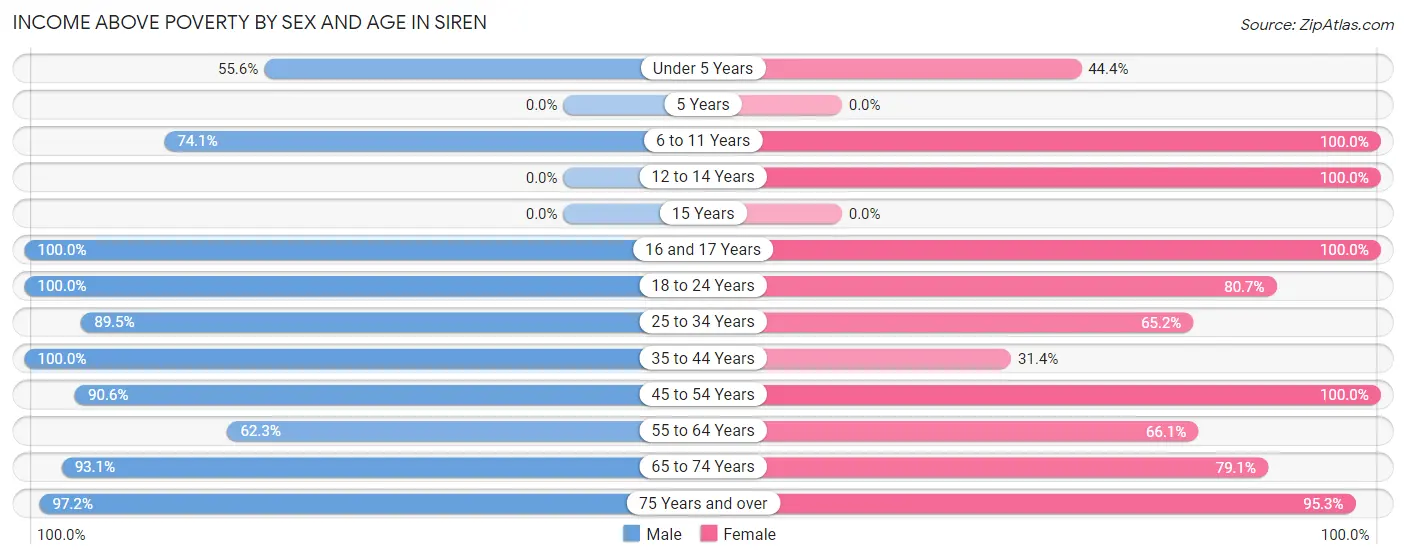
Income Above Poverty by Sex and Age in Siren
According to the poverty statistics in Siren, males aged 16 and 17 years and females aged 6 to 11 years are the age groups that are most secure financially, with 100.0% of males and 100.0% of females in these age groups living above the poverty line.
| Age Bracket | Male | Female |
| Under 5 Years | 10 (55.6%) | 4 (44.4%) |
| 5 Years | 0 (0.0%) | 0 (0.0%) |
| 6 to 11 Years | 20 (74.1%) | 10 (100.0%) |
| 12 to 14 Years | 0 (0.0%) | 2 (100.0%) |
| 15 Years | 0 (0.0%) | 0 (0.0%) |
| 16 and 17 Years | 10 (100.0%) | 1 (100.0%) |
| 18 to 24 Years | 19 (100.0%) | 25 (80.6%) |
| 25 to 34 Years | 17 (89.5%) | 30 (65.2%) |
| 35 to 44 Years | 19 (100.0%) | 22 (31.4%) |
| 45 to 54 Years | 29 (90.6%) | 44 (100.0%) |
| 55 to 64 Years | 48 (62.3%) | 41 (66.1%) |
| 65 to 74 Years | 27 (93.1%) | 34 (79.1%) |
| 75 Years and over | 70 (97.2%) | 61 (95.3%) |
| Total | 269 (83.5%) | 274 (71.4%) |
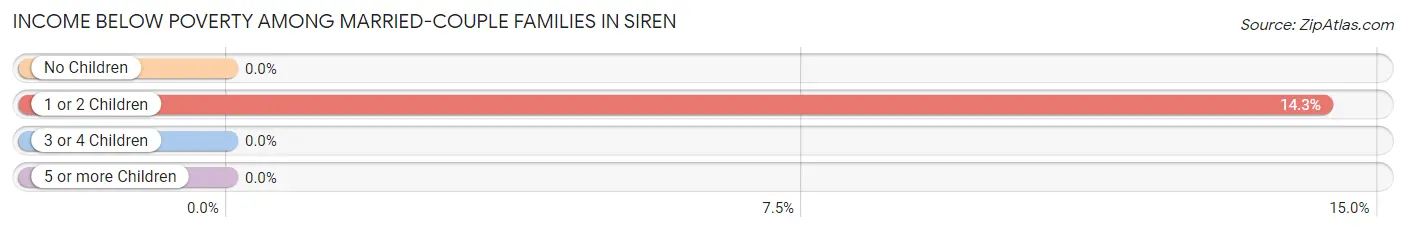
Income Below Poverty Among Married-Couple Families in Siren
The poverty statistics for married-couple families in Siren show that 3.0% or 3 of the total 101 families live below the poverty line. Families with 1 or 2 children have the highest poverty rate of 14.3%, comprising of 3 families. On the other hand, families with no children have the lowest poverty rate of 0.0%, which includes 0 families.
| Children | Above Poverty | Below Poverty |
| No Children | 80 (100.0%) | 0 (0.0%) |
| 1 or 2 Children | 18 (85.7%) | 3 (14.3%) |
| 3 or 4 Children | 0 (0.0%) | 0 (0.0%) |
| 5 or more Children | 0 (0.0%) | 0 (0.0%) |
| Total | 98 (97.0%) | 3 (3.0%) |
Income Below Poverty Among Single-Parent Households in Siren
According to the poverty data in Siren, 81.8% or 18 single-father households and 26.1% or 6 single-mother households are living below the poverty line. Among single-father households, those with no children have the highest poverty rate, with 18 households (90.0%) experiencing poverty. Likewise, among single-mother households, those with 1 or 2 children have the highest poverty rate, with 6 households (28.6%) falling below the poverty line.
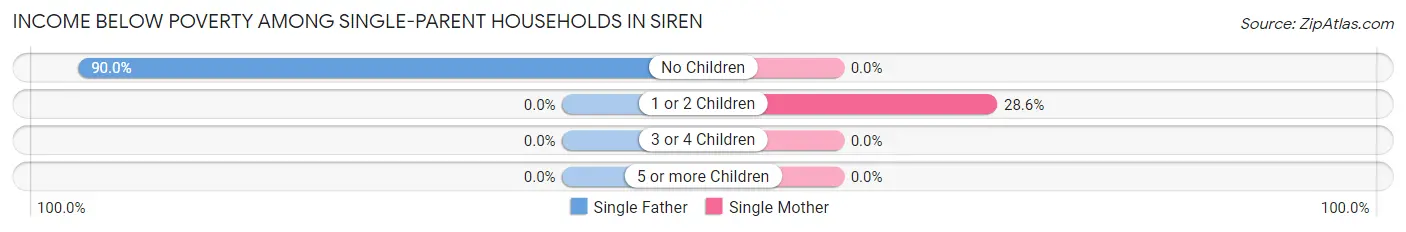
| Children | Single Father | Single Mother |
| No Children | 18 (90.0%) | 0 (0.0%) |
| 1 or 2 Children | 0 (0.0%) | 6 (28.6%) |
| 3 or 4 Children | 0 (0.0%) | 0 (0.0%) |
| 5 or more Children | 0 (0.0%) | 0 (0.0%) |
| Total | 18 (81.8%) | 6 (26.1%) |
Income Below Poverty Among Married-Couple vs Single-Parent Households in Siren
The poverty data for Siren shows that 3 of the married-couple family households (3.0%) and 24 of the single-parent households (53.3%) are living below the poverty level. Within the married-couple family households, those with 1 or 2 children have the highest poverty rate, with 3 households (14.3%) falling below the poverty line. Among the single-parent households, those with no children have the highest poverty rate, with 18 household (81.8%) living below poverty.
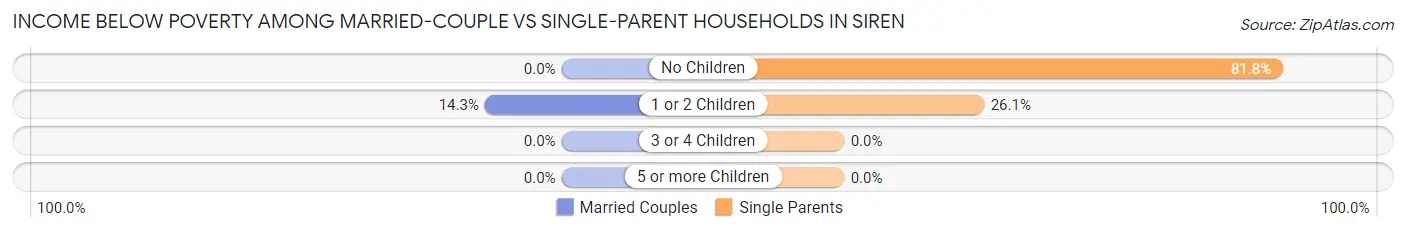
| Children | Married-Couple Families | Single-Parent Households |
| No Children | 0 (0.0%) | 18 (81.8%) |
| 1 or 2 Children | 3 (14.3%) | 6 (26.1%) |
| 3 or 4 Children | 0 (0.0%) | 0 (0.0%) |
| 5 or more Children | 0 (0.0%) | 0 (0.0%) |
| Total | 3 (3.0%) | 24 (53.3%) |
Race in Siren
The most populous races in Siren are White / Caucasian (665 | 93.7%), Two or more Races (37 | 5.2%), and Black / African American (6 | 0.9%).
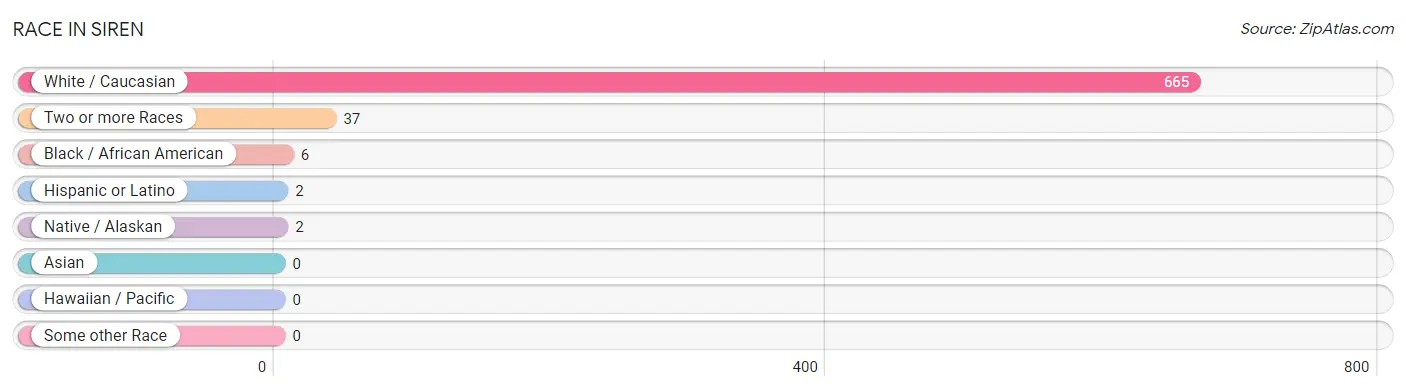
| Race | # Population | % Population |
| Asian | 0 | 0.0% |
| Black / African American | 6 | 0.9% |
| Hawaiian / Pacific | 0 | 0.0% |
| Hispanic or Latino | 2 | 0.3% |
| Native / Alaskan | 2 | 0.3% |
| White / Caucasian | 665 | 93.7% |
| Two or more Races | 37 | 5.2% |
| Some other Race | 0 | 0.0% |
| Total | 710 | 100.0% |
Ancestry in Siren
The most populous ancestries reported in Siren are German (253 | 35.6%), Norwegian (152 | 21.4%), American (128 | 18.0%), Swedish (75 | 10.6%), and Irish (42 | 5.9%), together accounting for 91.6% of all Siren residents.
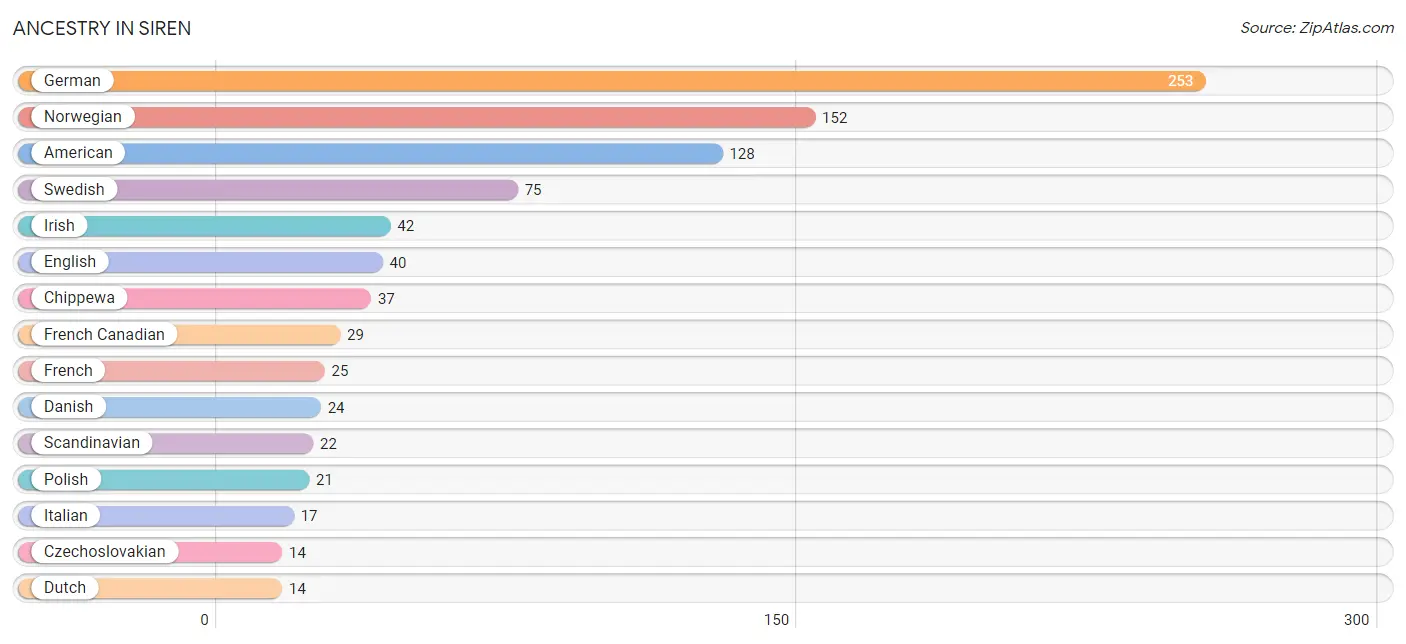
| Ancestry | # Population | % Population |
| American | 128 | 18.0% |
| Blackfeet | 2 | 0.3% |
| Chippewa | 37 | 5.2% |
| Croatian | 5 | 0.7% |
| Czech | 5 | 0.7% |
| Czechoslovakian | 14 | 2.0% |
| Danish | 24 | 3.4% |
| Dutch | 14 | 2.0% |
| English | 40 | 5.6% |
| European | 3 | 0.4% |
| French | 25 | 3.5% |
| French Canadian | 29 | 4.1% |
| German | 253 | 35.6% |
| Irish | 42 | 5.9% |
| Italian | 17 | 2.4% |
| Lithuanian | 1 | 0.1% |
| Norwegian | 152 | 21.4% |
| Polish | 21 | 3.0% |
| Puerto Rican | 2 | 0.3% |
| Russian | 5 | 0.7% |
| Scandinavian | 22 | 3.1% |
| Scottish | 1 | 0.1% |
| Swedish | 75 | 10.6% |
| Welsh | 2 | 0.3% | View All 24 Rows |
Immigrants in Siren
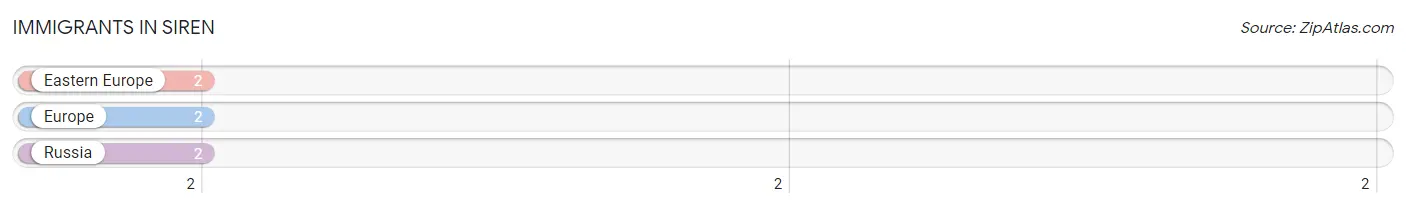
The most numerous immigrant groups reported in Siren came from Eastern Europe (2 | 0.3%), Europe (2 | 0.3%), and Russia (2 | 0.3%), together accounting for 0.8% of all Siren residents.
| Immigration Origin | # Population | % Population |
| Eastern Europe | 2 | 0.3% |
| Europe | 2 | 0.3% |
| Russia | 2 | 0.3% | View All 3 Rows |
Sex and Age in Siren
Sex and Age in Siren
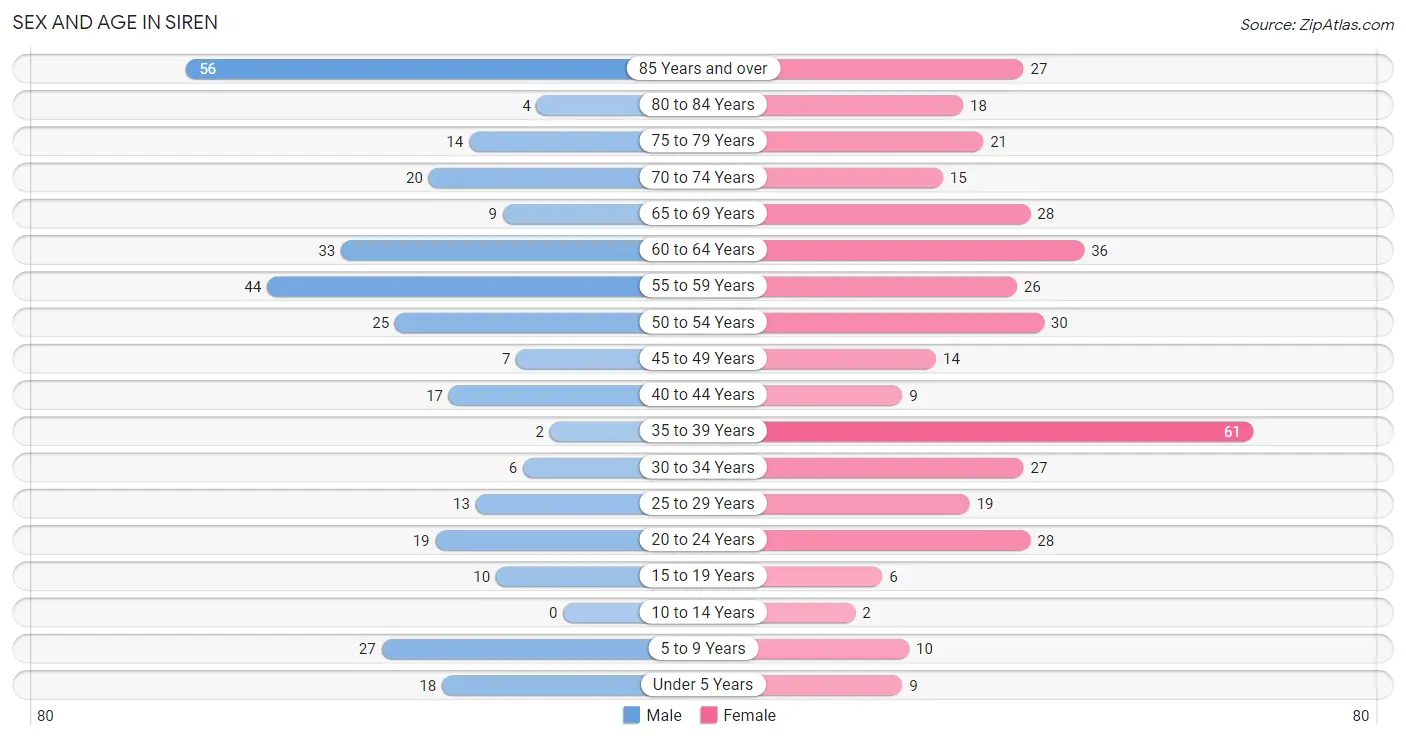
The most populous age groups in Siren are 85 Years and over (56 | 17.3%) for men and 35 to 39 Years (61 | 15.8%) for women.
| Age Bracket | Male | Female |
| Under 5 Years | 18 (5.6%) | 9 (2.3%) |
| 5 to 9 Years | 27 (8.3%) | 10 (2.6%) |
| 10 to 14 Years | 0 (0.0%) | 2 (0.5%) |
| 15 to 19 Years | 10 (3.1%) | 6 (1.5%) |
| 20 to 24 Years | 19 (5.9%) | 28 (7.2%) |
| 25 to 29 Years | 13 (4.0%) | 19 (4.9%) |
| 30 to 34 Years | 6 (1.8%) | 27 (7.0%) |
| 35 to 39 Years | 2 (0.6%) | 61 (15.8%) |
| 40 to 44 Years | 17 (5.2%) | 9 (2.3%) |
| 45 to 49 Years | 7 (2.2%) | 14 (3.6%) |
| 50 to 54 Years | 25 (7.7%) | 30 (7.8%) |
| 55 to 59 Years | 44 (13.6%) | 26 (6.7%) |
| 60 to 64 Years | 33 (10.2%) | 36 (9.3%) |
| 65 to 69 Years | 9 (2.8%) | 28 (7.2%) |
| 70 to 74 Years | 20 (6.2%) | 15 (3.9%) |
| 75 to 79 Years | 14 (4.3%) | 21 (5.4%) |
| 80 to 84 Years | 4 (1.2%) | 18 (4.7%) |
| 85 Years and over | 56 (17.3%) | 27 (7.0%) |
| Total | 324 (100.0%) | 386 (100.0%) |
Families and Households in Siren
Median Family Size in Siren
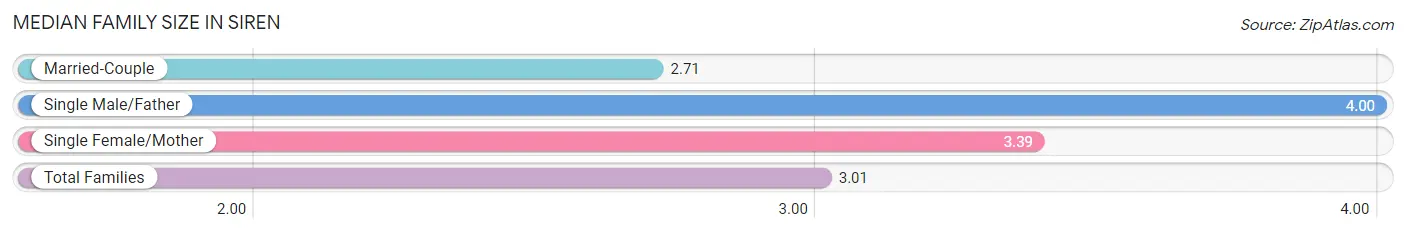
The median family size in Siren is 3.01 persons per family, with single male/father families (22 | 15.1%) accounting for the largest median family size of 4 persons per family. On the other hand, married-couple families (101 | 69.2%) represent the smallest median family size with 2.71 persons per family.
| Family Type | # Families | Family Size |
| Married-Couple | 101 (69.2%) | 2.71 |
| Single Male/Father | 22 (15.1%) | 4.00 |
| Single Female/Mother | 23 (15.8%) | 3.39 |
| Total Families | 146 (100.0%) | 3.01 |
Median Household Size in Siren
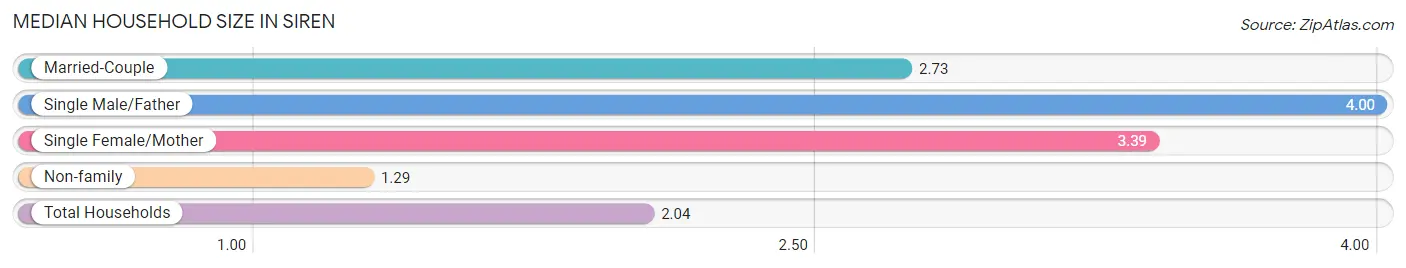
The median household size in Siren is 2.04 persons per household, with single male/father households (22 | 6.5%) accounting for the largest median household size of 4 persons per household. non-family households (194 | 57.1%) represent the smallest median household size with 1.29 persons per household.
| Household Type | # Households | Household Size |
| Married-Couple | 101 (29.7%) | 2.73 |
| Single Male/Father | 22 (6.5%) | 4.00 |
| Single Female/Mother | 23 (6.8%) | 3.39 |
| Non-family | 194 (57.1%) | 1.29 |
| Total Households | 340 (100.0%) | 2.04 |
Household Size by Marriage Status in Siren
Out of a total of 340 households in Siren, 146 (42.9%) are family households, while 194 (57.1%) are nonfamily households. The most numerous type of family households are 2-person households, comprising 108, and the most common type of nonfamily households are 1-person households, comprising 162.
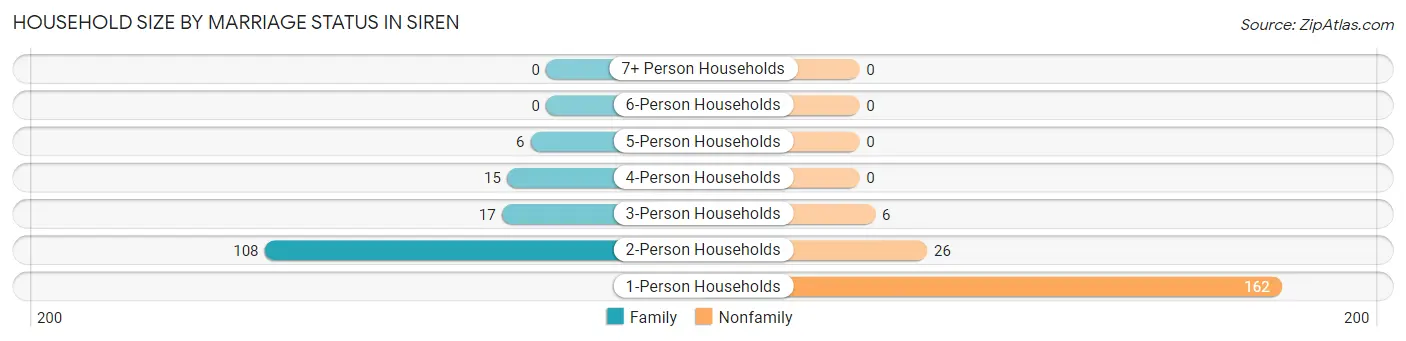
| Household Size | Family Households | Nonfamily Households |
| 1-Person Households | - | 162 (47.6%) |
| 2-Person Households | 108 (31.8%) | 26 (7.6%) |
| 3-Person Households | 17 (5.0%) | 6 (1.8%) |
| 4-Person Households | 15 (4.4%) | 0 (0.0%) |
| 5-Person Households | 6 (1.8%) | 0 (0.0%) |
| 6-Person Households | 0 (0.0%) | 0 (0.0%) |
| 7+ Person Households | 0 (0.0%) | 0 (0.0%) |
| Total | 146 (42.9%) | 194 (57.1%) |
Female Fertility in Siren
Fertility by Age in Siren
Average fertility rate in Siren is 12.0 births per 1,000 women. Women in the age bracket of 35 to 50 years have the highest fertility rate with 22.0 births per 1,000 women. Women in the age bracket of 35 to 50 years acount for 100.0% of all women with births.
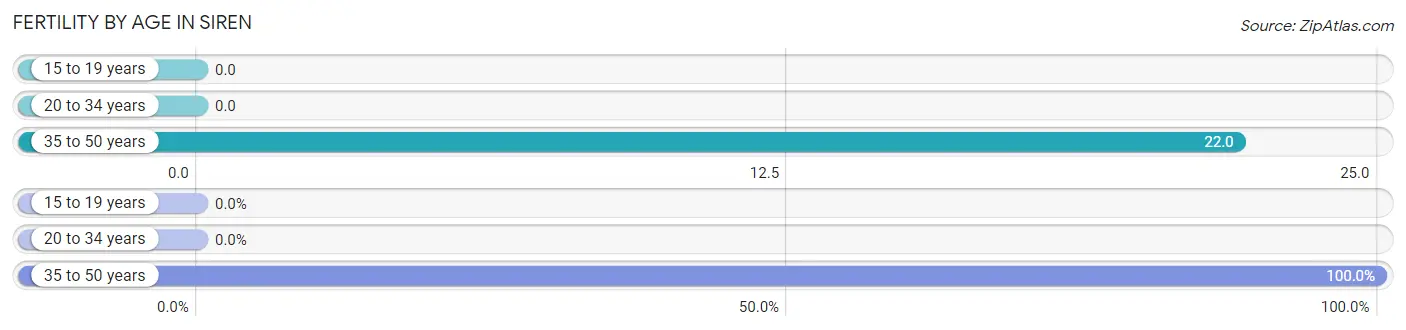
| Age Bracket | Women with Births | Births / 1,000 Women |
| 15 to 19 years | 0 (0.0%) | 0.0 |
| 20 to 34 years | 0 (0.0%) | 0.0 |
| 35 to 50 years | 2 (100.0%) | 22.0 |
| Total | 2 (100.0%) | 12.0 |
Fertility by Age by Marriage Status in Siren
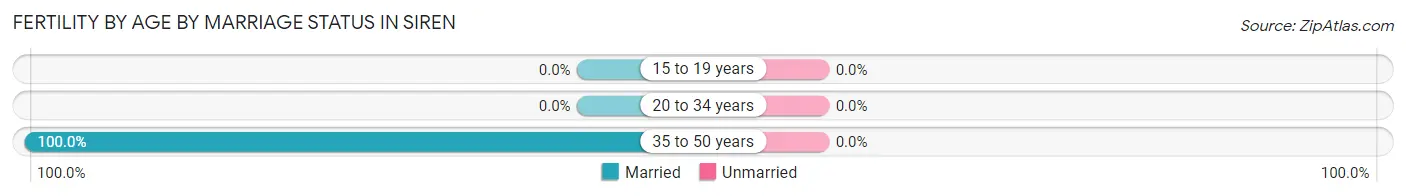
| Age Bracket | Married | Unmarried |
| 15 to 19 years | 0 (0.0%) | 0 (0.0%) |
| 20 to 34 years | 0 (0.0%) | 0 (0.0%) |
| 35 to 50 years | 2 (100.0%) | 0 (0.0%) |
| Total | 2 (100.0%) | 0 (0.0%) |
Fertility by Education in Siren
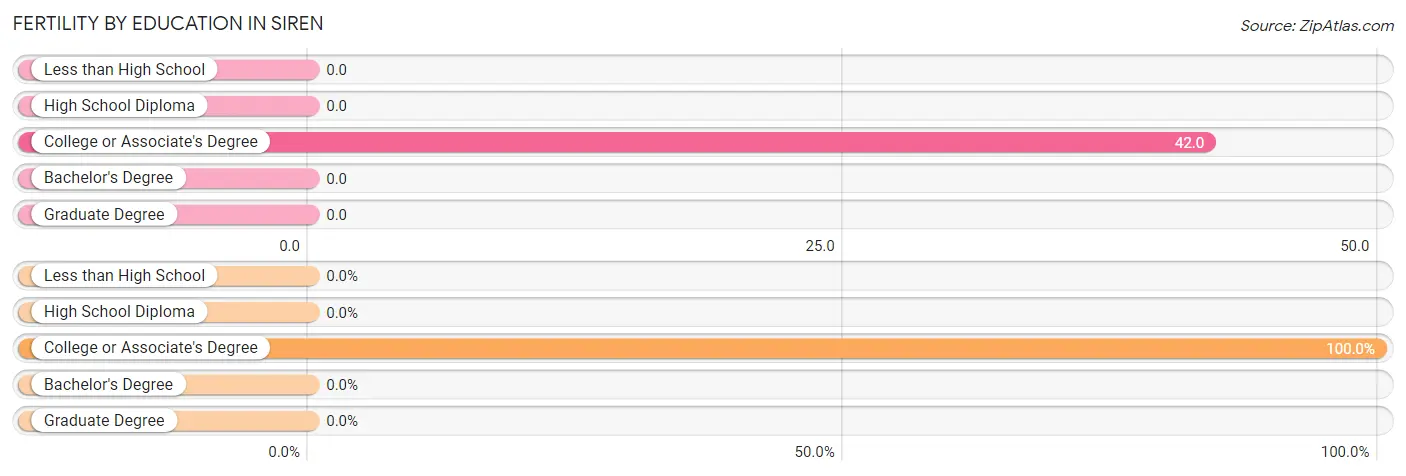
| Educational Attainment | Women with Births | Births / 1,000 Women |
| Less than High School | 0 (0.0%) | 0.0 |
| High School Diploma | 0 (0.0%) | 0.0 |
| College or Associate's Degree | 2 (100.0%) | 42.0 |
| Bachelor's Degree | 0 (0.0%) | 0.0 |
| Graduate Degree | 0 (0.0%) | 0.0 |
| Total | 2 (100.0%) | 12.0 |
Fertility by Education by Marriage Status in Siren
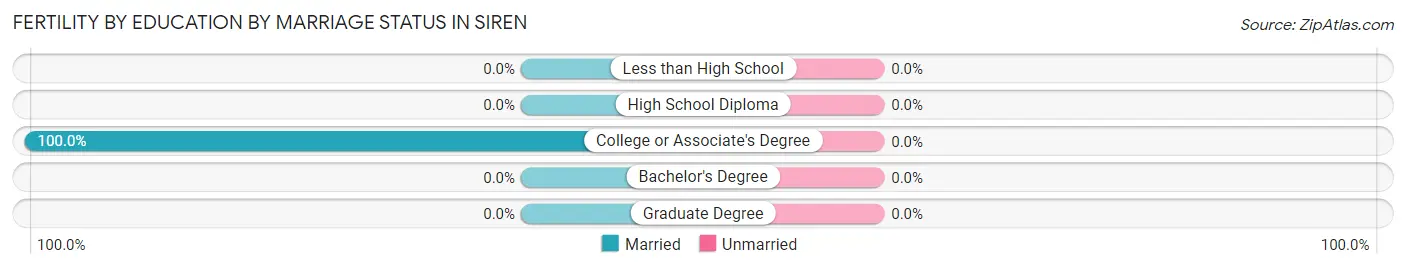
| Educational Attainment | Married | Unmarried |
| Less than High School | 0 (0.0%) | 0 (0.0%) |
| High School Diploma | 0 (0.0%) | 0 (0.0%) |
| College or Associate's Degree | 2 (100.0%) | 0 (0.0%) |
| Bachelor's Degree | 0 (0.0%) | 0 (0.0%) |
| Graduate Degree | 0 (0.0%) | 0 (0.0%) |
| Total | 2 (100.0%) | 0 (0.0%) |
Employment Characteristics in Siren
Employment by Class of Employer in Siren
Among the 250 employed individuals in Siren, private company employees (173 | 69.2%), not-for-profit organizations (35 | 14.0%), and local government employees (15 | 6.0%) make up the most common classes of employment.
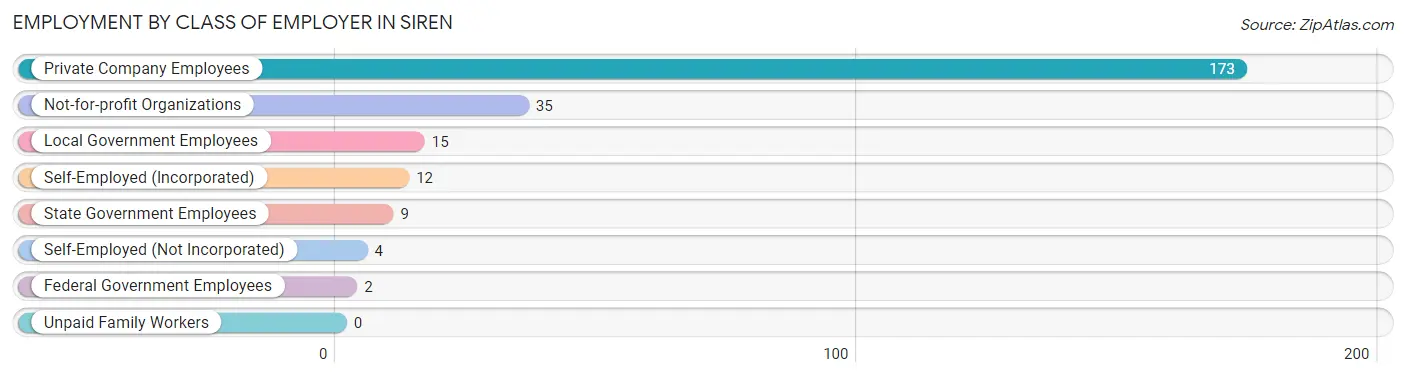
| Employer Class | # Employees | % Employees |
| Private Company Employees | 173 | 69.2% |
| Self-Employed (Incorporated) | 12 | 4.8% |
| Self-Employed (Not Incorporated) | 4 | 1.6% |
| Not-for-profit Organizations | 35 | 14.0% |
| Local Government Employees | 15 | 6.0% |
| State Government Employees | 9 | 3.6% |
| Federal Government Employees | 2 | 0.8% |
| Unpaid Family Workers | 0 | 0.0% |
| Total | 250 | 100.0% |
Employment Status by Age in Siren
According to the labor force statistics for Siren, out of the total population over 16 years of age (642), 43.0% or 276 individuals are in the labor force, with 8.7% or 24 of them unemployed. The age group with the highest labor force participation rate is 20 to 24 years, with 100.0% or 47 individuals in the labor force. Within the labor force, the 25 to 29 years age range has the highest percentage of unemployed individuals, with 31.3% or 10 of them being unemployed.
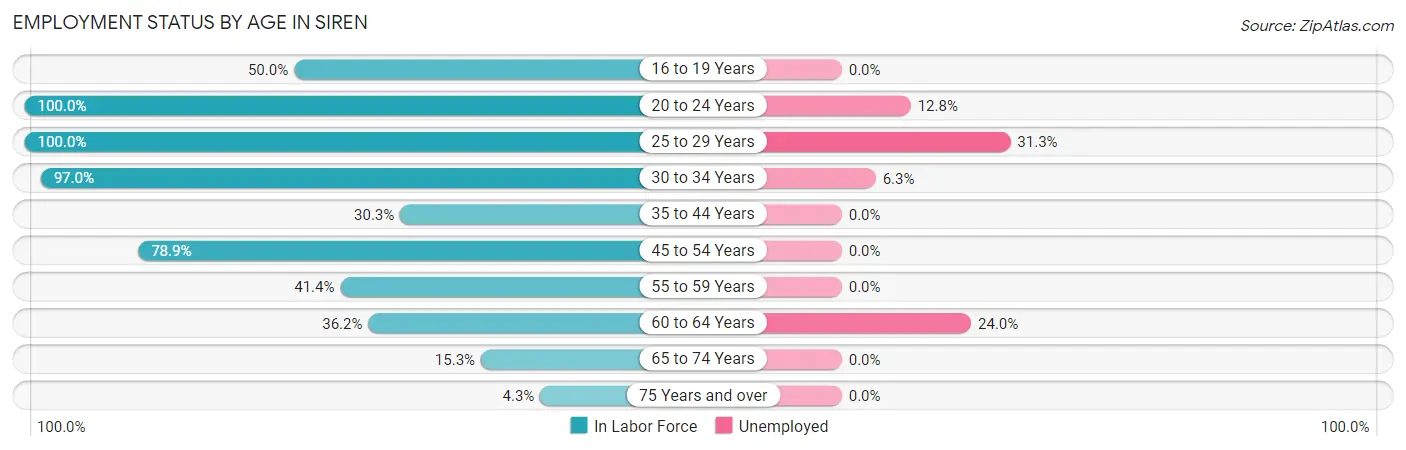
| Age Bracket | In Labor Force | Unemployed |
| 16 to 19 Years | 7 (50.0%) | 0 (0.0%) |
| 20 to 24 Years | 47 (100.0%) | 6 (12.8%) |
| 25 to 29 Years | 32 (100.0%) | 10 (31.3%) |
| 30 to 34 Years | 32 (97.0%) | 2 (6.3%) |
| 35 to 44 Years | 27 (30.3%) | 0 (0.0%) |
| 45 to 54 Years | 60 (78.9%) | 0 (0.0%) |
| 55 to 59 Years | 29 (41.4%) | 0 (0.0%) |
| 60 to 64 Years | 25 (36.2%) | 6 (24.0%) |
| 65 to 74 Years | 11 (15.3%) | 0 (0.0%) |
| 75 Years and over | 6 (4.3%) | 0 (0.0%) |
| Total | 276 (43.0%) | 24 (8.7%) |
Employment Status by Educational Attainment in Siren
According to labor force statistics for Siren, 55.6% of individuals (205) out of the total population between 25 and 64 years of age (369) are in the labor force, with 8.8% or 18 of them being unemployed. The group with the highest labor force participation rate are those with the educational attainment of college / associate degree, with 72.9% or 70 individuals in the labor force. Within the labor force, individuals with high school diploma education have the highest percentage of unemployment, with 21.3% or 16 of them being unemployed.
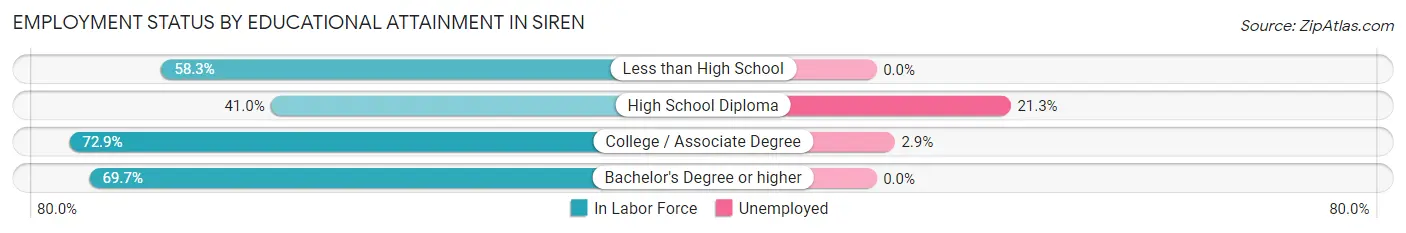
| Educational Attainment | In Labor Force | Unemployed |
| Less than High School | 14 (58.3%) | 0 (0.0%) |
| High School Diploma | 75 (41.0%) | 39 (21.3%) |
| College / Associate Degree | 70 (72.9%) | 3 (2.9%) |
| Bachelor's Degree or higher | 46 (69.7%) | 0 (0.0%) |
| Total | 205 (55.6%) | 32 (8.8%) |
Employment Occupations by Sex in Siren
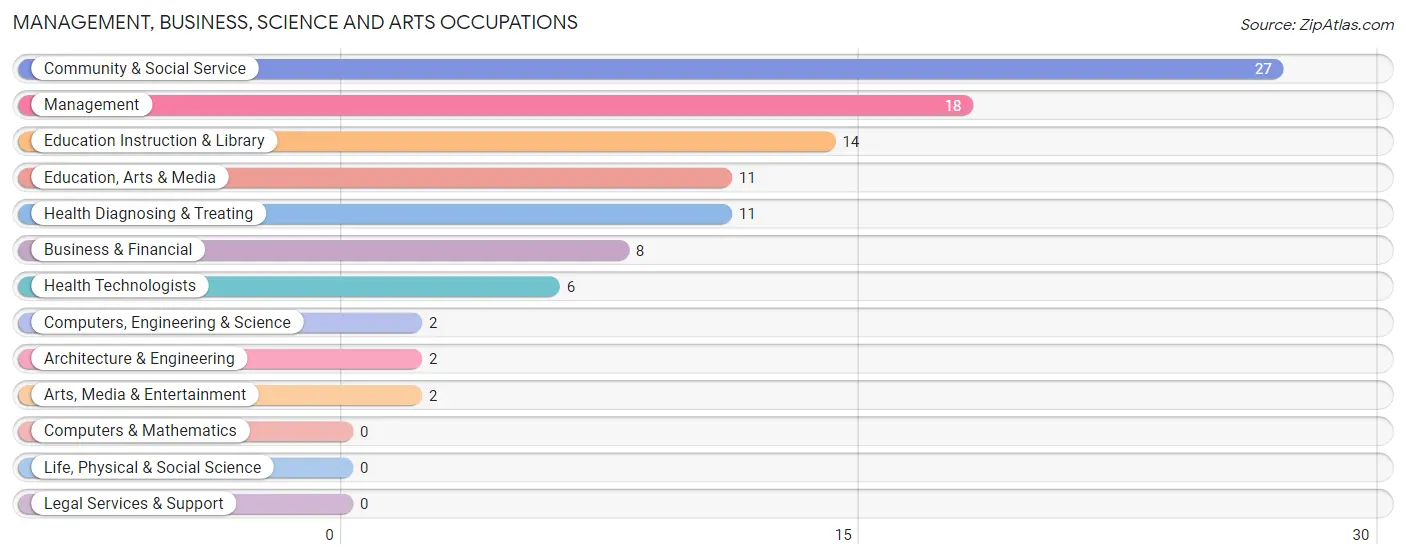
Management, Business, Science and Arts Occupations
The most common Management, Business, Science and Arts occupations in Siren are Community & Social Service (27 | 10.7%), Management (18 | 7.1%), Education Instruction & Library (14 | 5.6%), Education, Arts & Media (11 | 4.4%), and Health Diagnosing & Treating (11 | 4.4%).
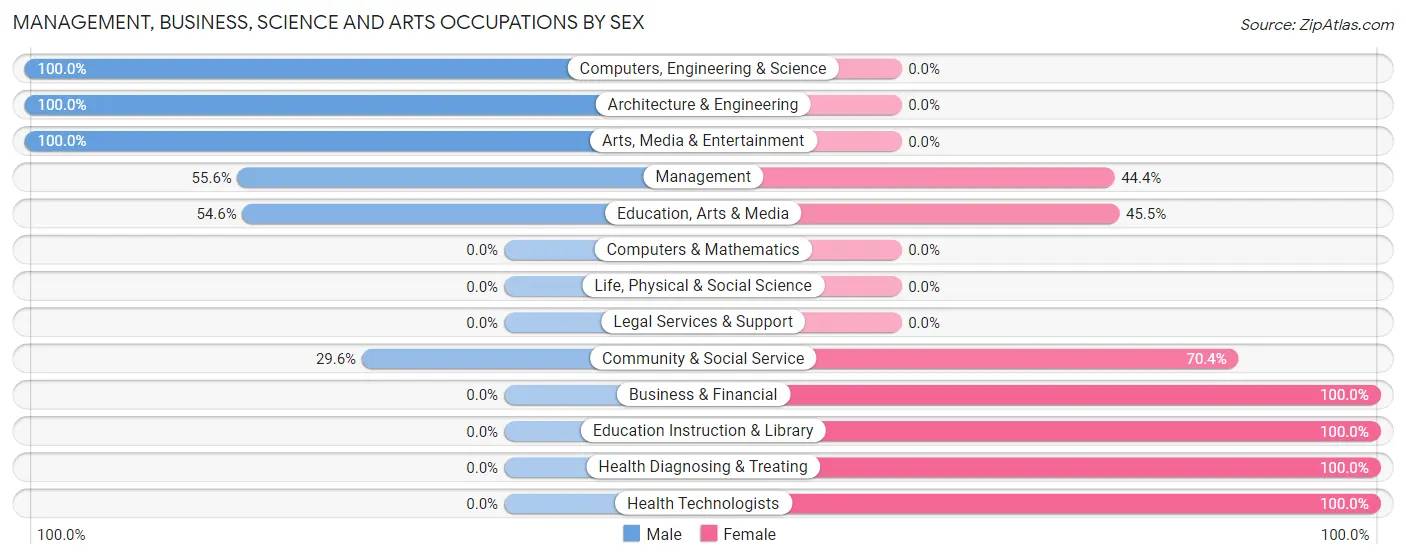
Management, Business, Science and Arts Occupations by Sex
Within the Management, Business, Science and Arts occupations in Siren, the most male-oriented occupations are Computers, Engineering & Science (100.0%), Architecture & Engineering (100.0%), and Arts, Media & Entertainment (100.0%), while the most female-oriented occupations are Business & Financial (100.0%), Education Instruction & Library (100.0%), and Health Diagnosing & Treating (100.0%).
| Occupation | Male | Female |
| Management | 10 (55.6%) | 8 (44.4%) |
| Business & Financial | 0 (0.0%) | 8 (100.0%) |
| Computers, Engineering & Science | 2 (100.0%) | 0 (0.0%) |
| Computers & Mathematics | 0 (0.0%) | 0 (0.0%) |
| Architecture & Engineering | 2 (100.0%) | 0 (0.0%) |
| Life, Physical & Social Science | 0 (0.0%) | 0 (0.0%) |
| Community & Social Service | 8 (29.6%) | 19 (70.4%) |
| Education, Arts & Media | 6 (54.5%) | 5 (45.5%) |
| Legal Services & Support | 0 (0.0%) | 0 (0.0%) |
| Education Instruction & Library | 0 (0.0%) | 14 (100.0%) |
| Arts, Media & Entertainment | 2 (100.0%) | 0 (0.0%) |
| Health Diagnosing & Treating | 0 (0.0%) | 11 (100.0%) |
| Health Technologists | 0 (0.0%) | 6 (100.0%) |
| Total (Category) | 20 (30.3%) | 46 (69.7%) |
| Total (Overall) | 101 (40.1%) | 151 (59.9%) |
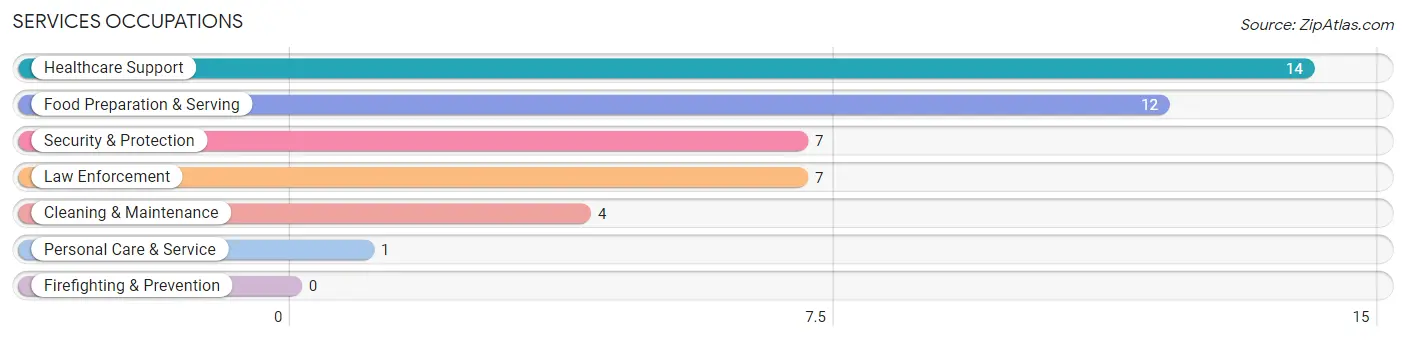
Services Occupations
The most common Services occupations in Siren are Healthcare Support (14 | 5.6%), Food Preparation & Serving (12 | 4.8%), Security & Protection (7 | 2.8%), Law Enforcement (7 | 2.8%), and Cleaning & Maintenance (4 | 1.6%).
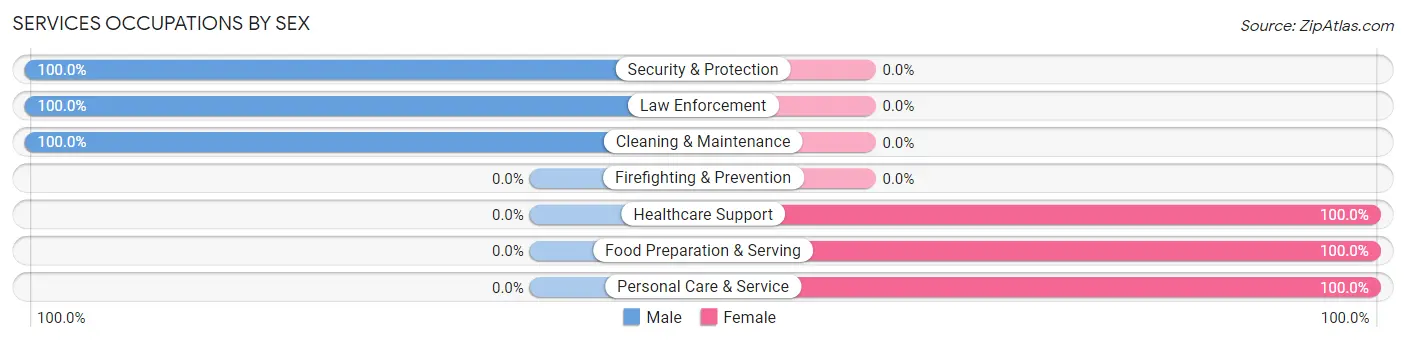
Services Occupations by Sex
Within the Services occupations in Siren, the most male-oriented occupations are Security & Protection (100.0%), Law Enforcement (100.0%), and Cleaning & Maintenance (100.0%), while the most female-oriented occupations are Healthcare Support (100.0%), Food Preparation & Serving (100.0%), and Personal Care & Service (100.0%).
| Occupation | Male | Female |
| Healthcare Support | 0 (0.0%) | 14 (100.0%) |
| Security & Protection | 7 (100.0%) | 0 (0.0%) |
| Firefighting & Prevention | 0 (0.0%) | 0 (0.0%) |
| Law Enforcement | 7 (100.0%) | 0 (0.0%) |
| Food Preparation & Serving | 0 (0.0%) | 12 (100.0%) |
| Cleaning & Maintenance | 4 (100.0%) | 0 (0.0%) |
| Personal Care & Service | 0 (0.0%) | 1 (100.0%) |
| Total (Category) | 11 (28.9%) | 27 (71.1%) |
| Total (Overall) | 101 (40.1%) | 151 (59.9%) |
Sales and Office Occupations
The most common Sales and Office occupations in Siren are Sales & Related (30 | 11.9%), and Office & Administration (26 | 10.3%).
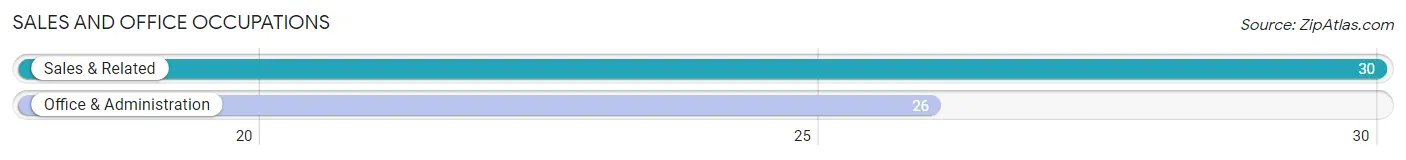
Sales and Office Occupations by Sex
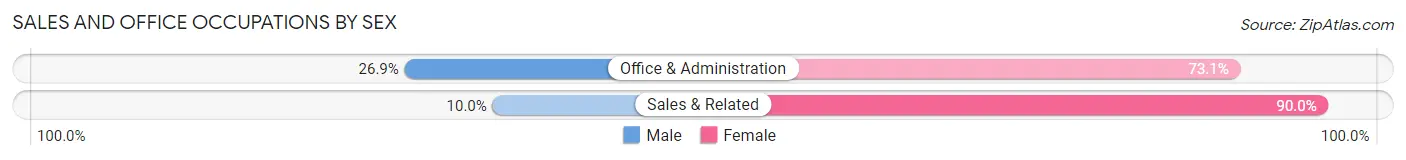
| Occupation | Male | Female |
| Sales & Related | 3 (10.0%) | 27 (90.0%) |
| Office & Administration | 7 (26.9%) | 19 (73.1%) |
| Total (Category) | 10 (17.9%) | 46 (82.1%) |
| Total (Overall) | 101 (40.1%) | 151 (59.9%) |
Natural Resources, Construction and Maintenance Occupations
The most common Natural Resources, Construction and Maintenance occupations in Siren are Installation, Maintenance & Repair (12 | 4.8%), and Farming, Fishing & Forestry (5 | 2.0%).
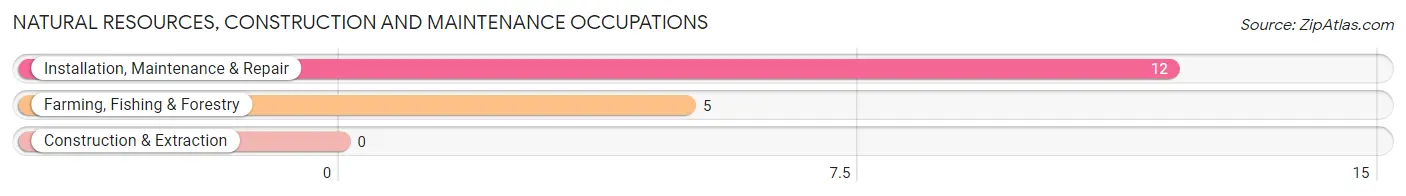
Natural Resources, Construction and Maintenance Occupations by Sex
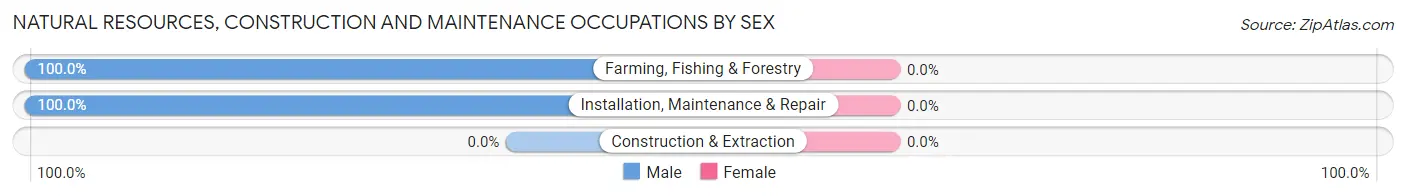
| Occupation | Male | Female |
| Farming, Fishing & Forestry | 5 (100.0%) | 0 (0.0%) |
| Construction & Extraction | 0 (0.0%) | 0 (0.0%) |
| Installation, Maintenance & Repair | 12 (100.0%) | 0 (0.0%) |
| Total (Category) | 17 (100.0%) | 0 (0.0%) |
| Total (Overall) | 101 (40.1%) | 151 (59.9%) |
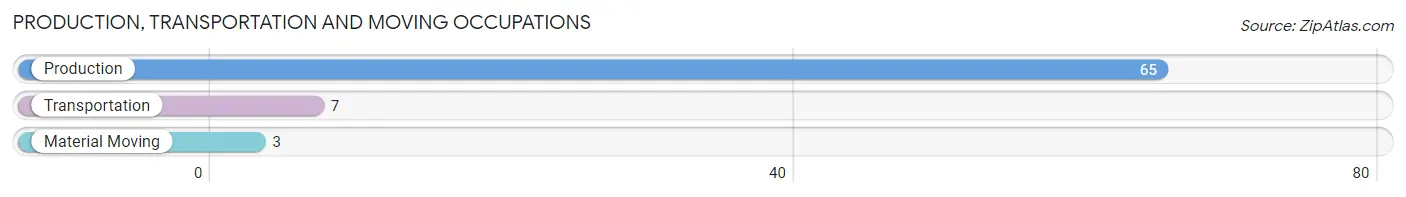
Production, Transportation and Moving Occupations
The most common Production, Transportation and Moving occupations in Siren are Production (65 | 25.8%), Transportation (7 | 2.8%), and Material Moving (3 | 1.2%).
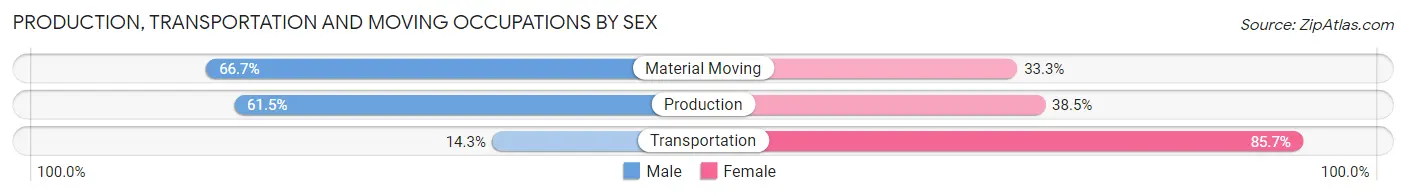
Production, Transportation and Moving Occupations by Sex
| Occupation | Male | Female |
| Production | 40 (61.5%) | 25 (38.5%) |
| Transportation | 1 (14.3%) | 6 (85.7%) |
| Material Moving | 2 (66.7%) | 1 (33.3%) |
| Total (Category) | 43 (57.3%) | 32 (42.7%) |
| Total (Overall) | 101 (40.1%) | 151 (59.9%) |
Employment Industries by Sex in Siren
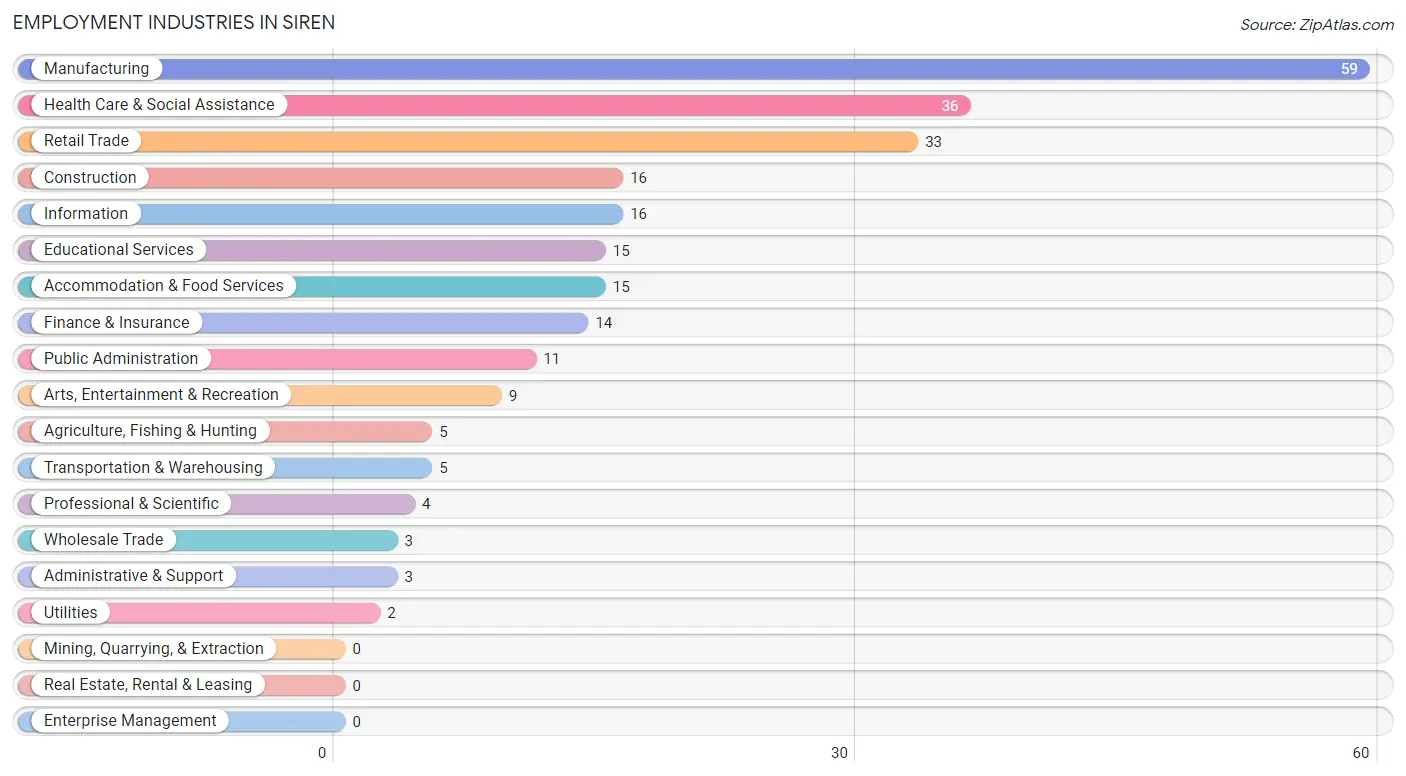
Employment Industries in Siren
The major employment industries in Siren include Manufacturing (59 | 23.4%), Health Care & Social Assistance (36 | 14.3%), Retail Trade (33 | 13.1%), Construction (16 | 6.4%), and Information (16 | 6.4%).
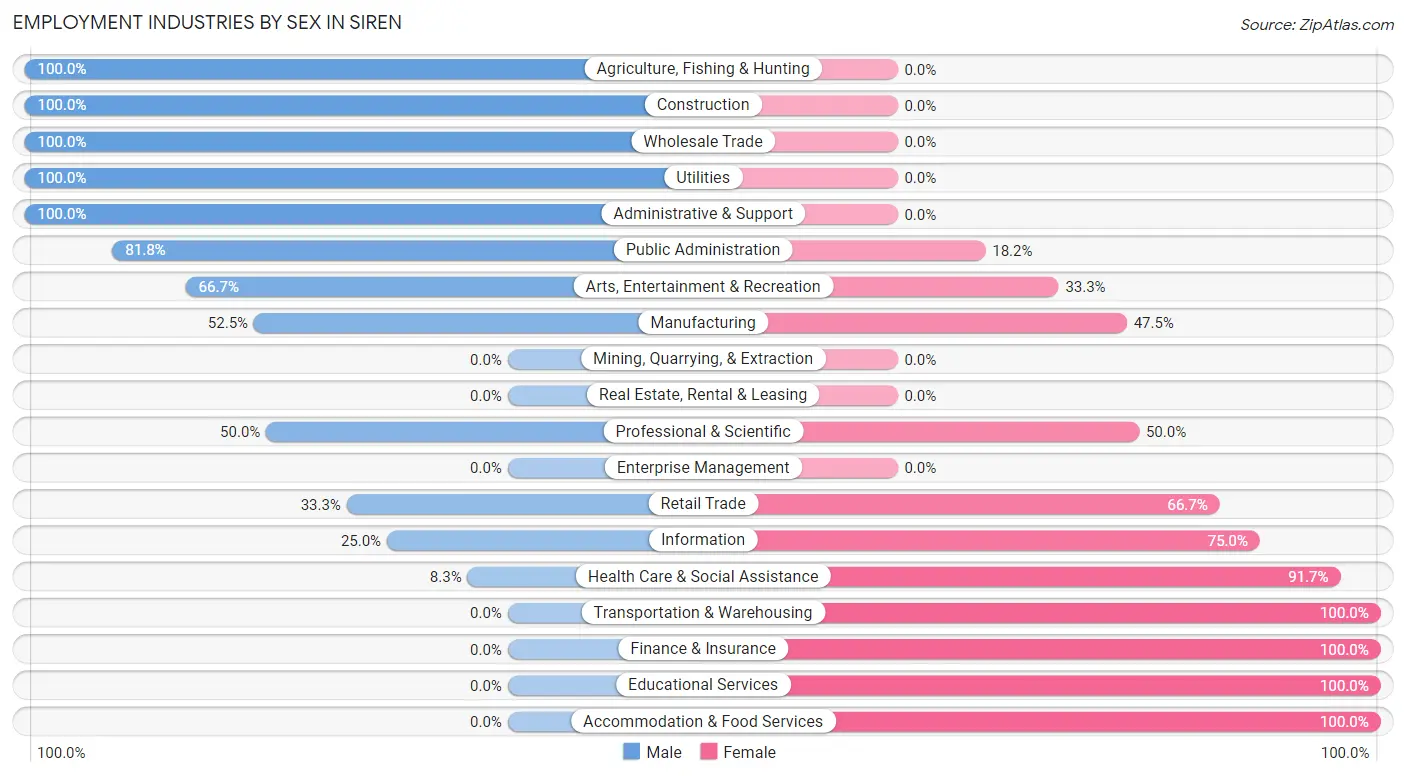
Employment Industries by Sex in Siren
The Siren industries that see more men than women are Agriculture, Fishing & Hunting (100.0%), Construction (100.0%), and Wholesale Trade (100.0%), whereas the industries that tend to have a higher number of women are Transportation & Warehousing (100.0%), Finance & Insurance (100.0%), and Educational Services (100.0%).
| Industry | Male | Female |
| Agriculture, Fishing & Hunting | 5 (100.0%) | 0 (0.0%) |
| Mining, Quarrying, & Extraction | 0 (0.0%) | 0 (0.0%) |
| Construction | 16 (100.0%) | 0 (0.0%) |
| Manufacturing | 31 (52.5%) | 28 (47.5%) |
| Wholesale Trade | 3 (100.0%) | 0 (0.0%) |
| Retail Trade | 11 (33.3%) | 22 (66.7%) |
| Transportation & Warehousing | 0 (0.0%) | 5 (100.0%) |
| Utilities | 2 (100.0%) | 0 (0.0%) |
| Information | 4 (25.0%) | 12 (75.0%) |
| Finance & Insurance | 0 (0.0%) | 14 (100.0%) |
| Real Estate, Rental & Leasing | 0 (0.0%) | 0 (0.0%) |
| Professional & Scientific | 2 (50.0%) | 2 (50.0%) |
| Enterprise Management | 0 (0.0%) | 0 (0.0%) |
| Administrative & Support | 3 (100.0%) | 0 (0.0%) |
| Educational Services | 0 (0.0%) | 15 (100.0%) |
| Health Care & Social Assistance | 3 (8.3%) | 33 (91.7%) |
| Arts, Entertainment & Recreation | 6 (66.7%) | 3 (33.3%) |
| Accommodation & Food Services | 0 (0.0%) | 15 (100.0%) |
| Public Administration | 9 (81.8%) | 2 (18.2%) |
| Total | 101 (40.1%) | 151 (59.9%) |
Education in Siren
School Enrollment in Siren
The most common levels of schooling among the 87 students in Siren are elementary school (37 | 42.5%), college / undergraduate (21 | 24.1%), and high school (15 | 17.2%).
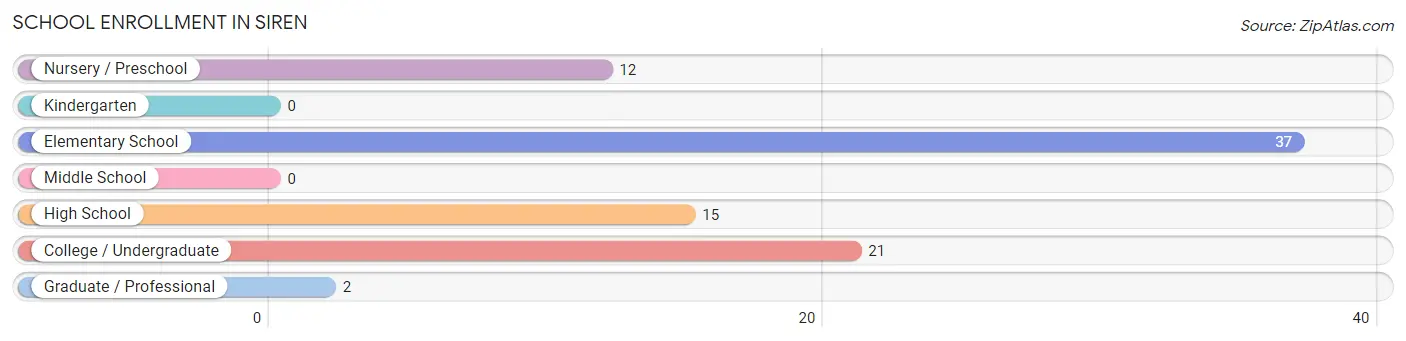
| School Level | # Students | % Students |
| Nursery / Preschool | 12 | 13.8% |
| Kindergarten | 0 | 0.0% |
| Elementary School | 37 | 42.5% |
| Middle School | 0 | 0.0% |
| High School | 15 | 17.2% |
| College / Undergraduate | 21 | 24.1% |
| Graduate / Professional | 2 | 2.3% |
| Total | 87 | 100.0% |
School Enrollment by Age by Funding Source in Siren
Out of a total of 87 students who are enrolled in schools in Siren, 6 (6.9%) attend a private institution, while the remaining 81 (93.1%) are enrolled in public schools. The age group of 25 to 34 year olds has the highest likelihood of being enrolled in private schools, with 6 (42.9% in the age bracket) enrolled. Conversely, the age group of 3 to 4 year olds has the lowest likelihood of being enrolled in a private school, with 12 (100.0% in the age bracket) attending a public institution.
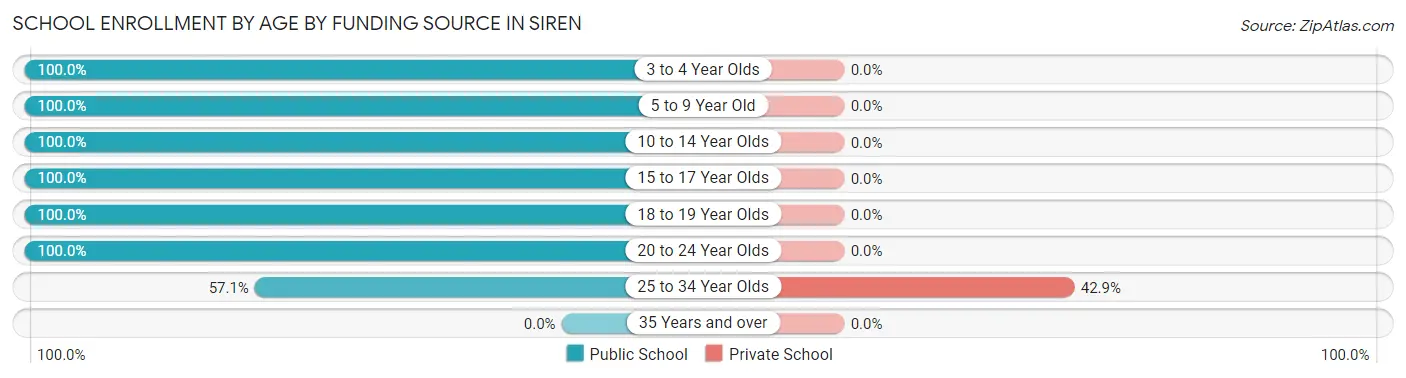
| Age Bracket | Public School | Private School |
| 3 to 4 Year Olds | 12 (100.0%) | 0 (0.0%) |
| 5 to 9 Year Old | 37 (100.0%) | 0 (0.0%) |
| 10 to 14 Year Olds | 2 (100.0%) | 0 (0.0%) |
| 15 to 17 Year Olds | 13 (100.0%) | 0 (0.0%) |
| 18 to 19 Year Olds | 3 (100.0%) | 0 (0.0%) |
| 20 to 24 Year Olds | 6 (100.0%) | 0 (0.0%) |
| 25 to 34 Year Olds | 8 (57.1%) | 6 (42.9%) |
| 35 Years and over | 0 (0.0%) | 0 (0.0%) |
| Total | 81 (93.1%) | 6 (6.9%) |
Educational Attainment by Field of Study in Siren
Education (27 | 25.7%), business (18 | 17.1%), physical & health sciences (17 | 16.2%), bio, nature & agricultural (14 | 13.3%), and communications (10 | 9.5%) are the most common fields of study among 105 individuals in Siren who have obtained a bachelor's degree or higher.
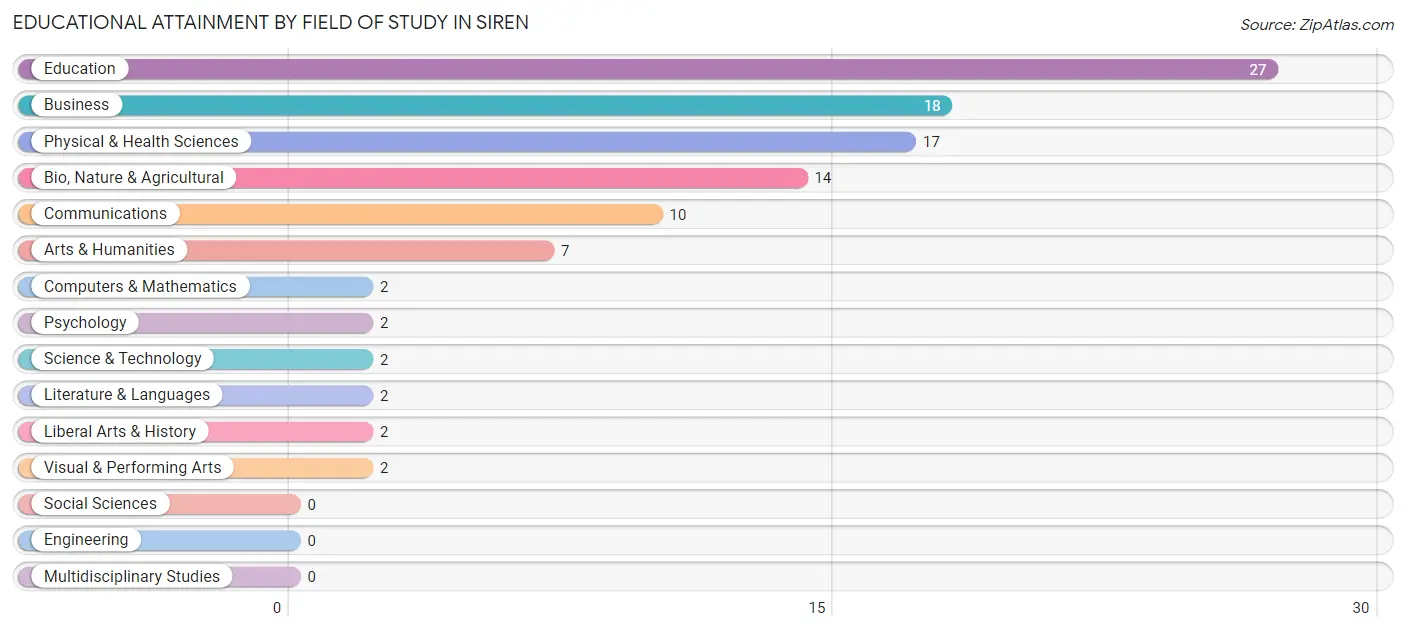
| Field of Study | # Graduates | % Graduates |
| Computers & Mathematics | 2 | 1.9% |
| Bio, Nature & Agricultural | 14 | 13.3% |
| Physical & Health Sciences | 17 | 16.2% |
| Psychology | 2 | 1.9% |
| Social Sciences | 0 | 0.0% |
| Engineering | 0 | 0.0% |
| Multidisciplinary Studies | 0 | 0.0% |
| Science & Technology | 2 | 1.9% |
| Business | 18 | 17.1% |
| Education | 27 | 25.7% |
| Literature & Languages | 2 | 1.9% |
| Liberal Arts & History | 2 | 1.9% |
| Visual & Performing Arts | 2 | 1.9% |
| Communications | 10 | 9.5% |
| Arts & Humanities | 7 | 6.7% |
| Total | 105 | 100.0% |
Transportation & Commute in Siren
Vehicle Availability by Sex in Siren
The most prevalent vehicle ownership categories in Siren are males with 3 vehicles (31, accounting for 30.7%) and females with 3 vehicles (41, making up 21.5%).
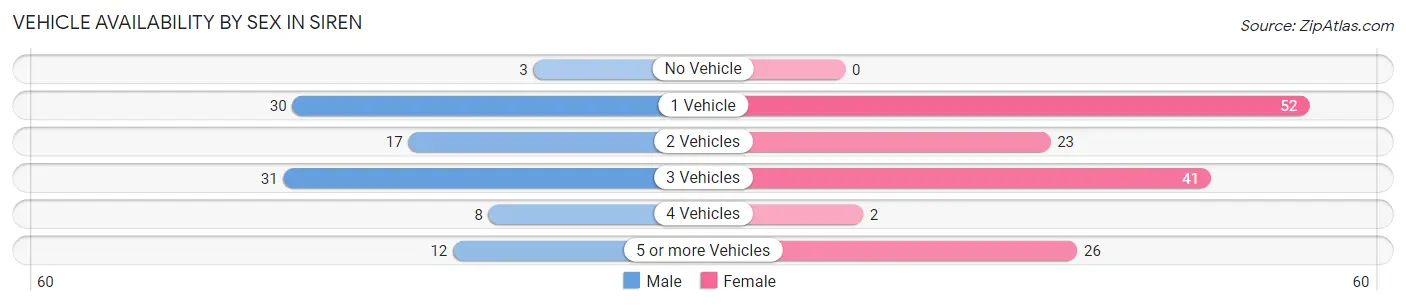
| Vehicles Available | Male | Female |
| No Vehicle | 3 (3.0%) | 0 (0.0%) |
| 1 Vehicle | 30 (29.7%) | 52 (36.1%) |
| 2 Vehicles | 17 (16.8%) | 23 (16.0%) |
| 3 Vehicles | 31 (30.7%) | 41 (28.5%) |
| 4 Vehicles | 8 (7.9%) | 2 (1.4%) |
| 5 or more Vehicles | 12 (11.9%) | 26 (18.1%) |
| Total | 101 (100.0%) | 144 (100.0%) |
Commute Time in Siren
The most frequently occuring commute durations in Siren are 5 to 9 minutes (52 commuters, 21.6%), 15 to 19 minutes (45 commuters, 18.7%), and 10 to 14 minutes (32 commuters, 13.3%).
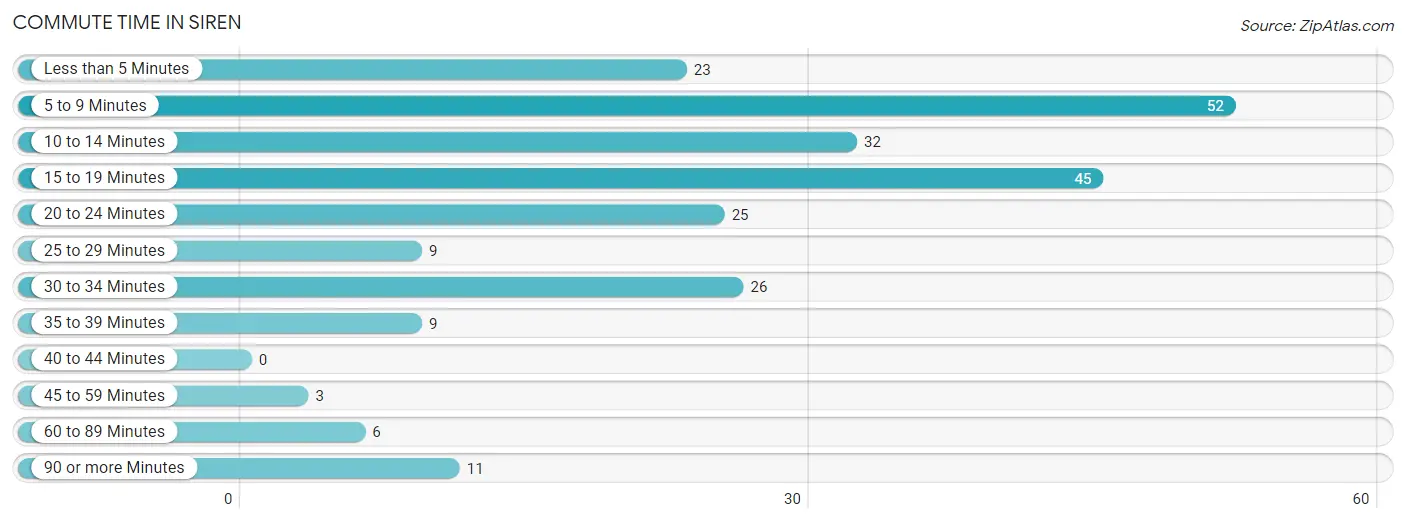
| Commute Time | # Commuters | % Commuters |
| Less than 5 Minutes | 23 | 9.5% |
| 5 to 9 Minutes | 52 | 21.6% |
| 10 to 14 Minutes | 32 | 13.3% |
| 15 to 19 Minutes | 45 | 18.7% |
| 20 to 24 Minutes | 25 | 10.4% |
| 25 to 29 Minutes | 9 | 3.7% |
| 30 to 34 Minutes | 26 | 10.8% |
| 35 to 39 Minutes | 9 | 3.7% |
| 40 to 44 Minutes | 0 | 0.0% |
| 45 to 59 Minutes | 3 | 1.2% |
| 60 to 89 Minutes | 6 | 2.5% |
| 90 or more Minutes | 11 | 4.6% |
Commute Time by Sex in Siren
The most common commute times in Siren are 15 to 19 minutes (16 commuters, 17.0%) for males and 5 to 9 minutes (39 commuters, 26.5%) for females.
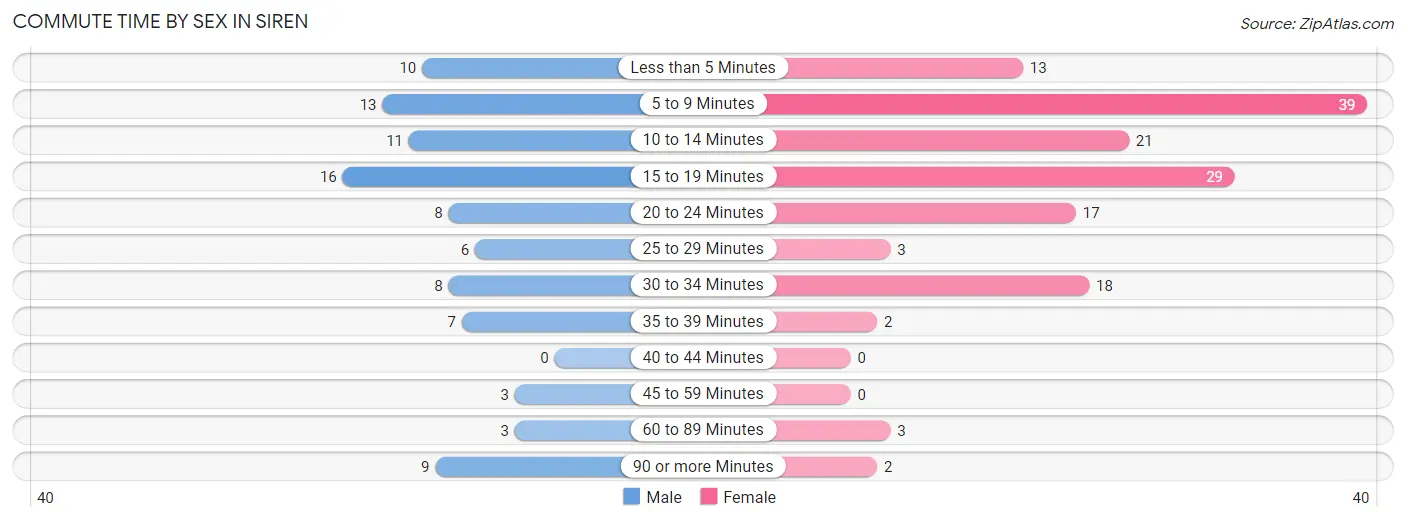
| Commute Time | Male | Female |
| Less than 5 Minutes | 10 (10.6%) | 13 (8.8%) |
| 5 to 9 Minutes | 13 (13.8%) | 39 (26.5%) |
| 10 to 14 Minutes | 11 (11.7%) | 21 (14.3%) |
| 15 to 19 Minutes | 16 (17.0%) | 29 (19.7%) |
| 20 to 24 Minutes | 8 (8.5%) | 17 (11.6%) |
| 25 to 29 Minutes | 6 (6.4%) | 3 (2.0%) |
| 30 to 34 Minutes | 8 (8.5%) | 18 (12.2%) |
| 35 to 39 Minutes | 7 (7.4%) | 2 (1.4%) |
| 40 to 44 Minutes | 0 (0.0%) | 0 (0.0%) |
| 45 to 59 Minutes | 3 (3.2%) | 0 (0.0%) |
| 60 to 89 Minutes | 3 (3.2%) | 3 (2.0%) |
| 90 or more Minutes | 9 (9.6%) | 2 (1.4%) |
Time of Departure to Work by Sex in Siren
The most frequent times of departure to work in Siren are 6:30 AM to 6:59 AM (23, 24.5%) for males and 8:00 AM to 8:29 AM (35, 23.8%) for females.
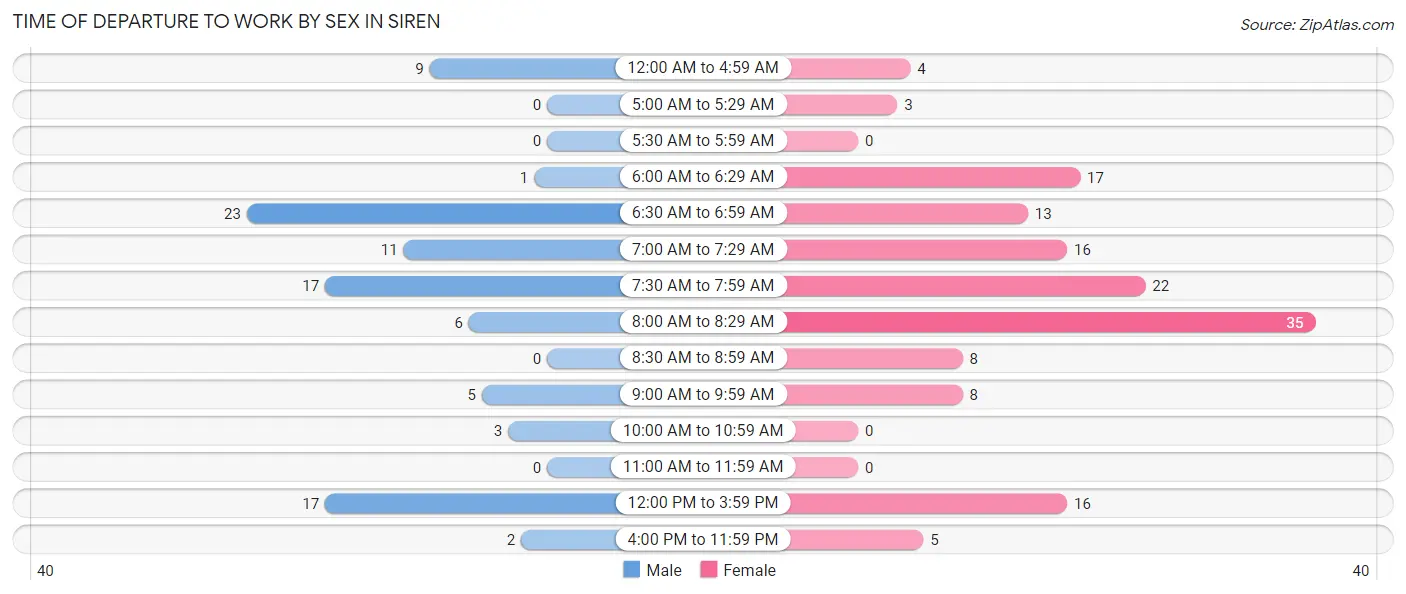
| Time of Departure | Male | Female |
| 12:00 AM to 4:59 AM | 9 (9.6%) | 4 (2.7%) |
| 5:00 AM to 5:29 AM | 0 (0.0%) | 3 (2.0%) |
| 5:30 AM to 5:59 AM | 0 (0.0%) | 0 (0.0%) |
| 6:00 AM to 6:29 AM | 1 (1.1%) | 17 (11.6%) |
| 6:30 AM to 6:59 AM | 23 (24.5%) | 13 (8.8%) |
| 7:00 AM to 7:29 AM | 11 (11.7%) | 16 (10.9%) |
| 7:30 AM to 7:59 AM | 17 (18.1%) | 22 (15.0%) |
| 8:00 AM to 8:29 AM | 6 (6.4%) | 35 (23.8%) |
| 8:30 AM to 8:59 AM | 0 (0.0%) | 8 (5.4%) |
| 9:00 AM to 9:59 AM | 5 (5.3%) | 8 (5.4%) |
| 10:00 AM to 10:59 AM | 3 (3.2%) | 0 (0.0%) |
| 11:00 AM to 11:59 AM | 0 (0.0%) | 0 (0.0%) |
| 12:00 PM to 3:59 PM | 17 (18.1%) | 16 (10.9%) |
| 4:00 PM to 11:59 PM | 2 (2.1%) | 5 (3.4%) |
| Total | 94 (100.0%) | 147 (100.0%) |
Housing Occupancy in Siren
Occupancy by Ownership in Siren
Of the total 340 dwellings in Siren, owner-occupied units account for 227 (66.8%), while renter-occupied units make up 113 (33.2%).
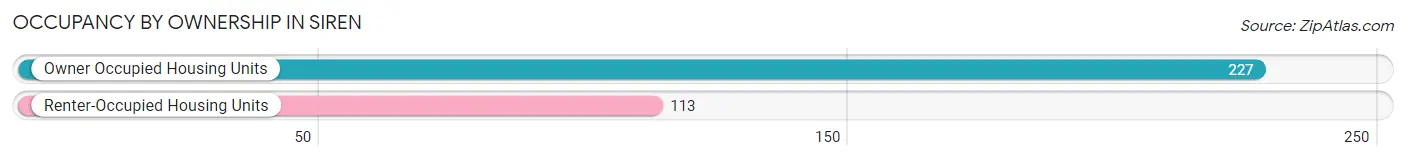
| Occupancy | # Housing Units | % Housing Units |
| Owner Occupied Housing Units | 227 | 66.8% |
| Renter-Occupied Housing Units | 113 | 33.2% |
| Total Occupied Housing Units | 340 | 100.0% |
Occupancy by Household Size in Siren
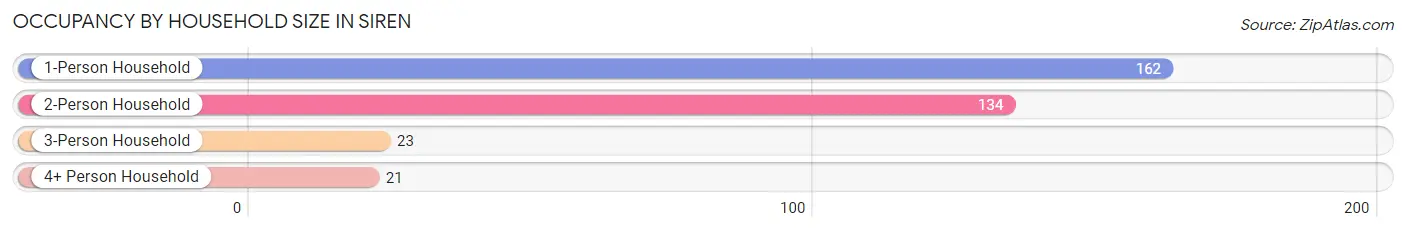
| Household Size | # Housing Units | % Housing Units |
| 1-Person Household | 162 | 47.6% |
| 2-Person Household | 134 | 39.4% |
| 3-Person Household | 23 | 6.8% |
| 4+ Person Household | 21 | 6.2% |
| Total Housing Units | 340 | 100.0% |
Occupancy by Ownership by Household Size in Siren
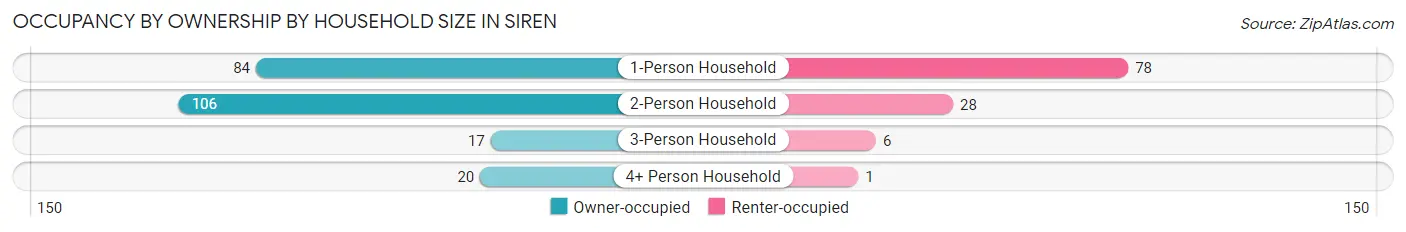
| Household Size | Owner-occupied | Renter-occupied |
| 1-Person Household | 84 (51.8%) | 78 (48.1%) |
| 2-Person Household | 106 (79.1%) | 28 (20.9%) |
| 3-Person Household | 17 (73.9%) | 6 (26.1%) |
| 4+ Person Household | 20 (95.2%) | 1 (4.8%) |
| Total Housing Units | 227 (66.8%) | 113 (33.2%) |
Occupancy by Educational Attainment in Siren
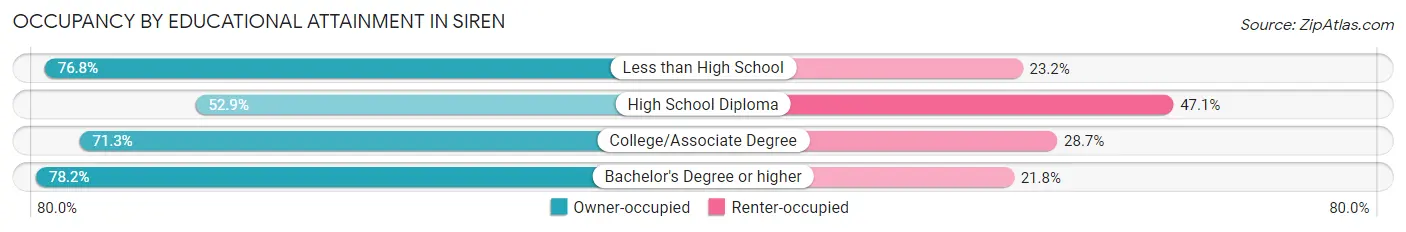
| Household Size | Owner-occupied | Renter-occupied |
| Less than High School | 43 (76.8%) | 13 (23.2%) |
| High School Diploma | 64 (52.9%) | 57 (47.1%) |
| College/Associate Degree | 77 (71.3%) | 31 (28.7%) |
| Bachelor's Degree or higher | 43 (78.2%) | 12 (21.8%) |
Occupancy by Age of Householder in Siren

| Age Bracket | # Households | % Households |
| Under 35 Years | 40 | 11.8% |
| 35 to 44 Years | 10 | 2.9% |
| 45 to 54 Years | 49 | 14.4% |
| 55 to 64 Years | 81 | 23.8% |
| 65 to 74 Years | 47 | 13.8% |
| 75 to 84 Years | 46 | 13.5% |
| 85 Years and Over | 67 | 19.7% |
| Total | 340 | 100.0% |
Housing Finances in Siren
Median Income by Occupancy in Siren
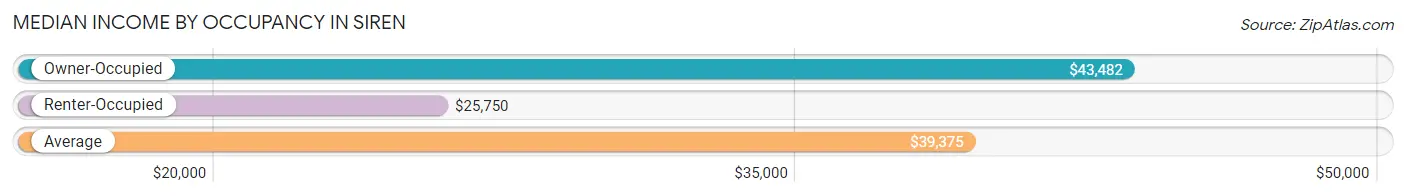
| Occupancy Type | # Households | Median Income |
| Owner-Occupied | 227 (66.8%) | $43,482 |
| Renter-Occupied | 113 (33.2%) | $25,750 |
| Average | 340 (100.0%) | $39,375 |
Occupancy by Householder Income Bracket in Siren
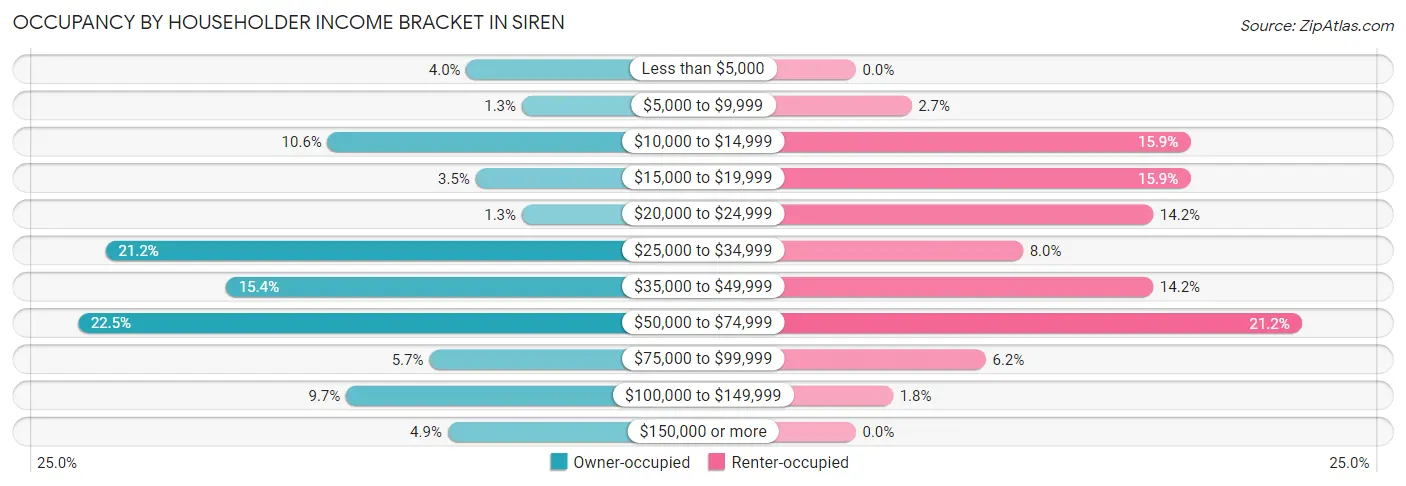
| Income Bracket | Owner-occupied | Renter-occupied |
| Less than $5,000 | 9 (4.0%) | 0 (0.0%) |
| $5,000 to $9,999 | 3 (1.3%) | 3 (2.6%) |
| $10,000 to $14,999 | 24 (10.6%) | 18 (15.9%) |
| $15,000 to $19,999 | 8 (3.5%) | 18 (15.9%) |
| $20,000 to $24,999 | 3 (1.3%) | 16 (14.2%) |
| $25,000 to $34,999 | 48 (21.1%) | 9 (8.0%) |
| $35,000 to $49,999 | 35 (15.4%) | 16 (14.2%) |
| $50,000 to $74,999 | 51 (22.5%) | 24 (21.2%) |
| $75,000 to $99,999 | 13 (5.7%) | 7 (6.2%) |
| $100,000 to $149,999 | 22 (9.7%) | 2 (1.8%) |
| $150,000 or more | 11 (4.9%) | 0 (0.0%) |
| Total | 227 (100.0%) | 113 (100.0%) |
Monthly Housing Cost Tiers in Siren
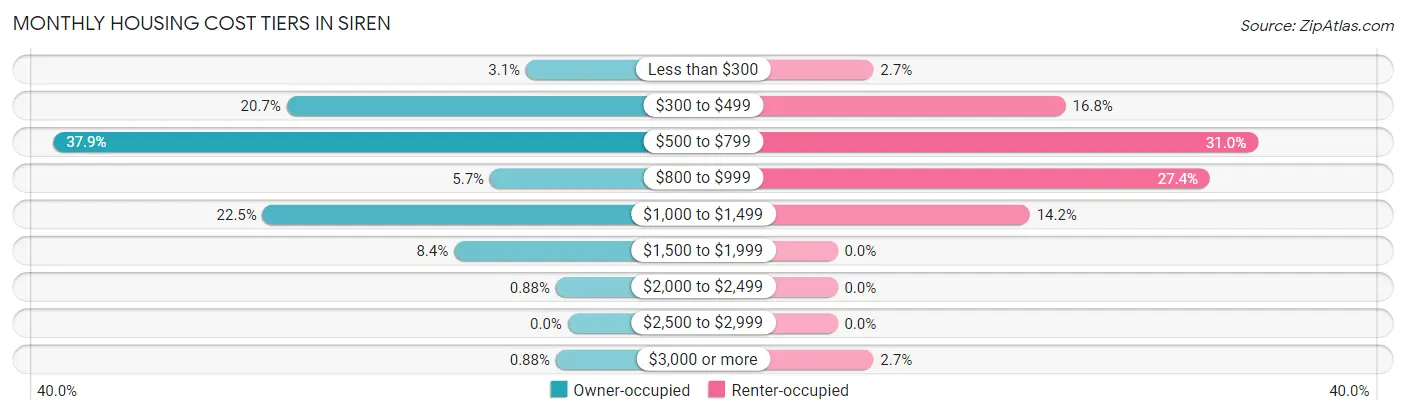
| Monthly Cost | Owner-occupied | Renter-occupied |
| Less than $300 | 7 (3.1%) | 3 (2.6%) |
| $300 to $499 | 47 (20.7%) | 19 (16.8%) |
| $500 to $799 | 86 (37.9%) | 35 (31.0%) |
| $800 to $999 | 13 (5.7%) | 31 (27.4%) |
| $1,000 to $1,499 | 51 (22.5%) | 16 (14.2%) |
| $1,500 to $1,999 | 19 (8.4%) | 0 (0.0%) |
| $2,000 to $2,499 | 2 (0.9%) | 0 (0.0%) |
| $2,500 to $2,999 | 0 (0.0%) | 0 (0.0%) |
| $3,000 or more | 2 (0.9%) | 3 (2.6%) |
| Total | 227 (100.0%) | 113 (100.0%) |
Physical Housing Characteristics in Siren
Housing Structures in Siren
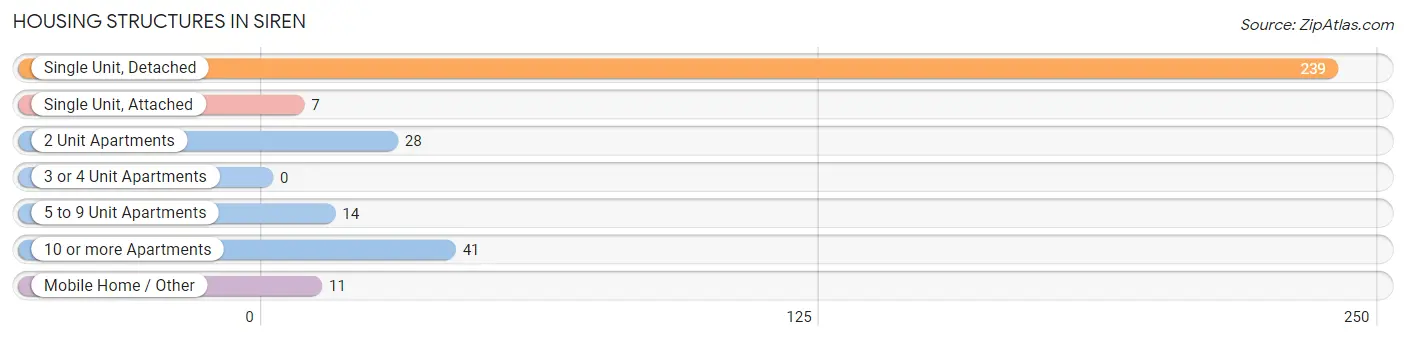
| Structure Type | # Housing Units | % Housing Units |
| Single Unit, Detached | 239 | 70.3% |
| Single Unit, Attached | 7 | 2.1% |
| 2 Unit Apartments | 28 | 8.2% |
| 3 or 4 Unit Apartments | 0 | 0.0% |
| 5 to 9 Unit Apartments | 14 | 4.1% |
| 10 or more Apartments | 41 | 12.1% |
| Mobile Home / Other | 11 | 3.2% |
| Total | 340 | 100.0% |
Housing Structures by Occupancy in Siren
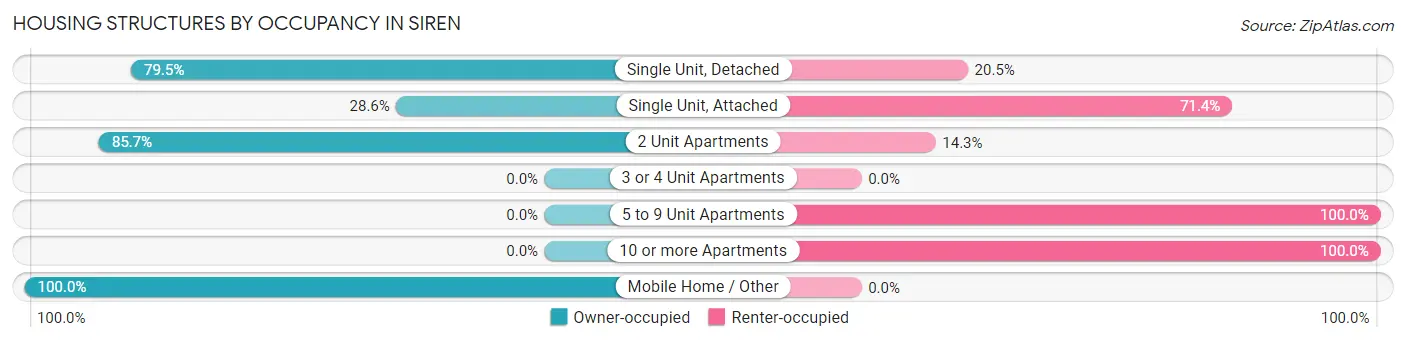
| Structure Type | Owner-occupied | Renter-occupied |
| Single Unit, Detached | 190 (79.5%) | 49 (20.5%) |
| Single Unit, Attached | 2 (28.6%) | 5 (71.4%) |
| 2 Unit Apartments | 24 (85.7%) | 4 (14.3%) |
| 3 or 4 Unit Apartments | 0 (0.0%) | 0 (0.0%) |
| 5 to 9 Unit Apartments | 0 (0.0%) | 14 (100.0%) |
| 10 or more Apartments | 0 (0.0%) | 41 (100.0%) |
| Mobile Home / Other | 11 (100.0%) | 0 (0.0%) |
| Total | 227 (66.8%) | 113 (33.2%) |
Housing Structures by Number of Rooms in Siren
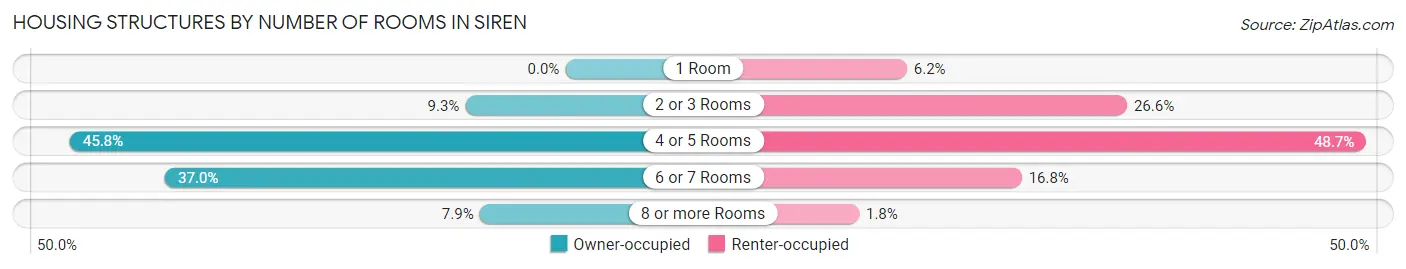
| Number of Rooms | Owner-occupied | Renter-occupied |
| 1 Room | 0 (0.0%) | 7 (6.2%) |
| 2 or 3 Rooms | 21 (9.2%) | 30 (26.6%) |
| 4 or 5 Rooms | 104 (45.8%) | 55 (48.7%) |
| 6 or 7 Rooms | 84 (37.0%) | 19 (16.8%) |
| 8 or more Rooms | 18 (7.9%) | 2 (1.8%) |
| Total | 227 (100.0%) | 113 (100.0%) |
Housing Structure by Heating Type in Siren
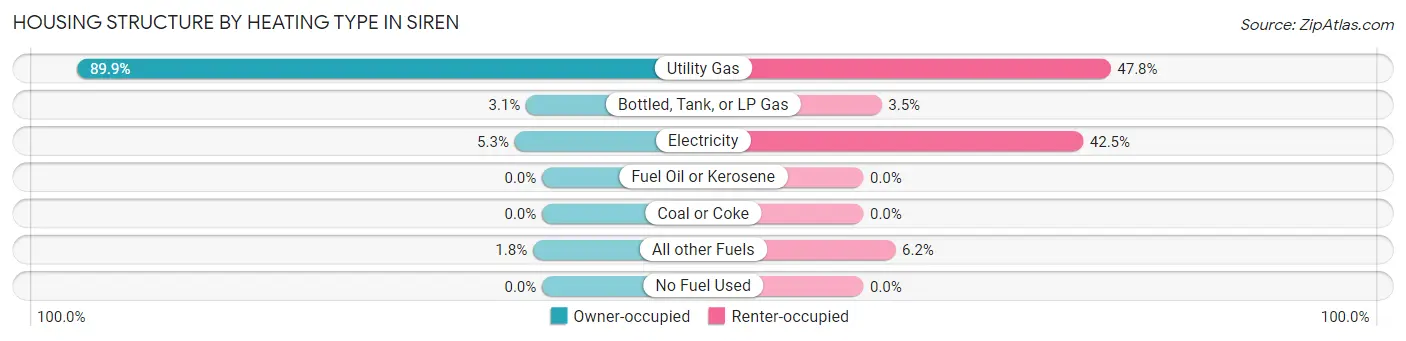
| Heating Type | Owner-occupied | Renter-occupied |
| Utility Gas | 204 (89.9%) | 54 (47.8%) |
| Bottled, Tank, or LP Gas | 7 (3.1%) | 4 (3.5%) |
| Electricity | 12 (5.3%) | 48 (42.5%) |
| Fuel Oil or Kerosene | 0 (0.0%) | 0 (0.0%) |
| Coal or Coke | 0 (0.0%) | 0 (0.0%) |
| All other Fuels | 4 (1.8%) | 7 (6.2%) |
| No Fuel Used | 0 (0.0%) | 0 (0.0%) |
| Total | 227 (100.0%) | 113 (100.0%) |
Household Vehicle Usage in Siren
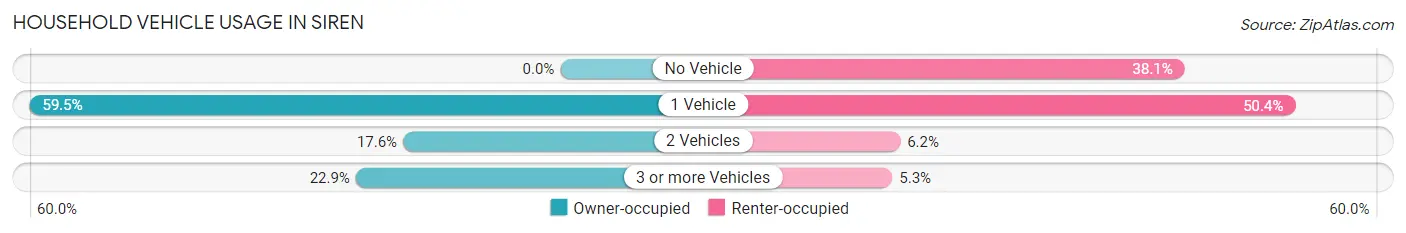
| Vehicles per Household | Owner-occupied | Renter-occupied |
| No Vehicle | 0 (0.0%) | 43 (38.1%) |
| 1 Vehicle | 135 (59.5%) | 57 (50.4%) |
| 2 Vehicles | 40 (17.6%) | 7 (6.2%) |
| 3 or more Vehicles | 52 (22.9%) | 6 (5.3%) |
| Total | 227 (100.0%) | 113 (100.0%) |
Real Estate & Mortgages in Siren
Real Estate and Mortgage Overview in Siren
| Characteristic | Without Mortgage | With Mortgage |
| Housing Units | 102 | 125 |
| Median Property Value | $175,000 | $137,200 |
| Median Household Income | $38,750 | $6 |
| Monthly Housing Costs | $493 | $2 |
| Real Estate Taxes | $2,434 | $5 |
Property Value by Mortgage Status in Siren
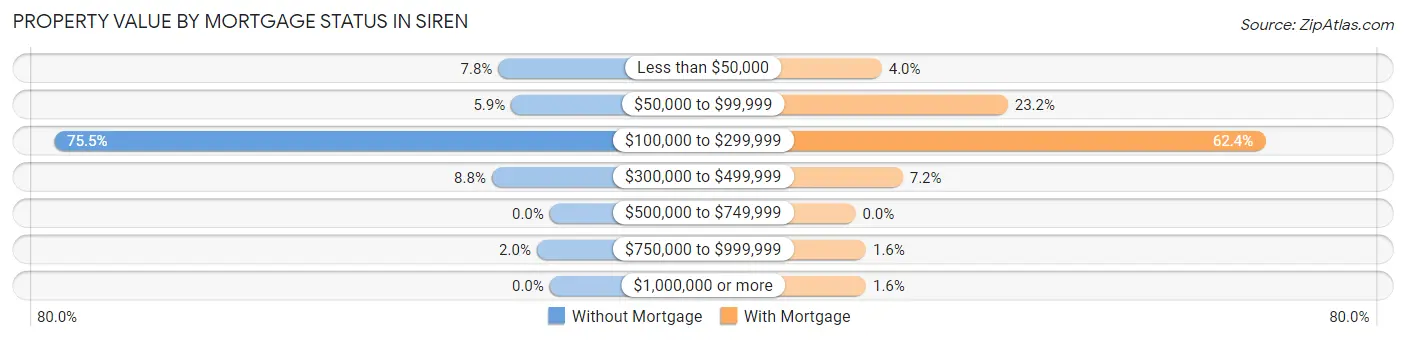
| Property Value | Without Mortgage | With Mortgage |
| Less than $50,000 | 8 (7.8%) | 5 (4.0%) |
| $50,000 to $99,999 | 6 (5.9%) | 29 (23.2%) |
| $100,000 to $299,999 | 77 (75.5%) | 78 (62.4%) |
| $300,000 to $499,999 | 9 (8.8%) | 9 (7.2%) |
| $500,000 to $749,999 | 0 (0.0%) | 0 (0.0%) |
| $750,000 to $999,999 | 2 (2.0%) | 2 (1.6%) |
| $1,000,000 or more | 0 (0.0%) | 2 (1.6%) |
| Total | 102 (100.0%) | 125 (100.0%) |
Household Income by Mortgage Status in Siren
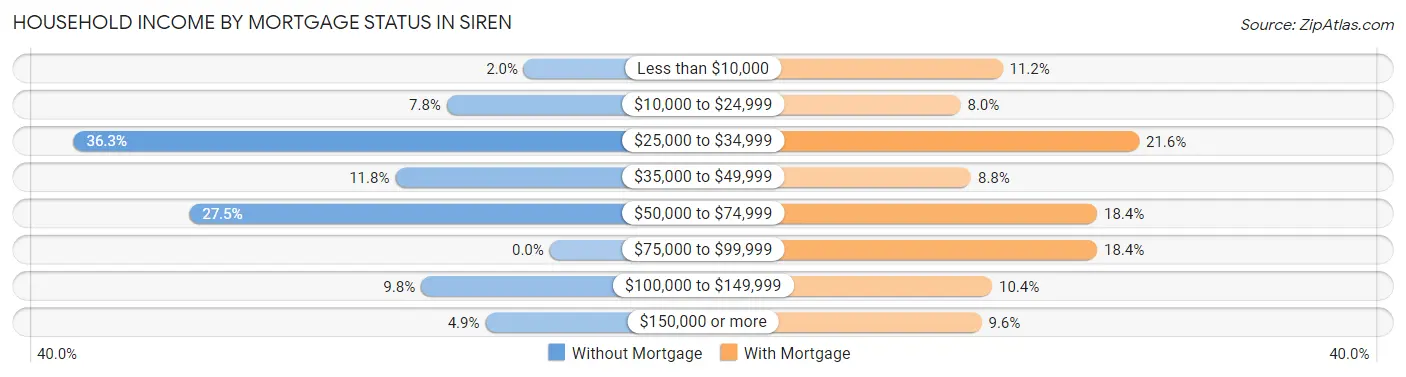
| Household Income | Without Mortgage | With Mortgage |
| Less than $10,000 | 2 (2.0%) | 14 (11.2%) |
| $10,000 to $24,999 | 8 (7.8%) | 10 (8.0%) |
| $25,000 to $34,999 | 37 (36.3%) | 27 (21.6%) |
| $35,000 to $49,999 | 12 (11.8%) | 11 (8.8%) |
| $50,000 to $74,999 | 28 (27.5%) | 23 (18.4%) |
| $75,000 to $99,999 | 0 (0.0%) | 23 (18.4%) |
| $100,000 to $149,999 | 10 (9.8%) | 13 (10.4%) |
| $150,000 or more | 5 (4.9%) | 12 (9.6%) |
| Total | 102 (100.0%) | 125 (100.0%) |
Property Value to Household Income Ratio in Siren
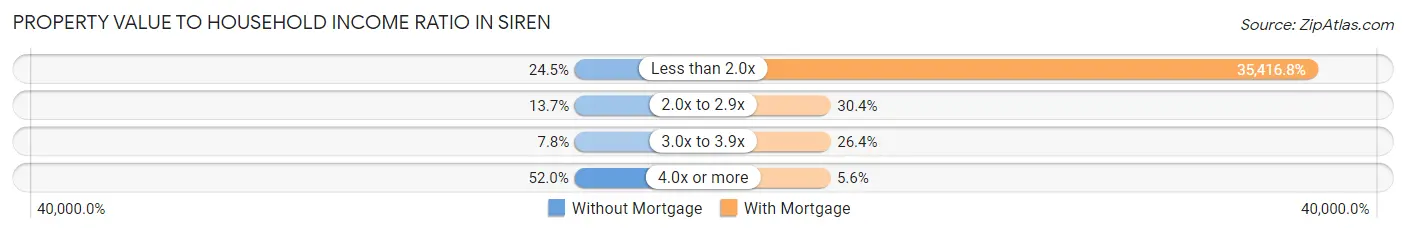
| Value-to-Income Ratio | Without Mortgage | With Mortgage |
| Less than 2.0x | 25 (24.5%) | 44,271 (35,416.8%) |
| 2.0x to 2.9x | 14 (13.7%) | 38 (30.4%) |
| 3.0x to 3.9x | 8 (7.8%) | 33 (26.4%) |
| 4.0x or more | 53 (52.0%) | 7 (5.6%) |
| Total | 102 (100.0%) | 125 (100.0%) |
Real Estate Taxes by Mortgage Status in Siren
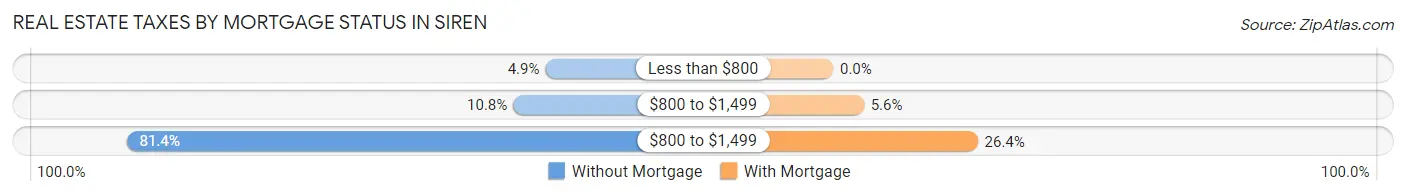
| Property Taxes | Without Mortgage | With Mortgage |
| Less than $800 | 5 (4.9%) | 0 (0.0%) |
| $800 to $1,499 | 11 (10.8%) | 7 (5.6%) |
| $800 to $1,499 | 83 (81.4%) | 33 (26.4%) |
| Total | 102 (100.0%) | 125 (100.0%) |
Health & Disability in Siren
Health Insurance Coverage by Age in Siren
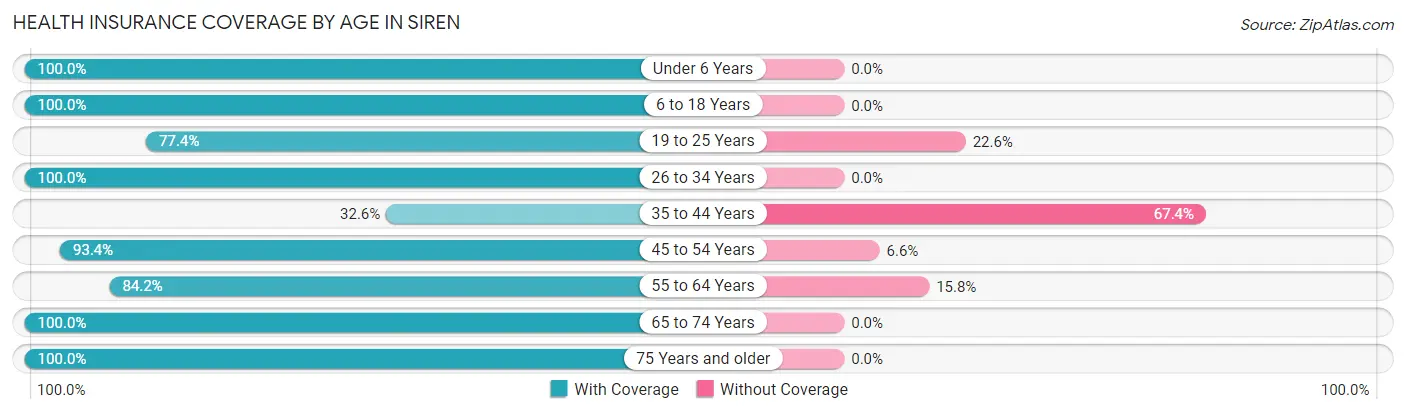
| Age Bracket | With Coverage | Without Coverage |
| Under 6 Years | 27 (100.0%) | 0 (0.0%) |
| 6 to 18 Years | 52 (100.0%) | 0 (0.0%) |
| 19 to 25 Years | 41 (77.4%) | 12 (22.6%) |
| 26 to 34 Years | 62 (100.0%) | 0 (0.0%) |
| 35 to 44 Years | 29 (32.6%) | 60 (67.4%) |
| 45 to 54 Years | 71 (93.4%) | 5 (6.6%) |
| 55 to 64 Years | 117 (84.2%) | 22 (15.8%) |
| 65 to 74 Years | 72 (100.0%) | 0 (0.0%) |
| 75 Years and older | 136 (100.0%) | 0 (0.0%) |
| Total | 607 (86.0%) | 99 (14.0%) |
Health Insurance Coverage by Citizenship Status in Siren
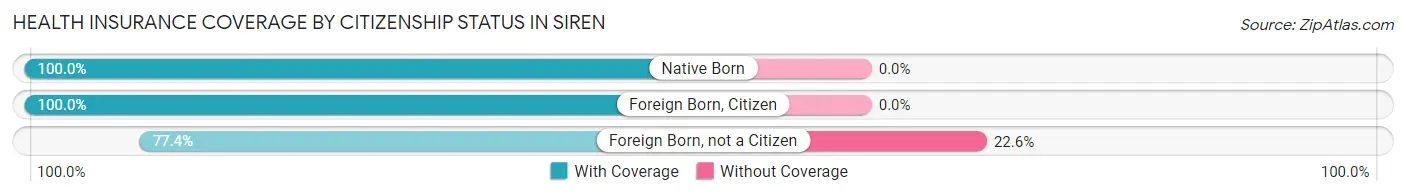
| Citizenship Status | With Coverage | Without Coverage |
| Native Born | 27 (100.0%) | 0 (0.0%) |
| Foreign Born, Citizen | 52 (100.0%) | 0 (0.0%) |
| Foreign Born, not a Citizen | 41 (77.4%) | 12 (22.6%) |
Health Insurance Coverage by Household Income in Siren
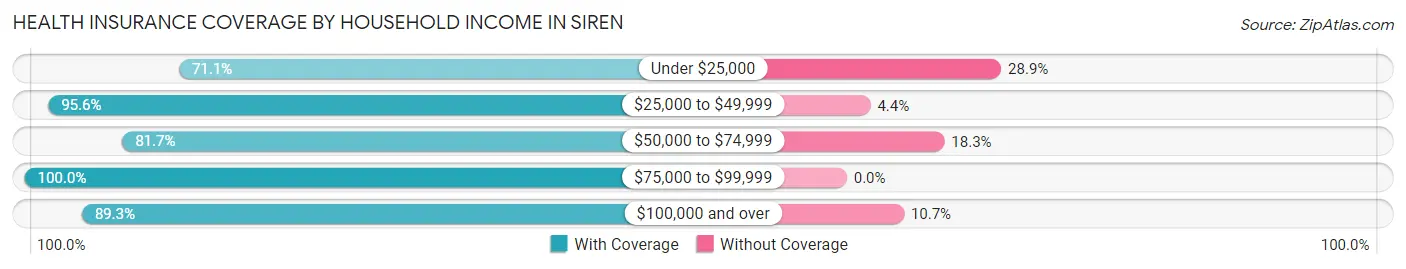
| Household Income | With Coverage | Without Coverage |
| Under $25,000 | 118 (71.1%) | 48 (28.9%) |
| $25,000 to $49,999 | 194 (95.6%) | 9 (4.4%) |
| $50,000 to $74,999 | 134 (81.7%) | 30 (18.3%) |
| $75,000 to $99,999 | 47 (100.0%) | 0 (0.0%) |
| $100,000 and over | 100 (89.3%) | 12 (10.7%) |
Public vs Private Health Insurance Coverage by Age in Siren
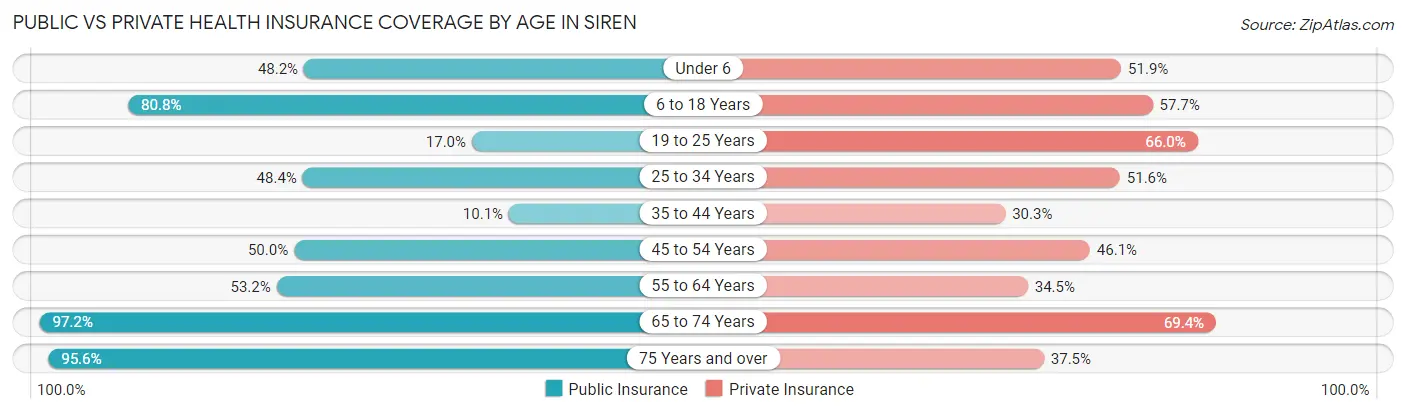
| Age Bracket | Public Insurance | Private Insurance |
| Under 6 | 13 (48.1%) | 14 (51.8%) |
| 6 to 18 Years | 42 (80.8%) | 30 (57.7%) |
| 19 to 25 Years | 9 (17.0%) | 35 (66.0%) |
| 25 to 34 Years | 30 (48.4%) | 32 (51.6%) |
| 35 to 44 Years | 9 (10.1%) | 27 (30.3%) |
| 45 to 54 Years | 38 (50.0%) | 35 (46.1%) |
| 55 to 64 Years | 74 (53.2%) | 48 (34.5%) |
| 65 to 74 Years | 70 (97.2%) | 50 (69.4%) |
| 75 Years and over | 130 (95.6%) | 51 (37.5%) |
| Total | 415 (58.8%) | 322 (45.6%) |
Disability Status by Sex by Age in Siren
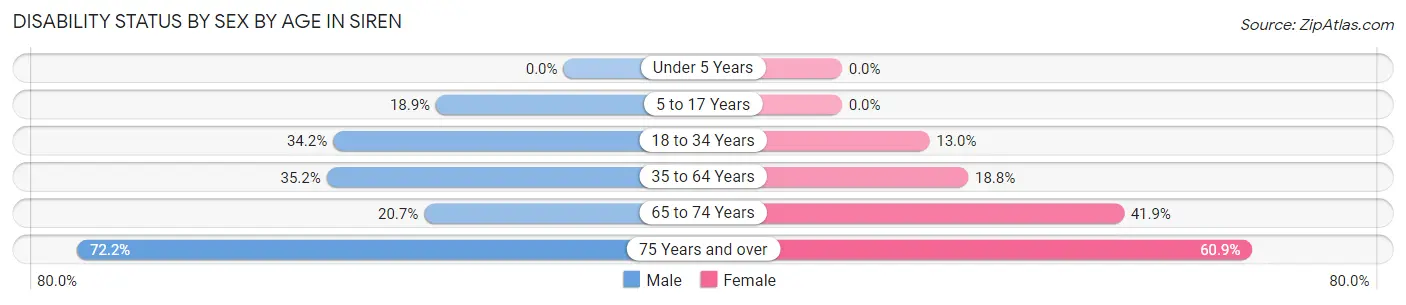
| Age Bracket | Male | Female |
| Under 5 Years | 0 (0.0%) | 0 (0.0%) |
| 5 to 17 Years | 7 (18.9%) | 0 (0.0%) |
| 18 to 34 Years | 13 (34.2%) | 10 (13.0%) |
| 35 to 64 Years | 45 (35.2%) | 33 (18.8%) |
| 65 to 74 Years | 6 (20.7%) | 18 (41.9%) |
| 75 Years and over | 52 (72.2%) | 39 (60.9%) |
Disability Class by Sex by Age in Siren
Disability Class: Hearing Difficulty
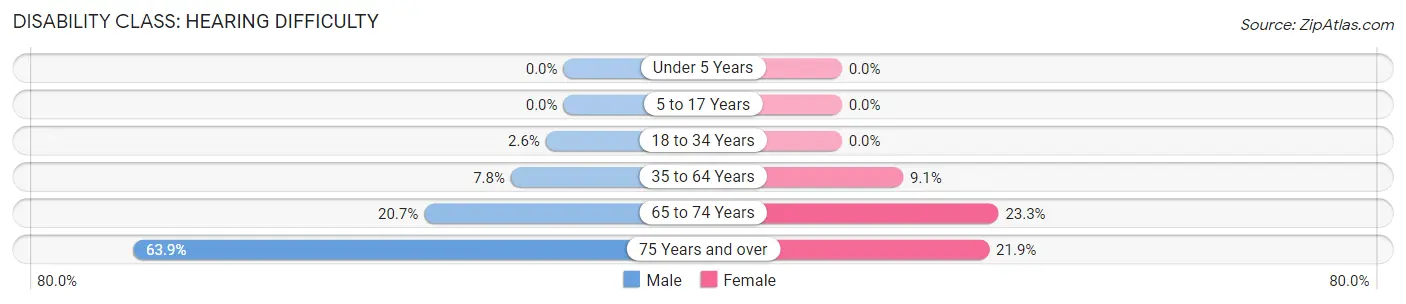
| Age Bracket | Male | Female |
| Under 5 Years | 0 (0.0%) | 0 (0.0%) |
| 5 to 17 Years | 0 (0.0%) | 0 (0.0%) |
| 18 to 34 Years | 1 (2.6%) | 0 (0.0%) |
| 35 to 64 Years | 10 (7.8%) | 16 (9.1%) |
| 65 to 74 Years | 6 (20.7%) | 10 (23.3%) |
| 75 Years and over | 46 (63.9%) | 14 (21.9%) |
Disability Class: Vision Difficulty
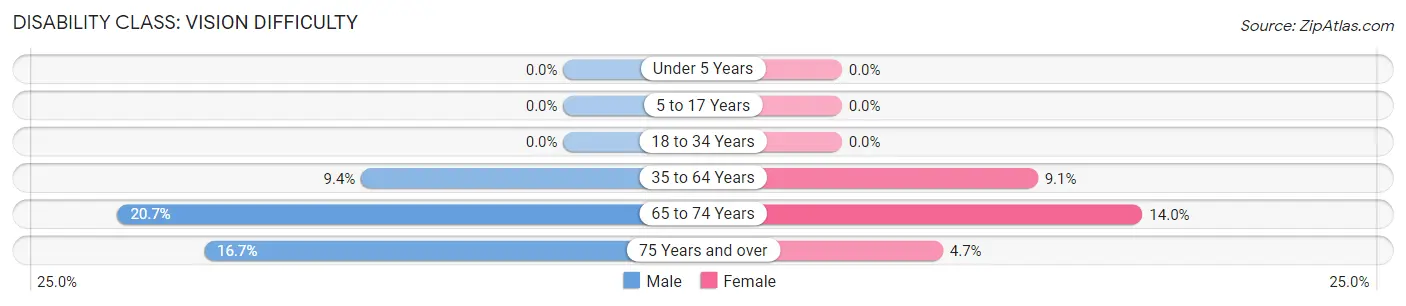
| Age Bracket | Male | Female |
| Under 5 Years | 0 (0.0%) | 0 (0.0%) |
| 5 to 17 Years | 0 (0.0%) | 0 (0.0%) |
| 18 to 34 Years | 0 (0.0%) | 0 (0.0%) |
| 35 to 64 Years | 12 (9.4%) | 16 (9.1%) |
| 65 to 74 Years | 6 (20.7%) | 6 (14.0%) |
| 75 Years and over | 12 (16.7%) | 3 (4.7%) |
Disability Class: Cognitive Difficulty
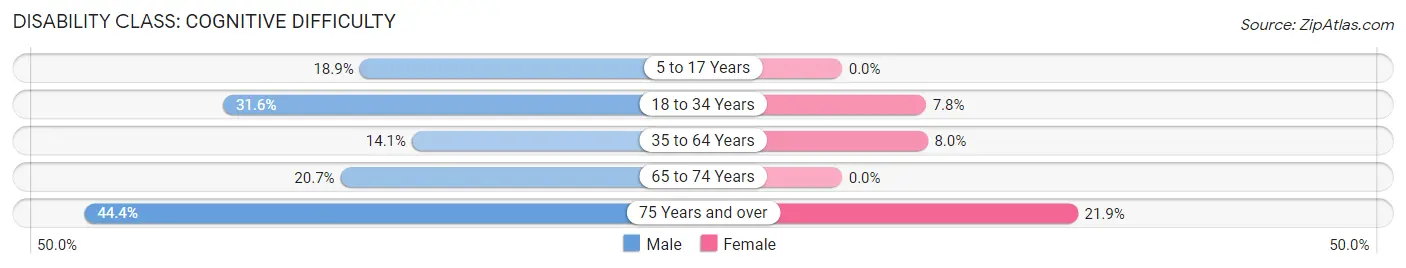
| Age Bracket | Male | Female |
| 5 to 17 Years | 7 (18.9%) | 0 (0.0%) |
| 18 to 34 Years | 12 (31.6%) | 6 (7.8%) |
| 35 to 64 Years | 18 (14.1%) | 14 (8.0%) |
| 65 to 74 Years | 6 (20.7%) | 0 (0.0%) |
| 75 Years and over | 32 (44.4%) | 14 (21.9%) |
Disability Class: Ambulatory Difficulty
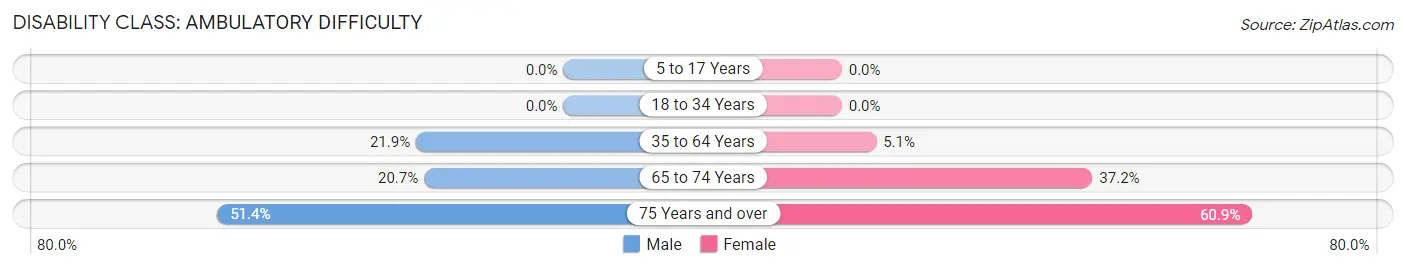
| Age Bracket | Male | Female |
| 5 to 17 Years | 0 (0.0%) | 0 (0.0%) |
| 18 to 34 Years | 0 (0.0%) | 0 (0.0%) |
| 35 to 64 Years | 28 (21.9%) | 9 (5.1%) |
| 65 to 74 Years | 6 (20.7%) | 16 (37.2%) |
| 75 Years and over | 37 (51.4%) | 39 (60.9%) |
Disability Class: Self-Care Difficulty
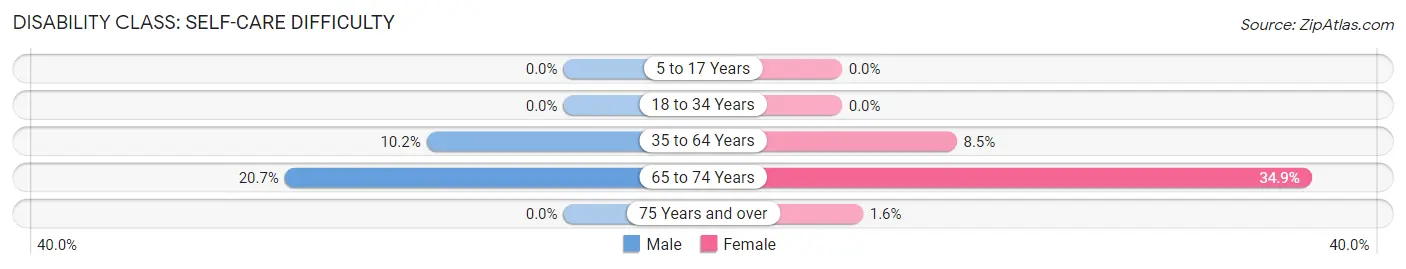
| Age Bracket | Male | Female |
| 5 to 17 Years | 0 (0.0%) | 0 (0.0%) |
| 18 to 34 Years | 0 (0.0%) | 0 (0.0%) |
| 35 to 64 Years | 13 (10.2%) | 15 (8.5%) |
| 65 to 74 Years | 6 (20.7%) | 15 (34.9%) |
| 75 Years and over | 0 (0.0%) | 1 (1.6%) |
Technology Access in Siren
Computing Device Access in Siren
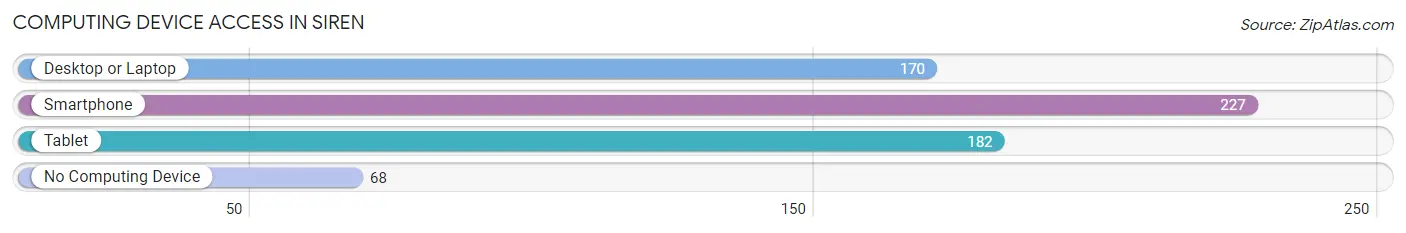
| Device Type | # Households | % Households |
| Desktop or Laptop | 170 | 50.0% |
| Smartphone | 227 | 66.8% |
| Tablet | 182 | 53.5% |
| No Computing Device | 68 | 20.0% |
| Total | 340 | 100.0% |
Internet Access in Siren
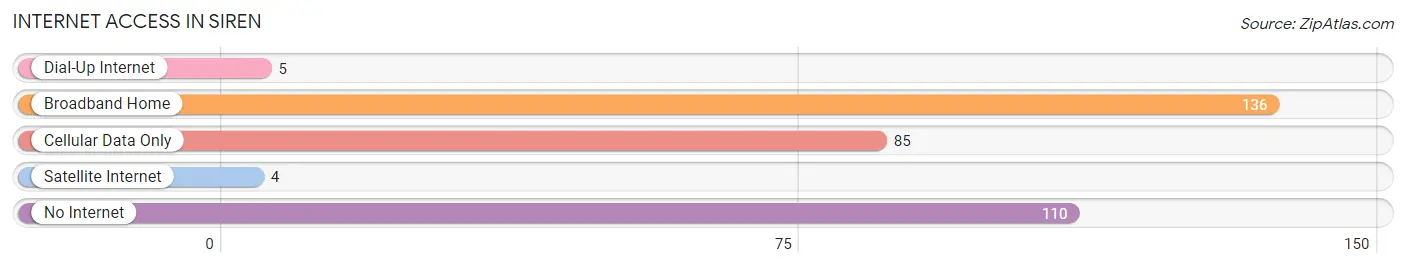
| Internet Type | # Households | % Households |
| Dial-Up Internet | 5 | 1.5% |
| Broadband Home | 136 | 40.0% |
| Cellular Data Only | 85 | 25.0% |
| Satellite Internet | 4 | 1.2% |
| No Internet | 110 | 32.4% |
| Total | 340 | 100.0% |
Siren Summary
Siren, Wisconsin is a small town located in Burnett County in the northwestern part of the state. It is situated on the banks of the Namekagon River, and is surrounded by the Chequamegon National Forest. The town has a population of approximately 1,000 people, and is known for its rural charm and natural beauty.
History
Siren was first settled in the late 1800s by a group of Swedish immigrants. The town was originally called “Svenska”, which means “Swedish” in Swedish. The name was changed to Siren in 1891, after the nearby lake. The town was officially incorporated in 1901.
In the early 1900s, the town was a logging and farming community. The logging industry was the main source of income for the town, and the local sawmill was the largest employer. The town also had a cheese factory, a creamery, and a general store.
In the 1950s, the logging industry began to decline, and the town began to focus on tourism. The town is now known for its outdoor recreation opportunities, such as fishing, hunting, camping, and hiking.
Geography
Siren is located in Burnett County, in the northwestern part of Wisconsin. It is situated on the banks of the Namekagon River, and is surrounded by the Chequamegon National Forest. The town is located approximately 30 miles from the Minnesota border.
The town has a total area of 1.2 square miles, all of which is land. The terrain is mostly flat, with some rolling hills. The climate is humid continental, with cold winters and warm summers.
Economy
The economy of Siren is largely based on tourism. The town is known for its outdoor recreation opportunities, such as fishing, hunting, camping, and hiking. The town also has several restaurants, bars, and shops.
The town is also home to several small businesses, such as a sawmill, a cheese factory, a creamery, and a general store. The town also has a few manufacturing companies, such as a furniture factory and a boat manufacturing plant.
Demographics
As of the 2010 census, the population of Siren was 1,000 people. The racial makeup of the town was 97.2% White, 0.7% Native American, 0.3% Asian, 0.2% from other races, and 1.6% from two or more races.
The median household income in Siren was $37,500, and the median family income was $45,000. The per capita income was $19,000. About 10.3% of the population was below the poverty line.
The town is served by the Siren School District, which includes an elementary school, a middle school, and a high school. The town also has a public library and a community center.
Common Questions
What is Per Capita Income in Siren?
Per Capita income in Siren is $25,659.
What is the Median Family Income in Siren?
Median Family Income in Siren is $57,647.
What is the Median Household income in Siren?
Median Household Income in Siren is $39,375.
What is Income or Wage Gap in Siren?
Income or Wage Gap in Siren is 37.1%.
Women in Siren earn 62.9 cents for every dollar earned by a man.
What is Inequality or Gini Index in Siren?
Inequality or Gini Index in Siren is 0.43.
What is the Total Population of Siren?
Total Population of Siren is 710.
What is the Total Male Population of Siren?
Total Male Population of Siren is 324.
What is the Total Female Population of Siren?
Total Female Population of Siren is 386.
What is the Ratio of Males per 100 Females in Siren?
There are 83.94 Males per 100 Females in Siren.
What is the Ratio of Females per 100 Males in Siren?
There are 119.14 Females per 100 Males in Siren.
What is the Median Population Age in Siren?
Median Population Age in Siren is 53.7 Years.
What is the Average Family Size in Siren
Average Family Size in Siren is 3.0 People.
What is the Average Household Size in Siren
Average Household Size in Siren is 2.0 People.
How Large is the Labor Force in Siren?
There are 276 People in the Labor Forcein in Siren.
What is the Percentage of People in the Labor Force in Siren?
43.0% of People are in the Labor Force in Siren.
What is the Unemployment Rate in Siren?
Unemployment Rate in Siren is 8.7%.