Sherwood, WI Map & Demographics
Sherwood Map
Sherwood Overview
$53,521
PER CAPITA INCOME
$138,125
AVG FAMILY INCOME
$125,156
AVG HOUSEHOLD INCOME
33.5%
WAGE / INCOME GAP [ % ]
66.5¢/ $1
WAGE / INCOME GAP [ $ ]
0.36
INEQUALITY / GINI INDEX
3,224
TOTAL POPULATION
1,695
MALE POPULATION
1,529
FEMALE POPULATION
110.86
MALES / 100 FEMALES
90.21
FEMALES / 100 MALES
44.0
MEDIAN AGE
2.9
AVG FAMILY SIZE
2.7
AVG HOUSEHOLD SIZE
1,912
LABOR FORCE [ PEOPLE ]
73.4%
PERCENT IN LABOR FORCE
1.1%
UNEMPLOYMENT RATE
Sherwood Zip Codes
Sherwood Area Codes
Income in Sherwood
Income Overview in Sherwood
Per Capita Income in Sherwood is $53,521, while median incomes of families and households are $138,125 and $125,156 respectively.
| Characteristic | Number | Measure |
| Per Capita Income | 3,224 | $53,521 |
| Median Family Income | 995 | $138,125 |
| Mean Family Income | 995 | $152,475 |
| Median Household Income | 1,205 | $125,156 |
| Mean Household Income | 1,205 | $141,346 |
| Income Deficit | 995 | $0 |
| Wage / Income Gap (%) | 3,224 | 33.51% |
| Wage / Income Gap ($) | 3,224 | 66.49¢ per $1 |
| Gini / Inequality Index | 3,224 | 0.36 |
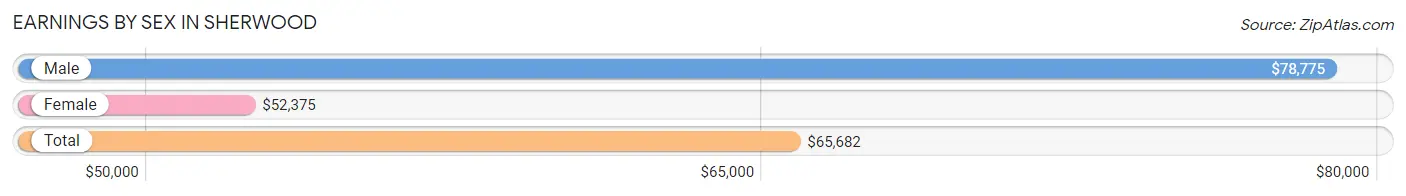
Earnings by Sex in Sherwood
Average Earnings in Sherwood are $65,682, $78,775 for men and $52,375 for women, a difference of 33.5%.
| Sex | Number | Average Earnings |
| Male | 1,097 (54.6%) | $78,775 |
| Female | 911 (45.4%) | $52,375 |
| Total | 2,008 (100.0%) | $65,682 |
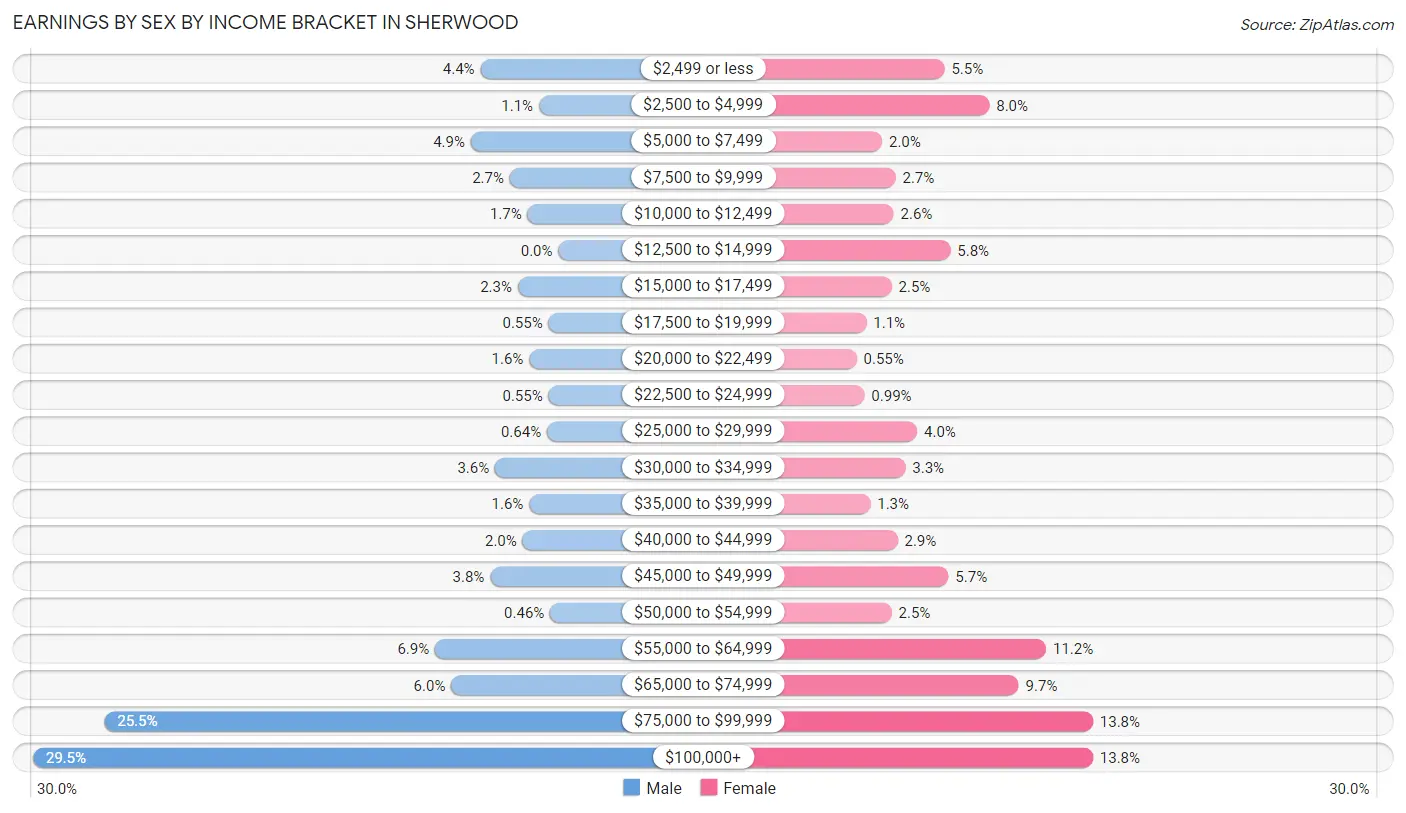
Earnings by Sex by Income Bracket in Sherwood
The most common earnings brackets in Sherwood are $100,000+ for men (324 | 29.5%) and $75,000 to $99,999 for women (126 | 13.8%).
| Income | Male | Female |
| $2,499 or less | 48 (4.4%) | 50 (5.5%) |
| $2,500 to $4,999 | 12 (1.1%) | 73 (8.0%) |
| $5,000 to $7,499 | 54 (4.9%) | 18 (2.0%) |
| $7,500 to $9,999 | 30 (2.7%) | 25 (2.7%) |
| $10,000 to $12,499 | 19 (1.7%) | 24 (2.6%) |
| $12,500 to $14,999 | 0 (0.0%) | 53 (5.8%) |
| $15,000 to $17,499 | 25 (2.3%) | 23 (2.5%) |
| $17,500 to $19,999 | 6 (0.5%) | 10 (1.1%) |
| $20,000 to $22,499 | 18 (1.6%) | 5 (0.5%) |
| $22,500 to $24,999 | 6 (0.5%) | 9 (1.0%) |
| $25,000 to $29,999 | 7 (0.6%) | 36 (4.0%) |
| $30,000 to $34,999 | 39 (3.6%) | 30 (3.3%) |
| $35,000 to $39,999 | 18 (1.6%) | 12 (1.3%) |
| $40,000 to $44,999 | 22 (2.0%) | 26 (2.9%) |
| $45,000 to $49,999 | 42 (3.8%) | 52 (5.7%) |
| $50,000 to $54,999 | 5 (0.5%) | 23 (2.5%) |
| $55,000 to $64,999 | 76 (6.9%) | 102 (11.2%) |
| $65,000 to $74,999 | 66 (6.0%) | 88 (9.7%) |
| $75,000 to $99,999 | 280 (25.5%) | 126 (13.8%) |
| $100,000+ | 324 (29.5%) | 126 (13.8%) |
| Total | 1,097 (100.0%) | 911 (100.0%) |
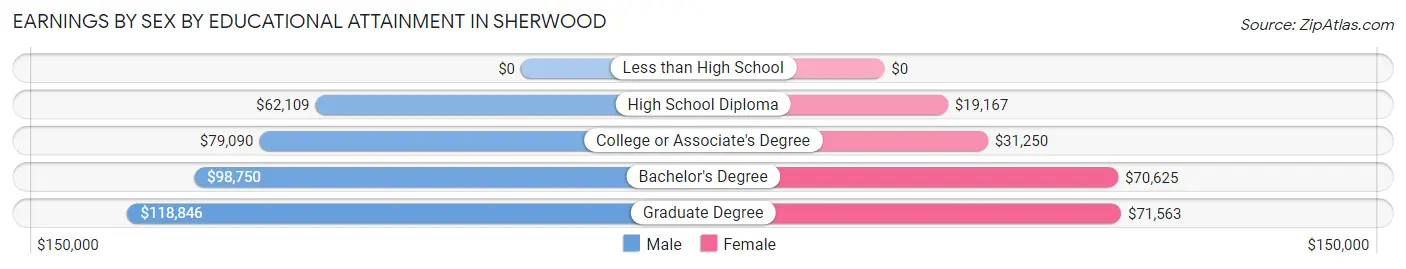
Earnings by Sex by Educational Attainment in Sherwood
Average earnings in Sherwood are $81,250 for men and $58,387 for women, a difference of 28.1%. Men with an educational attainment of graduate degree enjoy the highest average annual earnings of $118,846, while those with high school diploma education earn the least with $62,109. Women with an educational attainment of graduate degree earn the most with the average annual earnings of $71,563, while those with high school diploma education have the smallest earnings of $19,167.
| Educational Attainment | Male Income | Female Income |
| Less than High School | - | - |
| High School Diploma | $62,109 | $19,167 |
| College or Associate's Degree | $79,090 | $31,250 |
| Bachelor's Degree | $98,750 | $70,625 |
| Graduate Degree | $118,846 | $71,563 |
| Total | $81,250 | $58,387 |
Family Income in Sherwood
Family Income Brackets in Sherwood
According to the Sherwood family income data, there are 233 families falling into the $200,000+ income range, which is the most common income bracket and makes up 23.4% of all families. Conversely, the $15,000 to $24,999 income bracket is the least frequent group with only 3 families (0.3%) belonging to this category.
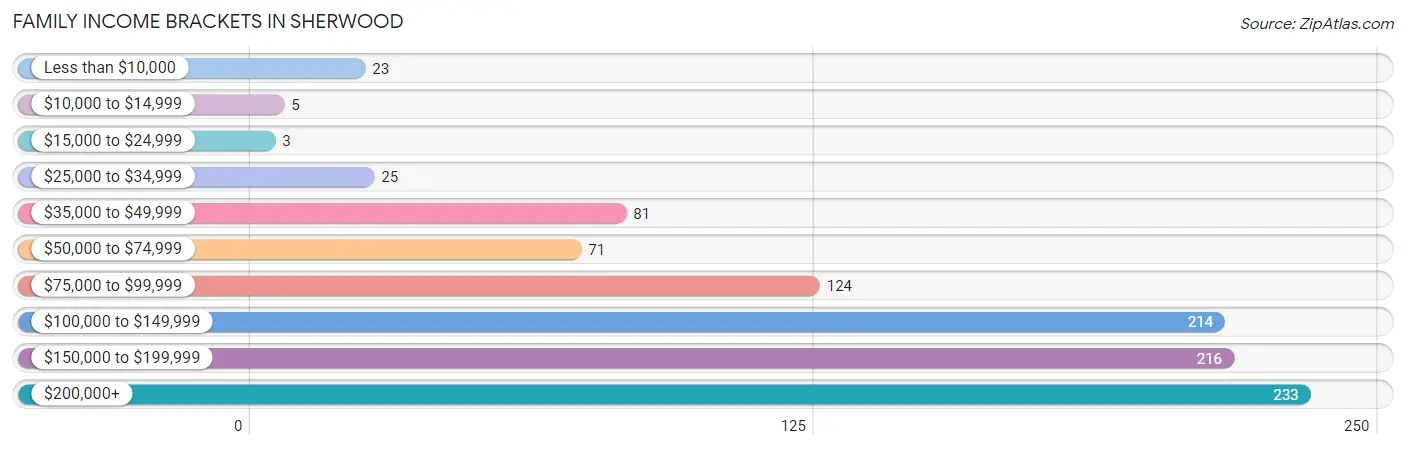
| Income Bracket | # Families | % Families |
| Less than $10,000 | 23 | 2.3% |
| $10,000 to $14,999 | 5 | 0.5% |
| $15,000 to $24,999 | 3 | 0.3% |
| $25,000 to $34,999 | 25 | 2.5% |
| $35,000 to $49,999 | 81 | 8.1% |
| $50,000 to $74,999 | 71 | 7.1% |
| $75,000 to $99,999 | 124 | 12.5% |
| $100,000 to $149,999 | 214 | 21.5% |
| $150,000 to $199,999 | 216 | 21.7% |
| $200,000+ | 233 | 23.4% |
Family Income by Famaliy Size in Sherwood
5-person families (115 | 11.6%) account for the highest median family income in Sherwood with $214,514 per family, while 2-person families (503 | 50.5%) have the highest median income of $50,992 per family member.
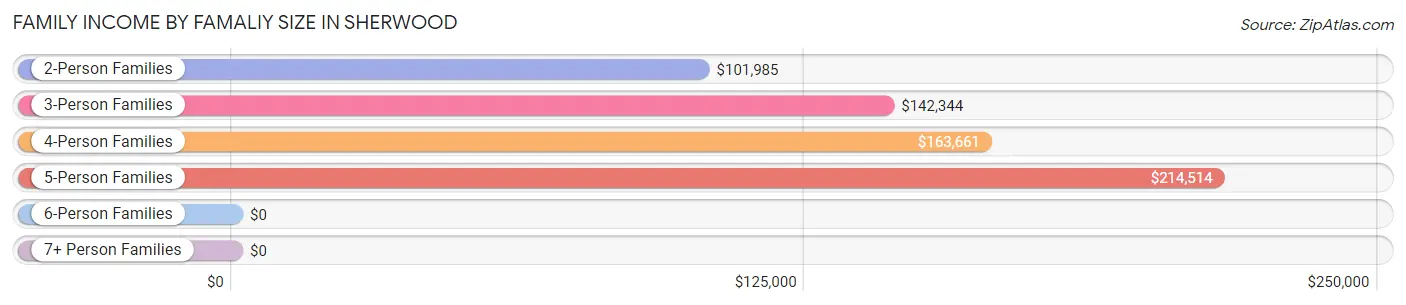
| Income Bracket | # Families | Median Income |
| 2-Person Families | 503 (50.5%) | $101,985 |
| 3-Person Families | 165 (16.6%) | $142,344 |
| 4-Person Families | 189 (19.0%) | $163,661 |
| 5-Person Families | 115 (11.6%) | $214,514 |
| 6-Person Families | 23 (2.3%) | $0 |
| 7+ Person Families | 0 (0.0%) | $0 |
| Total | 995 (100.0%) | $138,125 |
Family Income by Number of Earners in Sherwood
The median family income in Sherwood is $138,125, with families comprising 3+ earners (190) having the highest median family income of $198,750, while families with no earners (145) have the lowest median family income of $66,250, accounting for 19.1% and 14.6% of families, respectively.
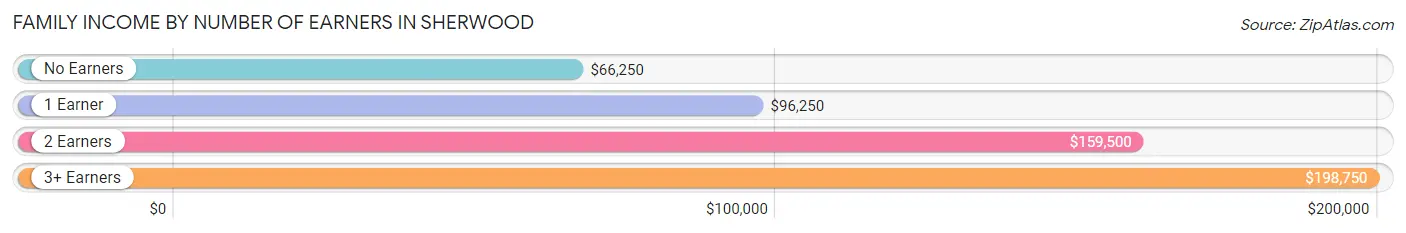
| Number of Earners | # Families | Median Income |
| No Earners | 145 (14.6%) | $66,250 |
| 1 Earner | 206 (20.7%) | $96,250 |
| 2 Earners | 454 (45.6%) | $159,500 |
| 3+ Earners | 190 (19.1%) | $198,750 |
| Total | 995 (100.0%) | $138,125 |
Household Income in Sherwood
Household Income Brackets in Sherwood
With 248 households falling in the category, the $100,000 to $149,999 income range is the most frequent in Sherwood, accounting for 20.6% of all households. In contrast, only 5 households (0.4%) fall into the less than $10,000 income bracket, making it the least populous group.
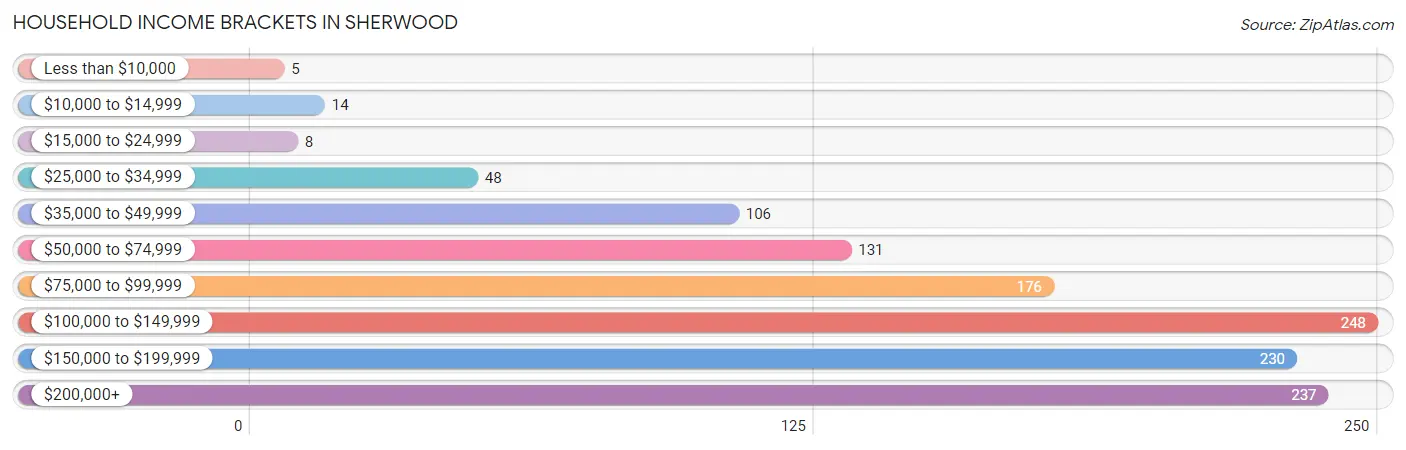
| Income Bracket | # Households | % Households |
| Less than $10,000 | 5 | 0.4% |
| $10,000 to $14,999 | 14 | 1.2% |
| $15,000 to $24,999 | 8 | 0.7% |
| $25,000 to $34,999 | 48 | 4.0% |
| $35,000 to $49,999 | 106 | 8.8% |
| $50,000 to $74,999 | 131 | 10.9% |
| $75,000 to $99,999 | 176 | 14.6% |
| $100,000 to $149,999 | 248 | 20.6% |
| $150,000 to $199,999 | 230 | 19.1% |
| $200,000+ | 237 | 19.7% |
Household Income by Householder Age in Sherwood
The median household income in Sherwood is $125,156, with the highest median household income of $150,000 found in the 45 to 64 years age bracket for the primary householder. A total of 580 households (48.1%) fall into this category. Meanwhile, the 15 to 24 years age bracket for the primary householder has the lowest median household income of $0, with 36 households (3.0%) in this group.
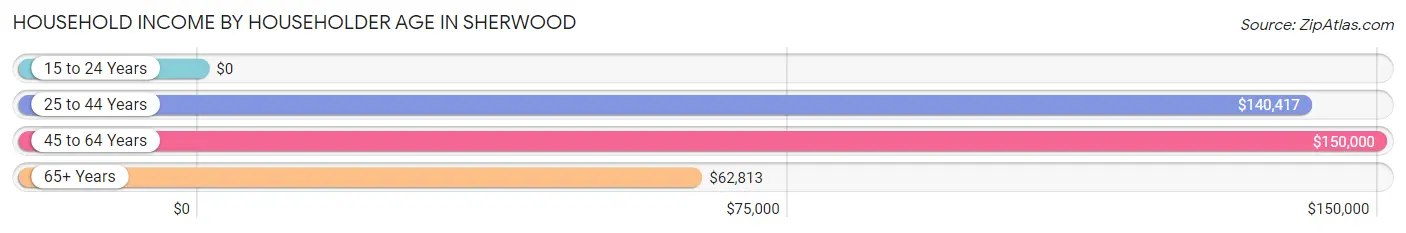
| Income Bracket | # Households | Median Income |
| 15 to 24 Years | 36 (3.0%) | $0 |
| 25 to 44 Years | 334 (27.7%) | $140,417 |
| 45 to 64 Years | 580 (48.1%) | $150,000 |
| 65+ Years | 255 (21.2%) | $62,813 |
| Total | 1,205 (100.0%) | $125,156 |
Poverty in Sherwood
Income Below Poverty by Sex and Age in Sherwood
With 2.0% poverty level for males and 4.3% for females among the residents of Sherwood, under 5 year old males and 16 and 17 year old females are the most vulnerable to poverty, with 12 males (14.0%) and 8 females (28.6%) in their respective age groups living below the poverty level.
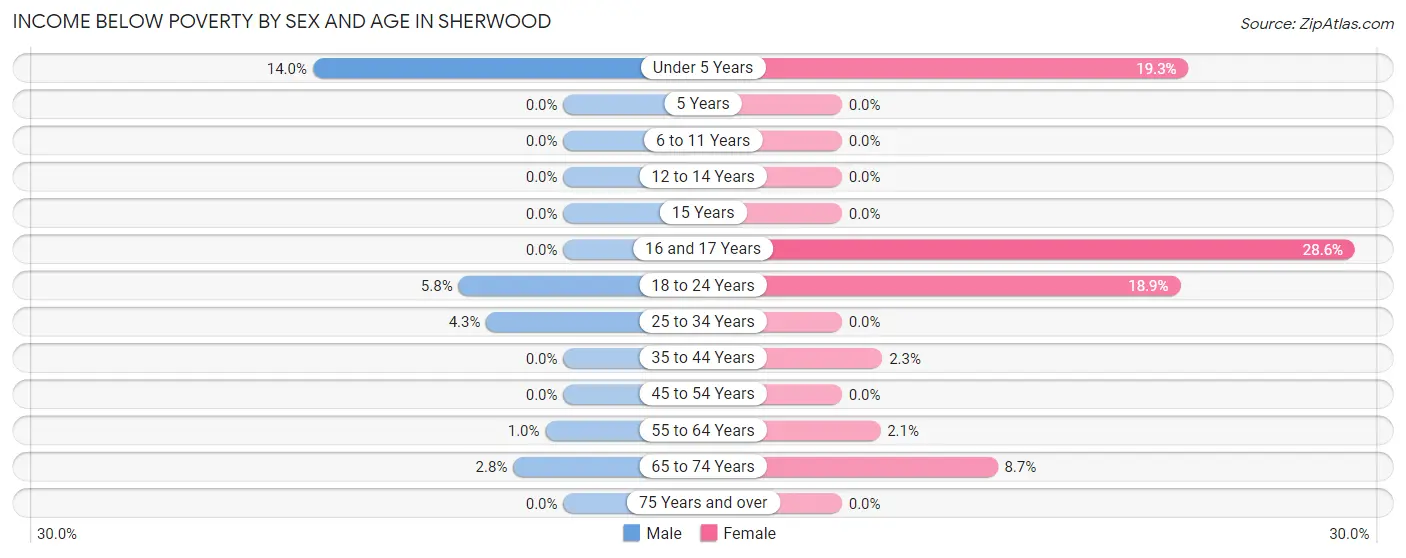
| Age Bracket | Male | Female |
| Under 5 Years | 12 (14.0%) | 11 (19.3%) |
| 5 Years | 0 (0.0%) | 0 (0.0%) |
| 6 to 11 Years | 0 (0.0%) | 0 (0.0%) |
| 12 to 14 Years | 0 (0.0%) | 0 (0.0%) |
| 15 Years | 0 (0.0%) | 0 (0.0%) |
| 16 and 17 Years | 0 (0.0%) | 8 (28.6%) |
| 18 to 24 Years | 8 (5.8%) | 23 (18.9%) |
| 25 to 34 Years | 6 (4.3%) | 0 (0.0%) |
| 35 to 44 Years | 0 (0.0%) | 4 (2.2%) |
| 45 to 54 Years | 0 (0.0%) | 0 (0.0%) |
| 55 to 64 Years | 3 (1.0%) | 5 (2.1%) |
| 65 to 74 Years | 5 (2.8%) | 15 (8.7%) |
| 75 Years and over | 0 (0.0%) | 0 (0.0%) |
| Total | 34 (2.0%) | 66 (4.3%) |
Income Above Poverty by Sex and Age in Sherwood
According to the poverty statistics in Sherwood, males aged 5 years and females aged 5 years are the age groups that are most secure financially, with 100.0% of males and 100.0% of females in these age groups living above the poverty line.
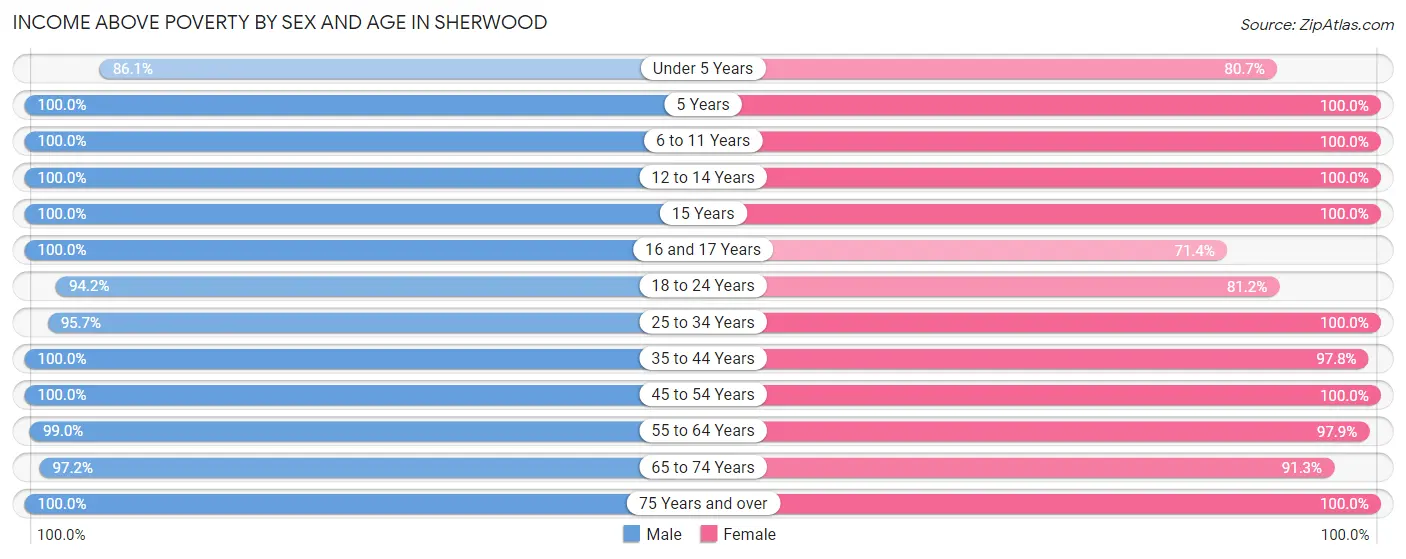
| Age Bracket | Male | Female |
| Under 5 Years | 74 (86.1%) | 46 (80.7%) |
| 5 Years | 20 (100.0%) | 12 (100.0%) |
| 6 to 11 Years | 113 (100.0%) | 89 (100.0%) |
| 12 to 14 Years | 104 (100.0%) | 96 (100.0%) |
| 15 Years | 15 (100.0%) | 21 (100.0%) |
| 16 and 17 Years | 90 (100.0%) | 20 (71.4%) |
| 18 to 24 Years | 129 (94.2%) | 99 (81.1%) |
| 25 to 34 Years | 134 (95.7%) | 145 (100.0%) |
| 35 to 44 Years | 194 (100.0%) | 174 (97.8%) |
| 45 to 54 Years | 284 (100.0%) | 282 (100.0%) |
| 55 to 64 Years | 296 (99.0%) | 229 (97.9%) |
| 65 to 74 Years | 174 (97.2%) | 158 (91.3%) |
| 75 Years and over | 32 (100.0%) | 88 (100.0%) |
| Total | 1,659 (98.0%) | 1,459 (95.7%) |
Income Below Poverty Among Married-Couple Families in Sherwood
The poverty statistics for married-couple families in Sherwood show that 0.5% or 5 of the total 906 families live below the poverty line. Families with no children have the highest poverty rate of 0.9%, comprising of 5 families. On the other hand, families with 1 or 2 children have the lowest poverty rate of 0.0%, which includes 0 families.
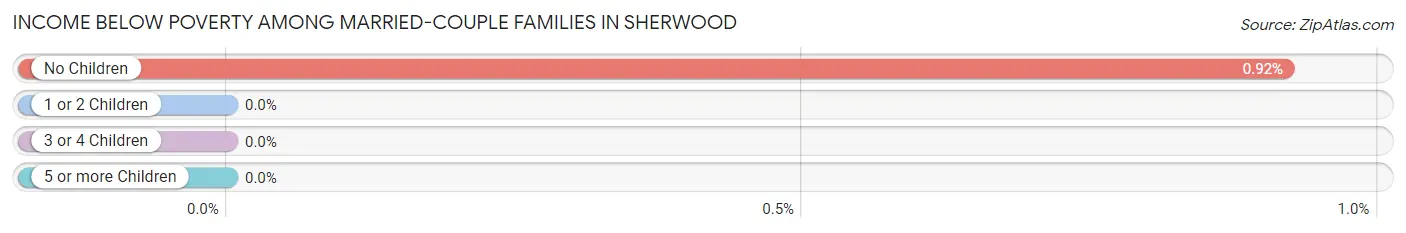
| Children | Above Poverty | Below Poverty |
| No Children | 540 (99.1%) | 5 (0.9%) |
| 1 or 2 Children | 263 (100.0%) | 0 (0.0%) |
| 3 or 4 Children | 98 (100.0%) | 0 (0.0%) |
| 5 or more Children | 0 (0.0%) | 0 (0.0%) |
| Total | 901 (99.5%) | 5 (0.5%) |
Income Below Poverty Among Single-Parent Households in Sherwood
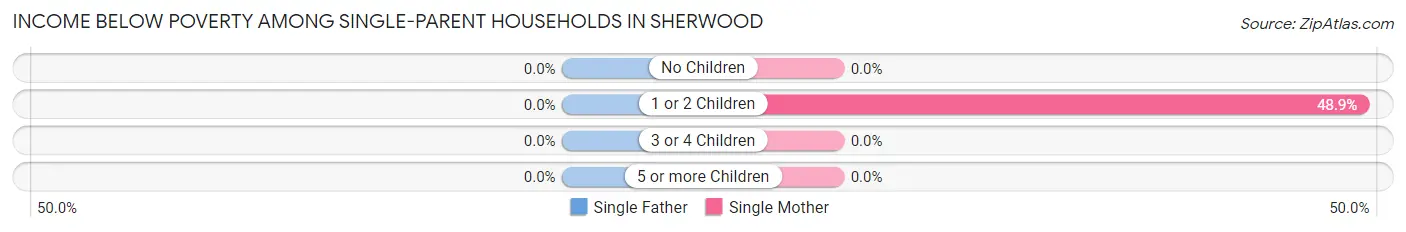
| Children | Single Father | Single Mother |
| No Children | 0 (0.0%) | 0 (0.0%) |
| 1 or 2 Children | 0 (0.0%) | 23 (48.9%) |
| 3 or 4 Children | 0 (0.0%) | 0 (0.0%) |
| 5 or more Children | 0 (0.0%) | 0 (0.0%) |
| Total | 0 (0.0%) | 23 (37.1%) |
Income Below Poverty Among Married-Couple vs Single-Parent Households in Sherwood
The poverty data for Sherwood shows that 5 of the married-couple family households (0.5%) and 23 of the single-parent households (25.8%) are living below the poverty level. Within the married-couple family households, those with no children have the highest poverty rate, with 5 households (0.9%) falling below the poverty line. Among the single-parent households, those with 1 or 2 children have the highest poverty rate, with 23 household (36.5%) living below poverty.
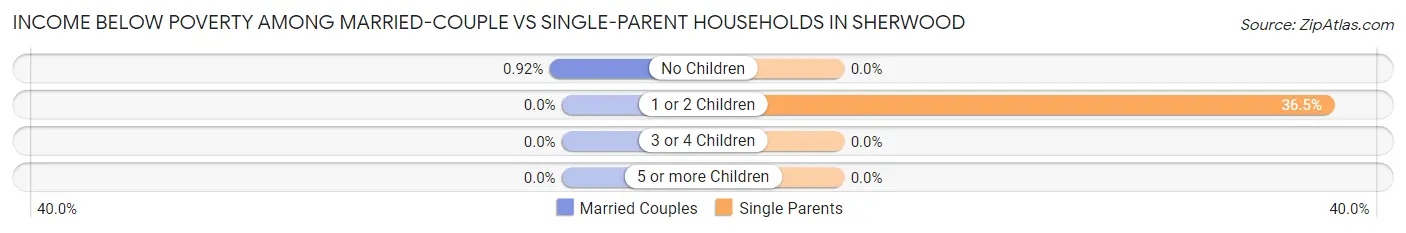
| Children | Married-Couple Families | Single-Parent Households |
| No Children | 5 (0.9%) | 0 (0.0%) |
| 1 or 2 Children | 0 (0.0%) | 23 (36.5%) |
| 3 or 4 Children | 0 (0.0%) | 0 (0.0%) |
| 5 or more Children | 0 (0.0%) | 0 (0.0%) |
| Total | 5 (0.5%) | 23 (25.8%) |
Race in Sherwood
The most populous races in Sherwood are White / Caucasian (3,148 | 97.6%), Two or more Races (50 | 1.5%), and Hispanic or Latino (16 | 0.5%).
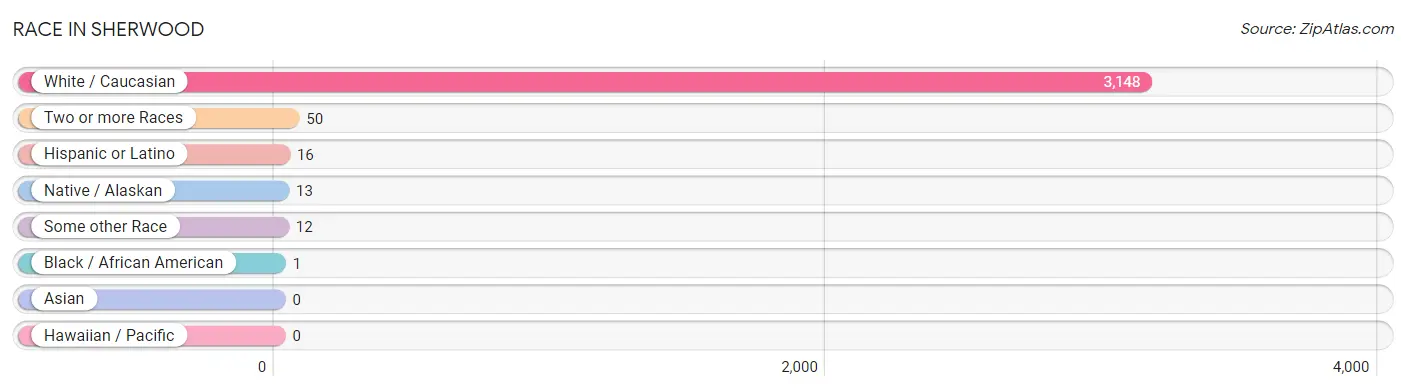
| Race | # Population | % Population |
| Asian | 0 | 0.0% |
| Black / African American | 1 | 0.0% |
| Hawaiian / Pacific | 0 | 0.0% |
| Hispanic or Latino | 16 | 0.5% |
| Native / Alaskan | 13 | 0.4% |
| White / Caucasian | 3,148 | 97.6% |
| Two or more Races | 50 | 1.5% |
| Some other Race | 12 | 0.4% |
| Total | 3,224 | 100.0% |
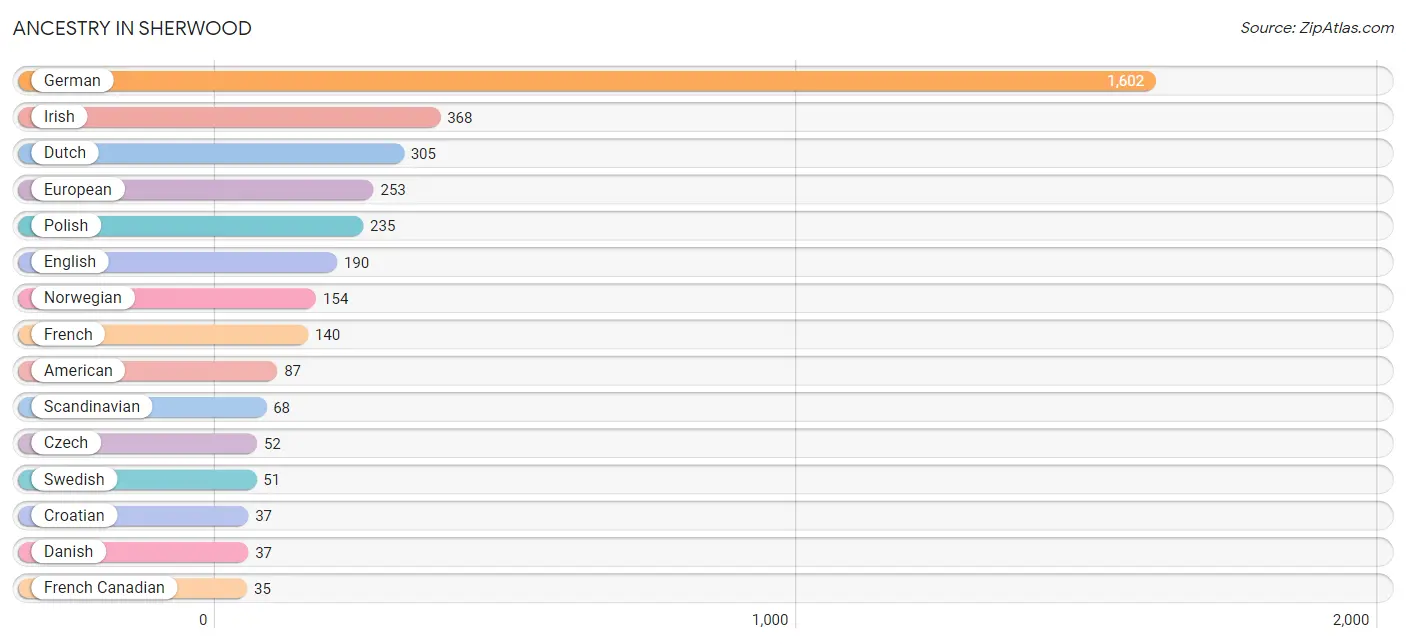
Ancestry in Sherwood
The most populous ancestries reported in Sherwood are German (1,602 | 49.7%), Irish (368 | 11.4%), Dutch (305 | 9.5%), European (253 | 7.9%), and Polish (235 | 7.3%), together accounting for 85.7% of all Sherwood residents.
| Ancestry | # Population | % Population |
| American | 87 | 2.7% |
| Arab | 2 | 0.1% |
| Austrian | 7 | 0.2% |
| Belgian | 26 | 0.8% |
| British | 24 | 0.7% |
| Cherokee | 6 | 0.2% |
| Croatian | 37 | 1.1% |
| Czech | 52 | 1.6% |
| Czechoslovakian | 2 | 0.1% |
| Danish | 37 | 1.1% |
| Dutch | 305 | 9.5% |
| Eastern European | 17 | 0.5% |
| English | 190 | 5.9% |
| European | 253 | 7.9% |
| Finnish | 12 | 0.4% |
| French | 140 | 4.3% |
| French Canadian | 35 | 1.1% |
| German | 1,602 | 49.7% |
| Hungarian | 5 | 0.2% |
| Irish | 368 | 11.4% |
| Iroquois | 5 | 0.2% |
| Italian | 12 | 0.4% |
| Lebanese | 2 | 0.1% |
| Lithuanian | 4 | 0.1% |
| Luxembourger | 4 | 0.1% |
| Mexican | 16 | 0.5% |
| Mexican American Indian | 8 | 0.3% |
| Northern European | 6 | 0.2% |
| Norwegian | 154 | 4.8% |
| Polish | 235 | 7.3% |
| Russian | 3 | 0.1% |
| Scandinavian | 68 | 2.1% |
| Scotch-Irish | 3 | 0.1% |
| Scottish | 9 | 0.3% |
| Slovene | 4 | 0.1% |
| Swedish | 51 | 1.6% |
| Swiss | 6 | 0.2% |
| Welsh | 15 | 0.5% |
| Yugoslavian | 4 | 0.1% | View All 39 Rows |
Immigrants in Sherwood
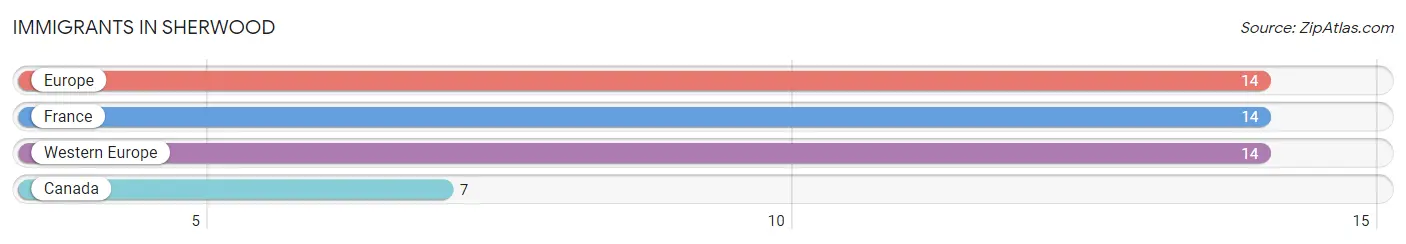
The most numerous immigrant groups reported in Sherwood came from Europe (14 | 0.4%), France (14 | 0.4%), Western Europe (14 | 0.4%), and Canada (7 | 0.2%), together accounting for 1.5% of all Sherwood residents.
| Immigration Origin | # Population | % Population |
| Canada | 7 | 0.2% |
| Europe | 14 | 0.4% |
| France | 14 | 0.4% |
| Western Europe | 14 | 0.4% | View All 4 Rows |
Sex and Age in Sherwood
Sex and Age in Sherwood
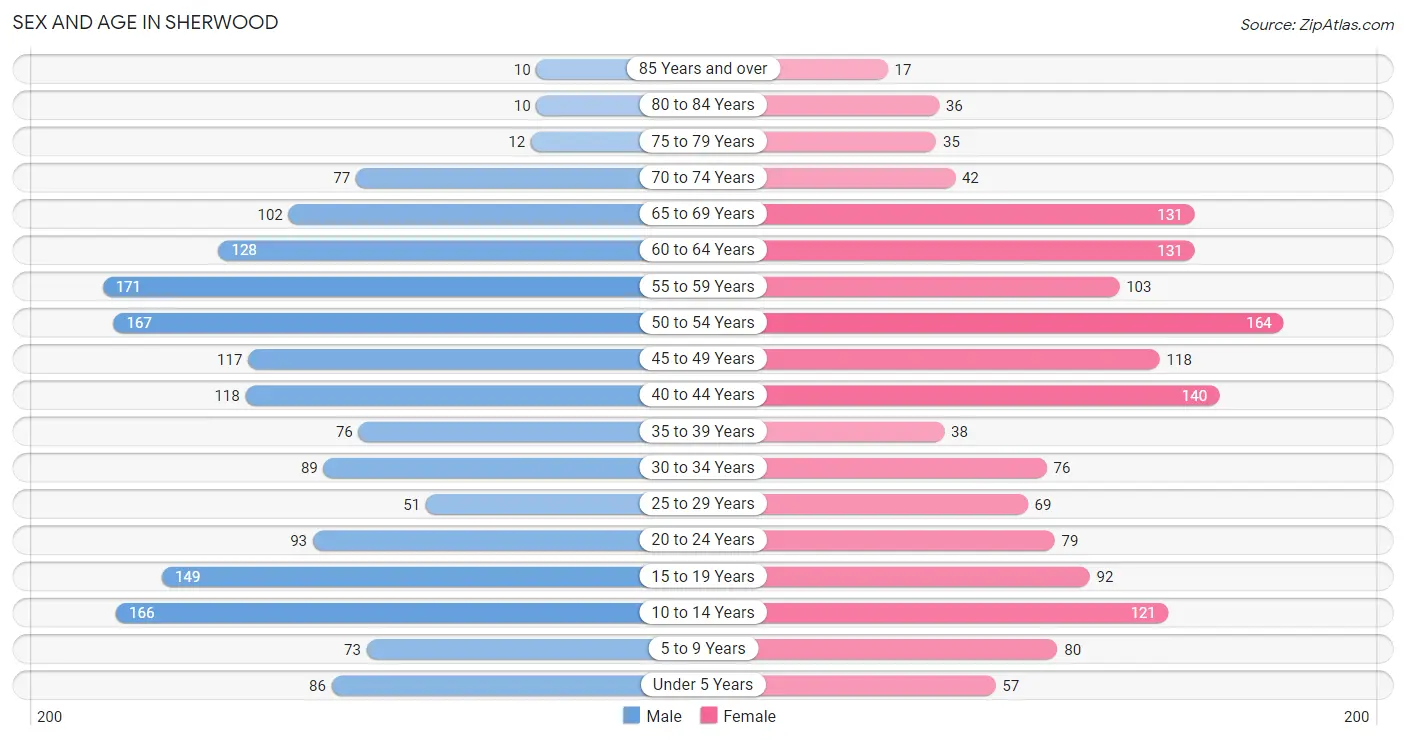
The most populous age groups in Sherwood are 55 to 59 Years (171 | 10.1%) for men and 50 to 54 Years (164 | 10.7%) for women.
| Age Bracket | Male | Female |
| Under 5 Years | 86 (5.1%) | 57 (3.7%) |
| 5 to 9 Years | 73 (4.3%) | 80 (5.2%) |
| 10 to 14 Years | 166 (9.8%) | 121 (7.9%) |
| 15 to 19 Years | 149 (8.8%) | 92 (6.0%) |
| 20 to 24 Years | 93 (5.5%) | 79 (5.2%) |
| 25 to 29 Years | 51 (3.0%) | 69 (4.5%) |
| 30 to 34 Years | 89 (5.2%) | 76 (5.0%) |
| 35 to 39 Years | 76 (4.5%) | 38 (2.5%) |
| 40 to 44 Years | 118 (7.0%) | 140 (9.2%) |
| 45 to 49 Years | 117 (6.9%) | 118 (7.7%) |
| 50 to 54 Years | 167 (9.9%) | 164 (10.7%) |
| 55 to 59 Years | 171 (10.1%) | 103 (6.7%) |
| 60 to 64 Years | 128 (7.5%) | 131 (8.6%) |
| 65 to 69 Years | 102 (6.0%) | 131 (8.6%) |
| 70 to 74 Years | 77 (4.5%) | 42 (2.8%) |
| 75 to 79 Years | 12 (0.7%) | 35 (2.3%) |
| 80 to 84 Years | 10 (0.6%) | 36 (2.4%) |
| 85 Years and over | 10 (0.6%) | 17 (1.1%) |
| Total | 1,695 (100.0%) | 1,529 (100.0%) |
Families and Households in Sherwood
Median Family Size in Sherwood
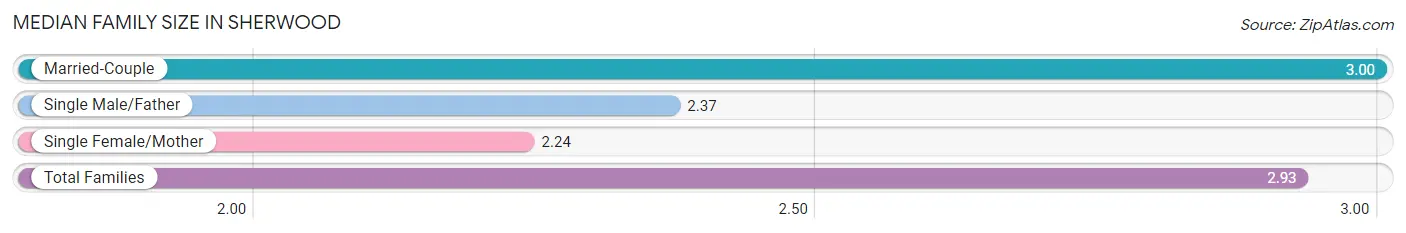
The median family size in Sherwood is 2.93 persons per family, with married-couple families (906 | 91.1%) accounting for the largest median family size of 3 persons per family. On the other hand, single female/mother families (62 | 6.2%) represent the smallest median family size with 2.24 persons per family.
| Family Type | # Families | Family Size |
| Married-Couple | 906 (91.1%) | 3.00 |
| Single Male/Father | 27 (2.7%) | 2.37 |
| Single Female/Mother | 62 (6.2%) | 2.24 |
| Total Families | 995 (100.0%) | 2.93 |
Median Household Size in Sherwood
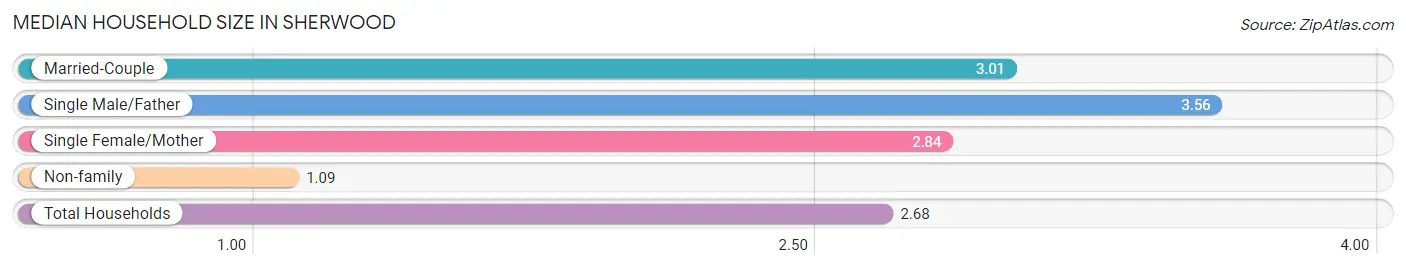
The median household size in Sherwood is 2.68 persons per household, with single male/father households (27 | 2.2%) accounting for the largest median household size of 3.56 persons per household. non-family households (210 | 17.4%) represent the smallest median household size with 1.09 persons per household.
| Household Type | # Households | Household Size |
| Married-Couple | 906 (75.2%) | 3.01 |
| Single Male/Father | 27 (2.2%) | 3.56 |
| Single Female/Mother | 62 (5.1%) | 2.84 |
| Non-family | 210 (17.4%) | 1.09 |
| Total Households | 1,205 (100.0%) | 2.68 |
Household Size by Marriage Status in Sherwood
Out of a total of 1,205 households in Sherwood, 995 (82.6%) are family households, while 210 (17.4%) are nonfamily households. The most numerous type of family households are 2-person households, comprising 476, and the most common type of nonfamily households are 1-person households, comprising 192.
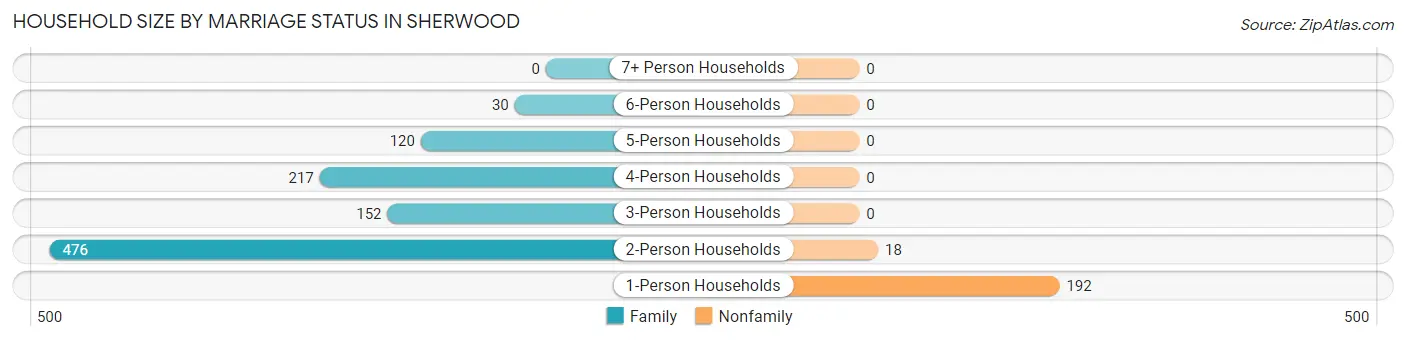
| Household Size | Family Households | Nonfamily Households |
| 1-Person Households | - | 192 (15.9%) |
| 2-Person Households | 476 (39.5%) | 18 (1.5%) |
| 3-Person Households | 152 (12.6%) | 0 (0.0%) |
| 4-Person Households | 217 (18.0%) | 0 (0.0%) |
| 5-Person Households | 120 (10.0%) | 0 (0.0%) |
| 6-Person Households | 30 (2.5%) | 0 (0.0%) |
| 7+ Person Households | 0 (0.0%) | 0 (0.0%) |
| Total | 995 (82.6%) | 210 (17.4%) |
Female Fertility in Sherwood
Fertility by Age in Sherwood
Average fertility rate in Sherwood is 83.0 births per 1,000 women. Women in the age bracket of 20 to 34 years have the highest fertility rate with 232.0 births per 1,000 women. Women in the age bracket of 20 to 34 years acount for 100.0% of all women with births.
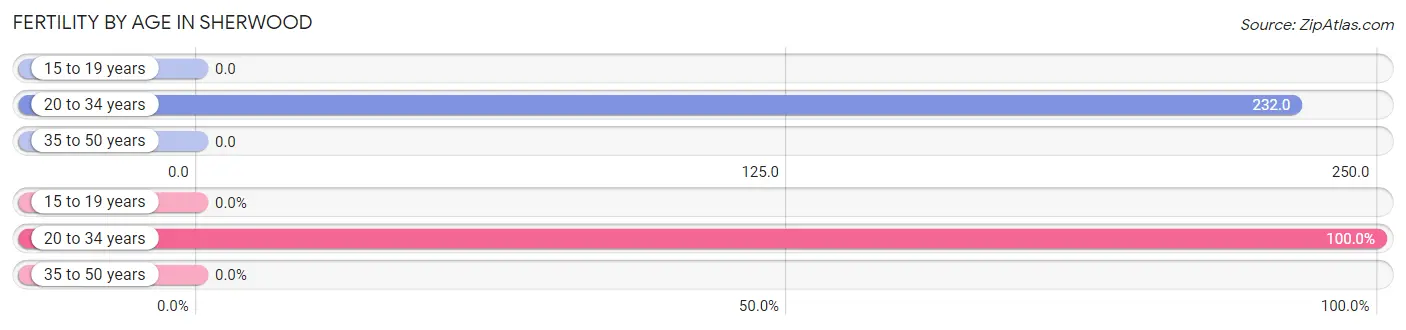
| Age Bracket | Women with Births | Births / 1,000 Women |
| 15 to 19 years | 0 (0.0%) | 0.0 |
| 20 to 34 years | 52 (100.0%) | 232.0 |
| 35 to 50 years | 0 (0.0%) | 0.0 |
| Total | 52 (100.0%) | 83.0 |
Fertility by Age by Marriage Status in Sherwood
84.6% of women with births (52) in Sherwood are married. The highest percentage of unmarried women with births falls into 20 to 34 years age bracket with 15.4% of them unmarried at the time of birth, while the lowest percentage of unmarried women with births belong to 20 to 34 years age bracket with 15.4% of them unmarried.
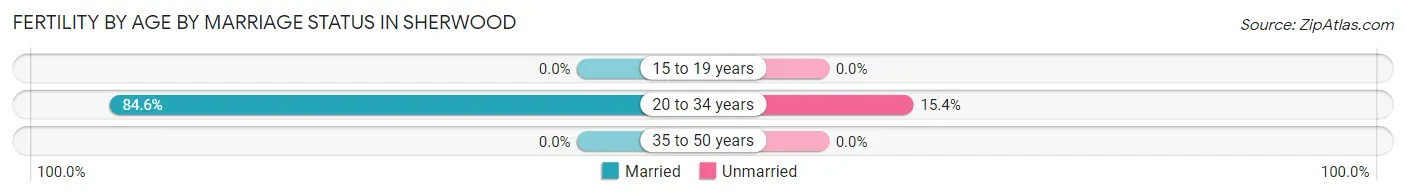
| Age Bracket | Married | Unmarried |
| 15 to 19 years | 0 (0.0%) | 0 (0.0%) |
| 20 to 34 years | 44 (84.6%) | 8 (15.4%) |
| 35 to 50 years | 0 (0.0%) | 0 (0.0%) |
| Total | 44 (84.6%) | 8 (15.4%) |
Fertility by Education in Sherwood
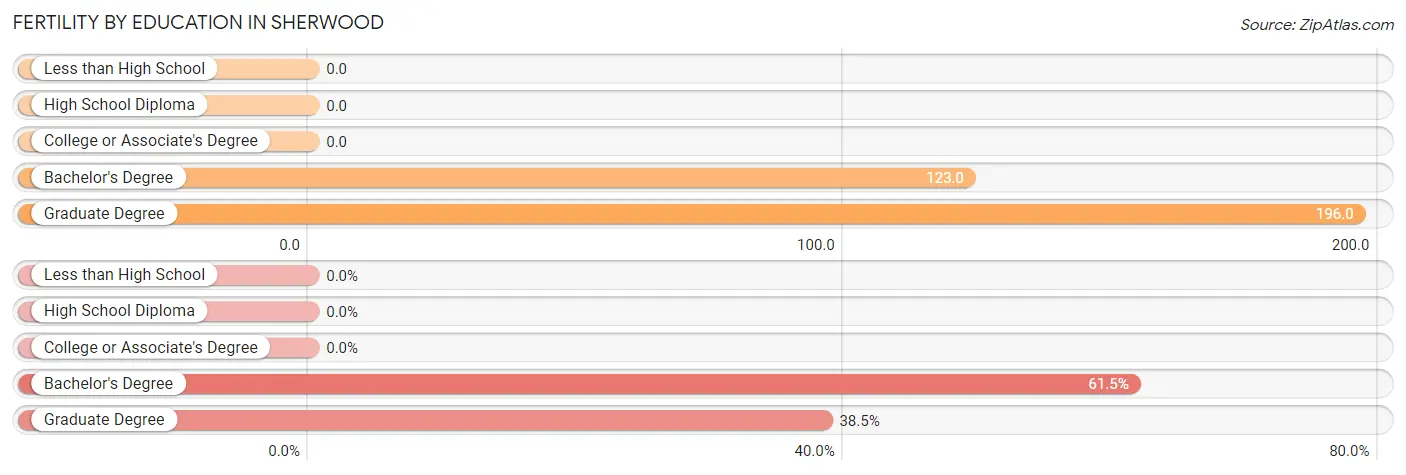
| Educational Attainment | Women with Births | Births / 1,000 Women |
| Less than High School | 0 (0.0%) | 0.0 |
| High School Diploma | 0 (0.0%) | 0.0 |
| College or Associate's Degree | 0 (0.0%) | 0.0 |
| Bachelor's Degree | 32 (61.5%) | 123.0 |
| Graduate Degree | 20 (38.5%) | 196.0 |
| Total | 52 (100.0%) | 83.0 |
Fertility by Education by Marriage Status in Sherwood
15.4% of women with births in Sherwood are unmarried. Women with the educational attainment of graduate degree are most likely to be married with 100.0% of them married at childbirth, while women with the educational attainment of bachelor's degree are least likely to be married with 25.0% of them unmarried at childbirth.
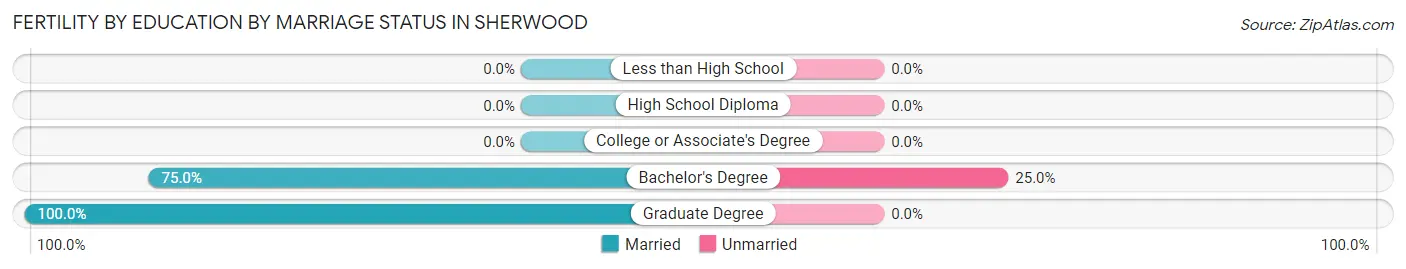
| Educational Attainment | Married | Unmarried |
| Less than High School | 0 (0.0%) | 0 (0.0%) |
| High School Diploma | 0 (0.0%) | 0 (0.0%) |
| College or Associate's Degree | 0 (0.0%) | 0 (0.0%) |
| Bachelor's Degree | 24 (75.0%) | 8 (25.0%) |
| Graduate Degree | 20 (100.0%) | 0 (0.0%) |
| Total | 44 (84.6%) | 8 (15.4%) |
Employment Characteristics in Sherwood
Employment by Class of Employer in Sherwood
Among the 1,855 employed individuals in Sherwood, private company employees (1,322 | 71.3%), not-for-profit organizations (196 | 10.6%), and local government employees (129 | 7.0%) make up the most common classes of employment.
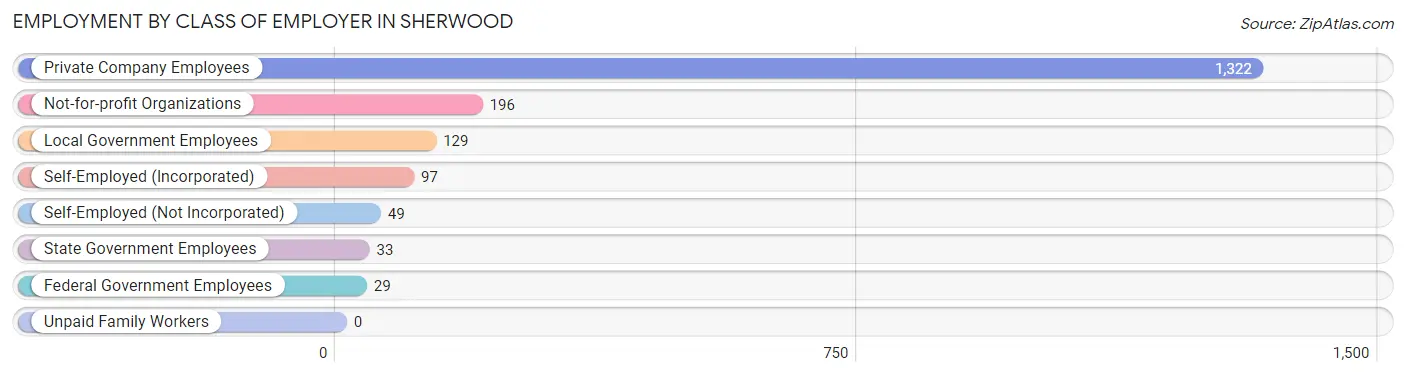
| Employer Class | # Employees | % Employees |
| Private Company Employees | 1,322 | 71.3% |
| Self-Employed (Incorporated) | 97 | 5.2% |
| Self-Employed (Not Incorporated) | 49 | 2.6% |
| Not-for-profit Organizations | 196 | 10.6% |
| Local Government Employees | 129 | 7.0% |
| State Government Employees | 33 | 1.8% |
| Federal Government Employees | 29 | 1.6% |
| Unpaid Family Workers | 0 | 0.0% |
| Total | 1,855 | 100.0% |
Employment Status by Age in Sherwood
According to the labor force statistics for Sherwood, out of the total population over 16 years of age (2,605), 73.4% or 1,912 individuals are in the labor force, with 1.1% or 21 of them unemployed. The age group with the highest labor force participation rate is 25 to 29 years, with 99.2% or 119 individuals in the labor force. Within the labor force, the 16 to 19 years age range has the highest percentage of unemployed individuals, with 5.0% or 6 of them being unemployed.
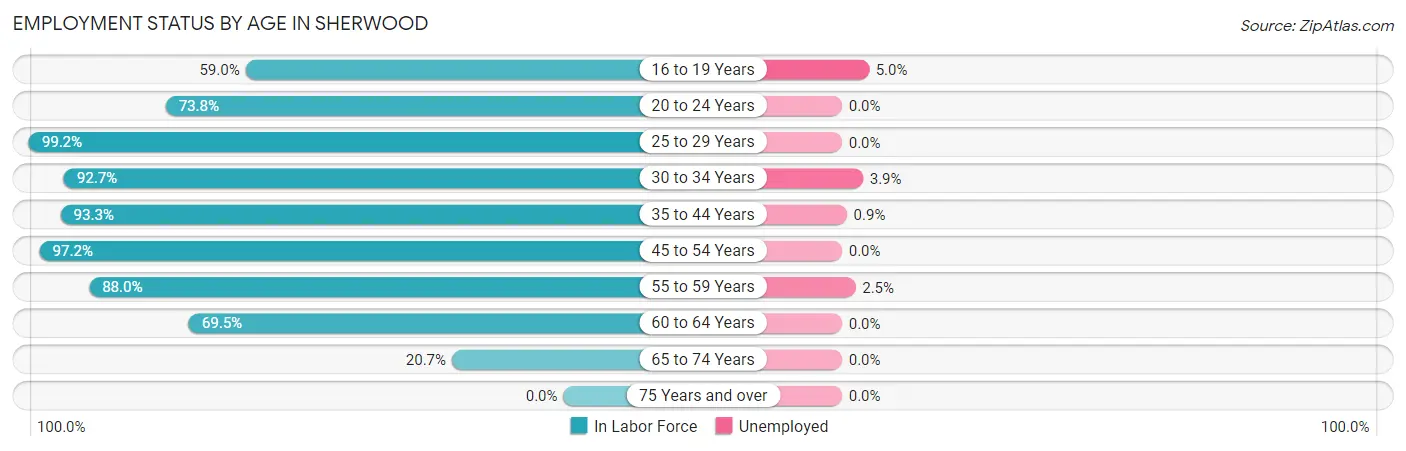
| Age Bracket | In Labor Force | Unemployed |
| 16 to 19 Years | 121 (59.0%) | 6 (5.0%) |
| 20 to 24 Years | 127 (73.8%) | 0 (0.0%) |
| 25 to 29 Years | 119 (99.2%) | 0 (0.0%) |
| 30 to 34 Years | 153 (92.7%) | 6 (3.9%) |
| 35 to 44 Years | 347 (93.3%) | 3 (0.9%) |
| 45 to 54 Years | 550 (97.2%) | 0 (0.0%) |
| 55 to 59 Years | 241 (88.0%) | 6 (2.5%) |
| 60 to 64 Years | 180 (69.5%) | 0 (0.0%) |
| 65 to 74 Years | 73 (20.7%) | 0 (0.0%) |
| 75 Years and over | 0 (0.0%) | 0 (0.0%) |
| Total | 1,912 (73.4%) | 21 (1.1%) |
Employment Status by Educational Attainment in Sherwood
According to labor force statistics for Sherwood, 90.5% of individuals (1,589) out of the total population between 25 and 64 years of age (1,756) are in the labor force, with 0.9% or 14 of them being unemployed. The group with the highest labor force participation rate are those with the educational attainment of less than high school, with 100.0% or 5 individuals in the labor force. Within the labor force, individuals with college / associate degree education have the highest percentage of unemployment, with 1.3% or 6 of them being unemployed.
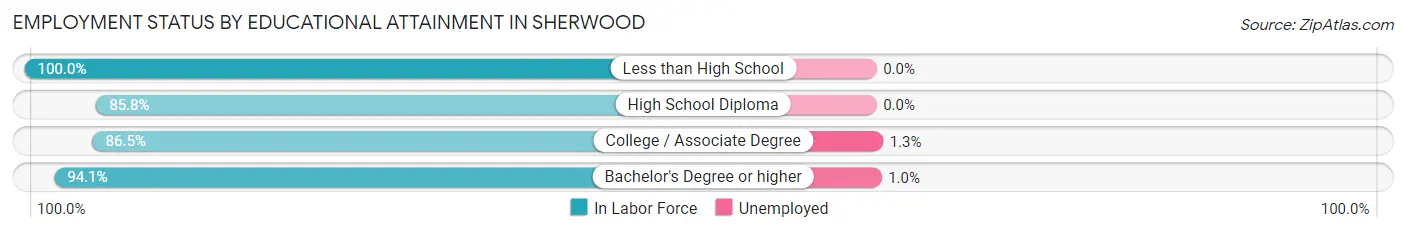
| Educational Attainment | In Labor Force | Unemployed |
| Less than High School | 5 (100.0%) | 0 (0.0%) |
| High School Diploma | 236 (85.8%) | 0 (0.0%) |
| College / Associate Degree | 455 (86.5%) | 7 (1.3%) |
| Bachelor's Degree or higher | 894 (94.1%) | 10 (1.0%) |
| Total | 1,589 (90.5%) | 16 (0.9%) |
Employment Occupations by Sex in Sherwood
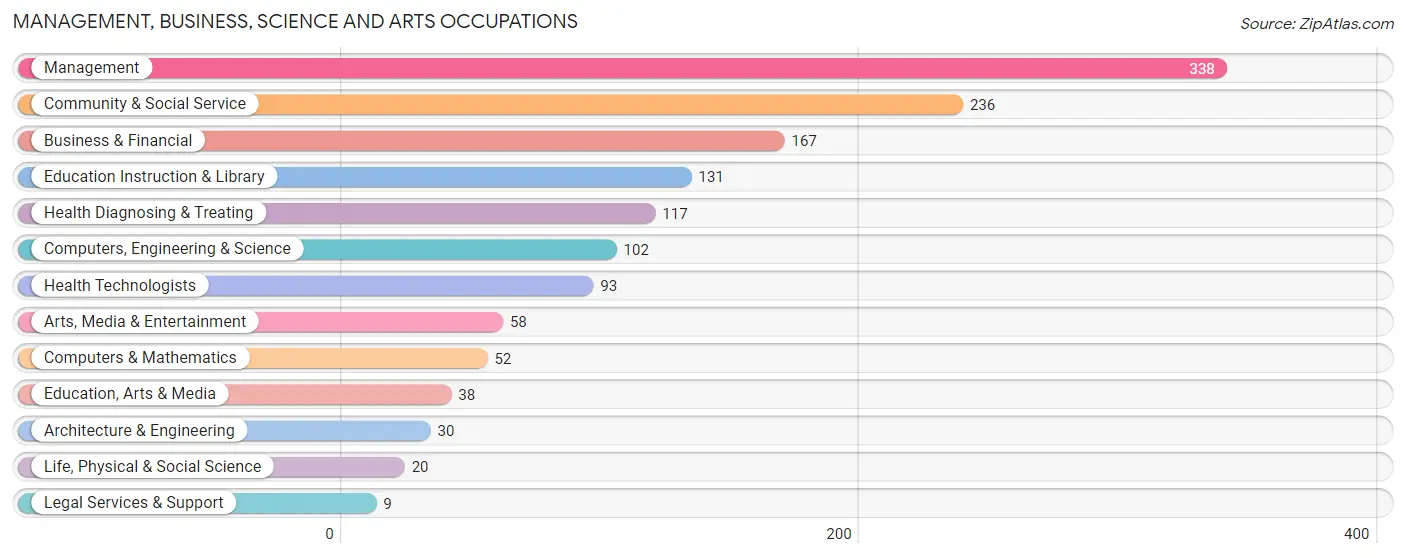
Management, Business, Science and Arts Occupations
The most common Management, Business, Science and Arts occupations in Sherwood are Management (338 | 17.9%), Community & Social Service (236 | 12.5%), Business & Financial (167 | 8.8%), Education Instruction & Library (131 | 6.9%), and Health Diagnosing & Treating (117 | 6.2%).
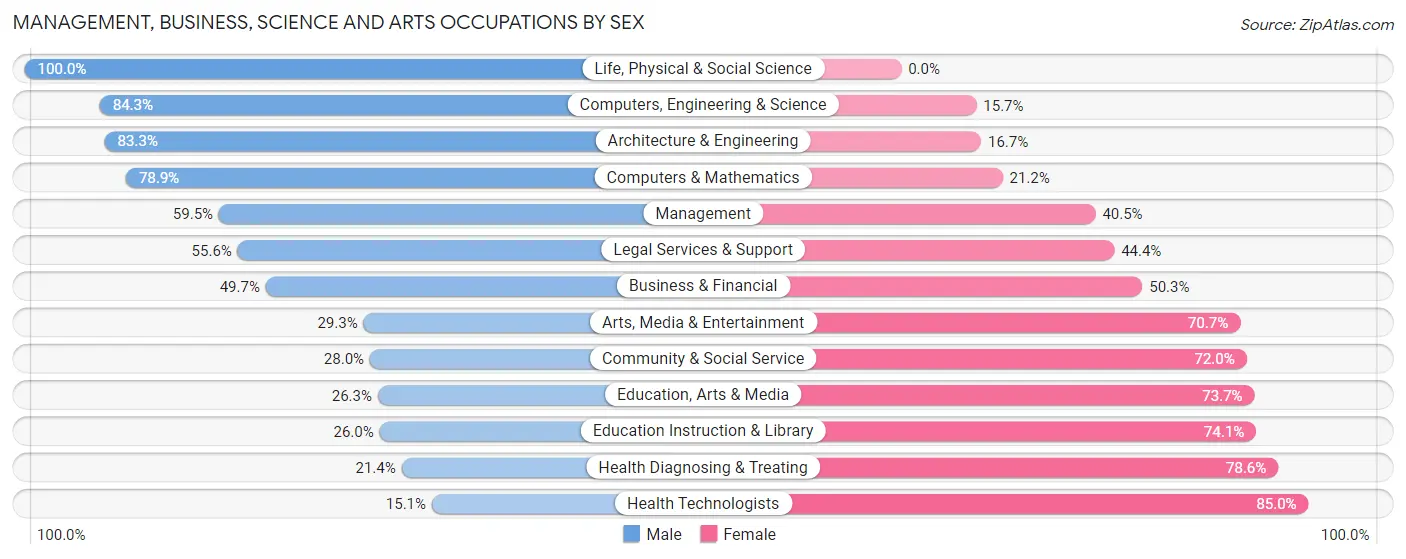
Management, Business, Science and Arts Occupations by Sex
Within the Management, Business, Science and Arts occupations in Sherwood, the most male-oriented occupations are Life, Physical & Social Science (100.0%), Computers, Engineering & Science (84.3%), and Architecture & Engineering (83.3%), while the most female-oriented occupations are Health Technologists (85.0%), Health Diagnosing & Treating (78.6%), and Education Instruction & Library (74.1%).
| Occupation | Male | Female |
| Management | 201 (59.5%) | 137 (40.5%) |
| Business & Financial | 83 (49.7%) | 84 (50.3%) |
| Computers, Engineering & Science | 86 (84.3%) | 16 (15.7%) |
| Computers & Mathematics | 41 (78.8%) | 11 (21.1%) |
| Architecture & Engineering | 25 (83.3%) | 5 (16.7%) |
| Life, Physical & Social Science | 20 (100.0%) | 0 (0.0%) |
| Community & Social Service | 66 (28.0%) | 170 (72.0%) |
| Education, Arts & Media | 10 (26.3%) | 28 (73.7%) |
| Legal Services & Support | 5 (55.6%) | 4 (44.4%) |
| Education Instruction & Library | 34 (26.0%) | 97 (74.1%) |
| Arts, Media & Entertainment | 17 (29.3%) | 41 (70.7%) |
| Health Diagnosing & Treating | 25 (21.4%) | 92 (78.6%) |
| Health Technologists | 14 (15.0%) | 79 (85.0%) |
| Total (Category) | 461 (48.0%) | 499 (52.0%) |
| Total (Overall) | 1,060 (56.1%) | 830 (43.9%) |
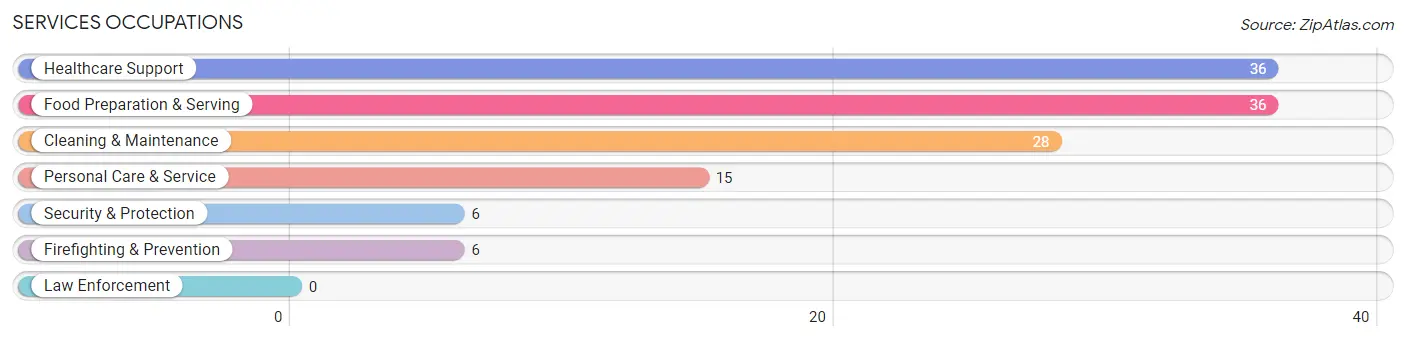
Services Occupations
The most common Services occupations in Sherwood are Healthcare Support (36 | 1.9%), Food Preparation & Serving (36 | 1.9%), Cleaning & Maintenance (28 | 1.5%), Personal Care & Service (15 | 0.8%), and Security & Protection (6 | 0.3%).
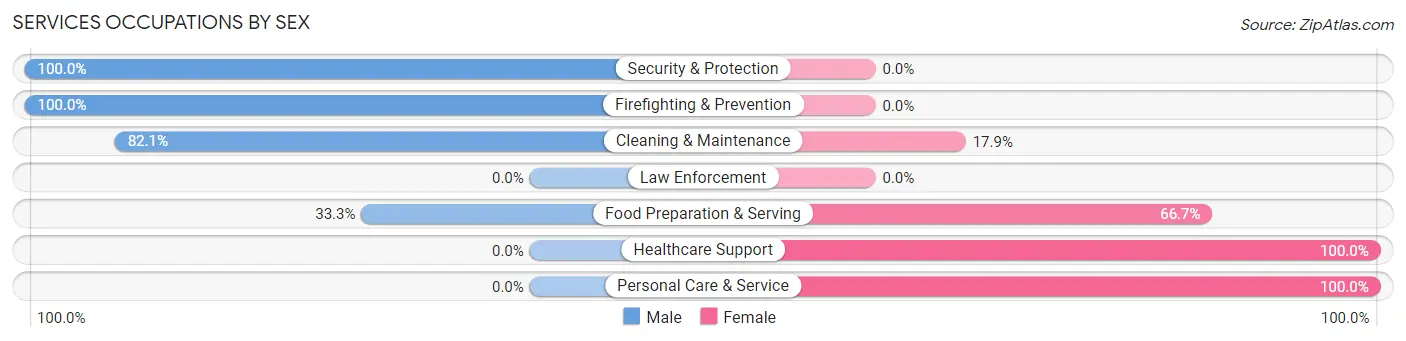
Services Occupations by Sex
Within the Services occupations in Sherwood, the most male-oriented occupations are Security & Protection (100.0%), Firefighting & Prevention (100.0%), and Cleaning & Maintenance (82.1%), while the most female-oriented occupations are Healthcare Support (100.0%), Personal Care & Service (100.0%), and Food Preparation & Serving (66.7%).
| Occupation | Male | Female |
| Healthcare Support | 0 (0.0%) | 36 (100.0%) |
| Security & Protection | 6 (100.0%) | 0 (0.0%) |
| Firefighting & Prevention | 6 (100.0%) | 0 (0.0%) |
| Law Enforcement | 0 (0.0%) | 0 (0.0%) |
| Food Preparation & Serving | 12 (33.3%) | 24 (66.7%) |
| Cleaning & Maintenance | 23 (82.1%) | 5 (17.9%) |
| Personal Care & Service | 0 (0.0%) | 15 (100.0%) |
| Total (Category) | 41 (33.9%) | 80 (66.1%) |
| Total (Overall) | 1,060 (56.1%) | 830 (43.9%) |
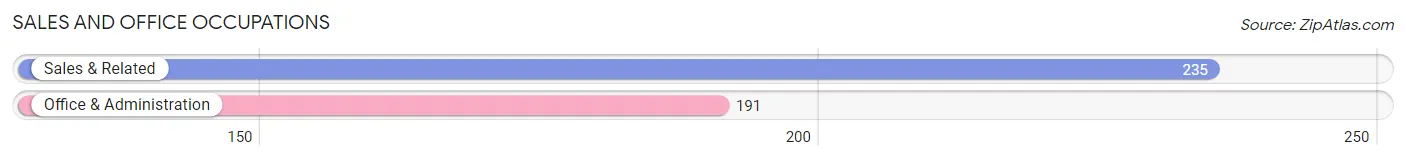
Sales and Office Occupations
The most common Sales and Office occupations in Sherwood are Sales & Related (235 | 12.4%), and Office & Administration (191 | 10.1%).
Sales and Office Occupations by Sex
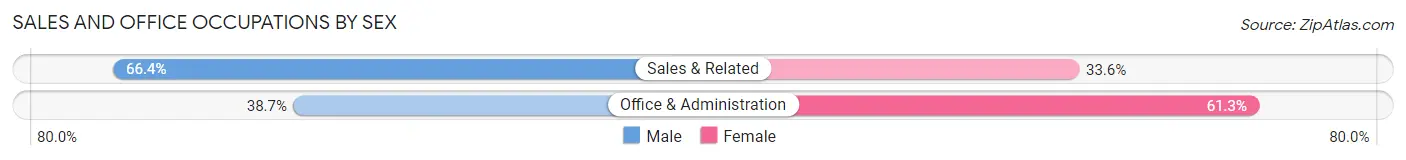
| Occupation | Male | Female |
| Sales & Related | 156 (66.4%) | 79 (33.6%) |
| Office & Administration | 74 (38.7%) | 117 (61.3%) |
| Total (Category) | 230 (54.0%) | 196 (46.0%) |
| Total (Overall) | 1,060 (56.1%) | 830 (43.9%) |
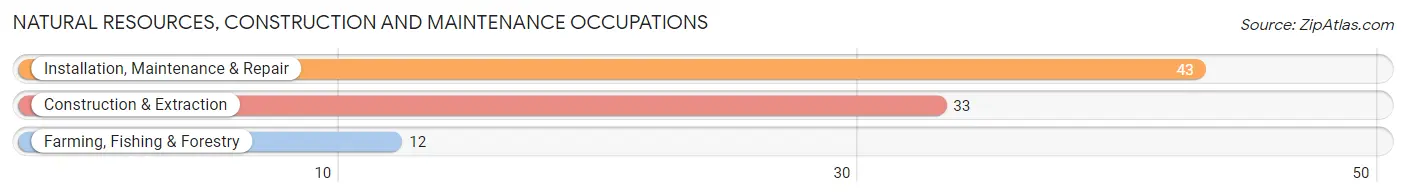
Natural Resources, Construction and Maintenance Occupations
The most common Natural Resources, Construction and Maintenance occupations in Sherwood are Installation, Maintenance & Repair (43 | 2.3%), Construction & Extraction (33 | 1.8%), and Farming, Fishing & Forestry (12 | 0.6%).
Natural Resources, Construction and Maintenance Occupations by Sex
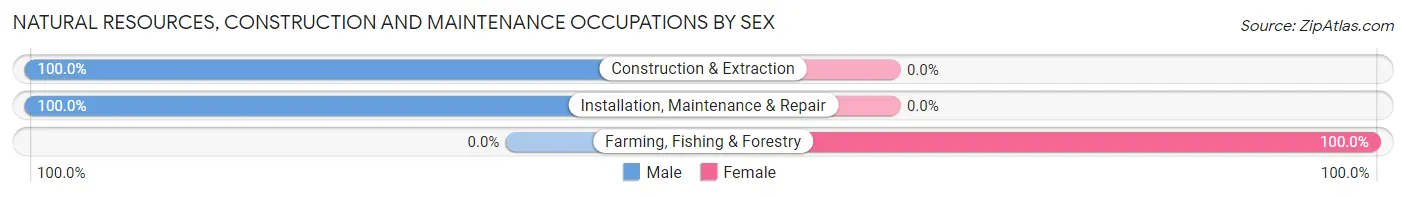
| Occupation | Male | Female |
| Farming, Fishing & Forestry | 0 (0.0%) | 12 (100.0%) |
| Construction & Extraction | 33 (100.0%) | 0 (0.0%) |
| Installation, Maintenance & Repair | 43 (100.0%) | 0 (0.0%) |
| Total (Category) | 76 (86.4%) | 12 (13.6%) |
| Total (Overall) | 1,060 (56.1%) | 830 (43.9%) |
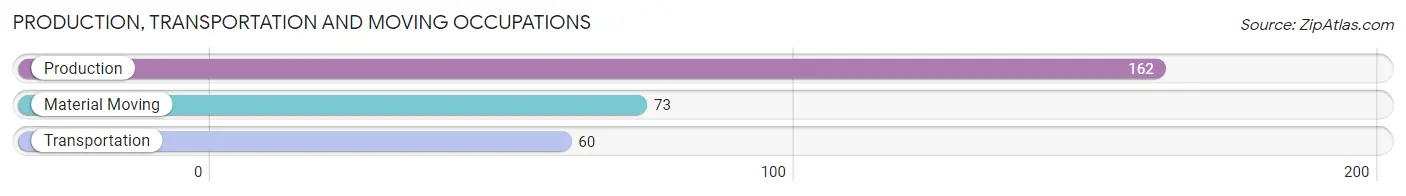
Production, Transportation and Moving Occupations
The most common Production, Transportation and Moving occupations in Sherwood are Production (162 | 8.6%), Material Moving (73 | 3.9%), and Transportation (60 | 3.2%).
Production, Transportation and Moving Occupations by Sex
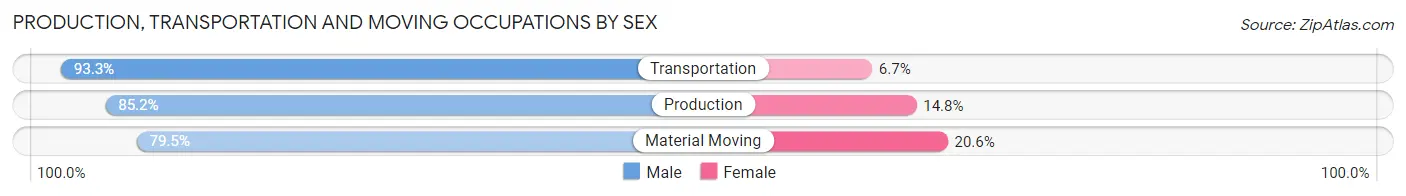
| Occupation | Male | Female |
| Production | 138 (85.2%) | 24 (14.8%) |
| Transportation | 56 (93.3%) | 4 (6.7%) |
| Material Moving | 58 (79.4%) | 15 (20.5%) |
| Total (Category) | 252 (85.4%) | 43 (14.6%) |
| Total (Overall) | 1,060 (56.1%) | 830 (43.9%) |
Employment Industries by Sex in Sherwood
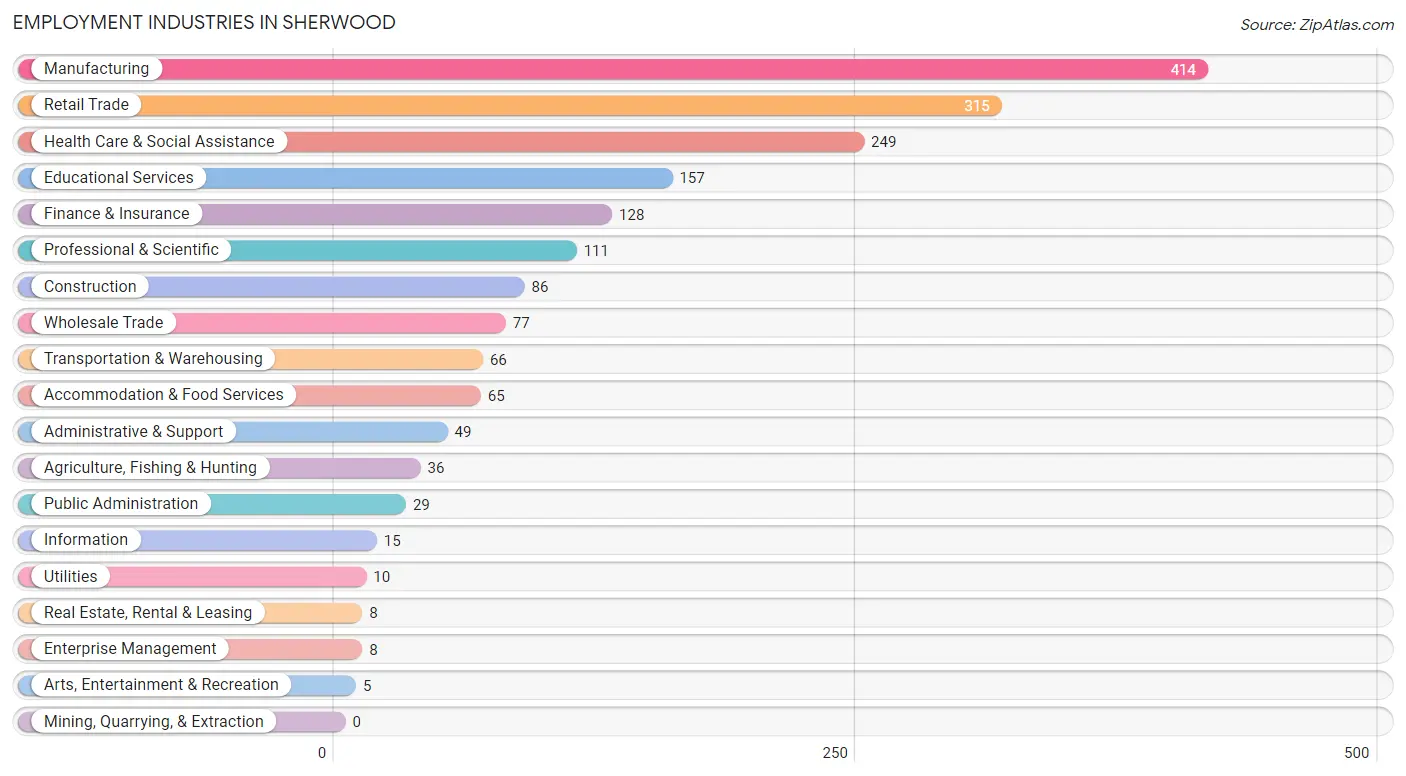
Employment Industries in Sherwood
The major employment industries in Sherwood include Manufacturing (414 | 21.9%), Retail Trade (315 | 16.7%), Health Care & Social Assistance (249 | 13.2%), Educational Services (157 | 8.3%), and Finance & Insurance (128 | 6.8%).
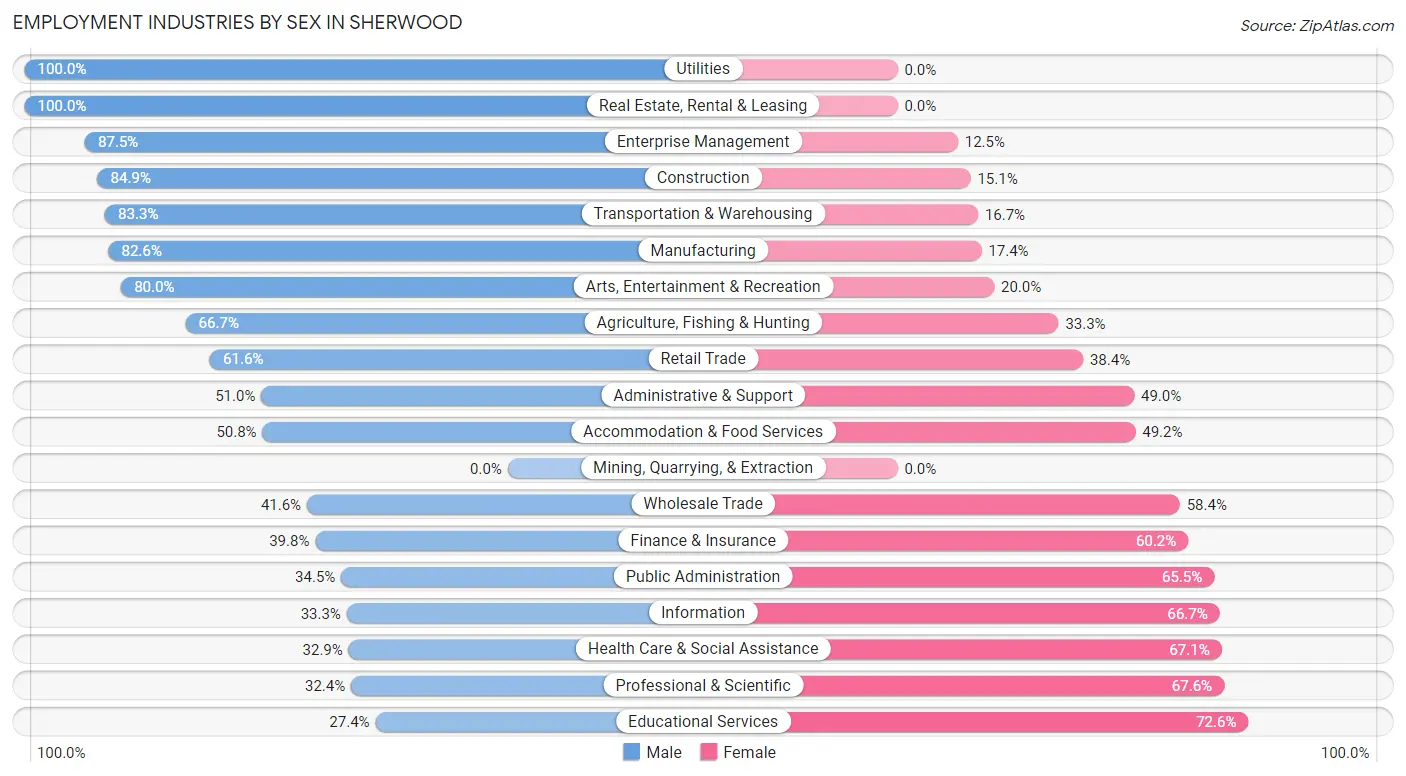
Employment Industries by Sex in Sherwood
The Sherwood industries that see more men than women are Utilities (100.0%), Real Estate, Rental & Leasing (100.0%), and Enterprise Management (87.5%), whereas the industries that tend to have a higher number of women are Educational Services (72.6%), Professional & Scientific (67.6%), and Health Care & Social Assistance (67.1%).
| Industry | Male | Female |
| Agriculture, Fishing & Hunting | 24 (66.7%) | 12 (33.3%) |
| Mining, Quarrying, & Extraction | 0 (0.0%) | 0 (0.0%) |
| Construction | 73 (84.9%) | 13 (15.1%) |
| Manufacturing | 342 (82.6%) | 72 (17.4%) |
| Wholesale Trade | 32 (41.6%) | 45 (58.4%) |
| Retail Trade | 194 (61.6%) | 121 (38.4%) |
| Transportation & Warehousing | 55 (83.3%) | 11 (16.7%) |
| Utilities | 10 (100.0%) | 0 (0.0%) |
| Information | 5 (33.3%) | 10 (66.7%) |
| Finance & Insurance | 51 (39.8%) | 77 (60.2%) |
| Real Estate, Rental & Leasing | 8 (100.0%) | 0 (0.0%) |
| Professional & Scientific | 36 (32.4%) | 75 (67.6%) |
| Enterprise Management | 7 (87.5%) | 1 (12.5%) |
| Administrative & Support | 25 (51.0%) | 24 (49.0%) |
| Educational Services | 43 (27.4%) | 114 (72.6%) |
| Health Care & Social Assistance | 82 (32.9%) | 167 (67.1%) |
| Arts, Entertainment & Recreation | 4 (80.0%) | 1 (20.0%) |
| Accommodation & Food Services | 33 (50.8%) | 32 (49.2%) |
| Public Administration | 10 (34.5%) | 19 (65.5%) |
| Total | 1,060 (56.1%) | 830 (43.9%) |
Education in Sherwood
School Enrollment in Sherwood
The most common levels of schooling among the 742 students in Sherwood are middle school (254 | 34.2%), high school (218 | 29.4%), and kindergarten (78 | 10.5%).
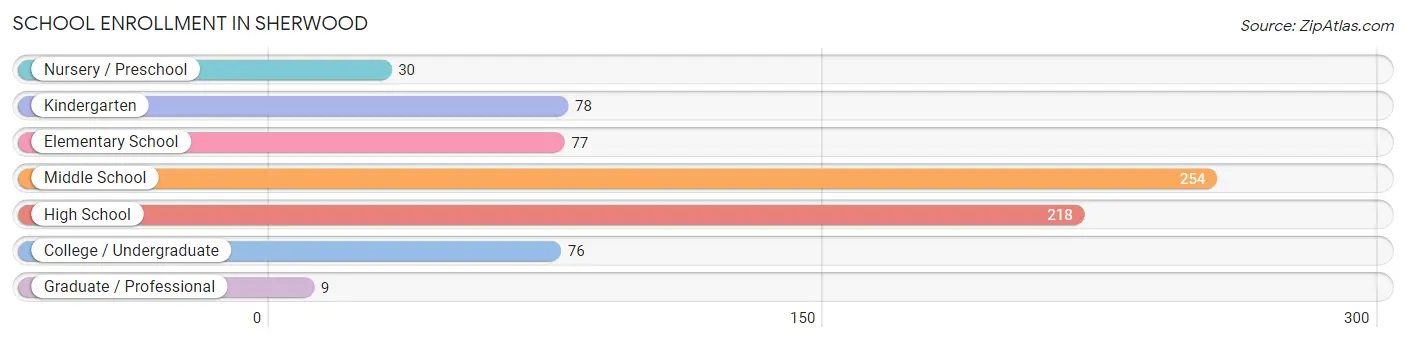
| School Level | # Students | % Students |
| Nursery / Preschool | 30 | 4.0% |
| Kindergarten | 78 | 10.5% |
| Elementary School | 77 | 10.4% |
| Middle School | 254 | 34.2% |
| High School | 218 | 29.4% |
| College / Undergraduate | 76 | 10.2% |
| Graduate / Professional | 9 | 1.2% |
| Total | 742 | 100.0% |
School Enrollment by Age by Funding Source in Sherwood
Out of a total of 742 students who are enrolled in schools in Sherwood, 135 (18.2%) attend a private institution, while the remaining 607 (81.8%) are enrolled in public schools. The age group of 18 to 19 year olds has the highest likelihood of being enrolled in private schools, with 23 (37.7% in the age bracket) enrolled. Conversely, the age group of 20 to 24 year olds has the lowest likelihood of being enrolled in a private school, with 38 (100.0% in the age bracket) attending a public institution.
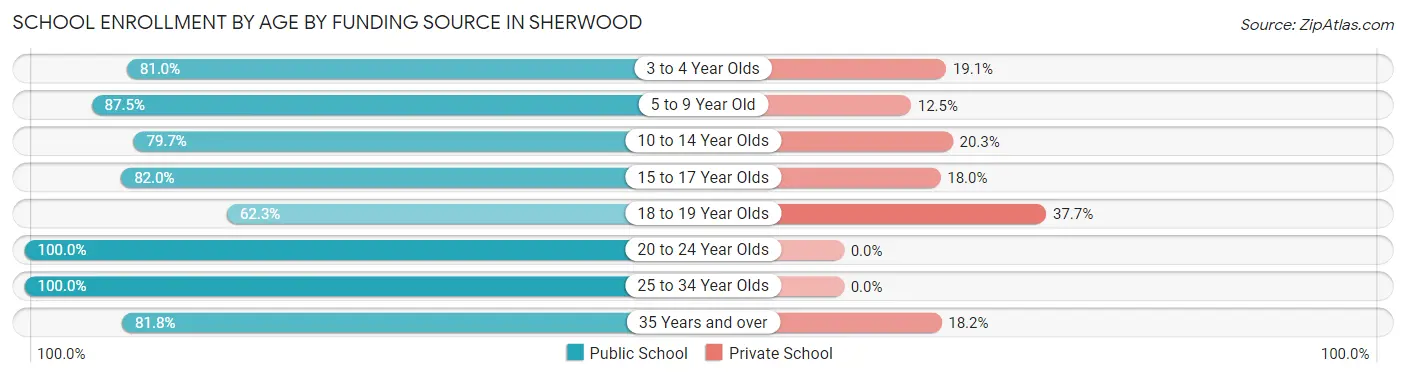
| Age Bracket | Public School | Private School |
| 3 to 4 Year Olds | 17 (80.9%) | 4 (19.1%) |
| 5 to 9 Year Old | 133 (87.5%) | 19 (12.5%) |
| 10 to 14 Year Olds | 228 (79.7%) | 58 (20.3%) |
| 15 to 17 Year Olds | 123 (82.0%) | 27 (18.0%) |
| 18 to 19 Year Olds | 38 (62.3%) | 23 (37.7%) |
| 20 to 24 Year Olds | 38 (100.0%) | 0 (0.0%) |
| 25 to 34 Year Olds | 12 (100.0%) | 0 (0.0%) |
| 35 Years and over | 18 (81.8%) | 4 (18.2%) |
| Total | 607 (81.8%) | 135 (18.2%) |
Educational Attainment by Field of Study in Sherwood
Business (317 | 24.8%), education (240 | 18.8%), science & technology (134 | 10.5%), bio, nature & agricultural (125 | 9.8%), and psychology (85 | 6.7%) are the most common fields of study among 1,276 individuals in Sherwood who have obtained a bachelor's degree or higher.
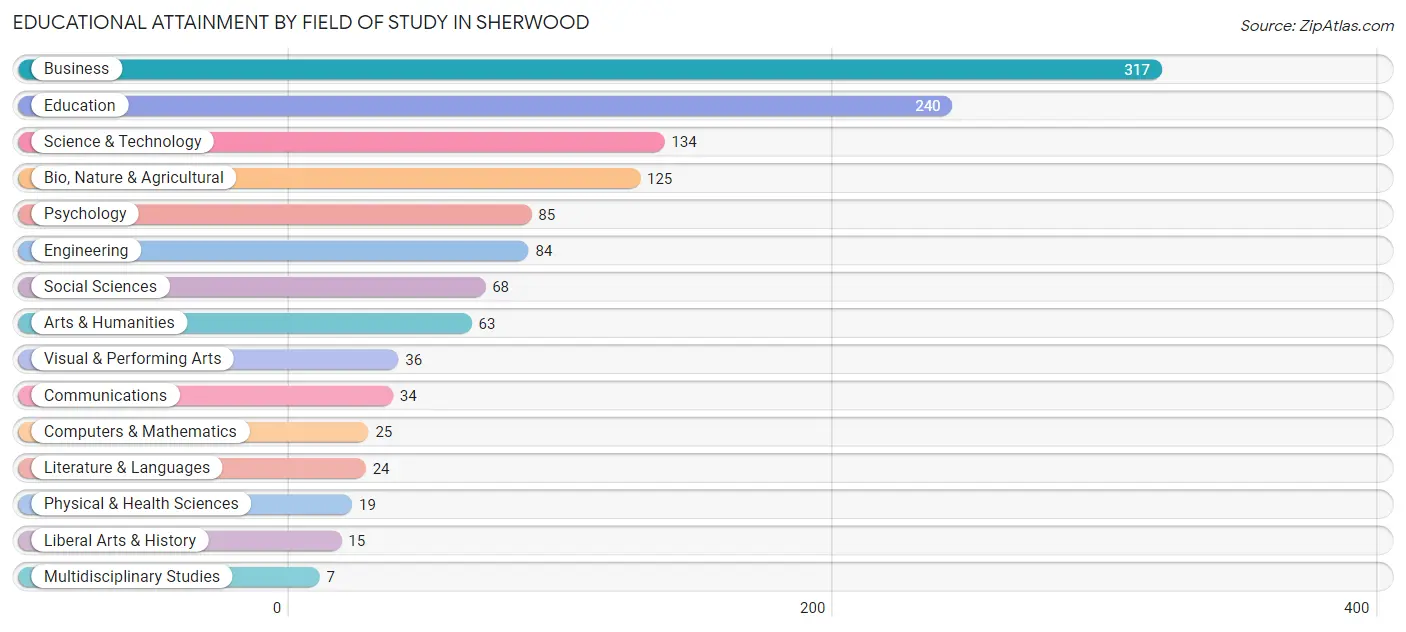
| Field of Study | # Graduates | % Graduates |
| Computers & Mathematics | 25 | 2.0% |
| Bio, Nature & Agricultural | 125 | 9.8% |
| Physical & Health Sciences | 19 | 1.5% |
| Psychology | 85 | 6.7% |
| Social Sciences | 68 | 5.3% |
| Engineering | 84 | 6.6% |
| Multidisciplinary Studies | 7 | 0.5% |
| Science & Technology | 134 | 10.5% |
| Business | 317 | 24.8% |
| Education | 240 | 18.8% |
| Literature & Languages | 24 | 1.9% |
| Liberal Arts & History | 15 | 1.2% |
| Visual & Performing Arts | 36 | 2.8% |
| Communications | 34 | 2.7% |
| Arts & Humanities | 63 | 4.9% |
| Total | 1,276 | 100.0% |
Transportation & Commute in Sherwood
Vehicle Availability by Sex in Sherwood
The most prevalent vehicle ownership categories in Sherwood are males with 3 vehicles (424, accounting for 40.4%) and females with 3 vehicles (309, making up 52.6%).
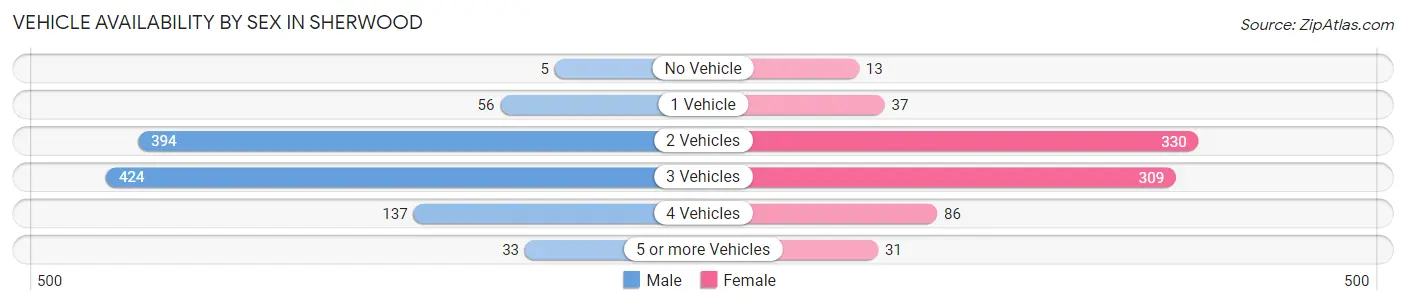
| Vehicles Available | Male | Female |
| No Vehicle | 5 (0.5%) | 13 (1.6%) |
| 1 Vehicle | 56 (5.3%) | 37 (4.6%) |
| 2 Vehicles | 394 (37.6%) | 330 (40.9%) |
| 3 Vehicles | 424 (40.4%) | 309 (38.3%) |
| 4 Vehicles | 137 (13.1%) | 86 (10.7%) |
| 5 or more Vehicles | 33 (3.2%) | 31 (3.8%) |
| Total | 1,049 (100.0%) | 806 (100.0%) |
Commute Time in Sherwood
The most frequently occuring commute durations in Sherwood are 20 to 24 minutes (462 commuters, 29.1%), 30 to 34 minutes (272 commuters, 17.1%), and 15 to 19 minutes (252 commuters, 15.9%).
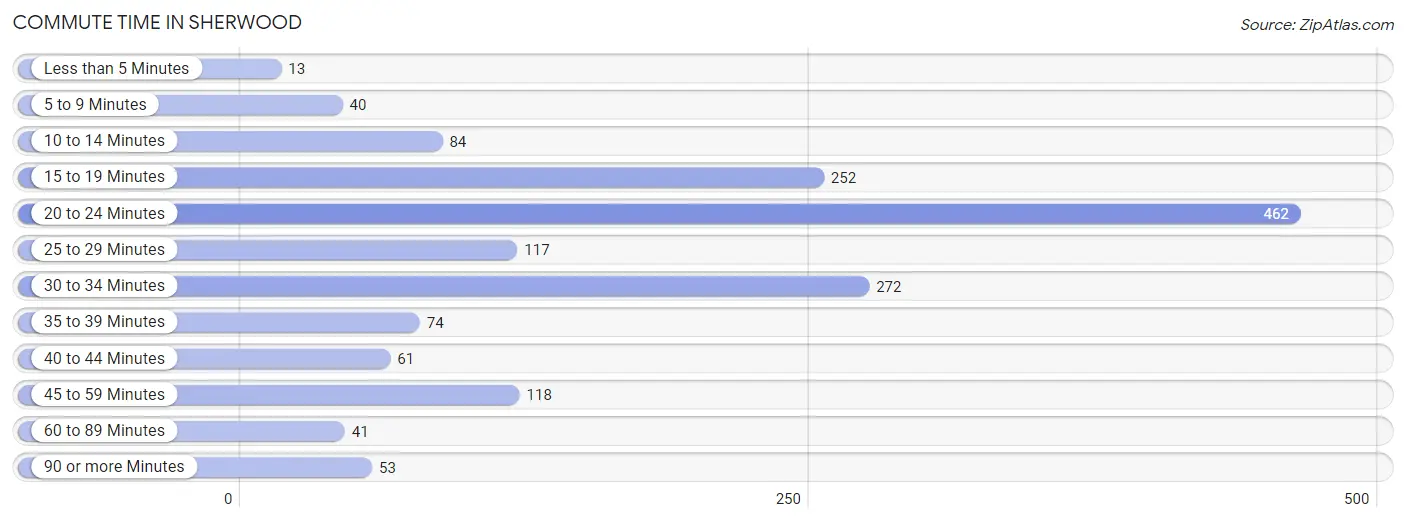
| Commute Time | # Commuters | % Commuters |
| Less than 5 Minutes | 13 | 0.8% |
| 5 to 9 Minutes | 40 | 2.5% |
| 10 to 14 Minutes | 84 | 5.3% |
| 15 to 19 Minutes | 252 | 15.9% |
| 20 to 24 Minutes | 462 | 29.1% |
| 25 to 29 Minutes | 117 | 7.4% |
| 30 to 34 Minutes | 272 | 17.1% |
| 35 to 39 Minutes | 74 | 4.7% |
| 40 to 44 Minutes | 61 | 3.8% |
| 45 to 59 Minutes | 118 | 7.4% |
| 60 to 89 Minutes | 41 | 2.6% |
| 90 or more Minutes | 53 | 3.3% |
Commute Time by Sex in Sherwood
The most common commute times in Sherwood are 20 to 24 minutes (310 commuters, 32.2%) for males and 20 to 24 minutes (152 commuters, 24.4%) for females.

| Commute Time | Male | Female |
| Less than 5 Minutes | 13 (1.3%) | 0 (0.0%) |
| 5 to 9 Minutes | 31 (3.2%) | 9 (1.4%) |
| 10 to 14 Minutes | 31 (3.2%) | 53 (8.5%) |
| 15 to 19 Minutes | 129 (13.4%) | 123 (19.7%) |
| 20 to 24 Minutes | 310 (32.2%) | 152 (24.4%) |
| 25 to 29 Minutes | 70 (7.3%) | 47 (7.5%) |
| 30 to 34 Minutes | 161 (16.7%) | 111 (17.8%) |
| 35 to 39 Minutes | 46 (4.8%) | 28 (4.5%) |
| 40 to 44 Minutes | 45 (4.7%) | 16 (2.6%) |
| 45 to 59 Minutes | 75 (7.8%) | 43 (6.9%) |
| 60 to 89 Minutes | 23 (2.4%) | 18 (2.9%) |
| 90 or more Minutes | 29 (3.0%) | 24 (3.8%) |
Time of Departure to Work by Sex in Sherwood
The most frequent times of departure to work in Sherwood are 6:30 AM to 6:59 AM (192, 19.9%) for males and 7:00 AM to 7:29 AM (197, 31.6%) for females.
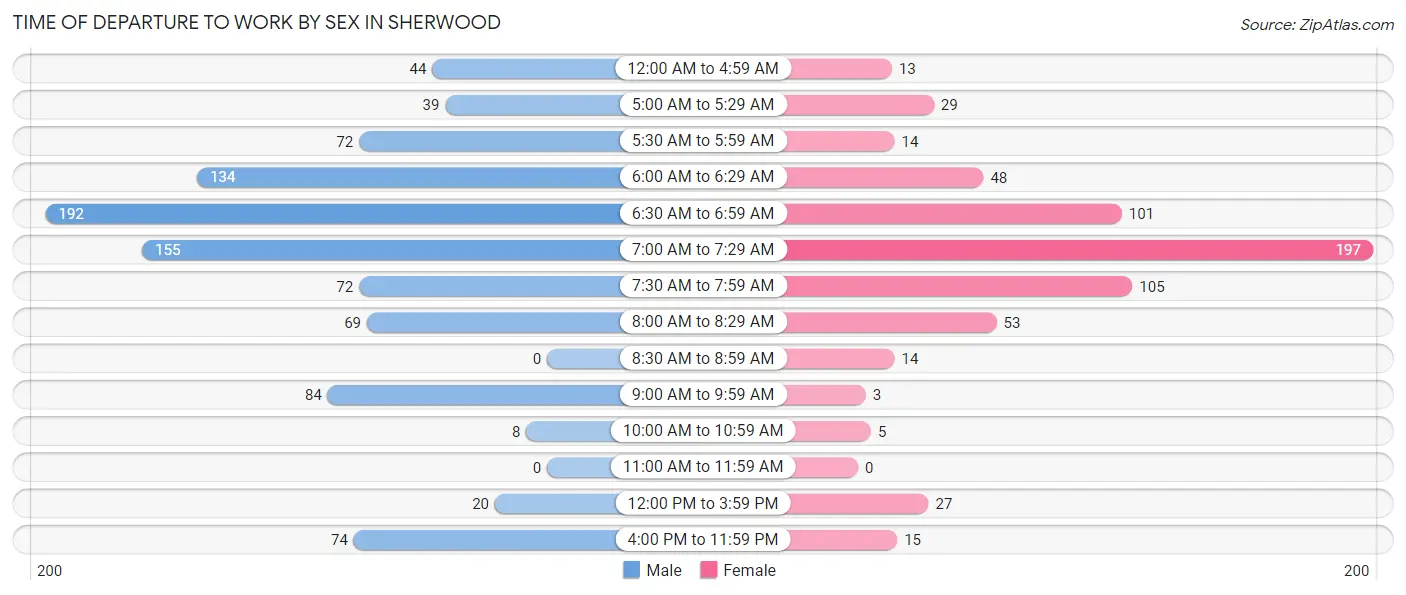
| Time of Departure | Male | Female |
| 12:00 AM to 4:59 AM | 44 (4.6%) | 13 (2.1%) |
| 5:00 AM to 5:29 AM | 39 (4.1%) | 29 (4.6%) |
| 5:30 AM to 5:59 AM | 72 (7.5%) | 14 (2.2%) |
| 6:00 AM to 6:29 AM | 134 (13.9%) | 48 (7.7%) |
| 6:30 AM to 6:59 AM | 192 (19.9%) | 101 (16.2%) |
| 7:00 AM to 7:29 AM | 155 (16.1%) | 197 (31.6%) |
| 7:30 AM to 7:59 AM | 72 (7.5%) | 105 (16.8%) |
| 8:00 AM to 8:29 AM | 69 (7.2%) | 53 (8.5%) |
| 8:30 AM to 8:59 AM | 0 (0.0%) | 14 (2.2%) |
| 9:00 AM to 9:59 AM | 84 (8.7%) | 3 (0.5%) |
| 10:00 AM to 10:59 AM | 8 (0.8%) | 5 (0.8%) |
| 11:00 AM to 11:59 AM | 0 (0.0%) | 0 (0.0%) |
| 12:00 PM to 3:59 PM | 20 (2.1%) | 27 (4.3%) |
| 4:00 PM to 11:59 PM | 74 (7.7%) | 15 (2.4%) |
| Total | 963 (100.0%) | 624 (100.0%) |
Housing Occupancy in Sherwood
Occupancy by Ownership in Sherwood
Of the total 1,205 dwellings in Sherwood, owner-occupied units account for 1,160 (96.3%), while renter-occupied units make up 45 (3.7%).
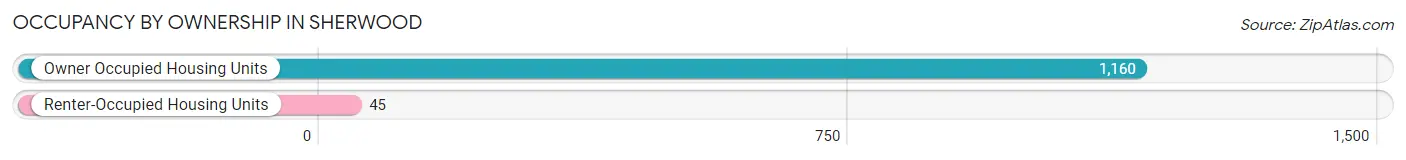
| Occupancy | # Housing Units | % Housing Units |
| Owner Occupied Housing Units | 1,160 | 96.3% |
| Renter-Occupied Housing Units | 45 | 3.7% |
| Total Occupied Housing Units | 1,205 | 100.0% |
Occupancy by Household Size in Sherwood
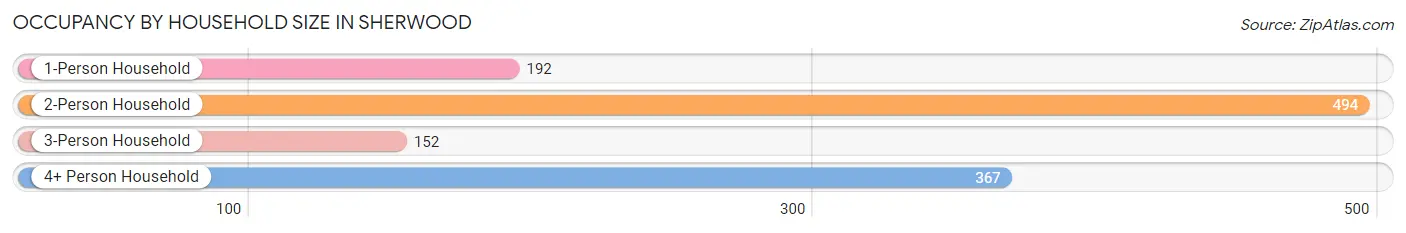
| Household Size | # Housing Units | % Housing Units |
| 1-Person Household | 192 | 15.9% |
| 2-Person Household | 494 | 41.0% |
| 3-Person Household | 152 | 12.6% |
| 4+ Person Household | 367 | 30.5% |
| Total Housing Units | 1,205 | 100.0% |
Occupancy by Ownership by Household Size in Sherwood
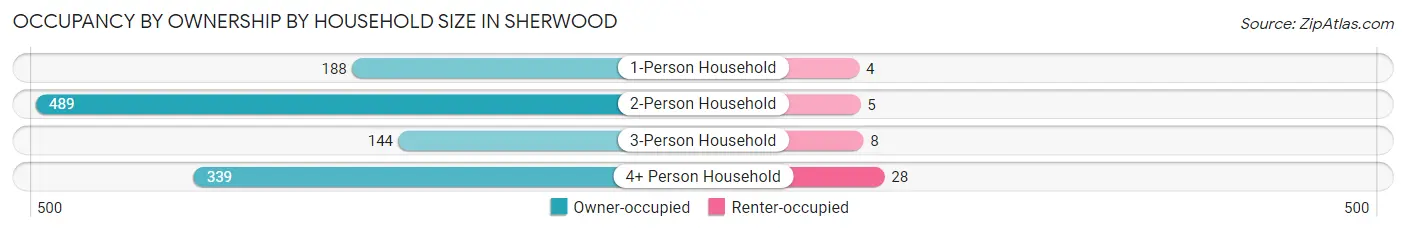
| Household Size | Owner-occupied | Renter-occupied |
| 1-Person Household | 188 (97.9%) | 4 (2.1%) |
| 2-Person Household | 489 (99.0%) | 5 (1.0%) |
| 3-Person Household | 144 (94.7%) | 8 (5.3%) |
| 4+ Person Household | 339 (92.4%) | 28 (7.6%) |
| Total Housing Units | 1,160 (96.3%) | 45 (3.7%) |
Occupancy by Educational Attainment in Sherwood
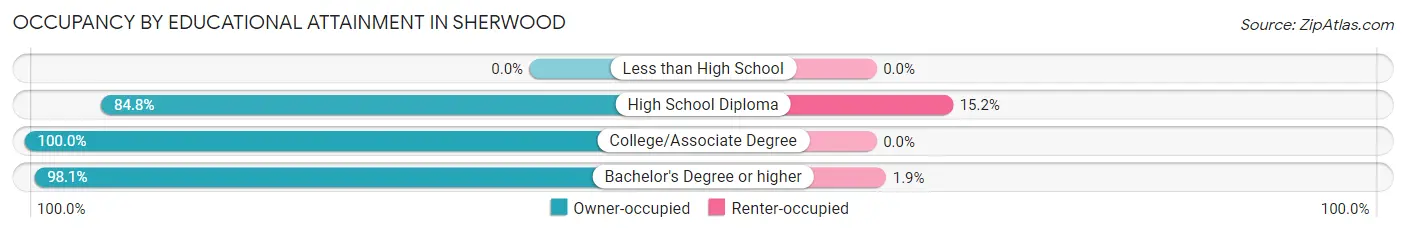
| Household Size | Owner-occupied | Renter-occupied |
| Less than High School | 0 (0.0%) | 0 (0.0%) |
| High School Diploma | 179 (84.8%) | 32 (15.2%) |
| College/Associate Degree | 312 (100.0%) | 0 (0.0%) |
| Bachelor's Degree or higher | 669 (98.1%) | 13 (1.9%) |
Occupancy by Age of Householder in Sherwood
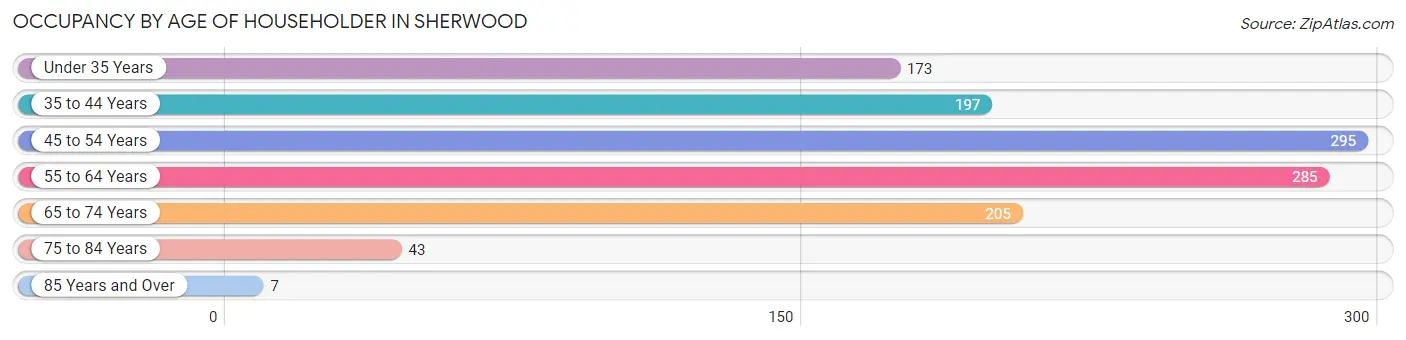
| Age Bracket | # Households | % Households |
| Under 35 Years | 173 | 14.4% |
| 35 to 44 Years | 197 | 16.4% |
| 45 to 54 Years | 295 | 24.5% |
| 55 to 64 Years | 285 | 23.6% |
| 65 to 74 Years | 205 | 17.0% |
| 75 to 84 Years | 43 | 3.6% |
| 85 Years and Over | 7 | 0.6% |
| Total | 1,205 | 100.0% |
Housing Finances in Sherwood
Median Income by Occupancy in Sherwood
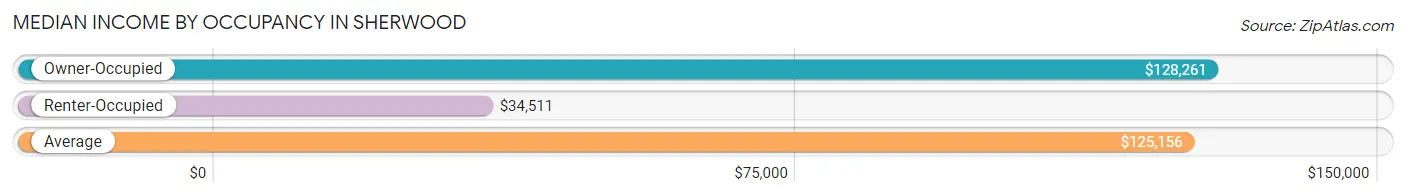
| Occupancy Type | # Households | Median Income |
| Owner-Occupied | 1,160 (96.3%) | $128,261 |
| Renter-Occupied | 45 (3.7%) | $34,511 |
| Average | 1,205 (100.0%) | $125,156 |
Occupancy by Householder Income Bracket in Sherwood
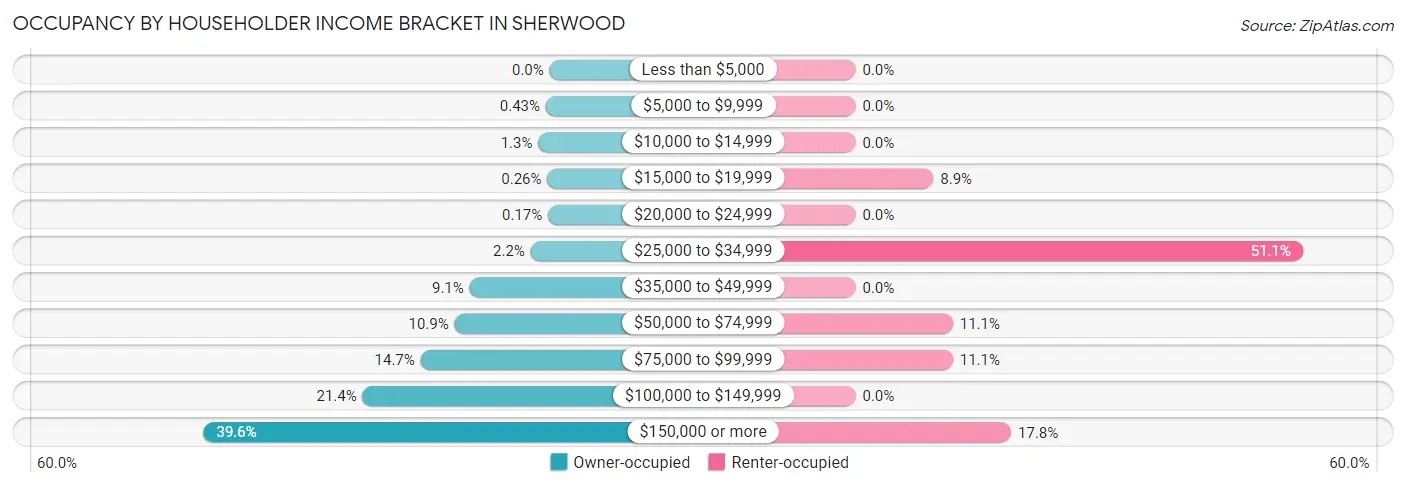
| Income Bracket | Owner-occupied | Renter-occupied |
| Less than $5,000 | 0 (0.0%) | 0 (0.0%) |
| $5,000 to $9,999 | 5 (0.4%) | 0 (0.0%) |
| $10,000 to $14,999 | 15 (1.3%) | 0 (0.0%) |
| $15,000 to $19,999 | 3 (0.3%) | 4 (8.9%) |
| $20,000 to $24,999 | 2 (0.2%) | 0 (0.0%) |
| $25,000 to $34,999 | 25 (2.2%) | 23 (51.1%) |
| $35,000 to $49,999 | 106 (9.1%) | 0 (0.0%) |
| $50,000 to $74,999 | 126 (10.9%) | 5 (11.1%) |
| $75,000 to $99,999 | 171 (14.7%) | 5 (11.1%) |
| $100,000 to $149,999 | 248 (21.4%) | 0 (0.0%) |
| $150,000 or more | 459 (39.6%) | 8 (17.8%) |
| Total | 1,160 (100.0%) | 45 (100.0%) |
Monthly Housing Cost Tiers in Sherwood
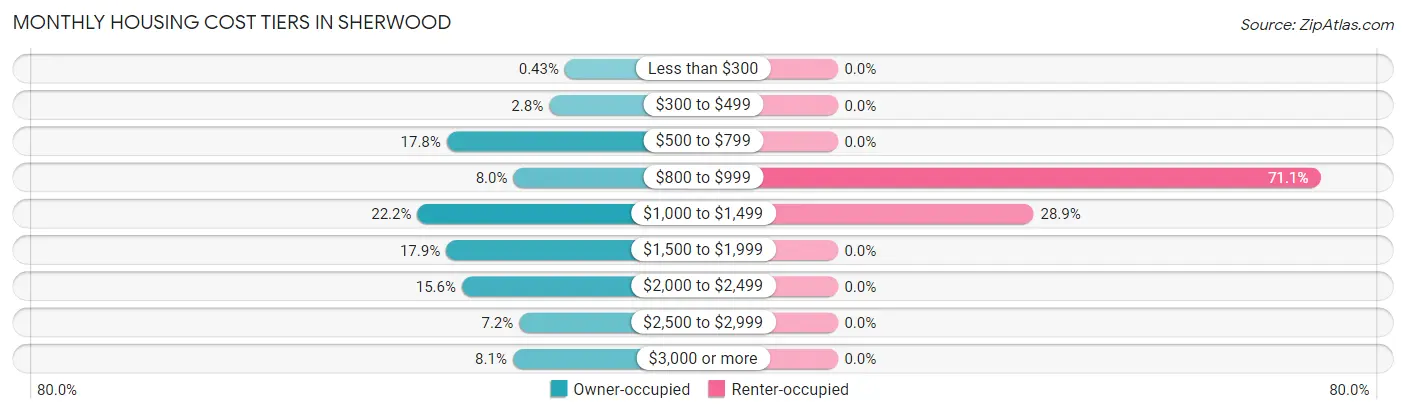
| Monthly Cost | Owner-occupied | Renter-occupied |
| Less than $300 | 5 (0.4%) | 0 (0.0%) |
| $300 to $499 | 32 (2.8%) | 0 (0.0%) |
| $500 to $799 | 207 (17.8%) | 0 (0.0%) |
| $800 to $999 | 93 (8.0%) | 32 (71.1%) |
| $1,000 to $1,499 | 257 (22.2%) | 13 (28.9%) |
| $1,500 to $1,999 | 208 (17.9%) | 0 (0.0%) |
| $2,000 to $2,499 | 181 (15.6%) | 0 (0.0%) |
| $2,500 to $2,999 | 83 (7.2%) | 0 (0.0%) |
| $3,000 or more | 94 (8.1%) | 0 (0.0%) |
| Total | 1,160 (100.0%) | 45 (100.0%) |
Physical Housing Characteristics in Sherwood
Housing Structures in Sherwood
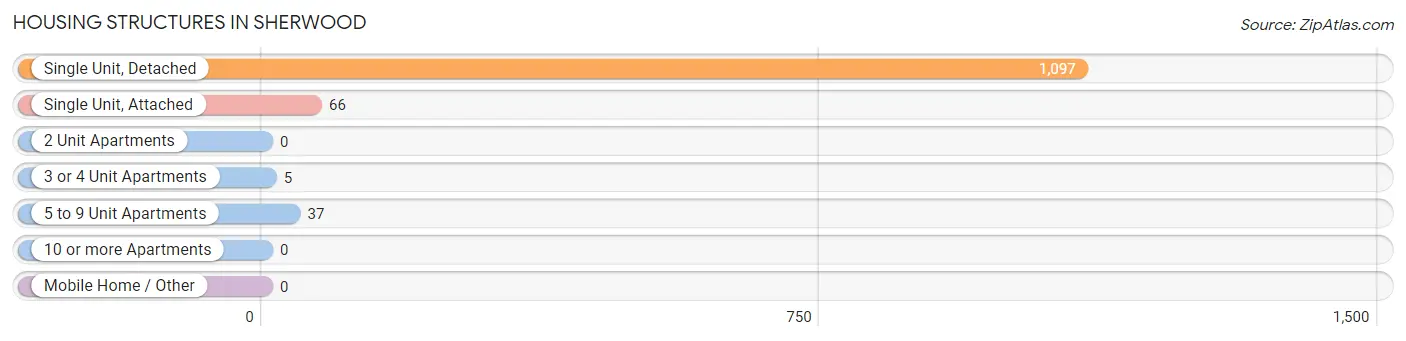
| Structure Type | # Housing Units | % Housing Units |
| Single Unit, Detached | 1,097 | 91.0% |
| Single Unit, Attached | 66 | 5.5% |
| 2 Unit Apartments | 0 | 0.0% |
| 3 or 4 Unit Apartments | 5 | 0.4% |
| 5 to 9 Unit Apartments | 37 | 3.1% |
| 10 or more Apartments | 0 | 0.0% |
| Mobile Home / Other | 0 | 0.0% |
| Total | 1,205 | 100.0% |
Housing Structures by Occupancy in Sherwood
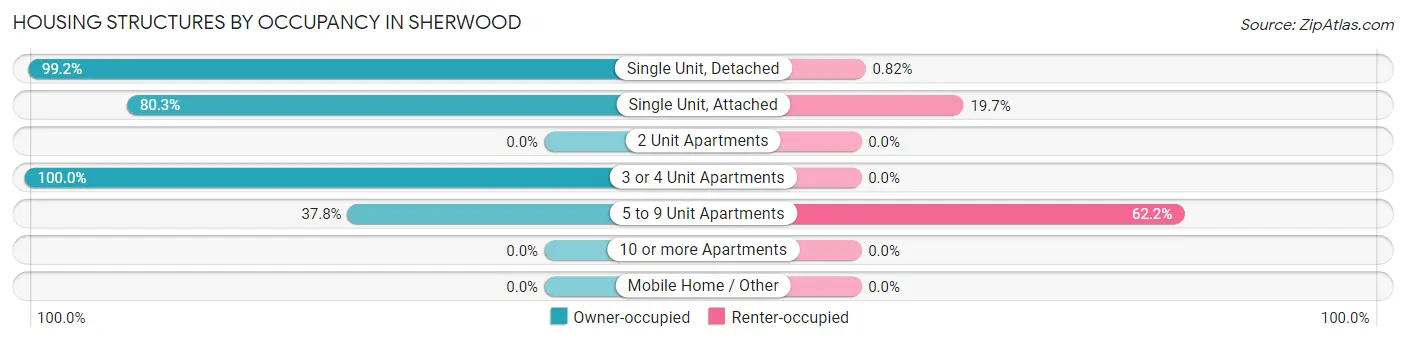
| Structure Type | Owner-occupied | Renter-occupied |
| Single Unit, Detached | 1,088 (99.2%) | 9 (0.8%) |
| Single Unit, Attached | 53 (80.3%) | 13 (19.7%) |
| 2 Unit Apartments | 0 (0.0%) | 0 (0.0%) |
| 3 or 4 Unit Apartments | 5 (100.0%) | 0 (0.0%) |
| 5 to 9 Unit Apartments | 14 (37.8%) | 23 (62.2%) |
| 10 or more Apartments | 0 (0.0%) | 0 (0.0%) |
| Mobile Home / Other | 0 (0.0%) | 0 (0.0%) |
| Total | 1,160 (96.3%) | 45 (3.7%) |
Housing Structures by Number of Rooms in Sherwood
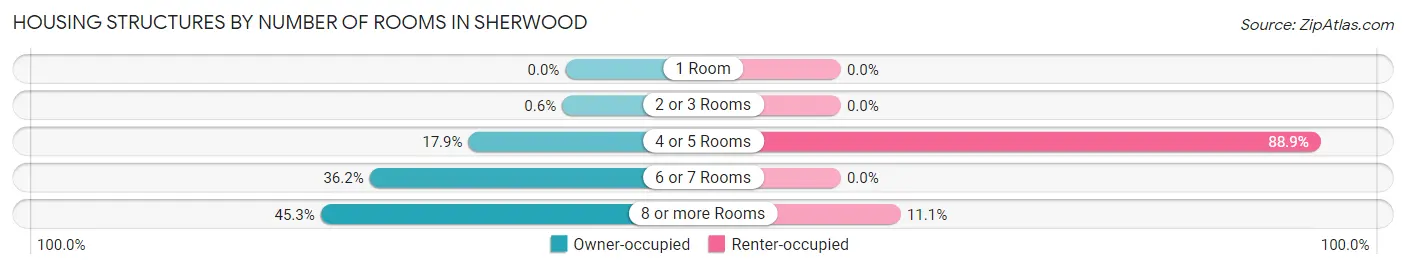
| Number of Rooms | Owner-occupied | Renter-occupied |
| 1 Room | 0 (0.0%) | 0 (0.0%) |
| 2 or 3 Rooms | 7 (0.6%) | 0 (0.0%) |
| 4 or 5 Rooms | 208 (17.9%) | 40 (88.9%) |
| 6 or 7 Rooms | 420 (36.2%) | 0 (0.0%) |
| 8 or more Rooms | 525 (45.3%) | 5 (11.1%) |
| Total | 1,160 (100.0%) | 45 (100.0%) |
Housing Structure by Heating Type in Sherwood
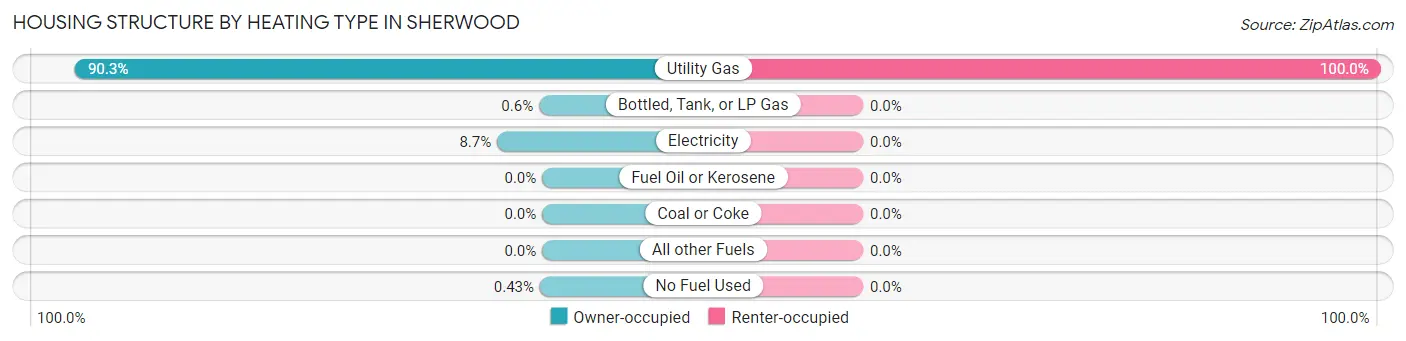
| Heating Type | Owner-occupied | Renter-occupied |
| Utility Gas | 1,047 (90.3%) | 45 (100.0%) |
| Bottled, Tank, or LP Gas | 7 (0.6%) | 0 (0.0%) |
| Electricity | 101 (8.7%) | 0 (0.0%) |
| Fuel Oil or Kerosene | 0 (0.0%) | 0 (0.0%) |
| Coal or Coke | 0 (0.0%) | 0 (0.0%) |
| All other Fuels | 0 (0.0%) | 0 (0.0%) |
| No Fuel Used | 5 (0.4%) | 0 (0.0%) |
| Total | 1,160 (100.0%) | 45 (100.0%) |
Household Vehicle Usage in Sherwood
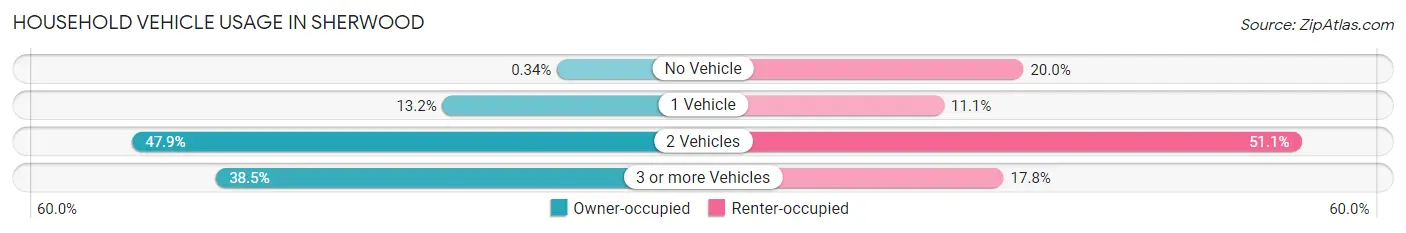
| Vehicles per Household | Owner-occupied | Renter-occupied |
| No Vehicle | 4 (0.3%) | 9 (20.0%) |
| 1 Vehicle | 153 (13.2%) | 5 (11.1%) |
| 2 Vehicles | 556 (47.9%) | 23 (51.1%) |
| 3 or more Vehicles | 447 (38.5%) | 8 (17.8%) |
| Total | 1,160 (100.0%) | 45 (100.0%) |
Real Estate & Mortgages in Sherwood
Real Estate and Mortgage Overview in Sherwood
| Characteristic | Without Mortgage | With Mortgage |
| Housing Units | 381 | 779 |
| Median Property Value | $305,000 | $309,500 |
| Median Household Income | $87,583 | $369 |
| Monthly Housing Costs | $748 | $94 |
| Real Estate Taxes | $4,545 | $0 |
Property Value by Mortgage Status in Sherwood
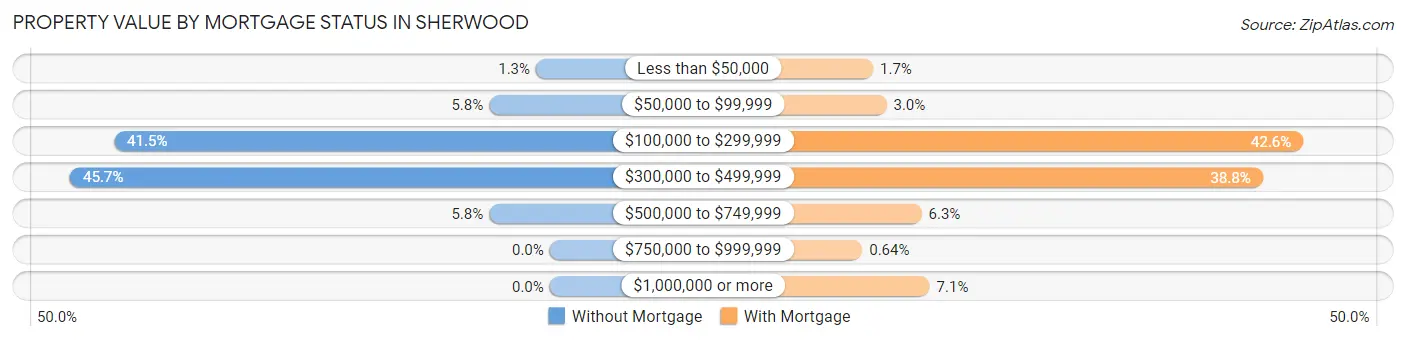
| Property Value | Without Mortgage | With Mortgage |
| Less than $50,000 | 5 (1.3%) | 13 (1.7%) |
| $50,000 to $99,999 | 22 (5.8%) | 23 (2.9%) |
| $100,000 to $299,999 | 158 (41.5%) | 332 (42.6%) |
| $300,000 to $499,999 | 174 (45.7%) | 302 (38.8%) |
| $500,000 to $749,999 | 22 (5.8%) | 49 (6.3%) |
| $750,000 to $999,999 | 0 (0.0%) | 5 (0.6%) |
| $1,000,000 or more | 0 (0.0%) | 55 (7.1%) |
| Total | 381 (100.0%) | 779 (100.0%) |
Household Income by Mortgage Status in Sherwood
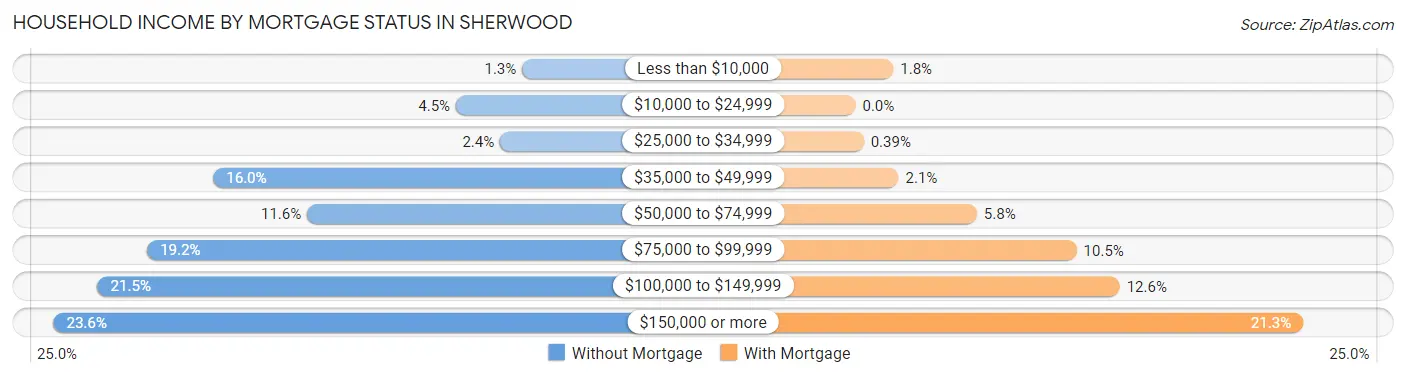
| Household Income | Without Mortgage | With Mortgage |
| Less than $10,000 | 5 (1.3%) | 14 (1.8%) |
| $10,000 to $24,999 | 17 (4.5%) | 0 (0.0%) |
| $25,000 to $34,999 | 9 (2.4%) | 3 (0.4%) |
| $35,000 to $49,999 | 61 (16.0%) | 16 (2.1%) |
| $50,000 to $74,999 | 44 (11.6%) | 45 (5.8%) |
| $75,000 to $99,999 | 73 (19.2%) | 82 (10.5%) |
| $100,000 to $149,999 | 82 (21.5%) | 98 (12.6%) |
| $150,000 or more | 90 (23.6%) | 166 (21.3%) |
| Total | 381 (100.0%) | 779 (100.0%) |
Property Value to Household Income Ratio in Sherwood
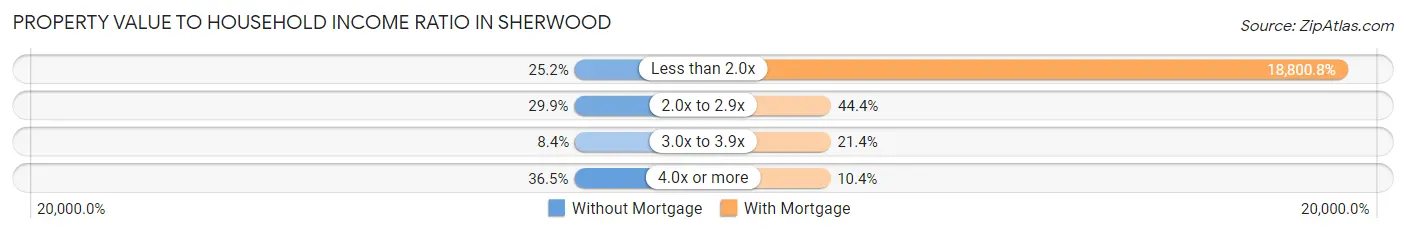
| Value-to-Income Ratio | Without Mortgage | With Mortgage |
| Less than 2.0x | 96 (25.2%) | 146,458 (18,800.8%) |
| 2.0x to 2.9x | 114 (29.9%) | 346 (44.4%) |
| 3.0x to 3.9x | 32 (8.4%) | 167 (21.4%) |
| 4.0x or more | 139 (36.5%) | 81 (10.4%) |
| Total | 381 (100.0%) | 779 (100.0%) |
Real Estate Taxes by Mortgage Status in Sherwood
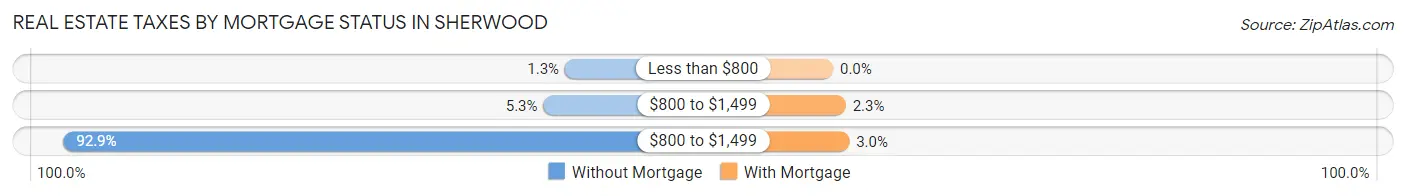
| Property Taxes | Without Mortgage | With Mortgage |
| Less than $800 | 5 (1.3%) | 0 (0.0%) |
| $800 to $1,499 | 20 (5.2%) | 18 (2.3%) |
| $800 to $1,499 | 354 (92.9%) | 23 (2.9%) |
| Total | 381 (100.0%) | 779 (100.0%) |
Health & Disability in Sherwood
Health Insurance Coverage by Age in Sherwood
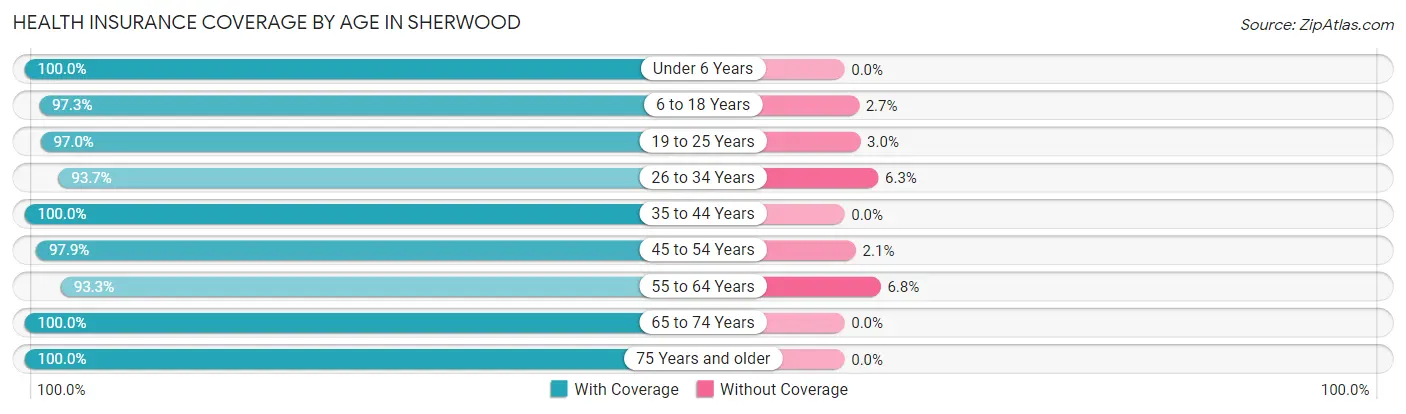
| Age Bracket | With Coverage | Without Coverage |
| Under 6 Years | 175 (100.0%) | 0 (0.0%) |
| 6 to 18 Years | 616 (97.3%) | 17 (2.7%) |
| 19 to 25 Years | 197 (97.0%) | 6 (3.0%) |
| 26 to 34 Years | 253 (93.7%) | 17 (6.3%) |
| 35 to 44 Years | 372 (100.0%) | 0 (0.0%) |
| 45 to 54 Years | 554 (97.9%) | 12 (2.1%) |
| 55 to 64 Years | 497 (93.2%) | 36 (6.8%) |
| 65 to 74 Years | 352 (100.0%) | 0 (0.0%) |
| 75 Years and older | 120 (100.0%) | 0 (0.0%) |
| Total | 3,136 (97.3%) | 88 (2.7%) |
Health Insurance Coverage by Citizenship Status in Sherwood
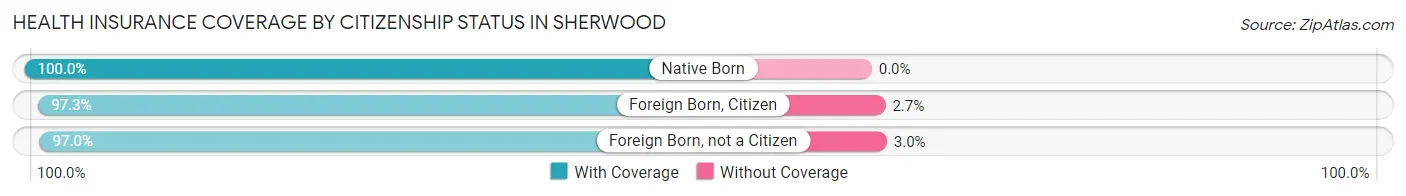
| Citizenship Status | With Coverage | Without Coverage |
| Native Born | 175 (100.0%) | 0 (0.0%) |
| Foreign Born, Citizen | 616 (97.3%) | 17 (2.7%) |
| Foreign Born, not a Citizen | 197 (97.0%) | 6 (3.0%) |
Health Insurance Coverage by Household Income in Sherwood
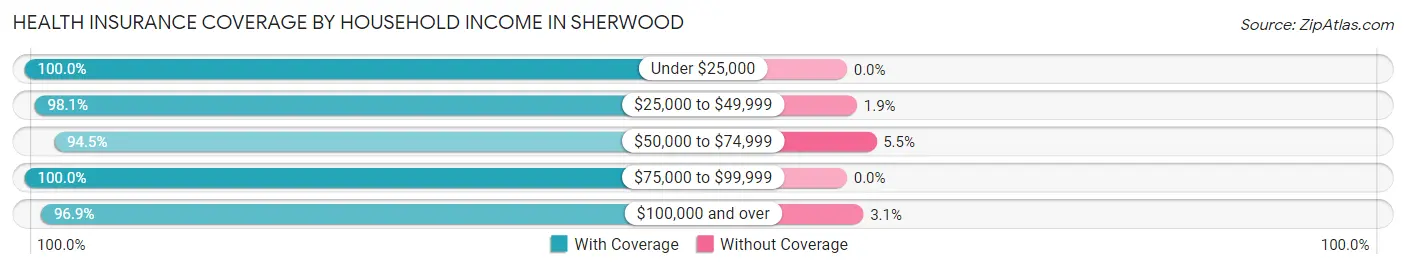
| Household Income | With Coverage | Without Coverage |
| Under $25,000 | 38 (100.0%) | 0 (0.0%) |
| $25,000 to $49,999 | 313 (98.1%) | 6 (1.9%) |
| $50,000 to $74,999 | 223 (94.5%) | 13 (5.5%) |
| $75,000 to $99,999 | 394 (100.0%) | 0 (0.0%) |
| $100,000 and over | 2,168 (96.9%) | 69 (3.1%) |
Public vs Private Health Insurance Coverage by Age in Sherwood
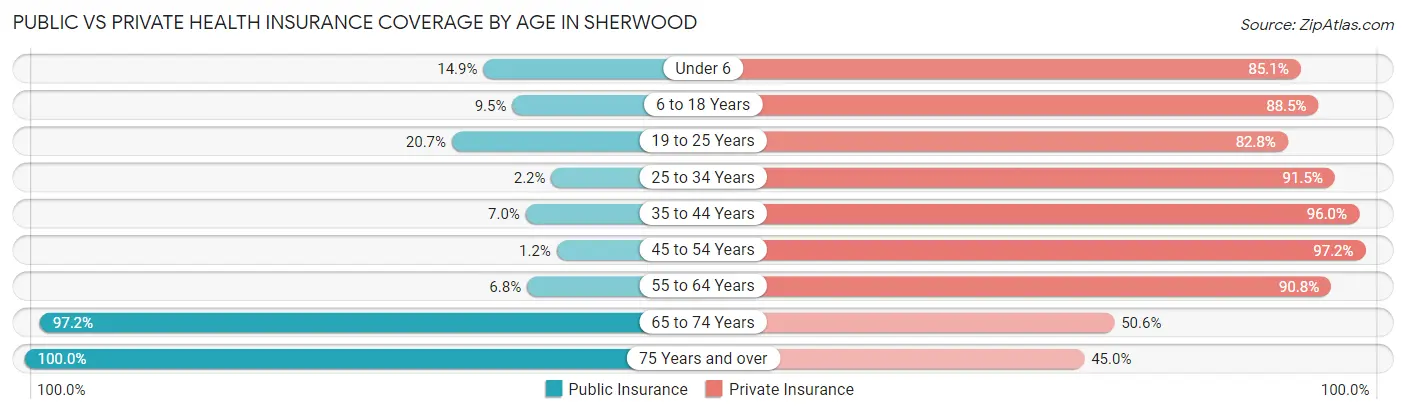
| Age Bracket | Public Insurance | Private Insurance |
| Under 6 | 26 (14.9%) | 149 (85.1%) |
| 6 to 18 Years | 60 (9.5%) | 560 (88.5%) |
| 19 to 25 Years | 42 (20.7%) | 168 (82.8%) |
| 25 to 34 Years | 6 (2.2%) | 247 (91.5%) |
| 35 to 44 Years | 26 (7.0%) | 357 (96.0%) |
| 45 to 54 Years | 7 (1.2%) | 550 (97.2%) |
| 55 to 64 Years | 36 (6.8%) | 484 (90.8%) |
| 65 to 74 Years | 342 (97.2%) | 178 (50.6%) |
| 75 Years and over | 120 (100.0%) | 54 (45.0%) |
| Total | 665 (20.6%) | 2,747 (85.2%) |
Disability Status by Sex by Age in Sherwood
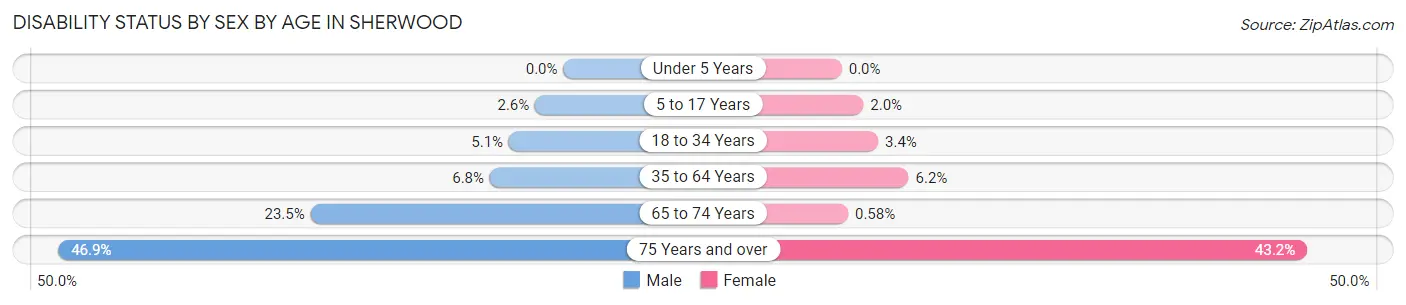
| Age Bracket | Male | Female |
| Under 5 Years | 0 (0.0%) | 0 (0.0%) |
| 5 to 17 Years | 9 (2.6%) | 5 (2.0%) |
| 18 to 34 Years | 14 (5.1%) | 9 (3.4%) |
| 35 to 64 Years | 53 (6.8%) | 43 (6.2%) |
| 65 to 74 Years | 42 (23.5%) | 1 (0.6%) |
| 75 Years and over | 15 (46.9%) | 38 (43.2%) |
Disability Class by Sex by Age in Sherwood
Disability Class: Hearing Difficulty
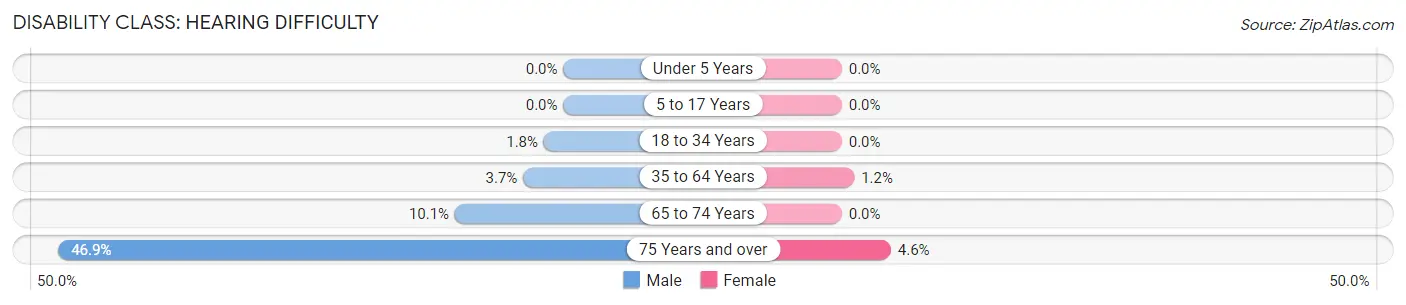
| Age Bracket | Male | Female |
| Under 5 Years | 0 (0.0%) | 0 (0.0%) |
| 5 to 17 Years | 0 (0.0%) | 0 (0.0%) |
| 18 to 34 Years | 5 (1.8%) | 0 (0.0%) |
| 35 to 64 Years | 29 (3.7%) | 8 (1.1%) |
| 65 to 74 Years | 18 (10.1%) | 0 (0.0%) |
| 75 Years and over | 15 (46.9%) | 4 (4.5%) |
Disability Class: Vision Difficulty
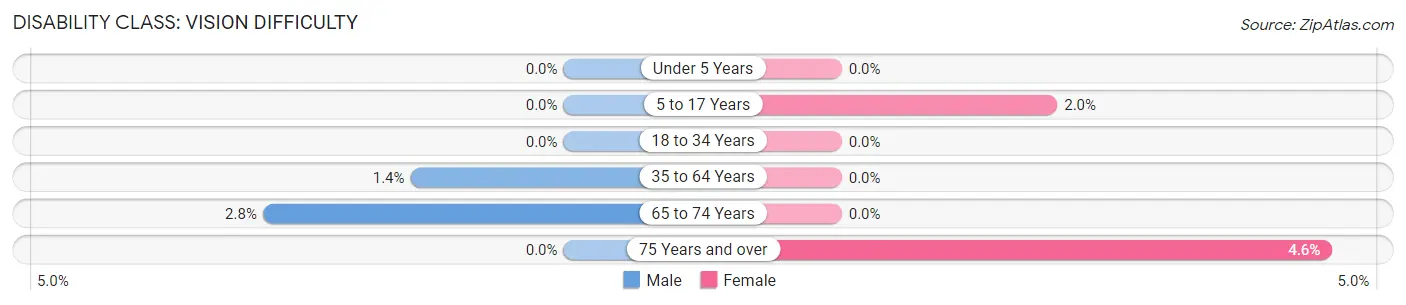
| Age Bracket | Male | Female |
| Under 5 Years | 0 (0.0%) | 0 (0.0%) |
| 5 to 17 Years | 0 (0.0%) | 5 (2.0%) |
| 18 to 34 Years | 0 (0.0%) | 0 (0.0%) |
| 35 to 64 Years | 11 (1.4%) | 0 (0.0%) |
| 65 to 74 Years | 5 (2.8%) | 0 (0.0%) |
| 75 Years and over | 0 (0.0%) | 4 (4.5%) |
Disability Class: Cognitive Difficulty
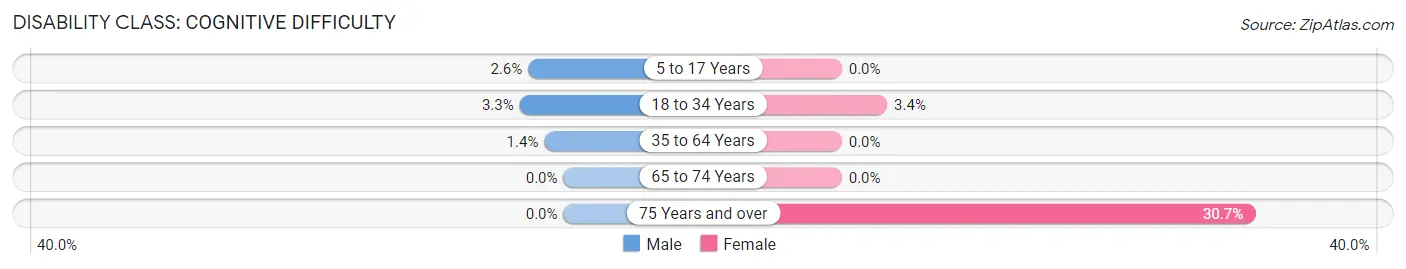
| Age Bracket | Male | Female |
| 5 to 17 Years | 9 (2.6%) | 0 (0.0%) |
| 18 to 34 Years | 9 (3.3%) | 9 (3.4%) |
| 35 to 64 Years | 11 (1.4%) | 0 (0.0%) |
| 65 to 74 Years | 0 (0.0%) | 0 (0.0%) |
| 75 Years and over | 0 (0.0%) | 27 (30.7%) |
Disability Class: Ambulatory Difficulty
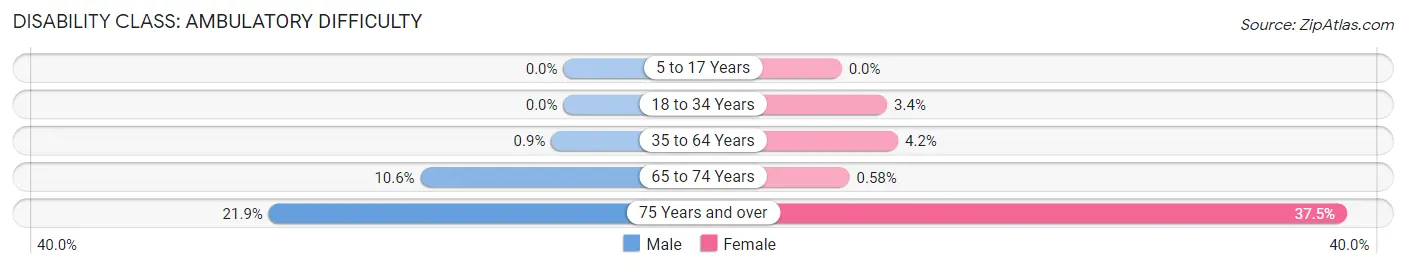
| Age Bracket | Male | Female |
| 5 to 17 Years | 0 (0.0%) | 0 (0.0%) |
| 18 to 34 Years | 0 (0.0%) | 9 (3.4%) |
| 35 to 64 Years | 7 (0.9%) | 29 (4.2%) |
| 65 to 74 Years | 19 (10.6%) | 1 (0.6%) |
| 75 Years and over | 7 (21.9%) | 33 (37.5%) |
Disability Class: Self-Care Difficulty
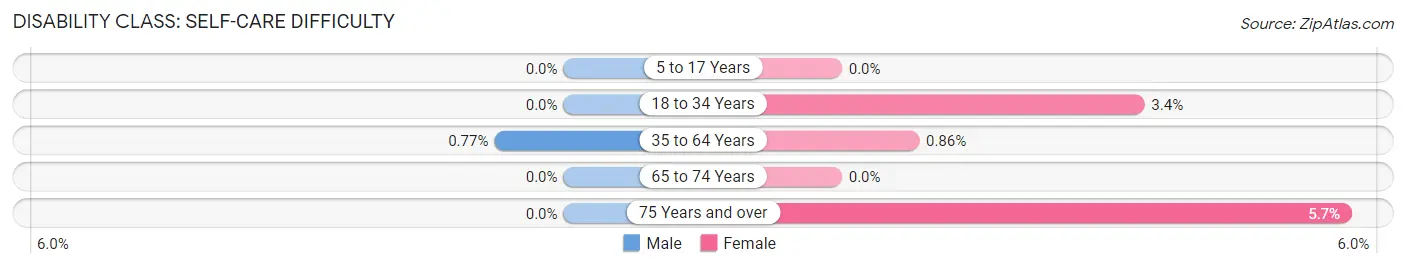
| Age Bracket | Male | Female |
| 5 to 17 Years | 0 (0.0%) | 0 (0.0%) |
| 18 to 34 Years | 0 (0.0%) | 9 (3.4%) |
| 35 to 64 Years | 6 (0.8%) | 6 (0.9%) |
| 65 to 74 Years | 0 (0.0%) | 0 (0.0%) |
| 75 Years and over | 0 (0.0%) | 5 (5.7%) |
Technology Access in Sherwood
Computing Device Access in Sherwood
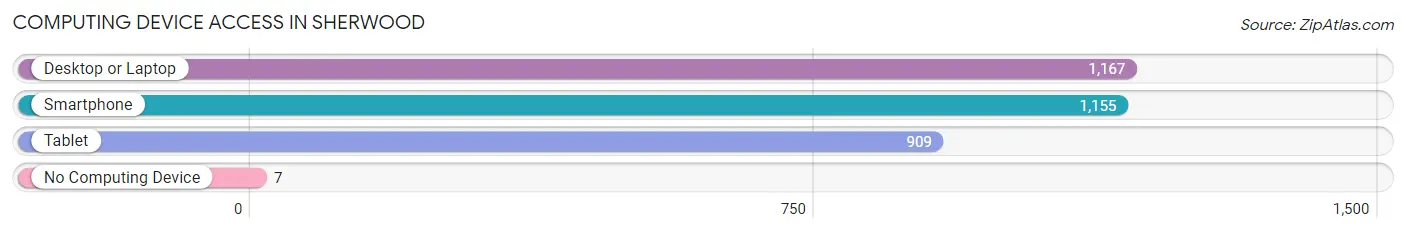
| Device Type | # Households | % Households |
| Desktop or Laptop | 1,167 | 96.9% |
| Smartphone | 1,155 | 95.9% |
| Tablet | 909 | 75.4% |
| No Computing Device | 7 | 0.6% |
| Total | 1,205 | 100.0% |
Internet Access in Sherwood
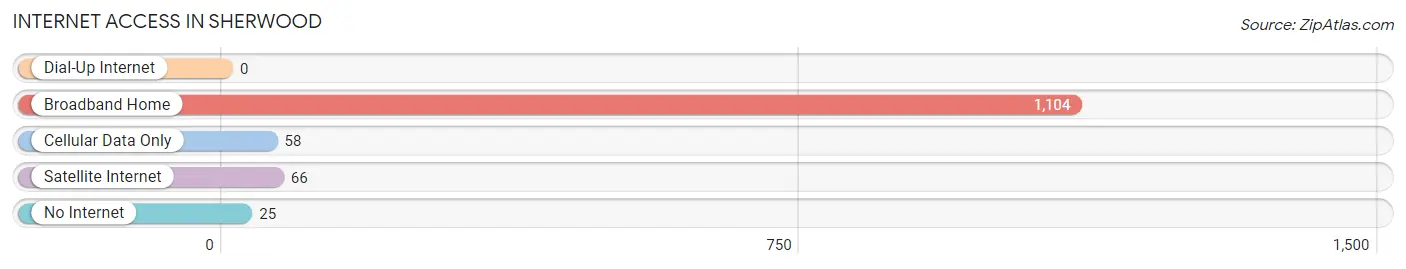
| Internet Type | # Households | % Households |
| Dial-Up Internet | 0 | 0.0% |
| Broadband Home | 1,104 | 91.6% |
| Cellular Data Only | 58 | 4.8% |
| Satellite Internet | 66 | 5.5% |
| No Internet | 25 | 2.1% |
| Total | 1,205 | 100.0% |
Sherwood Summary
Sherwood, Wisconsin is a small village located in Calumet County, Wisconsin. It is situated on the banks of the Fox River, about 25 miles north of Appleton. The village has a population of about 1,500 people and is part of the Appleton-Oshkosh-Neenah Metropolitan Statistical Area.
History
The area that is now Sherwood was first settled in the early 1800s by German immigrants. The village was originally known as “Sherwood’s Landing” and was named after the Sherwood family who owned the land. The village was officially incorporated in 1891.
In the early 1900s, Sherwood was a thriving community with a variety of businesses, including a sawmill, a grist mill, a cheese factory, and a general store. The village also had a post office, a bank, and a hotel.
In the 1950s, the village began to decline as many of the businesses closed or moved away. The population also began to decline as people moved to larger cities in search of better job opportunities.
Geography
Sherwood is located in Calumet County, Wisconsin, about 25 miles north of Appleton. The village is situated on the banks of the Fox River and is surrounded by rolling hills and farmland. The village is located in the Central Sands region of Wisconsin, which is known for its sandy soils and abundant lakes and rivers.
The village has a total area of 1.2 square miles, all of which is land. The village is located at an elevation of 845 feet above sea level.
Economy
The economy of Sherwood is largely based on agriculture and tourism. The village is home to several farms, which produce a variety of crops, including corn, soybeans, and hay. The village also has several small businesses, including a grocery store, a hardware store, and a restaurant.
The village is also a popular tourist destination, as it is located near several lakes and rivers. The village is home to several parks, including the Sherwood Forest Park, which offers camping, fishing, and hiking.
Demographics
As of the 2010 census, the population of Sherwood was 1,521. The racial makeup of the village was 97.3% White, 0.7% African American, 0.2% Native American, 0.3% Asian, 0.1% Pacific Islander, 0.4% from other races, and 1.0% from two or more races. Hispanic or Latino of any race were 1.3% of the population.
The median household income in Sherwood was $50,938, and the median family income was $60,000. The per capita income for the village was $22,845. About 5.3% of families and 7.2% of the population were below the poverty line, including 8.3% of those under age 18 and 5.2% of those age 65 or over.
Common Questions
What is Per Capita Income in Sherwood?
Per Capita income in Sherwood is $53,521.
What is the Median Family Income in Sherwood?
Median Family Income in Sherwood is $138,125.
What is the Median Household income in Sherwood?
Median Household Income in Sherwood is $125,156.
What is Income or Wage Gap in Sherwood?
Income or Wage Gap in Sherwood is 33.5%.
Women in Sherwood earn 66.5 cents for every dollar earned by a man.
What is Inequality or Gini Index in Sherwood?
Inequality or Gini Index in Sherwood is 0.36.
What is the Total Population of Sherwood?
Total Population of Sherwood is 3,224.
What is the Total Male Population of Sherwood?
Total Male Population of Sherwood is 1,695.
What is the Total Female Population of Sherwood?
Total Female Population of Sherwood is 1,529.
What is the Ratio of Males per 100 Females in Sherwood?
There are 110.86 Males per 100 Females in Sherwood.
What is the Ratio of Females per 100 Males in Sherwood?
There are 90.21 Females per 100 Males in Sherwood.
What is the Median Population Age in Sherwood?
Median Population Age in Sherwood is 44.0 Years.
What is the Average Family Size in Sherwood
Average Family Size in Sherwood is 2.9 People.
What is the Average Household Size in Sherwood
Average Household Size in Sherwood is 2.7 People.
How Large is the Labor Force in Sherwood?
There are 1,912 People in the Labor Forcein in Sherwood.
What is the Percentage of People in the Labor Force in Sherwood?
73.4% of People are in the Labor Force in Sherwood.
What is the Unemployment Rate in Sherwood?
Unemployment Rate in Sherwood is 1.1%.