Schofield, WI Map & Demographics
Schofield Map
Schofield Overview
$44,885
PER CAPITA INCOME
$81,310
AVG FAMILY INCOME
$63,279
AVG HOUSEHOLD INCOME
34.0%
WAGE / INCOME GAP [ % ]
66.0¢/ $1
WAGE / INCOME GAP [ $ ]
0.53
INEQUALITY / GINI INDEX
2,256
TOTAL POPULATION
1,174
MALE POPULATION
1,082
FEMALE POPULATION
108.50
MALES / 100 FEMALES
92.16
FEMALES / 100 MALES
38.1
MEDIAN AGE
3.0
AVG FAMILY SIZE
2.1
AVG HOUSEHOLD SIZE
1,319
LABOR FORCE [ PEOPLE ]
72.1%
PERCENT IN LABOR FORCE
5.9%
UNEMPLOYMENT RATE
Schofield Zip Codes
Schofield Area Codes
Income in Schofield
Income Overview in Schofield
Per Capita Income in Schofield is $44,885, while median incomes of families and households are $81,310 and $63,279 respectively.
| Characteristic | Number | Measure |
| Per Capita Income | 2,256 | $44,885 |
| Median Family Income | 544 | $81,310 |
| Mean Family Income | 544 | $102,703 |
| Median Household Income | 1,050 | $63,279 |
| Mean Household Income | 1,050 | $95,190 |
| Income Deficit | 544 | $0 |
| Wage / Income Gap (%) | 2,256 | 33.98% |
| Wage / Income Gap ($) | 2,256 | 66.02¢ per $1 |
| Gini / Inequality Index | 2,256 | 0.53 |
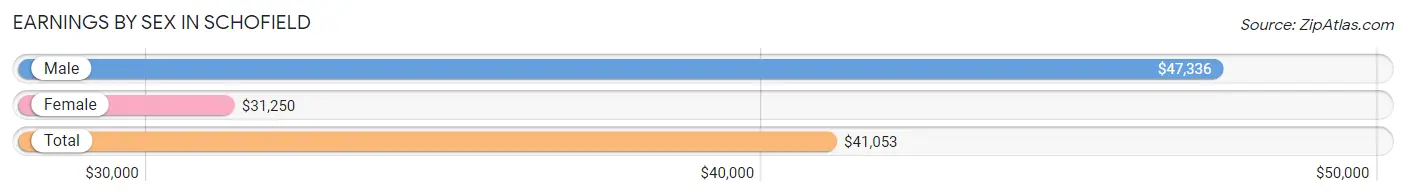
Earnings by Sex in Schofield
Average Earnings in Schofield are $41,053, $47,336 for men and $31,250 for women, a difference of 34.0%.
| Sex | Number | Average Earnings |
| Male | 743 (55.4%) | $47,336 |
| Female | 599 (44.6%) | $31,250 |
| Total | 1,342 (100.0%) | $41,053 |
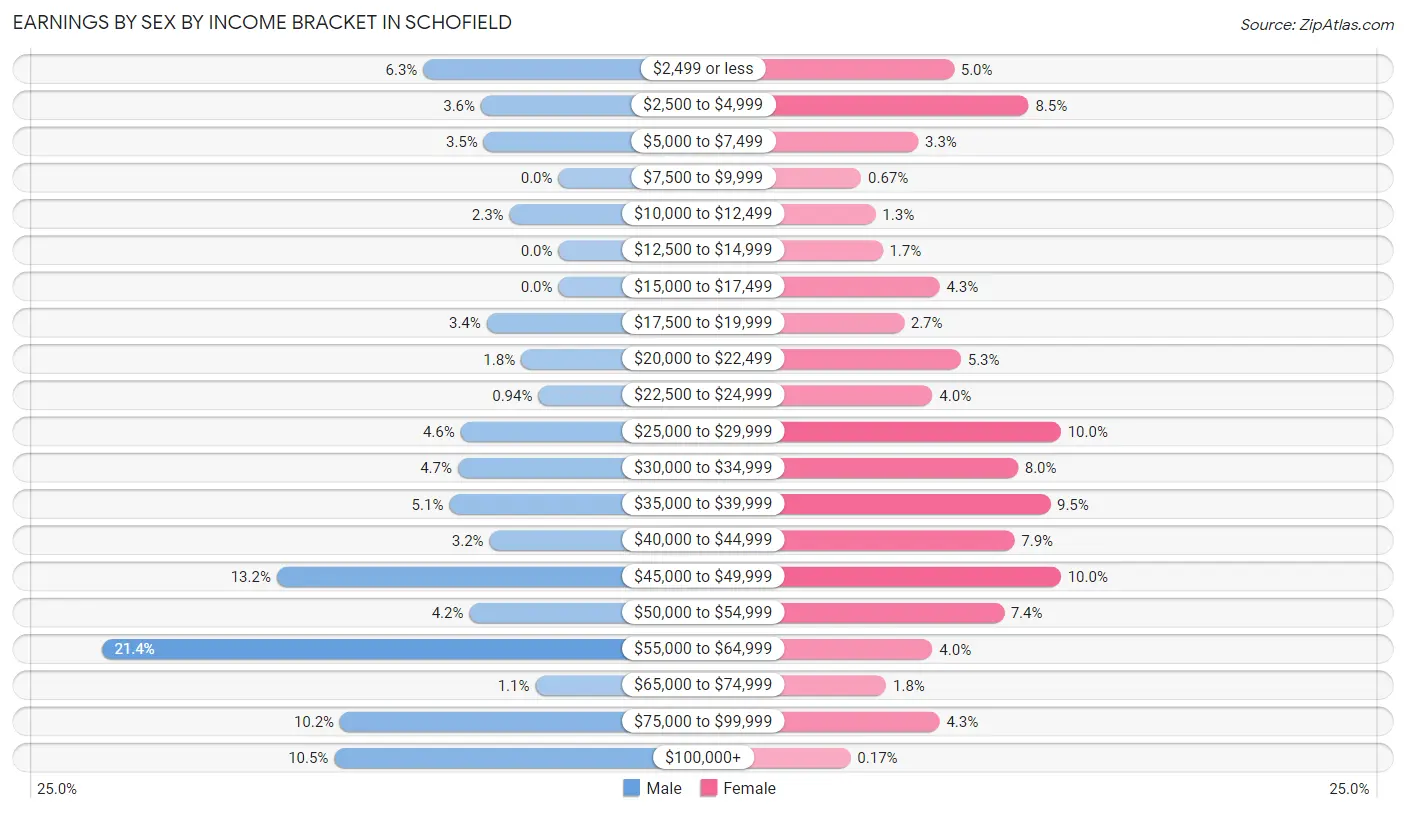
Earnings by Sex by Income Bracket in Schofield
The most common earnings brackets in Schofield are $55,000 to $64,999 for men (159 | 21.4%) and $25,000 to $29,999 for women (60 | 10.0%).
| Income | Male | Female |
| $2,499 or less | 47 (6.3%) | 30 (5.0%) |
| $2,500 to $4,999 | 27 (3.6%) | 51 (8.5%) |
| $5,000 to $7,499 | 26 (3.5%) | 20 (3.3%) |
| $7,500 to $9,999 | 0 (0.0%) | 4 (0.7%) |
| $10,000 to $12,499 | 17 (2.3%) | 8 (1.3%) |
| $12,500 to $14,999 | 0 (0.0%) | 10 (1.7%) |
| $15,000 to $17,499 | 0 (0.0%) | 26 (4.3%) |
| $17,500 to $19,999 | 25 (3.4%) | 16 (2.7%) |
| $20,000 to $22,499 | 13 (1.8%) | 32 (5.3%) |
| $22,500 to $24,999 | 7 (0.9%) | 24 (4.0%) |
| $25,000 to $29,999 | 34 (4.6%) | 60 (10.0%) |
| $30,000 to $34,999 | 35 (4.7%) | 48 (8.0%) |
| $35,000 to $39,999 | 38 (5.1%) | 57 (9.5%) |
| $40,000 to $44,999 | 24 (3.2%) | 47 (7.9%) |
| $45,000 to $49,999 | 98 (13.2%) | 60 (10.0%) |
| $50,000 to $54,999 | 31 (4.2%) | 44 (7.3%) |
| $55,000 to $64,999 | 159 (21.4%) | 24 (4.0%) |
| $65,000 to $74,999 | 8 (1.1%) | 11 (1.8%) |
| $75,000 to $99,999 | 76 (10.2%) | 26 (4.3%) |
| $100,000+ | 78 (10.5%) | 1 (0.2%) |
| Total | 743 (100.0%) | 599 (100.0%) |
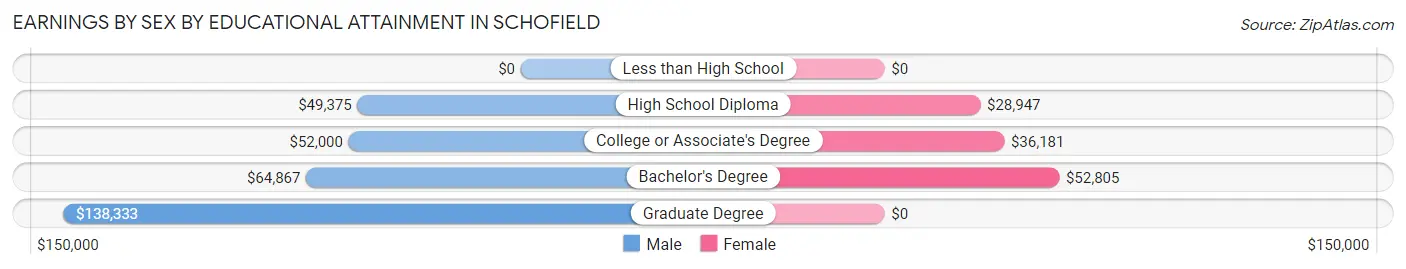
Earnings by Sex by Educational Attainment in Schofield
Average earnings in Schofield are $57,465 for men and $35,398 for women, a difference of 38.4%. Men with an educational attainment of graduate degree enjoy the highest average annual earnings of $138,333, while those with high school diploma education earn the least with $49,375. Women with an educational attainment of bachelor's degree earn the most with the average annual earnings of $52,805, while those with high school diploma education have the smallest earnings of $28,947.
| Educational Attainment | Male Income | Female Income |
| Less than High School | - | - |
| High School Diploma | $49,375 | $28,947 |
| College or Associate's Degree | $52,000 | $36,181 |
| Bachelor's Degree | $64,867 | $52,805 |
| Graduate Degree | $138,333 | $0 |
| Total | $57,465 | $35,398 |
Family Income in Schofield
Family Income Brackets in Schofield
According to the Schofield family income data, there are 181 families falling into the $75,000 to $99,999 income range, which is the most common income bracket and makes up 33.3% of all families.
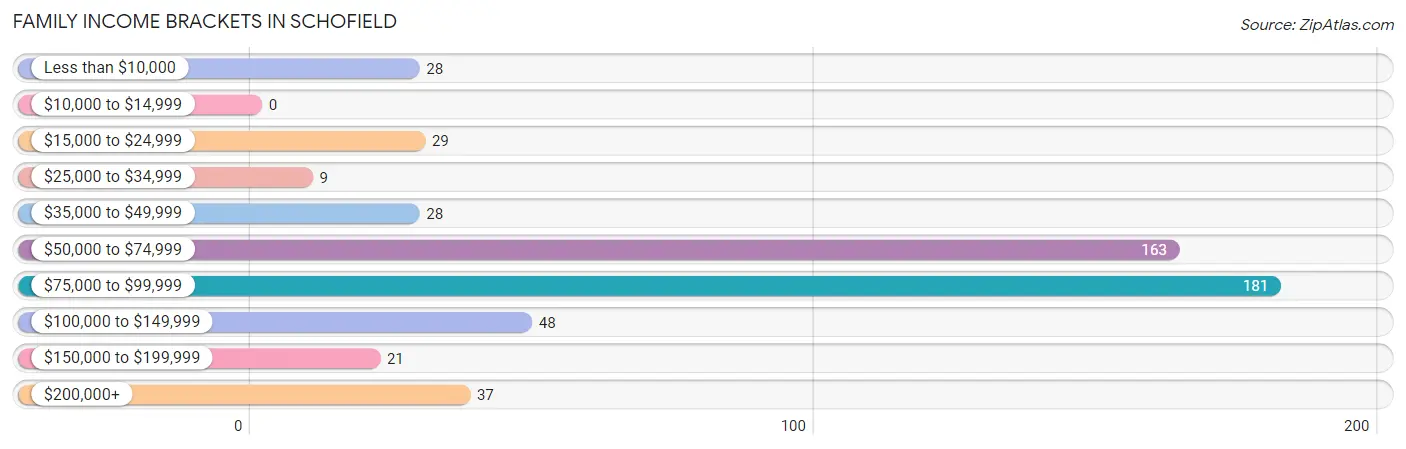
| Income Bracket | # Families | % Families |
| Less than $10,000 | 28 | 5.1% |
| $10,000 to $14,999 | 0 | 0.0% |
| $15,000 to $24,999 | 29 | 5.3% |
| $25,000 to $34,999 | 9 | 1.7% |
| $35,000 to $49,999 | 28 | 5.1% |
| $50,000 to $74,999 | 163 | 30.0% |
| $75,000 to $99,999 | 181 | 33.3% |
| $100,000 to $149,999 | 48 | 8.8% |
| $150,000 to $199,999 | 21 | 3.9% |
| $200,000+ | 37 | 6.8% |
Family Income by Famaliy Size in Schofield
3-person families (70 | 12.9%) account for the highest median family income in Schofield with $88,929 per family, while 2-person families (312 | 57.4%) have the highest median income of $38,438 per family member.
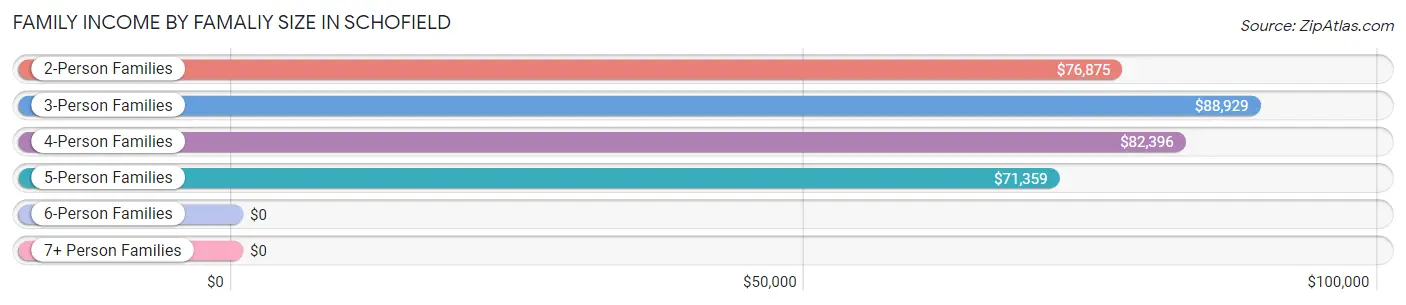
| Income Bracket | # Families | Median Income |
| 2-Person Families | 312 (57.4%) | $76,875 |
| 3-Person Families | 70 (12.9%) | $88,929 |
| 4-Person Families | 83 (15.3%) | $82,396 |
| 5-Person Families | 65 (11.9%) | $71,359 |
| 6-Person Families | 13 (2.4%) | $0 |
| 7+ Person Families | 1 (0.2%) | $0 |
| Total | 544 (100.0%) | $81,310 |
Family Income by Number of Earners in Schofield
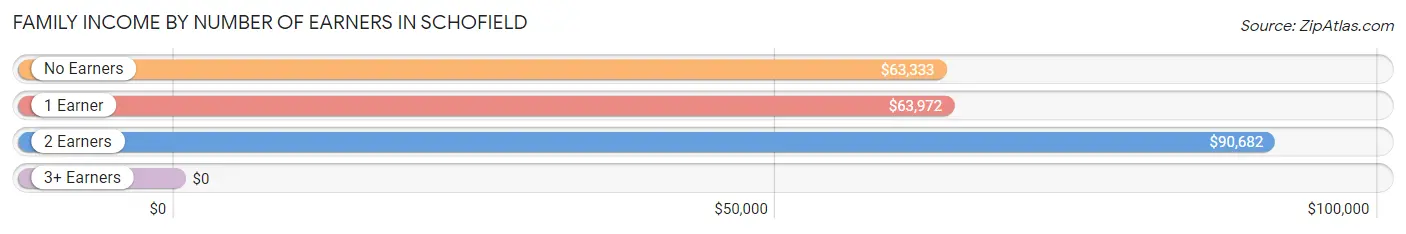
| Number of Earners | # Families | Median Income |
| No Earners | 82 (15.1%) | $63,333 |
| 1 Earner | 193 (35.5%) | $63,972 |
| 2 Earners | 220 (40.4%) | $90,682 |
| 3+ Earners | 49 (9.0%) | $0 |
| Total | 544 (100.0%) | $81,310 |
Household Income in Schofield
Household Income Brackets in Schofield
With 290 households falling in the category, the $50,000 to $74,999 income range is the most frequent in Schofield, accounting for 27.6% of all households. In contrast, only 28 households (2.7%) fall into the $150,000 to $199,999 income bracket, making it the least populous group.
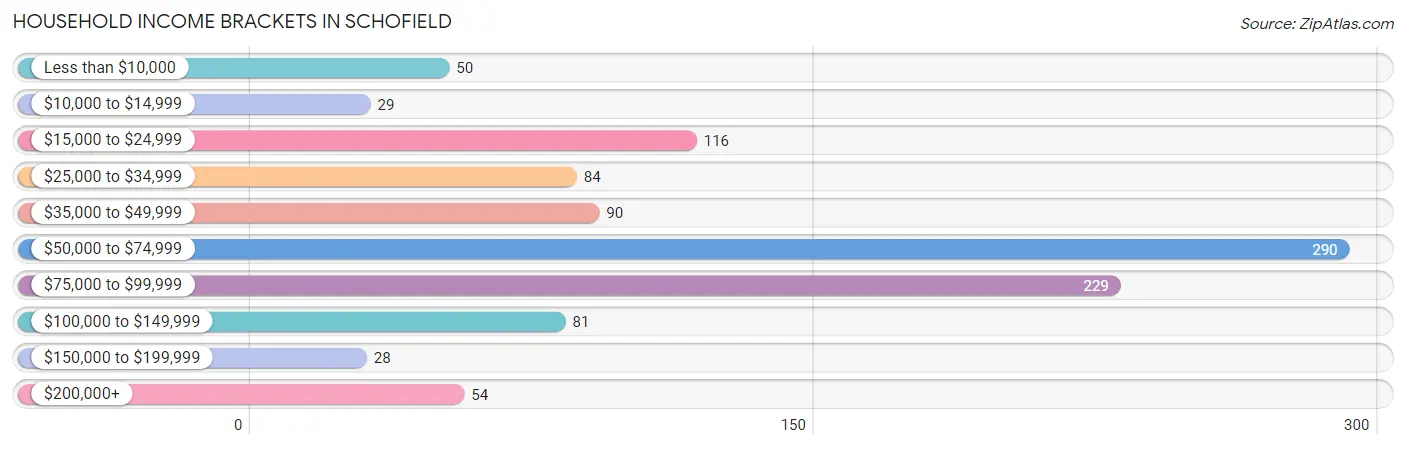
| Income Bracket | # Households | % Households |
| Less than $10,000 | 50 | 4.8% |
| $10,000 to $14,999 | 29 | 2.8% |
| $15,000 to $24,999 | 116 | 11.0% |
| $25,000 to $34,999 | 84 | 8.0% |
| $35,000 to $49,999 | 90 | 8.6% |
| $50,000 to $74,999 | 290 | 27.6% |
| $75,000 to $99,999 | 229 | 21.8% |
| $100,000 to $149,999 | 81 | 7.7% |
| $150,000 to $199,999 | 28 | 2.7% |
| $200,000+ | 54 | 5.1% |
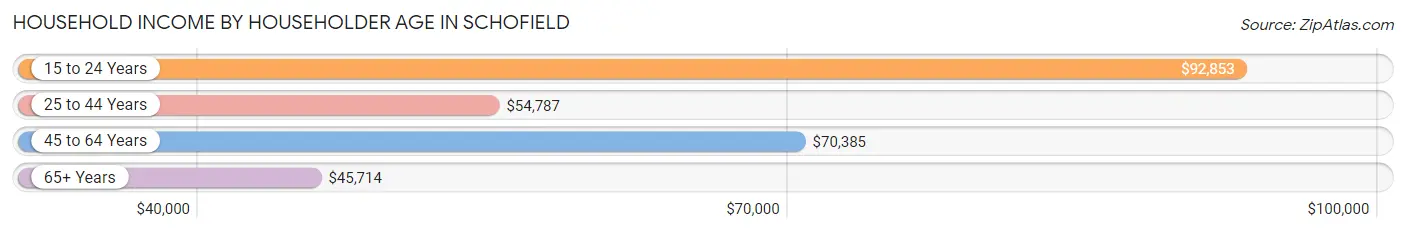
Household Income by Householder Age in Schofield
The median household income in Schofield is $63,279, with the highest median household income of $92,853 found in the 15 to 24 years age bracket for the primary householder. A total of 67 households (6.4%) fall into this category. Meanwhile, the 65+ years age bracket for the primary householder has the lowest median household income of $45,714, with 238 households (22.7%) in this group.
| Income Bracket | # Households | Median Income |
| 15 to 24 Years | 67 (6.4%) | $92,853 |
| 25 to 44 Years | 311 (29.6%) | $54,787 |
| 45 to 64 Years | 434 (41.3%) | $70,385 |
| 65+ Years | 238 (22.7%) | $45,714 |
| Total | 1,050 (100.0%) | $63,279 |
Poverty in Schofield
Income Below Poverty by Sex and Age in Schofield
With 10.6% poverty level for males and 16.7% for females among the residents of Schofield, 16 and 17 year old males and 15 year old females are the most vulnerable to poverty, with 28 males (68.3%) and 28 females (77.8%) in their respective age groups living below the poverty level.
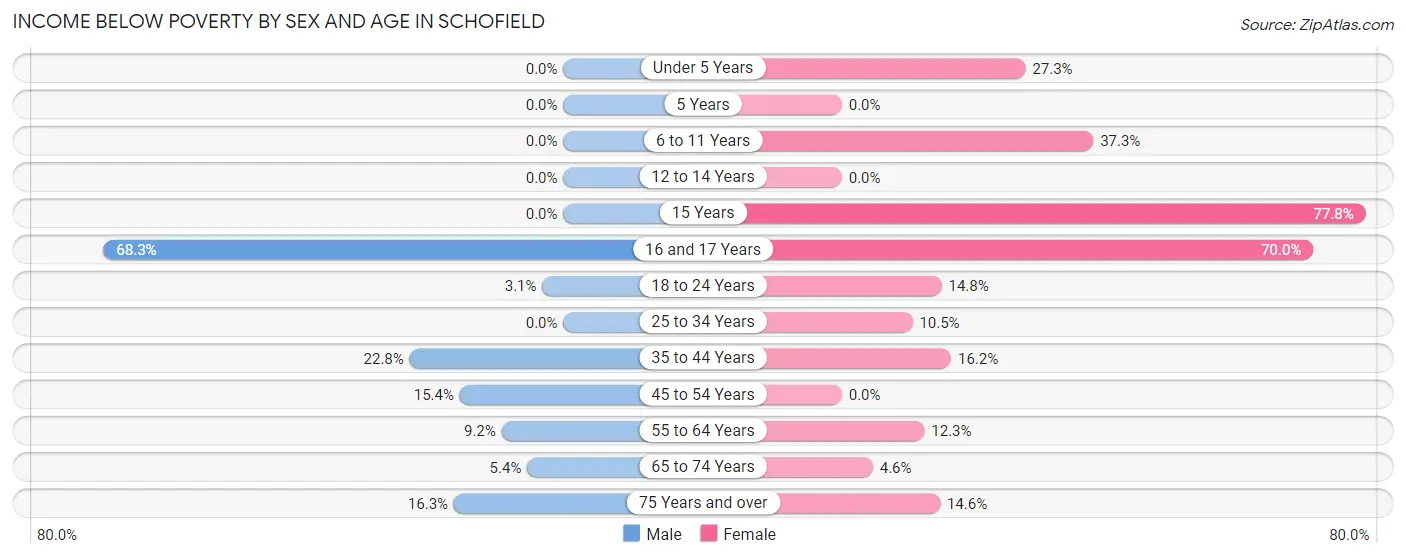
| Age Bracket | Male | Female |
| Under 5 Years | 0 (0.0%) | 15 (27.3%) |
| 5 Years | 0 (0.0%) | 0 (0.0%) |
| 6 to 11 Years | 0 (0.0%) | 28 (37.3%) |
| 12 to 14 Years | 0 (0.0%) | 0 (0.0%) |
| 15 Years | 0 (0.0%) | 28 (77.8%) |
| 16 and 17 Years | 28 (68.3%) | 28 (70.0%) |
| 18 to 24 Years | 6 (3.1%) | 16 (14.8%) |
| 25 to 34 Years | 0 (0.0%) | 17 (10.5%) |
| 35 to 44 Years | 29 (22.8%) | 18 (16.2%) |
| 45 to 54 Years | 24 (15.4%) | 0 (0.0%) |
| 55 to 64 Years | 21 (9.2%) | 13 (12.3%) |
| 65 to 74 Years | 3 (5.4%) | 4 (4.6%) |
| 75 Years and over | 13 (16.3%) | 14 (14.6%) |
| Total | 124 (10.6%) | 181 (16.7%) |
Income Above Poverty by Sex and Age in Schofield
According to the poverty statistics in Schofield, males aged under 5 years and females aged 5 years are the age groups that are most secure financially, with 100.0% of males and 100.0% of females in these age groups living above the poverty line.
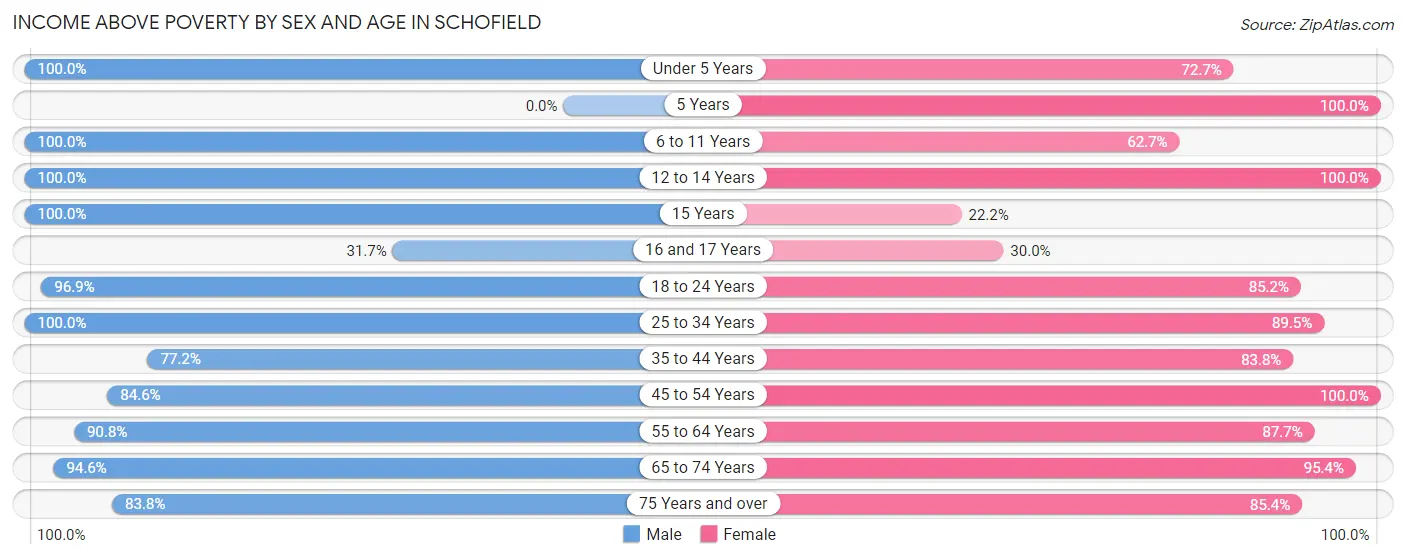
| Age Bracket | Male | Female |
| Under 5 Years | 12 (100.0%) | 40 (72.7%) |
| 5 Years | 0 (0.0%) | 1 (100.0%) |
| 6 to 11 Years | 90 (100.0%) | 47 (62.7%) |
| 12 to 14 Years | 40 (100.0%) | 82 (100.0%) |
| 15 Years | 36 (100.0%) | 8 (22.2%) |
| 16 and 17 Years | 13 (31.7%) | 12 (30.0%) |
| 18 to 24 Years | 186 (96.9%) | 92 (85.2%) |
| 25 to 34 Years | 115 (100.0%) | 145 (89.5%) |
| 35 to 44 Years | 98 (77.2%) | 93 (83.8%) |
| 45 to 54 Years | 132 (84.6%) | 123 (100.0%) |
| 55 to 64 Years | 208 (90.8%) | 93 (87.7%) |
| 65 to 74 Years | 53 (94.6%) | 83 (95.4%) |
| 75 Years and over | 67 (83.8%) | 82 (85.4%) |
| Total | 1,050 (89.4%) | 901 (83.3%) |
Income Below Poverty Among Married-Couple Families in Schofield
The poverty statistics for married-couple families in Schofield show that 0.9% or 3 of the total 315 families live below the poverty line. Families with no children have the highest poverty rate of 1.4%, comprising of 3 families. On the other hand, families with 1 or 2 children have the lowest poverty rate of 0.0%, which includes 0 families.
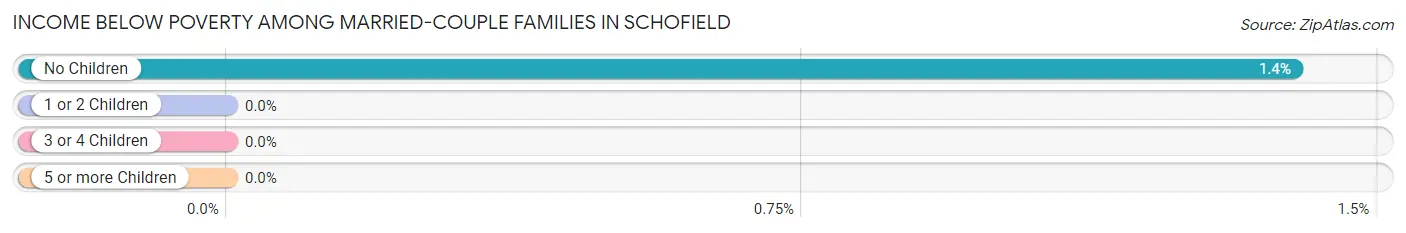
| Children | Above Poverty | Below Poverty |
| No Children | 213 (98.6%) | 3 (1.4%) |
| 1 or 2 Children | 98 (100.0%) | 0 (0.0%) |
| 3 or 4 Children | 1 (100.0%) | 0 (0.0%) |
| 5 or more Children | 0 (0.0%) | 0 (0.0%) |
| Total | 312 (99.1%) | 3 (0.9%) |
Income Below Poverty Among Single-Parent Households in Schofield
According to the poverty data in Schofield, 16.3% or 21 single-father households and 33.0% or 33 single-mother households are living below the poverty line. Among single-father households, those with 3 or 4 children have the highest poverty rate, with 21 households (45.7%) experiencing poverty. Likewise, among single-mother households, those with 1 or 2 children have the highest poverty rate, with 33 households (68.8%) falling below the poverty line.
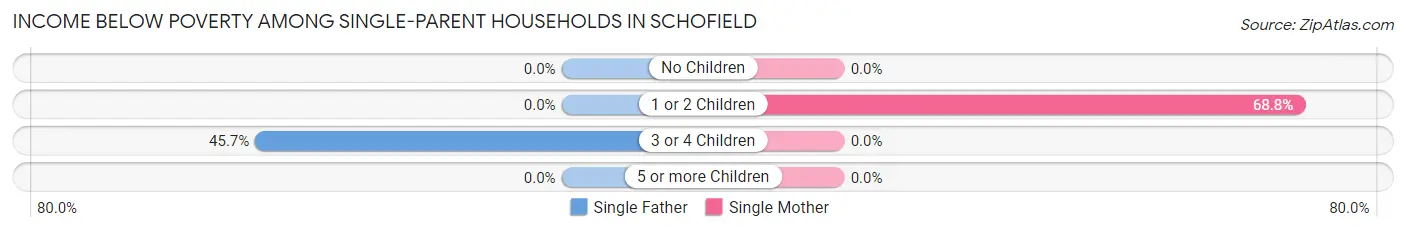
| Children | Single Father | Single Mother |
| No Children | 0 (0.0%) | 0 (0.0%) |
| 1 or 2 Children | 0 (0.0%) | 33 (68.8%) |
| 3 or 4 Children | 21 (45.7%) | 0 (0.0%) |
| 5 or more Children | 0 (0.0%) | 0 (0.0%) |
| Total | 21 (16.3%) | 33 (33.0%) |
Income Below Poverty Among Married-Couple vs Single-Parent Households in Schofield
The poverty data for Schofield shows that 3 of the married-couple family households (0.9%) and 54 of the single-parent households (23.6%) are living below the poverty level. Within the married-couple family households, those with no children have the highest poverty rate, with 3 households (1.4%) falling below the poverty line. Among the single-parent households, those with 3 or 4 children have the highest poverty rate, with 21 household (31.8%) living below poverty.
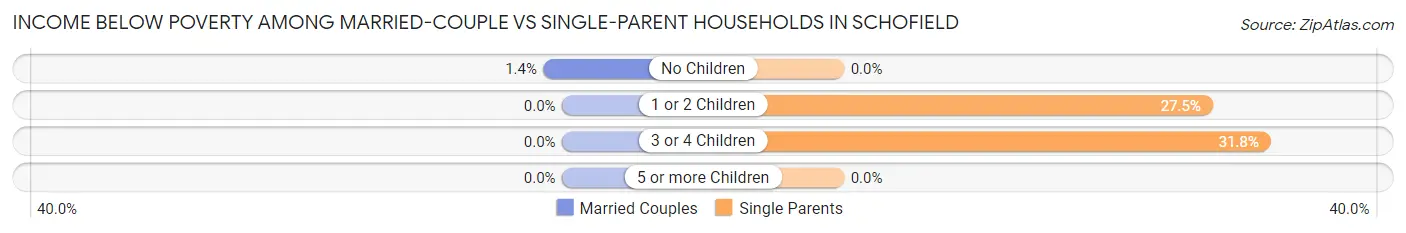
| Children | Married-Couple Families | Single-Parent Households |
| No Children | 3 (1.4%) | 0 (0.0%) |
| 1 or 2 Children | 0 (0.0%) | 33 (27.5%) |
| 3 or 4 Children | 0 (0.0%) | 21 (31.8%) |
| 5 or more Children | 0 (0.0%) | 0 (0.0%) |
| Total | 3 (0.9%) | 54 (23.6%) |
Race in Schofield
The most populous races in Schofield are White / Caucasian (1,912 | 84.8%), Two or more Races (293 | 13.0%), and Hispanic or Latino (185 | 8.2%).
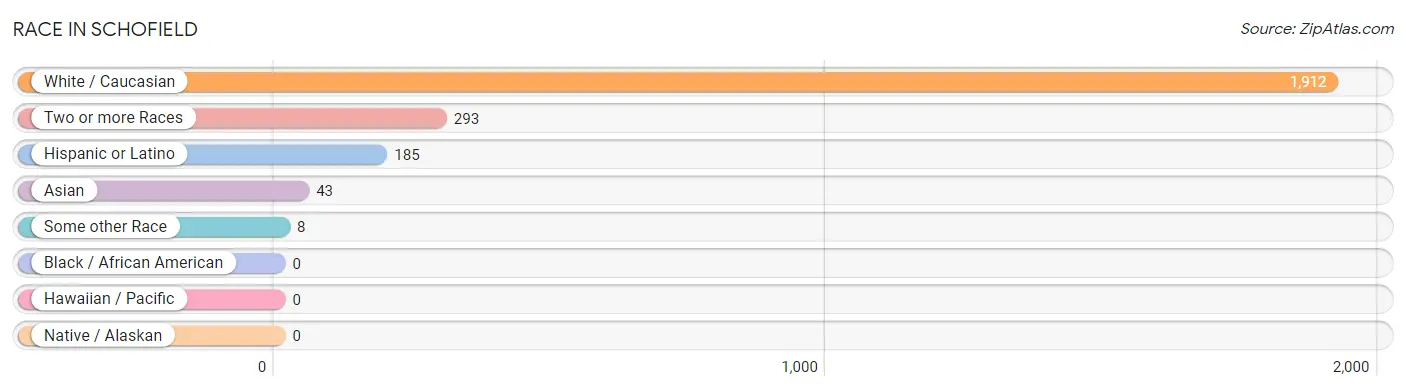
| Race | # Population | % Population |
| Asian | 43 | 1.9% |
| Black / African American | 0 | 0.0% |
| Hawaiian / Pacific | 0 | 0.0% |
| Hispanic or Latino | 185 | 8.2% |
| Native / Alaskan | 0 | 0.0% |
| White / Caucasian | 1,912 | 84.8% |
| Two or more Races | 293 | 13.0% |
| Some other Race | 8 | 0.4% |
| Total | 2,256 | 100.0% |
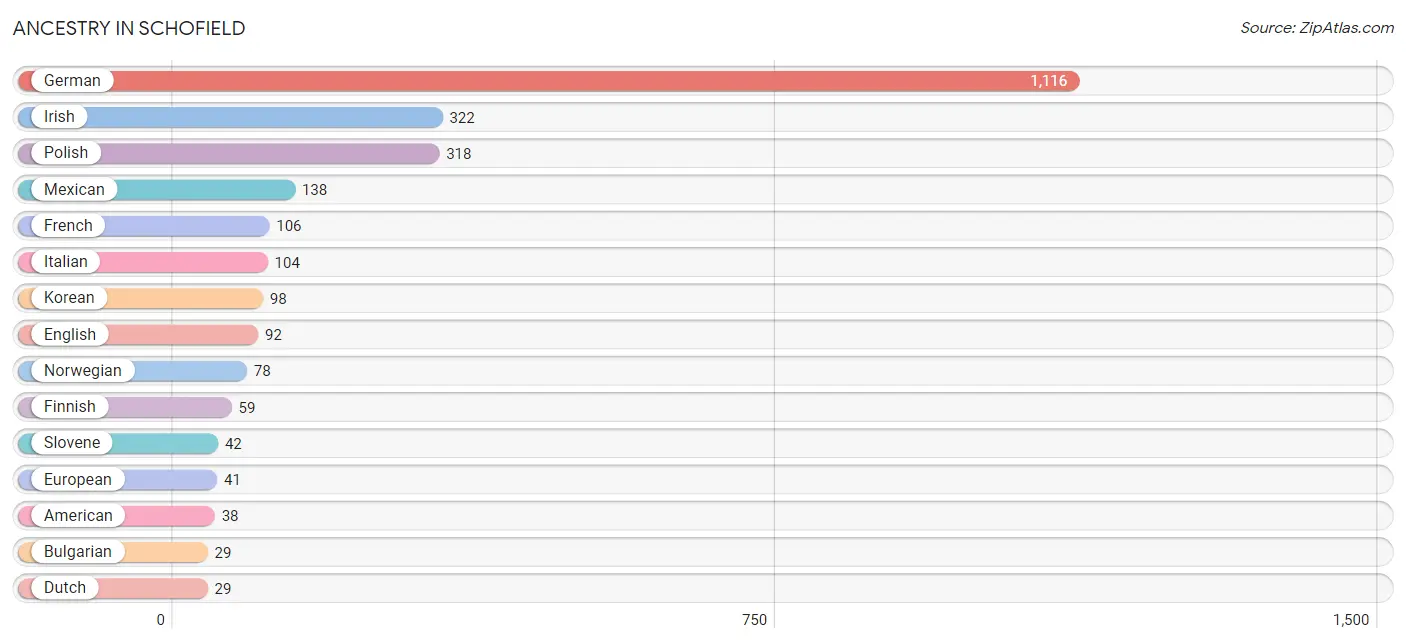
Ancestry in Schofield
The most populous ancestries reported in Schofield are German (1,116 | 49.5%), Irish (322 | 14.3%), Polish (318 | 14.1%), Mexican (138 | 6.1%), and French (106 | 4.7%), together accounting for 88.7% of all Schofield residents.
| Ancestry | # Population | % Population |
| American | 38 | 1.7% |
| Austrian | 5 | 0.2% |
| Belgian | 3 | 0.1% |
| Bhutanese | 3 | 0.1% |
| British | 9 | 0.4% |
| Bulgarian | 29 | 1.3% |
| Central American | 25 | 1.1% |
| Cherokee | 1 | 0.0% |
| Chippewa | 2 | 0.1% |
| Croatian | 8 | 0.4% |
| Czech | 27 | 1.2% |
| Danish | 5 | 0.2% |
| Dutch | 29 | 1.3% |
| English | 92 | 4.1% |
| European | 41 | 1.8% |
| Finnish | 59 | 2.6% |
| French | 106 | 4.7% |
| French Canadian | 6 | 0.3% |
| German | 1,116 | 49.5% |
| Greek | 5 | 0.2% |
| Hungarian | 28 | 1.2% |
| Indian (Asian) | 11 | 0.5% |
| Irish | 322 | 14.3% |
| Italian | 104 | 4.6% |
| Korean | 98 | 4.3% |
| Malaysian | 20 | 0.9% |
| Mexican | 138 | 6.1% |
| Mexican American Indian | 2 | 0.1% |
| Native Hawaiian | 2 | 0.1% |
| Nigerian | 9 | 0.4% |
| Norwegian | 78 | 3.5% |
| Panamanian | 25 | 1.1% |
| Peruvian | 13 | 0.6% |
| Polish | 318 | 14.1% |
| Puerto Rican | 9 | 0.4% |
| Russian | 6 | 0.3% |
| Scandinavian | 7 | 0.3% |
| Serbian | 4 | 0.2% |
| Slovene | 42 | 1.9% |
| South American | 13 | 0.6% |
| Sri Lankan | 5 | 0.2% |
| Subsaharan African | 9 | 0.4% |
| Swedish | 26 | 1.1% |
| Swiss | 5 | 0.2% |
| Ukrainian | 4 | 0.2% |
| Welsh | 6 | 0.3% | View All 46 Rows |
Immigrants in Schofield
The most numerous immigrant groups reported in Schofield came from Central America (62 | 2.8%), Latin America (62 | 2.8%), Mexico (61 | 2.7%), Asia (23 | 1.0%), and South Eastern Asia (23 | 1.0%), together accounting for 10.2% of all Schofield residents.
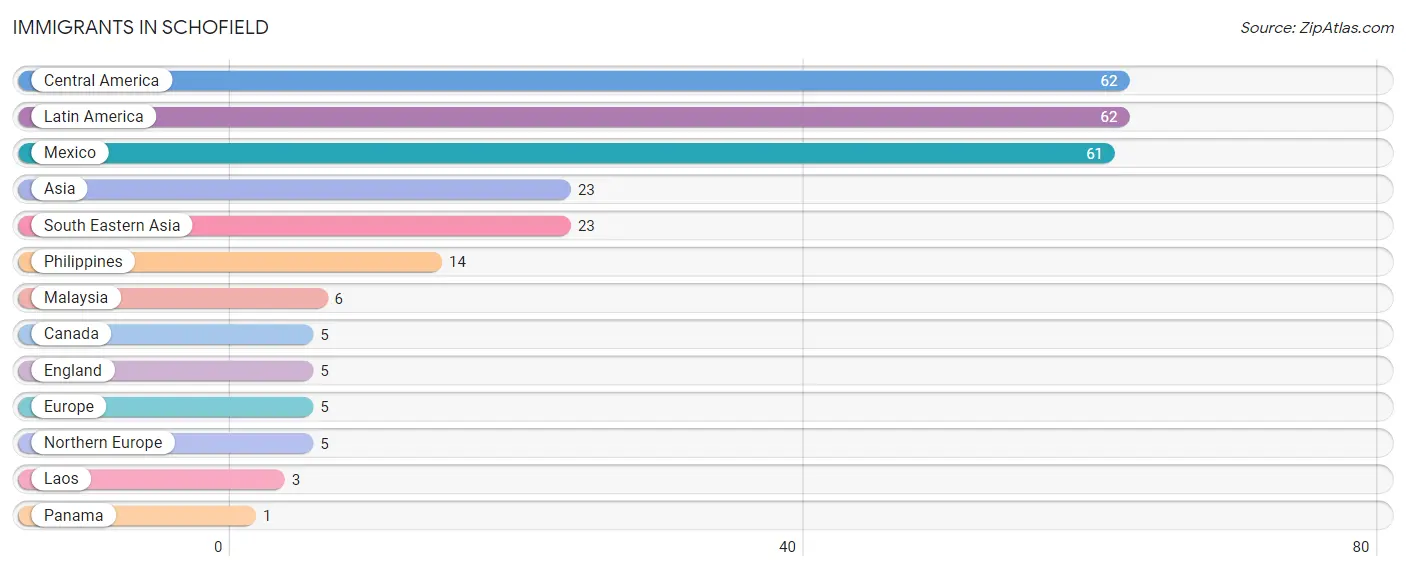
| Immigration Origin | # Population | % Population |
| Asia | 23 | 1.0% |
| Canada | 5 | 0.2% |
| Central America | 62 | 2.8% |
| England | 5 | 0.2% |
| Europe | 5 | 0.2% |
| Laos | 3 | 0.1% |
| Latin America | 62 | 2.8% |
| Malaysia | 6 | 0.3% |
| Mexico | 61 | 2.7% |
| Northern Europe | 5 | 0.2% |
| Panama | 1 | 0.0% |
| Philippines | 14 | 0.6% |
| South Eastern Asia | 23 | 1.0% | View All 13 Rows |
Sex and Age in Schofield
Sex and Age in Schofield
The most populous age groups in Schofield are 15 to 19 Years (174 | 14.8%) for men and 10 to 14 Years (117 | 10.8%) for women.
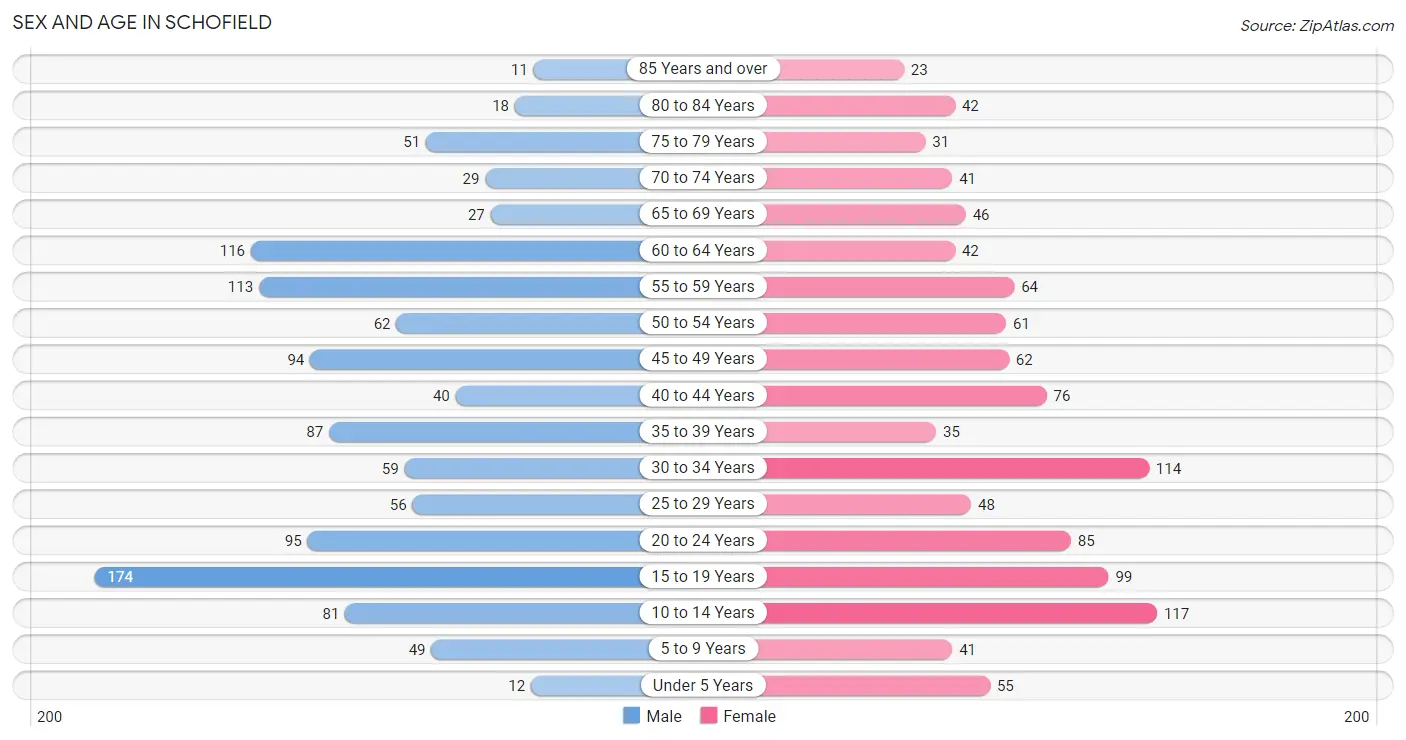
| Age Bracket | Male | Female |
| Under 5 Years | 12 (1.0%) | 55 (5.1%) |
| 5 to 9 Years | 49 (4.2%) | 41 (3.8%) |
| 10 to 14 Years | 81 (6.9%) | 117 (10.8%) |
| 15 to 19 Years | 174 (14.8%) | 99 (9.1%) |
| 20 to 24 Years | 95 (8.1%) | 85 (7.9%) |
| 25 to 29 Years | 56 (4.8%) | 48 (4.4%) |
| 30 to 34 Years | 59 (5.0%) | 114 (10.5%) |
| 35 to 39 Years | 87 (7.4%) | 35 (3.2%) |
| 40 to 44 Years | 40 (3.4%) | 76 (7.0%) |
| 45 to 49 Years | 94 (8.0%) | 62 (5.7%) |
| 50 to 54 Years | 62 (5.3%) | 61 (5.6%) |
| 55 to 59 Years | 113 (9.6%) | 64 (5.9%) |
| 60 to 64 Years | 116 (9.9%) | 42 (3.9%) |
| 65 to 69 Years | 27 (2.3%) | 46 (4.3%) |
| 70 to 74 Years | 29 (2.5%) | 41 (3.8%) |
| 75 to 79 Years | 51 (4.3%) | 31 (2.9%) |
| 80 to 84 Years | 18 (1.5%) | 42 (3.9%) |
| 85 Years and over | 11 (0.9%) | 23 (2.1%) |
| Total | 1,174 (100.0%) | 1,082 (100.0%) |
Families and Households in Schofield
Median Family Size in Schofield
The median family size in Schofield is 2.96 persons per family, with married-couple families (315 | 57.9%) accounting for the largest median family size of 2.97 persons per family. On the other hand, single female/mother families (100 | 18.4%) represent the smallest median family size with 2.93 persons per family.
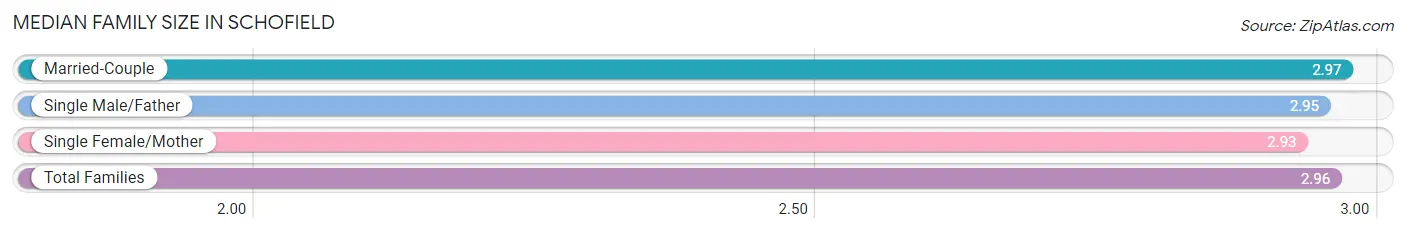
| Family Type | # Families | Family Size |
| Married-Couple | 315 (57.9%) | 2.97 |
| Single Male/Father | 129 (23.7%) | 2.95 |
| Single Female/Mother | 100 (18.4%) | 2.93 |
| Total Families | 544 (100.0%) | 2.96 |
Median Household Size in Schofield
The median household size in Schofield is 2.15 persons per household, with single male/father households (129 | 12.3%) accounting for the largest median household size of 3.11 persons per household. non-family households (506 | 48.2%) represent the smallest median household size with 1.21 persons per household.
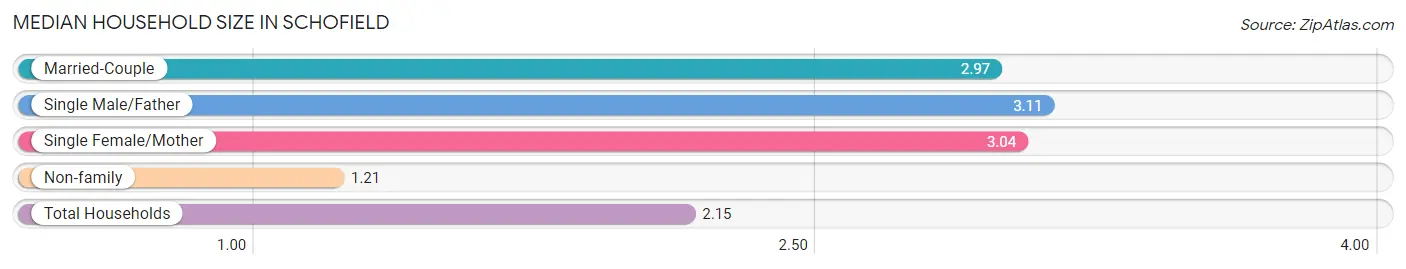
| Household Type | # Households | Household Size |
| Married-Couple | 315 (30.0%) | 2.97 |
| Single Male/Father | 129 (12.3%) | 3.11 |
| Single Female/Mother | 100 (9.5%) | 3.04 |
| Non-family | 506 (48.2%) | 1.21 |
| Total Households | 1,050 (100.0%) | 2.15 |
Household Size by Marriage Status in Schofield
Out of a total of 1,050 households in Schofield, 544 (51.8%) are family households, while 506 (48.2%) are nonfamily households. The most numerous type of family households are 2-person households, comprising 305, and the most common type of nonfamily households are 1-person households, comprising 413.
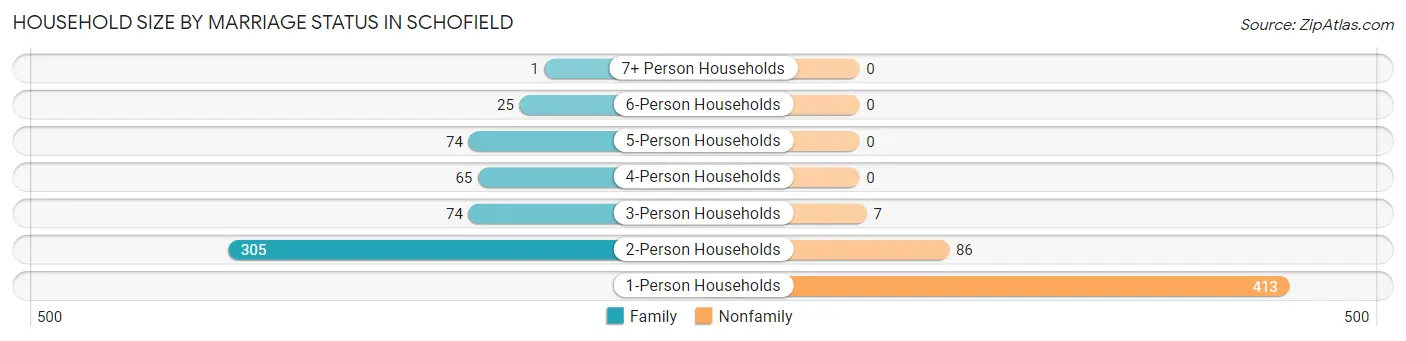
| Household Size | Family Households | Nonfamily Households |
| 1-Person Households | - | 413 (39.3%) |
| 2-Person Households | 305 (29.0%) | 86 (8.2%) |
| 3-Person Households | 74 (7.0%) | 7 (0.7%) |
| 4-Person Households | 65 (6.2%) | 0 (0.0%) |
| 5-Person Households | 74 (7.0%) | 0 (0.0%) |
| 6-Person Households | 25 (2.4%) | 0 (0.0%) |
| 7+ Person Households | 1 (0.1%) | 0 (0.0%) |
| Total | 544 (51.8%) | 506 (48.2%) |
Female Fertility in Schofield
Fertility by Age in Schofield
Average fertility rate in Schofield is 33.0 births per 1,000 women. Women in the age bracket of 20 to 34 years have the highest fertility rate with 69.0 births per 1,000 women. Women in the age bracket of 20 to 34 years acount for 100.0% of all women with births.
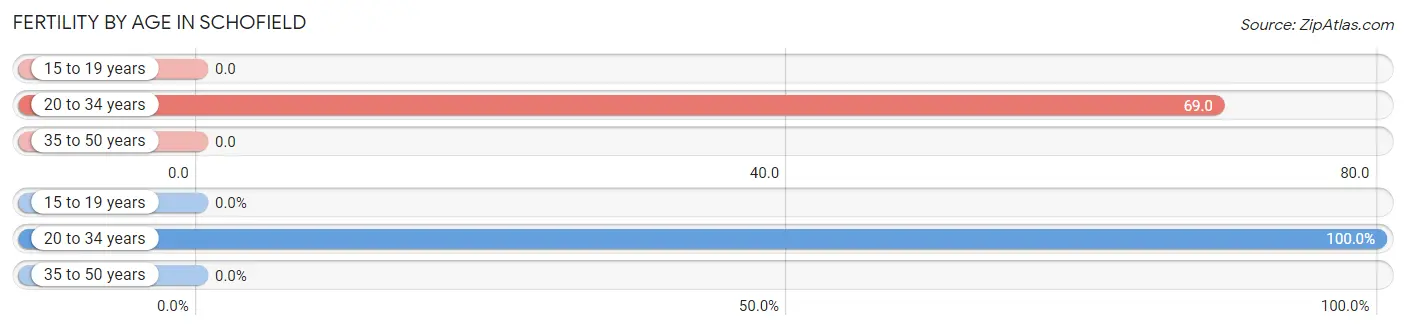
| Age Bracket | Women with Births | Births / 1,000 Women |
| 15 to 19 years | 0 (0.0%) | 0.0 |
| 20 to 34 years | 17 (100.0%) | 69.0 |
| 35 to 50 years | 0 (0.0%) | 0.0 |
| Total | 17 (100.0%) | 33.0 |
Fertility by Age by Marriage Status in Schofield
29.4% of women with births (17) in Schofield are married. The highest percentage of unmarried women with births falls into 20 to 34 years age bracket with 70.6% of them unmarried at the time of birth, while the lowest percentage of unmarried women with births belong to 20 to 34 years age bracket with 70.6% of them unmarried.
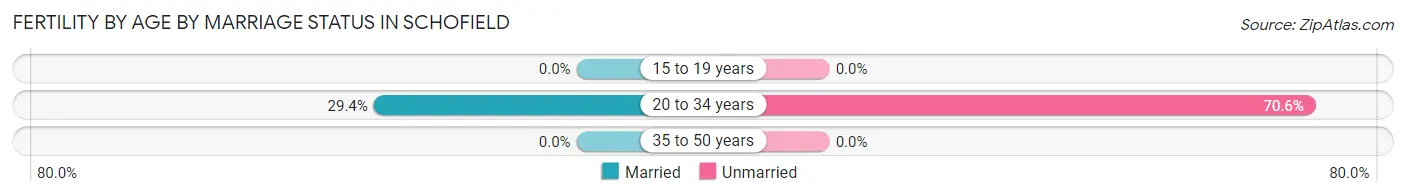
| Age Bracket | Married | Unmarried |
| 15 to 19 years | 0 (0.0%) | 0 (0.0%) |
| 20 to 34 years | 5 (29.4%) | 12 (70.6%) |
| 35 to 50 years | 0 (0.0%) | 0 (0.0%) |
| Total | 5 (29.4%) | 12 (70.6%) |
Fertility by Education in Schofield
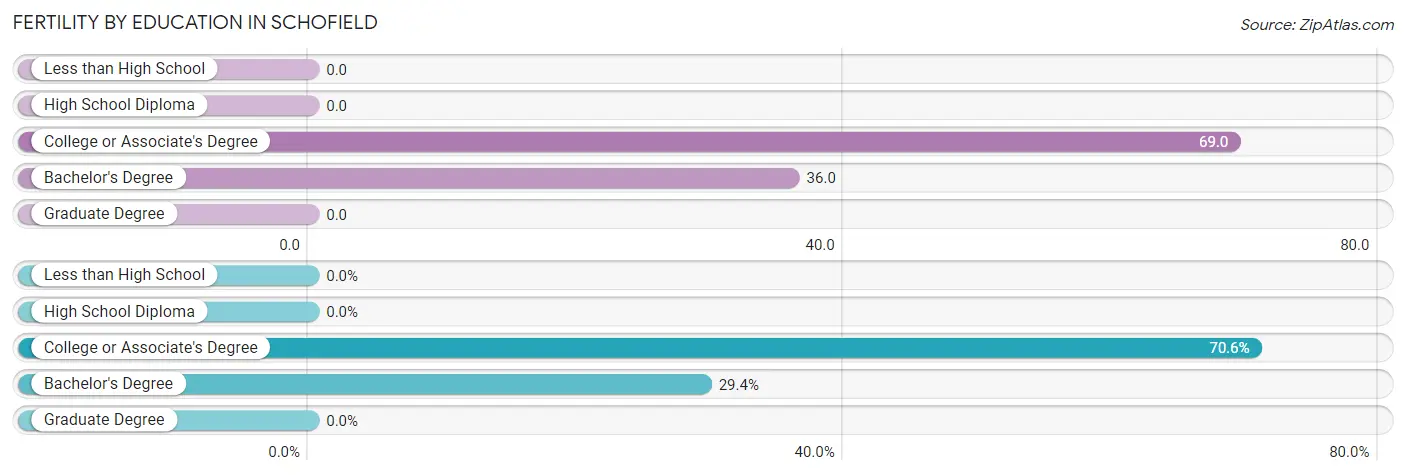
| Educational Attainment | Women with Births | Births / 1,000 Women |
| Less than High School | 0 (0.0%) | 0.0 |
| High School Diploma | 0 (0.0%) | 0.0 |
| College or Associate's Degree | 12 (70.6%) | 69.0 |
| Bachelor's Degree | 5 (29.4%) | 36.0 |
| Graduate Degree | 0 (0.0%) | 0.0 |
| Total | 17 (100.0%) | 33.0 |
Fertility by Education by Marriage Status in Schofield
70.6% of women with births in Schofield are unmarried. Women with the educational attainment of bachelor's degree are most likely to be married with 100.0% of them married at childbirth, while women with the educational attainment of college or associate's degree are least likely to be married with 100.0% of them unmarried at childbirth.
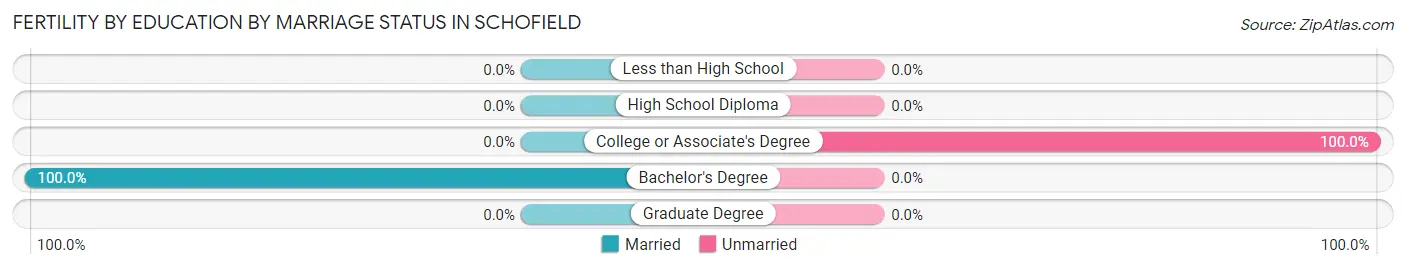
| Educational Attainment | Married | Unmarried |
| Less than High School | 0 (0.0%) | 0 (0.0%) |
| High School Diploma | 0 (0.0%) | 0 (0.0%) |
| College or Associate's Degree | 0 (0.0%) | 12 (100.0%) |
| Bachelor's Degree | 5 (100.0%) | 0 (0.0%) |
| Graduate Degree | 0 (0.0%) | 0 (0.0%) |
| Total | 5 (29.4%) | 12 (70.6%) |
Employment Characteristics in Schofield
Employment by Class of Employer in Schofield
Among the 1,240 employed individuals in Schofield, private company employees (907 | 73.2%), not-for-profit organizations (148 | 11.9%), and local government employees (92 | 7.4%) make up the most common classes of employment.
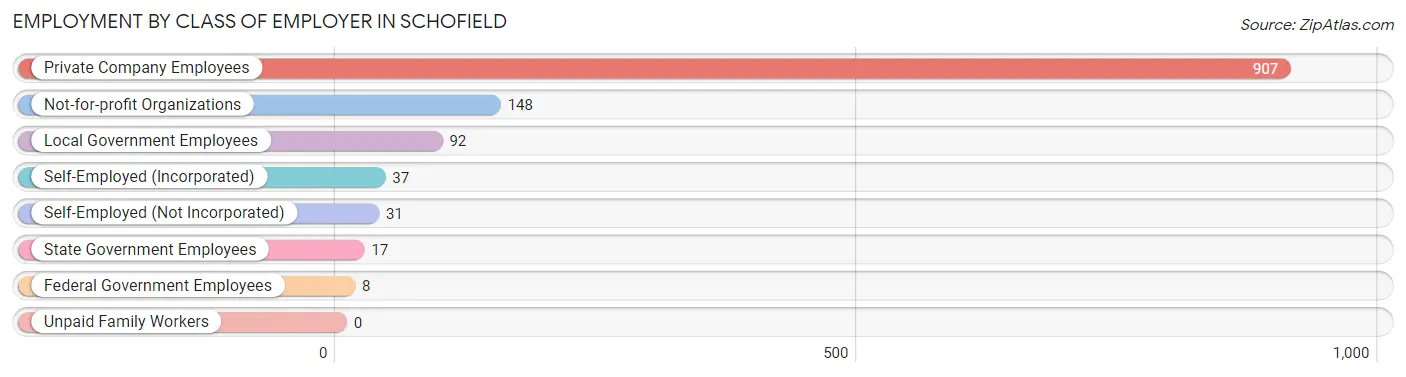
| Employer Class | # Employees | % Employees |
| Private Company Employees | 907 | 73.2% |
| Self-Employed (Incorporated) | 37 | 3.0% |
| Self-Employed (Not Incorporated) | 31 | 2.5% |
| Not-for-profit Organizations | 148 | 11.9% |
| Local Government Employees | 92 | 7.4% |
| State Government Employees | 17 | 1.4% |
| Federal Government Employees | 8 | 0.6% |
| Unpaid Family Workers | 0 | 0.0% |
| Total | 1,240 | 100.0% |
Employment Status by Age in Schofield
According to the labor force statistics for Schofield, out of the total population over 16 years of age (1,829), 72.1% or 1,319 individuals are in the labor force, with 5.9% or 78 of them unemployed. The age group with the highest labor force participation rate is 30 to 34 years, with 95.4% or 165 individuals in the labor force. Within the labor force, the 16 to 19 years age range has the highest percentage of unemployed individuals, with 18.4% or 28 of them being unemployed.
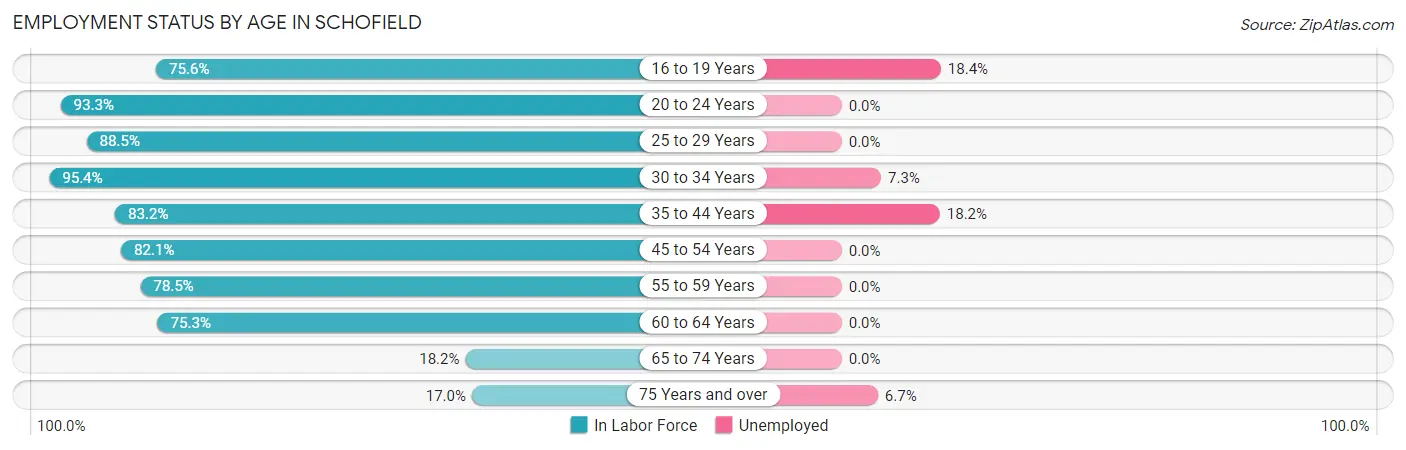
| Age Bracket | In Labor Force | Unemployed |
| 16 to 19 Years | 152 (75.6%) | 28 (18.4%) |
| 20 to 24 Years | 168 (93.3%) | 0 (0.0%) |
| 25 to 29 Years | 92 (88.5%) | 0 (0.0%) |
| 30 to 34 Years | 165 (95.4%) | 12 (7.3%) |
| 35 to 44 Years | 198 (83.2%) | 36 (18.2%) |
| 45 to 54 Years | 229 (82.1%) | 0 (0.0%) |
| 55 to 59 Years | 139 (78.5%) | 0 (0.0%) |
| 60 to 64 Years | 119 (75.3%) | 0 (0.0%) |
| 65 to 74 Years | 26 (18.2%) | 0 (0.0%) |
| 75 Years and over | 30 (17.0%) | 2 (6.7%) |
| Total | 1,319 (72.1%) | 78 (5.9%) |
Employment Status by Educational Attainment in Schofield
According to labor force statistics for Schofield, 83.4% of individuals (942) out of the total population between 25 and 64 years of age (1,129) are in the labor force, with 5.1% or 48 of them being unemployed. The group with the highest labor force participation rate are those with the educational attainment of bachelor's degree or higher, with 90.8% or 275 individuals in the labor force. Within the labor force, individuals with college / associate degree education have the highest percentage of unemployment, with 11.6% or 36 of them being unemployed.
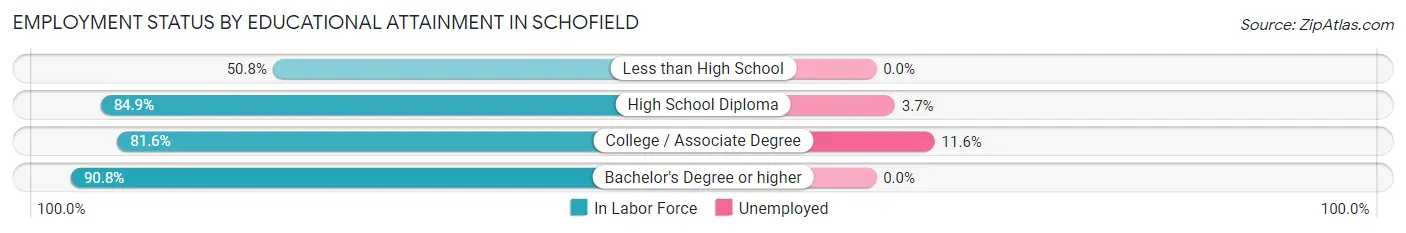
| Educational Attainment | In Labor Force | Unemployed |
| Less than High School | 32 (50.8%) | 0 (0.0%) |
| High School Diploma | 325 (84.9%) | 14 (3.7%) |
| College / Associate Degree | 310 (81.6%) | 44 (11.6%) |
| Bachelor's Degree or higher | 275 (90.8%) | 0 (0.0%) |
| Total | 942 (83.4%) | 58 (5.1%) |
Employment Occupations by Sex in Schofield
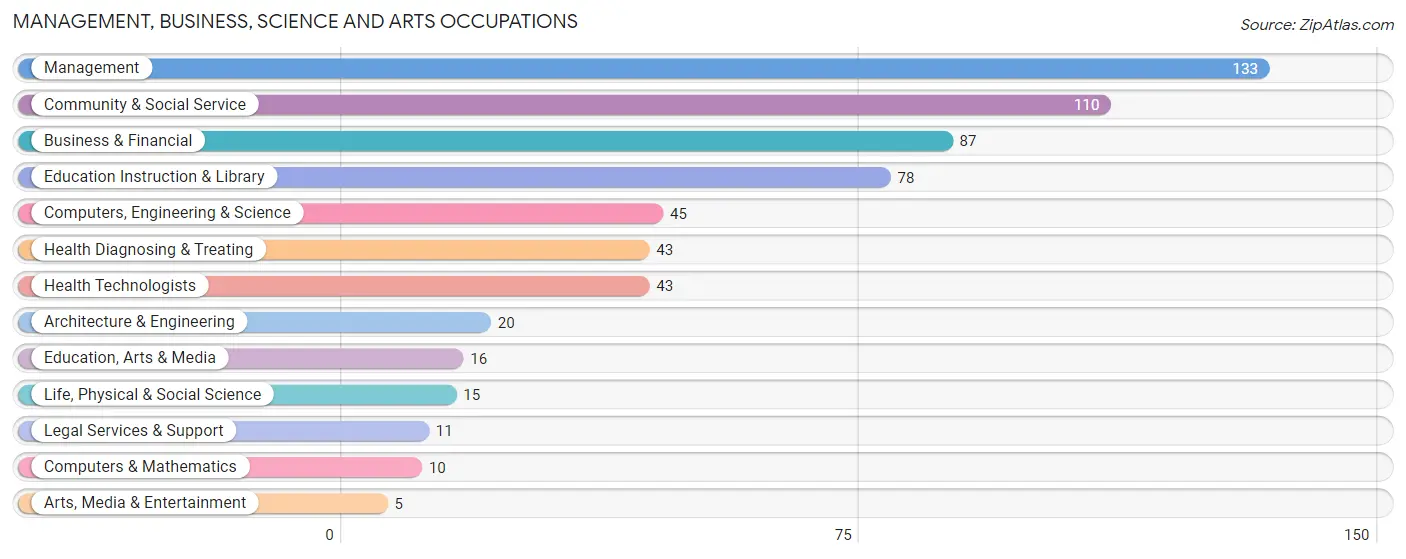
Management, Business, Science and Arts Occupations
The most common Management, Business, Science and Arts occupations in Schofield are Management (133 | 10.7%), Community & Social Service (110 | 8.9%), Business & Financial (87 | 7.0%), Education Instruction & Library (78 | 6.3%), and Computers, Engineering & Science (45 | 3.6%).
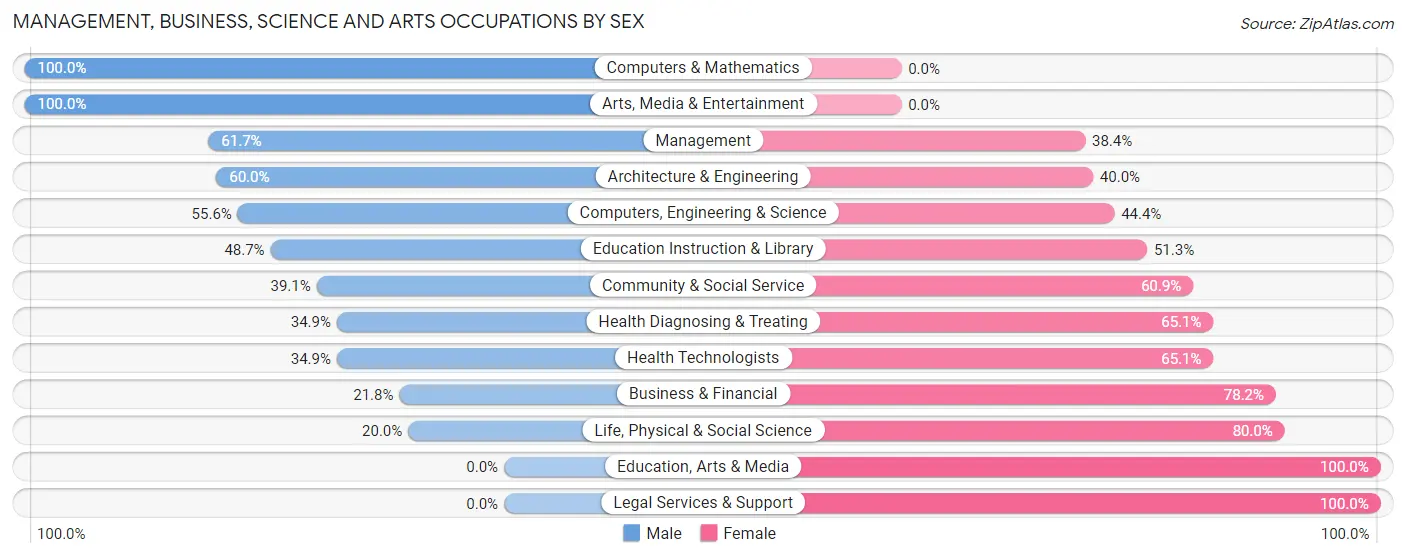
Management, Business, Science and Arts Occupations by Sex
Within the Management, Business, Science and Arts occupations in Schofield, the most male-oriented occupations are Computers & Mathematics (100.0%), Arts, Media & Entertainment (100.0%), and Management (61.7%), while the most female-oriented occupations are Education, Arts & Media (100.0%), Legal Services & Support (100.0%), and Life, Physical & Social Science (80.0%).
| Occupation | Male | Female |
| Management | 82 (61.7%) | 51 (38.4%) |
| Business & Financial | 19 (21.8%) | 68 (78.2%) |
| Computers, Engineering & Science | 25 (55.6%) | 20 (44.4%) |
| Computers & Mathematics | 10 (100.0%) | 0 (0.0%) |
| Architecture & Engineering | 12 (60.0%) | 8 (40.0%) |
| Life, Physical & Social Science | 3 (20.0%) | 12 (80.0%) |
| Community & Social Service | 43 (39.1%) | 67 (60.9%) |
| Education, Arts & Media | 0 (0.0%) | 16 (100.0%) |
| Legal Services & Support | 0 (0.0%) | 11 (100.0%) |
| Education Instruction & Library | 38 (48.7%) | 40 (51.3%) |
| Arts, Media & Entertainment | 5 (100.0%) | 0 (0.0%) |
| Health Diagnosing & Treating | 15 (34.9%) | 28 (65.1%) |
| Health Technologists | 15 (34.9%) | 28 (65.1%) |
| Total (Category) | 184 (44.0%) | 234 (56.0%) |
| Total (Overall) | 716 (57.7%) | 524 (42.3%) |
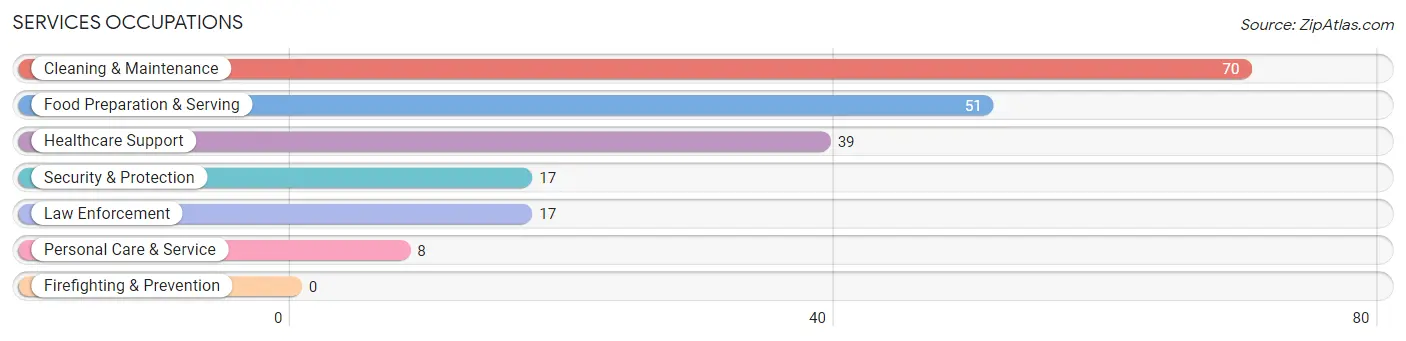
Services Occupations
The most common Services occupations in Schofield are Cleaning & Maintenance (70 | 5.7%), Food Preparation & Serving (51 | 4.1%), Healthcare Support (39 | 3.2%), Security & Protection (17 | 1.4%), and Law Enforcement (17 | 1.4%).
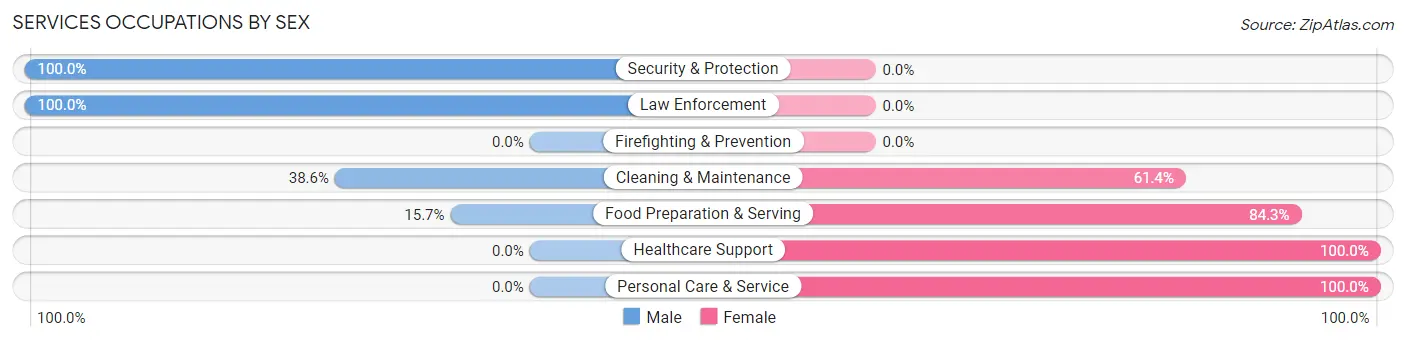
Services Occupations by Sex
Within the Services occupations in Schofield, the most male-oriented occupations are Security & Protection (100.0%), Law Enforcement (100.0%), and Cleaning & Maintenance (38.6%), while the most female-oriented occupations are Healthcare Support (100.0%), Personal Care & Service (100.0%), and Food Preparation & Serving (84.3%).
| Occupation | Male | Female |
| Healthcare Support | 0 (0.0%) | 39 (100.0%) |
| Security & Protection | 17 (100.0%) | 0 (0.0%) |
| Firefighting & Prevention | 0 (0.0%) | 0 (0.0%) |
| Law Enforcement | 17 (100.0%) | 0 (0.0%) |
| Food Preparation & Serving | 8 (15.7%) | 43 (84.3%) |
| Cleaning & Maintenance | 27 (38.6%) | 43 (61.4%) |
| Personal Care & Service | 0 (0.0%) | 8 (100.0%) |
| Total (Category) | 52 (28.1%) | 133 (71.9%) |
| Total (Overall) | 716 (57.7%) | 524 (42.3%) |
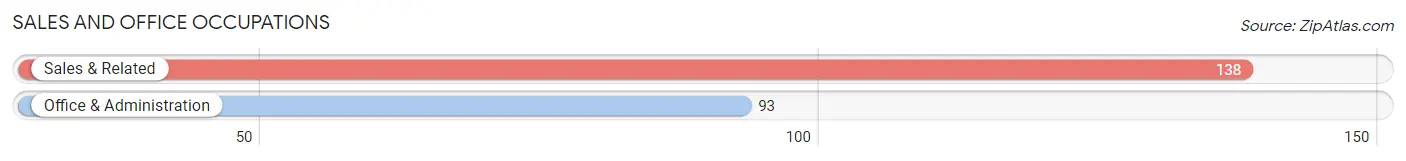
Sales and Office Occupations
The most common Sales and Office occupations in Schofield are Sales & Related (138 | 11.1%), and Office & Administration (93 | 7.5%).
Sales and Office Occupations by Sex
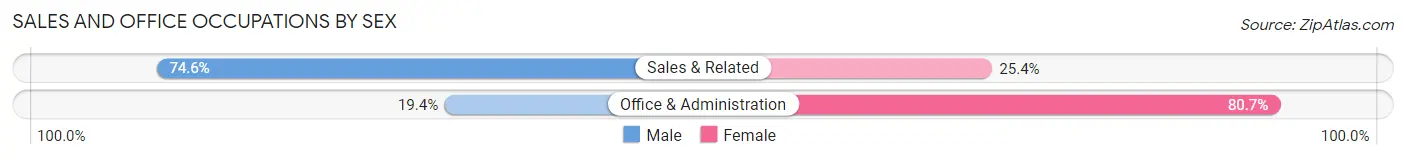
| Occupation | Male | Female |
| Sales & Related | 103 (74.6%) | 35 (25.4%) |
| Office & Administration | 18 (19.4%) | 75 (80.6%) |
| Total (Category) | 121 (52.4%) | 110 (47.6%) |
| Total (Overall) | 716 (57.7%) | 524 (42.3%) |
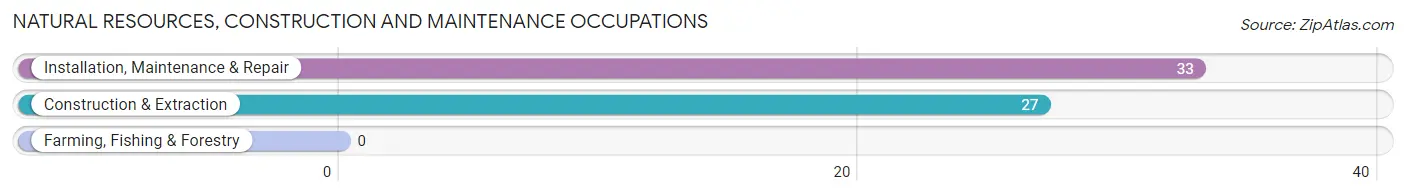
Natural Resources, Construction and Maintenance Occupations
The most common Natural Resources, Construction and Maintenance occupations in Schofield are Installation, Maintenance & Repair (33 | 2.7%), and Construction & Extraction (27 | 2.2%).
Natural Resources, Construction and Maintenance Occupations by Sex
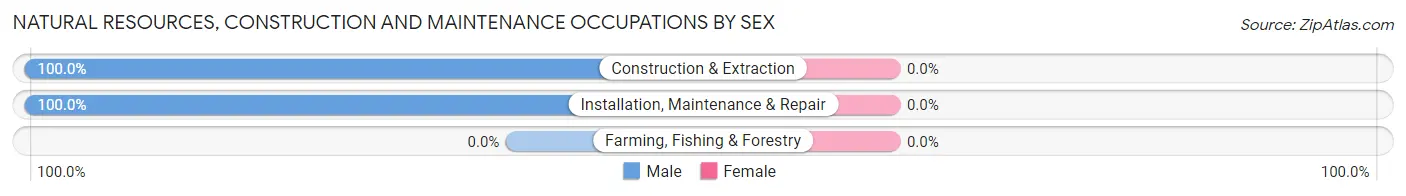
| Occupation | Male | Female |
| Farming, Fishing & Forestry | 0 (0.0%) | 0 (0.0%) |
| Construction & Extraction | 27 (100.0%) | 0 (0.0%) |
| Installation, Maintenance & Repair | 33 (100.0%) | 0 (0.0%) |
| Total (Category) | 60 (100.0%) | 0 (0.0%) |
| Total (Overall) | 716 (57.7%) | 524 (42.3%) |
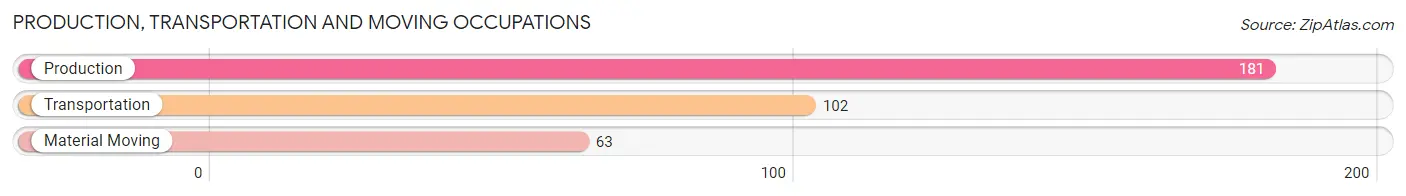
Production, Transportation and Moving Occupations
The most common Production, Transportation and Moving occupations in Schofield are Production (181 | 14.6%), Transportation (102 | 8.2%), and Material Moving (63 | 5.1%).
Production, Transportation and Moving Occupations by Sex
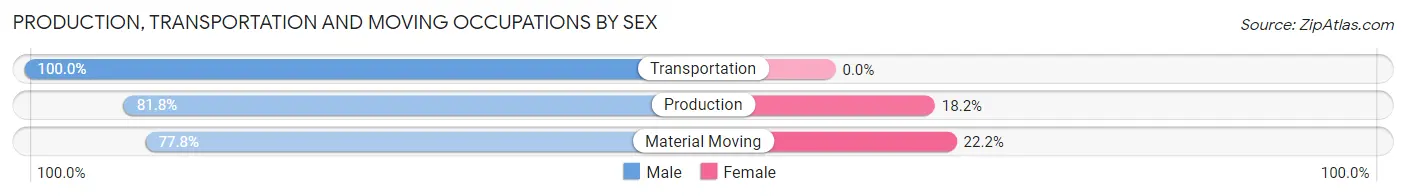
| Occupation | Male | Female |
| Production | 148 (81.8%) | 33 (18.2%) |
| Transportation | 102 (100.0%) | 0 (0.0%) |
| Material Moving | 49 (77.8%) | 14 (22.2%) |
| Total (Category) | 299 (86.4%) | 47 (13.6%) |
| Total (Overall) | 716 (57.7%) | 524 (42.3%) |
Employment Industries by Sex in Schofield
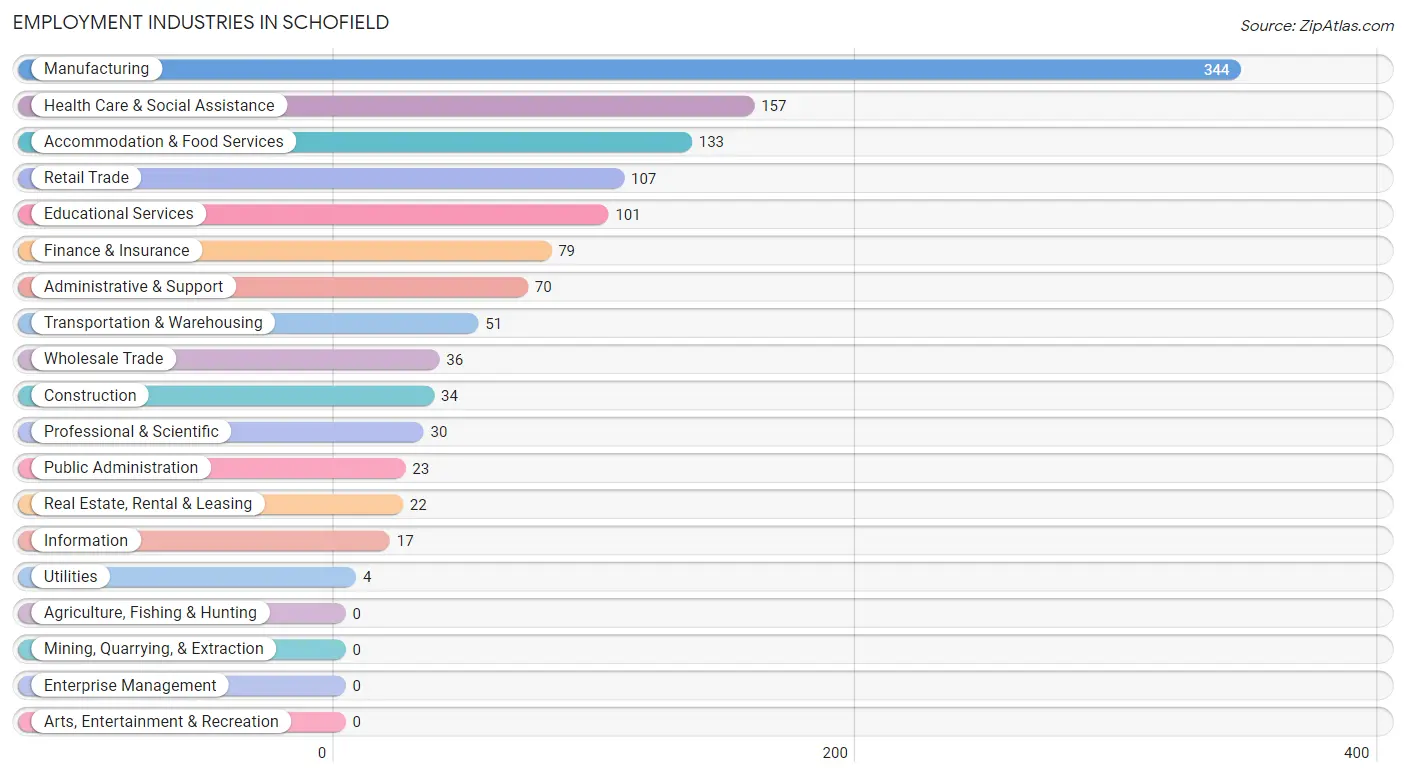
Employment Industries in Schofield
The major employment industries in Schofield include Manufacturing (344 | 27.7%), Health Care & Social Assistance (157 | 12.7%), Accommodation & Food Services (133 | 10.7%), Retail Trade (107 | 8.6%), and Educational Services (101 | 8.2%).
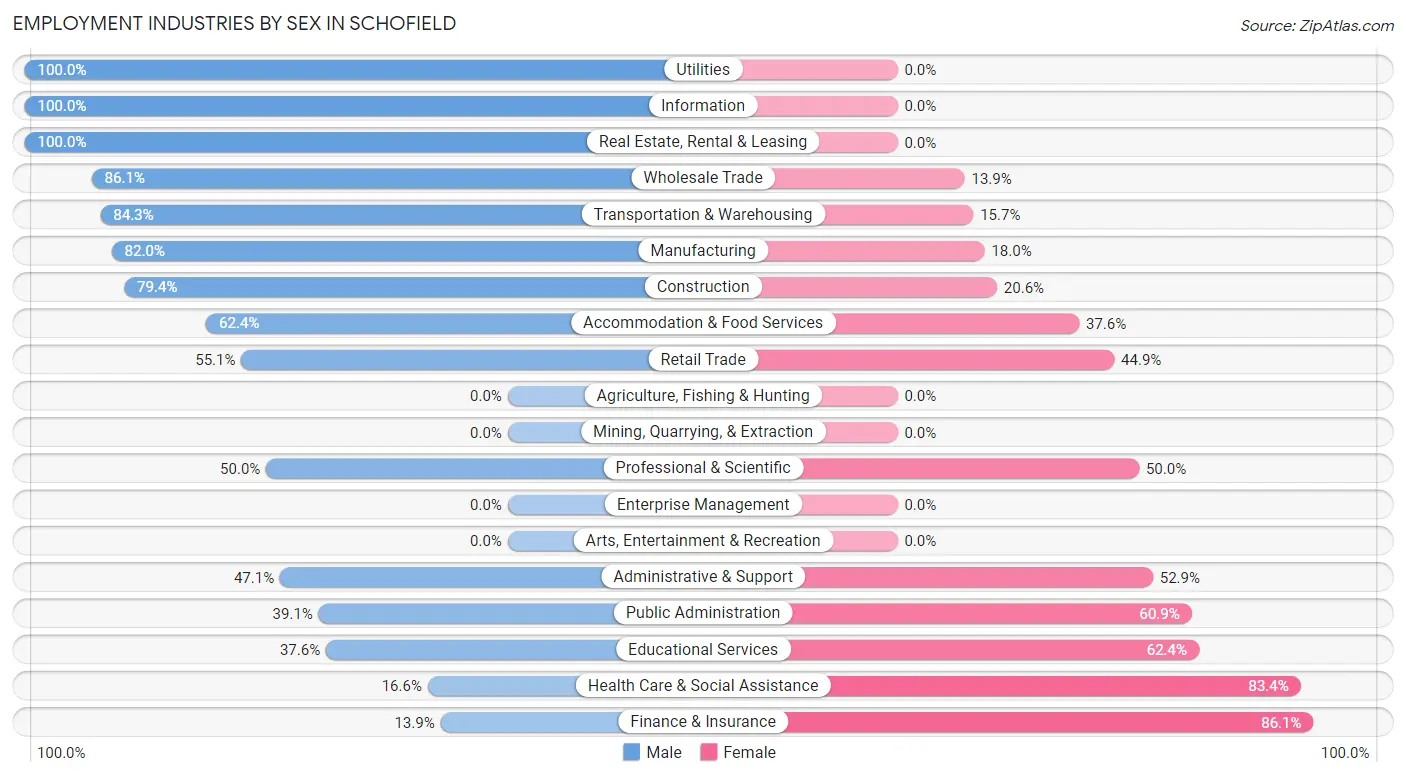
Employment Industries by Sex in Schofield
The Schofield industries that see more men than women are Utilities (100.0%), Information (100.0%), and Real Estate, Rental & Leasing (100.0%), whereas the industries that tend to have a higher number of women are Finance & Insurance (86.1%), Health Care & Social Assistance (83.4%), and Educational Services (62.4%).
| Industry | Male | Female |
| Agriculture, Fishing & Hunting | 0 (0.0%) | 0 (0.0%) |
| Mining, Quarrying, & Extraction | 0 (0.0%) | 0 (0.0%) |
| Construction | 27 (79.4%) | 7 (20.6%) |
| Manufacturing | 282 (82.0%) | 62 (18.0%) |
| Wholesale Trade | 31 (86.1%) | 5 (13.9%) |
| Retail Trade | 59 (55.1%) | 48 (44.9%) |
| Transportation & Warehousing | 43 (84.3%) | 8 (15.7%) |
| Utilities | 4 (100.0%) | 0 (0.0%) |
| Information | 17 (100.0%) | 0 (0.0%) |
| Finance & Insurance | 11 (13.9%) | 68 (86.1%) |
| Real Estate, Rental & Leasing | 22 (100.0%) | 0 (0.0%) |
| Professional & Scientific | 15 (50.0%) | 15 (50.0%) |
| Enterprise Management | 0 (0.0%) | 0 (0.0%) |
| Administrative & Support | 33 (47.1%) | 37 (52.9%) |
| Educational Services | 38 (37.6%) | 63 (62.4%) |
| Health Care & Social Assistance | 26 (16.6%) | 131 (83.4%) |
| Arts, Entertainment & Recreation | 0 (0.0%) | 0 (0.0%) |
| Accommodation & Food Services | 83 (62.4%) | 50 (37.6%) |
| Public Administration | 9 (39.1%) | 14 (60.9%) |
| Total | 716 (57.7%) | 524 (42.3%) |
Education in Schofield
School Enrollment in Schofield
The most common levels of schooling among the 595 students in Schofield are high school (182 | 30.6%), middle school (164 | 27.6%), and college / undergraduate (102 | 17.1%).
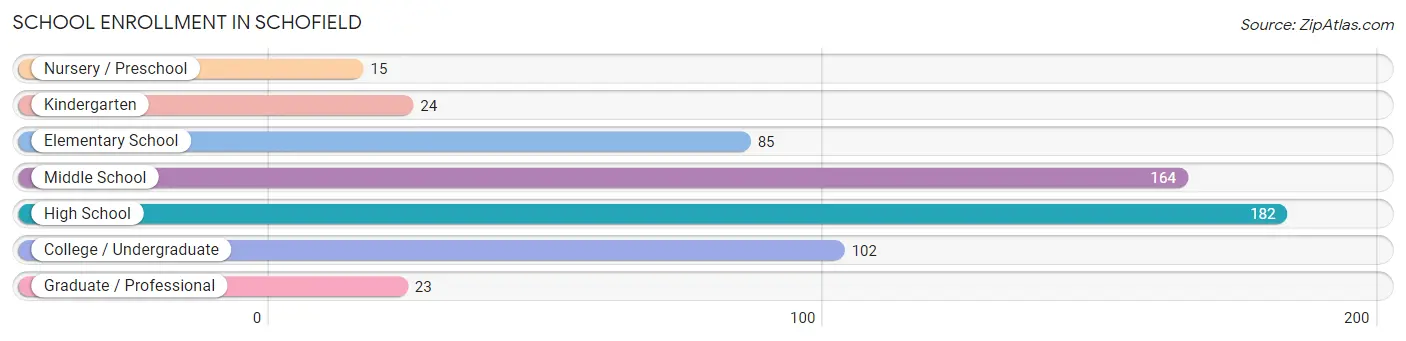
| School Level | # Students | % Students |
| Nursery / Preschool | 15 | 2.5% |
| Kindergarten | 24 | 4.0% |
| Elementary School | 85 | 14.3% |
| Middle School | 164 | 27.6% |
| High School | 182 | 30.6% |
| College / Undergraduate | 102 | 17.1% |
| Graduate / Professional | 23 | 3.9% |
| Total | 595 | 100.0% |
School Enrollment by Age by Funding Source in Schofield
Out of a total of 595 students who are enrolled in schools in Schofield, 93 (15.6%) attend a private institution, while the remaining 502 (84.4%) are enrolled in public schools. The age group of 20 to 24 year olds has the highest likelihood of being enrolled in private schools, with 26 (57.8% in the age bracket) enrolled. Conversely, the age group of 3 to 4 year olds has the lowest likelihood of being enrolled in a private school, with 15 (100.0% in the age bracket) attending a public institution.
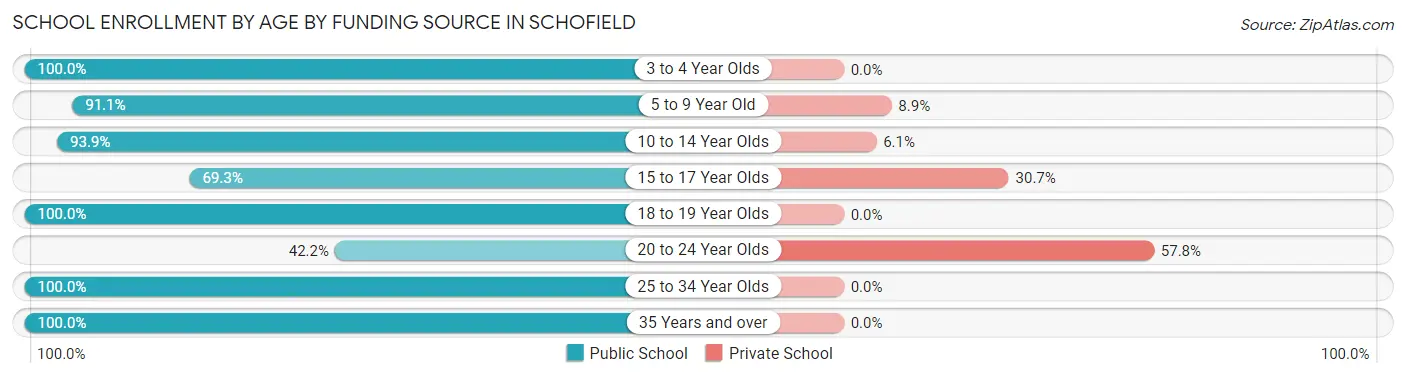
| Age Bracket | Public School | Private School |
| 3 to 4 Year Olds | 15 (100.0%) | 0 (0.0%) |
| 5 to 9 Year Old | 82 (91.1%) | 8 (8.9%) |
| 10 to 14 Year Olds | 186 (93.9%) | 12 (6.1%) |
| 15 to 17 Year Olds | 106 (69.3%) | 47 (30.7%) |
| 18 to 19 Year Olds | 22 (100.0%) | 0 (0.0%) |
| 20 to 24 Year Olds | 19 (42.2%) | 26 (57.8%) |
| 25 to 34 Year Olds | 25 (100.0%) | 0 (0.0%) |
| 35 Years and over | 47 (100.0%) | 0 (0.0%) |
| Total | 502 (84.4%) | 93 (15.6%) |
Educational Attainment by Field of Study in Schofield
Business (166 | 41.3%), bio, nature & agricultural (57 | 14.2%), education (28 | 7.0%), liberal arts & history (24 | 6.0%), and psychology (23 | 5.7%) are the most common fields of study among 402 individuals in Schofield who have obtained a bachelor's degree or higher.
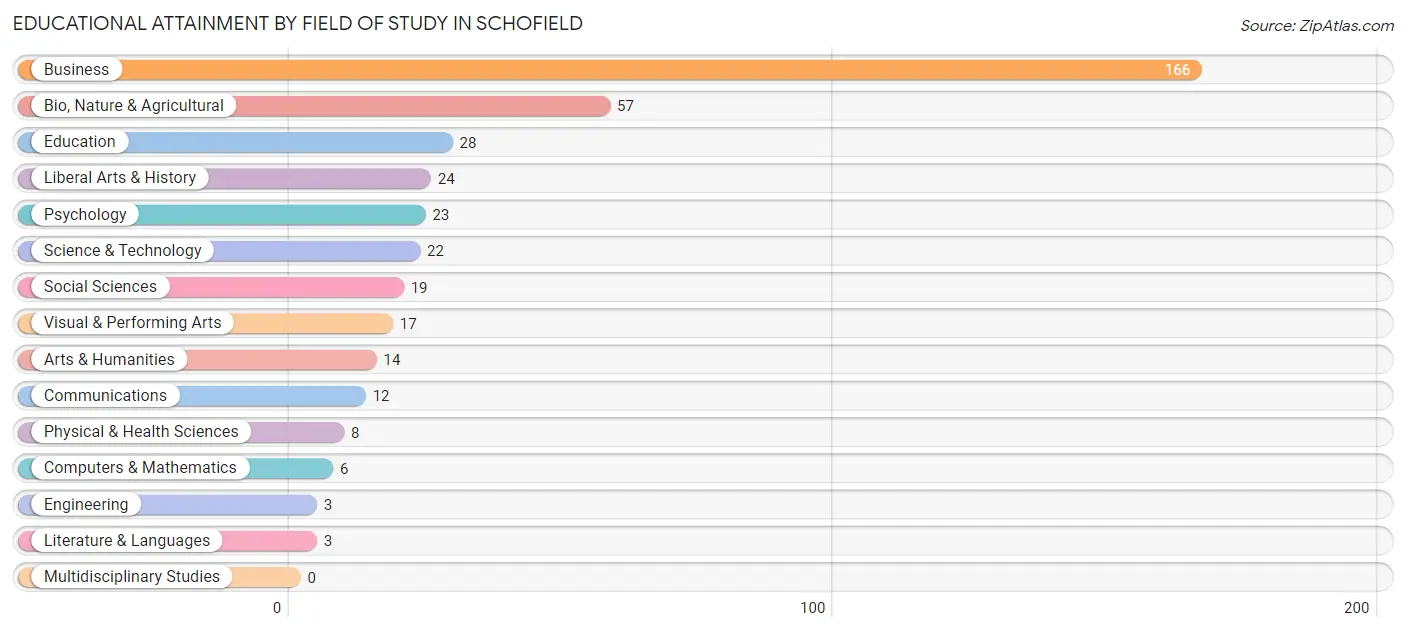
| Field of Study | # Graduates | % Graduates |
| Computers & Mathematics | 6 | 1.5% |
| Bio, Nature & Agricultural | 57 | 14.2% |
| Physical & Health Sciences | 8 | 2.0% |
| Psychology | 23 | 5.7% |
| Social Sciences | 19 | 4.7% |
| Engineering | 3 | 0.7% |
| Multidisciplinary Studies | 0 | 0.0% |
| Science & Technology | 22 | 5.5% |
| Business | 166 | 41.3% |
| Education | 28 | 7.0% |
| Literature & Languages | 3 | 0.7% |
| Liberal Arts & History | 24 | 6.0% |
| Visual & Performing Arts | 17 | 4.2% |
| Communications | 12 | 3.0% |
| Arts & Humanities | 14 | 3.5% |
| Total | 402 | 100.0% |
Transportation & Commute in Schofield
Vehicle Availability by Sex in Schofield
The most prevalent vehicle ownership categories in Schofield are males with 2 vehicles (325, accounting for 45.4%) and females with 2 vehicles (267, making up 62.0%).
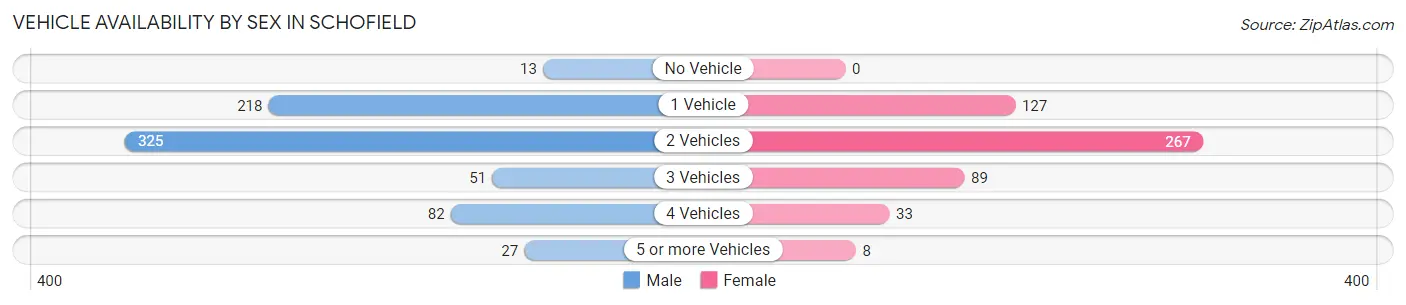
| Vehicles Available | Male | Female |
| No Vehicle | 13 (1.8%) | 0 (0.0%) |
| 1 Vehicle | 218 (30.4%) | 127 (24.2%) |
| 2 Vehicles | 325 (45.4%) | 267 (50.9%) |
| 3 Vehicles | 51 (7.1%) | 89 (17.0%) |
| 4 Vehicles | 82 (11.5%) | 33 (6.3%) |
| 5 or more Vehicles | 27 (3.8%) | 8 (1.5%) |
| Total | 716 (100.0%) | 524 (100.0%) |
Commute Time in Schofield
The most frequently occuring commute durations in Schofield are 15 to 19 minutes (496 commuters, 41.0%), 10 to 14 minutes (268 commuters, 22.2%), and 5 to 9 minutes (230 commuters, 19.0%).
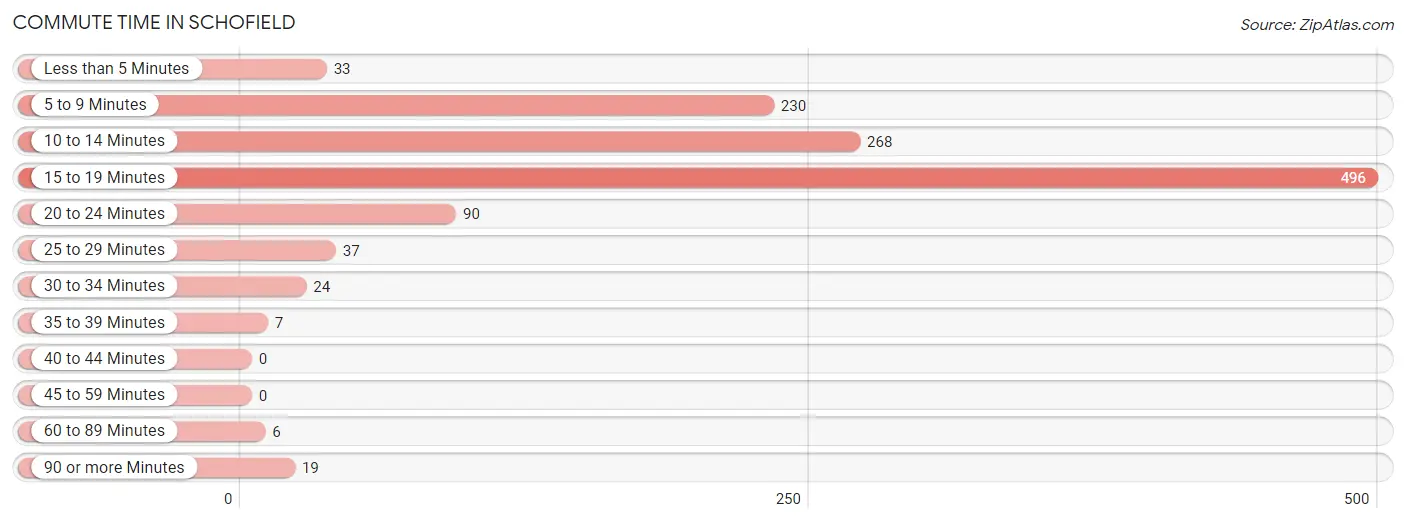
| Commute Time | # Commuters | % Commuters |
| Less than 5 Minutes | 33 | 2.7% |
| 5 to 9 Minutes | 230 | 19.0% |
| 10 to 14 Minutes | 268 | 22.2% |
| 15 to 19 Minutes | 496 | 41.0% |
| 20 to 24 Minutes | 90 | 7.4% |
| 25 to 29 Minutes | 37 | 3.1% |
| 30 to 34 Minutes | 24 | 2.0% |
| 35 to 39 Minutes | 7 | 0.6% |
| 40 to 44 Minutes | 0 | 0.0% |
| 45 to 59 Minutes | 0 | 0.0% |
| 60 to 89 Minutes | 6 | 0.5% |
| 90 or more Minutes | 19 | 1.6% |
Commute Time by Sex in Schofield
The most common commute times in Schofield are 15 to 19 minutes (214 commuters, 30.3%) for males and 15 to 19 minutes (282 commuters, 55.8%) for females.
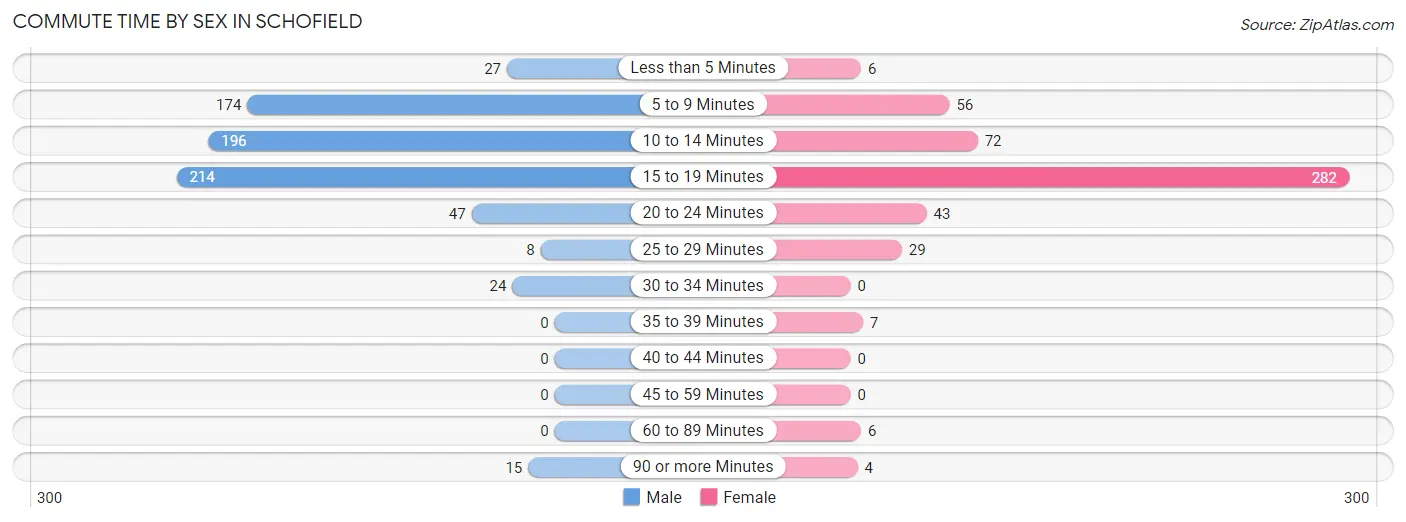
| Commute Time | Male | Female |
| Less than 5 Minutes | 27 (3.8%) | 6 (1.2%) |
| 5 to 9 Minutes | 174 (24.7%) | 56 (11.1%) |
| 10 to 14 Minutes | 196 (27.8%) | 72 (14.3%) |
| 15 to 19 Minutes | 214 (30.3%) | 282 (55.8%) |
| 20 to 24 Minutes | 47 (6.7%) | 43 (8.5%) |
| 25 to 29 Minutes | 8 (1.1%) | 29 (5.7%) |
| 30 to 34 Minutes | 24 (3.4%) | 0 (0.0%) |
| 35 to 39 Minutes | 0 (0.0%) | 7 (1.4%) |
| 40 to 44 Minutes | 0 (0.0%) | 0 (0.0%) |
| 45 to 59 Minutes | 0 (0.0%) | 0 (0.0%) |
| 60 to 89 Minutes | 0 (0.0%) | 6 (1.2%) |
| 90 or more Minutes | 15 (2.1%) | 4 (0.8%) |
Time of Departure to Work by Sex in Schofield
The most frequent times of departure to work in Schofield are 12:00 AM to 4:59 AM (131, 18.6%) for males and 7:30 AM to 7:59 AM (161, 31.9%) for females.
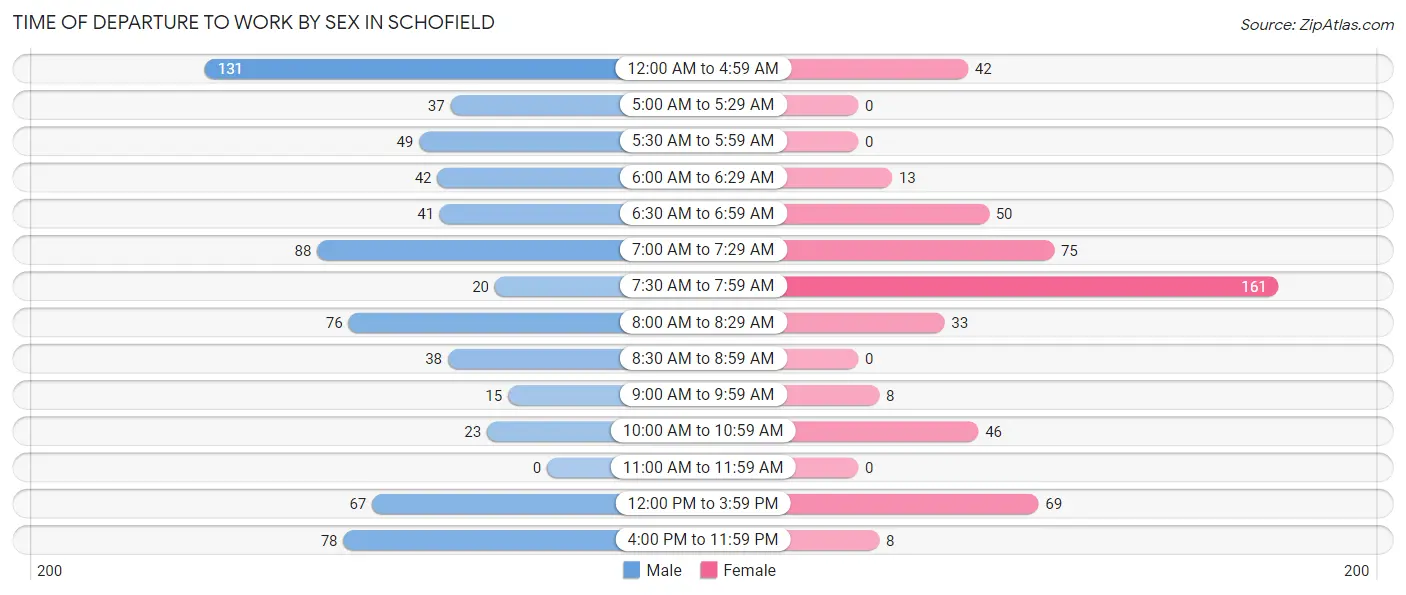
| Time of Departure | Male | Female |
| 12:00 AM to 4:59 AM | 131 (18.6%) | 42 (8.3%) |
| 5:00 AM to 5:29 AM | 37 (5.2%) | 0 (0.0%) |
| 5:30 AM to 5:59 AM | 49 (7.0%) | 0 (0.0%) |
| 6:00 AM to 6:29 AM | 42 (6.0%) | 13 (2.6%) |
| 6:30 AM to 6:59 AM | 41 (5.8%) | 50 (9.9%) |
| 7:00 AM to 7:29 AM | 88 (12.5%) | 75 (14.8%) |
| 7:30 AM to 7:59 AM | 20 (2.8%) | 161 (31.9%) |
| 8:00 AM to 8:29 AM | 76 (10.8%) | 33 (6.5%) |
| 8:30 AM to 8:59 AM | 38 (5.4%) | 0 (0.0%) |
| 9:00 AM to 9:59 AM | 15 (2.1%) | 8 (1.6%) |
| 10:00 AM to 10:59 AM | 23 (3.3%) | 46 (9.1%) |
| 11:00 AM to 11:59 AM | 0 (0.0%) | 0 (0.0%) |
| 12:00 PM to 3:59 PM | 67 (9.5%) | 69 (13.7%) |
| 4:00 PM to 11:59 PM | 78 (11.1%) | 8 (1.6%) |
| Total | 705 (100.0%) | 505 (100.0%) |
Housing Occupancy in Schofield
Occupancy by Ownership in Schofield
Of the total 1,050 dwellings in Schofield, owner-occupied units account for 529 (50.4%), while renter-occupied units make up 521 (49.6%).
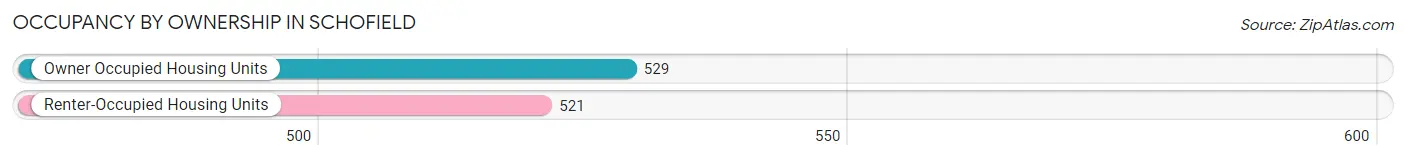
| Occupancy | # Housing Units | % Housing Units |
| Owner Occupied Housing Units | 529 | 50.4% |
| Renter-Occupied Housing Units | 521 | 49.6% |
| Total Occupied Housing Units | 1,050 | 100.0% |
Occupancy by Household Size in Schofield
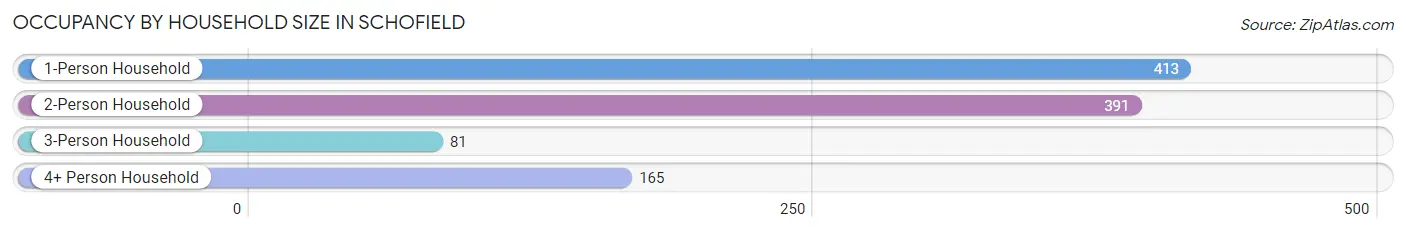
| Household Size | # Housing Units | % Housing Units |
| 1-Person Household | 413 | 39.3% |
| 2-Person Household | 391 | 37.2% |
| 3-Person Household | 81 | 7.7% |
| 4+ Person Household | 165 | 15.7% |
| Total Housing Units | 1,050 | 100.0% |
Occupancy by Ownership by Household Size in Schofield
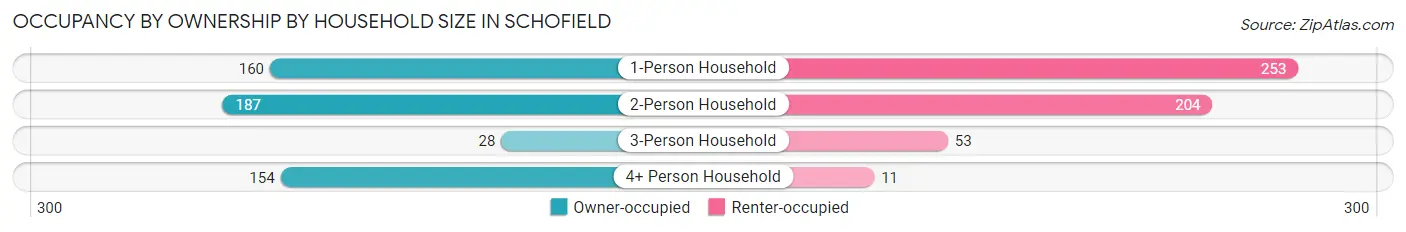
| Household Size | Owner-occupied | Renter-occupied |
| 1-Person Household | 160 (38.7%) | 253 (61.3%) |
| 2-Person Household | 187 (47.8%) | 204 (52.2%) |
| 3-Person Household | 28 (34.6%) | 53 (65.4%) |
| 4+ Person Household | 154 (93.3%) | 11 (6.7%) |
| Total Housing Units | 529 (50.4%) | 521 (49.6%) |
Occupancy by Educational Attainment in Schofield
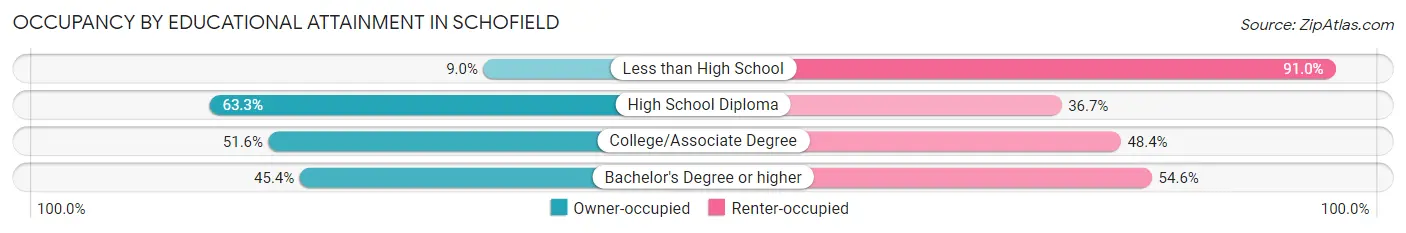
| Household Size | Owner-occupied | Renter-occupied |
| Less than High School | 6 (9.0%) | 61 (91.0%) |
| High School Diploma | 202 (63.3%) | 117 (36.7%) |
| College/Associate Degree | 164 (51.6%) | 154 (48.4%) |
| Bachelor's Degree or higher | 157 (45.4%) | 189 (54.6%) |
Occupancy by Age of Householder in Schofield
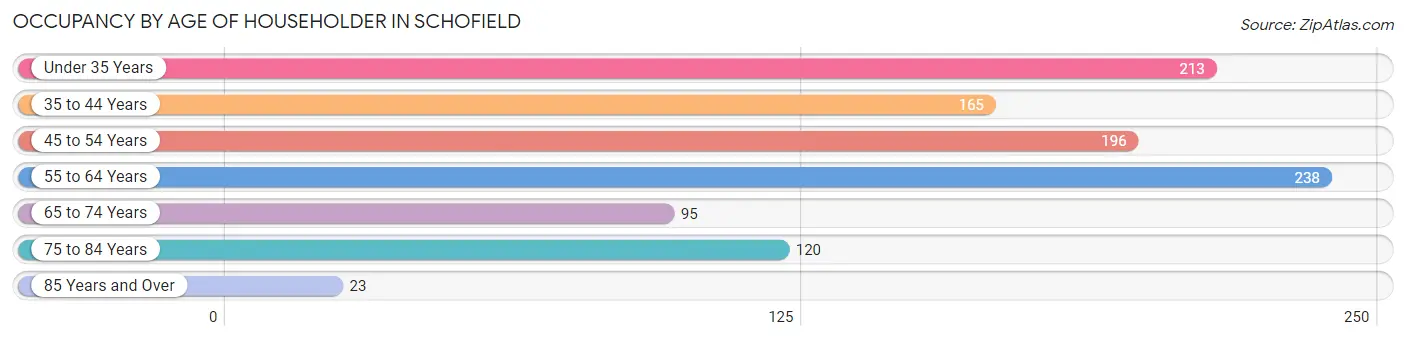
| Age Bracket | # Households | % Households |
| Under 35 Years | 213 | 20.3% |
| 35 to 44 Years | 165 | 15.7% |
| 45 to 54 Years | 196 | 18.7% |
| 55 to 64 Years | 238 | 22.7% |
| 65 to 74 Years | 95 | 9.0% |
| 75 to 84 Years | 120 | 11.4% |
| 85 Years and Over | 23 | 2.2% |
| Total | 1,050 | 100.0% |
Housing Finances in Schofield
Median Income by Occupancy in Schofield
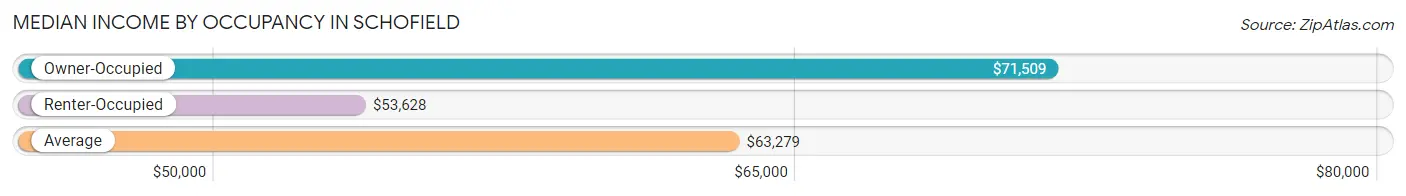
| Occupancy Type | # Households | Median Income |
| Owner-Occupied | 529 (50.4%) | $71,509 |
| Renter-Occupied | 521 (49.6%) | $53,628 |
| Average | 1,050 (100.0%) | $63,279 |
Occupancy by Householder Income Bracket in Schofield
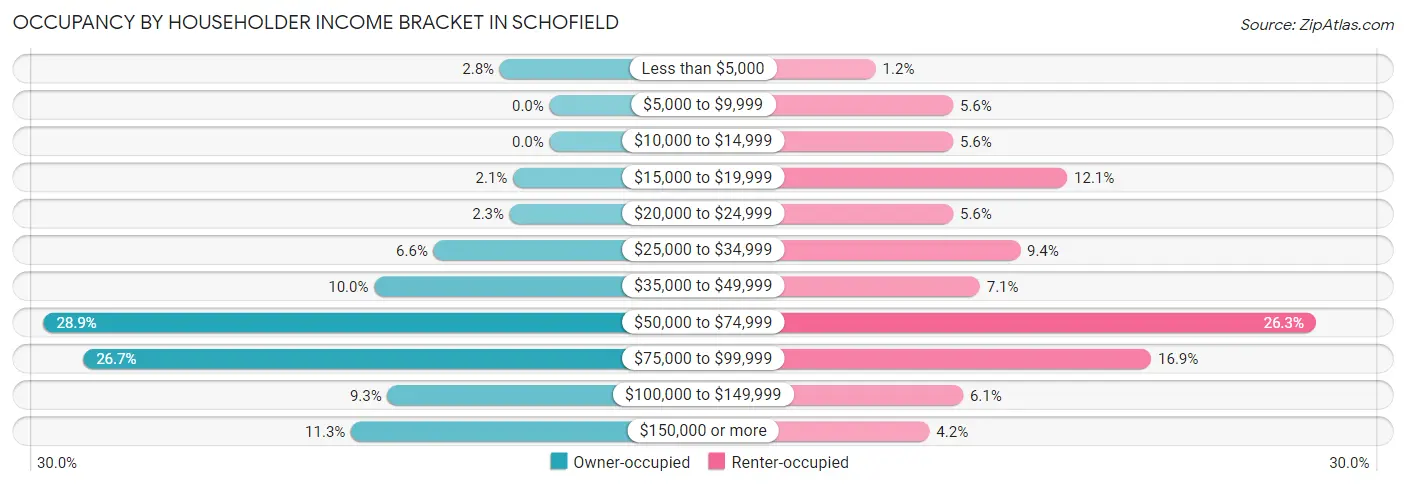
| Income Bracket | Owner-occupied | Renter-occupied |
| Less than $5,000 | 15 (2.8%) | 6 (1.1%) |
| $5,000 to $9,999 | 0 (0.0%) | 29 (5.6%) |
| $10,000 to $14,999 | 0 (0.0%) | 29 (5.6%) |
| $15,000 to $19,999 | 11 (2.1%) | 63 (12.1%) |
| $20,000 to $24,999 | 12 (2.3%) | 29 (5.6%) |
| $25,000 to $34,999 | 35 (6.6%) | 49 (9.4%) |
| $35,000 to $49,999 | 53 (10.0%) | 37 (7.1%) |
| $50,000 to $74,999 | 153 (28.9%) | 137 (26.3%) |
| $75,000 to $99,999 | 141 (26.7%) | 88 (16.9%) |
| $100,000 to $149,999 | 49 (9.3%) | 32 (6.1%) |
| $150,000 or more | 60 (11.3%) | 22 (4.2%) |
| Total | 529 (100.0%) | 521 (100.0%) |
Monthly Housing Cost Tiers in Schofield
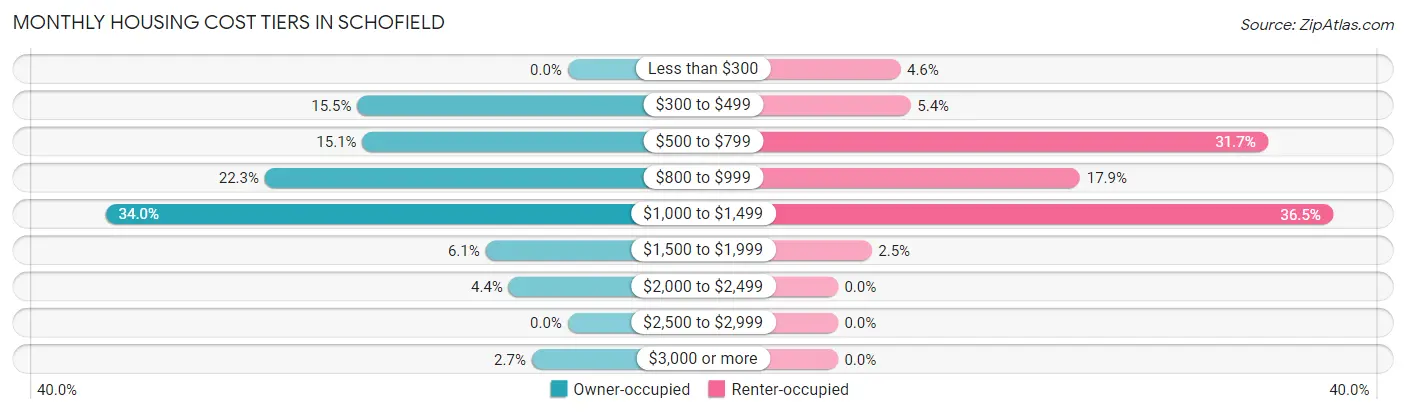
| Monthly Cost | Owner-occupied | Renter-occupied |
| Less than $300 | 0 (0.0%) | 24 (4.6%) |
| $300 to $499 | 82 (15.5%) | 28 (5.4%) |
| $500 to $799 | 80 (15.1%) | 165 (31.7%) |
| $800 to $999 | 118 (22.3%) | 93 (17.8%) |
| $1,000 to $1,499 | 180 (34.0%) | 190 (36.5%) |
| $1,500 to $1,999 | 32 (6.0%) | 13 (2.5%) |
| $2,000 to $2,499 | 23 (4.3%) | 0 (0.0%) |
| $2,500 to $2,999 | 0 (0.0%) | 0 (0.0%) |
| $3,000 or more | 14 (2.6%) | 0 (0.0%) |
| Total | 529 (100.0%) | 521 (100.0%) |
Physical Housing Characteristics in Schofield
Housing Structures in Schofield
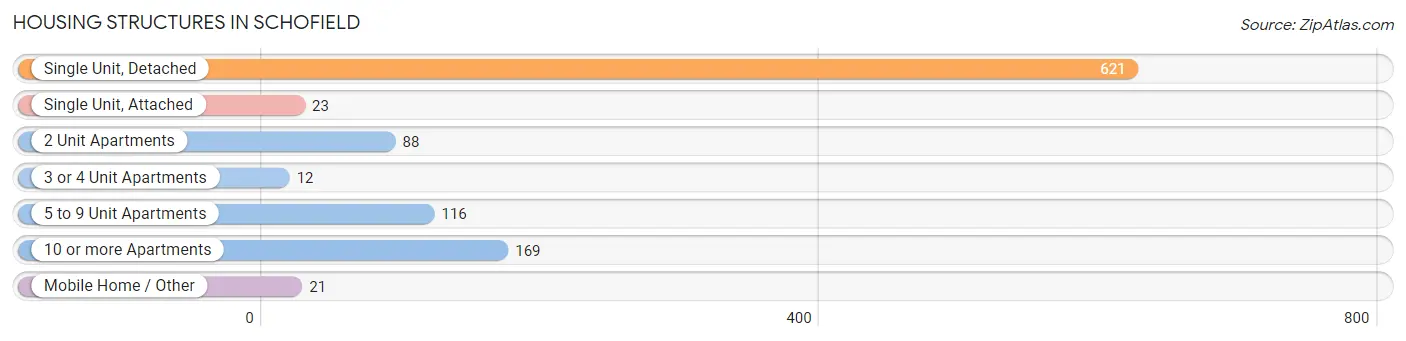
| Structure Type | # Housing Units | % Housing Units |
| Single Unit, Detached | 621 | 59.1% |
| Single Unit, Attached | 23 | 2.2% |
| 2 Unit Apartments | 88 | 8.4% |
| 3 or 4 Unit Apartments | 12 | 1.1% |
| 5 to 9 Unit Apartments | 116 | 11.1% |
| 10 or more Apartments | 169 | 16.1% |
| Mobile Home / Other | 21 | 2.0% |
| Total | 1,050 | 100.0% |
Housing Structures by Occupancy in Schofield
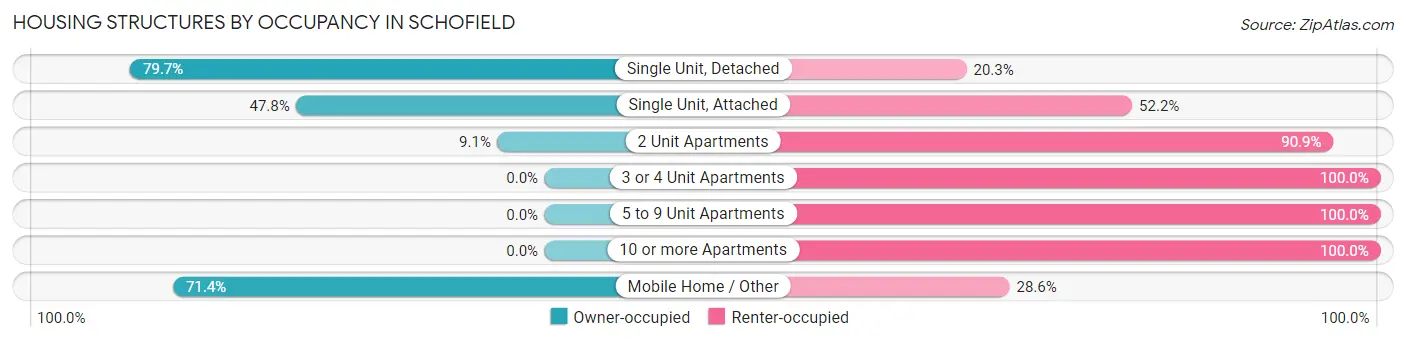
| Structure Type | Owner-occupied | Renter-occupied |
| Single Unit, Detached | 495 (79.7%) | 126 (20.3%) |
| Single Unit, Attached | 11 (47.8%) | 12 (52.2%) |
| 2 Unit Apartments | 8 (9.1%) | 80 (90.9%) |
| 3 or 4 Unit Apartments | 0 (0.0%) | 12 (100.0%) |
| 5 to 9 Unit Apartments | 0 (0.0%) | 116 (100.0%) |
| 10 or more Apartments | 0 (0.0%) | 169 (100.0%) |
| Mobile Home / Other | 15 (71.4%) | 6 (28.6%) |
| Total | 529 (50.4%) | 521 (49.6%) |
Housing Structures by Number of Rooms in Schofield
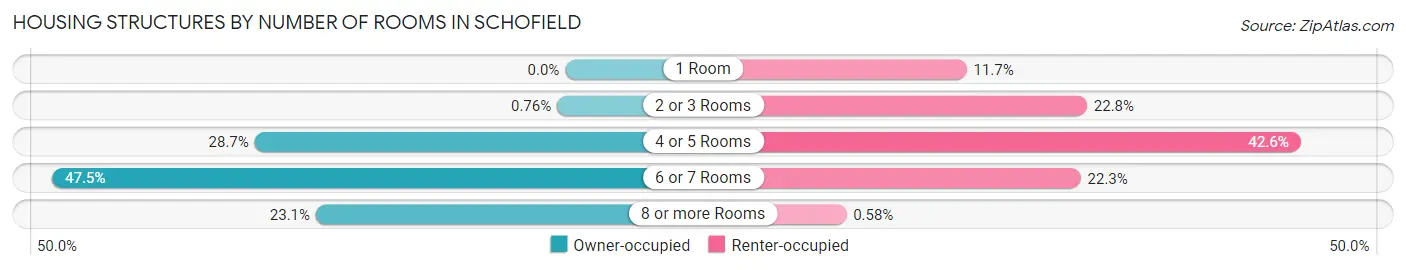
| Number of Rooms | Owner-occupied | Renter-occupied |
| 1 Room | 0 (0.0%) | 61 (11.7%) |
| 2 or 3 Rooms | 4 (0.8%) | 119 (22.8%) |
| 4 or 5 Rooms | 152 (28.7%) | 222 (42.6%) |
| 6 or 7 Rooms | 251 (47.4%) | 116 (22.3%) |
| 8 or more Rooms | 122 (23.1%) | 3 (0.6%) |
| Total | 529 (100.0%) | 521 (100.0%) |
Housing Structure by Heating Type in Schofield
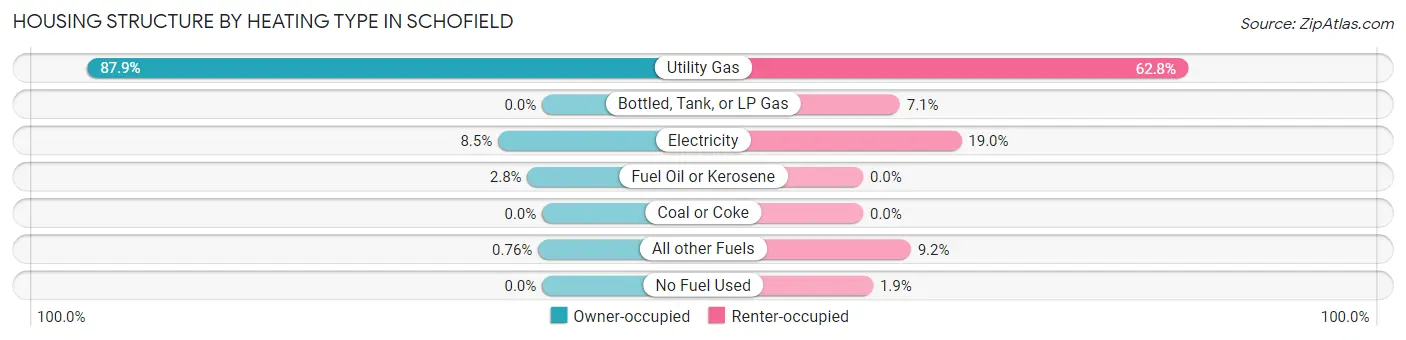
| Heating Type | Owner-occupied | Renter-occupied |
| Utility Gas | 465 (87.9%) | 327 (62.8%) |
| Bottled, Tank, or LP Gas | 0 (0.0%) | 37 (7.1%) |
| Electricity | 45 (8.5%) | 99 (19.0%) |
| Fuel Oil or Kerosene | 15 (2.8%) | 0 (0.0%) |
| Coal or Coke | 0 (0.0%) | 0 (0.0%) |
| All other Fuels | 4 (0.8%) | 48 (9.2%) |
| No Fuel Used | 0 (0.0%) | 10 (1.9%) |
| Total | 529 (100.0%) | 521 (100.0%) |
Household Vehicle Usage in Schofield
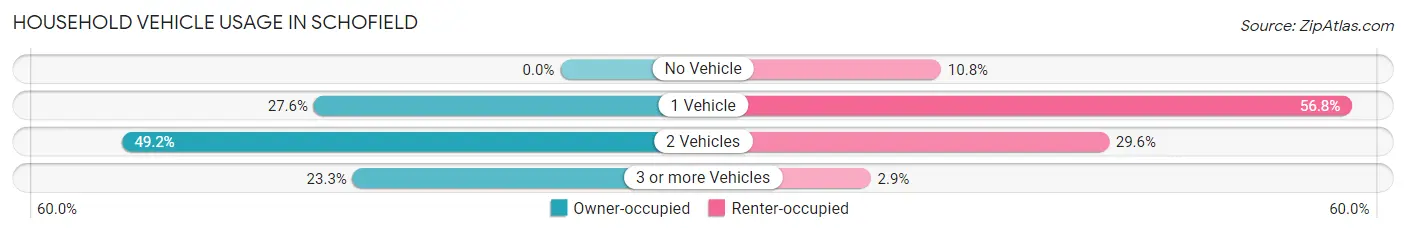
| Vehicles per Household | Owner-occupied | Renter-occupied |
| No Vehicle | 0 (0.0%) | 56 (10.7%) |
| 1 Vehicle | 146 (27.6%) | 296 (56.8%) |
| 2 Vehicles | 260 (49.1%) | 154 (29.6%) |
| 3 or more Vehicles | 123 (23.3%) | 15 (2.9%) |
| Total | 529 (100.0%) | 521 (100.0%) |
Real Estate & Mortgages in Schofield
Real Estate and Mortgage Overview in Schofield
| Characteristic | Without Mortgage | With Mortgage |
| Housing Units | 137 | 392 |
| Median Property Value | $135,500 | $133,300 |
| Median Household Income | $72,292 | $54 |
| Monthly Housing Costs | $461 | $14 |
| Real Estate Taxes | $2,482 | $0 |
Property Value by Mortgage Status in Schofield
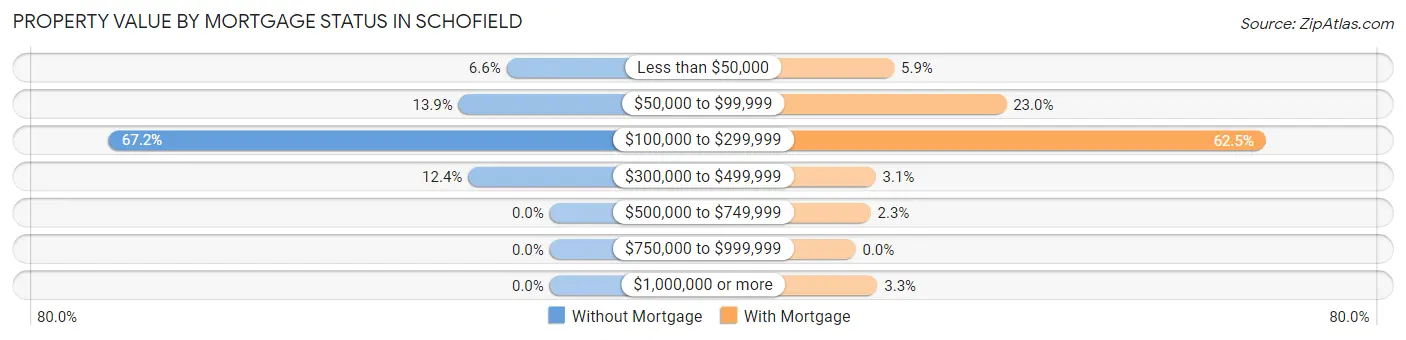
| Property Value | Without Mortgage | With Mortgage |
| Less than $50,000 | 9 (6.6%) | 23 (5.9%) |
| $50,000 to $99,999 | 19 (13.9%) | 90 (23.0%) |
| $100,000 to $299,999 | 92 (67.1%) | 245 (62.5%) |
| $300,000 to $499,999 | 17 (12.4%) | 12 (3.1%) |
| $500,000 to $749,999 | 0 (0.0%) | 9 (2.3%) |
| $750,000 to $999,999 | 0 (0.0%) | 0 (0.0%) |
| $1,000,000 or more | 0 (0.0%) | 13 (3.3%) |
| Total | 137 (100.0%) | 392 (100.0%) |
Household Income by Mortgage Status in Schofield
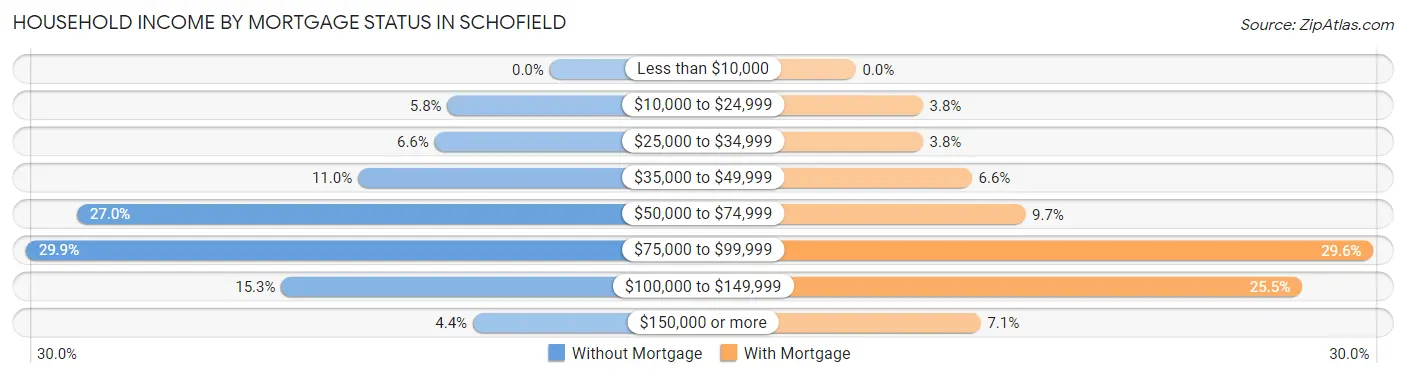
| Household Income | Without Mortgage | With Mortgage |
| Less than $10,000 | 0 (0.0%) | 0 (0.0%) |
| $10,000 to $24,999 | 8 (5.8%) | 15 (3.8%) |
| $25,000 to $34,999 | 9 (6.6%) | 15 (3.8%) |
| $35,000 to $49,999 | 15 (11.0%) | 26 (6.6%) |
| $50,000 to $74,999 | 37 (27.0%) | 38 (9.7%) |
| $75,000 to $99,999 | 41 (29.9%) | 116 (29.6%) |
| $100,000 to $149,999 | 21 (15.3%) | 100 (25.5%) |
| $150,000 or more | 6 (4.4%) | 28 (7.1%) |
| Total | 137 (100.0%) | 392 (100.0%) |
Property Value to Household Income Ratio in Schofield
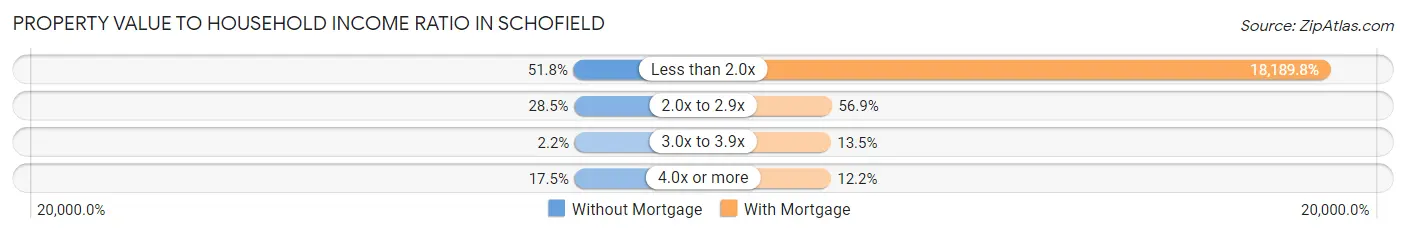
| Value-to-Income Ratio | Without Mortgage | With Mortgage |
| Less than 2.0x | 71 (51.8%) | 71,304 (18,189.8%) |
| 2.0x to 2.9x | 39 (28.5%) | 223 (56.9%) |
| 3.0x to 3.9x | 3 (2.2%) | 53 (13.5%) |
| 4.0x or more | 24 (17.5%) | 48 (12.2%) |
| Total | 137 (100.0%) | 392 (100.0%) |
Real Estate Taxes by Mortgage Status in Schofield
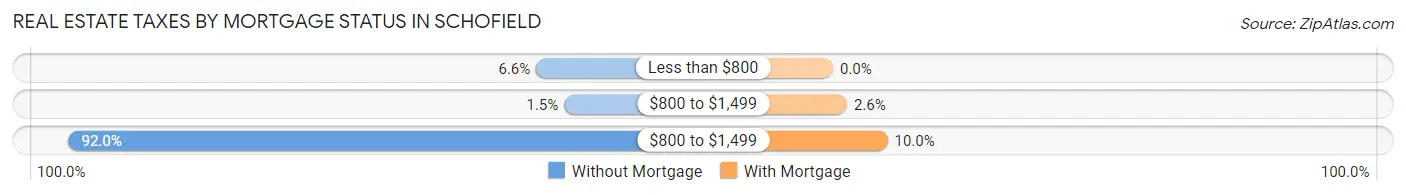
| Property Taxes | Without Mortgage | With Mortgage |
| Less than $800 | 9 (6.6%) | 0 (0.0%) |
| $800 to $1,499 | 2 (1.5%) | 10 (2.5%) |
| $800 to $1,499 | 126 (92.0%) | 39 (10.0%) |
| Total | 137 (100.0%) | 392 (100.0%) |
Health & Disability in Schofield
Health Insurance Coverage by Age in Schofield
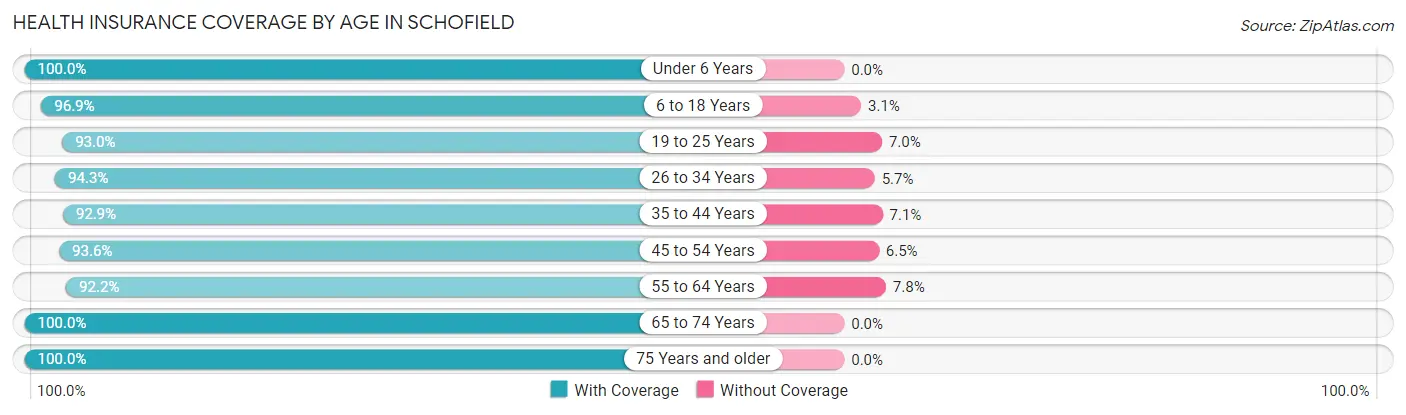
| Age Bracket | With Coverage | Without Coverage |
| Under 6 Years | 68 (100.0%) | 0 (0.0%) |
| 6 to 18 Years | 495 (96.9%) | 16 (3.1%) |
| 19 to 25 Years | 225 (93.0%) | 17 (7.0%) |
| 26 to 34 Years | 249 (94.3%) | 15 (5.7%) |
| 35 to 44 Years | 221 (92.9%) | 17 (7.1%) |
| 45 to 54 Years | 261 (93.5%) | 18 (6.5%) |
| 55 to 64 Years | 309 (92.2%) | 26 (7.8%) |
| 65 to 74 Years | 143 (100.0%) | 0 (0.0%) |
| 75 Years and older | 176 (100.0%) | 0 (0.0%) |
| Total | 2,147 (95.2%) | 109 (4.8%) |
Health Insurance Coverage by Citizenship Status in Schofield
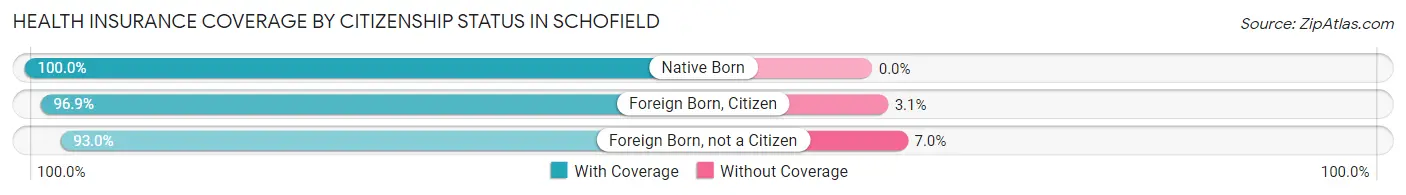
| Citizenship Status | With Coverage | Without Coverage |
| Native Born | 68 (100.0%) | 0 (0.0%) |
| Foreign Born, Citizen | 495 (96.9%) | 16 (3.1%) |
| Foreign Born, not a Citizen | 225 (93.0%) | 17 (7.0%) |
Health Insurance Coverage by Household Income in Schofield
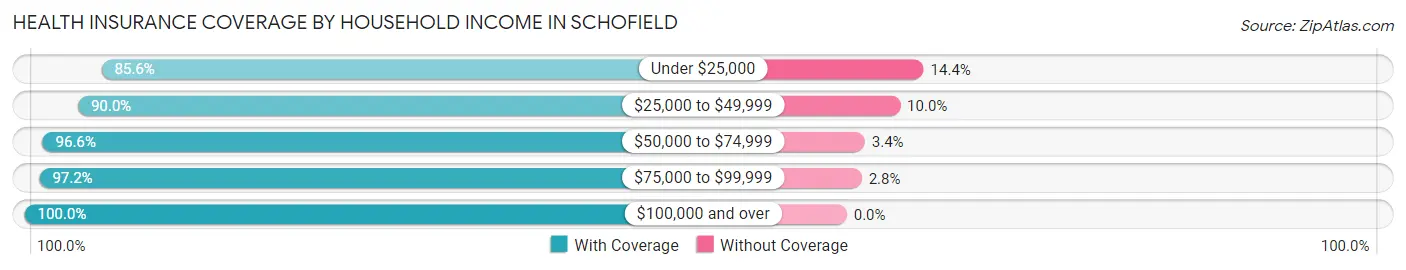
| Household Income | With Coverage | Without Coverage |
| Under $25,000 | 214 (85.6%) | 36 (14.4%) |
| $25,000 to $49,999 | 306 (90.0%) | 34 (10.0%) |
| $50,000 to $74,999 | 601 (96.6%) | 21 (3.4%) |
| $75,000 to $99,999 | 627 (97.2%) | 18 (2.8%) |
| $100,000 and over | 399 (100.0%) | 0 (0.0%) |
Public vs Private Health Insurance Coverage by Age in Schofield
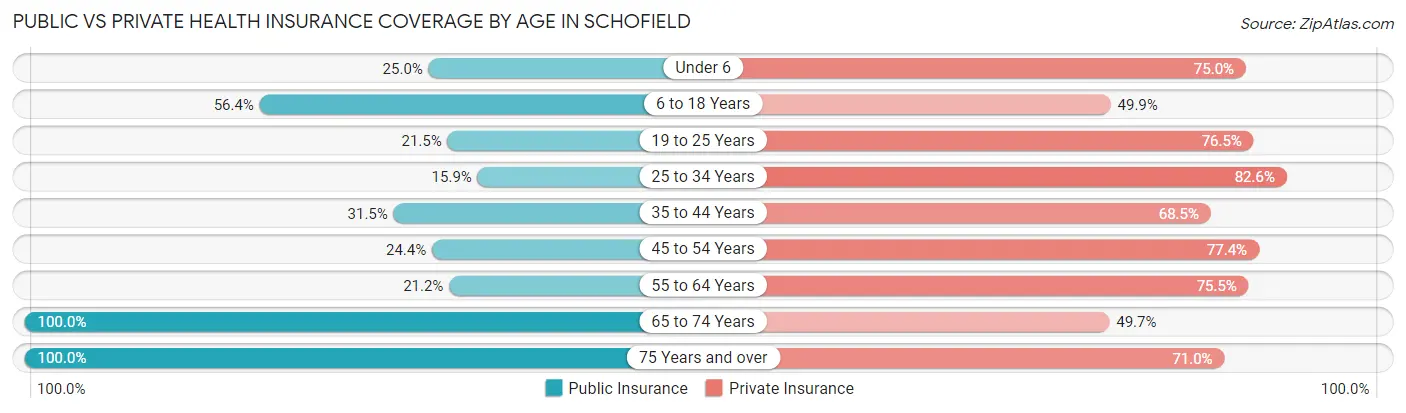
| Age Bracket | Public Insurance | Private Insurance |
| Under 6 | 17 (25.0%) | 51 (75.0%) |
| 6 to 18 Years | 288 (56.4%) | 255 (49.9%) |
| 19 to 25 Years | 52 (21.5%) | 185 (76.4%) |
| 25 to 34 Years | 42 (15.9%) | 218 (82.6%) |
| 35 to 44 Years | 75 (31.5%) | 163 (68.5%) |
| 45 to 54 Years | 68 (24.4%) | 216 (77.4%) |
| 55 to 64 Years | 71 (21.2%) | 253 (75.5%) |
| 65 to 74 Years | 143 (100.0%) | 71 (49.6%) |
| 75 Years and over | 176 (100.0%) | 125 (71.0%) |
| Total | 932 (41.3%) | 1,537 (68.1%) |
Disability Status by Sex by Age in Schofield
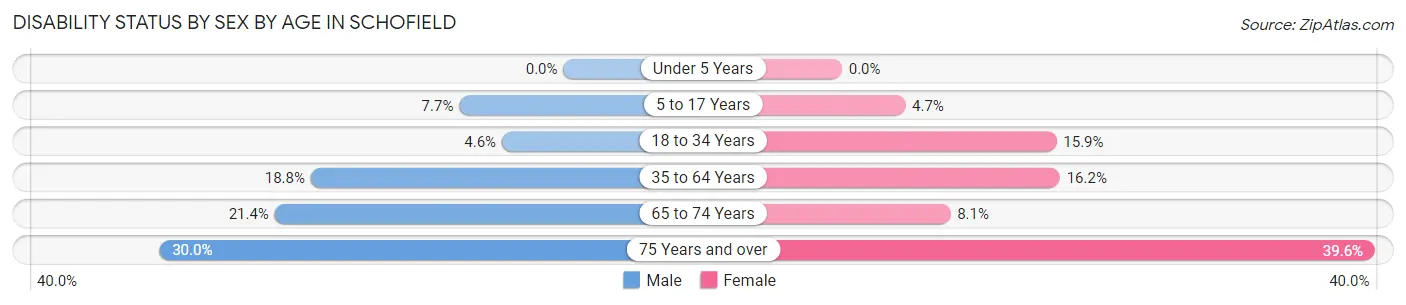
| Age Bracket | Male | Female |
| Under 5 Years | 0 (0.0%) | 0 (0.0%) |
| 5 to 17 Years | 16 (7.7%) | 11 (4.7%) |
| 18 to 34 Years | 14 (4.6%) | 43 (15.9%) |
| 35 to 64 Years | 96 (18.8%) | 55 (16.2%) |
| 65 to 74 Years | 12 (21.4%) | 7 (8.1%) |
| 75 Years and over | 24 (30.0%) | 38 (39.6%) |
Disability Class by Sex by Age in Schofield
Disability Class: Hearing Difficulty
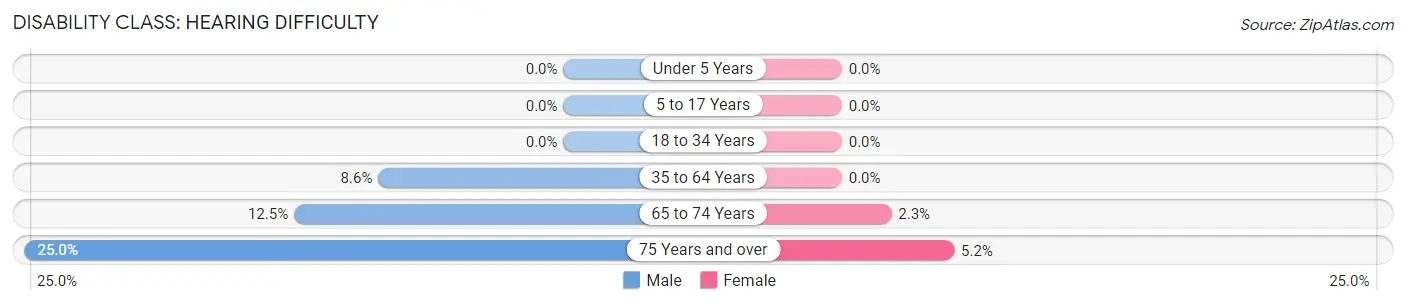
| Age Bracket | Male | Female |
| Under 5 Years | 0 (0.0%) | 0 (0.0%) |
| 5 to 17 Years | 0 (0.0%) | 0 (0.0%) |
| 18 to 34 Years | 0 (0.0%) | 0 (0.0%) |
| 35 to 64 Years | 44 (8.6%) | 0 (0.0%) |
| 65 to 74 Years | 7 (12.5%) | 2 (2.3%) |
| 75 Years and over | 20 (25.0%) | 5 (5.2%) |
Disability Class: Vision Difficulty
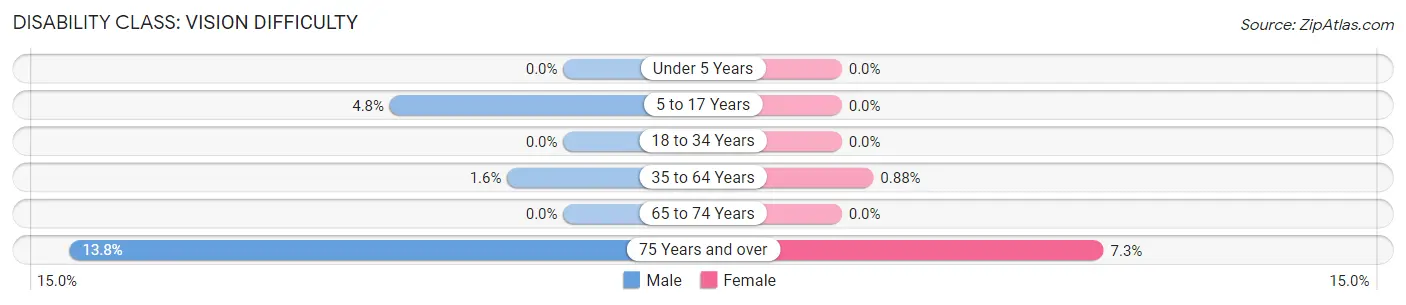
| Age Bracket | Male | Female |
| Under 5 Years | 0 (0.0%) | 0 (0.0%) |
| 5 to 17 Years | 10 (4.8%) | 0 (0.0%) |
| 18 to 34 Years | 0 (0.0%) | 0 (0.0%) |
| 35 to 64 Years | 8 (1.6%) | 3 (0.9%) |
| 65 to 74 Years | 0 (0.0%) | 0 (0.0%) |
| 75 Years and over | 11 (13.8%) | 7 (7.3%) |
Disability Class: Cognitive Difficulty
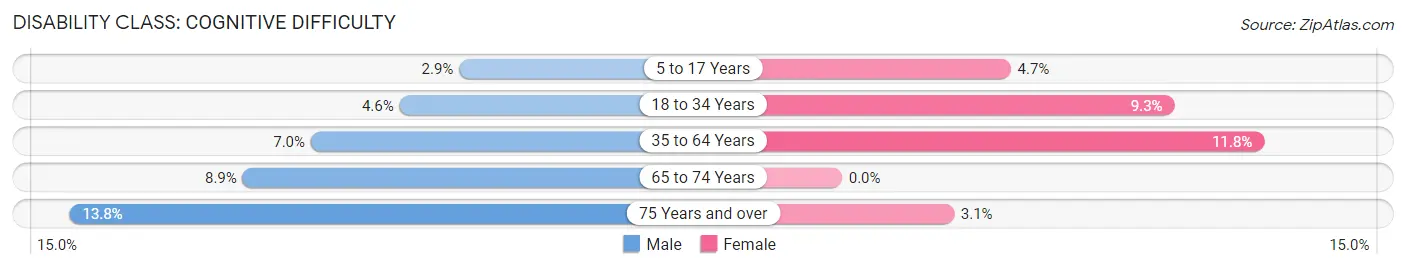
| Age Bracket | Male | Female |
| 5 to 17 Years | 6 (2.9%) | 11 (4.7%) |
| 18 to 34 Years | 14 (4.6%) | 25 (9.3%) |
| 35 to 64 Years | 36 (7.0%) | 40 (11.8%) |
| 65 to 74 Years | 5 (8.9%) | 0 (0.0%) |
| 75 Years and over | 11 (13.8%) | 3 (3.1%) |
Disability Class: Ambulatory Difficulty
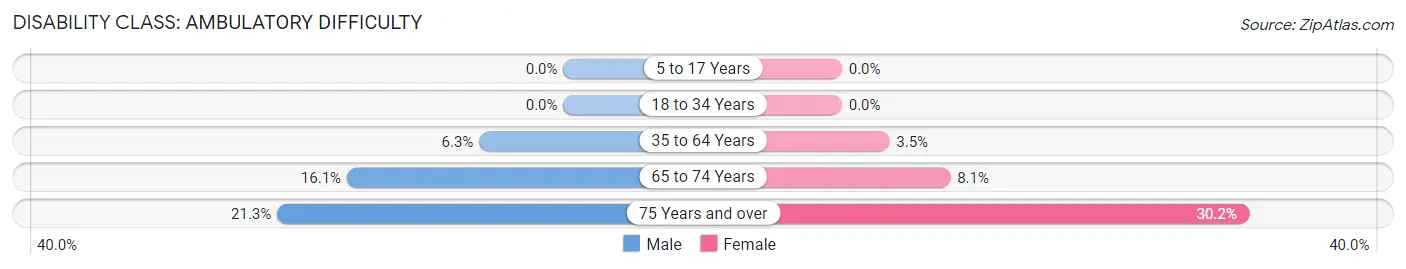
| Age Bracket | Male | Female |
| 5 to 17 Years | 0 (0.0%) | 0 (0.0%) |
| 18 to 34 Years | 0 (0.0%) | 0 (0.0%) |
| 35 to 64 Years | 32 (6.2%) | 12 (3.5%) |
| 65 to 74 Years | 9 (16.1%) | 7 (8.1%) |
| 75 Years and over | 17 (21.2%) | 29 (30.2%) |
Disability Class: Self-Care Difficulty
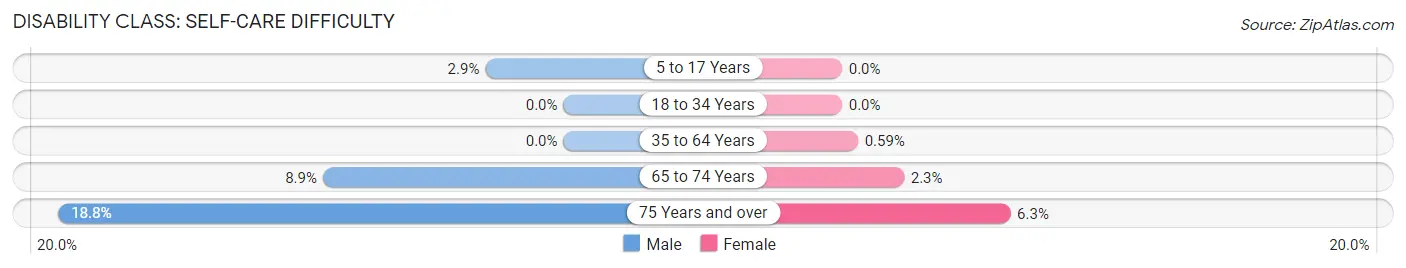
| Age Bracket | Male | Female |
| 5 to 17 Years | 6 (2.9%) | 0 (0.0%) |
| 18 to 34 Years | 0 (0.0%) | 0 (0.0%) |
| 35 to 64 Years | 0 (0.0%) | 2 (0.6%) |
| 65 to 74 Years | 5 (8.9%) | 2 (2.3%) |
| 75 Years and over | 15 (18.8%) | 6 (6.2%) |
Technology Access in Schofield
Computing Device Access in Schofield
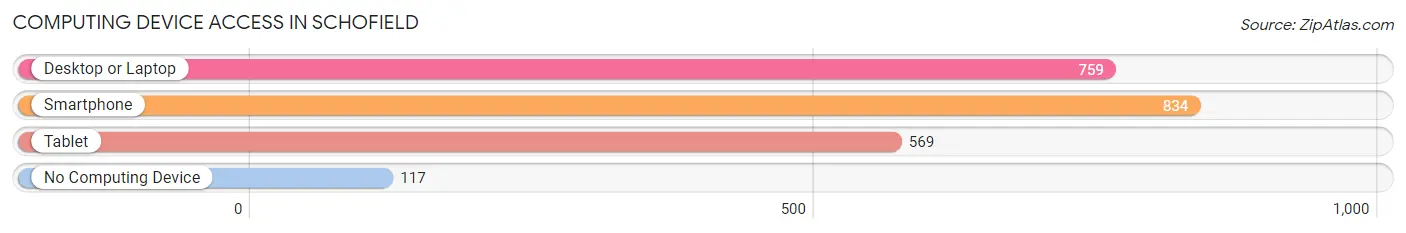
| Device Type | # Households | % Households |
| Desktop or Laptop | 759 | 72.3% |
| Smartphone | 834 | 79.4% |
| Tablet | 569 | 54.2% |
| No Computing Device | 117 | 11.1% |
| Total | 1,050 | 100.0% |
Internet Access in Schofield
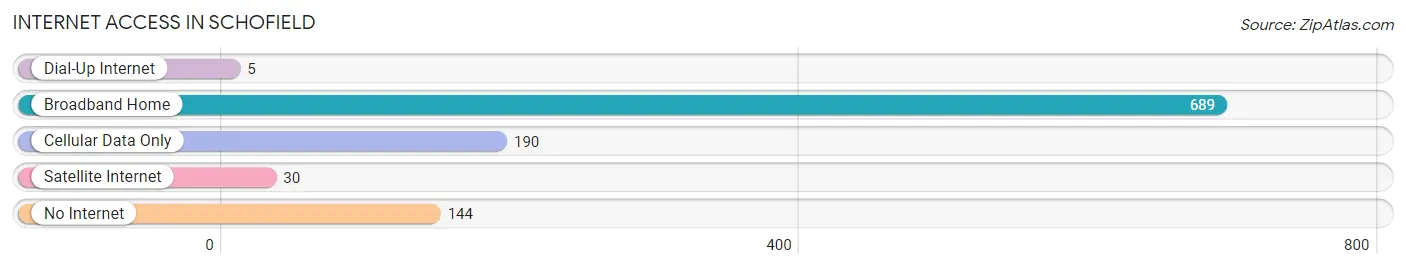
| Internet Type | # Households | % Households |
| Dial-Up Internet | 5 | 0.5% |
| Broadband Home | 689 | 65.6% |
| Cellular Data Only | 190 | 18.1% |
| Satellite Internet | 30 | 2.9% |
| No Internet | 144 | 13.7% |
| Total | 1,050 | 100.0% |
Schofield Summary
Schofield, Wisconsin is a small city located in Marathon County, Wisconsin. It is part of the Wausau, Wisconsin Metropolitan Statistical Area. The city has a population of approximately 4,000 people and is located about 10 miles west of Wausau.
History
Schofield was founded in 1883 by William Schofield, a lumberman from Wisconsin. He purchased land in the area and built a sawmill, which became the center of the town. The town was originally called Schofield Station, but was later changed to Schofield. The town was incorporated in 1891.
In the early 1900s, Schofield was a thriving lumber town. The sawmill was the largest employer in the area and the town was home to several other businesses, including a hotel, a bank, a general store, and a post office.
In the 1950s, the sawmill closed and the town began to decline. The population decreased and many businesses closed. In the 1970s, the city began to experience a resurgence. The city was revitalized with the construction of a new shopping center and the opening of a new hospital.
Geography
Schofield is located in Marathon County, Wisconsin. It is situated on the Wisconsin River, about 10 miles west of Wausau. The city is surrounded by rolling hills and forests. The city has a total area of 4.2 square miles, all of which is land.
Economy
The economy of Schofield is largely based on the service industry. The city is home to several restaurants, retail stores, and other businesses. The city is also home to a hospital and a number of medical offices.
The city is also home to several manufacturing companies, including a paper mill and a plastics factory. The city is also home to a number of small businesses, including a brewery, a winery, and a distillery.
Demographics
As of the 2010 census, the population of Schofield was 4,037. The racial makeup of the city was 94.3% White, 0.7% African American, 0.3% Native American, 0.7% Asian, 0.1% Pacific Islander, 2.2% from other races, and 1.9% from two or more races. Hispanic or Latino of any race were 4.2% of the population.
The median household income in Schofield was $45,938, and the median family income was $54,938. The per capita income for the city was $21,945. About 8.3% of families and 10.2% of the population were below the poverty line, including 14.2% of those under age 18 and 6.2% of those age 65 or over.
Schofield is a small city with a rich history and a diverse population. The city is home to a variety of businesses and industries, and is a great place to live and work.
Common Questions
What is Per Capita Income in Schofield?
Per Capita income in Schofield is $44,885.
What is the Median Family Income in Schofield?
Median Family Income in Schofield is $81,310.
What is the Median Household income in Schofield?
Median Household Income in Schofield is $63,279.
What is Income or Wage Gap in Schofield?
Income or Wage Gap in Schofield is 34.0%.
Women in Schofield earn 66.0 cents for every dollar earned by a man.
What is Inequality or Gini Index in Schofield?
Inequality or Gini Index in Schofield is 0.53.
What is the Total Population of Schofield?
Total Population of Schofield is 2,256.
What is the Total Male Population of Schofield?
Total Male Population of Schofield is 1,174.
What is the Total Female Population of Schofield?
Total Female Population of Schofield is 1,082.
What is the Ratio of Males per 100 Females in Schofield?
There are 108.50 Males per 100 Females in Schofield.
What is the Ratio of Females per 100 Males in Schofield?
There are 92.16 Females per 100 Males in Schofield.
What is the Median Population Age in Schofield?
Median Population Age in Schofield is 38.1 Years.
What is the Average Family Size in Schofield
Average Family Size in Schofield is 3.0 People.
What is the Average Household Size in Schofield
Average Household Size in Schofield is 2.1 People.
How Large is the Labor Force in Schofield?
There are 1,319 People in the Labor Forcein in Schofield.
What is the Percentage of People in the Labor Force in Schofield?
72.1% of People are in the Labor Force in Schofield.
What is the Unemployment Rate in Schofield?
Unemployment Rate in Schofield is 5.9%.