Rosendale, WI Map & Demographics
Rosendale Map
Rosendale Overview
$40,283
PER CAPITA INCOME
$93,125
AVG FAMILY INCOME
$86,364
AVG HOUSEHOLD INCOME
24.2%
WAGE / INCOME GAP [ % ]
75.8¢/ $1
WAGE / INCOME GAP [ $ ]
0.32
INEQUALITY / GINI INDEX
1,006
TOTAL POPULATION
529
MALE POPULATION
477
FEMALE POPULATION
110.90
MALES / 100 FEMALES
90.17
FEMALES / 100 MALES
43.6
MEDIAN AGE
2.8
AVG FAMILY SIZE
2.5
AVG HOUSEHOLD SIZE
577
LABOR FORCE [ PEOPLE ]
69.0%
PERCENT IN LABOR FORCE
3.6%
UNEMPLOYMENT RATE
Rosendale Zip Codes
Rosendale Area Codes
Income in Rosendale
Income Overview in Rosendale
Per Capita Income in Rosendale is $40,283, while median incomes of families and households are $93,125 and $86,364 respectively.
| Characteristic | Number | Measure |
| Per Capita Income | 1,006 | $40,283 |
| Median Family Income | 313 | $93,125 |
| Mean Family Income | 313 | $108,721 |
| Median Household Income | 400 | $86,364 |
| Mean Household Income | 400 | $99,468 |
| Income Deficit | 313 | $0 |
| Wage / Income Gap (%) | 1,006 | 24.17% |
| Wage / Income Gap ($) | 1,006 | 75.83¢ per $1 |
| Gini / Inequality Index | 1,006 | 0.32 |
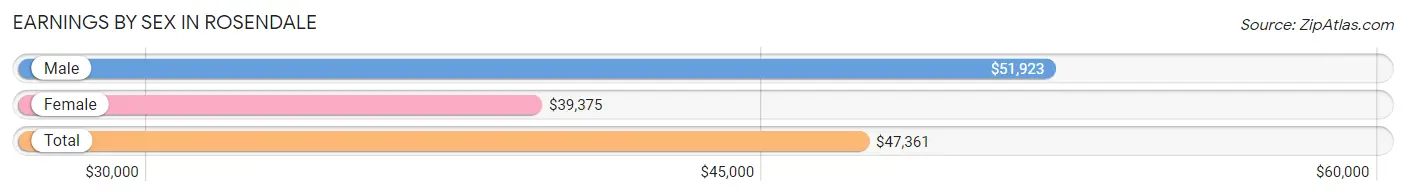
Earnings by Sex in Rosendale
Average Earnings in Rosendale are $47,361, $51,923 for men and $39,375 for women, a difference of 24.2%.
| Sex | Number | Average Earnings |
| Male | 348 (56.7%) | $51,923 |
| Female | 266 (43.3%) | $39,375 |
| Total | 614 (100.0%) | $47,361 |
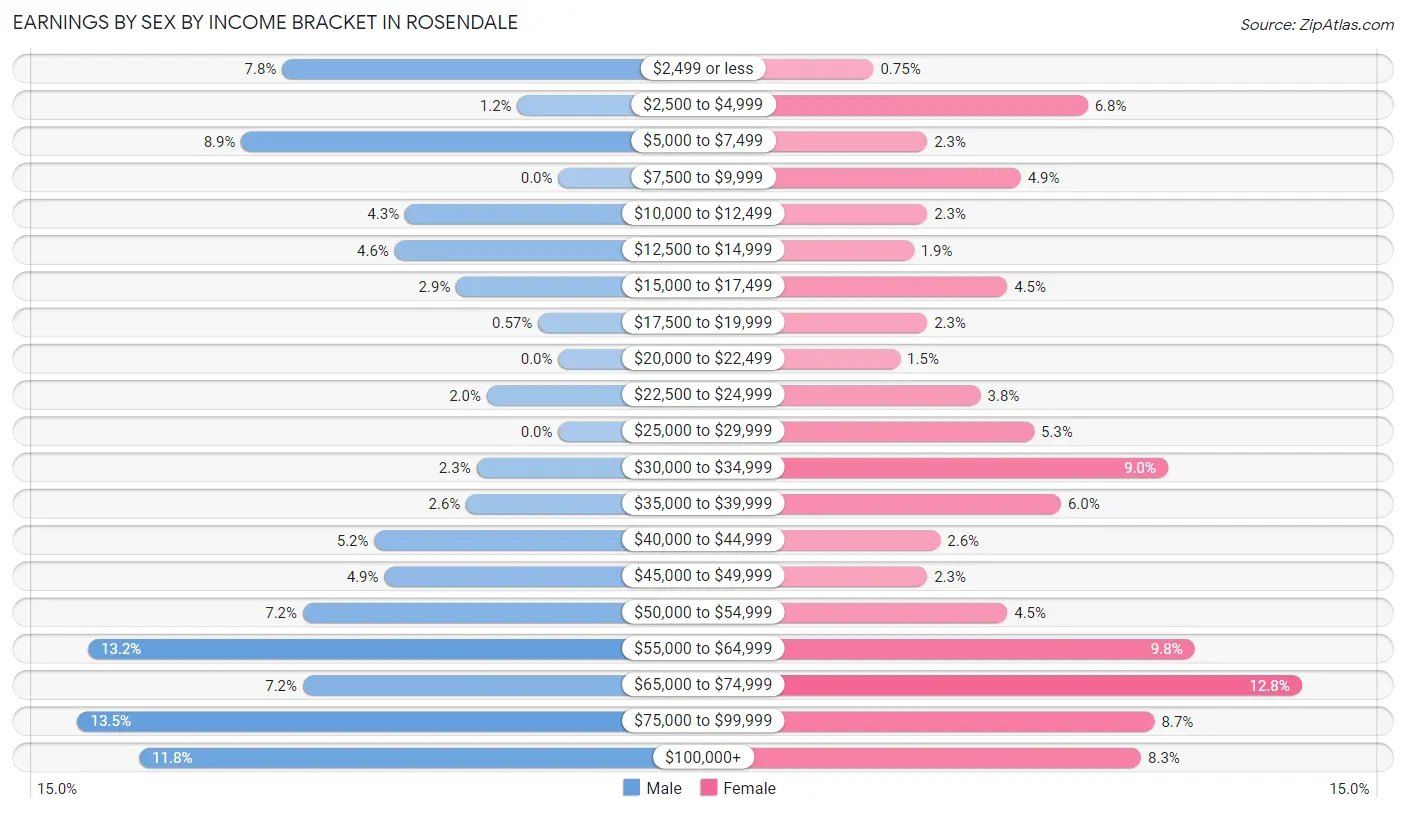
Earnings by Sex by Income Bracket in Rosendale
The most common earnings brackets in Rosendale are $75,000 to $99,999 for men (47 | 13.5%) and $65,000 to $74,999 for women (34 | 12.8%).
| Income | Male | Female |
| $2,499 or less | 27 (7.8%) | 2 (0.7%) |
| $2,500 to $4,999 | 4 (1.1%) | 18 (6.8%) |
| $5,000 to $7,499 | 31 (8.9%) | 6 (2.3%) |
| $7,500 to $9,999 | 0 (0.0%) | 13 (4.9%) |
| $10,000 to $12,499 | 15 (4.3%) | 6 (2.3%) |
| $12,500 to $14,999 | 16 (4.6%) | 5 (1.9%) |
| $15,000 to $17,499 | 10 (2.9%) | 12 (4.5%) |
| $17,500 to $19,999 | 2 (0.6%) | 6 (2.3%) |
| $20,000 to $22,499 | 0 (0.0%) | 4 (1.5%) |
| $22,500 to $24,999 | 7 (2.0%) | 10 (3.8%) |
| $25,000 to $29,999 | 0 (0.0%) | 14 (5.3%) |
| $30,000 to $34,999 | 8 (2.3%) | 24 (9.0%) |
| $35,000 to $39,999 | 9 (2.6%) | 16 (6.0%) |
| $40,000 to $44,999 | 18 (5.2%) | 7 (2.6%) |
| $45,000 to $49,999 | 17 (4.9%) | 6 (2.3%) |
| $50,000 to $54,999 | 25 (7.2%) | 12 (4.5%) |
| $55,000 to $64,999 | 46 (13.2%) | 26 (9.8%) |
| $65,000 to $74,999 | 25 (7.2%) | 34 (12.8%) |
| $75,000 to $99,999 | 47 (13.5%) | 23 (8.6%) |
| $100,000+ | 41 (11.8%) | 22 (8.3%) |
| Total | 348 (100.0%) | 266 (100.0%) |
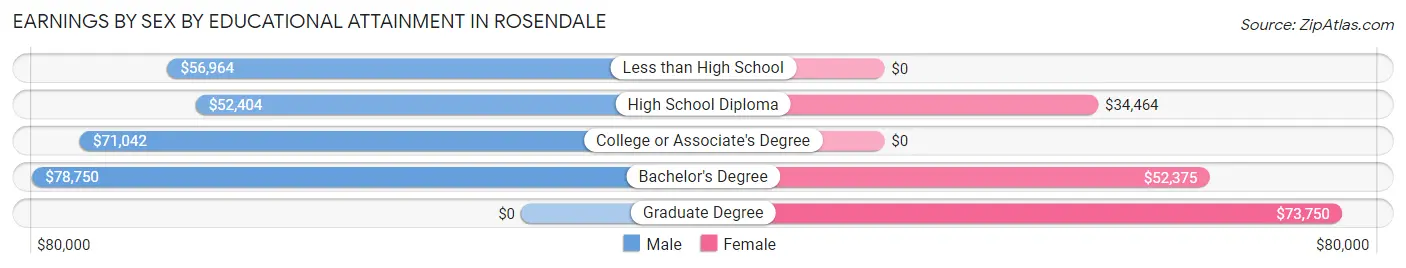
Earnings by Sex by Educational Attainment in Rosendale
Average earnings in Rosendale are $59,539 for men and $50,125 for women, a difference of 15.8%. Men with an educational attainment of bachelor's degree enjoy the highest average annual earnings of $78,750, while those with high school diploma education earn the least with $52,404. Women with an educational attainment of graduate degree earn the most with the average annual earnings of $73,750, while those with high school diploma education have the smallest earnings of $34,464.
| Educational Attainment | Male Income | Female Income |
| Less than High School | $56,964 | $0 |
| High School Diploma | $52,404 | $34,464 |
| College or Associate's Degree | $71,042 | $0 |
| Bachelor's Degree | $78,750 | $52,375 |
| Graduate Degree | - | - |
| Total | $59,539 | $50,125 |
Family Income in Rosendale
Family Income Brackets in Rosendale
According to the Rosendale family income data, there are 90 families falling into the $100,000 to $149,999 income range, which is the most common income bracket and makes up 28.7% of all families. Conversely, the $25,000 to $34,999 income bracket is the least frequent group with only 2 families (0.6%) belonging to this category.
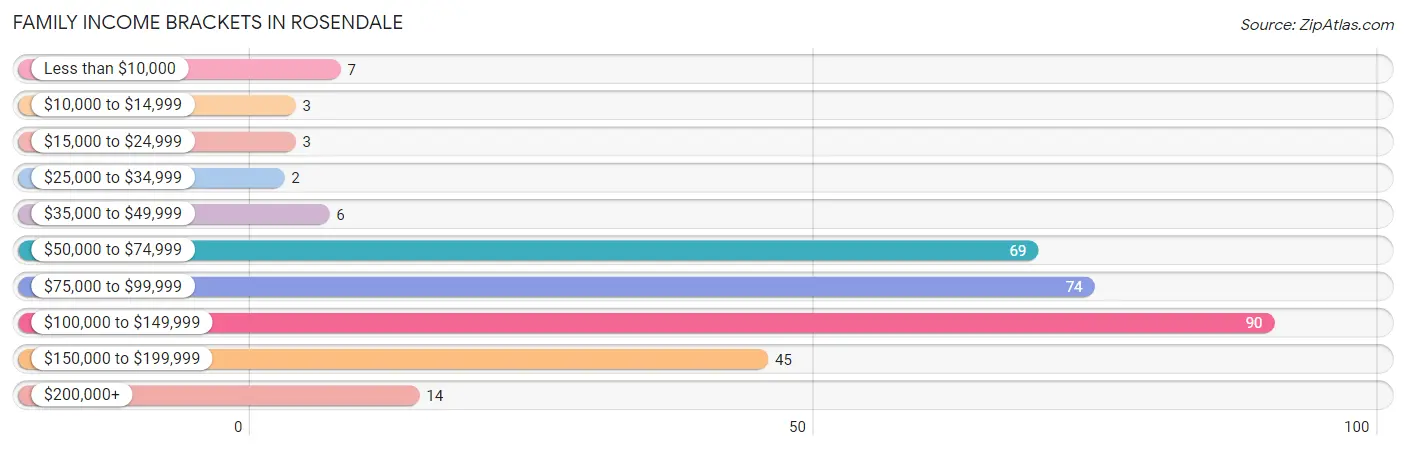
| Income Bracket | # Families | % Families |
| Less than $10,000 | 7 | 2.2% |
| $10,000 to $14,999 | 3 | 1.0% |
| $15,000 to $24,999 | 3 | 1.0% |
| $25,000 to $34,999 | 2 | 0.6% |
| $35,000 to $49,999 | 6 | 1.9% |
| $50,000 to $74,999 | 69 | 22.0% |
| $75,000 to $99,999 | 74 | 23.6% |
| $100,000 to $149,999 | 90 | 28.8% |
| $150,000 to $199,999 | 45 | 14.4% |
| $200,000+ | 14 | 4.5% |
Family Income by Famaliy Size in Rosendale
4-person families (34 | 10.9%) account for the highest median family income in Rosendale with $114,375 per family, while 2-person families (196 | 62.6%) have the highest median income of $43,013 per family member.
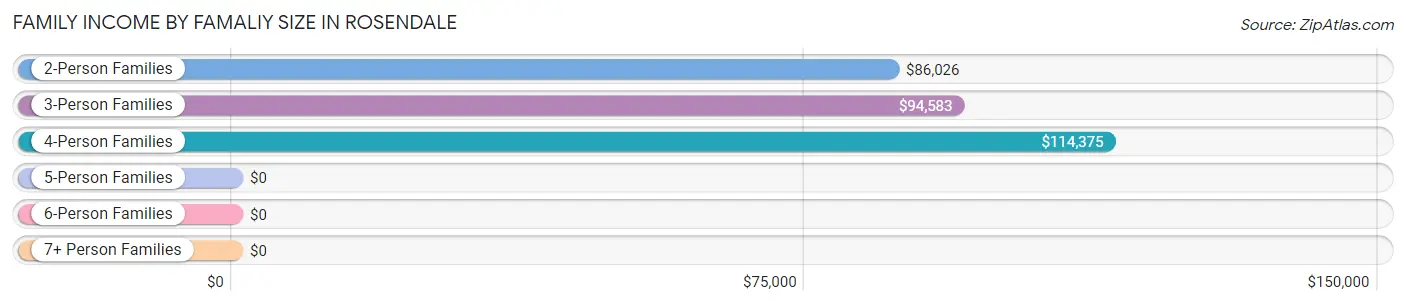
| Income Bracket | # Families | Median Income |
| 2-Person Families | 196 (62.6%) | $86,026 |
| 3-Person Families | 54 (17.2%) | $94,583 |
| 4-Person Families | 34 (10.9%) | $114,375 |
| 5-Person Families | 12 (3.8%) | $0 |
| 6-Person Families | 5 (1.6%) | $0 |
| 7+ Person Families | 12 (3.8%) | $0 |
| Total | 313 (100.0%) | $93,125 |
Family Income by Number of Earners in Rosendale
The median family income in Rosendale is $93,125, with families comprising 2 earners (131) having the highest median family income of $123,750, while families with 1 earner (59) have the lowest median family income of $66,125, accounting for 41.8% and 18.9% of families, respectively.
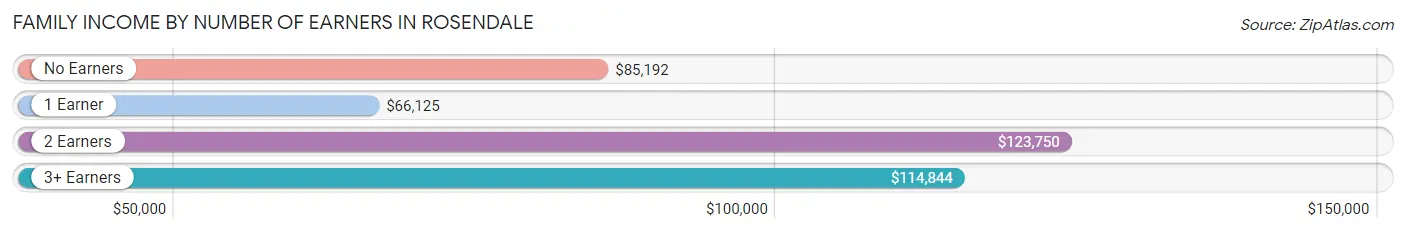
| Number of Earners | # Families | Median Income |
| No Earners | 72 (23.0%) | $85,192 |
| 1 Earner | 59 (18.9%) | $66,125 |
| 2 Earners | 131 (41.8%) | $123,750 |
| 3+ Earners | 51 (16.3%) | $114,844 |
| Total | 313 (100.0%) | $93,125 |
Household Income in Rosendale
Household Income Brackets in Rosendale
With 101 households falling in the category, the $100,000 to $149,999 income range is the most frequent in Rosendale, accounting for 25.3% of all households. In contrast, only 9 households (2.2%) fall into the less than $10,000 income bracket, making it the least populous group.
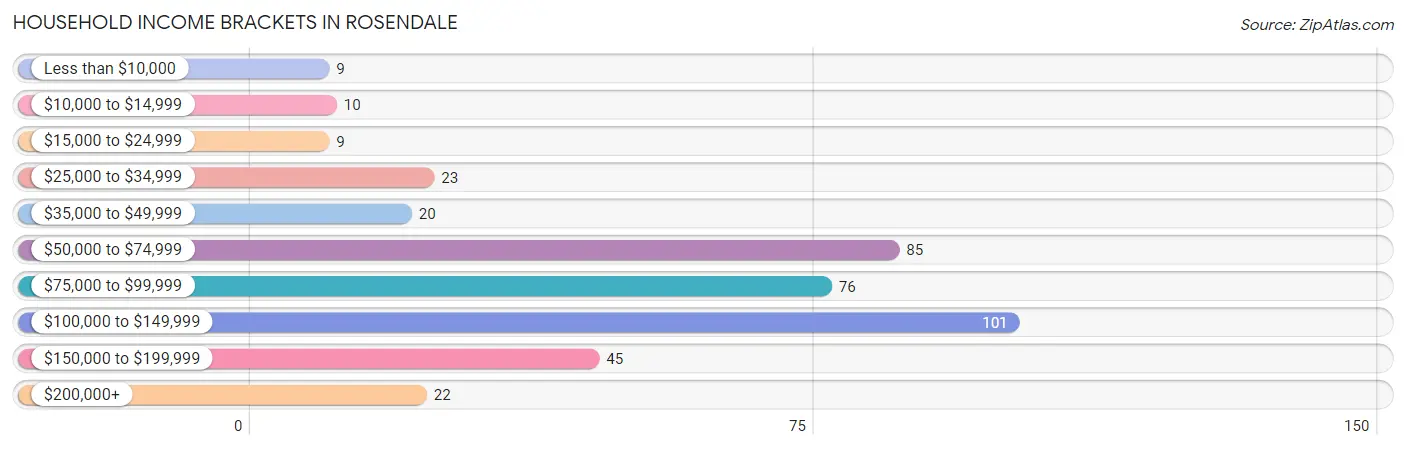
| Income Bracket | # Households | % Households |
| Less than $10,000 | 9 | 2.3% |
| $10,000 to $14,999 | 10 | 2.5% |
| $15,000 to $24,999 | 9 | 2.3% |
| $25,000 to $34,999 | 23 | 5.8% |
| $35,000 to $49,999 | 20 | 5.0% |
| $50,000 to $74,999 | 85 | 21.3% |
| $75,000 to $99,999 | 76 | 19.0% |
| $100,000 to $149,999 | 101 | 25.3% |
| $150,000 to $199,999 | 45 | 11.3% |
| $200,000+ | 22 | 5.5% |
Household Income by Householder Age in Rosendale
The median household income in Rosendale is $86,364, with the highest median household income of $120,833 found in the 25 to 44 years age bracket for the primary householder. A total of 104 households (26.0%) fall into this category. Meanwhile, the 15 to 24 years age bracket for the primary householder has the lowest median household income of $0, with 9 households (2.2%) in this group.
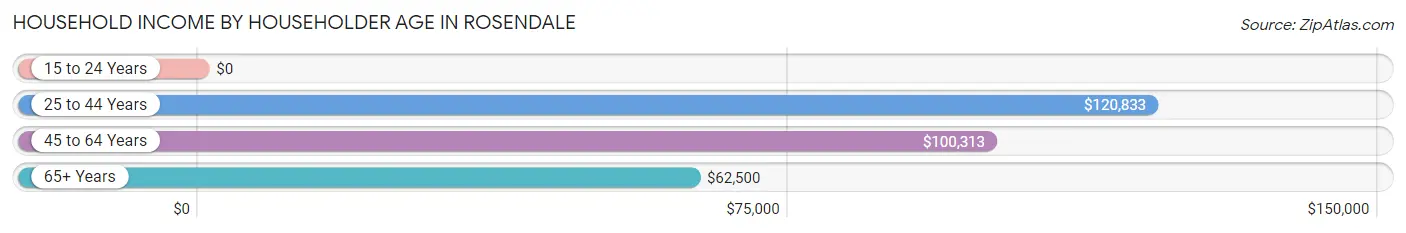
| Income Bracket | # Households | Median Income |
| 15 to 24 Years | 9 (2.2%) | $0 |
| 25 to 44 Years | 104 (26.0%) | $120,833 |
| 45 to 64 Years | 159 (39.8%) | $100,313 |
| 65+ Years | 128 (32.0%) | $62,500 |
| Total | 400 (100.0%) | $86,364 |
Poverty in Rosendale
Income Below Poverty by Sex and Age in Rosendale
With 4.5% poverty level for males and 7.1% for females among the residents of Rosendale, 15 year old males and 75 year old and over females are the most vulnerable to poverty, with 2 males (28.6%) and 17 females (34.7%) in their respective age groups living below the poverty level.
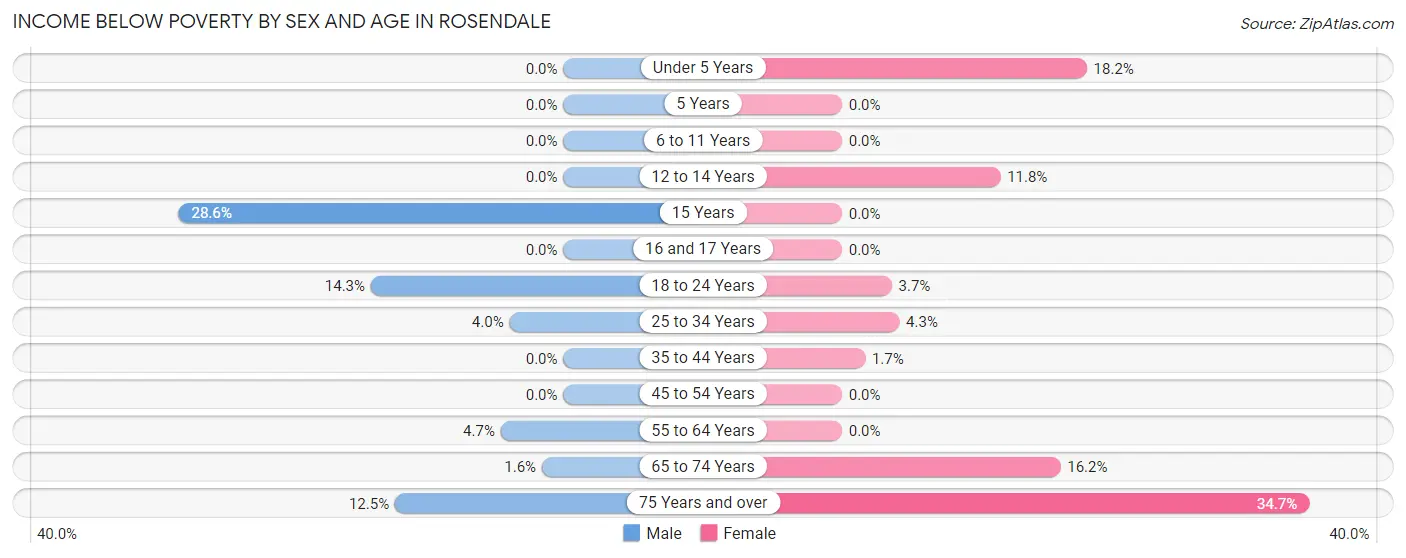
| Age Bracket | Male | Female |
| Under 5 Years | 0 (0.0%) | 4 (18.2%) |
| 5 Years | 0 (0.0%) | 0 (0.0%) |
| 6 to 11 Years | 0 (0.0%) | 0 (0.0%) |
| 12 to 14 Years | 0 (0.0%) | 2 (11.8%) |
| 15 Years | 2 (28.6%) | 0 (0.0%) |
| 16 and 17 Years | 0 (0.0%) | 0 (0.0%) |
| 18 to 24 Years | 12 (14.3%) | 1 (3.7%) |
| 25 to 34 Years | 2 (4.0%) | 2 (4.3%) |
| 35 to 44 Years | 0 (0.0%) | 1 (1.7%) |
| 45 to 54 Years | 0 (0.0%) | 0 (0.0%) |
| 55 to 64 Years | 4 (4.6%) | 0 (0.0%) |
| 65 to 74 Years | 1 (1.6%) | 6 (16.2%) |
| 75 Years and over | 3 (12.5%) | 17 (34.7%) |
| Total | 24 (4.5%) | 33 (7.1%) |
Income Above Poverty by Sex and Age in Rosendale
According to the poverty statistics in Rosendale, males aged under 5 years and females aged 6 to 11 years are the age groups that are most secure financially, with 100.0% of males and 100.0% of females in these age groups living above the poverty line.
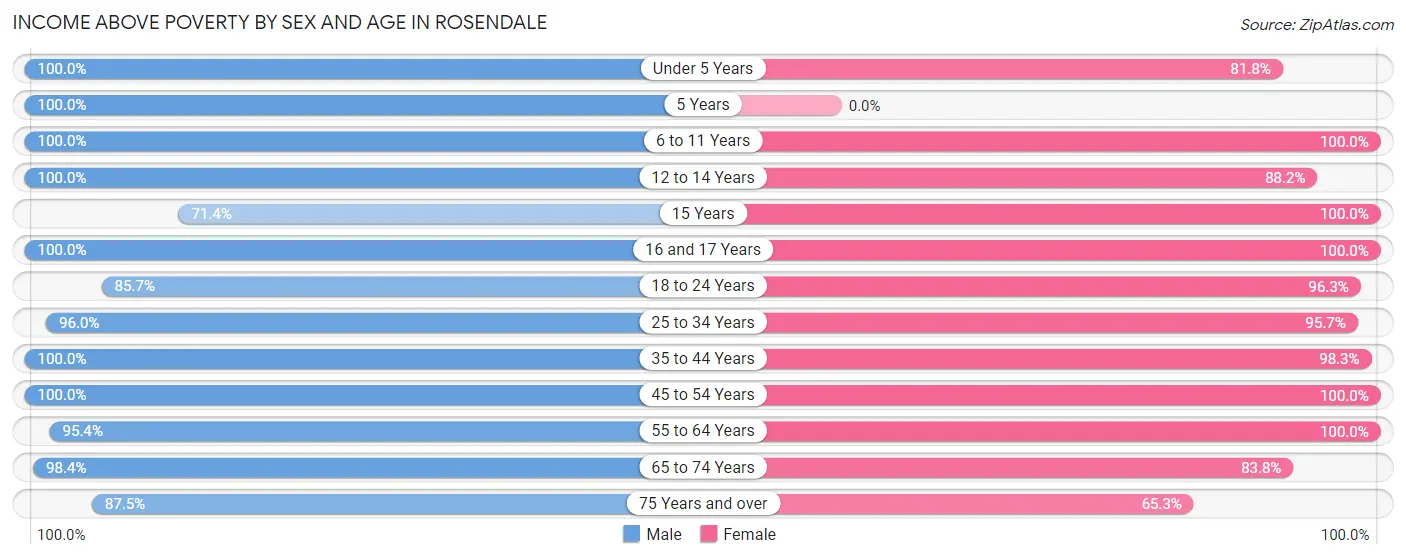
| Age Bracket | Male | Female |
| Under 5 Years | 14 (100.0%) | 18 (81.8%) |
| 5 Years | 2 (100.0%) | 0 (0.0%) |
| 6 to 11 Years | 32 (100.0%) | 26 (100.0%) |
| 12 to 14 Years | 25 (100.0%) | 15 (88.2%) |
| 15 Years | 5 (71.4%) | 13 (100.0%) |
| 16 and 17 Years | 10 (100.0%) | 17 (100.0%) |
| 18 to 24 Years | 72 (85.7%) | 26 (96.3%) |
| 25 to 34 Years | 48 (96.0%) | 45 (95.7%) |
| 35 to 44 Years | 47 (100.0%) | 57 (98.3%) |
| 45 to 54 Years | 85 (100.0%) | 79 (100.0%) |
| 55 to 64 Years | 82 (95.4%) | 73 (100.0%) |
| 65 to 74 Years | 62 (98.4%) | 31 (83.8%) |
| 75 Years and over | 21 (87.5%) | 32 (65.3%) |
| Total | 505 (95.5%) | 432 (92.9%) |
Income Below Poverty Among Married-Couple Families in Rosendale
The poverty statistics for married-couple families in Rosendale show that 4.0% or 11 of the total 276 families live below the poverty line. Families with 1 or 2 children have the highest poverty rate of 4.6%, comprising of 2 families. On the other hand, families with 3 or 4 children have the lowest poverty rate of 0.0%, which includes 0 families.
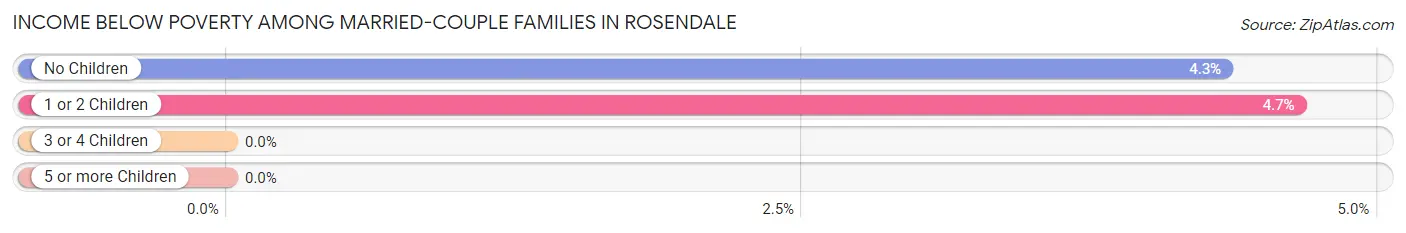
| Children | Above Poverty | Below Poverty |
| No Children | 199 (95.7%) | 9 (4.3%) |
| 1 or 2 Children | 41 (95.4%) | 2 (4.6%) |
| 3 or 4 Children | 25 (100.0%) | 0 (0.0%) |
| 5 or more Children | 0 (0.0%) | 0 (0.0%) |
| Total | 265 (96.0%) | 11 (4.0%) |
Income Below Poverty Among Single-Parent Households in Rosendale
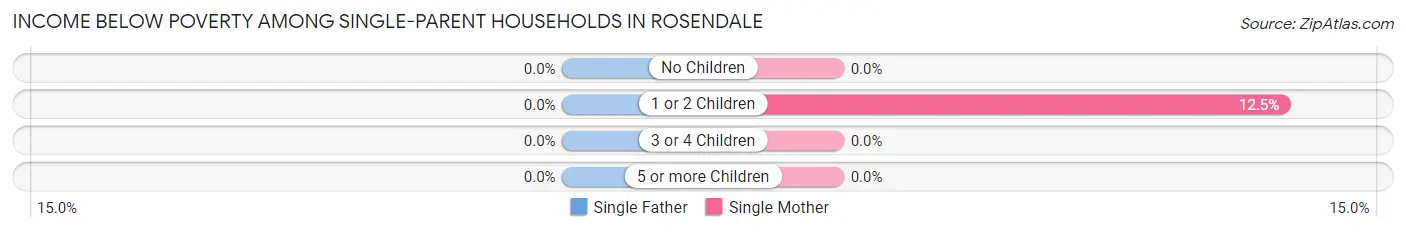
| Children | Single Father | Single Mother |
| No Children | 0 (0.0%) | 0 (0.0%) |
| 1 or 2 Children | 0 (0.0%) | 1 (12.5%) |
| 3 or 4 Children | 0 (0.0%) | 0 (0.0%) |
| 5 or more Children | 0 (0.0%) | 0 (0.0%) |
| Total | 0 (0.0%) | 1 (5.3%) |
Income Below Poverty Among Married-Couple vs Single-Parent Households in Rosendale
The poverty data for Rosendale shows that 11 of the married-couple family households (4.0%) and 1 of the single-parent households (2.7%) are living below the poverty level. Within the married-couple family households, those with 1 or 2 children have the highest poverty rate, with 2 households (4.6%) falling below the poverty line. Among the single-parent households, those with 1 or 2 children have the highest poverty rate, with 1 household (4.3%) living below poverty.
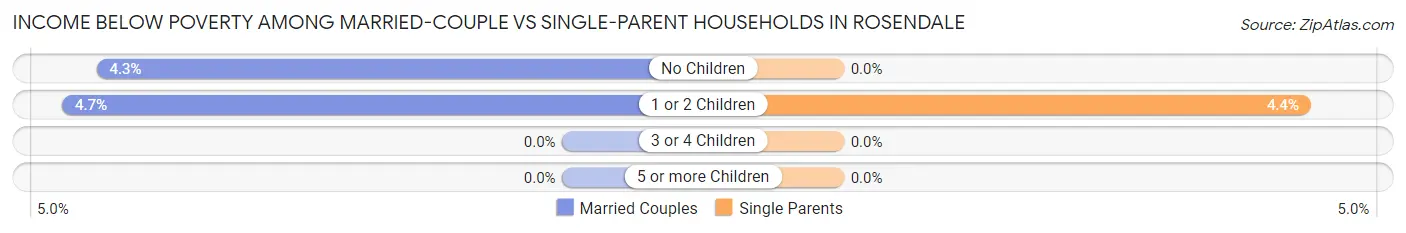
| Children | Married-Couple Families | Single-Parent Households |
| No Children | 9 (4.3%) | 0 (0.0%) |
| 1 or 2 Children | 2 (4.6%) | 1 (4.3%) |
| 3 or 4 Children | 0 (0.0%) | 0 (0.0%) |
| 5 or more Children | 0 (0.0%) | 0 (0.0%) |
| Total | 11 (4.0%) | 1 (2.7%) |
Race in Rosendale
The most populous races in Rosendale are White / Caucasian (954 | 94.8%), Two or more Races (42 | 4.2%), and Hispanic or Latino (30 | 3.0%).
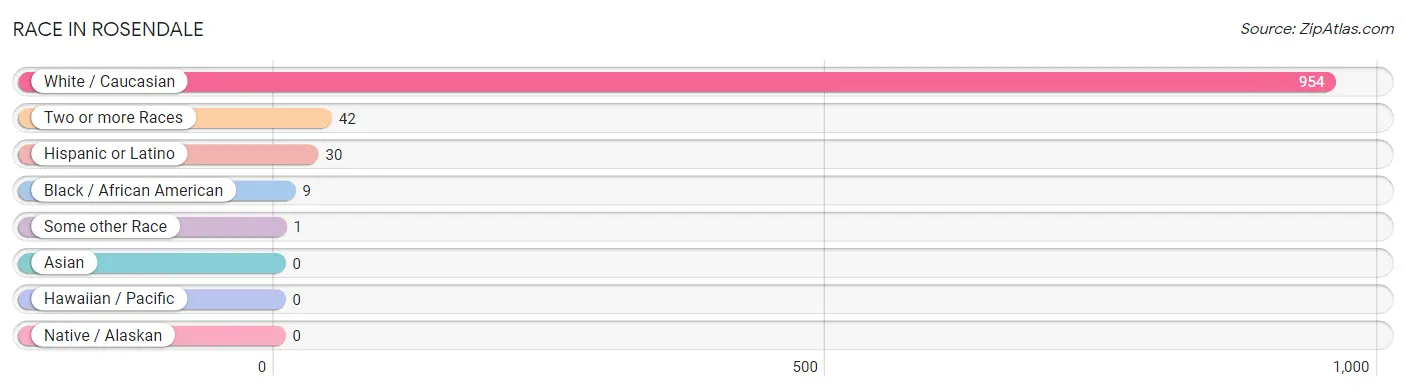
| Race | # Population | % Population |
| Asian | 0 | 0.0% |
| Black / African American | 9 | 0.9% |
| Hawaiian / Pacific | 0 | 0.0% |
| Hispanic or Latino | 30 | 3.0% |
| Native / Alaskan | 0 | 0.0% |
| White / Caucasian | 954 | 94.8% |
| Two or more Races | 42 | 4.2% |
| Some other Race | 1 | 0.1% |
| Total | 1,006 | 100.0% |
Ancestry in Rosendale
The most populous ancestries reported in Rosendale are German (541 | 53.8%), Irish (91 | 9.0%), Polish (43 | 4.3%), Dutch (32 | 3.2%), and English (28 | 2.8%), together accounting for 73.1% of all Rosendale residents.
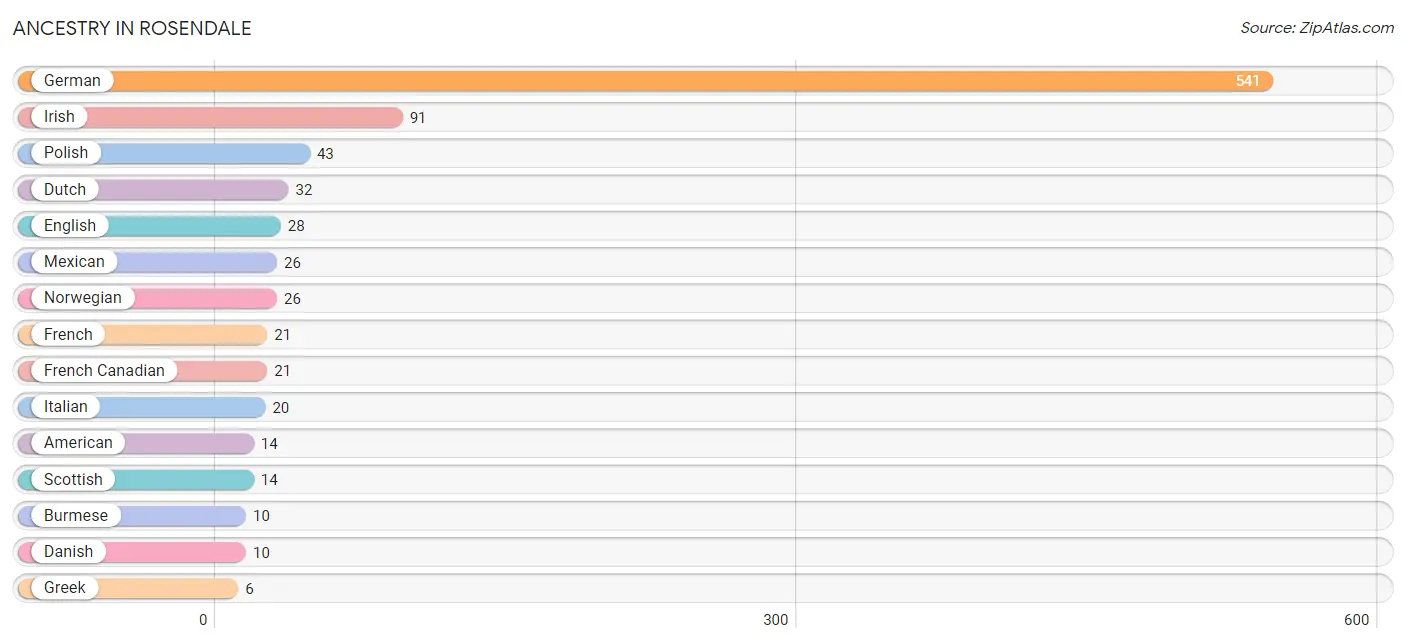
| Ancestry | # Population | % Population |
| American | 14 | 1.4% |
| British | 3 | 0.3% |
| Burmese | 10 | 1.0% |
| Chippewa | 1 | 0.1% |
| Danish | 10 | 1.0% |
| Dutch | 32 | 3.2% |
| English | 28 | 2.8% |
| European | 2 | 0.2% |
| French | 21 | 2.1% |
| French Canadian | 21 | 2.1% |
| German | 541 | 53.8% |
| Greek | 6 | 0.6% |
| Irish | 91 | 9.0% |
| Italian | 20 | 2.0% |
| Korean | 2 | 0.2% |
| Mexican | 26 | 2.6% |
| Northern European | 2 | 0.2% |
| Norwegian | 26 | 2.6% |
| Polish | 43 | 4.3% |
| Scottish | 14 | 1.4% |
| South American | 2 | 0.2% |
| Swedish | 4 | 0.4% |
| Venezuelan | 2 | 0.2% |
| Welsh | 2 | 0.2% | View All 24 Rows |
Immigrants in Rosendale
The most numerous immigrant groups reported in Rosendale came from Europe (3 | 0.3%), Germany (3 | 0.3%), Latin America (3 | 0.3%), Western Europe (3 | 0.3%), and South America (2 | 0.2%), together accounting for 1.4% of all Rosendale residents.
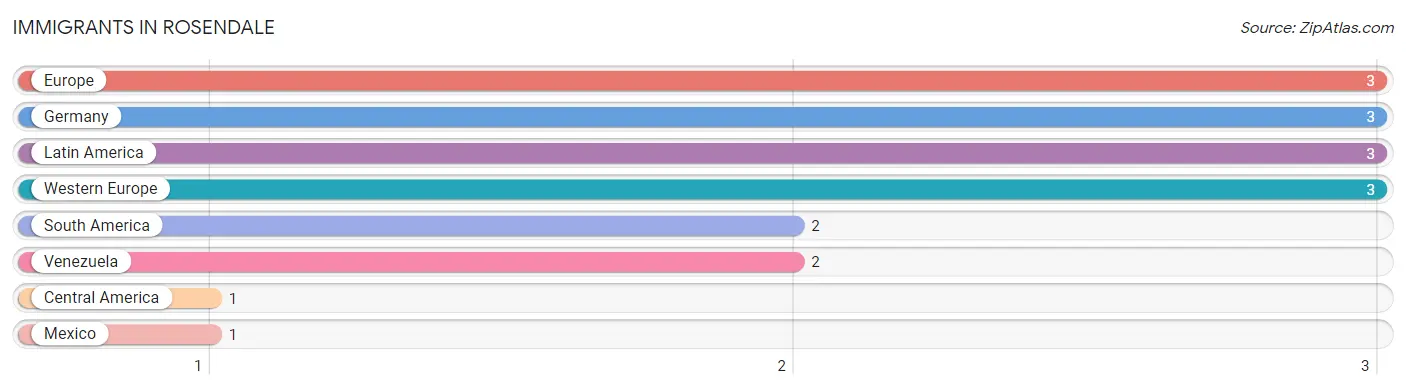
| Immigration Origin | # Population | % Population |
| Central America | 1 | 0.1% |
| Europe | 3 | 0.3% |
| Germany | 3 | 0.3% |
| Latin America | 3 | 0.3% |
| Mexico | 1 | 0.1% |
| South America | 2 | 0.2% |
| Venezuela | 2 | 0.2% |
| Western Europe | 3 | 0.3% | View All 8 Rows |
Sex and Age in Rosendale
Sex and Age in Rosendale
The most populous age groups in Rosendale are 15 to 19 Years (53 | 10.0%) for men and 50 to 54 Years (60 | 12.6%) for women.
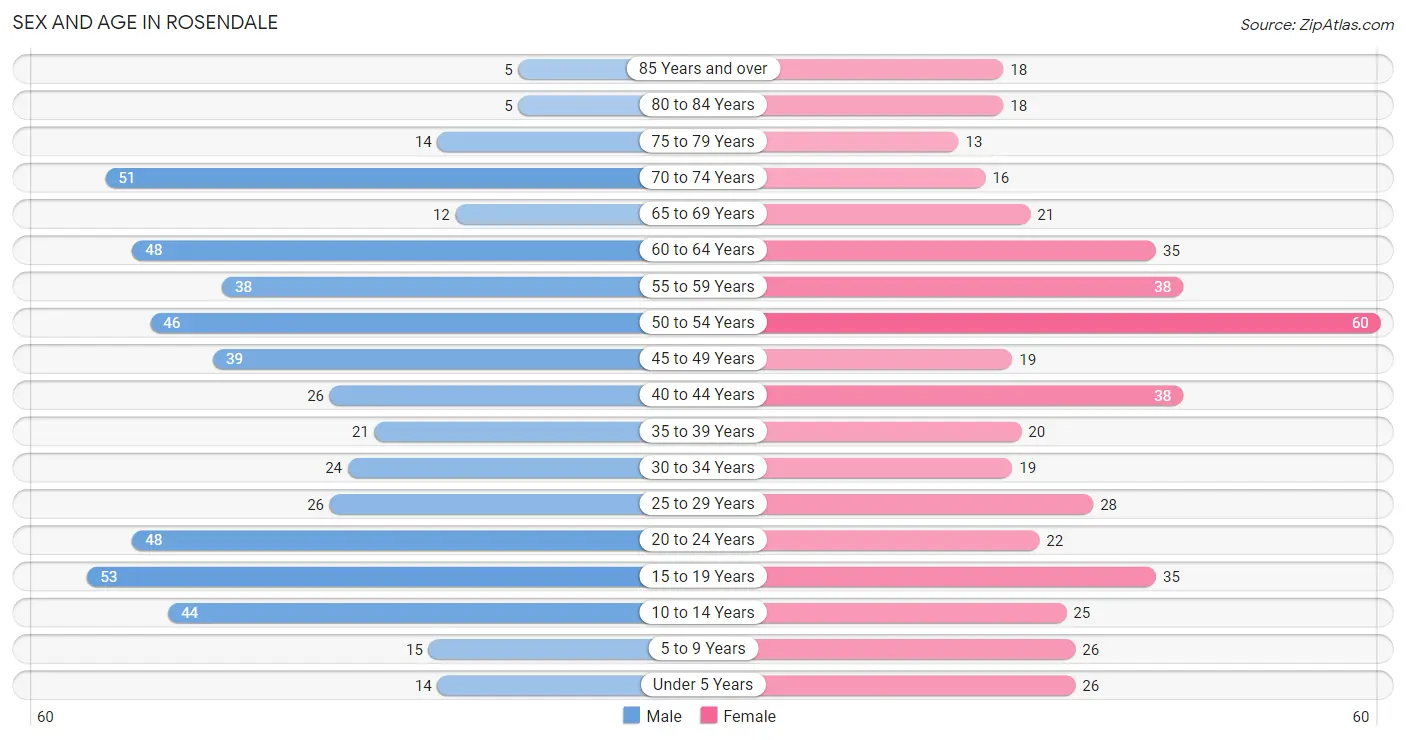
| Age Bracket | Male | Female |
| Under 5 Years | 14 (2.6%) | 26 (5.4%) |
| 5 to 9 Years | 15 (2.8%) | 26 (5.4%) |
| 10 to 14 Years | 44 (8.3%) | 25 (5.2%) |
| 15 to 19 Years | 53 (10.0%) | 35 (7.3%) |
| 20 to 24 Years | 48 (9.1%) | 22 (4.6%) |
| 25 to 29 Years | 26 (4.9%) | 28 (5.9%) |
| 30 to 34 Years | 24 (4.5%) | 19 (4.0%) |
| 35 to 39 Years | 21 (4.0%) | 20 (4.2%) |
| 40 to 44 Years | 26 (4.9%) | 38 (8.0%) |
| 45 to 49 Years | 39 (7.4%) | 19 (4.0%) |
| 50 to 54 Years | 46 (8.7%) | 60 (12.6%) |
| 55 to 59 Years | 38 (7.2%) | 38 (8.0%) |
| 60 to 64 Years | 48 (9.1%) | 35 (7.3%) |
| 65 to 69 Years | 12 (2.3%) | 21 (4.4%) |
| 70 to 74 Years | 51 (9.6%) | 16 (3.4%) |
| 75 to 79 Years | 14 (2.6%) | 13 (2.7%) |
| 80 to 84 Years | 5 (0.9%) | 18 (3.8%) |
| 85 Years and over | 5 (0.9%) | 18 (3.8%) |
| Total | 529 (100.0%) | 477 (100.0%) |
Families and Households in Rosendale
Median Family Size in Rosendale
The median family size in Rosendale is 2.75 persons per family, with single female/mother families (19 | 6.1%) accounting for the largest median family size of 3.74 persons per family. On the other hand, single male/father families (18 | 5.8%) represent the smallest median family size with 2.28 persons per family.
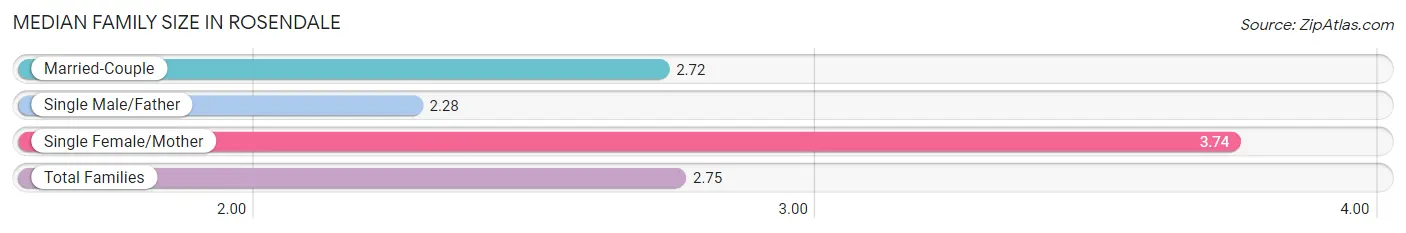
| Family Type | # Families | Family Size |
| Married-Couple | 276 (88.2%) | 2.72 |
| Single Male/Father | 18 (5.8%) | 2.28 |
| Single Female/Mother | 19 (6.1%) | 3.74 |
| Total Families | 313 (100.0%) | 2.75 |
Median Household Size in Rosendale
The median household size in Rosendale is 2.52 persons per household, with single female/mother households (19 | 4.8%) accounting for the largest median household size of 4.05 persons per household. non-family households (87 | 21.7%) represent the smallest median household size with 1.25 persons per household.
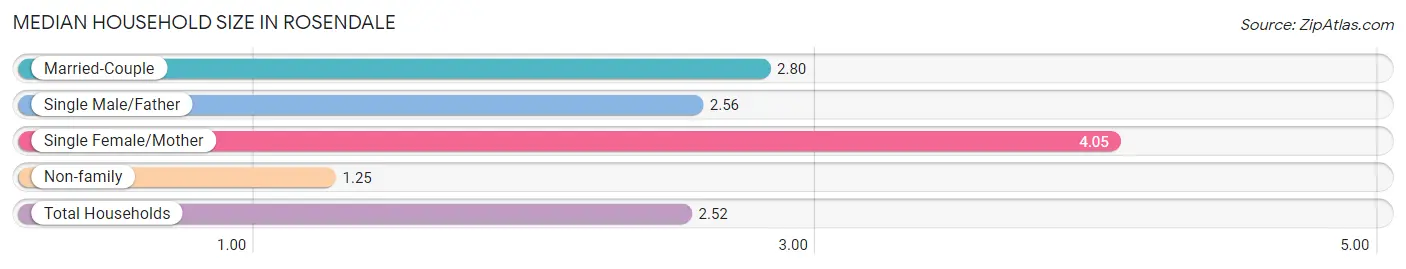
| Household Type | # Households | Household Size |
| Married-Couple | 276 (69.0%) | 2.80 |
| Single Male/Father | 18 (4.5%) | 2.56 |
| Single Female/Mother | 19 (4.8%) | 4.05 |
| Non-family | 87 (21.7%) | 1.25 |
| Total Households | 400 (100.0%) | 2.52 |
Household Size by Marriage Status in Rosendale
Out of a total of 400 households in Rosendale, 313 (78.2%) are family households, while 87 (21.7%) are nonfamily households. The most numerous type of family households are 2-person households, comprising 190, and the most common type of nonfamily households are 1-person households, comprising 66.
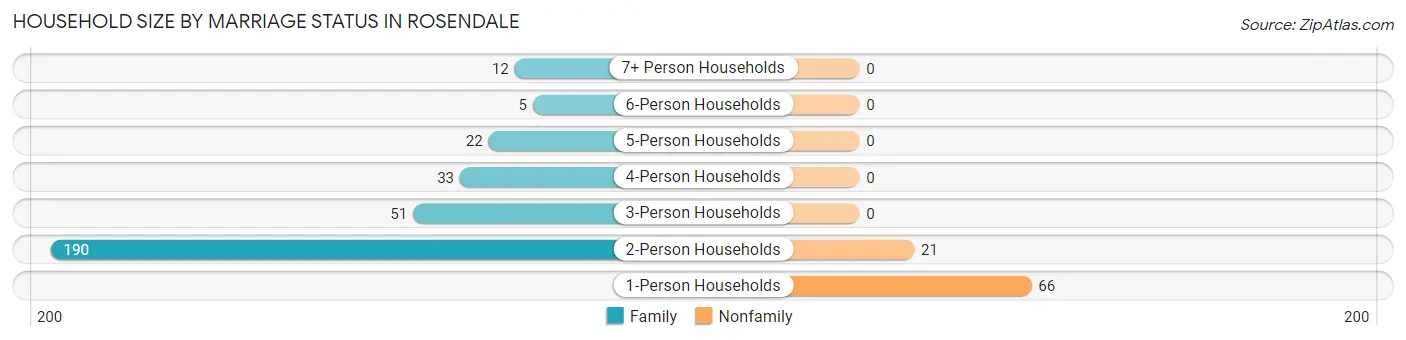
| Household Size | Family Households | Nonfamily Households |
| 1-Person Households | - | 66 (16.5%) |
| 2-Person Households | 190 (47.5%) | 21 (5.2%) |
| 3-Person Households | 51 (12.8%) | 0 (0.0%) |
| 4-Person Households | 33 (8.3%) | 0 (0.0%) |
| 5-Person Households | 22 (5.5%) | 0 (0.0%) |
| 6-Person Households | 5 (1.3%) | 0 (0.0%) |
| 7+ Person Households | 12 (3.0%) | 0 (0.0%) |
| Total | 313 (78.2%) | 87 (21.7%) |
Female Fertility in Rosendale
Fertility by Age in Rosendale
Average fertility rate in Rosendale is 22.0 births per 1,000 women. Women in the age bracket of 20 to 34 years have the highest fertility rate with 58.0 births per 1,000 women. Women in the age bracket of 20 to 34 years acount for 100.0% of all women with births.
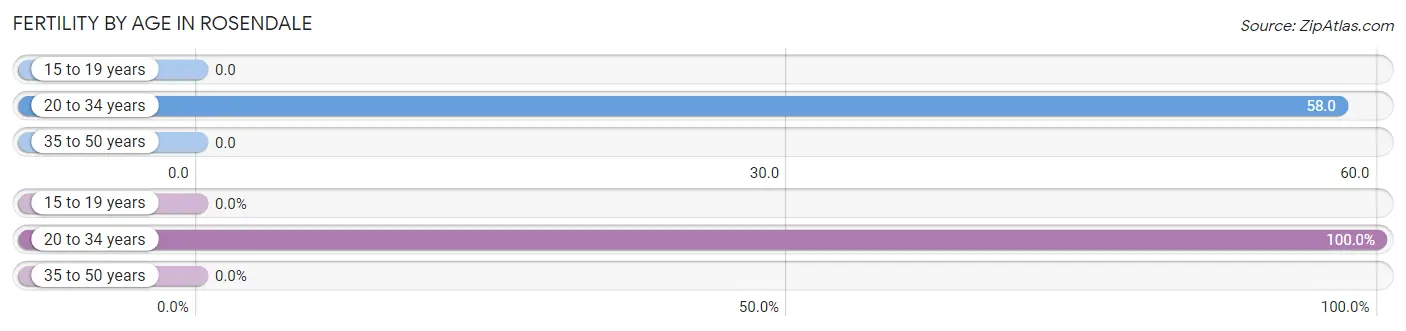
| Age Bracket | Women with Births | Births / 1,000 Women |
| 15 to 19 years | 0 (0.0%) | 0.0 |
| 20 to 34 years | 4 (100.0%) | 58.0 |
| 35 to 50 years | 0 (0.0%) | 0.0 |
| Total | 4 (100.0%) | 22.0 |
Fertility by Age by Marriage Status in Rosendale
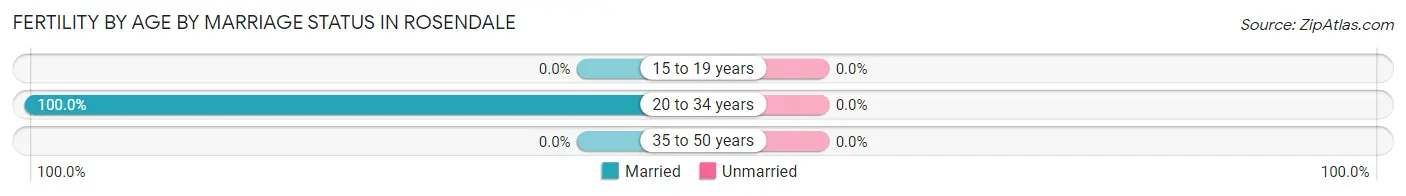
| Age Bracket | Married | Unmarried |
| 15 to 19 years | 0 (0.0%) | 0 (0.0%) |
| 20 to 34 years | 4 (100.0%) | 0 (0.0%) |
| 35 to 50 years | 0 (0.0%) | 0 (0.0%) |
| Total | 4 (100.0%) | 0 (0.0%) |
Fertility by Education in Rosendale
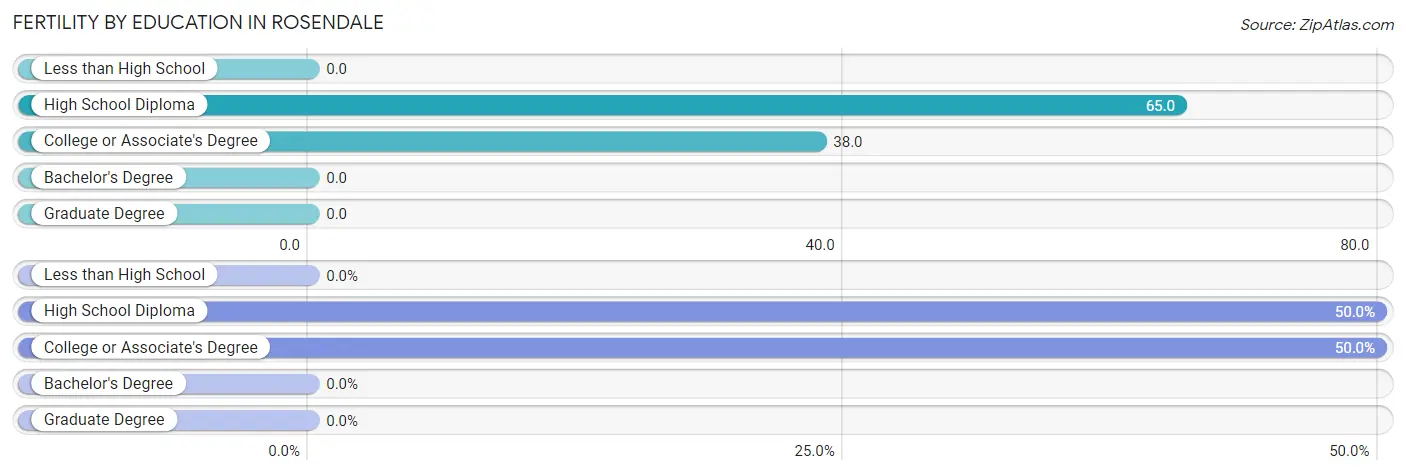
| Educational Attainment | Women with Births | Births / 1,000 Women |
| Less than High School | 0 (0.0%) | 0.0 |
| High School Diploma | 2 (50.0%) | 65.0 |
| College or Associate's Degree | 2 (50.0%) | 38.0 |
| Bachelor's Degree | 0 (0.0%) | 0.0 |
| Graduate Degree | 0 (0.0%) | 0.0 |
| Total | 4 (100.0%) | 22.0 |
Fertility by Education by Marriage Status in Rosendale
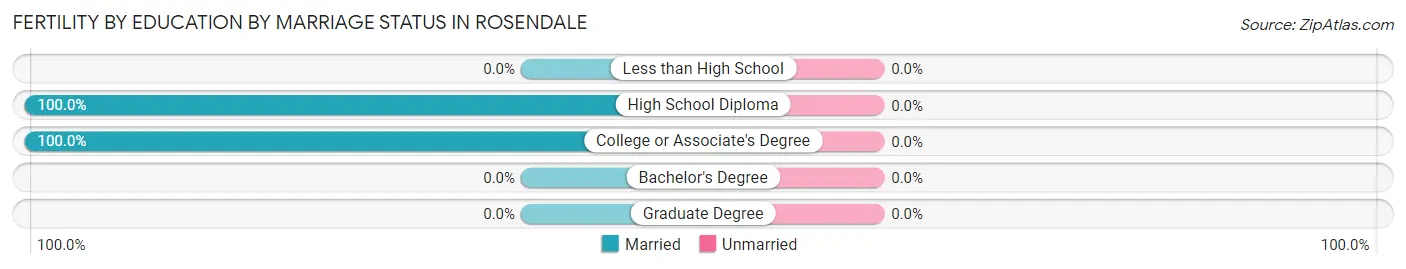
| Educational Attainment | Married | Unmarried |
| Less than High School | 0 (0.0%) | 0 (0.0%) |
| High School Diploma | 2 (100.0%) | 0 (0.0%) |
| College or Associate's Degree | 2 (100.0%) | 0 (0.0%) |
| Bachelor's Degree | 0 (0.0%) | 0 (0.0%) |
| Graduate Degree | 0 (0.0%) | 0 (0.0%) |
| Total | 4 (100.0%) | 0 (0.0%) |
Employment Characteristics in Rosendale
Employment by Class of Employer in Rosendale
Among the 536 employed individuals in Rosendale, private company employees (410 | 76.5%), not-for-profit organizations (45 | 8.4%), and local government employees (36 | 6.7%) make up the most common classes of employment.
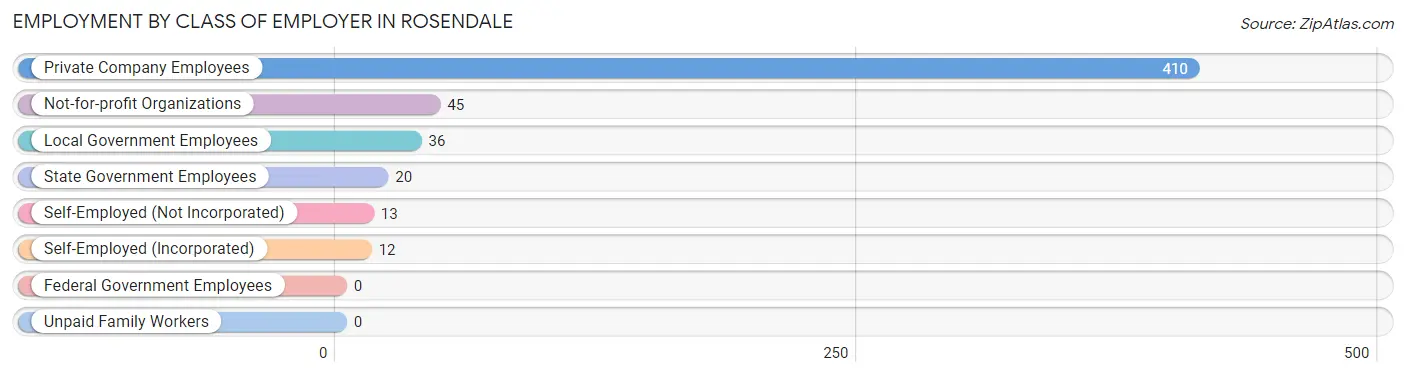
| Employer Class | # Employees | % Employees |
| Private Company Employees | 410 | 76.5% |
| Self-Employed (Incorporated) | 12 | 2.2% |
| Self-Employed (Not Incorporated) | 13 | 2.4% |
| Not-for-profit Organizations | 45 | 8.4% |
| Local Government Employees | 36 | 6.7% |
| State Government Employees | 20 | 3.7% |
| Federal Government Employees | 0 | 0.0% |
| Unpaid Family Workers | 0 | 0.0% |
| Total | 536 | 100.0% |
Employment Status by Age in Rosendale
According to the labor force statistics for Rosendale, out of the total population over 16 years of age (836), 69.0% or 577 individuals are in the labor force, with 3.6% or 21 of them unemployed. The age group with the highest labor force participation rate is 30 to 34 years, with 95.3% or 41 individuals in the labor force. Within the labor force, the 20 to 24 years age range has the highest percentage of unemployed individuals, with 21.2% or 14 of them being unemployed.
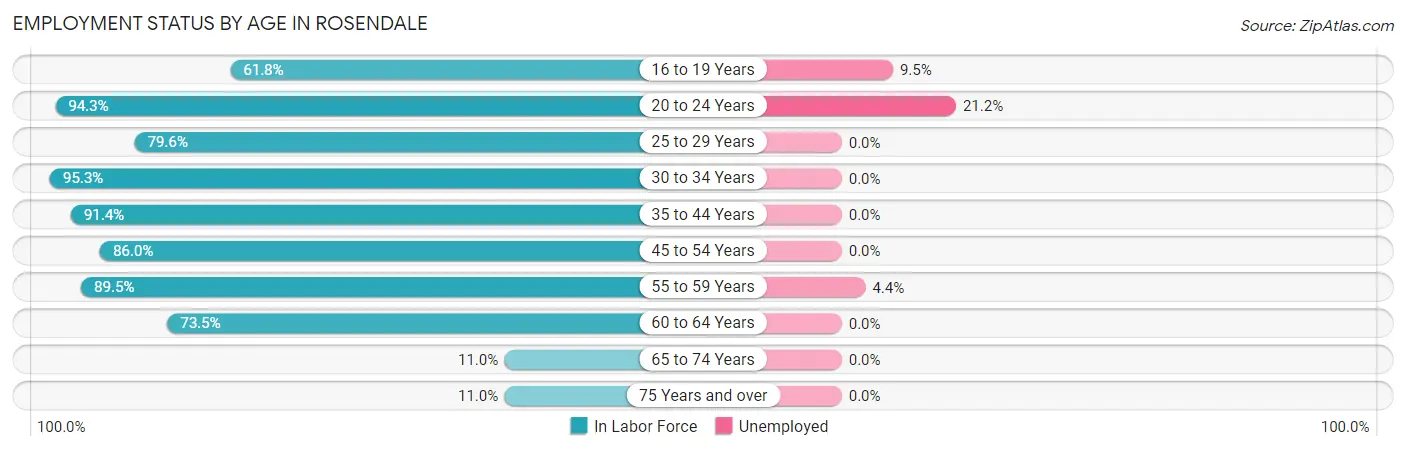
| Age Bracket | In Labor Force | Unemployed |
| 16 to 19 Years | 42 (61.8%) | 4 (9.5%) |
| 20 to 24 Years | 66 (94.3%) | 14 (21.2%) |
| 25 to 29 Years | 43 (79.6%) | 0 (0.0%) |
| 30 to 34 Years | 41 (95.3%) | 0 (0.0%) |
| 35 to 44 Years | 96 (91.4%) | 0 (0.0%) |
| 45 to 54 Years | 141 (86.0%) | 0 (0.0%) |
| 55 to 59 Years | 68 (89.5%) | 3 (4.4%) |
| 60 to 64 Years | 61 (73.5%) | 0 (0.0%) |
| 65 to 74 Years | 11 (11.0%) | 0 (0.0%) |
| 75 Years and over | 8 (11.0%) | 0 (0.0%) |
| Total | 577 (69.0%) | 21 (3.6%) |
Employment Status by Educational Attainment in Rosendale
According to labor force statistics for Rosendale, 85.7% of individuals (450) out of the total population between 25 and 64 years of age (525) are in the labor force, with 0.7% or 3 of them being unemployed. The group with the highest labor force participation rate are those with the educational attainment of bachelor's degree or higher, with 92.4% or 133 individuals in the labor force. Within the labor force, individuals with bachelor's degree or higher education have the highest percentage of unemployment, with 2.3% or 3 of them being unemployed.
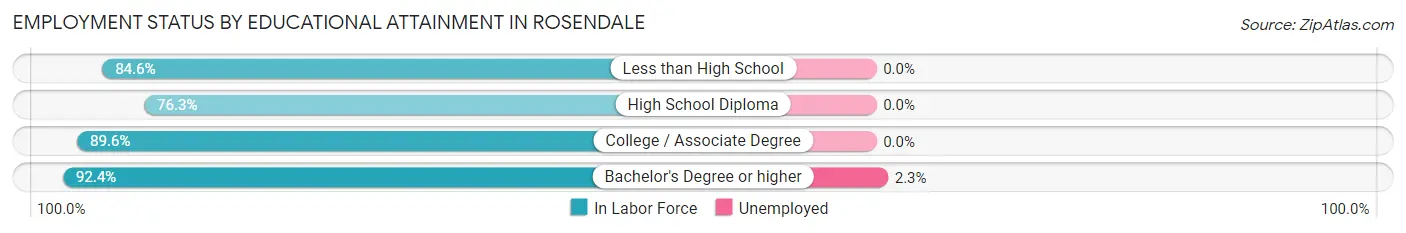
| Educational Attainment | In Labor Force | Unemployed |
| Less than High School | 22 (84.6%) | 0 (0.0%) |
| High School Diploma | 132 (76.3%) | 0 (0.0%) |
| College / Associate Degree | 163 (89.6%) | 0 (0.0%) |
| Bachelor's Degree or higher | 133 (92.4%) | 3 (2.3%) |
| Total | 450 (85.7%) | 4 (0.7%) |
Employment Occupations by Sex in Rosendale
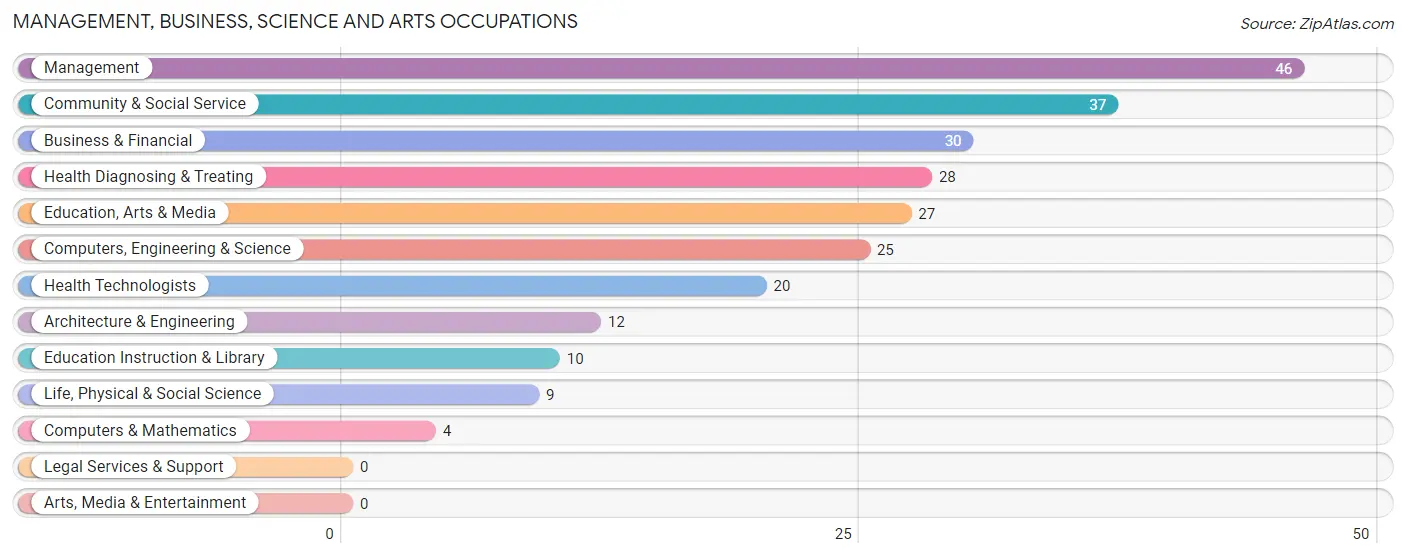
Management, Business, Science and Arts Occupations
The most common Management, Business, Science and Arts occupations in Rosendale are Management (46 | 8.3%), Community & Social Service (37 | 6.7%), Business & Financial (30 | 5.4%), Health Diagnosing & Treating (28 | 5.0%), and Education, Arts & Media (27 | 4.9%).
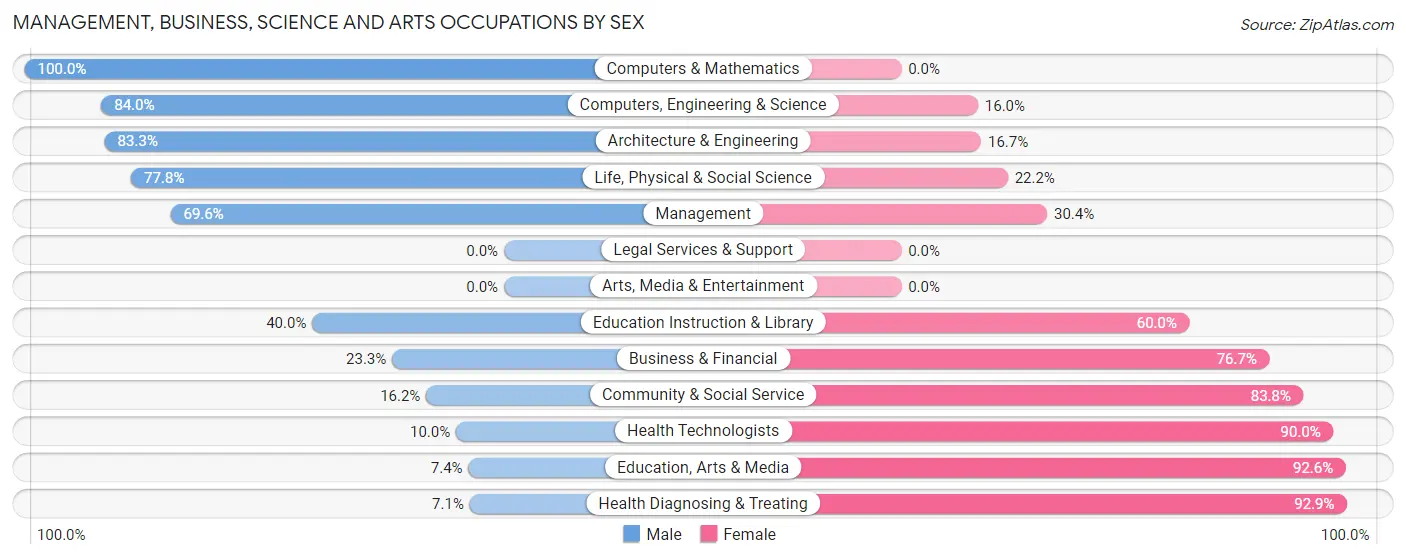
Management, Business, Science and Arts Occupations by Sex
Within the Management, Business, Science and Arts occupations in Rosendale, the most male-oriented occupations are Computers & Mathematics (100.0%), Computers, Engineering & Science (84.0%), and Architecture & Engineering (83.3%), while the most female-oriented occupations are Health Diagnosing & Treating (92.9%), Education, Arts & Media (92.6%), and Health Technologists (90.0%).
| Occupation | Male | Female |
| Management | 32 (69.6%) | 14 (30.4%) |
| Business & Financial | 7 (23.3%) | 23 (76.7%) |
| Computers, Engineering & Science | 21 (84.0%) | 4 (16.0%) |
| Computers & Mathematics | 4 (100.0%) | 0 (0.0%) |
| Architecture & Engineering | 10 (83.3%) | 2 (16.7%) |
| Life, Physical & Social Science | 7 (77.8%) | 2 (22.2%) |
| Community & Social Service | 6 (16.2%) | 31 (83.8%) |
| Education, Arts & Media | 2 (7.4%) | 25 (92.6%) |
| Legal Services & Support | 0 (0.0%) | 0 (0.0%) |
| Education Instruction & Library | 4 (40.0%) | 6 (60.0%) |
| Arts, Media & Entertainment | 0 (0.0%) | 0 (0.0%) |
| Health Diagnosing & Treating | 2 (7.1%) | 26 (92.9%) |
| Health Technologists | 2 (10.0%) | 18 (90.0%) |
| Total (Category) | 68 (41.0%) | 98 (59.0%) |
| Total (Overall) | 310 (55.8%) | 246 (44.2%) |
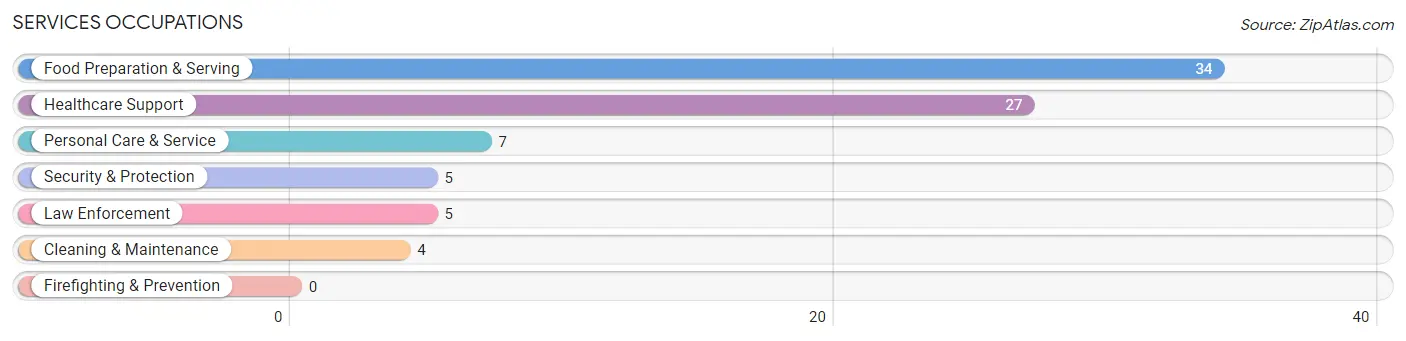
Services Occupations
The most common Services occupations in Rosendale are Food Preparation & Serving (34 | 6.1%), Healthcare Support (27 | 4.9%), Personal Care & Service (7 | 1.3%), Security & Protection (5 | 0.9%), and Law Enforcement (5 | 0.9%).
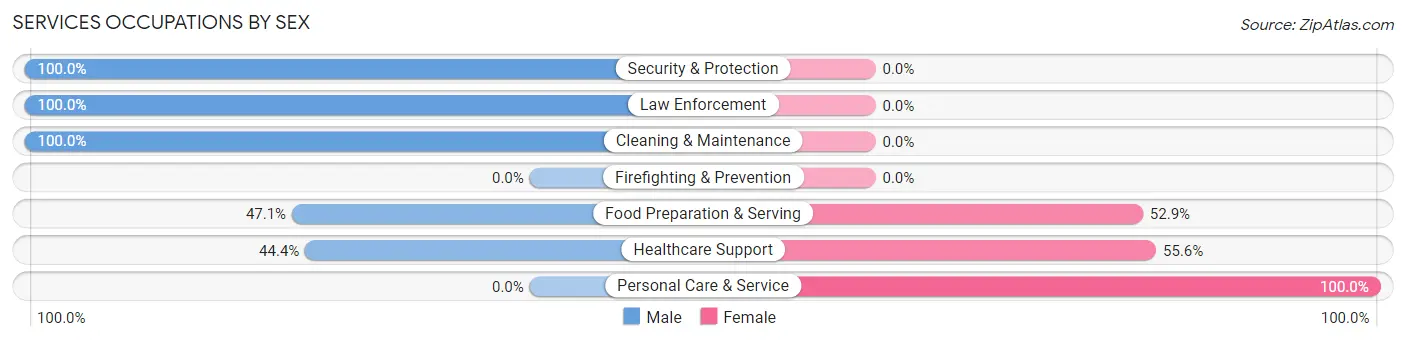
Services Occupations by Sex
Within the Services occupations in Rosendale, the most male-oriented occupations are Security & Protection (100.0%), Law Enforcement (100.0%), and Cleaning & Maintenance (100.0%), while the most female-oriented occupations are Personal Care & Service (100.0%), Healthcare Support (55.6%), and Food Preparation & Serving (52.9%).
| Occupation | Male | Female |
| Healthcare Support | 12 (44.4%) | 15 (55.6%) |
| Security & Protection | 5 (100.0%) | 0 (0.0%) |
| Firefighting & Prevention | 0 (0.0%) | 0 (0.0%) |
| Law Enforcement | 5 (100.0%) | 0 (0.0%) |
| Food Preparation & Serving | 16 (47.1%) | 18 (52.9%) |
| Cleaning & Maintenance | 4 (100.0%) | 0 (0.0%) |
| Personal Care & Service | 0 (0.0%) | 7 (100.0%) |
| Total (Category) | 37 (48.0%) | 40 (51.9%) |
| Total (Overall) | 310 (55.8%) | 246 (44.2%) |
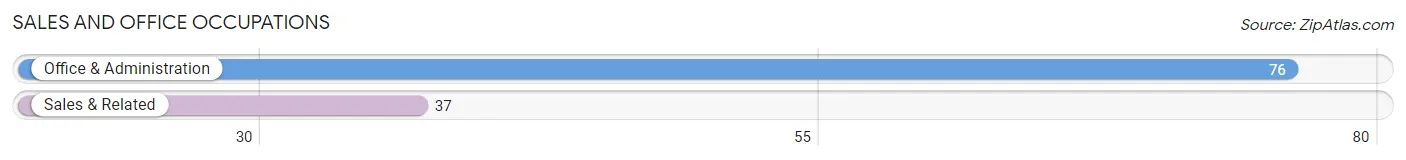
Sales and Office Occupations
The most common Sales and Office occupations in Rosendale are Office & Administration (76 | 13.7%), and Sales & Related (37 | 6.7%).
Sales and Office Occupations by Sex
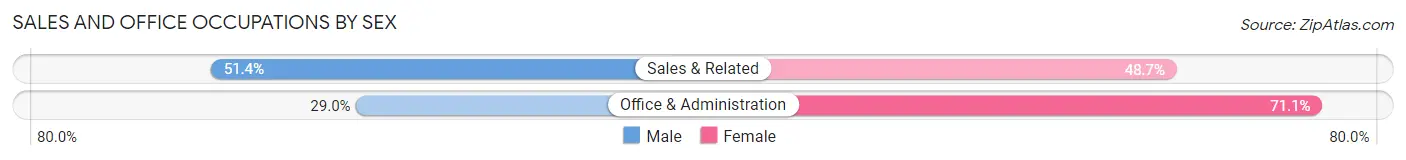
| Occupation | Male | Female |
| Sales & Related | 19 (51.3%) | 18 (48.6%) |
| Office & Administration | 22 (28.9%) | 54 (71.1%) |
| Total (Category) | 41 (36.3%) | 72 (63.7%) |
| Total (Overall) | 310 (55.8%) | 246 (44.2%) |
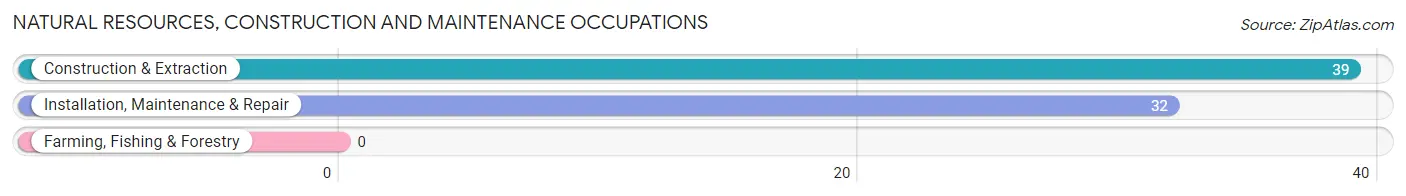
Natural Resources, Construction and Maintenance Occupations
The most common Natural Resources, Construction and Maintenance occupations in Rosendale are Construction & Extraction (39 | 7.0%), and Installation, Maintenance & Repair (32 | 5.8%).
Natural Resources, Construction and Maintenance Occupations by Sex
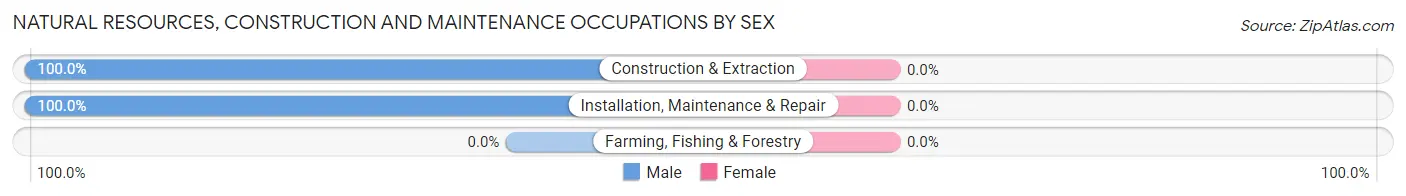
| Occupation | Male | Female |
| Farming, Fishing & Forestry | 0 (0.0%) | 0 (0.0%) |
| Construction & Extraction | 39 (100.0%) | 0 (0.0%) |
| Installation, Maintenance & Repair | 32 (100.0%) | 0 (0.0%) |
| Total (Category) | 71 (100.0%) | 0 (0.0%) |
| Total (Overall) | 310 (55.8%) | 246 (44.2%) |
Production, Transportation and Moving Occupations
The most common Production, Transportation and Moving occupations in Rosendale are Production (68 | 12.2%), Transportation (40 | 7.2%), and Material Moving (21 | 3.8%).
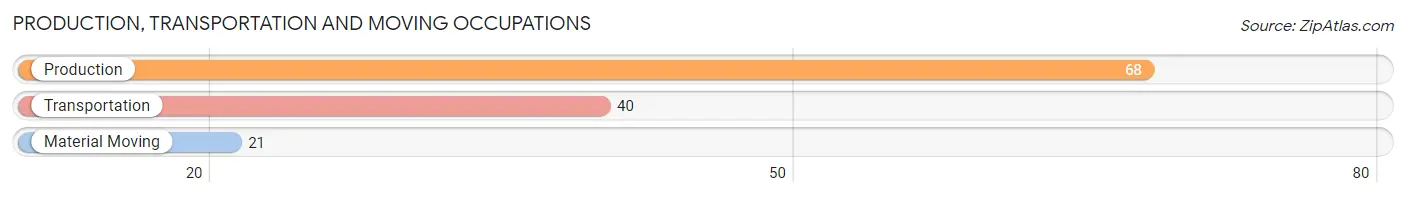
Production, Transportation and Moving Occupations by Sex
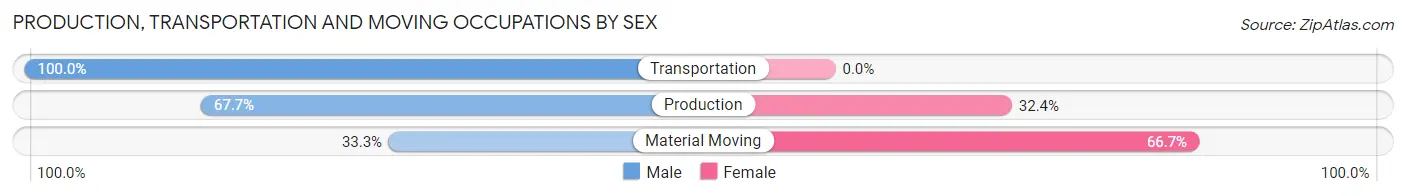
| Occupation | Male | Female |
| Production | 46 (67.6%) | 22 (32.4%) |
| Transportation | 40 (100.0%) | 0 (0.0%) |
| Material Moving | 7 (33.3%) | 14 (66.7%) |
| Total (Category) | 93 (72.1%) | 36 (27.9%) |
| Total (Overall) | 310 (55.8%) | 246 (44.2%) |
Employment Industries by Sex in Rosendale
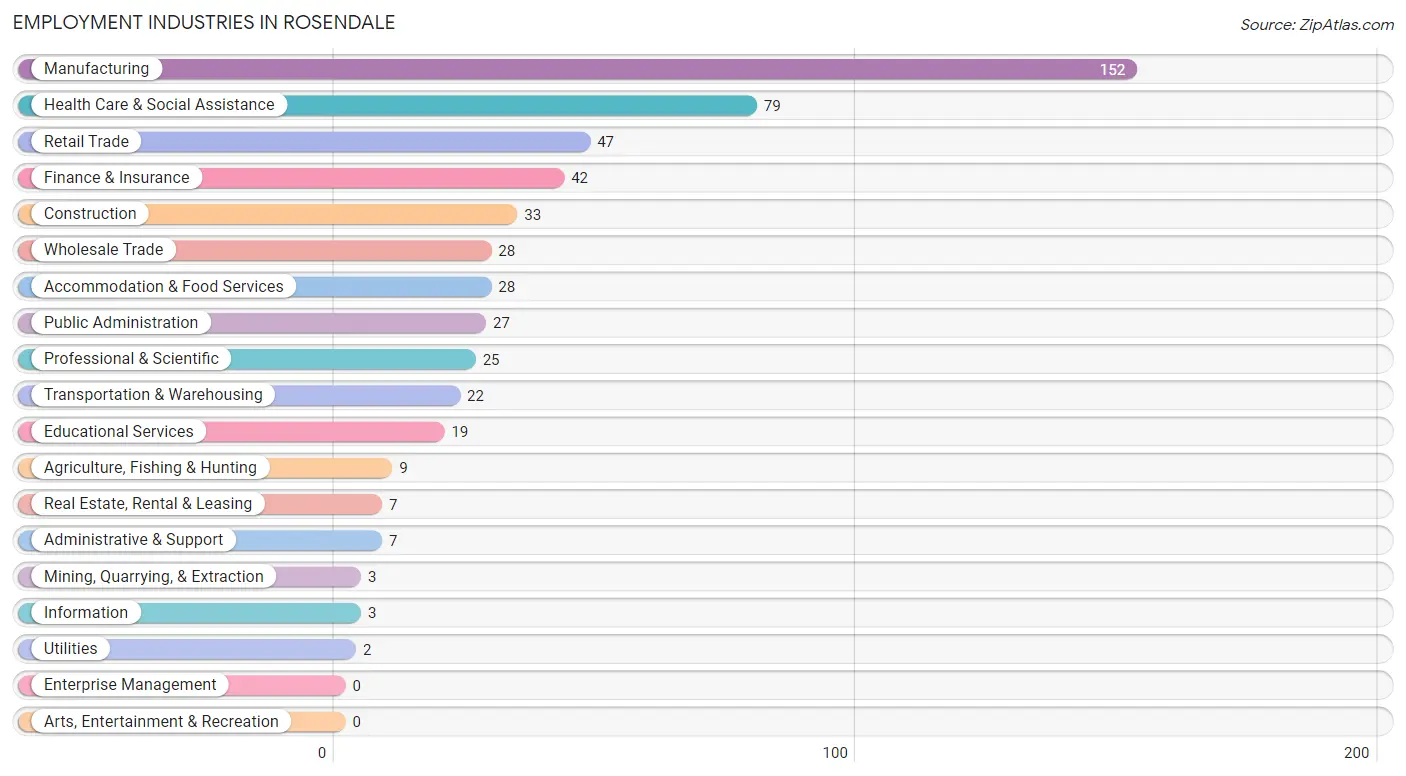
Employment Industries in Rosendale
The major employment industries in Rosendale include Manufacturing (152 | 27.3%), Health Care & Social Assistance (79 | 14.2%), Retail Trade (47 | 8.5%), Finance & Insurance (42 | 7.5%), and Construction (33 | 5.9%).
Employment Industries by Sex in Rosendale
The Rosendale industries that see more men than women are Agriculture, Fishing & Hunting (100.0%), Mining, Quarrying, & Extraction (100.0%), and Construction (100.0%), whereas the industries that tend to have a higher number of women are Retail Trade (83.0%), Public Administration (81.5%), and Health Care & Social Assistance (69.6%).
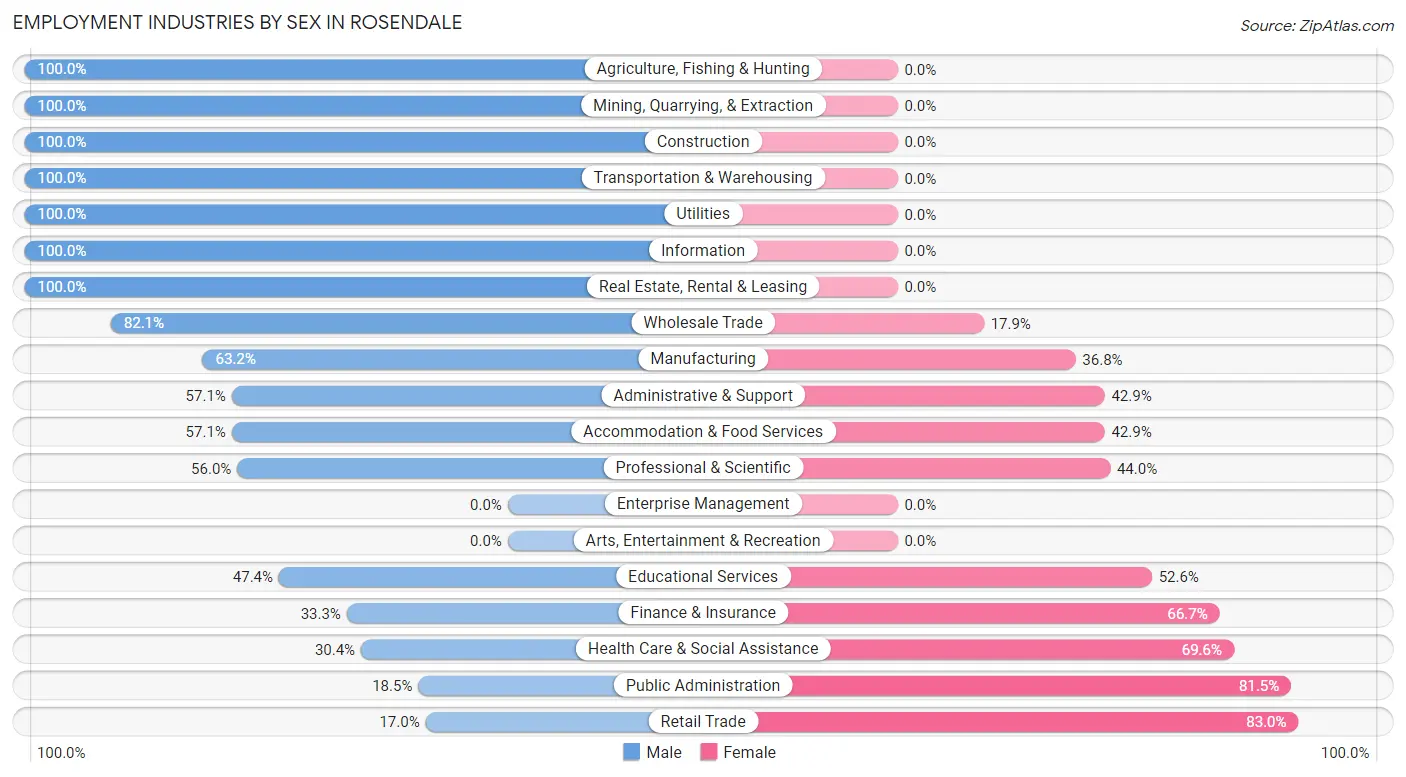
| Industry | Male | Female |
| Agriculture, Fishing & Hunting | 9 (100.0%) | 0 (0.0%) |
| Mining, Quarrying, & Extraction | 3 (100.0%) | 0 (0.0%) |
| Construction | 33 (100.0%) | 0 (0.0%) |
| Manufacturing | 96 (63.2%) | 56 (36.8%) |
| Wholesale Trade | 23 (82.1%) | 5 (17.9%) |
| Retail Trade | 8 (17.0%) | 39 (83.0%) |
| Transportation & Warehousing | 22 (100.0%) | 0 (0.0%) |
| Utilities | 2 (100.0%) | 0 (0.0%) |
| Information | 3 (100.0%) | 0 (0.0%) |
| Finance & Insurance | 14 (33.3%) | 28 (66.7%) |
| Real Estate, Rental & Leasing | 7 (100.0%) | 0 (0.0%) |
| Professional & Scientific | 14 (56.0%) | 11 (44.0%) |
| Enterprise Management | 0 (0.0%) | 0 (0.0%) |
| Administrative & Support | 4 (57.1%) | 3 (42.9%) |
| Educational Services | 9 (47.4%) | 10 (52.6%) |
| Health Care & Social Assistance | 24 (30.4%) | 55 (69.6%) |
| Arts, Entertainment & Recreation | 0 (0.0%) | 0 (0.0%) |
| Accommodation & Food Services | 16 (57.1%) | 12 (42.9%) |
| Public Administration | 5 (18.5%) | 22 (81.5%) |
| Total | 310 (55.8%) | 246 (44.2%) |
Education in Rosendale
School Enrollment in Rosendale
The most common levels of schooling among the 249 students in Rosendale are high school (70 | 28.1%), middle school (61 | 24.5%), and college / undergraduate (50 | 20.1%).
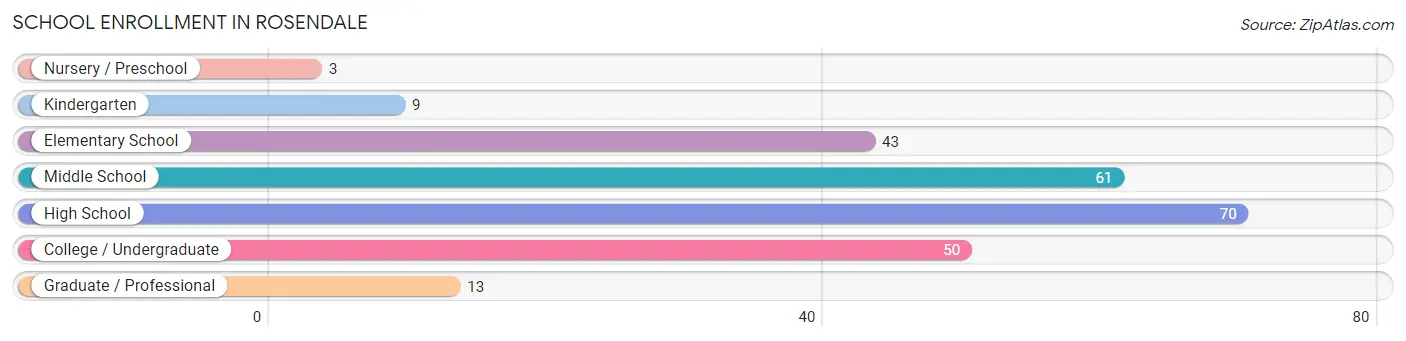
| School Level | # Students | % Students |
| Nursery / Preschool | 3 | 1.2% |
| Kindergarten | 9 | 3.6% |
| Elementary School | 43 | 17.3% |
| Middle School | 61 | 24.5% |
| High School | 70 | 28.1% |
| College / Undergraduate | 50 | 20.1% |
| Graduate / Professional | 13 | 5.2% |
| Total | 249 | 100.0% |
School Enrollment by Age by Funding Source in Rosendale
Out of a total of 249 students who are enrolled in schools in Rosendale, 25 (10.0%) attend a private institution, while the remaining 224 (90.0%) are enrolled in public schools. The age group of 20 to 24 year olds has the highest likelihood of being enrolled in private schools, with 13 (34.2% in the age bracket) enrolled. Conversely, the age group of 3 to 4 year olds has the lowest likelihood of being enrolled in a private school, with 6 (100.0% in the age bracket) attending a public institution.
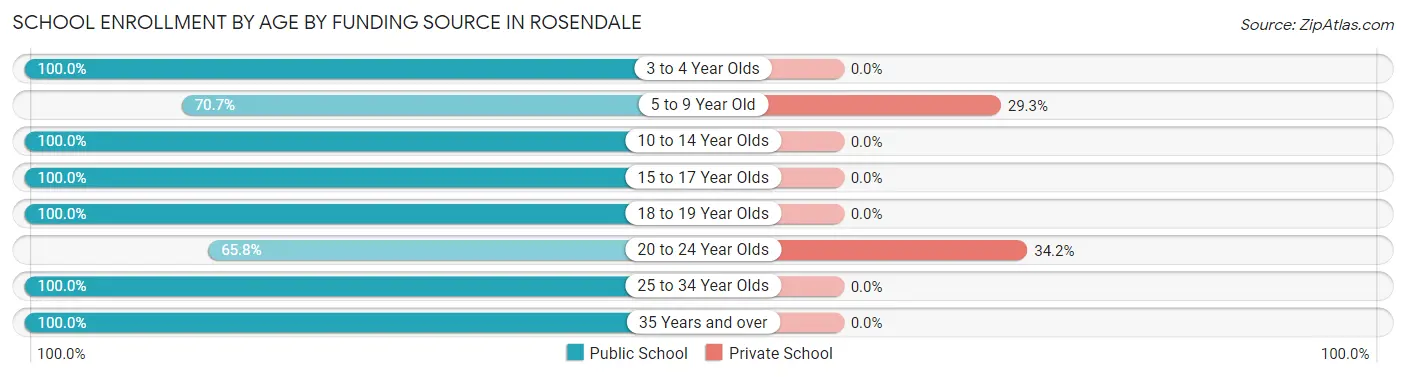
| Age Bracket | Public School | Private School |
| 3 to 4 Year Olds | 6 (100.0%) | 0 (0.0%) |
| 5 to 9 Year Old | 29 (70.7%) | 12 (29.3%) |
| 10 to 14 Year Olds | 69 (100.0%) | 0 (0.0%) |
| 15 to 17 Year Olds | 47 (100.0%) | 0 (0.0%) |
| 18 to 19 Year Olds | 31 (100.0%) | 0 (0.0%) |
| 20 to 24 Year Olds | 25 (65.8%) | 13 (34.2%) |
| 25 to 34 Year Olds | 4 (100.0%) | 0 (0.0%) |
| 35 Years and over | 13 (100.0%) | 0 (0.0%) |
| Total | 224 (90.0%) | 25 (10.0%) |
Educational Attainment by Field of Study in Rosendale
Business (48 | 23.9%), education (31 | 15.4%), science & technology (29 | 14.4%), bio, nature & agricultural (26 | 12.9%), and psychology (21 | 10.4%) are the most common fields of study among 201 individuals in Rosendale who have obtained a bachelor's degree or higher.
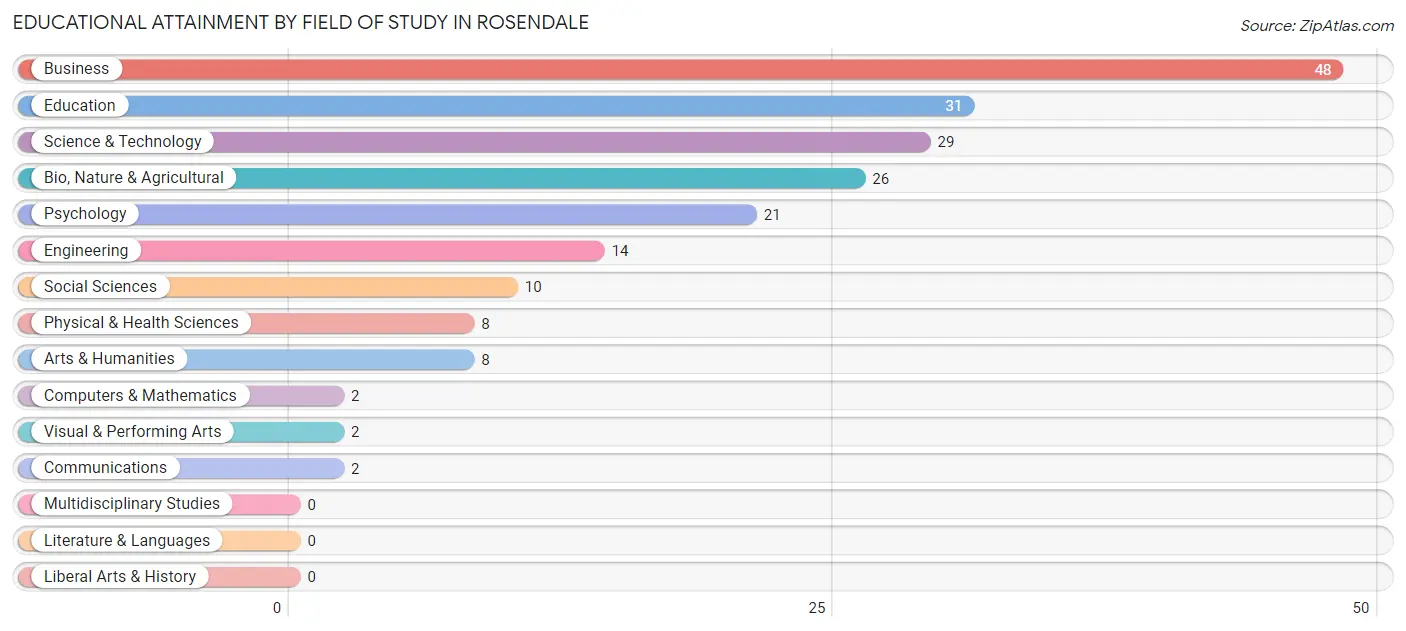
| Field of Study | # Graduates | % Graduates |
| Computers & Mathematics | 2 | 1.0% |
| Bio, Nature & Agricultural | 26 | 12.9% |
| Physical & Health Sciences | 8 | 4.0% |
| Psychology | 21 | 10.4% |
| Social Sciences | 10 | 5.0% |
| Engineering | 14 | 7.0% |
| Multidisciplinary Studies | 0 | 0.0% |
| Science & Technology | 29 | 14.4% |
| Business | 48 | 23.9% |
| Education | 31 | 15.4% |
| Literature & Languages | 0 | 0.0% |
| Liberal Arts & History | 0 | 0.0% |
| Visual & Performing Arts | 2 | 1.0% |
| Communications | 2 | 1.0% |
| Arts & Humanities | 8 | 4.0% |
| Total | 201 | 100.0% |
Transportation & Commute in Rosendale
Vehicle Availability by Sex in Rosendale
The most prevalent vehicle ownership categories in Rosendale are males with 2 vehicles (111, accounting for 36.2%) and females with 2 vehicles (84, making up 48.5%).
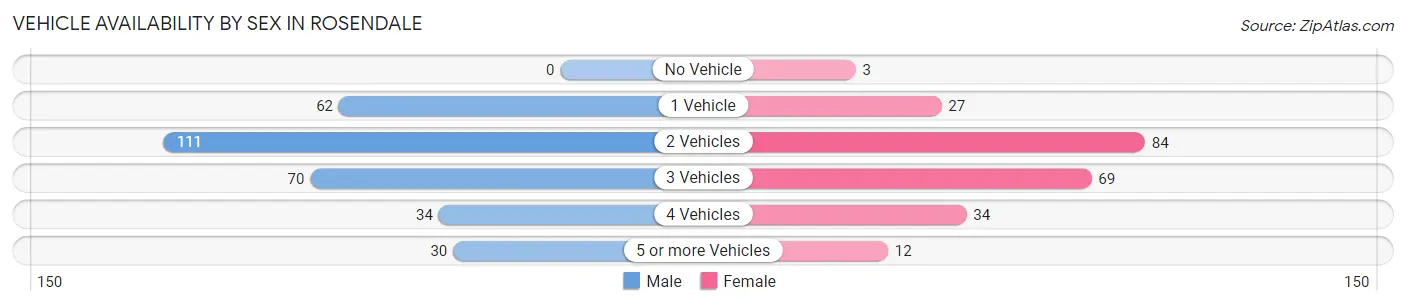
| Vehicles Available | Male | Female |
| No Vehicle | 0 (0.0%) | 3 (1.3%) |
| 1 Vehicle | 62 (20.2%) | 27 (11.8%) |
| 2 Vehicles | 111 (36.2%) | 84 (36.7%) |
| 3 Vehicles | 70 (22.8%) | 69 (30.1%) |
| 4 Vehicles | 34 (11.1%) | 34 (14.8%) |
| 5 or more Vehicles | 30 (9.8%) | 12 (5.2%) |
| Total | 307 (100.0%) | 229 (100.0%) |
Commute Time in Rosendale
The most frequently occuring commute durations in Rosendale are 20 to 24 minutes (118 commuters, 23.3%), 15 to 19 minutes (75 commuters, 14.8%), and 25 to 29 minutes (67 commuters, 13.2%).
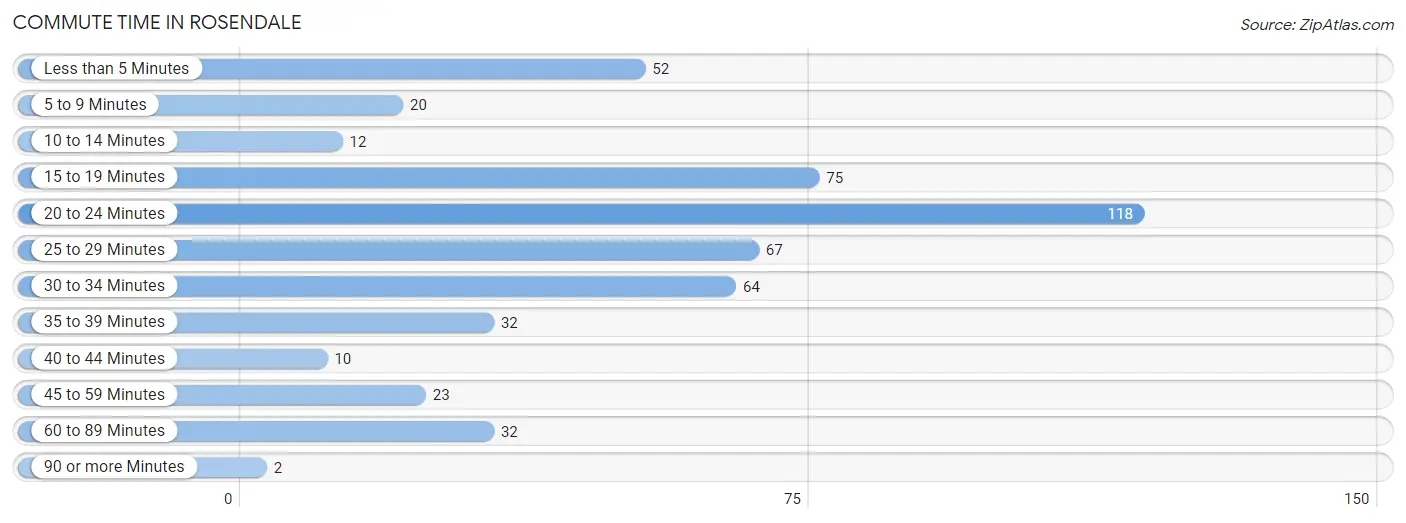
| Commute Time | # Commuters | % Commuters |
| Less than 5 Minutes | 52 | 10.3% |
| 5 to 9 Minutes | 20 | 3.9% |
| 10 to 14 Minutes | 12 | 2.4% |
| 15 to 19 Minutes | 75 | 14.8% |
| 20 to 24 Minutes | 118 | 23.3% |
| 25 to 29 Minutes | 67 | 13.2% |
| 30 to 34 Minutes | 64 | 12.6% |
| 35 to 39 Minutes | 32 | 6.3% |
| 40 to 44 Minutes | 10 | 2.0% |
| 45 to 59 Minutes | 23 | 4.5% |
| 60 to 89 Minutes | 32 | 6.3% |
| 90 or more Minutes | 2 | 0.4% |
Commute Time by Sex in Rosendale
The most common commute times in Rosendale are 20 to 24 minutes (66 commuters, 22.2%) for males and 20 to 24 minutes (52 commuters, 24.9%) for females.
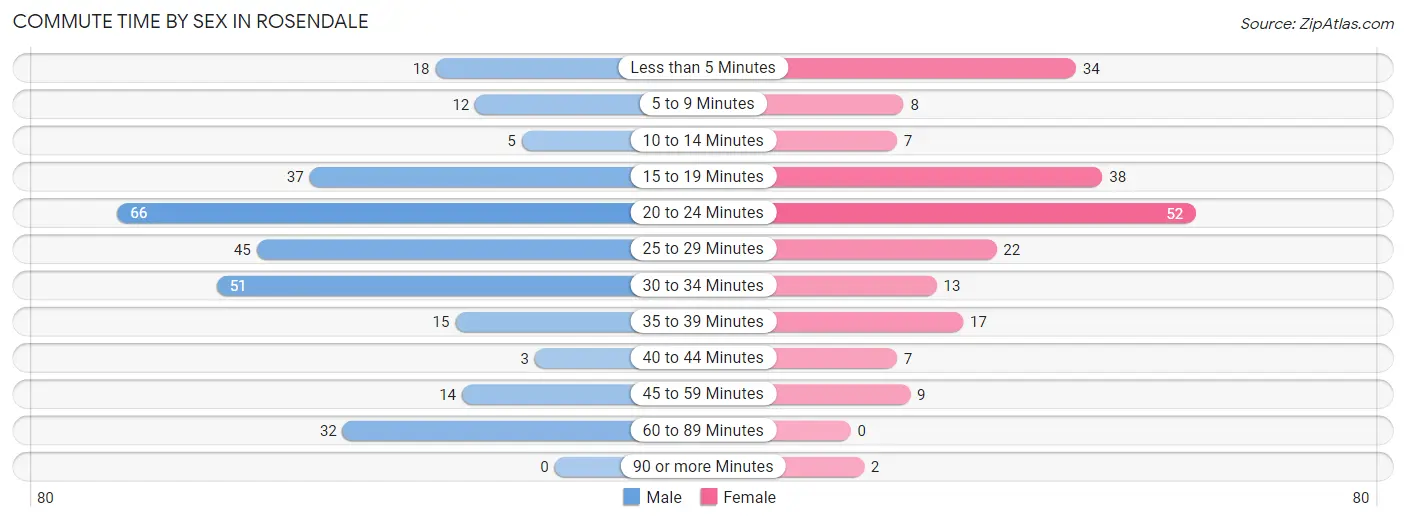
| Commute Time | Male | Female |
| Less than 5 Minutes | 18 (6.0%) | 34 (16.3%) |
| 5 to 9 Minutes | 12 (4.0%) | 8 (3.8%) |
| 10 to 14 Minutes | 5 (1.7%) | 7 (3.4%) |
| 15 to 19 Minutes | 37 (12.4%) | 38 (18.2%) |
| 20 to 24 Minutes | 66 (22.2%) | 52 (24.9%) |
| 25 to 29 Minutes | 45 (15.1%) | 22 (10.5%) |
| 30 to 34 Minutes | 51 (17.1%) | 13 (6.2%) |
| 35 to 39 Minutes | 15 (5.0%) | 17 (8.1%) |
| 40 to 44 Minutes | 3 (1.0%) | 7 (3.4%) |
| 45 to 59 Minutes | 14 (4.7%) | 9 (4.3%) |
| 60 to 89 Minutes | 32 (10.7%) | 0 (0.0%) |
| 90 or more Minutes | 0 (0.0%) | 2 (1.0%) |
Time of Departure to Work by Sex in Rosendale
The most frequent times of departure to work in Rosendale are 12:00 AM to 4:59 AM (62, 20.8%) for males and 7:30 AM to 7:59 AM (43, 20.6%) for females.
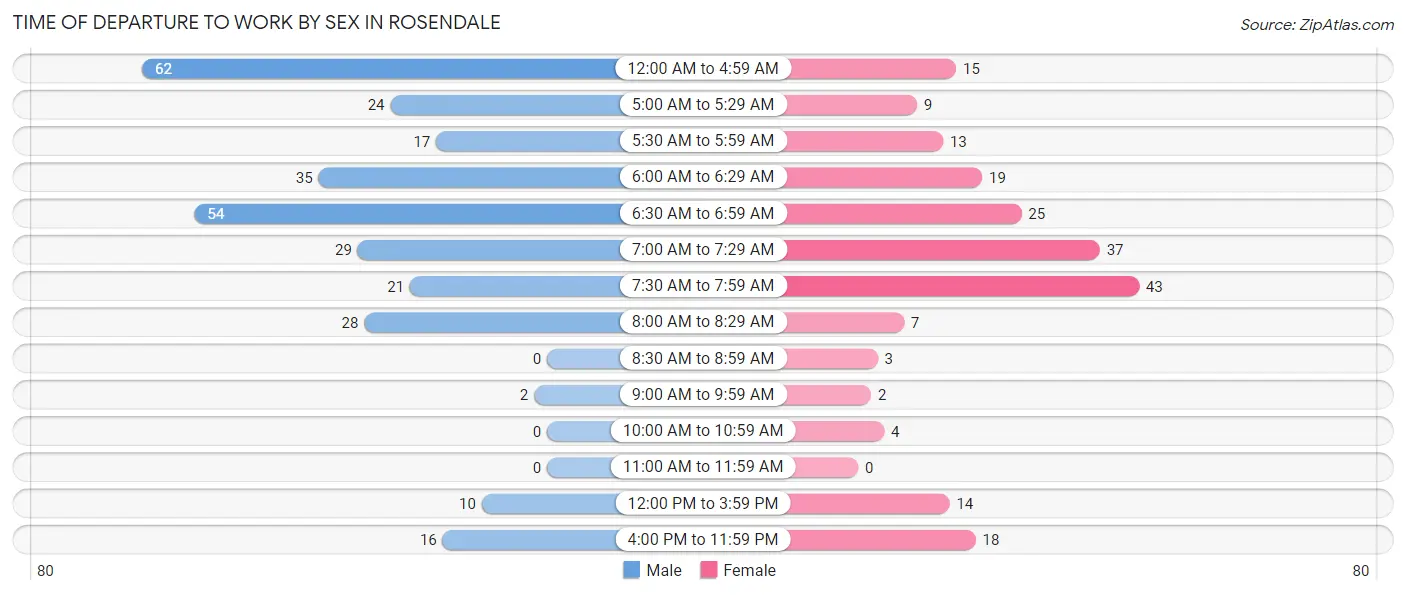
| Time of Departure | Male | Female |
| 12:00 AM to 4:59 AM | 62 (20.8%) | 15 (7.2%) |
| 5:00 AM to 5:29 AM | 24 (8.1%) | 9 (4.3%) |
| 5:30 AM to 5:59 AM | 17 (5.7%) | 13 (6.2%) |
| 6:00 AM to 6:29 AM | 35 (11.7%) | 19 (9.1%) |
| 6:30 AM to 6:59 AM | 54 (18.1%) | 25 (12.0%) |
| 7:00 AM to 7:29 AM | 29 (9.7%) | 37 (17.7%) |
| 7:30 AM to 7:59 AM | 21 (7.0%) | 43 (20.6%) |
| 8:00 AM to 8:29 AM | 28 (9.4%) | 7 (3.4%) |
| 8:30 AM to 8:59 AM | 0 (0.0%) | 3 (1.4%) |
| 9:00 AM to 9:59 AM | 2 (0.7%) | 2 (1.0%) |
| 10:00 AM to 10:59 AM | 0 (0.0%) | 4 (1.9%) |
| 11:00 AM to 11:59 AM | 0 (0.0%) | 0 (0.0%) |
| 12:00 PM to 3:59 PM | 10 (3.4%) | 14 (6.7%) |
| 4:00 PM to 11:59 PM | 16 (5.4%) | 18 (8.6%) |
| Total | 298 (100.0%) | 209 (100.0%) |
Housing Occupancy in Rosendale
Occupancy by Ownership in Rosendale
Of the total 400 dwellings in Rosendale, owner-occupied units account for 357 (89.2%), while renter-occupied units make up 43 (10.7%).
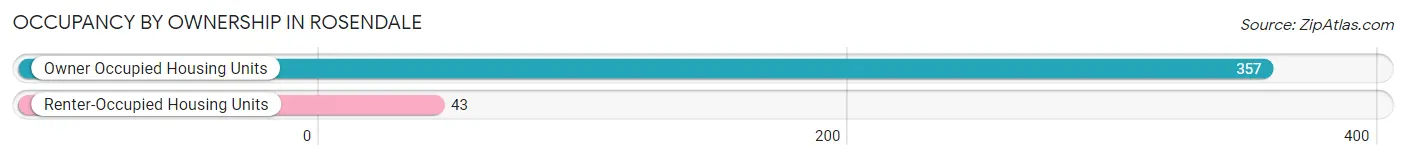
| Occupancy | # Housing Units | % Housing Units |
| Owner Occupied Housing Units | 357 | 89.2% |
| Renter-Occupied Housing Units | 43 | 10.7% |
| Total Occupied Housing Units | 400 | 100.0% |
Occupancy by Household Size in Rosendale
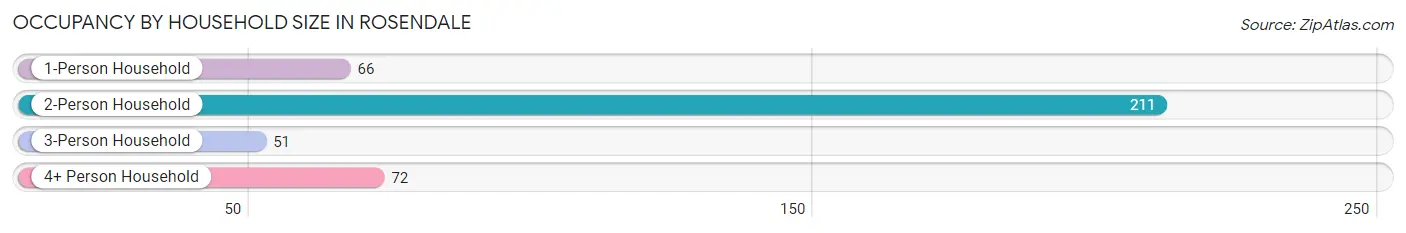
| Household Size | # Housing Units | % Housing Units |
| 1-Person Household | 66 | 16.5% |
| 2-Person Household | 211 | 52.7% |
| 3-Person Household | 51 | 12.8% |
| 4+ Person Household | 72 | 18.0% |
| Total Housing Units | 400 | 100.0% |
Occupancy by Ownership by Household Size in Rosendale
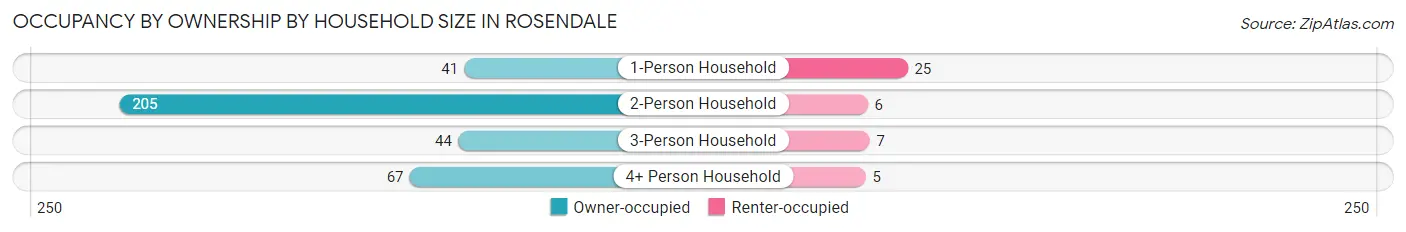
| Household Size | Owner-occupied | Renter-occupied |
| 1-Person Household | 41 (62.1%) | 25 (37.9%) |
| 2-Person Household | 205 (97.2%) | 6 (2.8%) |
| 3-Person Household | 44 (86.3%) | 7 (13.7%) |
| 4+ Person Household | 67 (93.1%) | 5 (6.9%) |
| Total Housing Units | 357 (89.2%) | 43 (10.7%) |
Occupancy by Educational Attainment in Rosendale
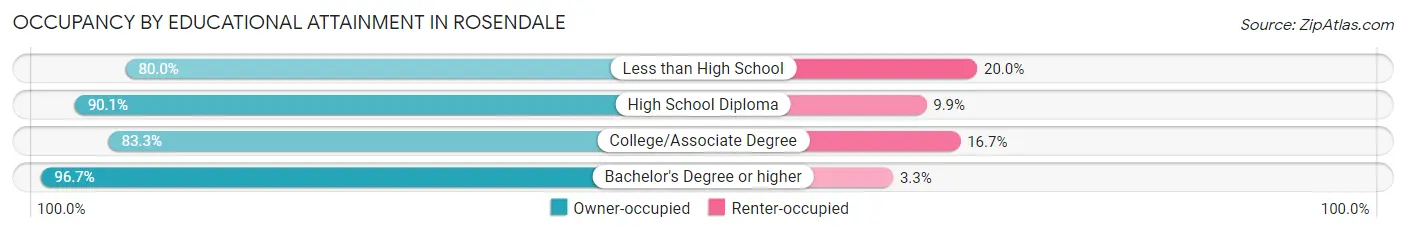
| Household Size | Owner-occupied | Renter-occupied |
| Less than High School | 12 (80.0%) | 3 (20.0%) |
| High School Diploma | 163 (90.1%) | 18 (9.9%) |
| College/Associate Degree | 95 (83.3%) | 19 (16.7%) |
| Bachelor's Degree or higher | 87 (96.7%) | 3 (3.3%) |
Occupancy by Age of Householder in Rosendale
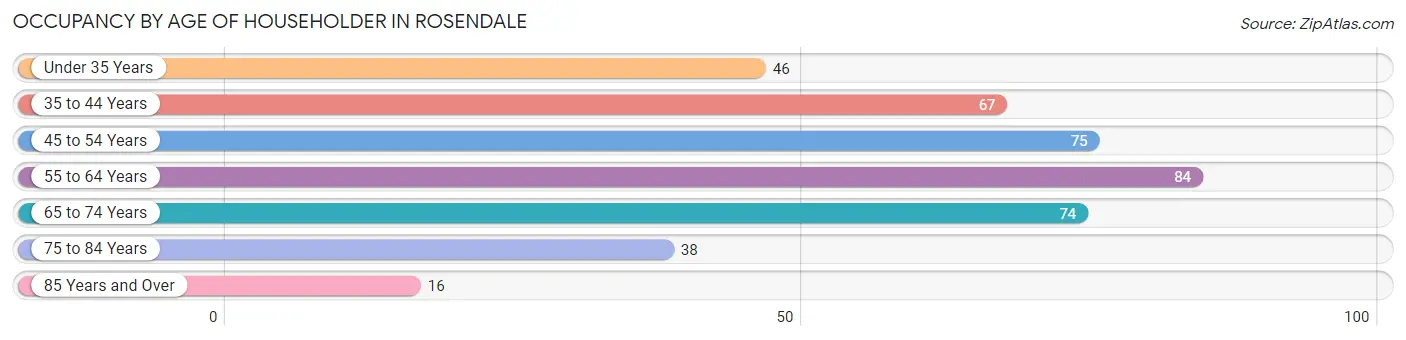
| Age Bracket | # Households | % Households |
| Under 35 Years | 46 | 11.5% |
| 35 to 44 Years | 67 | 16.8% |
| 45 to 54 Years | 75 | 18.8% |
| 55 to 64 Years | 84 | 21.0% |
| 65 to 74 Years | 74 | 18.5% |
| 75 to 84 Years | 38 | 9.5% |
| 85 Years and Over | 16 | 4.0% |
| Total | 400 | 100.0% |
Housing Finances in Rosendale
Median Income by Occupancy in Rosendale
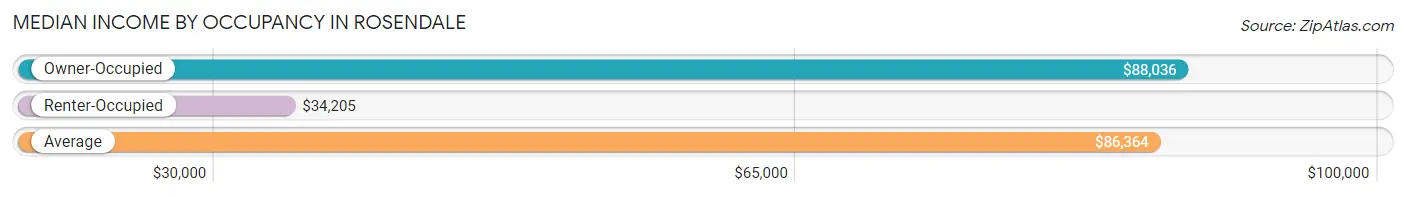
| Occupancy Type | # Households | Median Income |
| Owner-Occupied | 357 (89.2%) | $88,036 |
| Renter-Occupied | 43 (10.7%) | $34,205 |
| Average | 400 (100.0%) | $86,364 |
Occupancy by Householder Income Bracket in Rosendale
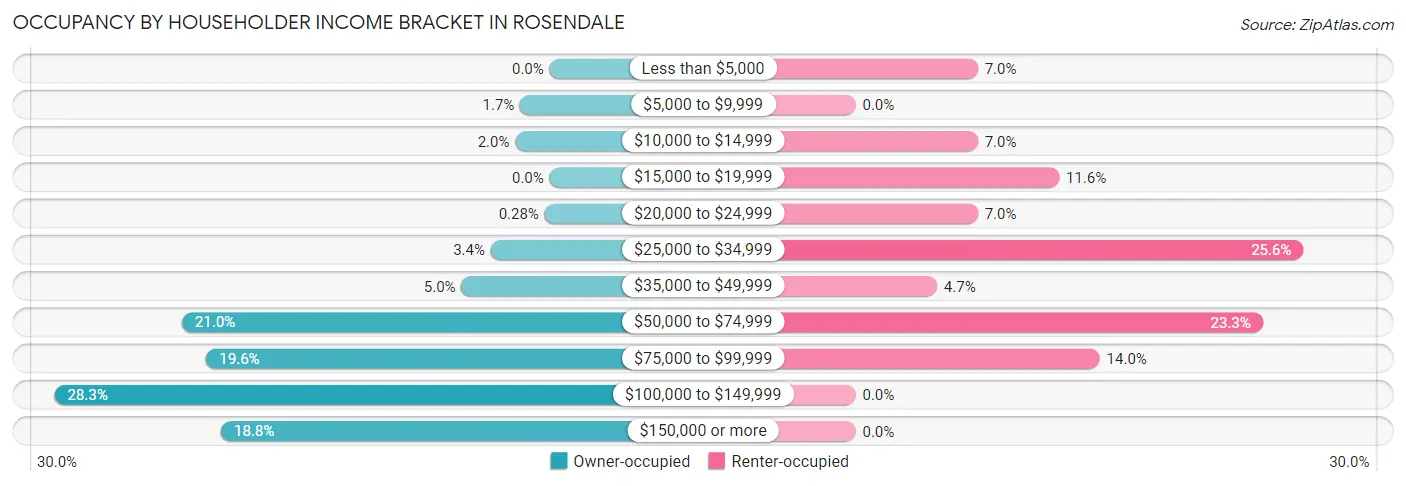
| Income Bracket | Owner-occupied | Renter-occupied |
| Less than $5,000 | 0 (0.0%) | 3 (7.0%) |
| $5,000 to $9,999 | 6 (1.7%) | 0 (0.0%) |
| $10,000 to $14,999 | 7 (2.0%) | 3 (7.0%) |
| $15,000 to $19,999 | 0 (0.0%) | 5 (11.6%) |
| $20,000 to $24,999 | 1 (0.3%) | 3 (7.0%) |
| $25,000 to $34,999 | 12 (3.4%) | 11 (25.6%) |
| $35,000 to $49,999 | 18 (5.0%) | 2 (4.6%) |
| $50,000 to $74,999 | 75 (21.0%) | 10 (23.3%) |
| $75,000 to $99,999 | 70 (19.6%) | 6 (14.0%) |
| $100,000 to $149,999 | 101 (28.3%) | 0 (0.0%) |
| $150,000 or more | 67 (18.8%) | 0 (0.0%) |
| Total | 357 (100.0%) | 43 (100.0%) |
Monthly Housing Cost Tiers in Rosendale
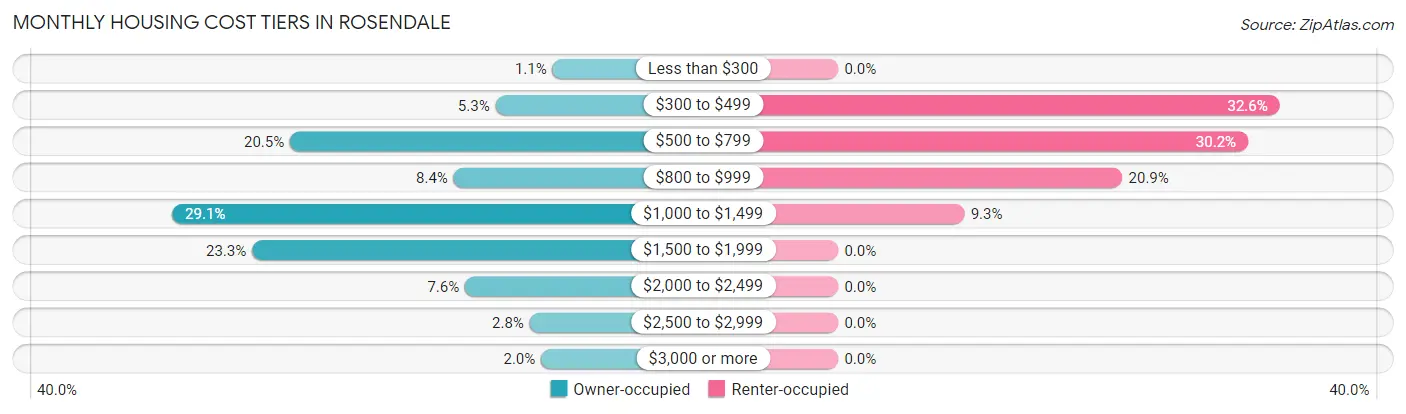
| Monthly Cost | Owner-occupied | Renter-occupied |
| Less than $300 | 4 (1.1%) | 0 (0.0%) |
| $300 to $499 | 19 (5.3%) | 14 (32.6%) |
| $500 to $799 | 73 (20.4%) | 13 (30.2%) |
| $800 to $999 | 30 (8.4%) | 9 (20.9%) |
| $1,000 to $1,499 | 104 (29.1%) | 4 (9.3%) |
| $1,500 to $1,999 | 83 (23.3%) | 0 (0.0%) |
| $2,000 to $2,499 | 27 (7.6%) | 0 (0.0%) |
| $2,500 to $2,999 | 10 (2.8%) | 0 (0.0%) |
| $3,000 or more | 7 (2.0%) | 0 (0.0%) |
| Total | 357 (100.0%) | 43 (100.0%) |
Physical Housing Characteristics in Rosendale
Housing Structures in Rosendale
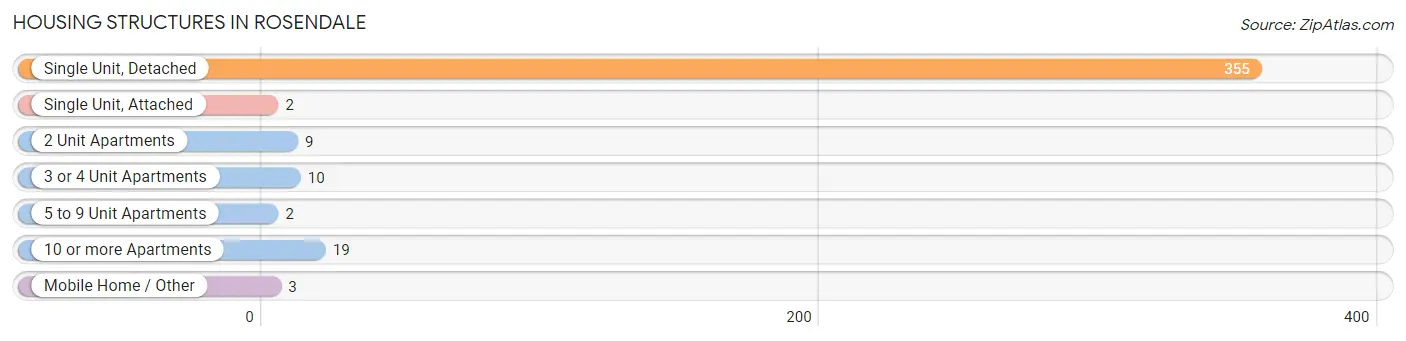
| Structure Type | # Housing Units | % Housing Units |
| Single Unit, Detached | 355 | 88.7% |
| Single Unit, Attached | 2 | 0.5% |
| 2 Unit Apartments | 9 | 2.2% |
| 3 or 4 Unit Apartments | 10 | 2.5% |
| 5 to 9 Unit Apartments | 2 | 0.5% |
| 10 or more Apartments | 19 | 4.8% |
| Mobile Home / Other | 3 | 0.7% |
| Total | 400 | 100.0% |
Housing Structures by Occupancy in Rosendale
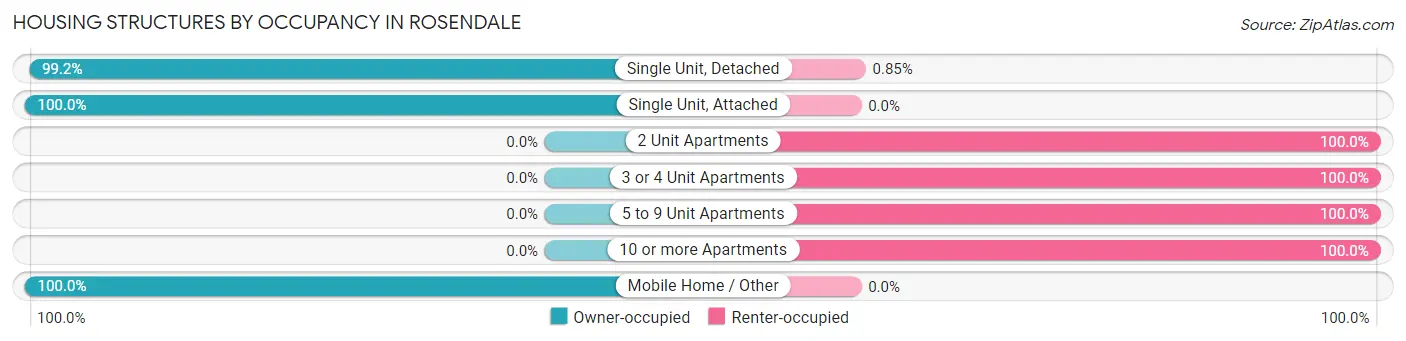
| Structure Type | Owner-occupied | Renter-occupied |
| Single Unit, Detached | 352 (99.2%) | 3 (0.9%) |
| Single Unit, Attached | 2 (100.0%) | 0 (0.0%) |
| 2 Unit Apartments | 0 (0.0%) | 9 (100.0%) |
| 3 or 4 Unit Apartments | 0 (0.0%) | 10 (100.0%) |
| 5 to 9 Unit Apartments | 0 (0.0%) | 2 (100.0%) |
| 10 or more Apartments | 0 (0.0%) | 19 (100.0%) |
| Mobile Home / Other | 3 (100.0%) | 0 (0.0%) |
| Total | 357 (89.2%) | 43 (10.7%) |
Housing Structures by Number of Rooms in Rosendale
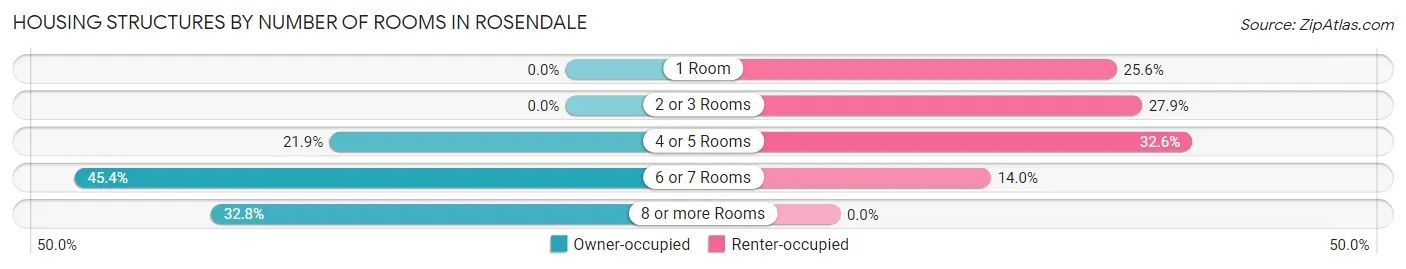
| Number of Rooms | Owner-occupied | Renter-occupied |
| 1 Room | 0 (0.0%) | 11 (25.6%) |
| 2 or 3 Rooms | 0 (0.0%) | 12 (27.9%) |
| 4 or 5 Rooms | 78 (21.8%) | 14 (32.6%) |
| 6 or 7 Rooms | 162 (45.4%) | 6 (14.0%) |
| 8 or more Rooms | 117 (32.8%) | 0 (0.0%) |
| Total | 357 (100.0%) | 43 (100.0%) |
Housing Structure by Heating Type in Rosendale
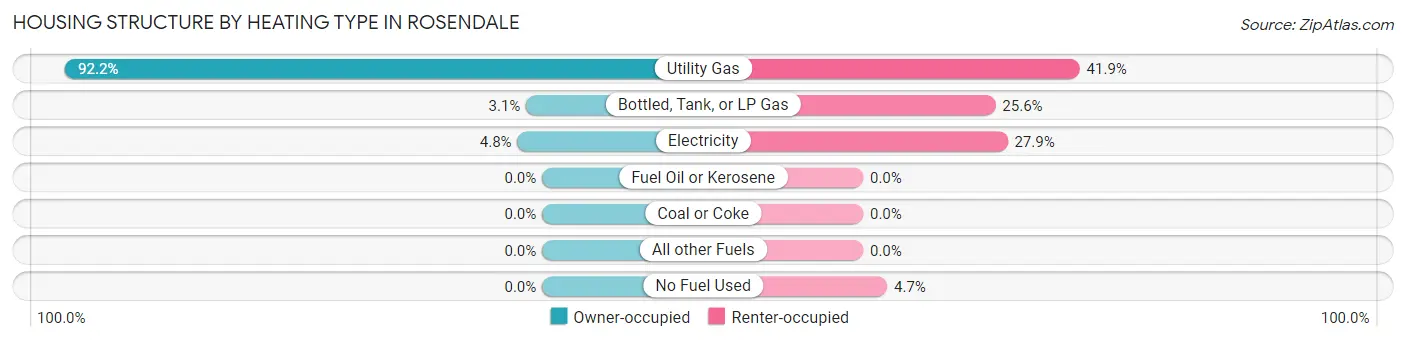
| Heating Type | Owner-occupied | Renter-occupied |
| Utility Gas | 329 (92.2%) | 18 (41.9%) |
| Bottled, Tank, or LP Gas | 11 (3.1%) | 11 (25.6%) |
| Electricity | 17 (4.8%) | 12 (27.9%) |
| Fuel Oil or Kerosene | 0 (0.0%) | 0 (0.0%) |
| Coal or Coke | 0 (0.0%) | 0 (0.0%) |
| All other Fuels | 0 (0.0%) | 0 (0.0%) |
| No Fuel Used | 0 (0.0%) | 2 (4.6%) |
| Total | 357 (100.0%) | 43 (100.0%) |
Household Vehicle Usage in Rosendale
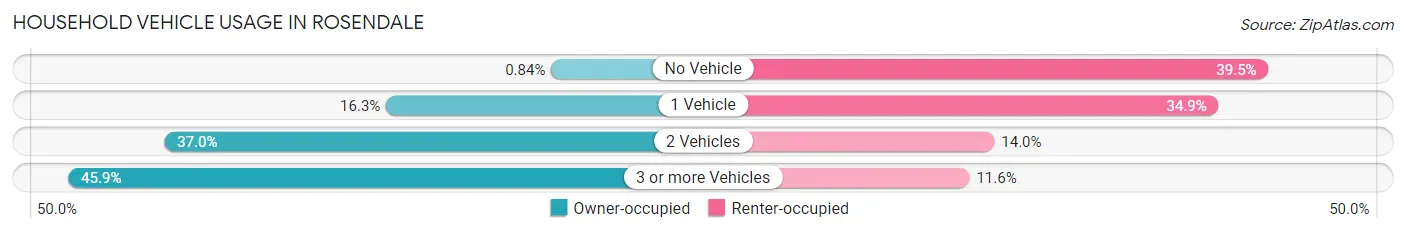
| Vehicles per Household | Owner-occupied | Renter-occupied |
| No Vehicle | 3 (0.8%) | 17 (39.5%) |
| 1 Vehicle | 58 (16.3%) | 15 (34.9%) |
| 2 Vehicles | 132 (37.0%) | 6 (14.0%) |
| 3 or more Vehicles | 164 (45.9%) | 5 (11.6%) |
| Total | 357 (100.0%) | 43 (100.0%) |
Real Estate & Mortgages in Rosendale
Real Estate and Mortgage Overview in Rosendale
| Characteristic | Without Mortgage | With Mortgage |
| Housing Units | 102 | 255 |
| Median Property Value | $200,000 | $238,100 |
| Median Household Income | $83,214 | $49 |
| Monthly Housing Costs | $590 | $7 |
| Real Estate Taxes | $3,000 | $0 |
Property Value by Mortgage Status in Rosendale
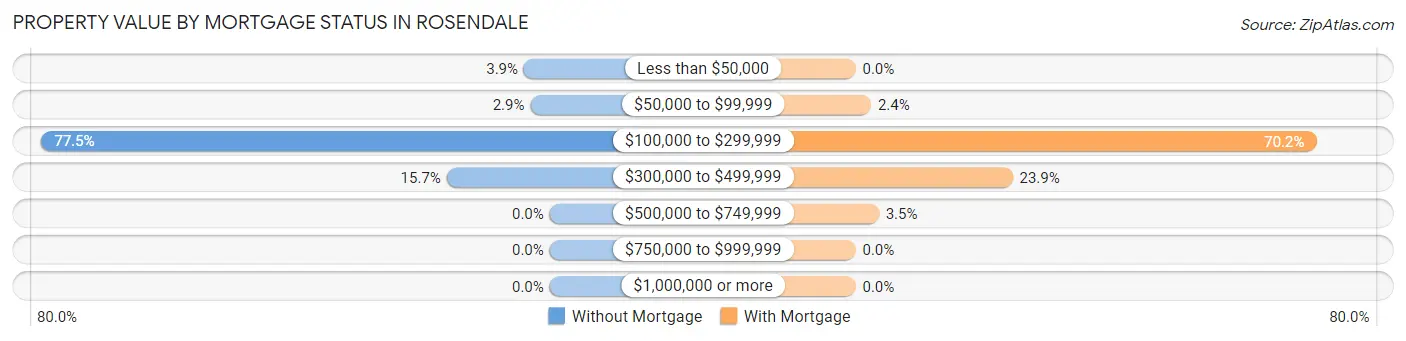
| Property Value | Without Mortgage | With Mortgage |
| Less than $50,000 | 4 (3.9%) | 0 (0.0%) |
| $50,000 to $99,999 | 3 (2.9%) | 6 (2.4%) |
| $100,000 to $299,999 | 79 (77.4%) | 179 (70.2%) |
| $300,000 to $499,999 | 16 (15.7%) | 61 (23.9%) |
| $500,000 to $749,999 | 0 (0.0%) | 9 (3.5%) |
| $750,000 to $999,999 | 0 (0.0%) | 0 (0.0%) |
| $1,000,000 or more | 0 (0.0%) | 0 (0.0%) |
| Total | 102 (100.0%) | 255 (100.0%) |
Household Income by Mortgage Status in Rosendale
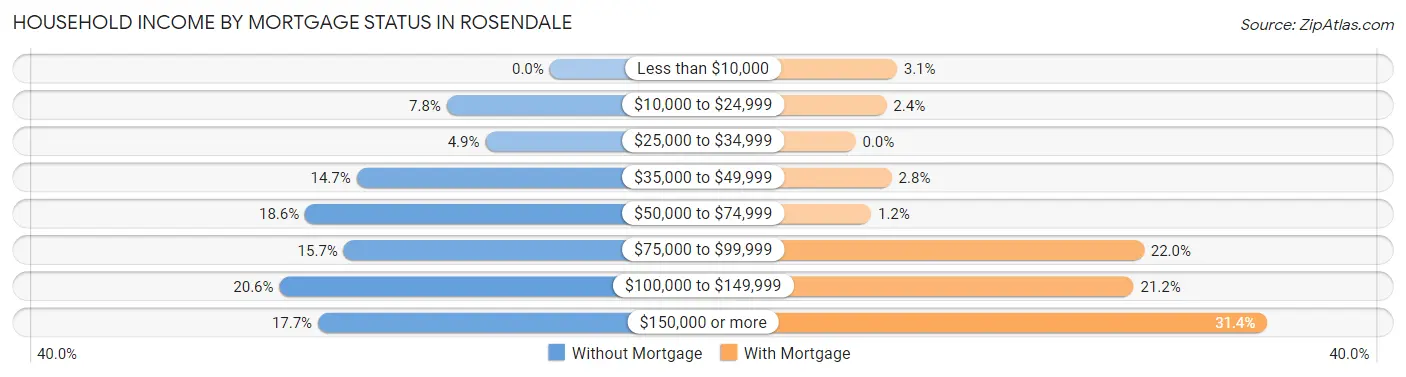
| Household Income | Without Mortgage | With Mortgage |
| Less than $10,000 | 0 (0.0%) | 8 (3.1%) |
| $10,000 to $24,999 | 8 (7.8%) | 6 (2.4%) |
| $25,000 to $34,999 | 5 (4.9%) | 0 (0.0%) |
| $35,000 to $49,999 | 15 (14.7%) | 7 (2.8%) |
| $50,000 to $74,999 | 19 (18.6%) | 3 (1.2%) |
| $75,000 to $99,999 | 16 (15.7%) | 56 (22.0%) |
| $100,000 to $149,999 | 21 (20.6%) | 54 (21.2%) |
| $150,000 or more | 18 (17.6%) | 80 (31.4%) |
| Total | 102 (100.0%) | 255 (100.0%) |
Property Value to Household Income Ratio in Rosendale
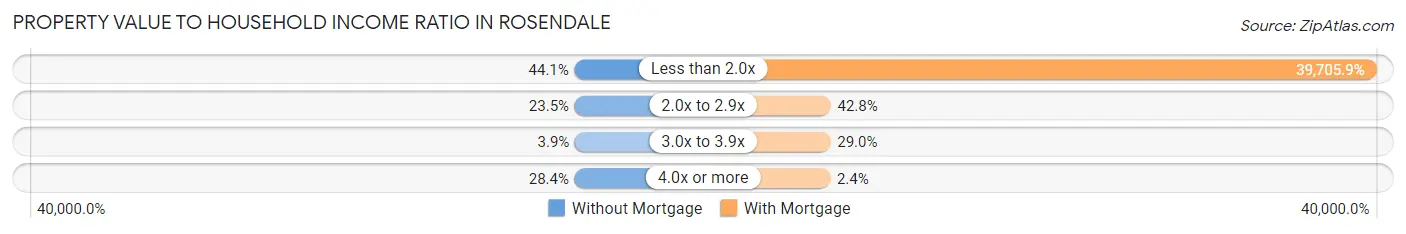
| Value-to-Income Ratio | Without Mortgage | With Mortgage |
| Less than 2.0x | 45 (44.1%) | 101,250 (39,705.9%) |
| 2.0x to 2.9x | 24 (23.5%) | 109 (42.7%) |
| 3.0x to 3.9x | 4 (3.9%) | 74 (29.0%) |
| 4.0x or more | 29 (28.4%) | 6 (2.4%) |
| Total | 102 (100.0%) | 255 (100.0%) |
Real Estate Taxes by Mortgage Status in Rosendale
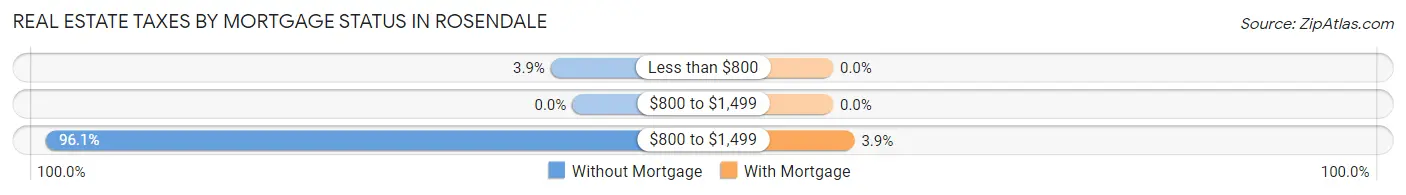
| Property Taxes | Without Mortgage | With Mortgage |
| Less than $800 | 4 (3.9%) | 0 (0.0%) |
| $800 to $1,499 | 0 (0.0%) | 0 (0.0%) |
| $800 to $1,499 | 98 (96.1%) | 10 (3.9%) |
| Total | 102 (100.0%) | 255 (100.0%) |
Health & Disability in Rosendale
Health Insurance Coverage by Age in Rosendale
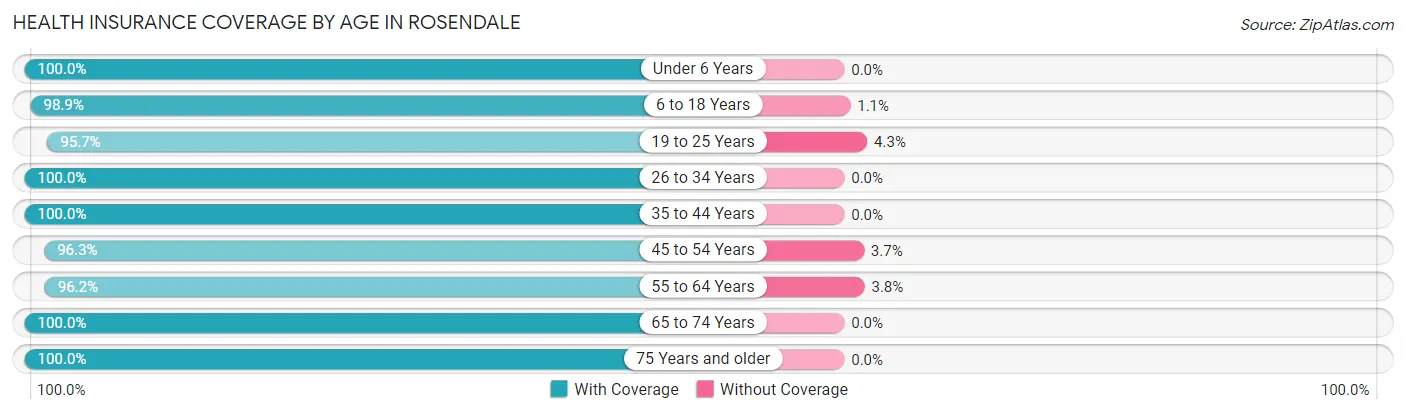
| Age Bracket | With Coverage | Without Coverage |
| Under 6 Years | 42 (100.0%) | 0 (0.0%) |
| 6 to 18 Years | 176 (98.9%) | 2 (1.1%) |
| 19 to 25 Years | 90 (95.7%) | 4 (4.3%) |
| 26 to 34 Years | 91 (100.0%) | 0 (0.0%) |
| 35 to 44 Years | 105 (100.0%) | 0 (0.0%) |
| 45 to 54 Years | 158 (96.3%) | 6 (3.7%) |
| 55 to 64 Years | 153 (96.2%) | 6 (3.8%) |
| 65 to 74 Years | 100 (100.0%) | 0 (0.0%) |
| 75 Years and older | 73 (100.0%) | 0 (0.0%) |
| Total | 988 (98.2%) | 18 (1.8%) |
Health Insurance Coverage by Citizenship Status in Rosendale
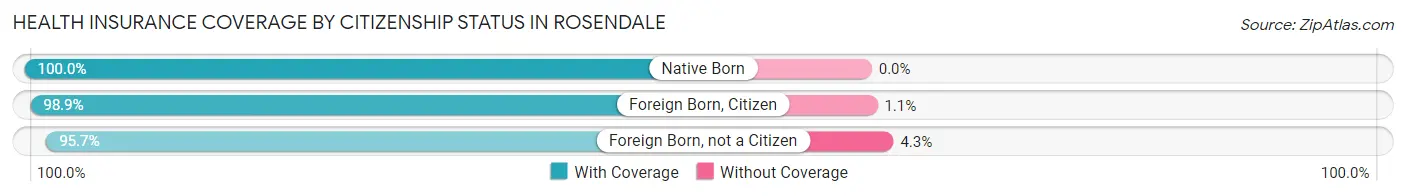
| Citizenship Status | With Coverage | Without Coverage |
| Native Born | 42 (100.0%) | 0 (0.0%) |
| Foreign Born, Citizen | 176 (98.9%) | 2 (1.1%) |
| Foreign Born, not a Citizen | 90 (95.7%) | 4 (4.3%) |
Health Insurance Coverage by Household Income in Rosendale
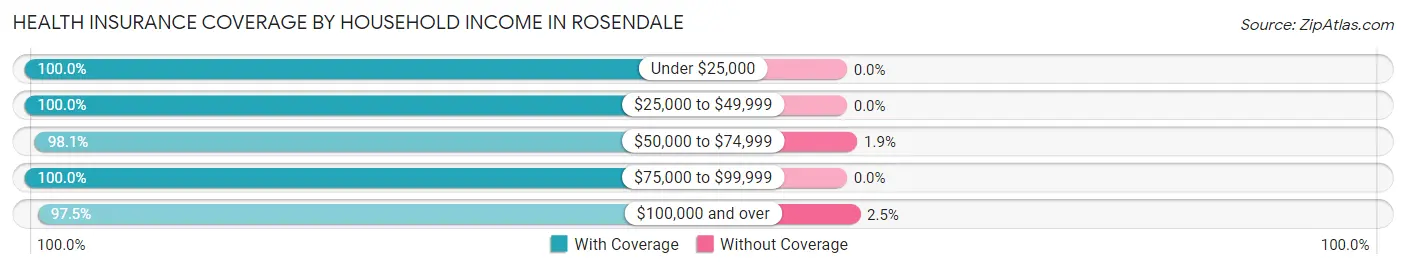
| Household Income | With Coverage | Without Coverage |
| Under $25,000 | 43 (100.0%) | 0 (0.0%) |
| $25,000 to $49,999 | 63 (100.0%) | 0 (0.0%) |
| $50,000 to $74,999 | 152 (98.1%) | 3 (1.9%) |
| $75,000 to $99,999 | 142 (100.0%) | 0 (0.0%) |
| $100,000 and over | 588 (97.5%) | 15 (2.5%) |
Public vs Private Health Insurance Coverage by Age in Rosendale
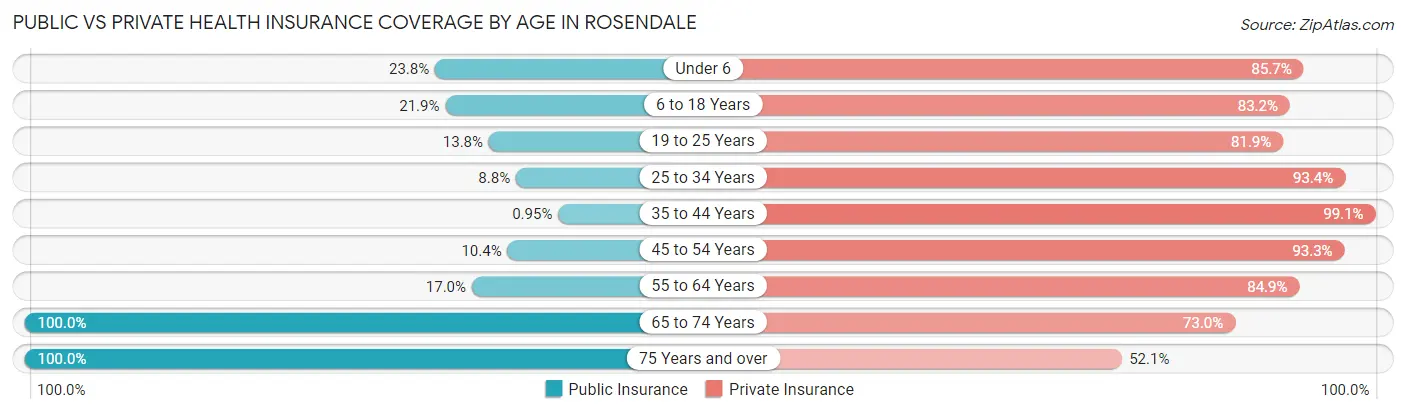
| Age Bracket | Public Insurance | Private Insurance |
| Under 6 | 10 (23.8%) | 36 (85.7%) |
| 6 to 18 Years | 39 (21.9%) | 148 (83.2%) |
| 19 to 25 Years | 13 (13.8%) | 77 (81.9%) |
| 25 to 34 Years | 8 (8.8%) | 85 (93.4%) |
| 35 to 44 Years | 1 (0.9%) | 104 (99.1%) |
| 45 to 54 Years | 17 (10.4%) | 153 (93.3%) |
| 55 to 64 Years | 27 (17.0%) | 135 (84.9%) |
| 65 to 74 Years | 100 (100.0%) | 73 (73.0%) |
| 75 Years and over | 73 (100.0%) | 38 (52.0%) |
| Total | 288 (28.6%) | 849 (84.4%) |
Disability Status by Sex by Age in Rosendale
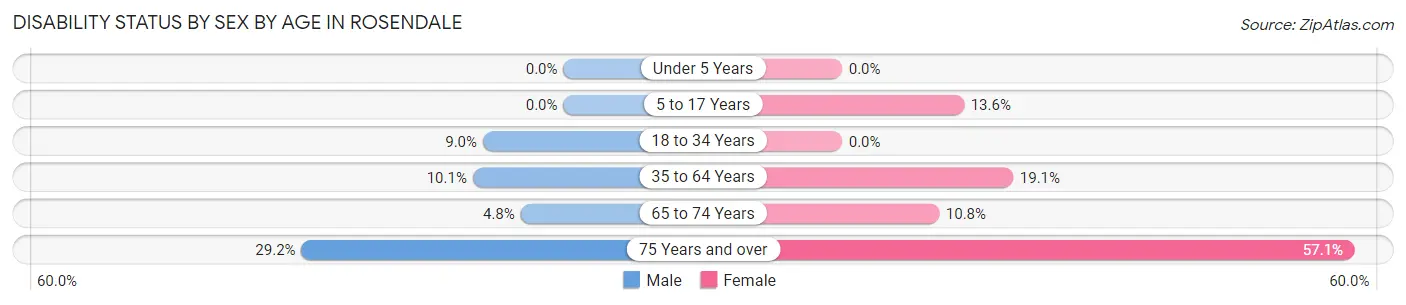
| Age Bracket | Male | Female |
| Under 5 Years | 0 (0.0%) | 0 (0.0%) |
| 5 to 17 Years | 0 (0.0%) | 11 (13.6%) |
| 18 to 34 Years | 12 (9.0%) | 0 (0.0%) |
| 35 to 64 Years | 22 (10.1%) | 40 (19.1%) |
| 65 to 74 Years | 3 (4.8%) | 4 (10.8%) |
| 75 Years and over | 7 (29.2%) | 28 (57.1%) |
Disability Class by Sex by Age in Rosendale
Disability Class: Hearing Difficulty
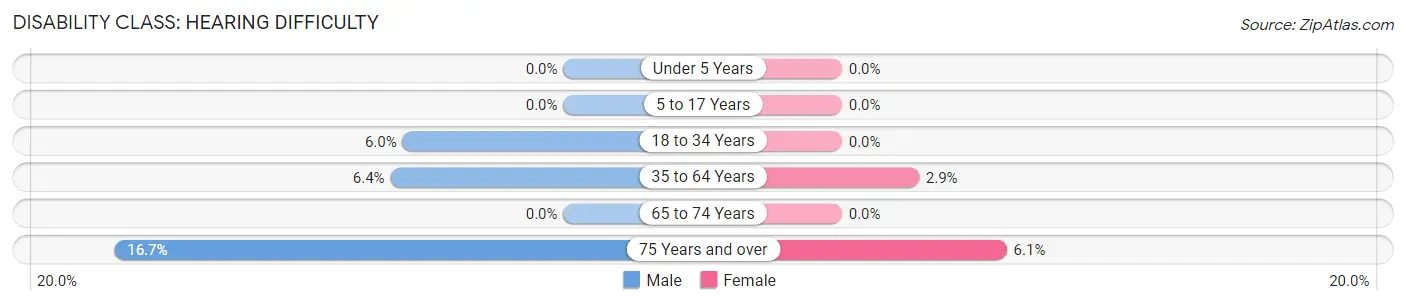
| Age Bracket | Male | Female |
| Under 5 Years | 0 (0.0%) | 0 (0.0%) |
| 5 to 17 Years | 0 (0.0%) | 0 (0.0%) |
| 18 to 34 Years | 8 (6.0%) | 0 (0.0%) |
| 35 to 64 Years | 14 (6.4%) | 6 (2.9%) |
| 65 to 74 Years | 0 (0.0%) | 0 (0.0%) |
| 75 Years and over | 4 (16.7%) | 3 (6.1%) |
Disability Class: Vision Difficulty
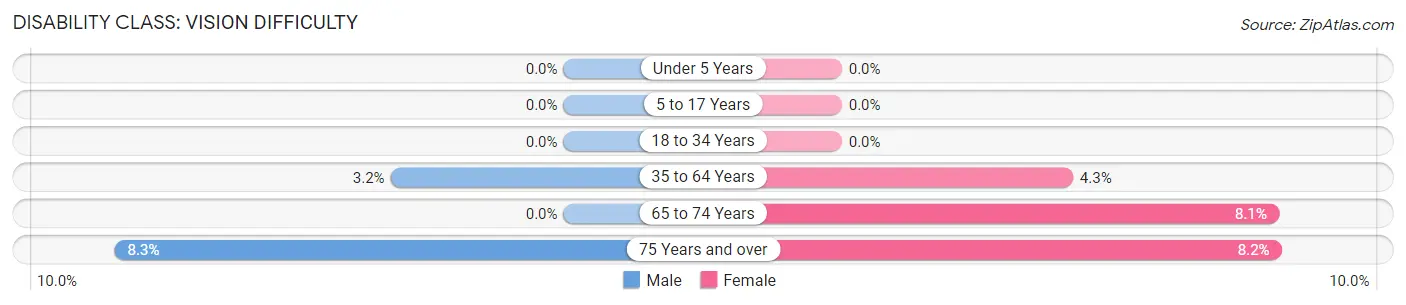
| Age Bracket | Male | Female |
| Under 5 Years | 0 (0.0%) | 0 (0.0%) |
| 5 to 17 Years | 0 (0.0%) | 0 (0.0%) |
| 18 to 34 Years | 0 (0.0%) | 0 (0.0%) |
| 35 to 64 Years | 7 (3.2%) | 9 (4.3%) |
| 65 to 74 Years | 0 (0.0%) | 3 (8.1%) |
| 75 Years and over | 2 (8.3%) | 4 (8.2%) |
Disability Class: Cognitive Difficulty
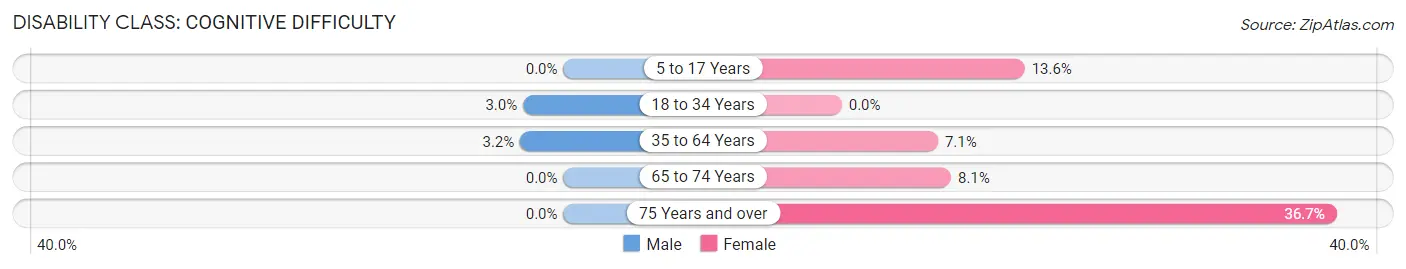
| Age Bracket | Male | Female |
| 5 to 17 Years | 0 (0.0%) | 11 (13.6%) |
| 18 to 34 Years | 4 (3.0%) | 0 (0.0%) |
| 35 to 64 Years | 7 (3.2%) | 15 (7.1%) |
| 65 to 74 Years | 0 (0.0%) | 3 (8.1%) |
| 75 Years and over | 0 (0.0%) | 18 (36.7%) |
Disability Class: Ambulatory Difficulty
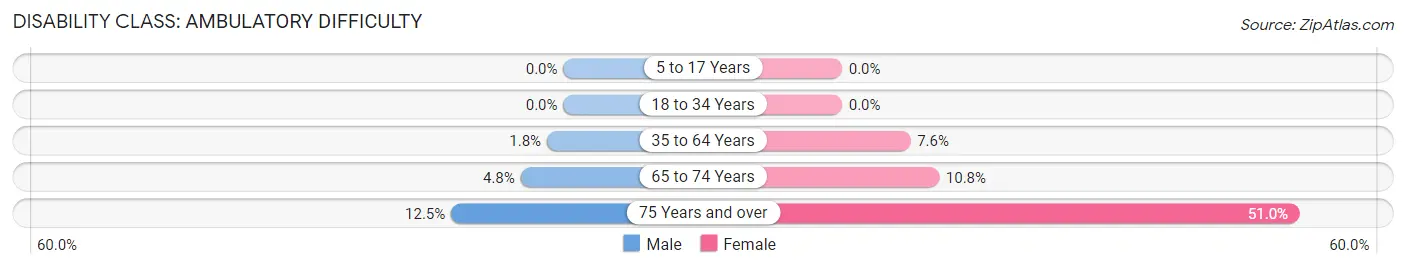
| Age Bracket | Male | Female |
| 5 to 17 Years | 0 (0.0%) | 0 (0.0%) |
| 18 to 34 Years | 0 (0.0%) | 0 (0.0%) |
| 35 to 64 Years | 4 (1.8%) | 16 (7.6%) |
| 65 to 74 Years | 3 (4.8%) | 4 (10.8%) |
| 75 Years and over | 3 (12.5%) | 25 (51.0%) |
Disability Class: Self-Care Difficulty
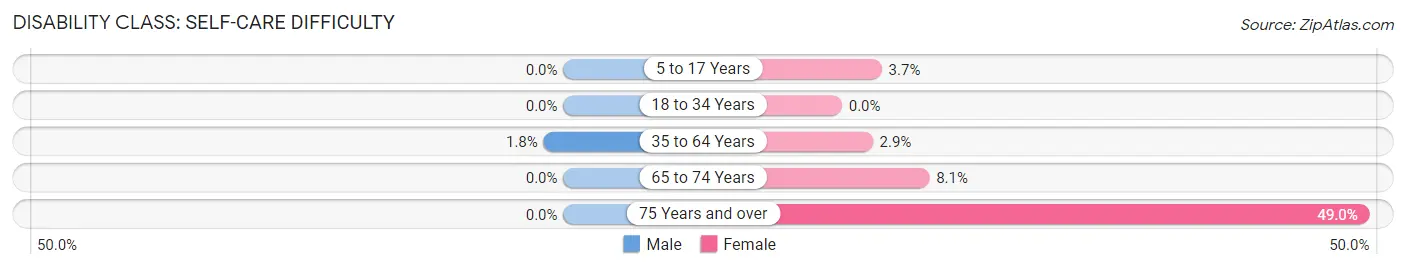
| Age Bracket | Male | Female |
| 5 to 17 Years | 0 (0.0%) | 3 (3.7%) |
| 18 to 34 Years | 0 (0.0%) | 0 (0.0%) |
| 35 to 64 Years | 4 (1.8%) | 6 (2.9%) |
| 65 to 74 Years | 0 (0.0%) | 3 (8.1%) |
| 75 Years and over | 0 (0.0%) | 24 (49.0%) |
Technology Access in Rosendale
Computing Device Access in Rosendale
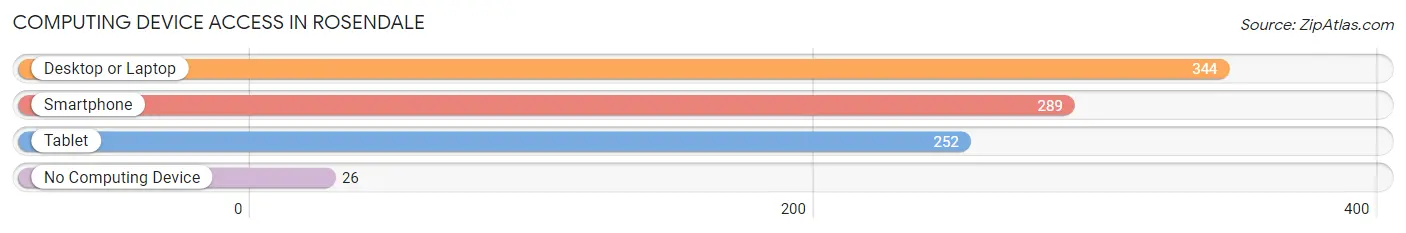
| Device Type | # Households | % Households |
| Desktop or Laptop | 344 | 86.0% |
| Smartphone | 289 | 72.3% |
| Tablet | 252 | 63.0% |
| No Computing Device | 26 | 6.5% |
| Total | 400 | 100.0% |
Internet Access in Rosendale
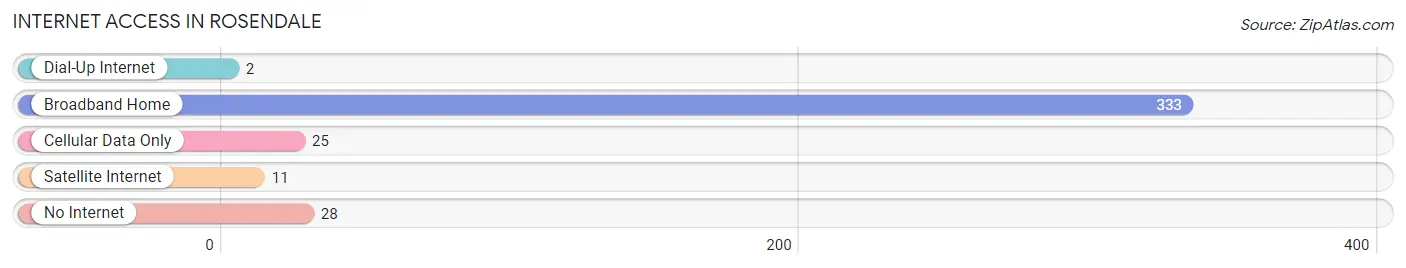
| Internet Type | # Households | % Households |
| Dial-Up Internet | 2 | 0.5% |
| Broadband Home | 333 | 83.3% |
| Cellular Data Only | 25 | 6.2% |
| Satellite Internet | 11 | 2.8% |
| No Internet | 28 | 7.0% |
| Total | 400 | 100.0% |
Rosendale Summary
Rosendale, Wisconsin is a small village located in Fond du Lac County, Wisconsin. It is situated on the banks of the Fond du Lac River, about 25 miles northwest of the city of Fond du Lac. The village has a population of approximately 1,000 people and covers an area of 0.7 square miles.
History
The area that is now Rosendale was first settled in the early 1840s by German immigrants. The village was originally known as “Rosenhain”, which means “Rose Valley” in German. The village was officially incorporated in 1876 and was named after the nearby Rosendale Springs.
The village was a popular destination for tourists in the late 19th and early 20th centuries. The Rosendale Hotel, which was built in 1891, was a popular destination for visitors. The hotel was destroyed by fire in the 1920s and was never rebuilt.
Geography
Rosendale is located in the Central Sands region of Wisconsin. The village is situated on the banks of the Fond du Lac River, which flows through the village. The terrain is mostly flat, with some rolling hills in the surrounding area. The village is surrounded by farmland and woodlands.
The climate in Rosendale is typical of the Central Sands region, with cold winters and warm summers. The average annual temperature is around 45 degrees Fahrenheit. The average annual precipitation is around 30 inches.
Economy
The economy of Rosendale is largely based on agriculture. The village is home to several dairy farms, as well as some vegetable and fruit farms. The village also has a few small businesses, including a grocery store, a hardware store, and a few restaurants.
Demographics
As of the 2010 census, the population of Rosendale was 1,000 people. The racial makeup of the village was 97.2% White, 0.7% African American, 0.3% Native American, 0.3% Asian, 0.1% Pacific Islander, and 1.5% from other races. The median household income was $45,000, and the median family income was $50,000.
Conclusion
Rosendale, Wisconsin is a small village located in Fond du Lac County, Wisconsin. It is situated on the banks of the Fond du Lac River, about 25 miles northwest of the city of Fond du Lac. The village has a population of approximately 1,000 people and covers an area of 0.7 square miles. The economy of Rosendale is largely based on agriculture, and the village is home to several dairy farms, as well as some vegetable and fruit farms. The racial makeup of the village is mostly White, with a small percentage of African American, Native American, Asian, and Pacific Islander residents. The median household income is $45,000, and the median family income is $50,000.
Common Questions
What is Per Capita Income in Rosendale?
Per Capita income in Rosendale is $40,283.
What is the Median Family Income in Rosendale?
Median Family Income in Rosendale is $93,125.
What is the Median Household income in Rosendale?
Median Household Income in Rosendale is $86,364.
What is Income or Wage Gap in Rosendale?
Income or Wage Gap in Rosendale is 24.2%.
Women in Rosendale earn 75.8 cents for every dollar earned by a man.
What is Inequality or Gini Index in Rosendale?
Inequality or Gini Index in Rosendale is 0.32.
What is the Total Population of Rosendale?
Total Population of Rosendale is 1,006.
What is the Total Male Population of Rosendale?
Total Male Population of Rosendale is 529.
What is the Total Female Population of Rosendale?
Total Female Population of Rosendale is 477.
What is the Ratio of Males per 100 Females in Rosendale?
There are 110.90 Males per 100 Females in Rosendale.
What is the Ratio of Females per 100 Males in Rosendale?
There are 90.17 Females per 100 Males in Rosendale.
What is the Median Population Age in Rosendale?
Median Population Age in Rosendale is 43.6 Years.
What is the Average Family Size in Rosendale
Average Family Size in Rosendale is 2.8 People.
What is the Average Household Size in Rosendale
Average Household Size in Rosendale is 2.5 People.
How Large is the Labor Force in Rosendale?
There are 577 People in the Labor Forcein in Rosendale.
What is the Percentage of People in the Labor Force in Rosendale?
69.0% of People are in the Labor Force in Rosendale.
What is the Unemployment Rate in Rosendale?
Unemployment Rate in Rosendale is 3.6%.