Ripon, WI Map & Demographics
Ripon Map
Ripon Overview
$32,587
PER CAPITA INCOME
$85,859
AVG FAMILY INCOME
$56,563
AVG HOUSEHOLD INCOME
50.5%
WAGE / INCOME GAP [ % ]
49.5¢/ $1
WAGE / INCOME GAP [ $ ]
$15,372
FAMILY INCOME DEFICIT
0.44
INEQUALITY / GINI INDEX
7,823
TOTAL POPULATION
3,621
MALE POPULATION
4,202
FEMALE POPULATION
86.17
MALES / 100 FEMALES
116.05
FEMALES / 100 MALES
41.2
MEDIAN AGE
3.0
AVG FAMILY SIZE
2.2
AVG HOUSEHOLD SIZE
3,930
LABOR FORCE [ PEOPLE ]
60.7%
PERCENT IN LABOR FORCE
2.5%
UNEMPLOYMENT RATE
Ripon Zip Codes
Ripon Area Codes
Income in Ripon
Income Overview in Ripon
Per Capita Income in Ripon is $32,587, while median incomes of families and households are $85,859 and $56,563 respectively.
| Characteristic | Number | Measure |
| Per Capita Income | 7,823 | $32,587 |
| Median Family Income | 1,573 | $85,859 |
| Mean Family Income | 1,573 | $101,196 |
| Median Household Income | 3,221 | $56,563 |
| Mean Household Income | 3,221 | $75,553 |
| Income Deficit | 1,573 | $15,372 |
| Wage / Income Gap (%) | 7,823 | 50.49% |
| Wage / Income Gap ($) | 7,823 | 49.51¢ per $1 |
| Gini / Inequality Index | 7,823 | 0.44 |
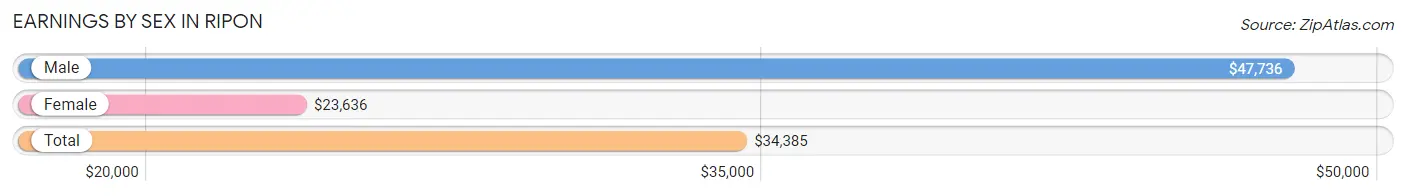
Earnings by Sex in Ripon
Average Earnings in Ripon are $34,385, $47,736 for men and $23,636 for women, a difference of 50.5%.
| Sex | Number | Average Earnings |
| Male | 2,185 (50.4%) | $47,736 |
| Female | 2,152 (49.6%) | $23,636 |
| Total | 4,337 (100.0%) | $34,385 |
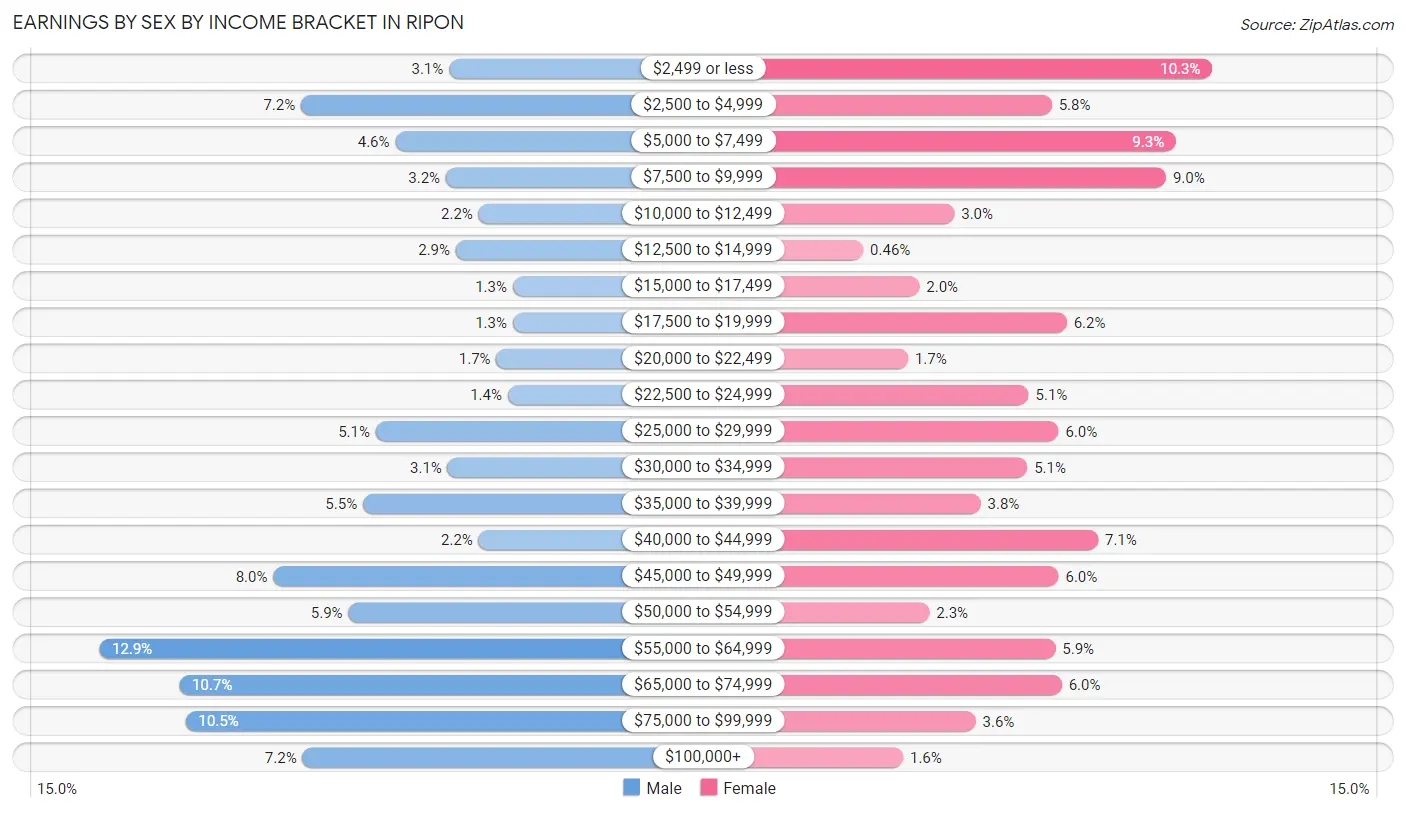
Earnings by Sex by Income Bracket in Ripon
The most common earnings brackets in Ripon are $55,000 to $64,999 for men (282 | 12.9%) and $2,499 or less for women (221 | 10.3%).
| Income | Male | Female |
| $2,499 or less | 67 (3.1%) | 221 (10.3%) |
| $2,500 to $4,999 | 158 (7.2%) | 124 (5.8%) |
| $5,000 to $7,499 | 100 (4.6%) | 199 (9.2%) |
| $7,500 to $9,999 | 69 (3.2%) | 193 (9.0%) |
| $10,000 to $12,499 | 49 (2.2%) | 65 (3.0%) |
| $12,500 to $14,999 | 63 (2.9%) | 10 (0.5%) |
| $15,000 to $17,499 | 28 (1.3%) | 44 (2.0%) |
| $17,500 to $19,999 | 28 (1.3%) | 133 (6.2%) |
| $20,000 to $22,499 | 38 (1.7%) | 37 (1.7%) |
| $22,500 to $24,999 | 31 (1.4%) | 110 (5.1%) |
| $25,000 to $29,999 | 112 (5.1%) | 128 (5.9%) |
| $30,000 to $34,999 | 68 (3.1%) | 109 (5.1%) |
| $35,000 to $39,999 | 120 (5.5%) | 81 (3.8%) |
| $40,000 to $44,999 | 49 (2.2%) | 152 (7.1%) |
| $45,000 to $49,999 | 175 (8.0%) | 128 (5.9%) |
| $50,000 to $54,999 | 129 (5.9%) | 50 (2.3%) |
| $55,000 to $64,999 | 282 (12.9%) | 126 (5.9%) |
| $65,000 to $74,999 | 233 (10.7%) | 130 (6.0%) |
| $75,000 to $99,999 | 229 (10.5%) | 78 (3.6%) |
| $100,000+ | 157 (7.2%) | 34 (1.6%) |
| Total | 2,185 (100.0%) | 2,152 (100.0%) |
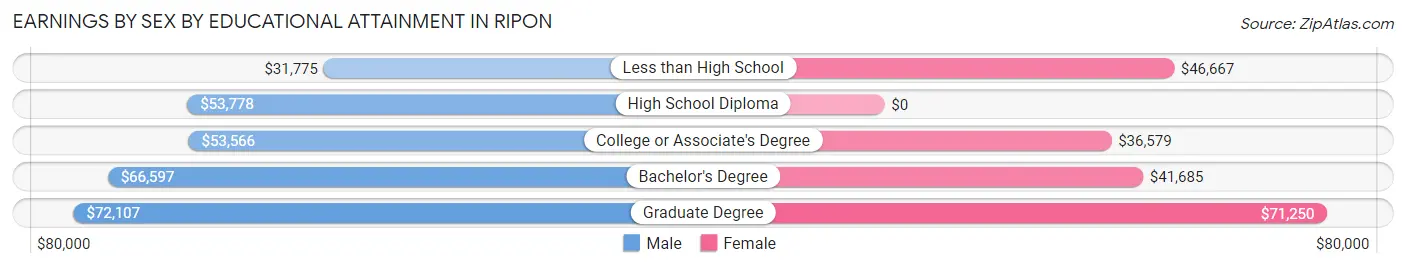
Earnings by Sex by Educational Attainment in Ripon
Average earnings in Ripon are $55,551 for men and $32,011 for women, a difference of 42.4%. Men with an educational attainment of graduate degree enjoy the highest average annual earnings of $72,107, while those with less than high school education earn the least with $31,775. Women with an educational attainment of graduate degree earn the most with the average annual earnings of $71,250, while those with college or associate's degree education have the smallest earnings of $36,579.
| Educational Attainment | Male Income | Female Income |
| Less than High School | $31,775 | $46,667 |
| High School Diploma | $53,778 | $0 |
| College or Associate's Degree | $53,566 | $36,579 |
| Bachelor's Degree | $66,597 | $41,685 |
| Graduate Degree | $72,107 | $71,250 |
| Total | $55,551 | $32,011 |
Family Income in Ripon
Family Income Brackets in Ripon
According to the Ripon family income data, there are 308 families falling into the $100,000 to $149,999 income range, which is the most common income bracket and makes up 19.6% of all families. Conversely, the $10,000 to $14,999 income bracket is the least frequent group with only 16 families (1.0%) belonging to this category.
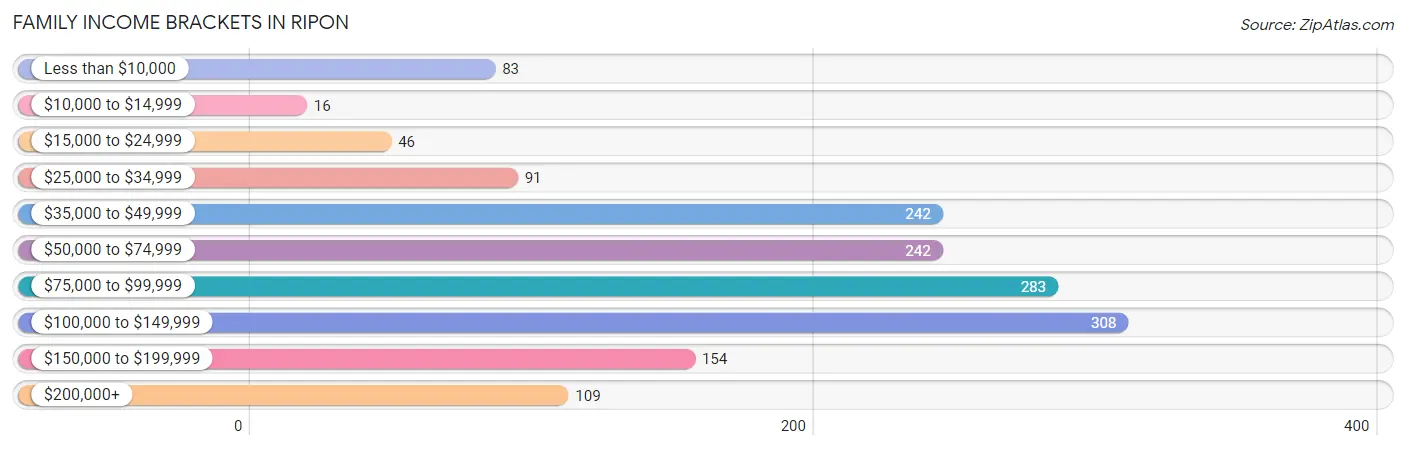
| Income Bracket | # Families | % Families |
| Less than $10,000 | 83 | 5.3% |
| $10,000 to $14,999 | 16 | 1.0% |
| $15,000 to $24,999 | 46 | 2.9% |
| $25,000 to $34,999 | 91 | 5.8% |
| $35,000 to $49,999 | 242 | 15.4% |
| $50,000 to $74,999 | 242 | 15.4% |
| $75,000 to $99,999 | 283 | 18.0% |
| $100,000 to $149,999 | 308 | 19.6% |
| $150,000 to $199,999 | 154 | 9.8% |
| $200,000+ | 109 | 6.9% |
Family Income by Famaliy Size in Ripon
3-person families (310 | 19.7%) account for the highest median family income in Ripon with $92,813 per family, while 2-person families (813 | 51.7%) have the highest median income of $32,482 per family member.
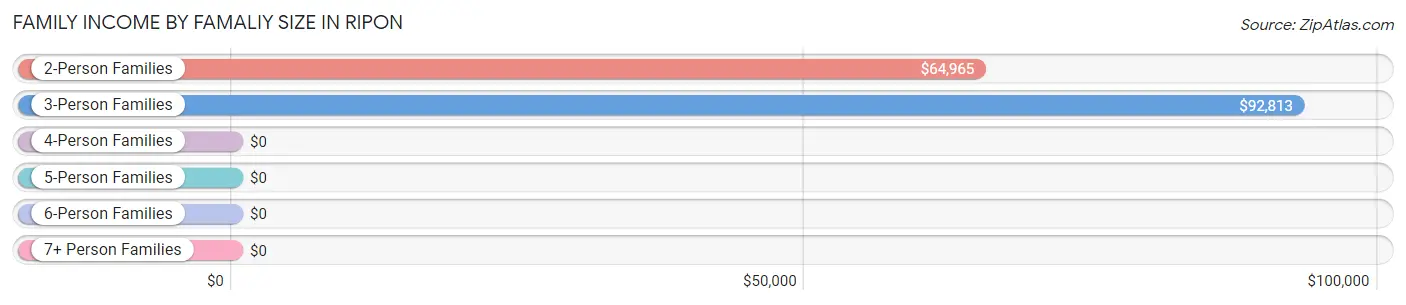
| Income Bracket | # Families | Median Income |
| 2-Person Families | 813 (51.7%) | $64,965 |
| 3-Person Families | 310 (19.7%) | $92,813 |
| 4-Person Families | 228 (14.5%) | $0 |
| 5-Person Families | 177 (11.3%) | $0 |
| 6-Person Families | 45 (2.9%) | $0 |
| 7+ Person Families | 0 (0.0%) | $0 |
| Total | 1,573 (100.0%) | $85,859 |
Family Income by Number of Earners in Ripon
The median family income in Ripon is $85,859, with families comprising 3+ earners (97) having the highest median family income of $104,826, while families with no earners (275) have the lowest median family income of $41,766, accounting for 6.2% and 17.5% of families, respectively.
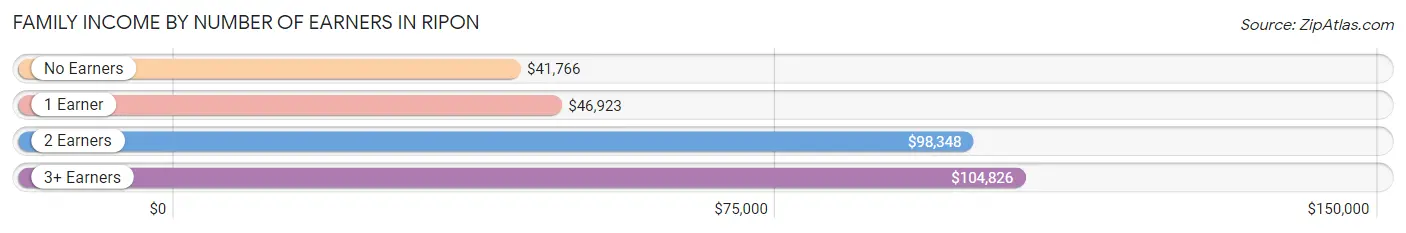
| Number of Earners | # Families | Median Income |
| No Earners | 275 (17.5%) | $41,766 |
| 1 Earner | 436 (27.7%) | $46,923 |
| 2 Earners | 765 (48.6%) | $98,348 |
| 3+ Earners | 97 (6.2%) | $104,826 |
| Total | 1,573 (100.0%) | $85,859 |
Household Income in Ripon
Household Income Brackets in Ripon
With 680 households falling in the category, the $50,000 to $74,999 income range is the most frequent in Ripon, accounting for 21.1% of all households. In contrast, only 110 households (3.4%) fall into the $200,000+ income bracket, making it the least populous group.
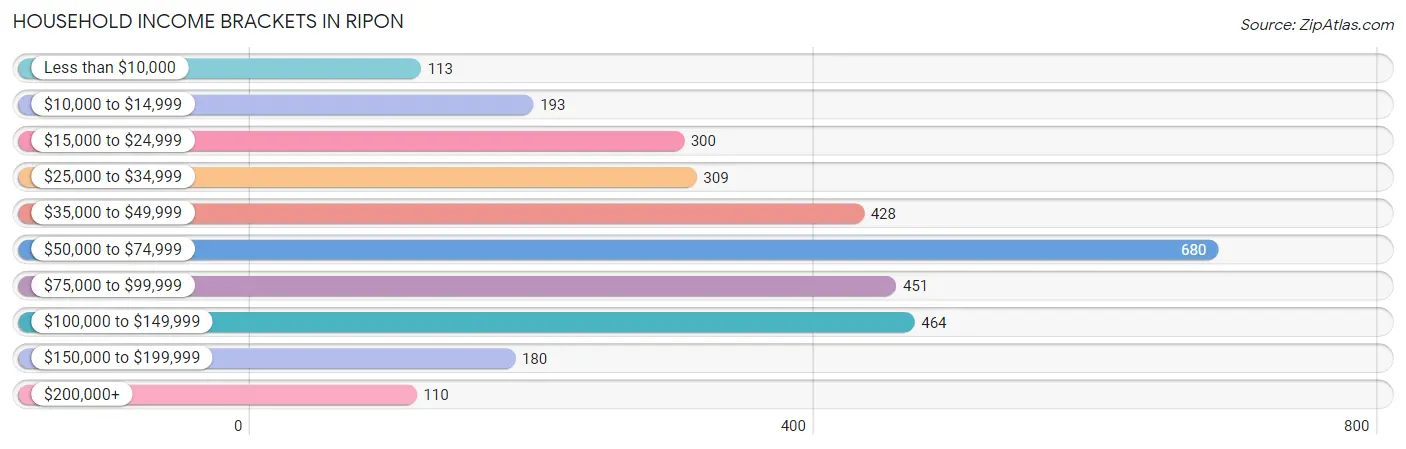
| Income Bracket | # Households | % Households |
| Less than $10,000 | 113 | 3.5% |
| $10,000 to $14,999 | 193 | 6.0% |
| $15,000 to $24,999 | 300 | 9.3% |
| $25,000 to $34,999 | 309 | 9.6% |
| $35,000 to $49,999 | 428 | 13.3% |
| $50,000 to $74,999 | 680 | 21.1% |
| $75,000 to $99,999 | 451 | 14.0% |
| $100,000 to $149,999 | 464 | 14.4% |
| $150,000 to $199,999 | 180 | 5.6% |
| $200,000+ | 110 | 3.4% |
Household Income by Householder Age in Ripon
The median household income in Ripon is $56,563, with the highest median household income of $137,566 found in the 15 to 24 years age bracket for the primary householder. A total of 111 households (3.5%) fall into this category. Meanwhile, the 65+ years age bracket for the primary householder has the lowest median household income of $40,103, with 1,211 households (37.6%) in this group.
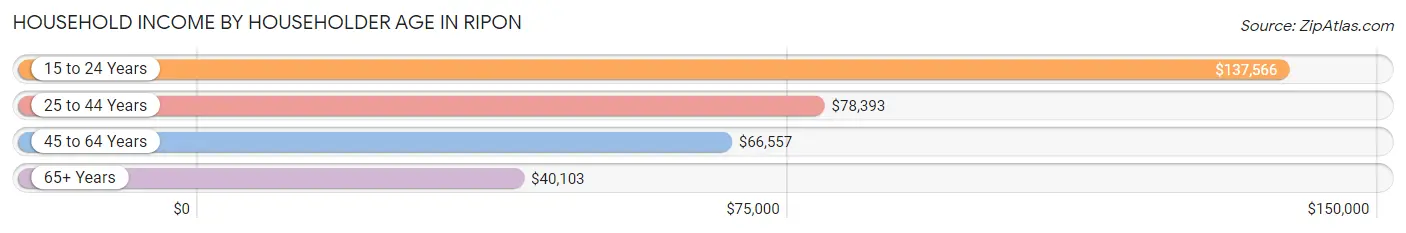
| Income Bracket | # Households | Median Income |
| 15 to 24 Years | 111 (3.5%) | $137,566 |
| 25 to 44 Years | 834 (25.9%) | $78,393 |
| 45 to 64 Years | 1,065 (33.1%) | $66,557 |
| 65+ Years | 1,211 (37.6%) | $40,103 |
| Total | 3,221 (100.0%) | $56,563 |
Poverty in Ripon
Income Below Poverty by Sex and Age in Ripon
With 10.1% poverty level for males and 13.8% for females among the residents of Ripon, 12 to 14 year old males and 12 to 14 year old females are the most vulnerable to poverty, with 59 males (50.0%) and 68 females (36.8%) in their respective age groups living below the poverty level.
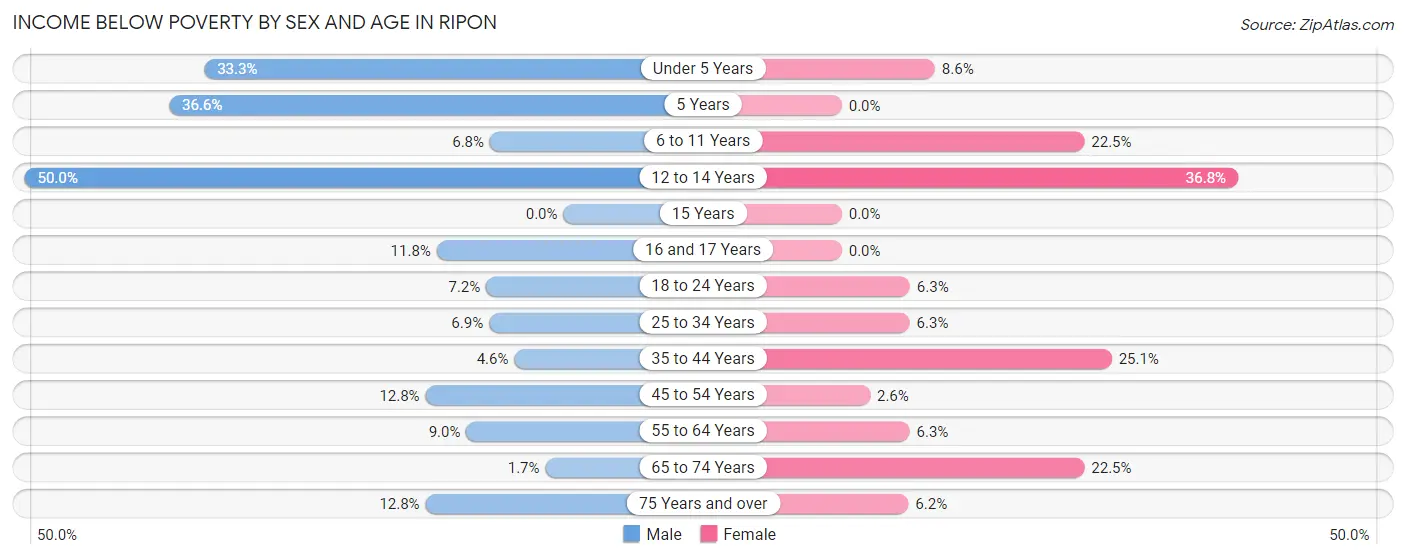
| Age Bracket | Male | Female |
| Under 5 Years | 49 (33.3%) | 14 (8.6%) |
| 5 Years | 15 (36.6%) | 0 (0.0%) |
| 6 to 11 Years | 21 (6.8%) | 61 (22.5%) |
| 12 to 14 Years | 59 (50.0%) | 68 (36.8%) |
| 15 Years | 0 (0.0%) | 0 (0.0%) |
| 16 and 17 Years | 8 (11.8%) | 0 (0.0%) |
| 18 to 24 Years | 17 (7.2%) | 6 (6.3%) |
| 25 to 34 Years | 34 (6.9%) | 16 (6.3%) |
| 35 to 44 Years | 23 (4.5%) | 129 (25.1%) |
| 45 to 54 Years | 43 (12.8%) | 9 (2.6%) |
| 55 to 64 Years | 42 (9.0%) | 41 (6.3%) |
| 65 to 74 Years | 7 (1.7%) | 140 (22.5%) |
| 75 Years and over | 21 (12.8%) | 28 (6.2%) |
| Total | 339 (10.1%) | 512 (13.8%) |
Income Above Poverty by Sex and Age in Ripon
According to the poverty statistics in Ripon, males aged 15 years and females aged 15 years are the age groups that are most secure financially, with 100.0% of males and 100.0% of females in these age groups living above the poverty line.
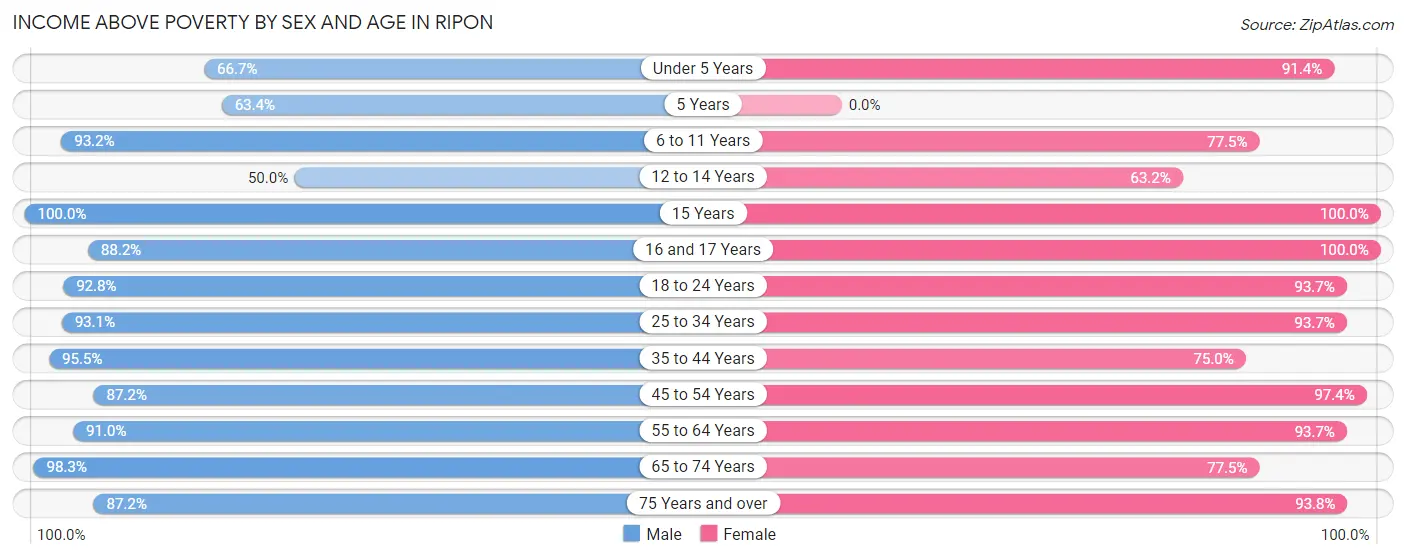
| Age Bracket | Male | Female |
| Under 5 Years | 98 (66.7%) | 148 (91.4%) |
| 5 Years | 26 (63.4%) | 0 (0.0%) |
| 6 to 11 Years | 287 (93.2%) | 210 (77.5%) |
| 12 to 14 Years | 59 (50.0%) | 117 (63.2%) |
| 15 Years | 54 (100.0%) | 35 (100.0%) |
| 16 and 17 Years | 60 (88.2%) | 117 (100.0%) |
| 18 to 24 Years | 220 (92.8%) | 89 (93.7%) |
| 25 to 34 Years | 459 (93.1%) | 238 (93.7%) |
| 35 to 44 Years | 483 (95.5%) | 386 (75.0%) |
| 45 to 54 Years | 293 (87.2%) | 334 (97.4%) |
| 55 to 64 Years | 424 (91.0%) | 611 (93.7%) |
| 65 to 74 Years | 411 (98.3%) | 482 (77.5%) |
| 75 Years and over | 143 (87.2%) | 425 (93.8%) |
| Total | 3,017 (89.9%) | 3,192 (86.2%) |
Income Below Poverty Among Married-Couple Families in Ripon
The poverty statistics for married-couple families in Ripon show that 3.9% or 46 of the total 1,171 families live below the poverty line. Families with 1 or 2 children have the highest poverty rate of 8.2%, comprising of 29 families. On the other hand, families with 3 or 4 children have the lowest poverty rate of 0.0%, which includes 0 families.
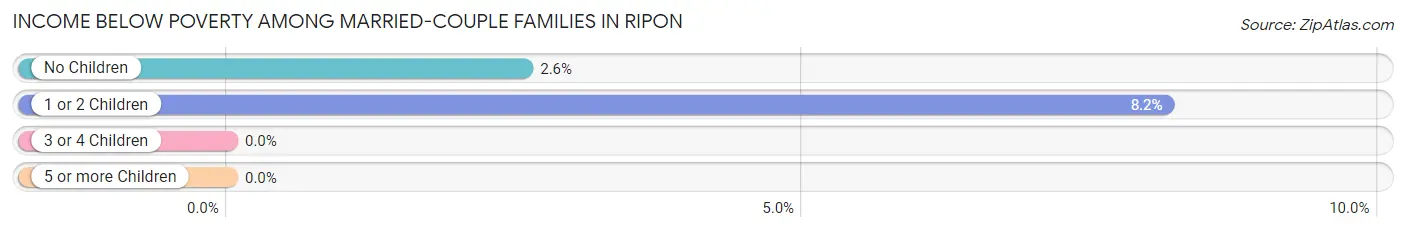
| Children | Above Poverty | Below Poverty |
| No Children | 645 (97.4%) | 17 (2.6%) |
| 1 or 2 Children | 327 (91.8%) | 29 (8.2%) |
| 3 or 4 Children | 153 (100.0%) | 0 (0.0%) |
| 5 or more Children | 0 (0.0%) | 0 (0.0%) |
| Total | 1,125 (96.1%) | 46 (3.9%) |
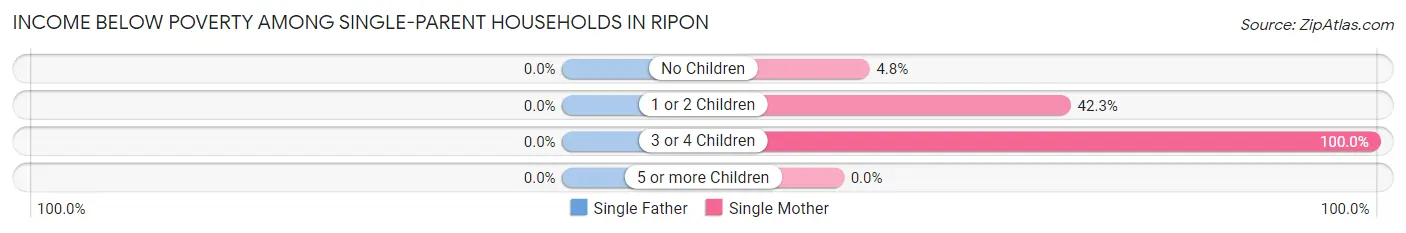
Income Below Poverty Among Single-Parent Households in Ripon
| Children | Single Father | Single Mother |
| No Children | 0 (0.0%) | 5 (4.8%) |
| 1 or 2 Children | 0 (0.0%) | 52 (42.3%) |
| 3 or 4 Children | 0 (0.0%) | 54 (100.0%) |
| 5 or more Children | 0 (0.0%) | 0 (0.0%) |
| Total | 0 (0.0%) | 111 (39.5%) |
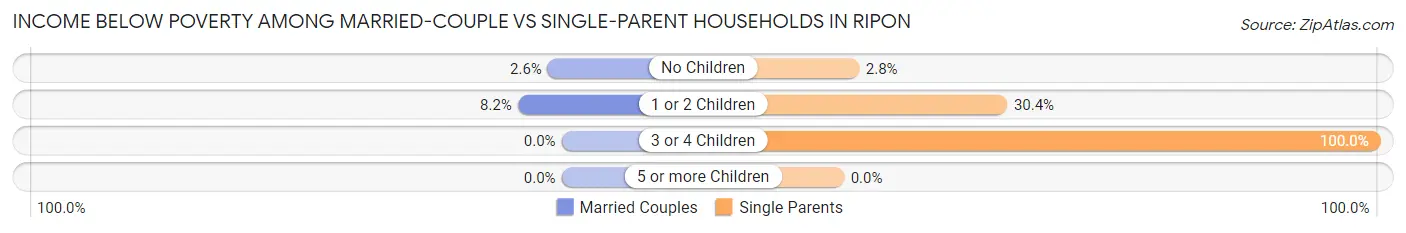
Income Below Poverty Among Married-Couple vs Single-Parent Households in Ripon
The poverty data for Ripon shows that 46 of the married-couple family households (3.9%) and 111 of the single-parent households (27.6%) are living below the poverty level. Within the married-couple family households, those with 1 or 2 children have the highest poverty rate, with 29 households (8.2%) falling below the poverty line. Among the single-parent households, those with 3 or 4 children have the highest poverty rate, with 54 household (100.0%) living below poverty.
| Children | Married-Couple Families | Single-Parent Households |
| No Children | 17 (2.6%) | 5 (2.8%) |
| 1 or 2 Children | 29 (8.2%) | 52 (30.4%) |
| 3 or 4 Children | 0 (0.0%) | 54 (100.0%) |
| 5 or more Children | 0 (0.0%) | 0 (0.0%) |
| Total | 46 (3.9%) | 111 (27.6%) |
Race in Ripon
The most populous races in Ripon are White / Caucasian (7,325 | 93.6%), Two or more Races (273 | 3.5%), and Hispanic or Latino (263 | 3.4%).

| Race | # Population | % Population |
| Asian | 22 | 0.3% |
| Black / African American | 45 | 0.6% |
| Hawaiian / Pacific | 0 | 0.0% |
| Hispanic or Latino | 263 | 3.4% |
| Native / Alaskan | 28 | 0.4% |
| White / Caucasian | 7,325 | 93.6% |
| Two or more Races | 273 | 3.5% |
| Some other Race | 130 | 1.7% |
| Total | 7,823 | 100.0% |
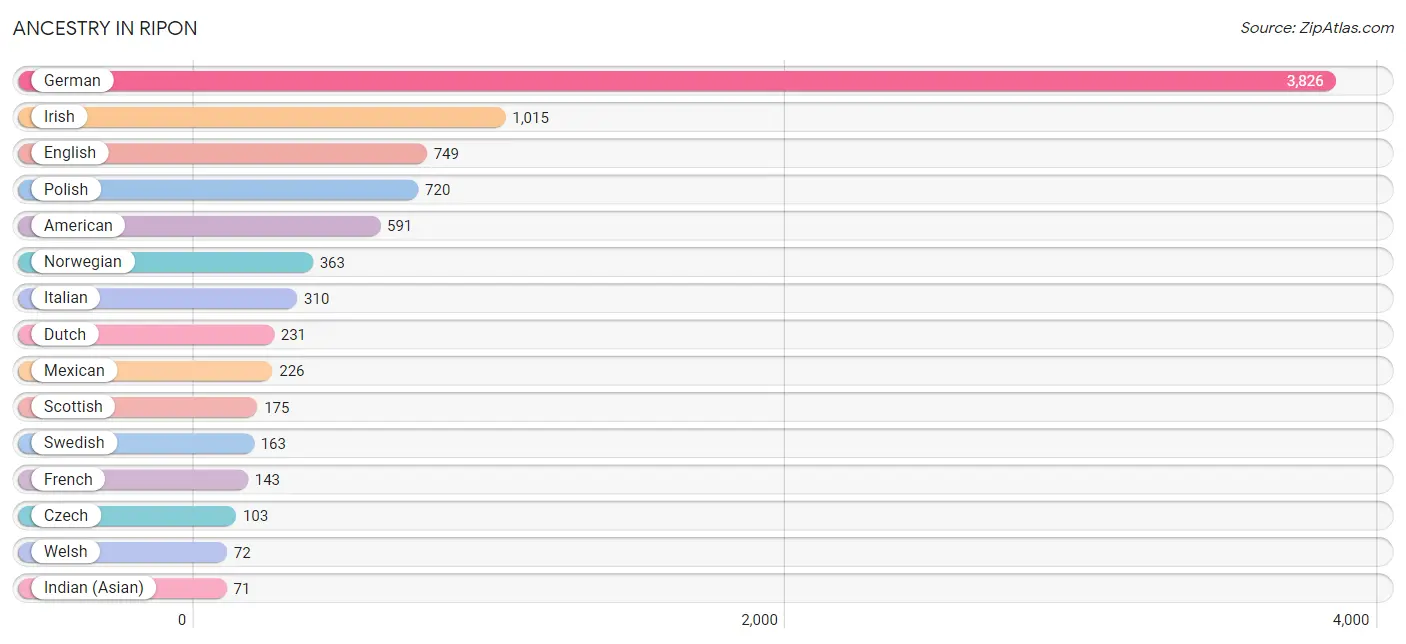
Ancestry in Ripon
The most populous ancestries reported in Ripon are German (3,826 | 48.9%), Irish (1,015 | 13.0%), English (749 | 9.6%), Polish (720 | 9.2%), and American (591 | 7.5%), together accounting for 88.2% of all Ripon residents.
| Ancestry | # Population | % Population |
| African | 30 | 0.4% |
| American | 591 | 7.5% |
| Belgian | 13 | 0.2% |
| Bhutanese | 1 | 0.0% |
| Central American | 5 | 0.1% |
| Cherokee | 30 | 0.4% |
| Croatian | 32 | 0.4% |
| Cuban | 18 | 0.2% |
| Czech | 103 | 1.3% |
| Danish | 34 | 0.4% |
| Dutch | 231 | 2.9% |
| English | 749 | 9.6% |
| European | 50 | 0.6% |
| Finnish | 46 | 0.6% |
| French | 143 | 1.8% |
| French American Indian | 1 | 0.0% |
| French Canadian | 27 | 0.4% |
| German | 3,826 | 48.9% |
| Greek | 25 | 0.3% |
| Guatemalan | 5 | 0.1% |
| Hungarian | 38 | 0.5% |
| Indian (Asian) | 71 | 0.9% |
| Irish | 1,015 | 13.0% |
| Italian | 310 | 4.0% |
| Korean | 8 | 0.1% |
| Laotian | 11 | 0.1% |
| Lithuanian | 8 | 0.1% |
| Luxembourger | 7 | 0.1% |
| Mexican | 226 | 2.9% |
| Nigerian | 11 | 0.1% |
| Northern European | 31 | 0.4% |
| Norwegian | 363 | 4.6% |
| Pakistani | 17 | 0.2% |
| Polish | 720 | 9.2% |
| Puerto Rican | 14 | 0.2% |
| Romanian | 5 | 0.1% |
| Russian | 49 | 0.6% |
| Samoan | 71 | 0.9% |
| Scandinavian | 15 | 0.2% |
| Scotch-Irish | 31 | 0.4% |
| Scottish | 175 | 2.2% |
| Subsaharan African | 41 | 0.5% |
| Swedish | 163 | 2.1% |
| Swiss | 9 | 0.1% |
| Ukrainian | 5 | 0.1% |
| Welsh | 72 | 0.9% |
| West Indian | 23 | 0.3% | View All 47 Rows |
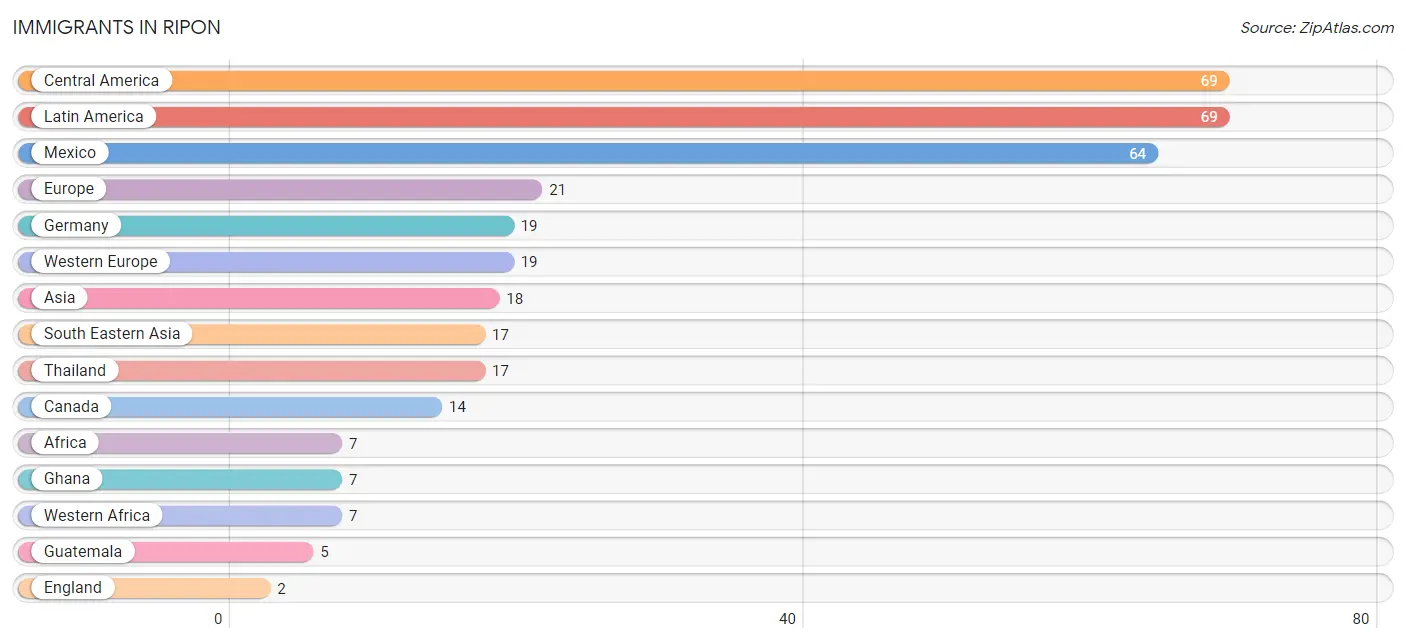
Immigrants in Ripon
The most numerous immigrant groups reported in Ripon came from Central America (69 | 0.9%), Latin America (69 | 0.9%), Mexico (64 | 0.8%), Europe (21 | 0.3%), and Germany (19 | 0.2%), together accounting for 3.1% of all Ripon residents.
| Immigration Origin | # Population | % Population |
| Africa | 7 | 0.1% |
| Asia | 18 | 0.2% |
| Canada | 14 | 0.2% |
| Central America | 69 | 0.9% |
| Eastern Asia | 1 | 0.0% |
| England | 2 | 0.0% |
| Europe | 21 | 0.3% |
| Germany | 19 | 0.2% |
| Ghana | 7 | 0.1% |
| Guatemala | 5 | 0.1% |
| Japan | 1 | 0.0% |
| Latin America | 69 | 0.9% |
| Mexico | 64 | 0.8% |
| Northern Europe | 2 | 0.0% |
| South Eastern Asia | 17 | 0.2% |
| Thailand | 17 | 0.2% |
| Western Africa | 7 | 0.1% |
| Western Europe | 19 | 0.2% | View All 18 Rows |
Sex and Age in Ripon
Sex and Age in Ripon
The most populous age groups in Ripon are 15 to 19 Years (321 | 8.9%) for men and 15 to 19 Years (397 | 9.5%) for women.
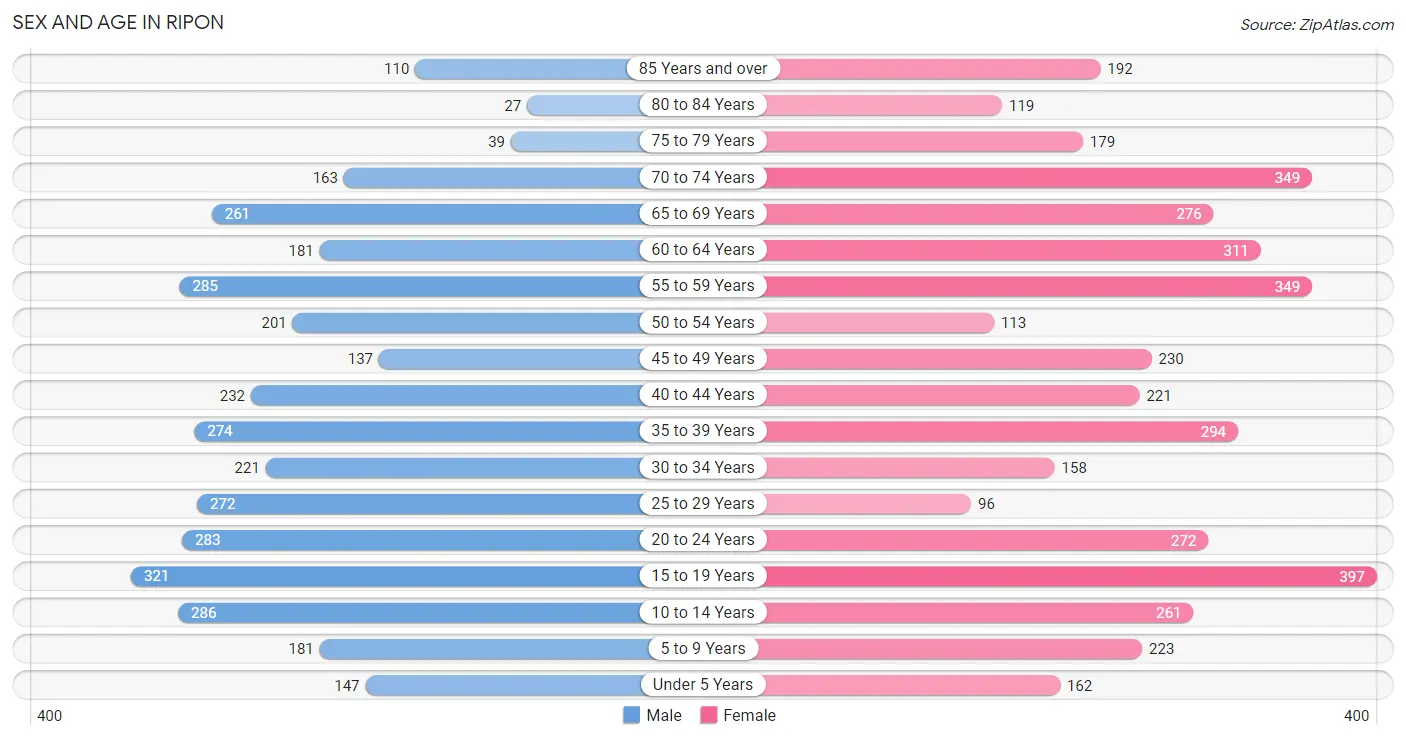
| Age Bracket | Male | Female |
| Under 5 Years | 147 (4.1%) | 162 (3.9%) |
| 5 to 9 Years | 181 (5.0%) | 223 (5.3%) |
| 10 to 14 Years | 286 (7.9%) | 261 (6.2%) |
| 15 to 19 Years | 321 (8.9%) | 397 (9.5%) |
| 20 to 24 Years | 283 (7.8%) | 272 (6.5%) |
| 25 to 29 Years | 272 (7.5%) | 96 (2.3%) |
| 30 to 34 Years | 221 (6.1%) | 158 (3.8%) |
| 35 to 39 Years | 274 (7.6%) | 294 (7.0%) |
| 40 to 44 Years | 232 (6.4%) | 221 (5.3%) |
| 45 to 49 Years | 137 (3.8%) | 230 (5.5%) |
| 50 to 54 Years | 201 (5.6%) | 113 (2.7%) |
| 55 to 59 Years | 285 (7.9%) | 349 (8.3%) |
| 60 to 64 Years | 181 (5.0%) | 311 (7.4%) |
| 65 to 69 Years | 261 (7.2%) | 276 (6.6%) |
| 70 to 74 Years | 163 (4.5%) | 349 (8.3%) |
| 75 to 79 Years | 39 (1.1%) | 179 (4.3%) |
| 80 to 84 Years | 27 (0.7%) | 119 (2.8%) |
| 85 Years and over | 110 (3.0%) | 192 (4.6%) |
| Total | 3,621 (100.0%) | 4,202 (100.0%) |
Families and Households in Ripon
Median Family Size in Ripon
The median family size in Ripon is 3.01 persons per family, with married-couple families (1,171 | 74.4%) accounting for the largest median family size of 3.07 persons per family. On the other hand, single male/father families (121 | 7.7%) represent the smallest median family size with 2.75 persons per family.
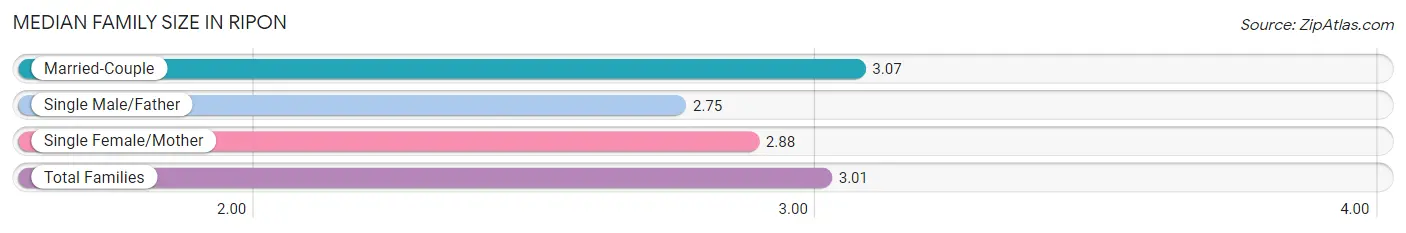
| Family Type | # Families | Family Size |
| Married-Couple | 1,171 (74.4%) | 3.07 |
| Single Male/Father | 121 (7.7%) | 2.75 |
| Single Female/Mother | 281 (17.9%) | 2.88 |
| Total Families | 1,573 (100.0%) | 3.01 |
Median Household Size in Ripon
The median household size in Ripon is 2.17 persons per household, with single male/father households (121 | 3.8%) accounting for the largest median household size of 3.36 persons per household. non-family households (1,648 | 51.2%) represent the smallest median household size with 1.22 persons per household.
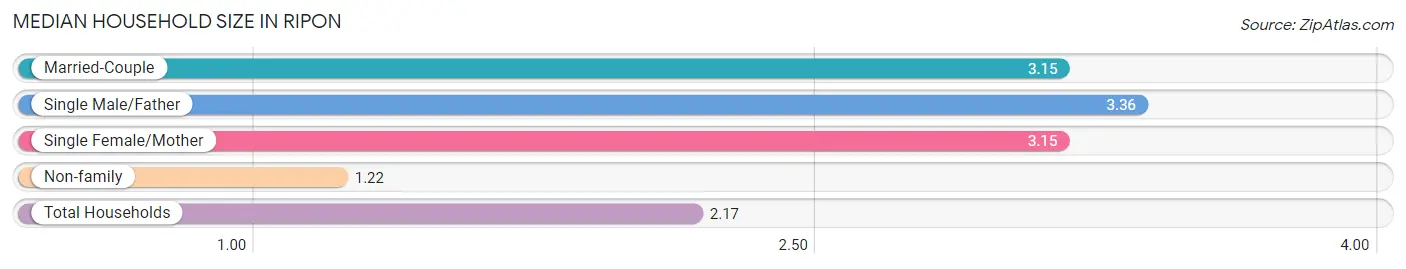
| Household Type | # Households | Household Size |
| Married-Couple | 1,171 (36.4%) | 3.15 |
| Single Male/Father | 121 (3.8%) | 3.36 |
| Single Female/Mother | 281 (8.7%) | 3.15 |
| Non-family | 1,648 (51.2%) | 1.22 |
| Total Households | 3,221 (100.0%) | 2.17 |
Household Size by Marriage Status in Ripon
Out of a total of 3,221 households in Ripon, 1,573 (48.8%) are family households, while 1,648 (51.2%) are nonfamily households. The most numerous type of family households are 2-person households, comprising 731, and the most common type of nonfamily households are 1-person households, comprising 1,304.
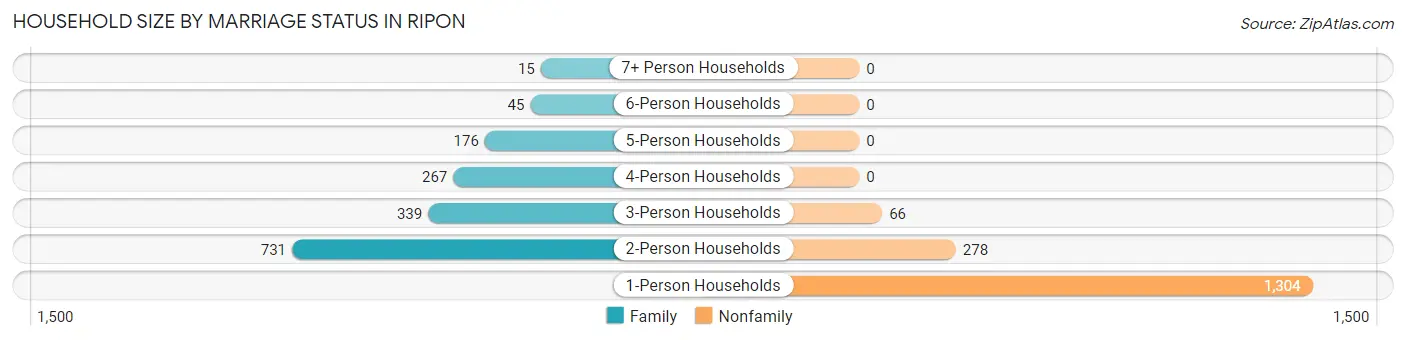
| Household Size | Family Households | Nonfamily Households |
| 1-Person Households | - | 1,304 (40.5%) |
| 2-Person Households | 731 (22.7%) | 278 (8.6%) |
| 3-Person Households | 339 (10.5%) | 66 (2.1%) |
| 4-Person Households | 267 (8.3%) | 0 (0.0%) |
| 5-Person Households | 176 (5.5%) | 0 (0.0%) |
| 6-Person Households | 45 (1.4%) | 0 (0.0%) |
| 7+ Person Households | 15 (0.5%) | 0 (0.0%) |
| Total | 1,573 (48.8%) | 1,648 (51.2%) |
Female Fertility in Ripon
Fertility by Age in Ripon
Average fertility rate in Ripon is 21.0 births per 1,000 women. Women in the age bracket of 20 to 34 years have the highest fertility rate with 27.0 births per 1,000 women. Women in the age bracket of 35 to 50 years acount for 48.6% of all women with births.
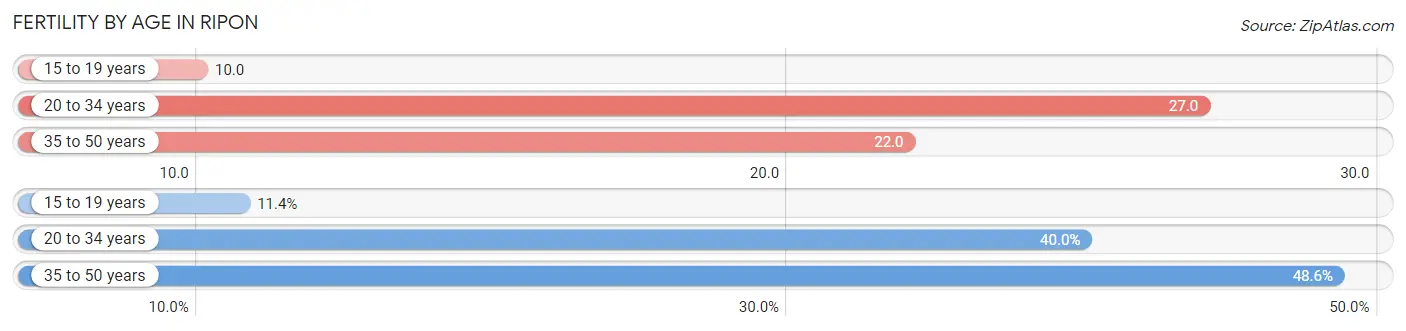
| Age Bracket | Women with Births | Births / 1,000 Women |
| 15 to 19 years | 4 (11.4%) | 10.0 |
| 20 to 34 years | 14 (40.0%) | 27.0 |
| 35 to 50 years | 17 (48.6%) | 22.0 |
| Total | 35 (100.0%) | 21.0 |
Fertility by Age by Marriage Status in Ripon
40.0% of women with births (35) in Ripon are married. The highest percentage of unmarried women with births falls into 15 to 19 years age bracket with 100.0% of them unmarried at the time of birth, while the lowest percentage of unmarried women with births belong to 20 to 34 years age bracket with 0.0% of them unmarried.
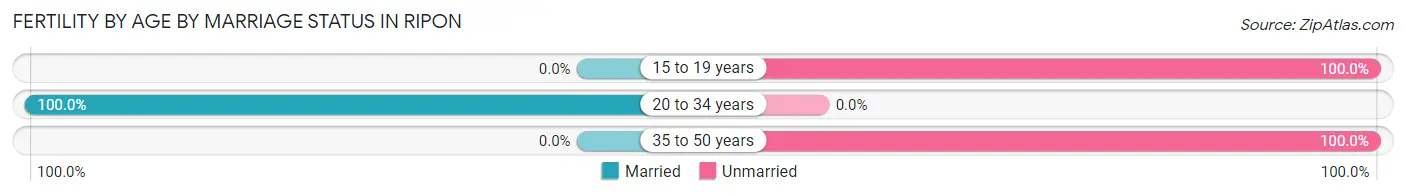
| Age Bracket | Married | Unmarried |
| 15 to 19 years | 0 (0.0%) | 4 (100.0%) |
| 20 to 34 years | 14 (100.0%) | 0 (0.0%) |
| 35 to 50 years | 0 (0.0%) | 17 (100.0%) |
| Total | 14 (40.0%) | 21 (60.0%) |
Fertility by Education in Ripon
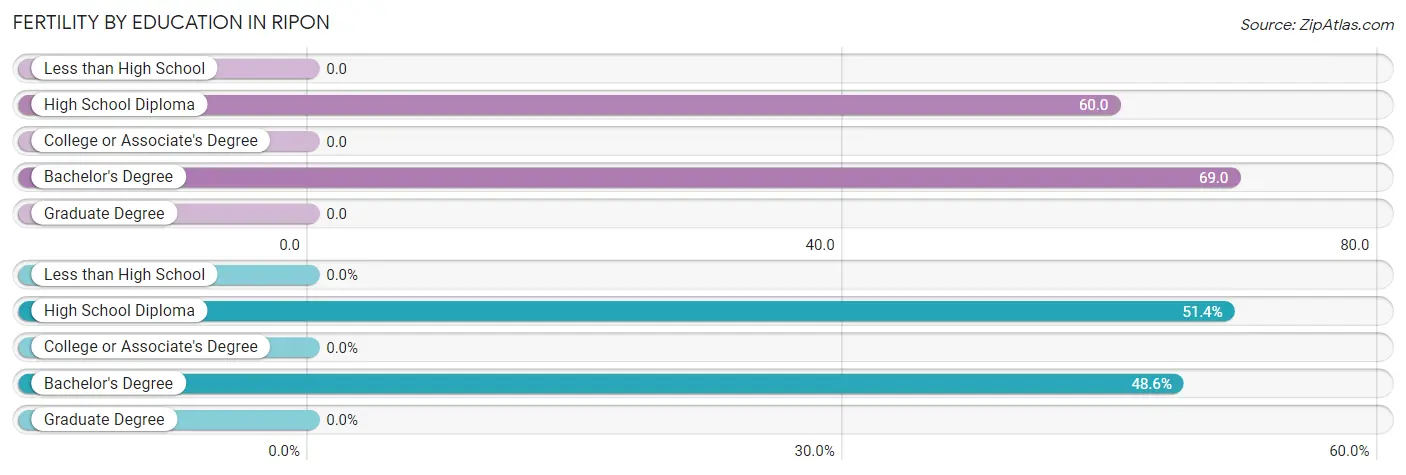
| Educational Attainment | Women with Births | Births / 1,000 Women |
| Less than High School | 0 (0.0%) | 0.0 |
| High School Diploma | 18 (51.4%) | 60.0 |
| College or Associate's Degree | 0 (0.0%) | 0.0 |
| Bachelor's Degree | 17 (48.6%) | 69.0 |
| Graduate Degree | 0 (0.0%) | 0.0 |
| Total | 35 (100.0%) | 21.0 |
Fertility by Education by Marriage Status in Ripon
60.0% of women with births in Ripon are unmarried. Women with the educational attainment of high school diploma are most likely to be married with 77.8% of them married at childbirth, while women with the educational attainment of bachelor's degree are least likely to be married with 100.0% of them unmarried at childbirth.
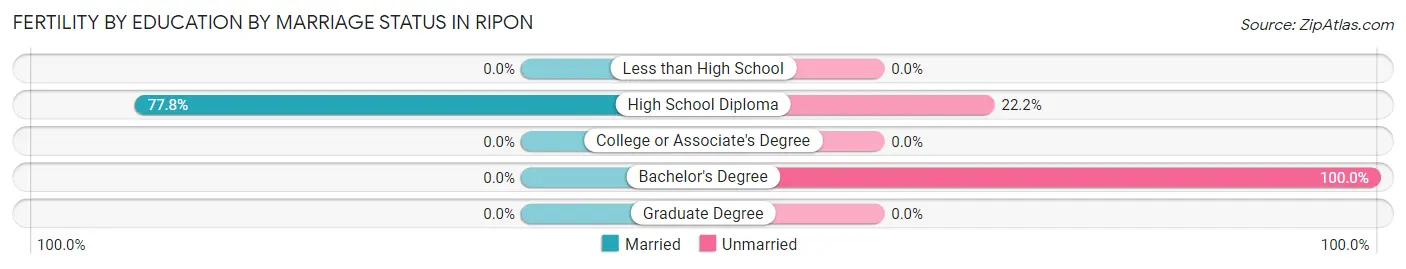
| Educational Attainment | Married | Unmarried |
| Less than High School | 0 (0.0%) | 0 (0.0%) |
| High School Diploma | 14 (77.8%) | 4 (22.2%) |
| College or Associate's Degree | 0 (0.0%) | 0 (0.0%) |
| Bachelor's Degree | 0 (0.0%) | 17 (100.0%) |
| Graduate Degree | 0 (0.0%) | 0 (0.0%) |
| Total | 14 (40.0%) | 21 (60.0%) |
Employment Characteristics in Ripon
Employment by Class of Employer in Ripon
Among the 3,736 employed individuals in Ripon, private company employees (2,777 | 74.3%), not-for-profit organizations (276 | 7.4%), and self-employed (not incorporated) (264 | 7.1%) make up the most common classes of employment.
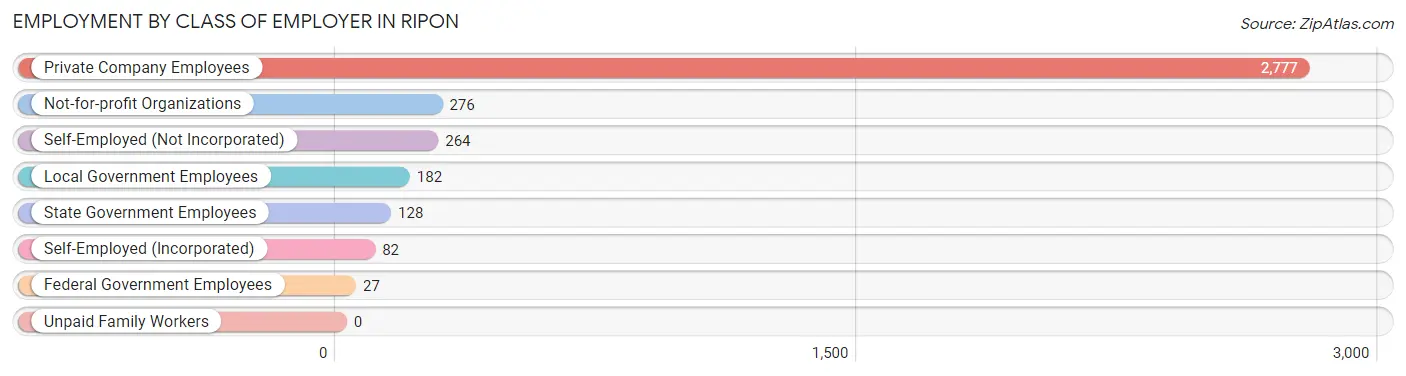
| Employer Class | # Employees | % Employees |
| Private Company Employees | 2,777 | 74.3% |
| Self-Employed (Incorporated) | 82 | 2.2% |
| Self-Employed (Not Incorporated) | 264 | 7.1% |
| Not-for-profit Organizations | 276 | 7.4% |
| Local Government Employees | 182 | 4.9% |
| State Government Employees | 128 | 3.4% |
| Federal Government Employees | 27 | 0.7% |
| Unpaid Family Workers | 0 | 0.0% |
| Total | 3,736 | 100.0% |
Employment Status by Age in Ripon
According to the labor force statistics for Ripon, out of the total population over 16 years of age (6,474), 60.7% or 3,930 individuals are in the labor force, with 2.5% or 98 of them unemployed. The age group with the highest labor force participation rate is 25 to 29 years, with 94.3% or 347 individuals in the labor force. Within the labor force, the 20 to 24 years age range has the highest percentage of unemployed individuals, with 7.0% or 27 of them being unemployed.
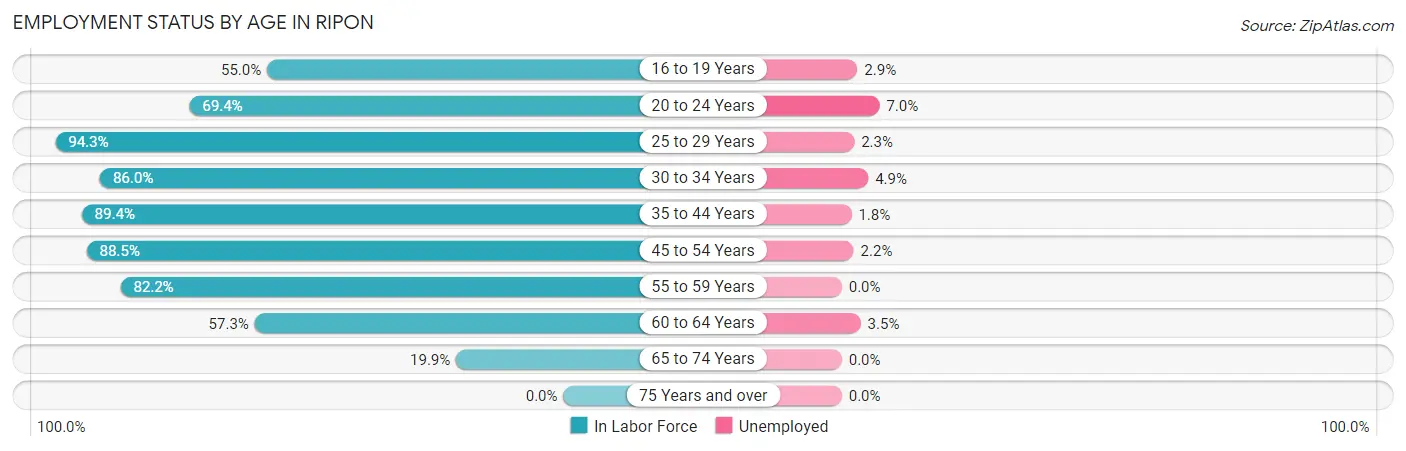
| Age Bracket | In Labor Force | Unemployed |
| 16 to 19 Years | 346 (55.0%) | 10 (2.9%) |
| 20 to 24 Years | 385 (69.4%) | 27 (7.0%) |
| 25 to 29 Years | 347 (94.3%) | 8 (2.3%) |
| 30 to 34 Years | 326 (86.0%) | 16 (4.9%) |
| 35 to 44 Years | 913 (89.4%) | 16 (1.8%) |
| 45 to 54 Years | 603 (88.5%) | 13 (2.2%) |
| 55 to 59 Years | 521 (82.2%) | 0 (0.0%) |
| 60 to 64 Years | 282 (57.3%) | 10 (3.5%) |
| 65 to 74 Years | 209 (19.9%) | 0 (0.0%) |
| 75 Years and over | 0 (0.0%) | 0 (0.0%) |
| Total | 3,930 (60.7%) | 98 (2.5%) |
Employment Status by Educational Attainment in Ripon
According to labor force statistics for Ripon, 83.7% of individuals (2,992) out of the total population between 25 and 64 years of age (3,575) are in the labor force, with 2.1% or 63 of them being unemployed. The group with the highest labor force participation rate are those with the educational attainment of bachelor's degree or higher, with 88.2% or 931 individuals in the labor force. Within the labor force, individuals with less than high school education have the highest percentage of unemployment, with 8.7% or 13 of them being unemployed.
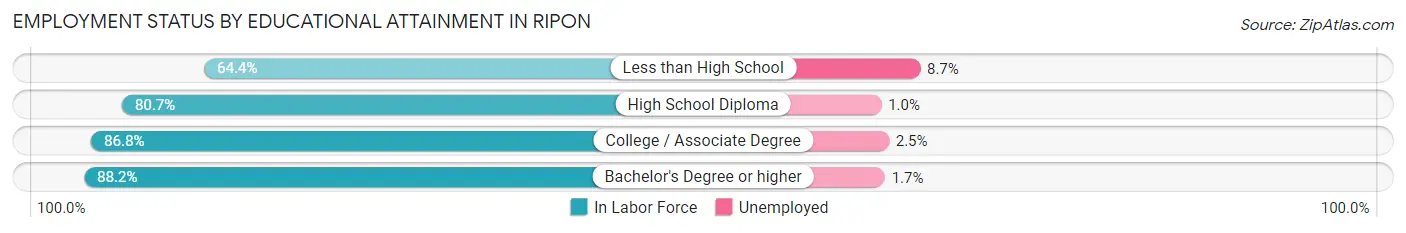
| Educational Attainment | In Labor Force | Unemployed |
| Less than High School | 150 (64.4%) | 20 (8.7%) |
| High School Diploma | 956 (80.7%) | 12 (1.0%) |
| College / Associate Degree | 957 (86.8%) | 28 (2.5%) |
| Bachelor's Degree or higher | 931 (88.2%) | 18 (1.7%) |
| Total | 2,992 (83.7%) | 75 (2.1%) |
Employment Occupations by Sex in Ripon
Management, Business, Science and Arts Occupations
The most common Management, Business, Science and Arts occupations in Ripon are Management (264 | 6.9%), Community & Social Service (226 | 5.9%), Business & Financial (118 | 3.1%), Computers, Engineering & Science (112 | 2.9%), and Education Instruction & Library (111 | 2.9%).
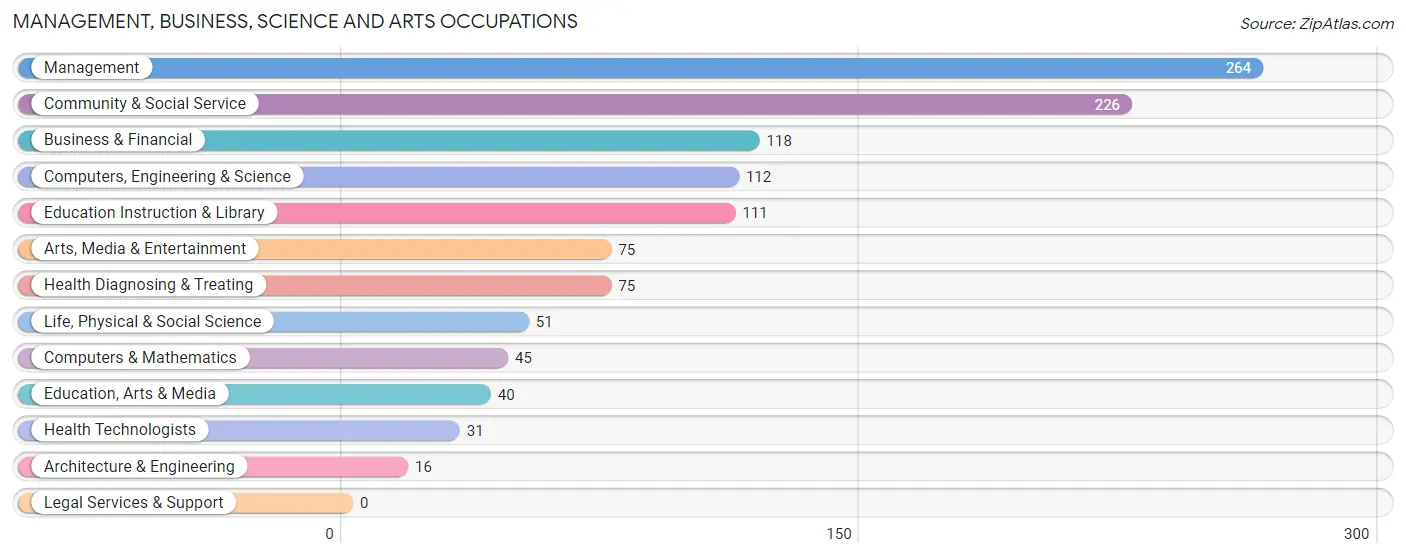
Management, Business, Science and Arts Occupations by Sex
Within the Management, Business, Science and Arts occupations in Ripon, the most male-oriented occupations are Health Technologists (67.7%), Architecture & Engineering (56.2%), and Health Diagnosing & Treating (54.7%), while the most female-oriented occupations are Life, Physical & Social Science (100.0%), Education, Arts & Media (100.0%), and Arts, Media & Entertainment (84.0%).
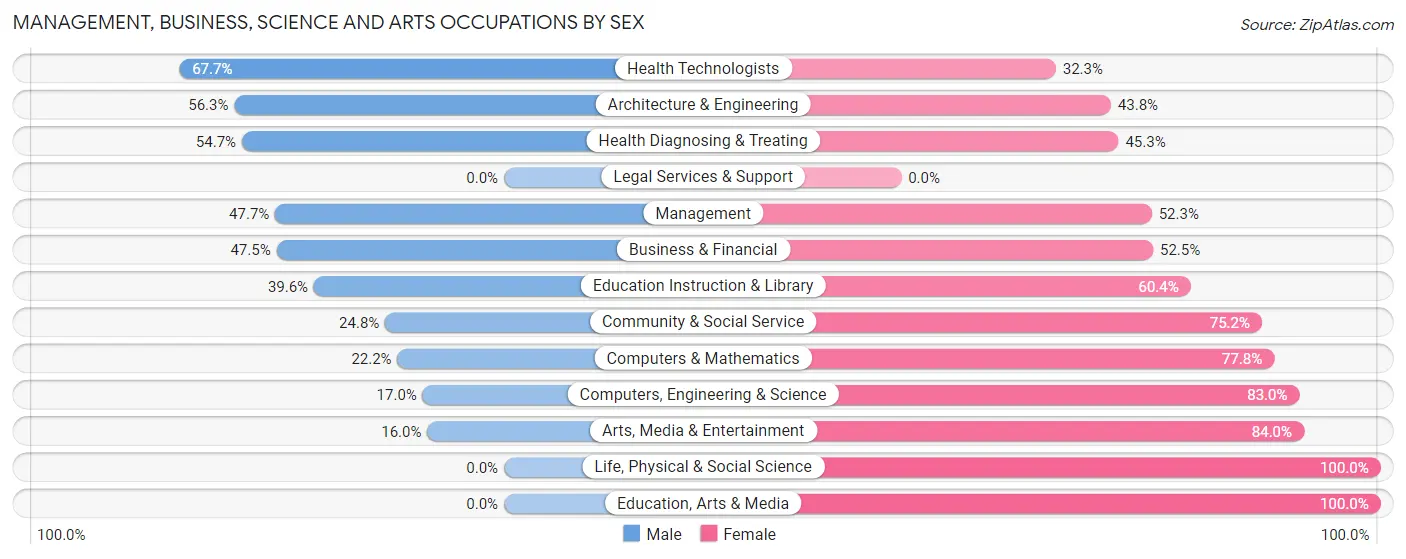
| Occupation | Male | Female |
| Management | 126 (47.7%) | 138 (52.3%) |
| Business & Financial | 56 (47.5%) | 62 (52.5%) |
| Computers, Engineering & Science | 19 (17.0%) | 93 (83.0%) |
| Computers & Mathematics | 10 (22.2%) | 35 (77.8%) |
| Architecture & Engineering | 9 (56.2%) | 7 (43.8%) |
| Life, Physical & Social Science | 0 (0.0%) | 51 (100.0%) |
| Community & Social Service | 56 (24.8%) | 170 (75.2%) |
| Education, Arts & Media | 0 (0.0%) | 40 (100.0%) |
| Legal Services & Support | 0 (0.0%) | 0 (0.0%) |
| Education Instruction & Library | 44 (39.6%) | 67 (60.4%) |
| Arts, Media & Entertainment | 12 (16.0%) | 63 (84.0%) |
| Health Diagnosing & Treating | 41 (54.7%) | 34 (45.3%) |
| Health Technologists | 21 (67.7%) | 10 (32.3%) |
| Total (Category) | 298 (37.5%) | 497 (62.5%) |
| Total (Overall) | 1,982 (51.7%) | 1,850 (48.3%) |
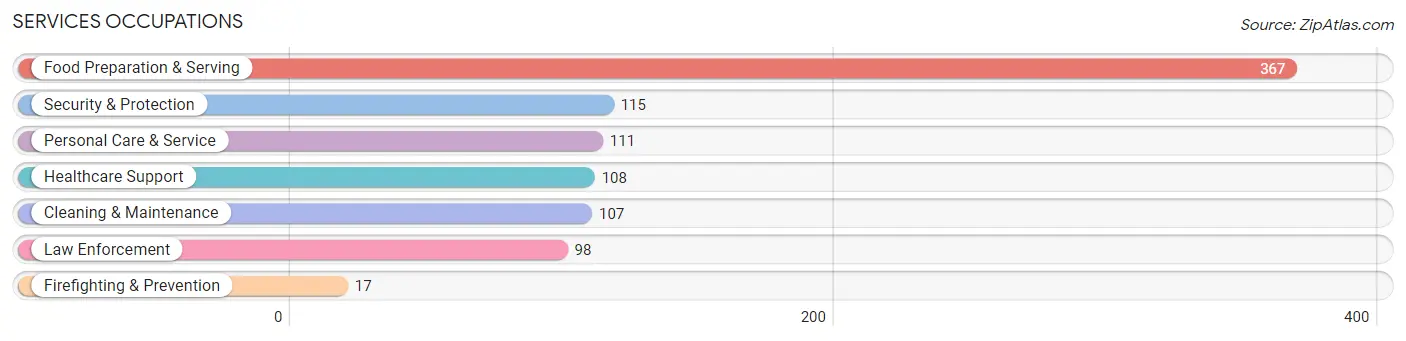
Services Occupations
The most common Services occupations in Ripon are Food Preparation & Serving (367 | 9.6%), Security & Protection (115 | 3.0%), Personal Care & Service (111 | 2.9%), Healthcare Support (108 | 2.8%), and Cleaning & Maintenance (107 | 2.8%).
Services Occupations by Sex
Within the Services occupations in Ripon, the most male-oriented occupations are Law Enforcement (91.8%), Security & Protection (78.3%), and Cleaning & Maintenance (51.4%), while the most female-oriented occupations are Firefighting & Prevention (100.0%), Healthcare Support (89.8%), and Personal Care & Service (66.7%).
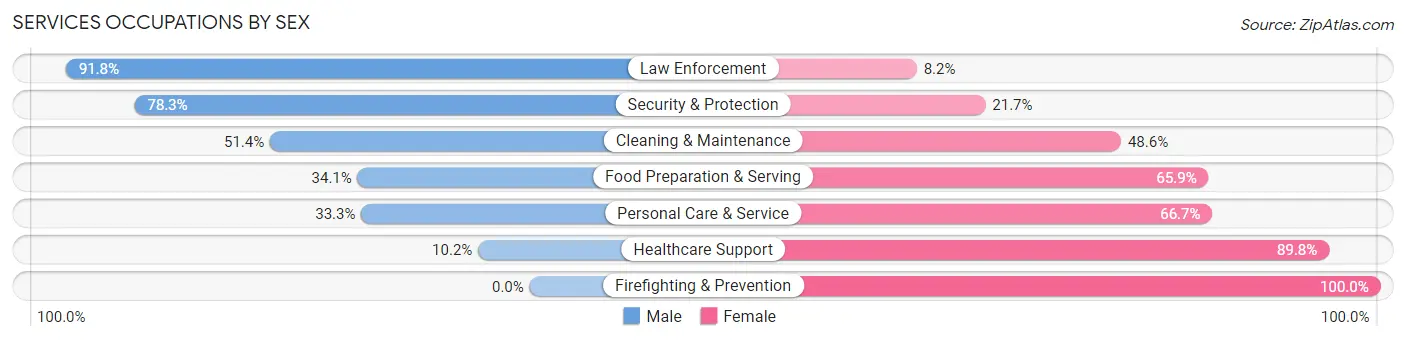
| Occupation | Male | Female |
| Healthcare Support | 11 (10.2%) | 97 (89.8%) |
| Security & Protection | 90 (78.3%) | 25 (21.7%) |
| Firefighting & Prevention | 0 (0.0%) | 17 (100.0%) |
| Law Enforcement | 90 (91.8%) | 8 (8.2%) |
| Food Preparation & Serving | 125 (34.1%) | 242 (65.9%) |
| Cleaning & Maintenance | 55 (51.4%) | 52 (48.6%) |
| Personal Care & Service | 37 (33.3%) | 74 (66.7%) |
| Total (Category) | 318 (39.4%) | 490 (60.6%) |
| Total (Overall) | 1,982 (51.7%) | 1,850 (48.3%) |
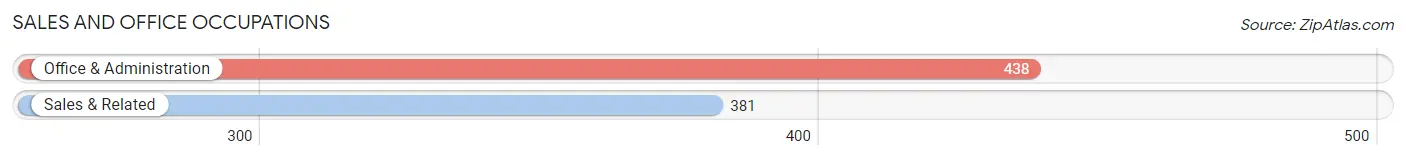
Sales and Office Occupations
The most common Sales and Office occupations in Ripon are Office & Administration (438 | 11.4%), and Sales & Related (381 | 9.9%).
Sales and Office Occupations by Sex
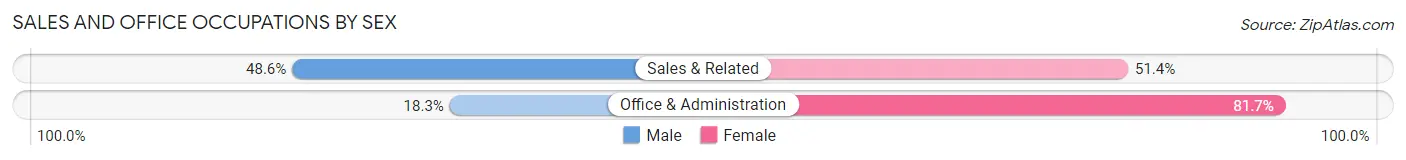
| Occupation | Male | Female |
| Sales & Related | 185 (48.6%) | 196 (51.4%) |
| Office & Administration | 80 (18.3%) | 358 (81.7%) |
| Total (Category) | 265 (32.4%) | 554 (67.6%) |
| Total (Overall) | 1,982 (51.7%) | 1,850 (48.3%) |
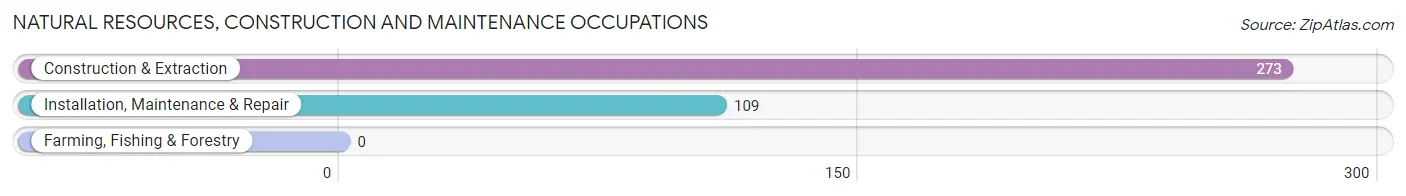
Natural Resources, Construction and Maintenance Occupations
The most common Natural Resources, Construction and Maintenance occupations in Ripon are Construction & Extraction (273 | 7.1%), and Installation, Maintenance & Repair (109 | 2.8%).
Natural Resources, Construction and Maintenance Occupations by Sex
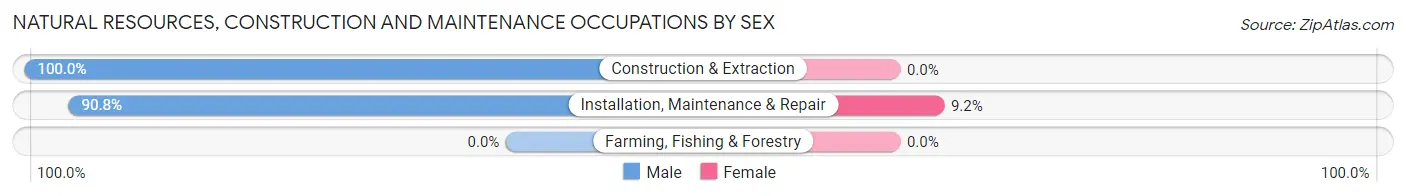
| Occupation | Male | Female |
| Farming, Fishing & Forestry | 0 (0.0%) | 0 (0.0%) |
| Construction & Extraction | 273 (100.0%) | 0 (0.0%) |
| Installation, Maintenance & Repair | 99 (90.8%) | 10 (9.2%) |
| Total (Category) | 372 (97.4%) | 10 (2.6%) |
| Total (Overall) | 1,982 (51.7%) | 1,850 (48.3%) |
Production, Transportation and Moving Occupations
The most common Production, Transportation and Moving occupations in Ripon are Production (713 | 18.6%), Transportation (161 | 4.2%), and Material Moving (154 | 4.0%).
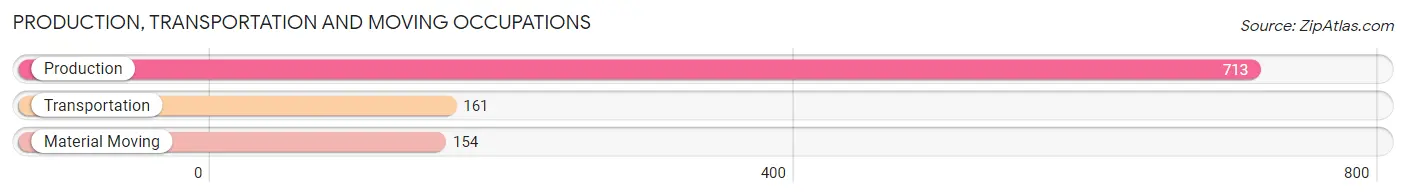
Production, Transportation and Moving Occupations by Sex
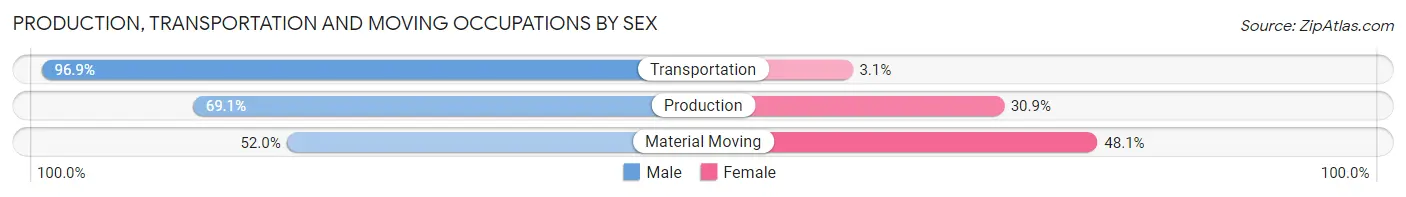
| Occupation | Male | Female |
| Production | 493 (69.1%) | 220 (30.9%) |
| Transportation | 156 (96.9%) | 5 (3.1%) |
| Material Moving | 80 (51.9%) | 74 (48.0%) |
| Total (Category) | 729 (70.9%) | 299 (29.1%) |
| Total (Overall) | 1,982 (51.7%) | 1,850 (48.3%) |
Employment Industries by Sex in Ripon
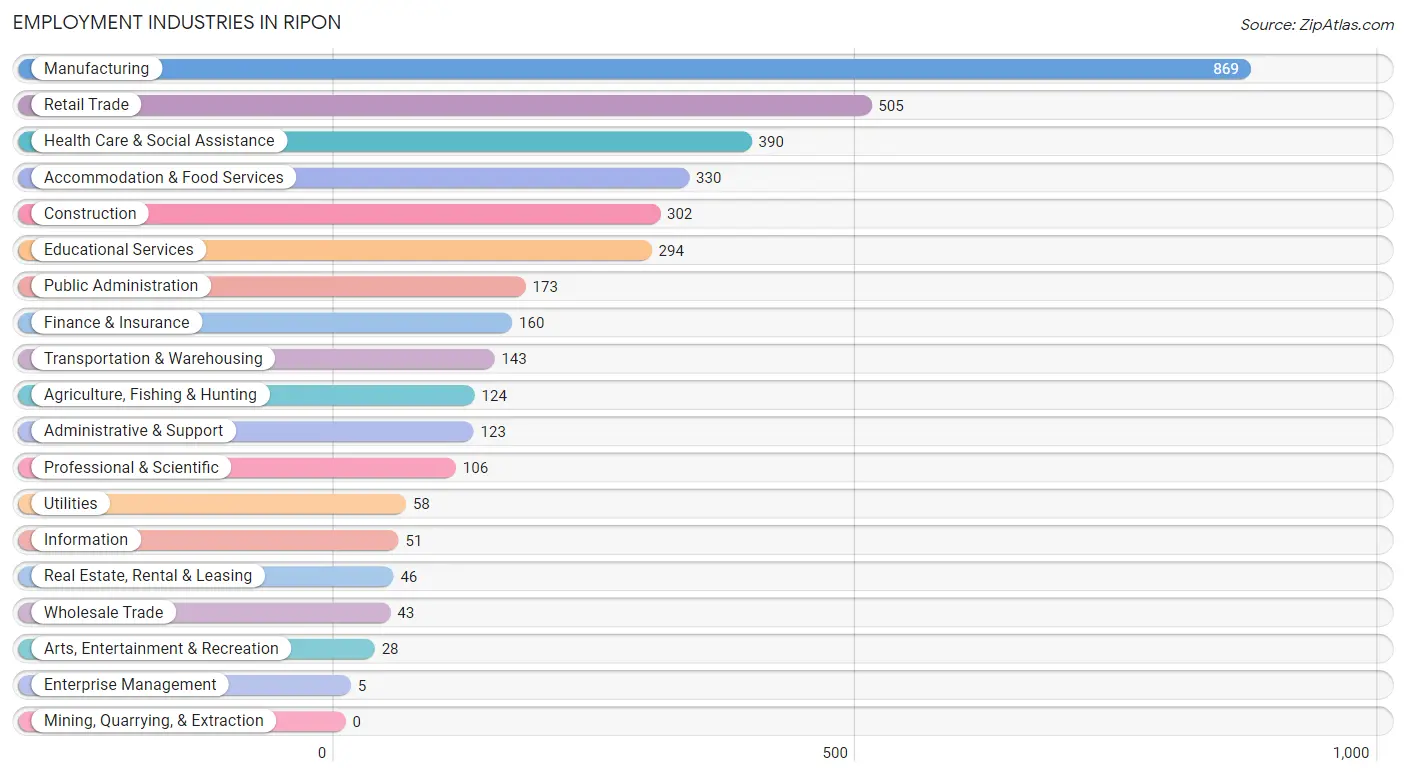
Employment Industries in Ripon
The major employment industries in Ripon include Manufacturing (869 | 22.7%), Retail Trade (505 | 13.2%), Health Care & Social Assistance (390 | 10.2%), Accommodation & Food Services (330 | 8.6%), and Construction (302 | 7.9%).
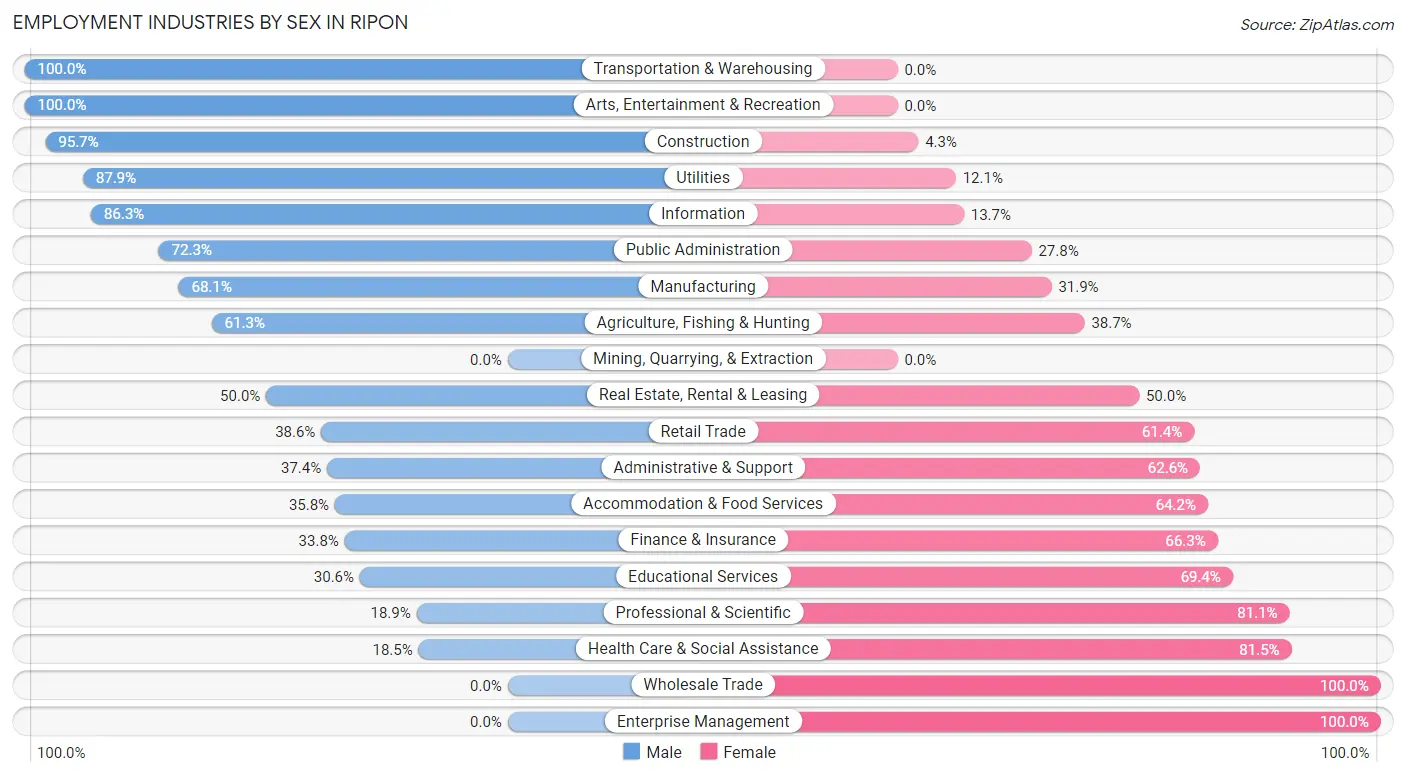
Employment Industries by Sex in Ripon
The Ripon industries that see more men than women are Transportation & Warehousing (100.0%), Arts, Entertainment & Recreation (100.0%), and Construction (95.7%), whereas the industries that tend to have a higher number of women are Wholesale Trade (100.0%), Enterprise Management (100.0%), and Health Care & Social Assistance (81.5%).
| Industry | Male | Female |
| Agriculture, Fishing & Hunting | 76 (61.3%) | 48 (38.7%) |
| Mining, Quarrying, & Extraction | 0 (0.0%) | 0 (0.0%) |
| Construction | 289 (95.7%) | 13 (4.3%) |
| Manufacturing | 592 (68.1%) | 277 (31.9%) |
| Wholesale Trade | 0 (0.0%) | 43 (100.0%) |
| Retail Trade | 195 (38.6%) | 310 (61.4%) |
| Transportation & Warehousing | 143 (100.0%) | 0 (0.0%) |
| Utilities | 51 (87.9%) | 7 (12.1%) |
| Information | 44 (86.3%) | 7 (13.7%) |
| Finance & Insurance | 54 (33.8%) | 106 (66.2%) |
| Real Estate, Rental & Leasing | 23 (50.0%) | 23 (50.0%) |
| Professional & Scientific | 20 (18.9%) | 86 (81.1%) |
| Enterprise Management | 0 (0.0%) | 5 (100.0%) |
| Administrative & Support | 46 (37.4%) | 77 (62.6%) |
| Educational Services | 90 (30.6%) | 204 (69.4%) |
| Health Care & Social Assistance | 72 (18.5%) | 318 (81.5%) |
| Arts, Entertainment & Recreation | 28 (100.0%) | 0 (0.0%) |
| Accommodation & Food Services | 118 (35.8%) | 212 (64.2%) |
| Public Administration | 125 (72.3%) | 48 (27.8%) |
| Total | 1,982 (51.7%) | 1,850 (48.3%) |
Education in Ripon
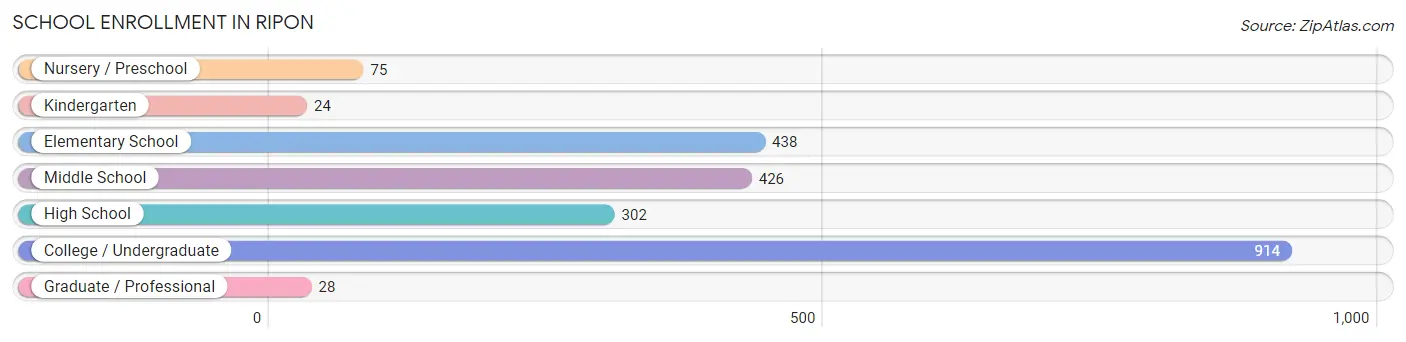
School Enrollment in Ripon
The most common levels of schooling among the 2,207 students in Ripon are college / undergraduate (914 | 41.4%), elementary school (438 | 19.9%), and middle school (426 | 19.3%).
| School Level | # Students | % Students |
| Nursery / Preschool | 75 | 3.4% |
| Kindergarten | 24 | 1.1% |
| Elementary School | 438 | 19.9% |
| Middle School | 426 | 19.3% |
| High School | 302 | 13.7% |
| College / Undergraduate | 914 | 41.4% |
| Graduate / Professional | 28 | 1.3% |
| Total | 2,207 | 100.0% |
School Enrollment by Age by Funding Source in Ripon
Out of a total of 2,207 students who are enrolled in schools in Ripon, 759 (34.4%) attend a private institution, while the remaining 1,448 (65.6%) are enrolled in public schools. The age group of 18 to 19 year olds has the highest likelihood of being enrolled in private schools, with 353 (87.0% in the age bracket) enrolled. Conversely, the age group of 15 to 17 year olds has the lowest likelihood of being enrolled in a private school, with 274 (100.0% in the age bracket) attending a public institution.
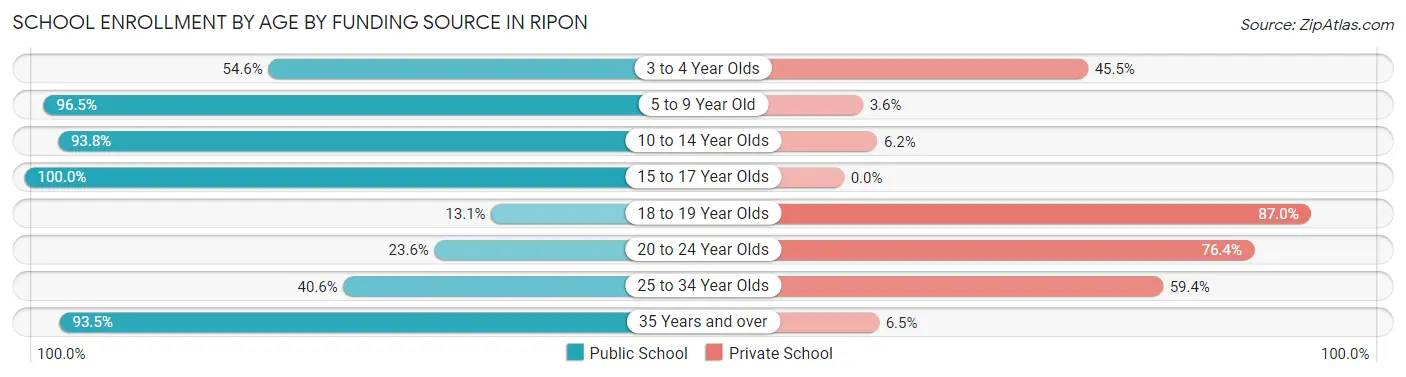
| Age Bracket | Public School | Private School |
| 3 to 4 Year Olds | 24 (54.5%) | 20 (45.5%) |
| 5 to 9 Year Old | 380 (96.5%) | 14 (3.5%) |
| 10 to 14 Year Olds | 513 (93.8%) | 34 (6.2%) |
| 15 to 17 Year Olds | 274 (100.0%) | 0 (0.0%) |
| 18 to 19 Year Olds | 53 (13.1%) | 353 (87.0%) |
| 20 to 24 Year Olds | 90 (23.6%) | 291 (76.4%) |
| 25 to 34 Year Olds | 28 (40.6%) | 41 (59.4%) |
| 35 Years and over | 86 (93.5%) | 6 (6.5%) |
| Total | 1,448 (65.6%) | 759 (34.4%) |
Educational Attainment by Field of Study in Ripon
Education (315 | 20.5%), business (260 | 16.9%), bio, nature & agricultural (193 | 12.5%), communications (122 | 7.9%), and liberal arts & history (88 | 5.7%) are the most common fields of study among 1,539 individuals in Ripon who have obtained a bachelor's degree or higher.
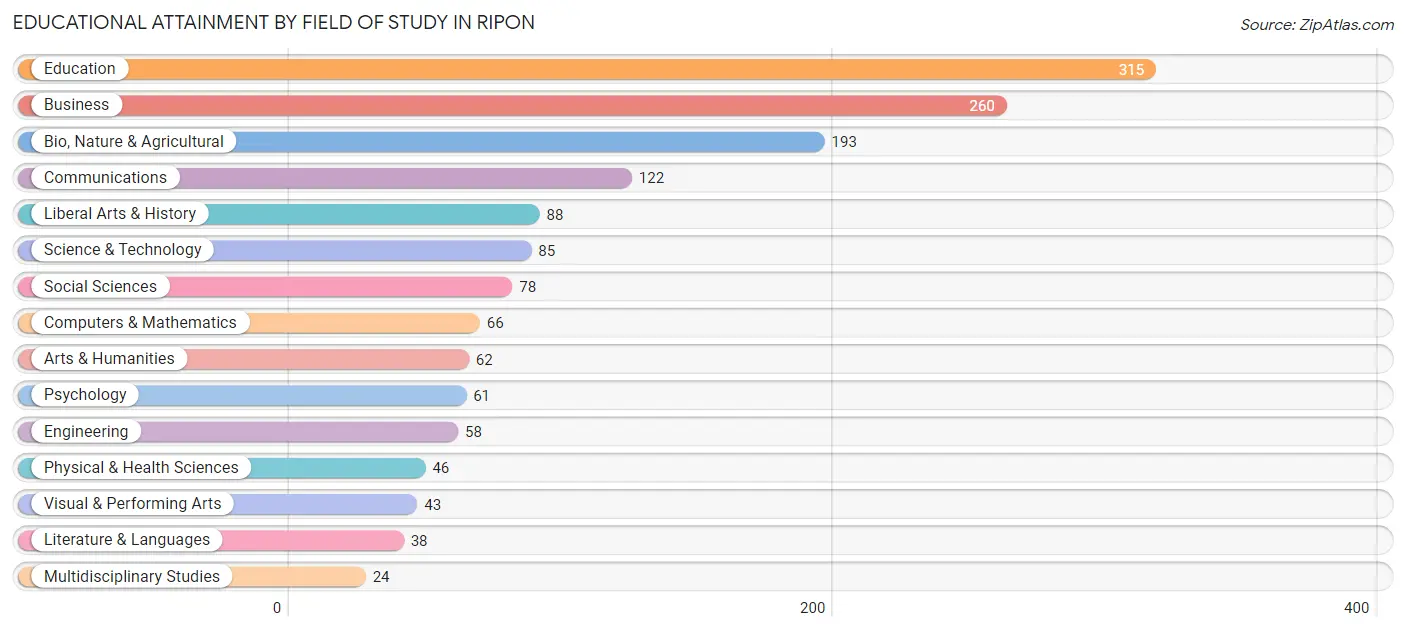
| Field of Study | # Graduates | % Graduates |
| Computers & Mathematics | 66 | 4.3% |
| Bio, Nature & Agricultural | 193 | 12.5% |
| Physical & Health Sciences | 46 | 3.0% |
| Psychology | 61 | 4.0% |
| Social Sciences | 78 | 5.1% |
| Engineering | 58 | 3.8% |
| Multidisciplinary Studies | 24 | 1.6% |
| Science & Technology | 85 | 5.5% |
| Business | 260 | 16.9% |
| Education | 315 | 20.5% |
| Literature & Languages | 38 | 2.5% |
| Liberal Arts & History | 88 | 5.7% |
| Visual & Performing Arts | 43 | 2.8% |
| Communications | 122 | 7.9% |
| Arts & Humanities | 62 | 4.0% |
| Total | 1,539 | 100.0% |
Transportation & Commute in Ripon
Vehicle Availability by Sex in Ripon
The most prevalent vehicle ownership categories in Ripon are males with 2 vehicles (698, accounting for 38.0%) and females with 2 vehicles (610, making up 45.4%).
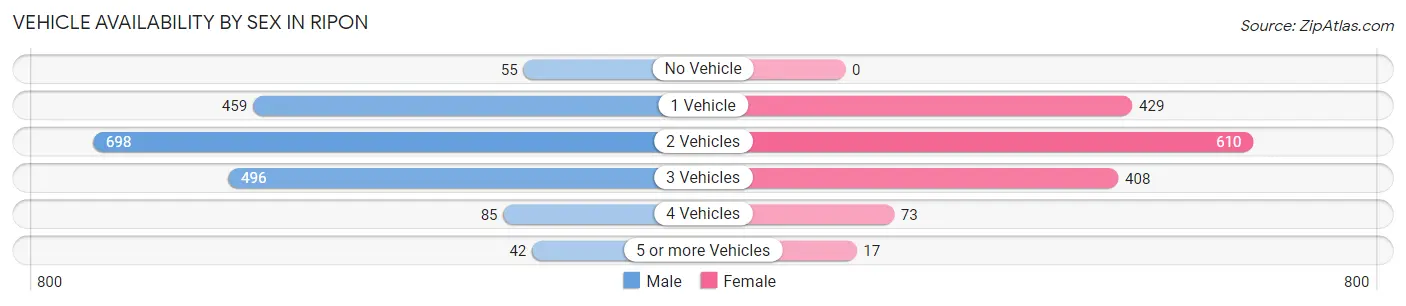
| Vehicles Available | Male | Female |
| No Vehicle | 55 (3.0%) | 0 (0.0%) |
| 1 Vehicle | 459 (25.0%) | 429 (27.9%) |
| 2 Vehicles | 698 (38.0%) | 610 (39.7%) |
| 3 Vehicles | 496 (27.0%) | 408 (26.6%) |
| 4 Vehicles | 85 (4.6%) | 73 (4.8%) |
| 5 or more Vehicles | 42 (2.3%) | 17 (1.1%) |
| Total | 1,835 (100.0%) | 1,537 (100.0%) |
Commute Time in Ripon
The most frequently occuring commute durations in Ripon are 5 to 9 minutes (1,016 commuters, 31.2%), 10 to 14 minutes (599 commuters, 18.4%), and less than 5 minutes (438 commuters, 13.5%).
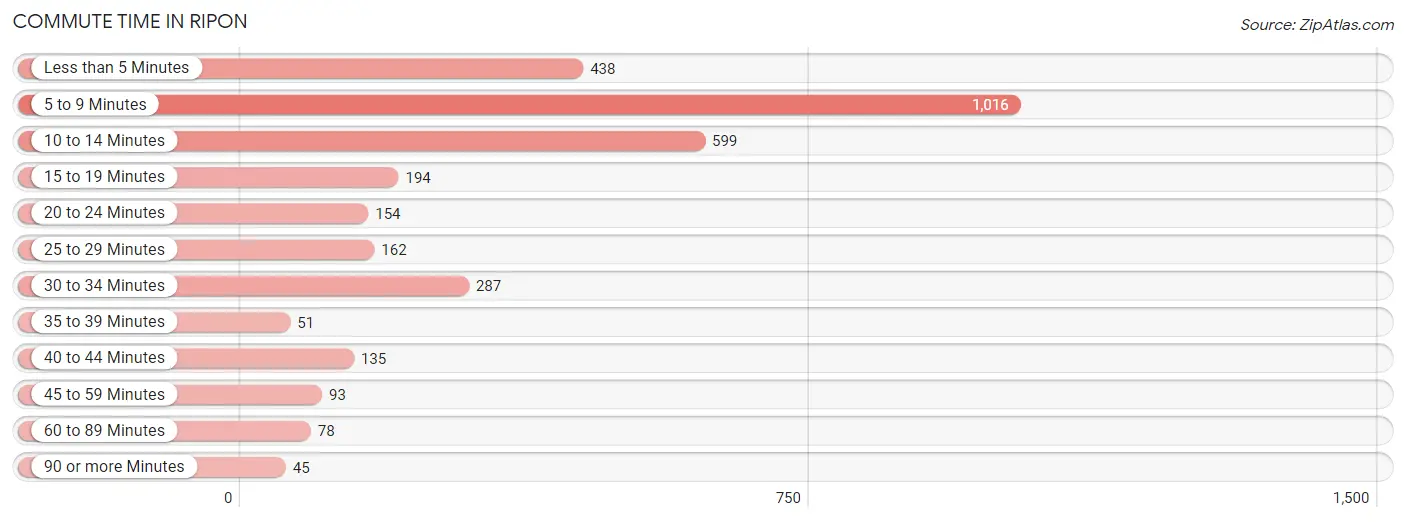
| Commute Time | # Commuters | % Commuters |
| Less than 5 Minutes | 438 | 13.5% |
| 5 to 9 Minutes | 1,016 | 31.2% |
| 10 to 14 Minutes | 599 | 18.4% |
| 15 to 19 Minutes | 194 | 6.0% |
| 20 to 24 Minutes | 154 | 4.7% |
| 25 to 29 Minutes | 162 | 5.0% |
| 30 to 34 Minutes | 287 | 8.8% |
| 35 to 39 Minutes | 51 | 1.6% |
| 40 to 44 Minutes | 135 | 4.2% |
| 45 to 59 Minutes | 93 | 2.9% |
| 60 to 89 Minutes | 78 | 2.4% |
| 90 or more Minutes | 45 | 1.4% |
Commute Time by Sex in Ripon
The most common commute times in Ripon are 5 to 9 minutes (573 commuters, 34.9%) for males and 5 to 9 minutes (443 commuters, 27.5%) for females.
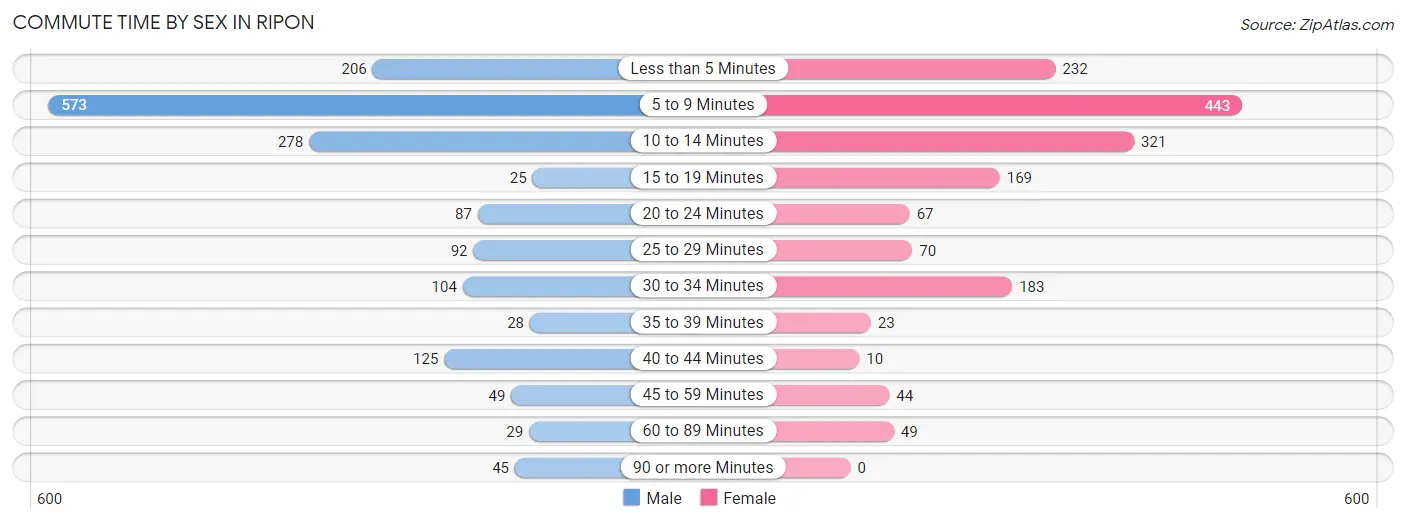
| Commute Time | Male | Female |
| Less than 5 Minutes | 206 (12.6%) | 232 (14.4%) |
| 5 to 9 Minutes | 573 (34.9%) | 443 (27.5%) |
| 10 to 14 Minutes | 278 (16.9%) | 321 (19.9%) |
| 15 to 19 Minutes | 25 (1.5%) | 169 (10.5%) |
| 20 to 24 Minutes | 87 (5.3%) | 67 (4.2%) |
| 25 to 29 Minutes | 92 (5.6%) | 70 (4.3%) |
| 30 to 34 Minutes | 104 (6.3%) | 183 (11.4%) |
| 35 to 39 Minutes | 28 (1.7%) | 23 (1.4%) |
| 40 to 44 Minutes | 125 (7.6%) | 10 (0.6%) |
| 45 to 59 Minutes | 49 (3.0%) | 44 (2.7%) |
| 60 to 89 Minutes | 29 (1.8%) | 49 (3.0%) |
| 90 or more Minutes | 45 (2.7%) | 0 (0.0%) |
Time of Departure to Work by Sex in Ripon
The most frequent times of departure to work in Ripon are 5:30 AM to 5:59 AM (255, 15.5%) for males and 12:00 PM to 3:59 PM (274, 17.0%) for females.
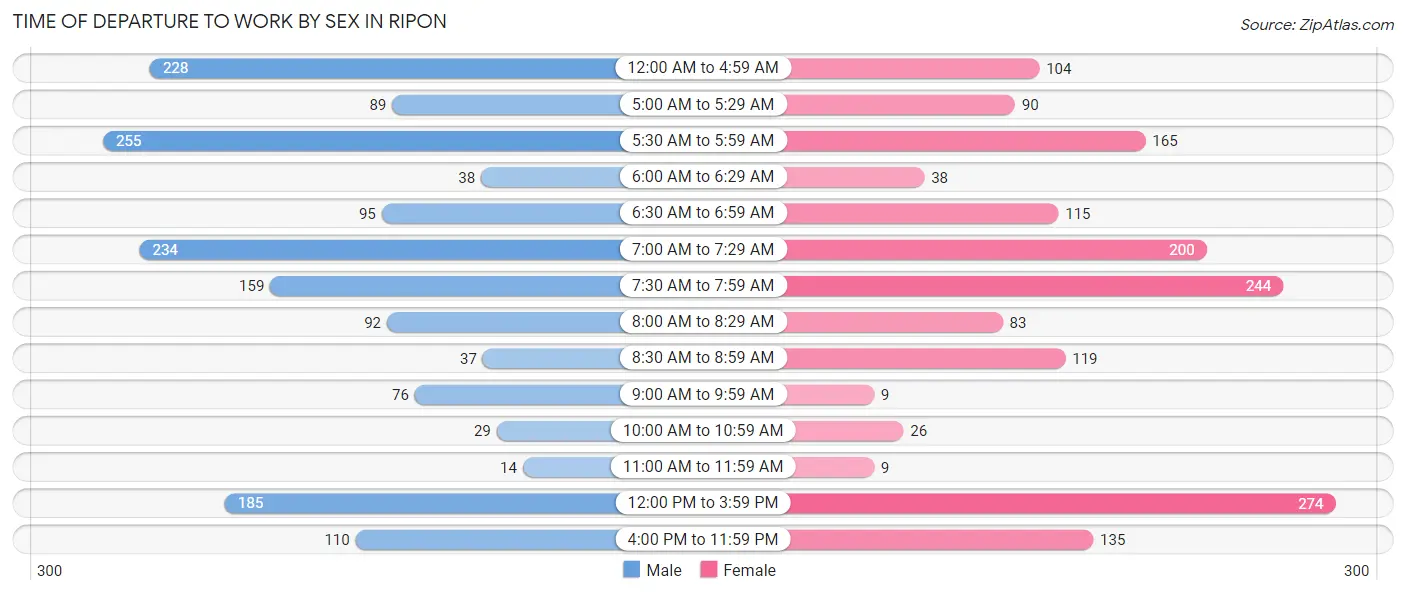
| Time of Departure | Male | Female |
| 12:00 AM to 4:59 AM | 228 (13.9%) | 104 (6.5%) |
| 5:00 AM to 5:29 AM | 89 (5.4%) | 90 (5.6%) |
| 5:30 AM to 5:59 AM | 255 (15.5%) | 165 (10.2%) |
| 6:00 AM to 6:29 AM | 38 (2.3%) | 38 (2.4%) |
| 6:30 AM to 6:59 AM | 95 (5.8%) | 115 (7.1%) |
| 7:00 AM to 7:29 AM | 234 (14.3%) | 200 (12.4%) |
| 7:30 AM to 7:59 AM | 159 (9.7%) | 244 (15.1%) |
| 8:00 AM to 8:29 AM | 92 (5.6%) | 83 (5.1%) |
| 8:30 AM to 8:59 AM | 37 (2.2%) | 119 (7.4%) |
| 9:00 AM to 9:59 AM | 76 (4.6%) | 9 (0.6%) |
| 10:00 AM to 10:59 AM | 29 (1.8%) | 26 (1.6%) |
| 11:00 AM to 11:59 AM | 14 (0.9%) | 9 (0.6%) |
| 12:00 PM to 3:59 PM | 185 (11.3%) | 274 (17.0%) |
| 4:00 PM to 11:59 PM | 110 (6.7%) | 135 (8.4%) |
| Total | 1,641 (100.0%) | 1,611 (100.0%) |
Housing Occupancy in Ripon
Occupancy by Ownership in Ripon
Of the total 3,221 dwellings in Ripon, owner-occupied units account for 2,027 (62.9%), while renter-occupied units make up 1,194 (37.1%).
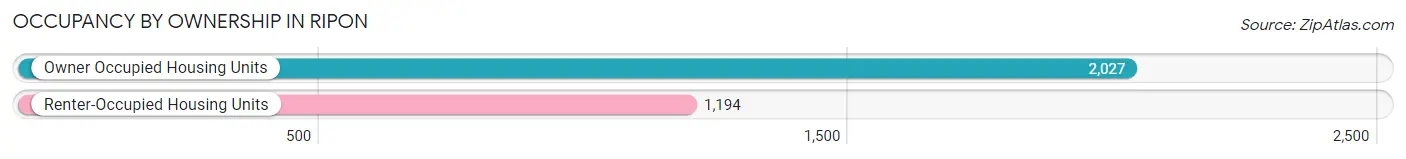
| Occupancy | # Housing Units | % Housing Units |
| Owner Occupied Housing Units | 2,027 | 62.9% |
| Renter-Occupied Housing Units | 1,194 | 37.1% |
| Total Occupied Housing Units | 3,221 | 100.0% |
Occupancy by Household Size in Ripon
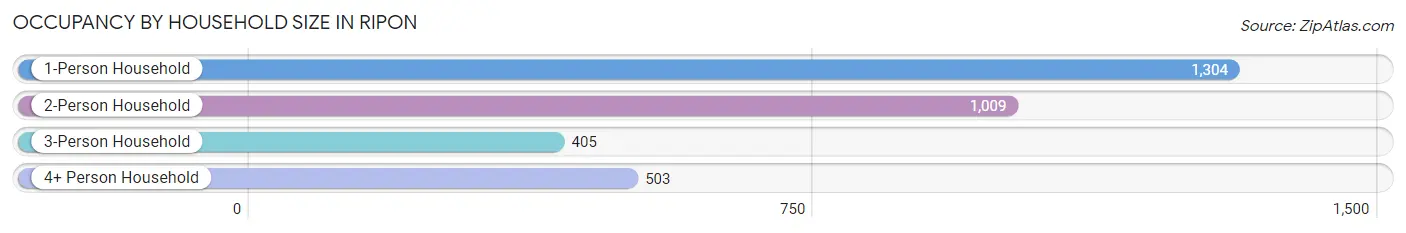
| Household Size | # Housing Units | % Housing Units |
| 1-Person Household | 1,304 | 40.5% |
| 2-Person Household | 1,009 | 31.3% |
| 3-Person Household | 405 | 12.6% |
| 4+ Person Household | 503 | 15.6% |
| Total Housing Units | 3,221 | 100.0% |
Occupancy by Ownership by Household Size in Ripon
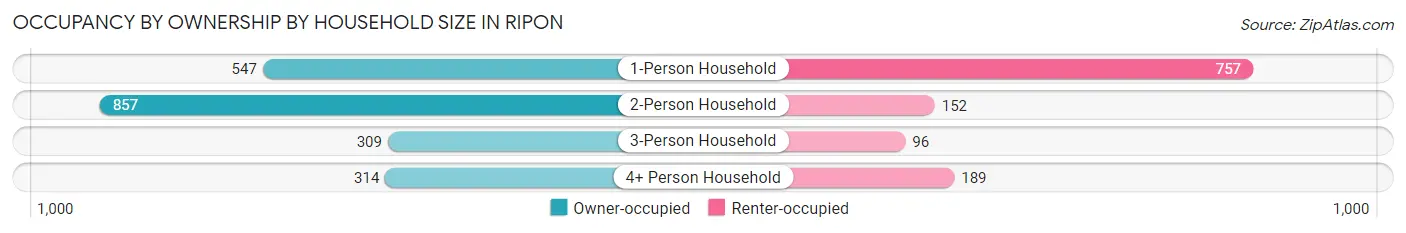
| Household Size | Owner-occupied | Renter-occupied |
| 1-Person Household | 547 (41.9%) | 757 (58.1%) |
| 2-Person Household | 857 (84.9%) | 152 (15.1%) |
| 3-Person Household | 309 (76.3%) | 96 (23.7%) |
| 4+ Person Household | 314 (62.4%) | 189 (37.6%) |
| Total Housing Units | 2,027 (62.9%) | 1,194 (37.1%) |
Occupancy by Educational Attainment in Ripon
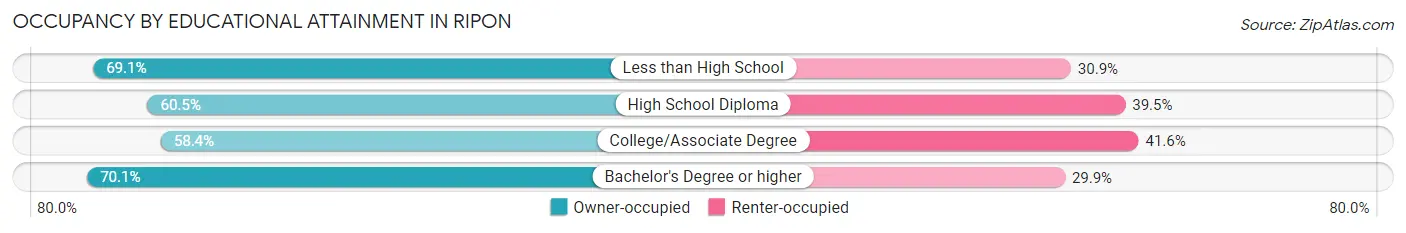
| Household Size | Owner-occupied | Renter-occupied |
| Less than High School | 132 (69.1%) | 59 (30.9%) |
| High School Diploma | 784 (60.5%) | 512 (39.5%) |
| College/Associate Degree | 519 (58.4%) | 370 (41.6%) |
| Bachelor's Degree or higher | 592 (70.1%) | 253 (29.9%) |
Occupancy by Age of Householder in Ripon
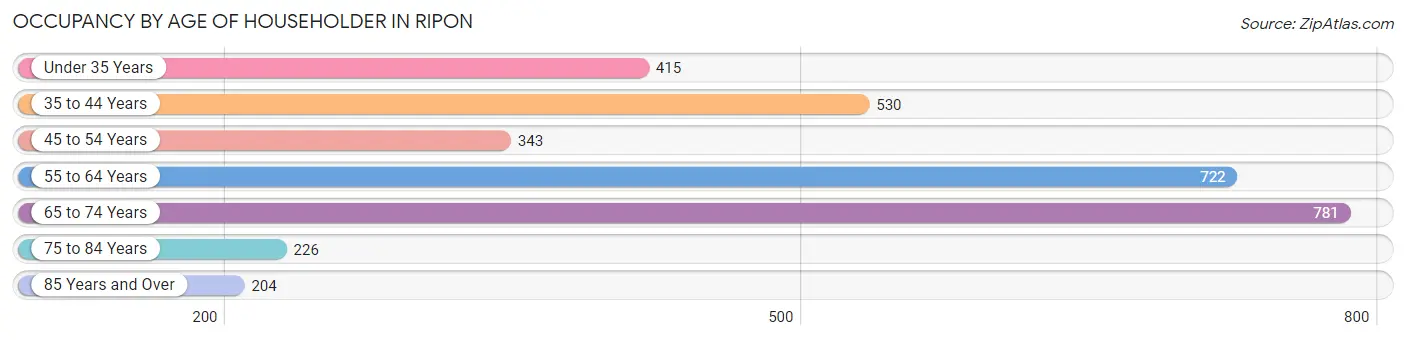
| Age Bracket | # Households | % Households |
| Under 35 Years | 415 | 12.9% |
| 35 to 44 Years | 530 | 16.5% |
| 45 to 54 Years | 343 | 10.6% |
| 55 to 64 Years | 722 | 22.4% |
| 65 to 74 Years | 781 | 24.2% |
| 75 to 84 Years | 226 | 7.0% |
| 85 Years and Over | 204 | 6.3% |
| Total | 3,221 | 100.0% |
Housing Finances in Ripon
Median Income by Occupancy in Ripon
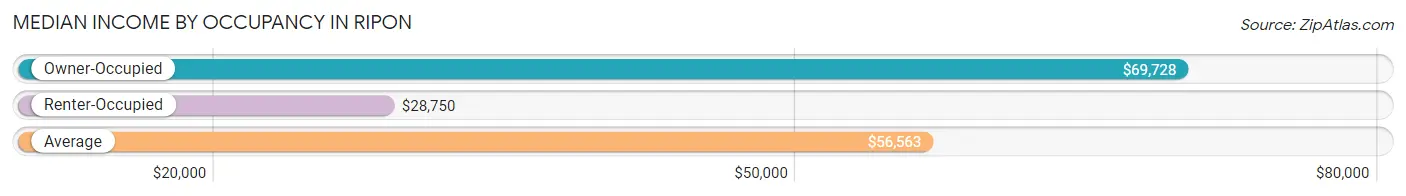
| Occupancy Type | # Households | Median Income |
| Owner-Occupied | 2,027 (62.9%) | $69,728 |
| Renter-Occupied | 1,194 (37.1%) | $28,750 |
| Average | 3,221 (100.0%) | $56,563 |
Occupancy by Householder Income Bracket in Ripon
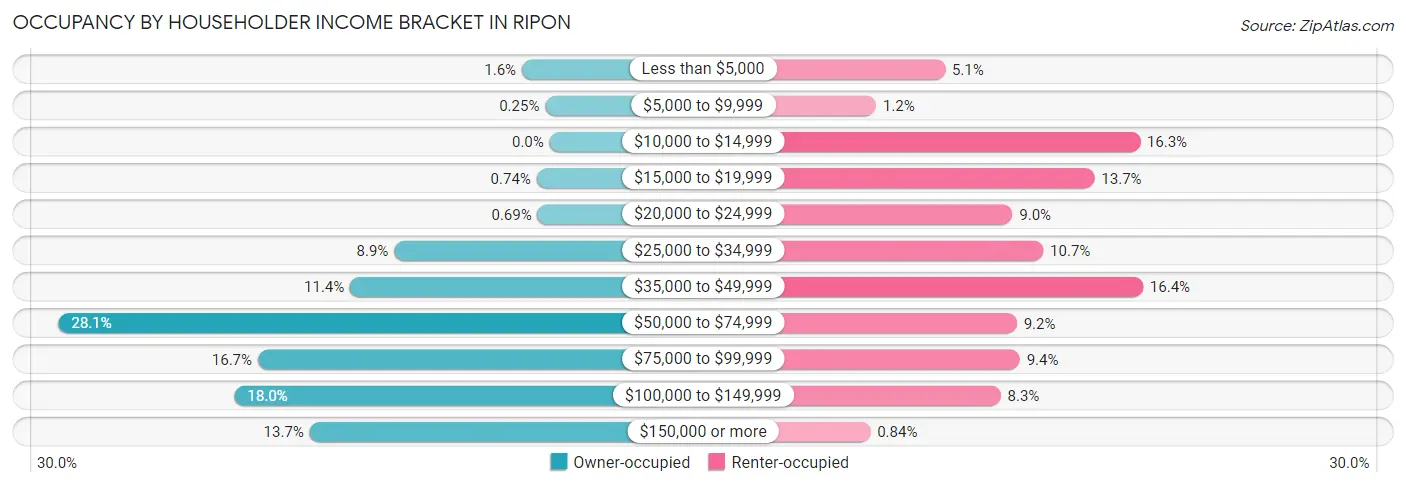
| Income Bracket | Owner-occupied | Renter-occupied |
| Less than $5,000 | 32 (1.6%) | 61 (5.1%) |
| $5,000 to $9,999 | 5 (0.3%) | 14 (1.2%) |
| $10,000 to $14,999 | 0 (0.0%) | 194 (16.3%) |
| $15,000 to $19,999 | 15 (0.7%) | 163 (13.7%) |
| $20,000 to $24,999 | 14 (0.7%) | 107 (9.0%) |
| $25,000 to $34,999 | 180 (8.9%) | 128 (10.7%) |
| $35,000 to $49,999 | 231 (11.4%) | 196 (16.4%) |
| $50,000 to $74,999 | 569 (28.1%) | 110 (9.2%) |
| $75,000 to $99,999 | 338 (16.7%) | 112 (9.4%) |
| $100,000 to $149,999 | 365 (18.0%) | 99 (8.3%) |
| $150,000 or more | 278 (13.7%) | 10 (0.8%) |
| Total | 2,027 (100.0%) | 1,194 (100.0%) |
Monthly Housing Cost Tiers in Ripon
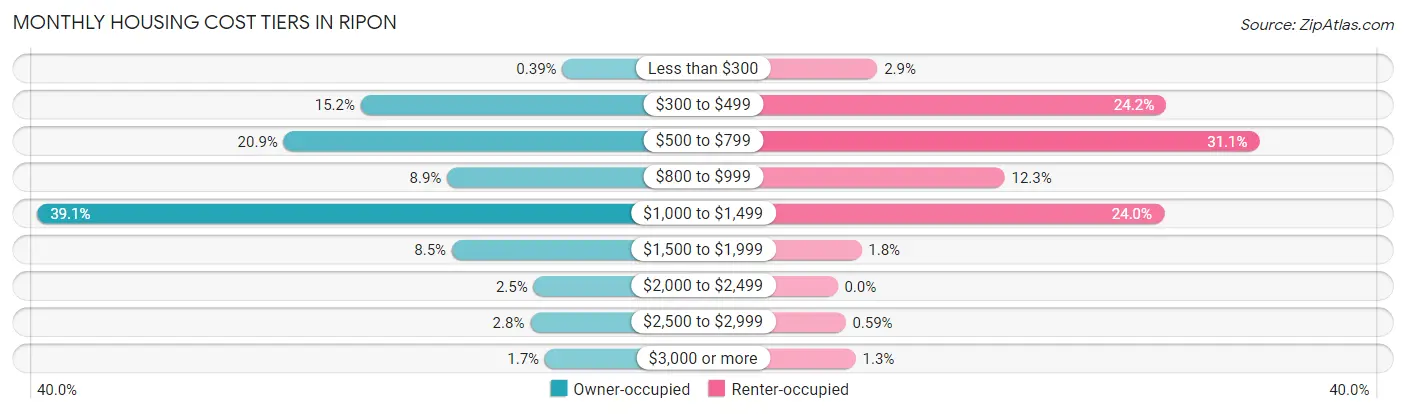
| Monthly Cost | Owner-occupied | Renter-occupied |
| Less than $300 | 8 (0.4%) | 35 (2.9%) |
| $300 to $499 | 309 (15.2%) | 289 (24.2%) |
| $500 to $799 | 424 (20.9%) | 371 (31.1%) |
| $800 to $999 | 180 (8.9%) | 147 (12.3%) |
| $1,000 to $1,499 | 792 (39.1%) | 287 (24.0%) |
| $1,500 to $1,999 | 173 (8.5%) | 21 (1.8%) |
| $2,000 to $2,499 | 51 (2.5%) | 0 (0.0%) |
| $2,500 to $2,999 | 56 (2.8%) | 7 (0.6%) |
| $3,000 or more | 34 (1.7%) | 16 (1.3%) |
| Total | 2,027 (100.0%) | 1,194 (100.0%) |
Physical Housing Characteristics in Ripon
Housing Structures in Ripon
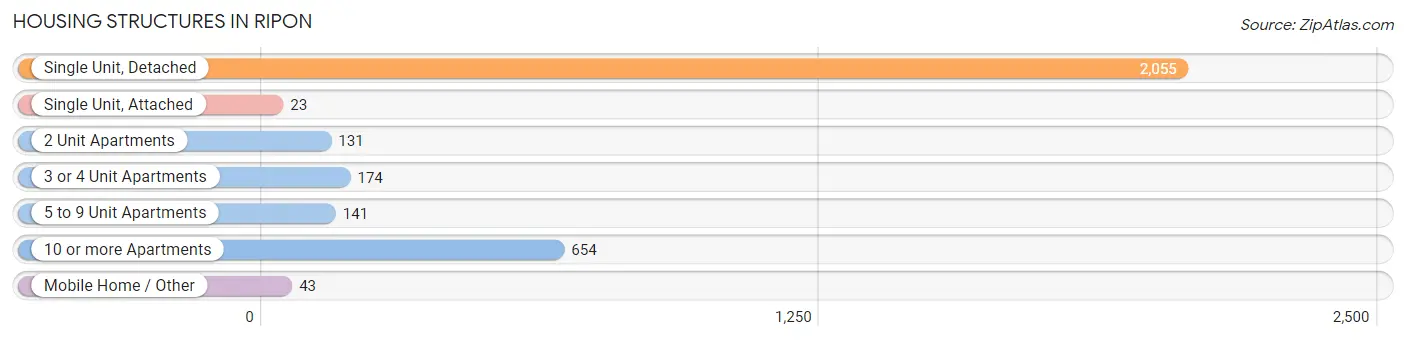
| Structure Type | # Housing Units | % Housing Units |
| Single Unit, Detached | 2,055 | 63.8% |
| Single Unit, Attached | 23 | 0.7% |
| 2 Unit Apartments | 131 | 4.1% |
| 3 or 4 Unit Apartments | 174 | 5.4% |
| 5 to 9 Unit Apartments | 141 | 4.4% |
| 10 or more Apartments | 654 | 20.3% |
| Mobile Home / Other | 43 | 1.3% |
| Total | 3,221 | 100.0% |
Housing Structures by Occupancy in Ripon
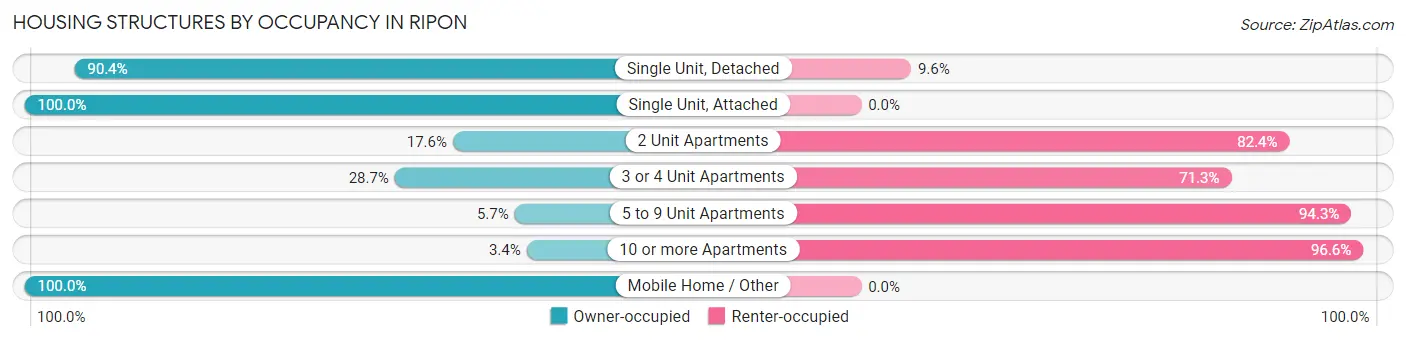
| Structure Type | Owner-occupied | Renter-occupied |
| Single Unit, Detached | 1,858 (90.4%) | 197 (9.6%) |
| Single Unit, Attached | 23 (100.0%) | 0 (0.0%) |
| 2 Unit Apartments | 23 (17.6%) | 108 (82.4%) |
| 3 or 4 Unit Apartments | 50 (28.7%) | 124 (71.3%) |
| 5 to 9 Unit Apartments | 8 (5.7%) | 133 (94.3%) |
| 10 or more Apartments | 22 (3.4%) | 632 (96.6%) |
| Mobile Home / Other | 43 (100.0%) | 0 (0.0%) |
| Total | 2,027 (62.9%) | 1,194 (37.1%) |
Housing Structures by Number of Rooms in Ripon
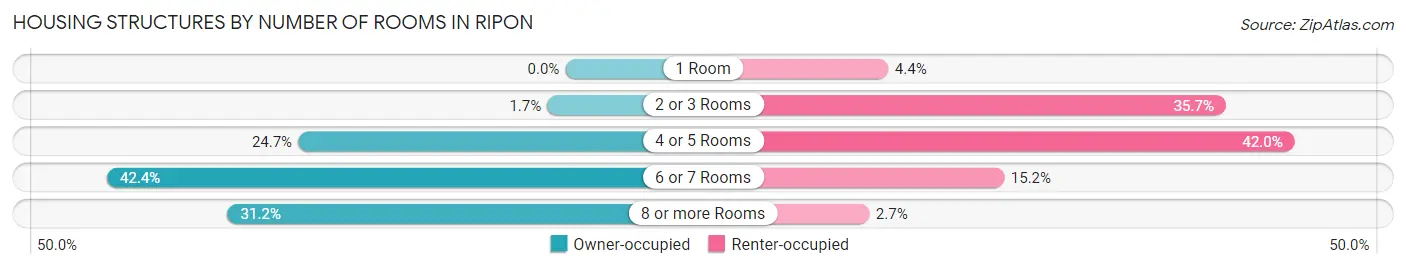
| Number of Rooms | Owner-occupied | Renter-occupied |
| 1 Room | 0 (0.0%) | 53 (4.4%) |
| 2 or 3 Rooms | 34 (1.7%) | 426 (35.7%) |
| 4 or 5 Rooms | 501 (24.7%) | 502 (42.0%) |
| 6 or 7 Rooms | 859 (42.4%) | 181 (15.2%) |
| 8 or more Rooms | 633 (31.2%) | 32 (2.7%) |
| Total | 2,027 (100.0%) | 1,194 (100.0%) |
Housing Structure by Heating Type in Ripon
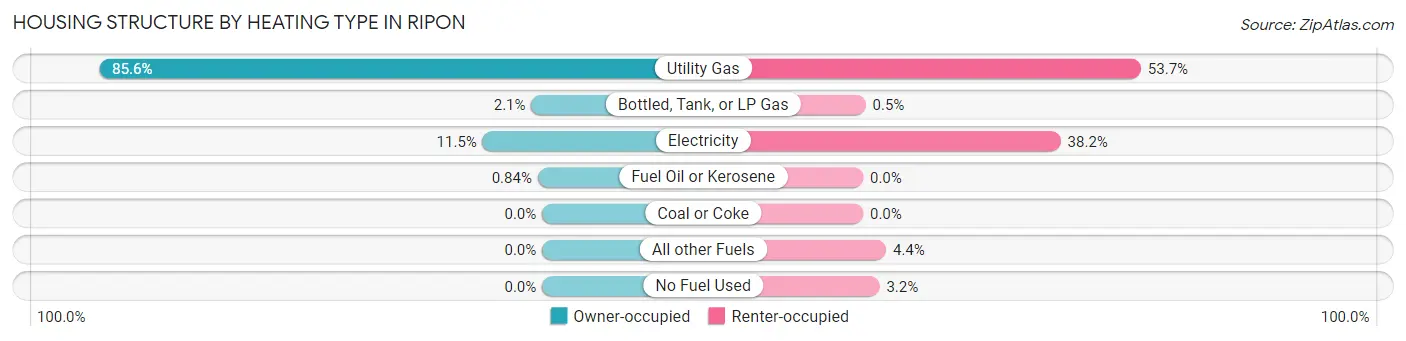
| Heating Type | Owner-occupied | Renter-occupied |
| Utility Gas | 1,735 (85.6%) | 641 (53.7%) |
| Bottled, Tank, or LP Gas | 42 (2.1%) | 6 (0.5%) |
| Electricity | 233 (11.5%) | 456 (38.2%) |
| Fuel Oil or Kerosene | 17 (0.8%) | 0 (0.0%) |
| Coal or Coke | 0 (0.0%) | 0 (0.0%) |
| All other Fuels | 0 (0.0%) | 53 (4.4%) |
| No Fuel Used | 0 (0.0%) | 38 (3.2%) |
| Total | 2,027 (100.0%) | 1,194 (100.0%) |
Household Vehicle Usage in Ripon
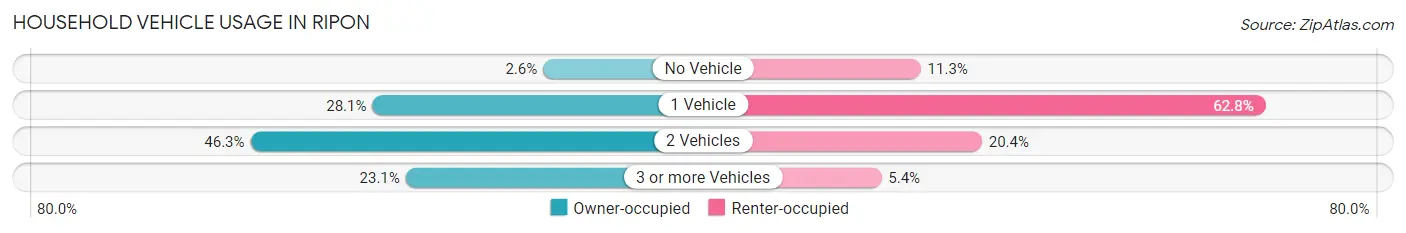
| Vehicles per Household | Owner-occupied | Renter-occupied |
| No Vehicle | 52 (2.6%) | 135 (11.3%) |
| 1 Vehicle | 569 (28.1%) | 750 (62.8%) |
| 2 Vehicles | 938 (46.3%) | 244 (20.4%) |
| 3 or more Vehicles | 468 (23.1%) | 65 (5.4%) |
| Total | 2,027 (100.0%) | 1,194 (100.0%) |
Real Estate & Mortgages in Ripon
Real Estate and Mortgage Overview in Ripon
| Characteristic | Without Mortgage | With Mortgage |
| Housing Units | 645 | 1,382 |
| Median Property Value | $147,200 | $156,100 |
| Median Household Income | $54,183 | $208 |
| Monthly Housing Costs | $513 | $34 |
| Real Estate Taxes | $2,734 | $5 |
Property Value by Mortgage Status in Ripon
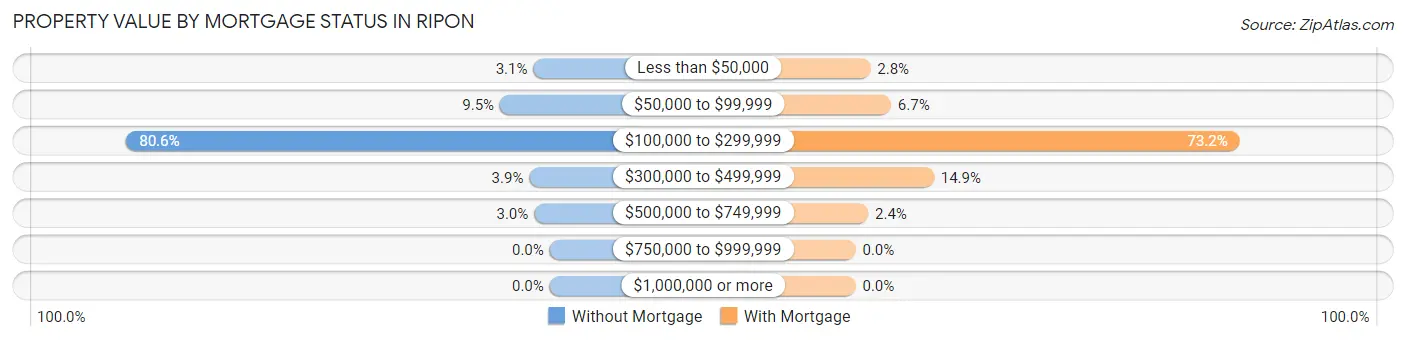
| Property Value | Without Mortgage | With Mortgage |
| Less than $50,000 | 20 (3.1%) | 39 (2.8%) |
| $50,000 to $99,999 | 61 (9.5%) | 93 (6.7%) |
| $100,000 to $299,999 | 520 (80.6%) | 1,011 (73.2%) |
| $300,000 to $499,999 | 25 (3.9%) | 206 (14.9%) |
| $500,000 to $749,999 | 19 (2.9%) | 33 (2.4%) |
| $750,000 to $999,999 | 0 (0.0%) | 0 (0.0%) |
| $1,000,000 or more | 0 (0.0%) | 0 (0.0%) |
| Total | 645 (100.0%) | 1,382 (100.0%) |
Household Income by Mortgage Status in Ripon
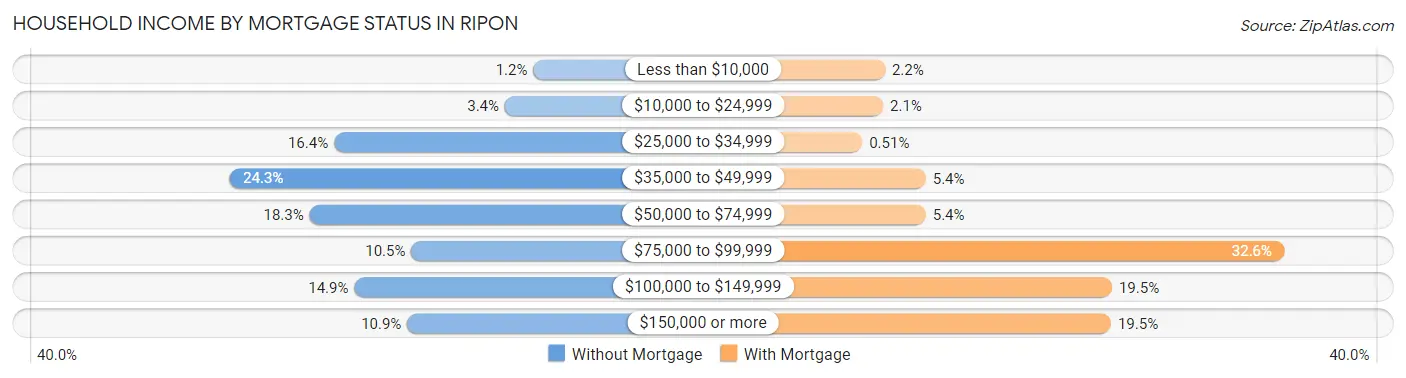
| Household Income | Without Mortgage | With Mortgage |
| Less than $10,000 | 8 (1.2%) | 31 (2.2%) |
| $10,000 to $24,999 | 22 (3.4%) | 29 (2.1%) |
| $25,000 to $34,999 | 106 (16.4%) | 7 (0.5%) |
| $35,000 to $49,999 | 157 (24.3%) | 74 (5.3%) |
| $50,000 to $74,999 | 118 (18.3%) | 74 (5.3%) |
| $75,000 to $99,999 | 68 (10.5%) | 451 (32.6%) |
| $100,000 to $149,999 | 96 (14.9%) | 270 (19.5%) |
| $150,000 or more | 70 (10.8%) | 269 (19.5%) |
| Total | 645 (100.0%) | 1,382 (100.0%) |
Property Value to Household Income Ratio in Ripon
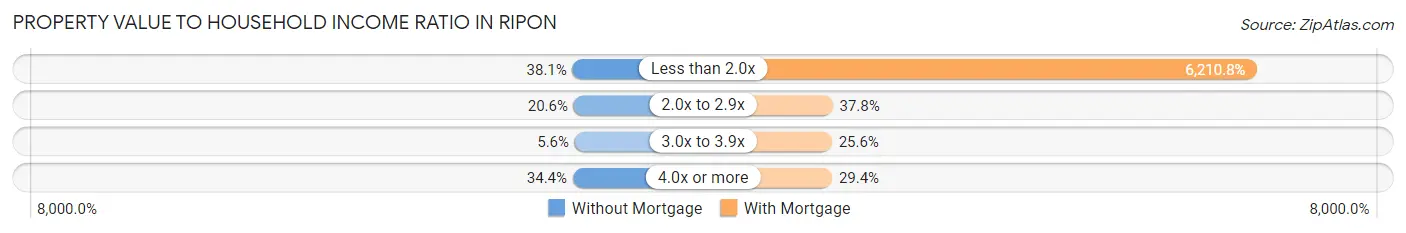
| Value-to-Income Ratio | Without Mortgage | With Mortgage |
| Less than 2.0x | 246 (38.1%) | 85,833 (6,210.8%) |
| 2.0x to 2.9x | 133 (20.6%) | 522 (37.8%) |
| 3.0x to 3.9x | 36 (5.6%) | 354 (25.6%) |
| 4.0x or more | 222 (34.4%) | 406 (29.4%) |
| Total | 645 (100.0%) | 1,382 (100.0%) |
Real Estate Taxes by Mortgage Status in Ripon
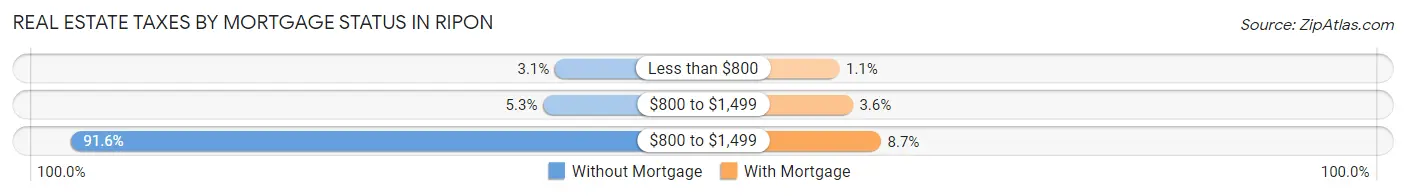
| Property Taxes | Without Mortgage | With Mortgage |
| Less than $800 | 20 (3.1%) | 15 (1.1%) |
| $800 to $1,499 | 34 (5.3%) | 49 (3.5%) |
| $800 to $1,499 | 591 (91.6%) | 120 (8.7%) |
| Total | 645 (100.0%) | 1,382 (100.0%) |
Health & Disability in Ripon
Health Insurance Coverage by Age in Ripon
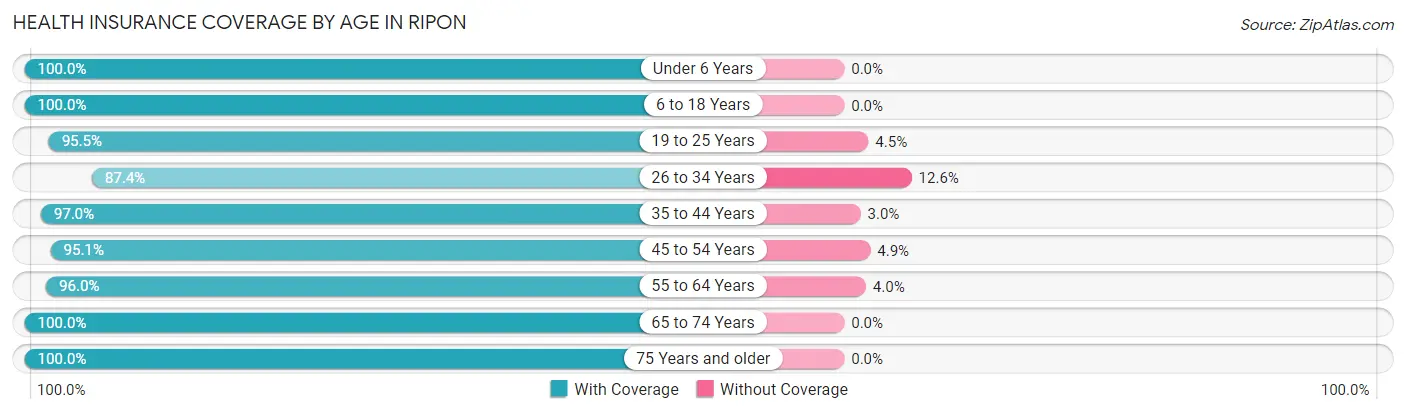
| Age Bracket | With Coverage | Without Coverage |
| Under 6 Years | 350 (100.0%) | 0 (0.0%) |
| 6 to 18 Years | 1,334 (100.0%) | 0 (0.0%) |
| 19 to 25 Years | 954 (95.5%) | 45 (4.5%) |
| 26 to 34 Years | 522 (87.4%) | 75 (12.6%) |
| 35 to 44 Years | 990 (97.0%) | 31 (3.0%) |
| 45 to 54 Years | 646 (95.1%) | 33 (4.9%) |
| 55 to 64 Years | 1,073 (96.0%) | 45 (4.0%) |
| 65 to 74 Years | 1,040 (100.0%) | 0 (0.0%) |
| 75 Years and older | 617 (100.0%) | 0 (0.0%) |
| Total | 7,526 (97.1%) | 229 (2.9%) |
Health Insurance Coverage by Citizenship Status in Ripon
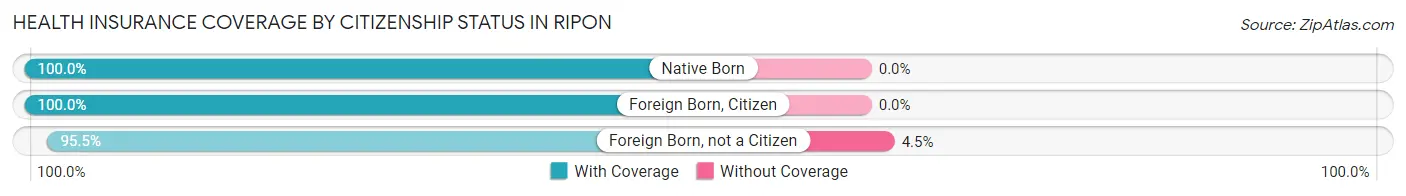
| Citizenship Status | With Coverage | Without Coverage |
| Native Born | 350 (100.0%) | 0 (0.0%) |
| Foreign Born, Citizen | 1,334 (100.0%) | 0 (0.0%) |
| Foreign Born, not a Citizen | 954 (95.5%) | 45 (4.5%) |
Health Insurance Coverage by Household Income in Ripon
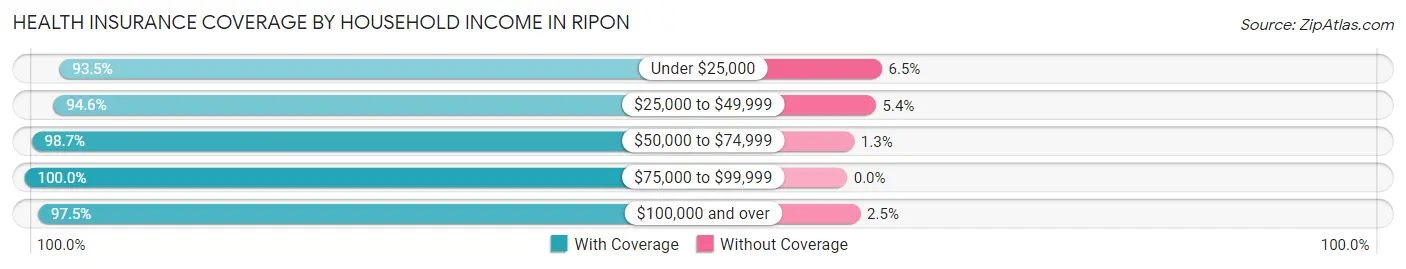
| Household Income | With Coverage | Without Coverage |
| Under $25,000 | 817 (93.5%) | 57 (6.5%) |
| $25,000 to $49,999 | 1,192 (94.6%) | 68 (5.4%) |
| $50,000 to $74,999 | 1,184 (98.7%) | 16 (1.3%) |
| $75,000 to $99,999 | 1,251 (100.0%) | 0 (0.0%) |
| $100,000 and over | 2,340 (97.5%) | 60 (2.5%) |
Public vs Private Health Insurance Coverage by Age in Ripon
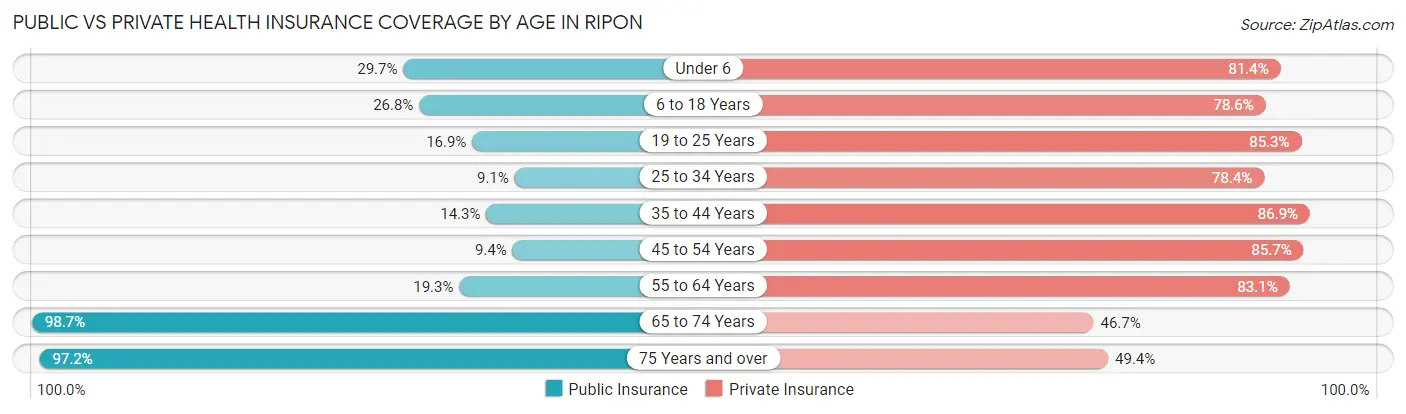
| Age Bracket | Public Insurance | Private Insurance |
| Under 6 | 104 (29.7%) | 285 (81.4%) |
| 6 to 18 Years | 357 (26.8%) | 1,049 (78.6%) |
| 19 to 25 Years | 169 (16.9%) | 852 (85.3%) |
| 25 to 34 Years | 54 (9.0%) | 468 (78.4%) |
| 35 to 44 Years | 146 (14.3%) | 887 (86.9%) |
| 45 to 54 Years | 64 (9.4%) | 582 (85.7%) |
| 55 to 64 Years | 216 (19.3%) | 929 (83.1%) |
| 65 to 74 Years | 1,026 (98.7%) | 486 (46.7%) |
| 75 Years and over | 600 (97.2%) | 305 (49.4%) |
| Total | 2,736 (35.3%) | 5,843 (75.3%) |
Disability Status by Sex by Age in Ripon
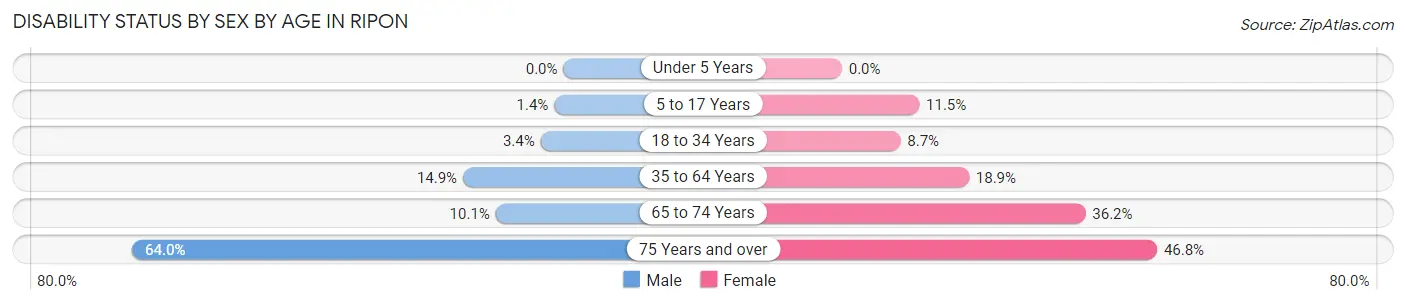
| Age Bracket | Male | Female |
| Under 5 Years | 0 (0.0%) | 0 (0.0%) |
| 5 to 17 Years | 8 (1.4%) | 73 (11.5%) |
| 18 to 34 Years | 33 (3.4%) | 67 (8.7%) |
| 35 to 64 Years | 195 (14.9%) | 285 (18.9%) |
| 65 to 74 Years | 42 (10.1%) | 225 (36.2%) |
| 75 Years and over | 105 (64.0%) | 212 (46.8%) |
Disability Class by Sex by Age in Ripon
Disability Class: Hearing Difficulty
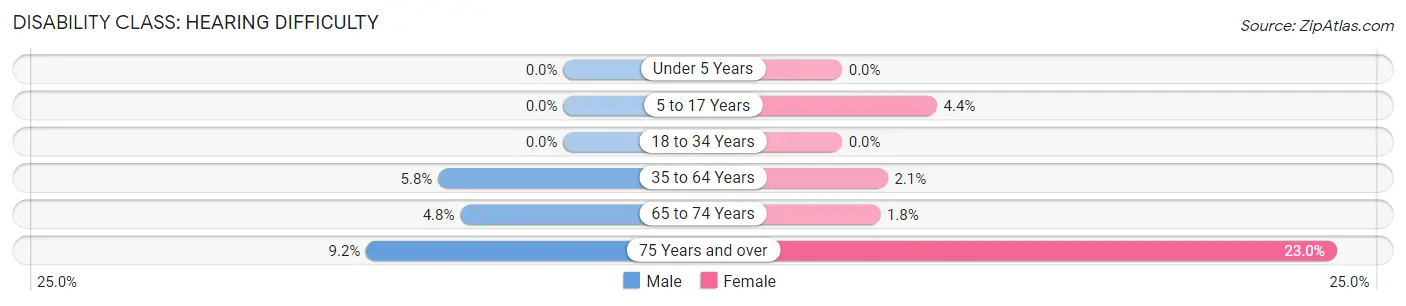
| Age Bracket | Male | Female |
| Under 5 Years | 0 (0.0%) | 0 (0.0%) |
| 5 to 17 Years | 0 (0.0%) | 28 (4.4%) |
| 18 to 34 Years | 0 (0.0%) | 0 (0.0%) |
| 35 to 64 Years | 76 (5.8%) | 32 (2.1%) |
| 65 to 74 Years | 20 (4.8%) | 11 (1.8%) |
| 75 Years and over | 15 (9.1%) | 104 (23.0%) |
Disability Class: Vision Difficulty
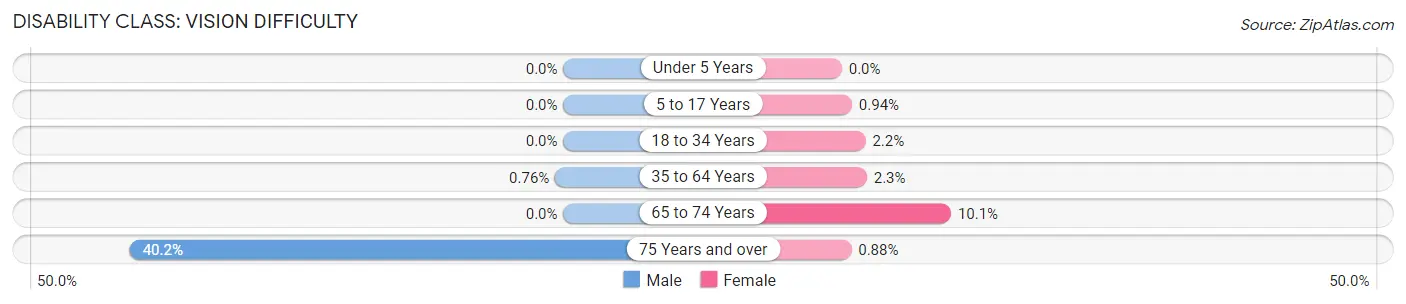
| Age Bracket | Male | Female |
| Under 5 Years | 0 (0.0%) | 0 (0.0%) |
| 5 to 17 Years | 0 (0.0%) | 6 (0.9%) |
| 18 to 34 Years | 0 (0.0%) | 17 (2.2%) |
| 35 to 64 Years | 10 (0.8%) | 35 (2.3%) |
| 65 to 74 Years | 0 (0.0%) | 63 (10.1%) |
| 75 Years and over | 66 (40.2%) | 4 (0.9%) |
Disability Class: Cognitive Difficulty
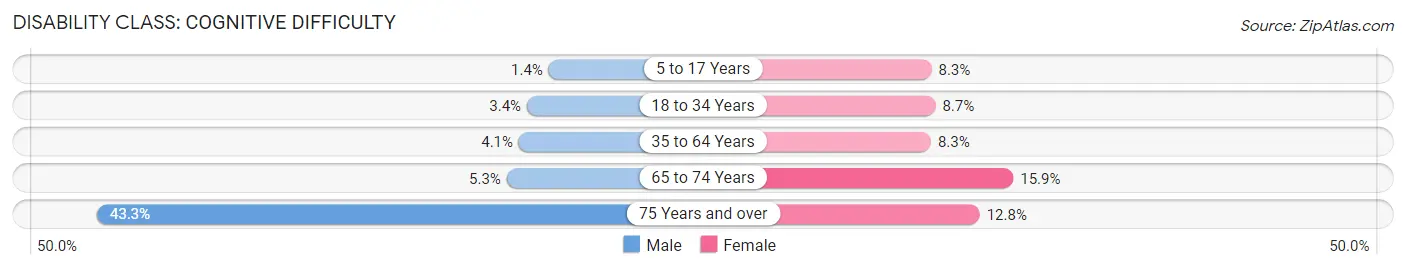
| Age Bracket | Male | Female |
| 5 to 17 Years | 8 (1.4%) | 53 (8.3%) |
| 18 to 34 Years | 33 (3.4%) | 67 (8.7%) |
| 35 to 64 Years | 54 (4.1%) | 125 (8.3%) |
| 65 to 74 Years | 22 (5.3%) | 99 (15.9%) |
| 75 Years and over | 71 (43.3%) | 58 (12.8%) |
Disability Class: Ambulatory Difficulty
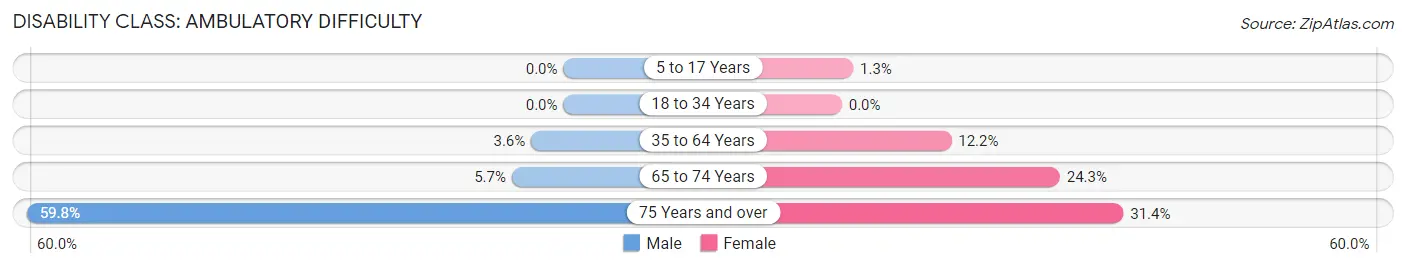
| Age Bracket | Male | Female |
| 5 to 17 Years | 0 (0.0%) | 8 (1.3%) |
| 18 to 34 Years | 0 (0.0%) | 0 (0.0%) |
| 35 to 64 Years | 47 (3.6%) | 184 (12.2%) |
| 65 to 74 Years | 24 (5.7%) | 151 (24.3%) |
| 75 Years and over | 98 (59.8%) | 142 (31.4%) |
Disability Class: Self-Care Difficulty
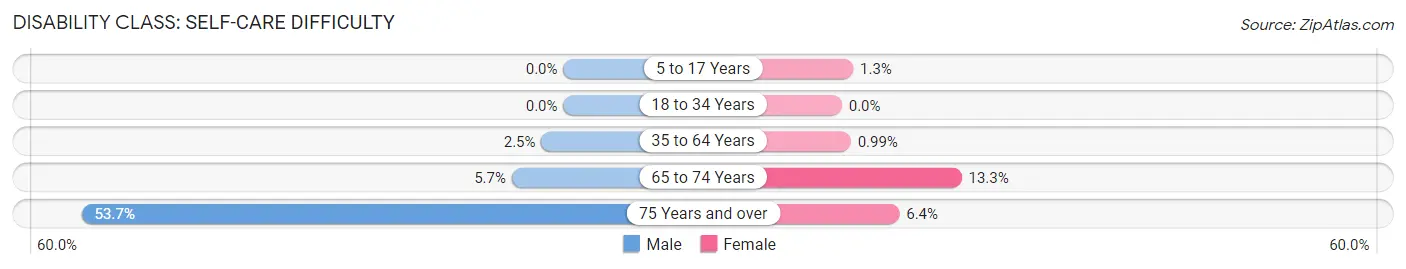
| Age Bracket | Male | Female |
| 5 to 17 Years | 0 (0.0%) | 8 (1.3%) |
| 18 to 34 Years | 0 (0.0%) | 0 (0.0%) |
| 35 to 64 Years | 32 (2.5%) | 15 (1.0%) |
| 65 to 74 Years | 24 (5.7%) | 83 (13.3%) |
| 75 Years and over | 88 (53.7%) | 29 (6.4%) |
Technology Access in Ripon
Computing Device Access in Ripon
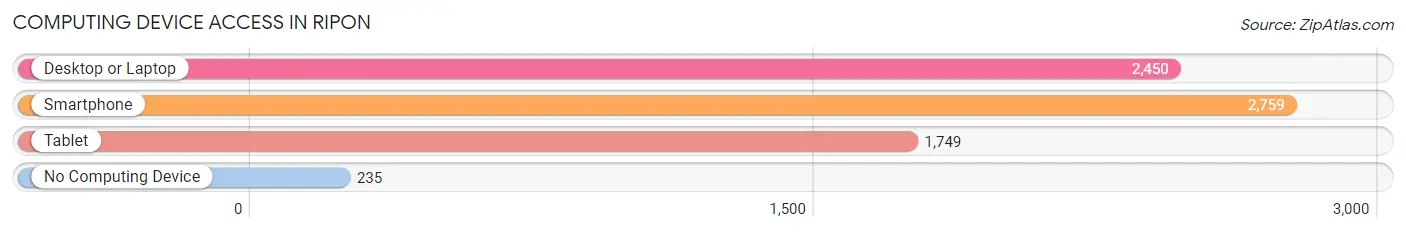
| Device Type | # Households | % Households |
| Desktop or Laptop | 2,450 | 76.1% |
| Smartphone | 2,759 | 85.7% |
| Tablet | 1,749 | 54.3% |
| No Computing Device | 235 | 7.3% |
| Total | 3,221 | 100.0% |
Internet Access in Ripon
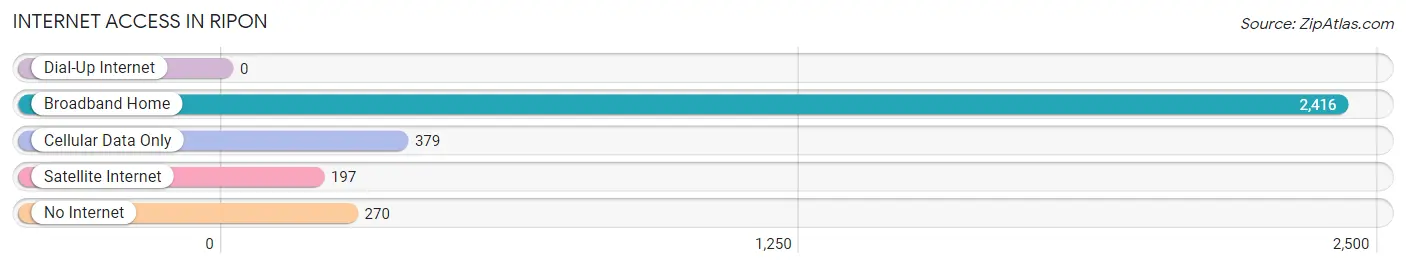
| Internet Type | # Households | % Households |
| Dial-Up Internet | 0 | 0.0% |
| Broadband Home | 2,416 | 75.0% |
| Cellular Data Only | 379 | 11.8% |
| Satellite Internet | 197 | 6.1% |
| No Internet | 270 | 8.4% |
| Total | 3,221 | 100.0% |
Ripon Summary
Ripon, Wisconsin is a small city located in Fond du Lac County, Wisconsin. It is situated on the Fox River, about 30 miles northeast of Madison. The city has a population of 7,731 as of the 2020 census, making it the smallest city in the state.
History
Ripon was founded in 1849 by Alvan Earle, a New York native who had moved to Wisconsin in 1844. Earle purchased a large tract of land along the Fox River and named the settlement after the city of Ripon, England. The city was incorporated in 1853 and quickly became a center of commerce and industry. The first industry in the city was a woolen mill, which was established in 1854. The mill was followed by a paper mill, a sawmill, and a grist mill.
In the late 19th century, Ripon became a center of the temperance movement. The city was the birthplace of the Republican Party, which was founded in 1854 at a meeting held in a local schoolhouse. The city was also home to the first kindergarten in the United States, which was established in 1856.
Geography
Ripon is located in the Fox River Valley, about 30 miles northeast of Madison. The city is situated on the Fox River, which flows through the city from north to south. The city is surrounded by rolling hills and farmland. The city is located in the Central Sands region of Wisconsin, which is characterized by sandy soils and a humid continental climate.
Economy
Ripon’s economy is largely based on agriculture and manufacturing. The city is home to several large manufacturing companies, including a paper mill, a cheese factory, and a plastics factory. The city is also home to several small businesses, including restaurants, retail stores, and service providers.
Demographics
As of the 2020 census, the population of Ripon was 7,731. The city has a median age of 38.7 years, and the median household income is $50,945. The city is predominantly white, with 87.3% of the population identifying as white. The city also has a small Hispanic population, with 5.3% of the population identifying as Hispanic or Latino.
Conclusion
Ripon, Wisconsin is a small city located in Fond du Lac County, Wisconsin. It is situated on the Fox River, about 30 miles northeast of Madison. The city has a population of 7,731 as of the 2020 census, making it the smallest city in the state. The city was founded in 1849 and has a long history of industry and commerce. The city’s economy is largely based on agriculture and manufacturing, and the city is home to several large companies. The city is predominantly white, with 87.3% of the population identifying as white. The city also has a small Hispanic population, with 5.3% of the population identifying as Hispanic or Latino.
Common Questions
What is Per Capita Income in Ripon?
Per Capita income in Ripon is $32,587.
What is the Median Family Income in Ripon?
Median Family Income in Ripon is $85,859.
What is the Median Household income in Ripon?
Median Household Income in Ripon is $56,563.
What is Income or Wage Gap in Ripon?
Income or Wage Gap in Ripon is 50.5%.
Women in Ripon earn 49.5 cents for every dollar earned by a man.
What is Family Income Deficit in Ripon?
Family Income Deficit in Ripon is $15,372.
Families that are below poverty line in Ripon earn $15,372 less on average than the poverty threshold level.
What is Inequality or Gini Index in Ripon?
Inequality or Gini Index in Ripon is 0.44.
What is the Total Population of Ripon?
Total Population of Ripon is 7,823.
What is the Total Male Population of Ripon?
Total Male Population of Ripon is 3,621.
What is the Total Female Population of Ripon?
Total Female Population of Ripon is 4,202.
What is the Ratio of Males per 100 Females in Ripon?
There are 86.17 Males per 100 Females in Ripon.
What is the Ratio of Females per 100 Males in Ripon?
There are 116.05 Females per 100 Males in Ripon.
What is the Median Population Age in Ripon?
Median Population Age in Ripon is 41.2 Years.
What is the Average Family Size in Ripon
Average Family Size in Ripon is 3.0 People.
What is the Average Household Size in Ripon
Average Household Size in Ripon is 2.2 People.
How Large is the Labor Force in Ripon?
There are 3,930 People in the Labor Forcein in Ripon.
What is the Percentage of People in the Labor Force in Ripon?
60.7% of People are in the Labor Force in Ripon.
What is the Unemployment Rate in Ripon?
Unemployment Rate in Ripon is 2.5%.