Richland Center, WI Map & Demographics
Richland Center Map
Richland Center Overview
$30,237
PER CAPITA INCOME
$71,708
AVG FAMILY INCOME
$54,295
AVG HOUSEHOLD INCOME
26.6%
WAGE / INCOME GAP [ % ]
73.4¢/ $1
WAGE / INCOME GAP [ $ ]
0.39
INEQUALITY / GINI INDEX
5,058
TOTAL POPULATION
2,268
MALE POPULATION
2,790
FEMALE POPULATION
81.29
MALES / 100 FEMALES
123.02
FEMALES / 100 MALES
43.8
MEDIAN AGE
2.9
AVG FAMILY SIZE
2.1
AVG HOUSEHOLD SIZE
2,610
LABOR FORCE [ PEOPLE ]
62.6%
PERCENT IN LABOR FORCE
1.8%
UNEMPLOYMENT RATE
Richland Center Zip Codes
Richland Center Area Codes
Income in Richland Center
Income Overview in Richland Center
Per Capita Income in Richland Center is $30,237, while median incomes of families and households are $71,708 and $54,295 respectively.
| Characteristic | Number | Measure |
| Per Capita Income | 5,058 | $30,237 |
| Median Family Income | 1,164 | $71,708 |
| Mean Family Income | 1,164 | $82,406 |
| Median Household Income | 2,288 | $54,295 |
| Mean Household Income | 2,288 | $64,350 |
| Income Deficit | 1,164 | $0 |
| Wage / Income Gap (%) | 5,058 | 26.59% |
| Wage / Income Gap ($) | 5,058 | 73.41¢ per $1 |
| Gini / Inequality Index | 5,058 | 0.39 |
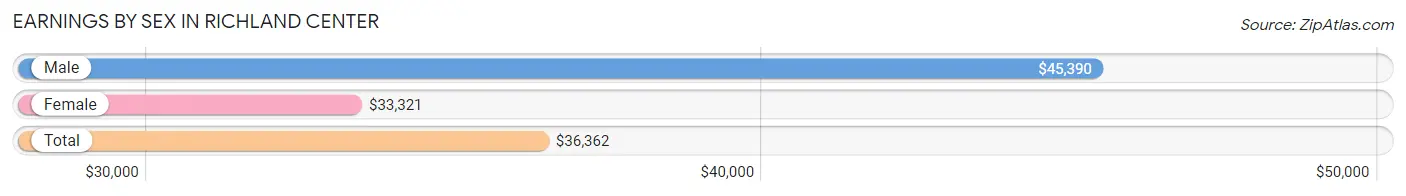
Earnings by Sex in Richland Center
Average Earnings in Richland Center are $36,362, $45,390 for men and $33,321 for women, a difference of 26.6%.
| Sex | Number | Average Earnings |
| Male | 1,393 (49.6%) | $45,390 |
| Female | 1,416 (50.4%) | $33,321 |
| Total | 2,809 (100.0%) | $36,362 |
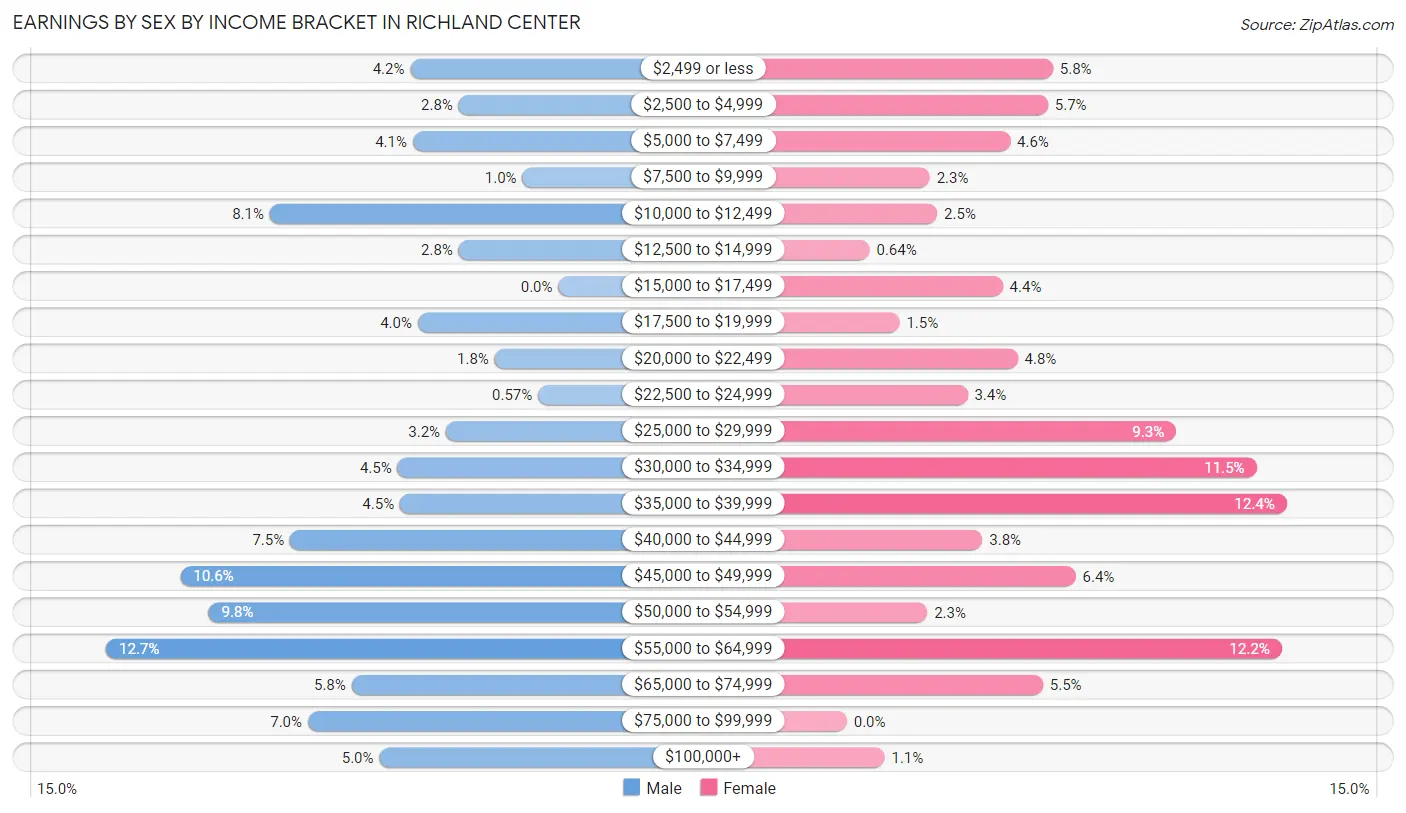
Earnings by Sex by Income Bracket in Richland Center
The most common earnings brackets in Richland Center are $55,000 to $64,999 for men (177 | 12.7%) and $35,000 to $39,999 for women (175 | 12.4%).
| Income | Male | Female |
| $2,499 or less | 58 (4.2%) | 82 (5.8%) |
| $2,500 to $4,999 | 39 (2.8%) | 80 (5.7%) |
| $5,000 to $7,499 | 57 (4.1%) | 65 (4.6%) |
| $7,500 to $9,999 | 14 (1.0%) | 33 (2.3%) |
| $10,000 to $12,499 | 113 (8.1%) | 36 (2.5%) |
| $12,500 to $14,999 | 39 (2.8%) | 9 (0.6%) |
| $15,000 to $17,499 | 0 (0.0%) | 62 (4.4%) |
| $17,500 to $19,999 | 55 (4.0%) | 21 (1.5%) |
| $20,000 to $22,499 | 25 (1.8%) | 68 (4.8%) |
| $22,500 to $24,999 | 8 (0.6%) | 48 (3.4%) |
| $25,000 to $29,999 | 44 (3.2%) | 131 (9.2%) |
| $30,000 to $34,999 | 63 (4.5%) | 163 (11.5%) |
| $35,000 to $39,999 | 62 (4.4%) | 175 (12.4%) |
| $40,000 to $44,999 | 105 (7.5%) | 54 (3.8%) |
| $45,000 to $49,999 | 148 (10.6%) | 91 (6.4%) |
| $50,000 to $54,999 | 137 (9.8%) | 32 (2.3%) |
| $55,000 to $64,999 | 177 (12.7%) | 173 (12.2%) |
| $65,000 to $74,999 | 81 (5.8%) | 78 (5.5%) |
| $75,000 to $99,999 | 98 (7.0%) | 0 (0.0%) |
| $100,000+ | 70 (5.0%) | 15 (1.1%) |
| Total | 1,393 (100.0%) | 1,416 (100.0%) |
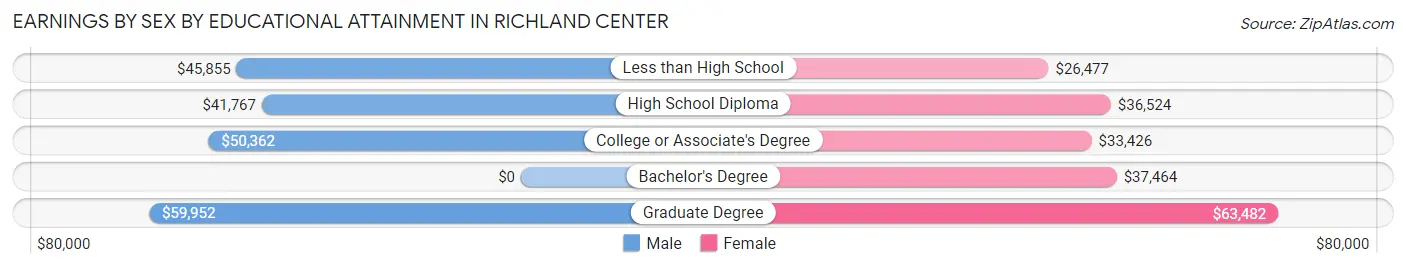
Earnings by Sex by Educational Attainment in Richland Center
Average earnings in Richland Center are $46,989 for men and $35,510 for women, a difference of 24.4%. Men with an educational attainment of graduate degree enjoy the highest average annual earnings of $59,952, while those with high school diploma education earn the least with $41,767. Women with an educational attainment of graduate degree earn the most with the average annual earnings of $63,482, while those with less than high school education have the smallest earnings of $26,477.
| Educational Attainment | Male Income | Female Income |
| Less than High School | $45,855 | $26,477 |
| High School Diploma | $41,767 | $36,524 |
| College or Associate's Degree | $50,362 | $33,426 |
| Bachelor's Degree | - | - |
| Graduate Degree | $59,952 | $63,482 |
| Total | $46,989 | $35,510 |
Family Income in Richland Center
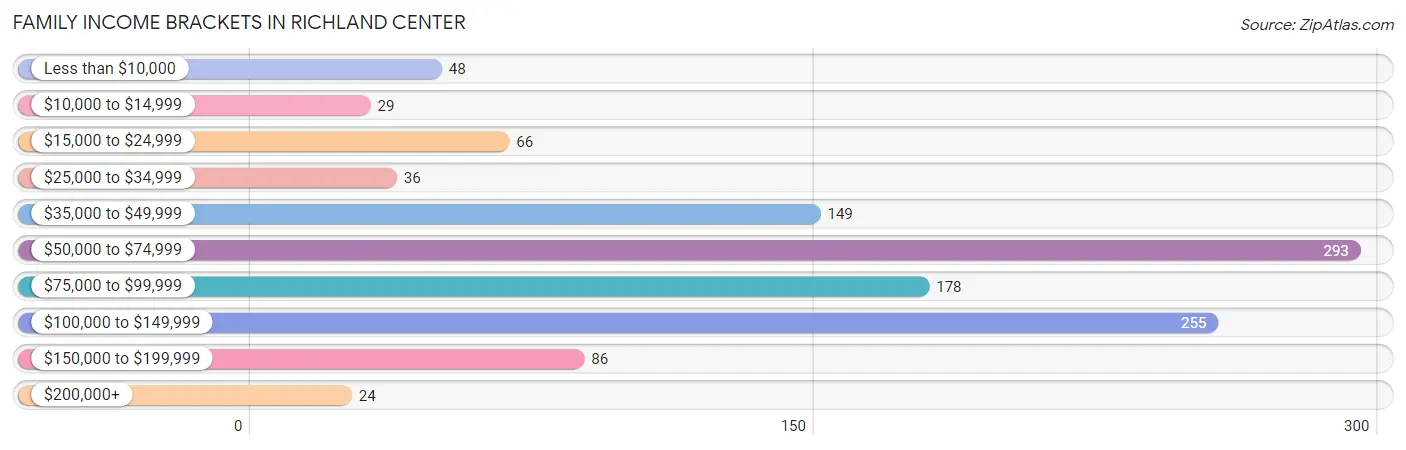
Family Income Brackets in Richland Center
According to the Richland Center family income data, there are 293 families falling into the $50,000 to $74,999 income range, which is the most common income bracket and makes up 25.2% of all families. Conversely, the $200,000+ income bracket is the least frequent group with only 24 families (2.1%) belonging to this category.
| Income Bracket | # Families | % Families |
| Less than $10,000 | 48 | 4.1% |
| $10,000 to $14,999 | 29 | 2.5% |
| $15,000 to $24,999 | 66 | 5.7% |
| $25,000 to $34,999 | 36 | 3.1% |
| $35,000 to $49,999 | 149 | 12.8% |
| $50,000 to $74,999 | 293 | 25.2% |
| $75,000 to $99,999 | 178 | 15.3% |
| $100,000 to $149,999 | 255 | 21.9% |
| $150,000 to $199,999 | 86 | 7.4% |
| $200,000+ | 24 | 2.1% |
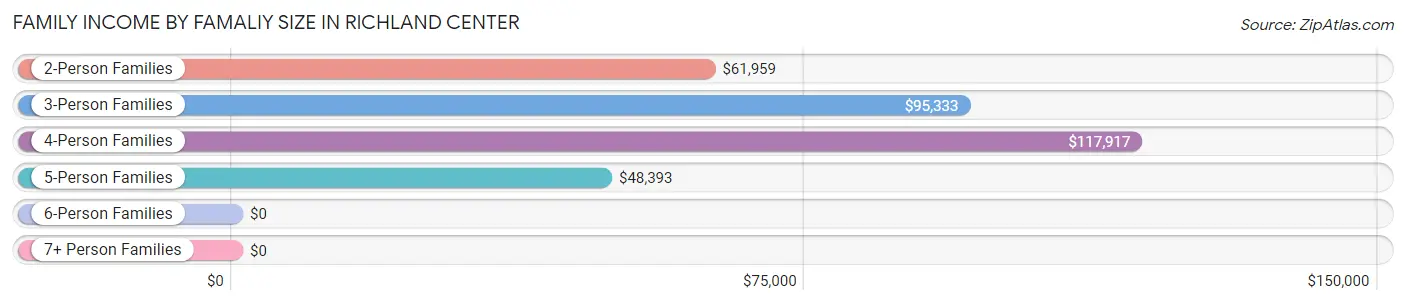
Family Income by Famaliy Size in Richland Center
4-person families (77 | 6.6%) account for the highest median family income in Richland Center with $117,917 per family, while 3-person families (344 | 29.5%) have the highest median income of $31,778 per family member.
| Income Bracket | # Families | Median Income |
| 2-Person Families | 612 (52.6%) | $61,959 |
| 3-Person Families | 344 (29.5%) | $95,333 |
| 4-Person Families | 77 (6.6%) | $117,917 |
| 5-Person Families | 77 (6.6%) | $48,393 |
| 6-Person Families | 41 (3.5%) | $0 |
| 7+ Person Families | 13 (1.1%) | $0 |
| Total | 1,164 (100.0%) | $71,708 |
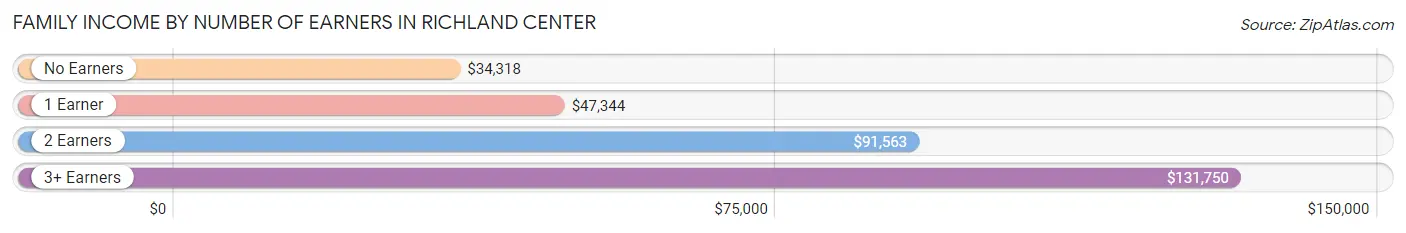
Family Income by Number of Earners in Richland Center
The median family income in Richland Center is $71,708, with families comprising 3+ earners (167) having the highest median family income of $131,750, while families with no earners (148) have the lowest median family income of $34,318, accounting for 14.3% and 12.7% of families, respectively.
| Number of Earners | # Families | Median Income |
| No Earners | 148 (12.7%) | $34,318 |
| 1 Earner | 404 (34.7%) | $47,344 |
| 2 Earners | 445 (38.2%) | $91,563 |
| 3+ Earners | 167 (14.3%) | $131,750 |
| Total | 1,164 (100.0%) | $71,708 |
Household Income in Richland Center
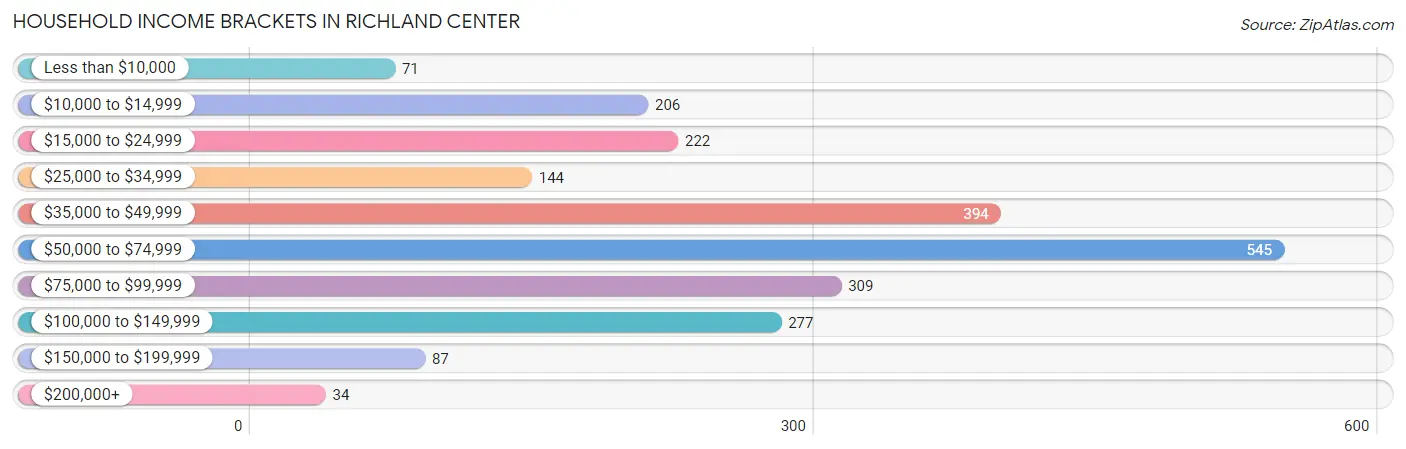
Household Income Brackets in Richland Center
With 545 households falling in the category, the $50,000 to $74,999 income range is the most frequent in Richland Center, accounting for 23.8% of all households. In contrast, only 34 households (1.5%) fall into the $200,000+ income bracket, making it the least populous group.
| Income Bracket | # Households | % Households |
| Less than $10,000 | 71 | 3.1% |
| $10,000 to $14,999 | 206 | 9.0% |
| $15,000 to $24,999 | 222 | 9.7% |
| $25,000 to $34,999 | 144 | 6.3% |
| $35,000 to $49,999 | 394 | 17.2% |
| $50,000 to $74,999 | 545 | 23.8% |
| $75,000 to $99,999 | 309 | 13.5% |
| $100,000 to $149,999 | 277 | 12.1% |
| $150,000 to $199,999 | 87 | 3.8% |
| $200,000+ | 34 | 1.5% |
Household Income by Householder Age in Richland Center
The median household income in Richland Center is $54,295, with the highest median household income of $70,750 found in the 15 to 24 years age bracket for the primary householder. A total of 76 households (3.3%) fall into this category. Meanwhile, the 65+ years age bracket for the primary householder has the lowest median household income of $36,368, with 837 households (36.6%) in this group.
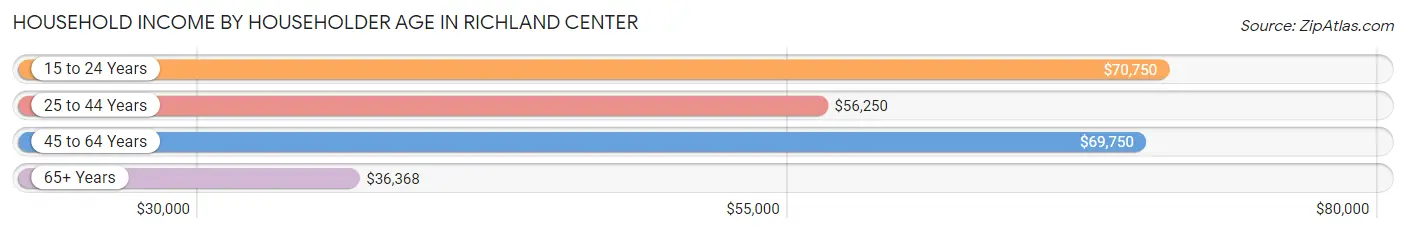
| Income Bracket | # Households | Median Income |
| 15 to 24 Years | 76 (3.3%) | $70,750 |
| 25 to 44 Years | 594 (26.0%) | $56,250 |
| 45 to 64 Years | 781 (34.1%) | $69,750 |
| 65+ Years | 837 (36.6%) | $36,368 |
| Total | 2,288 (100.0%) | $54,295 |
Poverty in Richland Center
Income Below Poverty by Sex and Age in Richland Center
With 12.1% poverty level for males and 23.3% for females among the residents of Richland Center, 5 year old males and 6 to 11 year old females are the most vulnerable to poverty, with 11 males (100.0%) and 122 females (55.7%) in their respective age groups living below the poverty level.
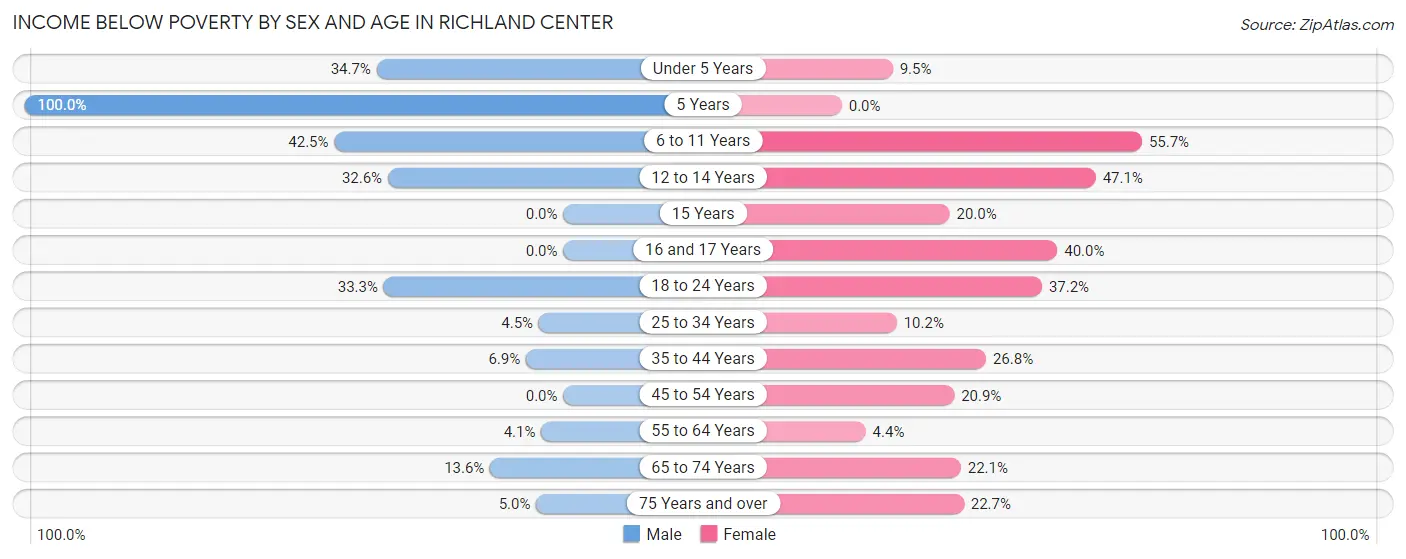
| Age Bracket | Male | Female |
| Under 5 Years | 35 (34.6%) | 12 (9.5%) |
| 5 Years | 11 (100.0%) | 0 (0.0%) |
| 6 to 11 Years | 51 (42.5%) | 122 (55.7%) |
| 12 to 14 Years | 28 (32.6%) | 41 (47.1%) |
| 15 Years | 0 (0.0%) | 11 (20.0%) |
| 16 and 17 Years | 0 (0.0%) | 22 (40.0%) |
| 18 to 24 Years | 40 (33.3%) | 94 (37.1%) |
| 25 to 34 Years | 11 (4.5%) | 25 (10.2%) |
| 35 to 44 Years | 21 (6.9%) | 80 (26.8%) |
| 45 to 54 Years | 0 (0.0%) | 68 (20.9%) |
| 55 to 64 Years | 15 (4.1%) | 16 (4.4%) |
| 65 to 74 Years | 44 (13.6%) | 76 (22.1%) |
| 75 Years and over | 12 (5.0%) | 65 (22.7%) |
| Total | 268 (12.1%) | 632 (23.3%) |
Income Above Poverty by Sex and Age in Richland Center
According to the poverty statistics in Richland Center, males aged 15 years and females aged 5 years are the age groups that are most secure financially, with 100.0% of males and 100.0% of females in these age groups living above the poverty line.
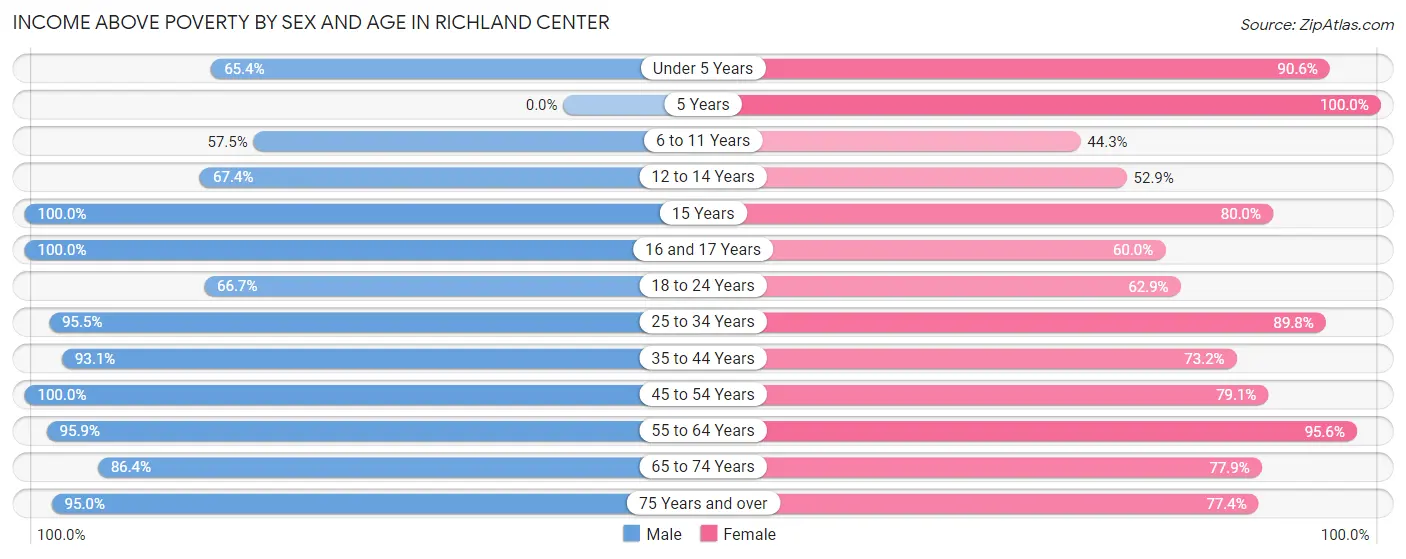
| Age Bracket | Male | Female |
| Under 5 Years | 66 (65.3%) | 115 (90.5%) |
| 5 Years | 0 (0.0%) | 51 (100.0%) |
| 6 to 11 Years | 69 (57.5%) | 97 (44.3%) |
| 12 to 14 Years | 58 (67.4%) | 46 (52.9%) |
| 15 Years | 20 (100.0%) | 44 (80.0%) |
| 16 and 17 Years | 79 (100.0%) | 33 (60.0%) |
| 18 to 24 Years | 80 (66.7%) | 159 (62.8%) |
| 25 to 34 Years | 232 (95.5%) | 220 (89.8%) |
| 35 to 44 Years | 282 (93.1%) | 219 (73.2%) |
| 45 to 54 Years | 206 (100.0%) | 258 (79.1%) |
| 55 to 64 Years | 352 (95.9%) | 345 (95.6%) |
| 65 to 74 Years | 280 (86.4%) | 268 (77.9%) |
| 75 Years and over | 227 (95.0%) | 222 (77.3%) |
| Total | 1,951 (87.9%) | 2,077 (76.7%) |
Income Below Poverty Among Married-Couple Families in Richland Center
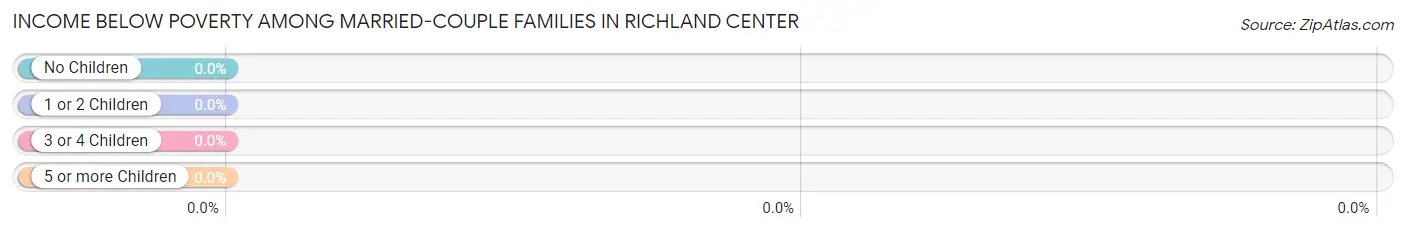
| Children | Above Poverty | Below Poverty |
| No Children | 585 (100.0%) | 0 (0.0%) |
| 1 or 2 Children | 127 (100.0%) | 0 (0.0%) |
| 3 or 4 Children | 58 (100.0%) | 0 (0.0%) |
| 5 or more Children | 13 (100.0%) | 0 (0.0%) |
| Total | 783 (100.0%) | 0 (0.0%) |
Income Below Poverty Among Single-Parent Households in Richland Center
According to the poverty data in Richland Center, 13.4% or 21 single-father households and 46.0% or 103 single-mother households are living below the poverty line. Among single-father households, those with no children have the highest poverty rate, with 9 households (15.8%) experiencing poverty. Likewise, among single-mother households, those with 3 or 4 children have the highest poverty rate, with 31 households (100.0%) falling below the poverty line.
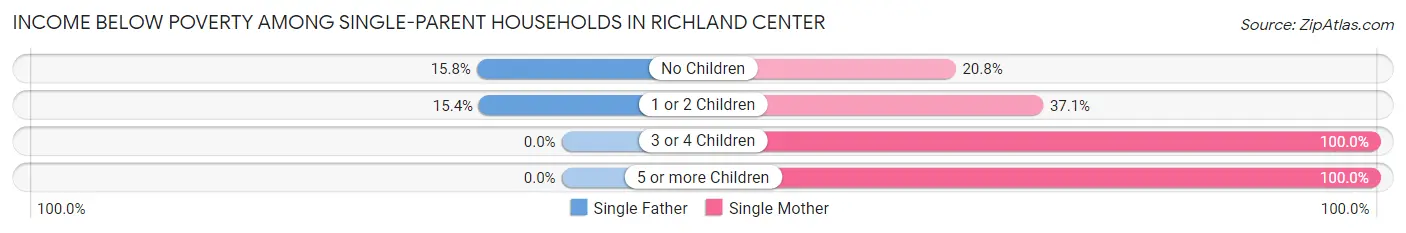
| Children | Single Father | Single Mother |
| No Children | 9 (15.8%) | 10 (20.8%) |
| 1 or 2 Children | 12 (15.4%) | 49 (37.1%) |
| 3 or 4 Children | 0 (0.0%) | 31 (100.0%) |
| 5 or more Children | 0 (0.0%) | 13 (100.0%) |
| Total | 21 (13.4%) | 103 (46.0%) |
Income Below Poverty Among Married-Couple vs Single-Parent Households in Richland Center
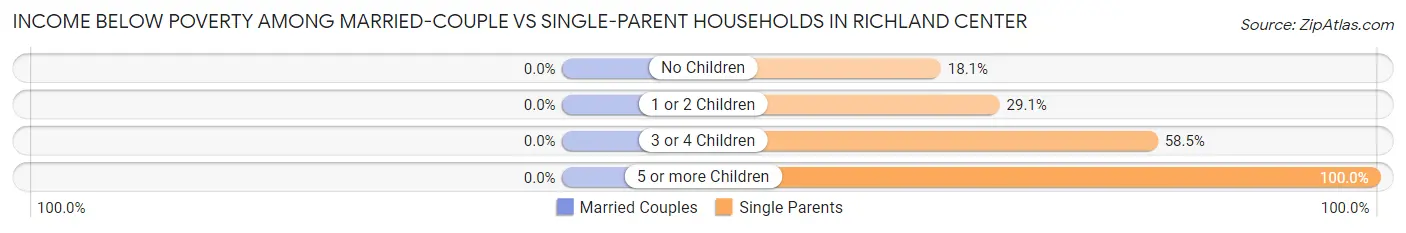
| Children | Married-Couple Families | Single-Parent Households |
| No Children | 0 (0.0%) | 19 (18.1%) |
| 1 or 2 Children | 0 (0.0%) | 61 (29.0%) |
| 3 or 4 Children | 0 (0.0%) | 31 (58.5%) |
| 5 or more Children | 0 (0.0%) | 13 (100.0%) |
| Total | 0 (0.0%) | 124 (32.6%) |
Race in Richland Center
The most populous races in Richland Center are White / Caucasian (4,592 | 90.8%), Some other Race (230 | 4.5%), and Hispanic or Latino (202 | 4.0%).
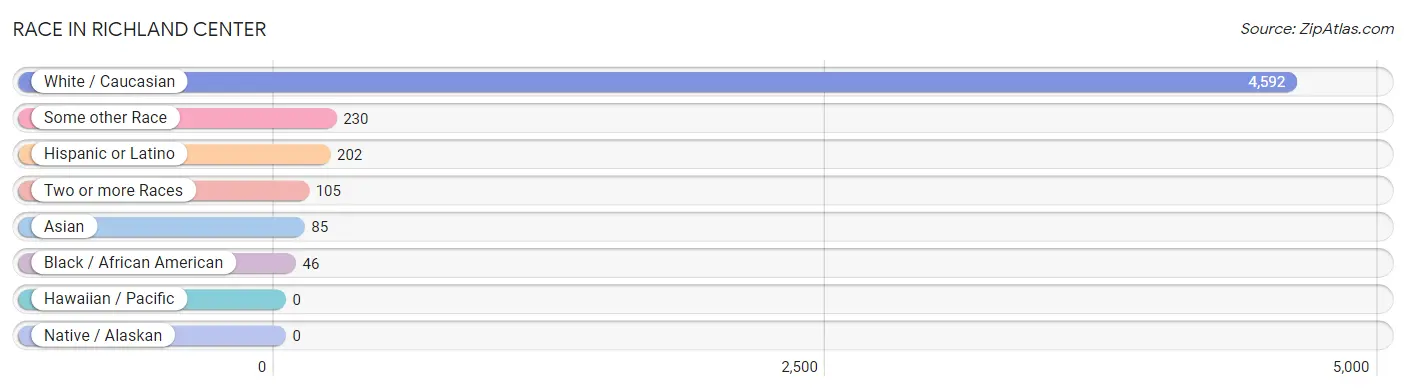
| Race | # Population | % Population |
| Asian | 85 | 1.7% |
| Black / African American | 46 | 0.9% |
| Hawaiian / Pacific | 0 | 0.0% |
| Hispanic or Latino | 202 | 4.0% |
| Native / Alaskan | 0 | 0.0% |
| White / Caucasian | 4,592 | 90.8% |
| Two or more Races | 105 | 2.1% |
| Some other Race | 230 | 4.5% |
| Total | 5,058 | 100.0% |
Ancestry in Richland Center
The most populous ancestries reported in Richland Center are German (1,925 | 38.1%), Norwegian (681 | 13.5%), English (607 | 12.0%), Irish (470 | 9.3%), and Scotch-Irish (151 | 3.0%), together accounting for 75.8% of all Richland Center residents.
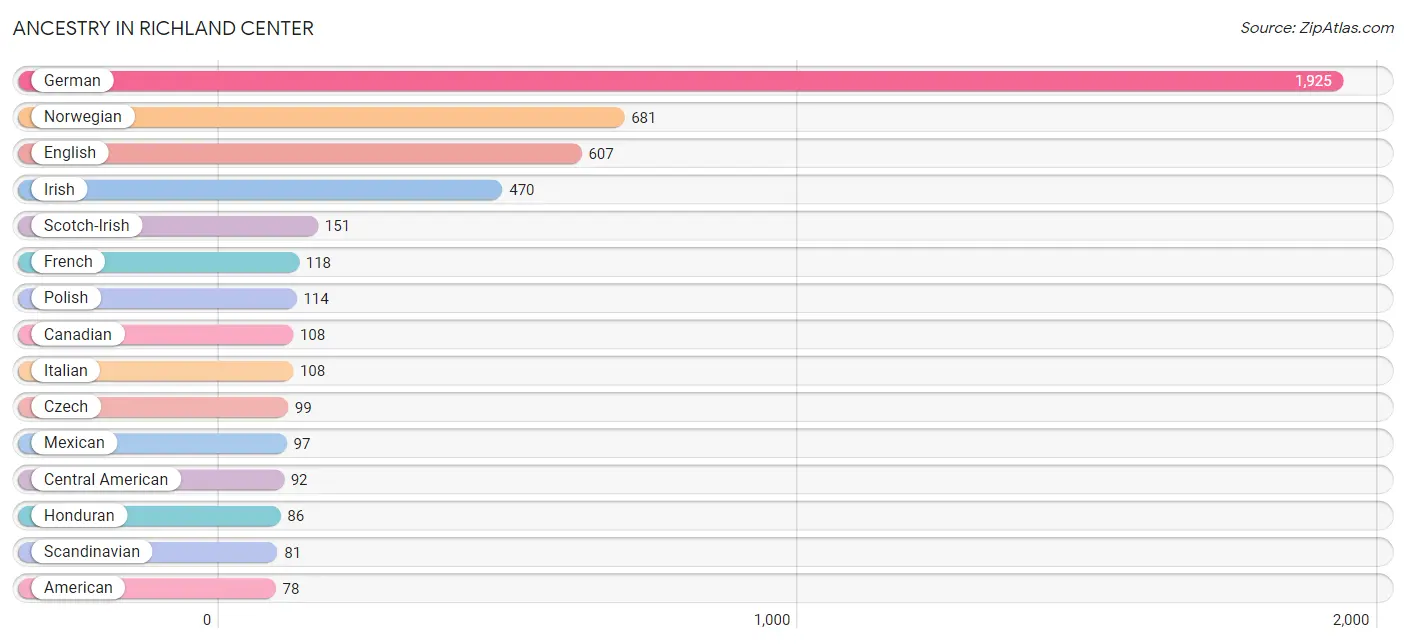
| Ancestry | # Population | % Population |
| American | 78 | 1.5% |
| Australian | 1 | 0.0% |
| Austrian | 23 | 0.4% |
| Bhutanese | 10 | 0.2% |
| British | 33 | 0.6% |
| Burmese | 5 | 0.1% |
| Canadian | 108 | 2.1% |
| Central American | 92 | 1.8% |
| Chippewa | 27 | 0.5% |
| Crow | 5 | 0.1% |
| Czech | 99 | 2.0% |
| Danish | 11 | 0.2% |
| Dominican | 10 | 0.2% |
| Dutch | 65 | 1.3% |
| English | 607 | 12.0% |
| European | 25 | 0.5% |
| French | 118 | 2.3% |
| German | 1,925 | 38.1% |
| Greek | 13 | 0.3% |
| Guatemalan | 6 | 0.1% |
| Honduran | 86 | 1.7% |
| Hungarian | 32 | 0.6% |
| Indian (Asian) | 52 | 1.0% |
| Irish | 470 | 9.3% |
| Italian | 108 | 2.1% |
| Malaysian | 19 | 0.4% |
| Mexican | 97 | 1.9% |
| Northern European | 61 | 1.2% |
| Norwegian | 681 | 13.5% |
| Pennsylvania German | 1 | 0.0% |
| Polish | 114 | 2.2% |
| Romanian | 11 | 0.2% |
| Scandinavian | 81 | 1.6% |
| Scotch-Irish | 151 | 3.0% |
| Scottish | 53 | 1.1% |
| Swedish | 24 | 0.5% |
| Swiss | 62 | 1.2% |
| Thai | 11 | 0.2% |
| Welsh | 38 | 0.7% |
| Yugoslavian | 1 | 0.0% | View All 40 Rows |
Immigrants in Richland Center
The most numerous immigrant groups reported in Richland Center came from Latin America (131 | 2.6%), Central America (121 | 2.4%), Mexico (98 | 1.9%), Asia (85 | 1.7%), and Eastern Asia (55 | 1.1%), together accounting for 9.7% of all Richland Center residents.
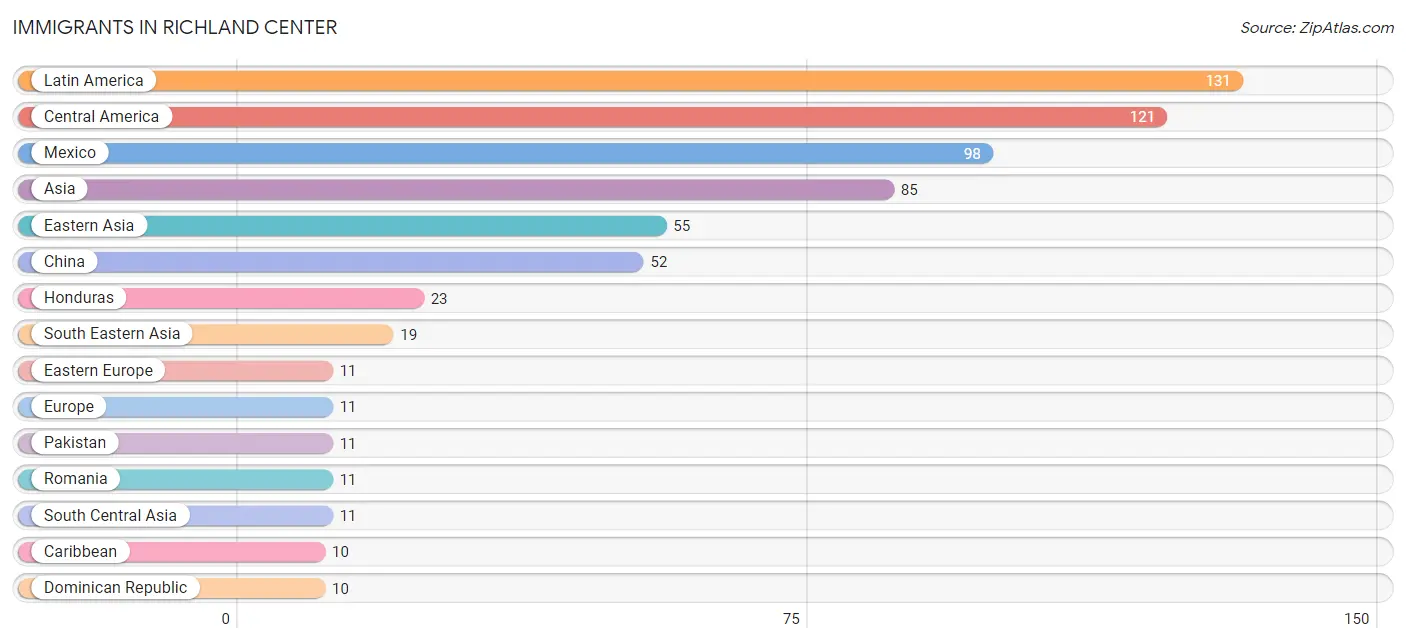
| Immigration Origin | # Population | % Population |
| Asia | 85 | 1.7% |
| Caribbean | 10 | 0.2% |
| Central America | 121 | 2.4% |
| China | 52 | 1.0% |
| Dominican Republic | 10 | 0.2% |
| Eastern Asia | 55 | 1.1% |
| Eastern Europe | 11 | 0.2% |
| Europe | 11 | 0.2% |
| Honduras | 23 | 0.4% |
| Korea | 3 | 0.1% |
| Laos | 9 | 0.2% |
| Latin America | 131 | 2.6% |
| Mexico | 98 | 1.9% |
| Pakistan | 11 | 0.2% |
| Philippines | 10 | 0.2% |
| Romania | 11 | 0.2% |
| South Central Asia | 11 | 0.2% |
| South Eastern Asia | 19 | 0.4% | View All 18 Rows |
Sex and Age in Richland Center
Sex and Age in Richland Center
The most populous age groups in Richland Center are 55 to 59 Years (190 | 8.4%) for men and 15 to 19 Years (285 | 10.2%) for women.
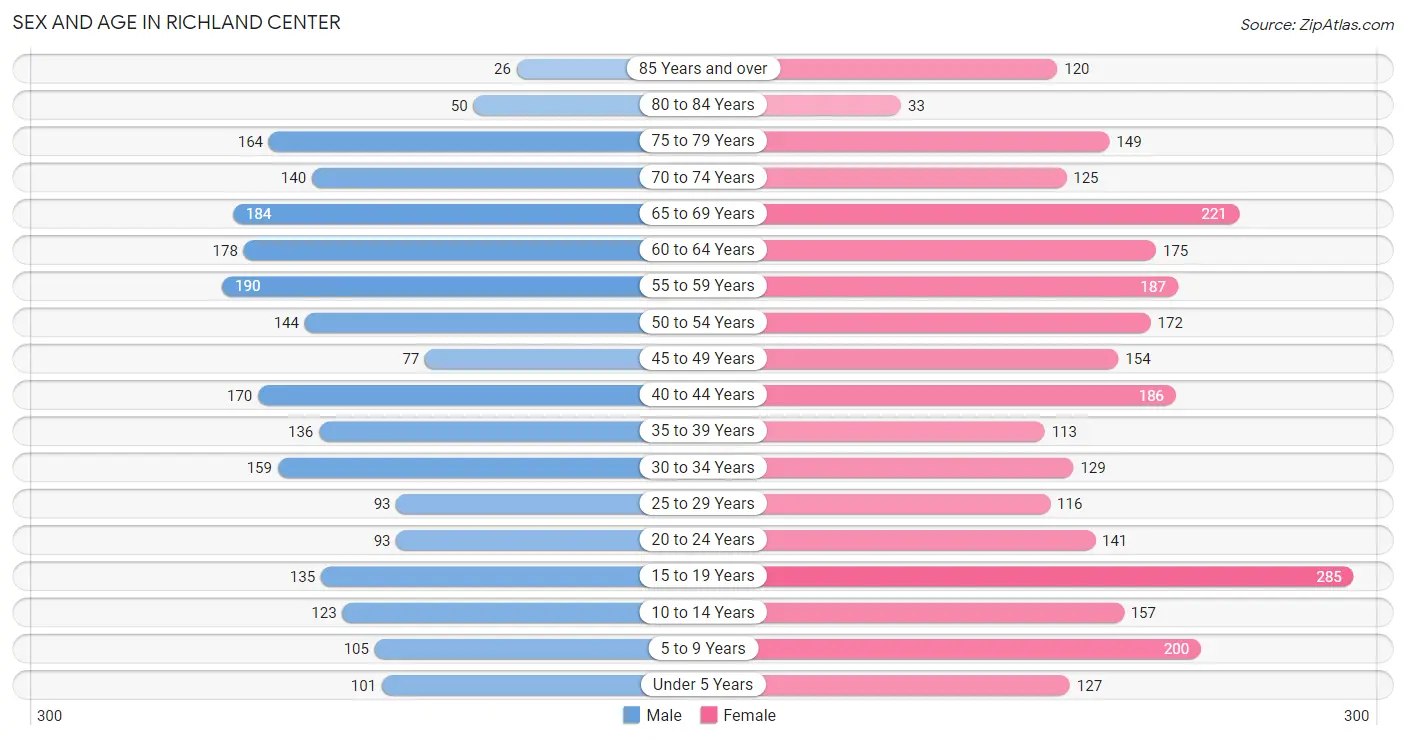
| Age Bracket | Male | Female |
| Under 5 Years | 101 (4.4%) | 127 (4.5%) |
| 5 to 9 Years | 105 (4.6%) | 200 (7.2%) |
| 10 to 14 Years | 123 (5.4%) | 157 (5.6%) |
| 15 to 19 Years | 135 (5.9%) | 285 (10.2%) |
| 20 to 24 Years | 93 (4.1%) | 141 (5.1%) |
| 25 to 29 Years | 93 (4.1%) | 116 (4.2%) |
| 30 to 34 Years | 159 (7.0%) | 129 (4.6%) |
| 35 to 39 Years | 136 (6.0%) | 113 (4.1%) |
| 40 to 44 Years | 170 (7.5%) | 186 (6.7%) |
| 45 to 49 Years | 77 (3.4%) | 154 (5.5%) |
| 50 to 54 Years | 144 (6.4%) | 172 (6.2%) |
| 55 to 59 Years | 190 (8.4%) | 187 (6.7%) |
| 60 to 64 Years | 178 (7.9%) | 175 (6.3%) |
| 65 to 69 Years | 184 (8.1%) | 221 (7.9%) |
| 70 to 74 Years | 140 (6.2%) | 125 (4.5%) |
| 75 to 79 Years | 164 (7.2%) | 149 (5.3%) |
| 80 to 84 Years | 50 (2.2%) | 33 (1.2%) |
| 85 Years and over | 26 (1.1%) | 120 (4.3%) |
| Total | 2,268 (100.0%) | 2,790 (100.0%) |
Families and Households in Richland Center
Median Family Size in Richland Center
The median family size in Richland Center is 2.90 persons per family, with single female/mother families (224 | 19.2%) accounting for the largest median family size of 3.29 persons per family. On the other hand, single male/father families (157 | 13.5%) represent the smallest median family size with 2.55 persons per family.
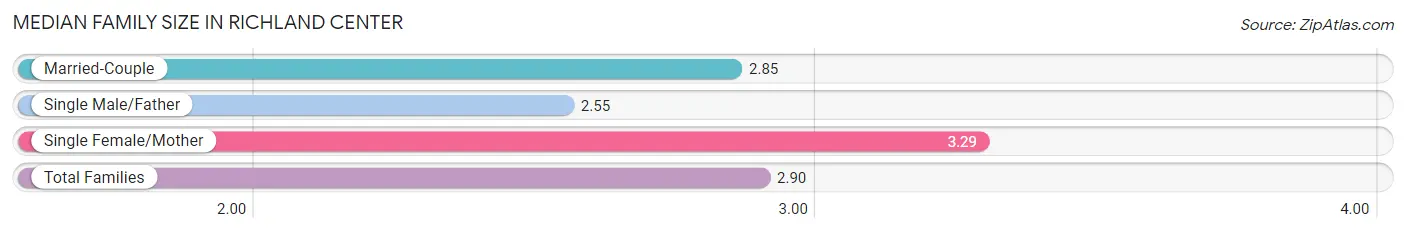
| Family Type | # Families | Family Size |
| Married-Couple | 783 (67.3%) | 2.85 |
| Single Male/Father | 157 (13.5%) | 2.55 |
| Single Female/Mother | 224 (19.2%) | 3.29 |
| Total Families | 1,164 (100.0%) | 2.90 |
Median Household Size in Richland Center
The median household size in Richland Center is 2.14 persons per household, with single female/mother households (224 | 9.8%) accounting for the largest median household size of 3.63 persons per household. non-family households (1,124 | 49.1%) represent the smallest median household size with 1.21 persons per household.
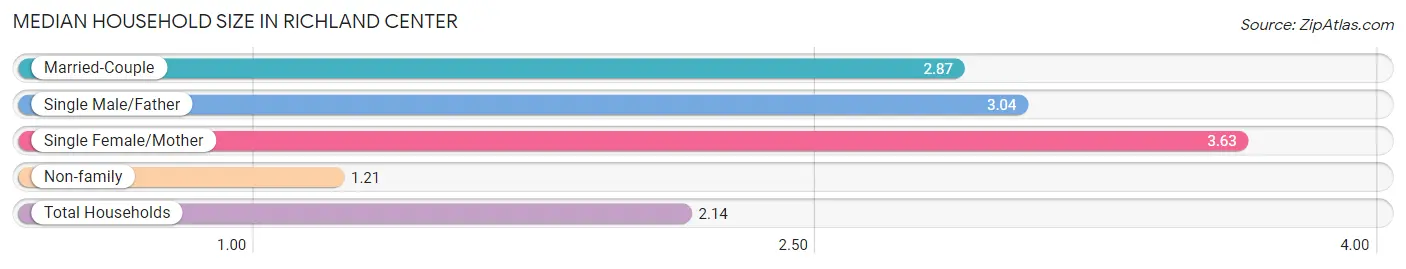
| Household Type | # Households | Household Size |
| Married-Couple | 783 (34.2%) | 2.87 |
| Single Male/Father | 157 (6.9%) | 3.04 |
| Single Female/Mother | 224 (9.8%) | 3.63 |
| Non-family | 1,124 (49.1%) | 1.21 |
| Total Households | 2,288 (100.0%) | 2.14 |
Household Size by Marriage Status in Richland Center
Out of a total of 2,288 households in Richland Center, 1,164 (50.9%) are family households, while 1,124 (49.1%) are nonfamily households. The most numerous type of family households are 2-person households, comprising 574, and the most common type of nonfamily households are 1-person households, comprising 913.
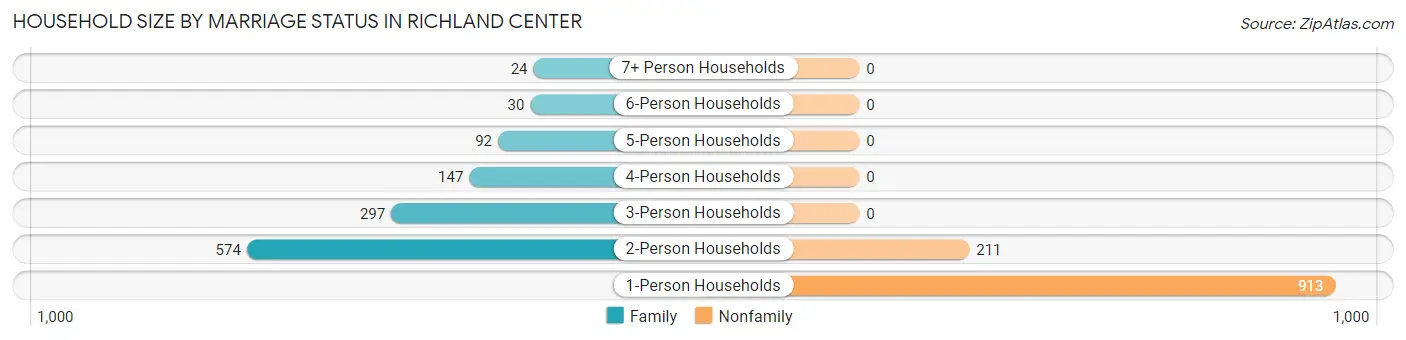
| Household Size | Family Households | Nonfamily Households |
| 1-Person Households | - | 913 (39.9%) |
| 2-Person Households | 574 (25.1%) | 211 (9.2%) |
| 3-Person Households | 297 (13.0%) | 0 (0.0%) |
| 4-Person Households | 147 (6.4%) | 0 (0.0%) |
| 5-Person Households | 92 (4.0%) | 0 (0.0%) |
| 6-Person Households | 30 (1.3%) | 0 (0.0%) |
| 7+ Person Households | 24 (1.1%) | 0 (0.0%) |
| Total | 1,164 (50.9%) | 1,124 (49.1%) |
Female Fertility in Richland Center
Fertility by Age in Richland Center
Average fertility rate in Richland Center is 11.0 births per 1,000 women. Women in the age bracket of 35 to 50 years have the highest fertility rate with 27.0 births per 1,000 women. Women in the age bracket of 35 to 50 years acount for 100.0% of all women with births.
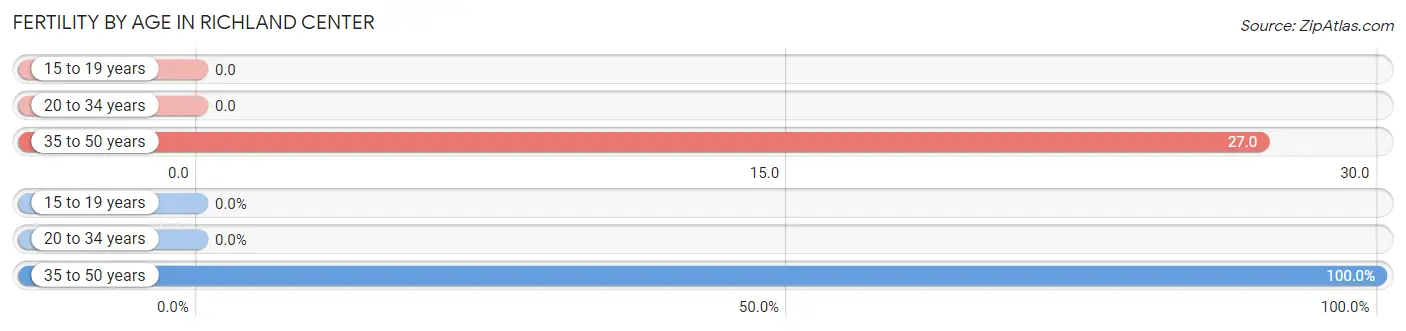
| Age Bracket | Women with Births | Births / 1,000 Women |
| 15 to 19 years | 0 (0.0%) | 0.0 |
| 20 to 34 years | 0 (0.0%) | 0.0 |
| 35 to 50 years | 13 (100.0%) | 27.0 |
| Total | 13 (100.0%) | 11.0 |
Fertility by Age by Marriage Status in Richland Center
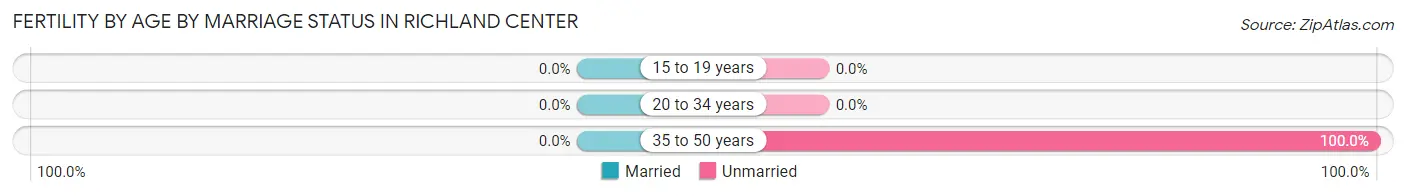
| Age Bracket | Married | Unmarried |
| 15 to 19 years | 0 (0.0%) | 0 (0.0%) |
| 20 to 34 years | 0 (0.0%) | 0 (0.0%) |
| 35 to 50 years | 0 (0.0%) | 13 (100.0%) |
| Total | 0 (0.0%) | 13 (100.0%) |
Fertility by Education in Richland Center
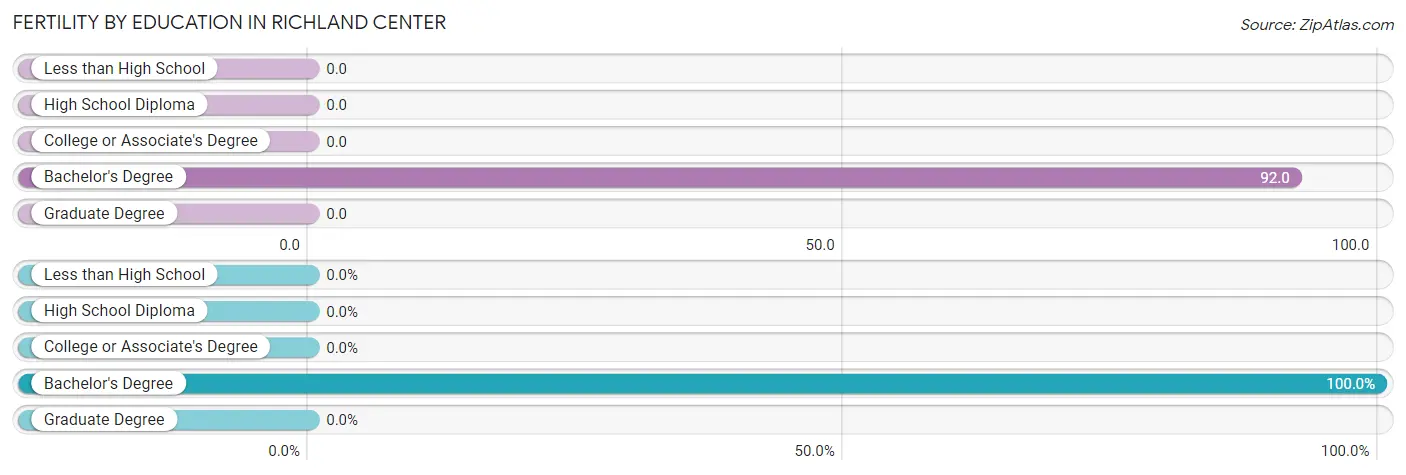
| Educational Attainment | Women with Births | Births / 1,000 Women |
| Less than High School | 0 (0.0%) | 0.0 |
| High School Diploma | 0 (0.0%) | 0.0 |
| College or Associate's Degree | 0 (0.0%) | 0.0 |
| Bachelor's Degree | 13 (100.0%) | 92.0 |
| Graduate Degree | 0 (0.0%) | 0.0 |
| Total | 13 (100.0%) | 11.0 |
Fertility by Education by Marriage Status in Richland Center
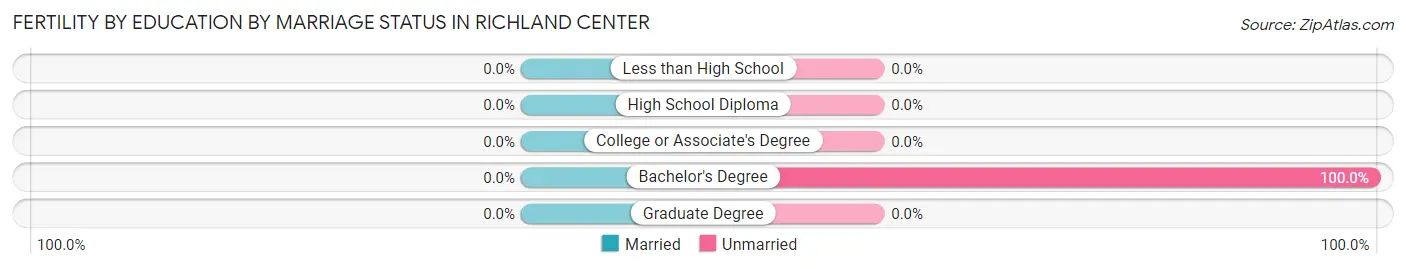
| Educational Attainment | Married | Unmarried |
| Less than High School | 0 (0.0%) | 0 (0.0%) |
| High School Diploma | 0 (0.0%) | 0 (0.0%) |
| College or Associate's Degree | 0 (0.0%) | 0 (0.0%) |
| Bachelor's Degree | 0 (0.0%) | 13 (100.0%) |
| Graduate Degree | 0 (0.0%) | 0 (0.0%) |
| Total | 0 (0.0%) | 13 (100.0%) |
Employment Characteristics in Richland Center
Employment by Class of Employer in Richland Center
Among the 2,514 employed individuals in Richland Center, private company employees (1,720 | 68.4%), local government employees (263 | 10.5%), and not-for-profit organizations (258 | 10.3%) make up the most common classes of employment.
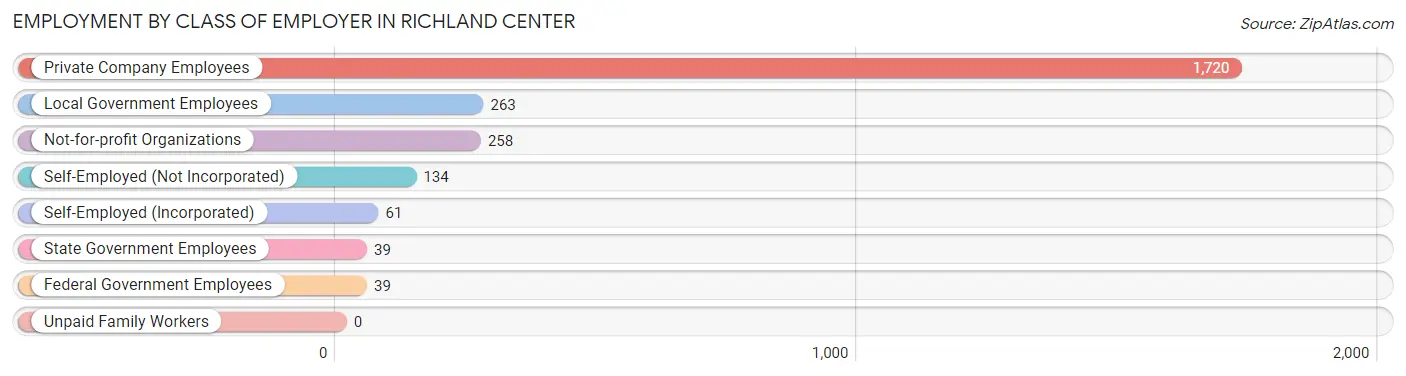
| Employer Class | # Employees | % Employees |
| Private Company Employees | 1,720 | 68.4% |
| Self-Employed (Incorporated) | 61 | 2.4% |
| Self-Employed (Not Incorporated) | 134 | 5.3% |
| Not-for-profit Organizations | 258 | 10.3% |
| Local Government Employees | 263 | 10.5% |
| State Government Employees | 39 | 1.5% |
| Federal Government Employees | 39 | 1.5% |
| Unpaid Family Workers | 0 | 0.0% |
| Total | 2,514 | 100.0% |
Employment Status by Age in Richland Center
According to the labor force statistics for Richland Center, out of the total population over 16 years of age (4,170), 62.6% or 2,610 individuals are in the labor force, with 1.8% or 47 of them unemployed. The age group with the highest labor force participation rate is 20 to 24 years, with 99.1% or 232 individuals in the labor force. Within the labor force, the 20 to 24 years age range has the highest percentage of unemployed individuals, with 12.5% or 29 of them being unemployed.
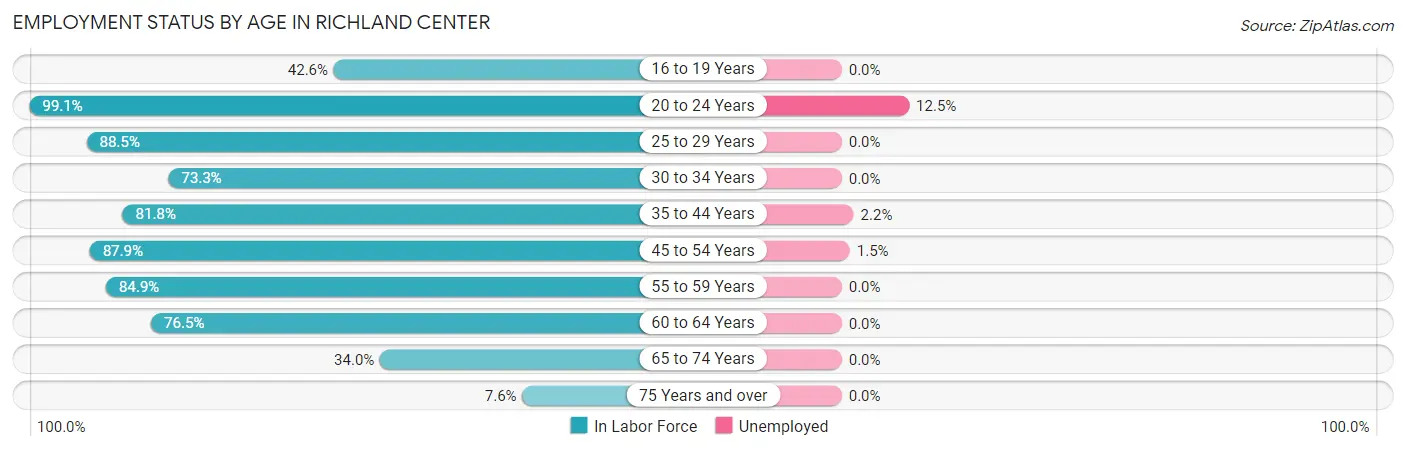
| Age Bracket | In Labor Force | Unemployed |
| 16 to 19 Years | 147 (42.6%) | 0 (0.0%) |
| 20 to 24 Years | 232 (99.1%) | 29 (12.5%) |
| 25 to 29 Years | 185 (88.5%) | 0 (0.0%) |
| 30 to 34 Years | 211 (73.3%) | 0 (0.0%) |
| 35 to 44 Years | 495 (81.8%) | 11 (2.2%) |
| 45 to 54 Years | 481 (87.9%) | 7 (1.5%) |
| 55 to 59 Years | 320 (84.9%) | 0 (0.0%) |
| 60 to 64 Years | 270 (76.5%) | 0 (0.0%) |
| 65 to 74 Years | 228 (34.0%) | 0 (0.0%) |
| 75 Years and over | 41 (7.6%) | 0 (0.0%) |
| Total | 2,610 (62.6%) | 47 (1.8%) |
Employment Status by Educational Attainment in Richland Center
According to labor force statistics for Richland Center, 82.5% of individuals (1,963) out of the total population between 25 and 64 years of age (2,379) are in the labor force, with 0.9% or 18 of them being unemployed. The group with the highest labor force participation rate are those with the educational attainment of college / associate degree, with 91.8% or 690 individuals in the labor force. Within the labor force, individuals with high school diploma education have the highest percentage of unemployment, with 1.2% or 11 of them being unemployed.
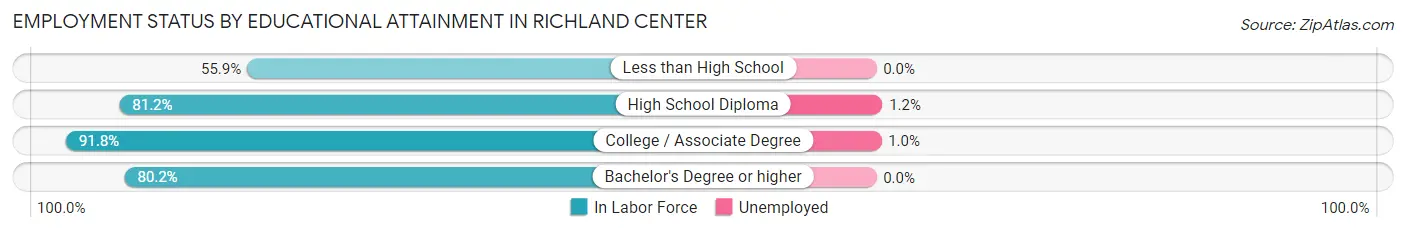
| Educational Attainment | In Labor Force | Unemployed |
| Less than High School | 100 (55.9%) | 0 (0.0%) |
| High School Diploma | 884 (81.2%) | 13 (1.2%) |
| College / Associate Degree | 690 (91.8%) | 8 (1.0%) |
| Bachelor's Degree or higher | 288 (80.2%) | 0 (0.0%) |
| Total | 1,963 (82.5%) | 21 (0.9%) |
Employment Occupations by Sex in Richland Center
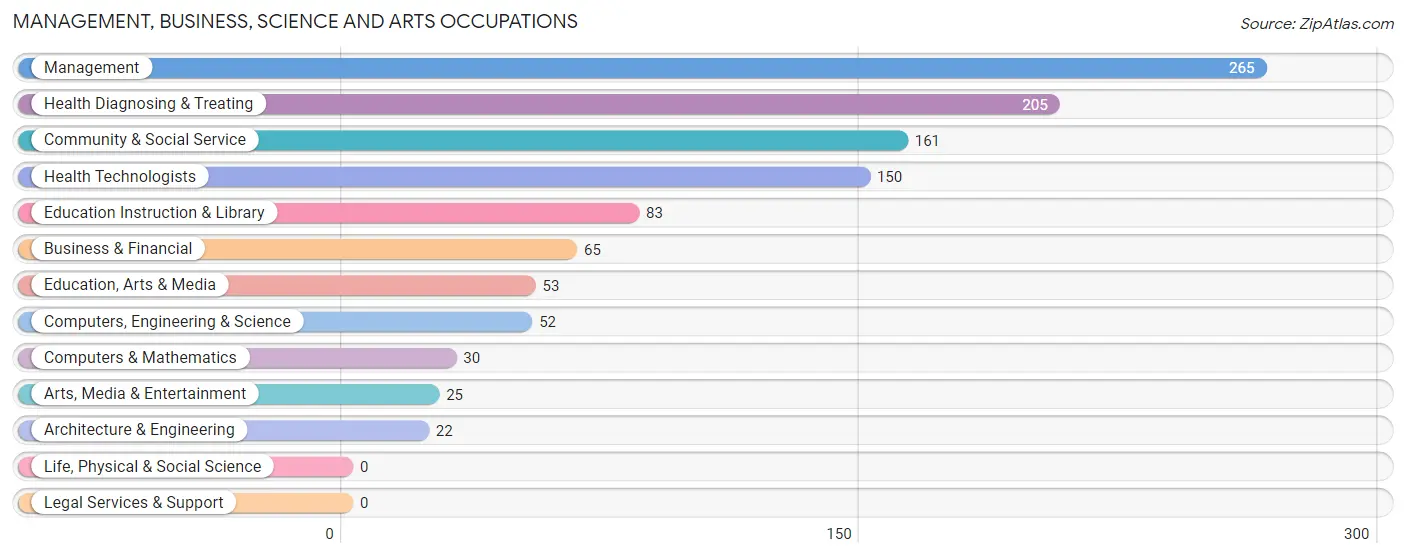
Management, Business, Science and Arts Occupations
The most common Management, Business, Science and Arts occupations in Richland Center are Management (265 | 10.3%), Health Diagnosing & Treating (205 | 8.0%), Community & Social Service (161 | 6.3%), Health Technologists (150 | 5.9%), and Education Instruction & Library (83 | 3.2%).
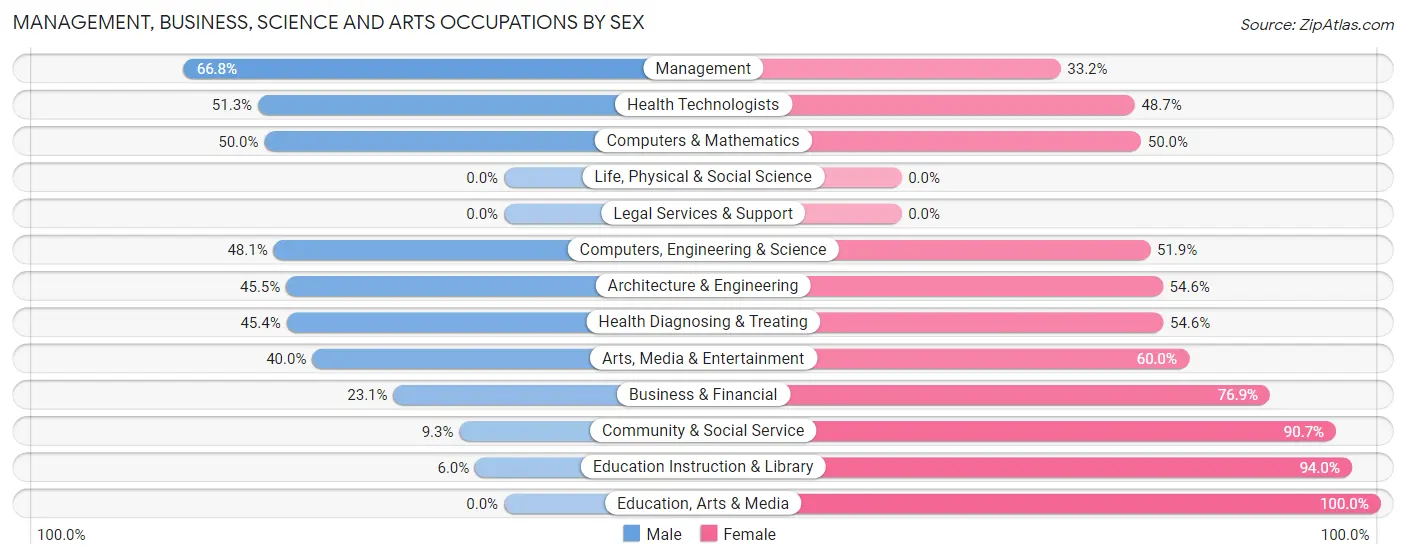
Management, Business, Science and Arts Occupations by Sex
Within the Management, Business, Science and Arts occupations in Richland Center, the most male-oriented occupations are Management (66.8%), Health Technologists (51.3%), and Computers & Mathematics (50.0%), while the most female-oriented occupations are Education, Arts & Media (100.0%), Education Instruction & Library (94.0%), and Community & Social Service (90.7%).
| Occupation | Male | Female |
| Management | 177 (66.8%) | 88 (33.2%) |
| Business & Financial | 15 (23.1%) | 50 (76.9%) |
| Computers, Engineering & Science | 25 (48.1%) | 27 (51.9%) |
| Computers & Mathematics | 15 (50.0%) | 15 (50.0%) |
| Architecture & Engineering | 10 (45.5%) | 12 (54.5%) |
| Life, Physical & Social Science | 0 (0.0%) | 0 (0.0%) |
| Community & Social Service | 15 (9.3%) | 146 (90.7%) |
| Education, Arts & Media | 0 (0.0%) | 53 (100.0%) |
| Legal Services & Support | 0 (0.0%) | 0 (0.0%) |
| Education Instruction & Library | 5 (6.0%) | 78 (94.0%) |
| Arts, Media & Entertainment | 10 (40.0%) | 15 (60.0%) |
| Health Diagnosing & Treating | 93 (45.4%) | 112 (54.6%) |
| Health Technologists | 77 (51.3%) | 73 (48.7%) |
| Total (Category) | 325 (43.4%) | 423 (56.6%) |
| Total (Overall) | 1,259 (49.1%) | 1,304 (50.9%) |
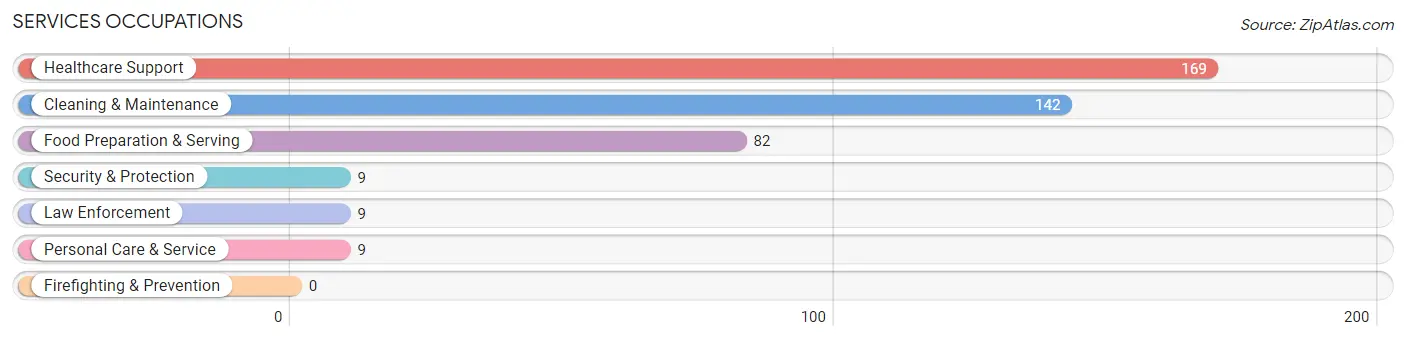
Services Occupations
The most common Services occupations in Richland Center are Healthcare Support (169 | 6.6%), Cleaning & Maintenance (142 | 5.5%), Food Preparation & Serving (82 | 3.2%), Security & Protection (9 | 0.4%), and Law Enforcement (9 | 0.4%).
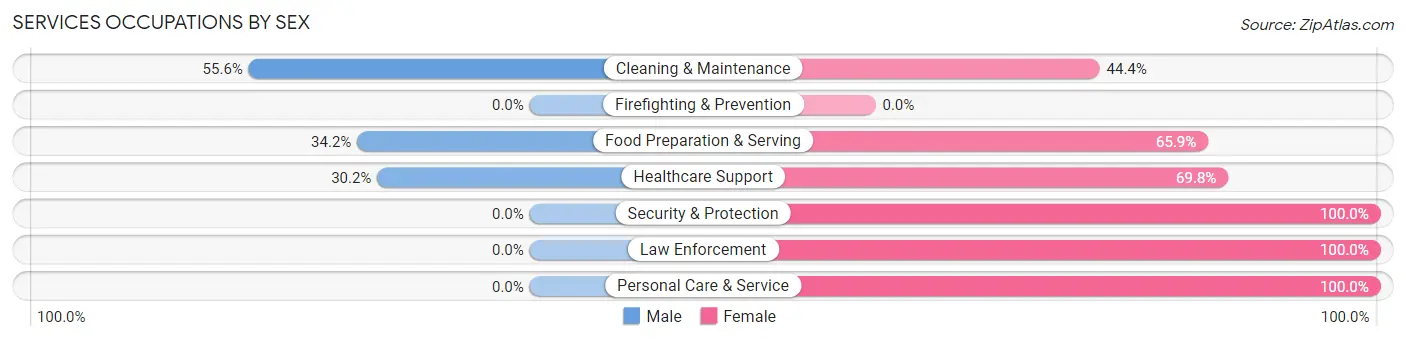
Services Occupations by Sex
Within the Services occupations in Richland Center, the most male-oriented occupations are Cleaning & Maintenance (55.6%), Food Preparation & Serving (34.2%), and Healthcare Support (30.2%), while the most female-oriented occupations are Security & Protection (100.0%), Law Enforcement (100.0%), and Personal Care & Service (100.0%).
| Occupation | Male | Female |
| Healthcare Support | 51 (30.2%) | 118 (69.8%) |
| Security & Protection | 0 (0.0%) | 9 (100.0%) |
| Firefighting & Prevention | 0 (0.0%) | 0 (0.0%) |
| Law Enforcement | 0 (0.0%) | 9 (100.0%) |
| Food Preparation & Serving | 28 (34.2%) | 54 (65.8%) |
| Cleaning & Maintenance | 79 (55.6%) | 63 (44.4%) |
| Personal Care & Service | 0 (0.0%) | 9 (100.0%) |
| Total (Category) | 158 (38.4%) | 253 (61.6%) |
| Total (Overall) | 1,259 (49.1%) | 1,304 (50.9%) |
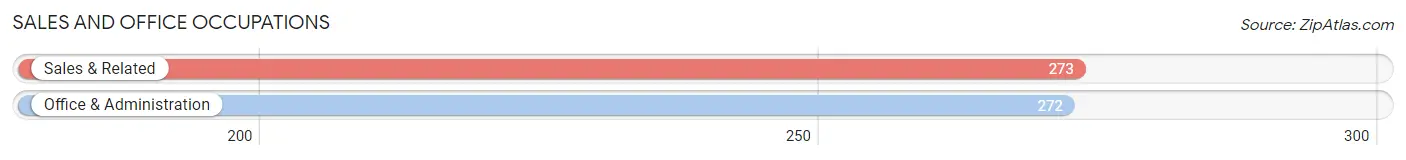
Sales and Office Occupations
The most common Sales and Office occupations in Richland Center are Sales & Related (273 | 10.6%), and Office & Administration (272 | 10.6%).
Sales and Office Occupations by Sex
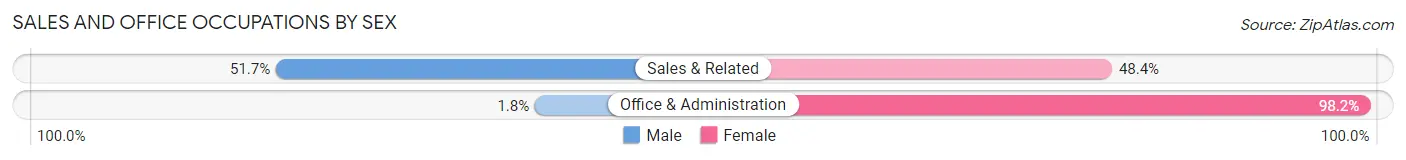
| Occupation | Male | Female |
| Sales & Related | 141 (51.6%) | 132 (48.3%) |
| Office & Administration | 5 (1.8%) | 267 (98.2%) |
| Total (Category) | 146 (26.8%) | 399 (73.2%) |
| Total (Overall) | 1,259 (49.1%) | 1,304 (50.9%) |
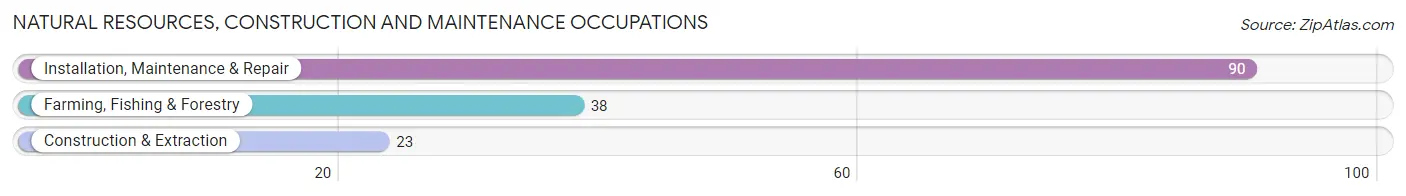
Natural Resources, Construction and Maintenance Occupations
The most common Natural Resources, Construction and Maintenance occupations in Richland Center are Installation, Maintenance & Repair (90 | 3.5%), Farming, Fishing & Forestry (38 | 1.5%), and Construction & Extraction (23 | 0.9%).
Natural Resources, Construction and Maintenance Occupations by Sex
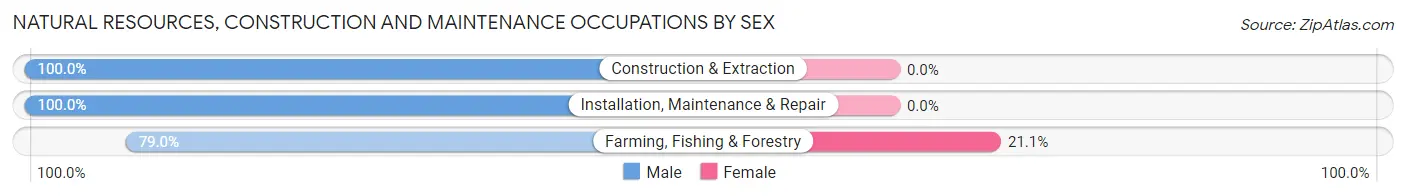
| Occupation | Male | Female |
| Farming, Fishing & Forestry | 30 (78.9%) | 8 (21.0%) |
| Construction & Extraction | 23 (100.0%) | 0 (0.0%) |
| Installation, Maintenance & Repair | 90 (100.0%) | 0 (0.0%) |
| Total (Category) | 143 (94.7%) | 8 (5.3%) |
| Total (Overall) | 1,259 (49.1%) | 1,304 (50.9%) |
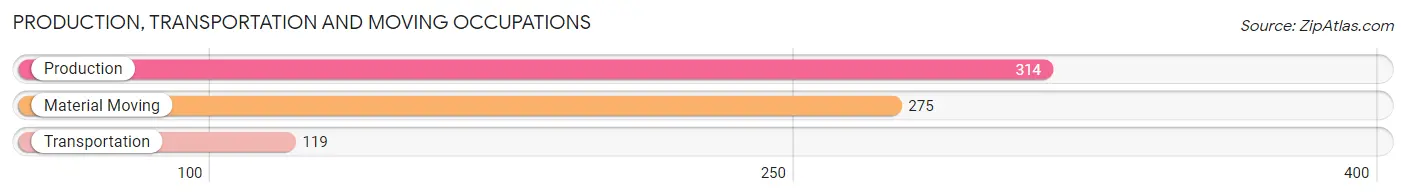
Production, Transportation and Moving Occupations
The most common Production, Transportation and Moving occupations in Richland Center are Production (314 | 12.2%), Material Moving (275 | 10.7%), and Transportation (119 | 4.6%).
Production, Transportation and Moving Occupations by Sex
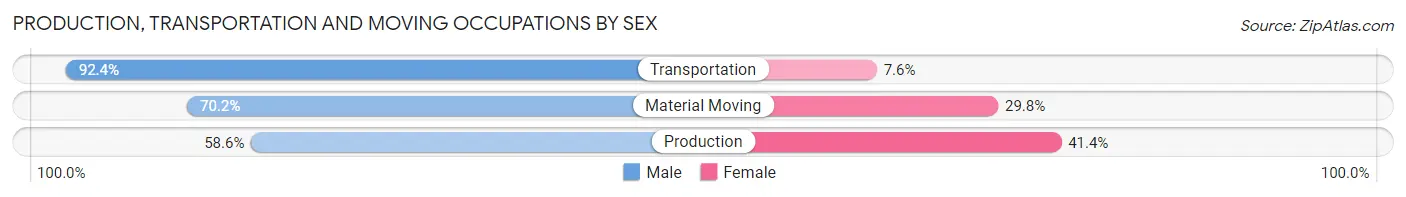
| Occupation | Male | Female |
| Production | 184 (58.6%) | 130 (41.4%) |
| Transportation | 110 (92.4%) | 9 (7.6%) |
| Material Moving | 193 (70.2%) | 82 (29.8%) |
| Total (Category) | 487 (68.8%) | 221 (31.2%) |
| Total (Overall) | 1,259 (49.1%) | 1,304 (50.9%) |
Employment Industries by Sex in Richland Center
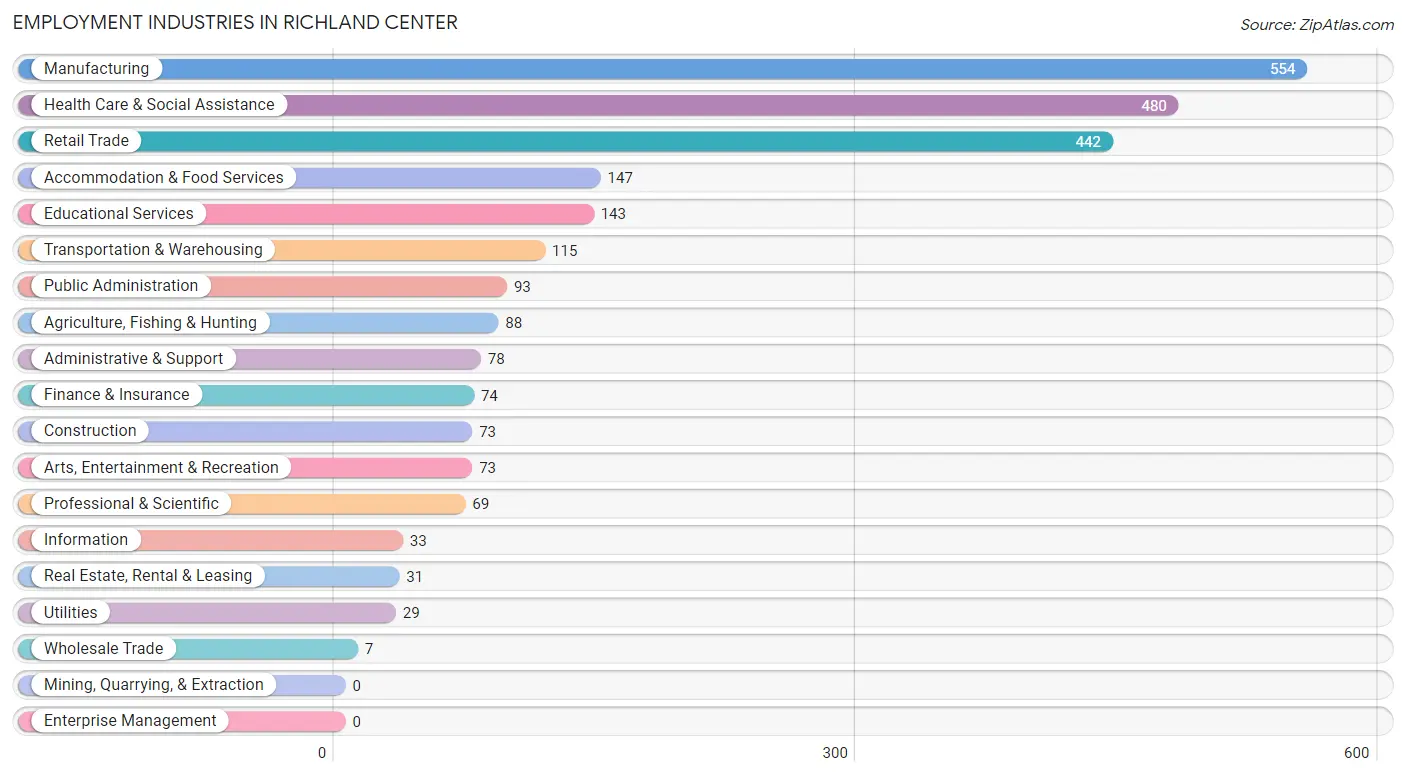
Employment Industries in Richland Center
The major employment industries in Richland Center include Manufacturing (554 | 21.6%), Health Care & Social Assistance (480 | 18.7%), Retail Trade (442 | 17.2%), Accommodation & Food Services (147 | 5.7%), and Educational Services (143 | 5.6%).
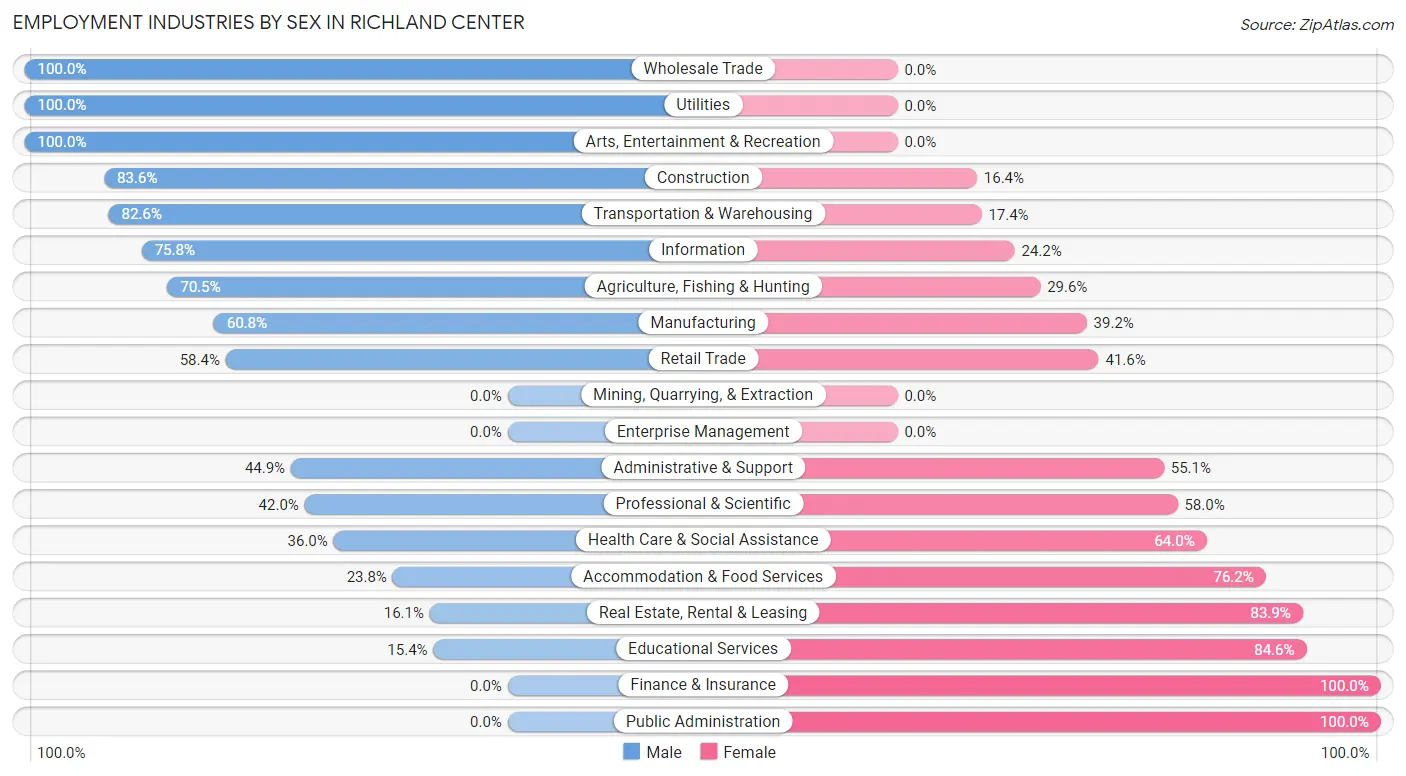
Employment Industries by Sex in Richland Center
The Richland Center industries that see more men than women are Wholesale Trade (100.0%), Utilities (100.0%), and Arts, Entertainment & Recreation (100.0%), whereas the industries that tend to have a higher number of women are Finance & Insurance (100.0%), Public Administration (100.0%), and Educational Services (84.6%).
| Industry | Male | Female |
| Agriculture, Fishing & Hunting | 62 (70.5%) | 26 (29.5%) |
| Mining, Quarrying, & Extraction | 0 (0.0%) | 0 (0.0%) |
| Construction | 61 (83.6%) | 12 (16.4%) |
| Manufacturing | 337 (60.8%) | 217 (39.2%) |
| Wholesale Trade | 7 (100.0%) | 0 (0.0%) |
| Retail Trade | 258 (58.4%) | 184 (41.6%) |
| Transportation & Warehousing | 95 (82.6%) | 20 (17.4%) |
| Utilities | 29 (100.0%) | 0 (0.0%) |
| Information | 25 (75.8%) | 8 (24.2%) |
| Finance & Insurance | 0 (0.0%) | 74 (100.0%) |
| Real Estate, Rental & Leasing | 5 (16.1%) | 26 (83.9%) |
| Professional & Scientific | 29 (42.0%) | 40 (58.0%) |
| Enterprise Management | 0 (0.0%) | 0 (0.0%) |
| Administrative & Support | 35 (44.9%) | 43 (55.1%) |
| Educational Services | 22 (15.4%) | 121 (84.6%) |
| Health Care & Social Assistance | 173 (36.0%) | 307 (64.0%) |
| Arts, Entertainment & Recreation | 73 (100.0%) | 0 (0.0%) |
| Accommodation & Food Services | 35 (23.8%) | 112 (76.2%) |
| Public Administration | 0 (0.0%) | 93 (100.0%) |
| Total | 1,259 (49.1%) | 1,304 (50.9%) |
Education in Richland Center
School Enrollment in Richland Center
The most common levels of schooling among the 1,154 students in Richland Center are college / undergraduate (281 | 24.3%), high school (248 | 21.5%), and elementary school (237 | 20.5%).
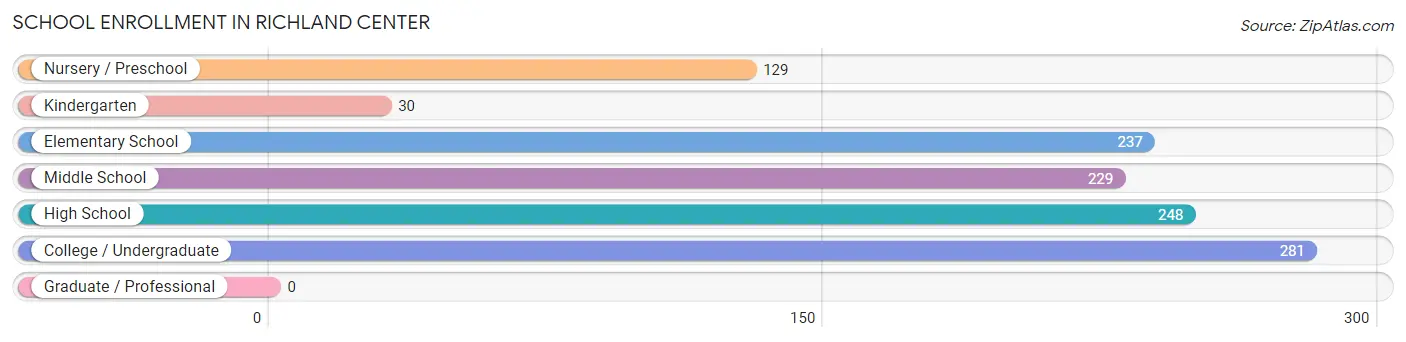
| School Level | # Students | % Students |
| Nursery / Preschool | 129 | 11.2% |
| Kindergarten | 30 | 2.6% |
| Elementary School | 237 | 20.5% |
| Middle School | 229 | 19.8% |
| High School | 248 | 21.5% |
| College / Undergraduate | 281 | 24.3% |
| Graduate / Professional | 0 | 0.0% |
| Total | 1,154 | 100.0% |
School Enrollment by Age by Funding Source in Richland Center
Out of a total of 1,154 students who are enrolled in schools in Richland Center, 300 (26.0%) attend a private institution, while the remaining 854 (74.0%) are enrolled in public schools. The age group of 20 to 24 year olds has the highest likelihood of being enrolled in private schools, with 29 (63.0% in the age bracket) enrolled. Conversely, the age group of 25 to 34 year olds has the lowest likelihood of being enrolled in a private school, with 77 (93.9% in the age bracket) attending a public institution.
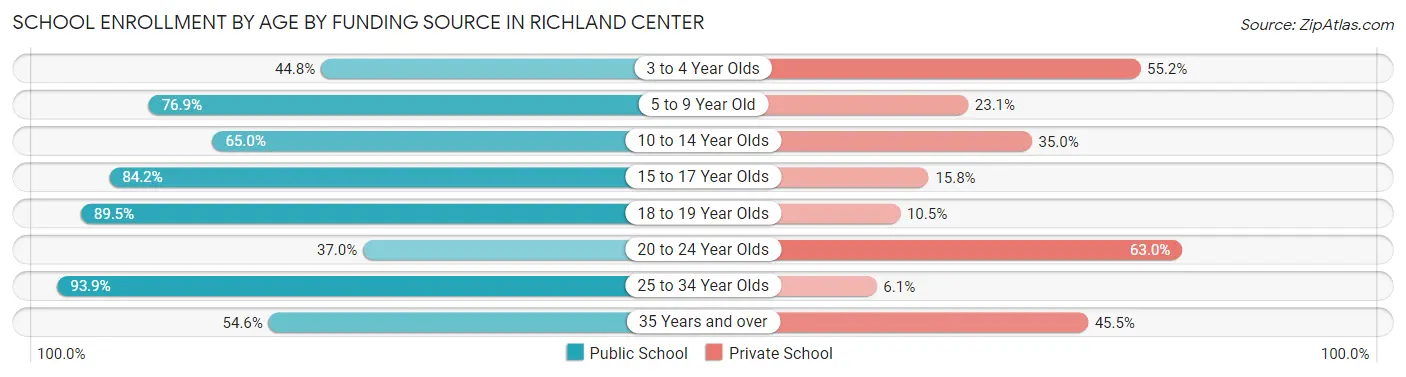
| Age Bracket | Public School | Private School |
| 3 to 4 Year Olds | 30 (44.8%) | 37 (55.2%) |
| 5 to 9 Year Old | 226 (76.9%) | 68 (23.1%) |
| 10 to 14 Year Olds | 182 (65.0%) | 98 (35.0%) |
| 15 to 17 Year Olds | 176 (84.2%) | 33 (15.8%) |
| 18 to 19 Year Olds | 128 (89.5%) | 15 (10.5%) |
| 20 to 24 Year Olds | 17 (37.0%) | 29 (63.0%) |
| 25 to 34 Year Olds | 77 (93.9%) | 5 (6.1%) |
| 35 Years and over | 18 (54.5%) | 15 (45.5%) |
| Total | 854 (74.0%) | 300 (26.0%) |
Educational Attainment by Field of Study in Richland Center
Education (169 | 23.6%), science & technology (124 | 17.3%), bio, nature & agricultural (84 | 11.7%), business (76 | 10.6%), and liberal arts & history (65 | 9.1%) are the most common fields of study among 715 individuals in Richland Center who have obtained a bachelor's degree or higher.
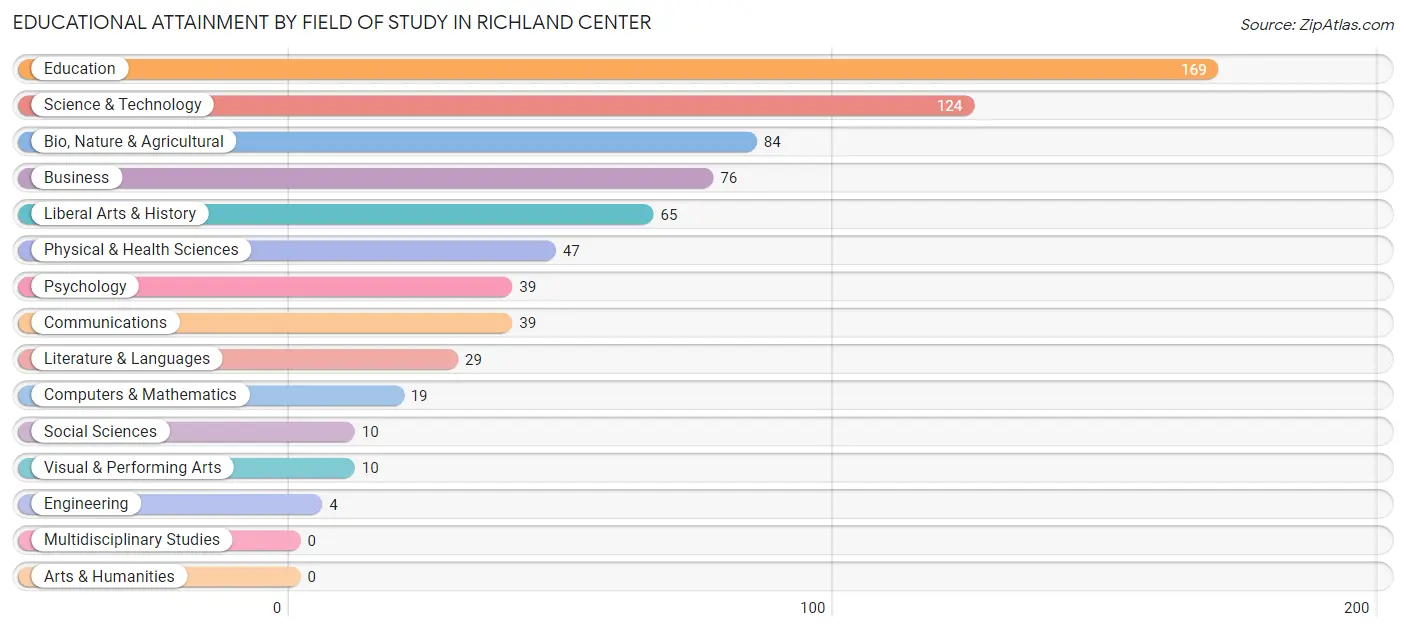
| Field of Study | # Graduates | % Graduates |
| Computers & Mathematics | 19 | 2.7% |
| Bio, Nature & Agricultural | 84 | 11.7% |
| Physical & Health Sciences | 47 | 6.6% |
| Psychology | 39 | 5.4% |
| Social Sciences | 10 | 1.4% |
| Engineering | 4 | 0.6% |
| Multidisciplinary Studies | 0 | 0.0% |
| Science & Technology | 124 | 17.3% |
| Business | 76 | 10.6% |
| Education | 169 | 23.6% |
| Literature & Languages | 29 | 4.1% |
| Liberal Arts & History | 65 | 9.1% |
| Visual & Performing Arts | 10 | 1.4% |
| Communications | 39 | 5.4% |
| Arts & Humanities | 0 | 0.0% |
| Total | 715 | 100.0% |
Transportation & Commute in Richland Center
Vehicle Availability by Sex in Richland Center
The most prevalent vehicle ownership categories in Richland Center are males with 2 vehicles (487, accounting for 38.8%) and females with 2 vehicles (388, making up 39.9%).
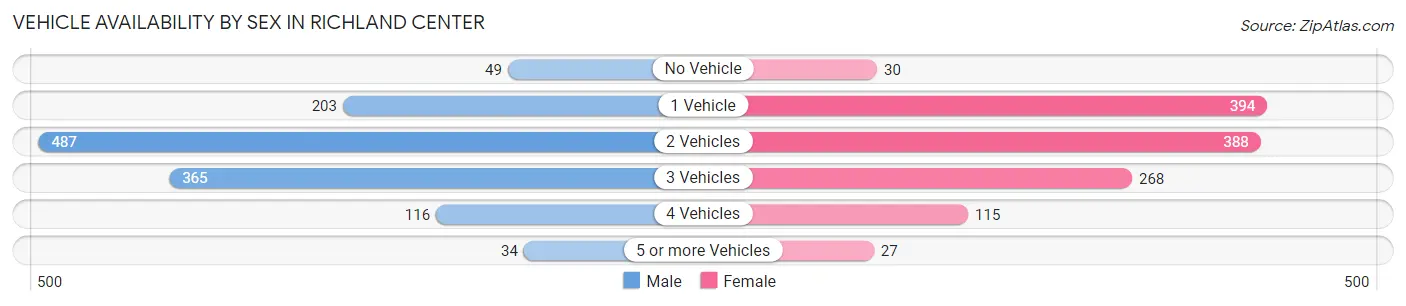
| Vehicles Available | Male | Female |
| No Vehicle | 49 (3.9%) | 30 (2.5%) |
| 1 Vehicle | 203 (16.2%) | 394 (32.2%) |
| 2 Vehicles | 487 (38.8%) | 388 (31.8%) |
| 3 Vehicles | 365 (29.1%) | 268 (21.9%) |
| 4 Vehicles | 116 (9.2%) | 115 (9.4%) |
| 5 or more Vehicles | 34 (2.7%) | 27 (2.2%) |
| Total | 1,254 (100.0%) | 1,222 (100.0%) |
Commute Time in Richland Center
The most frequently occuring commute durations in Richland Center are 5 to 9 minutes (742 commuters, 31.3%), 10 to 14 minutes (531 commuters, 22.4%), and 15 to 19 minutes (269 commuters, 11.3%).
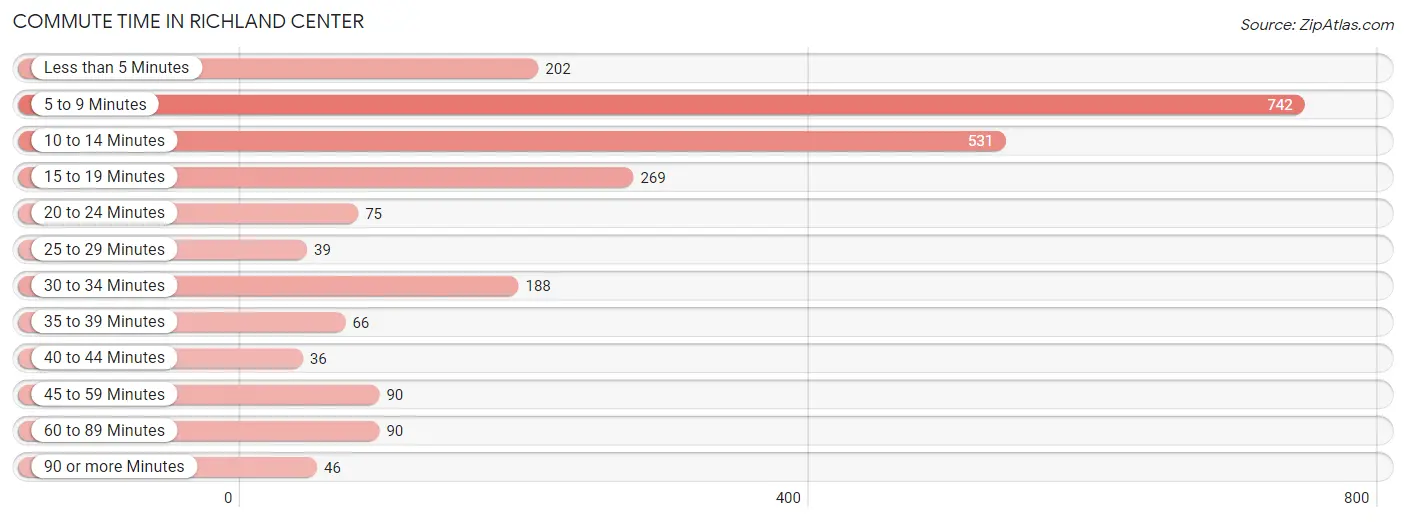
| Commute Time | # Commuters | % Commuters |
| Less than 5 Minutes | 202 | 8.5% |
| 5 to 9 Minutes | 742 | 31.3% |
| 10 to 14 Minutes | 531 | 22.4% |
| 15 to 19 Minutes | 269 | 11.3% |
| 20 to 24 Minutes | 75 | 3.2% |
| 25 to 29 Minutes | 39 | 1.6% |
| 30 to 34 Minutes | 188 | 7.9% |
| 35 to 39 Minutes | 66 | 2.8% |
| 40 to 44 Minutes | 36 | 1.5% |
| 45 to 59 Minutes | 90 | 3.8% |
| 60 to 89 Minutes | 90 | 3.8% |
| 90 or more Minutes | 46 | 1.9% |
Commute Time by Sex in Richland Center
The most common commute times in Richland Center are 5 to 9 minutes (377 commuters, 31.5%) for males and 5 to 9 minutes (365 commuters, 31.0%) for females.
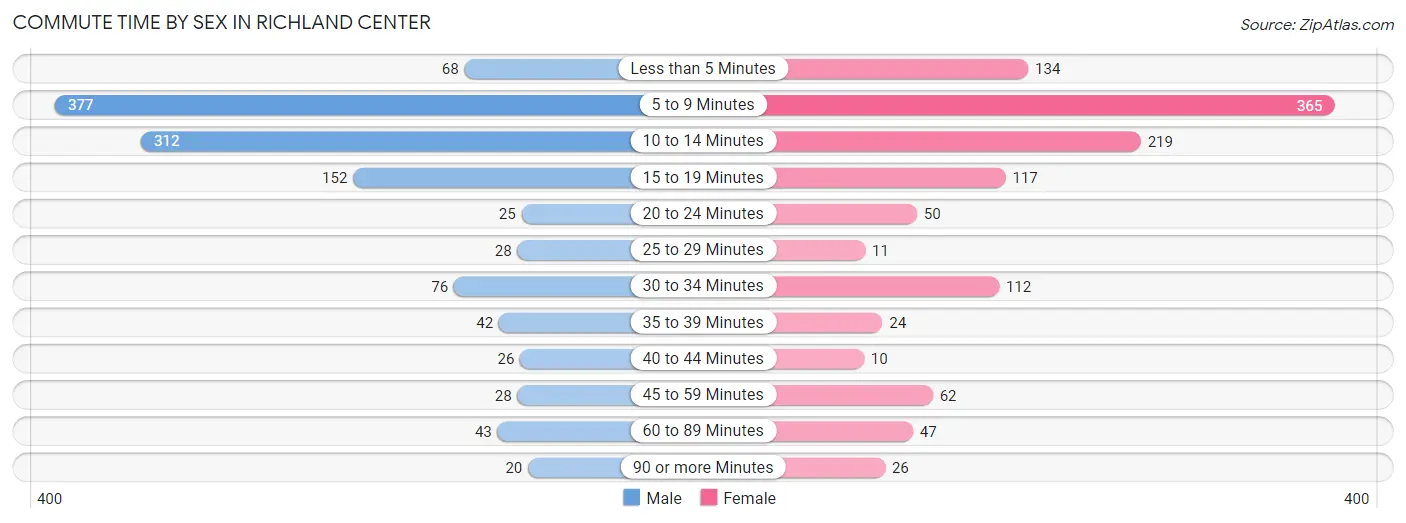
| Commute Time | Male | Female |
| Less than 5 Minutes | 68 (5.7%) | 134 (11.4%) |
| 5 to 9 Minutes | 377 (31.5%) | 365 (31.0%) |
| 10 to 14 Minutes | 312 (26.1%) | 219 (18.6%) |
| 15 to 19 Minutes | 152 (12.7%) | 117 (9.9%) |
| 20 to 24 Minutes | 25 (2.1%) | 50 (4.3%) |
| 25 to 29 Minutes | 28 (2.3%) | 11 (0.9%) |
| 30 to 34 Minutes | 76 (6.4%) | 112 (9.5%) |
| 35 to 39 Minutes | 42 (3.5%) | 24 (2.0%) |
| 40 to 44 Minutes | 26 (2.2%) | 10 (0.9%) |
| 45 to 59 Minutes | 28 (2.3%) | 62 (5.3%) |
| 60 to 89 Minutes | 43 (3.6%) | 47 (4.0%) |
| 90 or more Minutes | 20 (1.7%) | 26 (2.2%) |
Time of Departure to Work by Sex in Richland Center
The most frequent times of departure to work in Richland Center are 6:30 AM to 6:59 AM (195, 16.3%) for males and 4:00 PM to 11:59 PM (185, 15.7%) for females.
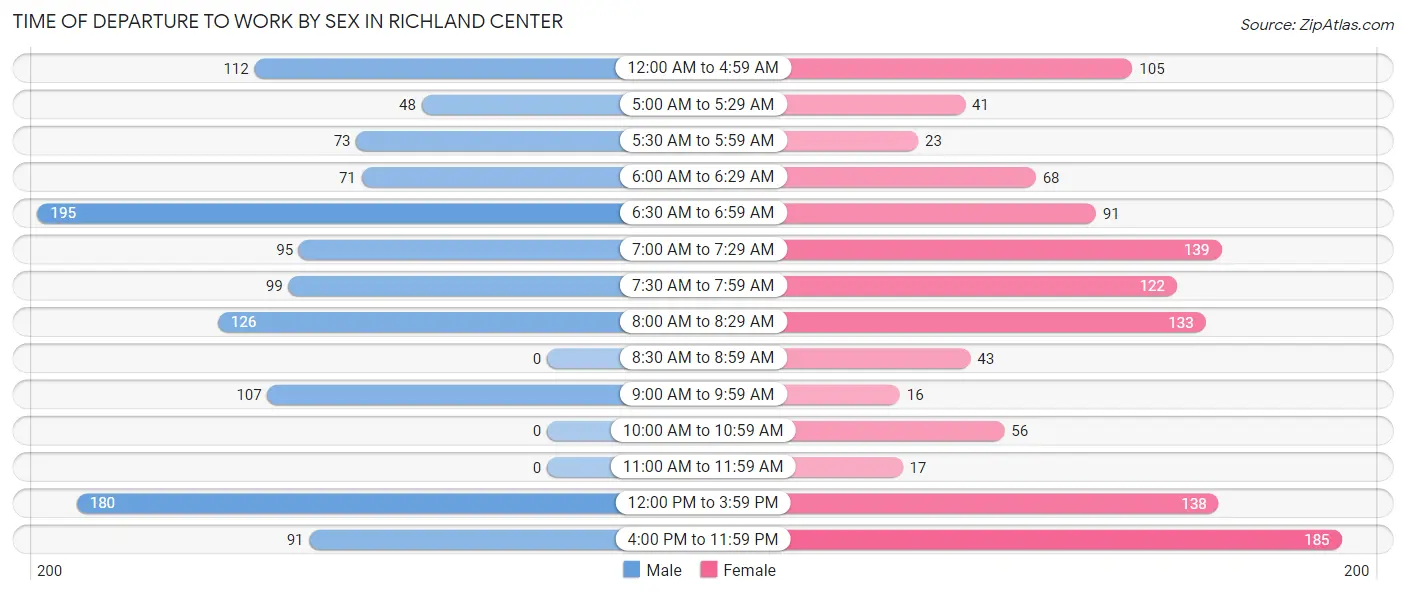
| Time of Departure | Male | Female |
| 12:00 AM to 4:59 AM | 112 (9.4%) | 105 (8.9%) |
| 5:00 AM to 5:29 AM | 48 (4.0%) | 41 (3.5%) |
| 5:30 AM to 5:59 AM | 73 (6.1%) | 23 (1.9%) |
| 6:00 AM to 6:29 AM | 71 (5.9%) | 68 (5.8%) |
| 6:30 AM to 6:59 AM | 195 (16.3%) | 91 (7.7%) |
| 7:00 AM to 7:29 AM | 95 (7.9%) | 139 (11.8%) |
| 7:30 AM to 7:59 AM | 99 (8.3%) | 122 (10.4%) |
| 8:00 AM to 8:29 AM | 126 (10.5%) | 133 (11.3%) |
| 8:30 AM to 8:59 AM | 0 (0.0%) | 43 (3.6%) |
| 9:00 AM to 9:59 AM | 107 (8.9%) | 16 (1.4%) |
| 10:00 AM to 10:59 AM | 0 (0.0%) | 56 (4.8%) |
| 11:00 AM to 11:59 AM | 0 (0.0%) | 17 (1.4%) |
| 12:00 PM to 3:59 PM | 180 (15.0%) | 138 (11.7%) |
| 4:00 PM to 11:59 PM | 91 (7.6%) | 185 (15.7%) |
| Total | 1,197 (100.0%) | 1,177 (100.0%) |
Housing Occupancy in Richland Center
Occupancy by Ownership in Richland Center
Of the total 2,288 dwellings in Richland Center, owner-occupied units account for 1,337 (58.4%), while renter-occupied units make up 951 (41.6%).
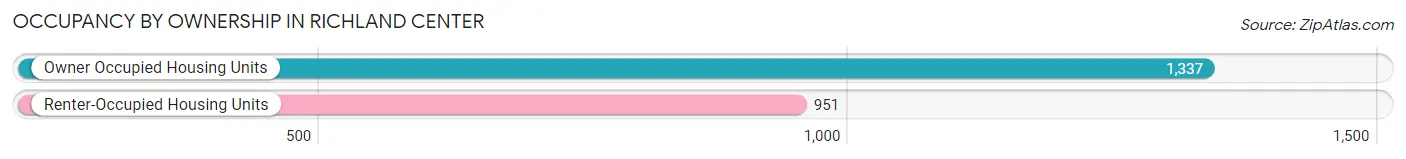
| Occupancy | # Housing Units | % Housing Units |
| Owner Occupied Housing Units | 1,337 | 58.4% |
| Renter-Occupied Housing Units | 951 | 41.6% |
| Total Occupied Housing Units | 2,288 | 100.0% |
Occupancy by Household Size in Richland Center
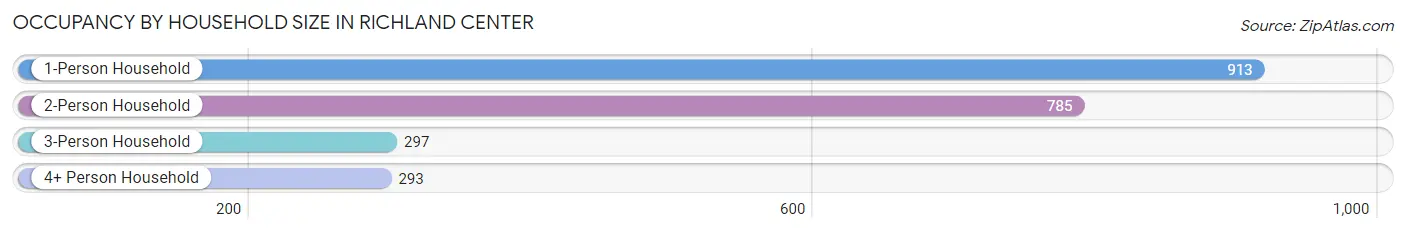
| Household Size | # Housing Units | % Housing Units |
| 1-Person Household | 913 | 39.9% |
| 2-Person Household | 785 | 34.3% |
| 3-Person Household | 297 | 13.0% |
| 4+ Person Household | 293 | 12.8% |
| Total Housing Units | 2,288 | 100.0% |
Occupancy by Ownership by Household Size in Richland Center
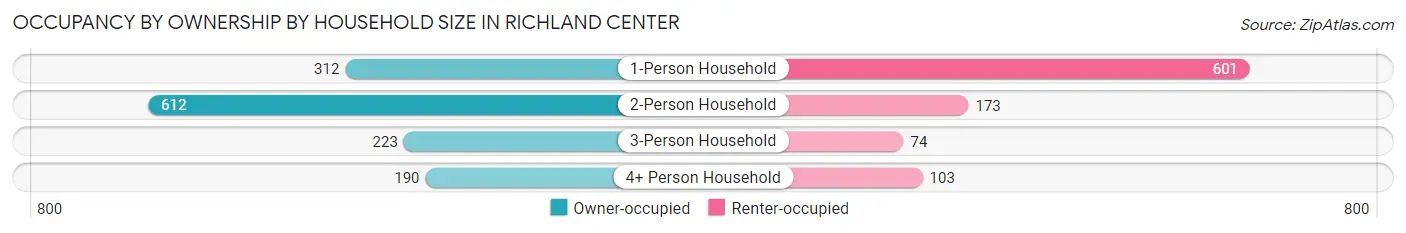
| Household Size | Owner-occupied | Renter-occupied |
| 1-Person Household | 312 (34.2%) | 601 (65.8%) |
| 2-Person Household | 612 (78.0%) | 173 (22.0%) |
| 3-Person Household | 223 (75.1%) | 74 (24.9%) |
| 4+ Person Household | 190 (64.8%) | 103 (35.1%) |
| Total Housing Units | 1,337 (58.4%) | 951 (41.6%) |
Occupancy by Educational Attainment in Richland Center
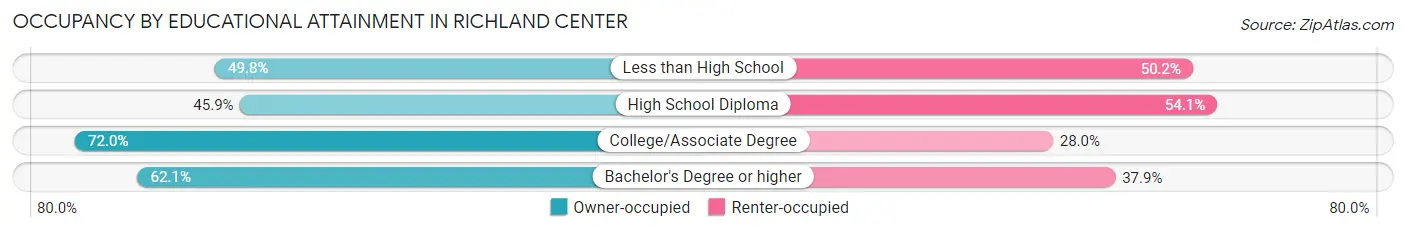
| Household Size | Owner-occupied | Renter-occupied |
| Less than High School | 116 (49.8%) | 117 (50.2%) |
| High School Diploma | 378 (45.9%) | 445 (54.1%) |
| College/Associate Degree | 568 (72.0%) | 221 (28.0%) |
| Bachelor's Degree or higher | 275 (62.1%) | 168 (37.9%) |
Occupancy by Age of Householder in Richland Center
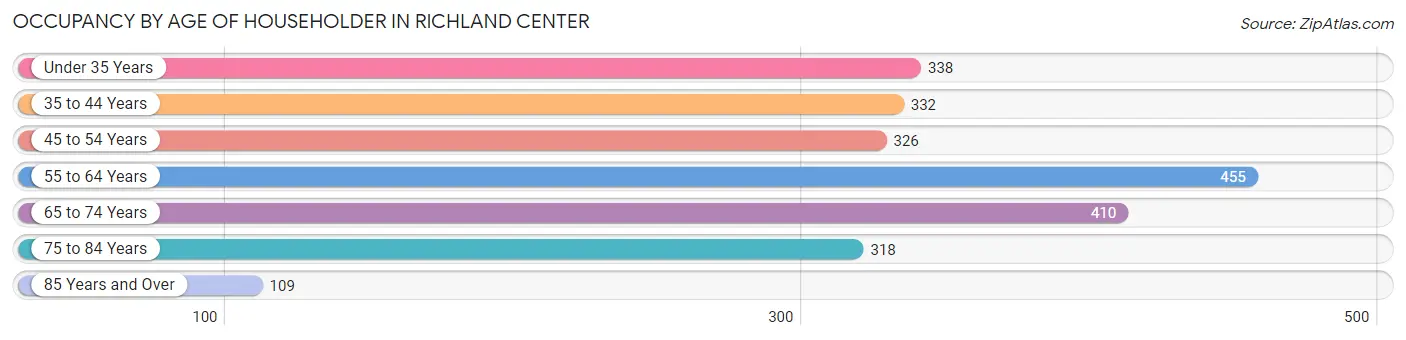
| Age Bracket | # Households | % Households |
| Under 35 Years | 338 | 14.8% |
| 35 to 44 Years | 332 | 14.5% |
| 45 to 54 Years | 326 | 14.2% |
| 55 to 64 Years | 455 | 19.9% |
| 65 to 74 Years | 410 | 17.9% |
| 75 to 84 Years | 318 | 13.9% |
| 85 Years and Over | 109 | 4.8% |
| Total | 2,288 | 100.0% |
Housing Finances in Richland Center
Median Income by Occupancy in Richland Center
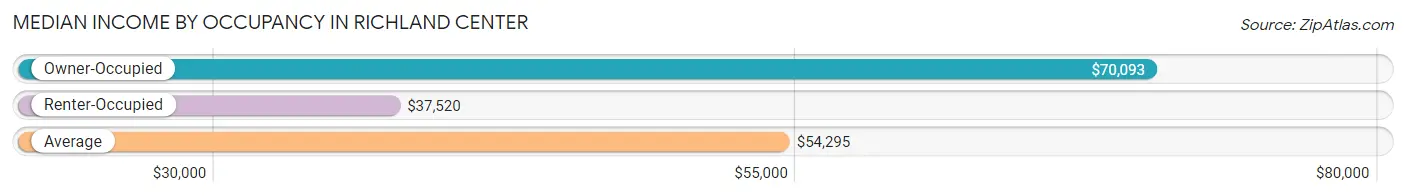
| Occupancy Type | # Households | Median Income |
| Owner-Occupied | 1,337 (58.4%) | $70,093 |
| Renter-Occupied | 951 (41.6%) | $37,520 |
| Average | 2,288 (100.0%) | $54,295 |
Occupancy by Householder Income Bracket in Richland Center
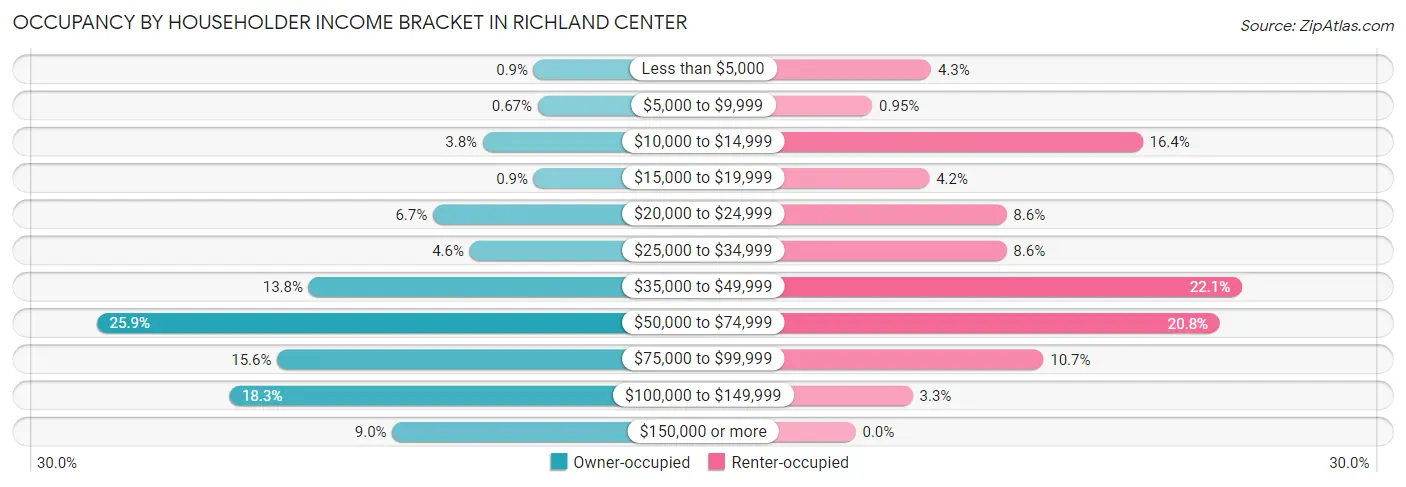
| Income Bracket | Owner-occupied | Renter-occupied |
| Less than $5,000 | 12 (0.9%) | 41 (4.3%) |
| $5,000 to $9,999 | 9 (0.7%) | 9 (0.9%) |
| $10,000 to $14,999 | 51 (3.8%) | 156 (16.4%) |
| $15,000 to $19,999 | 12 (0.9%) | 40 (4.2%) |
| $20,000 to $24,999 | 89 (6.7%) | 82 (8.6%) |
| $25,000 to $34,999 | 61 (4.6%) | 82 (8.6%) |
| $35,000 to $49,999 | 184 (13.8%) | 210 (22.1%) |
| $50,000 to $74,999 | 346 (25.9%) | 198 (20.8%) |
| $75,000 to $99,999 | 208 (15.6%) | 102 (10.7%) |
| $100,000 to $149,999 | 245 (18.3%) | 31 (3.3%) |
| $150,000 or more | 120 (9.0%) | 0 (0.0%) |
| Total | 1,337 (100.0%) | 951 (100.0%) |
Monthly Housing Cost Tiers in Richland Center
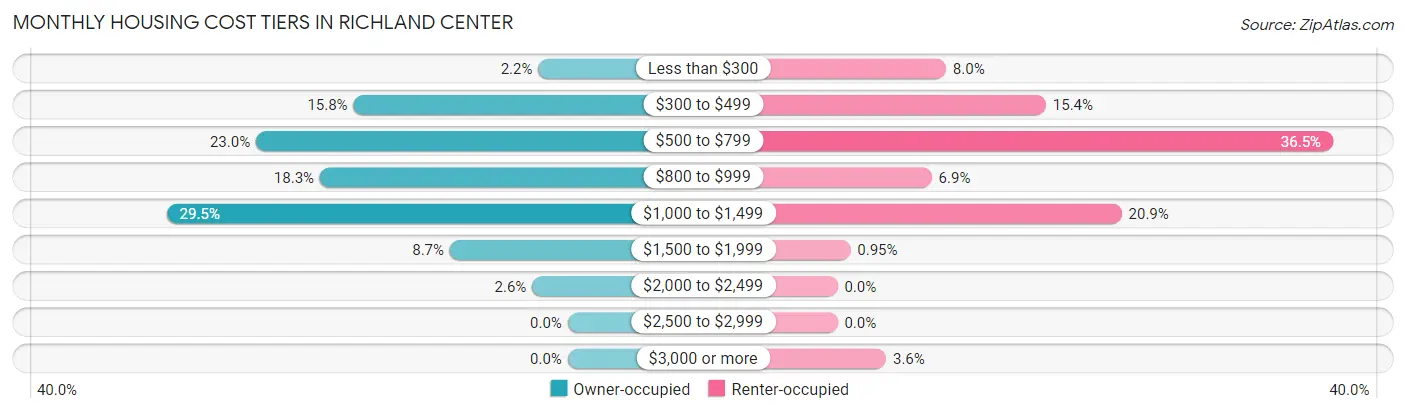
| Monthly Cost | Owner-occupied | Renter-occupied |
| Less than $300 | 29 (2.2%) | 76 (8.0%) |
| $300 to $499 | 211 (15.8%) | 146 (15.3%) |
| $500 to $799 | 307 (23.0%) | 347 (36.5%) |
| $800 to $999 | 244 (18.2%) | 66 (6.9%) |
| $1,000 to $1,499 | 395 (29.5%) | 199 (20.9%) |
| $1,500 to $1,999 | 116 (8.7%) | 9 (0.9%) |
| $2,000 to $2,499 | 35 (2.6%) | 0 (0.0%) |
| $2,500 to $2,999 | 0 (0.0%) | 0 (0.0%) |
| $3,000 or more | 0 (0.0%) | 34 (3.6%) |
| Total | 1,337 (100.0%) | 951 (100.0%) |
Physical Housing Characteristics in Richland Center
Housing Structures in Richland Center
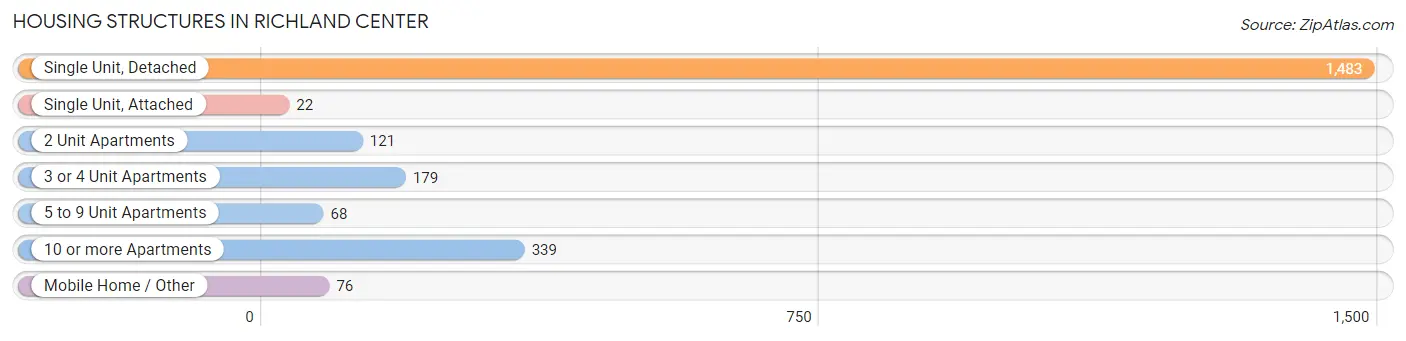
| Structure Type | # Housing Units | % Housing Units |
| Single Unit, Detached | 1,483 | 64.8% |
| Single Unit, Attached | 22 | 1.0% |
| 2 Unit Apartments | 121 | 5.3% |
| 3 or 4 Unit Apartments | 179 | 7.8% |
| 5 to 9 Unit Apartments | 68 | 3.0% |
| 10 or more Apartments | 339 | 14.8% |
| Mobile Home / Other | 76 | 3.3% |
| Total | 2,288 | 100.0% |
Housing Structures by Occupancy in Richland Center
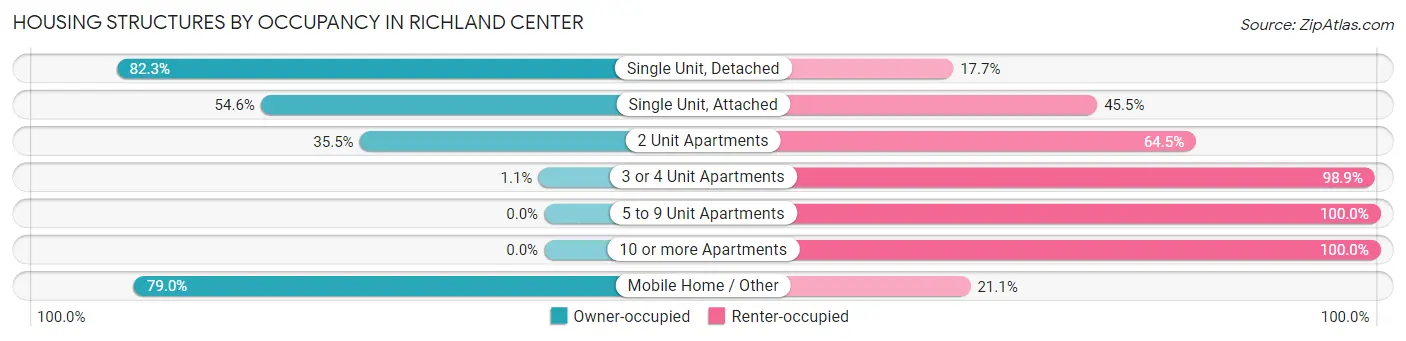
| Structure Type | Owner-occupied | Renter-occupied |
| Single Unit, Detached | 1,220 (82.3%) | 263 (17.7%) |
| Single Unit, Attached | 12 (54.5%) | 10 (45.5%) |
| 2 Unit Apartments | 43 (35.5%) | 78 (64.5%) |
| 3 or 4 Unit Apartments | 2 (1.1%) | 177 (98.9%) |
| 5 to 9 Unit Apartments | 0 (0.0%) | 68 (100.0%) |
| 10 or more Apartments | 0 (0.0%) | 339 (100.0%) |
| Mobile Home / Other | 60 (78.9%) | 16 (21.0%) |
| Total | 1,337 (58.4%) | 951 (41.6%) |
Housing Structures by Number of Rooms in Richland Center
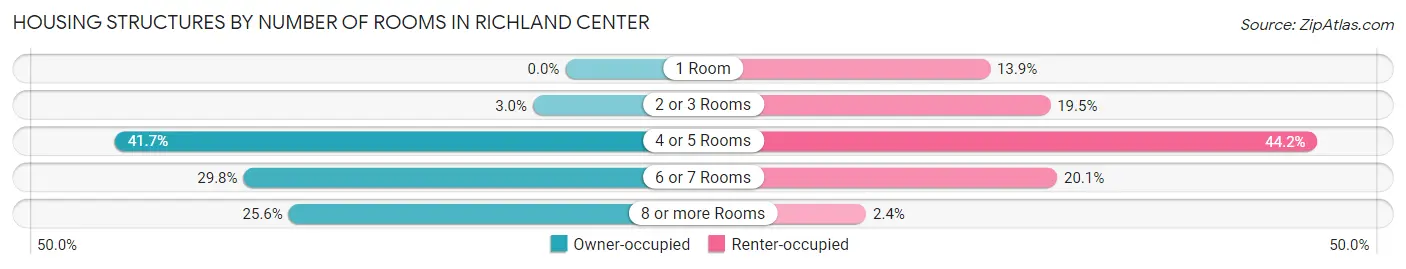
| Number of Rooms | Owner-occupied | Renter-occupied |
| 1 Room | 0 (0.0%) | 132 (13.9%) |
| 2 or 3 Rooms | 40 (3.0%) | 185 (19.5%) |
| 4 or 5 Rooms | 557 (41.7%) | 420 (44.2%) |
| 6 or 7 Rooms | 398 (29.8%) | 191 (20.1%) |
| 8 or more Rooms | 342 (25.6%) | 23 (2.4%) |
| Total | 1,337 (100.0%) | 951 (100.0%) |
Housing Structure by Heating Type in Richland Center
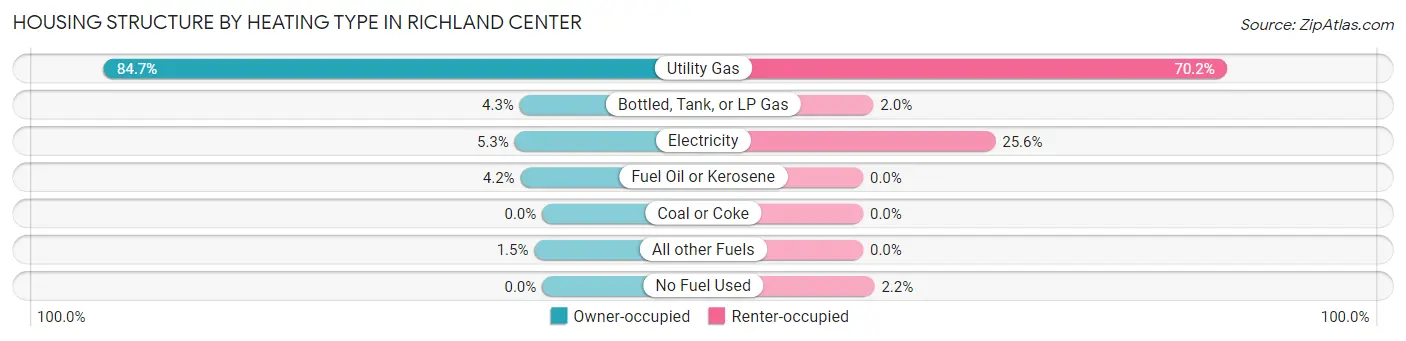
| Heating Type | Owner-occupied | Renter-occupied |
| Utility Gas | 1,132 (84.7%) | 668 (70.2%) |
| Bottled, Tank, or LP Gas | 58 (4.3%) | 19 (2.0%) |
| Electricity | 71 (5.3%) | 243 (25.6%) |
| Fuel Oil or Kerosene | 56 (4.2%) | 0 (0.0%) |
| Coal or Coke | 0 (0.0%) | 0 (0.0%) |
| All other Fuels | 20 (1.5%) | 0 (0.0%) |
| No Fuel Used | 0 (0.0%) | 21 (2.2%) |
| Total | 1,337 (100.0%) | 951 (100.0%) |
Household Vehicle Usage in Richland Center
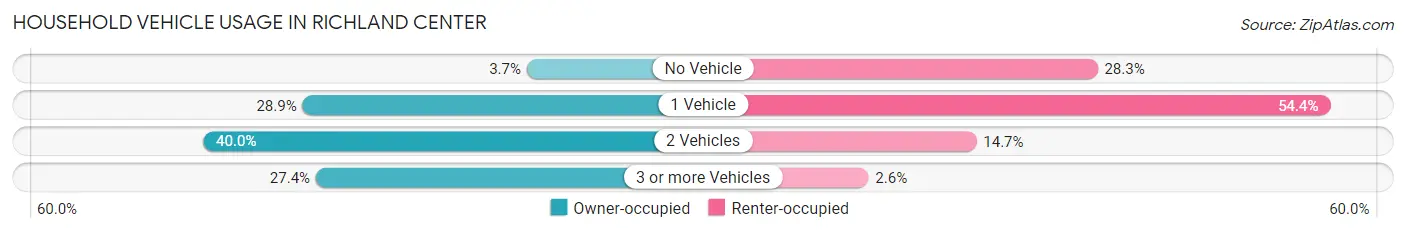
| Vehicles per Household | Owner-occupied | Renter-occupied |
| No Vehicle | 50 (3.7%) | 269 (28.3%) |
| 1 Vehicle | 386 (28.9%) | 517 (54.4%) |
| 2 Vehicles | 535 (40.0%) | 140 (14.7%) |
| 3 or more Vehicles | 366 (27.4%) | 25 (2.6%) |
| Total | 1,337 (100.0%) | 951 (100.0%) |
Real Estate & Mortgages in Richland Center
Real Estate and Mortgage Overview in Richland Center
| Characteristic | Without Mortgage | With Mortgage |
| Housing Units | 494 | 843 |
| Median Property Value | $111,400 | $125,100 |
| Median Household Income | $58,966 | $51 |
| Monthly Housing Costs | $513 | $0 |
| Real Estate Taxes | $2,311 | $0 |
Property Value by Mortgage Status in Richland Center
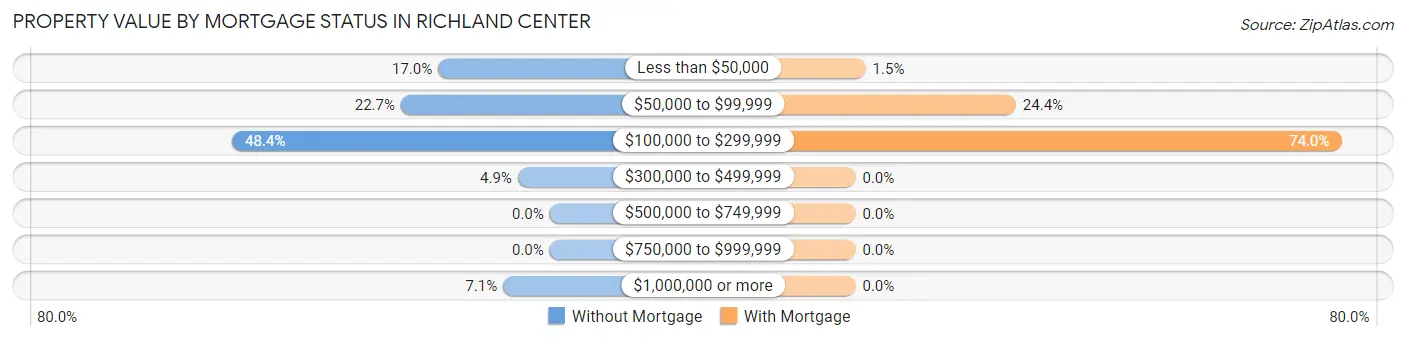
| Property Value | Without Mortgage | With Mortgage |
| Less than $50,000 | 84 (17.0%) | 13 (1.5%) |
| $50,000 to $99,999 | 112 (22.7%) | 206 (24.4%) |
| $100,000 to $299,999 | 239 (48.4%) | 624 (74.0%) |
| $300,000 to $499,999 | 24 (4.9%) | 0 (0.0%) |
| $500,000 to $749,999 | 0 (0.0%) | 0 (0.0%) |
| $750,000 to $999,999 | 0 (0.0%) | 0 (0.0%) |
| $1,000,000 or more | 35 (7.1%) | 0 (0.0%) |
| Total | 494 (100.0%) | 843 (100.0%) |
Household Income by Mortgage Status in Richland Center
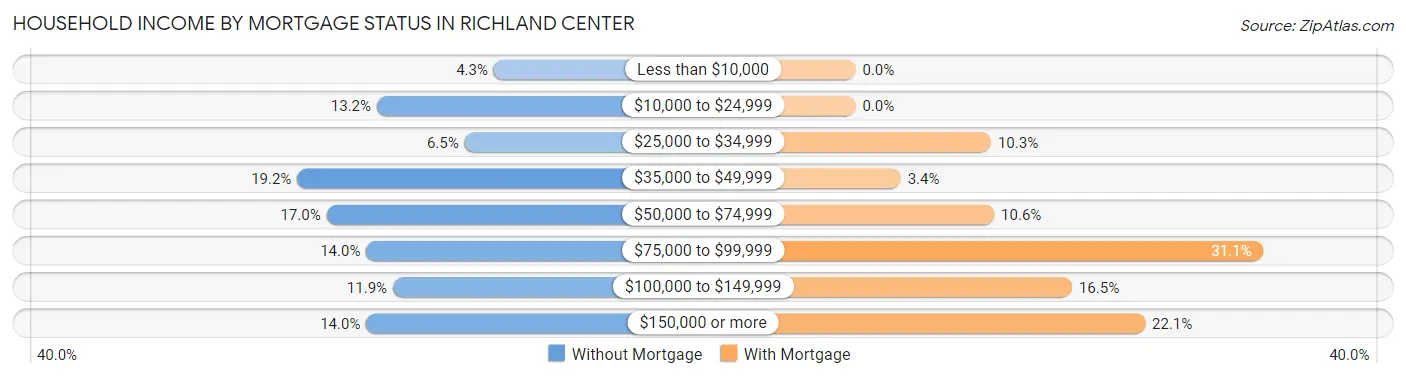
| Household Income | Without Mortgage | With Mortgage |
| Less than $10,000 | 21 (4.3%) | 0 (0.0%) |
| $10,000 to $24,999 | 65 (13.2%) | 0 (0.0%) |
| $25,000 to $34,999 | 32 (6.5%) | 87 (10.3%) |
| $35,000 to $49,999 | 95 (19.2%) | 29 (3.4%) |
| $50,000 to $74,999 | 84 (17.0%) | 89 (10.6%) |
| $75,000 to $99,999 | 69 (14.0%) | 262 (31.1%) |
| $100,000 to $149,999 | 59 (11.9%) | 139 (16.5%) |
| $150,000 or more | 69 (14.0%) | 186 (22.1%) |
| Total | 494 (100.0%) | 843 (100.0%) |
Property Value to Household Income Ratio in Richland Center
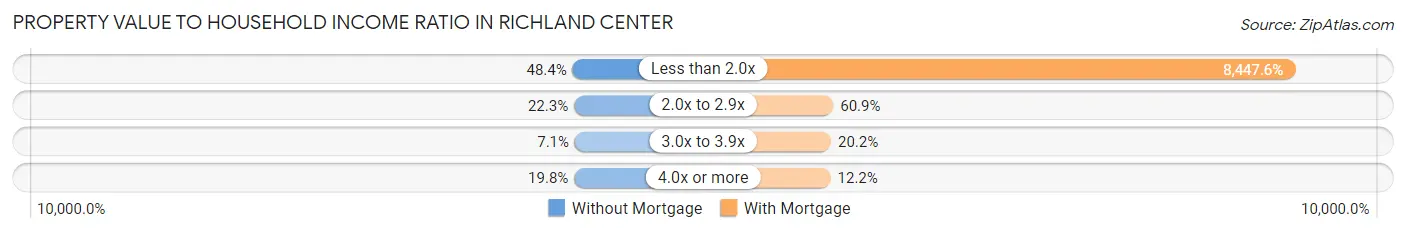
| Value-to-Income Ratio | Without Mortgage | With Mortgage |
| Less than 2.0x | 239 (48.4%) | 71,213 (8,447.6%) |
| 2.0x to 2.9x | 110 (22.3%) | 513 (60.9%) |
| 3.0x to 3.9x | 35 (7.1%) | 170 (20.2%) |
| 4.0x or more | 98 (19.8%) | 103 (12.2%) |
| Total | 494 (100.0%) | 843 (100.0%) |
Real Estate Taxes by Mortgage Status in Richland Center
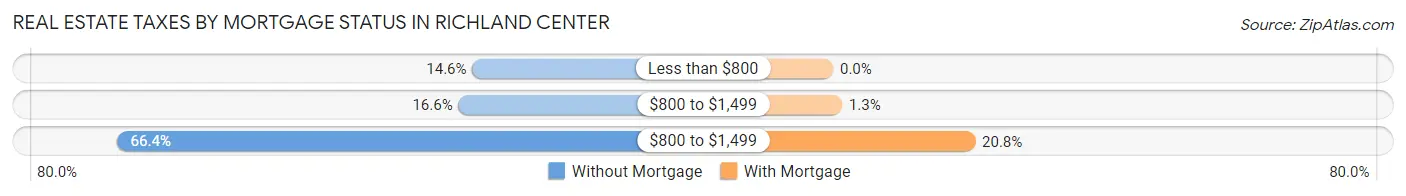
| Property Taxes | Without Mortgage | With Mortgage |
| Less than $800 | 72 (14.6%) | 0 (0.0%) |
| $800 to $1,499 | 82 (16.6%) | 11 (1.3%) |
| $800 to $1,499 | 328 (66.4%) | 175 (20.8%) |
| Total | 494 (100.0%) | 843 (100.0%) |
Health & Disability in Richland Center
Health Insurance Coverage by Age in Richland Center
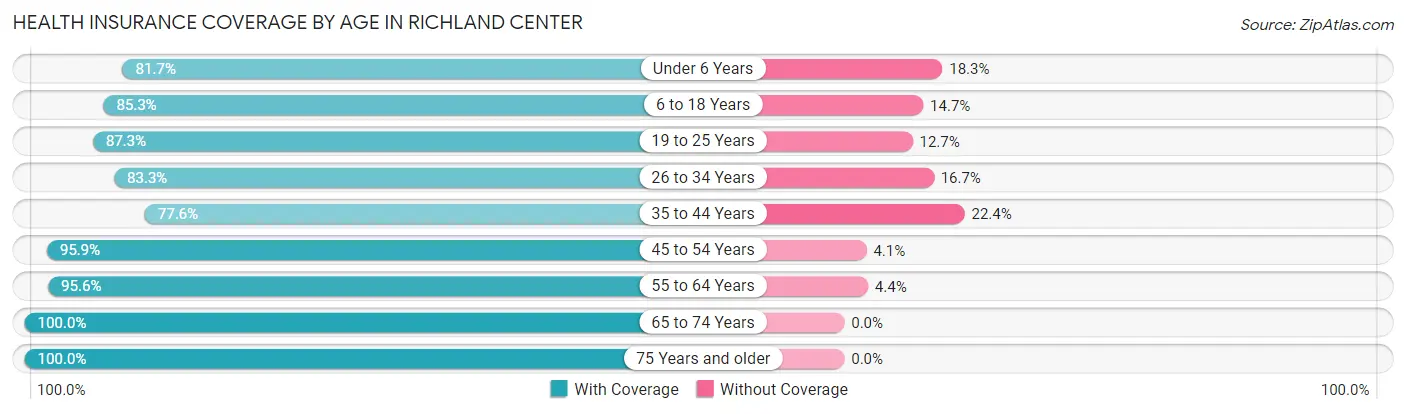
| Age Bracket | With Coverage | Without Coverage |
| Under 6 Years | 246 (81.7%) | 55 (18.3%) |
| 6 to 18 Years | 725 (85.3%) | 125 (14.7%) |
| 19 to 25 Years | 302 (87.3%) | 44 (12.7%) |
| 26 to 34 Years | 380 (83.3%) | 76 (16.7%) |
| 35 to 44 Years | 467 (77.6%) | 135 (22.4%) |
| 45 to 54 Years | 510 (95.9%) | 22 (4.1%) |
| 55 to 64 Years | 696 (95.6%) | 32 (4.4%) |
| 65 to 74 Years | 668 (100.0%) | 0 (0.0%) |
| 75 Years and older | 526 (100.0%) | 0 (0.0%) |
| Total | 4,520 (90.2%) | 489 (9.8%) |
Health Insurance Coverage by Citizenship Status in Richland Center
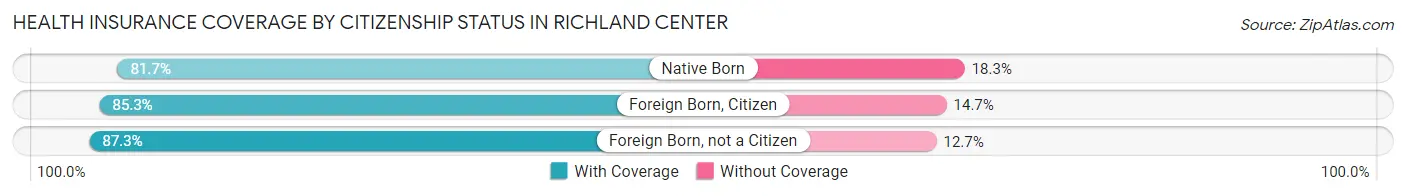
| Citizenship Status | With Coverage | Without Coverage |
| Native Born | 246 (81.7%) | 55 (18.3%) |
| Foreign Born, Citizen | 725 (85.3%) | 125 (14.7%) |
| Foreign Born, not a Citizen | 302 (87.3%) | 44 (12.7%) |
Health Insurance Coverage by Household Income in Richland Center
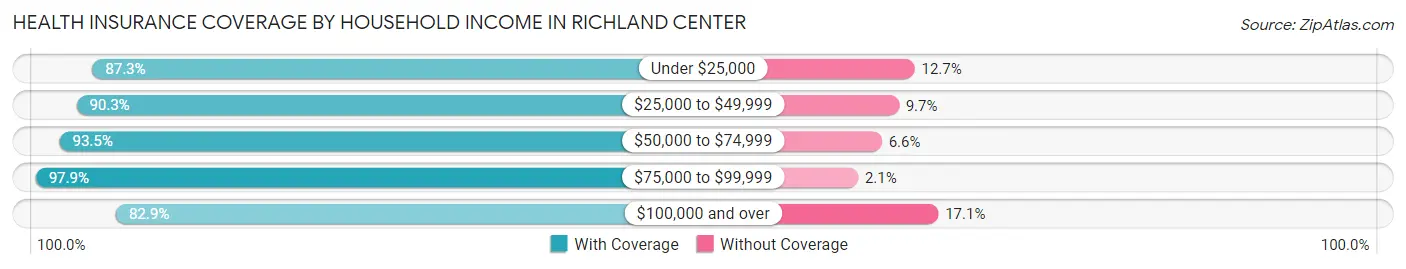
| Household Income | With Coverage | Without Coverage |
| Under $25,000 | 715 (87.3%) | 104 (12.7%) |
| $25,000 to $49,999 | 836 (90.3%) | 90 (9.7%) |
| $50,000 to $74,999 | 956 (93.4%) | 67 (6.6%) |
| $75,000 to $99,999 | 890 (97.9%) | 19 (2.1%) |
| $100,000 and over | 1,011 (82.9%) | 209 (17.1%) |
Public vs Private Health Insurance Coverage by Age in Richland Center
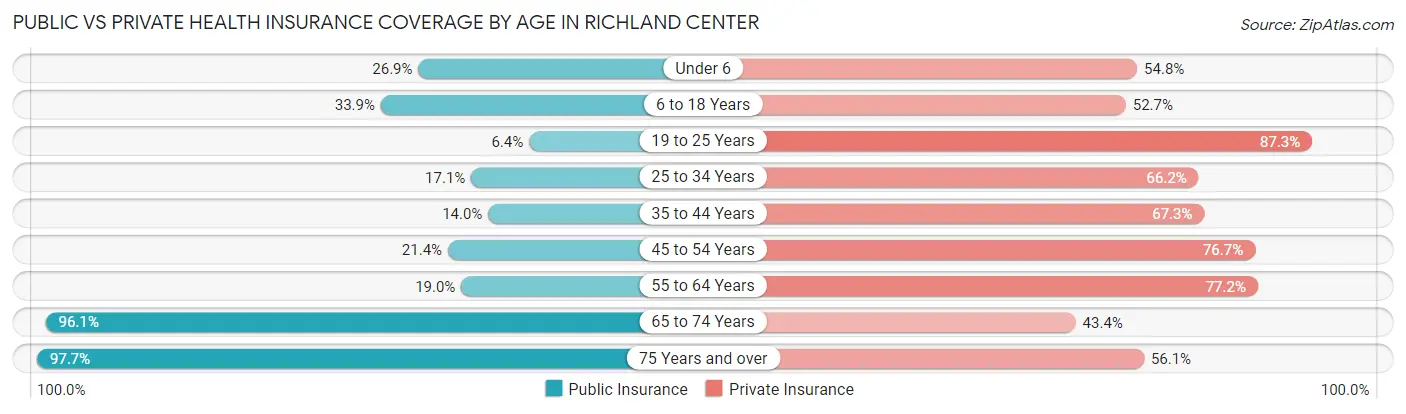
| Age Bracket | Public Insurance | Private Insurance |
| Under 6 | 81 (26.9%) | 165 (54.8%) |
| 6 to 18 Years | 288 (33.9%) | 448 (52.7%) |
| 19 to 25 Years | 22 (6.4%) | 302 (87.3%) |
| 25 to 34 Years | 78 (17.1%) | 302 (66.2%) |
| 35 to 44 Years | 84 (14.0%) | 405 (67.3%) |
| 45 to 54 Years | 114 (21.4%) | 408 (76.7%) |
| 55 to 64 Years | 138 (19.0%) | 562 (77.2%) |
| 65 to 74 Years | 642 (96.1%) | 290 (43.4%) |
| 75 Years and over | 514 (97.7%) | 295 (56.1%) |
| Total | 1,961 (39.2%) | 3,177 (63.4%) |
Disability Status by Sex by Age in Richland Center
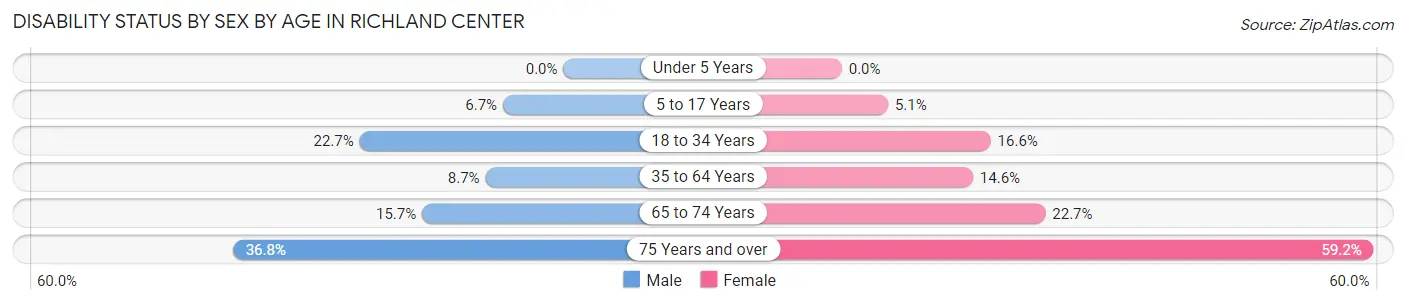
| Age Bracket | Male | Female |
| Under 5 Years | 0 (0.0%) | 0 (0.0%) |
| 5 to 17 Years | 22 (6.7%) | 24 (5.1%) |
| 18 to 34 Years | 84 (22.7%) | 93 (16.6%) |
| 35 to 64 Years | 76 (8.7%) | 144 (14.6%) |
| 65 to 74 Years | 51 (15.7%) | 78 (22.7%) |
| 75 Years and over | 88 (36.8%) | 170 (59.2%) |
Disability Class by Sex by Age in Richland Center
Disability Class: Hearing Difficulty
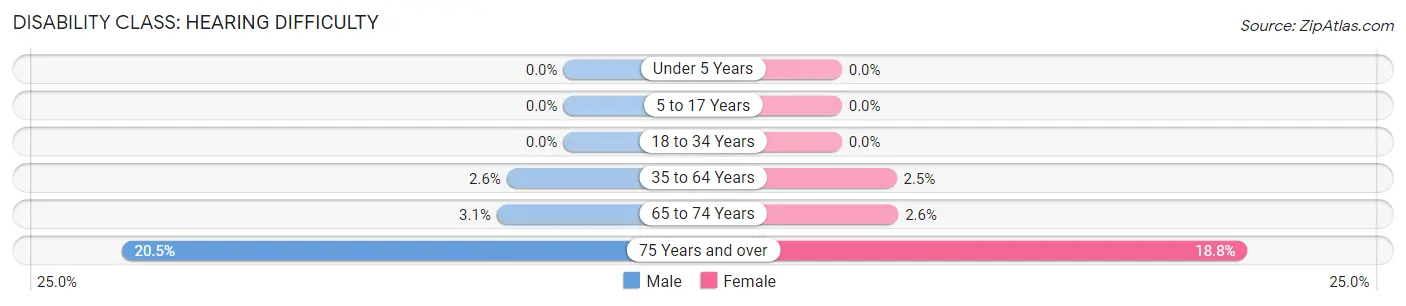
| Age Bracket | Male | Female |
| Under 5 Years | 0 (0.0%) | 0 (0.0%) |
| 5 to 17 Years | 0 (0.0%) | 0 (0.0%) |
| 18 to 34 Years | 0 (0.0%) | 0 (0.0%) |
| 35 to 64 Years | 23 (2.6%) | 25 (2.5%) |
| 65 to 74 Years | 10 (3.1%) | 9 (2.6%) |
| 75 Years and over | 49 (20.5%) | 54 (18.8%) |
Disability Class: Vision Difficulty
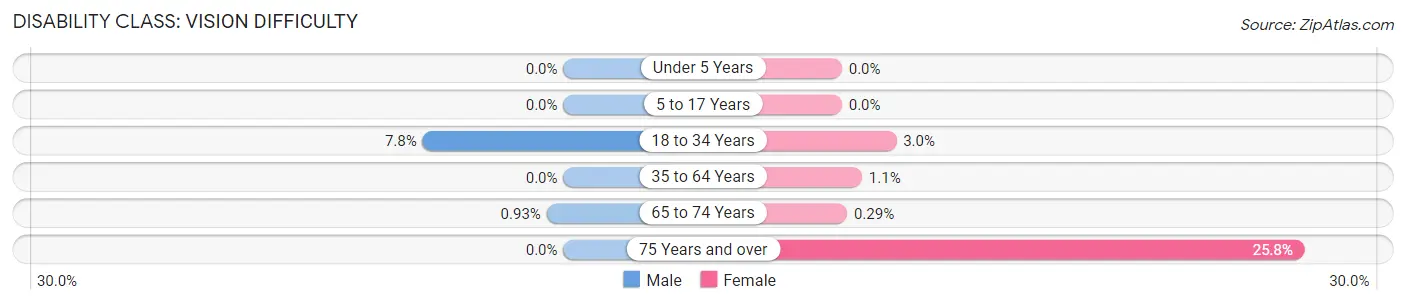
| Age Bracket | Male | Female |
| Under 5 Years | 0 (0.0%) | 0 (0.0%) |
| 5 to 17 Years | 0 (0.0%) | 0 (0.0%) |
| 18 to 34 Years | 29 (7.8%) | 17 (3.0%) |
| 35 to 64 Years | 0 (0.0%) | 11 (1.1%) |
| 65 to 74 Years | 3 (0.9%) | 1 (0.3%) |
| 75 Years and over | 0 (0.0%) | 74 (25.8%) |
Disability Class: Cognitive Difficulty
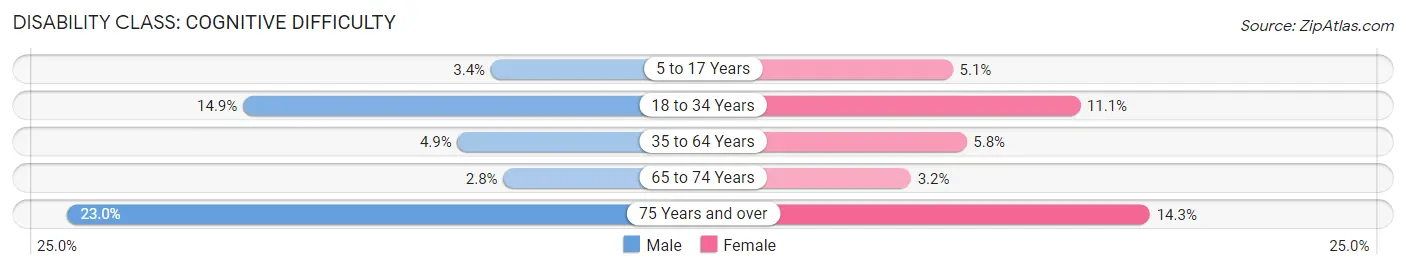
| Age Bracket | Male | Female |
| 5 to 17 Years | 11 (3.4%) | 24 (5.1%) |
| 18 to 34 Years | 55 (14.9%) | 62 (11.1%) |
| 35 to 64 Years | 43 (4.9%) | 57 (5.8%) |
| 65 to 74 Years | 9 (2.8%) | 11 (3.2%) |
| 75 Years and over | 55 (23.0%) | 41 (14.3%) |
Disability Class: Ambulatory Difficulty
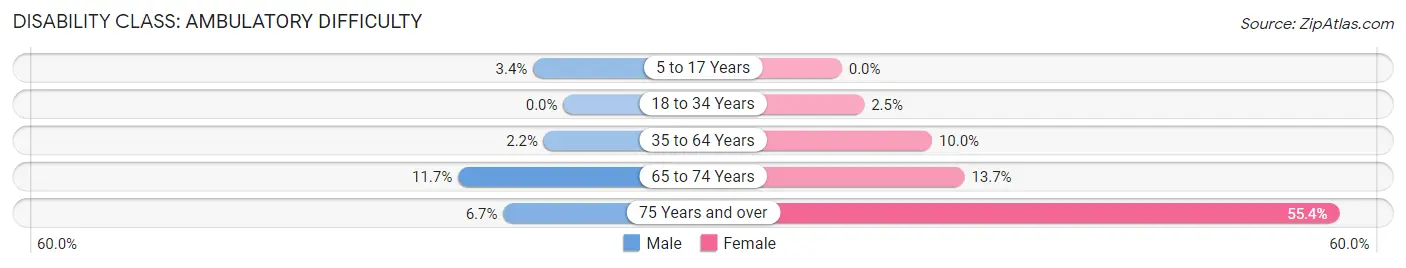
| Age Bracket | Male | Female |
| 5 to 17 Years | 11 (3.4%) | 0 (0.0%) |
| 18 to 34 Years | 0 (0.0%) | 14 (2.5%) |
| 35 to 64 Years | 19 (2.2%) | 99 (10.0%) |
| 65 to 74 Years | 38 (11.7%) | 47 (13.7%) |
| 75 Years and over | 16 (6.7%) | 159 (55.4%) |
Disability Class: Self-Care Difficulty
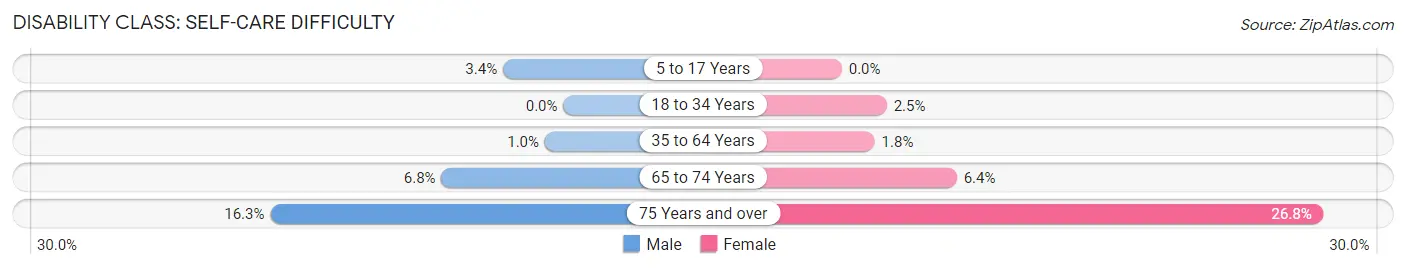
| Age Bracket | Male | Female |
| 5 to 17 Years | 11 (3.4%) | 0 (0.0%) |
| 18 to 34 Years | 0 (0.0%) | 14 (2.5%) |
| 35 to 64 Years | 9 (1.0%) | 18 (1.8%) |
| 65 to 74 Years | 22 (6.8%) | 22 (6.4%) |
| 75 Years and over | 39 (16.3%) | 77 (26.8%) |
Technology Access in Richland Center
Computing Device Access in Richland Center
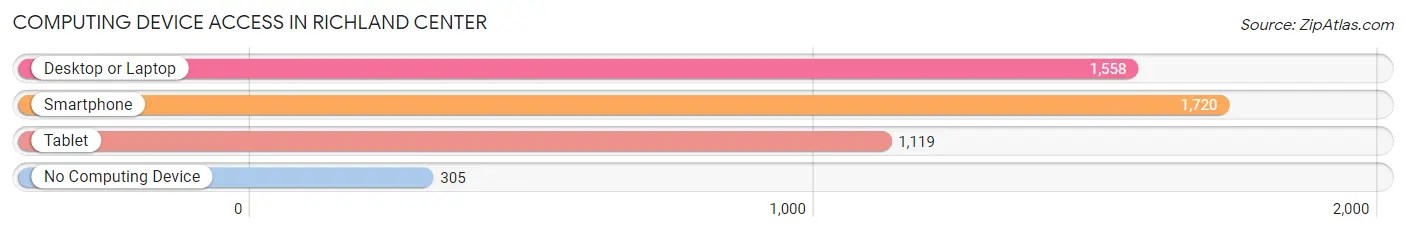
| Device Type | # Households | % Households |
| Desktop or Laptop | 1,558 | 68.1% |
| Smartphone | 1,720 | 75.2% |
| Tablet | 1,119 | 48.9% |
| No Computing Device | 305 | 13.3% |
| Total | 2,288 | 100.0% |
Internet Access in Richland Center
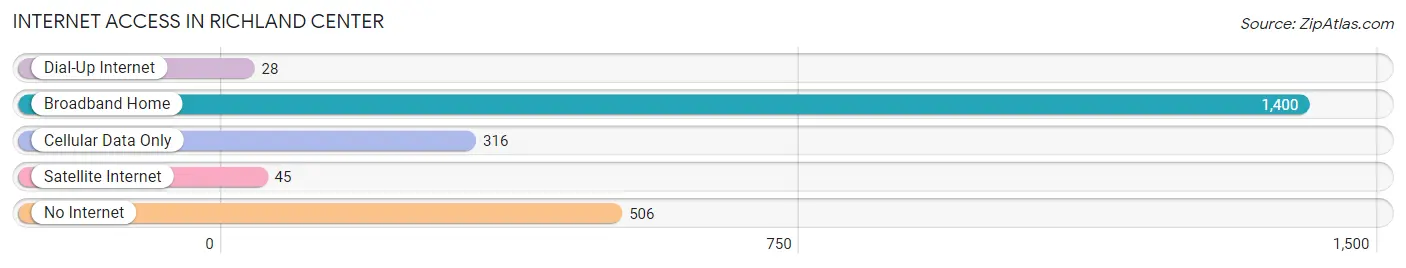
| Internet Type | # Households | % Households |
| Dial-Up Internet | 28 | 1.2% |
| Broadband Home | 1,400 | 61.2% |
| Cellular Data Only | 316 | 13.8% |
| Satellite Internet | 45 | 2.0% |
| No Internet | 506 | 22.1% |
| Total | 2,288 | 100.0% |
Richland Center Summary
Richland Center is a city located in the southwestern corner of Wisconsin, in Richland County. It is the county seat of Richland County and is located about 60 miles west of Madison, the state capital. The city is situated in the Driftless Area, a region of the Midwest that was not glaciated during the last ice age. Richland Center has a population of 5,184 as of the 2010 census, and is the largest city in the county.
History
The area that is now Richland Center was first settled in 1845 by a group of settlers from New York. The city was officially founded in 1851 and was named after the nearby Richland Creek. The city was incorporated in 1872 and was designated as the county seat of Richland County in 1873.
In the late 19th century, Richland Center was a major center for the lumber industry, with several sawmills located in the city. The city also had a thriving agricultural industry, with several grain elevators and a creamery. The city was also home to several manufacturing companies, including a furniture factory, a canning factory, and a brickyard.
Geography
Richland Center is located at 43°19'N 90°22'W (43.3167, -90.3667). The city is situated in the Driftless Area, a region of the Midwest that was not glaciated during the last ice age. The city is located in the Central Plain region of Wisconsin, and is surrounded by rolling hills and valleys. The city is located about 60 miles west of Madison, the state capital.
The city has a total area of 4.2 square miles, all of which is land. The city is located in the Upper Wisconsin River watershed, and is drained by the Pine River and the Richland Creek.
Economy
Richland Center has a diverse economy, with a mix of manufacturing, retail, and service industries. The city is home to several manufacturing companies, including a furniture factory, a canning factory, and a brickyard. The city also has a thriving agricultural industry, with several grain elevators and a creamery.
The city is also home to several retail stores, including a Walmart Supercenter, a Kmart, and several other smaller stores. The city also has a variety of restaurants, including several fast food restaurants, a few sit-down restaurants, and several bars and pubs.
Demographics
As of the 2010 census, Richland Center had a population of 5,184. The racial makeup of the city was 97.2% White, 0.4% African American, 0.3% Native American, 0.4% Asian, 0.2% from other races, and 1.5% from two or more races. Hispanic or Latino of any race were 1.2% of the population.
The median household income in Richland Center was $37,917, and the median family income was $45,938. The per capita income for the city was $19,945. About 11.2% of families and 14.2% of the population were below the poverty line, including 19.2% of those under age 18 and 8.2% of those age 65 or over.
Common Questions
What is Per Capita Income in Richland Center?
Per Capita income in Richland Center is $30,237.
What is the Median Family Income in Richland Center?
Median Family Income in Richland Center is $71,708.
What is the Median Household income in Richland Center?
Median Household Income in Richland Center is $54,295.
What is Income or Wage Gap in Richland Center?
Income or Wage Gap in Richland Center is 26.6%.
Women in Richland Center earn 73.4 cents for every dollar earned by a man.
What is Inequality or Gini Index in Richland Center?
Inequality or Gini Index in Richland Center is 0.39.
What is the Total Population of Richland Center?
Total Population of Richland Center is 5,058.
What is the Total Male Population of Richland Center?
Total Male Population of Richland Center is 2,268.
What is the Total Female Population of Richland Center?
Total Female Population of Richland Center is 2,790.
What is the Ratio of Males per 100 Females in Richland Center?
There are 81.29 Males per 100 Females in Richland Center.
What is the Ratio of Females per 100 Males in Richland Center?
There are 123.02 Females per 100 Males in Richland Center.
What is the Median Population Age in Richland Center?
Median Population Age in Richland Center is 43.8 Years.
What is the Average Family Size in Richland Center
Average Family Size in Richland Center is 2.9 People.
What is the Average Household Size in Richland Center
Average Household Size in Richland Center is 2.1 People.
How Large is the Labor Force in Richland Center?
There are 2,610 People in the Labor Forcein in Richland Center.
What is the Percentage of People in the Labor Force in Richland Center?
62.6% of People are in the Labor Force in Richland Center.
What is the Unemployment Rate in Richland Center?
Unemployment Rate in Richland Center is 1.8%.