Princeton, WI
Princeton Map
Princeton Overview
1,106
TOTAL POPULATION
471
MALE POPULATION
635
FEMALE POPULATION
74.17
MALES / 100 FEMALES
134.82
FEMALES / 100 MALES
45.8
MEDIAN AGE
3.1
AVG FAMILY SIZE
2.2
AVG HOUSEHOLD SIZE
$29,355
PER CAPITA INCOME
$67,105
AVG FAMILY INCOME
$59,904
AVG HOUSEHOLD INCOME
23.5%
WAGE / INCOME GAP [ % ]
76.5¢/ $1
WAGE / INCOME GAP [ $ ]
0.34
INEQUALITY / GINI INDEX
638
LABOR FORCE [ PEOPLE ]
67.9%
PERCENT IN LABOR FORCE
10.0%
UNEMPLOYMENT RATE
Princeton Zip Codes
Princeton Area Codes
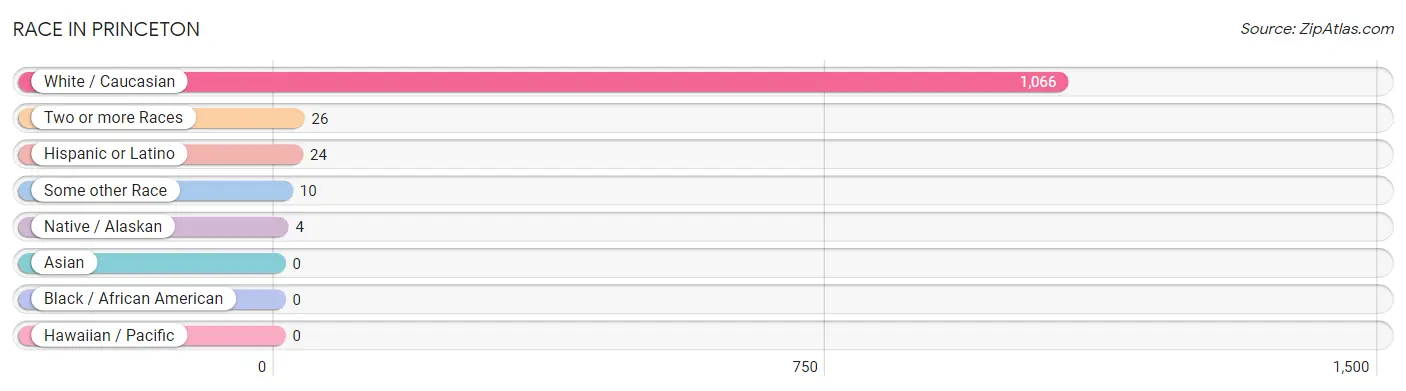
Race in Princeton
The most populous races in Princeton are White / Caucasian (1,066 | 96.4%), Two or more Races (26 | 2.4%), and Hispanic or Latino (24 | 2.2%).
| Race | # Population | % Population |
| Asian | 0 | 0.0% |
| Black / African American | 0 | 0.0% |
| Hawaiian / Pacific | 0 | 0.0% |
| Hispanic or Latino | 24 | 2.2% |
| Native / Alaskan | 4 | 0.4% |
| White / Caucasian | 1,066 | 96.4% |
| Two or more Races | 26 | 2.4% |
| Some other Race | 10 | 0.9% |
| Total | 1,106 | 100.0% |
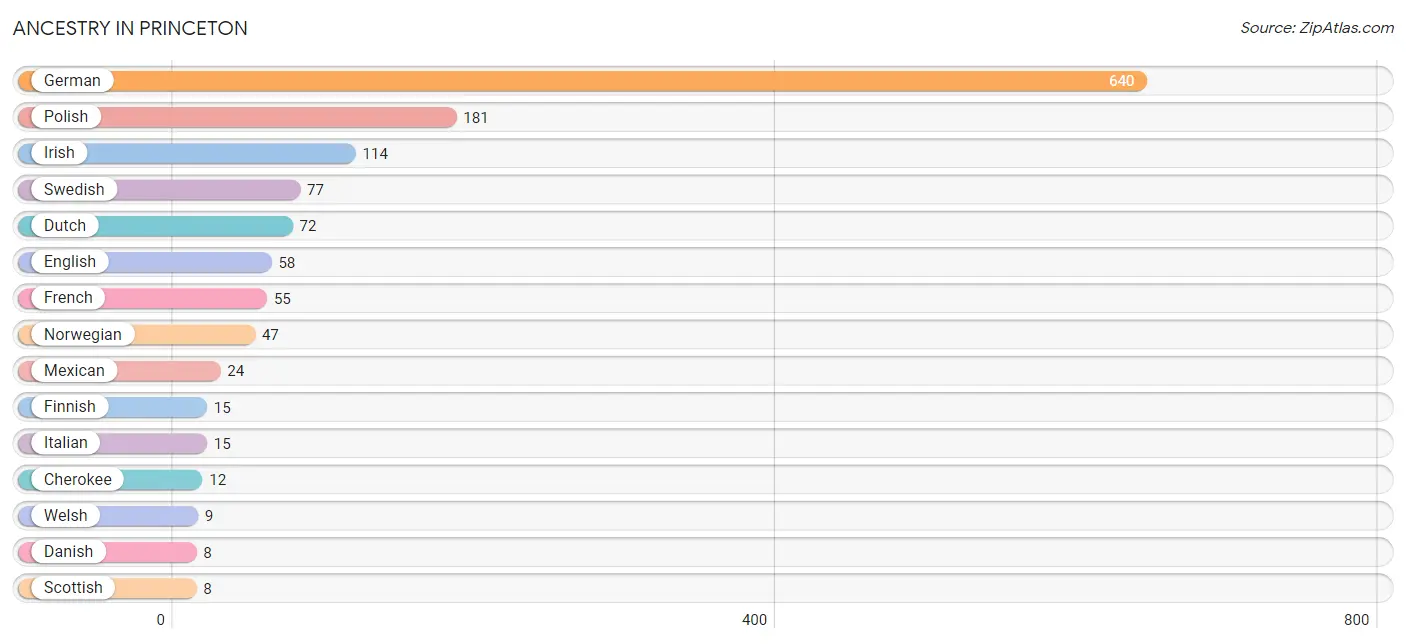
Ancestry in Princeton
The most populous ancestries reported in Princeton are German (640 | 57.9%), Polish (181 | 16.4%), Irish (114 | 10.3%), Swedish (77 | 7.0%), and Dutch (72 | 6.5%), together accounting for 98.0% of all Princeton residents.
| Ancestry | # Population | % Population |
| American | 3 | 0.3% |
| Arab | 3 | 0.3% |
| British | 5 | 0.4% |
| Cherokee | 12 | 1.1% |
| Chippewa | 4 | 0.4% |
| Czech | 7 | 0.6% |
| Danish | 8 | 0.7% |
| Dutch | 72 | 6.5% |
| English | 58 | 5.2% |
| Finnish | 15 | 1.4% |
| French | 55 | 5.0% |
| German | 640 | 57.9% |
| Irish | 114 | 10.3% |
| Italian | 15 | 1.4% |
| Lebanese | 3 | 0.3% |
| Luxembourger | 1 | 0.1% |
| Mexican | 24 | 2.2% |
| Northern European | 3 | 0.3% |
| Norwegian | 47 | 4.3% |
| Polish | 181 | 16.4% |
| Portuguese | 3 | 0.3% |
| Scotch-Irish | 2 | 0.2% |
| Scottish | 8 | 0.7% |
| Slovene | 2 | 0.2% |
| Swedish | 77 | 7.0% |
| Welsh | 9 | 0.8% | View All 26 Rows |
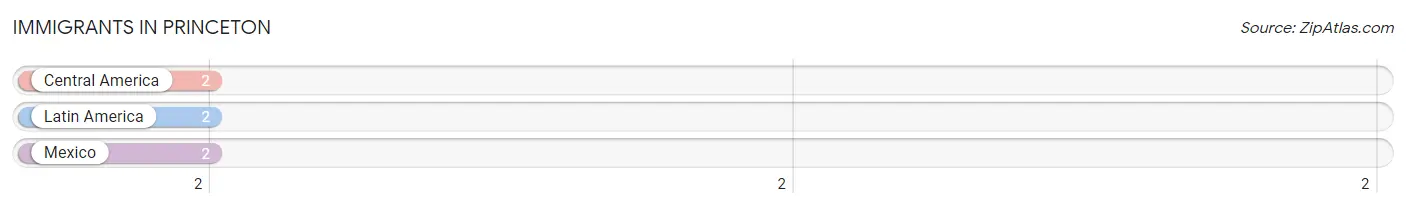
Immigrants in Princeton
The most numerous immigrant groups reported in Princeton came from Central America (2 | 0.2%), Latin America (2 | 0.2%), and Mexico (2 | 0.2%), together accounting for 0.5% of all Princeton residents.
| Immigration Origin | # Population | % Population |
| Central America | 2 | 0.2% |
| Latin America | 2 | 0.2% |
| Mexico | 2 | 0.2% | View All 3 Rows |
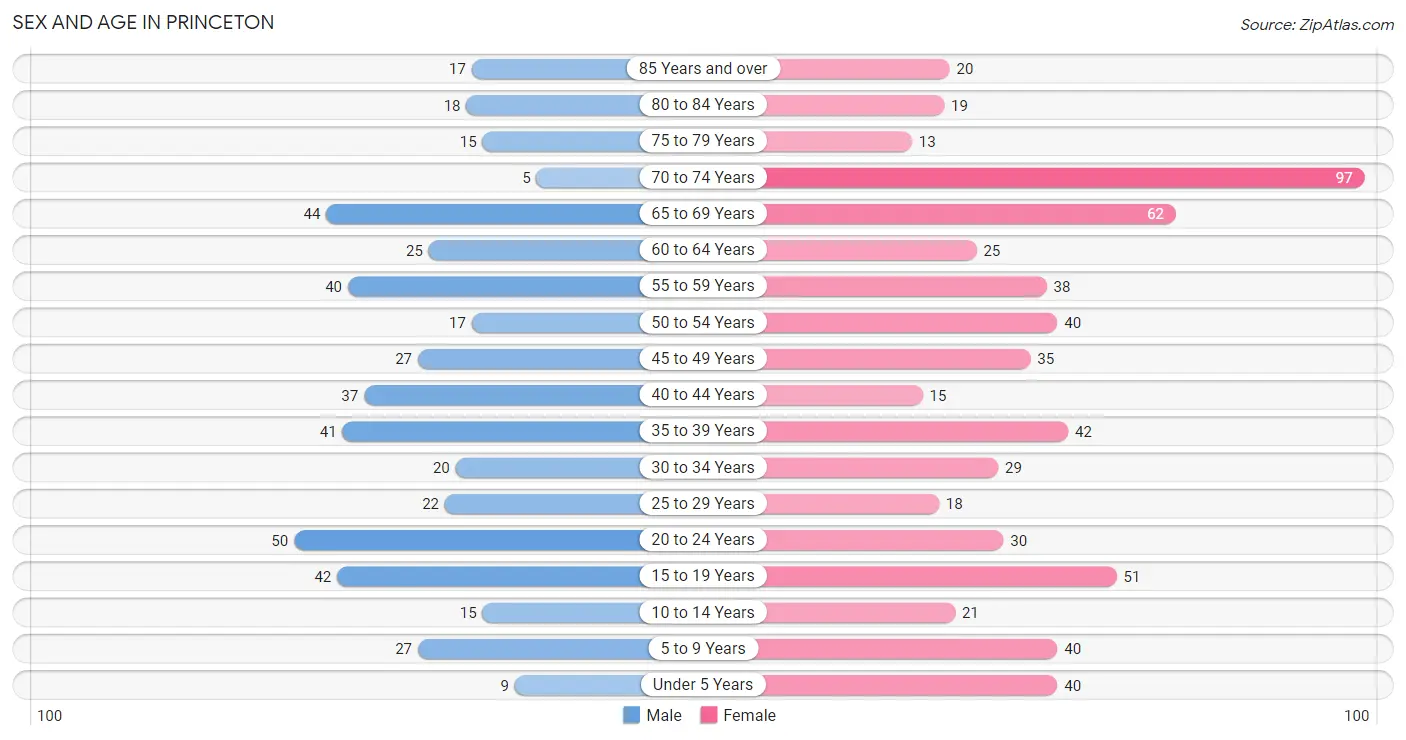
Sex and Age in Princeton
Sex and Age in Princeton
The most populous age groups in Princeton are 20 to 24 Years (50 | 10.6%) for men and 70 to 74 Years (97 | 15.3%) for women.
| Age Bracket | Male | Female |
| Under 5 Years | 9 (1.9%) | 40 (6.3%) |
| 5 to 9 Years | 27 (5.7%) | 40 (6.3%) |
| 10 to 14 Years | 15 (3.2%) | 21 (3.3%) |
| 15 to 19 Years | 42 (8.9%) | 51 (8.0%) |
| 20 to 24 Years | 50 (10.6%) | 30 (4.7%) |
| 25 to 29 Years | 22 (4.7%) | 18 (2.8%) |
| 30 to 34 Years | 20 (4.3%) | 29 (4.6%) |
| 35 to 39 Years | 41 (8.7%) | 42 (6.6%) |
| 40 to 44 Years | 37 (7.9%) | 15 (2.4%) |
| 45 to 49 Years | 27 (5.7%) | 35 (5.5%) |
| 50 to 54 Years | 17 (3.6%) | 40 (6.3%) |
| 55 to 59 Years | 40 (8.5%) | 38 (6.0%) |
| 60 to 64 Years | 25 (5.3%) | 25 (3.9%) |
| 65 to 69 Years | 44 (9.3%) | 62 (9.8%) |
| 70 to 74 Years | 5 (1.1%) | 97 (15.3%) |
| 75 to 79 Years | 15 (3.2%) | 13 (2.1%) |
| 80 to 84 Years | 18 (3.8%) | 19 (3.0%) |
| 85 Years and over | 17 (3.6%) | 20 (3.2%) |
| Total | 471 (100.0%) | 635 (100.0%) |
Families and Households in Princeton
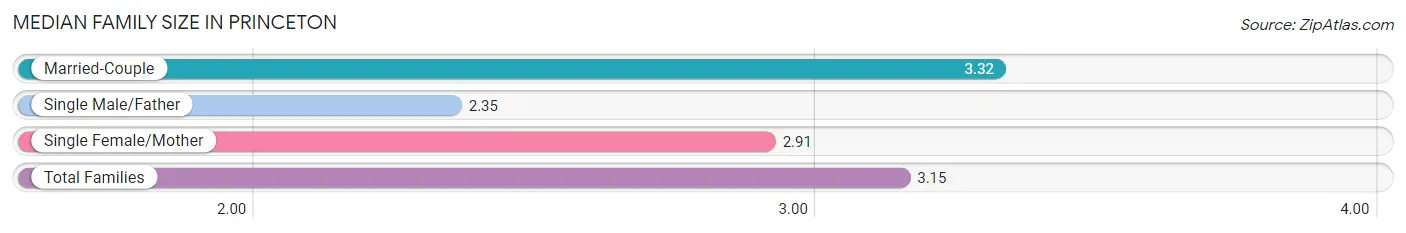
Median Family Size in Princeton
The median family size in Princeton is 3.15 persons per family, with married-couple families (167 | 71.4%) accounting for the largest median family size of 3.32 persons per family. On the other hand, single male/father families (20 | 8.6%) represent the smallest median family size with 2.35 persons per family.
| Family Type | # Families | Family Size |
| Married-Couple | 167 (71.4%) | 3.32 |
| Single Male/Father | 20 (8.6%) | 2.35 |
| Single Female/Mother | 47 (20.1%) | 2.91 |
| Total Families | 234 (100.0%) | 3.15 |
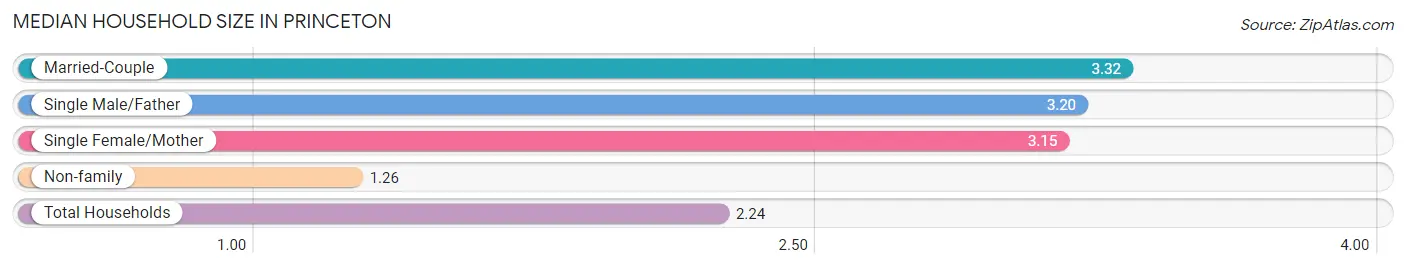
Median Household Size in Princeton
The median household size in Princeton is 2.24 persons per household, with married-couple households (167 | 34.7%) accounting for the largest median household size of 3.32 persons per household. non-family households (247 | 51.3%) represent the smallest median household size with 1.26 persons per household.
| Household Type | # Households | Household Size |
| Married-Couple | 167 (34.7%) | 3.32 |
| Single Male/Father | 20 (4.2%) | 3.20 |
| Single Female/Mother | 47 (9.8%) | 3.15 |
| Non-family | 247 (51.3%) | 1.26 |
| Total Households | 481 (100.0%) | 2.24 |
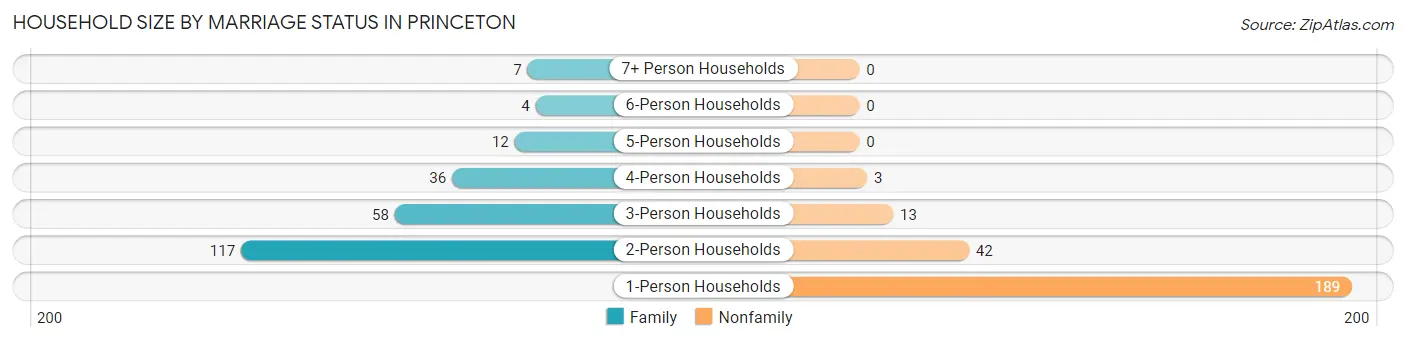
Household Size by Marriage Status in Princeton
Out of a total of 481 households in Princeton, 234 (48.6%) are family households, while 247 (51.3%) are nonfamily households. The most numerous type of family households are 2-person households, comprising 117, and the most common type of nonfamily households are 1-person households, comprising 189.
| Household Size | Family Households | Nonfamily Households |
| 1-Person Households | - | 189 (39.3%) |
| 2-Person Households | 117 (24.3%) | 42 (8.7%) |
| 3-Person Households | 58 (12.1%) | 13 (2.7%) |
| 4-Person Households | 36 (7.5%) | 3 (0.6%) |
| 5-Person Households | 12 (2.5%) | 0 (0.0%) |
| 6-Person Households | 4 (0.8%) | 0 (0.0%) |
| 7+ Person Households | 7 (1.5%) | 0 (0.0%) |
| Total | 234 (48.6%) | 247 (51.3%) |
Female Fertility in Princeton
Fertility by Age in Princeton
Average fertility rate in Princeton is 40.0 births per 1,000 women. Women in the age bracket of 35 to 50 years have the highest fertility rate with 61.0 births per 1,000 women. Women in the age bracket of 35 to 50 years acount for 66.7% of all women with births.
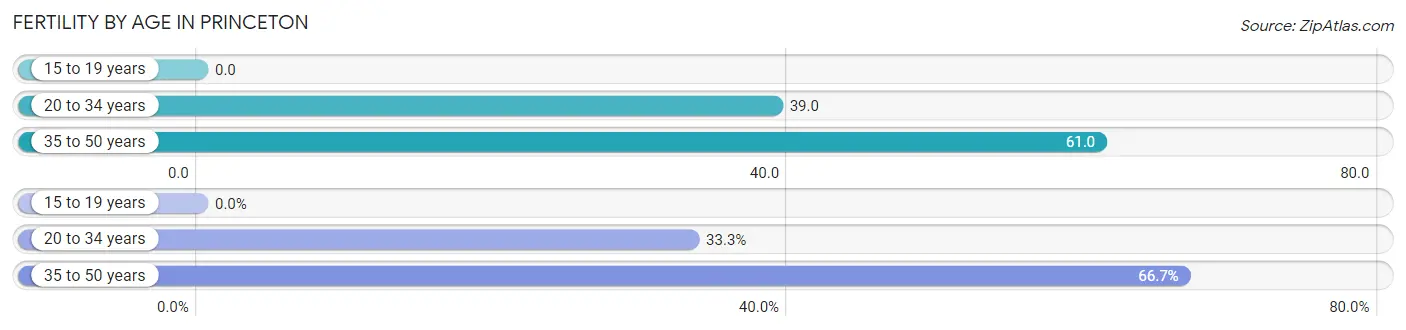
| Age Bracket | Women with Births | Births / 1,000 Women |
| 15 to 19 years | 0 (0.0%) | 0.0 |
| 20 to 34 years | 3 (33.3%) | 39.0 |
| 35 to 50 years | 6 (66.7%) | 61.0 |
| Total | 9 (100.0%) | 40.0 |
Fertility by Age by Marriage Status in Princeton
66.7% of women with births (9) in Princeton are married. The highest percentage of unmarried women with births falls into 20 to 34 years age bracket with 100.0% of them unmarried at the time of birth, while the lowest percentage of unmarried women with births belong to 35 to 50 years age bracket with 0.0% of them unmarried.
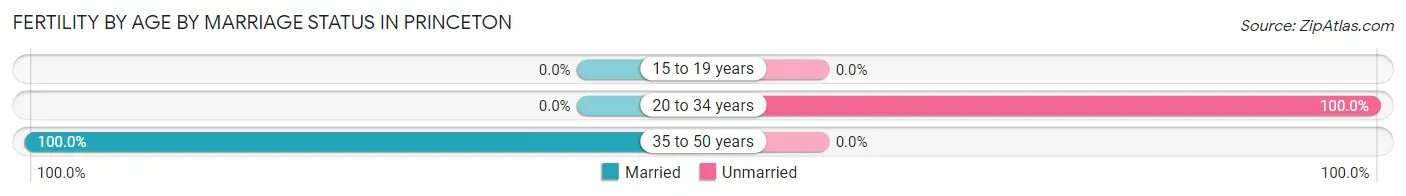
| Age Bracket | Married | Unmarried |
| 15 to 19 years | 0 (0.0%) | 0 (0.0%) |
| 20 to 34 years | 0 (0.0%) | 3 (100.0%) |
| 35 to 50 years | 6 (100.0%) | 0 (0.0%) |
| Total | 6 (66.7%) | 3 (33.3%) |
Fertility by Education in Princeton
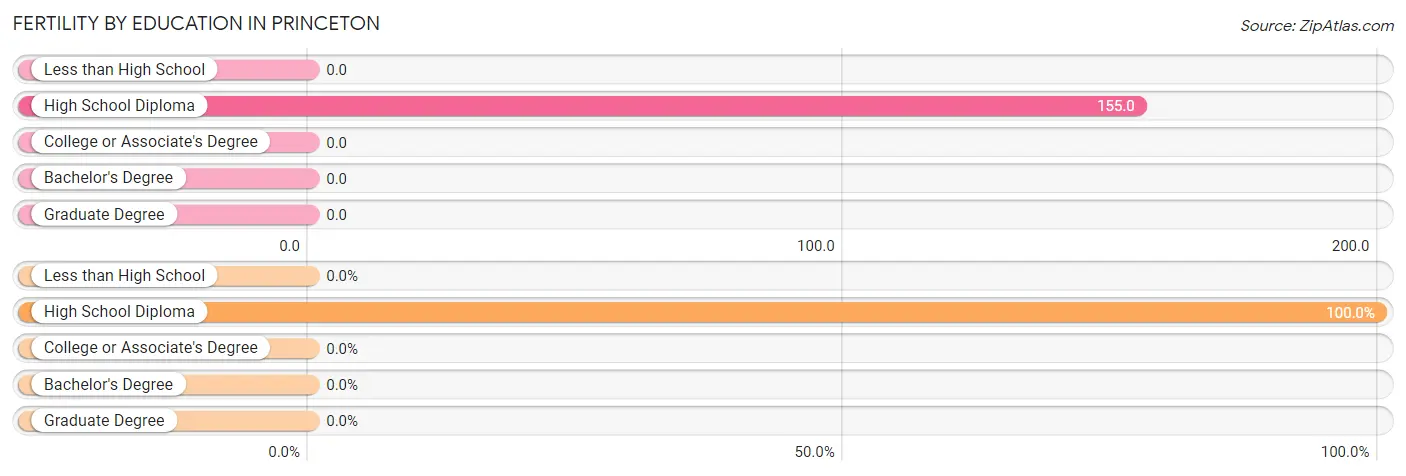
| Educational Attainment | Women with Births | Births / 1,000 Women |
| Less than High School | 0 (0.0%) | 0.0 |
| High School Diploma | 9 (100.0%) | 155.0 |
| College or Associate's Degree | 0 (0.0%) | 0.0 |
| Bachelor's Degree | 0 (0.0%) | 0.0 |
| Graduate Degree | 0 (0.0%) | 0.0 |
| Total | 9 (100.0%) | 40.0 |
Fertility by Education by Marriage Status in Princeton
33.3% of women with births in Princeton are unmarried. Women with the educational attainment of high school diploma are most likely to be married with 66.7% of them married at childbirth, while women with the educational attainment of high school diploma are least likely to be married with 33.3% of them unmarried at childbirth.
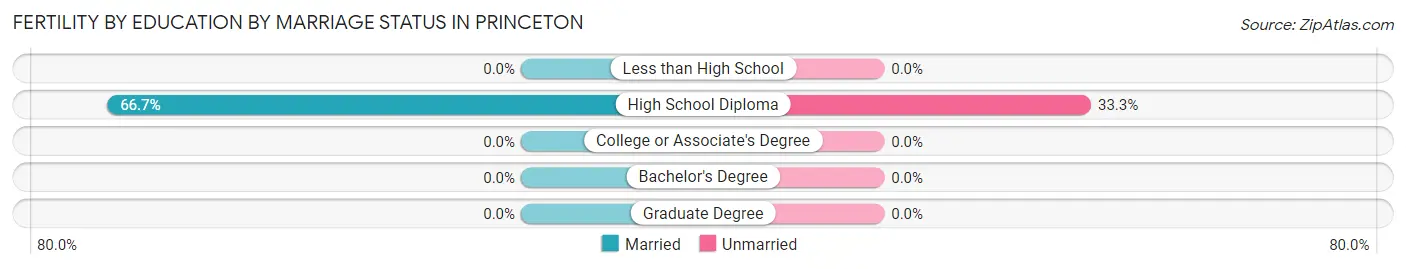
| Educational Attainment | Married | Unmarried |
| Less than High School | 0 (0.0%) | 0 (0.0%) |
| High School Diploma | 6 (66.7%) | 3 (33.3%) |
| College or Associate's Degree | 0 (0.0%) | 0 (0.0%) |
| Bachelor's Degree | 0 (0.0%) | 0 (0.0%) |
| Graduate Degree | 0 (0.0%) | 0 (0.0%) |
| Total | 6 (66.7%) | 3 (33.3%) |
Income in Princeton
Income Overview in Princeton
Per Capita Income in Princeton is $29,355, while median incomes of families and households are $67,105 and $59,904 respectively.
| Characteristic | Number | Measure |
| Per Capita Income | 1,106 | $29,355 |
| Median Family Income | 234 | $67,105 |
| Mean Family Income | 234 | $69,924 |
| Median Household Income | 481 | $59,904 |
| Mean Household Income | 481 | $58,990 |
| Income Deficit | 234 | $0 |
| Wage / Income Gap (%) | 1,106 | 23.54% |
| Wage / Income Gap ($) | 1,106 | 76.46¢ per $1 |
| Gini / Inequality Index | 1,106 | 0.34 |
Earnings by Sex in Princeton
Average Earnings in Princeton are $40,643, $46,900 for men and $35,859 for women, a difference of 23.5%.
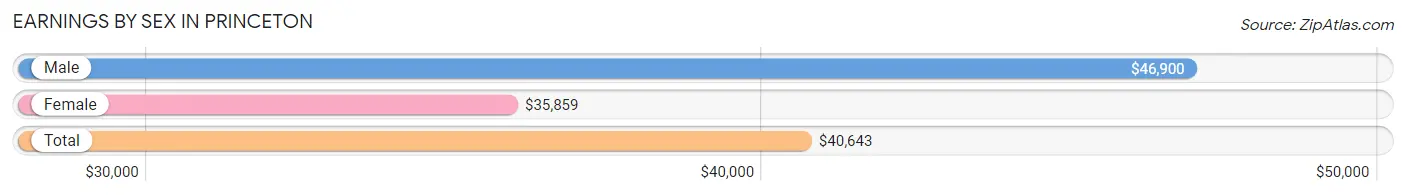
| Sex | Number | Average Earnings |
| Male | 300 (48.1%) | $46,900 |
| Female | 323 (51.8%) | $35,859 |
| Total | 623 (100.0%) | $40,643 |
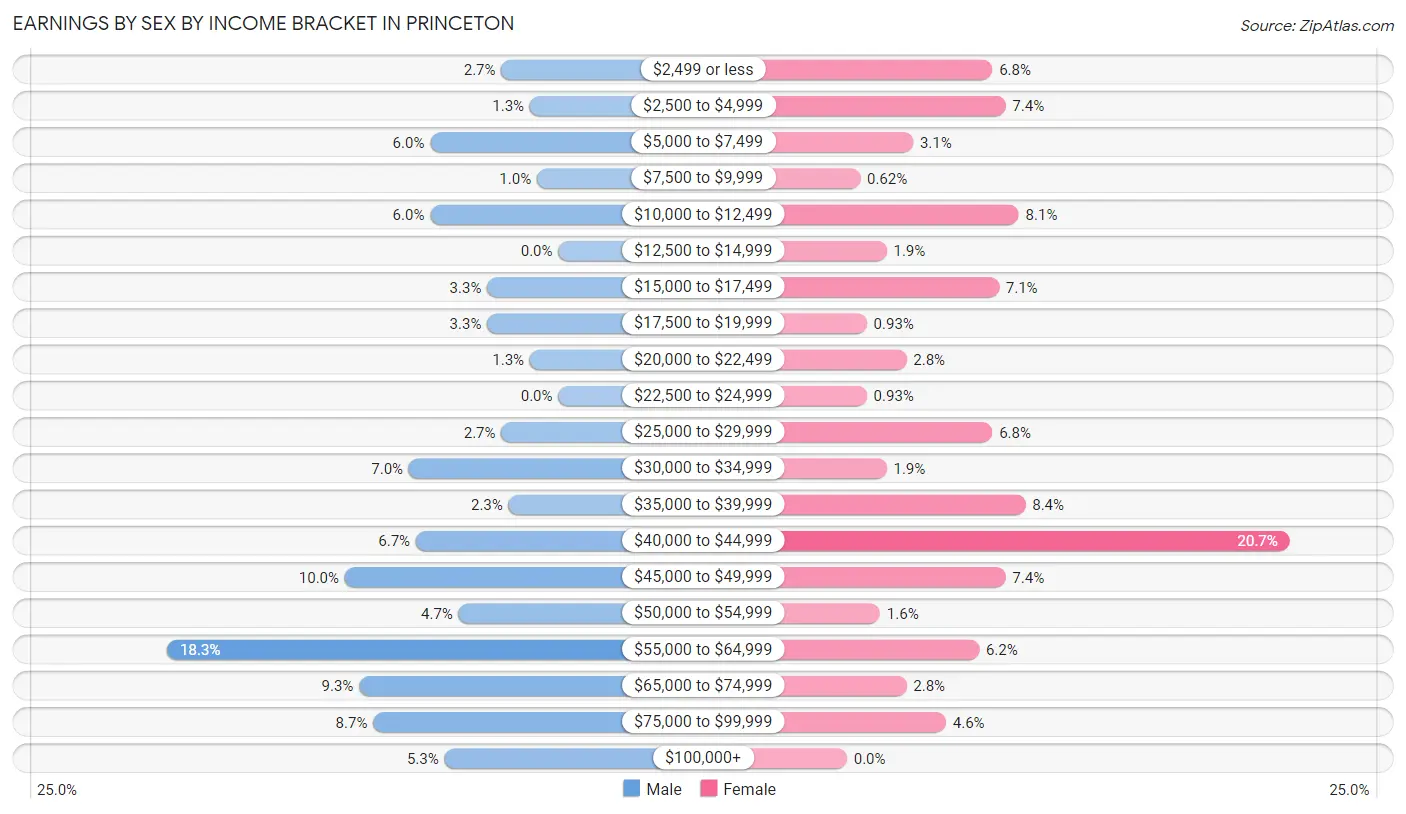
Earnings by Sex by Income Bracket in Princeton
The most common earnings brackets in Princeton are $55,000 to $64,999 for men (55 | 18.3%) and $40,000 to $44,999 for women (67 | 20.7%).
| Income | Male | Female |
| $2,499 or less | 8 (2.7%) | 22 (6.8%) |
| $2,500 to $4,999 | 4 (1.3%) | 24 (7.4%) |
| $5,000 to $7,499 | 18 (6.0%) | 10 (3.1%) |
| $7,500 to $9,999 | 3 (1.0%) | 2 (0.6%) |
| $10,000 to $12,499 | 18 (6.0%) | 26 (8.1%) |
| $12,500 to $14,999 | 0 (0.0%) | 6 (1.9%) |
| $15,000 to $17,499 | 10 (3.3%) | 23 (7.1%) |
| $17,500 to $19,999 | 10 (3.3%) | 3 (0.9%) |
| $20,000 to $22,499 | 4 (1.3%) | 9 (2.8%) |
| $22,500 to $24,999 | 0 (0.0%) | 3 (0.9%) |
| $25,000 to $29,999 | 8 (2.7%) | 22 (6.8%) |
| $30,000 to $34,999 | 21 (7.0%) | 6 (1.9%) |
| $35,000 to $39,999 | 7 (2.3%) | 27 (8.4%) |
| $40,000 to $44,999 | 20 (6.7%) | 67 (20.7%) |
| $45,000 to $49,999 | 30 (10.0%) | 24 (7.4%) |
| $50,000 to $54,999 | 14 (4.7%) | 5 (1.5%) |
| $55,000 to $64,999 | 55 (18.3%) | 20 (6.2%) |
| $65,000 to $74,999 | 28 (9.3%) | 9 (2.8%) |
| $75,000 to $99,999 | 26 (8.7%) | 15 (4.6%) |
| $100,000+ | 16 (5.3%) | 0 (0.0%) |
| Total | 300 (100.0%) | 323 (100.0%) |
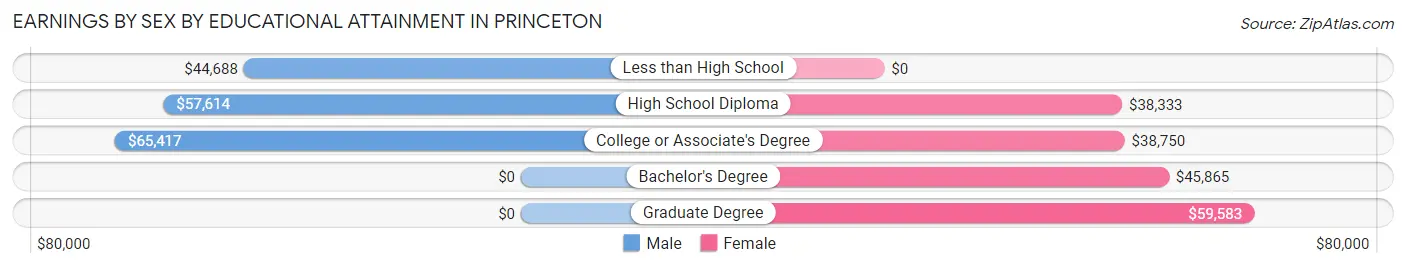
Earnings by Sex by Educational Attainment in Princeton
Average earnings in Princeton are $58,158 for men and $40,271 for women, a difference of 30.8%. Men with an educational attainment of college or associate's degree enjoy the highest average annual earnings of $65,417, while those with less than high school education earn the least with $44,688. Women with an educational attainment of graduate degree earn the most with the average annual earnings of $59,583, while those with high school diploma education have the smallest earnings of $38,333.
| Educational Attainment | Male Income | Female Income |
| Less than High School | $44,688 | $0 |
| High School Diploma | $57,614 | $38,333 |
| College or Associate's Degree | $65,417 | $38,750 |
| Bachelor's Degree | - | - |
| Graduate Degree | - | - |
| Total | $58,158 | $40,271 |
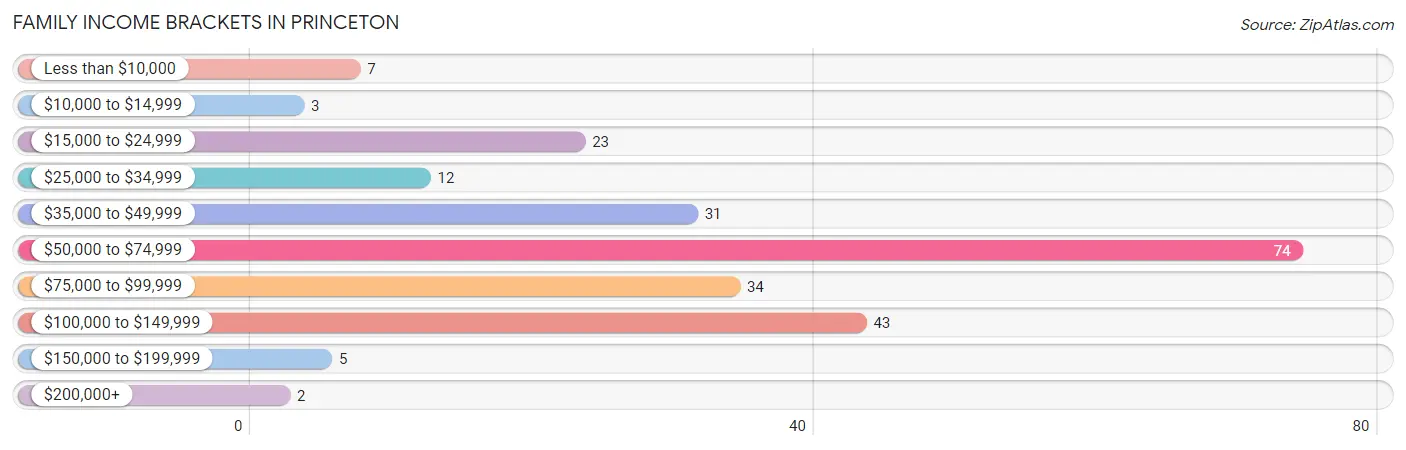
Family Income in Princeton
Family Income Brackets in Princeton
According to the Princeton family income data, there are 74 families falling into the $50,000 to $74,999 income range, which is the most common income bracket and makes up 31.6% of all families. Conversely, the $200,000+ income bracket is the least frequent group with only 2 families (0.9%) belonging to this category.
| Income Bracket | # Families | % Families |
| Less than $10,000 | 7 | 3.0% |
| $10,000 to $14,999 | 3 | 1.3% |
| $15,000 to $24,999 | 23 | 9.8% |
| $25,000 to $34,999 | 12 | 5.1% |
| $35,000 to $49,999 | 31 | 13.2% |
| $50,000 to $74,999 | 74 | 31.6% |
| $75,000 to $99,999 | 34 | 14.5% |
| $100,000 to $149,999 | 43 | 18.4% |
| $150,000 to $199,999 | 5 | 2.1% |
| $200,000+ | 2 | 0.9% |
Family Income by Famaliy Size in Princeton
4-person families (38 | 16.2%) account for the highest median family income in Princeton with $70,625 per family, while 2-person families (138 | 59.0%) have the highest median income of $32,084 per family member.
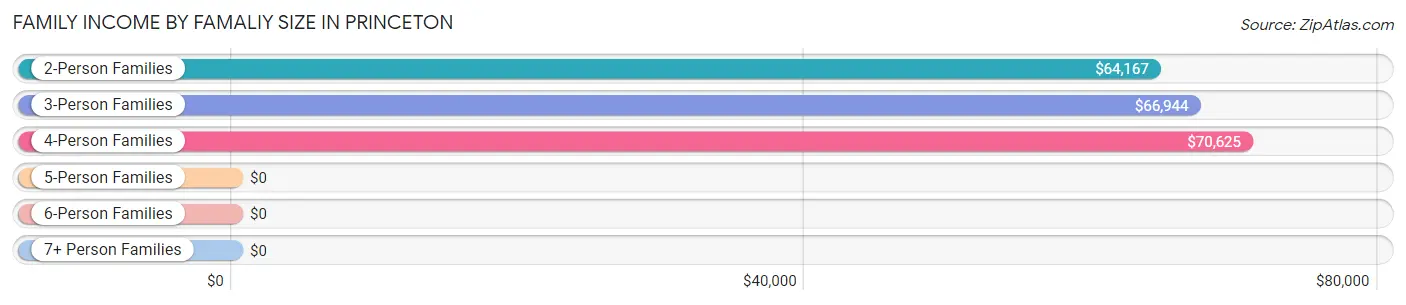
| Income Bracket | # Families | Median Income |
| 2-Person Families | 138 (59.0%) | $64,167 |
| 3-Person Families | 42 (17.9%) | $66,944 |
| 4-Person Families | 38 (16.2%) | $70,625 |
| 5-Person Families | 5 (2.1%) | $0 |
| 6-Person Families | 4 (1.7%) | $0 |
| 7+ Person Families | 7 (3.0%) | $0 |
| Total | 234 (100.0%) | $67,105 |
Family Income by Number of Earners in Princeton
The median family income in Princeton is $67,105, with families comprising 3+ earners (32) having the highest median family income of $105,714, while families with no earners (50) have the lowest median family income of $48,889, accounting for 13.7% and 21.4% of families, respectively.
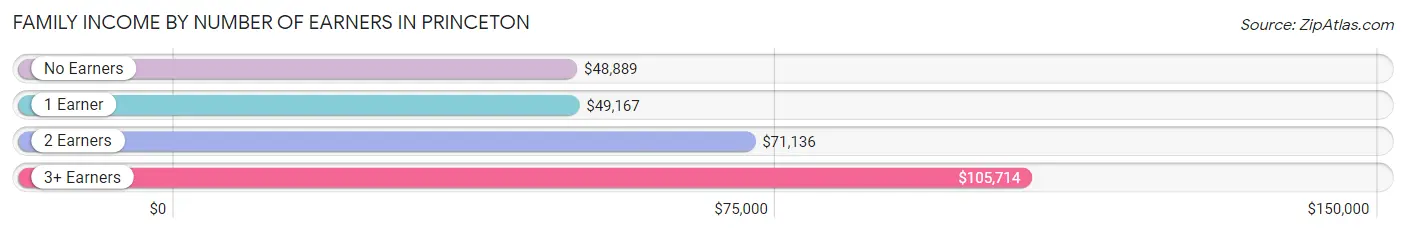
| Number of Earners | # Families | Median Income |
| No Earners | 50 (21.4%) | $48,889 |
| 1 Earner | 70 (29.9%) | $49,167 |
| 2 Earners | 82 (35.0%) | $71,136 |
| 3+ Earners | 32 (13.7%) | $105,714 |
| Total | 234 (100.0%) | $67,105 |
Household Income in Princeton
Household Income Brackets in Princeton
With 128 households falling in the category, the $50,000 to $74,999 income range is the most frequent in Princeton, accounting for 26.6% of all households. In contrast, only 2 households (0.4%) fall into the $200,000+ income bracket, making it the least populous group.
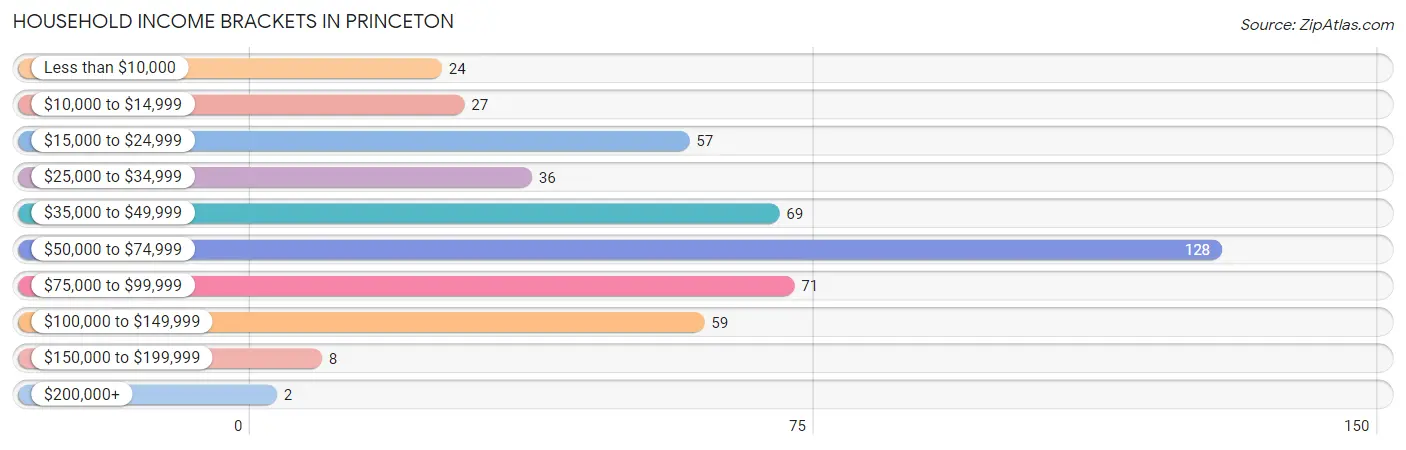
| Income Bracket | # Households | % Households |
| Less than $10,000 | 24 | 5.0% |
| $10,000 to $14,999 | 27 | 5.6% |
| $15,000 to $24,999 | 57 | 11.9% |
| $25,000 to $34,999 | 36 | 7.5% |
| $35,000 to $49,999 | 69 | 14.3% |
| $50,000 to $74,999 | 128 | 26.6% |
| $75,000 to $99,999 | 71 | 14.8% |
| $100,000 to $149,999 | 59 | 12.3% |
| $150,000 to $199,999 | 8 | 1.7% |
| $200,000+ | 2 | 0.4% |
Household Income by Householder Age in Princeton
The median household income in Princeton is $59,904, with the highest median household income of $66,250 found in the 15 to 24 years age bracket for the primary householder. A total of 24 households (5.0%) fall into this category. Meanwhile, the 65+ years age bracket for the primary householder has the lowest median household income of $38,571, with 138 households (28.7%) in this group.
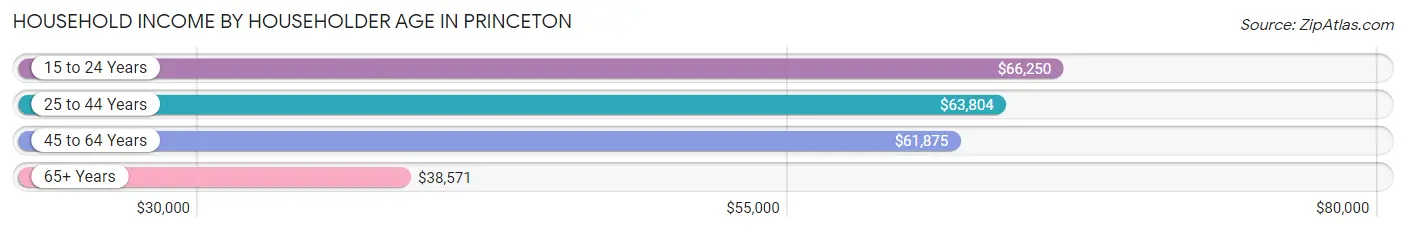
| Income Bracket | # Households | Median Income |
| 15 to 24 Years | 24 (5.0%) | $66,250 |
| 25 to 44 Years | 148 (30.8%) | $63,804 |
| 45 to 64 Years | 171 (35.5%) | $61,875 |
| 65+ Years | 138 (28.7%) | $38,571 |
| Total | 481 (100.0%) | $59,904 |
Poverty in Princeton
Income Below Poverty by Sex and Age in Princeton
With 13.7% poverty level for males and 18.0% for females among the residents of Princeton, under 5 year old males and 75 year old and over females are the most vulnerable to poverty, with 9 males (100.0%) and 16 females (37.2%) in their respective age groups living below the poverty level.
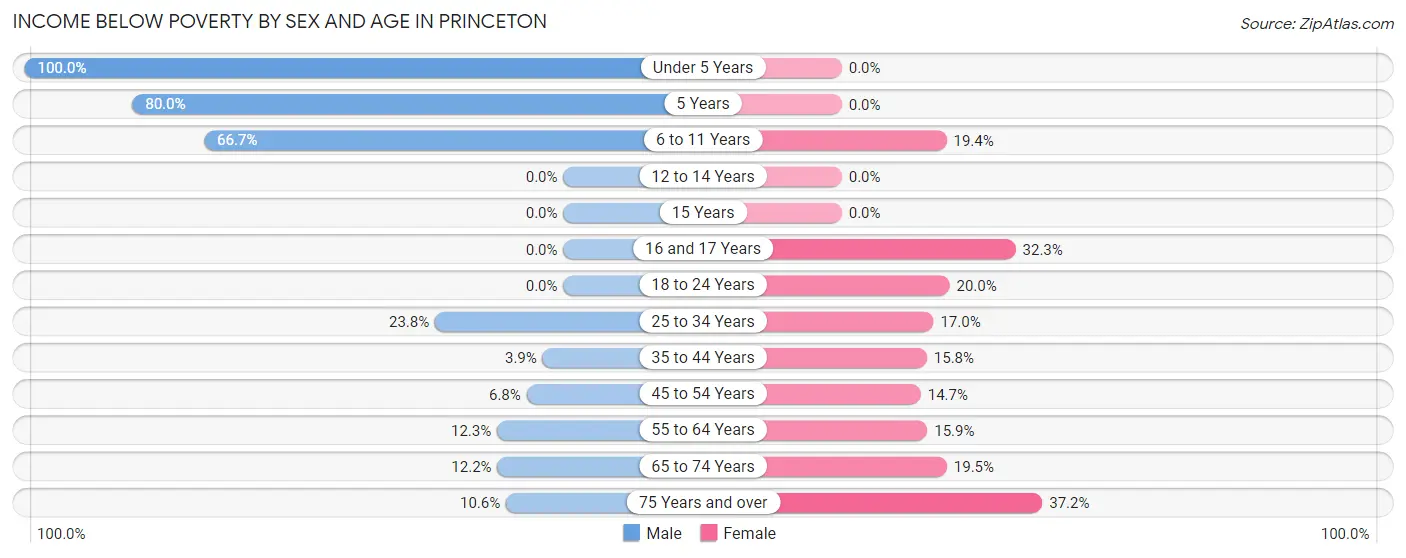
| Age Bracket | Male | Female |
| Under 5 Years | 9 (100.0%) | 0 (0.0%) |
| 5 Years | 8 (80.0%) | 0 (0.0%) |
| 6 to 11 Years | 12 (66.7%) | 7 (19.4%) |
| 12 to 14 Years | 0 (0.0%) | 0 (0.0%) |
| 15 Years | 0 (0.0%) | 0 (0.0%) |
| 16 and 17 Years | 0 (0.0%) | 10 (32.3%) |
| 18 to 24 Years | 0 (0.0%) | 10 (20.0%) |
| 25 to 34 Years | 10 (23.8%) | 8 (17.0%) |
| 35 to 44 Years | 3 (3.8%) | 9 (15.8%) |
| 45 to 54 Years | 3 (6.8%) | 11 (14.7%) |
| 55 to 64 Years | 8 (12.3%) | 10 (15.9%) |
| 65 to 74 Years | 6 (12.2%) | 31 (19.5%) |
| 75 Years and over | 5 (10.6%) | 16 (37.2%) |
| Total | 64 (13.7%) | 112 (18.0%) |
Income Above Poverty by Sex and Age in Princeton
According to the poverty statistics in Princeton, males aged 12 to 14 years and females aged under 5 years are the age groups that are most secure financially, with 100.0% of males and 100.0% of females in these age groups living above the poverty line.
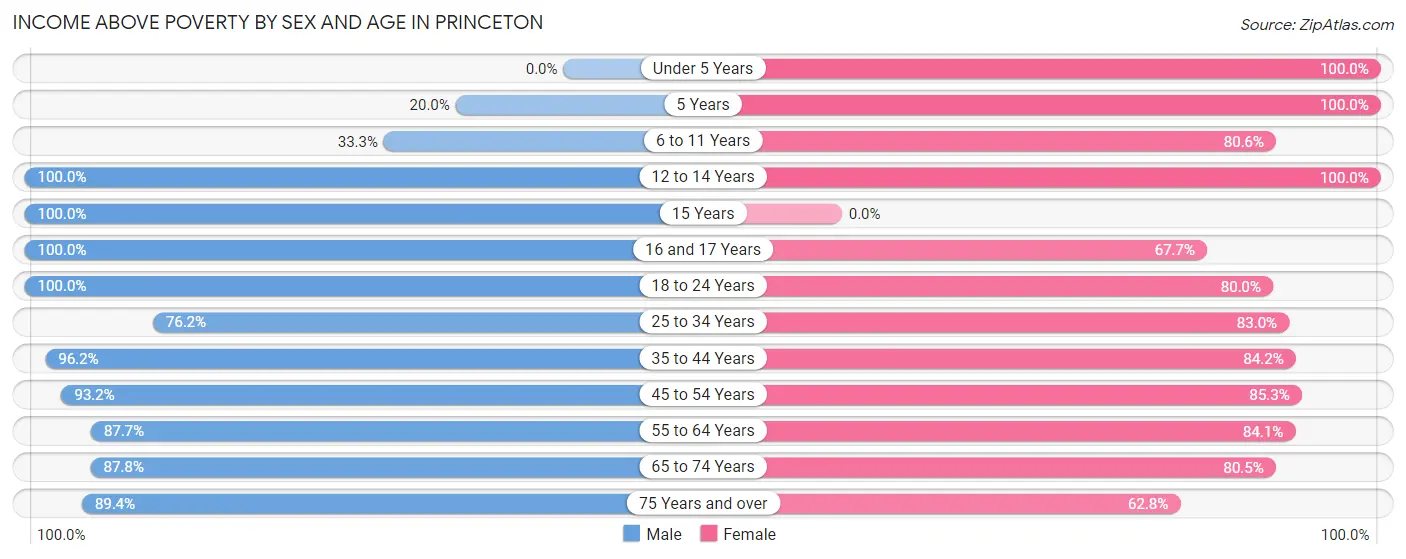
| Age Bracket | Male | Female |
| Under 5 Years | 0 (0.0%) | 40 (100.0%) |
| 5 Years | 2 (20.0%) | 9 (100.0%) |
| 6 to 11 Years | 6 (33.3%) | 29 (80.6%) |
| 12 to 14 Years | 12 (100.0%) | 11 (100.0%) |
| 15 Years | 14 (100.0%) | 0 (0.0%) |
| 16 and 17 Years | 11 (100.0%) | 21 (67.7%) |
| 18 to 24 Years | 67 (100.0%) | 40 (80.0%) |
| 25 to 34 Years | 32 (76.2%) | 39 (83.0%) |
| 35 to 44 Years | 75 (96.2%) | 48 (84.2%) |
| 45 to 54 Years | 41 (93.2%) | 64 (85.3%) |
| 55 to 64 Years | 57 (87.7%) | 53 (84.1%) |
| 65 to 74 Years | 43 (87.8%) | 128 (80.5%) |
| 75 Years and over | 42 (89.4%) | 27 (62.8%) |
| Total | 402 (86.3%) | 509 (82.0%) |
Income Below Poverty Among Married-Couple Families in Princeton
The poverty statistics for married-couple families in Princeton show that 1.8% or 3 of the total 167 families live below the poverty line. Families with no children have the highest poverty rate of 2.6%, comprising of 3 families. On the other hand, families with 1 or 2 children have the lowest poverty rate of 0.0%, which includes 0 families.
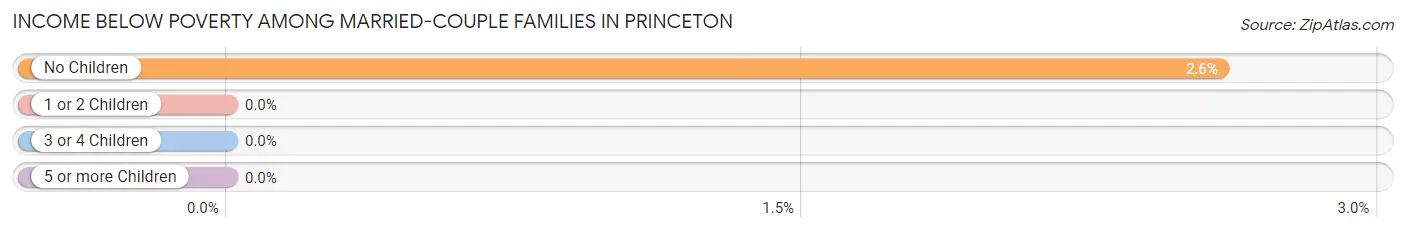
| Children | Above Poverty | Below Poverty |
| No Children | 113 (97.4%) | 3 (2.6%) |
| 1 or 2 Children | 40 (100.0%) | 0 (0.0%) |
| 3 or 4 Children | 4 (100.0%) | 0 (0.0%) |
| 5 or more Children | 7 (100.0%) | 0 (0.0%) |
| Total | 164 (98.2%) | 3 (1.8%) |
Income Below Poverty Among Single-Parent Households in Princeton
According to the poverty data in Princeton, 50.0% or 10 single-father households and 19.2% or 9 single-mother households are living below the poverty line. Among single-father households, those with 1 or 2 children have the highest poverty rate, with 10 households (50.0%) experiencing poverty. Likewise, among single-mother households, those with 3 or 4 children have the highest poverty rate, with 7 households (100.0%) falling below the poverty line.
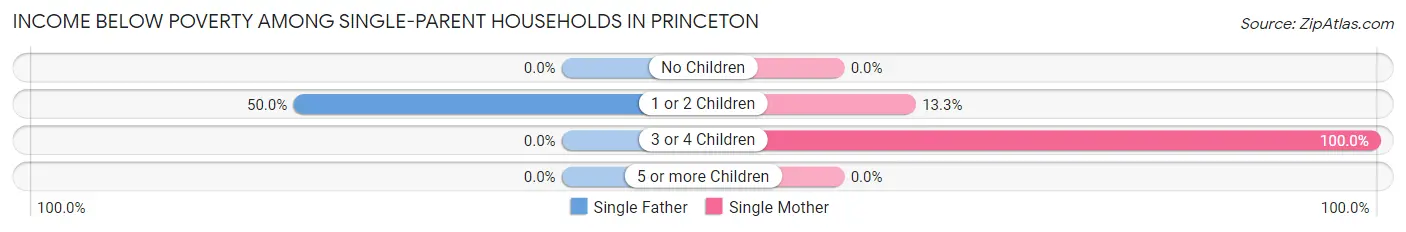
| Children | Single Father | Single Mother |
| No Children | 0 (0.0%) | 0 (0.0%) |
| 1 or 2 Children | 10 (50.0%) | 2 (13.3%) |
| 3 or 4 Children | 0 (0.0%) | 7 (100.0%) |
| 5 or more Children | 0 (0.0%) | 0 (0.0%) |
| Total | 10 (50.0%) | 9 (19.2%) |
Income Below Poverty Among Married-Couple vs Single-Parent Households in Princeton
The poverty data for Princeton shows that 3 of the married-couple family households (1.8%) and 19 of the single-parent households (28.4%) are living below the poverty level. Within the married-couple family households, those with no children have the highest poverty rate, with 3 households (2.6%) falling below the poverty line. Among the single-parent households, those with 3 or 4 children have the highest poverty rate, with 7 household (100.0%) living below poverty.
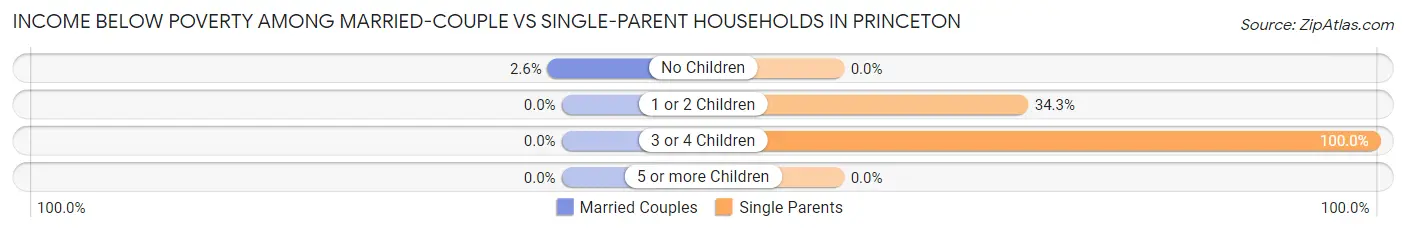
| Children | Married-Couple Families | Single-Parent Households |
| No Children | 3 (2.6%) | 0 (0.0%) |
| 1 or 2 Children | 0 (0.0%) | 12 (34.3%) |
| 3 or 4 Children | 0 (0.0%) | 7 (100.0%) |
| 5 or more Children | 0 (0.0%) | 0 (0.0%) |
| Total | 3 (1.8%) | 19 (28.4%) |
Employment Characteristics in Princeton
Employment by Class of Employer in Princeton
Among the 574 employed individuals in Princeton, private company employees (399 | 69.5%), self-employed (not incorporated) (49 | 8.5%), and not-for-profit organizations (42 | 7.3%) make up the most common classes of employment.
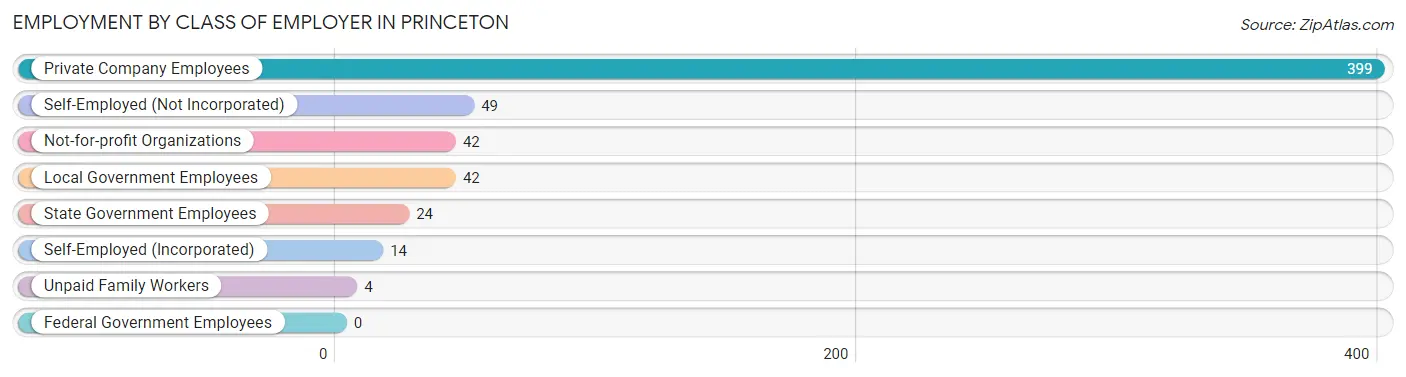
| Employer Class | # Employees | % Employees |
| Private Company Employees | 399 | 69.5% |
| Self-Employed (Incorporated) | 14 | 2.4% |
| Self-Employed (Not Incorporated) | 49 | 8.5% |
| Not-for-profit Organizations | 42 | 7.3% |
| Local Government Employees | 42 | 7.3% |
| State Government Employees | 24 | 4.2% |
| Federal Government Employees | 0 | 0.0% |
| Unpaid Family Workers | 4 | 0.7% |
| Total | 574 | 100.0% |
Employment Status by Age in Princeton
According to the labor force statistics for Princeton, out of the total population over 16 years of age (940), 67.9% or 638 individuals are in the labor force, with 10.0% or 64 of them unemployed. The age group with the highest labor force participation rate is 20 to 24 years, with 100.0% or 80 individuals in the labor force. Within the labor force, the 16 to 19 years age range has the highest percentage of unemployed individuals, with 50.0% or 30 of them being unemployed.
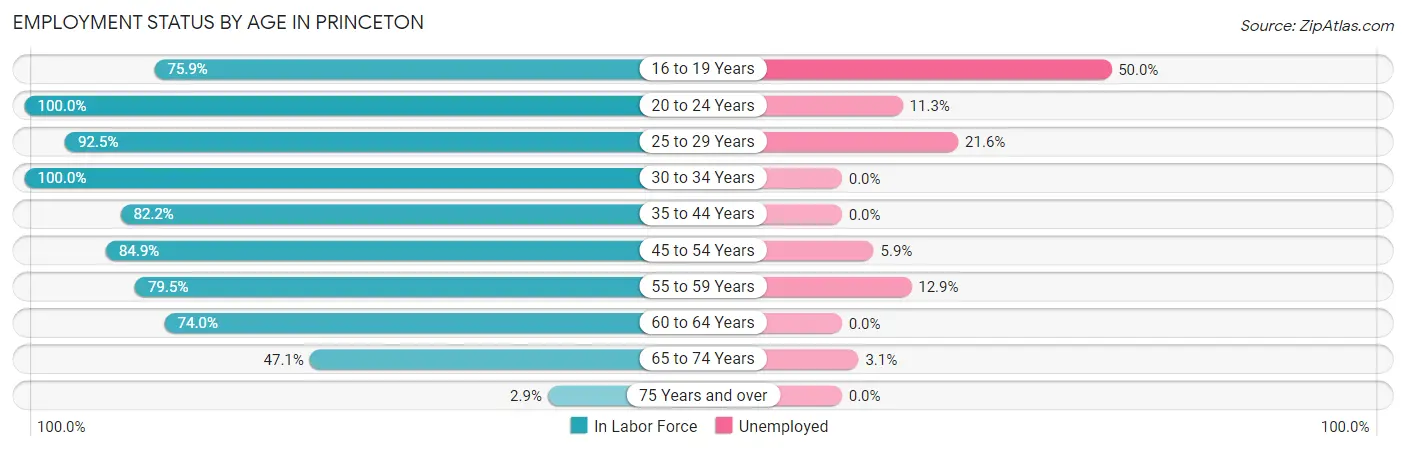
| Age Bracket | In Labor Force | Unemployed |
| 16 to 19 Years | 60 (75.9%) | 30 (50.0%) |
| 20 to 24 Years | 80 (100.0%) | 9 (11.3%) |
| 25 to 29 Years | 37 (92.5%) | 8 (21.6%) |
| 30 to 34 Years | 49 (100.0%) | 0 (0.0%) |
| 35 to 44 Years | 111 (82.2%) | 0 (0.0%) |
| 45 to 54 Years | 101 (84.9%) | 6 (5.9%) |
| 55 to 59 Years | 62 (79.5%) | 8 (12.9%) |
| 60 to 64 Years | 37 (74.0%) | 0 (0.0%) |
| 65 to 74 Years | 98 (47.1%) | 3 (3.1%) |
| 75 Years and over | 3 (2.9%) | 0 (0.0%) |
| Total | 638 (67.9%) | 64 (10.0%) |
Employment Status by Educational Attainment in Princeton
According to labor force statistics for Princeton, 84.3% of individuals (397) out of the total population between 25 and 64 years of age (471) are in the labor force, with 5.5% or 22 of them being unemployed. The group with the highest labor force participation rate are those with the educational attainment of high school diploma, with 87.2% or 170 individuals in the labor force. Within the labor force, individuals with less than high school education have the highest percentage of unemployment, with 30.0% or 3 of them being unemployed.
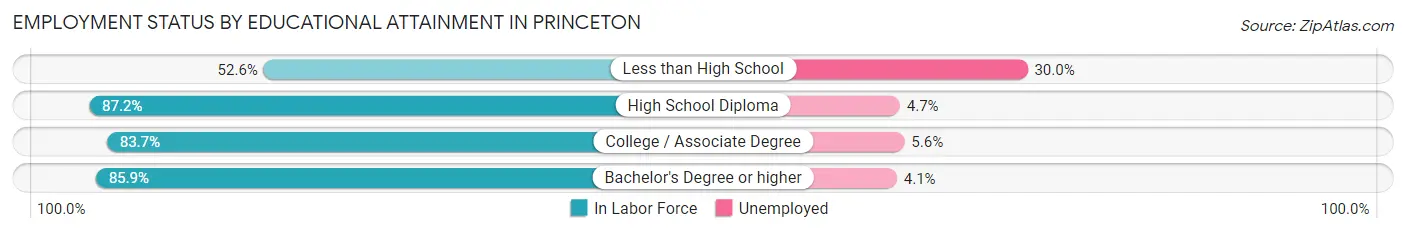
| Educational Attainment | In Labor Force | Unemployed |
| Less than High School | 10 (52.6%) | 6 (30.0%) |
| High School Diploma | 170 (87.2%) | 9 (4.7%) |
| College / Associate Degree | 144 (83.7%) | 10 (5.6%) |
| Bachelor's Degree or higher | 73 (85.9%) | 3 (4.1%) |
| Total | 397 (84.3%) | 26 (5.5%) |
Employment Occupations by Sex in Princeton
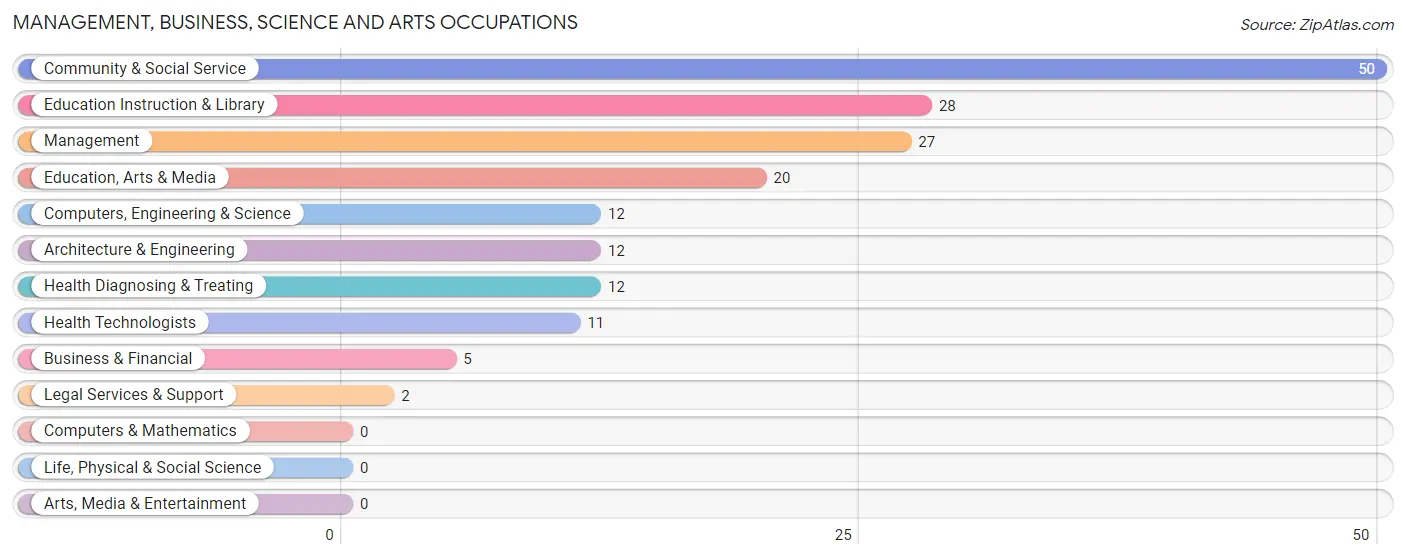
Management, Business, Science and Arts Occupations
The most common Management, Business, Science and Arts occupations in Princeton are Community & Social Service (50 | 8.7%), Education Instruction & Library (28 | 4.9%), Management (27 | 4.7%), Education, Arts & Media (20 | 3.5%), and Computers, Engineering & Science (12 | 2.1%).
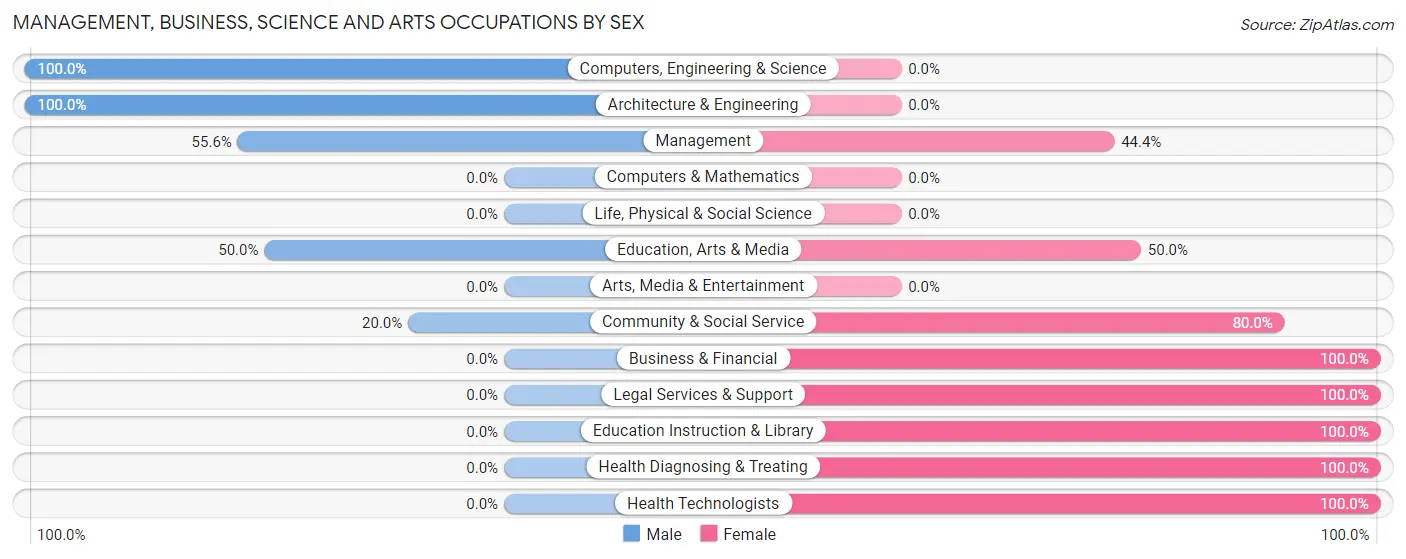
Management, Business, Science and Arts Occupations by Sex
Within the Management, Business, Science and Arts occupations in Princeton, the most male-oriented occupations are Computers, Engineering & Science (100.0%), Architecture & Engineering (100.0%), and Management (55.6%), while the most female-oriented occupations are Business & Financial (100.0%), Legal Services & Support (100.0%), and Education Instruction & Library (100.0%).
| Occupation | Male | Female |
| Management | 15 (55.6%) | 12 (44.4%) |
| Business & Financial | 0 (0.0%) | 5 (100.0%) |
| Computers, Engineering & Science | 12 (100.0%) | 0 (0.0%) |
| Computers & Mathematics | 0 (0.0%) | 0 (0.0%) |
| Architecture & Engineering | 12 (100.0%) | 0 (0.0%) |
| Life, Physical & Social Science | 0 (0.0%) | 0 (0.0%) |
| Community & Social Service | 10 (20.0%) | 40 (80.0%) |
| Education, Arts & Media | 10 (50.0%) | 10 (50.0%) |
| Legal Services & Support | 0 (0.0%) | 2 (100.0%) |
| Education Instruction & Library | 0 (0.0%) | 28 (100.0%) |
| Arts, Media & Entertainment | 0 (0.0%) | 0 (0.0%) |
| Health Diagnosing & Treating | 0 (0.0%) | 12 (100.0%) |
| Health Technologists | 0 (0.0%) | 11 (100.0%) |
| Total (Category) | 37 (34.9%) | 69 (65.1%) |
| Total (Overall) | 274 (47.7%) | 300 (52.3%) |
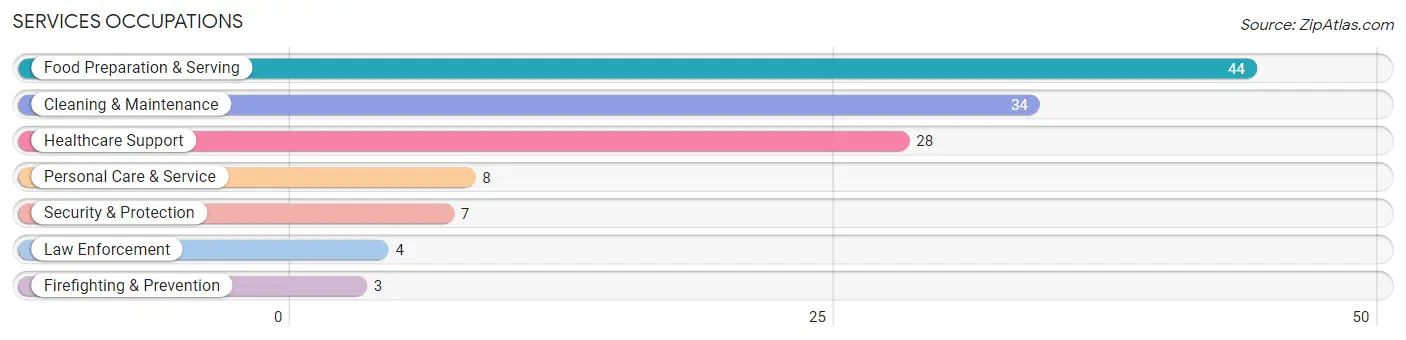
Services Occupations
The most common Services occupations in Princeton are Food Preparation & Serving (44 | 7.7%), Cleaning & Maintenance (34 | 5.9%), Healthcare Support (28 | 4.9%), Personal Care & Service (8 | 1.4%), and Security & Protection (7 | 1.2%).
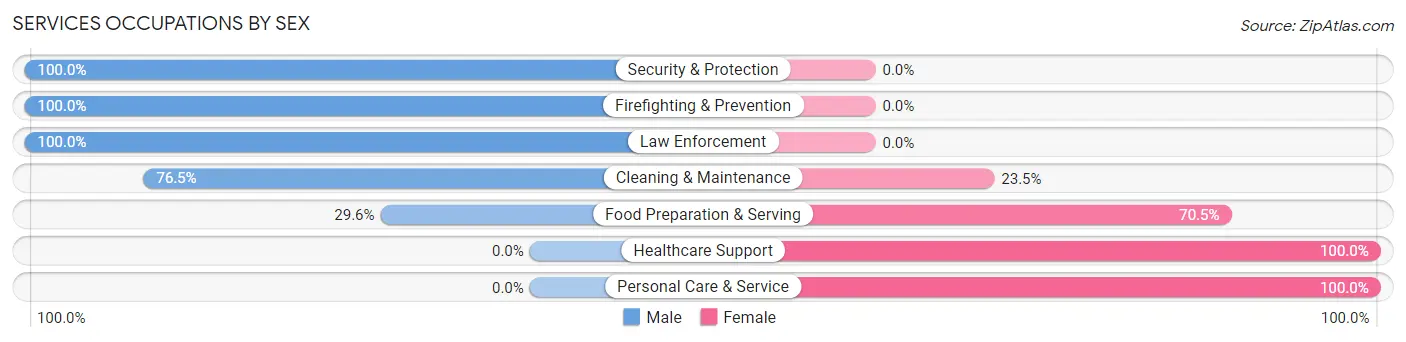
Services Occupations by Sex
Within the Services occupations in Princeton, the most male-oriented occupations are Security & Protection (100.0%), Firefighting & Prevention (100.0%), and Law Enforcement (100.0%), while the most female-oriented occupations are Healthcare Support (100.0%), Personal Care & Service (100.0%), and Food Preparation & Serving (70.5%).
| Occupation | Male | Female |
| Healthcare Support | 0 (0.0%) | 28 (100.0%) |
| Security & Protection | 7 (100.0%) | 0 (0.0%) |
| Firefighting & Prevention | 3 (100.0%) | 0 (0.0%) |
| Law Enforcement | 4 (100.0%) | 0 (0.0%) |
| Food Preparation & Serving | 13 (29.5%) | 31 (70.5%) |
| Cleaning & Maintenance | 26 (76.5%) | 8 (23.5%) |
| Personal Care & Service | 0 (0.0%) | 8 (100.0%) |
| Total (Category) | 46 (38.0%) | 75 (62.0%) |
| Total (Overall) | 274 (47.7%) | 300 (52.3%) |
Sales and Office Occupations
The most common Sales and Office occupations in Princeton are Office & Administration (38 | 6.6%), and Sales & Related (34 | 5.9%).
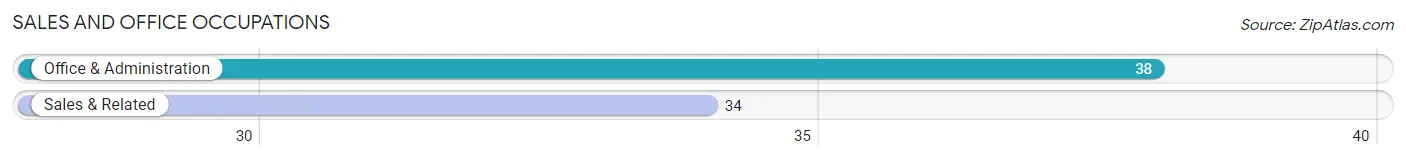
Sales and Office Occupations by Sex
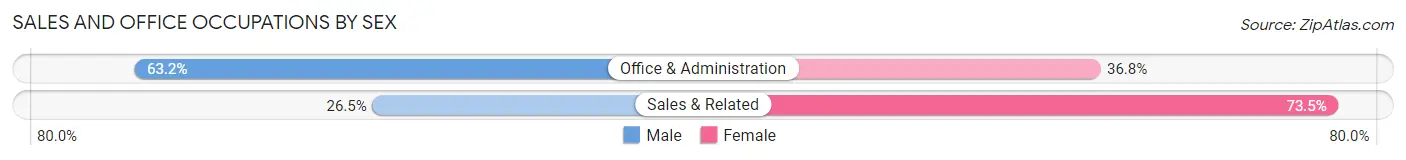
| Occupation | Male | Female |
| Sales & Related | 9 (26.5%) | 25 (73.5%) |
| Office & Administration | 24 (63.2%) | 14 (36.8%) |
| Total (Category) | 33 (45.8%) | 39 (54.2%) |
| Total (Overall) | 274 (47.7%) | 300 (52.3%) |
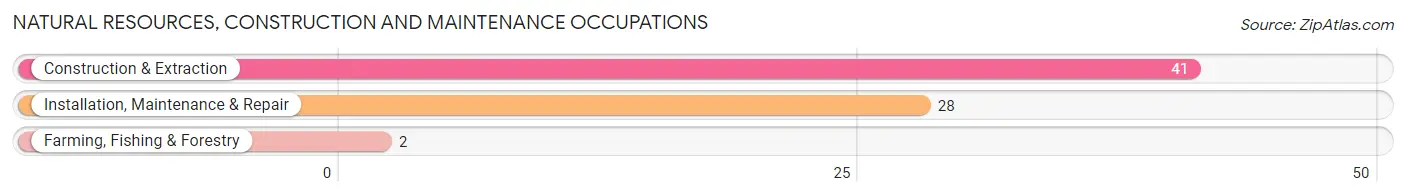
Natural Resources, Construction and Maintenance Occupations
The most common Natural Resources, Construction and Maintenance occupations in Princeton are Construction & Extraction (41 | 7.1%), Installation, Maintenance & Repair (28 | 4.9%), and Farming, Fishing & Forestry (2 | 0.4%).
Natural Resources, Construction and Maintenance Occupations by Sex
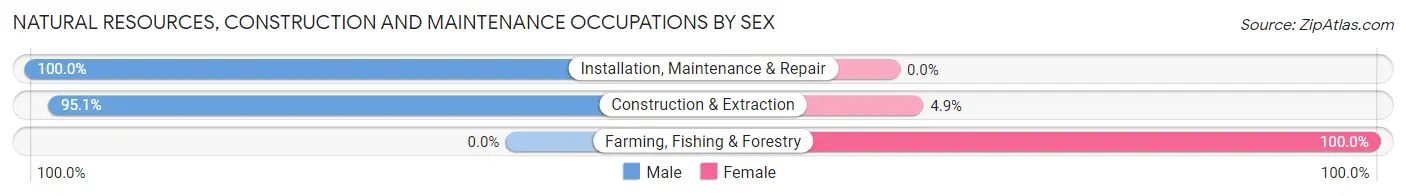
| Occupation | Male | Female |
| Farming, Fishing & Forestry | 0 (0.0%) | 2 (100.0%) |
| Construction & Extraction | 39 (95.1%) | 2 (4.9%) |
| Installation, Maintenance & Repair | 28 (100.0%) | 0 (0.0%) |
| Total (Category) | 67 (94.4%) | 4 (5.6%) |
| Total (Overall) | 274 (47.7%) | 300 (52.3%) |
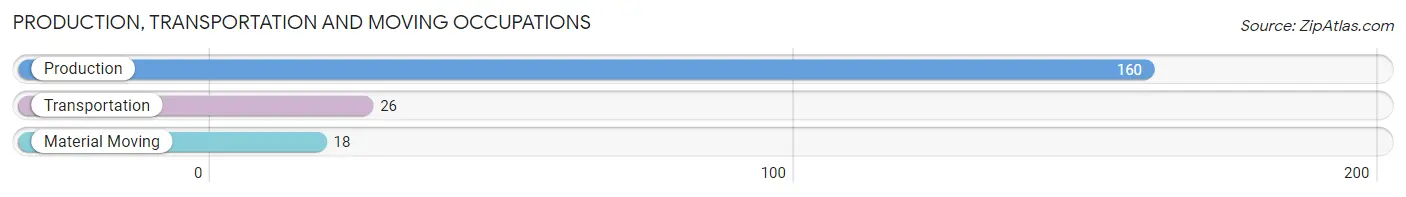
Production, Transportation and Moving Occupations
The most common Production, Transportation and Moving occupations in Princeton are Production (160 | 27.9%), Transportation (26 | 4.5%), and Material Moving (18 | 3.1%).
Production, Transportation and Moving Occupations by Sex
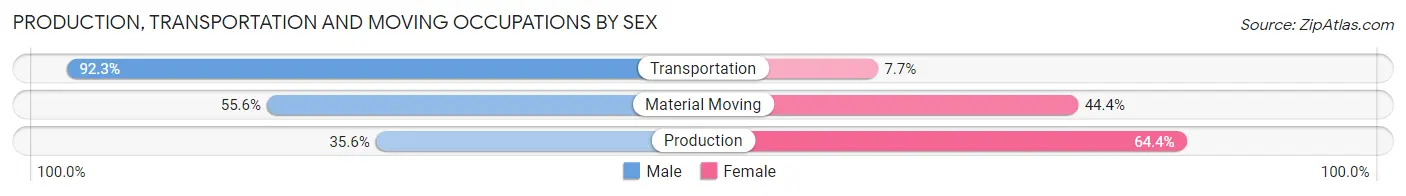
| Occupation | Male | Female |
| Production | 57 (35.6%) | 103 (64.4%) |
| Transportation | 24 (92.3%) | 2 (7.7%) |
| Material Moving | 10 (55.6%) | 8 (44.4%) |
| Total (Category) | 91 (44.6%) | 113 (55.4%) |
| Total (Overall) | 274 (47.7%) | 300 (52.3%) |
Employment Industries by Sex in Princeton
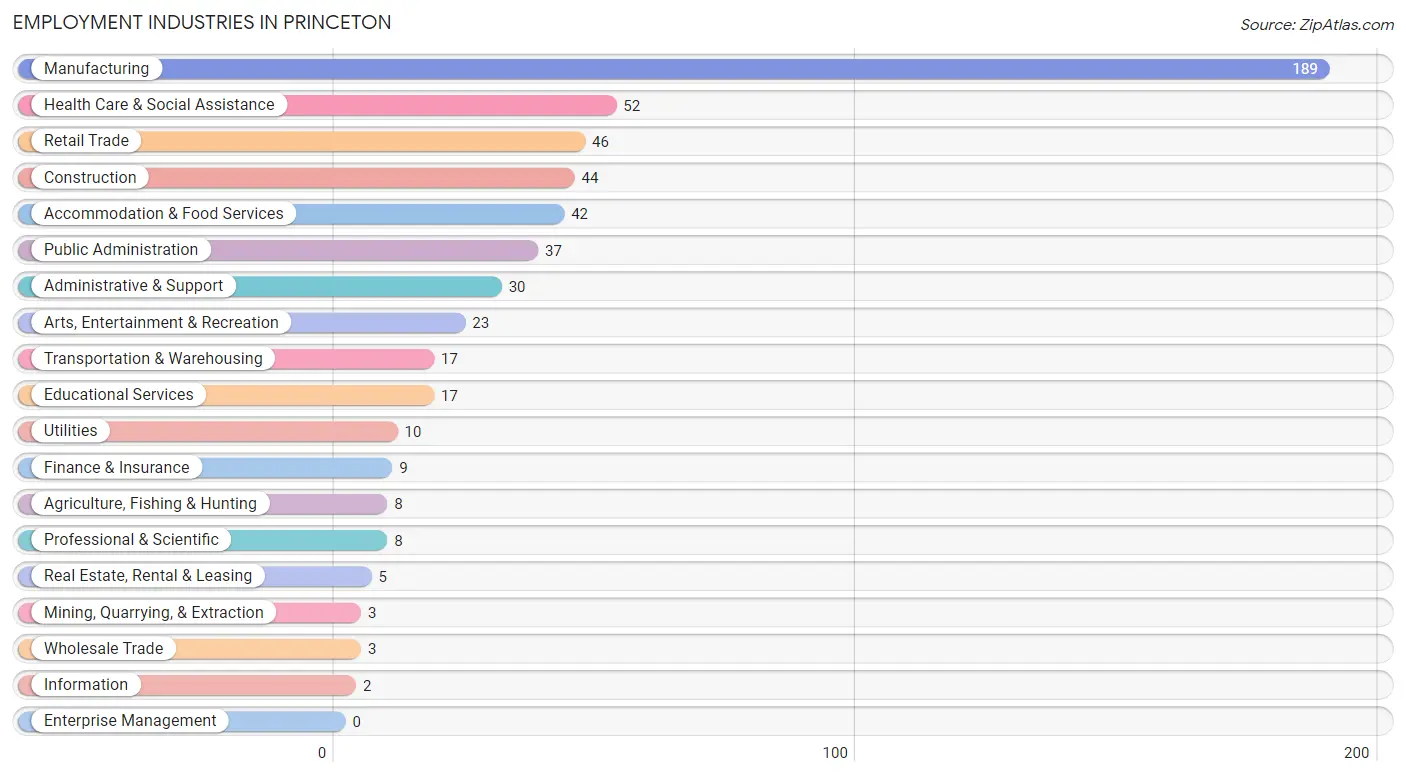
Employment Industries in Princeton
The major employment industries in Princeton include Manufacturing (189 | 32.9%), Health Care & Social Assistance (52 | 9.1%), Retail Trade (46 | 8.0%), Construction (44 | 7.7%), and Accommodation & Food Services (42 | 7.3%).
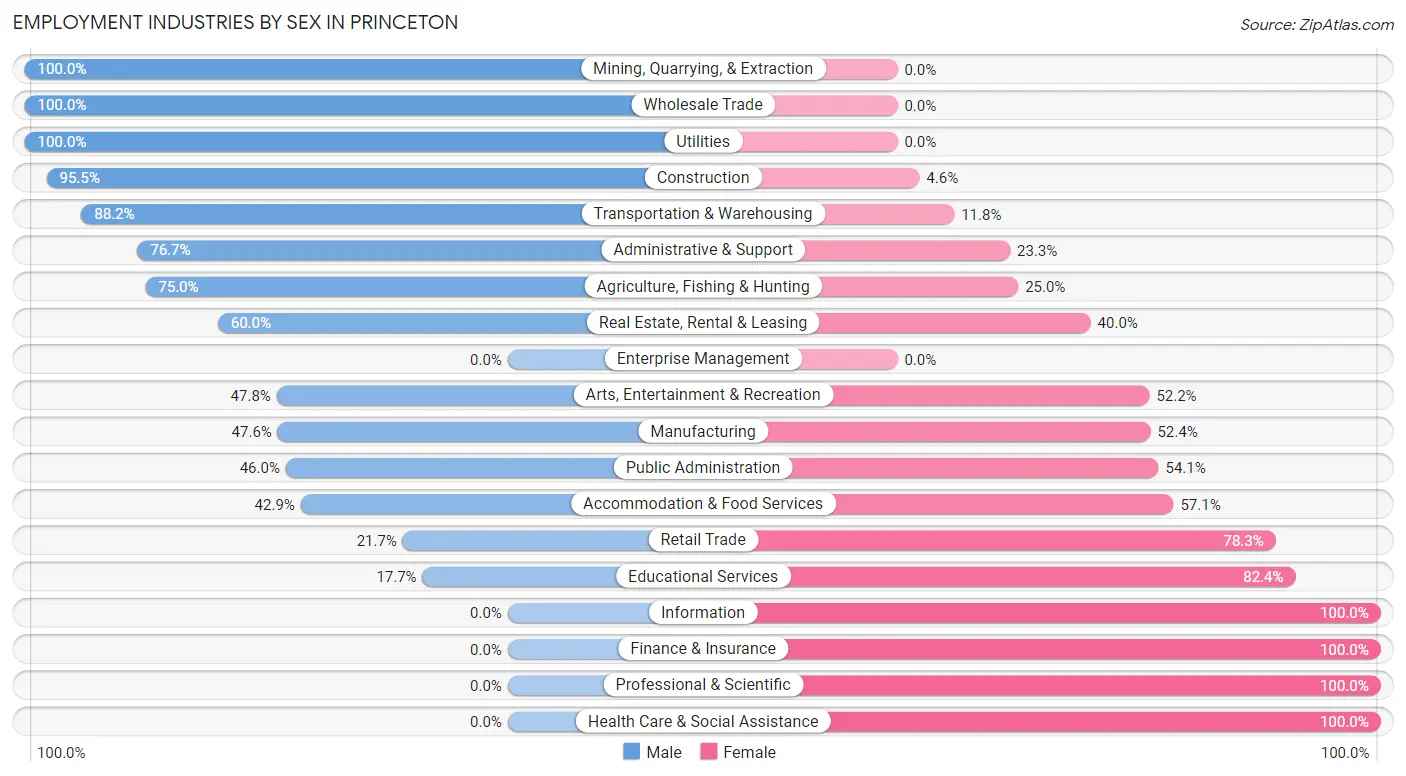
Employment Industries by Sex in Princeton
The Princeton industries that see more men than women are Mining, Quarrying, & Extraction (100.0%), Wholesale Trade (100.0%), and Utilities (100.0%), whereas the industries that tend to have a higher number of women are Information (100.0%), Finance & Insurance (100.0%), and Professional & Scientific (100.0%).
| Industry | Male | Female |
| Agriculture, Fishing & Hunting | 6 (75.0%) | 2 (25.0%) |
| Mining, Quarrying, & Extraction | 3 (100.0%) | 0 (0.0%) |
| Construction | 42 (95.5%) | 2 (4.5%) |
| Manufacturing | 90 (47.6%) | 99 (52.4%) |
| Wholesale Trade | 3 (100.0%) | 0 (0.0%) |
| Retail Trade | 10 (21.7%) | 36 (78.3%) |
| Transportation & Warehousing | 15 (88.2%) | 2 (11.8%) |
| Utilities | 10 (100.0%) | 0 (0.0%) |
| Information | 0 (0.0%) | 2 (100.0%) |
| Finance & Insurance | 0 (0.0%) | 9 (100.0%) |
| Real Estate, Rental & Leasing | 3 (60.0%) | 2 (40.0%) |
| Professional & Scientific | 0 (0.0%) | 8 (100.0%) |
| Enterprise Management | 0 (0.0%) | 0 (0.0%) |
| Administrative & Support | 23 (76.7%) | 7 (23.3%) |
| Educational Services | 3 (17.6%) | 14 (82.4%) |
| Health Care & Social Assistance | 0 (0.0%) | 52 (100.0%) |
| Arts, Entertainment & Recreation | 11 (47.8%) | 12 (52.2%) |
| Accommodation & Food Services | 18 (42.9%) | 24 (57.1%) |
| Public Administration | 17 (46.0%) | 20 (54.0%) |
| Total | 274 (47.7%) | 300 (52.3%) |
Education in Princeton
School Enrollment in Princeton
The most common levels of schooling among the 224 students in Princeton are high school (78 | 34.8%), elementary school (56 | 25.0%), and college / undergraduate (43 | 19.2%).
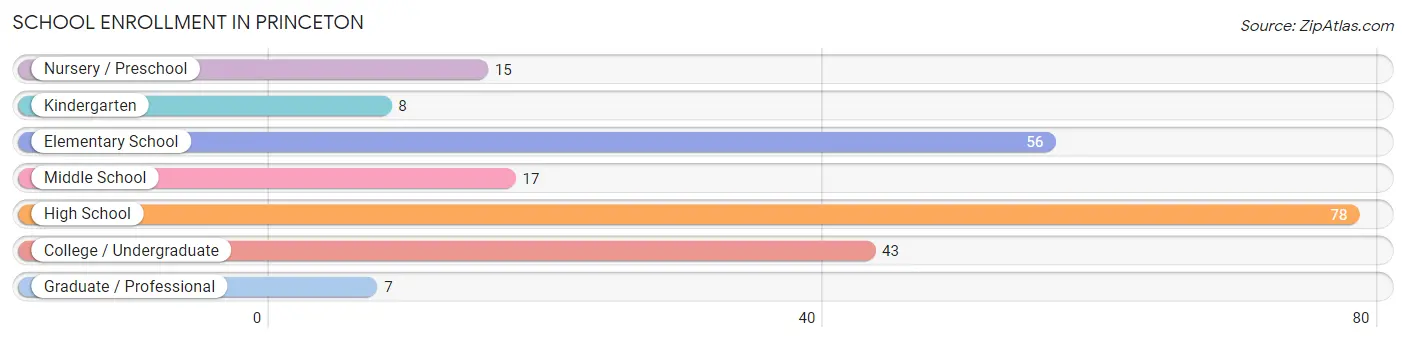
| School Level | # Students | % Students |
| Nursery / Preschool | 15 | 6.7% |
| Kindergarten | 8 | 3.6% |
| Elementary School | 56 | 25.0% |
| Middle School | 17 | 7.6% |
| High School | 78 | 34.8% |
| College / Undergraduate | 43 | 19.2% |
| Graduate / Professional | 7 | 3.1% |
| Total | 224 | 100.0% |
School Enrollment by Age by Funding Source in Princeton
Out of a total of 224 students who are enrolled in schools in Princeton, 46 (20.5%) attend a private institution, while the remaining 178 (79.5%) are enrolled in public schools. The age group of 3 to 4 year olds has the highest likelihood of being enrolled in private schools, with 4 (100.0% in the age bracket) enrolled. Conversely, the age group of 20 to 24 year olds has the lowest likelihood of being enrolled in a private school, with 18 (100.0% in the age bracket) attending a public institution.
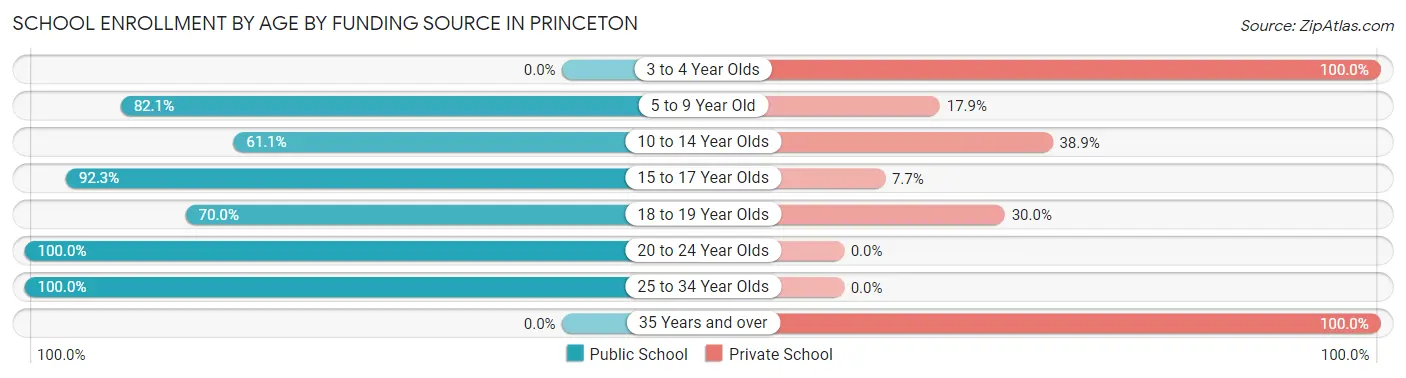
| Age Bracket | Public School | Private School |
| 3 to 4 Year Olds | 0 (0.0%) | 4 (100.0%) |
| 5 to 9 Year Old | 55 (82.1%) | 12 (17.9%) |
| 10 to 14 Year Olds | 22 (61.1%) | 14 (38.9%) |
| 15 to 17 Year Olds | 48 (92.3%) | 4 (7.7%) |
| 18 to 19 Year Olds | 21 (70.0%) | 9 (30.0%) |
| 20 to 24 Year Olds | 18 (100.0%) | 0 (0.0%) |
| 25 to 34 Year Olds | 14 (100.0%) | 0 (0.0%) |
| 35 Years and over | 0 (0.0%) | 3 (100.0%) |
| Total | 178 (79.5%) | 46 (20.5%) |
Educational Attainment by Field of Study in Princeton
Education (25 | 22.7%), arts & humanities (21 | 19.1%), business (17 | 15.4%), social sciences (13 | 11.8%), and visual & performing arts (11 | 10.0%) are the most common fields of study among 110 individuals in Princeton who have obtained a bachelor's degree or higher.
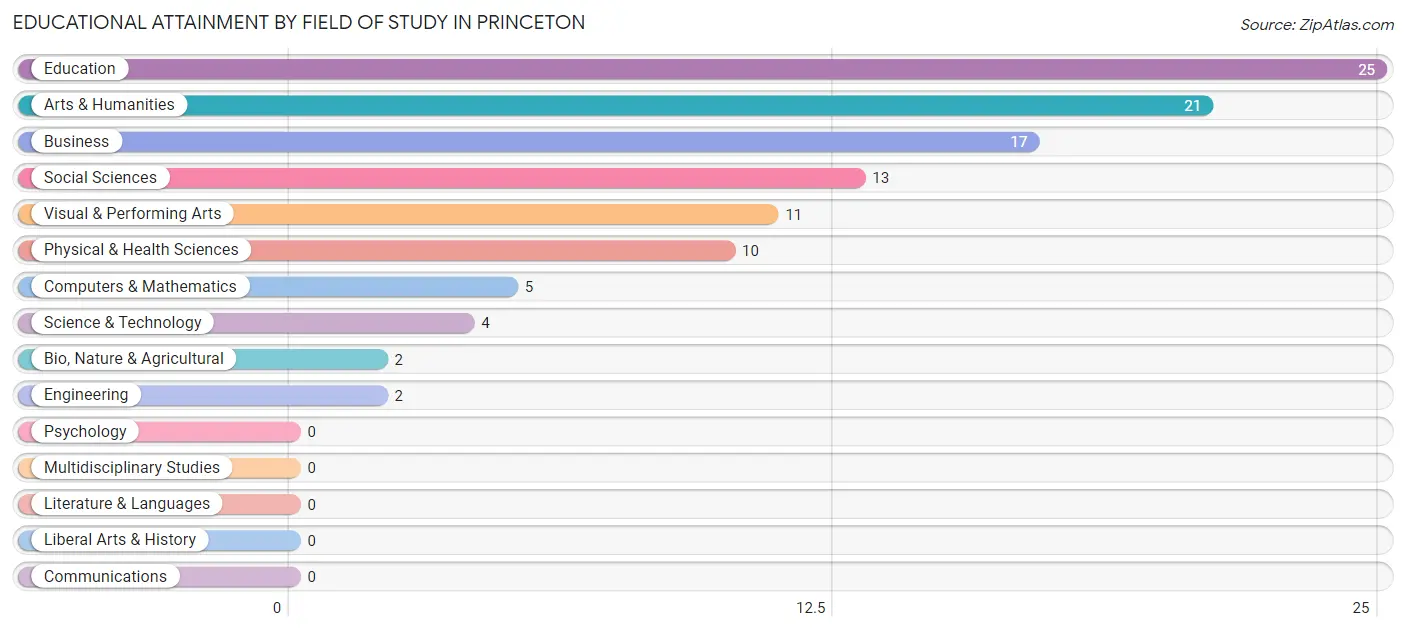
| Field of Study | # Graduates | % Graduates |
| Computers & Mathematics | 5 | 4.5% |
| Bio, Nature & Agricultural | 2 | 1.8% |
| Physical & Health Sciences | 10 | 9.1% |
| Psychology | 0 | 0.0% |
| Social Sciences | 13 | 11.8% |
| Engineering | 2 | 1.8% |
| Multidisciplinary Studies | 0 | 0.0% |
| Science & Technology | 4 | 3.6% |
| Business | 17 | 15.4% |
| Education | 25 | 22.7% |
| Literature & Languages | 0 | 0.0% |
| Liberal Arts & History | 0 | 0.0% |
| Visual & Performing Arts | 11 | 10.0% |
| Communications | 0 | 0.0% |
| Arts & Humanities | 21 | 19.1% |
| Total | 110 | 100.0% |
Transportation & Commute in Princeton
Vehicle Availability by Sex in Princeton
The most prevalent vehicle ownership categories in Princeton are males with 2 vehicles (99, accounting for 36.1%) and females with 2 vehicles (129, making up 33.0%).
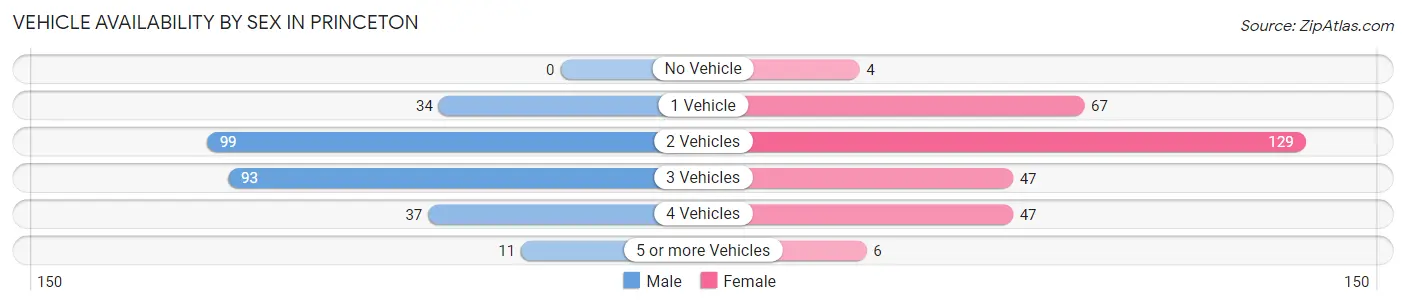
| Vehicles Available | Male | Female |
| No Vehicle | 0 (0.0%) | 4 (1.3%) |
| 1 Vehicle | 34 (12.4%) | 67 (22.3%) |
| 2 Vehicles | 99 (36.1%) | 129 (43.0%) |
| 3 Vehicles | 93 (33.9%) | 47 (15.7%) |
| 4 Vehicles | 37 (13.5%) | 47 (15.7%) |
| 5 or more Vehicles | 11 (4.0%) | 6 (2.0%) |
| Total | 274 (100.0%) | 300 (100.0%) |
Commute Time in Princeton
The most frequently occuring commute durations in Princeton are 20 to 24 minutes (86 commuters, 16.5%), 10 to 14 minutes (75 commuters, 14.4%), and 45 to 59 minutes (75 commuters, 14.4%).
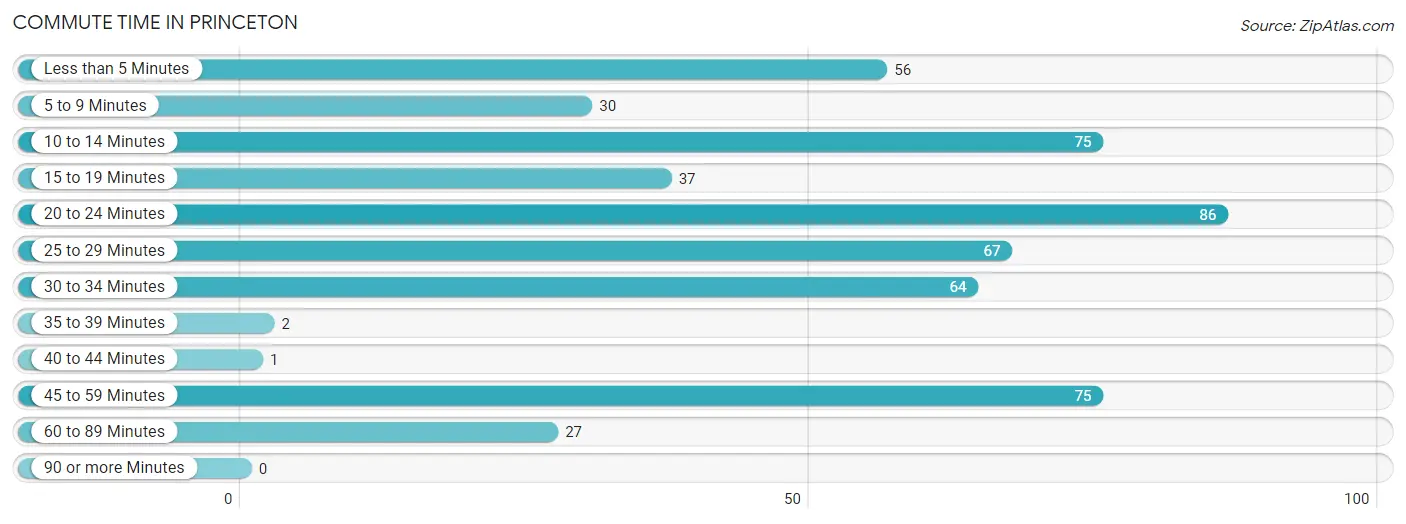
| Commute Time | # Commuters | % Commuters |
| Less than 5 Minutes | 56 | 10.8% |
| 5 to 9 Minutes | 30 | 5.8% |
| 10 to 14 Minutes | 75 | 14.4% |
| 15 to 19 Minutes | 37 | 7.1% |
| 20 to 24 Minutes | 86 | 16.5% |
| 25 to 29 Minutes | 67 | 12.9% |
| 30 to 34 Minutes | 64 | 12.3% |
| 35 to 39 Minutes | 2 | 0.4% |
| 40 to 44 Minutes | 1 | 0.2% |
| 45 to 59 Minutes | 75 | 14.4% |
| 60 to 89 Minutes | 27 | 5.2% |
| 90 or more Minutes | 0 | 0.0% |
Commute Time by Sex in Princeton
The most common commute times in Princeton are 20 to 24 minutes (54 commuters, 23.4%) for males and 10 to 14 minutes (72 commuters, 24.9%) for females.
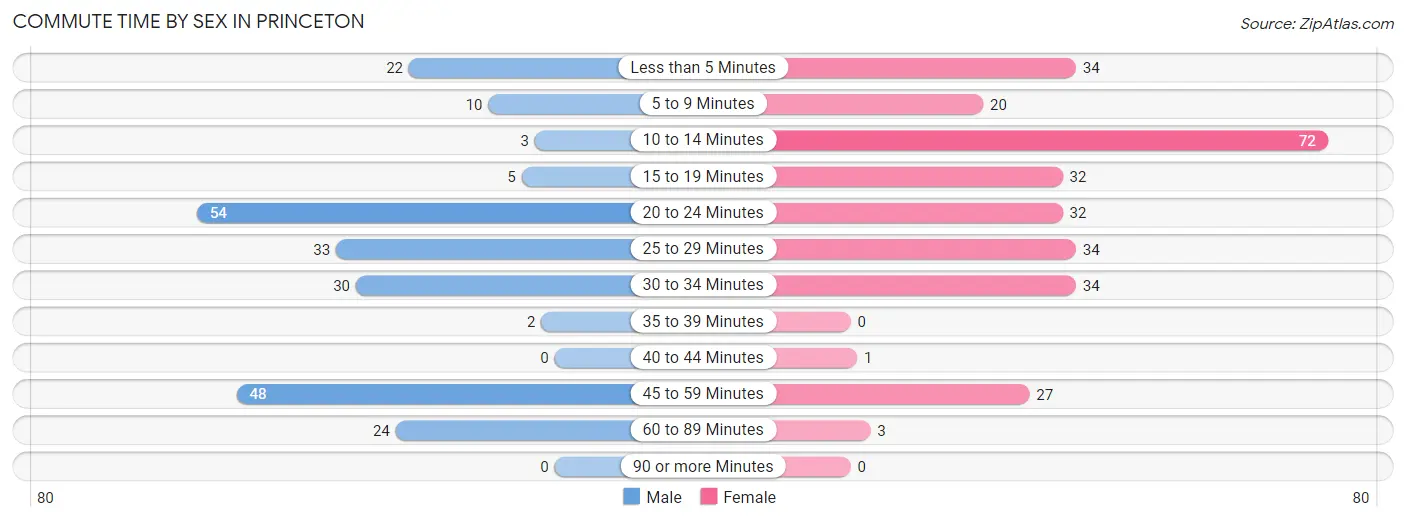
| Commute Time | Male | Female |
| Less than 5 Minutes | 22 (9.5%) | 34 (11.8%) |
| 5 to 9 Minutes | 10 (4.3%) | 20 (6.9%) |
| 10 to 14 Minutes | 3 (1.3%) | 72 (24.9%) |
| 15 to 19 Minutes | 5 (2.2%) | 32 (11.1%) |
| 20 to 24 Minutes | 54 (23.4%) | 32 (11.1%) |
| 25 to 29 Minutes | 33 (14.3%) | 34 (11.8%) |
| 30 to 34 Minutes | 30 (13.0%) | 34 (11.8%) |
| 35 to 39 Minutes | 2 (0.9%) | 0 (0.0%) |
| 40 to 44 Minutes | 0 (0.0%) | 1 (0.4%) |
| 45 to 59 Minutes | 48 (20.8%) | 27 (9.3%) |
| 60 to 89 Minutes | 24 (10.4%) | 3 (1.0%) |
| 90 or more Minutes | 0 (0.0%) | 0 (0.0%) |
Time of Departure to Work by Sex in Princeton
The most frequent times of departure to work in Princeton are 4:00 PM to 11:59 PM (36, 15.6%) for males and 6:00 AM to 6:29 AM (67, 23.2%) for females.
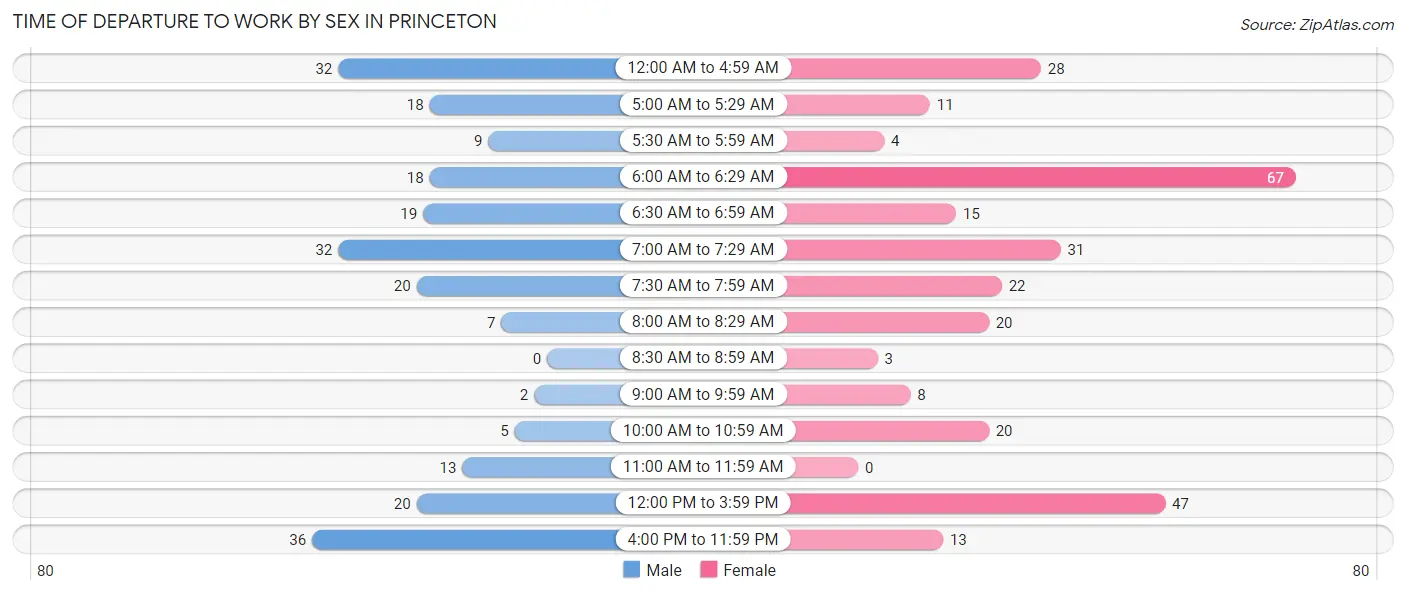
| Time of Departure | Male | Female |
| 12:00 AM to 4:59 AM | 32 (13.9%) | 28 (9.7%) |
| 5:00 AM to 5:29 AM | 18 (7.8%) | 11 (3.8%) |
| 5:30 AM to 5:59 AM | 9 (3.9%) | 4 (1.4%) |
| 6:00 AM to 6:29 AM | 18 (7.8%) | 67 (23.2%) |
| 6:30 AM to 6:59 AM | 19 (8.2%) | 15 (5.2%) |
| 7:00 AM to 7:29 AM | 32 (13.9%) | 31 (10.7%) |
| 7:30 AM to 7:59 AM | 20 (8.7%) | 22 (7.6%) |
| 8:00 AM to 8:29 AM | 7 (3.0%) | 20 (6.9%) |
| 8:30 AM to 8:59 AM | 0 (0.0%) | 3 (1.0%) |
| 9:00 AM to 9:59 AM | 2 (0.9%) | 8 (2.8%) |
| 10:00 AM to 10:59 AM | 5 (2.2%) | 20 (6.9%) |
| 11:00 AM to 11:59 AM | 13 (5.6%) | 0 (0.0%) |
| 12:00 PM to 3:59 PM | 20 (8.7%) | 47 (16.3%) |
| 4:00 PM to 11:59 PM | 36 (15.6%) | 13 (4.5%) |
| Total | 231 (100.0%) | 289 (100.0%) |
Housing Occupancy in Princeton
Occupancy by Ownership in Princeton
Of the total 481 dwellings in Princeton, owner-occupied units account for 343 (71.3%), while renter-occupied units make up 138 (28.7%).
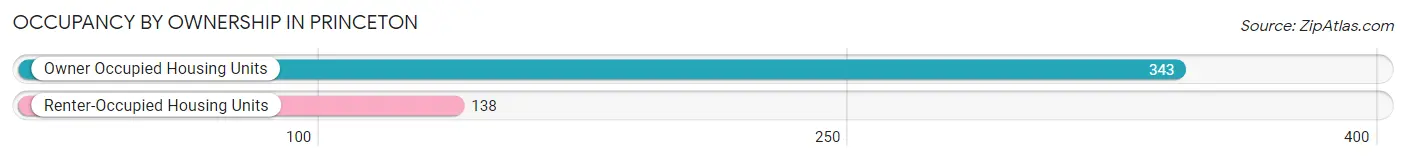
| Occupancy | # Housing Units | % Housing Units |
| Owner Occupied Housing Units | 343 | 71.3% |
| Renter-Occupied Housing Units | 138 | 28.7% |
| Total Occupied Housing Units | 481 | 100.0% |
Occupancy by Household Size in Princeton
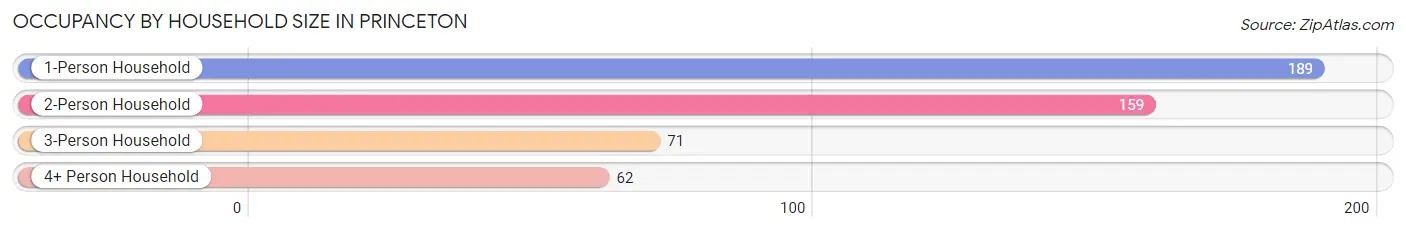
| Household Size | # Housing Units | % Housing Units |
| 1-Person Household | 189 | 39.3% |
| 2-Person Household | 159 | 33.1% |
| 3-Person Household | 71 | 14.8% |
| 4+ Person Household | 62 | 12.9% |
| Total Housing Units | 481 | 100.0% |
Occupancy by Ownership by Household Size in Princeton
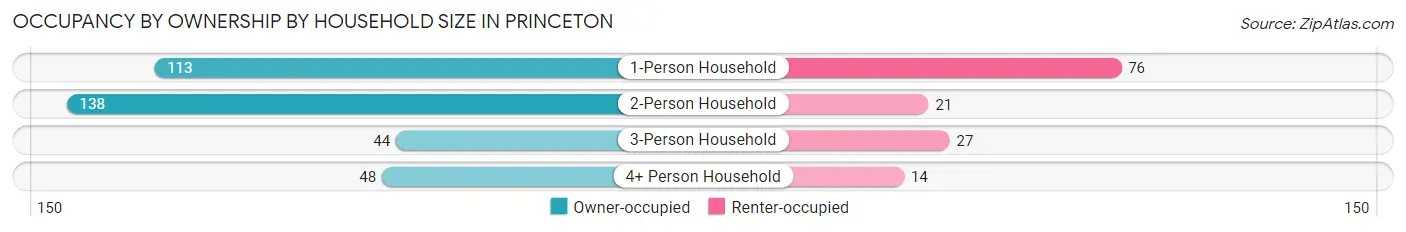
| Household Size | Owner-occupied | Renter-occupied |
| 1-Person Household | 113 (59.8%) | 76 (40.2%) |
| 2-Person Household | 138 (86.8%) | 21 (13.2%) |
| 3-Person Household | 44 (62.0%) | 27 (38.0%) |
| 4+ Person Household | 48 (77.4%) | 14 (22.6%) |
| Total Housing Units | 343 (71.3%) | 138 (28.7%) |
Occupancy by Educational Attainment in Princeton
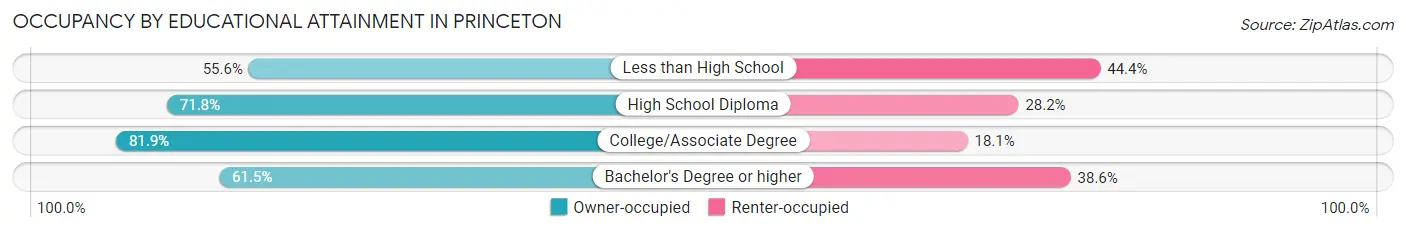
| Household Size | Owner-occupied | Renter-occupied |
| Less than High School | 30 (55.6%) | 24 (44.4%) |
| High School Diploma | 140 (71.8%) | 55 (28.2%) |
| College/Associate Degree | 122 (81.9%) | 27 (18.1%) |
| Bachelor's Degree or higher | 51 (61.5%) | 32 (38.6%) |
Occupancy by Age of Householder in Princeton
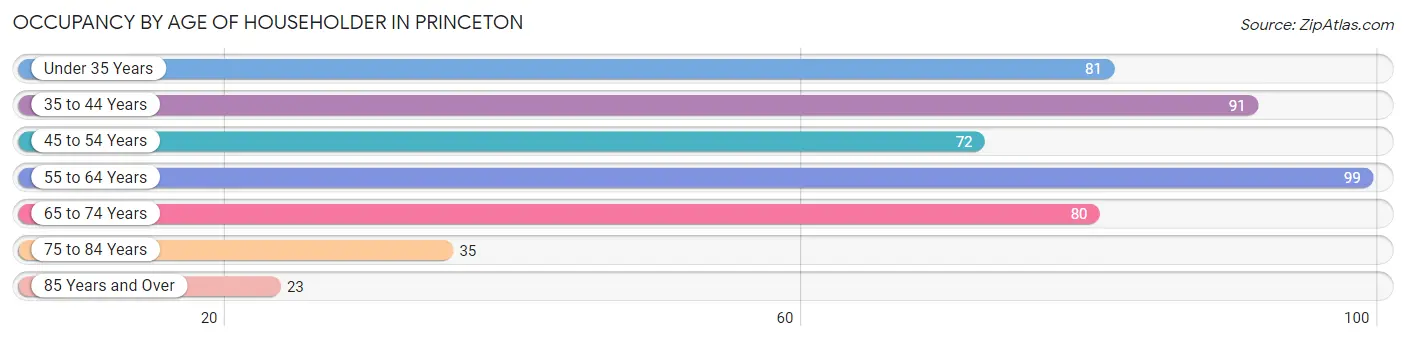
| Age Bracket | # Households | % Households |
| Under 35 Years | 81 | 16.8% |
| 35 to 44 Years | 91 | 18.9% |
| 45 to 54 Years | 72 | 15.0% |
| 55 to 64 Years | 99 | 20.6% |
| 65 to 74 Years | 80 | 16.6% |
| 75 to 84 Years | 35 | 7.3% |
| 85 Years and Over | 23 | 4.8% |
| Total | 481 | 100.0% |
Housing Finances in Princeton
Median Income by Occupancy in Princeton
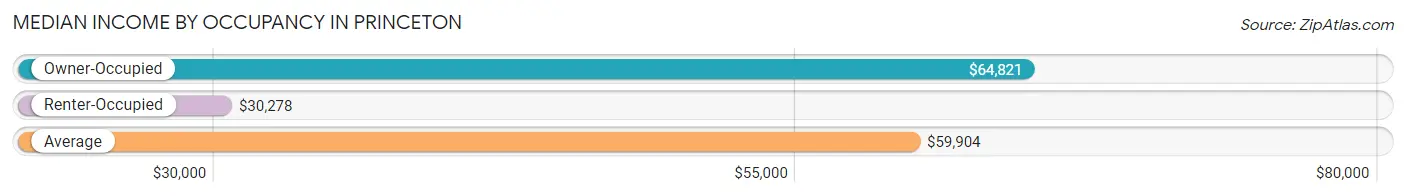
| Occupancy Type | # Households | Median Income |
| Owner-Occupied | 343 (71.3%) | $64,821 |
| Renter-Occupied | 138 (28.7%) | $30,278 |
| Average | 481 (100.0%) | $59,904 |
Occupancy by Householder Income Bracket in Princeton
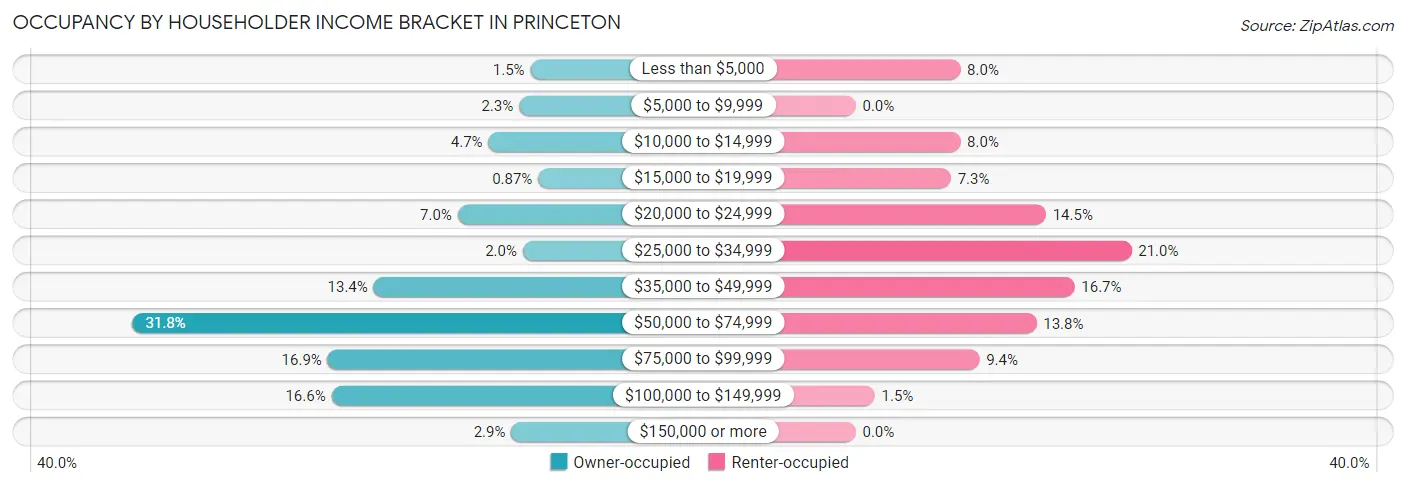
| Income Bracket | Owner-occupied | Renter-occupied |
| Less than $5,000 | 5 (1.5%) | 11 (8.0%) |
| $5,000 to $9,999 | 8 (2.3%) | 0 (0.0%) |
| $10,000 to $14,999 | 16 (4.7%) | 11 (8.0%) |
| $15,000 to $19,999 | 3 (0.9%) | 10 (7.2%) |
| $20,000 to $24,999 | 24 (7.0%) | 20 (14.5%) |
| $25,000 to $34,999 | 7 (2.0%) | 29 (21.0%) |
| $35,000 to $49,999 | 46 (13.4%) | 23 (16.7%) |
| $50,000 to $74,999 | 109 (31.8%) | 19 (13.8%) |
| $75,000 to $99,999 | 58 (16.9%) | 13 (9.4%) |
| $100,000 to $149,999 | 57 (16.6%) | 2 (1.5%) |
| $150,000 or more | 10 (2.9%) | 0 (0.0%) |
| Total | 343 (100.0%) | 138 (100.0%) |
Monthly Housing Cost Tiers in Princeton
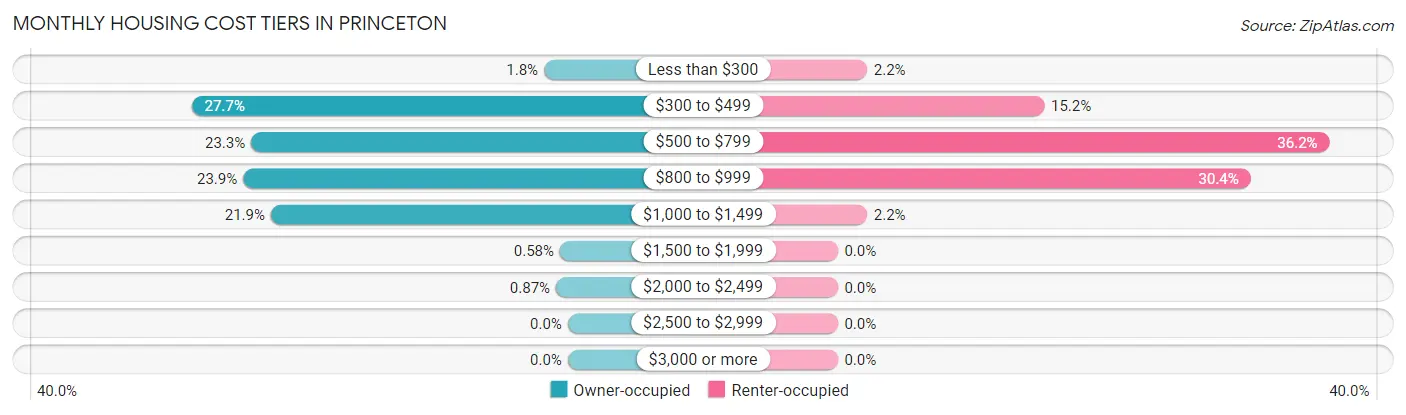
| Monthly Cost | Owner-occupied | Renter-occupied |
| Less than $300 | 6 (1.8%) | 3 (2.2%) |
| $300 to $499 | 95 (27.7%) | 21 (15.2%) |
| $500 to $799 | 80 (23.3%) | 50 (36.2%) |
| $800 to $999 | 82 (23.9%) | 42 (30.4%) |
| $1,000 to $1,499 | 75 (21.9%) | 3 (2.2%) |
| $1,500 to $1,999 | 2 (0.6%) | 0 (0.0%) |
| $2,000 to $2,499 | 3 (0.9%) | 0 (0.0%) |
| $2,500 to $2,999 | 0 (0.0%) | 0 (0.0%) |
| $3,000 or more | 0 (0.0%) | 0 (0.0%) |
| Total | 343 (100.0%) | 138 (100.0%) |
Physical Housing Characteristics in Princeton
Housing Structures in Princeton
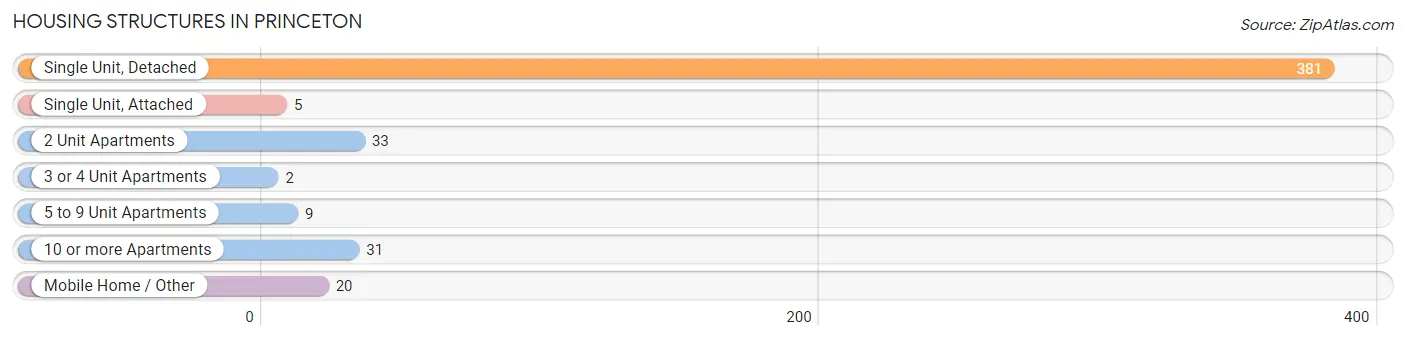
| Structure Type | # Housing Units | % Housing Units |
| Single Unit, Detached | 381 | 79.2% |
| Single Unit, Attached | 5 | 1.0% |
| 2 Unit Apartments | 33 | 6.9% |
| 3 or 4 Unit Apartments | 2 | 0.4% |
| 5 to 9 Unit Apartments | 9 | 1.9% |
| 10 or more Apartments | 31 | 6.4% |
| Mobile Home / Other | 20 | 4.2% |
| Total | 481 | 100.0% |
Housing Structures by Occupancy in Princeton
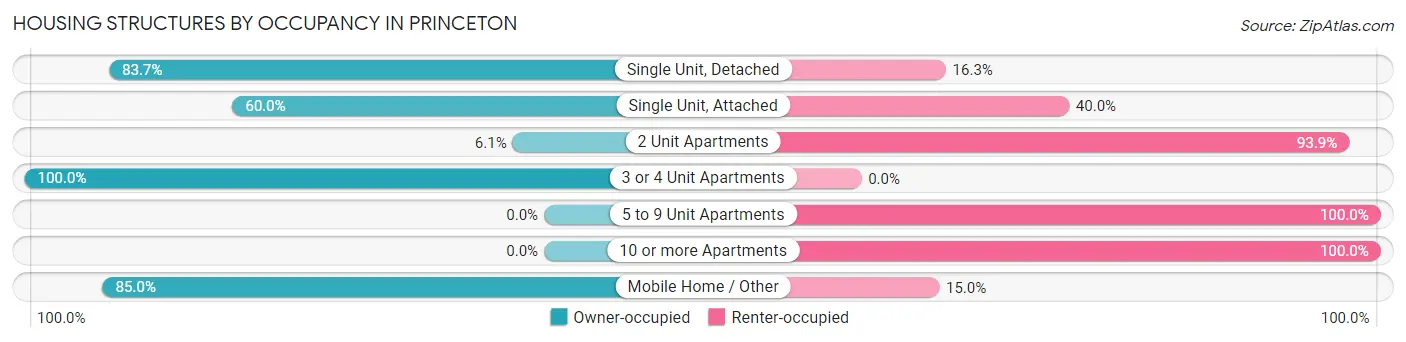
| Structure Type | Owner-occupied | Renter-occupied |
| Single Unit, Detached | 319 (83.7%) | 62 (16.3%) |
| Single Unit, Attached | 3 (60.0%) | 2 (40.0%) |
| 2 Unit Apartments | 2 (6.1%) | 31 (93.9%) |
| 3 or 4 Unit Apartments | 2 (100.0%) | 0 (0.0%) |
| 5 to 9 Unit Apartments | 0 (0.0%) | 9 (100.0%) |
| 10 or more Apartments | 0 (0.0%) | 31 (100.0%) |
| Mobile Home / Other | 17 (85.0%) | 3 (15.0%) |
| Total | 343 (71.3%) | 138 (28.7%) |
Housing Structures by Number of Rooms in Princeton
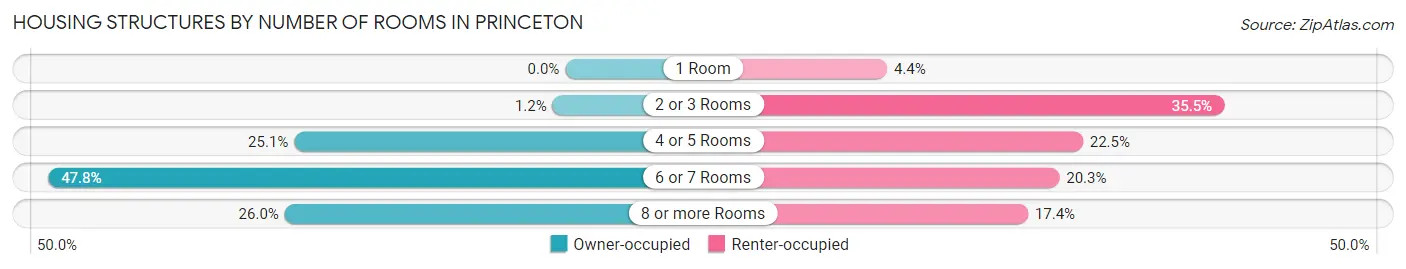
| Number of Rooms | Owner-occupied | Renter-occupied |
| 1 Room | 0 (0.0%) | 6 (4.3%) |
| 2 or 3 Rooms | 4 (1.2%) | 49 (35.5%) |
| 4 or 5 Rooms | 86 (25.1%) | 31 (22.5%) |
| 6 or 7 Rooms | 164 (47.8%) | 28 (20.3%) |
| 8 or more Rooms | 89 (26.0%) | 24 (17.4%) |
| Total | 343 (100.0%) | 138 (100.0%) |
Housing Structure by Heating Type in Princeton
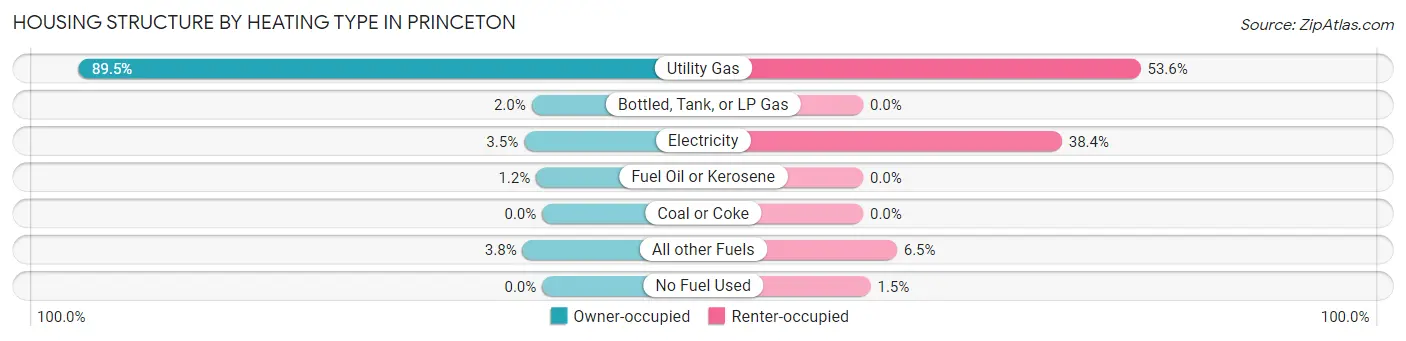
| Heating Type | Owner-occupied | Renter-occupied |
| Utility Gas | 307 (89.5%) | 74 (53.6%) |
| Bottled, Tank, or LP Gas | 7 (2.0%) | 0 (0.0%) |
| Electricity | 12 (3.5%) | 53 (38.4%) |
| Fuel Oil or Kerosene | 4 (1.2%) | 0 (0.0%) |
| Coal or Coke | 0 (0.0%) | 0 (0.0%) |
| All other Fuels | 13 (3.8%) | 9 (6.5%) |
| No Fuel Used | 0 (0.0%) | 2 (1.5%) |
| Total | 343 (100.0%) | 138 (100.0%) |
Household Vehicle Usage in Princeton
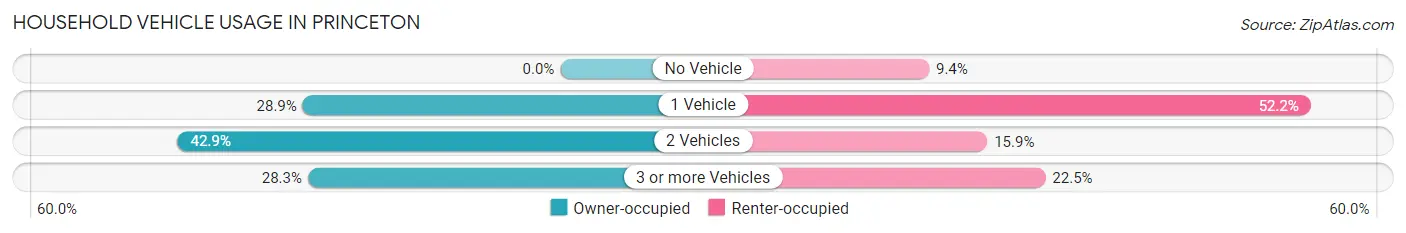
| Vehicles per Household | Owner-occupied | Renter-occupied |
| No Vehicle | 0 (0.0%) | 13 (9.4%) |
| 1 Vehicle | 99 (28.9%) | 72 (52.2%) |
| 2 Vehicles | 147 (42.9%) | 22 (15.9%) |
| 3 or more Vehicles | 97 (28.3%) | 31 (22.5%) |
| Total | 343 (100.0%) | 138 (100.0%) |
Real Estate & Mortgages in Princeton
Real Estate and Mortgage Overview in Princeton
| Characteristic | Without Mortgage | With Mortgage |
| Housing Units | 162 | 181 |
| Median Property Value | $95,000 | $100,300 |
| Median Household Income | $62,717 | $8 |
| Monthly Housing Costs | $450 | $0 |
| Real Estate Taxes | $1,625 | $0 |
Property Value by Mortgage Status in Princeton
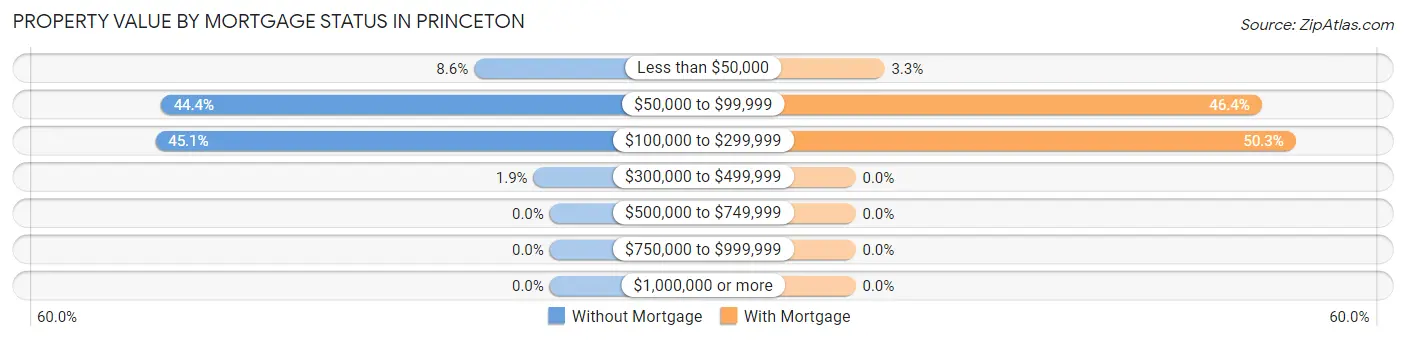
| Property Value | Without Mortgage | With Mortgage |
| Less than $50,000 | 14 (8.6%) | 6 (3.3%) |
| $50,000 to $99,999 | 72 (44.4%) | 84 (46.4%) |
| $100,000 to $299,999 | 73 (45.1%) | 91 (50.3%) |
| $300,000 to $499,999 | 3 (1.8%) | 0 (0.0%) |
| $500,000 to $749,999 | 0 (0.0%) | 0 (0.0%) |
| $750,000 to $999,999 | 0 (0.0%) | 0 (0.0%) |
| $1,000,000 or more | 0 (0.0%) | 0 (0.0%) |
| Total | 162 (100.0%) | 181 (100.0%) |
Household Income by Mortgage Status in Princeton
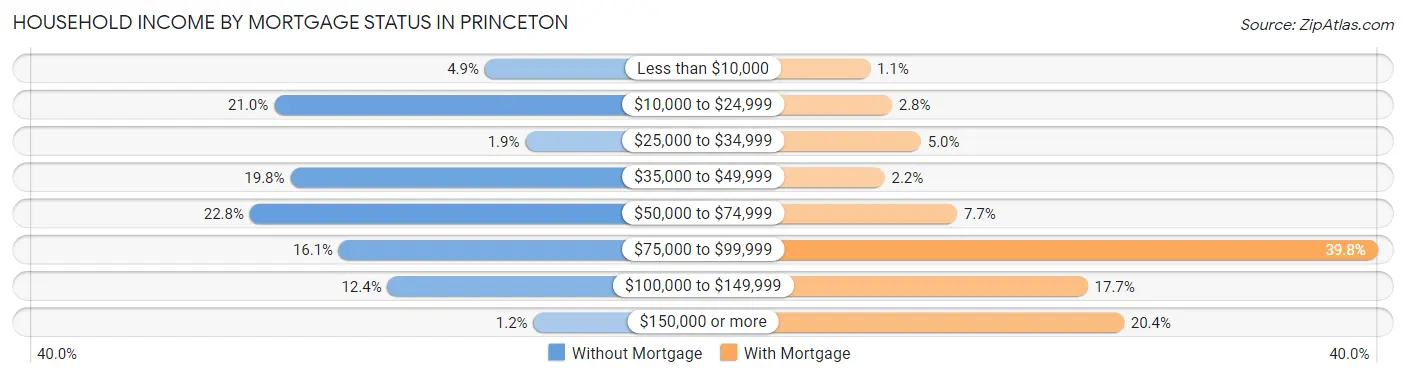
| Household Income | Without Mortgage | With Mortgage |
| Less than $10,000 | 8 (4.9%) | 2 (1.1%) |
| $10,000 to $24,999 | 34 (21.0%) | 5 (2.8%) |
| $25,000 to $34,999 | 3 (1.8%) | 9 (5.0%) |
| $35,000 to $49,999 | 32 (19.8%) | 4 (2.2%) |
| $50,000 to $74,999 | 37 (22.8%) | 14 (7.7%) |
| $75,000 to $99,999 | 26 (16.1%) | 72 (39.8%) |
| $100,000 to $149,999 | 20 (12.3%) | 32 (17.7%) |
| $150,000 or more | 2 (1.2%) | 37 (20.4%) |
| Total | 162 (100.0%) | 181 (100.0%) |
Property Value to Household Income Ratio in Princeton
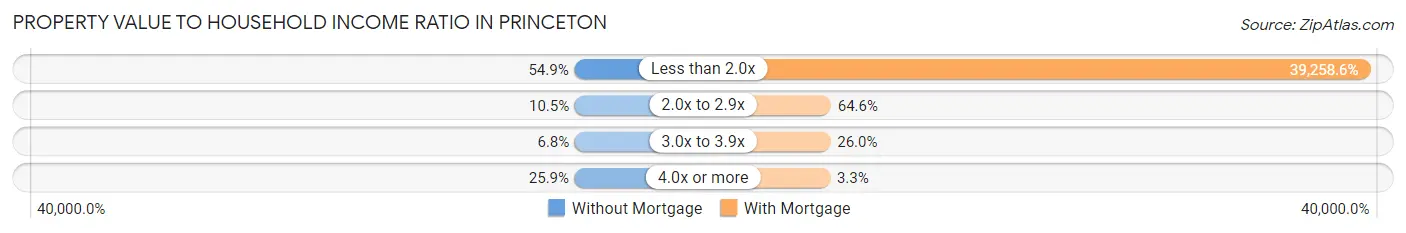
| Value-to-Income Ratio | Without Mortgage | With Mortgage |
| Less than 2.0x | 89 (54.9%) | 71,058 (39,258.6%) |
| 2.0x to 2.9x | 17 (10.5%) | 117 (64.6%) |
| 3.0x to 3.9x | 11 (6.8%) | 47 (26.0%) |
| 4.0x or more | 42 (25.9%) | 6 (3.3%) |
| Total | 162 (100.0%) | 181 (100.0%) |
Real Estate Taxes by Mortgage Status in Princeton
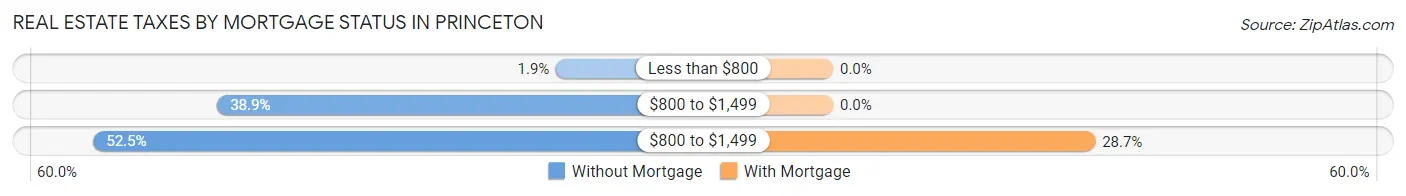
| Property Taxes | Without Mortgage | With Mortgage |
| Less than $800 | 3 (1.8%) | 0 (0.0%) |
| $800 to $1,499 | 63 (38.9%) | 0 (0.0%) |
| $800 to $1,499 | 85 (52.5%) | 52 (28.7%) |
| Total | 162 (100.0%) | 181 (100.0%) |
Health & Disability in Princeton
Health Insurance Coverage by Age in Princeton
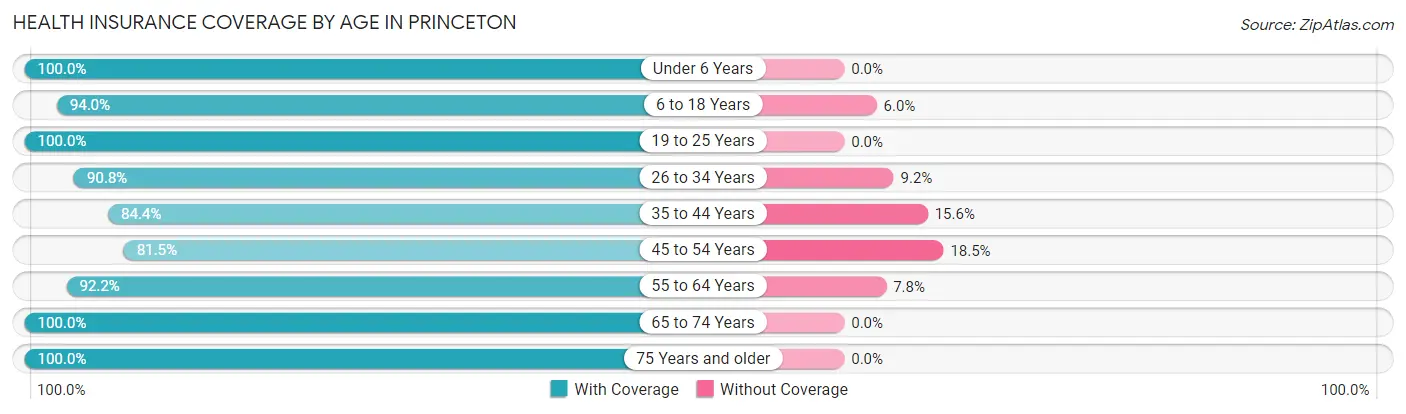
| Age Bracket | With Coverage | Without Coverage |
| Under 6 Years | 68 (100.0%) | 0 (0.0%) |
| 6 to 18 Years | 156 (94.0%) | 10 (6.0%) |
| 19 to 25 Years | 93 (100.0%) | 0 (0.0%) |
| 26 to 34 Years | 79 (90.8%) | 8 (9.2%) |
| 35 to 44 Years | 114 (84.4%) | 21 (15.6%) |
| 45 to 54 Years | 97 (81.5%) | 22 (18.5%) |
| 55 to 64 Years | 118 (92.2%) | 10 (7.8%) |
| 65 to 74 Years | 208 (100.0%) | 0 (0.0%) |
| 75 Years and older | 90 (100.0%) | 0 (0.0%) |
| Total | 1,023 (93.5%) | 71 (6.5%) |
Health Insurance Coverage by Citizenship Status in Princeton
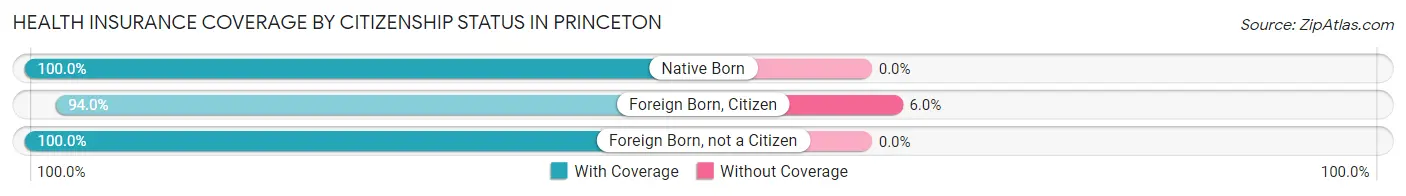
| Citizenship Status | With Coverage | Without Coverage |
| Native Born | 68 (100.0%) | 0 (0.0%) |
| Foreign Born, Citizen | 156 (94.0%) | 10 (6.0%) |
| Foreign Born, not a Citizen | 93 (100.0%) | 0 (0.0%) |
Health Insurance Coverage by Household Income in Princeton
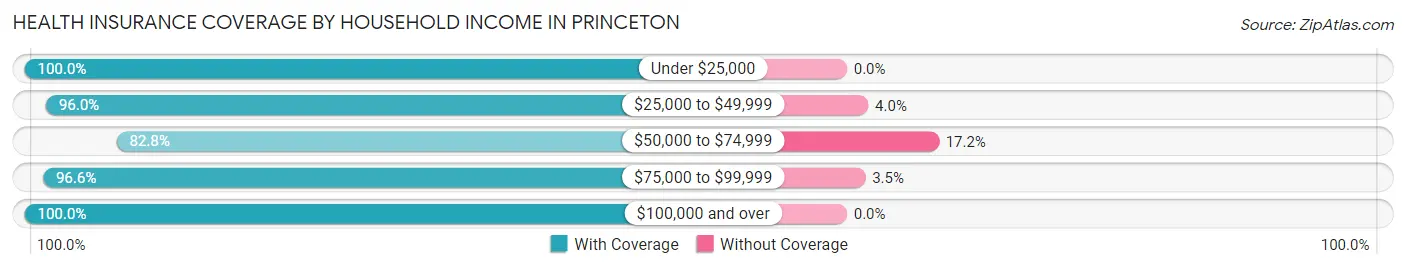
| Household Income | With Coverage | Without Coverage |
| Under $25,000 | 143 (100.0%) | 0 (0.0%) |
| $25,000 to $49,999 | 216 (96.0%) | 9 (4.0%) |
| $50,000 to $74,999 | 274 (82.8%) | 57 (17.2%) |
| $75,000 to $99,999 | 140 (96.6%) | 5 (3.5%) |
| $100,000 and over | 233 (100.0%) | 0 (0.0%) |
Public vs Private Health Insurance Coverage by Age in Princeton
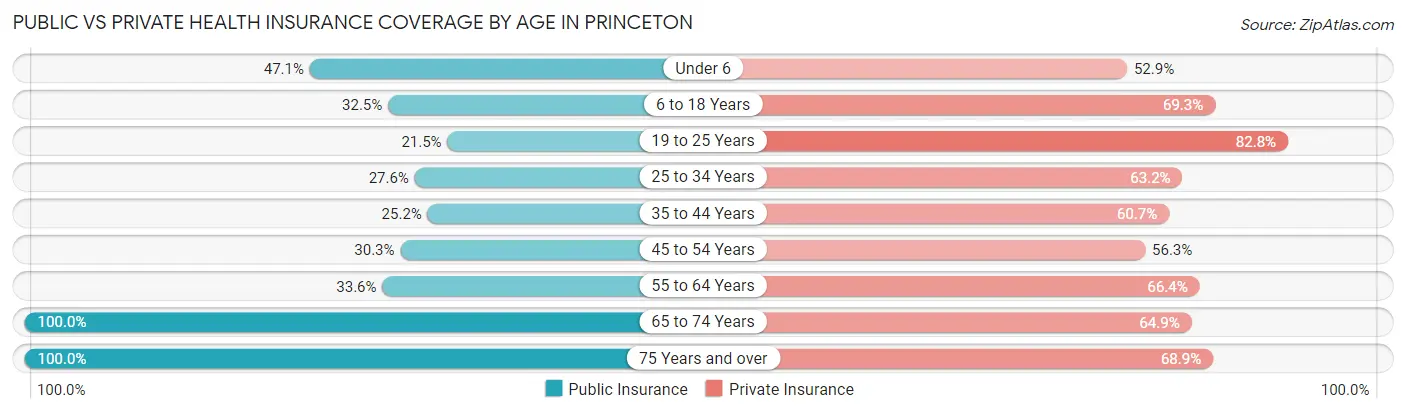
| Age Bracket | Public Insurance | Private Insurance |
| Under 6 | 32 (47.1%) | 36 (52.9%) |
| 6 to 18 Years | 54 (32.5%) | 115 (69.3%) |
| 19 to 25 Years | 20 (21.5%) | 77 (82.8%) |
| 25 to 34 Years | 24 (27.6%) | 55 (63.2%) |
| 35 to 44 Years | 34 (25.2%) | 82 (60.7%) |
| 45 to 54 Years | 36 (30.2%) | 67 (56.3%) |
| 55 to 64 Years | 43 (33.6%) | 85 (66.4%) |
| 65 to 74 Years | 208 (100.0%) | 135 (64.9%) |
| 75 Years and over | 90 (100.0%) | 62 (68.9%) |
| Total | 541 (49.4%) | 714 (65.3%) |
Disability Status by Sex by Age in Princeton
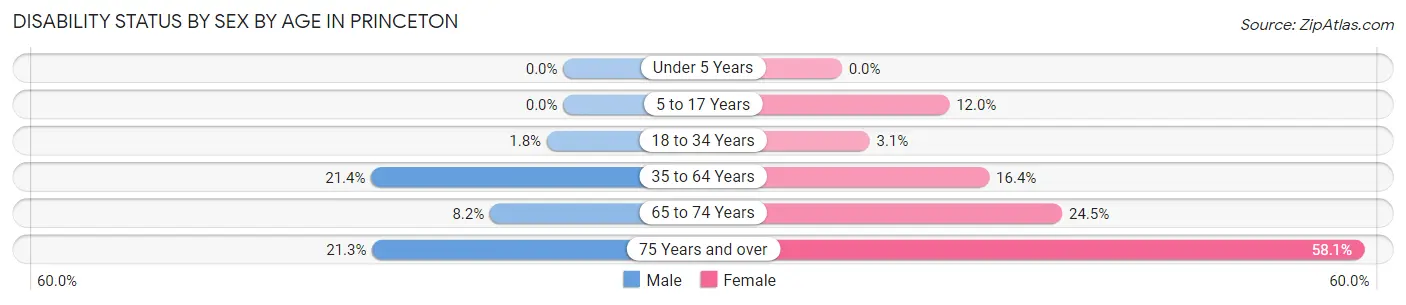
| Age Bracket | Male | Female |
| Under 5 Years | 0 (0.0%) | 0 (0.0%) |
| 5 to 17 Years | 0 (0.0%) | 11 (12.0%) |
| 18 to 34 Years | 2 (1.8%) | 3 (3.1%) |
| 35 to 64 Years | 40 (21.4%) | 32 (16.4%) |
| 65 to 74 Years | 4 (8.2%) | 39 (24.5%) |
| 75 Years and over | 10 (21.3%) | 25 (58.1%) |
Disability Class by Sex by Age in Princeton
Disability Class: Hearing Difficulty
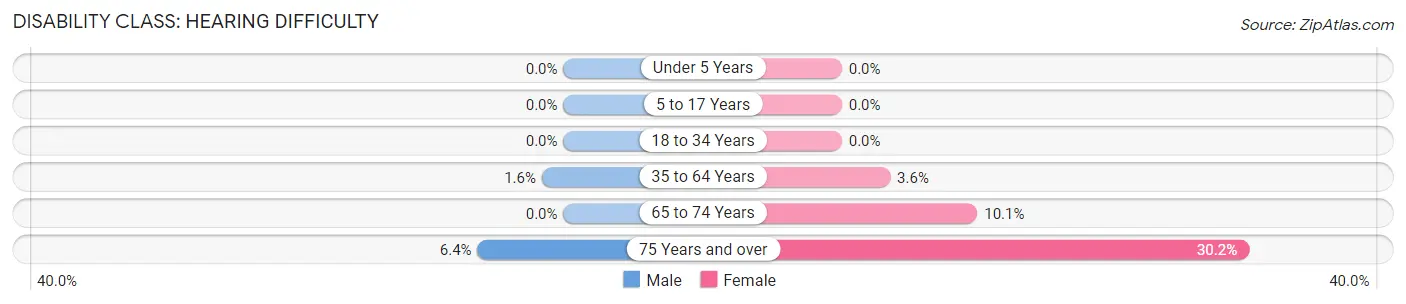
| Age Bracket | Male | Female |
| Under 5 Years | 0 (0.0%) | 0 (0.0%) |
| 5 to 17 Years | 0 (0.0%) | 0 (0.0%) |
| 18 to 34 Years | 0 (0.0%) | 0 (0.0%) |
| 35 to 64 Years | 3 (1.6%) | 7 (3.6%) |
| 65 to 74 Years | 0 (0.0%) | 16 (10.1%) |
| 75 Years and over | 3 (6.4%) | 13 (30.2%) |
Disability Class: Vision Difficulty
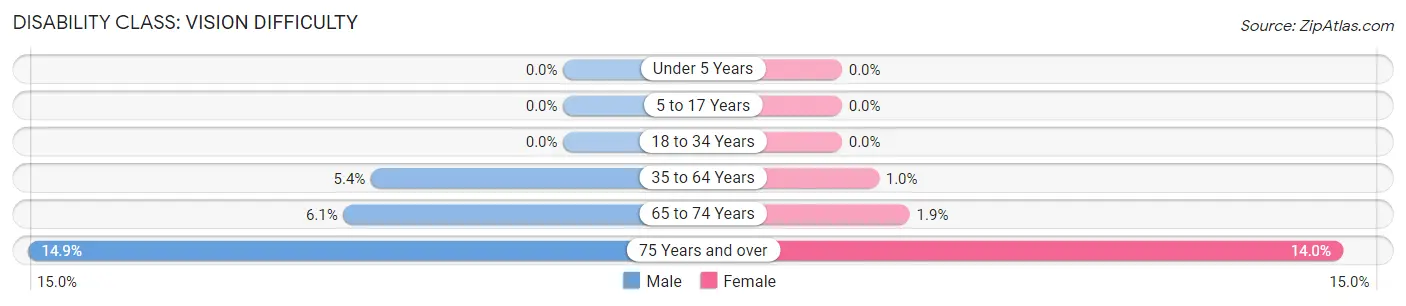
| Age Bracket | Male | Female |
| Under 5 Years | 0 (0.0%) | 0 (0.0%) |
| 5 to 17 Years | 0 (0.0%) | 0 (0.0%) |
| 18 to 34 Years | 0 (0.0%) | 0 (0.0%) |
| 35 to 64 Years | 10 (5.3%) | 2 (1.0%) |
| 65 to 74 Years | 3 (6.1%) | 3 (1.9%) |
| 75 Years and over | 7 (14.9%) | 6 (14.0%) |
Disability Class: Cognitive Difficulty
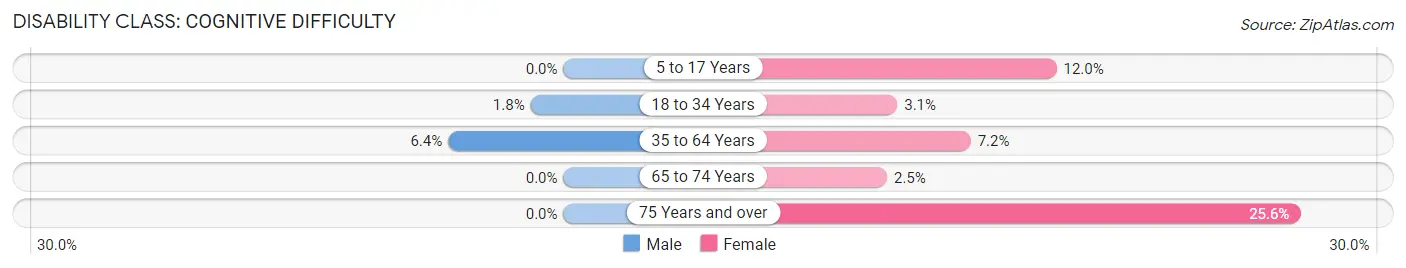
| Age Bracket | Male | Female |
| 5 to 17 Years | 0 (0.0%) | 11 (12.0%) |
| 18 to 34 Years | 2 (1.8%) | 3 (3.1%) |
| 35 to 64 Years | 12 (6.4%) | 14 (7.2%) |
| 65 to 74 Years | 0 (0.0%) | 4 (2.5%) |
| 75 Years and over | 0 (0.0%) | 11 (25.6%) |
Disability Class: Ambulatory Difficulty
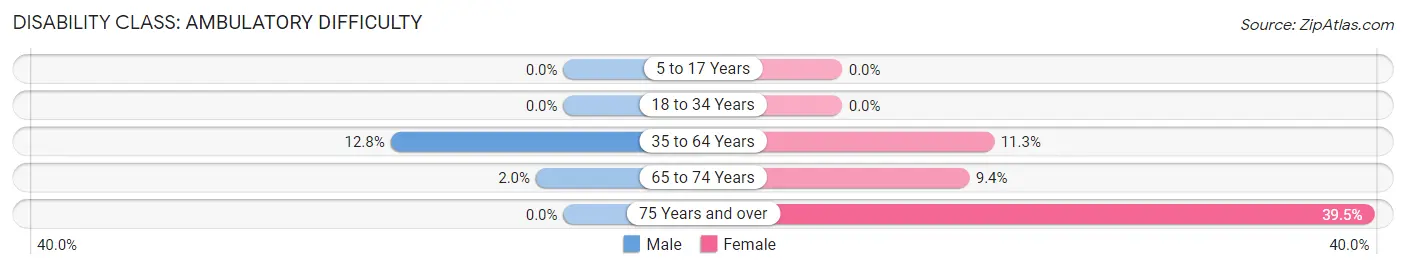
| Age Bracket | Male | Female |
| 5 to 17 Years | 0 (0.0%) | 0 (0.0%) |
| 18 to 34 Years | 0 (0.0%) | 0 (0.0%) |
| 35 to 64 Years | 24 (12.8%) | 22 (11.3%) |
| 65 to 74 Years | 1 (2.0%) | 15 (9.4%) |
| 75 Years and over | 0 (0.0%) | 17 (39.5%) |
Disability Class: Self-Care Difficulty
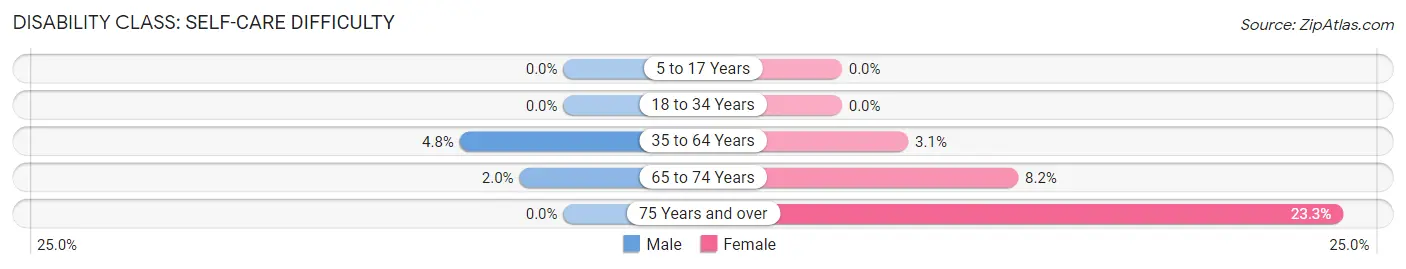
| Age Bracket | Male | Female |
| 5 to 17 Years | 0 (0.0%) | 0 (0.0%) |
| 18 to 34 Years | 0 (0.0%) | 0 (0.0%) |
| 35 to 64 Years | 9 (4.8%) | 6 (3.1%) |
| 65 to 74 Years | 1 (2.0%) | 13 (8.2%) |
| 75 Years and over | 0 (0.0%) | 10 (23.3%) |
Technology Access in Princeton
Computing Device Access in Princeton
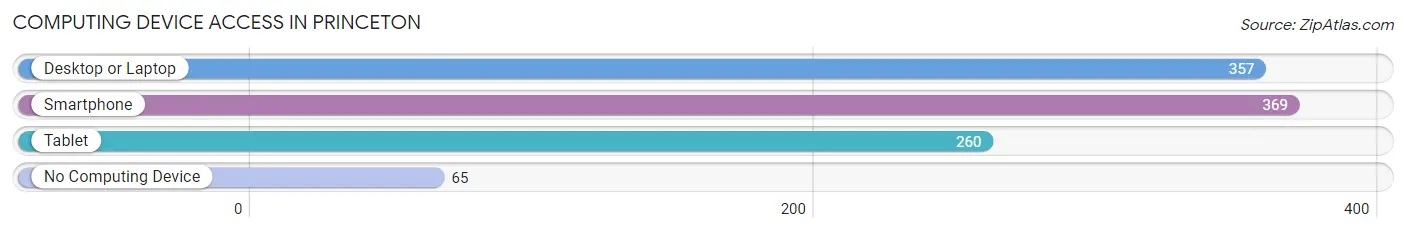
| Device Type | # Households | % Households |
| Desktop or Laptop | 357 | 74.2% |
| Smartphone | 369 | 76.7% |
| Tablet | 260 | 54.0% |
| No Computing Device | 65 | 13.5% |
| Total | 481 | 100.0% |
Internet Access in Princeton
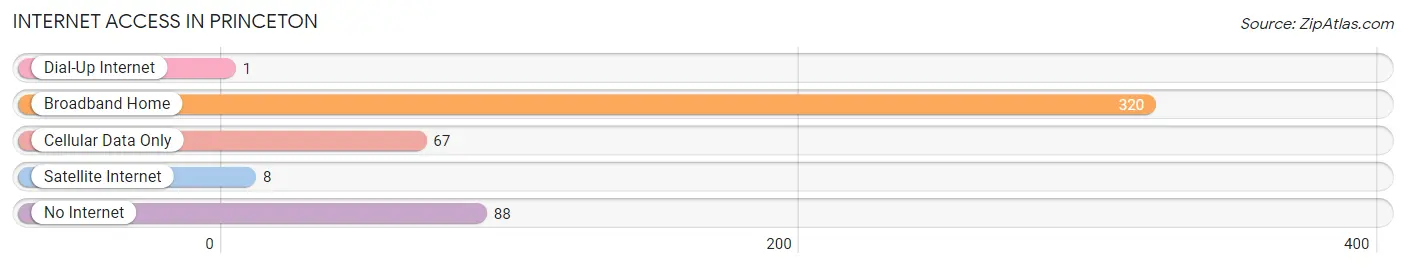
| Internet Type | # Households | % Households |
| Dial-Up Internet | 1 | 0.2% |
| Broadband Home | 320 | 66.5% |
| Cellular Data Only | 67 | 13.9% |
| Satellite Internet | 8 | 1.7% |
| No Internet | 88 | 18.3% |
| Total | 481 | 100.0% |
Princeton Summary
Princeton, Wisconsin is a small town located in Green Lake County, Wisconsin. It is situated on the banks of the Fox River and is home to a population of just over 1,000 people. The town was founded in 1848 and has a rich history of industry, agriculture, and recreation.
Geography
Princeton is located in the Fox River Valley, which is part of the Central Plain region of Wisconsin. The town is situated on the banks of the Fox River, which is a tributary of the Wisconsin River. The Fox River is a popular destination for recreational activities such as fishing, canoeing, and kayaking. The town is also located near the Horicon Marsh, which is a National Wildlife Refuge and a popular destination for bird watching.
The town is located in the Central Plain region of Wisconsin, which is characterized by rolling hills and flat plains. The area is known for its fertile soil and is home to many farms and agricultural businesses. The town is also located near the Horicon Marsh, which is a National Wildlife Refuge and a popular destination for bird watching.
Economy
Princeton’s economy is largely based on agriculture and tourism. The town is home to several farms, which produce a variety of crops such as corn, soybeans, and wheat. The town is also home to several businesses that cater to tourists, such as restaurants, hotels, and shops.
The town is also home to several manufacturing businesses, such as a paper mill and a furniture factory. These businesses provide jobs for many of the town’s residents.
Demographics
As of the 2010 census, the population of Princeton was 1,039. The town is predominantly white, with 94.3% of the population identifying as white. The town also has a small Hispanic population, with 4.2% of the population identifying as Hispanic or Latino.
The median household income in Princeton is $45,938, which is slightly lower than the national median of $50,046. The median age in Princeton is 43.7, which is slightly higher than the national median of 37.4.
Conclusion
Princeton, Wisconsin is a small town located in Green Lake County, Wisconsin. It is situated on the banks of the Fox River and is home to a population of just over 1,000 people. The town was founded in 1848 and has a rich history of industry, agriculture, and recreation. The town’s economy is largely based on agriculture and tourism, and the town is home to several manufacturing businesses. The population of Princeton is predominantly white, with a small Hispanic population. The median household income in Princeton is slightly lower than the national median, and the median age is slightly higher than the national median.
Common Questions
What is the Total Population of Princeton?
Total Population of Princeton is 1,106.
What is the Total Male Population of Princeton?
Total Male Population of Princeton is 471.
What is the Total Female Population of Princeton?
Total Female Population of Princeton is 635.
What is the Ratio of Males per 100 Females in Princeton?
There are 74.17 Males per 100 Females in Princeton.
What is the Ratio of Females per 100 Males in Princeton?
There are 134.82 Females per 100 Males in Princeton.
What is the Median Population Age in Princeton?
Median Population Age in Princeton is 45.8 Years.
What is the Average Family Size in Princeton
Average Family Size in Princeton is 3.1 People.
What is the Average Household Size in Princeton
Average Household Size in Princeton is 2.2 People.
What is Per Capita Income in Princeton?
Per Capita income in Princeton is $29,355.
What is the Median Family Income in Princeton?
Median Family Income in Princeton is $67,105.
What is the Median Household income in Princeton?
Median Household Income in Princeton is $59,904.
What is Income or Wage Gap in Princeton?
Income or Wage Gap in Princeton is 23.5%.
Women in Princeton earn 76.5 cents for every dollar earned by a man.
What is Inequality or Gini Index in Princeton?
Inequality or Gini Index in Princeton is 0.34.
How Large is the Labor Force in Princeton?
There are 638 People in the Labor Forcein in Princeton.
What is the Percentage of People in the Labor Force in Princeton?
67.9% of People are in the Labor Force in Princeton.
What is the Unemployment Rate in Princeton?
Unemployment Rate in Princeton is 10.0%.