Port Edwards, WI Map & Demographics
Port Edwards Map
Port Edwards Overview
$30,963
PER CAPITA INCOME
$80,625
AVG FAMILY INCOME
$70,347
AVG HOUSEHOLD INCOME
43.9%
WAGE / INCOME GAP [ % ]
56.1¢/ $1
WAGE / INCOME GAP [ $ ]
0.39
INEQUALITY / GINI INDEX
1,818
TOTAL POPULATION
878
MALE POPULATION
940
FEMALE POPULATION
93.40
MALES / 100 FEMALES
107.06
FEMALES / 100 MALES
40.5
MEDIAN AGE
2.8
AVG FAMILY SIZE
2.5
AVG HOUSEHOLD SIZE
745
LABOR FORCE [ PEOPLE ]
53.2%
PERCENT IN LABOR FORCE
2.8%
UNEMPLOYMENT RATE
Port Edwards Zip Codes
Port Edwards Area Codes
Income in Port Edwards
Income Overview in Port Edwards
Per Capita Income in Port Edwards is $30,963, while median incomes of families and households are $80,625 and $70,347 respectively.
| Characteristic | Number | Measure |
| Per Capita Income | 1,818 | $30,963 |
| Median Family Income | 524 | $80,625 |
| Mean Family Income | 524 | $86,980 |
| Median Household Income | 711 | $70,347 |
| Mean Household Income | 711 | $79,447 |
| Income Deficit | 524 | $0 |
| Wage / Income Gap (%) | 1,818 | 43.86% |
| Wage / Income Gap ($) | 1,818 | 56.14¢ per $1 |
| Gini / Inequality Index | 1,818 | 0.39 |
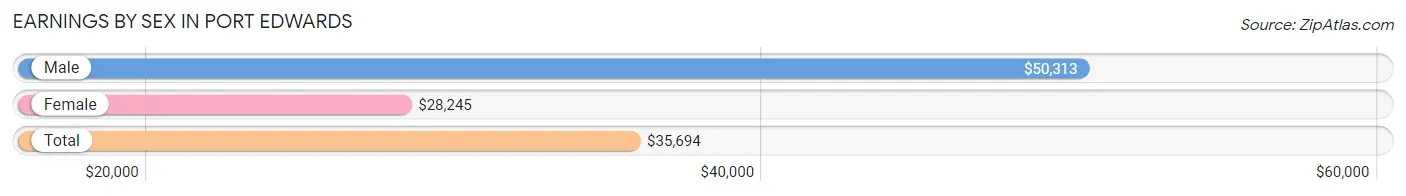
Earnings by Sex in Port Edwards
Average Earnings in Port Edwards are $35,694, $50,313 for men and $28,245 for women, a difference of 43.9%.
| Sex | Number | Average Earnings |
| Male | 443 (52.2%) | $50,313 |
| Female | 406 (47.8%) | $28,245 |
| Total | 849 (100.0%) | $35,694 |
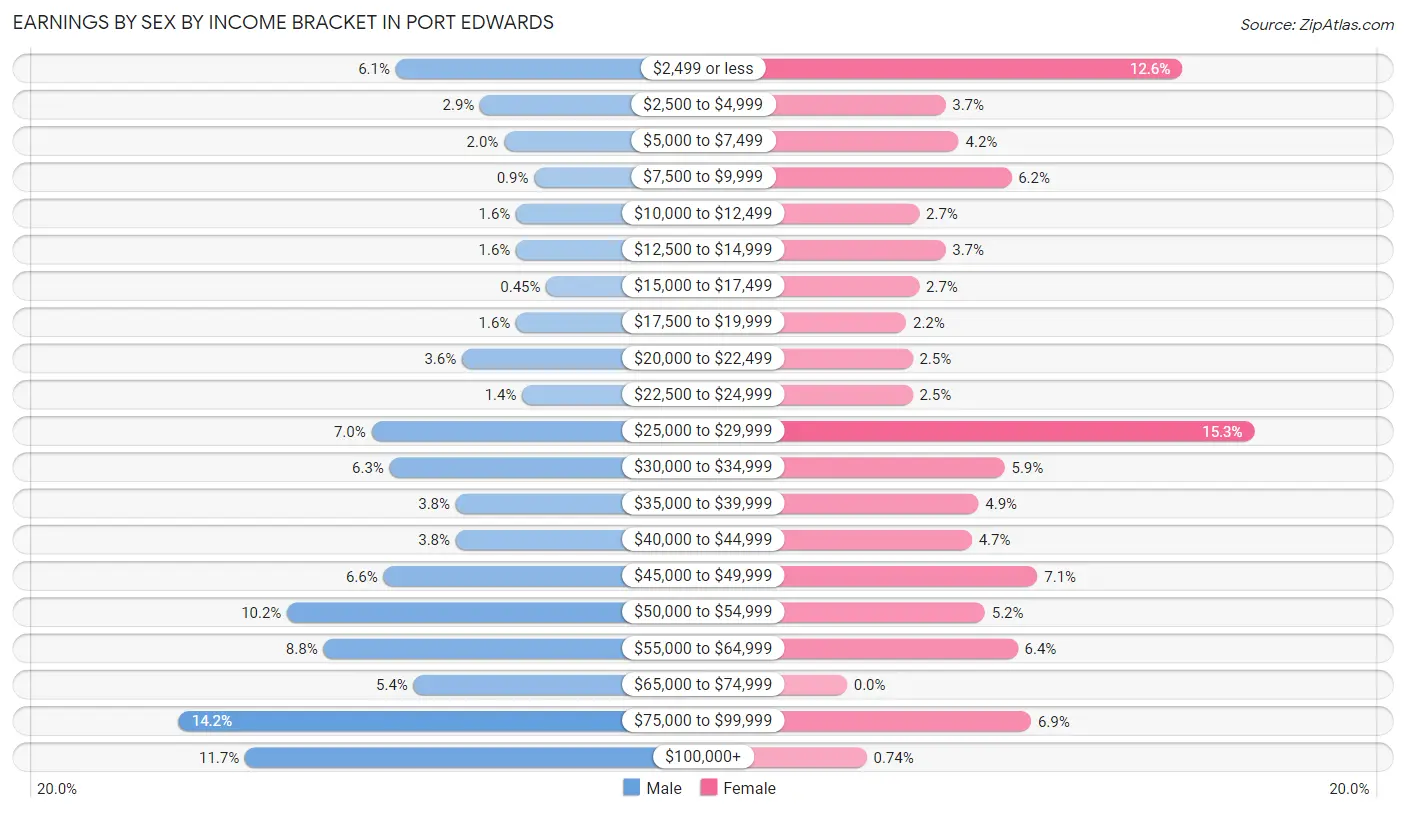
Earnings by Sex by Income Bracket in Port Edwards
The most common earnings brackets in Port Edwards are $75,000 to $99,999 for men (63 | 14.2%) and $25,000 to $29,999 for women (62 | 15.3%).
| Income | Male | Female |
| $2,499 or less | 27 (6.1%) | 51 (12.6%) |
| $2,500 to $4,999 | 13 (2.9%) | 15 (3.7%) |
| $5,000 to $7,499 | 9 (2.0%) | 17 (4.2%) |
| $7,500 to $9,999 | 4 (0.9%) | 25 (6.2%) |
| $10,000 to $12,499 | 7 (1.6%) | 11 (2.7%) |
| $12,500 to $14,999 | 7 (1.6%) | 15 (3.7%) |
| $15,000 to $17,499 | 2 (0.4%) | 11 (2.7%) |
| $17,500 to $19,999 | 7 (1.6%) | 9 (2.2%) |
| $20,000 to $22,499 | 16 (3.6%) | 10 (2.5%) |
| $22,500 to $24,999 | 6 (1.3%) | 10 (2.5%) |
| $25,000 to $29,999 | 31 (7.0%) | 62 (15.3%) |
| $30,000 to $34,999 | 28 (6.3%) | 24 (5.9%) |
| $35,000 to $39,999 | 17 (3.8%) | 20 (4.9%) |
| $40,000 to $44,999 | 17 (3.8%) | 19 (4.7%) |
| $45,000 to $49,999 | 29 (6.6%) | 29 (7.1%) |
| $50,000 to $54,999 | 45 (10.2%) | 21 (5.2%) |
| $55,000 to $64,999 | 39 (8.8%) | 26 (6.4%) |
| $65,000 to $74,999 | 24 (5.4%) | 0 (0.0%) |
| $75,000 to $99,999 | 63 (14.2%) | 28 (6.9%) |
| $100,000+ | 52 (11.7%) | 3 (0.7%) |
| Total | 443 (100.0%) | 406 (100.0%) |
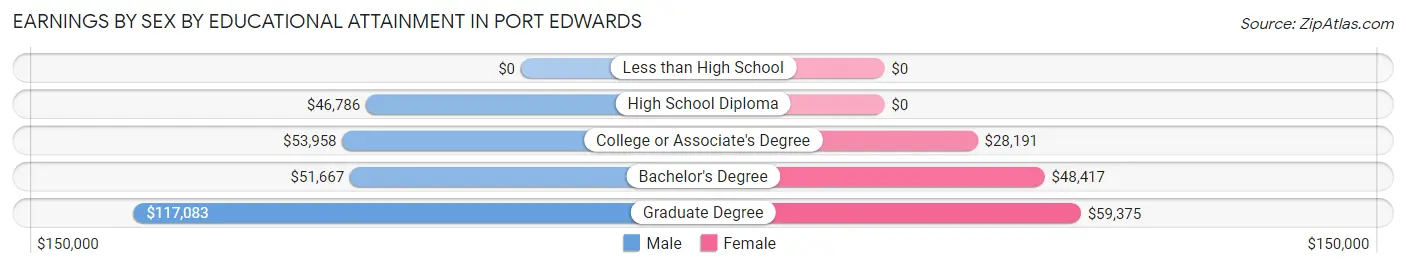
Earnings by Sex by Educational Attainment in Port Edwards
Average earnings in Port Edwards are $53,500 for men and $29,122 for women, a difference of 45.6%. Men with an educational attainment of graduate degree enjoy the highest average annual earnings of $117,083, while those with high school diploma education earn the least with $46,786. Women with an educational attainment of graduate degree earn the most with the average annual earnings of $59,375, while those with college or associate's degree education have the smallest earnings of $28,191.
| Educational Attainment | Male Income | Female Income |
| Less than High School | - | - |
| High School Diploma | $46,786 | $0 |
| College or Associate's Degree | $53,958 | $28,191 |
| Bachelor's Degree | $51,667 | $48,417 |
| Graduate Degree | $117,083 | $59,375 |
| Total | $53,500 | $29,122 |
Family Income in Port Edwards
Family Income Brackets in Port Edwards
According to the Port Edwards family income data, there are 125 families falling into the $100,000 to $149,999 income range, which is the most common income bracket and makes up 23.8% of all families. Conversely, the $10,000 to $14,999 income bracket is the least frequent group with only 11 families (2.1%) belonging to this category.
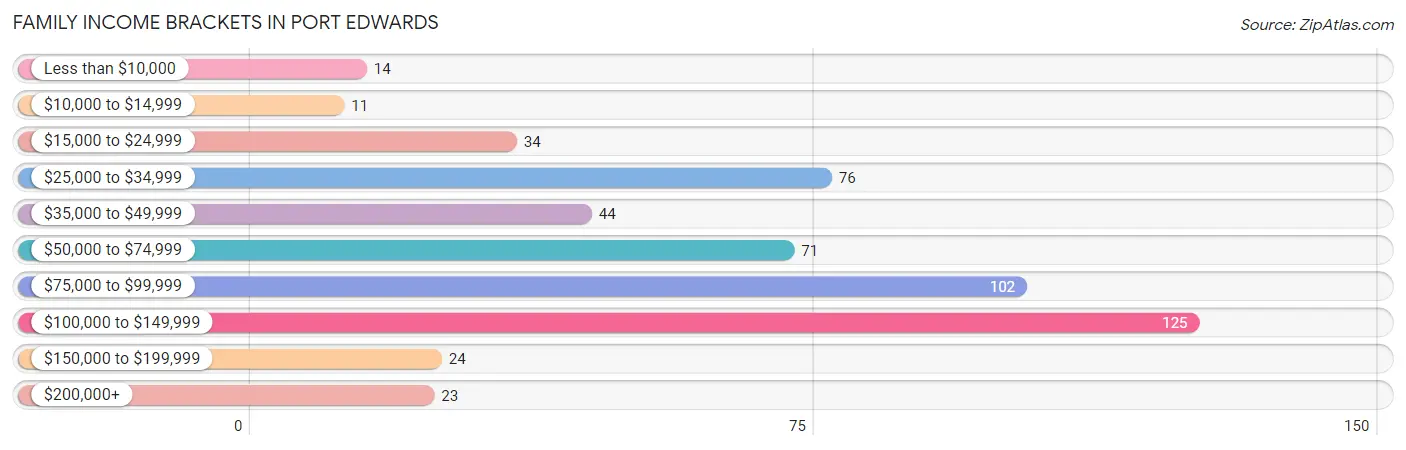
| Income Bracket | # Families | % Families |
| Less than $10,000 | 14 | 2.7% |
| $10,000 to $14,999 | 11 | 2.1% |
| $15,000 to $24,999 | 34 | 6.5% |
| $25,000 to $34,999 | 76 | 14.5% |
| $35,000 to $49,999 | 44 | 8.4% |
| $50,000 to $74,999 | 71 | 13.5% |
| $75,000 to $99,999 | 102 | 19.5% |
| $100,000 to $149,999 | 125 | 23.9% |
| $150,000 to $199,999 | 24 | 4.6% |
| $200,000+ | 23 | 4.4% |
Family Income by Famaliy Size in Port Edwards
5-person families (37 | 7.1%) account for the highest median family income in Port Edwards with $135,139 per family, while 2-person families (243 | 46.4%) have the highest median income of $43,024 per family member.
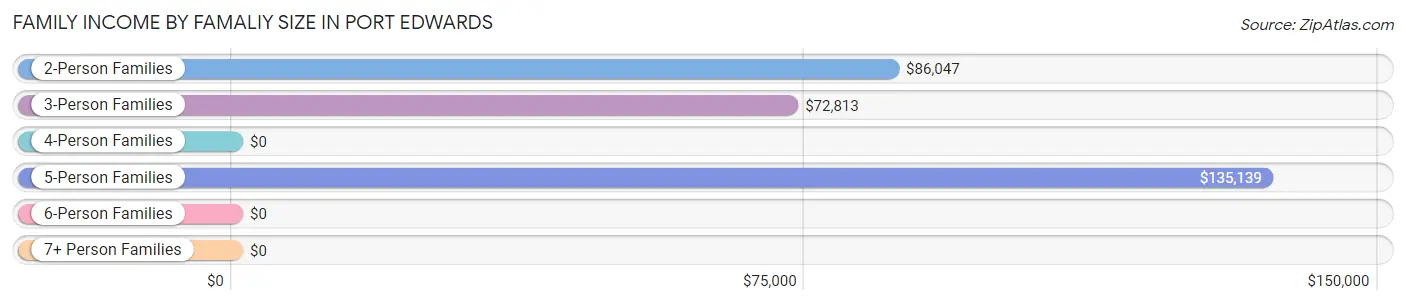
| Income Bracket | # Families | Median Income |
| 2-Person Families | 243 (46.4%) | $86,047 |
| 3-Person Families | 123 (23.5%) | $72,813 |
| 4-Person Families | 115 (22.0%) | $0 |
| 5-Person Families | 37 (7.1%) | $135,139 |
| 6-Person Families | 3 (0.6%) | $0 |
| 7+ Person Families | 3 (0.6%) | $0 |
| Total | 524 (100.0%) | $80,625 |
Family Income by Number of Earners in Port Edwards
The median family income in Port Edwards is $80,625, with families comprising 3+ earners (46) having the highest median family income of $123,167, while families with 1 earner (133) have the lowest median family income of $46,125, accounting for 8.8% and 25.4% of families, respectively.
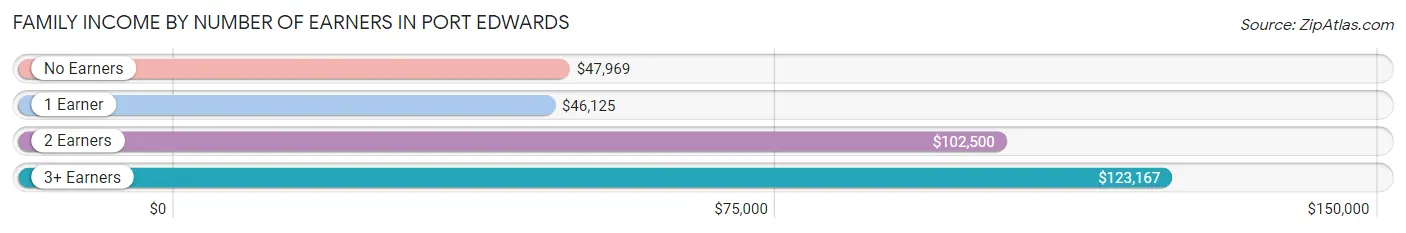
| Number of Earners | # Families | Median Income |
| No Earners | 155 (29.6%) | $47,969 |
| 1 Earner | 133 (25.4%) | $46,125 |
| 2 Earners | 190 (36.3%) | $102,500 |
| 3+ Earners | 46 (8.8%) | $123,167 |
| Total | 524 (100.0%) | $80,625 |
Household Income in Port Edwards
Household Income Brackets in Port Edwards
With 137 households falling in the category, the $100,000 to $149,999 income range is the most frequent in Port Edwards, accounting for 19.3% of all households. In contrast, only 17 households (2.4%) fall into the less than $10,000 income bracket, making it the least populous group.
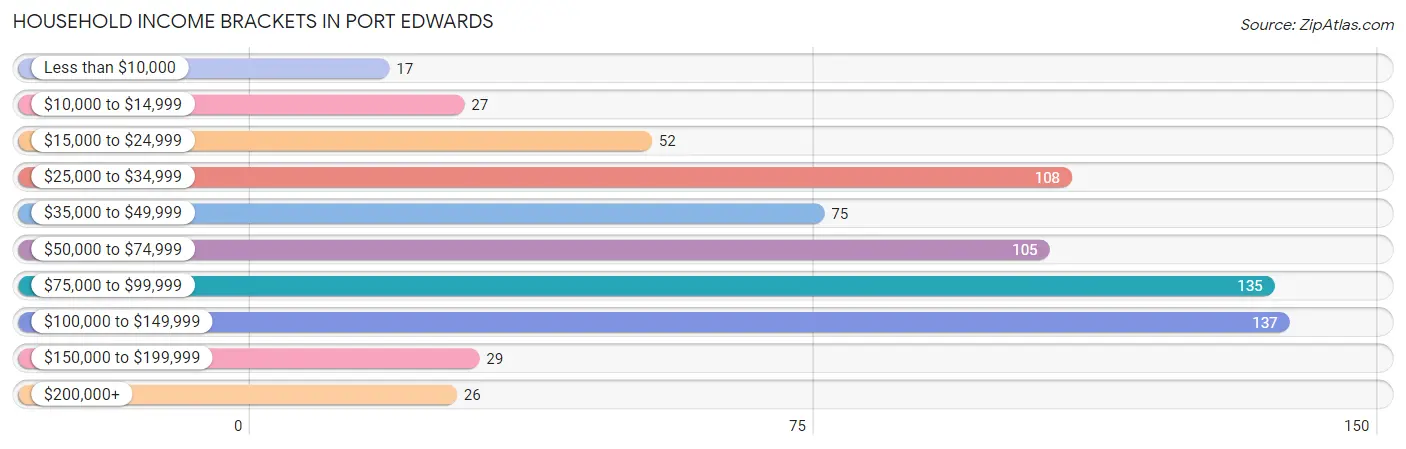
| Income Bracket | # Households | % Households |
| Less than $10,000 | 17 | 2.4% |
| $10,000 to $14,999 | 27 | 3.8% |
| $15,000 to $24,999 | 52 | 7.3% |
| $25,000 to $34,999 | 108 | 15.2% |
| $35,000 to $49,999 | 75 | 10.5% |
| $50,000 to $74,999 | 105 | 14.8% |
| $75,000 to $99,999 | 135 | 19.0% |
| $100,000 to $149,999 | 137 | 19.3% |
| $150,000 to $199,999 | 29 | 4.1% |
| $200,000+ | 26 | 3.7% |
Household Income by Householder Age in Port Edwards
The median household income in Port Edwards is $70,347, with the highest median household income of $77,500 found in the 45 to 64 years age bracket for the primary householder. A total of 218 households (30.7%) fall into this category. Meanwhile, the 15 to 24 years age bracket for the primary householder has the lowest median household income of $0, with 37 households (5.2%) in this group.
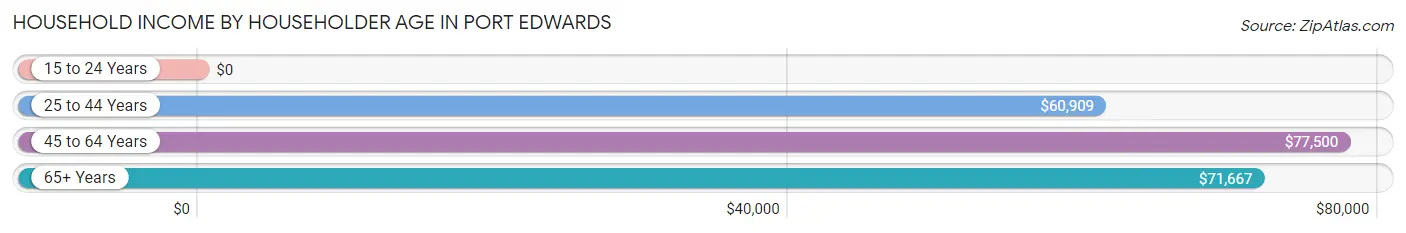
| Income Bracket | # Households | Median Income |
| 15 to 24 Years | 37 (5.2%) | $0 |
| 25 to 44 Years | 222 (31.2%) | $60,909 |
| 45 to 64 Years | 218 (30.7%) | $77,500 |
| 65+ Years | 234 (32.9%) | $71,667 |
| Total | 711 (100.0%) | $70,347 |
Poverty in Port Edwards
Income Below Poverty by Sex and Age in Port Edwards
With 9.9% poverty level for males and 17.1% for females among the residents of Port Edwards, 16 and 17 year old males and 6 to 11 year old females are the most vulnerable to poverty, with 18 males (81.8%) and 49 females (46.2%) in their respective age groups living below the poverty level.
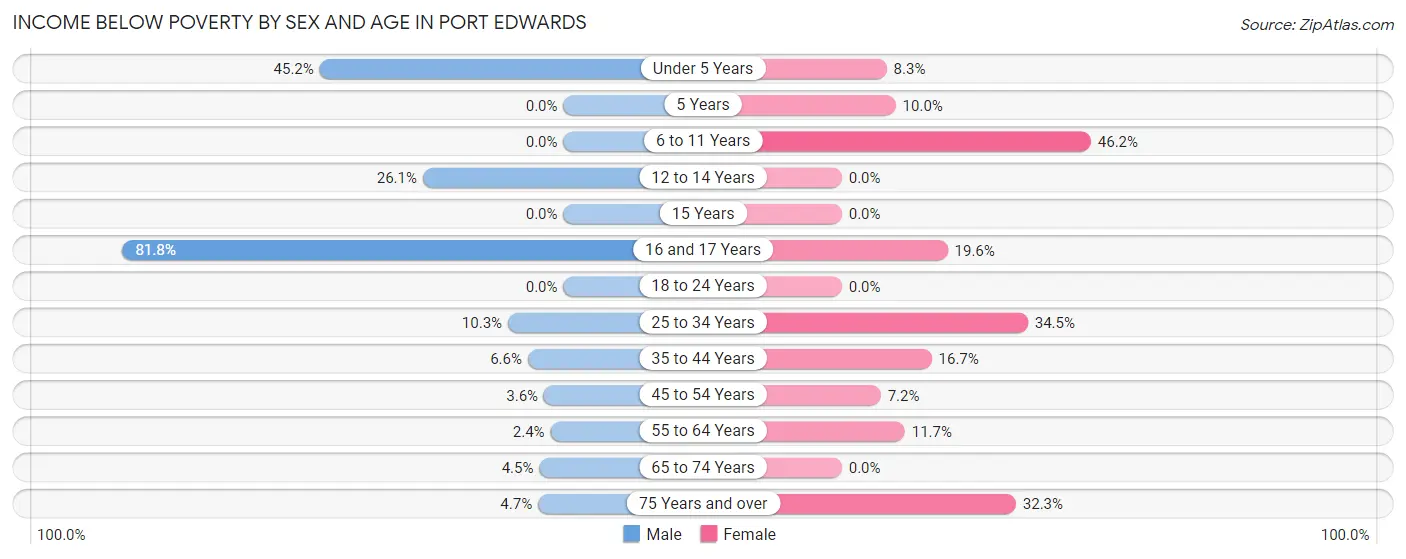
| Age Bracket | Male | Female |
| Under 5 Years | 19 (45.2%) | 4 (8.3%) |
| 5 Years | 0 (0.0%) | 1 (10.0%) |
| 6 to 11 Years | 0 (0.0%) | 49 (46.2%) |
| 12 to 14 Years | 18 (26.1%) | 0 (0.0%) |
| 15 Years | 0 (0.0%) | 0 (0.0%) |
| 16 and 17 Years | 18 (81.8%) | 11 (19.6%) |
| 18 to 24 Years | 0 (0.0%) | 0 (0.0%) |
| 25 to 34 Years | 7 (10.3%) | 29 (34.5%) |
| 35 to 44 Years | 7 (6.6%) | 18 (16.7%) |
| 45 to 54 Years | 3 (3.6%) | 6 (7.2%) |
| 55 to 64 Years | 3 (2.4%) | 11 (11.7%) |
| 65 to 74 Years | 5 (4.5%) | 0 (0.0%) |
| 75 Years and over | 4 (4.7%) | 21 (32.3%) |
| Total | 84 (9.9%) | 150 (17.1%) |
Income Above Poverty by Sex and Age in Port Edwards
According to the poverty statistics in Port Edwards, males aged 5 years and females aged 12 to 14 years are the age groups that are most secure financially, with 100.0% of males and 100.0% of females in these age groups living above the poverty line.
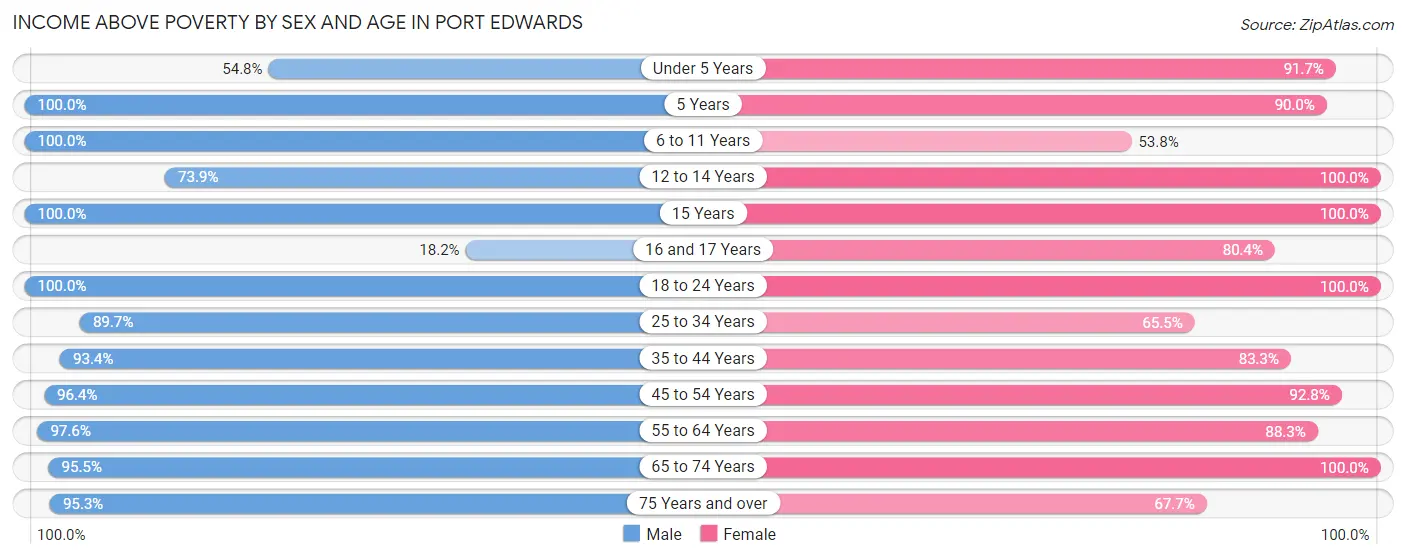
| Age Bracket | Male | Female |
| Under 5 Years | 23 (54.8%) | 44 (91.7%) |
| 5 Years | 3 (100.0%) | 9 (90.0%) |
| 6 to 11 Years | 44 (100.0%) | 57 (53.8%) |
| 12 to 14 Years | 51 (73.9%) | 43 (100.0%) |
| 15 Years | 19 (100.0%) | 3 (100.0%) |
| 16 and 17 Years | 4 (18.2%) | 45 (80.4%) |
| 18 to 24 Years | 68 (100.0%) | 72 (100.0%) |
| 25 to 34 Years | 61 (89.7%) | 55 (65.5%) |
| 35 to 44 Years | 99 (93.4%) | 90 (83.3%) |
| 45 to 54 Years | 80 (96.4%) | 77 (92.8%) |
| 55 to 64 Years | 122 (97.6%) | 83 (88.3%) |
| 65 to 74 Years | 107 (95.5%) | 108 (100.0%) |
| 75 Years and over | 81 (95.3%) | 44 (67.7%) |
| Total | 762 (90.1%) | 730 (83.0%) |
Income Below Poverty Among Married-Couple Families in Port Edwards
The poverty statistics for married-couple families in Port Edwards show that 1.8% or 7 of the total 390 families live below the poverty line. Families with 3 or 4 children have the highest poverty rate of 12.5%, comprising of 3 families. On the other hand, families with 1 or 2 children have the lowest poverty rate of 0.0%, which includes 0 families.
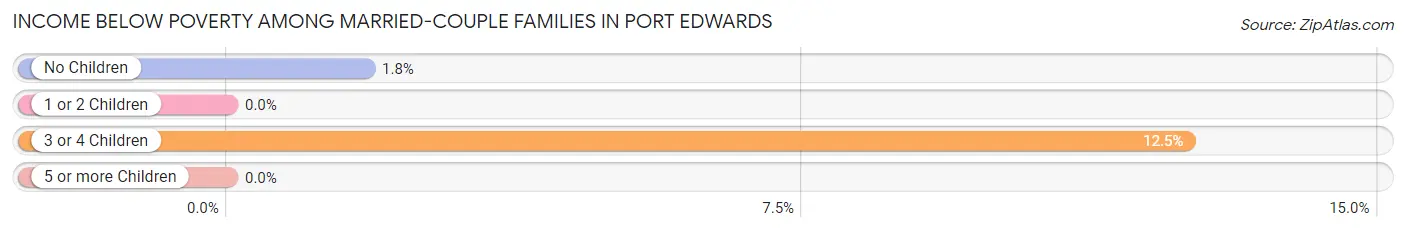
| Children | Above Poverty | Below Poverty |
| No Children | 219 (98.2%) | 4 (1.8%) |
| 1 or 2 Children | 140 (100.0%) | 0 (0.0%) |
| 3 or 4 Children | 21 (87.5%) | 3 (12.5%) |
| 5 or more Children | 3 (100.0%) | 0 (0.0%) |
| Total | 383 (98.2%) | 7 (1.8%) |
Income Below Poverty Among Single-Parent Households in Port Edwards
According to the poverty data in Port Edwards, 16.7% or 7 single-father households and 40.2% or 37 single-mother households are living below the poverty line. Among single-father households, those with 3 or 4 children have the highest poverty rate, with 7 households (100.0%) experiencing poverty. Likewise, among single-mother households, those with 3 or 4 children have the highest poverty rate, with 10 households (100.0%) falling below the poverty line.
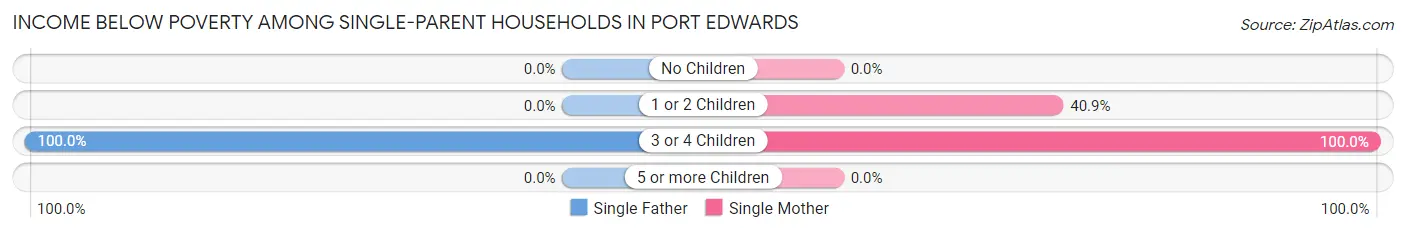
| Children | Single Father | Single Mother |
| No Children | 0 (0.0%) | 0 (0.0%) |
| 1 or 2 Children | 0 (0.0%) | 27 (40.9%) |
| 3 or 4 Children | 7 (100.0%) | 10 (100.0%) |
| 5 or more Children | 0 (0.0%) | 0 (0.0%) |
| Total | 7 (16.7%) | 37 (40.2%) |
Income Below Poverty Among Married-Couple vs Single-Parent Households in Port Edwards
The poverty data for Port Edwards shows that 7 of the married-couple family households (1.8%) and 44 of the single-parent households (32.8%) are living below the poverty level. Within the married-couple family households, those with 3 or 4 children have the highest poverty rate, with 3 households (12.5%) falling below the poverty line. Among the single-parent households, those with 3 or 4 children have the highest poverty rate, with 17 household (100.0%) living below poverty.
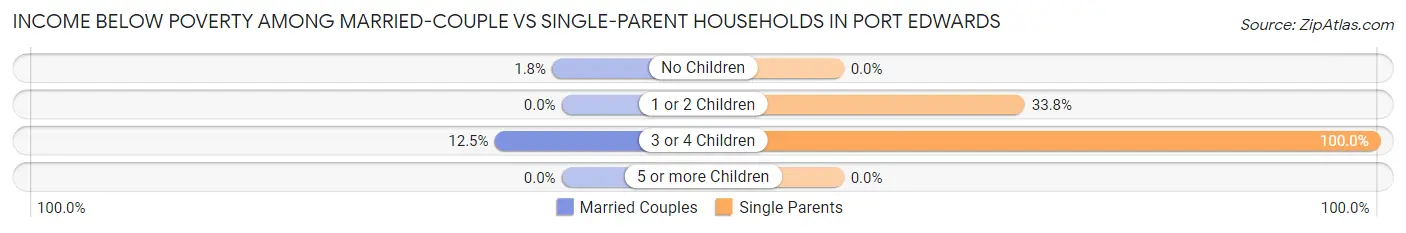
| Children | Married-Couple Families | Single-Parent Households |
| No Children | 4 (1.8%) | 0 (0.0%) |
| 1 or 2 Children | 0 (0.0%) | 27 (33.8%) |
| 3 or 4 Children | 3 (12.5%) | 17 (100.0%) |
| 5 or more Children | 0 (0.0%) | 0 (0.0%) |
| Total | 7 (1.8%) | 44 (32.8%) |
Race in Port Edwards
The most populous races in Port Edwards are White / Caucasian (1,617 | 88.9%), Two or more Races (173 | 9.5%), and Hispanic or Latino (23 | 1.3%).
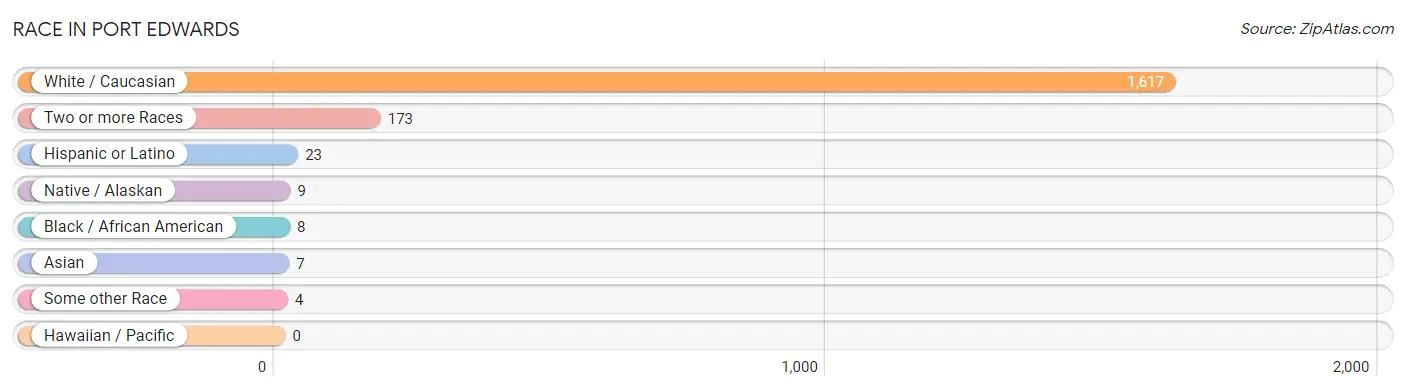
| Race | # Population | % Population |
| Asian | 7 | 0.4% |
| Black / African American | 8 | 0.4% |
| Hawaiian / Pacific | 0 | 0.0% |
| Hispanic or Latino | 23 | 1.3% |
| Native / Alaskan | 9 | 0.5% |
| White / Caucasian | 1,617 | 88.9% |
| Two or more Races | 173 | 9.5% |
| Some other Race | 4 | 0.2% |
| Total | 1,818 | 100.0% |
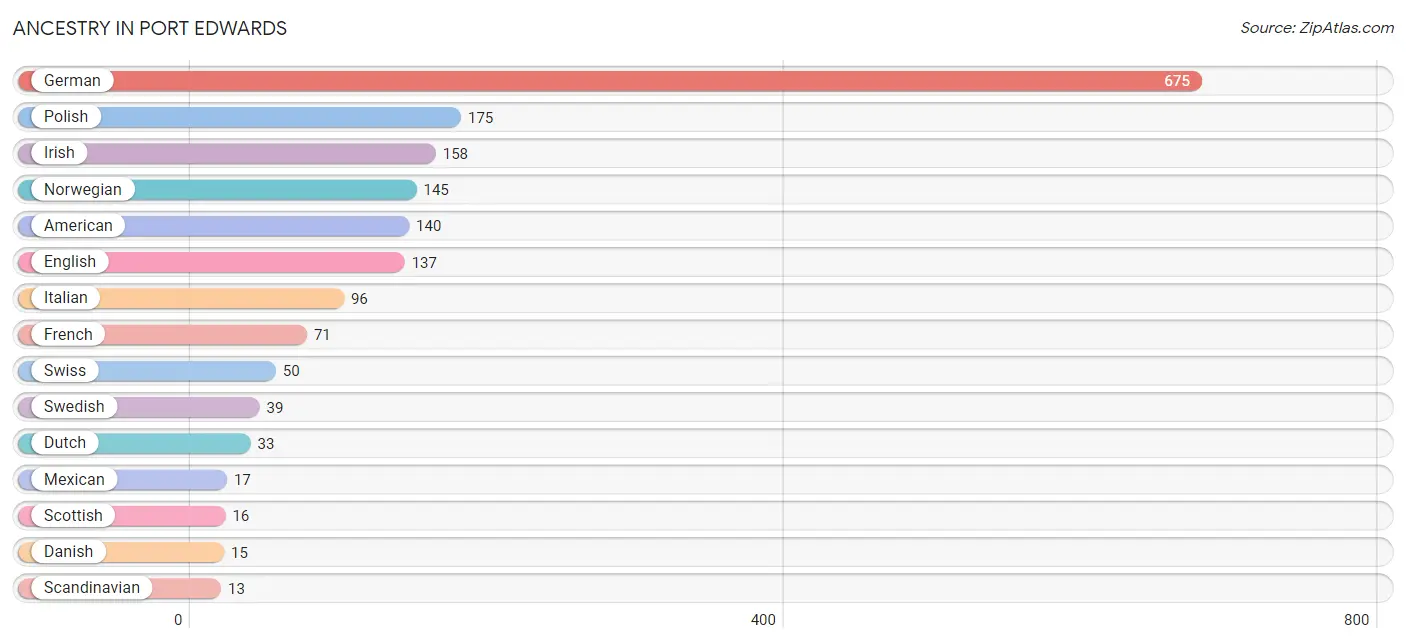
Ancestry in Port Edwards
The most populous ancestries reported in Port Edwards are German (675 | 37.1%), Polish (175 | 9.6%), Irish (158 | 8.7%), Norwegian (145 | 8.0%), and American (140 | 7.7%), together accounting for 71.1% of all Port Edwards residents.
| Ancestry | # Population | % Population |
| American | 140 | 7.7% |
| Arab | 6 | 0.3% |
| Belgian | 3 | 0.2% |
| British | 6 | 0.3% |
| Chippewa | 2 | 0.1% |
| Czech | 6 | 0.3% |
| Czechoslovakian | 3 | 0.2% |
| Danish | 15 | 0.8% |
| Dutch | 33 | 1.8% |
| Eastern European | 7 | 0.4% |
| English | 137 | 7.5% |
| European | 9 | 0.5% |
| French | 71 | 3.9% |
| French Canadian | 9 | 0.5% |
| German | 675 | 37.1% |
| Greek | 9 | 0.5% |
| Guamanian / Chamorro | 2 | 0.1% |
| Indian (Asian) | 5 | 0.3% |
| Irish | 158 | 8.7% |
| Italian | 96 | 5.3% |
| Korean | 4 | 0.2% |
| Latvian | 3 | 0.2% |
| Menominee | 9 | 0.5% |
| Mexican | 17 | 0.9% |
| Norwegian | 145 | 8.0% |
| Pakistani | 3 | 0.2% |
| Pennsylvania German | 3 | 0.2% |
| Polish | 175 | 9.6% |
| Puerto Rican | 6 | 0.3% |
| Romanian | 3 | 0.2% |
| Russian | 6 | 0.3% |
| Scandinavian | 13 | 0.7% |
| Scotch-Irish | 2 | 0.1% |
| Scottish | 16 | 0.9% |
| Swedish | 39 | 2.1% |
| Swiss | 50 | 2.8% |
| Syrian | 6 | 0.3% |
| Welsh | 6 | 0.3% | View All 38 Rows |
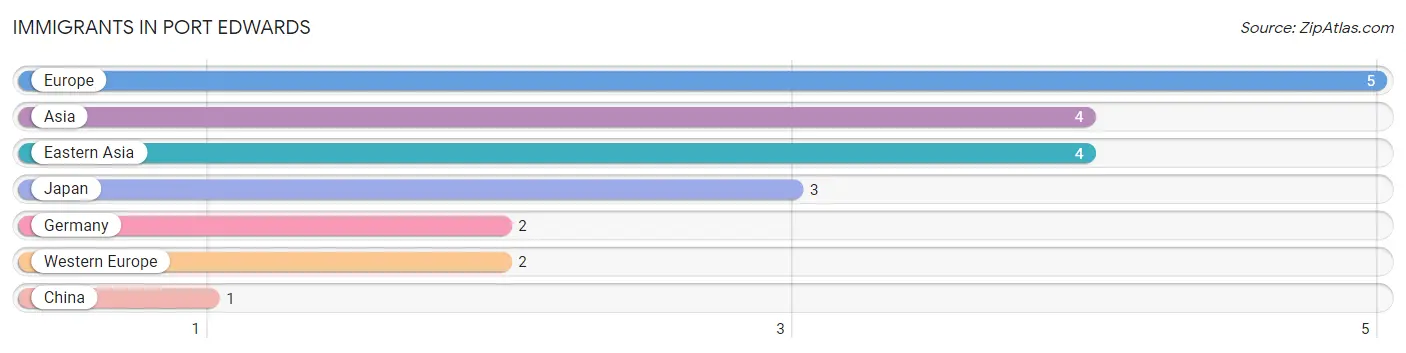
Immigrants in Port Edwards
The most numerous immigrant groups reported in Port Edwards came from Europe (5 | 0.3%), Asia (4 | 0.2%), Eastern Asia (4 | 0.2%), Japan (3 | 0.2%), and Germany (2 | 0.1%), together accounting for 1.0% of all Port Edwards residents.
| Immigration Origin | # Population | % Population |
| Asia | 4 | 0.2% |
| China | 1 | 0.1% |
| Eastern Asia | 4 | 0.2% |
| Europe | 5 | 0.3% |
| Germany | 2 | 0.1% |
| Japan | 3 | 0.2% |
| Western Europe | 2 | 0.1% | View All 7 Rows |
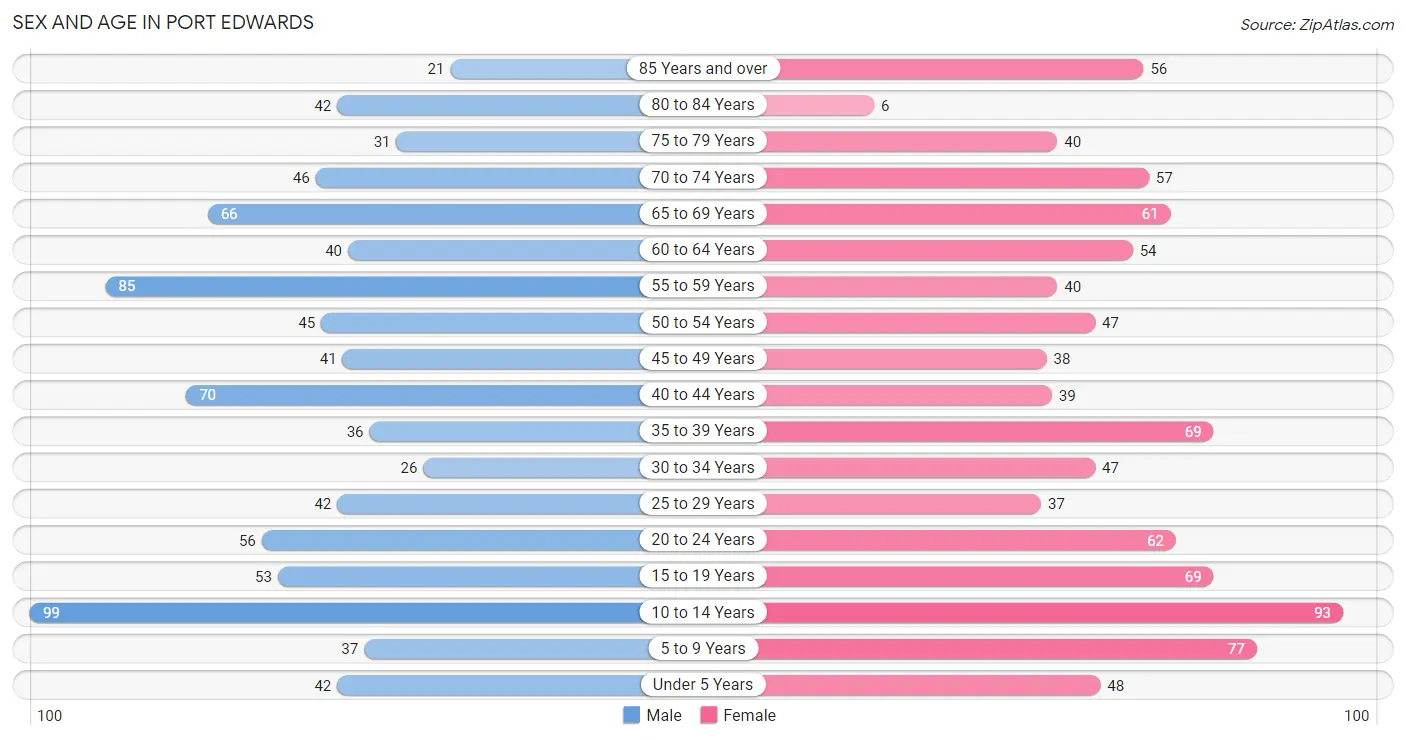
Sex and Age in Port Edwards
Sex and Age in Port Edwards
The most populous age groups in Port Edwards are 10 to 14 Years (99 | 11.3%) for men and 10 to 14 Years (93 | 9.9%) for women.
| Age Bracket | Male | Female |
| Under 5 Years | 42 (4.8%) | 48 (5.1%) |
| 5 to 9 Years | 37 (4.2%) | 77 (8.2%) |
| 10 to 14 Years | 99 (11.3%) | 93 (9.9%) |
| 15 to 19 Years | 53 (6.0%) | 69 (7.3%) |
| 20 to 24 Years | 56 (6.4%) | 62 (6.6%) |
| 25 to 29 Years | 42 (4.8%) | 37 (3.9%) |
| 30 to 34 Years | 26 (3.0%) | 47 (5.0%) |
| 35 to 39 Years | 36 (4.1%) | 69 (7.3%) |
| 40 to 44 Years | 70 (8.0%) | 39 (4.2%) |
| 45 to 49 Years | 41 (4.7%) | 38 (4.0%) |
| 50 to 54 Years | 45 (5.1%) | 47 (5.0%) |
| 55 to 59 Years | 85 (9.7%) | 40 (4.3%) |
| 60 to 64 Years | 40 (4.6%) | 54 (5.7%) |
| 65 to 69 Years | 66 (7.5%) | 61 (6.5%) |
| 70 to 74 Years | 46 (5.2%) | 57 (6.1%) |
| 75 to 79 Years | 31 (3.5%) | 40 (4.3%) |
| 80 to 84 Years | 42 (4.8%) | 6 (0.6%) |
| 85 Years and over | 21 (2.4%) | 56 (6.0%) |
| Total | 878 (100.0%) | 940 (100.0%) |
Families and Households in Port Edwards
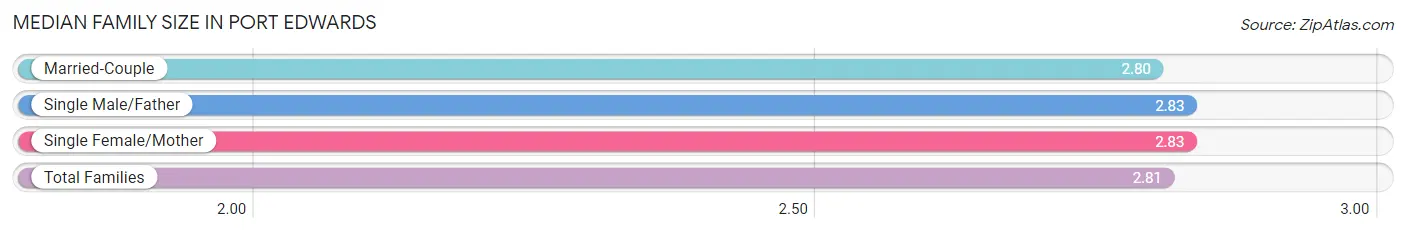
Median Family Size in Port Edwards
The median family size in Port Edwards is 2.81 persons per family, with single male/father families (42 | 8.0%) accounting for the largest median family size of 2.83 persons per family. On the other hand, married-couple families (390 | 74.4%) represent the smallest median family size with 2.80 persons per family.
| Family Type | # Families | Family Size |
| Married-Couple | 390 (74.4%) | 2.80 |
| Single Male/Father | 42 (8.0%) | 2.83 |
| Single Female/Mother | 92 (17.6%) | 2.83 |
| Total Families | 524 (100.0%) | 2.81 |
Median Household Size in Port Edwards
The median household size in Port Edwards is 2.47 persons per household, with single female/mother households (92 | 12.9%) accounting for the largest median household size of 3.35 persons per household. non-family households (187 | 26.3%) represent the smallest median household size with 1.16 persons per household.

| Household Type | # Households | Household Size |
| Married-Couple | 390 (54.8%) | 2.81 |
| Single Male/Father | 42 (5.9%) | 3.24 |
| Single Female/Mother | 92 (12.9%) | 3.35 |
| Non-family | 187 (26.3%) | 1.16 |
| Total Households | 711 (100.0%) | 2.47 |
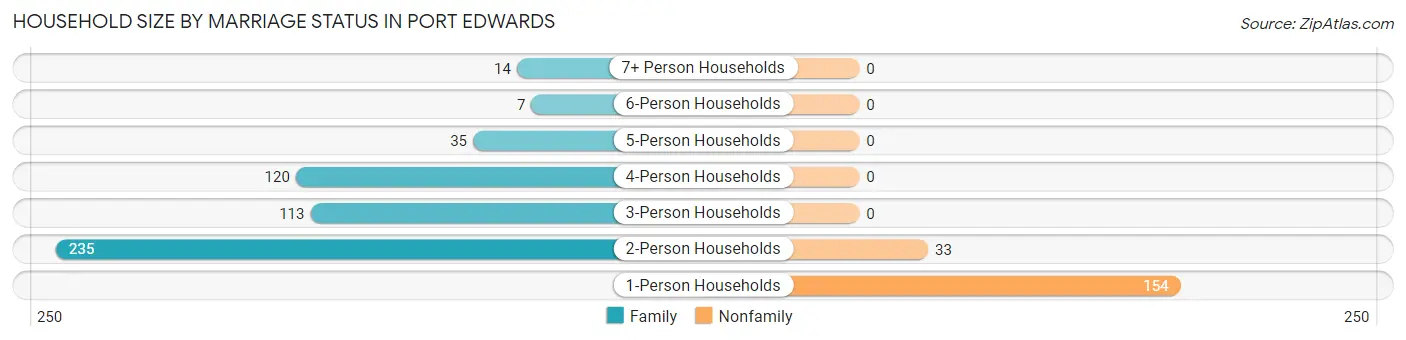
Household Size by Marriage Status in Port Edwards
Out of a total of 711 households in Port Edwards, 524 (73.7%) are family households, while 187 (26.3%) are nonfamily households. The most numerous type of family households are 2-person households, comprising 235, and the most common type of nonfamily households are 1-person households, comprising 154.
| Household Size | Family Households | Nonfamily Households |
| 1-Person Households | - | 154 (21.7%) |
| 2-Person Households | 235 (33.1%) | 33 (4.6%) |
| 3-Person Households | 113 (15.9%) | 0 (0.0%) |
| 4-Person Households | 120 (16.9%) | 0 (0.0%) |
| 5-Person Households | 35 (4.9%) | 0 (0.0%) |
| 6-Person Households | 7 (1.0%) | 0 (0.0%) |
| 7+ Person Households | 14 (2.0%) | 0 (0.0%) |
| Total | 524 (73.7%) | 187 (26.3%) |
Female Fertility in Port Edwards
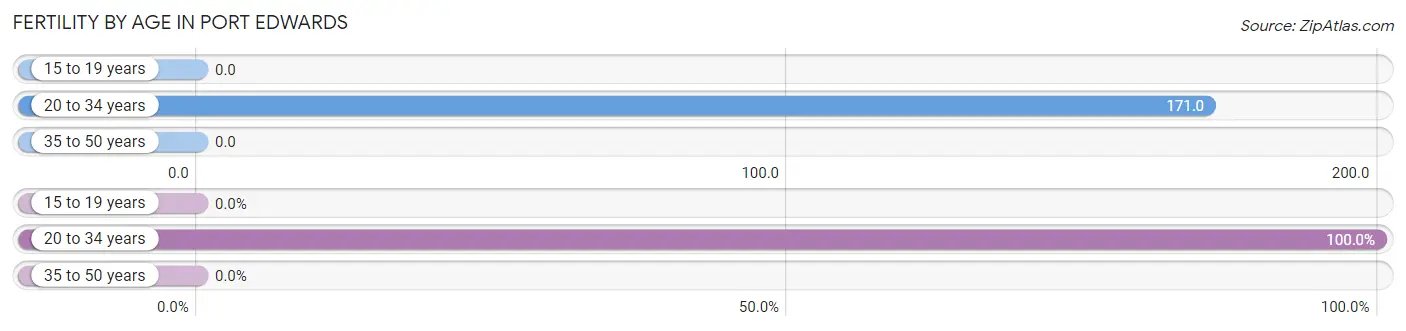
Fertility by Age in Port Edwards
Average fertility rate in Port Edwards is 68.0 births per 1,000 women. Women in the age bracket of 20 to 34 years have the highest fertility rate with 171.0 births per 1,000 women. Women in the age bracket of 20 to 34 years acount for 100.0% of all women with births.
| Age Bracket | Women with Births | Births / 1,000 Women |
| 15 to 19 years | 0 (0.0%) | 0.0 |
| 20 to 34 years | 25 (100.0%) | 171.0 |
| 35 to 50 years | 0 (0.0%) | 0.0 |
| Total | 25 (100.0%) | 68.0 |
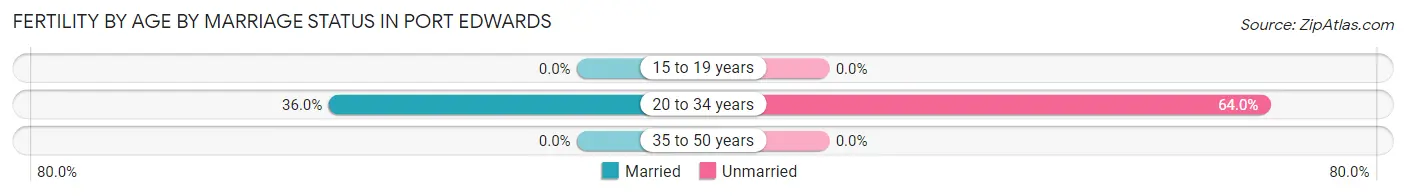
Fertility by Age by Marriage Status in Port Edwards
36.0% of women with births (25) in Port Edwards are married. The highest percentage of unmarried women with births falls into 20 to 34 years age bracket with 64.0% of them unmarried at the time of birth, while the lowest percentage of unmarried women with births belong to 20 to 34 years age bracket with 64.0% of them unmarried.
| Age Bracket | Married | Unmarried |
| 15 to 19 years | 0 (0.0%) | 0 (0.0%) |
| 20 to 34 years | 9 (36.0%) | 16 (64.0%) |
| 35 to 50 years | 0 (0.0%) | 0 (0.0%) |
| Total | 9 (36.0%) | 16 (64.0%) |
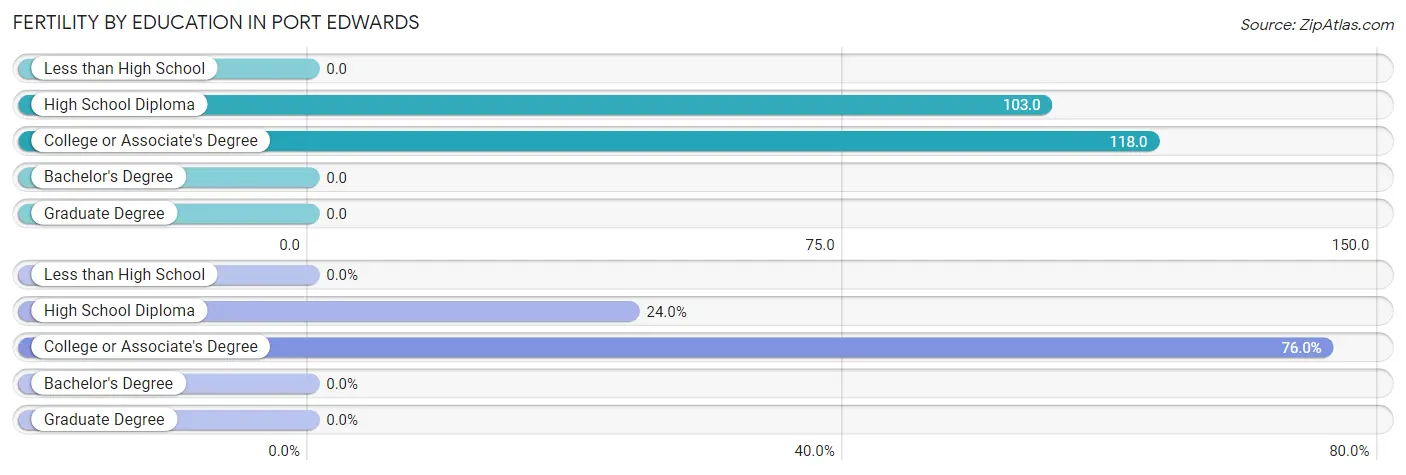
Fertility by Education in Port Edwards
| Educational Attainment | Women with Births | Births / 1,000 Women |
| Less than High School | 0 (0.0%) | 0.0 |
| High School Diploma | 6 (24.0%) | 103.0 |
| College or Associate's Degree | 19 (76.0%) | 118.0 |
| Bachelor's Degree | 0 (0.0%) | 0.0 |
| Graduate Degree | 0 (0.0%) | 0.0 |
| Total | 25 (100.0%) | 68.0 |
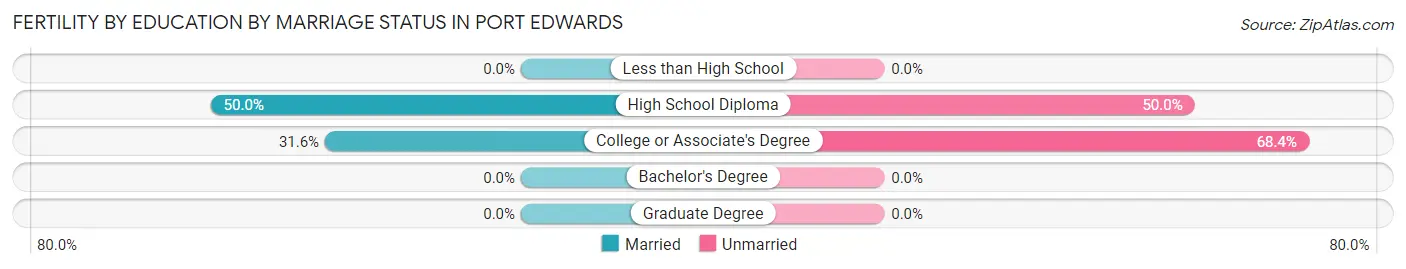
Fertility by Education by Marriage Status in Port Edwards
64.0% of women with births in Port Edwards are unmarried. Women with the educational attainment of high school diploma are most likely to be married with 50.0% of them married at childbirth, while women with the educational attainment of college or associate's degree are least likely to be married with 68.4% of them unmarried at childbirth.
| Educational Attainment | Married | Unmarried |
| Less than High School | 0 (0.0%) | 0 (0.0%) |
| High School Diploma | 3 (50.0%) | 3 (50.0%) |
| College or Associate's Degree | 6 (31.6%) | 13 (68.4%) |
| Bachelor's Degree | 0 (0.0%) | 0 (0.0%) |
| Graduate Degree | 0 (0.0%) | 0 (0.0%) |
| Total | 9 (36.0%) | 16 (64.0%) |
Employment Characteristics in Port Edwards
Employment by Class of Employer in Port Edwards
Among the 704 employed individuals in Port Edwards, private company employees (498 | 70.7%), not-for-profit organizations (78 | 11.1%), and local government employees (55 | 7.8%) make up the most common classes of employment.
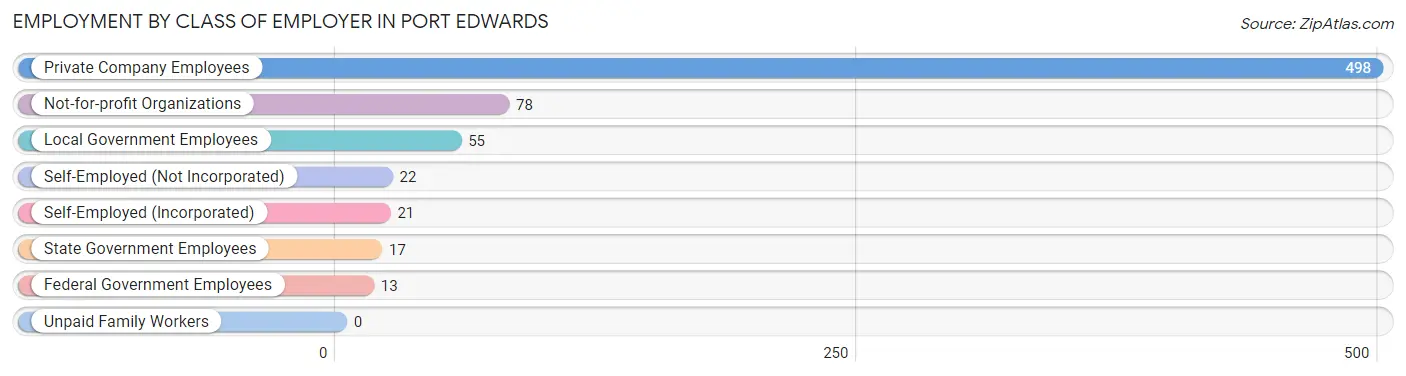
| Employer Class | # Employees | % Employees |
| Private Company Employees | 498 | 70.7% |
| Self-Employed (Incorporated) | 21 | 3.0% |
| Self-Employed (Not Incorporated) | 22 | 3.1% |
| Not-for-profit Organizations | 78 | 11.1% |
| Local Government Employees | 55 | 7.8% |
| State Government Employees | 17 | 2.4% |
| Federal Government Employees | 13 | 1.8% |
| Unpaid Family Workers | 0 | 0.0% |
| Total | 704 | 100.0% |
Employment Status by Age in Port Edwards
According to the labor force statistics for Port Edwards, out of the total population over 16 years of age (1,400), 53.2% or 745 individuals are in the labor force, with 2.8% or 21 of them unemployed. The age group with the highest labor force participation rate is 35 to 44 years, with 92.5% or 198 individuals in the labor force. Within the labor force, the 55 to 59 years age range has the highest percentage of unemployed individuals, with 10.2% or 6 of them being unemployed.
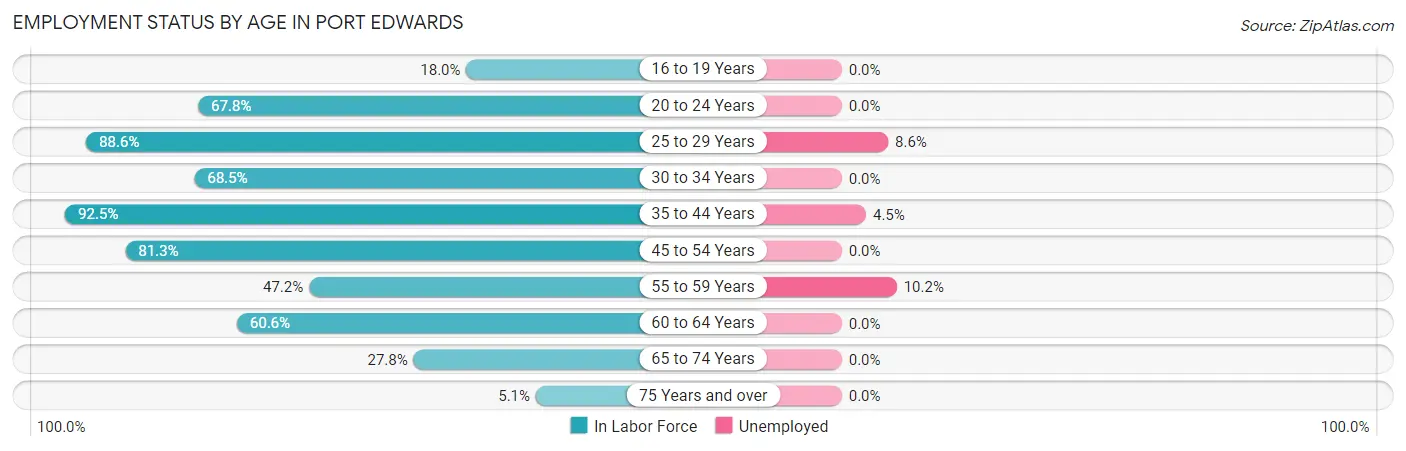
| Age Bracket | In Labor Force | Unemployed |
| 16 to 19 Years | 18 (18.0%) | 0 (0.0%) |
| 20 to 24 Years | 80 (67.8%) | 0 (0.0%) |
| 25 to 29 Years | 70 (88.6%) | 6 (8.6%) |
| 30 to 34 Years | 50 (68.5%) | 0 (0.0%) |
| 35 to 44 Years | 198 (92.5%) | 9 (4.5%) |
| 45 to 54 Years | 139 (81.3%) | 0 (0.0%) |
| 55 to 59 Years | 59 (47.2%) | 6 (10.2%) |
| 60 to 64 Years | 57 (60.6%) | 0 (0.0%) |
| 65 to 74 Years | 64 (27.8%) | 0 (0.0%) |
| 75 Years and over | 10 (5.1%) | 0 (0.0%) |
| Total | 745 (53.2%) | 21 (2.8%) |
Employment Status by Educational Attainment in Port Edwards
According to labor force statistics for Port Edwards, 75.8% of individuals (573) out of the total population between 25 and 64 years of age (756) are in the labor force, with 3.7% or 21 of them being unemployed. The group with the highest labor force participation rate are those with the educational attainment of bachelor's degree or higher, with 89.2% or 157 individuals in the labor force. Within the labor force, individuals with high school diploma education have the highest percentage of unemployment, with 6.3% or 9 of them being unemployed.
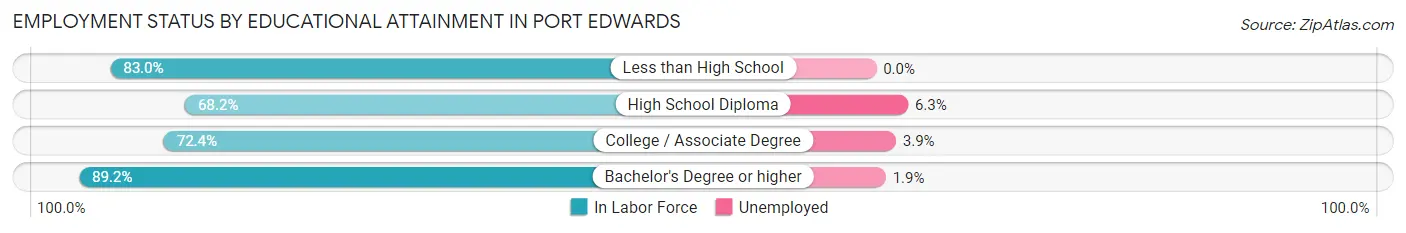
| Educational Attainment | In Labor Force | Unemployed |
| Less than High School | 39 (83.0%) | 0 (0.0%) |
| High School Diploma | 144 (68.2%) | 13 (6.3%) |
| College / Associate Degree | 233 (72.4%) | 13 (3.9%) |
| Bachelor's Degree or higher | 157 (89.2%) | 3 (1.9%) |
| Total | 573 (75.8%) | 28 (3.7%) |
Employment Occupations by Sex in Port Edwards
Management, Business, Science and Arts Occupations
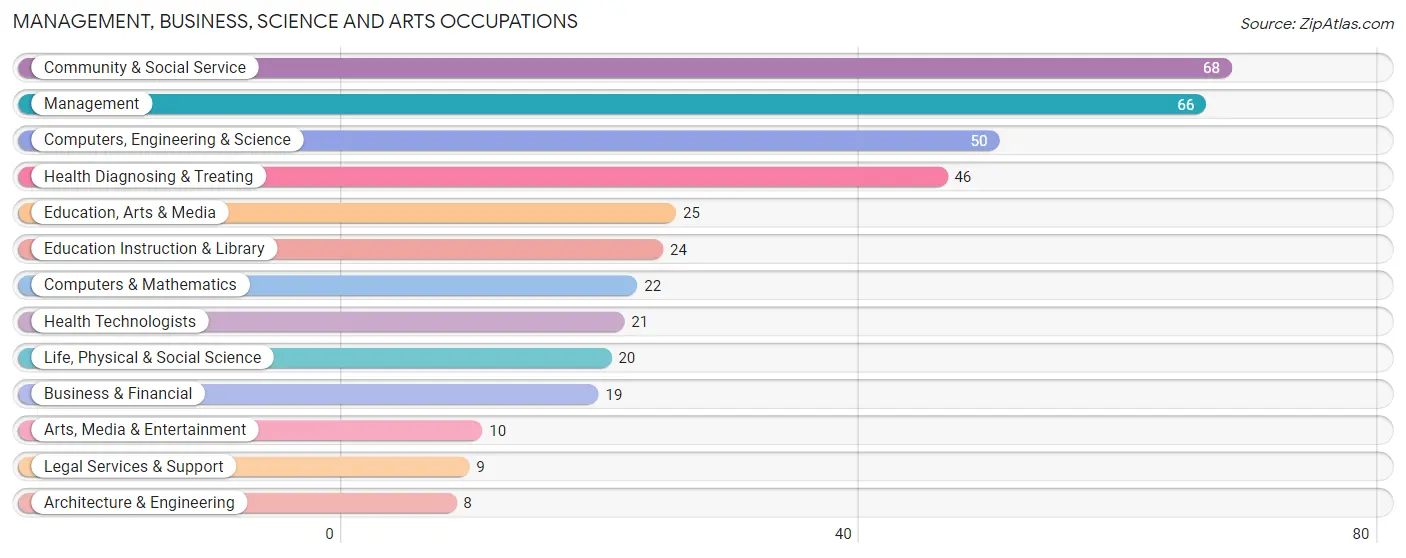
The most common Management, Business, Science and Arts occupations in Port Edwards are Community & Social Service (68 | 9.4%), Management (66 | 9.1%), Computers, Engineering & Science (50 | 6.9%), Health Diagnosing & Treating (46 | 6.4%), and Education, Arts & Media (25 | 3.5%).
Management, Business, Science and Arts Occupations by Sex
Within the Management, Business, Science and Arts occupations in Port Edwards, the most male-oriented occupations are Computers & Mathematics (100.0%), Computers, Engineering & Science (84.0%), and Architecture & Engineering (75.0%), while the most female-oriented occupations are Education Instruction & Library (79.2%), Health Technologists (71.4%), and Health Diagnosing & Treating (65.2%).
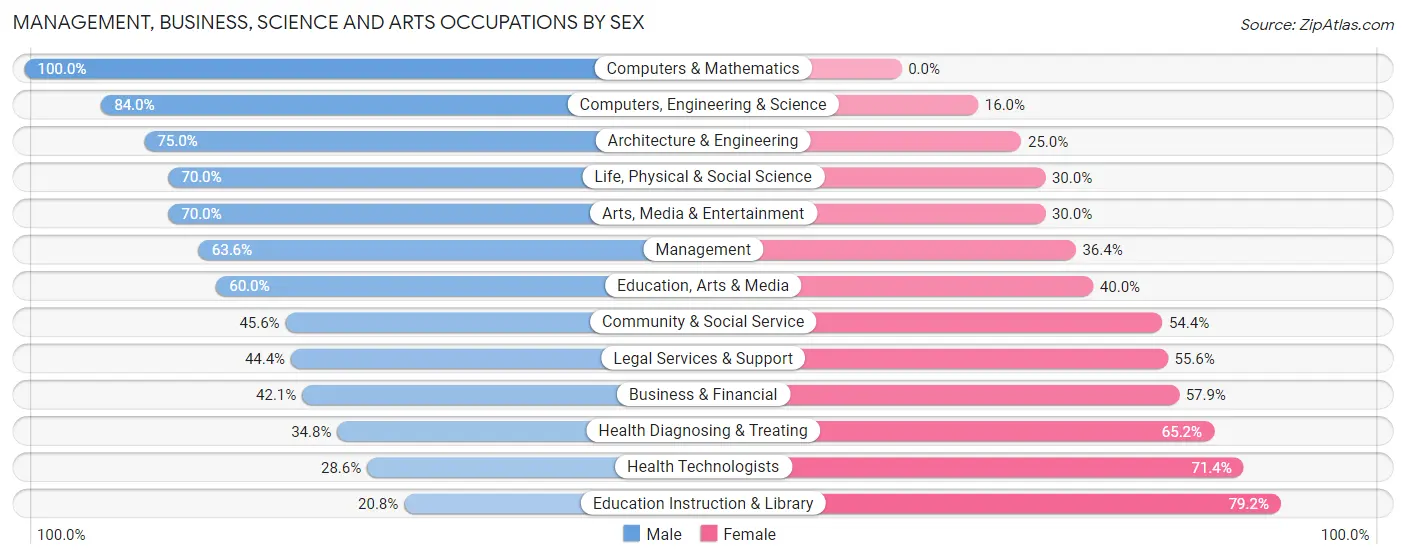
| Occupation | Male | Female |
| Management | 42 (63.6%) | 24 (36.4%) |
| Business & Financial | 8 (42.1%) | 11 (57.9%) |
| Computers, Engineering & Science | 42 (84.0%) | 8 (16.0%) |
| Computers & Mathematics | 22 (100.0%) | 0 (0.0%) |
| Architecture & Engineering | 6 (75.0%) | 2 (25.0%) |
| Life, Physical & Social Science | 14 (70.0%) | 6 (30.0%) |
| Community & Social Service | 31 (45.6%) | 37 (54.4%) |
| Education, Arts & Media | 15 (60.0%) | 10 (40.0%) |
| Legal Services & Support | 4 (44.4%) | 5 (55.6%) |
| Education Instruction & Library | 5 (20.8%) | 19 (79.2%) |
| Arts, Media & Entertainment | 7 (70.0%) | 3 (30.0%) |
| Health Diagnosing & Treating | 16 (34.8%) | 30 (65.2%) |
| Health Technologists | 6 (28.6%) | 15 (71.4%) |
| Total (Category) | 139 (55.8%) | 110 (44.2%) |
| Total (Overall) | 390 (53.9%) | 334 (46.1%) |
Services Occupations
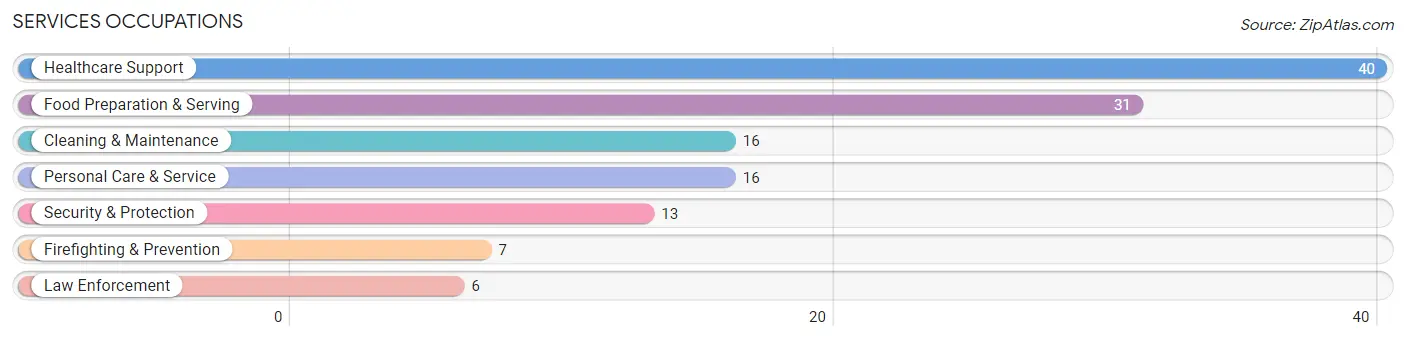
The most common Services occupations in Port Edwards are Healthcare Support (40 | 5.5%), Food Preparation & Serving (31 | 4.3%), Cleaning & Maintenance (16 | 2.2%), Personal Care & Service (16 | 2.2%), and Security & Protection (13 | 1.8%).
Services Occupations by Sex
Within the Services occupations in Port Edwards, the most male-oriented occupations are Firefighting & Prevention (71.4%), Security & Protection (69.2%), and Law Enforcement (66.7%), while the most female-oriented occupations are Personal Care & Service (81.2%), Healthcare Support (80.0%), and Cleaning & Maintenance (50.0%).
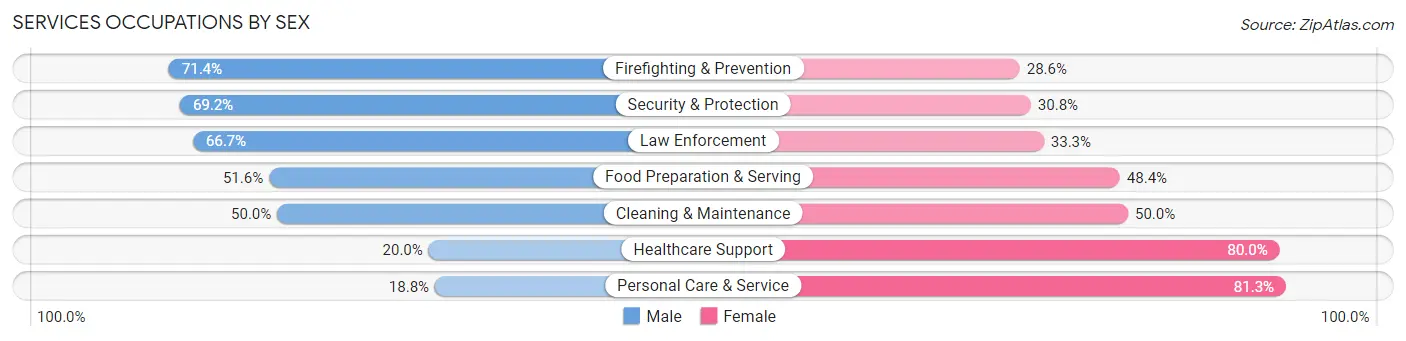
| Occupation | Male | Female |
| Healthcare Support | 8 (20.0%) | 32 (80.0%) |
| Security & Protection | 9 (69.2%) | 4 (30.8%) |
| Firefighting & Prevention | 5 (71.4%) | 2 (28.6%) |
| Law Enforcement | 4 (66.7%) | 2 (33.3%) |
| Food Preparation & Serving | 16 (51.6%) | 15 (48.4%) |
| Cleaning & Maintenance | 8 (50.0%) | 8 (50.0%) |
| Personal Care & Service | 3 (18.8%) | 13 (81.2%) |
| Total (Category) | 44 (37.9%) | 72 (62.1%) |
| Total (Overall) | 390 (53.9%) | 334 (46.1%) |
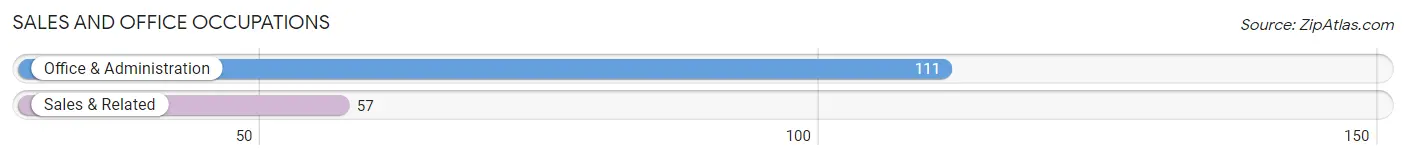
Sales and Office Occupations
The most common Sales and Office occupations in Port Edwards are Office & Administration (111 | 15.3%), and Sales & Related (57 | 7.9%).
Sales and Office Occupations by Sex
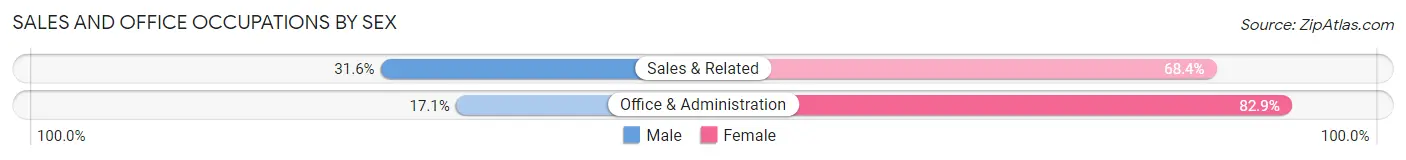
| Occupation | Male | Female |
| Sales & Related | 18 (31.6%) | 39 (68.4%) |
| Office & Administration | 19 (17.1%) | 92 (82.9%) |
| Total (Category) | 37 (22.0%) | 131 (78.0%) |
| Total (Overall) | 390 (53.9%) | 334 (46.1%) |
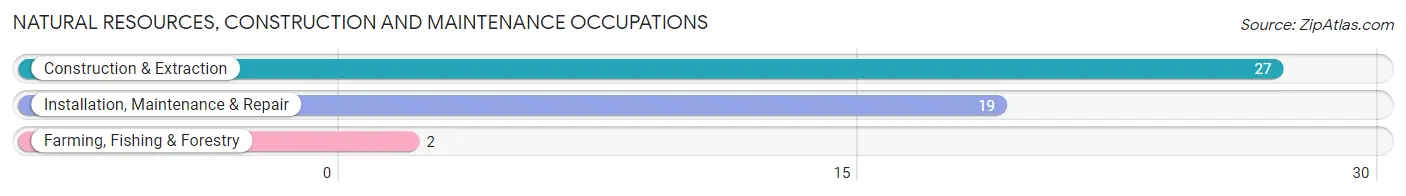
Natural Resources, Construction and Maintenance Occupations
The most common Natural Resources, Construction and Maintenance occupations in Port Edwards are Construction & Extraction (27 | 3.7%), Installation, Maintenance & Repair (19 | 2.6%), and Farming, Fishing & Forestry (2 | 0.3%).
Natural Resources, Construction and Maintenance Occupations by Sex
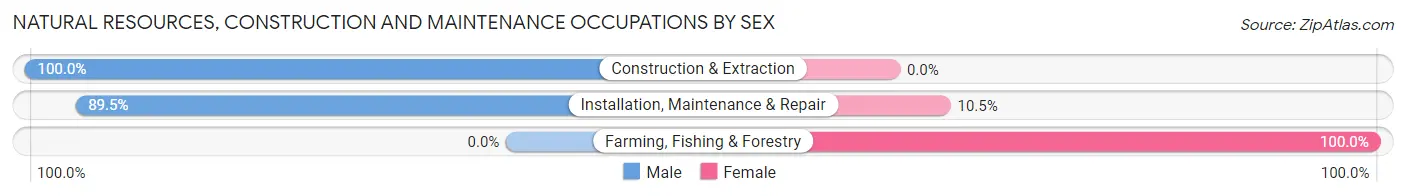
| Occupation | Male | Female |
| Farming, Fishing & Forestry | 0 (0.0%) | 2 (100.0%) |
| Construction & Extraction | 27 (100.0%) | 0 (0.0%) |
| Installation, Maintenance & Repair | 17 (89.5%) | 2 (10.5%) |
| Total (Category) | 44 (91.7%) | 4 (8.3%) |
| Total (Overall) | 390 (53.9%) | 334 (46.1%) |
Production, Transportation and Moving Occupations
The most common Production, Transportation and Moving occupations in Port Edwards are Transportation (61 | 8.4%), Production (59 | 8.2%), and Material Moving (23 | 3.2%).
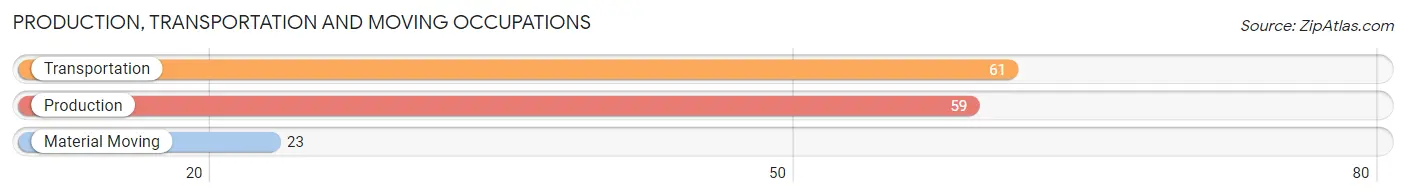
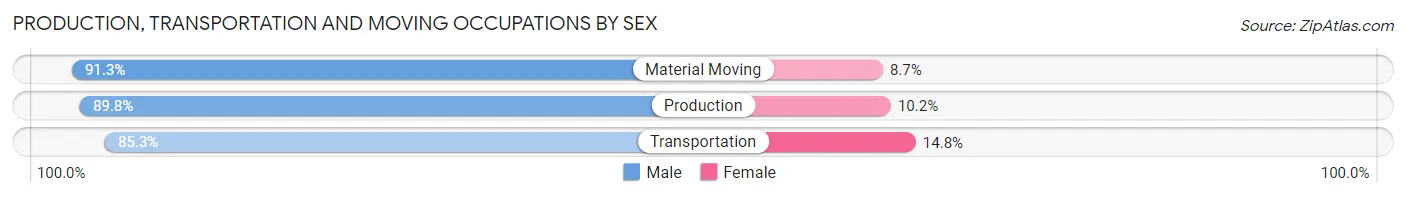
Production, Transportation and Moving Occupations by Sex
| Occupation | Male | Female |
| Production | 53 (89.8%) | 6 (10.2%) |
| Transportation | 52 (85.3%) | 9 (14.7%) |
| Material Moving | 21 (91.3%) | 2 (8.7%) |
| Total (Category) | 126 (88.1%) | 17 (11.9%) |
| Total (Overall) | 390 (53.9%) | 334 (46.1%) |
Employment Industries by Sex in Port Edwards
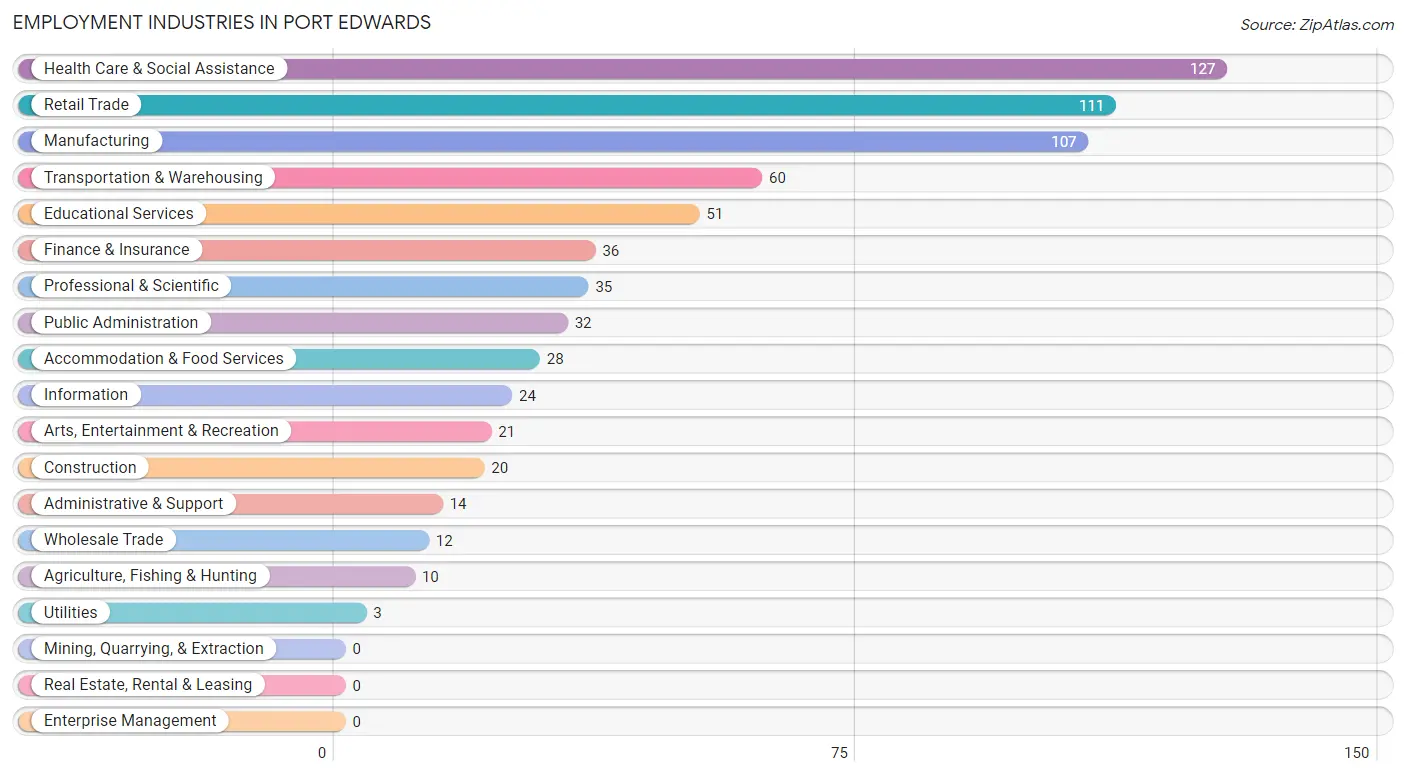
Employment Industries in Port Edwards
The major employment industries in Port Edwards include Health Care & Social Assistance (127 | 17.5%), Retail Trade (111 | 15.3%), Manufacturing (107 | 14.8%), Transportation & Warehousing (60 | 8.3%), and Educational Services (51 | 7.0%).
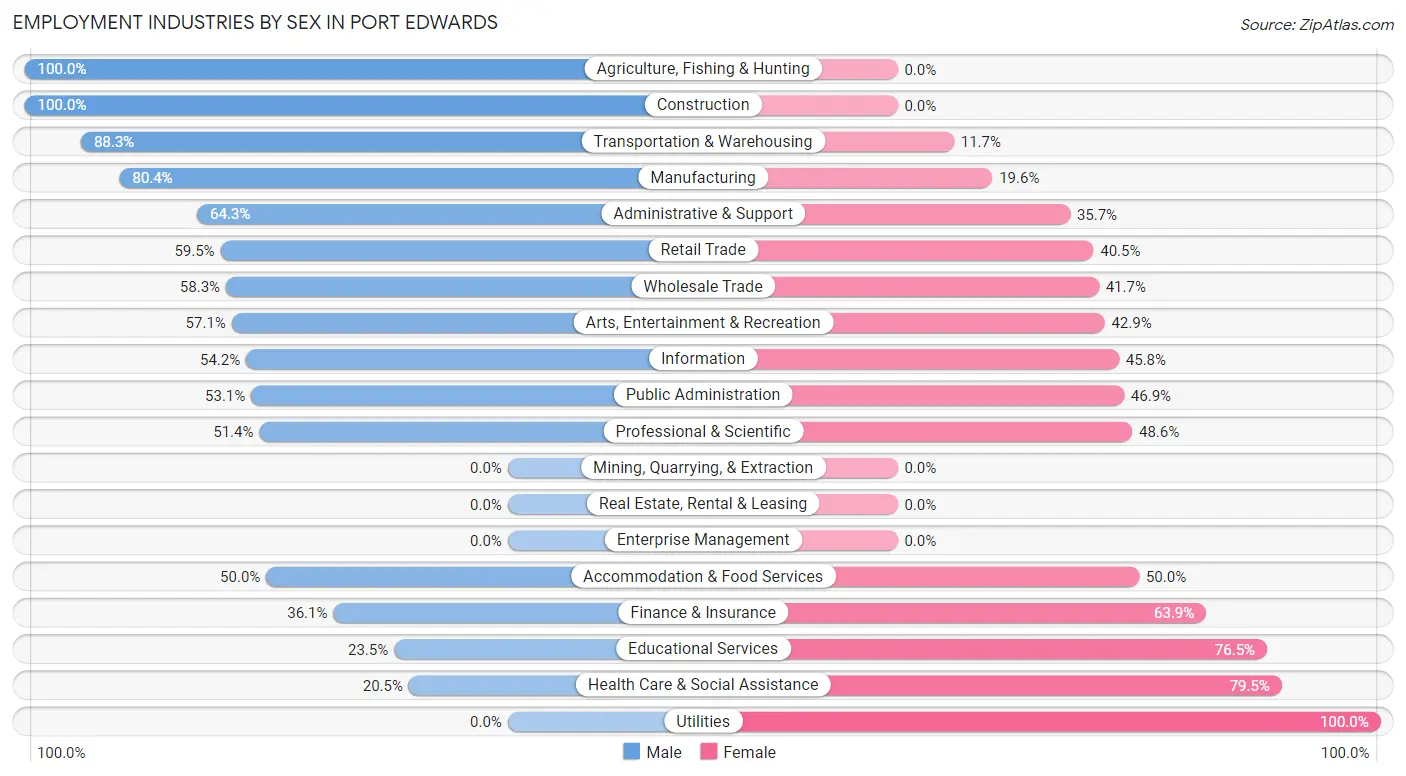
Employment Industries by Sex in Port Edwards
The Port Edwards industries that see more men than women are Agriculture, Fishing & Hunting (100.0%), Construction (100.0%), and Transportation & Warehousing (88.3%), whereas the industries that tend to have a higher number of women are Utilities (100.0%), Health Care & Social Assistance (79.5%), and Educational Services (76.5%).
| Industry | Male | Female |
| Agriculture, Fishing & Hunting | 10 (100.0%) | 0 (0.0%) |
| Mining, Quarrying, & Extraction | 0 (0.0%) | 0 (0.0%) |
| Construction | 20 (100.0%) | 0 (0.0%) |
| Manufacturing | 86 (80.4%) | 21 (19.6%) |
| Wholesale Trade | 7 (58.3%) | 5 (41.7%) |
| Retail Trade | 66 (59.5%) | 45 (40.5%) |
| Transportation & Warehousing | 53 (88.3%) | 7 (11.7%) |
| Utilities | 0 (0.0%) | 3 (100.0%) |
| Information | 13 (54.2%) | 11 (45.8%) |
| Finance & Insurance | 13 (36.1%) | 23 (63.9%) |
| Real Estate, Rental & Leasing | 0 (0.0%) | 0 (0.0%) |
| Professional & Scientific | 18 (51.4%) | 17 (48.6%) |
| Enterprise Management | 0 (0.0%) | 0 (0.0%) |
| Administrative & Support | 9 (64.3%) | 5 (35.7%) |
| Educational Services | 12 (23.5%) | 39 (76.5%) |
| Health Care & Social Assistance | 26 (20.5%) | 101 (79.5%) |
| Arts, Entertainment & Recreation | 12 (57.1%) | 9 (42.9%) |
| Accommodation & Food Services | 14 (50.0%) | 14 (50.0%) |
| Public Administration | 17 (53.1%) | 15 (46.9%) |
| Total | 390 (53.9%) | 334 (46.1%) |
Education in Port Edwards
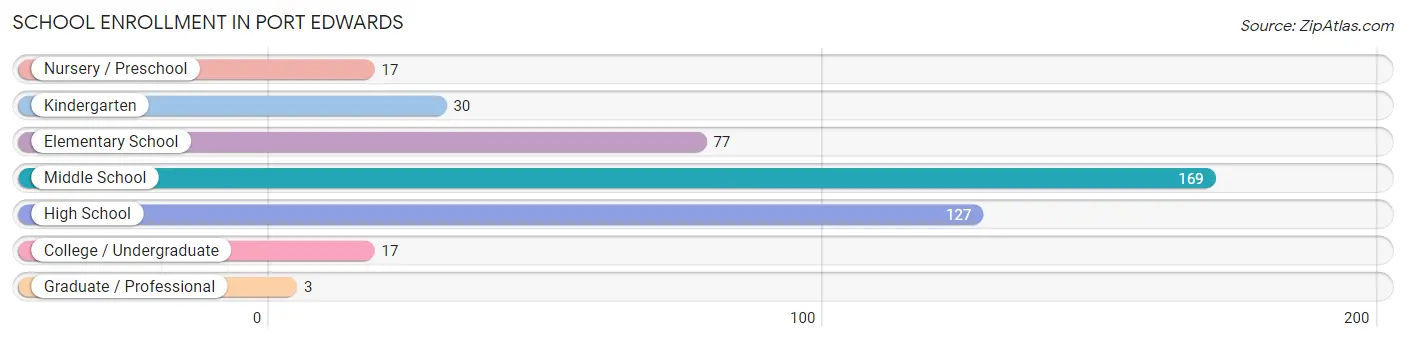
School Enrollment in Port Edwards
The most common levels of schooling among the 440 students in Port Edwards are middle school (169 | 38.4%), high school (127 | 28.9%), and elementary school (77 | 17.5%).
| School Level | # Students | % Students |
| Nursery / Preschool | 17 | 3.9% |
| Kindergarten | 30 | 6.8% |
| Elementary School | 77 | 17.5% |
| Middle School | 169 | 38.4% |
| High School | 127 | 28.9% |
| College / Undergraduate | 17 | 3.9% |
| Graduate / Professional | 3 | 0.7% |
| Total | 440 | 100.0% |
School Enrollment by Age by Funding Source in Port Edwards
Out of a total of 440 students who are enrolled in schools in Port Edwards, 44 (10.0%) attend a private institution, while the remaining 396 (90.0%) are enrolled in public schools. The age group of 25 to 34 year olds has the highest likelihood of being enrolled in private schools, with 3 (100.0% in the age bracket) enrolled. Conversely, the age group of 18 to 19 year olds has the lowest likelihood of being enrolled in a private school, with 20 (100.0% in the age bracket) attending a public institution.
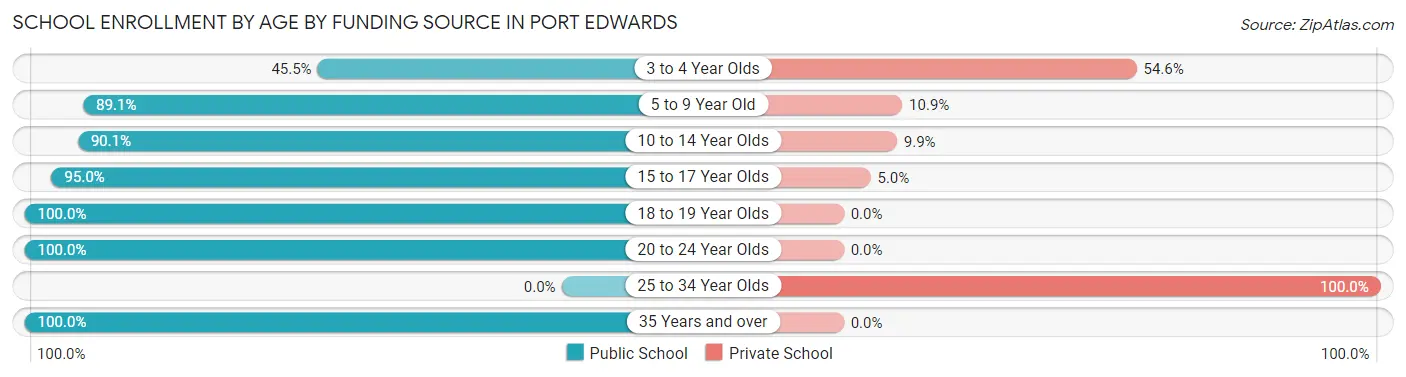
| Age Bracket | Public School | Private School |
| 3 to 4 Year Olds | 5 (45.5%) | 6 (54.5%) |
| 5 to 9 Year Old | 90 (89.1%) | 11 (10.9%) |
| 10 to 14 Year Olds | 173 (90.1%) | 19 (9.9%) |
| 15 to 17 Year Olds | 95 (95.0%) | 5 (5.0%) |
| 18 to 19 Year Olds | 20 (100.0%) | 0 (0.0%) |
| 20 to 24 Year Olds | 6 (100.0%) | 0 (0.0%) |
| 25 to 34 Year Olds | 0 (0.0%) | 3 (100.0%) |
| 35 Years and over | 7 (100.0%) | 0 (0.0%) |
| Total | 396 (90.0%) | 44 (10.0%) |
Educational Attainment by Field of Study in Port Edwards
Education (84 | 29.6%), business (35 | 12.3%), science & technology (23 | 8.1%), bio, nature & agricultural (21 | 7.4%), and social sciences (21 | 7.4%) are the most common fields of study among 284 individuals in Port Edwards who have obtained a bachelor's degree or higher.
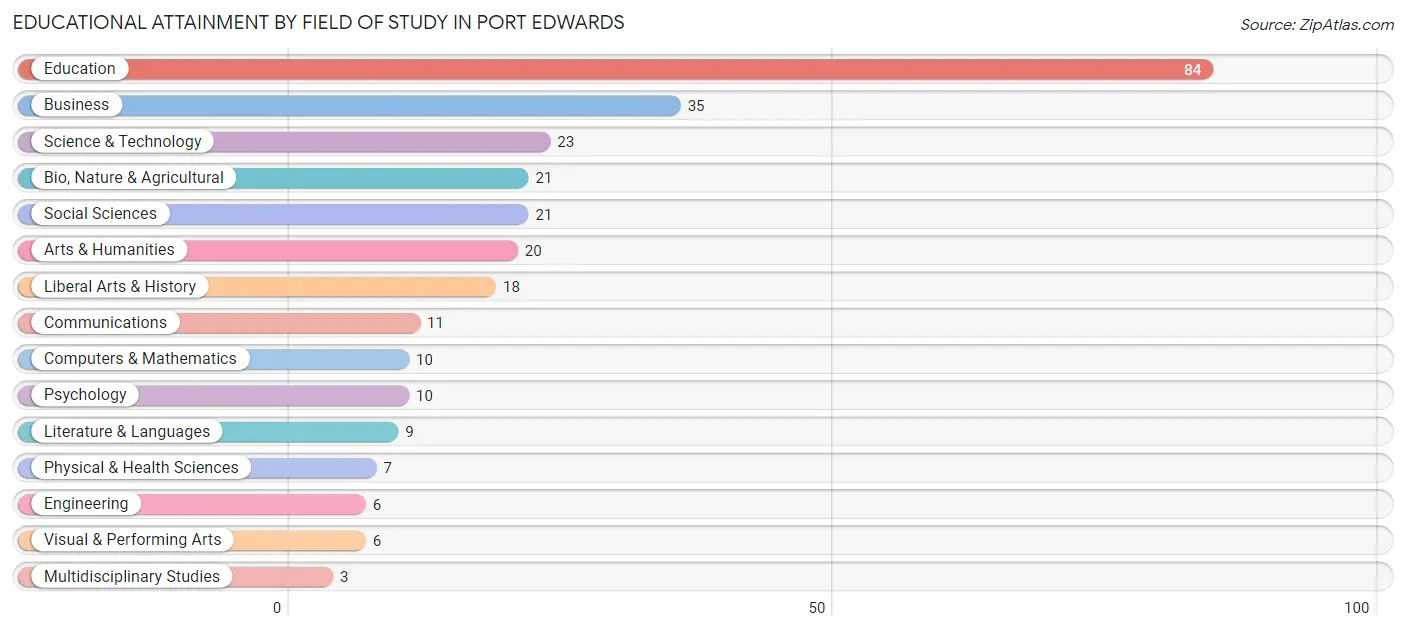
| Field of Study | # Graduates | % Graduates |
| Computers & Mathematics | 10 | 3.5% |
| Bio, Nature & Agricultural | 21 | 7.4% |
| Physical & Health Sciences | 7 | 2.5% |
| Psychology | 10 | 3.5% |
| Social Sciences | 21 | 7.4% |
| Engineering | 6 | 2.1% |
| Multidisciplinary Studies | 3 | 1.1% |
| Science & Technology | 23 | 8.1% |
| Business | 35 | 12.3% |
| Education | 84 | 29.6% |
| Literature & Languages | 9 | 3.2% |
| Liberal Arts & History | 18 | 6.3% |
| Visual & Performing Arts | 6 | 2.1% |
| Communications | 11 | 3.9% |
| Arts & Humanities | 20 | 7.0% |
| Total | 284 | 100.0% |
Transportation & Commute in Port Edwards
Vehicle Availability by Sex in Port Edwards
The most prevalent vehicle ownership categories in Port Edwards are males with 2 vehicles (184, accounting for 47.8%) and females with 2 vehicles (146, making up 57.7%).
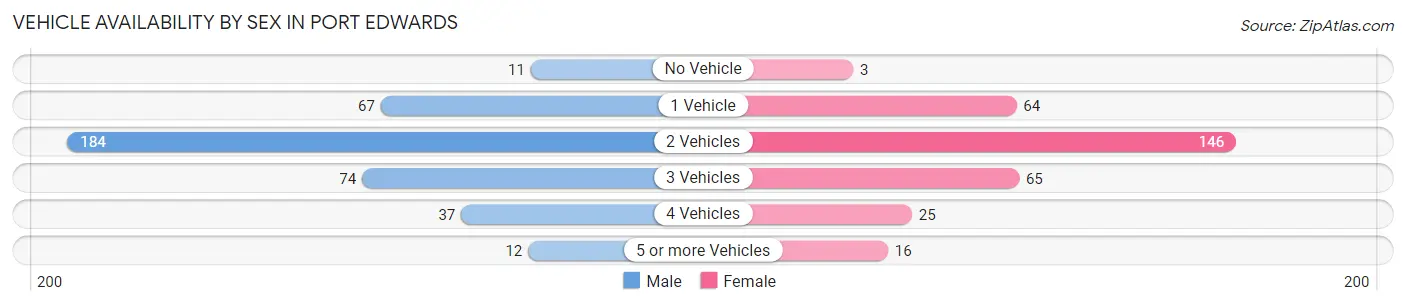
| Vehicles Available | Male | Female |
| No Vehicle | 11 (2.9%) | 3 (0.9%) |
| 1 Vehicle | 67 (17.4%) | 64 (20.1%) |
| 2 Vehicles | 184 (47.8%) | 146 (45.8%) |
| 3 Vehicles | 74 (19.2%) | 65 (20.4%) |
| 4 Vehicles | 37 (9.6%) | 25 (7.8%) |
| 5 or more Vehicles | 12 (3.1%) | 16 (5.0%) |
| Total | 385 (100.0%) | 319 (100.0%) |
Commute Time in Port Edwards
The most frequently occuring commute durations in Port Edwards are 10 to 14 minutes (207 commuters, 32.3%), 15 to 19 minutes (94 commuters, 14.7%), and 5 to 9 minutes (76 commuters, 11.9%).
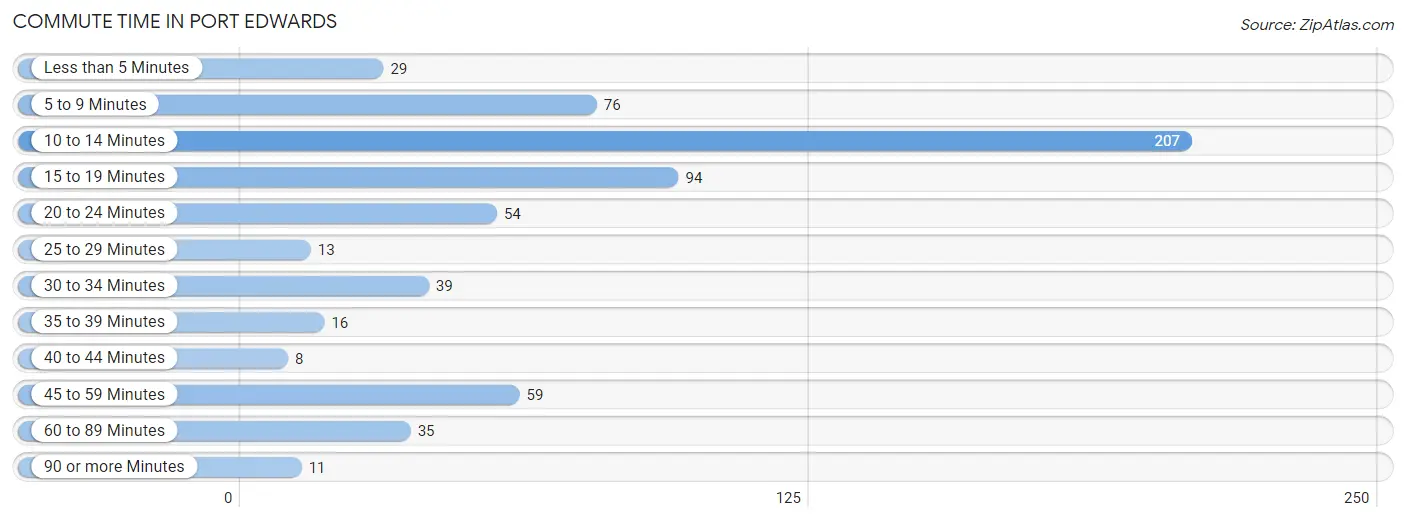
| Commute Time | # Commuters | % Commuters |
| Less than 5 Minutes | 29 | 4.5% |
| 5 to 9 Minutes | 76 | 11.9% |
| 10 to 14 Minutes | 207 | 32.3% |
| 15 to 19 Minutes | 94 | 14.7% |
| 20 to 24 Minutes | 54 | 8.4% |
| 25 to 29 Minutes | 13 | 2.0% |
| 30 to 34 Minutes | 39 | 6.1% |
| 35 to 39 Minutes | 16 | 2.5% |
| 40 to 44 Minutes | 8 | 1.3% |
| 45 to 59 Minutes | 59 | 9.2% |
| 60 to 89 Minutes | 35 | 5.5% |
| 90 or more Minutes | 11 | 1.7% |
Commute Time by Sex in Port Edwards
The most common commute times in Port Edwards are 10 to 14 minutes (138 commuters, 37.3%) for males and 10 to 14 minutes (69 commuters, 25.5%) for females.
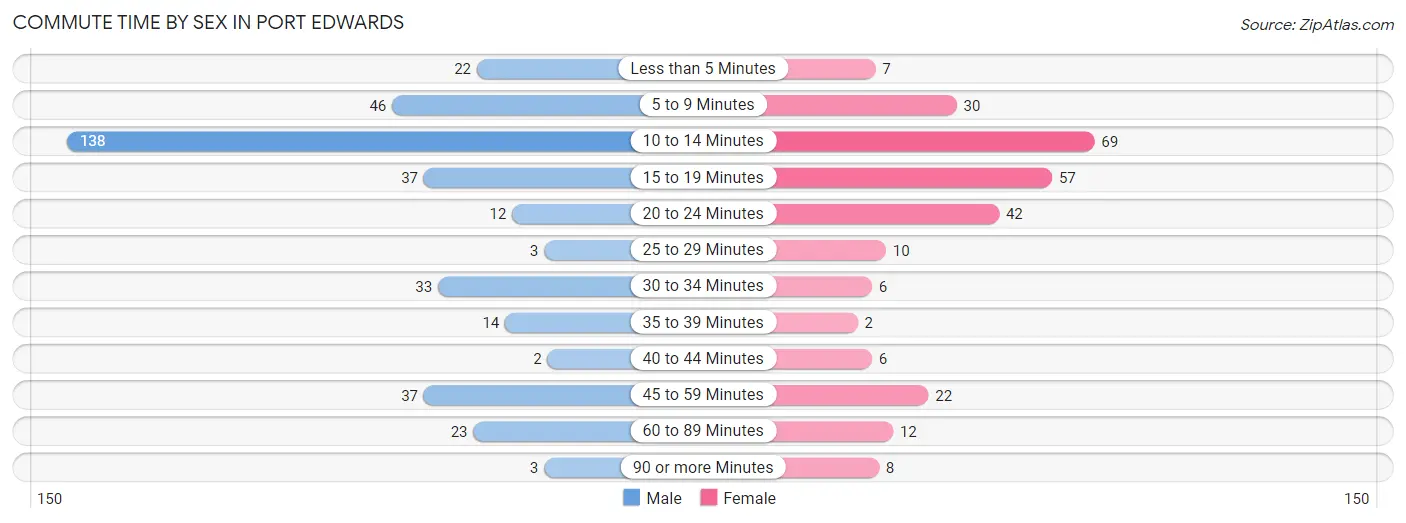
| Commute Time | Male | Female |
| Less than 5 Minutes | 22 (5.9%) | 7 (2.6%) |
| 5 to 9 Minutes | 46 (12.4%) | 30 (11.1%) |
| 10 to 14 Minutes | 138 (37.3%) | 69 (25.5%) |
| 15 to 19 Minutes | 37 (10.0%) | 57 (21.0%) |
| 20 to 24 Minutes | 12 (3.2%) | 42 (15.5%) |
| 25 to 29 Minutes | 3 (0.8%) | 10 (3.7%) |
| 30 to 34 Minutes | 33 (8.9%) | 6 (2.2%) |
| 35 to 39 Minutes | 14 (3.8%) | 2 (0.7%) |
| 40 to 44 Minutes | 2 (0.5%) | 6 (2.2%) |
| 45 to 59 Minutes | 37 (10.0%) | 22 (8.1%) |
| 60 to 89 Minutes | 23 (6.2%) | 12 (4.4%) |
| 90 or more Minutes | 3 (0.8%) | 8 (2.9%) |
Time of Departure to Work by Sex in Port Edwards
The most frequent times of departure to work in Port Edwards are 4:00 PM to 11:59 PM (63, 17.0%) for males and 7:00 AM to 7:29 AM (66, 24.3%) for females.
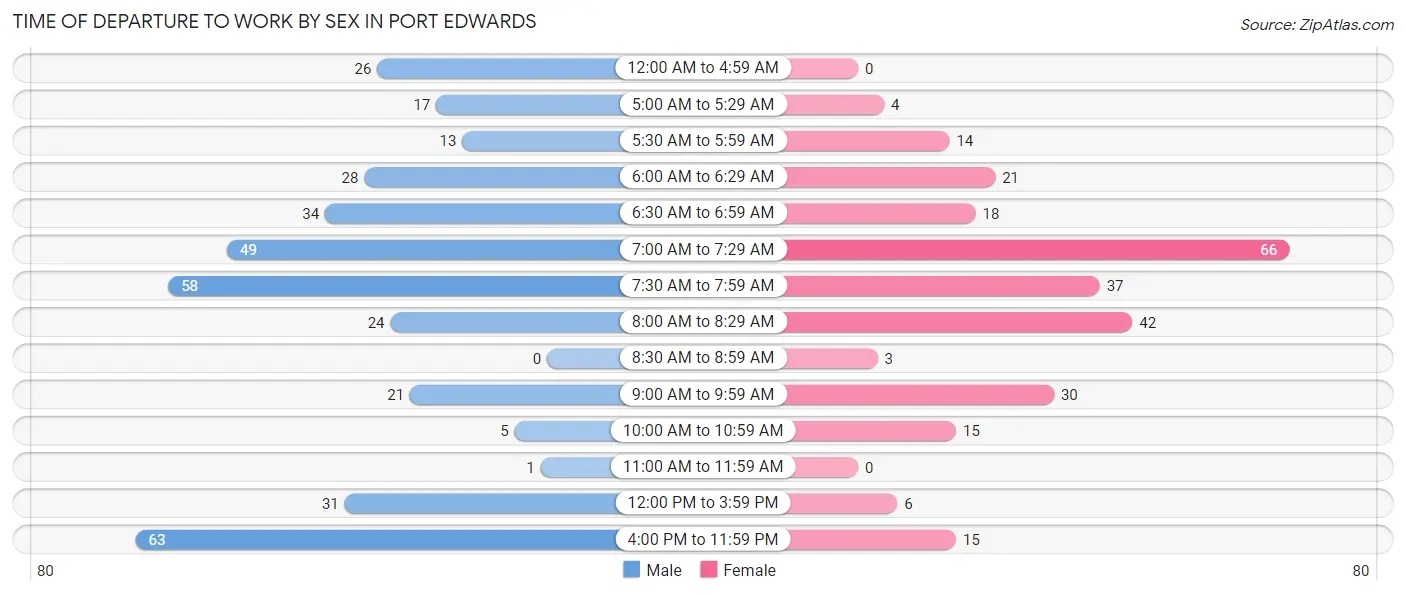
| Time of Departure | Male | Female |
| 12:00 AM to 4:59 AM | 26 (7.0%) | 0 (0.0%) |
| 5:00 AM to 5:29 AM | 17 (4.6%) | 4 (1.5%) |
| 5:30 AM to 5:59 AM | 13 (3.5%) | 14 (5.2%) |
| 6:00 AM to 6:29 AM | 28 (7.6%) | 21 (7.7%) |
| 6:30 AM to 6:59 AM | 34 (9.2%) | 18 (6.6%) |
| 7:00 AM to 7:29 AM | 49 (13.2%) | 66 (24.3%) |
| 7:30 AM to 7:59 AM | 58 (15.7%) | 37 (13.7%) |
| 8:00 AM to 8:29 AM | 24 (6.5%) | 42 (15.5%) |
| 8:30 AM to 8:59 AM | 0 (0.0%) | 3 (1.1%) |
| 9:00 AM to 9:59 AM | 21 (5.7%) | 30 (11.1%) |
| 10:00 AM to 10:59 AM | 5 (1.3%) | 15 (5.5%) |
| 11:00 AM to 11:59 AM | 1 (0.3%) | 0 (0.0%) |
| 12:00 PM to 3:59 PM | 31 (8.4%) | 6 (2.2%) |
| 4:00 PM to 11:59 PM | 63 (17.0%) | 15 (5.5%) |
| Total | 370 (100.0%) | 271 (100.0%) |
Housing Occupancy in Port Edwards
Occupancy by Ownership in Port Edwards
Of the total 711 dwellings in Port Edwards, owner-occupied units account for 562 (79.0%), while renter-occupied units make up 149 (21.0%).
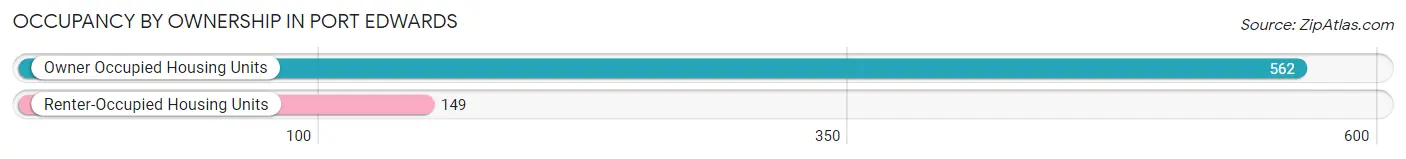
| Occupancy | # Housing Units | % Housing Units |
| Owner Occupied Housing Units | 562 | 79.0% |
| Renter-Occupied Housing Units | 149 | 21.0% |
| Total Occupied Housing Units | 711 | 100.0% |
Occupancy by Household Size in Port Edwards
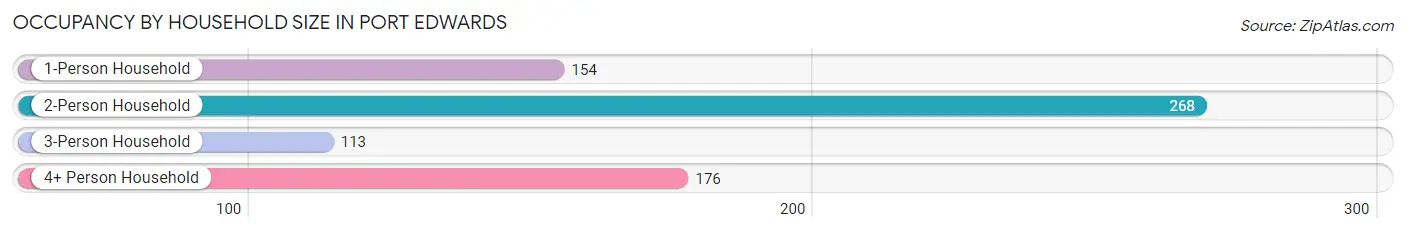
| Household Size | # Housing Units | % Housing Units |
| 1-Person Household | 154 | 21.7% |
| 2-Person Household | 268 | 37.7% |
| 3-Person Household | 113 | 15.9% |
| 4+ Person Household | 176 | 24.7% |
| Total Housing Units | 711 | 100.0% |
Occupancy by Ownership by Household Size in Port Edwards
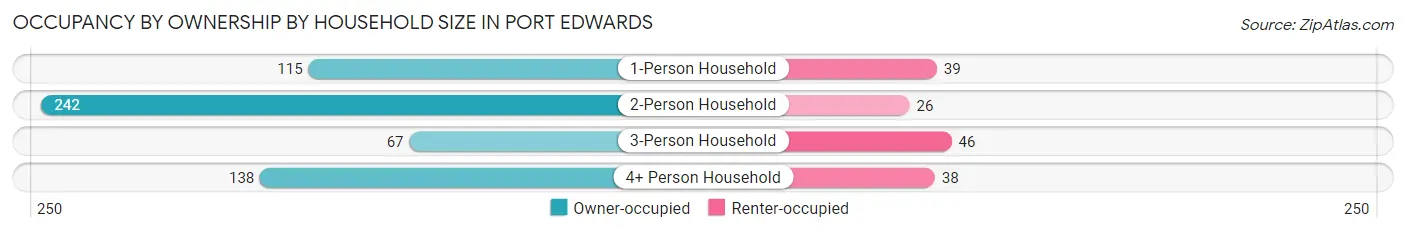
| Household Size | Owner-occupied | Renter-occupied |
| 1-Person Household | 115 (74.7%) | 39 (25.3%) |
| 2-Person Household | 242 (90.3%) | 26 (9.7%) |
| 3-Person Household | 67 (59.3%) | 46 (40.7%) |
| 4+ Person Household | 138 (78.4%) | 38 (21.6%) |
| Total Housing Units | 562 (79.0%) | 149 (21.0%) |
Occupancy by Educational Attainment in Port Edwards
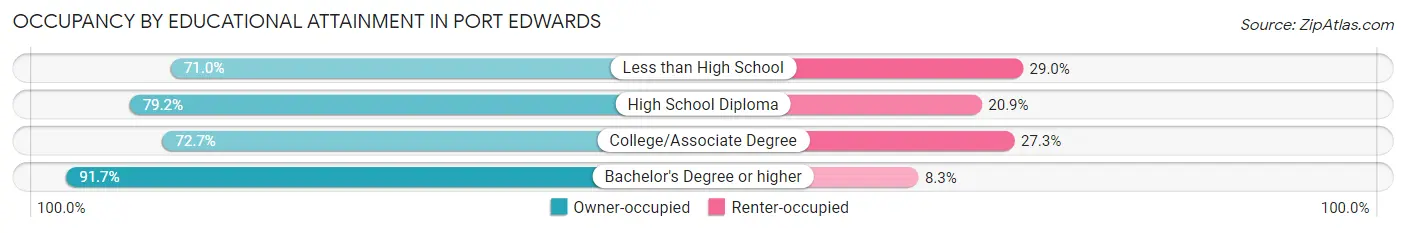
| Household Size | Owner-occupied | Renter-occupied |
| Less than High School | 22 (71.0%) | 9 (29.0%) |
| High School Diploma | 167 (79.1%) | 44 (20.8%) |
| College/Associate Degree | 218 (72.7%) | 82 (27.3%) |
| Bachelor's Degree or higher | 155 (91.7%) | 14 (8.3%) |
Occupancy by Age of Householder in Port Edwards
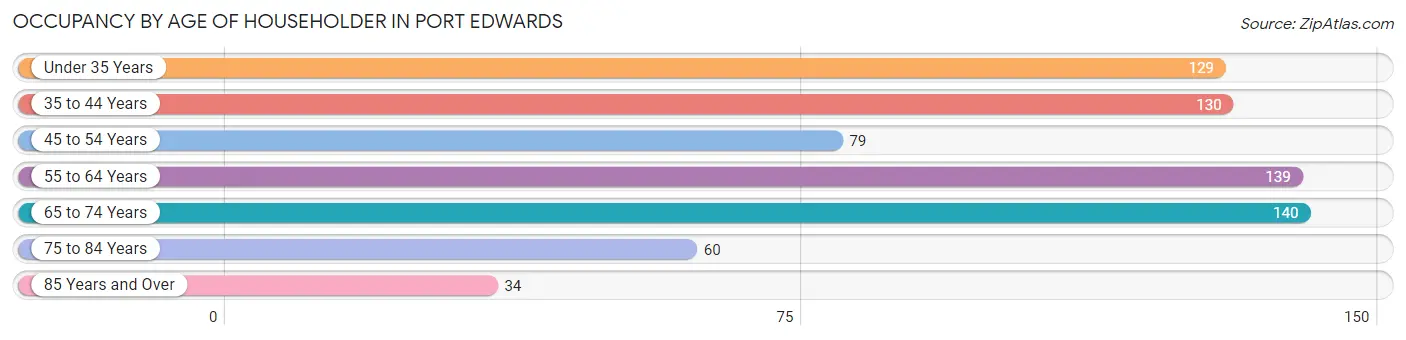
| Age Bracket | # Households | % Households |
| Under 35 Years | 129 | 18.1% |
| 35 to 44 Years | 130 | 18.3% |
| 45 to 54 Years | 79 | 11.1% |
| 55 to 64 Years | 139 | 19.6% |
| 65 to 74 Years | 140 | 19.7% |
| 75 to 84 Years | 60 | 8.4% |
| 85 Years and Over | 34 | 4.8% |
| Total | 711 | 100.0% |
Housing Finances in Port Edwards
Median Income by Occupancy in Port Edwards
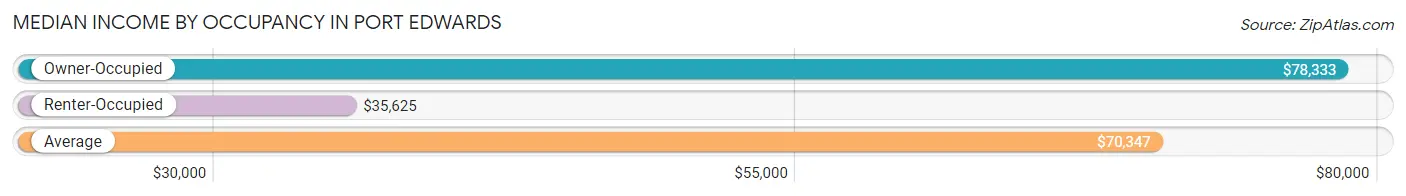
| Occupancy Type | # Households | Median Income |
| Owner-Occupied | 562 (79.0%) | $78,333 |
| Renter-Occupied | 149 (21.0%) | $35,625 |
| Average | 711 (100.0%) | $70,347 |
Occupancy by Householder Income Bracket in Port Edwards
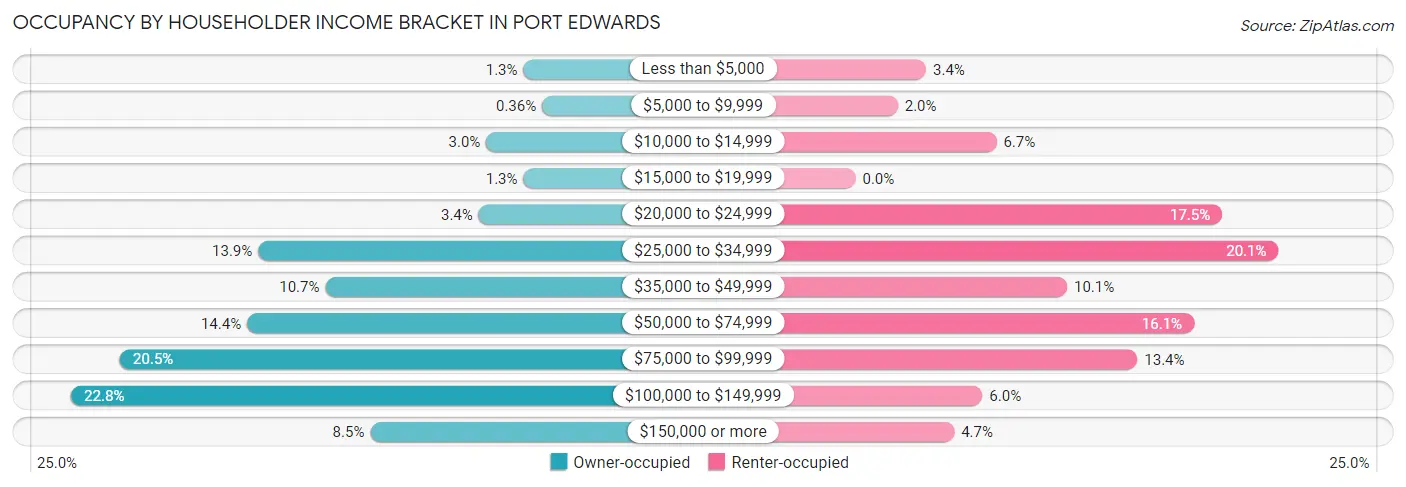
| Income Bracket | Owner-occupied | Renter-occupied |
| Less than $5,000 | 7 (1.3%) | 5 (3.4%) |
| $5,000 to $9,999 | 2 (0.4%) | 3 (2.0%) |
| $10,000 to $14,999 | 17 (3.0%) | 10 (6.7%) |
| $15,000 to $19,999 | 7 (1.3%) | 0 (0.0%) |
| $20,000 to $24,999 | 19 (3.4%) | 26 (17.4%) |
| $25,000 to $34,999 | 78 (13.9%) | 30 (20.1%) |
| $35,000 to $49,999 | 60 (10.7%) | 15 (10.1%) |
| $50,000 to $74,999 | 81 (14.4%) | 24 (16.1%) |
| $75,000 to $99,999 | 115 (20.5%) | 20 (13.4%) |
| $100,000 to $149,999 | 128 (22.8%) | 9 (6.0%) |
| $150,000 or more | 48 (8.5%) | 7 (4.7%) |
| Total | 562 (100.0%) | 149 (100.0%) |
Monthly Housing Cost Tiers in Port Edwards
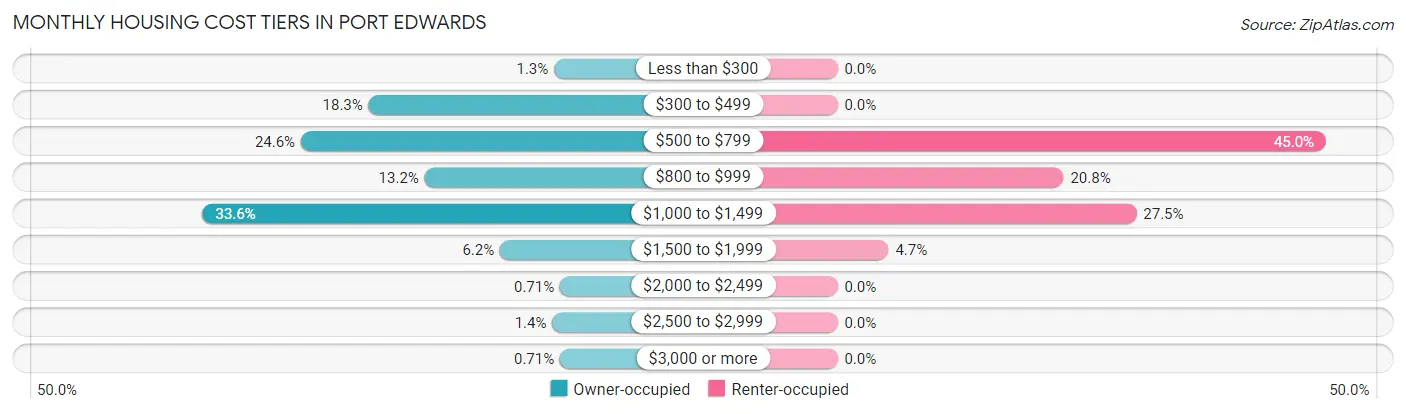
| Monthly Cost | Owner-occupied | Renter-occupied |
| Less than $300 | 7 (1.3%) | 0 (0.0%) |
| $300 to $499 | 103 (18.3%) | 0 (0.0%) |
| $500 to $799 | 138 (24.6%) | 67 (45.0%) |
| $800 to $999 | 74 (13.2%) | 31 (20.8%) |
| $1,000 to $1,499 | 189 (33.6%) | 41 (27.5%) |
| $1,500 to $1,999 | 35 (6.2%) | 7 (4.7%) |
| $2,000 to $2,499 | 4 (0.7%) | 0 (0.0%) |
| $2,500 to $2,999 | 8 (1.4%) | 0 (0.0%) |
| $3,000 or more | 4 (0.7%) | 0 (0.0%) |
| Total | 562 (100.0%) | 149 (100.0%) |
Physical Housing Characteristics in Port Edwards
Housing Structures in Port Edwards
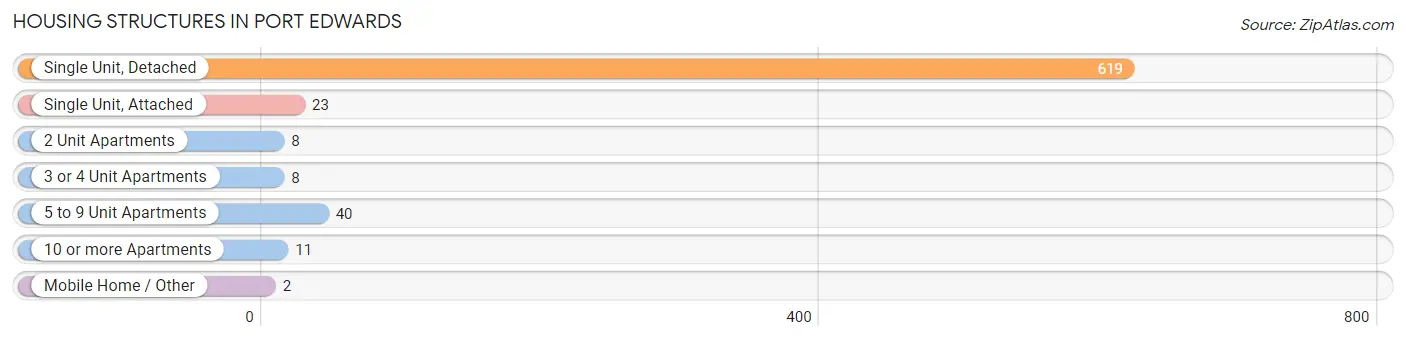
| Structure Type | # Housing Units | % Housing Units |
| Single Unit, Detached | 619 | 87.1% |
| Single Unit, Attached | 23 | 3.2% |
| 2 Unit Apartments | 8 | 1.1% |
| 3 or 4 Unit Apartments | 8 | 1.1% |
| 5 to 9 Unit Apartments | 40 | 5.6% |
| 10 or more Apartments | 11 | 1.5% |
| Mobile Home / Other | 2 | 0.3% |
| Total | 711 | 100.0% |
Housing Structures by Occupancy in Port Edwards
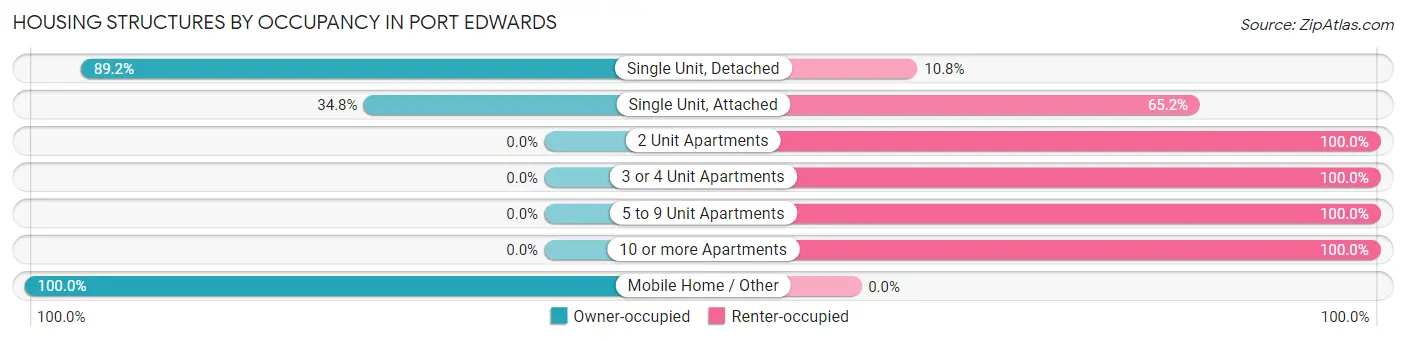
| Structure Type | Owner-occupied | Renter-occupied |
| Single Unit, Detached | 552 (89.2%) | 67 (10.8%) |
| Single Unit, Attached | 8 (34.8%) | 15 (65.2%) |
| 2 Unit Apartments | 0 (0.0%) | 8 (100.0%) |
| 3 or 4 Unit Apartments | 0 (0.0%) | 8 (100.0%) |
| 5 to 9 Unit Apartments | 0 (0.0%) | 40 (100.0%) |
| 10 or more Apartments | 0 (0.0%) | 11 (100.0%) |
| Mobile Home / Other | 2 (100.0%) | 0 (0.0%) |
| Total | 562 (79.0%) | 149 (21.0%) |
Housing Structures by Number of Rooms in Port Edwards
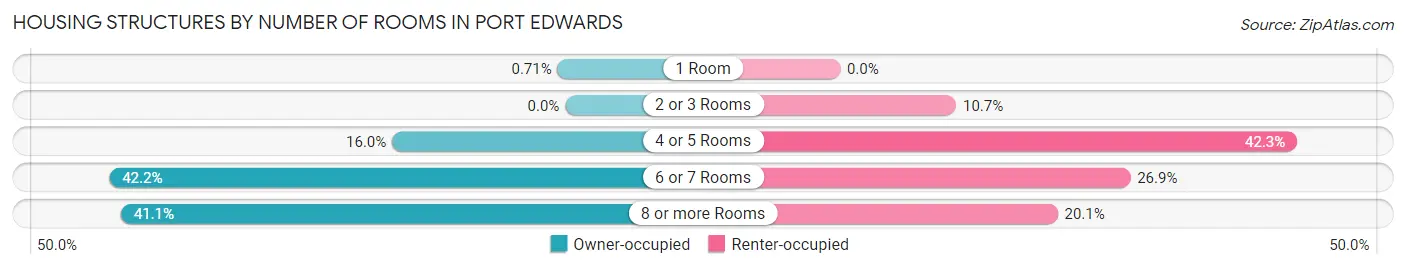
| Number of Rooms | Owner-occupied | Renter-occupied |
| 1 Room | 4 (0.7%) | 0 (0.0%) |
| 2 or 3 Rooms | 0 (0.0%) | 16 (10.7%) |
| 4 or 5 Rooms | 90 (16.0%) | 63 (42.3%) |
| 6 or 7 Rooms | 237 (42.2%) | 40 (26.9%) |
| 8 or more Rooms | 231 (41.1%) | 30 (20.1%) |
| Total | 562 (100.0%) | 149 (100.0%) |
Housing Structure by Heating Type in Port Edwards
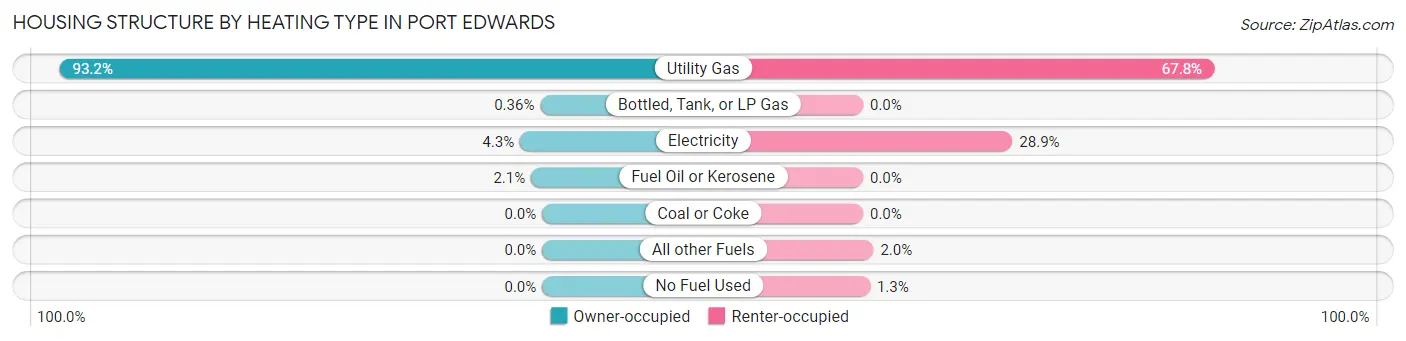
| Heating Type | Owner-occupied | Renter-occupied |
| Utility Gas | 524 (93.2%) | 101 (67.8%) |
| Bottled, Tank, or LP Gas | 2 (0.4%) | 0 (0.0%) |
| Electricity | 24 (4.3%) | 43 (28.9%) |
| Fuel Oil or Kerosene | 12 (2.1%) | 0 (0.0%) |
| Coal or Coke | 0 (0.0%) | 0 (0.0%) |
| All other Fuels | 0 (0.0%) | 3 (2.0%) |
| No Fuel Used | 0 (0.0%) | 2 (1.3%) |
| Total | 562 (100.0%) | 149 (100.0%) |
Household Vehicle Usage in Port Edwards
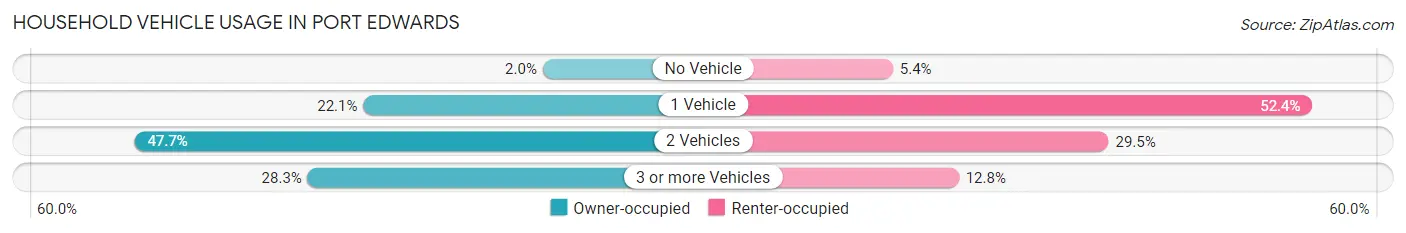
| Vehicles per Household | Owner-occupied | Renter-occupied |
| No Vehicle | 11 (2.0%) | 8 (5.4%) |
| 1 Vehicle | 124 (22.1%) | 78 (52.3%) |
| 2 Vehicles | 268 (47.7%) | 44 (29.5%) |
| 3 or more Vehicles | 159 (28.3%) | 19 (12.8%) |
| Total | 562 (100.0%) | 149 (100.0%) |
Real Estate & Mortgages in Port Edwards
Real Estate and Mortgage Overview in Port Edwards
| Characteristic | Without Mortgage | With Mortgage |
| Housing Units | 223 | 339 |
| Median Property Value | $135,400 | $115,100 |
| Median Household Income | $78,125 | $22 |
| Monthly Housing Costs | $504 | $4 |
| Real Estate Taxes | $2,774 | $0 |
Property Value by Mortgage Status in Port Edwards
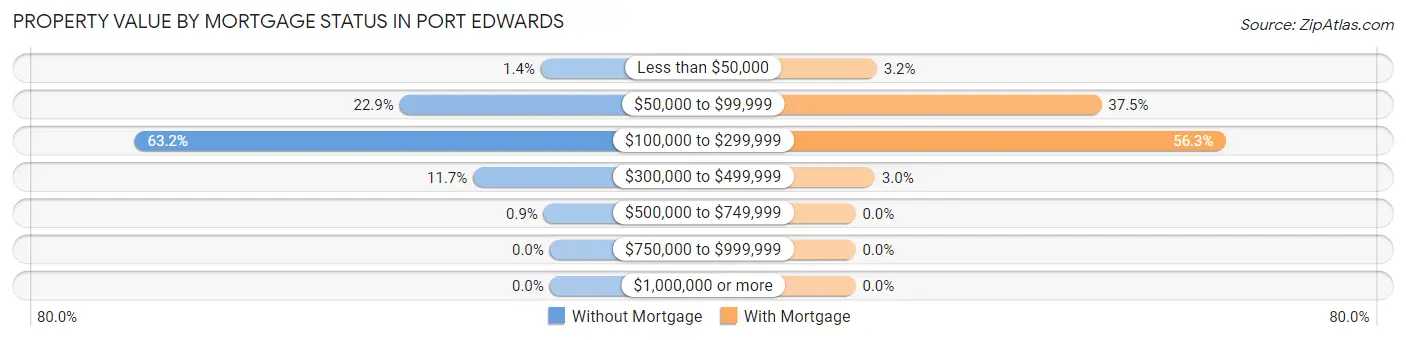
| Property Value | Without Mortgage | With Mortgage |
| Less than $50,000 | 3 (1.3%) | 11 (3.2%) |
| $50,000 to $99,999 | 51 (22.9%) | 127 (37.5%) |
| $100,000 to $299,999 | 141 (63.2%) | 191 (56.3%) |
| $300,000 to $499,999 | 26 (11.7%) | 10 (2.9%) |
| $500,000 to $749,999 | 2 (0.9%) | 0 (0.0%) |
| $750,000 to $999,999 | 0 (0.0%) | 0 (0.0%) |
| $1,000,000 or more | 0 (0.0%) | 0 (0.0%) |
| Total | 223 (100.0%) | 339 (100.0%) |
Household Income by Mortgage Status in Port Edwards
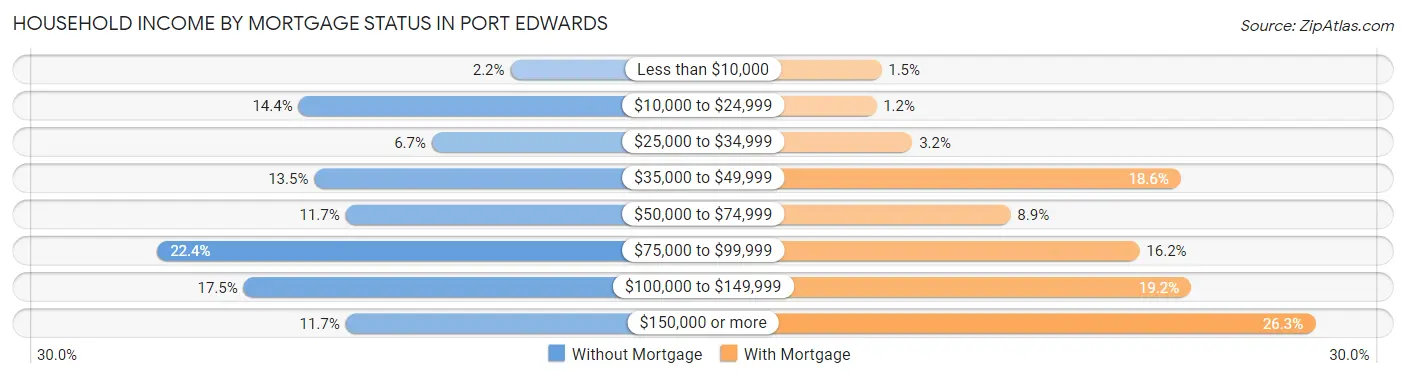
| Household Income | Without Mortgage | With Mortgage |
| Less than $10,000 | 5 (2.2%) | 5 (1.5%) |
| $10,000 to $24,999 | 32 (14.3%) | 4 (1.2%) |
| $25,000 to $34,999 | 15 (6.7%) | 11 (3.2%) |
| $35,000 to $49,999 | 30 (13.5%) | 63 (18.6%) |
| $50,000 to $74,999 | 26 (11.7%) | 30 (8.8%) |
| $75,000 to $99,999 | 50 (22.4%) | 55 (16.2%) |
| $100,000 to $149,999 | 39 (17.5%) | 65 (19.2%) |
| $150,000 or more | 26 (11.7%) | 89 (26.3%) |
| Total | 223 (100.0%) | 339 (100.0%) |
Property Value to Household Income Ratio in Port Edwards
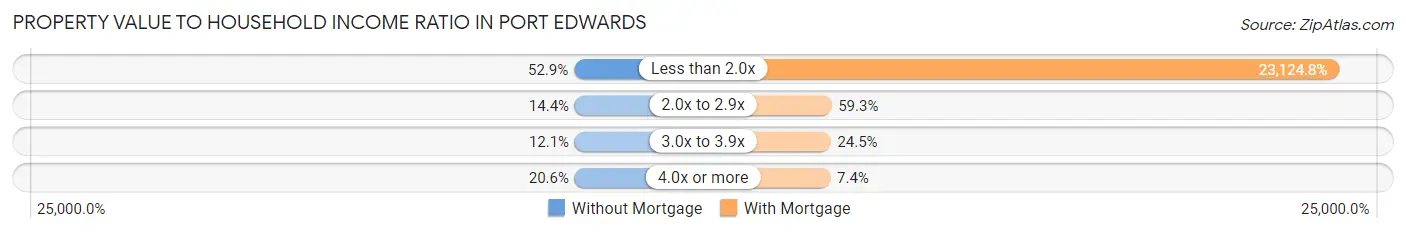
| Value-to-Income Ratio | Without Mortgage | With Mortgage |
| Less than 2.0x | 118 (52.9%) | 78,393 (23,124.8%) |
| 2.0x to 2.9x | 32 (14.3%) | 201 (59.3%) |
| 3.0x to 3.9x | 27 (12.1%) | 83 (24.5%) |
| 4.0x or more | 46 (20.6%) | 25 (7.4%) |
| Total | 223 (100.0%) | 339 (100.0%) |
Real Estate Taxes by Mortgage Status in Port Edwards
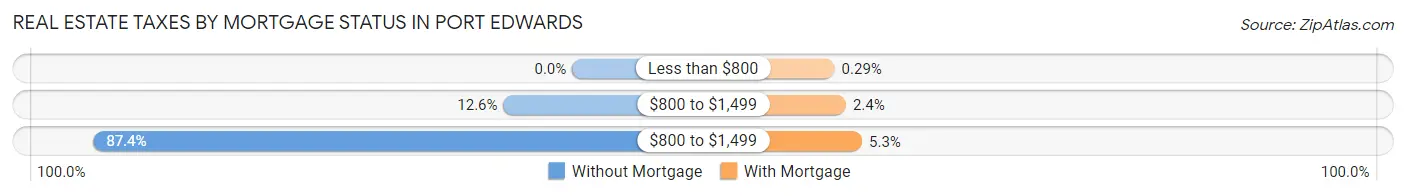
| Property Taxes | Without Mortgage | With Mortgage |
| Less than $800 | 0 (0.0%) | 1 (0.3%) |
| $800 to $1,499 | 28 (12.6%) | 8 (2.4%) |
| $800 to $1,499 | 195 (87.4%) | 18 (5.3%) |
| Total | 223 (100.0%) | 339 (100.0%) |
Health & Disability in Port Edwards
Health Insurance Coverage by Age in Port Edwards
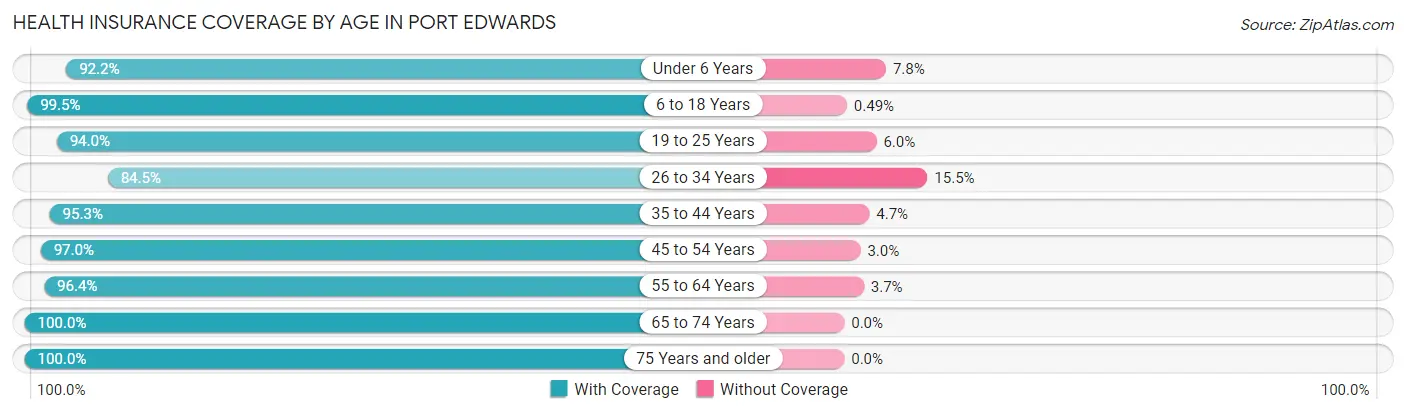
| Age Bracket | With Coverage | Without Coverage |
| Under 6 Years | 95 (92.2%) | 8 (7.8%) |
| 6 to 18 Years | 404 (99.5%) | 2 (0.5%) |
| 19 to 25 Years | 141 (94.0%) | 9 (6.0%) |
| 26 to 34 Years | 109 (84.5%) | 20 (15.5%) |
| 35 to 44 Years | 204 (95.3%) | 10 (4.7%) |
| 45 to 54 Years | 161 (97.0%) | 5 (3.0%) |
| 55 to 64 Years | 211 (96.4%) | 8 (3.6%) |
| 65 to 74 Years | 220 (100.0%) | 0 (0.0%) |
| 75 Years and older | 150 (100.0%) | 0 (0.0%) |
| Total | 1,695 (96.5%) | 62 (3.5%) |
Health Insurance Coverage by Citizenship Status in Port Edwards
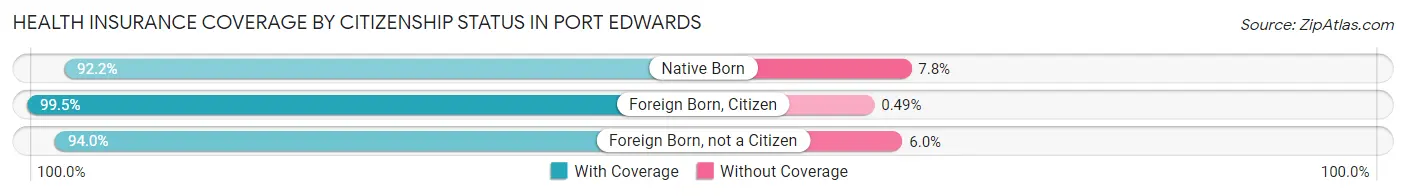
| Citizenship Status | With Coverage | Without Coverage |
| Native Born | 95 (92.2%) | 8 (7.8%) |
| Foreign Born, Citizen | 404 (99.5%) | 2 (0.5%) |
| Foreign Born, not a Citizen | 141 (94.0%) | 9 (6.0%) |
Health Insurance Coverage by Household Income in Port Edwards
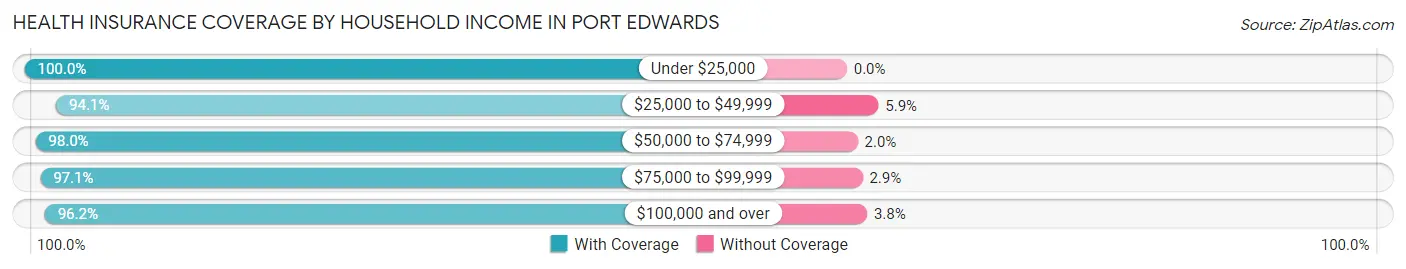
| Household Income | With Coverage | Without Coverage |
| Under $25,000 | 190 (100.0%) | 0 (0.0%) |
| $25,000 to $49,999 | 414 (94.1%) | 26 (5.9%) |
| $50,000 to $74,999 | 241 (98.0%) | 5 (2.0%) |
| $75,000 to $99,999 | 265 (97.1%) | 8 (2.9%) |
| $100,000 and over | 585 (96.2%) | 23 (3.8%) |
Public vs Private Health Insurance Coverage by Age in Port Edwards
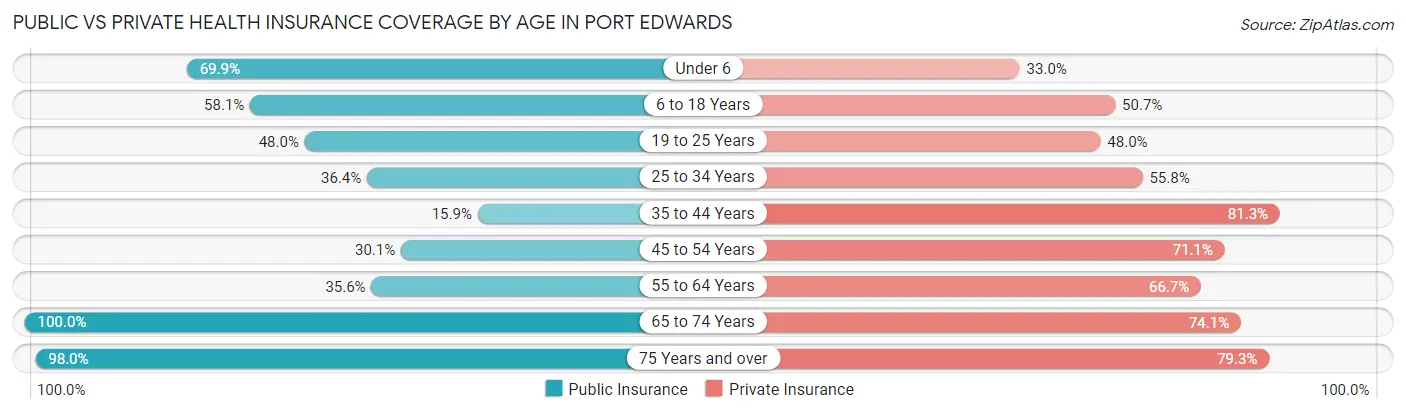
| Age Bracket | Public Insurance | Private Insurance |
| Under 6 | 72 (69.9%) | 34 (33.0%) |
| 6 to 18 Years | 236 (58.1%) | 206 (50.7%) |
| 19 to 25 Years | 72 (48.0%) | 72 (48.0%) |
| 25 to 34 Years | 47 (36.4%) | 72 (55.8%) |
| 35 to 44 Years | 34 (15.9%) | 174 (81.3%) |
| 45 to 54 Years | 50 (30.1%) | 118 (71.1%) |
| 55 to 64 Years | 78 (35.6%) | 146 (66.7%) |
| 65 to 74 Years | 220 (100.0%) | 163 (74.1%) |
| 75 Years and over | 147 (98.0%) | 119 (79.3%) |
| Total | 956 (54.4%) | 1,104 (62.8%) |
Disability Status by Sex by Age in Port Edwards
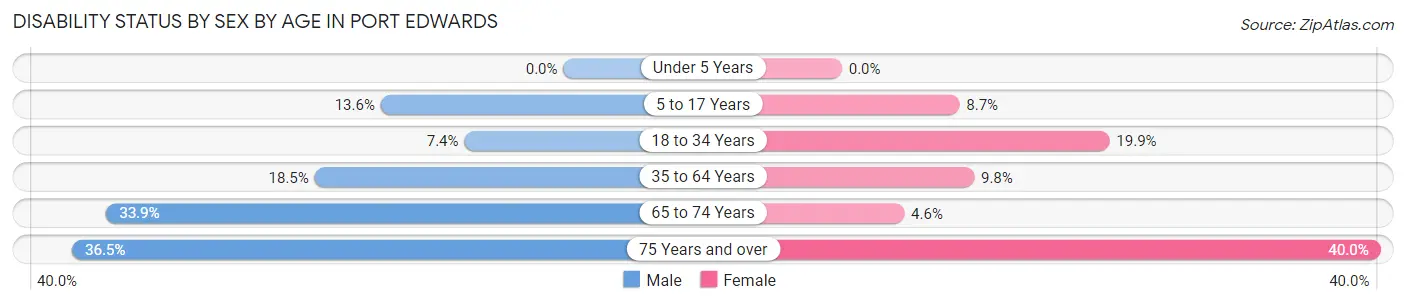
| Age Bracket | Male | Female |
| Under 5 Years | 0 (0.0%) | 0 (0.0%) |
| 5 to 17 Years | 24 (13.6%) | 20 (8.7%) |
| 18 to 34 Years | 10 (7.3%) | 31 (19.9%) |
| 35 to 64 Years | 58 (18.5%) | 28 (9.8%) |
| 65 to 74 Years | 38 (33.9%) | 5 (4.6%) |
| 75 Years and over | 31 (36.5%) | 26 (40.0%) |
Disability Class by Sex by Age in Port Edwards
Disability Class: Hearing Difficulty
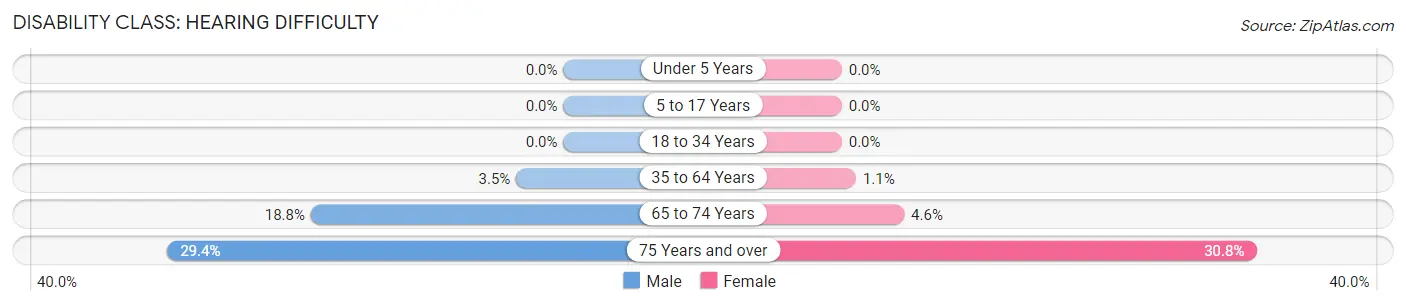
| Age Bracket | Male | Female |
| Under 5 Years | 0 (0.0%) | 0 (0.0%) |
| 5 to 17 Years | 0 (0.0%) | 0 (0.0%) |
| 18 to 34 Years | 0 (0.0%) | 0 (0.0%) |
| 35 to 64 Years | 11 (3.5%) | 3 (1.1%) |
| 65 to 74 Years | 21 (18.8%) | 5 (4.6%) |
| 75 Years and over | 25 (29.4%) | 20 (30.8%) |
Disability Class: Vision Difficulty
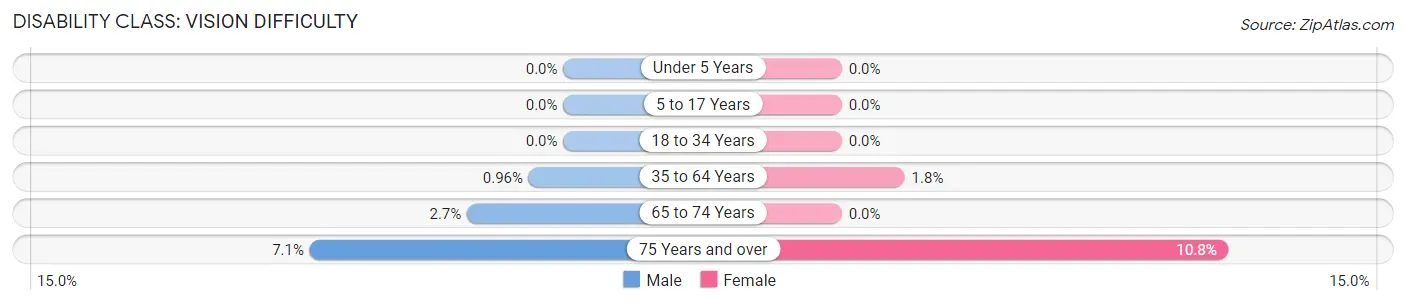
| Age Bracket | Male | Female |
| Under 5 Years | 0 (0.0%) | 0 (0.0%) |
| 5 to 17 Years | 0 (0.0%) | 0 (0.0%) |
| 18 to 34 Years | 0 (0.0%) | 0 (0.0%) |
| 35 to 64 Years | 3 (1.0%) | 5 (1.8%) |
| 65 to 74 Years | 3 (2.7%) | 0 (0.0%) |
| 75 Years and over | 6 (7.1%) | 7 (10.8%) |
Disability Class: Cognitive Difficulty
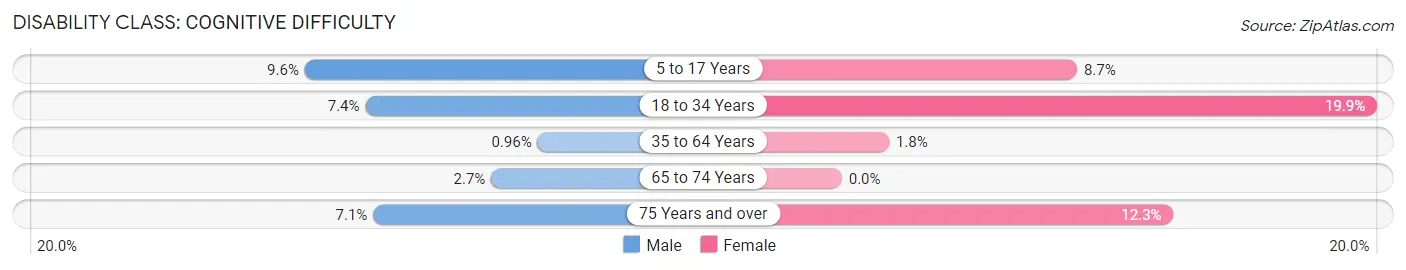
| Age Bracket | Male | Female |
| 5 to 17 Years | 17 (9.6%) | 20 (8.7%) |
| 18 to 34 Years | 10 (7.3%) | 31 (19.9%) |
| 35 to 64 Years | 3 (1.0%) | 5 (1.8%) |
| 65 to 74 Years | 3 (2.7%) | 0 (0.0%) |
| 75 Years and over | 6 (7.1%) | 8 (12.3%) |
Disability Class: Ambulatory Difficulty
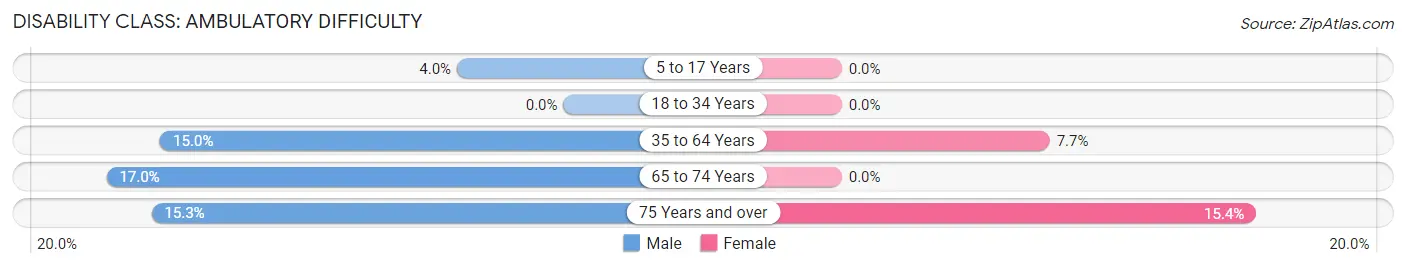
| Age Bracket | Male | Female |
| 5 to 17 Years | 7 (4.0%) | 0 (0.0%) |
| 18 to 34 Years | 0 (0.0%) | 0 (0.0%) |
| 35 to 64 Years | 47 (15.0%) | 22 (7.7%) |
| 65 to 74 Years | 19 (17.0%) | 0 (0.0%) |
| 75 Years and over | 13 (15.3%) | 10 (15.4%) |
Disability Class: Self-Care Difficulty
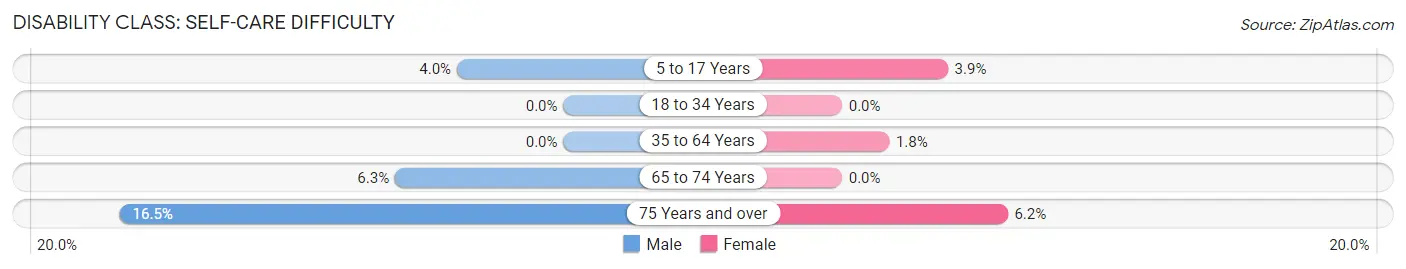
| Age Bracket | Male | Female |
| 5 to 17 Years | 7 (4.0%) | 9 (3.9%) |
| 18 to 34 Years | 0 (0.0%) | 0 (0.0%) |
| 35 to 64 Years | 0 (0.0%) | 5 (1.8%) |
| 65 to 74 Years | 7 (6.2%) | 0 (0.0%) |
| 75 Years and over | 14 (16.5%) | 4 (6.1%) |
Technology Access in Port Edwards
Computing Device Access in Port Edwards
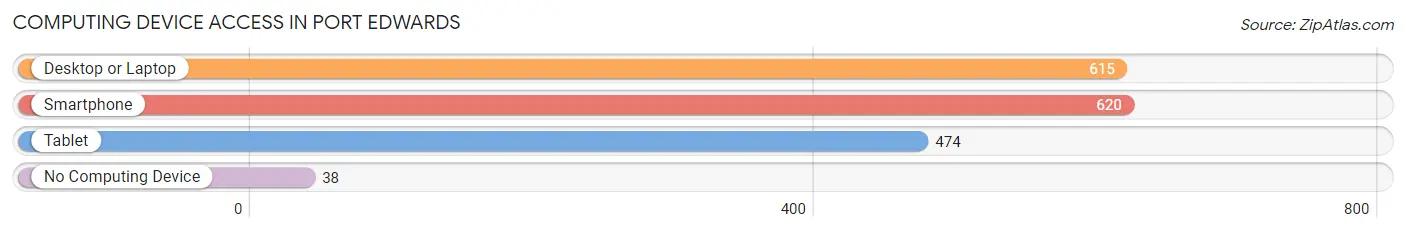
| Device Type | # Households | % Households |
| Desktop or Laptop | 615 | 86.5% |
| Smartphone | 620 | 87.2% |
| Tablet | 474 | 66.7% |
| No Computing Device | 38 | 5.3% |
| Total | 711 | 100.0% |
Internet Access in Port Edwards
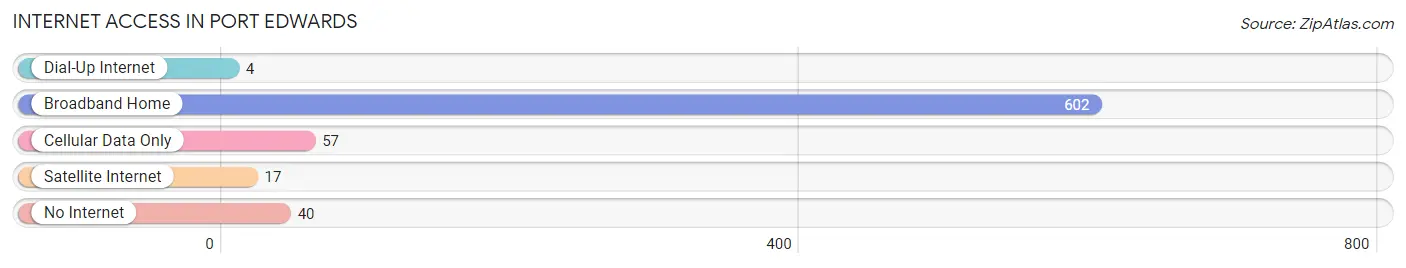
| Internet Type | # Households | % Households |
| Dial-Up Internet | 4 | 0.6% |
| Broadband Home | 602 | 84.7% |
| Cellular Data Only | 57 | 8.0% |
| Satellite Internet | 17 | 2.4% |
| No Internet | 40 | 5.6% |
| Total | 711 | 100.0% |
Port Edwards Summary
History
Port Edwards is a village located in Wood County, Wisconsin, United States. It is situated on the Wisconsin River, near the city of Wisconsin Rapids. The village was founded in 1876 by William Edwards, who named it after himself. The village was incorporated in 1891.
The village of Port Edwards has a long and interesting history. The first settlers arrived in the area in the early 1800s, and the village was officially founded in 1876. The village was named after William Edwards, who was the first settler in the area.
The village was originally a logging and lumbering town, and the Wisconsin River was used to transport logs to the sawmills. The village also had a number of other industries, including a brickyard, a flour mill, a cheese factory, and a canning factory.
In the early 1900s, the village began to grow and develop. The first school was built in 1906, and the first library was established in 1908. The village also had a number of churches, including the Methodist Episcopal Church, the Congregational Church, and the Catholic Church.
The village continued to grow and develop throughout the 20th century. In the 1950s, the village was home to a number of industries, including a paper mill, a furniture factory, and a canning factory. The village also had a number of stores, including a grocery store, a hardware store, and a drug store.
Geography
Port Edwards is located in Wood County, Wisconsin, United States. It is situated on the Wisconsin River, near the city of Wisconsin Rapids. The village is located in the Central Plain region of Wisconsin, and is surrounded by rolling hills and forests. The village is located at an elevation of 845 feet above sea level.
The village has a total area of 1.2 square miles, all of which is land. The village is located in the Central Time Zone, and is in the Central Standard Time Zone.
Economy
The economy of Port Edwards is largely based on tourism and manufacturing. The village is home to a number of tourist attractions, including the Wisconsin River, the Port Edwards Historical Museum, and the Port Edwards Nature Center. The village also has a number of manufacturing companies, including a paper mill, a furniture factory, and a canning factory.
The village also has a number of stores, including a grocery store, a hardware store, and a drug store. The village also has a number of restaurants, including a pizza parlor, a Mexican restaurant, and a Chinese restaurant.
Demographics
As of the 2010 census, the village of Port Edwards had a population of 1,845. The population density was 1,521.7 people per square mile. The racial makeup of the village was 97.2% White, 0.3% African American, 0.2% Native American, 0.3% Asian, 0.1% Pacific Islander, 0.7% from other races, and 1.2% from two or more races. Hispanic or Latino of any race were 1.7% of the population.
The median income for a household in the village was $41,250, and the median income for a family was $50,000. The per capita income for the village was $20,845. About 8.2% of families and 10.2% of the population were below the poverty line, including 14.2% of those under age 18 and 5.2% of those age 65 or over.
Common Questions
What is Per Capita Income in Port Edwards?
Per Capita income in Port Edwards is $30,963.
What is the Median Family Income in Port Edwards?
Median Family Income in Port Edwards is $80,625.
What is the Median Household income in Port Edwards?
Median Household Income in Port Edwards is $70,347.
What is Income or Wage Gap in Port Edwards?
Income or Wage Gap in Port Edwards is 43.9%.
Women in Port Edwards earn 56.1 cents for every dollar earned by a man.
What is Inequality or Gini Index in Port Edwards?
Inequality or Gini Index in Port Edwards is 0.39.
What is the Total Population of Port Edwards?
Total Population of Port Edwards is 1,818.
What is the Total Male Population of Port Edwards?
Total Male Population of Port Edwards is 878.
What is the Total Female Population of Port Edwards?
Total Female Population of Port Edwards is 940.
What is the Ratio of Males per 100 Females in Port Edwards?
There are 93.40 Males per 100 Females in Port Edwards.
What is the Ratio of Females per 100 Males in Port Edwards?
There are 107.06 Females per 100 Males in Port Edwards.
What is the Median Population Age in Port Edwards?
Median Population Age in Port Edwards is 40.5 Years.
What is the Average Family Size in Port Edwards
Average Family Size in Port Edwards is 2.8 People.
What is the Average Household Size in Port Edwards
Average Household Size in Port Edwards is 2.5 People.
How Large is the Labor Force in Port Edwards?
There are 745 People in the Labor Forcein in Port Edwards.
What is the Percentage of People in the Labor Force in Port Edwards?
53.2% of People are in the Labor Force in Port Edwards.
What is the Unemployment Rate in Port Edwards?
Unemployment Rate in Port Edwards is 2.8%.