Platteville, WI Map & Demographics
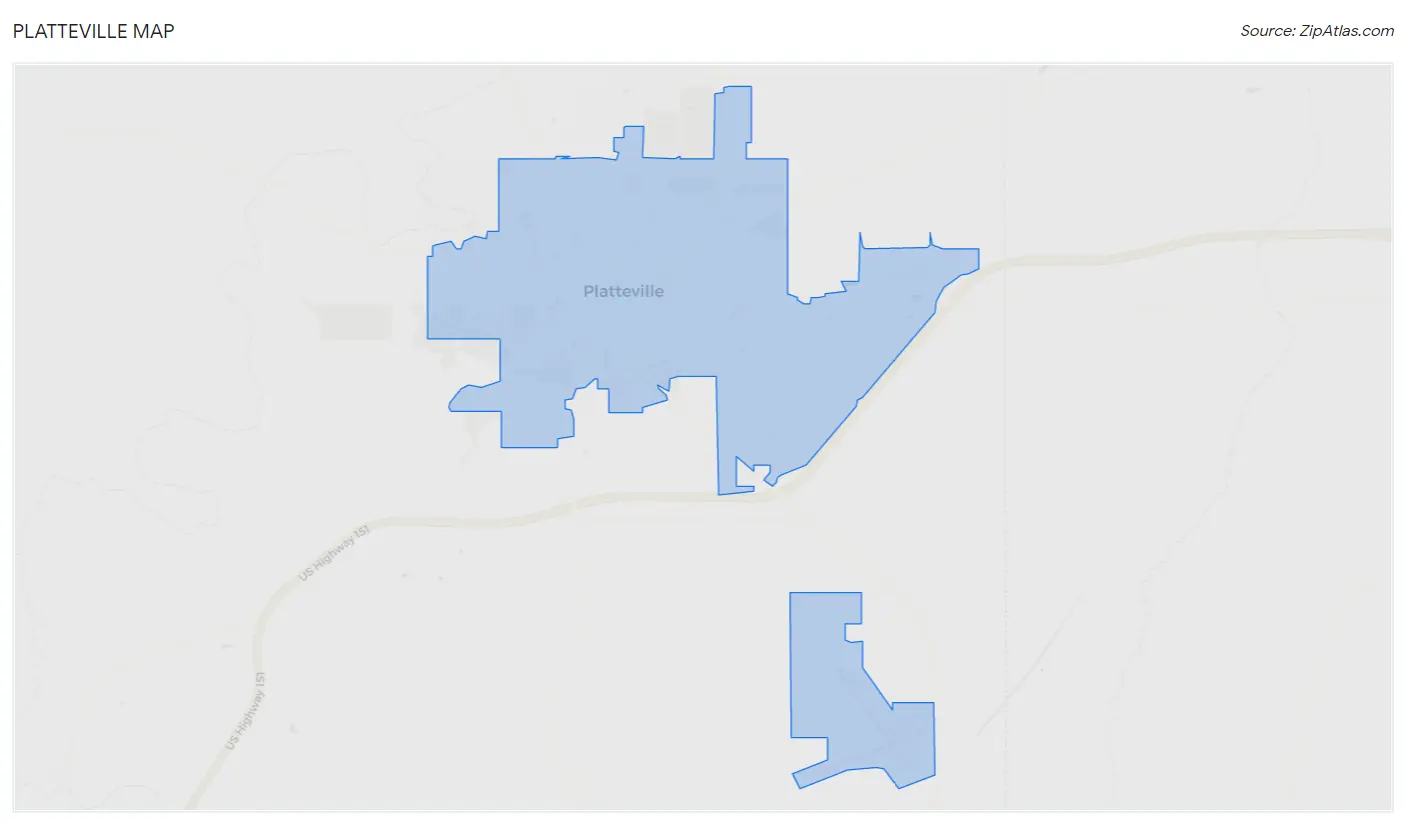
Platteville Map
Platteville Overview
$24,992
PER CAPITA INCOME
$90,119
AVG FAMILY INCOME
$46,554
AVG HOUSEHOLD INCOME
14.3%
WAGE / INCOME GAP [ % ]
85.7¢/ $1
WAGE / INCOME GAP [ $ ]
0.46
INEQUALITY / GINI INDEX
11,543
TOTAL POPULATION
6,393
MALE POPULATION
5,150
FEMALE POPULATION
124.14
MALES / 100 FEMALES
80.56
FEMALES / 100 MALES
22.9
MEDIAN AGE
3.0
AVG FAMILY SIZE
2.2
AVG HOUSEHOLD SIZE
6,675
LABOR FORCE [ PEOPLE ]
65.2%
PERCENT IN LABOR FORCE
4.2%
UNEMPLOYMENT RATE
Platteville Zip Codes
Platteville Area Codes
Income in Platteville
Income Overview in Platteville
Per Capita Income in Platteville is $24,992, while median incomes of families and households are $90,119 and $46,554 respectively.
| Characteristic | Number | Measure |
| Per Capita Income | 11,543 | $24,992 |
| Median Family Income | 1,576 | $90,119 |
| Mean Family Income | 1,576 | $89,775 |
| Median Household Income | 4,109 | $46,554 |
| Mean Household Income | 4,109 | $65,660 |
| Income Deficit | 1,576 | $0 |
| Wage / Income Gap (%) | 11,543 | 14.28% |
| Wage / Income Gap ($) | 11,543 | 85.72¢ per $1 |
| Gini / Inequality Index | 11,543 | 0.46 |
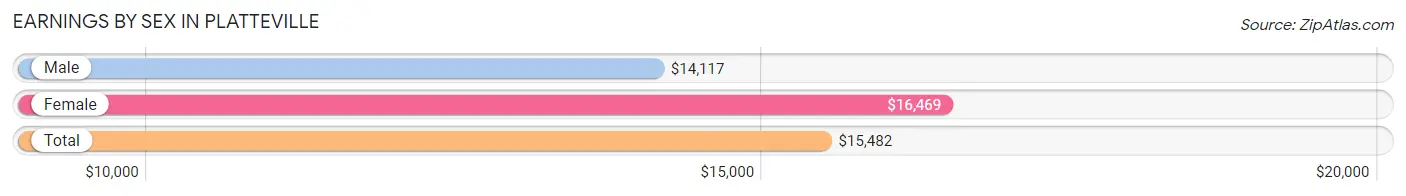
Earnings by Sex in Platteville
Average Earnings in Platteville are $15,482, $14,117 for men and $16,469 for women, a difference of 14.3%.
| Sex | Number | Average Earnings |
| Male | 4,639 (57.5%) | $14,117 |
| Female | 3,436 (42.5%) | $16,469 |
| Total | 8,075 (100.0%) | $15,482 |
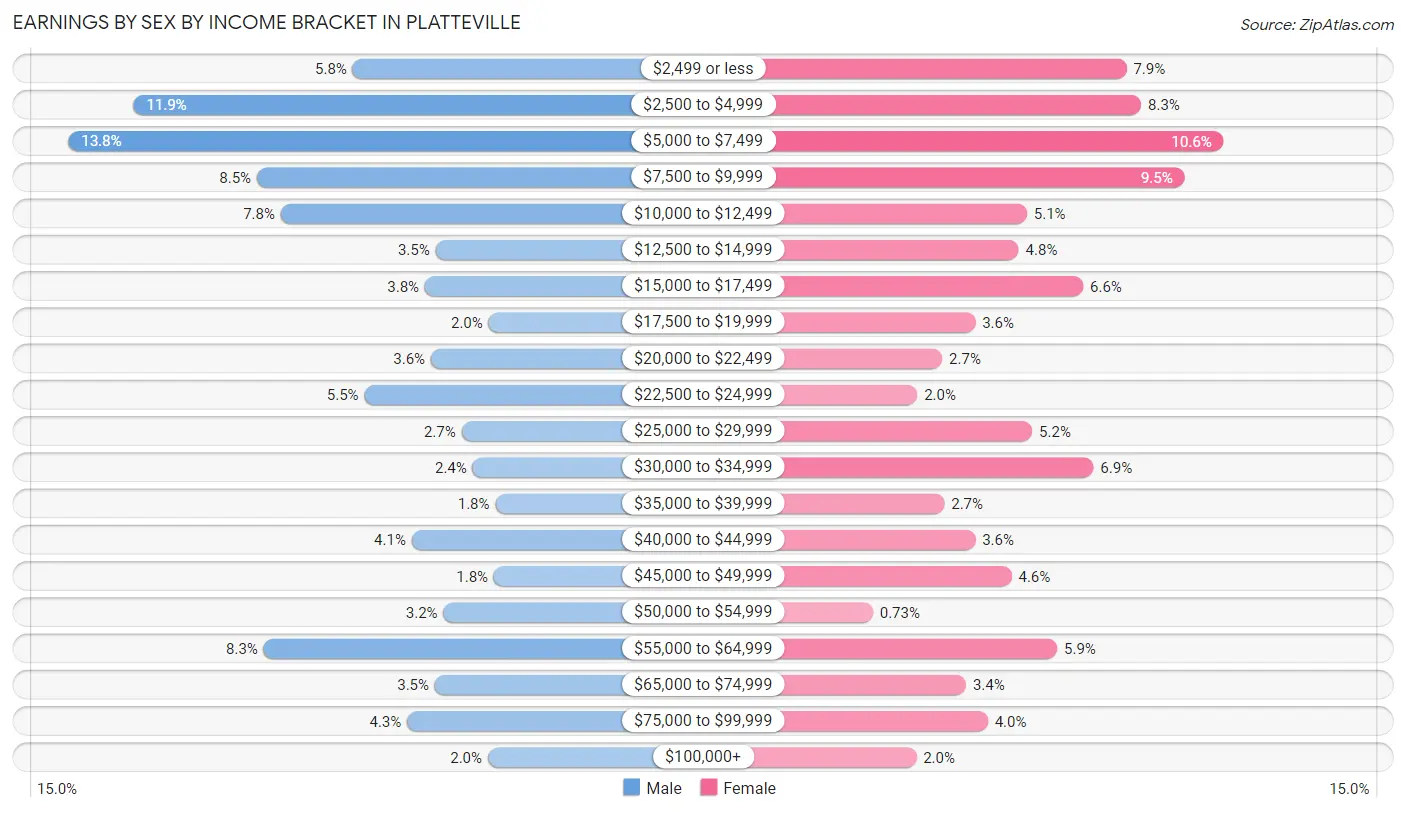
Earnings by Sex by Income Bracket in Platteville
The most common earnings brackets in Platteville are $5,000 to $7,499 for men (639 | 13.8%) and $5,000 to $7,499 for women (364 | 10.6%).
| Income | Male | Female |
| $2,499 or less | 268 (5.8%) | 270 (7.9%) |
| $2,500 to $4,999 | 554 (11.9%) | 284 (8.3%) |
| $5,000 to $7,499 | 639 (13.8%) | 364 (10.6%) |
| $7,500 to $9,999 | 393 (8.5%) | 326 (9.5%) |
| $10,000 to $12,499 | 362 (7.8%) | 174 (5.1%) |
| $12,500 to $14,999 | 160 (3.5%) | 166 (4.8%) |
| $15,000 to $17,499 | 174 (3.7%) | 228 (6.6%) |
| $17,500 to $19,999 | 91 (2.0%) | 124 (3.6%) |
| $20,000 to $22,499 | 166 (3.6%) | 92 (2.7%) |
| $22,500 to $24,999 | 253 (5.4%) | 68 (2.0%) |
| $25,000 to $29,999 | 126 (2.7%) | 179 (5.2%) |
| $30,000 to $34,999 | 112 (2.4%) | 238 (6.9%) |
| $35,000 to $39,999 | 82 (1.8%) | 94 (2.7%) |
| $40,000 to $44,999 | 191 (4.1%) | 124 (3.6%) |
| $45,000 to $49,999 | 84 (1.8%) | 159 (4.6%) |
| $50,000 to $54,999 | 150 (3.2%) | 25 (0.7%) |
| $55,000 to $64,999 | 384 (8.3%) | 203 (5.9%) |
| $65,000 to $74,999 | 161 (3.5%) | 115 (3.4%) |
| $75,000 to $99,999 | 197 (4.3%) | 136 (4.0%) |
| $100,000+ | 92 (2.0%) | 67 (1.9%) |
| Total | 4,639 (100.0%) | 3,436 (100.0%) |
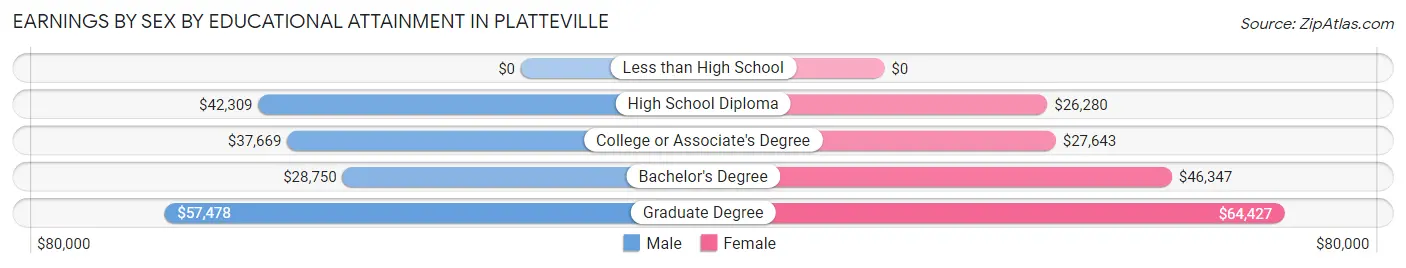
Earnings by Sex by Educational Attainment in Platteville
Average earnings in Platteville are $42,705 for men and $39,390 for women, a difference of 7.8%. Men with an educational attainment of graduate degree enjoy the highest average annual earnings of $57,478, while those with bachelor's degree education earn the least with $28,750. Women with an educational attainment of graduate degree earn the most with the average annual earnings of $64,427, while those with high school diploma education have the smallest earnings of $26,280.
| Educational Attainment | Male Income | Female Income |
| Less than High School | - | - |
| High School Diploma | $42,309 | $26,280 |
| College or Associate's Degree | $37,669 | $27,643 |
| Bachelor's Degree | $28,750 | $46,347 |
| Graduate Degree | $57,478 | $64,427 |
| Total | $42,705 | $39,390 |
Family Income in Platteville
Family Income Brackets in Platteville
According to the Platteville family income data, there are 511 families falling into the $100,000 to $149,999 income range, which is the most common income bracket and makes up 32.4% of all families.
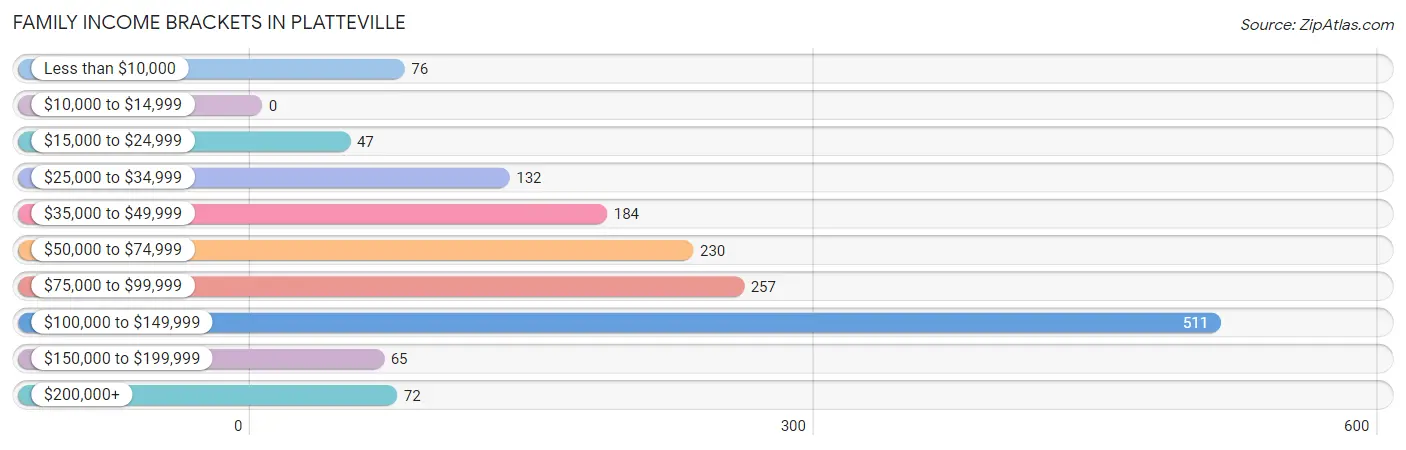
| Income Bracket | # Families | % Families |
| Less than $10,000 | 76 | 4.8% |
| $10,000 to $14,999 | 0 | 0.0% |
| $15,000 to $24,999 | 47 | 3.0% |
| $25,000 to $34,999 | 132 | 8.4% |
| $35,000 to $49,999 | 184 | 11.7% |
| $50,000 to $74,999 | 230 | 14.6% |
| $75,000 to $99,999 | 257 | 16.3% |
| $100,000 to $149,999 | 511 | 32.4% |
| $150,000 to $199,999 | 65 | 4.1% |
| $200,000+ | 72 | 4.6% |
Family Income by Famaliy Size in Platteville
6-person families (33 | 2.1%) account for the highest median family income in Platteville with $146,339 per family, while 2-person families (777 | 49.3%) have the highest median income of $39,946 per family member.
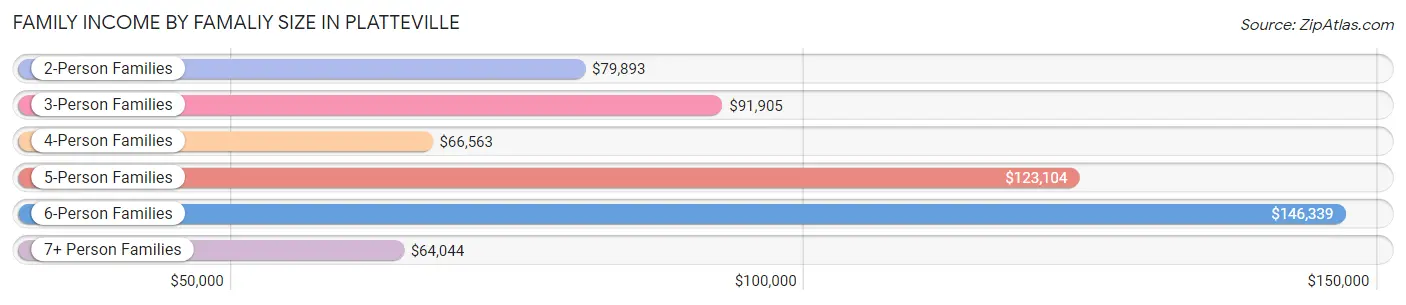
| Income Bracket | # Families | Median Income |
| 2-Person Families | 777 (49.3%) | $79,893 |
| 3-Person Families | 338 (21.4%) | $91,905 |
| 4-Person Families | 294 (18.6%) | $66,563 |
| 5-Person Families | 91 (5.8%) | $123,104 |
| 6-Person Families | 33 (2.1%) | $146,339 |
| 7+ Person Families | 43 (2.7%) | $64,044 |
| Total | 1,576 (100.0%) | $90,119 |
Family Income by Number of Earners in Platteville
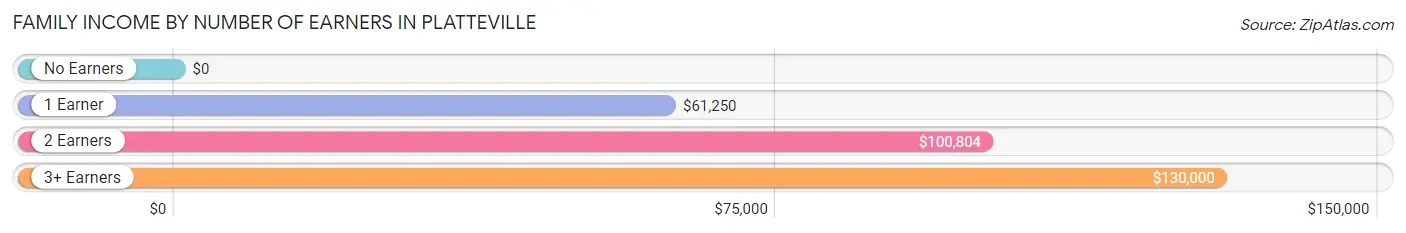
| Number of Earners | # Families | Median Income |
| No Earners | 122 (7.7%) | $0 |
| 1 Earner | 637 (40.4%) | $61,250 |
| 2 Earners | 721 (45.8%) | $100,804 |
| 3+ Earners | 96 (6.1%) | $130,000 |
| Total | 1,576 (100.0%) | $90,119 |
Household Income in Platteville
Household Income Brackets in Platteville
With 744 households falling in the category, the $50,000 to $74,999 income range is the most frequent in Platteville, accounting for 18.1% of all households. In contrast, only 90 households (2.2%) fall into the $200,000+ income bracket, making it the least populous group.
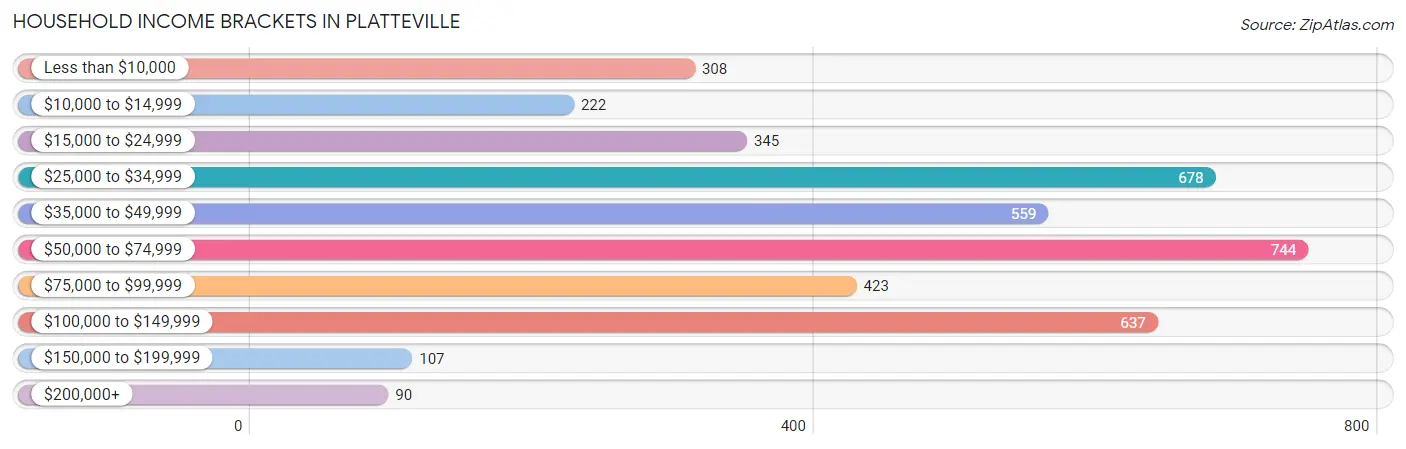
| Income Bracket | # Households | % Households |
| Less than $10,000 | 308 | 7.5% |
| $10,000 to $14,999 | 222 | 5.4% |
| $15,000 to $24,999 | 345 | 8.4% |
| $25,000 to $34,999 | 678 | 16.5% |
| $35,000 to $49,999 | 559 | 13.6% |
| $50,000 to $74,999 | 744 | 18.1% |
| $75,000 to $99,999 | 423 | 10.3% |
| $100,000 to $149,999 | 637 | 15.5% |
| $150,000 to $199,999 | 107 | 2.6% |
| $200,000+ | 90 | 2.2% |
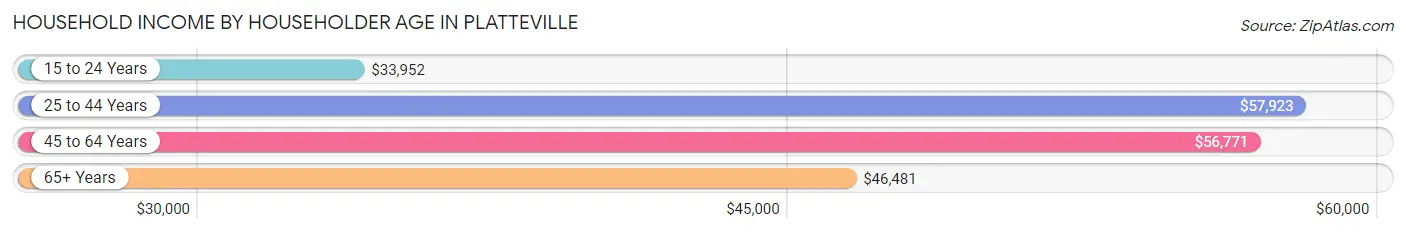
Household Income by Householder Age in Platteville
The median household income in Platteville is $46,554, with the highest median household income of $57,923 found in the 25 to 44 years age bracket for the primary householder. A total of 1,296 households (31.5%) fall into this category. Meanwhile, the 15 to 24 years age bracket for the primary householder has the lowest median household income of $33,952, with 1,017 households (24.7%) in this group.
| Income Bracket | # Households | Median Income |
| 15 to 24 Years | 1,017 (24.7%) | $33,952 |
| 25 to 44 Years | 1,296 (31.5%) | $57,923 |
| 45 to 64 Years | 1,026 (25.0%) | $56,771 |
| 65+ Years | 770 (18.7%) | $46,481 |
| Total | 4,109 (100.0%) | $46,554 |
Poverty in Platteville
Income Below Poverty by Sex and Age in Platteville
With 28.9% poverty level for males and 22.7% for females among the residents of Platteville, 18 to 24 year old males and 18 to 24 year old females are the most vulnerable to poverty, with 1,007 males (60.9%) and 603 females (54.0%) in their respective age groups living below the poverty level.
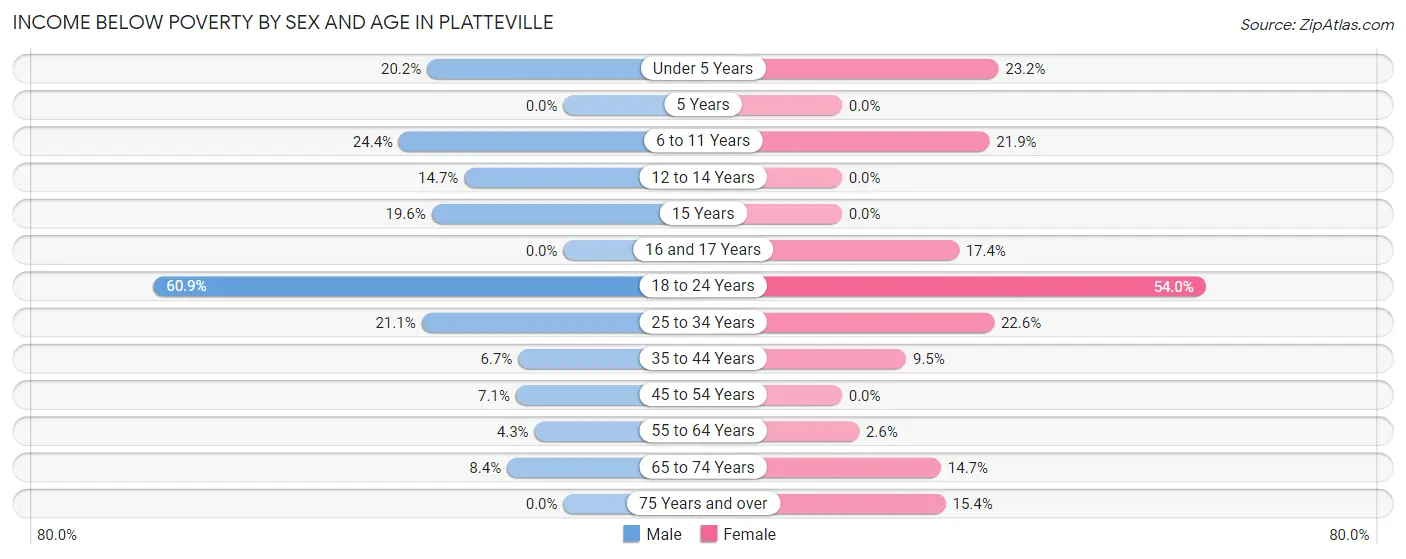
| Age Bracket | Male | Female |
| Under 5 Years | 34 (20.2%) | 33 (23.2%) |
| 5 Years | 0 (0.0%) | 0 (0.0%) |
| 6 to 11 Years | 42 (24.4%) | 32 (21.9%) |
| 12 to 14 Years | 33 (14.7%) | 0 (0.0%) |
| 15 Years | 18 (19.6%) | 0 (0.0%) |
| 16 and 17 Years | 0 (0.0%) | 42 (17.4%) |
| 18 to 24 Years | 1,007 (60.9%) | 603 (54.0%) |
| 25 to 34 Years | 173 (21.1%) | 101 (22.6%) |
| 35 to 44 Years | 30 (6.7%) | 44 (9.5%) |
| 45 to 54 Years | 28 (7.1%) | 0 (0.0%) |
| 55 to 64 Years | 13 (4.3%) | 11 (2.5%) |
| 65 to 74 Years | 20 (8.4%) | 55 (14.7%) |
| 75 Years and over | 0 (0.0%) | 53 (15.4%) |
| Total | 1,398 (28.9%) | 974 (22.7%) |
Income Above Poverty by Sex and Age in Platteville
According to the poverty statistics in Platteville, males aged 5 years and females aged 5 years are the age groups that are most secure financially, with 100.0% of males and 100.0% of females in these age groups living above the poverty line.
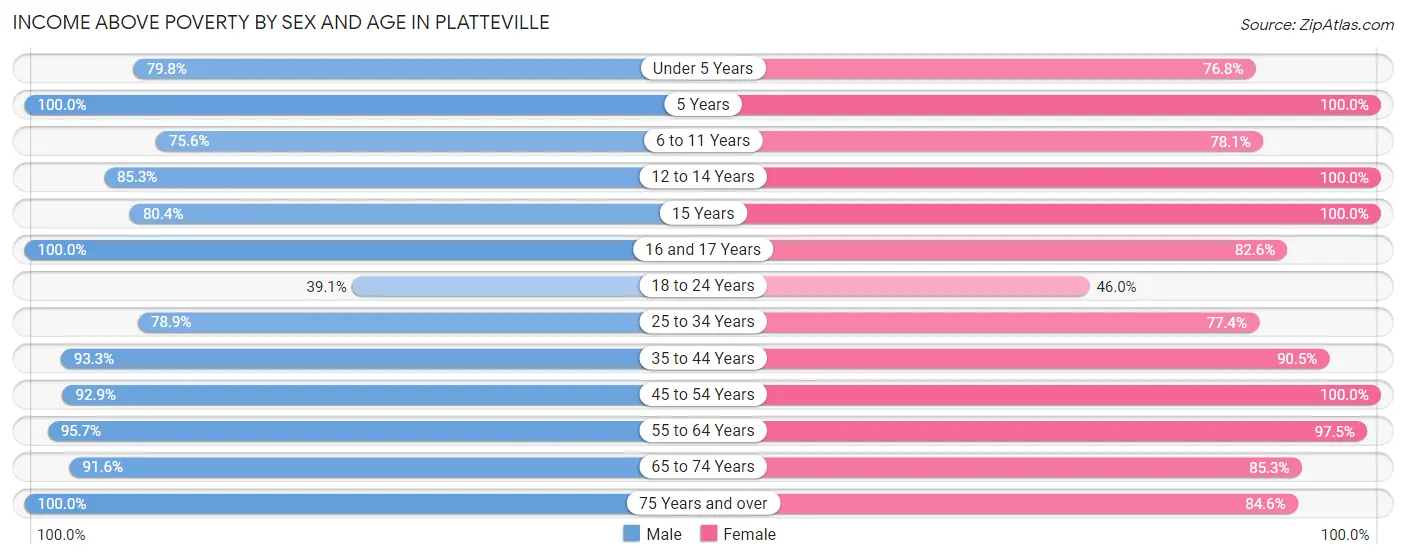
| Age Bracket | Male | Female |
| Under 5 Years | 134 (79.8%) | 109 (76.8%) |
| 5 Years | 85 (100.0%) | 17 (100.0%) |
| 6 to 11 Years | 130 (75.6%) | 114 (78.1%) |
| 12 to 14 Years | 191 (85.3%) | 113 (100.0%) |
| 15 Years | 74 (80.4%) | 61 (100.0%) |
| 16 and 17 Years | 53 (100.0%) | 200 (82.6%) |
| 18 to 24 Years | 647 (39.1%) | 513 (46.0%) |
| 25 to 34 Years | 648 (78.9%) | 346 (77.4%) |
| 35 to 44 Years | 416 (93.3%) | 417 (90.5%) |
| 45 to 54 Years | 368 (92.9%) | 407 (100.0%) |
| 55 to 64 Years | 290 (95.7%) | 420 (97.5%) |
| 65 to 74 Years | 219 (91.6%) | 319 (85.3%) |
| 75 Years and over | 180 (100.0%) | 291 (84.6%) |
| Total | 3,435 (71.1%) | 3,327 (77.3%) |
Income Below Poverty Among Married-Couple Families in Platteville
The poverty statistics for married-couple families in Platteville show that 2.3% or 26 of the total 1,109 families live below the poverty line. Families with 3 or 4 children have the highest poverty rate of 11.3%, comprising of 11 families. On the other hand, families with 1 or 2 children have the lowest poverty rate of 0.0%, which includes 0 families.
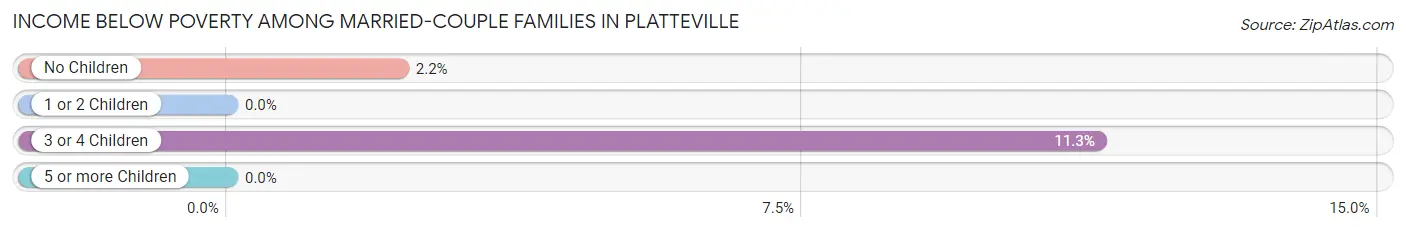
| Children | Above Poverty | Below Poverty |
| No Children | 657 (97.8%) | 15 (2.2%) |
| 1 or 2 Children | 325 (100.0%) | 0 (0.0%) |
| 3 or 4 Children | 86 (88.7%) | 11 (11.3%) |
| 5 or more Children | 15 (100.0%) | 0 (0.0%) |
| Total | 1,083 (97.7%) | 26 (2.3%) |
Income Below Poverty Among Single-Parent Households in Platteville
According to the poverty data in Platteville, 31.5% or 28 single-father households and 10.1% or 38 single-mother households are living below the poverty line. Among single-father households, those with 1 or 2 children have the highest poverty rate, with 28 households (63.6%) experiencing poverty. Likewise, among single-mother households, those with 3 or 4 children have the highest poverty rate, with 17 households (17.5%) falling below the poverty line.
| Children | Single Father | Single Mother |
| No Children | 0 (0.0%) | 0 (0.0%) |
| 1 or 2 Children | 28 (63.6%) | 21 (10.5%) |
| 3 or 4 Children | 0 (0.0%) | 17 (17.5%) |
| 5 or more Children | 0 (0.0%) | 0 (0.0%) |
| Total | 28 (31.5%) | 38 (10.1%) |
Income Below Poverty Among Married-Couple vs Single-Parent Households in Platteville
The poverty data for Platteville shows that 26 of the married-couple family households (2.3%) and 66 of the single-parent households (14.1%) are living below the poverty level. Within the married-couple family households, those with 3 or 4 children have the highest poverty rate, with 11 households (11.3%) falling below the poverty line. Among the single-parent households, those with 1 or 2 children have the highest poverty rate, with 49 household (20.1%) living below poverty.
| Children | Married-Couple Families | Single-Parent Households |
| No Children | 15 (2.2%) | 0 (0.0%) |
| 1 or 2 Children | 0 (0.0%) | 49 (20.1%) |
| 3 or 4 Children | 11 (11.3%) | 17 (12.7%) |
| 5 or more Children | 0 (0.0%) | 0 (0.0%) |
| Total | 26 (2.3%) | 66 (14.1%) |
Race in Platteville
The most populous races in Platteville are White / Caucasian (10,495 | 90.9%), Black / African American (448 | 3.9%), and Asian (323 | 2.8%).
| Race | # Population | % Population |
| Asian | 323 | 2.8% |
| Black / African American | 448 | 3.9% |
| Hawaiian / Pacific | 0 | 0.0% |
| Hispanic or Latino | 301 | 2.6% |
| Native / Alaskan | 18 | 0.2% |
| White / Caucasian | 10,495 | 90.9% |
| Two or more Races | 245 | 2.1% |
| Some other Race | 14 | 0.1% |
| Total | 11,543 | 100.0% |
Ancestry in Platteville
The most populous ancestries reported in Platteville are German (4,413 | 38.2%), Irish (1,166 | 10.1%), English (1,005 | 8.7%), Polish (860 | 7.4%), and Norwegian (747 | 6.5%), together accounting for 71.0% of all Platteville residents.
| Ancestry | # Population | % Population |
| African | 34 | 0.3% |
| American | 175 | 1.5% |
| Arab | 40 | 0.4% |
| Bangladeshi | 12 | 0.1% |
| Belgian | 23 | 0.2% |
| Blackfeet | 28 | 0.2% |
| Burmese | 39 | 0.3% |
| Central American | 20 | 0.2% |
| Cherokee | 32 | 0.3% |
| Chippewa | 5 | 0.0% |
| Croatian | 4 | 0.0% |
| Cuban | 28 | 0.2% |
| Czech | 86 | 0.7% |
| Danish | 105 | 0.9% |
| Dutch | 301 | 2.6% |
| Eastern European | 8 | 0.1% |
| Ecuadorian | 8 | 0.1% |
| English | 1,005 | 8.7% |
| European | 98 | 0.9% |
| Filipino | 24 | 0.2% |
| Finnish | 145 | 1.3% |
| French | 344 | 3.0% |
| French Canadian | 73 | 0.6% |
| German | 4,413 | 38.2% |
| Greek | 29 | 0.3% |
| Hungarian | 43 | 0.4% |
| Icelander | 27 | 0.2% |
| Indian (Asian) | 69 | 0.6% |
| Inupiat | 7 | 0.1% |
| Irish | 1,166 | 10.1% |
| Italian | 268 | 2.3% |
| Jamaican | 21 | 0.2% |
| Korean | 27 | 0.2% |
| Laotian | 28 | 0.2% |
| Lebanese | 40 | 0.4% |
| Lithuanian | 4 | 0.0% |
| Luxembourger | 29 | 0.3% |
| Mexican | 189 | 1.6% |
| Mexican American Indian | 13 | 0.1% |
| Nicaraguan | 20 | 0.2% |
| Nigerian | 16 | 0.1% |
| Northern European | 6 | 0.1% |
| Norwegian | 747 | 6.5% |
| Polish | 860 | 7.4% |
| Portuguese | 5 | 0.0% |
| Puerto Rican | 21 | 0.2% |
| Romanian | 12 | 0.1% |
| Russian | 38 | 0.3% |
| Scandinavian | 45 | 0.4% |
| Scotch-Irish | 62 | 0.5% |
| Scottish | 108 | 0.9% |
| Serbian | 6 | 0.1% |
| Slovene | 28 | 0.2% |
| South American | 8 | 0.1% |
| Spaniard | 7 | 0.1% |
| Spanish | 28 | 0.2% |
| Subsaharan African | 34 | 0.3% |
| Swedish | 182 | 1.6% |
| Swiss | 159 | 1.4% |
| Thai | 64 | 0.5% |
| Ukrainian | 7 | 0.1% |
| Vietnamese | 105 | 0.9% |
| Welsh | 45 | 0.4% | View All 63 Rows |
Immigrants in Platteville
The most numerous immigrant groups reported in Platteville came from Asia (259 | 2.2%), South Central Asia (109 | 0.9%), Eastern Asia (101 | 0.9%), Bangladesh (86 | 0.7%), and China (73 | 0.6%), together accounting for 5.4% of all Platteville residents.
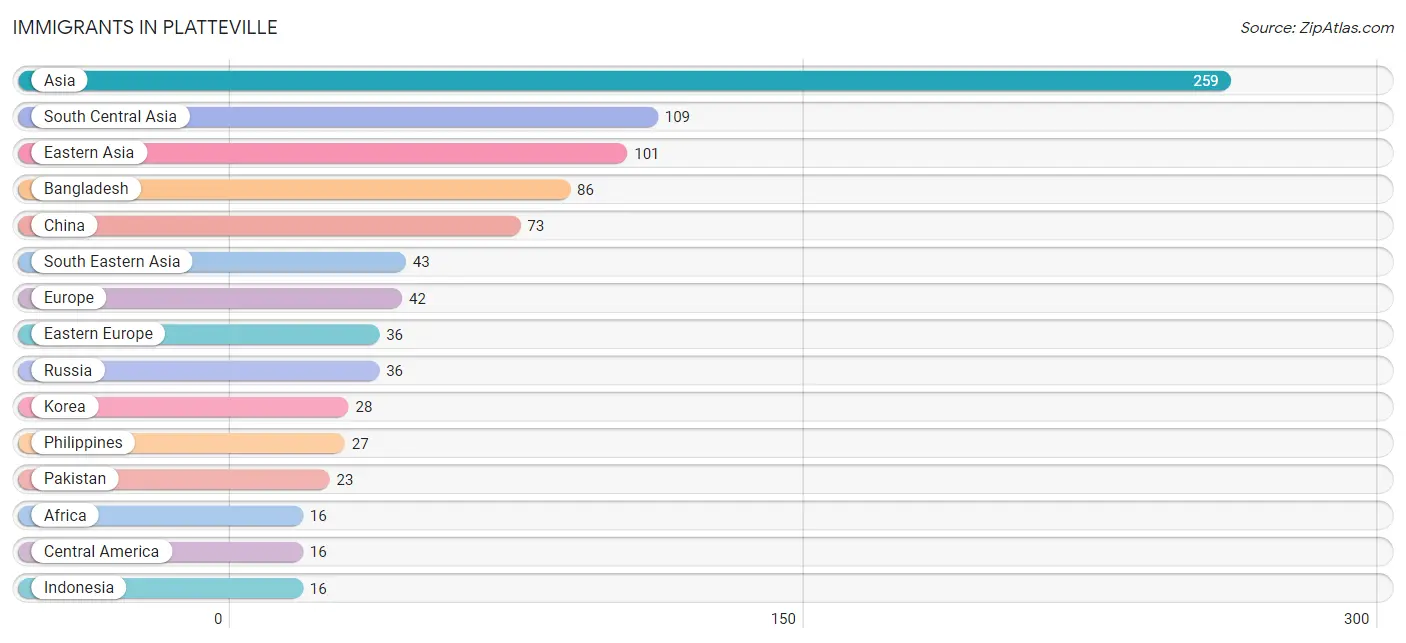
| Immigration Origin | # Population | % Population |
| Africa | 16 | 0.1% |
| Armenia | 2 | 0.0% |
| Asia | 259 | 2.2% |
| Bangladesh | 86 | 0.7% |
| Central America | 16 | 0.1% |
| China | 73 | 0.6% |
| Eastern Asia | 101 | 0.9% |
| Eastern Europe | 36 | 0.3% |
| Europe | 42 | 0.4% |
| Germany | 6 | 0.1% |
| Indonesia | 16 | 0.1% |
| Korea | 28 | 0.2% |
| Latin America | 16 | 0.1% |
| Lebanon | 4 | 0.0% |
| Mexico | 16 | 0.1% |
| Nigeria | 16 | 0.1% |
| Pakistan | 23 | 0.2% |
| Philippines | 27 | 0.2% |
| Russia | 36 | 0.3% |
| South Central Asia | 109 | 0.9% |
| South Eastern Asia | 43 | 0.4% |
| Taiwan | 12 | 0.1% |
| Western Africa | 16 | 0.1% |
| Western Asia | 6 | 0.1% |
| Western Europe | 6 | 0.1% | View All 25 Rows |
Sex and Age in Platteville
Sex and Age in Platteville
The most populous age groups in Platteville are 20 to 24 Years (2,195 | 34.3%) for men and 20 to 24 Years (1,307 | 25.4%) for women.
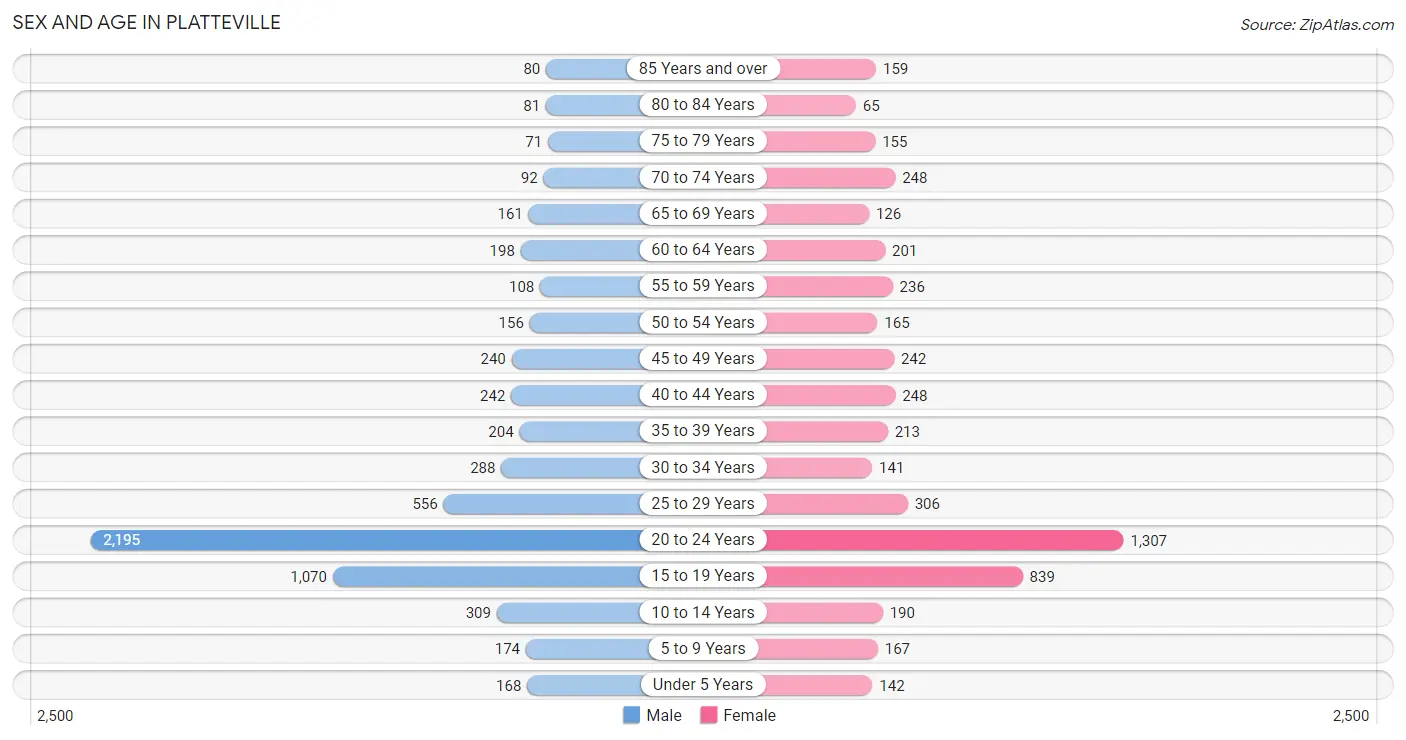
| Age Bracket | Male | Female |
| Under 5 Years | 168 (2.6%) | 142 (2.8%) |
| 5 to 9 Years | 174 (2.7%) | 167 (3.2%) |
| 10 to 14 Years | 309 (4.8%) | 190 (3.7%) |
| 15 to 19 Years | 1,070 (16.7%) | 839 (16.3%) |
| 20 to 24 Years | 2,195 (34.3%) | 1,307 (25.4%) |
| 25 to 29 Years | 556 (8.7%) | 306 (5.9%) |
| 30 to 34 Years | 288 (4.5%) | 141 (2.7%) |
| 35 to 39 Years | 204 (3.2%) | 213 (4.1%) |
| 40 to 44 Years | 242 (3.8%) | 248 (4.8%) |
| 45 to 49 Years | 240 (3.7%) | 242 (4.7%) |
| 50 to 54 Years | 156 (2.4%) | 165 (3.2%) |
| 55 to 59 Years | 108 (1.7%) | 236 (4.6%) |
| 60 to 64 Years | 198 (3.1%) | 201 (3.9%) |
| 65 to 69 Years | 161 (2.5%) | 126 (2.5%) |
| 70 to 74 Years | 92 (1.4%) | 248 (4.8%) |
| 75 to 79 Years | 71 (1.1%) | 155 (3.0%) |
| 80 to 84 Years | 81 (1.3%) | 65 (1.3%) |
| 85 Years and over | 80 (1.3%) | 159 (3.1%) |
| Total | 6,393 (100.0%) | 5,150 (100.0%) |
Families and Households in Platteville
Median Family Size in Platteville
The median family size in Platteville is 2.98 persons per family, with single female/mother families (378 | 24.0%) accounting for the largest median family size of 3.1 persons per family. On the other hand, single male/father families (89 | 5.7%) represent the smallest median family size with 2.70 persons per family.
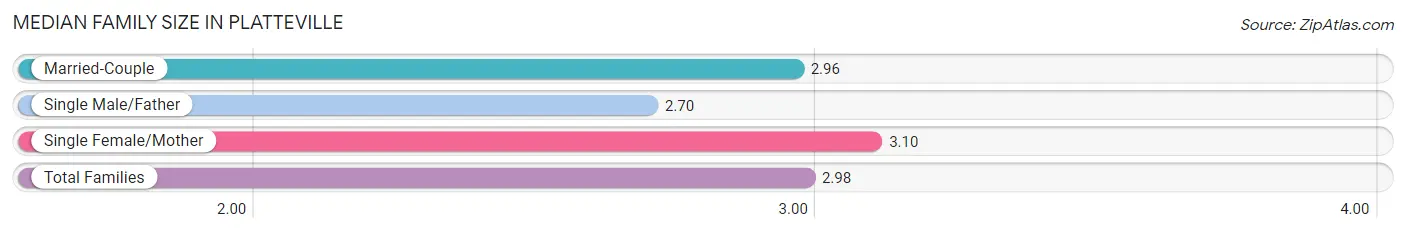
| Family Type | # Families | Family Size |
| Married-Couple | 1,109 (70.4%) | 2.96 |
| Single Male/Father | 89 (5.7%) | 2.70 |
| Single Female/Mother | 378 (24.0%) | 3.10 |
| Total Families | 1,576 (100.0%) | 2.98 |
Median Household Size in Platteville
The median household size in Platteville is 2.24 persons per household, with single female/mother households (378 | 9.2%) accounting for the largest median household size of 3.59 persons per household. non-family households (2,533 | 61.7%) represent the smallest median household size with 1.70 persons per household.
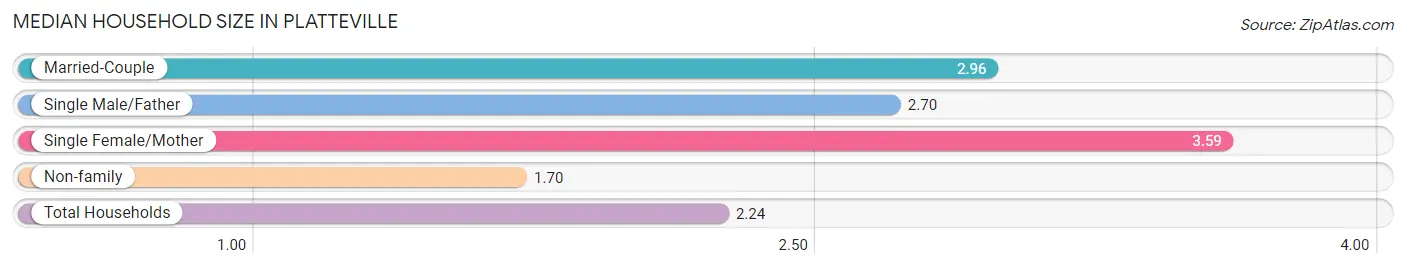
| Household Type | # Households | Household Size |
| Married-Couple | 1,109 (27.0%) | 2.96 |
| Single Male/Father | 89 (2.2%) | 2.70 |
| Single Female/Mother | 378 (9.2%) | 3.59 |
| Non-family | 2,533 (61.7%) | 1.70 |
| Total Households | 4,109 (100.0%) | 2.24 |
Household Size by Marriage Status in Platteville
Out of a total of 4,109 households in Platteville, 1,576 (38.4%) are family households, while 2,533 (61.7%) are nonfamily households. The most numerous type of family households are 2-person households, comprising 762, and the most common type of nonfamily households are 1-person households, comprising 1,446.
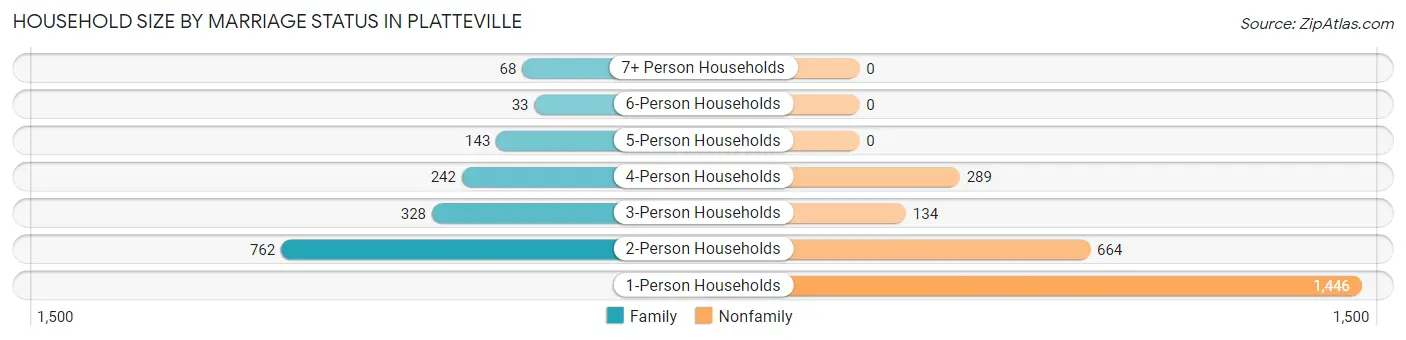
| Household Size | Family Households | Nonfamily Households |
| 1-Person Households | - | 1,446 (35.2%) |
| 2-Person Households | 762 (18.5%) | 664 (16.2%) |
| 3-Person Households | 328 (8.0%) | 134 (3.3%) |
| 4-Person Households | 242 (5.9%) | 289 (7.0%) |
| 5-Person Households | 143 (3.5%) | 0 (0.0%) |
| 6-Person Households | 33 (0.8%) | 0 (0.0%) |
| 7+ Person Households | 68 (1.7%) | 0 (0.0%) |
| Total | 1,576 (38.4%) | 2,533 (61.7%) |
Female Fertility in Platteville
Fertility by Age in Platteville
Average fertility rate in Platteville is 47.0 births per 1,000 women. Women in the age bracket of 20 to 34 years have the highest fertility rate with 54.0 births per 1,000 women. Women in the age bracket of 20 to 34 years acount for 60.7% of all women with births.
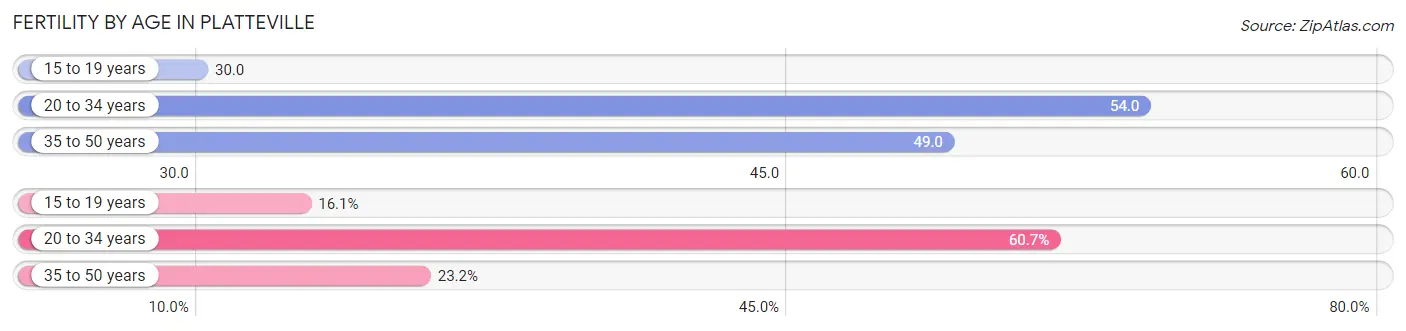
| Age Bracket | Women with Births | Births / 1,000 Women |
| 15 to 19 years | 25 (16.1%) | 30.0 |
| 20 to 34 years | 94 (60.7%) | 54.0 |
| 35 to 50 years | 36 (23.2%) | 49.0 |
| Total | 155 (100.0%) | 47.0 |
Fertility by Age by Marriage Status in Platteville
83.9% of women with births (155) in Platteville are married. The highest percentage of unmarried women with births falls into 15 to 19 years age bracket with 100.0% of them unmarried at the time of birth, while the lowest percentage of unmarried women with births belong to 20 to 34 years age bracket with 0.0% of them unmarried.
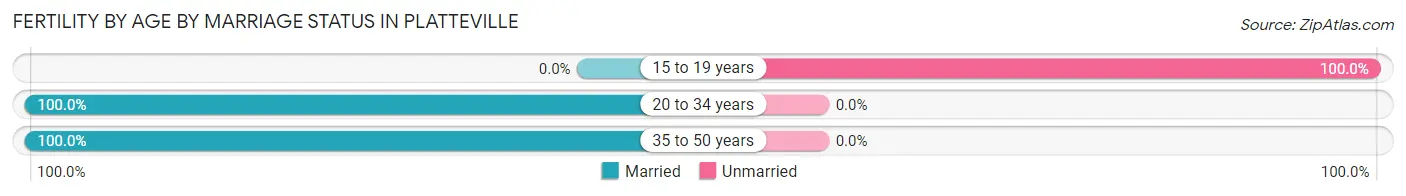
| Age Bracket | Married | Unmarried |
| 15 to 19 years | 0 (0.0%) | 25 (100.0%) |
| 20 to 34 years | 94 (100.0%) | 0 (0.0%) |
| 35 to 50 years | 36 (100.0%) | 0 (0.0%) |
| Total | 130 (83.9%) | 25 (16.1%) |
Fertility by Education in Platteville
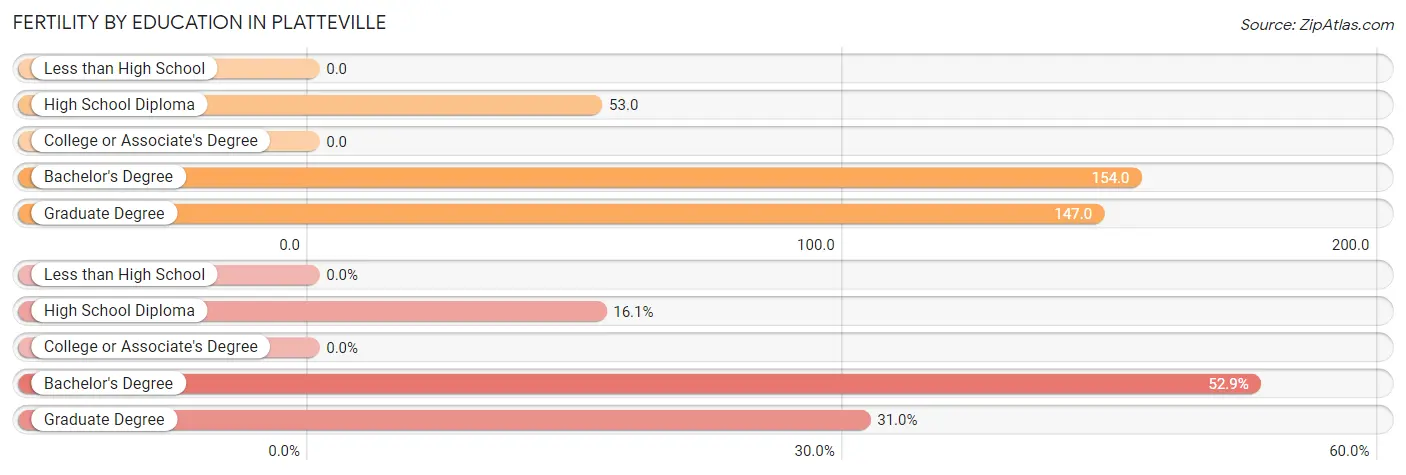
| Educational Attainment | Women with Births | Births / 1,000 Women |
| Less than High School | 0 (0.0%) | 0.0 |
| High School Diploma | 25 (16.1%) | 53.0 |
| College or Associate's Degree | 0 (0.0%) | 0.0 |
| Bachelor's Degree | 82 (52.9%) | 154.0 |
| Graduate Degree | 48 (31.0%) | 147.0 |
| Total | 155 (100.0%) | 47.0 |
Fertility by Education by Marriage Status in Platteville
16.1% of women with births in Platteville are unmarried. Women with the educational attainment of bachelor's degree are most likely to be married with 100.0% of them married at childbirth, while women with the educational attainment of high school diploma are least likely to be married with 100.0% of them unmarried at childbirth.
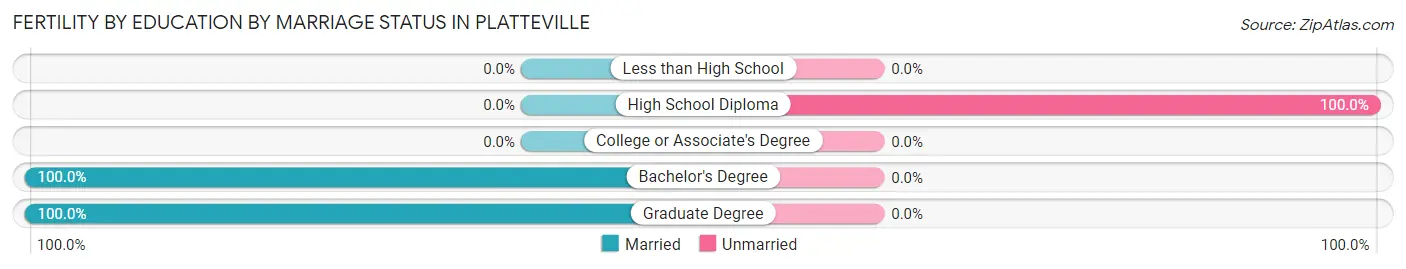
| Educational Attainment | Married | Unmarried |
| Less than High School | 0 (0.0%) | 0 (0.0%) |
| High School Diploma | 0 (0.0%) | 25 (100.0%) |
| College or Associate's Degree | 0 (0.0%) | 0 (0.0%) |
| Bachelor's Degree | 82 (100.0%) | 0 (0.0%) |
| Graduate Degree | 48 (100.0%) | 0 (0.0%) |
| Total | 130 (83.9%) | 25 (16.1%) |
Employment Characteristics in Platteville
Employment by Class of Employer in Platteville
Among the 6,280 employed individuals in Platteville, private company employees (4,175 | 66.5%), state government employees (868 | 13.8%), and local government employees (456 | 7.3%) make up the most common classes of employment.
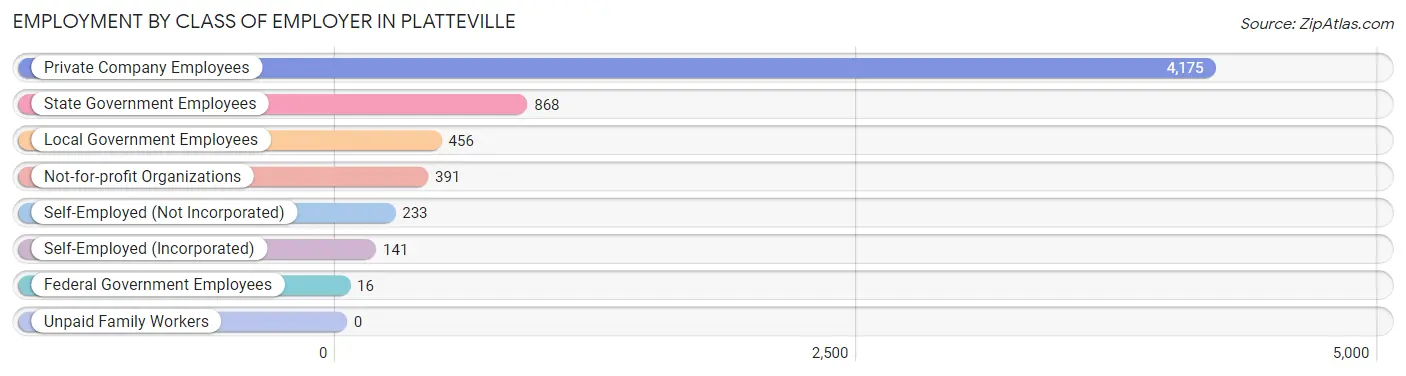
| Employer Class | # Employees | % Employees |
| Private Company Employees | 4,175 | 66.5% |
| Self-Employed (Incorporated) | 141 | 2.2% |
| Self-Employed (Not Incorporated) | 233 | 3.7% |
| Not-for-profit Organizations | 391 | 6.2% |
| Local Government Employees | 456 | 7.3% |
| State Government Employees | 868 | 13.8% |
| Federal Government Employees | 16 | 0.3% |
| Unpaid Family Workers | 0 | 0.0% |
| Total | 6,280 | 100.0% |
Employment Status by Age in Platteville
According to the labor force statistics for Platteville, out of the total population over 16 years of age (10,238), 65.2% or 6,675 individuals are in the labor force, with 4.2% or 280 of them unemployed. The age group with the highest labor force participation rate is 45 to 54 years, with 97.8% or 785 individuals in the labor force. Within the labor force, the 16 to 19 years age range has the highest percentage of unemployed individuals, with 9.0% or 71 of them being unemployed.
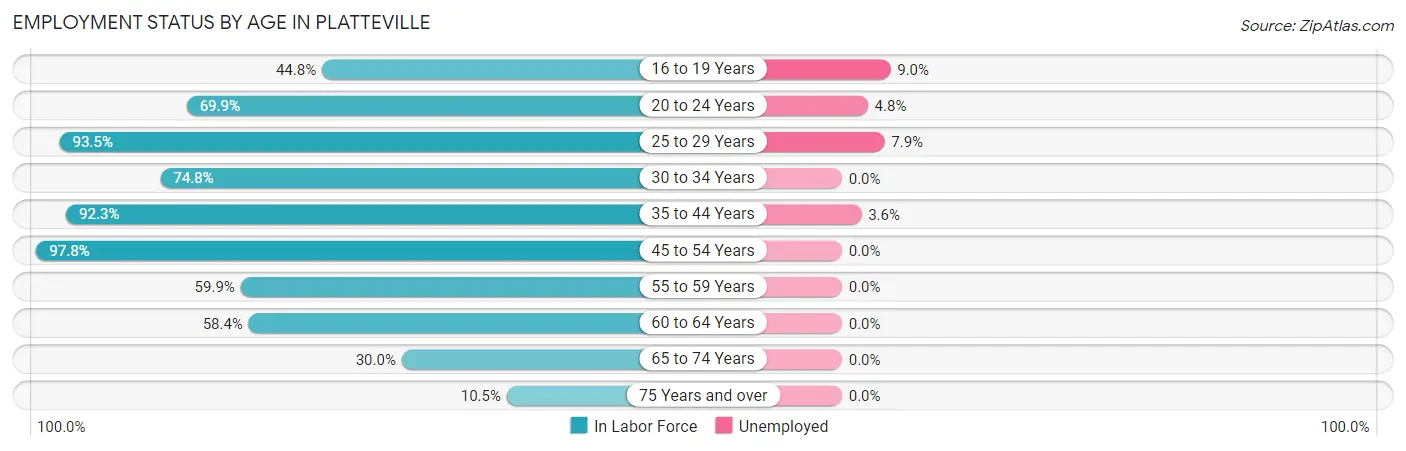
| Age Bracket | In Labor Force | Unemployed |
| 16 to 19 Years | 786 (44.8%) | 71 (9.0%) |
| 20 to 24 Years | 2,448 (69.9%) | 118 (4.8%) |
| 25 to 29 Years | 806 (93.5%) | 64 (7.9%) |
| 30 to 34 Years | 321 (74.8%) | 0 (0.0%) |
| 35 to 44 Years | 837 (92.3%) | 30 (3.6%) |
| 45 to 54 Years | 785 (97.8%) | 0 (0.0%) |
| 55 to 59 Years | 206 (59.9%) | 0 (0.0%) |
| 60 to 64 Years | 233 (58.4%) | 0 (0.0%) |
| 65 to 74 Years | 188 (30.0%) | 0 (0.0%) |
| 75 Years and over | 64 (10.5%) | 0 (0.0%) |
| Total | 6,675 (65.2%) | 280 (4.2%) |
Employment Status by Educational Attainment in Platteville
According to labor force statistics for Platteville, 85.1% of individuals (3,186) out of the total population between 25 and 64 years of age (3,744) are in the labor force, with 2.9% or 92 of them being unemployed. The group with the highest labor force participation rate are those with the educational attainment of bachelor's degree or higher, with 91.9% or 1,679 individuals in the labor force. Within the labor force, individuals with high school diploma education have the highest percentage of unemployment, with 7.5% or 30 of them being unemployed.
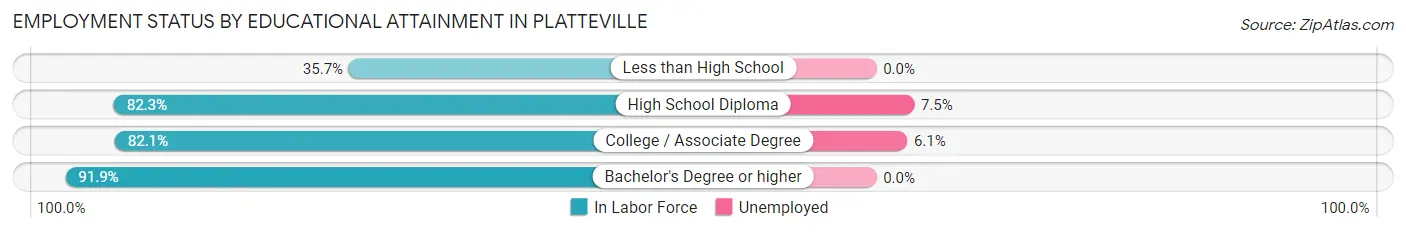
| Educational Attainment | In Labor Force | Unemployed |
| Less than High School | 51 (35.7%) | 0 (0.0%) |
| High School Diploma | 401 (82.3%) | 37 (7.5%) |
| College / Associate Degree | 1,057 (82.1%) | 79 (6.1%) |
| Bachelor's Degree or higher | 1,679 (91.9%) | 0 (0.0%) |
| Total | 3,186 (85.1%) | 109 (2.9%) |
Employment Occupations by Sex in Platteville
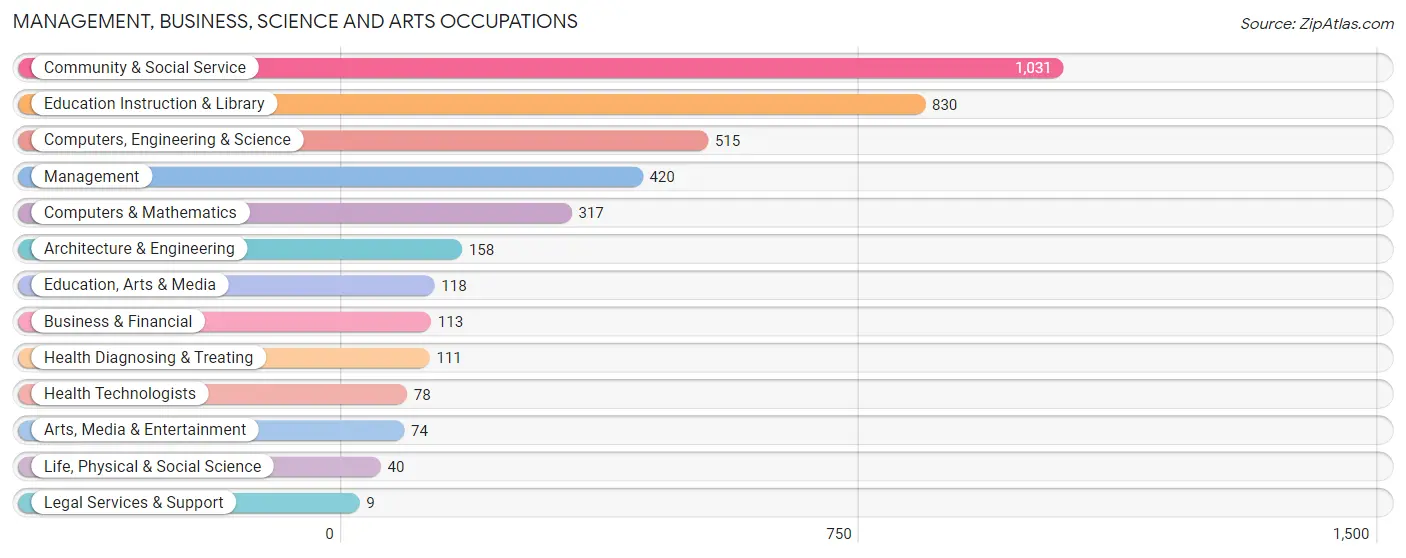
Management, Business, Science and Arts Occupations
The most common Management, Business, Science and Arts occupations in Platteville are Community & Social Service (1,031 | 16.1%), Education Instruction & Library (830 | 13.0%), Computers, Engineering & Science (515 | 8.1%), Management (420 | 6.6%), and Computers & Mathematics (317 | 5.0%).
Management, Business, Science and Arts Occupations by Sex
Within the Management, Business, Science and Arts occupations in Platteville, the most male-oriented occupations are Life, Physical & Social Science (100.0%), Legal Services & Support (100.0%), and Arts, Media & Entertainment (91.9%), while the most female-oriented occupations are Health Technologists (78.2%), Education Instruction & Library (69.0%), and Health Diagnosing & Treating (68.5%).
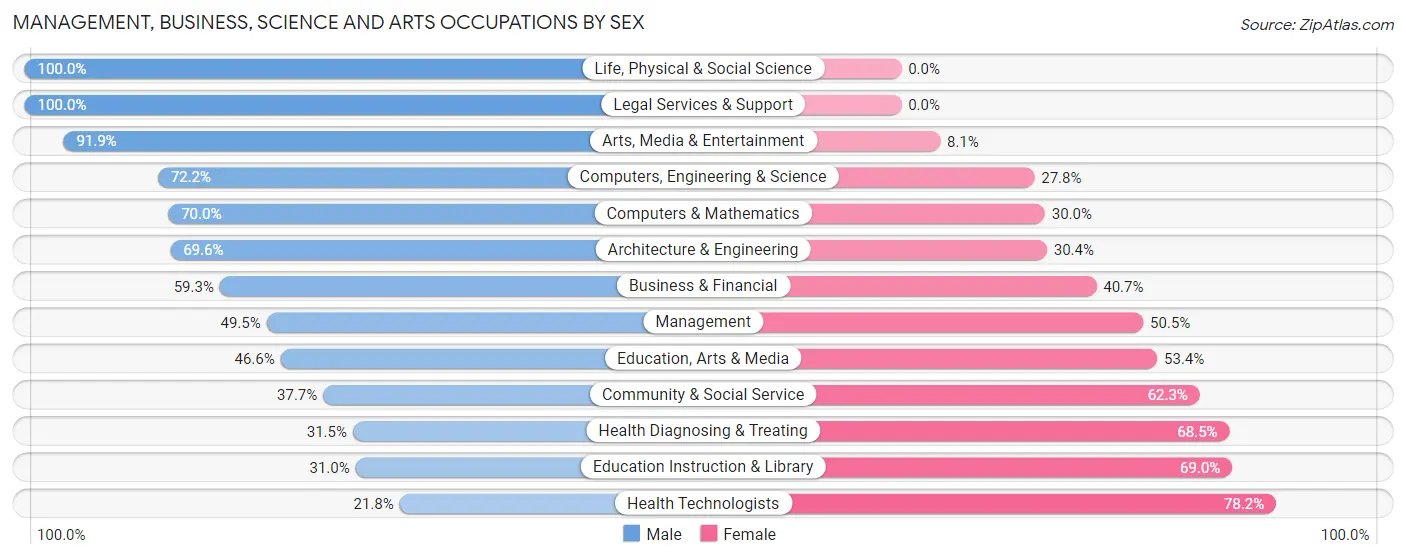
| Occupation | Male | Female |
| Management | 208 (49.5%) | 212 (50.5%) |
| Business & Financial | 67 (59.3%) | 46 (40.7%) |
| Computers, Engineering & Science | 372 (72.2%) | 143 (27.8%) |
| Computers & Mathematics | 222 (70.0%) | 95 (30.0%) |
| Architecture & Engineering | 110 (69.6%) | 48 (30.4%) |
| Life, Physical & Social Science | 40 (100.0%) | 0 (0.0%) |
| Community & Social Service | 389 (37.7%) | 642 (62.3%) |
| Education, Arts & Media | 55 (46.6%) | 63 (53.4%) |
| Legal Services & Support | 9 (100.0%) | 0 (0.0%) |
| Education Instruction & Library | 257 (31.0%) | 573 (69.0%) |
| Arts, Media & Entertainment | 68 (91.9%) | 6 (8.1%) |
| Health Diagnosing & Treating | 35 (31.5%) | 76 (68.5%) |
| Health Technologists | 17 (21.8%) | 61 (78.2%) |
| Total (Category) | 1,071 (48.9%) | 1,119 (51.1%) |
| Total (Overall) | 3,438 (53.8%) | 2,953 (46.2%) |
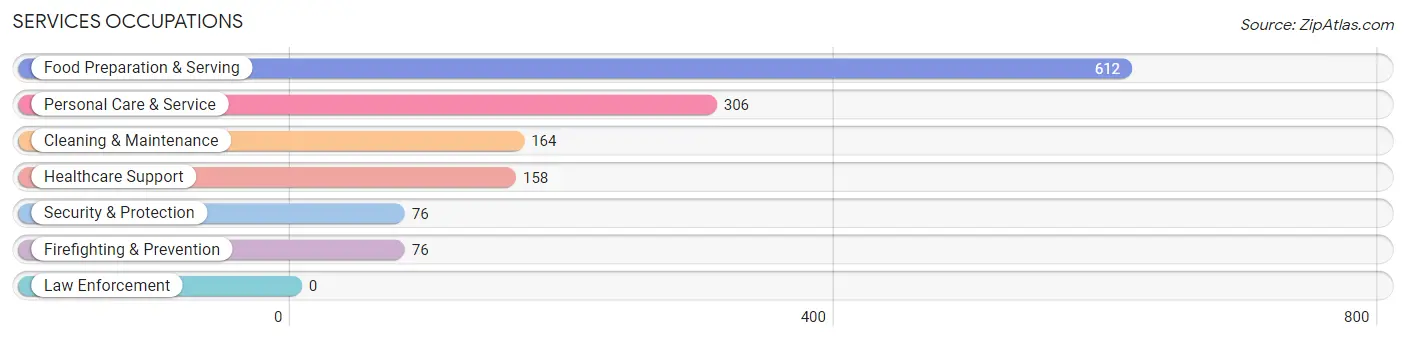
Services Occupations
The most common Services occupations in Platteville are Food Preparation & Serving (612 | 9.6%), Personal Care & Service (306 | 4.8%), Cleaning & Maintenance (164 | 2.6%), Healthcare Support (158 | 2.5%), and Security & Protection (76 | 1.2%).
Services Occupations by Sex
Within the Services occupations in Platteville, the most male-oriented occupations are Cleaning & Maintenance (51.2%), Personal Care & Service (48.4%), and Food Preparation & Serving (43.1%), while the most female-oriented occupations are Healthcare Support (100.0%), Security & Protection (80.3%), and Firefighting & Prevention (80.3%).
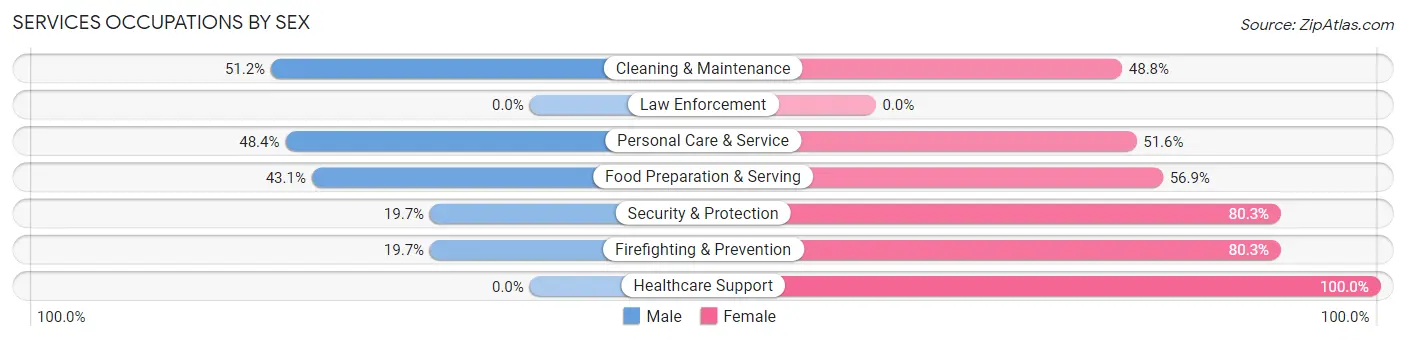
| Occupation | Male | Female |
| Healthcare Support | 0 (0.0%) | 158 (100.0%) |
| Security & Protection | 15 (19.7%) | 61 (80.3%) |
| Firefighting & Prevention | 15 (19.7%) | 61 (80.3%) |
| Law Enforcement | 0 (0.0%) | 0 (0.0%) |
| Food Preparation & Serving | 264 (43.1%) | 348 (56.9%) |
| Cleaning & Maintenance | 84 (51.2%) | 80 (48.8%) |
| Personal Care & Service | 148 (48.4%) | 158 (51.6%) |
| Total (Category) | 511 (38.8%) | 805 (61.2%) |
| Total (Overall) | 3,438 (53.8%) | 2,953 (46.2%) |
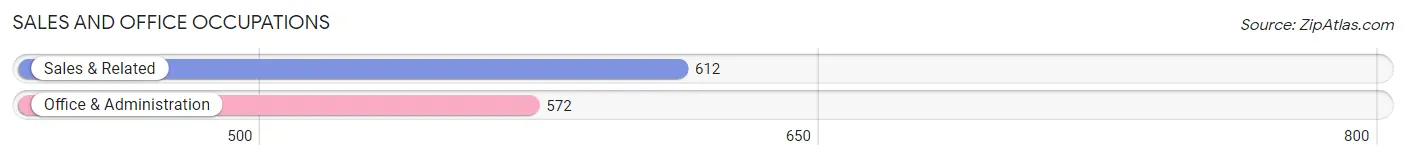
Sales and Office Occupations
The most common Sales and Office occupations in Platteville are Sales & Related (612 | 9.6%), and Office & Administration (572 | 8.9%).
Sales and Office Occupations by Sex
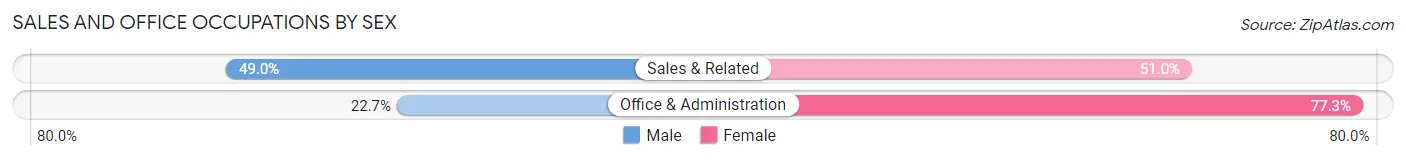
| Occupation | Male | Female |
| Sales & Related | 300 (49.0%) | 312 (51.0%) |
| Office & Administration | 130 (22.7%) | 442 (77.3%) |
| Total (Category) | 430 (36.3%) | 754 (63.7%) |
| Total (Overall) | 3,438 (53.8%) | 2,953 (46.2%) |
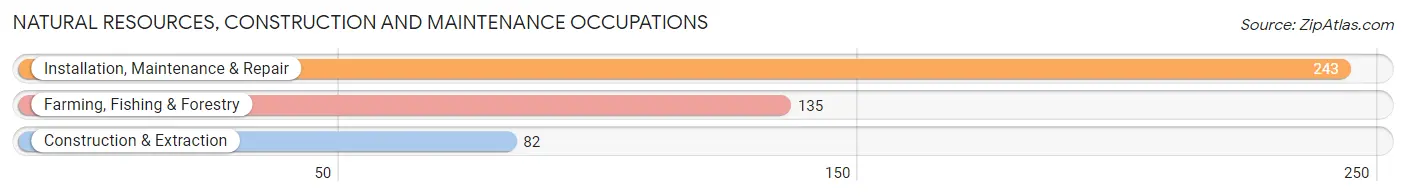
Natural Resources, Construction and Maintenance Occupations
The most common Natural Resources, Construction and Maintenance occupations in Platteville are Installation, Maintenance & Repair (243 | 3.8%), Farming, Fishing & Forestry (135 | 2.1%), and Construction & Extraction (82 | 1.3%).
Natural Resources, Construction and Maintenance Occupations by Sex
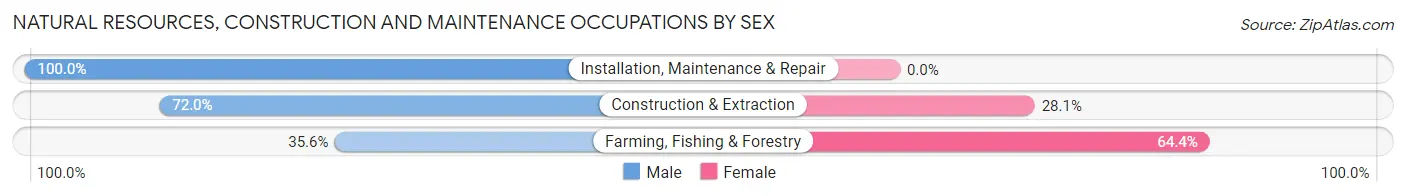
| Occupation | Male | Female |
| Farming, Fishing & Forestry | 48 (35.6%) | 87 (64.4%) |
| Construction & Extraction | 59 (72.0%) | 23 (28.1%) |
| Installation, Maintenance & Repair | 243 (100.0%) | 0 (0.0%) |
| Total (Category) | 350 (76.1%) | 110 (23.9%) |
| Total (Overall) | 3,438 (53.8%) | 2,953 (46.2%) |
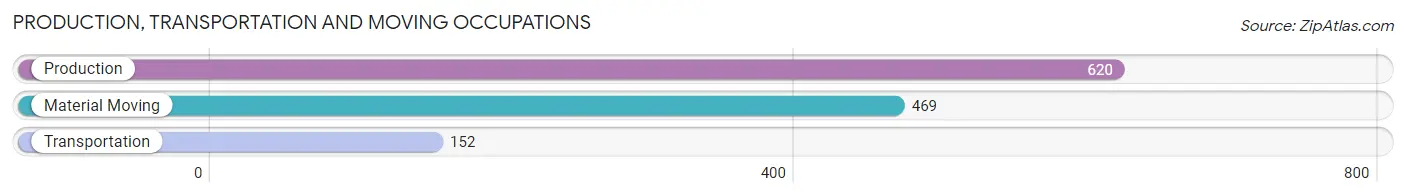
Production, Transportation and Moving Occupations
The most common Production, Transportation and Moving occupations in Platteville are Production (620 | 9.7%), Material Moving (469 | 7.3%), and Transportation (152 | 2.4%).
Production, Transportation and Moving Occupations by Sex
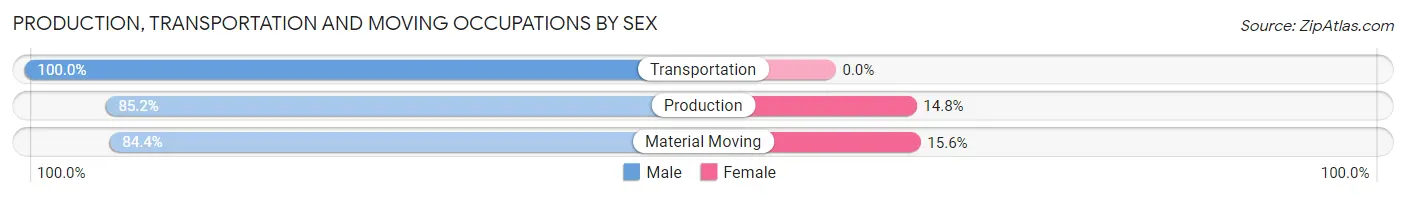
| Occupation | Male | Female |
| Production | 528 (85.2%) | 92 (14.8%) |
| Transportation | 152 (100.0%) | 0 (0.0%) |
| Material Moving | 396 (84.4%) | 73 (15.6%) |
| Total (Category) | 1,076 (86.7%) | 165 (13.3%) |
| Total (Overall) | 3,438 (53.8%) | 2,953 (46.2%) |
Employment Industries by Sex in Platteville
Employment Industries in Platteville
The major employment industries in Platteville include Educational Services (1,265 | 19.8%), Retail Trade (1,209 | 18.9%), Accommodation & Food Services (891 | 13.9%), Manufacturing (678 | 10.6%), and Health Care & Social Assistance (478 | 7.5%).
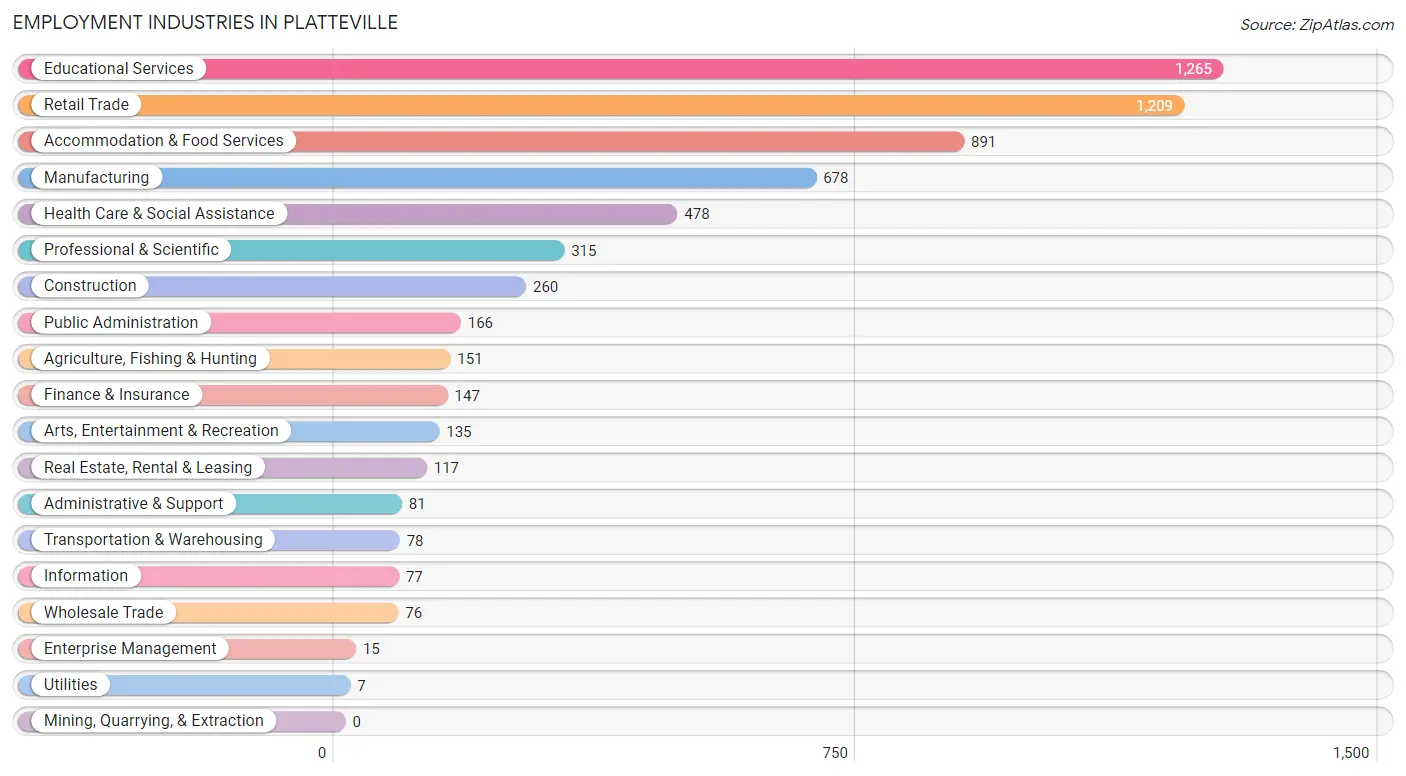
Employment Industries by Sex in Platteville
The Platteville industries that see more men than women are Transportation & Warehousing (100.0%), Utilities (100.0%), and Enterprise Management (100.0%), whereas the industries that tend to have a higher number of women are Health Care & Social Assistance (89.7%), Public Administration (71.1%), and Information (68.8%).
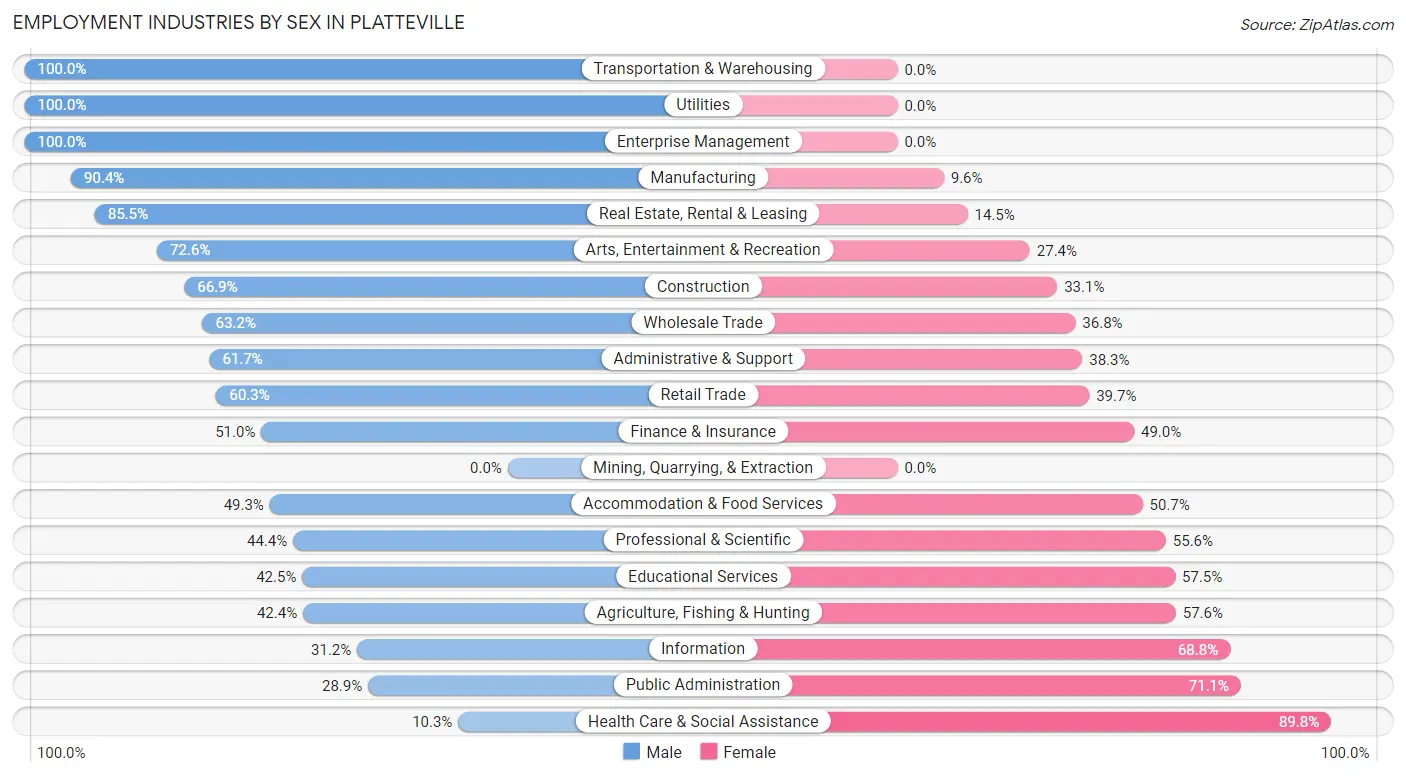
| Industry | Male | Female |
| Agriculture, Fishing & Hunting | 64 (42.4%) | 87 (57.6%) |
| Mining, Quarrying, & Extraction | 0 (0.0%) | 0 (0.0%) |
| Construction | 174 (66.9%) | 86 (33.1%) |
| Manufacturing | 613 (90.4%) | 65 (9.6%) |
| Wholesale Trade | 48 (63.2%) | 28 (36.8%) |
| Retail Trade | 729 (60.3%) | 480 (39.7%) |
| Transportation & Warehousing | 78 (100.0%) | 0 (0.0%) |
| Utilities | 7 (100.0%) | 0 (0.0%) |
| Information | 24 (31.2%) | 53 (68.8%) |
| Finance & Insurance | 75 (51.0%) | 72 (49.0%) |
| Real Estate, Rental & Leasing | 100 (85.5%) | 17 (14.5%) |
| Professional & Scientific | 140 (44.4%) | 175 (55.6%) |
| Enterprise Management | 15 (100.0%) | 0 (0.0%) |
| Administrative & Support | 50 (61.7%) | 31 (38.3%) |
| Educational Services | 538 (42.5%) | 727 (57.5%) |
| Health Care & Social Assistance | 49 (10.2%) | 429 (89.7%) |
| Arts, Entertainment & Recreation | 98 (72.6%) | 37 (27.4%) |
| Accommodation & Food Services | 439 (49.3%) | 452 (50.7%) |
| Public Administration | 48 (28.9%) | 118 (71.1%) |
| Total | 3,438 (53.8%) | 2,953 (46.2%) |
Education in Platteville
School Enrollment in Platteville
The most common levels of schooling among the 6,283 students in Platteville are college / undergraduate (4,733 | 75.3%), high school (576 | 9.2%), and middle school (434 | 6.9%).
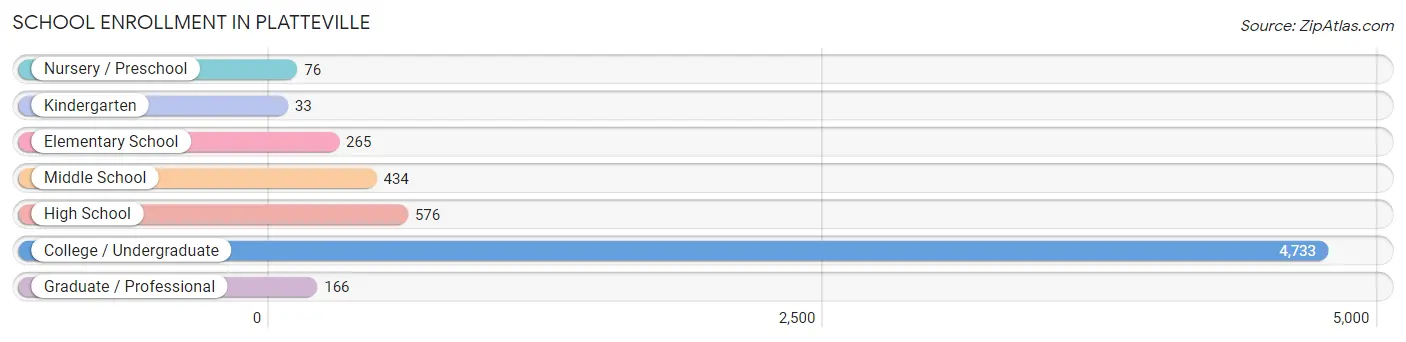
| School Level | # Students | % Students |
| Nursery / Preschool | 76 | 1.2% |
| Kindergarten | 33 | 0.5% |
| Elementary School | 265 | 4.2% |
| Middle School | 434 | 6.9% |
| High School | 576 | 9.2% |
| College / Undergraduate | 4,733 | 75.3% |
| Graduate / Professional | 166 | 2.6% |
| Total | 6,283 | 100.0% |
School Enrollment by Age by Funding Source in Platteville
Out of a total of 6,283 students who are enrolled in schools in Platteville, 402 (6.4%) attend a private institution, while the remaining 5,881 (93.6%) are enrolled in public schools. The age group of 35 years and over has the highest likelihood of being enrolled in private schools, with 60 (46.9% in the age bracket) enrolled. Conversely, the age group of 3 to 4 year olds has the lowest likelihood of being enrolled in a private school, with 7 (100.0% in the age bracket) attending a public institution.
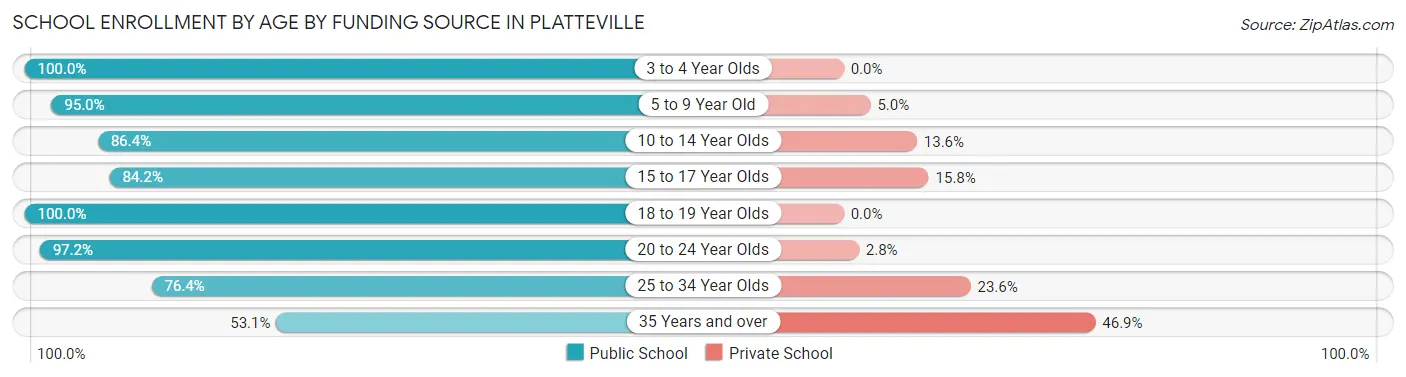
| Age Bracket | Public School | Private School |
| 3 to 4 Year Olds | 7 (100.0%) | 0 (0.0%) |
| 5 to 9 Year Old | 324 (95.0%) | 17 (5.0%) |
| 10 to 14 Year Olds | 431 (86.4%) | 68 (13.6%) |
| 15 to 17 Year Olds | 383 (84.2%) | 72 (15.8%) |
| 18 to 19 Year Olds | 1,366 (100.0%) | 0 (0.0%) |
| 20 to 24 Year Olds | 2,998 (97.2%) | 87 (2.8%) |
| 25 to 34 Year Olds | 307 (76.4%) | 95 (23.6%) |
| 35 Years and over | 68 (53.1%) | 60 (46.9%) |
| Total | 5,881 (93.6%) | 402 (6.4%) |
Educational Attainment by Field of Study in Platteville
Education (570 | 24.1%), business (376 | 15.9%), computers & mathematics (215 | 9.1%), science & technology (197 | 8.3%), and bio, nature & agricultural (181 | 7.7%) are the most common fields of study among 2,361 individuals in Platteville who have obtained a bachelor's degree or higher.
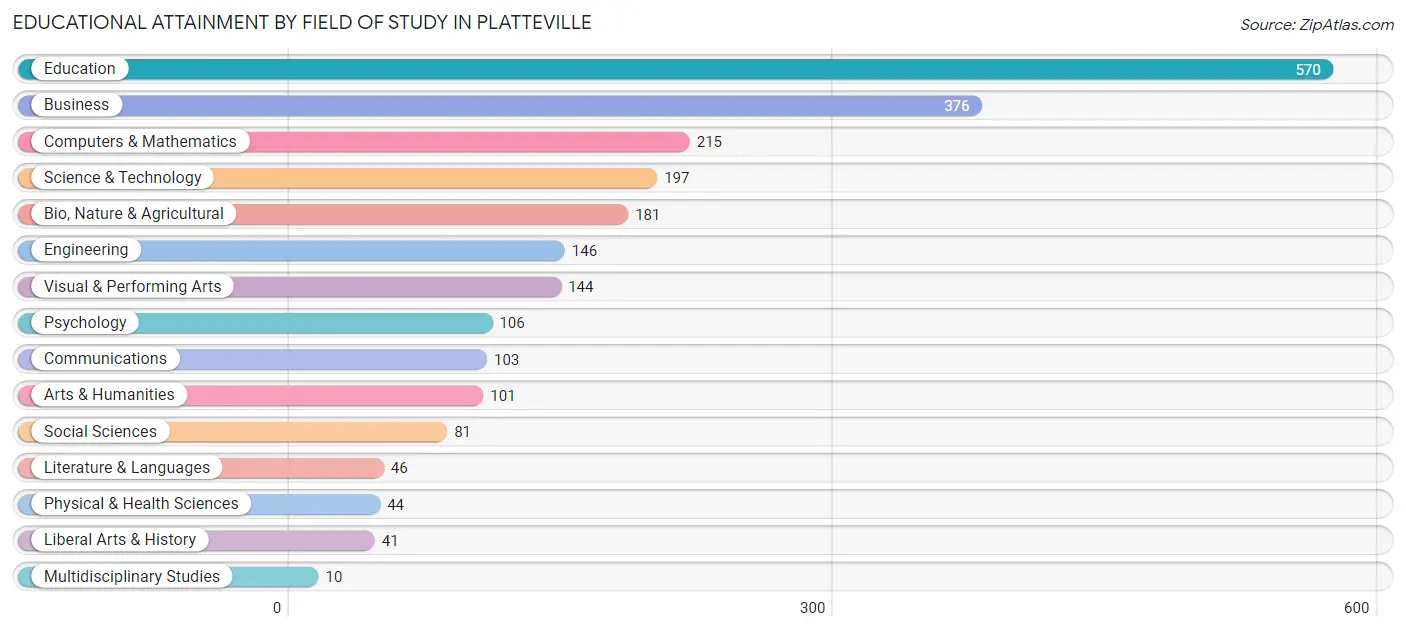
| Field of Study | # Graduates | % Graduates |
| Computers & Mathematics | 215 | 9.1% |
| Bio, Nature & Agricultural | 181 | 7.7% |
| Physical & Health Sciences | 44 | 1.9% |
| Psychology | 106 | 4.5% |
| Social Sciences | 81 | 3.4% |
| Engineering | 146 | 6.2% |
| Multidisciplinary Studies | 10 | 0.4% |
| Science & Technology | 197 | 8.3% |
| Business | 376 | 15.9% |
| Education | 570 | 24.1% |
| Literature & Languages | 46 | 1.9% |
| Liberal Arts & History | 41 | 1.7% |
| Visual & Performing Arts | 144 | 6.1% |
| Communications | 103 | 4.4% |
| Arts & Humanities | 101 | 4.3% |
| Total | 2,361 | 100.0% |
Transportation & Commute in Platteville
Vehicle Availability by Sex in Platteville
The most prevalent vehicle ownership categories in Platteville are males with 2 vehicles (995, accounting for 35.3%) and females with 2 vehicles (1,057, making up 40.5%).
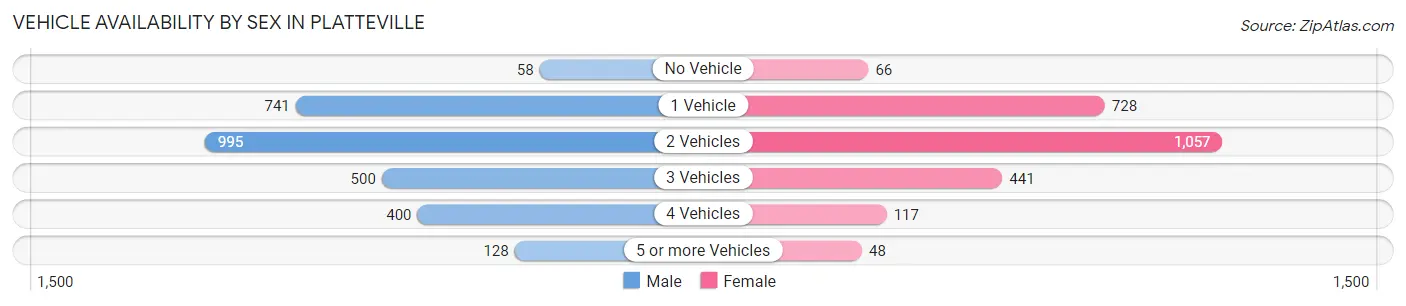
| Vehicles Available | Male | Female |
| No Vehicle | 58 (2.1%) | 66 (2.7%) |
| 1 Vehicle | 741 (26.3%) | 728 (29.6%) |
| 2 Vehicles | 995 (35.3%) | 1,057 (43.0%) |
| 3 Vehicles | 500 (17.7%) | 441 (17.9%) |
| 4 Vehicles | 400 (14.2%) | 117 (4.8%) |
| 5 or more Vehicles | 128 (4.5%) | 48 (1.9%) |
| Total | 2,822 (100.0%) | 2,457 (100.0%) |
Commute Time in Platteville
The most frequently occuring commute durations in Platteville are 5 to 9 minutes (2,091 commuters, 35.5%), 10 to 14 minutes (1,058 commuters, 18.0%), and less than 5 minutes (512 commuters, 8.7%).
| Commute Time | # Commuters | % Commuters |
| Less than 5 Minutes | 512 | 8.7% |
| 5 to 9 Minutes | 2,091 | 35.5% |
| 10 to 14 Minutes | 1,058 | 18.0% |
| 15 to 19 Minutes | 317 | 5.4% |
| 20 to 24 Minutes | 497 | 8.4% |
| 25 to 29 Minutes | 388 | 6.6% |
| 30 to 34 Minutes | 396 | 6.7% |
| 35 to 39 Minutes | 140 | 2.4% |
| 40 to 44 Minutes | 170 | 2.9% |
| 45 to 59 Minutes | 84 | 1.4% |
| 60 to 89 Minutes | 174 | 2.9% |
| 90 or more Minutes | 62 | 1.1% |
Commute Time by Sex in Platteville
The most common commute times in Platteville are 5 to 9 minutes (1,052 commuters, 32.7%) for males and 5 to 9 minutes (1,039 commuters, 38.8%) for females.
| Commute Time | Male | Female |
| Less than 5 Minutes | 370 (11.5%) | 142 (5.3%) |
| 5 to 9 Minutes | 1,052 (32.7%) | 1,039 (38.8%) |
| 10 to 14 Minutes | 657 (20.4%) | 401 (15.0%) |
| 15 to 19 Minutes | 166 (5.2%) | 151 (5.6%) |
| 20 to 24 Minutes | 143 (4.4%) | 354 (13.2%) |
| 25 to 29 Minutes | 319 (9.9%) | 69 (2.6%) |
| 30 to 34 Minutes | 161 (5.0%) | 235 (8.8%) |
| 35 to 39 Minutes | 94 (2.9%) | 46 (1.7%) |
| 40 to 44 Minutes | 89 (2.8%) | 81 (3.0%) |
| 45 to 59 Minutes | 13 (0.4%) | 71 (2.6%) |
| 60 to 89 Minutes | 107 (3.3%) | 67 (2.5%) |
| 90 or more Minutes | 43 (1.3%) | 19 (0.7%) |
Time of Departure to Work by Sex in Platteville
The most frequent times of departure to work in Platteville are 12:00 PM to 3:59 PM (465, 14.5%) for males and 7:00 AM to 7:29 AM (606, 22.7%) for females.
| Time of Departure | Male | Female |
| 12:00 AM to 4:59 AM | 110 (3.4%) | 39 (1.5%) |
| 5:00 AM to 5:29 AM | 62 (1.9%) | 55 (2.1%) |
| 5:30 AM to 5:59 AM | 221 (6.9%) | 69 (2.6%) |
| 6:00 AM to 6:29 AM | 67 (2.1%) | 35 (1.3%) |
| 6:30 AM to 6:59 AM | 221 (6.9%) | 329 (12.3%) |
| 7:00 AM to 7:29 AM | 451 (14.0%) | 606 (22.7%) |
| 7:30 AM to 7:59 AM | 391 (12.2%) | 391 (14.6%) |
| 8:00 AM to 8:29 AM | 304 (9.5%) | 220 (8.2%) |
| 8:30 AM to 8:59 AM | 136 (4.2%) | 182 (6.8%) |
| 9:00 AM to 9:59 AM | 268 (8.3%) | 27 (1.0%) |
| 10:00 AM to 10:59 AM | 155 (4.8%) | 166 (6.2%) |
| 11:00 AM to 11:59 AM | 25 (0.8%) | 78 (2.9%) |
| 12:00 PM to 3:59 PM | 465 (14.5%) | 377 (14.1%) |
| 4:00 PM to 11:59 PM | 338 (10.5%) | 101 (3.8%) |
| Total | 3,214 (100.0%) | 2,675 (100.0%) |
Housing Occupancy in Platteville
Occupancy by Ownership in Platteville
Of the total 4,109 dwellings in Platteville, owner-occupied units account for 1,624 (39.5%), while renter-occupied units make up 2,485 (60.5%).
| Occupancy | # Housing Units | % Housing Units |
| Owner Occupied Housing Units | 1,624 | 39.5% |
| Renter-Occupied Housing Units | 2,485 | 60.5% |
| Total Occupied Housing Units | 4,109 | 100.0% |
Occupancy by Household Size in Platteville
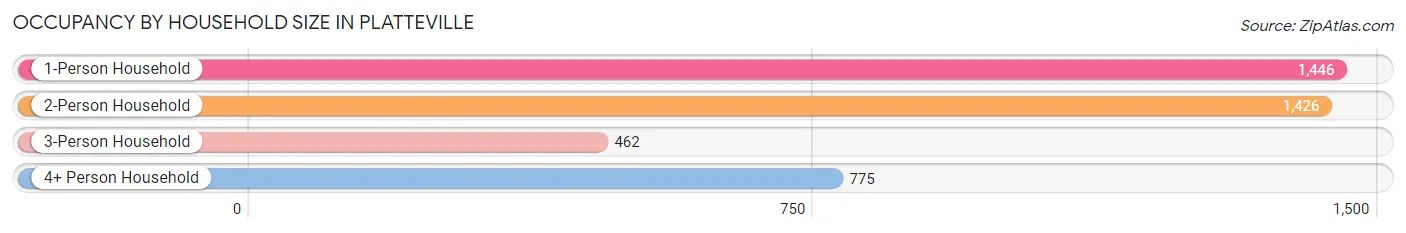
| Household Size | # Housing Units | % Housing Units |
| 1-Person Household | 1,446 | 35.2% |
| 2-Person Household | 1,426 | 34.7% |
| 3-Person Household | 462 | 11.2% |
| 4+ Person Household | 775 | 18.9% |
| Total Housing Units | 4,109 | 100.0% |
Occupancy by Ownership by Household Size in Platteville
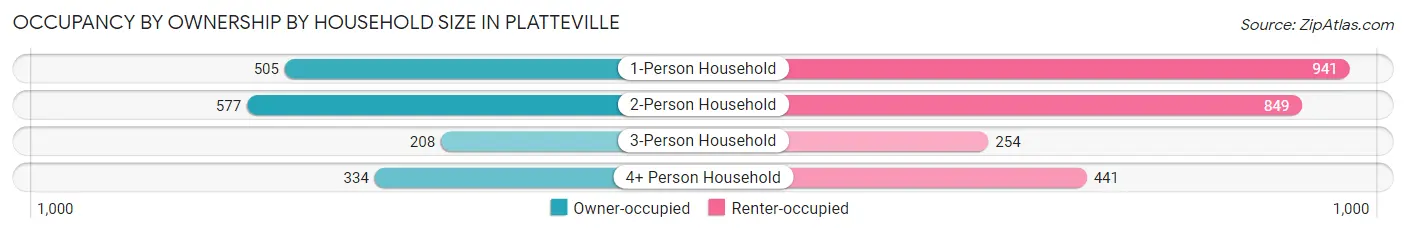
| Household Size | Owner-occupied | Renter-occupied |
| 1-Person Household | 505 (34.9%) | 941 (65.1%) |
| 2-Person Household | 577 (40.5%) | 849 (59.5%) |
| 3-Person Household | 208 (45.0%) | 254 (55.0%) |
| 4+ Person Household | 334 (43.1%) | 441 (56.9%) |
| Total Housing Units | 1,624 (39.5%) | 2,485 (60.5%) |
Occupancy by Educational Attainment in Platteville
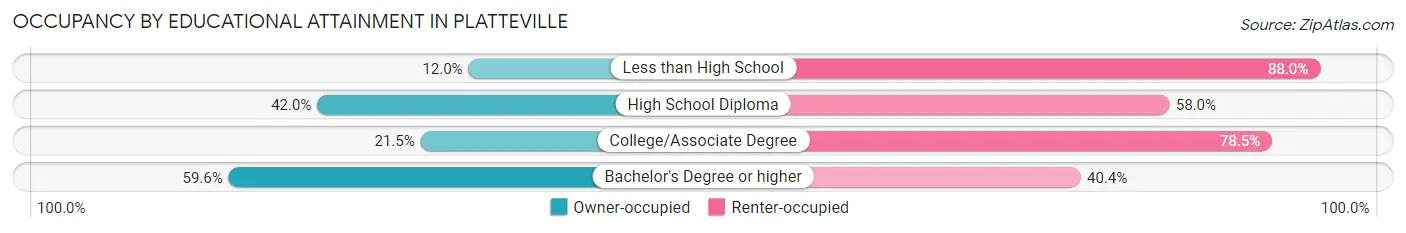
| Household Size | Owner-occupied | Renter-occupied |
| Less than High School | 18 (12.0%) | 132 (88.0%) |
| High School Diploma | 283 (42.0%) | 391 (58.0%) |
| College/Associate Degree | 358 (21.5%) | 1,307 (78.5%) |
| Bachelor's Degree or higher | 965 (59.6%) | 655 (40.4%) |
Occupancy by Age of Householder in Platteville
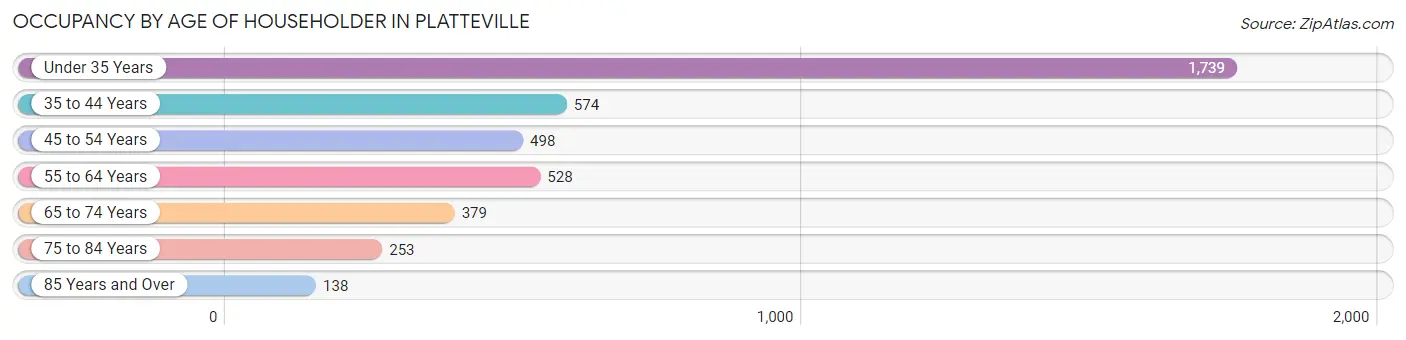
| Age Bracket | # Households | % Households |
| Under 35 Years | 1,739 | 42.3% |
| 35 to 44 Years | 574 | 14.0% |
| 45 to 54 Years | 498 | 12.1% |
| 55 to 64 Years | 528 | 12.9% |
| 65 to 74 Years | 379 | 9.2% |
| 75 to 84 Years | 253 | 6.2% |
| 85 Years and Over | 138 | 3.4% |
| Total | 4,109 | 100.0% |
Housing Finances in Platteville
Median Income by Occupancy in Platteville
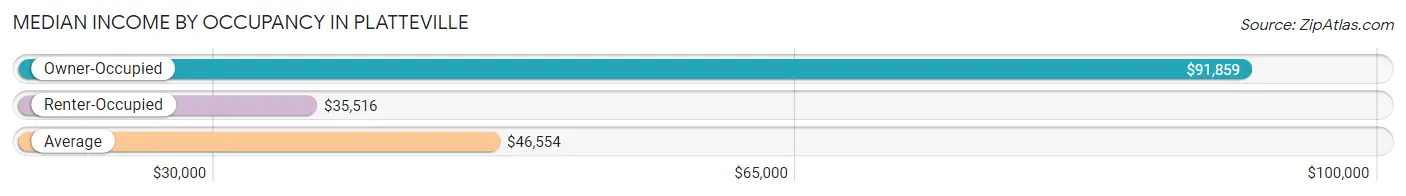
| Occupancy Type | # Households | Median Income |
| Owner-Occupied | 1,624 (39.5%) | $91,859 |
| Renter-Occupied | 2,485 (60.5%) | $35,516 |
| Average | 4,109 (100.0%) | $46,554 |
Occupancy by Householder Income Bracket in Platteville
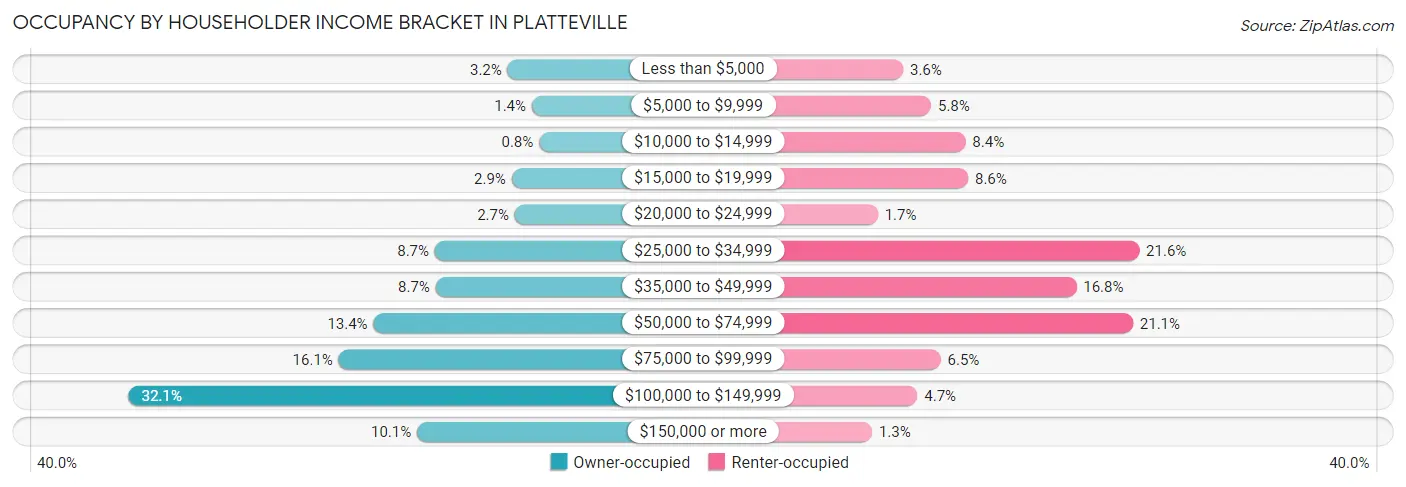
| Income Bracket | Owner-occupied | Renter-occupied |
| Less than $5,000 | 52 (3.2%) | 90 (3.6%) |
| $5,000 to $9,999 | 22 (1.3%) | 143 (5.8%) |
| $10,000 to $14,999 | 13 (0.8%) | 208 (8.4%) |
| $15,000 to $19,999 | 47 (2.9%) | 213 (8.6%) |
| $20,000 to $24,999 | 43 (2.6%) | 42 (1.7%) |
| $25,000 to $34,999 | 142 (8.7%) | 537 (21.6%) |
| $35,000 to $49,999 | 141 (8.7%) | 418 (16.8%) |
| $50,000 to $74,999 | 218 (13.4%) | 525 (21.1%) |
| $75,000 to $99,999 | 261 (16.1%) | 161 (6.5%) |
| $100,000 to $149,999 | 521 (32.1%) | 117 (4.7%) |
| $150,000 or more | 164 (10.1%) | 31 (1.3%) |
| Total | 1,624 (100.0%) | 2,485 (100.0%) |
Monthly Housing Cost Tiers in Platteville
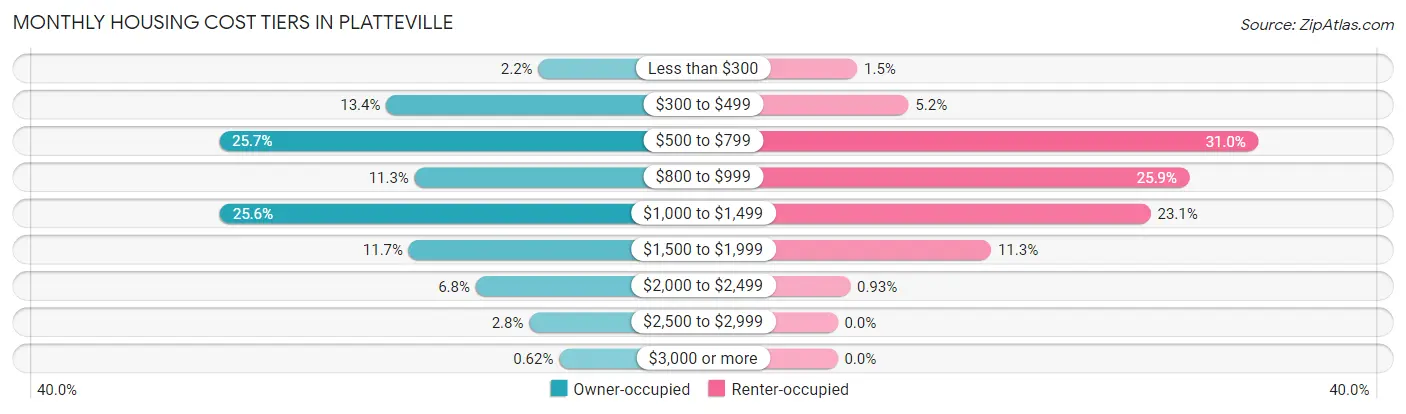
| Monthly Cost | Owner-occupied | Renter-occupied |
| Less than $300 | 35 (2.2%) | 36 (1.5%) |
| $300 to $499 | 217 (13.4%) | 130 (5.2%) |
| $500 to $799 | 417 (25.7%) | 769 (30.9%) |
| $800 to $999 | 183 (11.3%) | 643 (25.9%) |
| $1,000 to $1,499 | 416 (25.6%) | 573 (23.1%) |
| $1,500 to $1,999 | 190 (11.7%) | 281 (11.3%) |
| $2,000 to $2,499 | 110 (6.8%) | 23 (0.9%) |
| $2,500 to $2,999 | 46 (2.8%) | 0 (0.0%) |
| $3,000 or more | 10 (0.6%) | 0 (0.0%) |
| Total | 1,624 (100.0%) | 2,485 (100.0%) |
Physical Housing Characteristics in Platteville
Housing Structures in Platteville
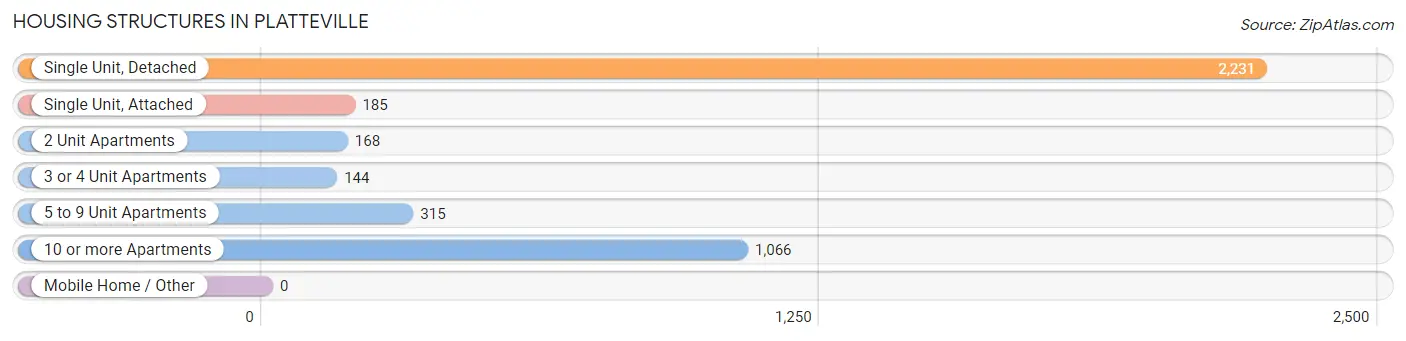
| Structure Type | # Housing Units | % Housing Units |
| Single Unit, Detached | 2,231 | 54.3% |
| Single Unit, Attached | 185 | 4.5% |
| 2 Unit Apartments | 168 | 4.1% |
| 3 or 4 Unit Apartments | 144 | 3.5% |
| 5 to 9 Unit Apartments | 315 | 7.7% |
| 10 or more Apartments | 1,066 | 25.9% |
| Mobile Home / Other | 0 | 0.0% |
| Total | 4,109 | 100.0% |
Housing Structures by Occupancy in Platteville
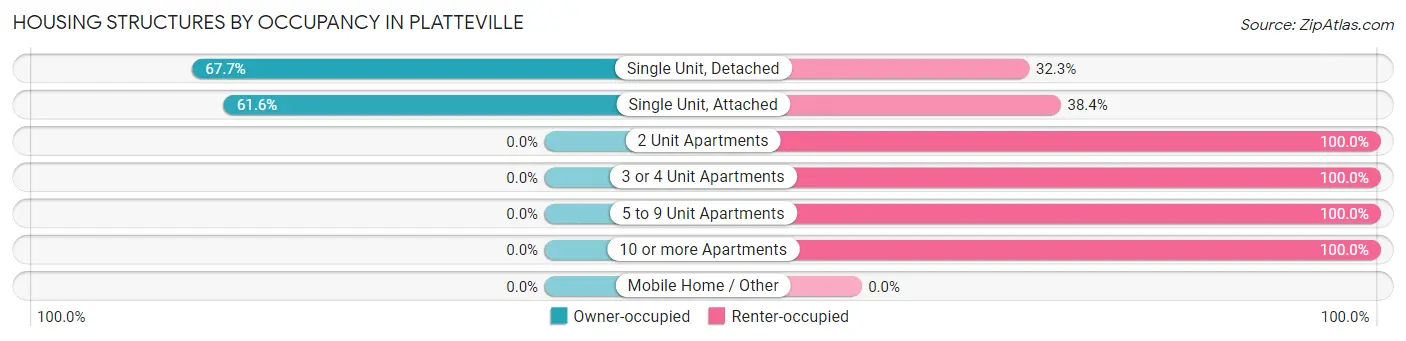
| Structure Type | Owner-occupied | Renter-occupied |
| Single Unit, Detached | 1,510 (67.7%) | 721 (32.3%) |
| Single Unit, Attached | 114 (61.6%) | 71 (38.4%) |
| 2 Unit Apartments | 0 (0.0%) | 168 (100.0%) |
| 3 or 4 Unit Apartments | 0 (0.0%) | 144 (100.0%) |
| 5 to 9 Unit Apartments | 0 (0.0%) | 315 (100.0%) |
| 10 or more Apartments | 0 (0.0%) | 1,066 (100.0%) |
| Mobile Home / Other | 0 (0.0%) | 0 (0.0%) |
| Total | 1,624 (39.5%) | 2,485 (60.5%) |
Housing Structures by Number of Rooms in Platteville
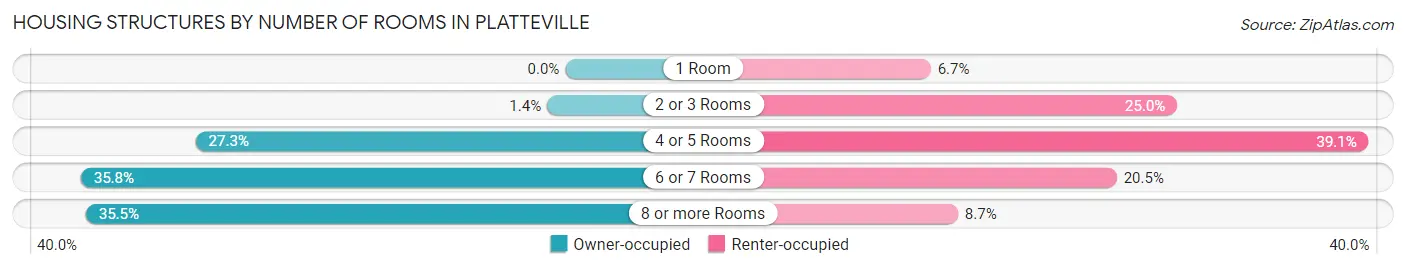
| Number of Rooms | Owner-occupied | Renter-occupied |
| 1 Room | 0 (0.0%) | 167 (6.7%) |
| 2 or 3 Rooms | 22 (1.3%) | 620 (24.9%) |
| 4 or 5 Rooms | 444 (27.3%) | 972 (39.1%) |
| 6 or 7 Rooms | 582 (35.8%) | 509 (20.5%) |
| 8 or more Rooms | 576 (35.5%) | 217 (8.7%) |
| Total | 1,624 (100.0%) | 2,485 (100.0%) |
Housing Structure by Heating Type in Platteville
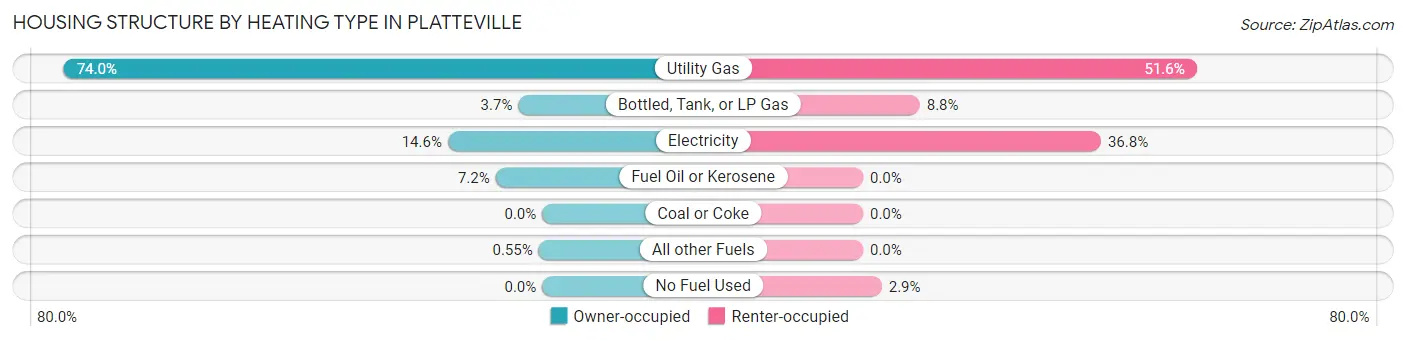
| Heating Type | Owner-occupied | Renter-occupied |
| Utility Gas | 1,201 (74.0%) | 1,281 (51.5%) |
| Bottled, Tank, or LP Gas | 60 (3.7%) | 218 (8.8%) |
| Electricity | 237 (14.6%) | 914 (36.8%) |
| Fuel Oil or Kerosene | 117 (7.2%) | 0 (0.0%) |
| Coal or Coke | 0 (0.0%) | 0 (0.0%) |
| All other Fuels | 9 (0.5%) | 0 (0.0%) |
| No Fuel Used | 0 (0.0%) | 72 (2.9%) |
| Total | 1,624 (100.0%) | 2,485 (100.0%) |
Household Vehicle Usage in Platteville
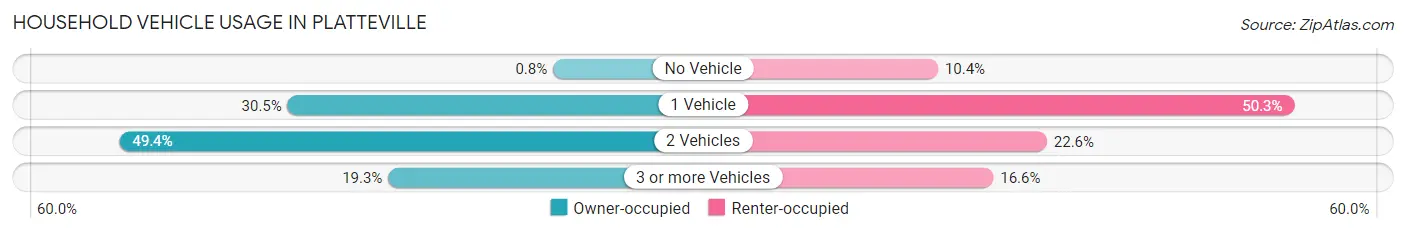
| Vehicles per Household | Owner-occupied | Renter-occupied |
| No Vehicle | 13 (0.8%) | 259 (10.4%) |
| 1 Vehicle | 496 (30.5%) | 1,251 (50.3%) |
| 2 Vehicles | 802 (49.4%) | 562 (22.6%) |
| 3 or more Vehicles | 313 (19.3%) | 413 (16.6%) |
| Total | 1,624 (100.0%) | 2,485 (100.0%) |
Real Estate & Mortgages in Platteville
Real Estate and Mortgage Overview in Platteville
| Characteristic | Without Mortgage | With Mortgage |
| Housing Units | 772 | 852 |
| Median Property Value | $167,000 | $190,400 |
| Median Household Income | $68,684 | $63 |
| Monthly Housing Costs | $627 | $10 |
| Real Estate Taxes | $3,448 | $0 |
Property Value by Mortgage Status in Platteville
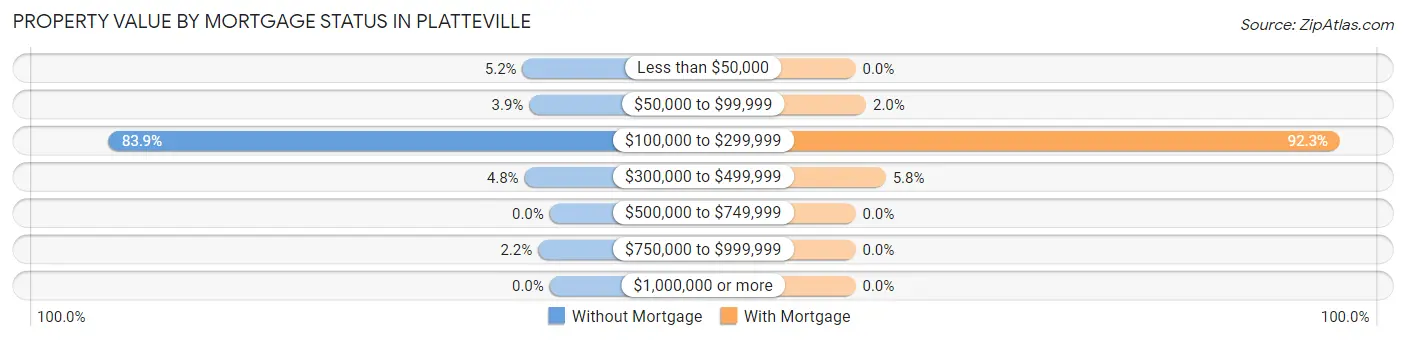
| Property Value | Without Mortgage | With Mortgage |
| Less than $50,000 | 40 (5.2%) | 0 (0.0%) |
| $50,000 to $99,999 | 30 (3.9%) | 17 (2.0%) |
| $100,000 to $299,999 | 648 (83.9%) | 786 (92.2%) |
| $300,000 to $499,999 | 37 (4.8%) | 49 (5.8%) |
| $500,000 to $749,999 | 0 (0.0%) | 0 (0.0%) |
| $750,000 to $999,999 | 17 (2.2%) | 0 (0.0%) |
| $1,000,000 or more | 0 (0.0%) | 0 (0.0%) |
| Total | 772 (100.0%) | 852 (100.0%) |
Household Income by Mortgage Status in Platteville
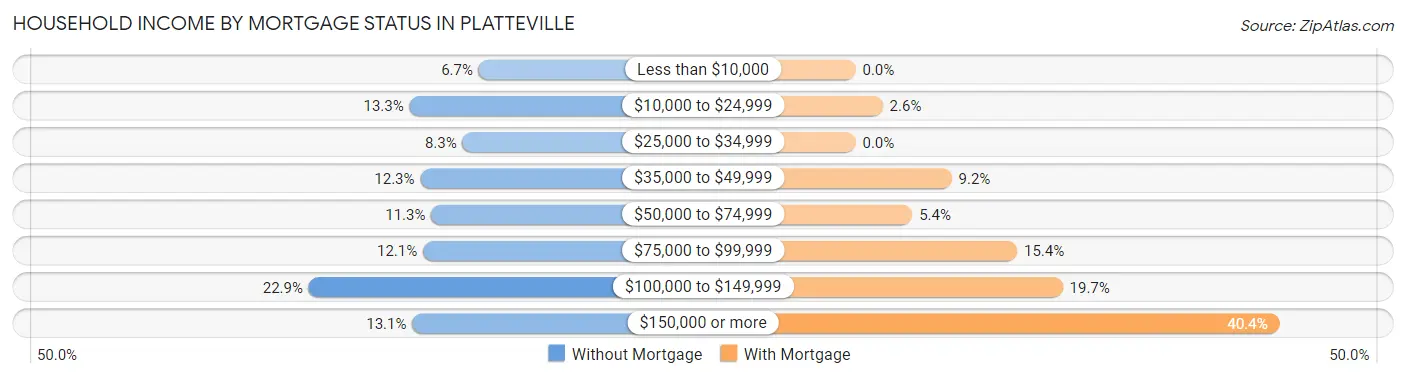
| Household Income | Without Mortgage | With Mortgage |
| Less than $10,000 | 52 (6.7%) | 0 (0.0%) |
| $10,000 to $24,999 | 103 (13.3%) | 22 (2.6%) |
| $25,000 to $34,999 | 64 (8.3%) | 0 (0.0%) |
| $35,000 to $49,999 | 95 (12.3%) | 78 (9.1%) |
| $50,000 to $74,999 | 87 (11.3%) | 46 (5.4%) |
| $75,000 to $99,999 | 93 (12.0%) | 131 (15.4%) |
| $100,000 to $149,999 | 177 (22.9%) | 168 (19.7%) |
| $150,000 or more | 101 (13.1%) | 344 (40.4%) |
| Total | 772 (100.0%) | 852 (100.0%) |
Property Value to Household Income Ratio in Platteville
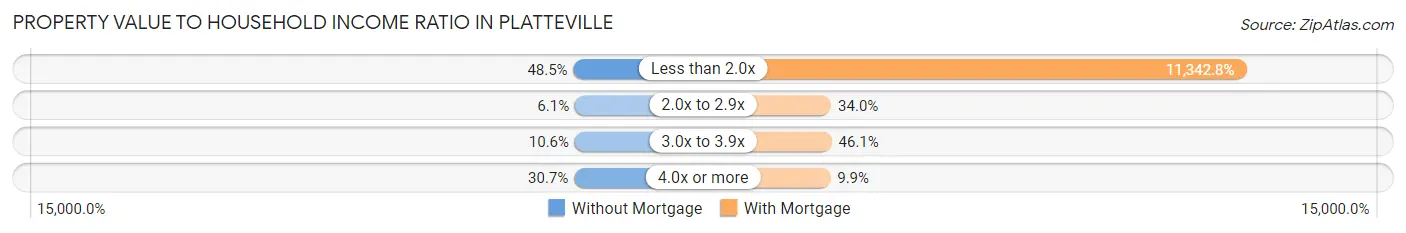
| Value-to-Income Ratio | Without Mortgage | With Mortgage |
| Less than 2.0x | 374 (48.4%) | 96,641 (11,342.8%) |
| 2.0x to 2.9x | 47 (6.1%) | 290 (34.0%) |
| 3.0x to 3.9x | 82 (10.6%) | 393 (46.1%) |
| 4.0x or more | 237 (30.7%) | 84 (9.9%) |
| Total | 772 (100.0%) | 852 (100.0%) |
Real Estate Taxes by Mortgage Status in Platteville
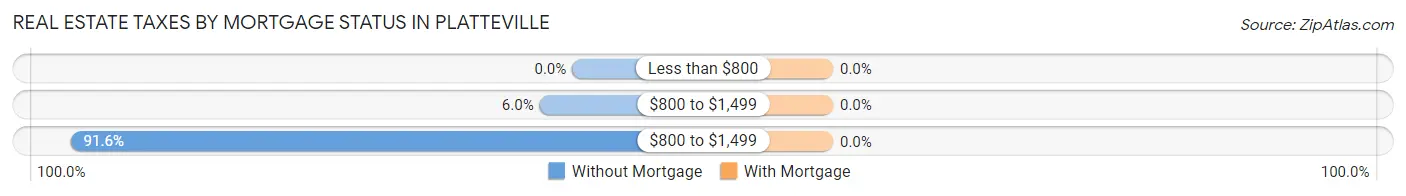
| Property Taxes | Without Mortgage | With Mortgage |
| Less than $800 | 0 (0.0%) | 0 (0.0%) |
| $800 to $1,499 | 46 (6.0%) | 0 (0.0%) |
| $800 to $1,499 | 707 (91.6%) | 0 (0.0%) |
| Total | 772 (100.0%) | 852 (100.0%) |
Health & Disability in Platteville
Health Insurance Coverage by Age in Platteville
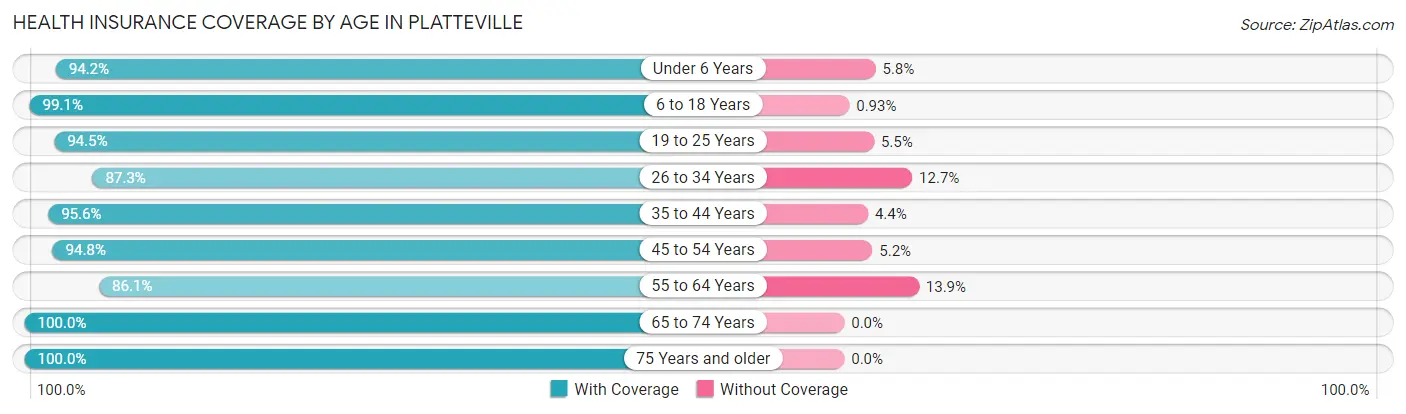
| Age Bracket | With Coverage | Without Coverage |
| Under 6 Years | 388 (94.2%) | 24 (5.8%) |
| 6 to 18 Years | 1,920 (99.1%) | 18 (0.9%) |
| 19 to 25 Years | 4,065 (94.5%) | 238 (5.5%) |
| 26 to 34 Years | 1,042 (87.3%) | 151 (12.7%) |
| 35 to 44 Years | 867 (95.6%) | 40 (4.4%) |
| 45 to 54 Years | 761 (94.8%) | 42 (5.2%) |
| 55 to 64 Years | 632 (86.1%) | 102 (13.9%) |
| 65 to 74 Years | 613 (100.0%) | 0 (0.0%) |
| 75 Years and older | 524 (100.0%) | 0 (0.0%) |
| Total | 10,812 (94.6%) | 615 (5.4%) |
Health Insurance Coverage by Citizenship Status in Platteville
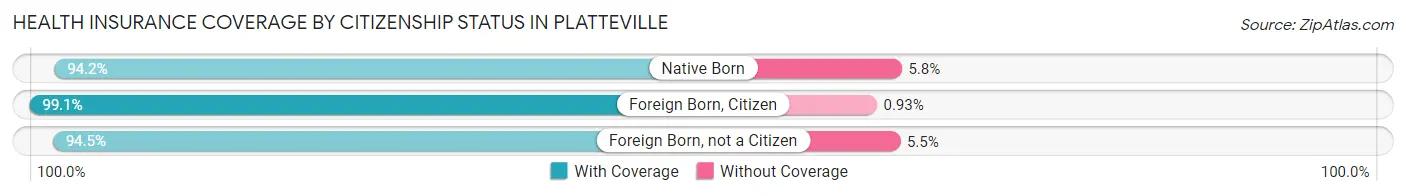
| Citizenship Status | With Coverage | Without Coverage |
| Native Born | 388 (94.2%) | 24 (5.8%) |
| Foreign Born, Citizen | 1,920 (99.1%) | 18 (0.9%) |
| Foreign Born, not a Citizen | 4,065 (94.5%) | 238 (5.5%) |
Health Insurance Coverage by Household Income in Platteville
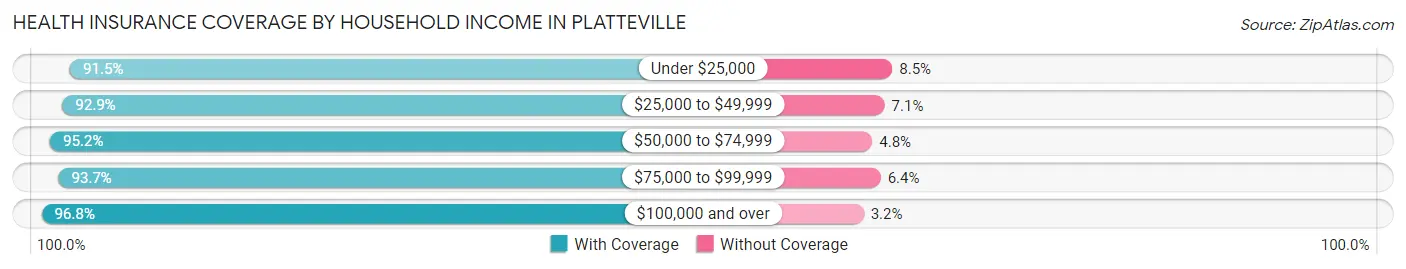
| Household Income | With Coverage | Without Coverage |
| Under $25,000 | 1,425 (91.5%) | 133 (8.5%) |
| $25,000 to $49,999 | 2,295 (92.9%) | 175 (7.1%) |
| $50,000 to $74,999 | 1,614 (95.2%) | 81 (4.8%) |
| $75,000 to $99,999 | 1,091 (93.6%) | 74 (6.4%) |
| $100,000 and over | 2,231 (96.8%) | 73 (3.2%) |
Public vs Private Health Insurance Coverage by Age in Platteville
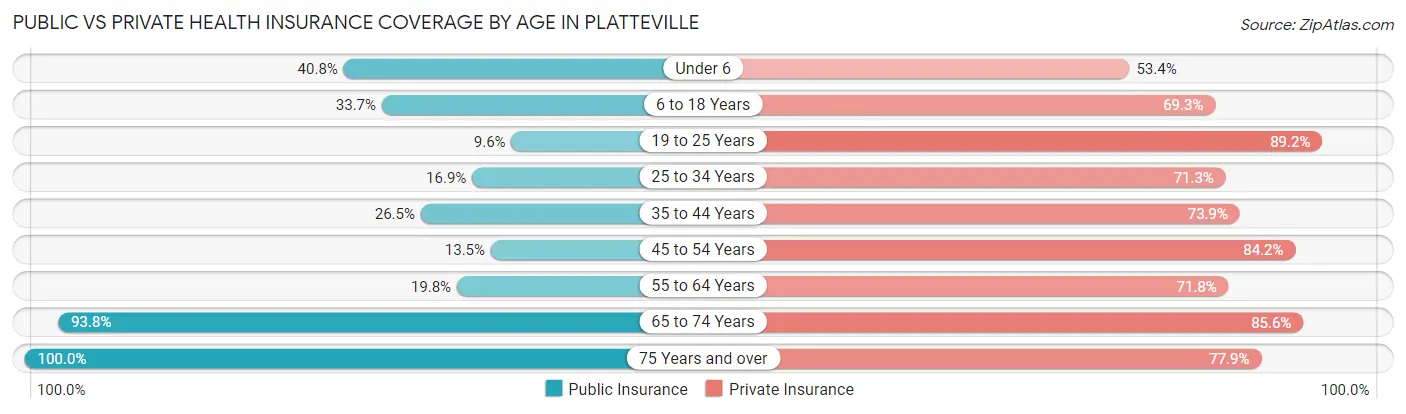
| Age Bracket | Public Insurance | Private Insurance |
| Under 6 | 168 (40.8%) | 220 (53.4%) |
| 6 to 18 Years | 653 (33.7%) | 1,343 (69.3%) |
| 19 to 25 Years | 415 (9.6%) | 3,837 (89.2%) |
| 25 to 34 Years | 202 (16.9%) | 850 (71.3%) |
| 35 to 44 Years | 240 (26.5%) | 670 (73.9%) |
| 45 to 54 Years | 108 (13.5%) | 676 (84.2%) |
| 55 to 64 Years | 145 (19.8%) | 527 (71.8%) |
| 65 to 74 Years | 575 (93.8%) | 525 (85.6%) |
| 75 Years and over | 524 (100.0%) | 408 (77.9%) |
| Total | 3,030 (26.5%) | 9,056 (79.2%) |
Disability Status by Sex by Age in Platteville
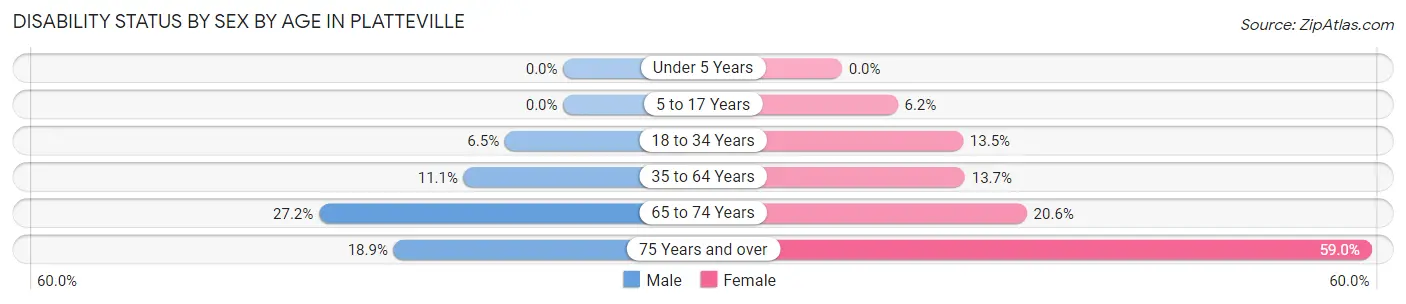
| Age Bracket | Male | Female |
| Under 5 Years | 0 (0.0%) | 0 (0.0%) |
| 5 to 17 Years | 0 (0.0%) | 41 (6.2%) |
| 18 to 34 Years | 257 (6.5%) | 309 (13.5%) |
| 35 to 64 Years | 127 (11.1%) | 178 (13.7%) |
| 65 to 74 Years | 65 (27.2%) | 77 (20.6%) |
| 75 Years and over | 34 (18.9%) | 203 (59.0%) |
Disability Class by Sex by Age in Platteville
Disability Class: Hearing Difficulty
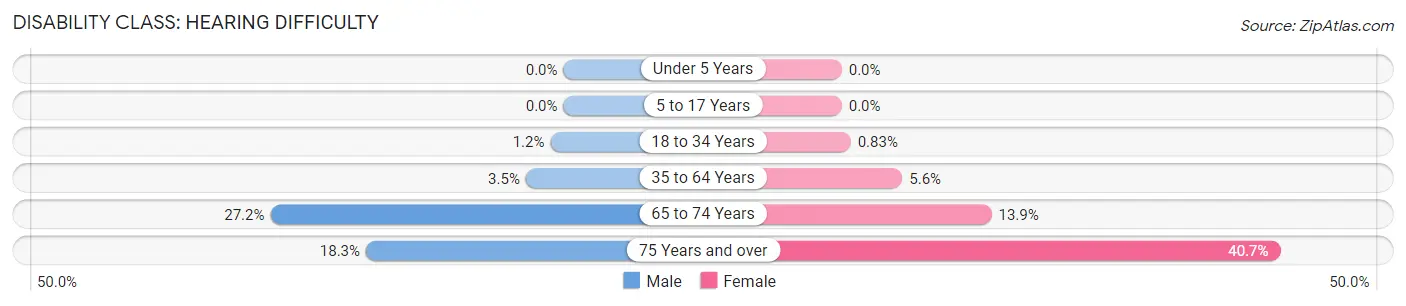
| Age Bracket | Male | Female |
| Under 5 Years | 0 (0.0%) | 0 (0.0%) |
| 5 to 17 Years | 0 (0.0%) | 0 (0.0%) |
| 18 to 34 Years | 48 (1.2%) | 19 (0.8%) |
| 35 to 64 Years | 40 (3.5%) | 73 (5.6%) |
| 65 to 74 Years | 65 (27.2%) | 52 (13.9%) |
| 75 Years and over | 33 (18.3%) | 140 (40.7%) |
Disability Class: Vision Difficulty
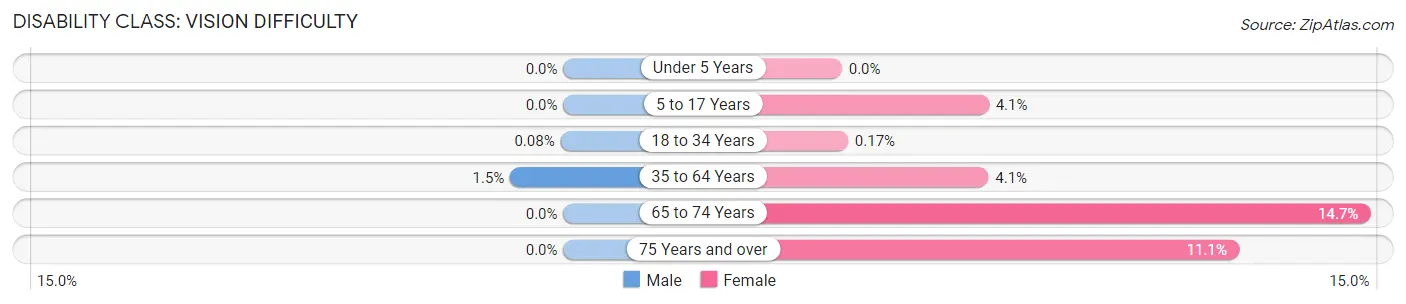
| Age Bracket | Male | Female |
| Under 5 Years | 0 (0.0%) | 0 (0.0%) |
| 5 to 17 Years | 0 (0.0%) | 27 (4.1%) |
| 18 to 34 Years | 3 (0.1%) | 4 (0.2%) |
| 35 to 64 Years | 17 (1.5%) | 53 (4.1%) |
| 65 to 74 Years | 0 (0.0%) | 55 (14.7%) |
| 75 Years and over | 0 (0.0%) | 38 (11.1%) |
Disability Class: Cognitive Difficulty
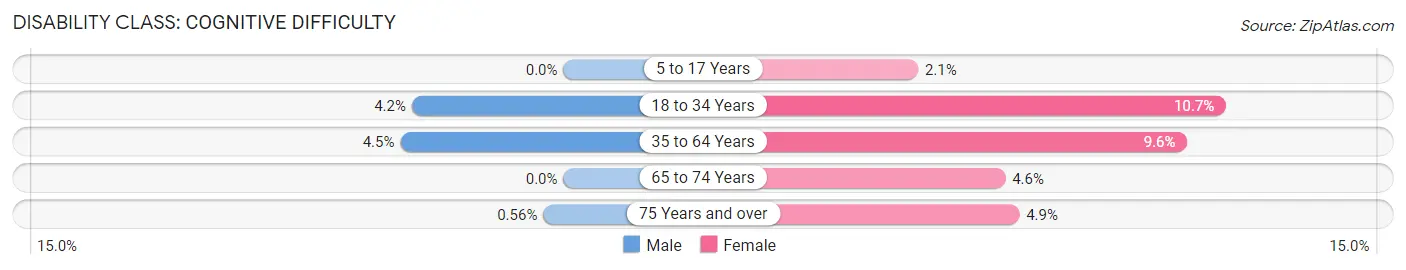
| Age Bracket | Male | Female |
| 5 to 17 Years | 0 (0.0%) | 14 (2.1%) |
| 18 to 34 Years | 167 (4.2%) | 245 (10.7%) |
| 35 to 64 Years | 52 (4.5%) | 125 (9.6%) |
| 65 to 74 Years | 0 (0.0%) | 17 (4.5%) |
| 75 Years and over | 1 (0.6%) | 17 (4.9%) |
Disability Class: Ambulatory Difficulty
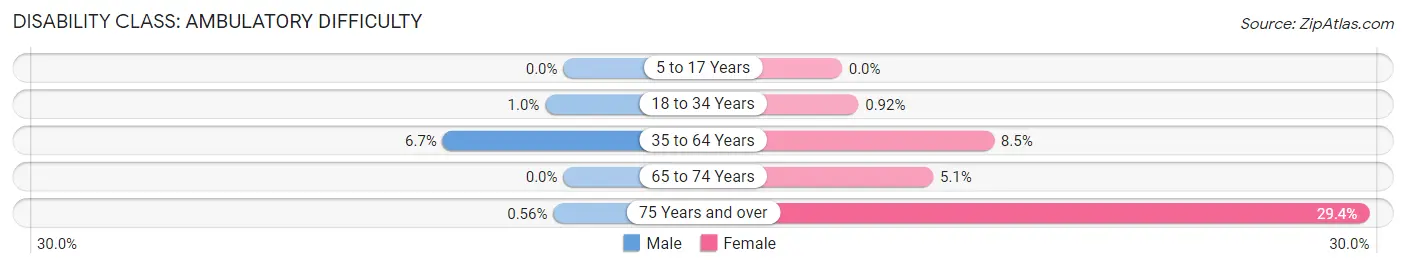
| Age Bracket | Male | Female |
| 5 to 17 Years | 0 (0.0%) | 0 (0.0%) |
| 18 to 34 Years | 40 (1.0%) | 21 (0.9%) |
| 35 to 64 Years | 77 (6.7%) | 110 (8.5%) |
| 65 to 74 Years | 0 (0.0%) | 19 (5.1%) |
| 75 Years and over | 1 (0.6%) | 101 (29.4%) |
Disability Class: Self-Care Difficulty
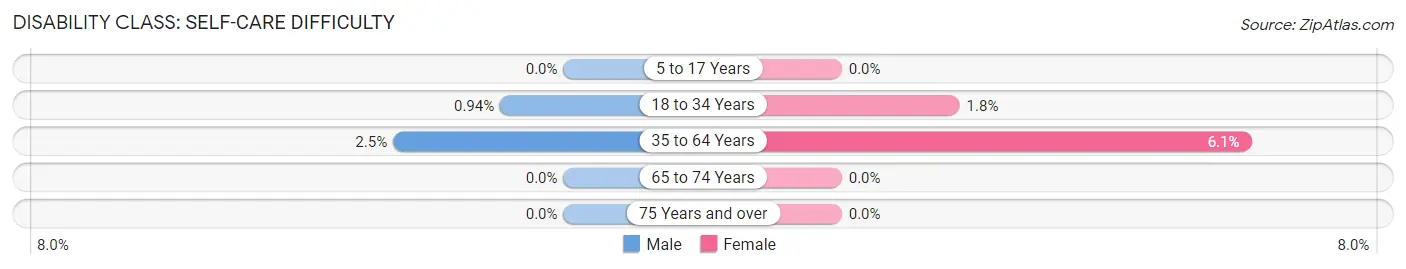
| Age Bracket | Male | Female |
| 5 to 17 Years | 0 (0.0%) | 0 (0.0%) |
| 18 to 34 Years | 37 (0.9%) | 40 (1.8%) |
| 35 to 64 Years | 29 (2.5%) | 79 (6.1%) |
| 65 to 74 Years | 0 (0.0%) | 0 (0.0%) |
| 75 Years and over | 0 (0.0%) | 0 (0.0%) |
Technology Access in Platteville
Computing Device Access in Platteville
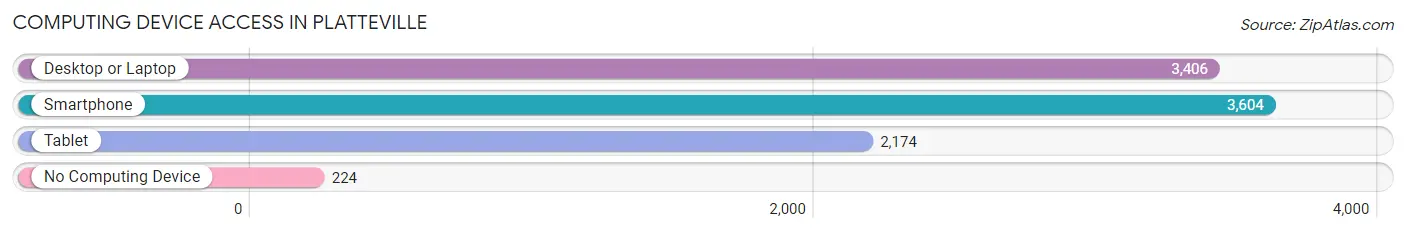
| Device Type | # Households | % Households |
| Desktop or Laptop | 3,406 | 82.9% |
| Smartphone | 3,604 | 87.7% |
| Tablet | 2,174 | 52.9% |
| No Computing Device | 224 | 5.4% |
| Total | 4,109 | 100.0% |
Internet Access in Platteville
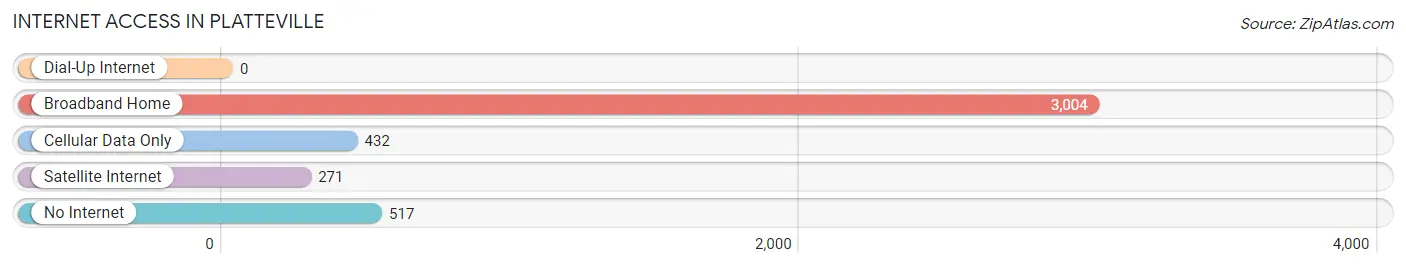
| Internet Type | # Households | % Households |
| Dial-Up Internet | 0 | 0.0% |
| Broadband Home | 3,004 | 73.1% |
| Cellular Data Only | 432 | 10.5% |
| Satellite Internet | 271 | 6.6% |
| No Internet | 517 | 12.6% |
| Total | 4,109 | 100.0% |
Platteville Summary
Platteville, Wisconsin is a small city located in the southwestern corner of the state. It is the county seat of Grant County and is home to the University of Wisconsin-Platteville. The city has a population of 11,224 as of the 2020 census.
History
Platteville was founded in 1827 by Moses Meeker, a surveyor from New York. He named the city after the Platte River, which runs through the area. The city was incorporated in 1851 and was the first city in Grant County.
In the late 19th century, Platteville was a major center for the mining of lead and zinc. The city was home to several large mining companies, including the Platteville Mining Company, which was founded in 1872. The city was also home to the Platteville Iron Works, which produced iron products for the mining industry.
The University of Wisconsin-Platteville was founded in 1866 and is the oldest university in the state. The university has grown to become one of the largest universities in the state, with an enrollment of over 8,000 students.
Geography
Platteville is located in the southwestern corner of Wisconsin, in Grant County. The city is situated on the banks of the Platte River, which runs through the city. The city is surrounded by rolling hills and is located in the Driftless Area, which is characterized by its rugged terrain and lack of glaciation.
The city has a total area of 5.3 square miles, of which 5.2 square miles is land and 0.1 square miles is water. The city has a humid continental climate, with cold winters and hot, humid summers.
Economy
Platteville's economy is largely based on education, manufacturing, and agriculture. The University of Wisconsin-Platteville is the largest employer in the city, with over 2,000 employees. The city is also home to several manufacturing companies, including the Platteville Iron Works, which produces iron products for the mining industry.
Agriculture is also an important part of the city's economy. The city is home to several dairy farms, as well as a number of vegetable and fruit farms.
Demographics
As of the 2020 census, Platteville had a population of 11,224. The racial makeup of the city was 94.2% White, 1.2% African American, 0.7% Native American, 1.2% Asian, 0.2% Pacific Islander, 1.2% from other races, and 1.5% from two or more races. Hispanic or Latino of any race were 3.2% of the population.
The median household income in Platteville was $45,945, and the median family income was $58,945. The per capita income for the city was $22,945. About 11.2% of families and 16.2% of the population were below the poverty line, including 22.2% of those under age 18 and 8.2% of those age 65 or over.
Common Questions
What is Per Capita Income in Platteville?
Per Capita income in Platteville is $24,992.
What is the Median Family Income in Platteville?
Median Family Income in Platteville is $90,119.
What is the Median Household income in Platteville?
Median Household Income in Platteville is $46,554.
What is Income or Wage Gap in Platteville?
Income or Wage Gap in Platteville is 14.3%.
Women in Platteville earn 85.7 cents for every dollar earned by a man.
What is Inequality or Gini Index in Platteville?
Inequality or Gini Index in Platteville is 0.46.
What is the Total Population of Platteville?
Total Population of Platteville is 11,543.
What is the Total Male Population of Platteville?
Total Male Population of Platteville is 6,393.
What is the Total Female Population of Platteville?
Total Female Population of Platteville is 5,150.
What is the Ratio of Males per 100 Females in Platteville?
There are 124.14 Males per 100 Females in Platteville.
What is the Ratio of Females per 100 Males in Platteville?
There are 80.56 Females per 100 Males in Platteville.
What is the Median Population Age in Platteville?
Median Population Age in Platteville is 22.9 Years.
What is the Average Family Size in Platteville
Average Family Size in Platteville is 3.0 People.
What is the Average Household Size in Platteville
Average Household Size in Platteville is 2.2 People.
How Large is the Labor Force in Platteville?
There are 6,675 People in the Labor Forcein in Platteville.
What is the Percentage of People in the Labor Force in Platteville?
65.2% of People are in the Labor Force in Platteville.
What is the Unemployment Rate in Platteville?
Unemployment Rate in Platteville is 4.2%.