Pembine, WI Map & Demographics
Pembine Map
Pembine Overview
$13,177
PER CAPITA INCOME
$85,682
AVG FAMILY INCOME
$28,722
AVG HOUSEHOLD INCOME
0.28
INEQUALITY / GINI INDEX
223
TOTAL POPULATION
114
MALE POPULATION
109
FEMALE POPULATION
104.59
MALES / 100 FEMALES
95.61
FEMALES / 100 MALES
43.4
MEDIAN AGE
2.9
AVG FAMILY SIZE
2.9
AVG HOUSEHOLD SIZE
59
LABOR FORCE [ PEOPLE ]
44.4%
PERCENT IN LABOR FORCE
Pembine Zip Codes
Pembine Area Codes
Income in Pembine
Income Overview in Pembine
Per Capita Income in Pembine is $13,177, while median incomes of families and households are $85,682 and $28,722 respectively.
| Characteristic | Number | Measure |
| Per Capita Income | 223 | $13,177 |
| Median Family Income | 16 | $85,682 |
| Mean Family Income | 16 | $80,731 |
| Median Household Income | 77 | $28,722 |
| Mean Household Income | 77 | $37,503 |
| Income Deficit | 16 | $0 |
| Wage / Income Gap (%) | 223 | 0.00% |
| Wage / Income Gap ($) | 223 | 100.00¢ per $1 |
| Gini / Inequality Index | 223 | 0.28 |
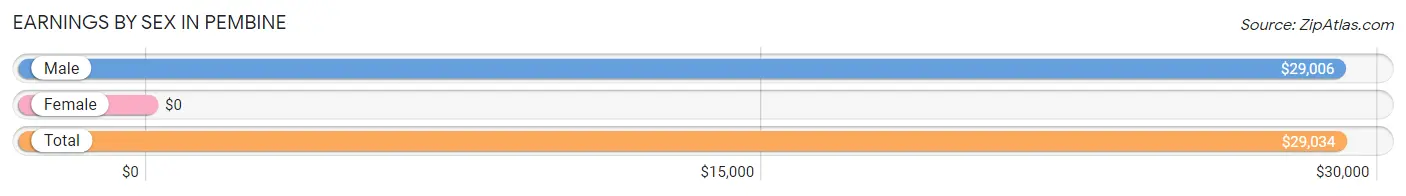
Earnings by Sex in Pembine
| Sex | Number | Average Earnings |
| Male | 59 (92.2%) | $29,006 |
| Female | 5 (7.8%) | $0 |
| Total | 64 (100.0%) | $29,034 |
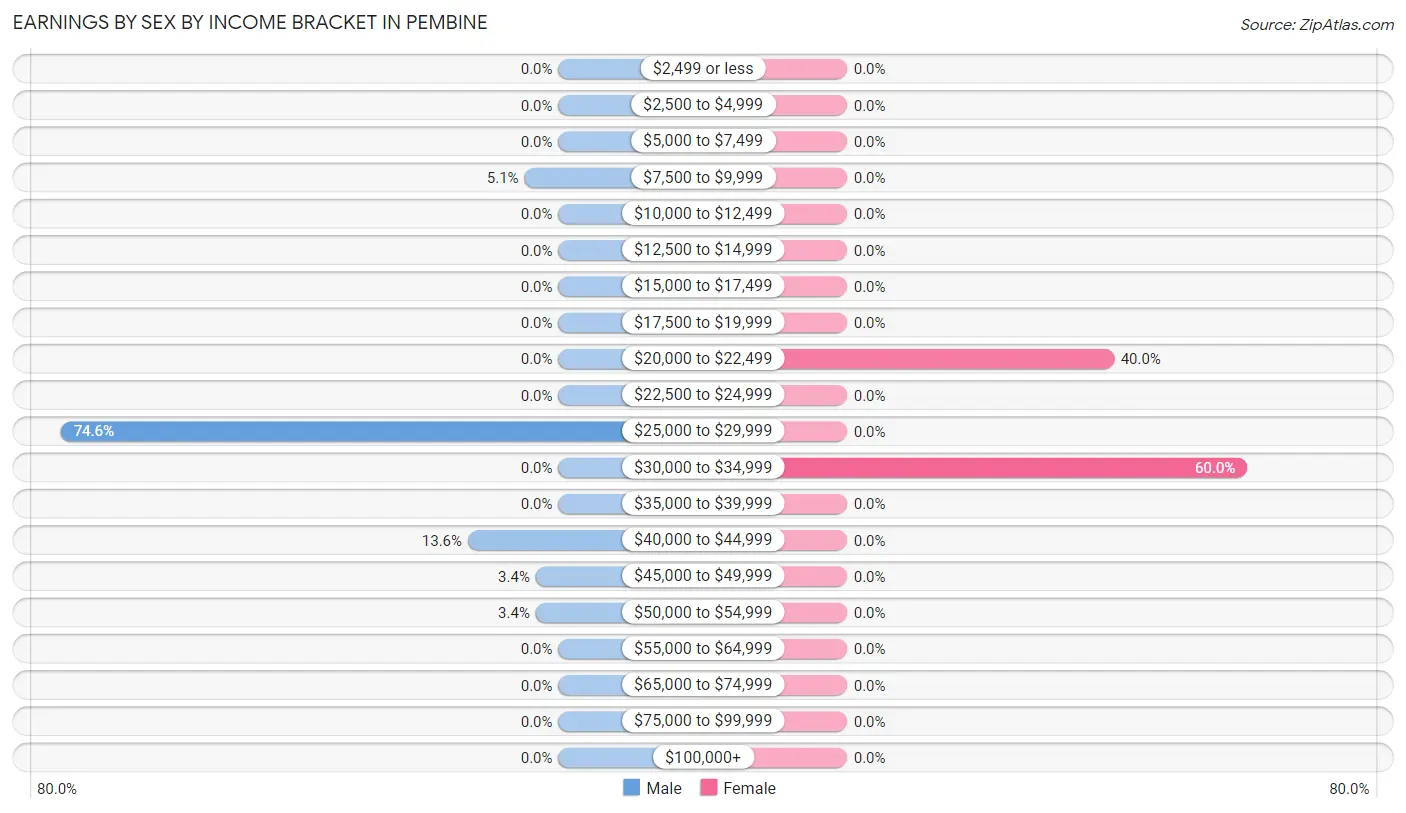
Earnings by Sex by Income Bracket in Pembine
The most common earnings brackets in Pembine are $25,000 to $29,999 for men (44 | 74.6%) and $30,000 to $34,999 for women (3 | 60.0%).
| Income | Male | Female |
| $2,499 or less | 0 (0.0%) | 0 (0.0%) |
| $2,500 to $4,999 | 0 (0.0%) | 0 (0.0%) |
| $5,000 to $7,499 | 0 (0.0%) | 0 (0.0%) |
| $7,500 to $9,999 | 3 (5.1%) | 0 (0.0%) |
| $10,000 to $12,499 | 0 (0.0%) | 0 (0.0%) |
| $12,500 to $14,999 | 0 (0.0%) | 0 (0.0%) |
| $15,000 to $17,499 | 0 (0.0%) | 0 (0.0%) |
| $17,500 to $19,999 | 0 (0.0%) | 0 (0.0%) |
| $20,000 to $22,499 | 0 (0.0%) | 2 (40.0%) |
| $22,500 to $24,999 | 0 (0.0%) | 0 (0.0%) |
| $25,000 to $29,999 | 44 (74.6%) | 0 (0.0%) |
| $30,000 to $34,999 | 0 (0.0%) | 3 (60.0%) |
| $35,000 to $39,999 | 0 (0.0%) | 0 (0.0%) |
| $40,000 to $44,999 | 8 (13.6%) | 0 (0.0%) |
| $45,000 to $49,999 | 2 (3.4%) | 0 (0.0%) |
| $50,000 to $54,999 | 2 (3.4%) | 0 (0.0%) |
| $55,000 to $64,999 | 0 (0.0%) | 0 (0.0%) |
| $65,000 to $74,999 | 0 (0.0%) | 0 (0.0%) |
| $75,000 to $99,999 | 0 (0.0%) | 0 (0.0%) |
| $100,000+ | 0 (0.0%) | 0 (0.0%) |
| Total | 59 (100.0%) | 5 (100.0%) |
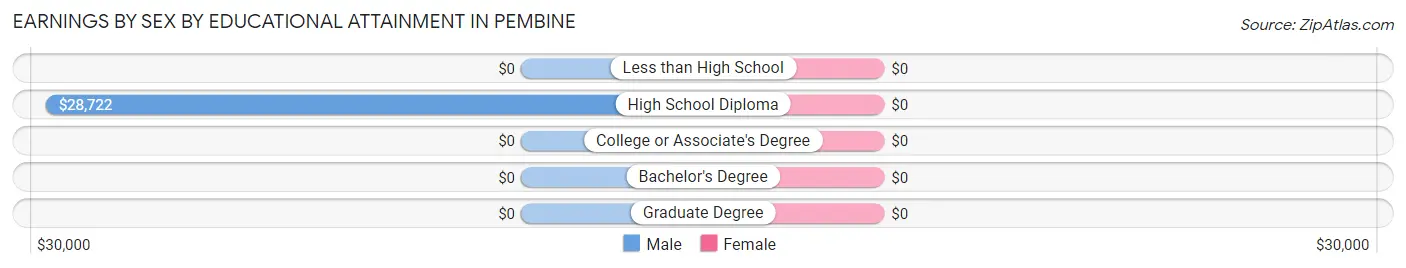
Earnings by Sex by Educational Attainment in Pembine
| Educational Attainment | Male Income | Female Income |
| Less than High School | - | - |
| High School Diploma | $28,722 | $0 |
| College or Associate's Degree | - | - |
| Bachelor's Degree | - | - |
| Graduate Degree | - | - |
| Total | $29,006 | $0 |
Family Income in Pembine
Family Income Brackets in Pembine
According to the Pembine family income data, there are 13 families falling into the $75,000 to $99,999 income range, which is the most common income bracket and makes up 81.2% of all families.
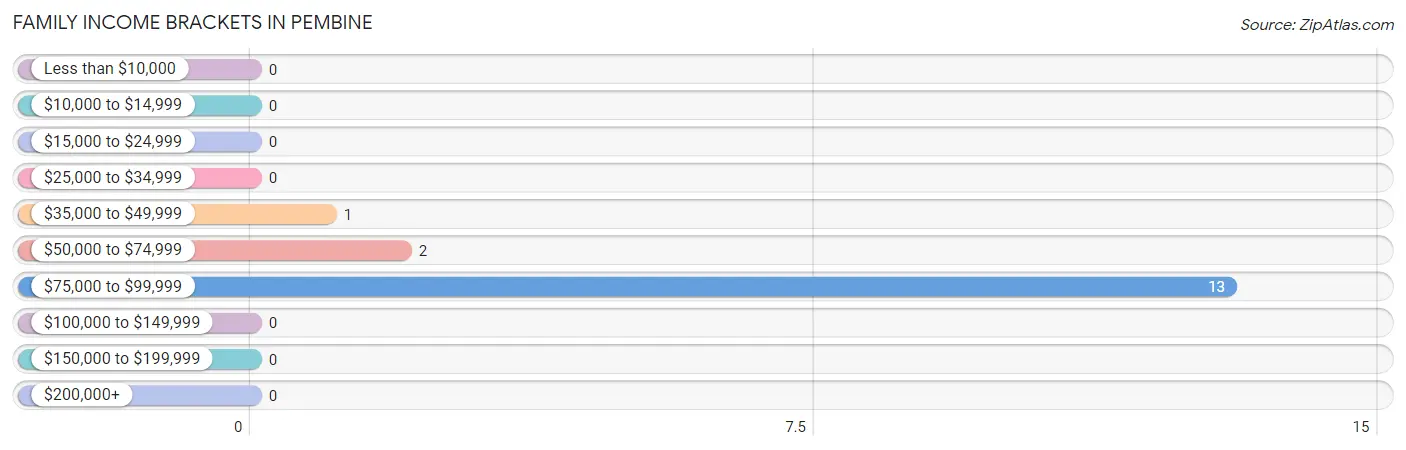
| Income Bracket | # Families | % Families |
| Less than $10,000 | 0 | 0.0% |
| $10,000 to $14,999 | 0 | 0.0% |
| $15,000 to $24,999 | 0 | 0.0% |
| $25,000 to $34,999 | 0 | 0.0% |
| $35,000 to $49,999 | 1 | 6.3% |
| $50,000 to $74,999 | 2 | 12.5% |
| $75,000 to $99,999 | 13 | 81.3% |
| $100,000 to $149,999 | 0 | 0.0% |
| $150,000 to $199,999 | 0 | 0.0% |
| $200,000+ | 0 | 0.0% |
Family Income by Famaliy Size in Pembine
2-person families (14 | 87.5%) account for the highest median family income in Pembine with $85,909 per family, while 2-person families (14 | 87.5%) have the highest median income of $42,954 per family member.
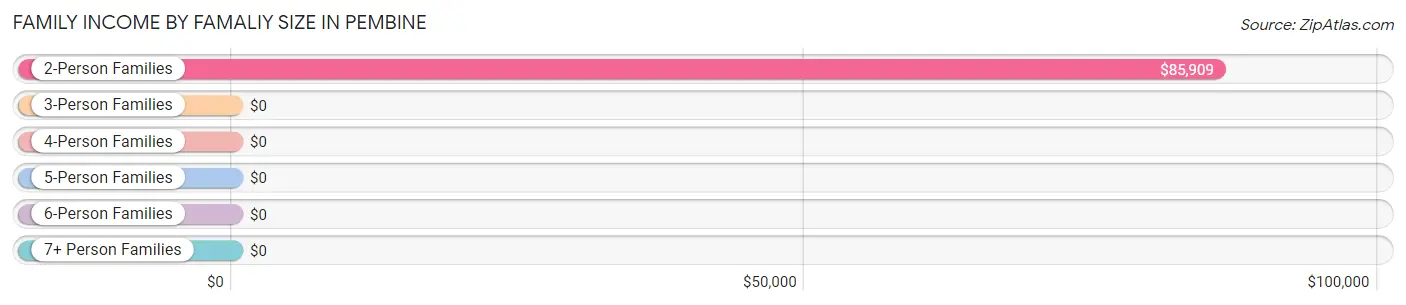
| Income Bracket | # Families | Median Income |
| 2-Person Families | 14 (87.5%) | $85,909 |
| 3-Person Families | 0 (0.0%) | $0 |
| 4-Person Families | 2 (12.5%) | $0 |
| 5-Person Families | 0 (0.0%) | $0 |
| 6-Person Families | 0 (0.0%) | $0 |
| 7+ Person Families | 0 (0.0%) | $0 |
| Total | 16 (100.0%) | $85,682 |
Family Income by Number of Earners in Pembine
| Number of Earners | # Families | Median Income |
| No Earners | 1 (6.2%) | $0 |
| 1 Earner | 11 (68.8%) | $0 |
| 2 Earners | 4 (25.0%) | $0 |
| 3+ Earners | 0 (0.0%) | $0 |
| Total | 16 (100.0%) | $85,682 |
Household Income in Pembine
Household Income Brackets in Pembine
With 44 households falling in the category, the $25,000 to $34,999 income range is the most frequent in Pembine, accounting for 57.1% of all households.
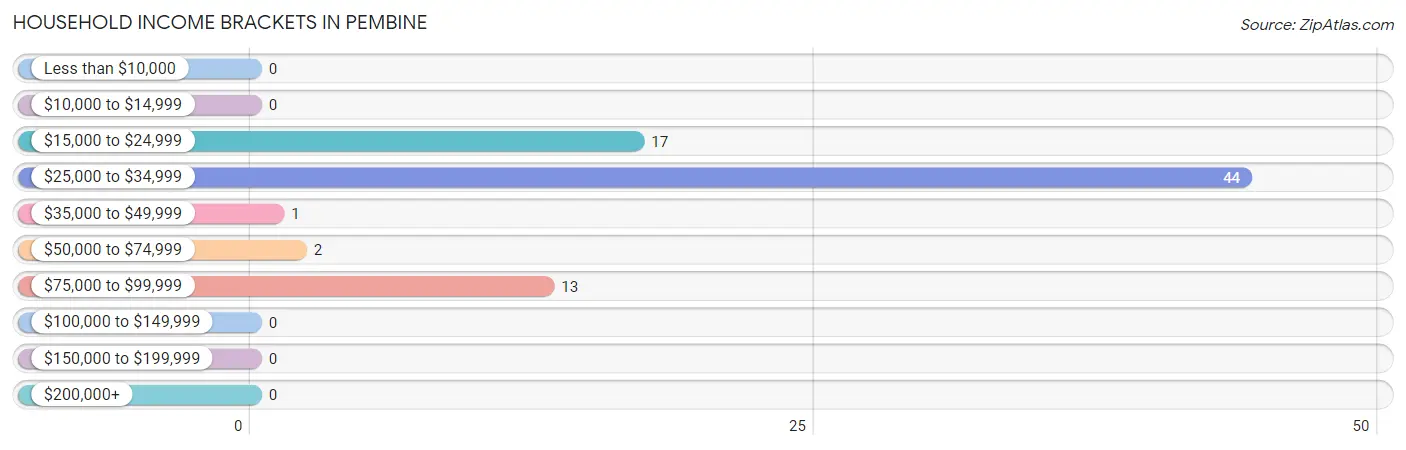
| Income Bracket | # Households | % Households |
| Less than $10,000 | 0 | 0.0% |
| $10,000 to $14,999 | 0 | 0.0% |
| $15,000 to $24,999 | 17 | 22.1% |
| $25,000 to $34,999 | 44 | 57.1% |
| $35,000 to $49,999 | 1 | 1.3% |
| $50,000 to $74,999 | 2 | 2.6% |
| $75,000 to $99,999 | 13 | 16.9% |
| $100,000 to $149,999 | 0 | 0.0% |
| $150,000 to $199,999 | 0 | 0.0% |
| $200,000+ | 0 | 0.0% |
Household Income by Householder Age in Pembine
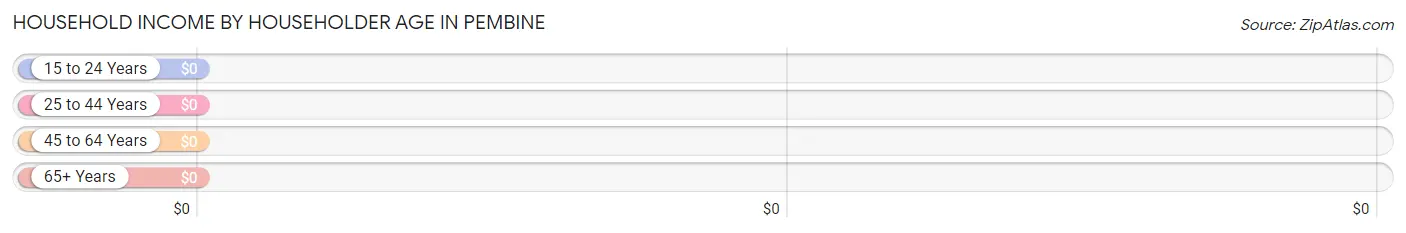
| Income Bracket | # Households | Median Income |
| 15 to 24 Years | 0 (0.0%) | $0 |
| 25 to 44 Years | 2 (2.6%) | $0 |
| 45 to 64 Years | 46 (59.7%) | $0 |
| 65+ Years | 29 (37.7%) | $0 |
| Total | 77 (100.0%) | $28,722 |
Poverty in Pembine
Income Below Poverty by Sex and Age in Pembine
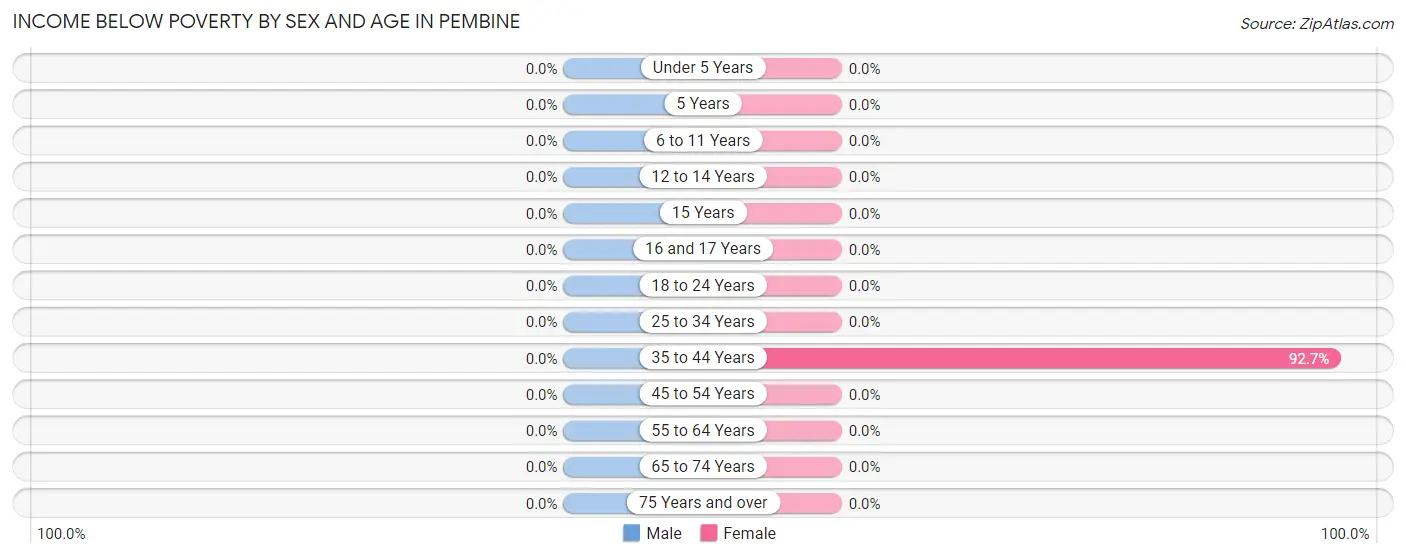
| Age Bracket | Male | Female |
| Under 5 Years | 0 (0.0%) | 0 (0.0%) |
| 5 Years | 0 (0.0%) | 0 (0.0%) |
| 6 to 11 Years | 0 (0.0%) | 0 (0.0%) |
| 12 to 14 Years | 0 (0.0%) | 0 (0.0%) |
| 15 Years | 0 (0.0%) | 0 (0.0%) |
| 16 and 17 Years | 0 (0.0%) | 0 (0.0%) |
| 18 to 24 Years | 0 (0.0%) | 0 (0.0%) |
| 25 to 34 Years | 0 (0.0%) | 0 (0.0%) |
| 35 to 44 Years | 0 (0.0%) | 38 (92.7%) |
| 45 to 54 Years | 0 (0.0%) | 0 (0.0%) |
| 55 to 64 Years | 0 (0.0%) | 0 (0.0%) |
| 65 to 74 Years | 0 (0.0%) | 0 (0.0%) |
| 75 Years and over | 0 (0.0%) | 0 (0.0%) |
| Total | 0 (0.0%) | 38 (54.3%) |
Income Above Poverty by Sex and Age in Pembine
According to the poverty statistics in Pembine, males aged 6 to 11 years and females aged 6 to 11 years are the age groups that are most secure financially, with 100.0% of males and 100.0% of females in these age groups living above the poverty line.
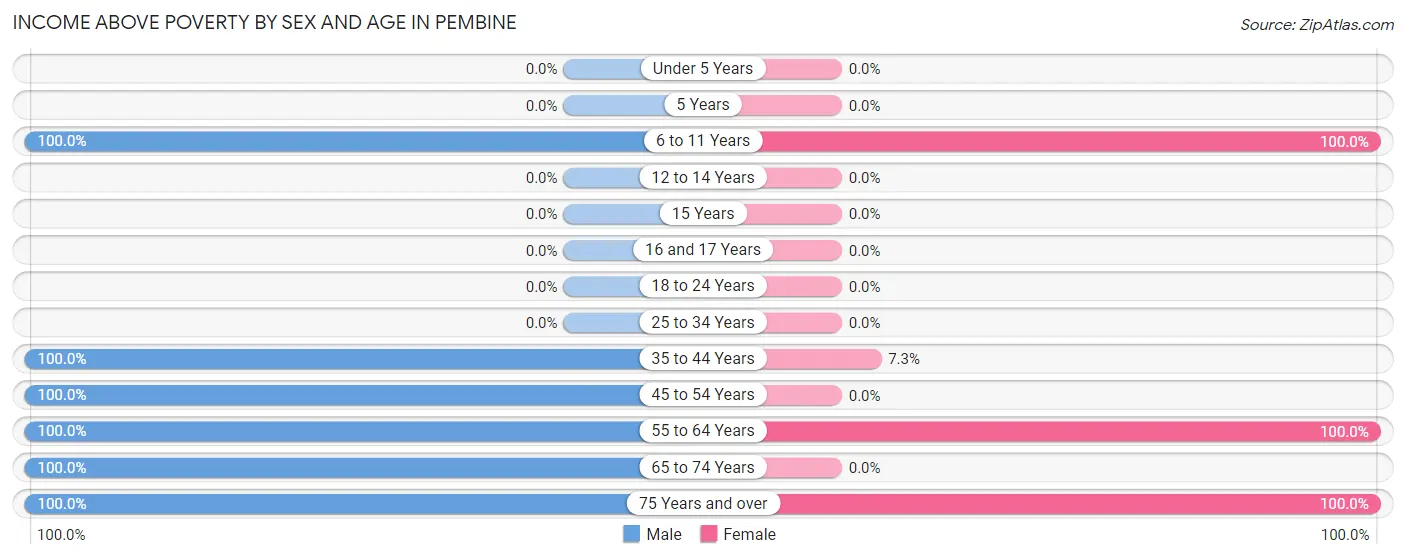
| Age Bracket | Male | Female |
| Under 5 Years | 0 (0.0%) | 0 (0.0%) |
| 5 Years | 0 (0.0%) | 0 (0.0%) |
| 6 to 11 Years | 7 (100.0%) | 6 (100.0%) |
| 12 to 14 Years | 0 (0.0%) | 0 (0.0%) |
| 15 Years | 0 (0.0%) | 0 (0.0%) |
| 16 and 17 Years | 0 (0.0%) | 0 (0.0%) |
| 18 to 24 Years | 0 (0.0%) | 0 (0.0%) |
| 25 to 34 Years | 0 (0.0%) | 0 (0.0%) |
| 35 to 44 Years | 11 (100.0%) | 3 (7.3%) |
| 45 to 54 Years | 44 (100.0%) | 0 (0.0%) |
| 55 to 64 Years | 2 (100.0%) | 2 (100.0%) |
| 65 to 74 Years | 8 (100.0%) | 0 (0.0%) |
| 75 Years and over | 4 (100.0%) | 21 (100.0%) |
| Total | 76 (100.0%) | 32 (45.7%) |
Income Below Poverty Among Married-Couple Families in Pembine
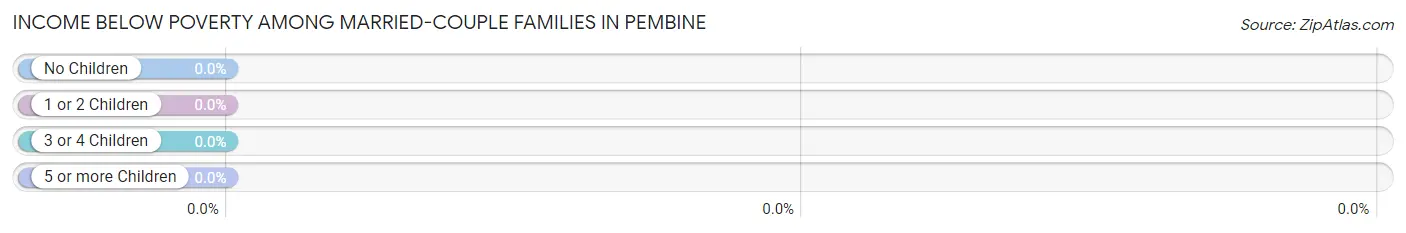
| Children | Above Poverty | Below Poverty |
| No Children | 6 (100.0%) | 0 (0.0%) |
| 1 or 2 Children | 2 (100.0%) | 0 (0.0%) |
| 3 or 4 Children | 0 (0.0%) | 0 (0.0%) |
| 5 or more Children | 0 (0.0%) | 0 (0.0%) |
| Total | 8 (100.0%) | 0 (0.0%) |
Income Below Poverty Among Single-Parent Households in Pembine
| Children | Single Father | Single Mother |
| No Children | 0 (0.0%) | 0 (0.0%) |
| 1 or 2 Children | 0 (0.0%) | 0 (0.0%) |
| 3 or 4 Children | 0 (0.0%) | 0 (0.0%) |
| 5 or more Children | 0 (0.0%) | 0 (0.0%) |
| Total | 0 (0.0%) | 0 (0.0%) |
Income Below Poverty Among Married-Couple vs Single-Parent Households in Pembine
| Children | Married-Couple Families | Single-Parent Households |
| No Children | 0 (0.0%) | 0 (0.0%) |
| 1 or 2 Children | 0 (0.0%) | 0 (0.0%) |
| 3 or 4 Children | 0 (0.0%) | 0 (0.0%) |
| 5 or more Children | 0 (0.0%) | 0 (0.0%) |
| Total | 0 (0.0%) | 0 (0.0%) |
Race in Pembine
The most populous races in Pembine are White / Caucasian (208 | 93.3%), and Two or more Races (15 | 6.7%).
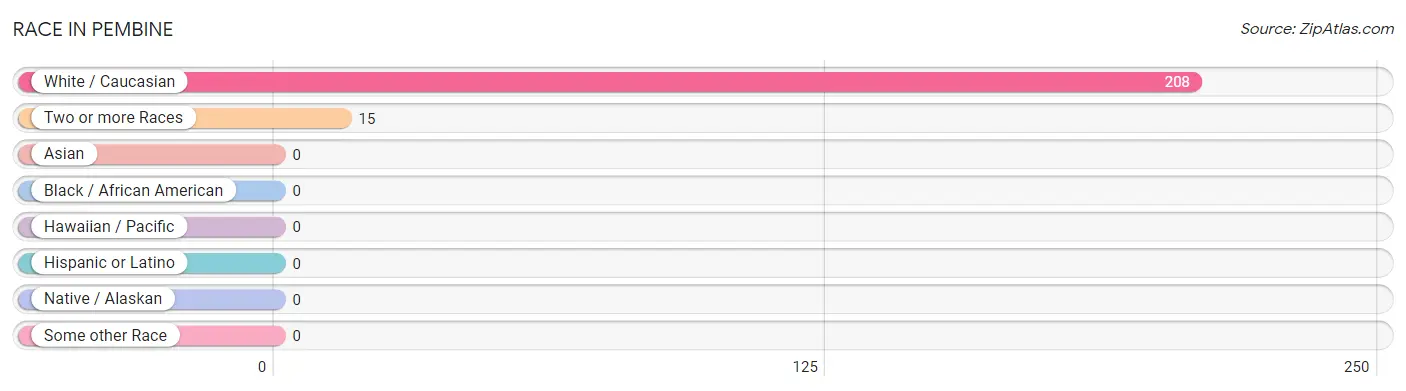
| Race | # Population | % Population |
| Asian | 0 | 0.0% |
| Black / African American | 0 | 0.0% |
| Hawaiian / Pacific | 0 | 0.0% |
| Hispanic or Latino | 0 | 0.0% |
| Native / Alaskan | 0 | 0.0% |
| White / Caucasian | 208 | 93.3% |
| Two or more Races | 15 | 6.7% |
| Some other Race | 0 | 0.0% |
| Total | 223 | 100.0% |
Ancestry in Pembine
The most populous ancestries reported in Pembine are Polish (46 | 20.6%), German (22 | 9.9%), English (21 | 9.4%), Bhutanese (15 | 6.7%), and Norwegian (10 | 4.5%), together accounting for 51.1% of all Pembine residents.
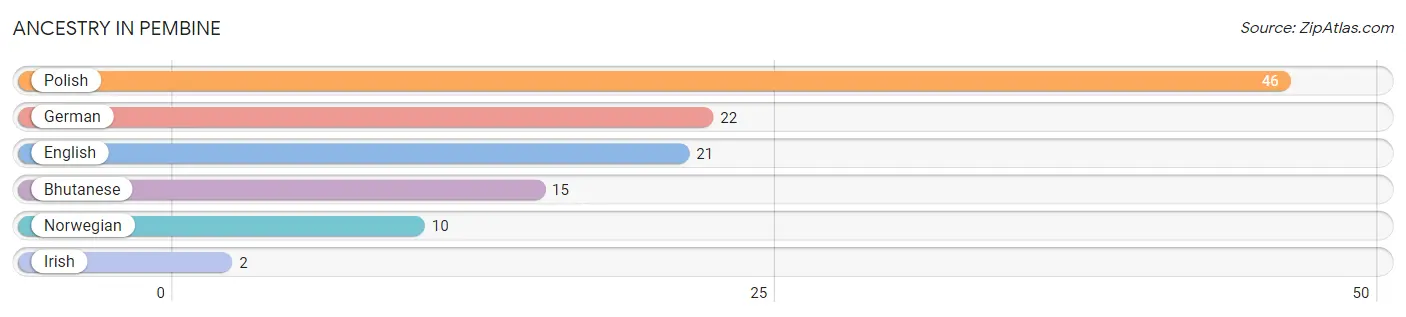
| Ancestry | # Population | % Population |
| Bhutanese | 15 | 6.7% |
| English | 21 | 9.4% |
| German | 22 | 9.9% |
| Irish | 2 | 0.9% |
| Norwegian | 10 | 4.5% |
| Polish | 46 | 20.6% | View All 6 Rows |
Immigrants in Pembine

| Immigration Origin | # Population | % Population | View All 0 Rows |
Sex and Age in Pembine
Sex and Age in Pembine
The most populous age groups in Pembine are 45 to 49 Years (44 | 38.6%) for men and 10 to 14 Years (45 | 41.3%) for women.
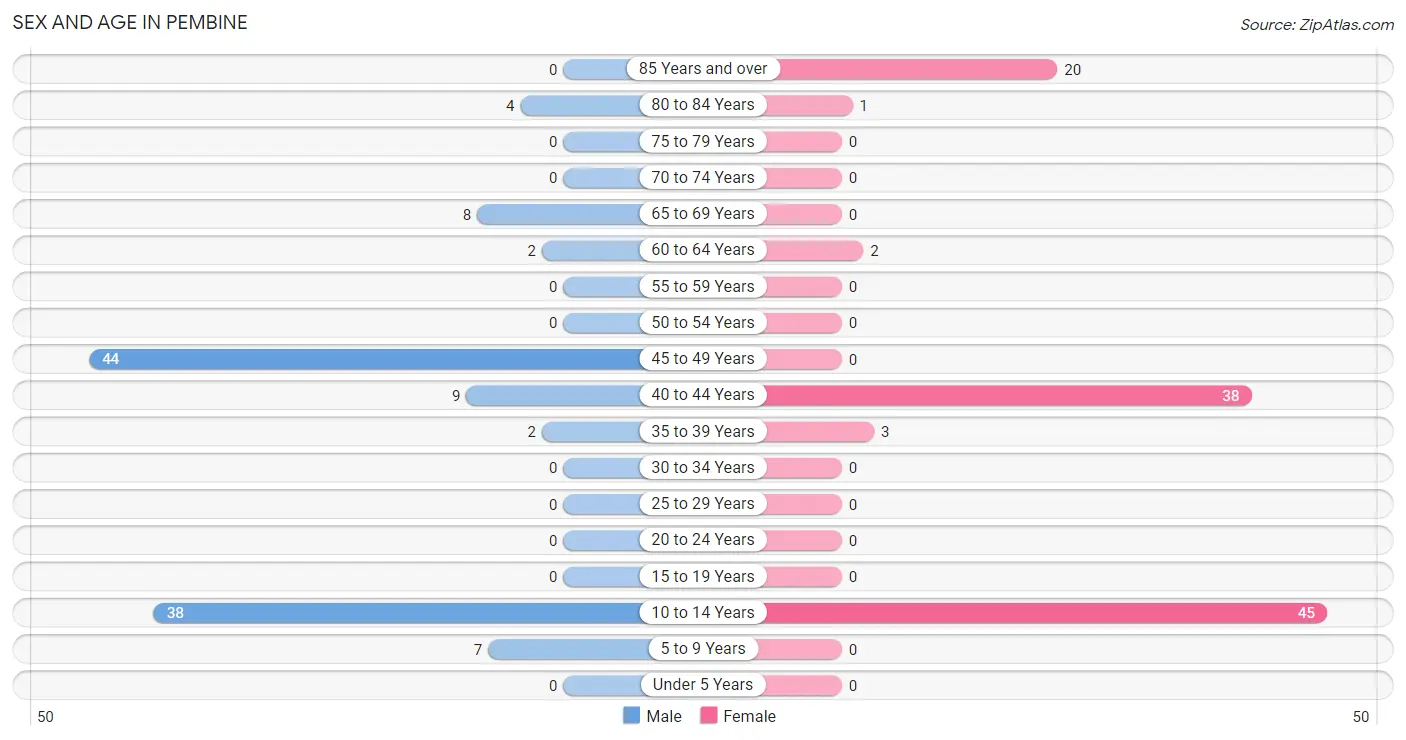
| Age Bracket | Male | Female |
| Under 5 Years | 0 (0.0%) | 0 (0.0%) |
| 5 to 9 Years | 7 (6.1%) | 0 (0.0%) |
| 10 to 14 Years | 38 (33.3%) | 45 (41.3%) |
| 15 to 19 Years | 0 (0.0%) | 0 (0.0%) |
| 20 to 24 Years | 0 (0.0%) | 0 (0.0%) |
| 25 to 29 Years | 0 (0.0%) | 0 (0.0%) |
| 30 to 34 Years | 0 (0.0%) | 0 (0.0%) |
| 35 to 39 Years | 2 (1.8%) | 3 (2.8%) |
| 40 to 44 Years | 9 (7.9%) | 38 (34.9%) |
| 45 to 49 Years | 44 (38.6%) | 0 (0.0%) |
| 50 to 54 Years | 0 (0.0%) | 0 (0.0%) |
| 55 to 59 Years | 0 (0.0%) | 0 (0.0%) |
| 60 to 64 Years | 2 (1.8%) | 2 (1.8%) |
| 65 to 69 Years | 8 (7.0%) | 0 (0.0%) |
| 70 to 74 Years | 0 (0.0%) | 0 (0.0%) |
| 75 to 79 Years | 0 (0.0%) | 0 (0.0%) |
| 80 to 84 Years | 4 (3.5%) | 1 (0.9%) |
| 85 Years and over | 0 (0.0%) | 20 (18.3%) |
| Total | 114 (100.0%) | 109 (100.0%) |
Families and Households in Pembine
Median Family Size in Pembine
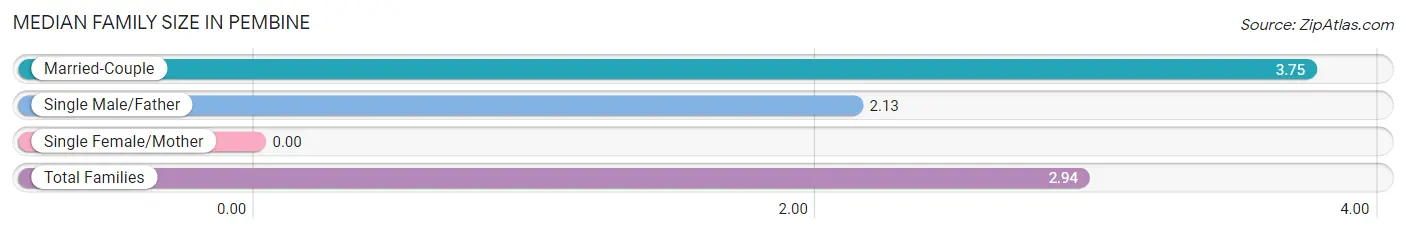
| Family Type | # Families | Family Size |
| Married-Couple | 8 (50.0%) | 3.75 |
| Single Male/Father | 8 (50.0%) | 2.13 |
| Single Female/Mother | 0 (0.0%) | - |
| Total Families | 16 (100.0%) | 2.94 |
Median Household Size in Pembine
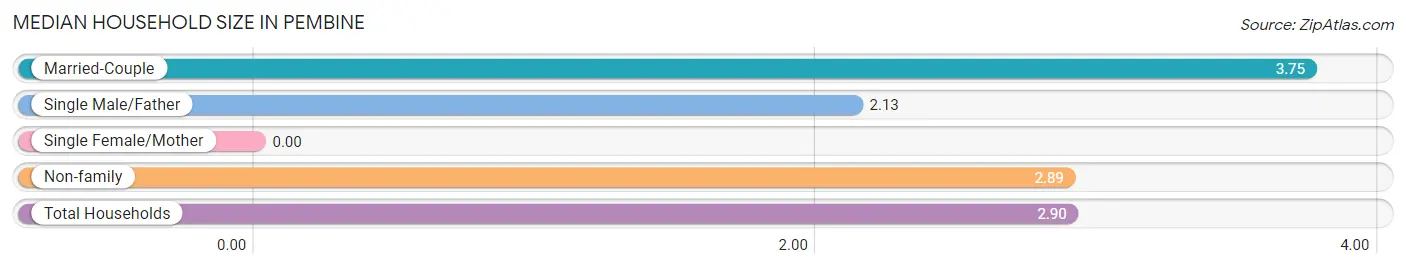
| Household Type | # Households | Household Size |
| Married-Couple | 8 (10.4%) | 3.75 |
| Single Male/Father | 8 (10.4%) | 2.13 |
| Single Female/Mother | 0 (0.0%) | - |
| Non-family | 61 (79.2%) | 2.89 |
| Total Households | 77 (100.0%) | 2.90 |
Household Size by Marriage Status in Pembine
Out of a total of 77 households in Pembine, 16 (20.8%) are family households, while 61 (79.2%) are nonfamily households. The most numerous type of family households are 2-person households, comprising 14, and the most common type of nonfamily households are 4-person households, comprising 44.
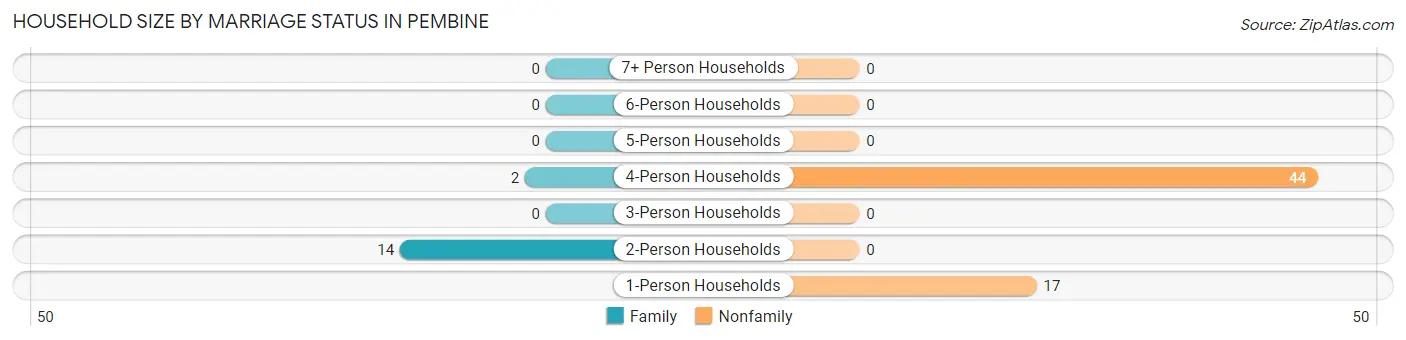
| Household Size | Family Households | Nonfamily Households |
| 1-Person Households | - | 17 (22.1%) |
| 2-Person Households | 14 (18.2%) | 0 (0.0%) |
| 3-Person Households | 0 (0.0%) | 0 (0.0%) |
| 4-Person Households | 2 (2.6%) | 44 (57.1%) |
| 5-Person Households | 0 (0.0%) | 0 (0.0%) |
| 6-Person Households | 0 (0.0%) | 0 (0.0%) |
| 7+ Person Households | 0 (0.0%) | 0 (0.0%) |
| Total | 16 (20.8%) | 61 (79.2%) |
Female Fertility in Pembine
Fertility by Age in Pembine
| Age Bracket | Women with Births | Births / 1,000 Women |
| 15 to 19 years | 0 (0.0%) | 0.0 |
| 20 to 34 years | 0 (0.0%) | 0.0 |
| 35 to 50 years | 0 (0.0%) | 0.0 |
| Total | 0 (0.0%) | 0.0 |
Fertility by Age by Marriage Status in Pembine
| Age Bracket | Married | Unmarried |
| 15 to 19 years | 0 (0.0%) | 0 (0.0%) |
| 20 to 34 years | 0 (0.0%) | 0 (0.0%) |
| 35 to 50 years | 0 (0.0%) | 0 (0.0%) |
| Total | 0 (0.0%) | 0 (0.0%) |
Fertility by Education in Pembine
| Educational Attainment | Women with Births | Births / 1,000 Women |
| Less than High School | 0 (0.0%) | 0.0 |
| High School Diploma | 0 (0.0%) | 0.0 |
| College or Associate's Degree | 0 (0.0%) | 0.0 |
| Bachelor's Degree | 0 (0.0%) | 0.0 |
| Graduate Degree | 0 (0.0%) | 0.0 |
| Total | 0 (0.0%) | 0.0 |
Fertility by Education by Marriage Status in Pembine
| Educational Attainment | Married | Unmarried |
| Less than High School | 0 (0.0%) | 0 (0.0%) |
| High School Diploma | 0 (0.0%) | 0 (0.0%) |
| College or Associate's Degree | 0 (0.0%) | 0 (0.0%) |
| Bachelor's Degree | 0 (0.0%) | 0 (0.0%) |
| Graduate Degree | 0 (0.0%) | 0 (0.0%) |
| Total | 0 (0.0%) | 0 (0.0%) |
Employment Characteristics in Pembine
Employment by Class of Employer in Pembine
Among the 59 employed individuals in Pembine, private company employees (54 | 91.5%), and federal government employees (5 | 8.5%) make up the most common classes of employment.
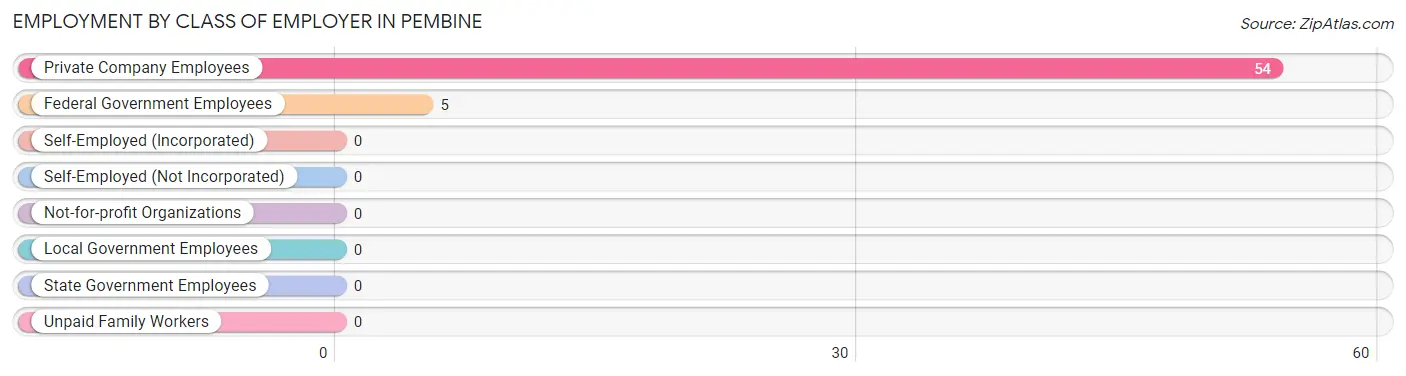
| Employer Class | # Employees | % Employees |
| Private Company Employees | 54 | 91.5% |
| Self-Employed (Incorporated) | 0 | 0.0% |
| Self-Employed (Not Incorporated) | 0 | 0.0% |
| Not-for-profit Organizations | 0 | 0.0% |
| Local Government Employees | 0 | 0.0% |
| State Government Employees | 0 | 0.0% |
| Federal Government Employees | 5 | 8.5% |
| Unpaid Family Workers | 0 | 0.0% |
| Total | 59 | 100.0% |
Employment Status by Age in Pembine
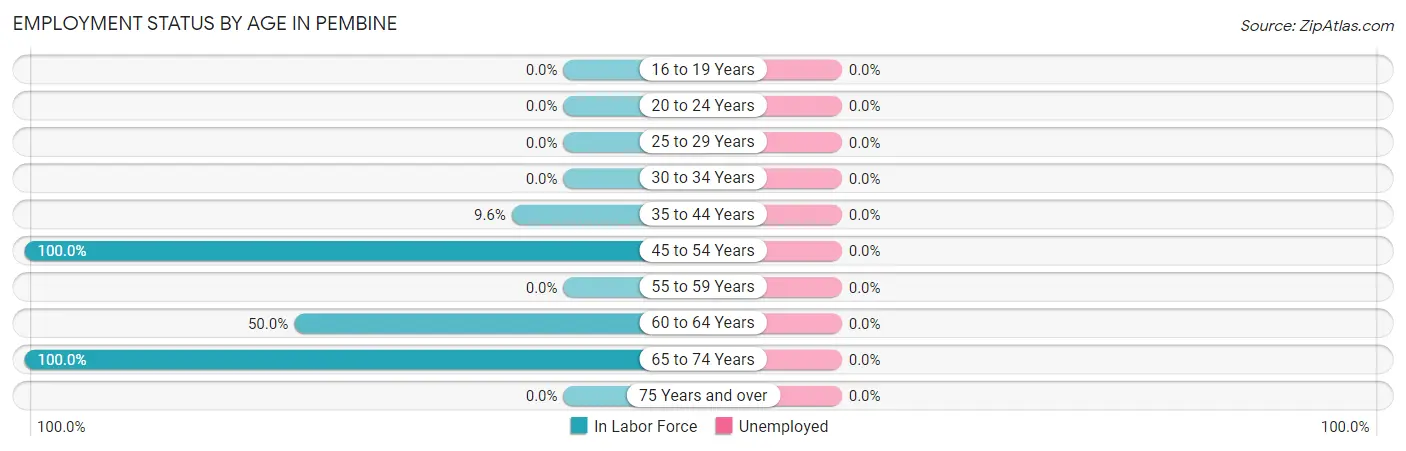
| Age Bracket | In Labor Force | Unemployed |
| 16 to 19 Years | 0 (0.0%) | 0 (0.0%) |
| 20 to 24 Years | 0 (0.0%) | 0 (0.0%) |
| 25 to 29 Years | 0 (0.0%) | 0 (0.0%) |
| 30 to 34 Years | 0 (0.0%) | 0 (0.0%) |
| 35 to 44 Years | 5 (9.6%) | 0 (0.0%) |
| 45 to 54 Years | 44 (100.0%) | 0 (0.0%) |
| 55 to 59 Years | 0 (0.0%) | 0 (0.0%) |
| 60 to 64 Years | 2 (50.0%) | 0 (0.0%) |
| 65 to 74 Years | 8 (100.0%) | 0 (0.0%) |
| 75 Years and over | 0 (0.0%) | 0 (0.0%) |
| Total | 59 (44.4%) | 0 (0.0%) |
Employment Status by Educational Attainment in Pembine
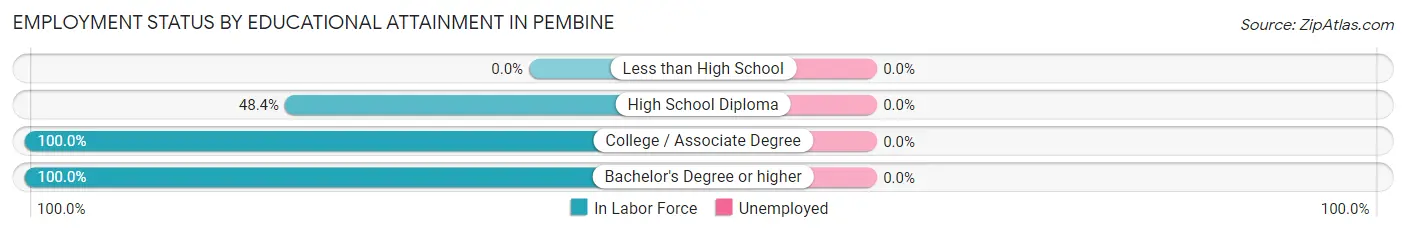
| Educational Attainment | In Labor Force | Unemployed |
| Less than High School | 0 (0.0%) | 0 (0.0%) |
| High School Diploma | 46 (48.4%) | 0 (0.0%) |
| College / Associate Degree | 3 (100.0%) | 0 (0.0%) |
| Bachelor's Degree or higher | 2 (100.0%) | 0 (0.0%) |
| Total | 51 (51.0%) | 0 (0.0%) |
Employment Occupations by Sex in Pembine
Management, Business, Science and Arts Occupations
The most common Management, Business, Science and Arts occupations in Pembine are , and Business & Financial (2 | 3.4%).
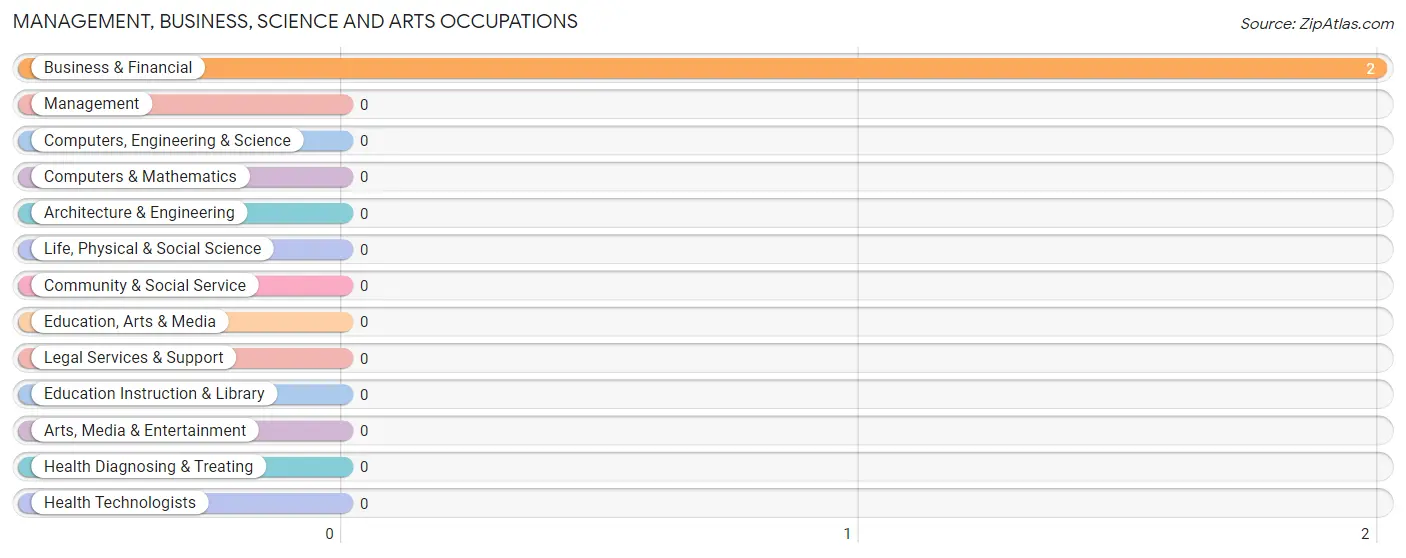
Management, Business, Science and Arts Occupations by Sex
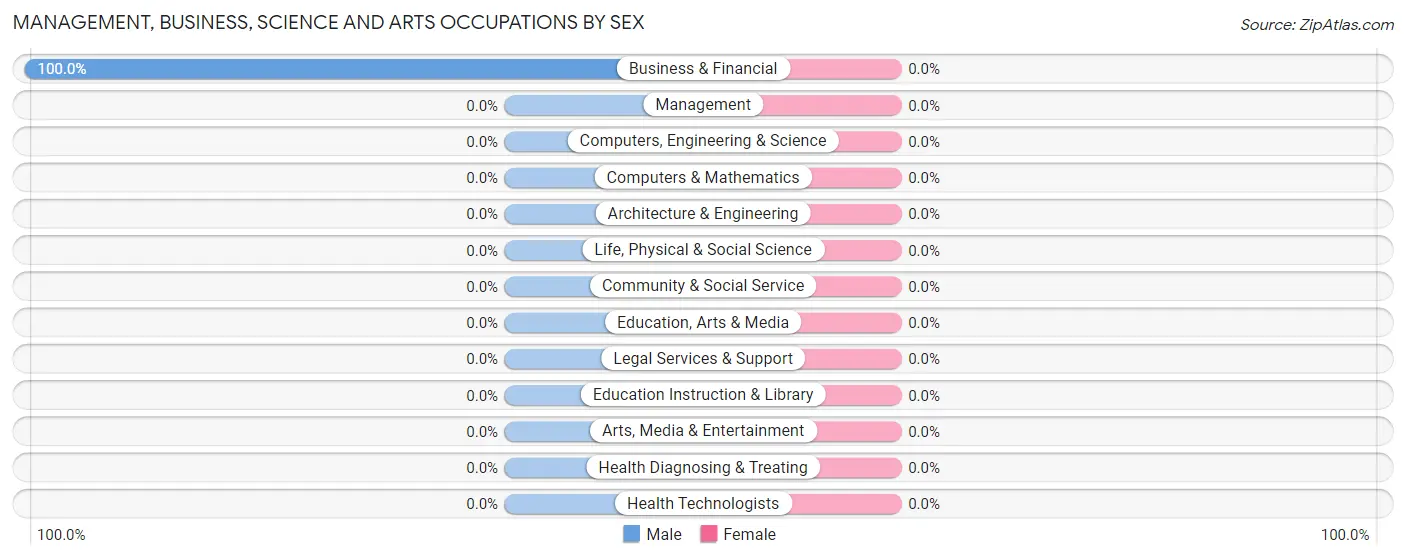
| Occupation | Male | Female |
| Management | 0 (0.0%) | 0 (0.0%) |
| Business & Financial | 2 (100.0%) | 0 (0.0%) |
| Computers, Engineering & Science | 0 (0.0%) | 0 (0.0%) |
| Computers & Mathematics | 0 (0.0%) | 0 (0.0%) |
| Architecture & Engineering | 0 (0.0%) | 0 (0.0%) |
| Life, Physical & Social Science | 0 (0.0%) | 0 (0.0%) |
| Community & Social Service | 0 (0.0%) | 0 (0.0%) |
| Education, Arts & Media | 0 (0.0%) | 0 (0.0%) |
| Legal Services & Support | 0 (0.0%) | 0 (0.0%) |
| Education Instruction & Library | 0 (0.0%) | 0 (0.0%) |
| Arts, Media & Entertainment | 0 (0.0%) | 0 (0.0%) |
| Health Diagnosing & Treating | 0 (0.0%) | 0 (0.0%) |
| Health Technologists | 0 (0.0%) | 0 (0.0%) |
| Total (Category) | 2 (100.0%) | 0 (0.0%) |
| Total (Overall) | 54 (91.5%) | 5 (8.5%) |
Services Occupations
The most common Services occupations in Pembine are Food Preparation & Serving (3 | 5.1%), and Personal Care & Service (2 | 3.4%).
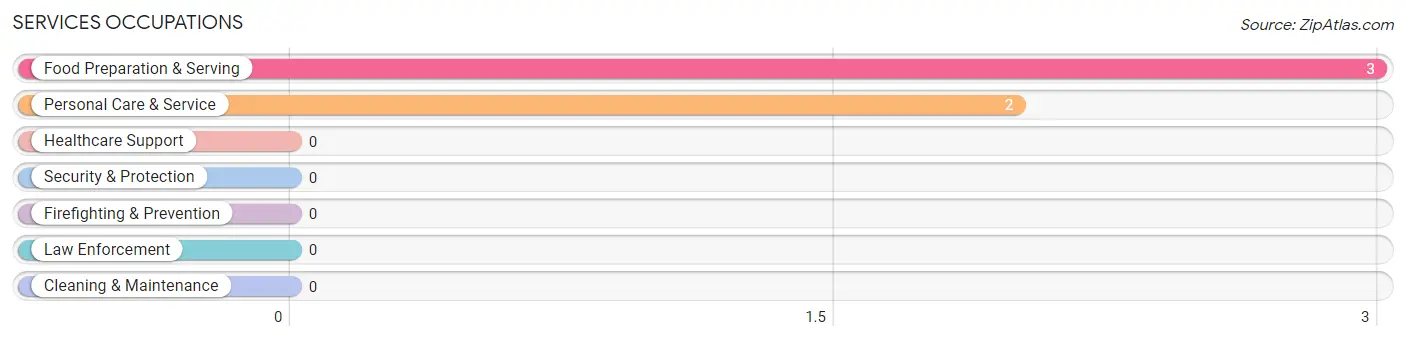
Services Occupations by Sex
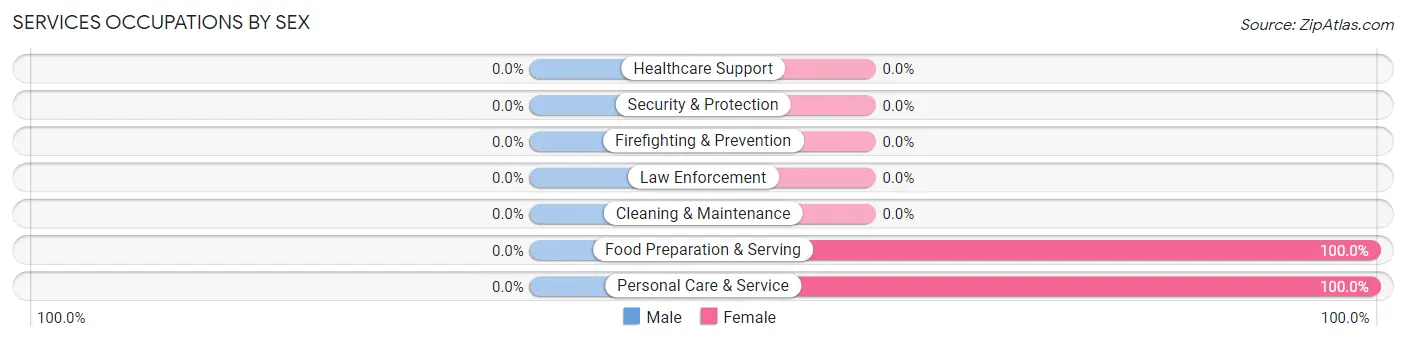
| Occupation | Male | Female |
| Healthcare Support | 0 (0.0%) | 0 (0.0%) |
| Security & Protection | 0 (0.0%) | 0 (0.0%) |
| Firefighting & Prevention | 0 (0.0%) | 0 (0.0%) |
| Law Enforcement | 0 (0.0%) | 0 (0.0%) |
| Food Preparation & Serving | 0 (0.0%) | 3 (100.0%) |
| Cleaning & Maintenance | 0 (0.0%) | 0 (0.0%) |
| Personal Care & Service | 0 (0.0%) | 2 (100.0%) |
| Total (Category) | 0 (0.0%) | 5 (100.0%) |
| Total (Overall) | 54 (91.5%) | 5 (8.5%) |
Sales and Office Occupations
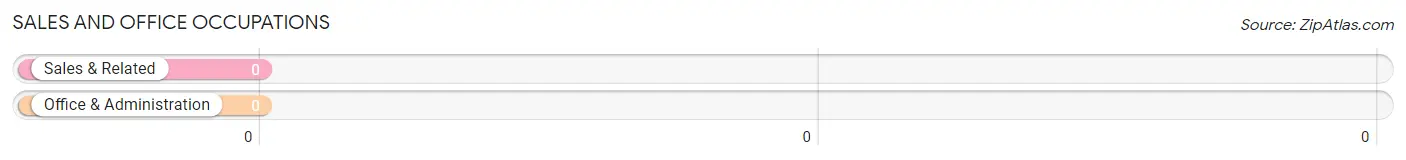
Sales and Office Occupations by Sex
| Occupation | Male | Female |
| Sales & Related | 0 (0.0%) | 0 (0.0%) |
| Office & Administration | 0 (0.0%) | 0 (0.0%) |
| Total (Category) | 0 (0.0%) | 0 (0.0%) |
| Total (Overall) | 54 (91.5%) | 5 (8.5%) |
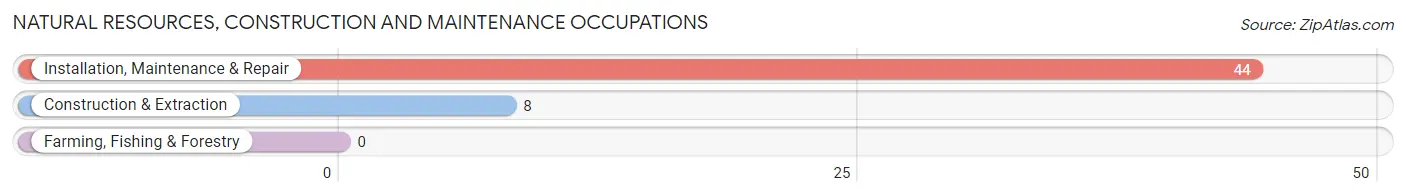
Natural Resources, Construction and Maintenance Occupations
The most common Natural Resources, Construction and Maintenance occupations in Pembine are Installation, Maintenance & Repair (44 | 74.6%), and Construction & Extraction (8 | 13.6%).
Natural Resources, Construction and Maintenance Occupations by Sex
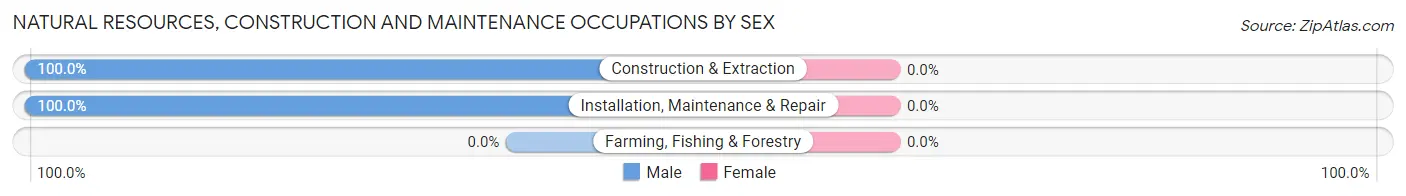
| Occupation | Male | Female |
| Farming, Fishing & Forestry | 0 (0.0%) | 0 (0.0%) |
| Construction & Extraction | 8 (100.0%) | 0 (0.0%) |
| Installation, Maintenance & Repair | 44 (100.0%) | 0 (0.0%) |
| Total (Category) | 52 (100.0%) | 0 (0.0%) |
| Total (Overall) | 54 (91.5%) | 5 (8.5%) |
Production, Transportation and Moving Occupations
Production, Transportation and Moving Occupations by Sex
| Occupation | Male | Female |
| Production | 0 (0.0%) | 0 (0.0%) |
| Transportation | 0 (0.0%) | 0 (0.0%) |
| Material Moving | 0 (0.0%) | 0 (0.0%) |
| Total (Category) | 0 (0.0%) | 0 (0.0%) |
| Total (Overall) | 54 (91.5%) | 5 (8.5%) |
Employment Industries by Sex in Pembine
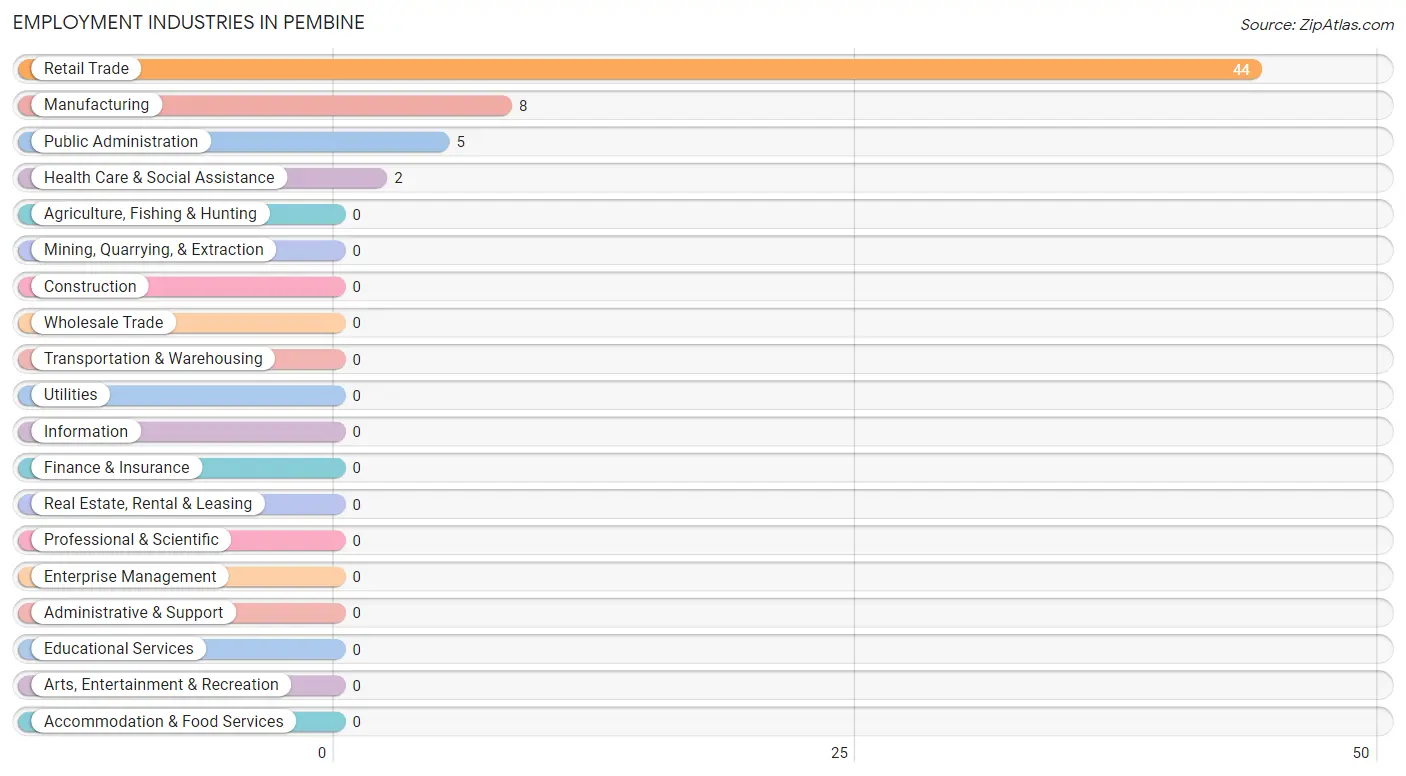
Employment Industries in Pembine
The major employment industries in Pembine include Retail Trade (44 | 74.6%), Manufacturing (8 | 13.6%), Public Administration (5 | 8.5%), and Health Care & Social Assistance (2 | 3.4%).
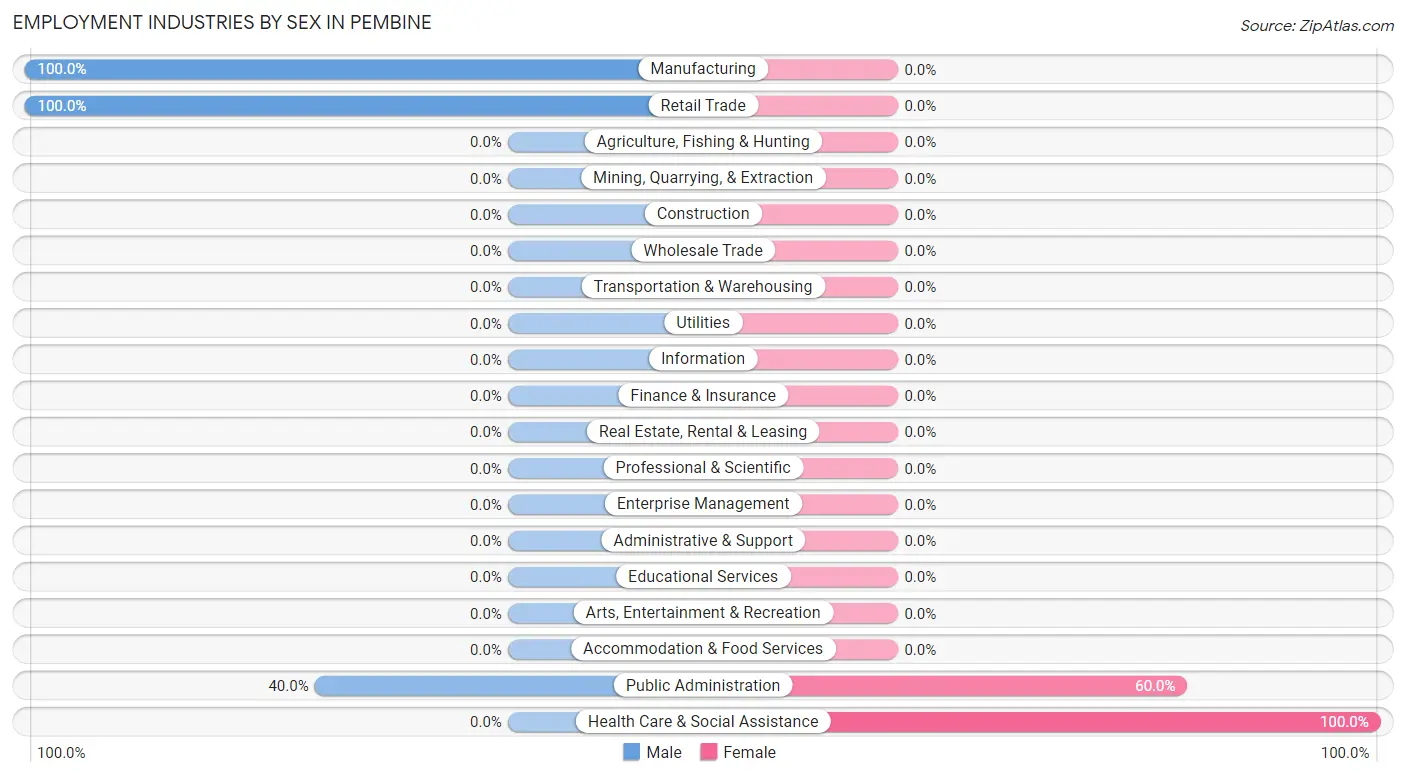
Employment Industries by Sex in Pembine
The Pembine industries that see more men than women are Manufacturing (100.0%), Retail Trade (100.0%), and Public Administration (40.0%), whereas the industries that tend to have a higher number of women are Health Care & Social Assistance (100.0%), and Public Administration (60.0%).
| Industry | Male | Female |
| Agriculture, Fishing & Hunting | 0 (0.0%) | 0 (0.0%) |
| Mining, Quarrying, & Extraction | 0 (0.0%) | 0 (0.0%) |
| Construction | 0 (0.0%) | 0 (0.0%) |
| Manufacturing | 8 (100.0%) | 0 (0.0%) |
| Wholesale Trade | 0 (0.0%) | 0 (0.0%) |
| Retail Trade | 44 (100.0%) | 0 (0.0%) |
| Transportation & Warehousing | 0 (0.0%) | 0 (0.0%) |
| Utilities | 0 (0.0%) | 0 (0.0%) |
| Information | 0 (0.0%) | 0 (0.0%) |
| Finance & Insurance | 0 (0.0%) | 0 (0.0%) |
| Real Estate, Rental & Leasing | 0 (0.0%) | 0 (0.0%) |
| Professional & Scientific | 0 (0.0%) | 0 (0.0%) |
| Enterprise Management | 0 (0.0%) | 0 (0.0%) |
| Administrative & Support | 0 (0.0%) | 0 (0.0%) |
| Educational Services | 0 (0.0%) | 0 (0.0%) |
| Health Care & Social Assistance | 0 (0.0%) | 2 (100.0%) |
| Arts, Entertainment & Recreation | 0 (0.0%) | 0 (0.0%) |
| Accommodation & Food Services | 0 (0.0%) | 0 (0.0%) |
| Public Administration | 2 (40.0%) | 3 (60.0%) |
| Total | 54 (91.5%) | 5 (8.5%) |
Education in Pembine
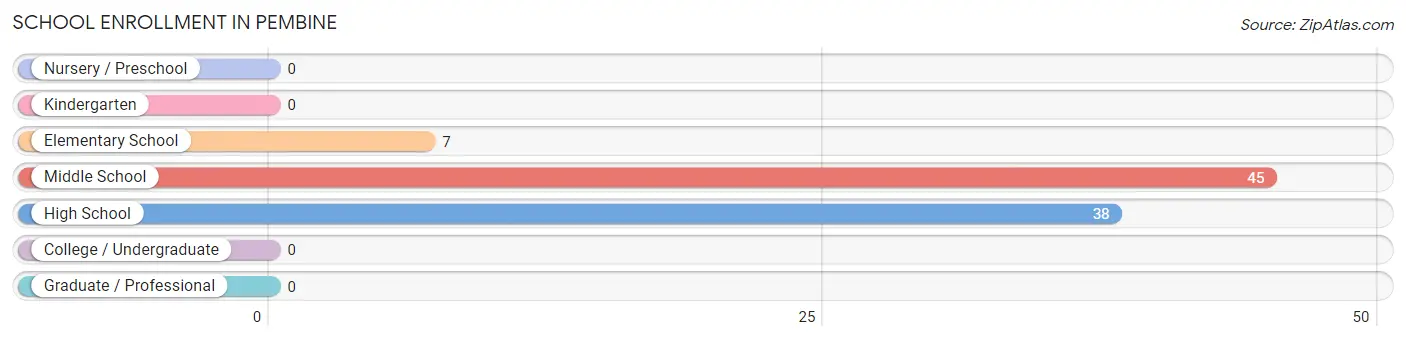
School Enrollment in Pembine
The most common levels of schooling among the 90 students in Pembine are middle school (45 | 50.0%), high school (38 | 42.2%), and elementary school (7 | 7.8%).
| School Level | # Students | % Students |
| Nursery / Preschool | 0 | 0.0% |
| Kindergarten | 0 | 0.0% |
| Elementary School | 7 | 7.8% |
| Middle School | 45 | 50.0% |
| High School | 38 | 42.2% |
| College / Undergraduate | 0 | 0.0% |
| Graduate / Professional | 0 | 0.0% |
| Total | 90 | 100.0% |
School Enrollment by Age by Funding Source in Pembine
Out of a total of 90 students who are enrolled in schools in Pembine, 38 (42.2%) attend a private institution, while the remaining 52 (57.8%) are enrolled in public schools. The age group of 10 to 14 year olds has the highest likelihood of being enrolled in private schools, with 38 (45.8% in the age bracket) enrolled. Conversely, the age group of 5 to 9 year old has the lowest likelihood of being enrolled in a private school, with 7 (100.0% in the age bracket) attending a public institution.
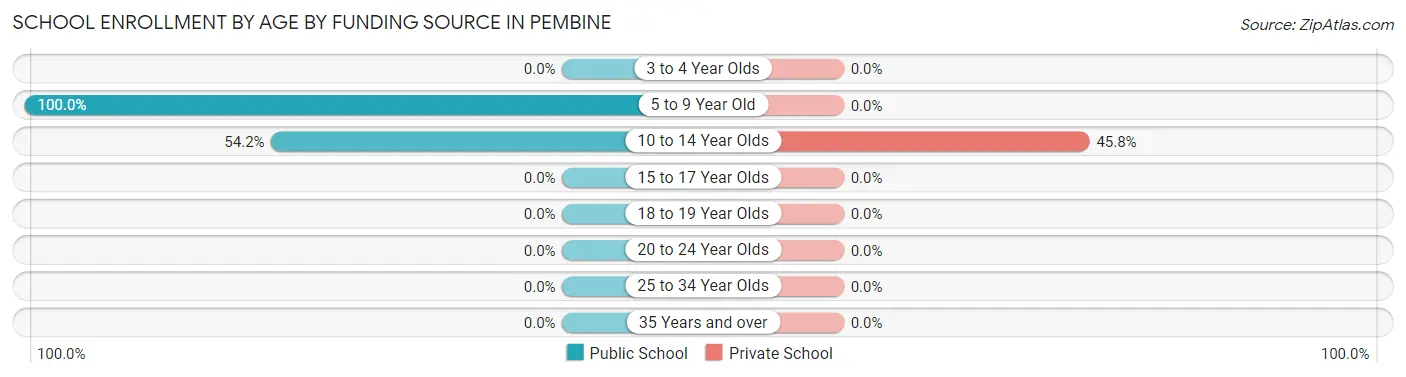
| Age Bracket | Public School | Private School |
| 3 to 4 Year Olds | 0 (0.0%) | 0 (0.0%) |
| 5 to 9 Year Old | 7 (100.0%) | 0 (0.0%) |
| 10 to 14 Year Olds | 45 (54.2%) | 38 (45.8%) |
| 15 to 17 Year Olds | 0 (0.0%) | 0 (0.0%) |
| 18 to 19 Year Olds | 0 (0.0%) | 0 (0.0%) |
| 20 to 24 Year Olds | 0 (0.0%) | 0 (0.0%) |
| 25 to 34 Year Olds | 0 (0.0%) | 0 (0.0%) |
| 35 Years and over | 0 (0.0%) | 0 (0.0%) |
| Total | 52 (57.8%) | 38 (42.2%) |
Educational Attainment by Field of Study in Pembine
Business (2 | 66.7%), and science & technology (1 | 33.3%) are the most common fields of study among 3 individuals in Pembine who have obtained a bachelor's degree or higher.
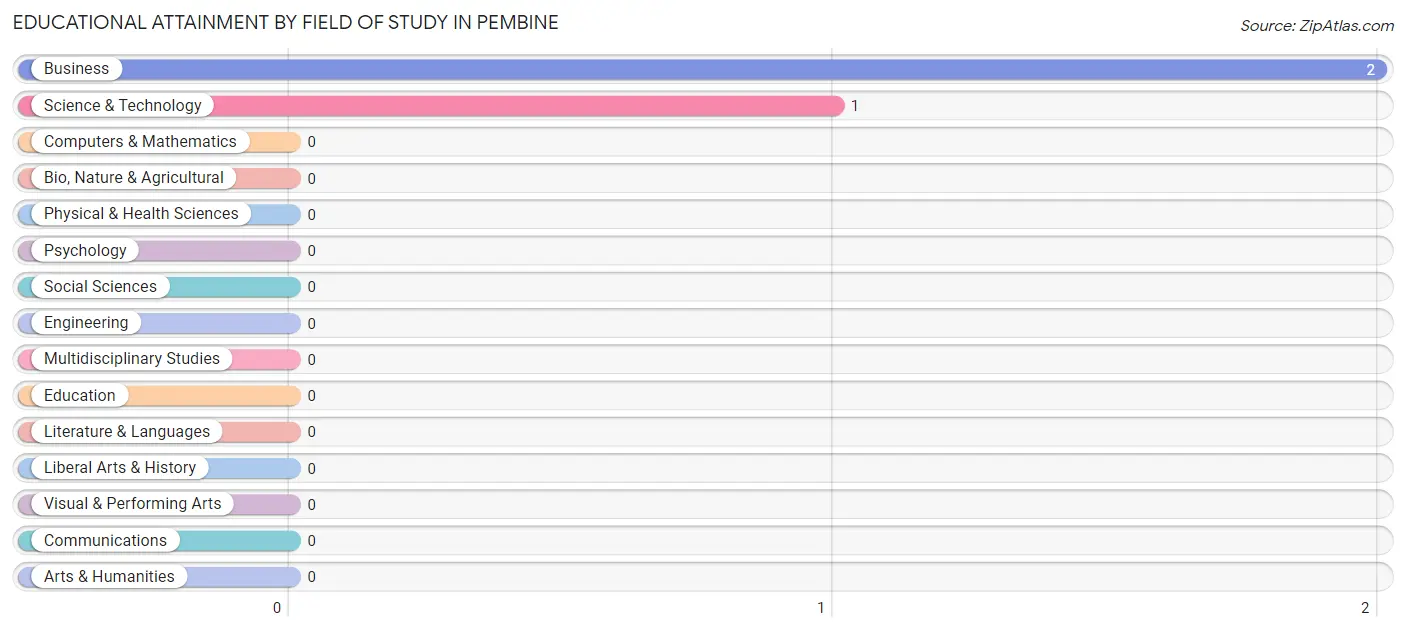
| Field of Study | # Graduates | % Graduates |
| Computers & Mathematics | 0 | 0.0% |
| Bio, Nature & Agricultural | 0 | 0.0% |
| Physical & Health Sciences | 0 | 0.0% |
| Psychology | 0 | 0.0% |
| Social Sciences | 0 | 0.0% |
| Engineering | 0 | 0.0% |
| Multidisciplinary Studies | 0 | 0.0% |
| Science & Technology | 1 | 33.3% |
| Business | 2 | 66.7% |
| Education | 0 | 0.0% |
| Literature & Languages | 0 | 0.0% |
| Liberal Arts & History | 0 | 0.0% |
| Visual & Performing Arts | 0 | 0.0% |
| Communications | 0 | 0.0% |
| Arts & Humanities | 0 | 0.0% |
| Total | 3 | 100.0% |
Transportation & Commute in Pembine
Vehicle Availability by Sex in Pembine
The most prevalent vehicle ownership categories in Pembine are males with 2 vehicles (52, accounting for 96.3%) and females with 2 vehicles (2, making up 1,040.0%).
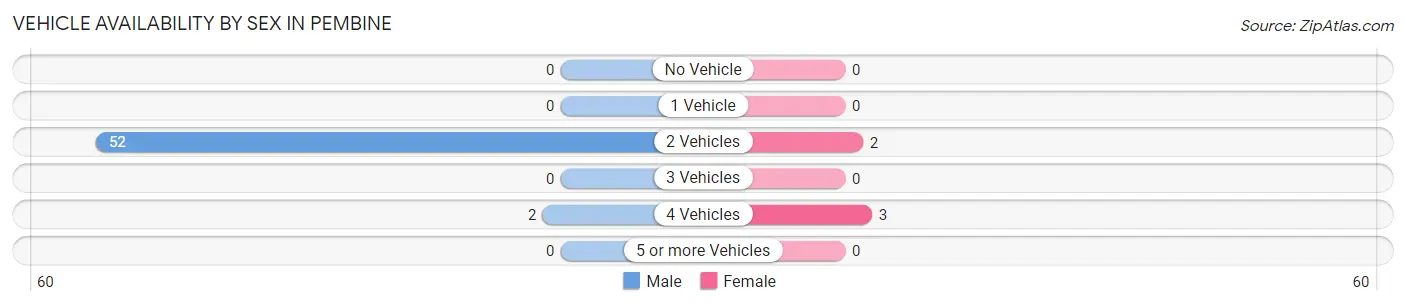
| Vehicles Available | Male | Female |
| No Vehicle | 0 (0.0%) | 0 (0.0%) |
| 1 Vehicle | 0 (0.0%) | 0 (0.0%) |
| 2 Vehicles | 52 (96.3%) | 2 (40.0%) |
| 3 Vehicles | 0 (0.0%) | 0 (0.0%) |
| 4 Vehicles | 2 (3.7%) | 3 (60.0%) |
| 5 or more Vehicles | 0 (0.0%) | 0 (0.0%) |
| Total | 54 (100.0%) | 5 (100.0%) |
Commute Time in Pembine
The most frequently occuring commute durations in Pembine are 30 to 34 minutes (46 commuters, 78.0%), 15 to 19 minutes (8 commuters, 13.6%), and 25 to 29 minutes (5 commuters, 8.5%).
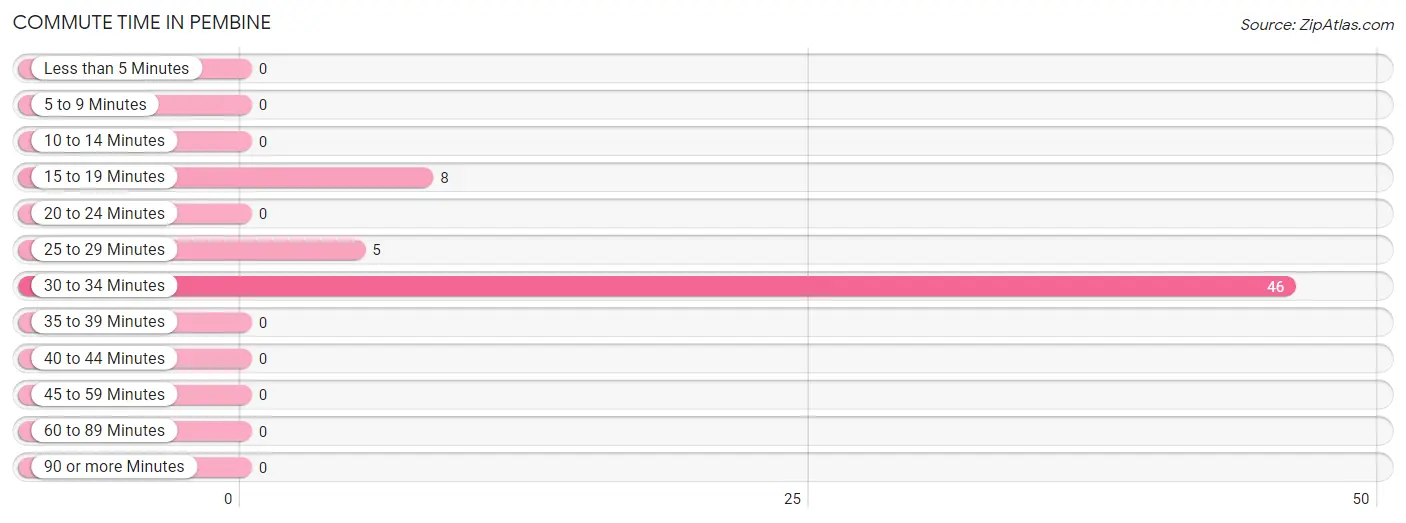
| Commute Time | # Commuters | % Commuters |
| Less than 5 Minutes | 0 | 0.0% |
| 5 to 9 Minutes | 0 | 0.0% |
| 10 to 14 Minutes | 0 | 0.0% |
| 15 to 19 Minutes | 8 | 13.6% |
| 20 to 24 Minutes | 0 | 0.0% |
| 25 to 29 Minutes | 5 | 8.5% |
| 30 to 34 Minutes | 46 | 78.0% |
| 35 to 39 Minutes | 0 | 0.0% |
| 40 to 44 Minutes | 0 | 0.0% |
| 45 to 59 Minutes | 0 | 0.0% |
| 60 to 89 Minutes | 0 | 0.0% |
| 90 or more Minutes | 0 | 0.0% |
Commute Time by Sex in Pembine
The most common commute times in Pembine are 30 to 34 minutes (44 commuters, 81.5%) for males and 25 to 29 minutes (3 commuters, 60.0%) for females.
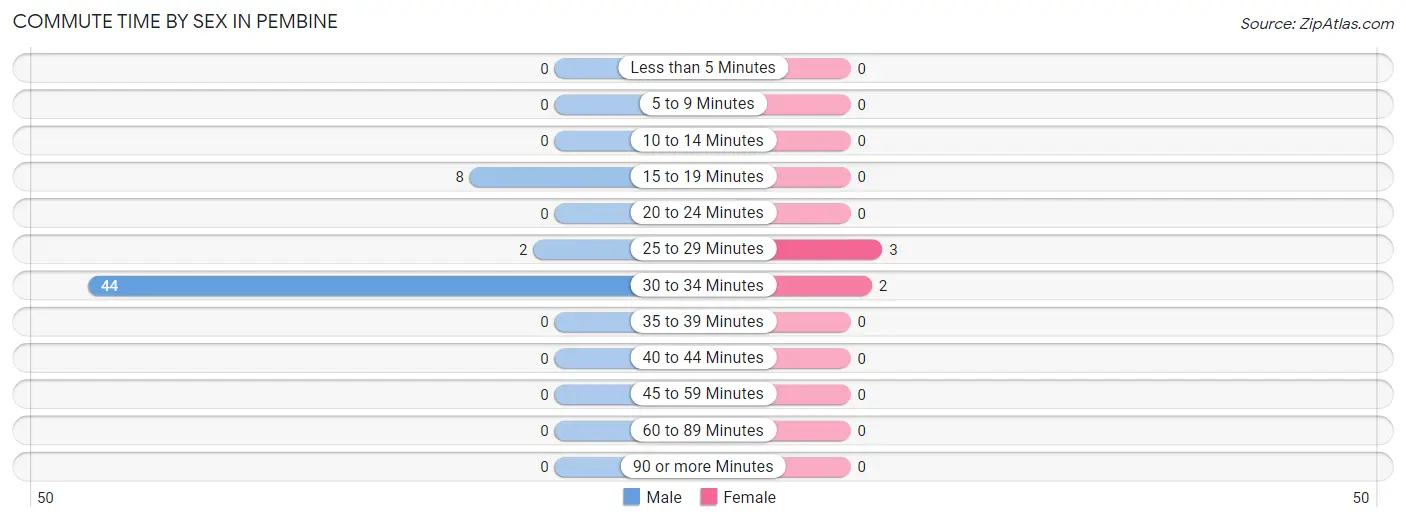
| Commute Time | Male | Female |
| Less than 5 Minutes | 0 (0.0%) | 0 (0.0%) |
| 5 to 9 Minutes | 0 (0.0%) | 0 (0.0%) |
| 10 to 14 Minutes | 0 (0.0%) | 0 (0.0%) |
| 15 to 19 Minutes | 8 (14.8%) | 0 (0.0%) |
| 20 to 24 Minutes | 0 (0.0%) | 0 (0.0%) |
| 25 to 29 Minutes | 2 (3.7%) | 3 (60.0%) |
| 30 to 34 Minutes | 44 (81.5%) | 2 (40.0%) |
| 35 to 39 Minutes | 0 (0.0%) | 0 (0.0%) |
| 40 to 44 Minutes | 0 (0.0%) | 0 (0.0%) |
| 45 to 59 Minutes | 0 (0.0%) | 0 (0.0%) |
| 60 to 89 Minutes | 0 (0.0%) | 0 (0.0%) |
| 90 or more Minutes | 0 (0.0%) | 0 (0.0%) |
Time of Departure to Work by Sex in Pembine
The most frequent times of departure to work in Pembine are 8:00 AM to 8:29 AM (44, 81.5%) for males and 8:30 AM to 8:59 AM (3, 60.0%) for females.
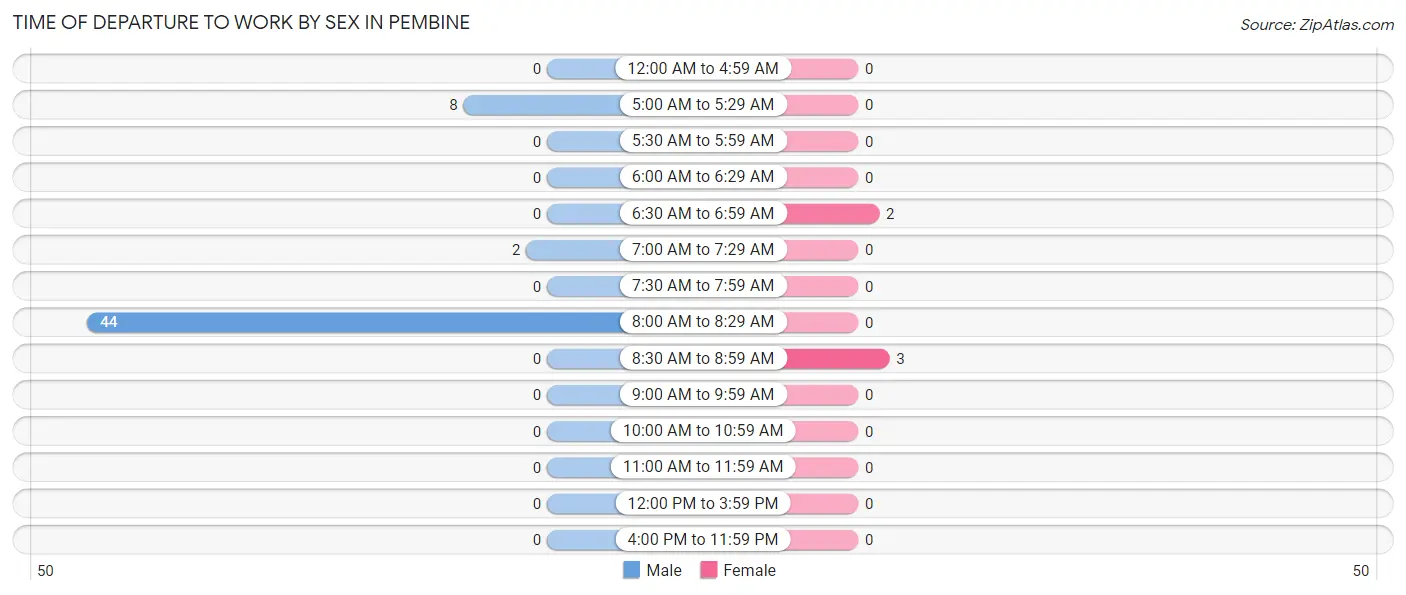
| Time of Departure | Male | Female |
| 12:00 AM to 4:59 AM | 0 (0.0%) | 0 (0.0%) |
| 5:00 AM to 5:29 AM | 8 (14.8%) | 0 (0.0%) |
| 5:30 AM to 5:59 AM | 0 (0.0%) | 0 (0.0%) |
| 6:00 AM to 6:29 AM | 0 (0.0%) | 0 (0.0%) |
| 6:30 AM to 6:59 AM | 0 (0.0%) | 2 (40.0%) |
| 7:00 AM to 7:29 AM | 2 (3.7%) | 0 (0.0%) |
| 7:30 AM to 7:59 AM | 0 (0.0%) | 0 (0.0%) |
| 8:00 AM to 8:29 AM | 44 (81.5%) | 0 (0.0%) |
| 8:30 AM to 8:59 AM | 0 (0.0%) | 3 (60.0%) |
| 9:00 AM to 9:59 AM | 0 (0.0%) | 0 (0.0%) |
| 10:00 AM to 10:59 AM | 0 (0.0%) | 0 (0.0%) |
| 11:00 AM to 11:59 AM | 0 (0.0%) | 0 (0.0%) |
| 12:00 PM to 3:59 PM | 0 (0.0%) | 0 (0.0%) |
| 4:00 PM to 11:59 PM | 0 (0.0%) | 0 (0.0%) |
| Total | 54 (100.0%) | 5 (100.0%) |
Housing Occupancy in Pembine
Occupancy by Ownership in Pembine
Of the total 77 dwellings in Pembine, owner-occupied units account for 60 (77.9%), while renter-occupied units make up 17 (22.1%).
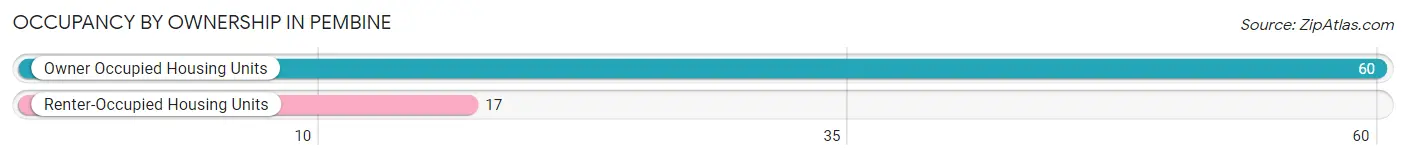
| Occupancy | # Housing Units | % Housing Units |
| Owner Occupied Housing Units | 60 | 77.9% |
| Renter-Occupied Housing Units | 17 | 22.1% |
| Total Occupied Housing Units | 77 | 100.0% |
Occupancy by Household Size in Pembine
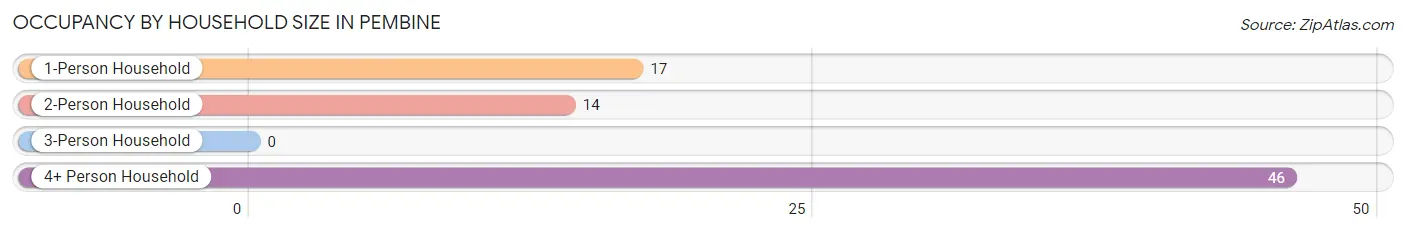
| Household Size | # Housing Units | % Housing Units |
| 1-Person Household | 17 | 22.1% |
| 2-Person Household | 14 | 18.2% |
| 3-Person Household | 0 | 0.0% |
| 4+ Person Household | 46 | 59.7% |
| Total Housing Units | 77 | 100.0% |
Occupancy by Ownership by Household Size in Pembine
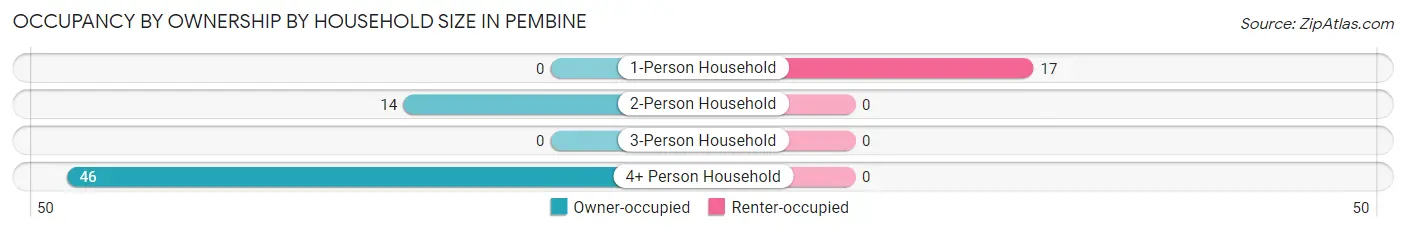
| Household Size | Owner-occupied | Renter-occupied |
| 1-Person Household | 0 (0.0%) | 17 (100.0%) |
| 2-Person Household | 14 (100.0%) | 0 (0.0%) |
| 3-Person Household | 0 (0.0%) | 0 (0.0%) |
| 4+ Person Household | 46 (100.0%) | 0 (0.0%) |
| Total Housing Units | 60 (77.9%) | 17 (22.1%) |
Occupancy by Educational Attainment in Pembine
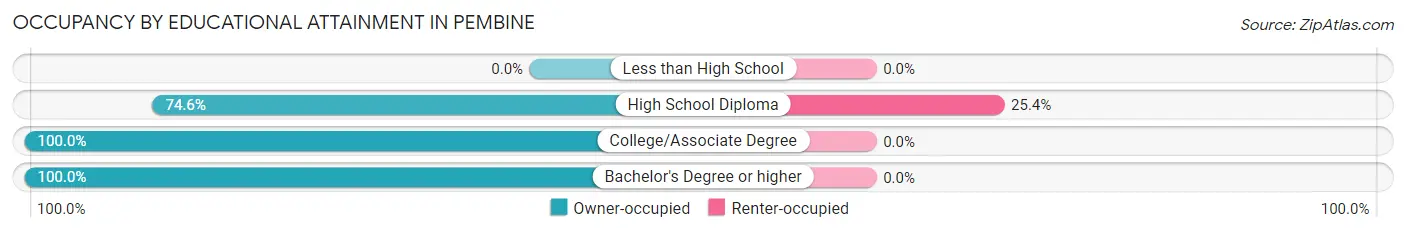
| Household Size | Owner-occupied | Renter-occupied |
| Less than High School | 0 (0.0%) | 0 (0.0%) |
| High School Diploma | 50 (74.6%) | 17 (25.4%) |
| College/Associate Degree | 8 (100.0%) | 0 (0.0%) |
| Bachelor's Degree or higher | 2 (100.0%) | 0 (0.0%) |
Occupancy by Age of Householder in Pembine
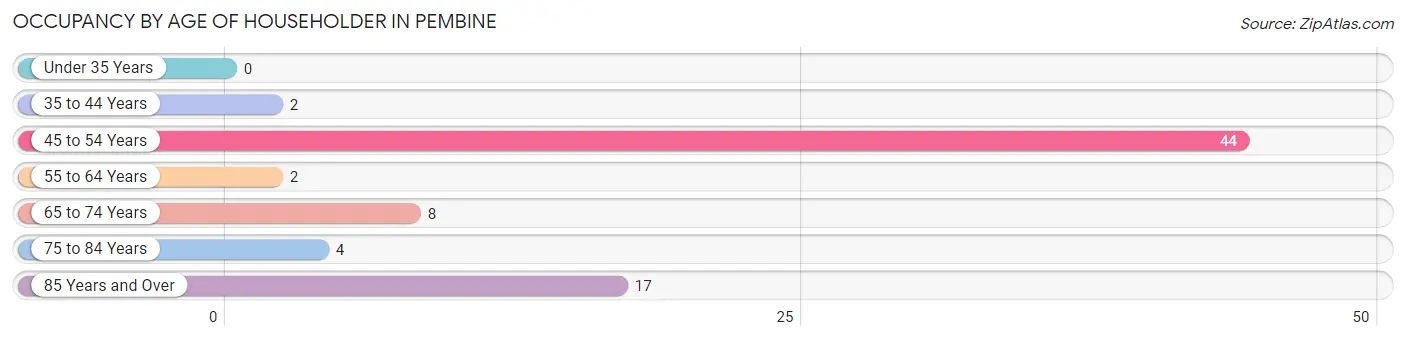
| Age Bracket | # Households | % Households |
| Under 35 Years | 0 | 0.0% |
| 35 to 44 Years | 2 | 2.6% |
| 45 to 54 Years | 44 | 57.1% |
| 55 to 64 Years | 2 | 2.6% |
| 65 to 74 Years | 8 | 10.4% |
| 75 to 84 Years | 4 | 5.2% |
| 85 Years and Over | 17 | 22.1% |
| Total | 77 | 100.0% |
Housing Finances in Pembine
Median Income by Occupancy in Pembine
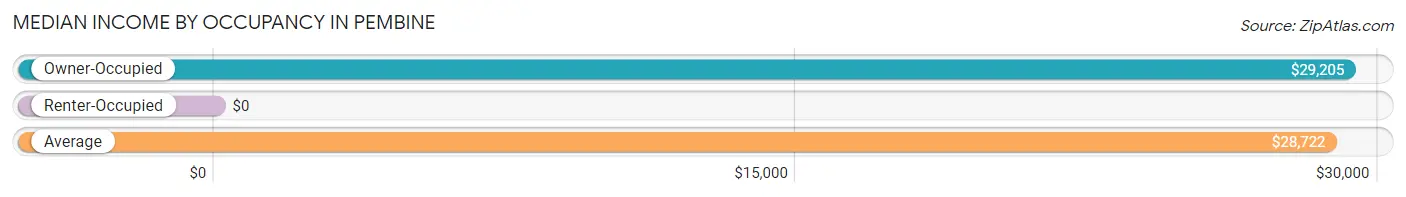
| Occupancy Type | # Households | Median Income |
| Owner-Occupied | 60 (77.9%) | $29,205 |
| Renter-Occupied | 17 (22.1%) | $0 |
| Average | 77 (100.0%) | $28,722 |
Occupancy by Householder Income Bracket in Pembine
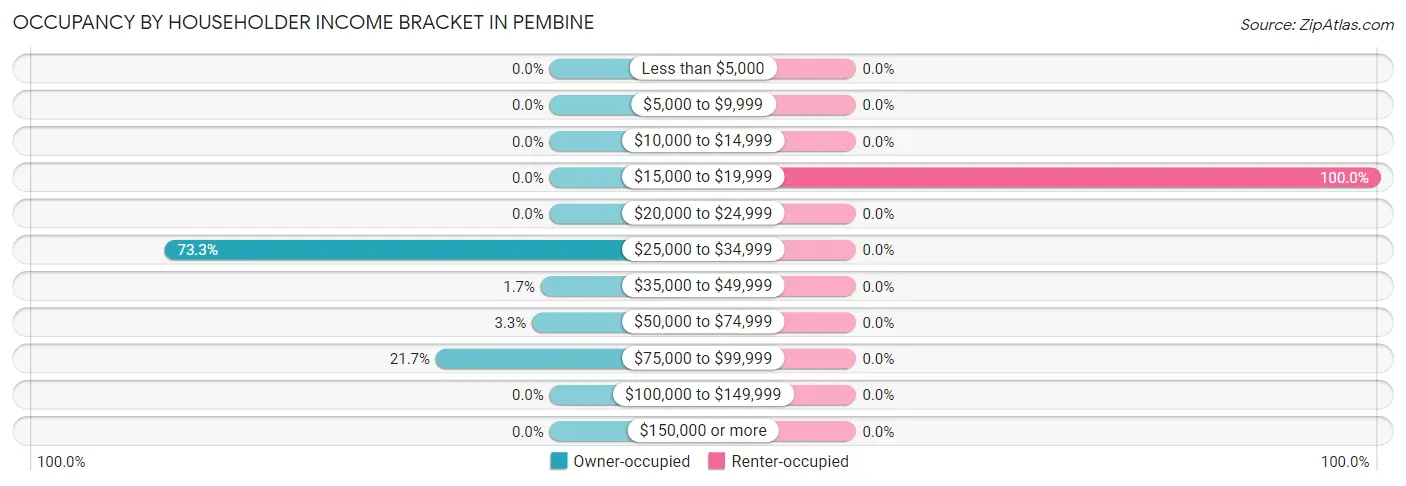
| Income Bracket | Owner-occupied | Renter-occupied |
| Less than $5,000 | 0 (0.0%) | 0 (0.0%) |
| $5,000 to $9,999 | 0 (0.0%) | 0 (0.0%) |
| $10,000 to $14,999 | 0 (0.0%) | 0 (0.0%) |
| $15,000 to $19,999 | 0 (0.0%) | 17 (100.0%) |
| $20,000 to $24,999 | 0 (0.0%) | 0 (0.0%) |
| $25,000 to $34,999 | 44 (73.3%) | 0 (0.0%) |
| $35,000 to $49,999 | 1 (1.7%) | 0 (0.0%) |
| $50,000 to $74,999 | 2 (3.3%) | 0 (0.0%) |
| $75,000 to $99,999 | 13 (21.7%) | 0 (0.0%) |
| $100,000 to $149,999 | 0 (0.0%) | 0 (0.0%) |
| $150,000 or more | 0 (0.0%) | 0 (0.0%) |
| Total | 60 (100.0%) | 17 (100.0%) |
Monthly Housing Cost Tiers in Pembine
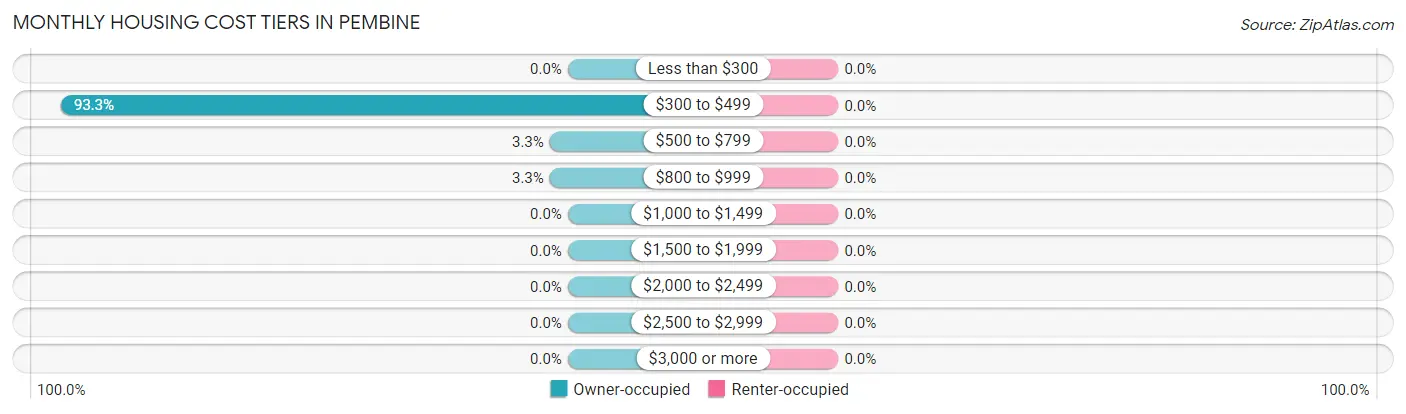
| Monthly Cost | Owner-occupied | Renter-occupied |
| Less than $300 | 0 (0.0%) | 0 (0.0%) |
| $300 to $499 | 56 (93.3%) | 0 (0.0%) |
| $500 to $799 | 2 (3.3%) | 0 (0.0%) |
| $800 to $999 | 2 (3.3%) | 0 (0.0%) |
| $1,000 to $1,499 | 0 (0.0%) | 0 (0.0%) |
| $1,500 to $1,999 | 0 (0.0%) | 0 (0.0%) |
| $2,000 to $2,499 | 0 (0.0%) | 0 (0.0%) |
| $2,500 to $2,999 | 0 (0.0%) | 0 (0.0%) |
| $3,000 or more | 0 (0.0%) | 0 (0.0%) |
| Total | 60 (100.0%) | 17 (100.0%) |
Physical Housing Characteristics in Pembine
Housing Structures in Pembine
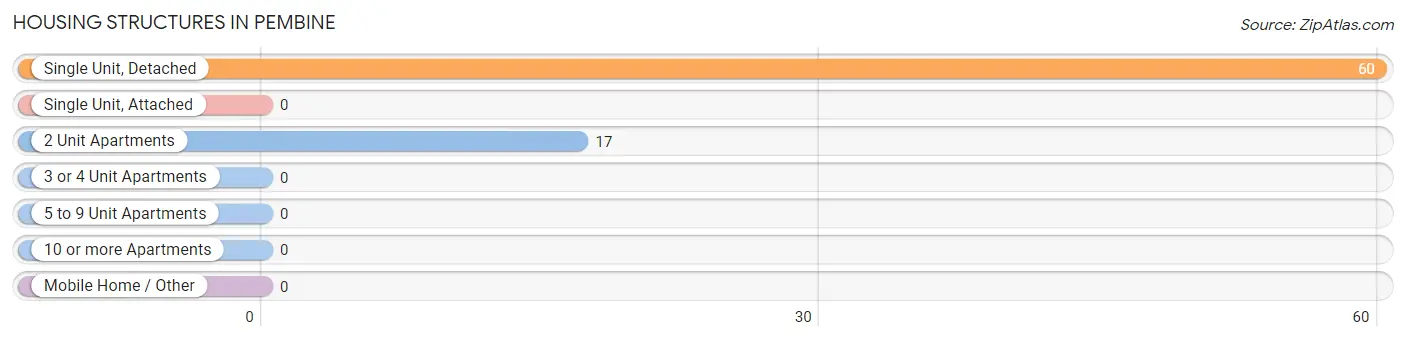
| Structure Type | # Housing Units | % Housing Units |
| Single Unit, Detached | 60 | 77.9% |
| Single Unit, Attached | 0 | 0.0% |
| 2 Unit Apartments | 17 | 22.1% |
| 3 or 4 Unit Apartments | 0 | 0.0% |
| 5 to 9 Unit Apartments | 0 | 0.0% |
| 10 or more Apartments | 0 | 0.0% |
| Mobile Home / Other | 0 | 0.0% |
| Total | 77 | 100.0% |
Housing Structures by Occupancy in Pembine
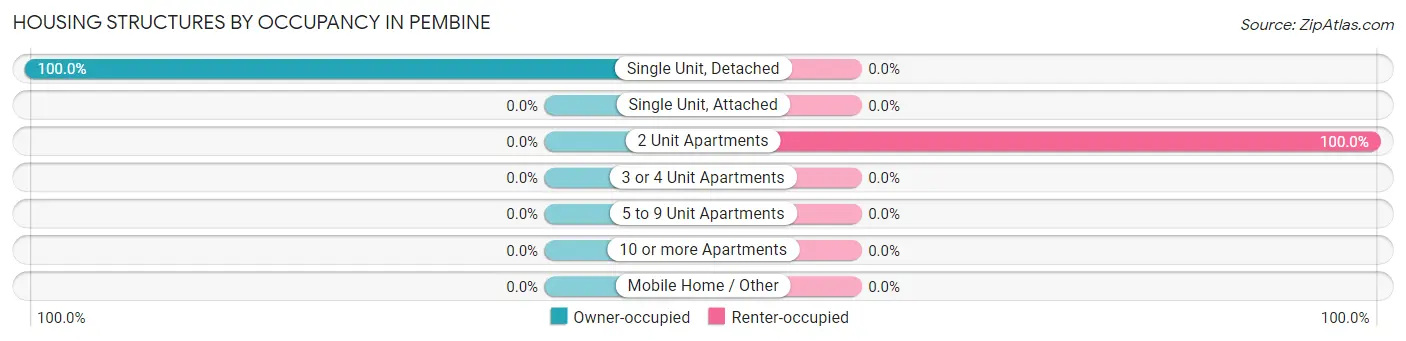
| Structure Type | Owner-occupied | Renter-occupied |
| Single Unit, Detached | 60 (100.0%) | 0 (0.0%) |
| Single Unit, Attached | 0 (0.0%) | 0 (0.0%) |
| 2 Unit Apartments | 0 (0.0%) | 17 (100.0%) |
| 3 or 4 Unit Apartments | 0 (0.0%) | 0 (0.0%) |
| 5 to 9 Unit Apartments | 0 (0.0%) | 0 (0.0%) |
| 10 or more Apartments | 0 (0.0%) | 0 (0.0%) |
| Mobile Home / Other | 0 (0.0%) | 0 (0.0%) |
| Total | 60 (77.9%) | 17 (22.1%) |
Housing Structures by Number of Rooms in Pembine
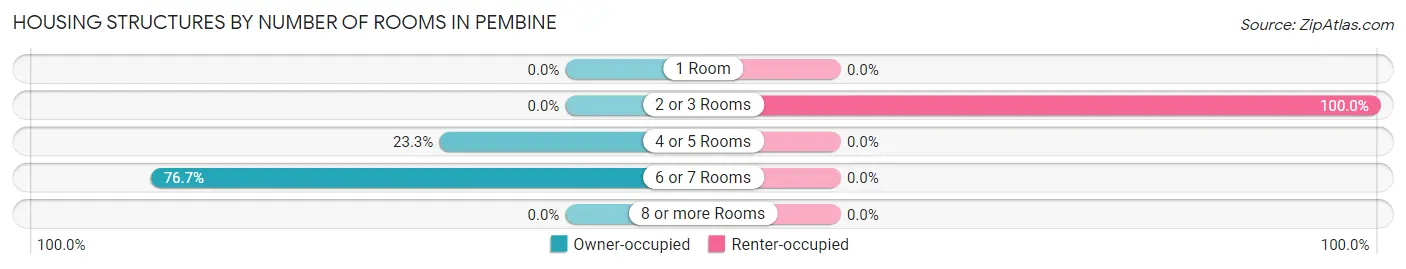
| Number of Rooms | Owner-occupied | Renter-occupied |
| 1 Room | 0 (0.0%) | 0 (0.0%) |
| 2 or 3 Rooms | 0 (0.0%) | 17 (100.0%) |
| 4 or 5 Rooms | 14 (23.3%) | 0 (0.0%) |
| 6 or 7 Rooms | 46 (76.7%) | 0 (0.0%) |
| 8 or more Rooms | 0 (0.0%) | 0 (0.0%) |
| Total | 60 (100.0%) | 17 (100.0%) |
Housing Structure by Heating Type in Pembine
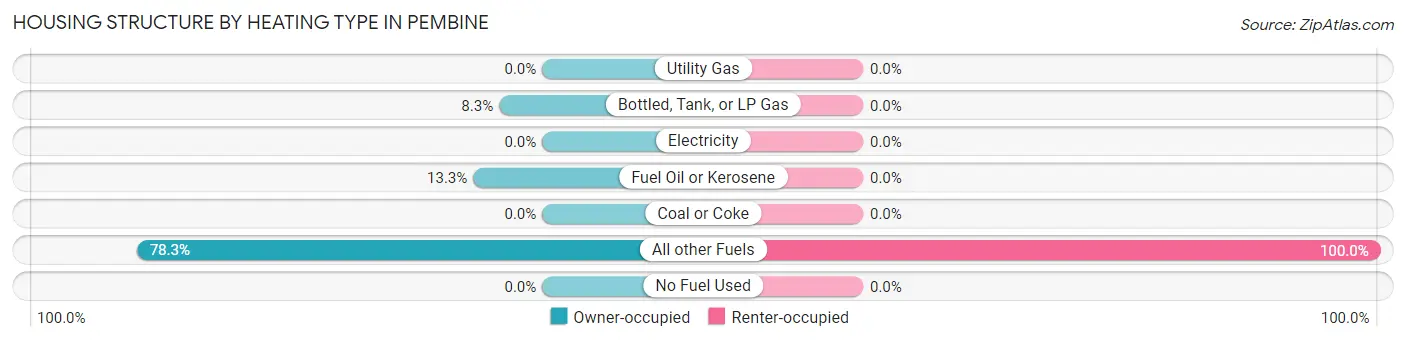
| Heating Type | Owner-occupied | Renter-occupied |
| Utility Gas | 0 (0.0%) | 0 (0.0%) |
| Bottled, Tank, or LP Gas | 5 (8.3%) | 0 (0.0%) |
| Electricity | 0 (0.0%) | 0 (0.0%) |
| Fuel Oil or Kerosene | 8 (13.3%) | 0 (0.0%) |
| Coal or Coke | 0 (0.0%) | 0 (0.0%) |
| All other Fuels | 47 (78.3%) | 17 (100.0%) |
| No Fuel Used | 0 (0.0%) | 0 (0.0%) |
| Total | 60 (100.0%) | 17 (100.0%) |
Household Vehicle Usage in Pembine
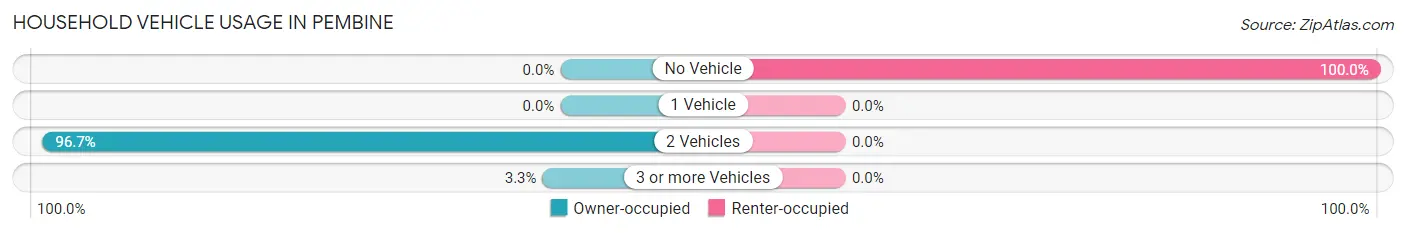
| Vehicles per Household | Owner-occupied | Renter-occupied |
| No Vehicle | 0 (0.0%) | 17 (100.0%) |
| 1 Vehicle | 0 (0.0%) | 0 (0.0%) |
| 2 Vehicles | 58 (96.7%) | 0 (0.0%) |
| 3 or more Vehicles | 2 (3.3%) | 0 (0.0%) |
| Total | 60 (100.0%) | 17 (100.0%) |
Real Estate & Mortgages in Pembine
Real Estate and Mortgage Overview in Pembine
| Characteristic | Without Mortgage | With Mortgage |
| Housing Units | 58 | 2 |
| Median Property Value | $56,600 | $0 |
| Median Household Income | $29,148 | $0 |
| Monthly Housing Costs | $378 | $0 |
| Real Estate Taxes | $1,239 | $0 |
Property Value by Mortgage Status in Pembine
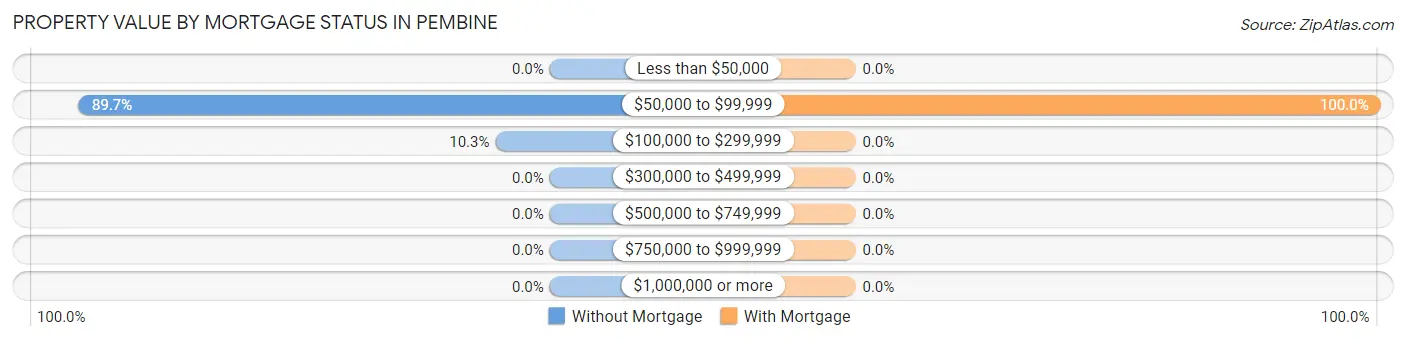
| Property Value | Without Mortgage | With Mortgage |
| Less than $50,000 | 0 (0.0%) | 0 (0.0%) |
| $50,000 to $99,999 | 52 (89.7%) | 2 (100.0%) |
| $100,000 to $299,999 | 6 (10.3%) | 0 (0.0%) |
| $300,000 to $499,999 | 0 (0.0%) | 0 (0.0%) |
| $500,000 to $749,999 | 0 (0.0%) | 0 (0.0%) |
| $750,000 to $999,999 | 0 (0.0%) | 0 (0.0%) |
| $1,000,000 or more | 0 (0.0%) | 0 (0.0%) |
| Total | 58 (100.0%) | 2 (100.0%) |
Household Income by Mortgage Status in Pembine
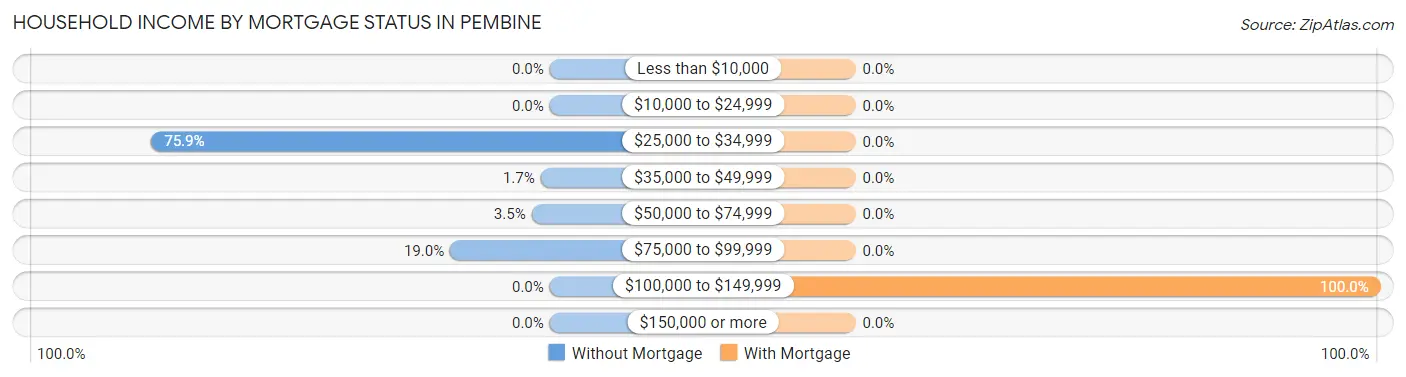
| Household Income | Without Mortgage | With Mortgage |
| Less than $10,000 | 0 (0.0%) | 0 (0.0%) |
| $10,000 to $24,999 | 0 (0.0%) | 0 (0.0%) |
| $25,000 to $34,999 | 44 (75.9%) | 0 (0.0%) |
| $35,000 to $49,999 | 1 (1.7%) | 0 (0.0%) |
| $50,000 to $74,999 | 2 (3.5%) | 0 (0.0%) |
| $75,000 to $99,999 | 11 (19.0%) | 0 (0.0%) |
| $100,000 to $149,999 | 0 (0.0%) | 2 (100.0%) |
| $150,000 or more | 0 (0.0%) | 0 (0.0%) |
| Total | 58 (100.0%) | 2 (100.0%) |
Property Value to Household Income Ratio in Pembine
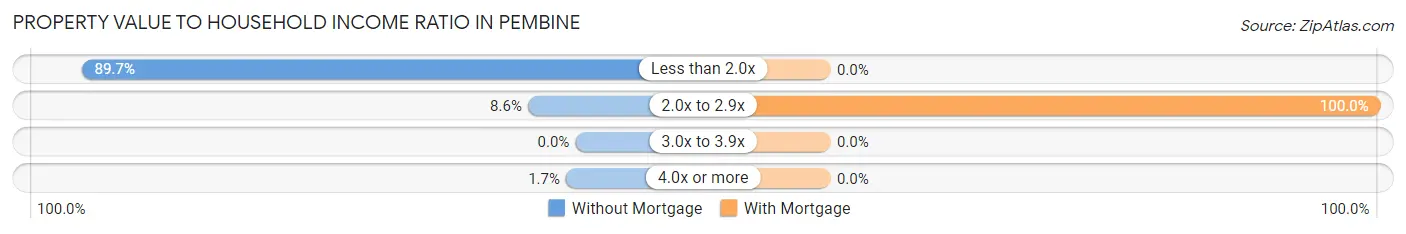
| Value-to-Income Ratio | Without Mortgage | With Mortgage |
| Less than 2.0x | 52 (89.7%) | 0 (0.0%) |
| 2.0x to 2.9x | 5 (8.6%) | 2 (100.0%) |
| 3.0x to 3.9x | 0 (0.0%) | 0 (0.0%) |
| 4.0x or more | 1 (1.7%) | 0 (0.0%) |
| Total | 58 (100.0%) | 2 (100.0%) |
Real Estate Taxes by Mortgage Status in Pembine
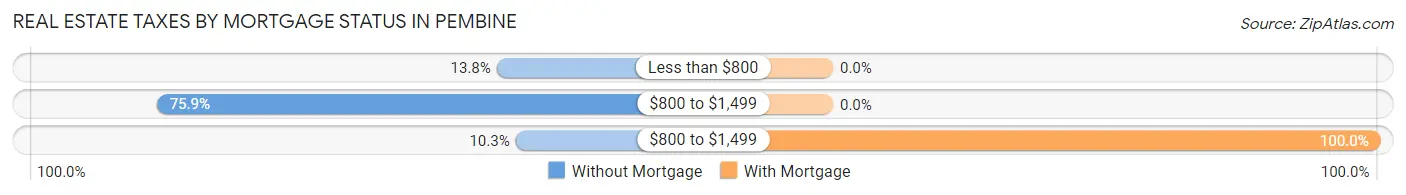
| Property Taxes | Without Mortgage | With Mortgage |
| Less than $800 | 8 (13.8%) | 0 (0.0%) |
| $800 to $1,499 | 44 (75.9%) | 0 (0.0%) |
| $800 to $1,499 | 6 (10.3%) | 2 (100.0%) |
| Total | 58 (100.0%) | 2 (100.0%) |
Health & Disability in Pembine
Health Insurance Coverage by Age in Pembine
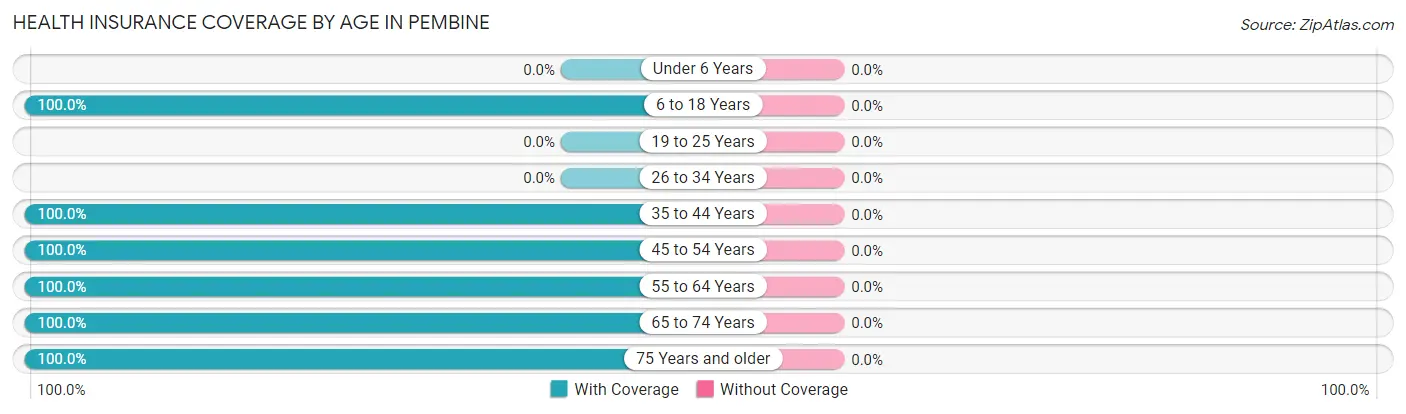
| Age Bracket | With Coverage | Without Coverage |
| Under 6 Years | 0 (0.0%) | 0 (0.0%) |
| 6 to 18 Years | 90 (100.0%) | 0 (0.0%) |
| 19 to 25 Years | 0 (0.0%) | 0 (0.0%) |
| 26 to 34 Years | 0 (0.0%) | 0 (0.0%) |
| 35 to 44 Years | 52 (100.0%) | 0 (0.0%) |
| 45 to 54 Years | 44 (100.0%) | 0 (0.0%) |
| 55 to 64 Years | 4 (100.0%) | 0 (0.0%) |
| 65 to 74 Years | 8 (100.0%) | 0 (0.0%) |
| 75 Years and older | 25 (100.0%) | 0 (0.0%) |
| Total | 223 (100.0%) | 0 (0.0%) |
Health Insurance Coverage by Citizenship Status in Pembine
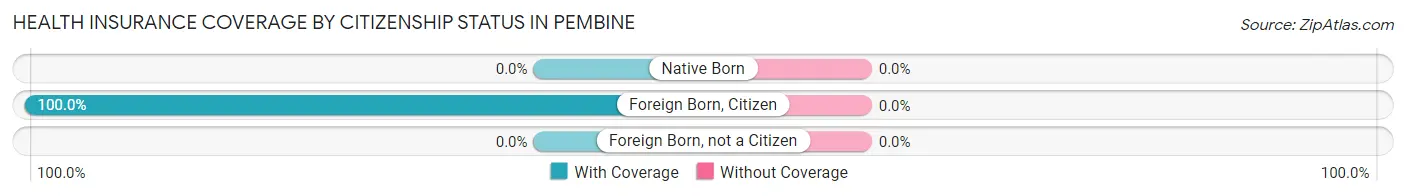
| Citizenship Status | With Coverage | Without Coverage |
| Native Born | 0 (0.0%) | 0 (0.0%) |
| Foreign Born, Citizen | 90 (100.0%) | 0 (0.0%) |
| Foreign Born, not a Citizen | 0 (0.0%) | 0 (0.0%) |
Health Insurance Coverage by Household Income in Pembine
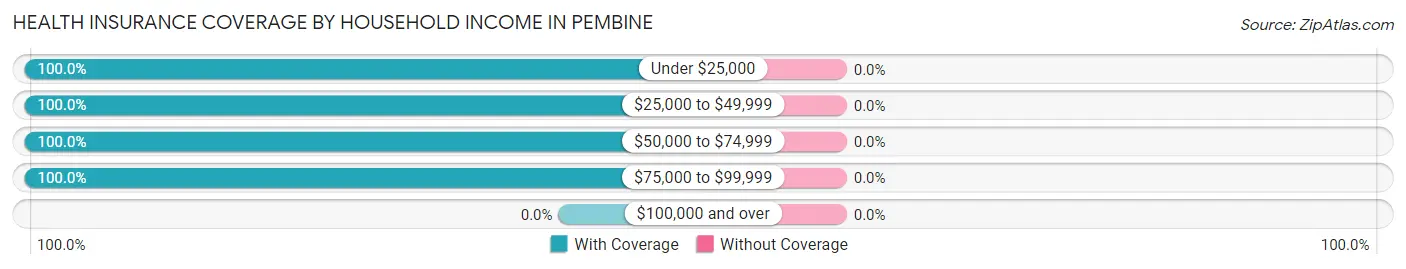
| Household Income | With Coverage | Without Coverage |
| Under $25,000 | 17 (100.0%) | 0 (0.0%) |
| $25,000 to $49,999 | 161 (100.0%) | 0 (0.0%) |
| $50,000 to $74,999 | 4 (100.0%) | 0 (0.0%) |
| $75,000 to $99,999 | 41 (100.0%) | 0 (0.0%) |
| $100,000 and over | 0 (0.0%) | 0 (0.0%) |
Public vs Private Health Insurance Coverage by Age in Pembine
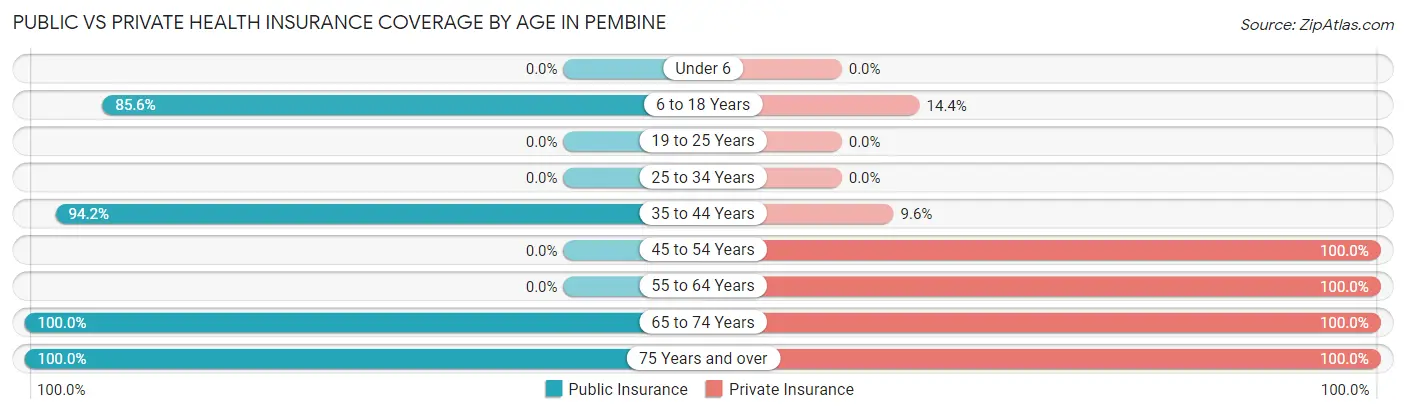
| Age Bracket | Public Insurance | Private Insurance |
| Under 6 | 0 (0.0%) | 0 (0.0%) |
| 6 to 18 Years | 77 (85.6%) | 13 (14.4%) |
| 19 to 25 Years | 0 (0.0%) | 0 (0.0%) |
| 25 to 34 Years | 0 (0.0%) | 0 (0.0%) |
| 35 to 44 Years | 49 (94.2%) | 5 (9.6%) |
| 45 to 54 Years | 0 (0.0%) | 44 (100.0%) |
| 55 to 64 Years | 0 (0.0%) | 4 (100.0%) |
| 65 to 74 Years | 8 (100.0%) | 8 (100.0%) |
| 75 Years and over | 25 (100.0%) | 25 (100.0%) |
| Total | 159 (71.3%) | 99 (44.4%) |
Disability Status by Sex by Age in Pembine
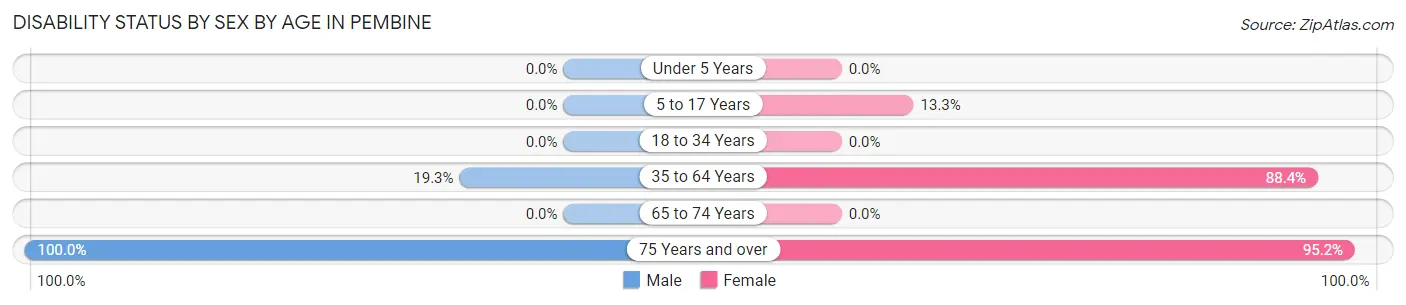
| Age Bracket | Male | Female |
| Under 5 Years | 0 (0.0%) | 0 (0.0%) |
| 5 to 17 Years | 0 (0.0%) | 6 (13.3%) |
| 18 to 34 Years | 0 (0.0%) | 0 (0.0%) |
| 35 to 64 Years | 11 (19.3%) | 38 (88.4%) |
| 65 to 74 Years | 0 (0.0%) | 0 (0.0%) |
| 75 Years and over | 4 (100.0%) | 20 (95.2%) |
Disability Class by Sex by Age in Pembine
Disability Class: Hearing Difficulty
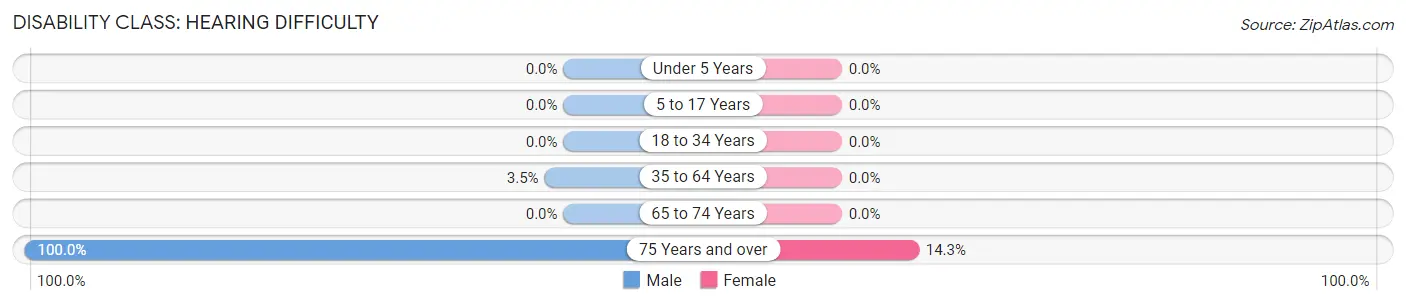
| Age Bracket | Male | Female |
| Under 5 Years | 0 (0.0%) | 0 (0.0%) |
| 5 to 17 Years | 0 (0.0%) | 0 (0.0%) |
| 18 to 34 Years | 0 (0.0%) | 0 (0.0%) |
| 35 to 64 Years | 2 (3.5%) | 0 (0.0%) |
| 65 to 74 Years | 0 (0.0%) | 0 (0.0%) |
| 75 Years and over | 4 (100.0%) | 3 (14.3%) |
Disability Class: Vision Difficulty
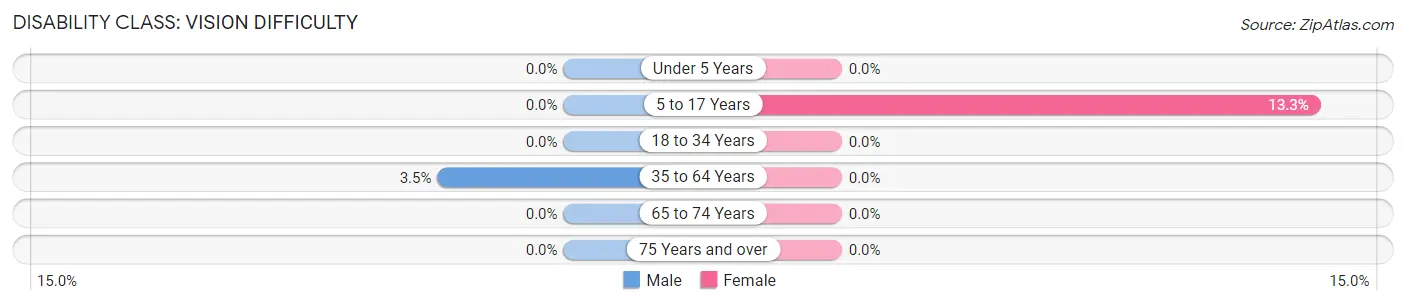
| Age Bracket | Male | Female |
| Under 5 Years | 0 (0.0%) | 0 (0.0%) |
| 5 to 17 Years | 0 (0.0%) | 6 (13.3%) |
| 18 to 34 Years | 0 (0.0%) | 0 (0.0%) |
| 35 to 64 Years | 2 (3.5%) | 0 (0.0%) |
| 65 to 74 Years | 0 (0.0%) | 0 (0.0%) |
| 75 Years and over | 0 (0.0%) | 0 (0.0%) |
Disability Class: Cognitive Difficulty
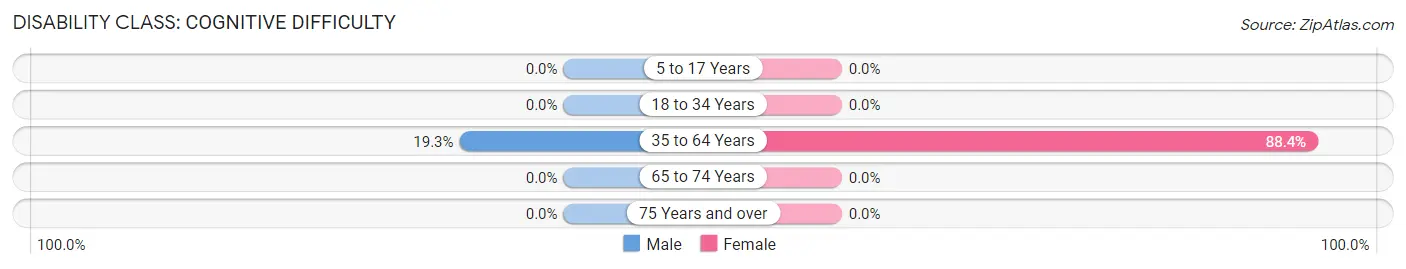
| Age Bracket | Male | Female |
| 5 to 17 Years | 0 (0.0%) | 0 (0.0%) |
| 18 to 34 Years | 0 (0.0%) | 0 (0.0%) |
| 35 to 64 Years | 11 (19.3%) | 38 (88.4%) |
| 65 to 74 Years | 0 (0.0%) | 0 (0.0%) |
| 75 Years and over | 0 (0.0%) | 0 (0.0%) |
Disability Class: Ambulatory Difficulty
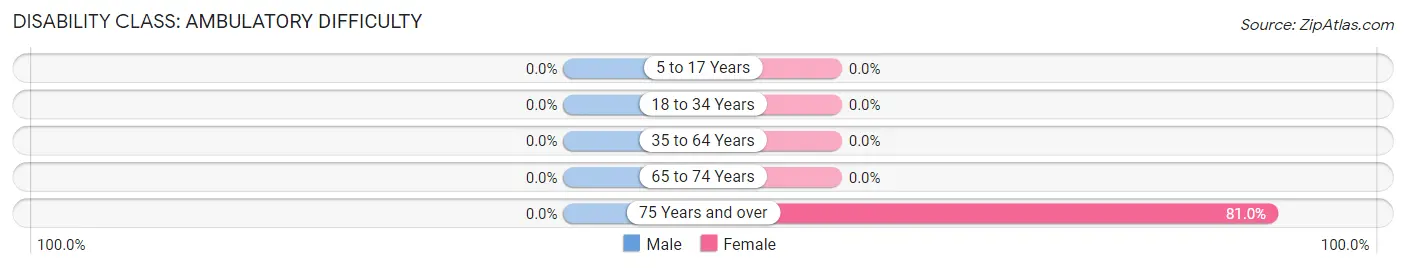
| Age Bracket | Male | Female |
| 5 to 17 Years | 0 (0.0%) | 0 (0.0%) |
| 18 to 34 Years | 0 (0.0%) | 0 (0.0%) |
| 35 to 64 Years | 0 (0.0%) | 0 (0.0%) |
| 65 to 74 Years | 0 (0.0%) | 0 (0.0%) |
| 75 Years and over | 0 (0.0%) | 17 (80.9%) |
Disability Class: Self-Care Difficulty
| Age Bracket | Male | Female |
| 5 to 17 Years | 0 (0.0%) | 0 (0.0%) |
| 18 to 34 Years | 0 (0.0%) | 0 (0.0%) |
| 35 to 64 Years | 0 (0.0%) | 0 (0.0%) |
| 65 to 74 Years | 0 (0.0%) | 0 (0.0%) |
| 75 Years and over | 0 (0.0%) | 0 (0.0%) |
Technology Access in Pembine
Computing Device Access in Pembine
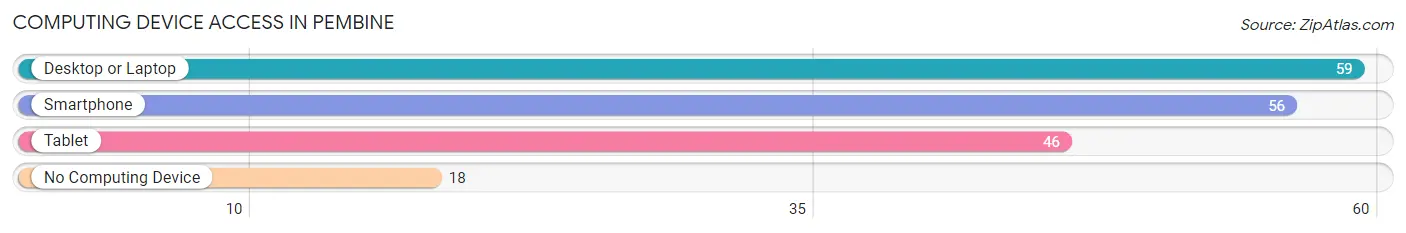
| Device Type | # Households | % Households |
| Desktop or Laptop | 59 | 76.6% |
| Smartphone | 56 | 72.7% |
| Tablet | 46 | 59.7% |
| No Computing Device | 18 | 23.4% |
| Total | 77 | 100.0% |
Internet Access in Pembine
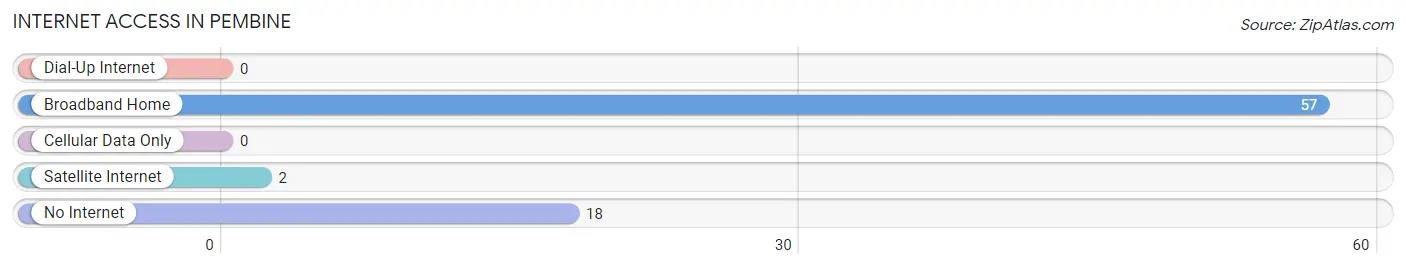
| Internet Type | # Households | % Households |
| Dial-Up Internet | 0 | 0.0% |
| Broadband Home | 57 | 74.0% |
| Cellular Data Only | 0 | 0.0% |
| Satellite Internet | 2 | 2.6% |
| No Internet | 18 | 23.4% |
| Total | 77 | 100.0% |
Pembine Summary
Pembine, Wisconsin is a small unincorporated community located in Marinette County, Wisconsin. It is situated on the Menominee River, which forms the border between Wisconsin and Michigan. The population of Pembine was estimated to be around 1,000 people in 2020.
History
Pembine was first settled in 1854 by a group of French-Canadian immigrants. The town was named after the Pembin River, which flows through the area. The first post office was established in 1856.
In the late 19th century, Pembine was a thriving lumber town. The town was home to several sawmills, a grist mill, and a shingle mill. The lumber industry was the main source of employment for the town’s residents.
In the early 20th century, the lumber industry began to decline and the town’s population began to dwindle. In the 1950s, the town was revitalized by the construction of a paper mill. The mill provided jobs for many of the town’s residents and helped to revive the local economy.
Geography
Pembine is located in Marinette County, Wisconsin. It is situated on the Menominee River, which forms the border between Wisconsin and Michigan. The town is located in the northern part of the state, about 30 miles south of the city of Green Bay.
The town is surrounded by forests and lakes, making it a popular destination for outdoor recreation. The nearby Menominee River is a popular spot for fishing, boating, and swimming.
Economy
The economy of Pembine is largely based on the paper mill that was built in the 1950s. The mill is the largest employer in the town and provides jobs for many of the town’s residents.
In addition to the paper mill, the town is home to several small businesses, including a grocery store, a hardware store, and a restaurant. The town also has a small tourist industry, with several bed and breakfasts and campgrounds located in the area.
Demographics
The population of Pembine was estimated to be around 1,000 people in 2020. The town is predominantly white, with about 95% of the population identifying as Caucasian. The median household income in the town is around $40,000.
The town is served by the Pembine School District, which includes an elementary school, a middle school, and a high school. The town also has a public library and a community center.
Conclusion
Pembine, Wisconsin is a small unincorporated community located in Marinette County, Wisconsin. It is situated on the Menominee River, which forms the border between Wisconsin and Michigan. The town has a population of around 1,000 people and is predominantly white. The economy of the town is largely based on the paper mill that was built in the 1950s. The town is also home to several small businesses and a small tourist industry. The town is served by the Pembine School District and has a public library and a community center.
Common Questions
What is Per Capita Income in Pembine?
Per Capita income in Pembine is $13,177.
What is the Median Family Income in Pembine?
Median Family Income in Pembine is $85,682.
What is the Median Household income in Pembine?
Median Household Income in Pembine is $28,722.
What is Inequality or Gini Index in Pembine?
Inequality or Gini Index in Pembine is 0.28.
What is the Total Population of Pembine?
Total Population of Pembine is 223.
What is the Total Male Population of Pembine?
Total Male Population of Pembine is 114.
What is the Total Female Population of Pembine?
Total Female Population of Pembine is 109.
What is the Ratio of Males per 100 Females in Pembine?
There are 104.59 Males per 100 Females in Pembine.
What is the Ratio of Females per 100 Males in Pembine?
There are 95.61 Females per 100 Males in Pembine.
What is the Median Population Age in Pembine?
Median Population Age in Pembine is 43.4 Years.
What is the Average Family Size in Pembine
Average Family Size in Pembine is 2.9 People.
What is the Average Household Size in Pembine
Average Household Size in Pembine is 2.9 People.
How Large is the Labor Force in Pembine?
There are 59 People in the Labor Forcein in Pembine.
What is the Percentage of People in the Labor Force in Pembine?
44.4% of People are in the Labor Force in Pembine.