Park Falls, WI Map & Demographics
Park Falls Map
Park Falls Overview
$28,337
PER CAPITA INCOME
$54,464
AVG FAMILY INCOME
$43,631
AVG HOUSEHOLD INCOME
16.2%
WAGE / INCOME GAP [ % ]
83.8¢/ $1
WAGE / INCOME GAP [ $ ]
$10,232
FAMILY INCOME DEFICIT
0.43
INEQUALITY / GINI INDEX
2,389
TOTAL POPULATION
1,077
MALE POPULATION
1,312
FEMALE POPULATION
82.09
MALES / 100 FEMALES
121.82
FEMALES / 100 MALES
44.4
MEDIAN AGE
3.0
AVG FAMILY SIZE
2.0
AVG HOUSEHOLD SIZE
918
LABOR FORCE [ PEOPLE ]
47.8%
PERCENT IN LABOR FORCE
2.7%
UNEMPLOYMENT RATE
Park Falls Zip Codes
Park Falls Area Codes
Income in Park Falls
Income Overview in Park Falls
Per Capita Income in Park Falls is $28,337, while median incomes of families and households are $54,464 and $43,631 respectively.
| Characteristic | Number | Measure |
| Per Capita Income | 2,389 | $28,337 |
| Median Family Income | 511 | $54,464 |
| Mean Family Income | 511 | $73,383 |
| Median Household Income | 1,150 | $43,631 |
| Mean Household Income | 1,150 | $57,450 |
| Income Deficit | 511 | $10,232 |
| Wage / Income Gap (%) | 2,389 | 16.19% |
| Wage / Income Gap ($) | 2,389 | 83.81¢ per $1 |
| Gini / Inequality Index | 2,389 | 0.43 |
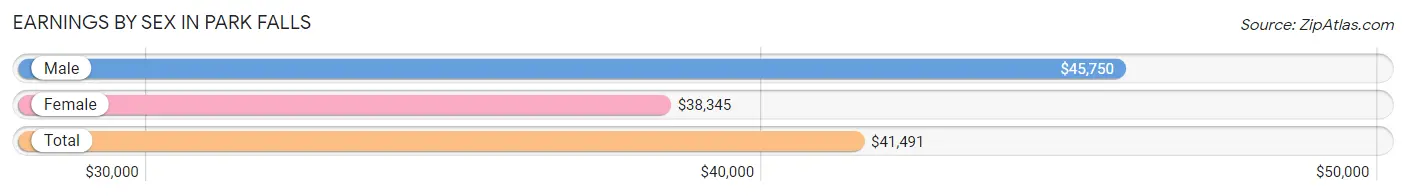
Earnings by Sex in Park Falls
Average Earnings in Park Falls are $41,491, $45,750 for men and $38,345 for women, a difference of 16.2%.
| Sex | Number | Average Earnings |
| Male | 453 (47.3%) | $45,750 |
| Female | 505 (52.7%) | $38,345 |
| Total | 958 (100.0%) | $41,491 |
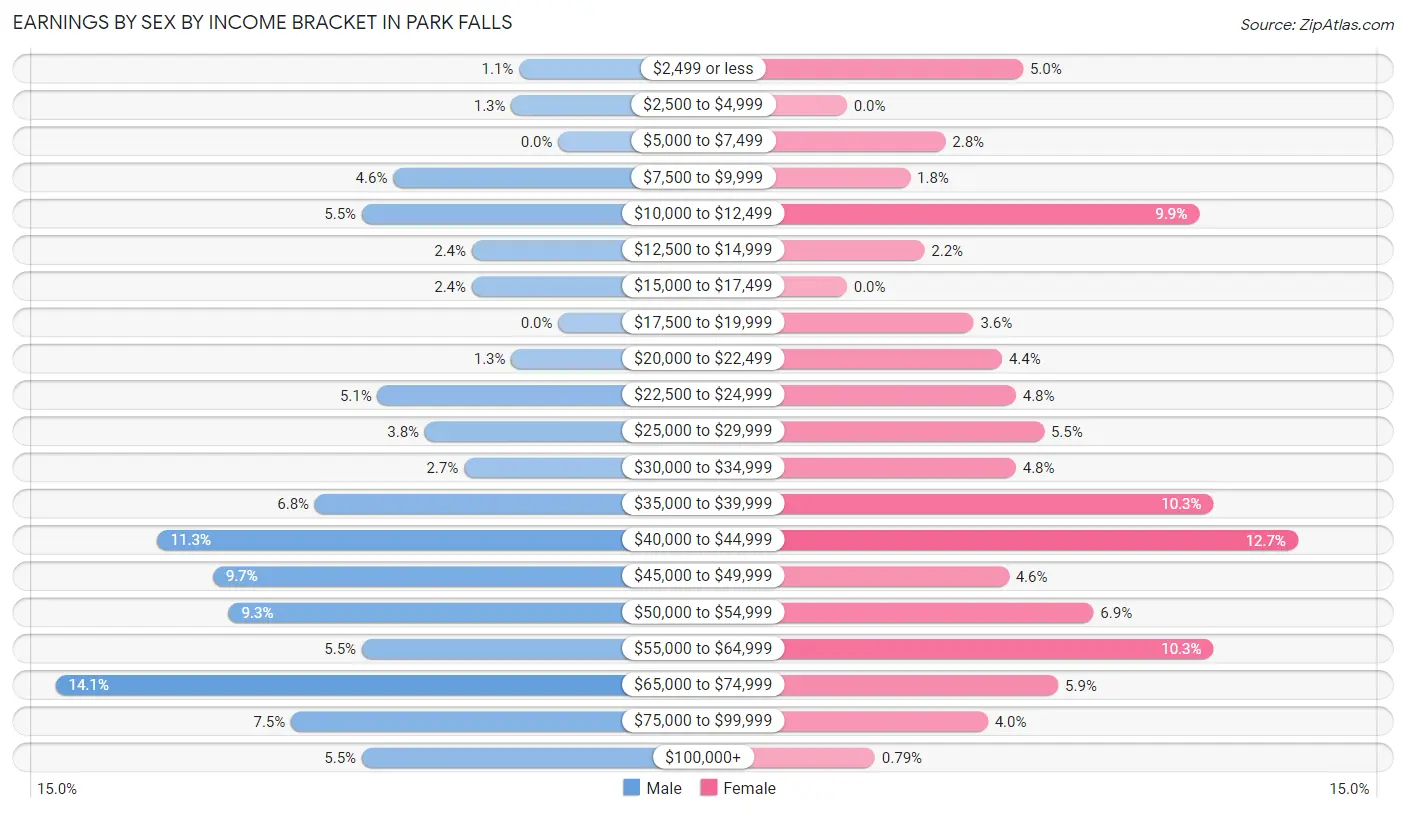
Earnings by Sex by Income Bracket in Park Falls
The most common earnings brackets in Park Falls are $65,000 to $74,999 for men (64 | 14.1%) and $40,000 to $44,999 for women (64 | 12.7%).
| Income | Male | Female |
| $2,499 or less | 5 (1.1%) | 25 (5.0%) |
| $2,500 to $4,999 | 6 (1.3%) | 0 (0.0%) |
| $5,000 to $7,499 | 0 (0.0%) | 14 (2.8%) |
| $7,500 to $9,999 | 21 (4.6%) | 9 (1.8%) |
| $10,000 to $12,499 | 25 (5.5%) | 50 (9.9%) |
| $12,500 to $14,999 | 11 (2.4%) | 11 (2.2%) |
| $15,000 to $17,499 | 11 (2.4%) | 0 (0.0%) |
| $17,500 to $19,999 | 0 (0.0%) | 18 (3.6%) |
| $20,000 to $22,499 | 6 (1.3%) | 22 (4.4%) |
| $22,500 to $24,999 | 23 (5.1%) | 24 (4.8%) |
| $25,000 to $29,999 | 17 (3.7%) | 28 (5.5%) |
| $30,000 to $34,999 | 12 (2.6%) | 24 (4.8%) |
| $35,000 to $39,999 | 31 (6.8%) | 52 (10.3%) |
| $40,000 to $44,999 | 51 (11.3%) | 64 (12.7%) |
| $45,000 to $49,999 | 44 (9.7%) | 23 (4.5%) |
| $50,000 to $54,999 | 42 (9.3%) | 35 (6.9%) |
| $55,000 to $64,999 | 25 (5.5%) | 52 (10.3%) |
| $65,000 to $74,999 | 64 (14.1%) | 30 (5.9%) |
| $75,000 to $99,999 | 34 (7.5%) | 20 (4.0%) |
| $100,000+ | 25 (5.5%) | 4 (0.8%) |
| Total | 453 (100.0%) | 505 (100.0%) |
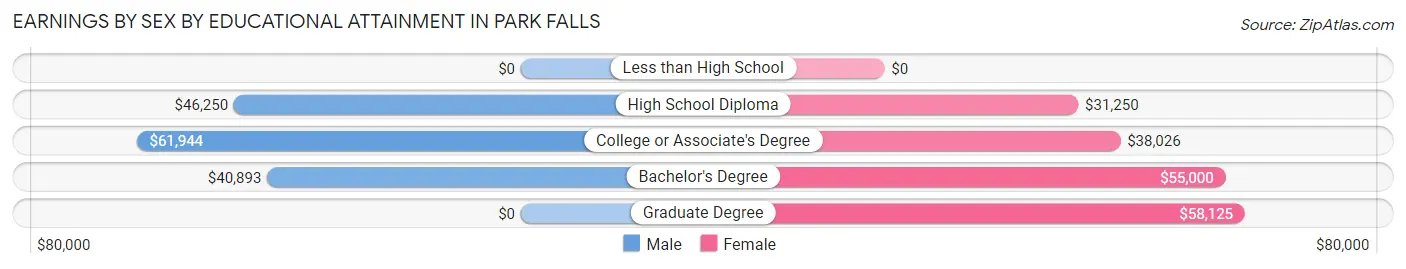
Earnings by Sex by Educational Attainment in Park Falls
Average earnings in Park Falls are $52,531 for men and $39,224 for women, a difference of 25.3%. Men with an educational attainment of college or associate's degree enjoy the highest average annual earnings of $61,944, while those with bachelor's degree education earn the least with $40,893. Women with an educational attainment of graduate degree earn the most with the average annual earnings of $58,125, while those with high school diploma education have the smallest earnings of $31,250.
| Educational Attainment | Male Income | Female Income |
| Less than High School | - | - |
| High School Diploma | $46,250 | $31,250 |
| College or Associate's Degree | $61,944 | $38,026 |
| Bachelor's Degree | $40,893 | $55,000 |
| Graduate Degree | - | - |
| Total | $52,531 | $39,224 |
Family Income in Park Falls
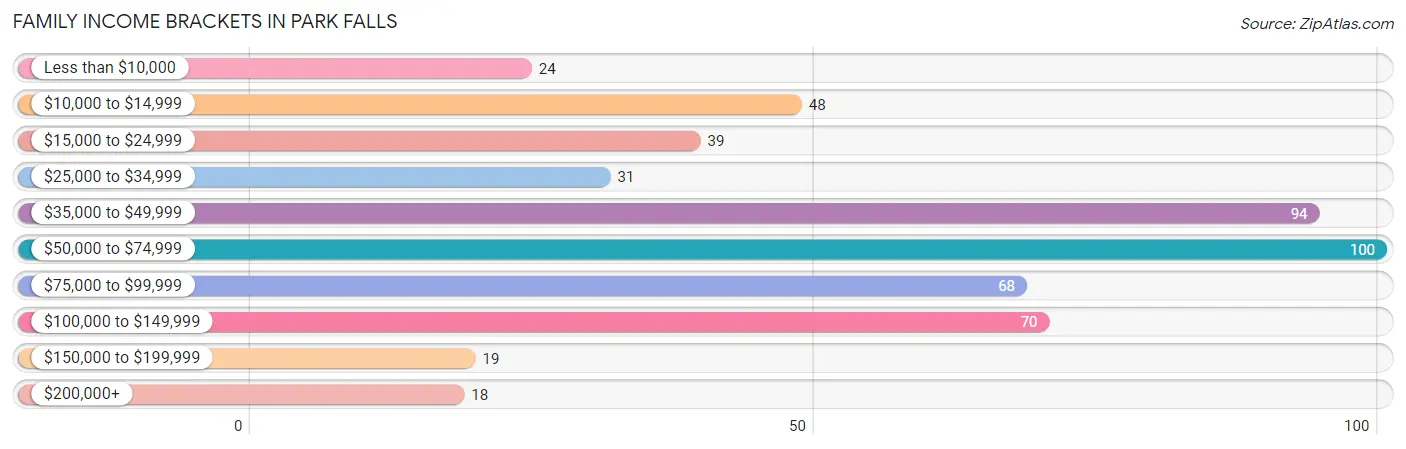
Family Income Brackets in Park Falls
According to the Park Falls family income data, there are 100 families falling into the $50,000 to $74,999 income range, which is the most common income bracket and makes up 19.6% of all families. Conversely, the $200,000+ income bracket is the least frequent group with only 18 families (3.5%) belonging to this category.
| Income Bracket | # Families | % Families |
| Less than $10,000 | 24 | 4.7% |
| $10,000 to $14,999 | 48 | 9.4% |
| $15,000 to $24,999 | 39 | 7.6% |
| $25,000 to $34,999 | 31 | 6.1% |
| $35,000 to $49,999 | 94 | 18.4% |
| $50,000 to $74,999 | 100 | 19.6% |
| $75,000 to $99,999 | 68 | 13.3% |
| $100,000 to $149,999 | 70 | 13.7% |
| $150,000 to $199,999 | 19 | 3.7% |
| $200,000+ | 18 | 3.5% |
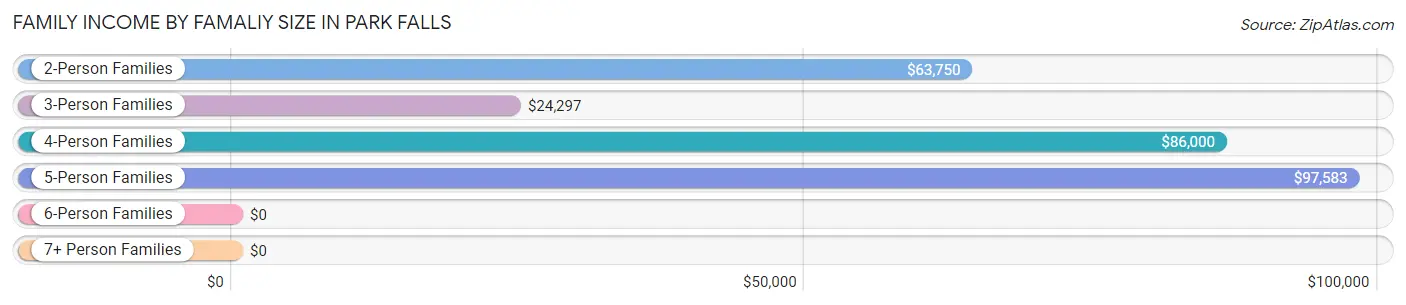
Family Income by Famaliy Size in Park Falls
5-person families (39 | 7.6%) account for the highest median family income in Park Falls with $97,583 per family, while 2-person families (290 | 56.8%) have the highest median income of $31,875 per family member.
| Income Bracket | # Families | Median Income |
| 2-Person Families | 290 (56.8%) | $63,750 |
| 3-Person Families | 129 (25.2%) | $24,297 |
| 4-Person Families | 38 (7.4%) | $86,000 |
| 5-Person Families | 39 (7.6%) | $97,583 |
| 6-Person Families | 8 (1.6%) | $0 |
| 7+ Person Families | 7 (1.4%) | $0 |
| Total | 511 (100.0%) | $54,464 |
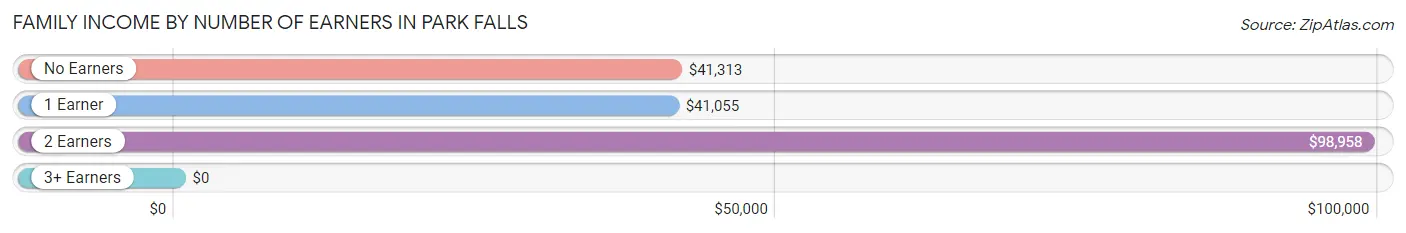
Family Income by Number of Earners in Park Falls
| Number of Earners | # Families | Median Income |
| No Earners | 129 (25.2%) | $41,313 |
| 1 Earner | 191 (37.4%) | $41,055 |
| 2 Earners | 183 (35.8%) | $98,958 |
| 3+ Earners | 8 (1.6%) | $0 |
| Total | 511 (100.0%) | $54,464 |
Household Income in Park Falls
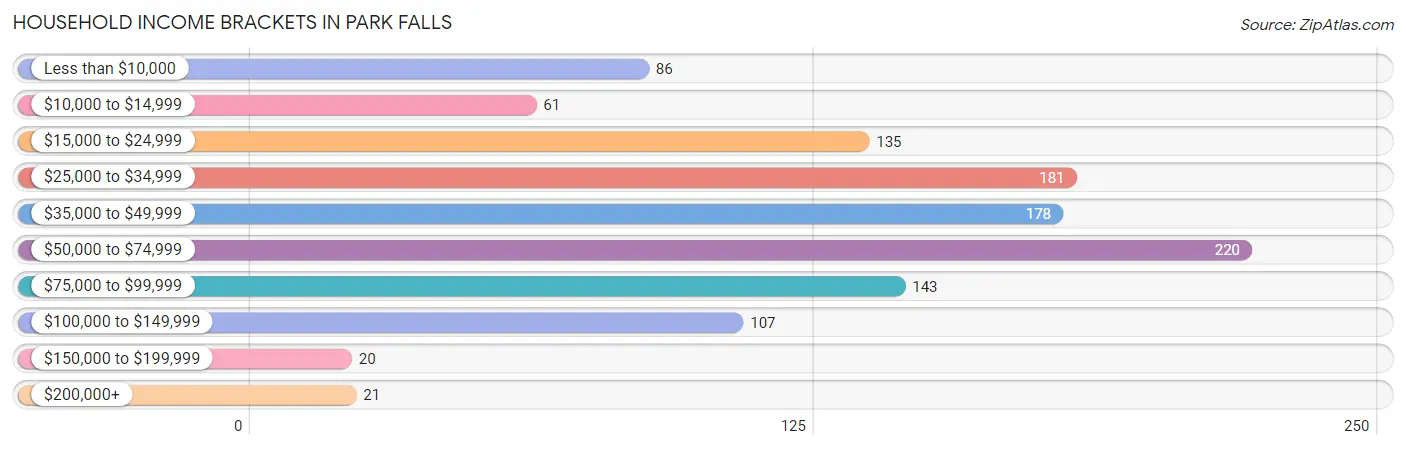
Household Income Brackets in Park Falls
With 220 households falling in the category, the $50,000 to $74,999 income range is the most frequent in Park Falls, accounting for 19.1% of all households. In contrast, only 20 households (1.7%) fall into the $150,000 to $199,999 income bracket, making it the least populous group.
| Income Bracket | # Households | % Households |
| Less than $10,000 | 86 | 7.5% |
| $10,000 to $14,999 | 61 | 5.3% |
| $15,000 to $24,999 | 135 | 11.7% |
| $25,000 to $34,999 | 181 | 15.7% |
| $35,000 to $49,999 | 178 | 15.5% |
| $50,000 to $74,999 | 220 | 19.1% |
| $75,000 to $99,999 | 143 | 12.4% |
| $100,000 to $149,999 | 107 | 9.3% |
| $150,000 to $199,999 | 20 | 1.7% |
| $200,000+ | 21 | 1.8% |
Household Income by Householder Age in Park Falls
The median household income in Park Falls is $43,631, with the highest median household income of $53,542 found in the 45 to 64 years age bracket for the primary householder. A total of 415 households (36.1%) fall into this category. Meanwhile, the 15 to 24 years age bracket for the primary householder has the lowest median household income of $0, with 17 households (1.5%) in this group.
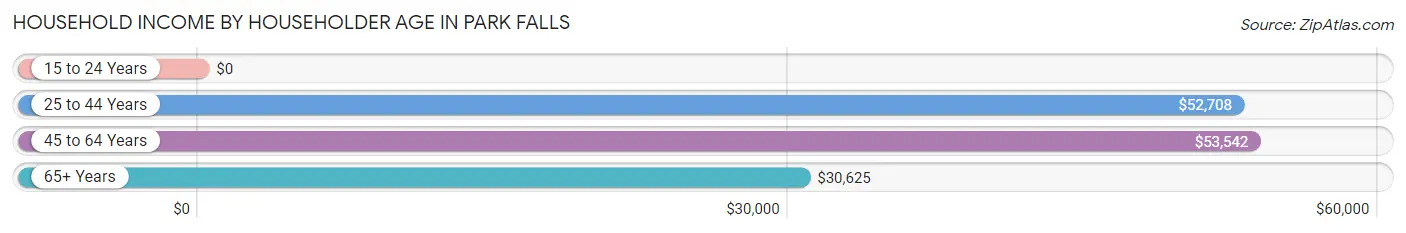
| Income Bracket | # Households | Median Income |
| 15 to 24 Years | 17 (1.5%) | $0 |
| 25 to 44 Years | 320 (27.8%) | $52,708 |
| 45 to 64 Years | 415 (36.1%) | $53,542 |
| 65+ Years | 398 (34.6%) | $30,625 |
| Total | 1,150 (100.0%) | $43,631 |
Poverty in Park Falls
Income Below Poverty by Sex and Age in Park Falls
With 26.5% poverty level for males and 29.4% for females among the residents of Park Falls, 5 year old males and 16 and 17 year old females are the most vulnerable to poverty, with 15 males (100.0%) and 5 females (100.0%) in their respective age groups living below the poverty level.
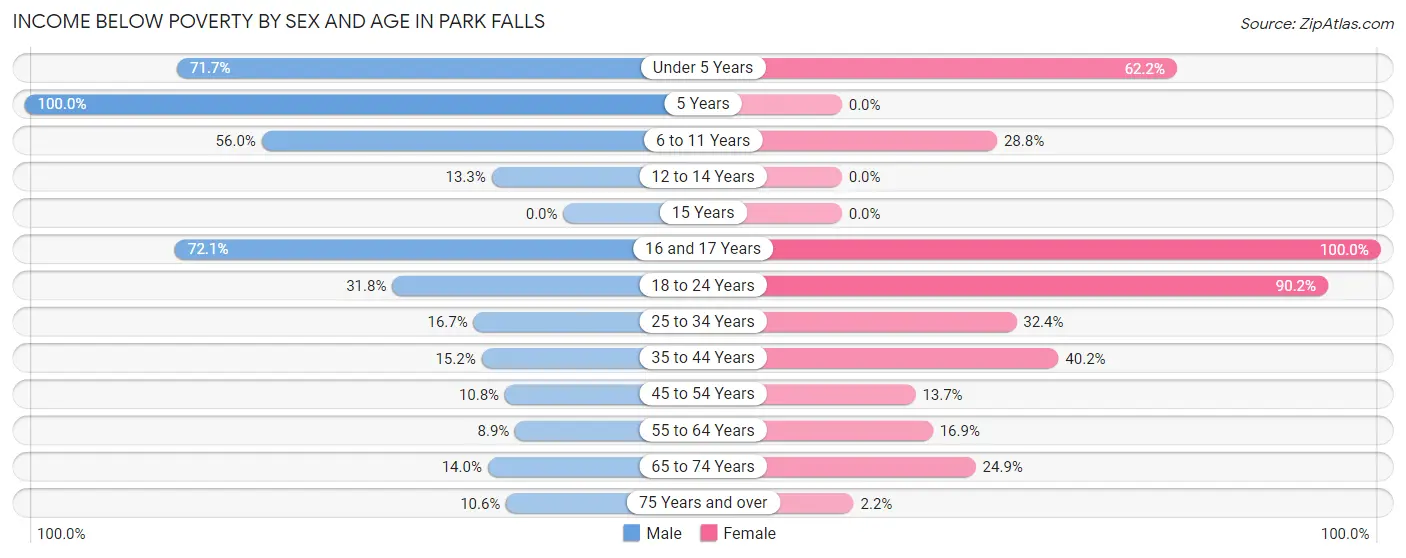
| Age Bracket | Male | Female |
| Under 5 Years | 38 (71.7%) | 46 (62.2%) |
| 5 Years | 15 (100.0%) | 0 (0.0%) |
| 6 to 11 Years | 56 (56.0%) | 17 (28.8%) |
| 12 to 14 Years | 8 (13.3%) | 0 (0.0%) |
| 15 Years | 0 (0.0%) | 0 (0.0%) |
| 16 and 17 Years | 49 (72.1%) | 5 (100.0%) |
| 18 to 24 Years | 27 (31.8%) | 129 (90.2%) |
| 25 to 34 Years | 15 (16.7%) | 46 (32.4%) |
| 35 to 44 Years | 19 (15.2%) | 39 (40.2%) |
| 45 to 54 Years | 9 (10.8%) | 19 (13.7%) |
| 55 to 64 Years | 16 (8.9%) | 26 (16.9%) |
| 65 to 74 Years | 16 (14.0%) | 41 (24.8%) |
| 75 Years and over | 7 (10.6%) | 4 (2.2%) |
| Total | 275 (26.5%) | 372 (29.4%) |
Income Above Poverty by Sex and Age in Park Falls
According to the poverty statistics in Park Falls, males aged 55 to 64 years and females aged 5 years are the age groups that are most secure financially, with 91.1% of males and 100.0% of females in these age groups living above the poverty line.
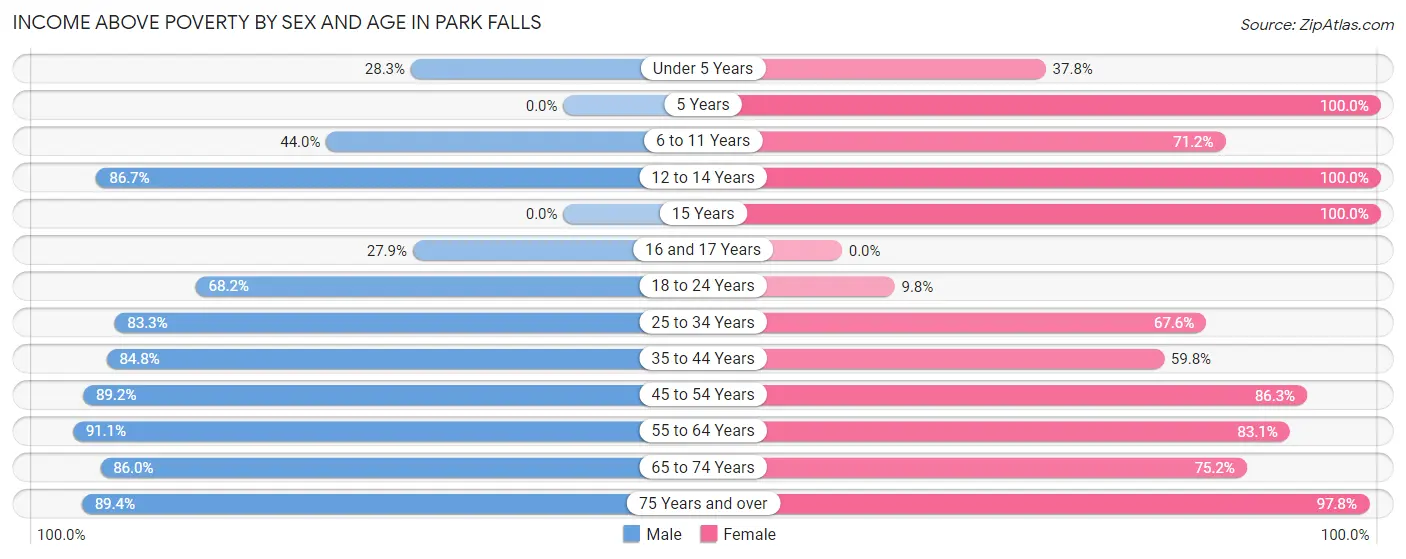
| Age Bracket | Male | Female |
| Under 5 Years | 15 (28.3%) | 28 (37.8%) |
| 5 Years | 0 (0.0%) | 17 (100.0%) |
| 6 to 11 Years | 44 (44.0%) | 42 (71.2%) |
| 12 to 14 Years | 52 (86.7%) | 61 (100.0%) |
| 15 Years | 0 (0.0%) | 24 (100.0%) |
| 16 and 17 Years | 19 (27.9%) | 0 (0.0%) |
| 18 to 24 Years | 58 (68.2%) | 14 (9.8%) |
| 25 to 34 Years | 75 (83.3%) | 96 (67.6%) |
| 35 to 44 Years | 106 (84.8%) | 58 (59.8%) |
| 45 to 54 Years | 74 (89.2%) | 120 (86.3%) |
| 55 to 64 Years | 163 (91.1%) | 128 (83.1%) |
| 65 to 74 Years | 98 (86.0%) | 124 (75.1%) |
| 75 Years and over | 59 (89.4%) | 179 (97.8%) |
| Total | 763 (73.5%) | 891 (70.6%) |
Income Below Poverty Among Married-Couple Families in Park Falls
The poverty statistics for married-couple families in Park Falls show that 9.6% or 33 of the total 345 families live below the poverty line. Families with 3 or 4 children have the highest poverty rate of 34.2%, comprising of 13 families. On the other hand, families with 5 or more children have the lowest poverty rate of 0.0%, which includes 0 families.
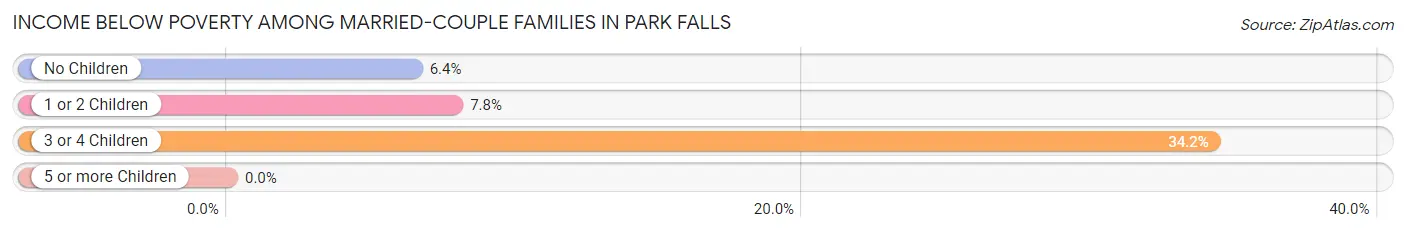
| Children | Above Poverty | Below Poverty |
| No Children | 233 (93.6%) | 16 (6.4%) |
| 1 or 2 Children | 47 (92.2%) | 4 (7.8%) |
| 3 or 4 Children | 25 (65.8%) | 13 (34.2%) |
| 5 or more Children | 7 (100.0%) | 0 (0.0%) |
| Total | 312 (90.4%) | 33 (9.6%) |
Income Below Poverty Among Single-Parent Households in Park Falls
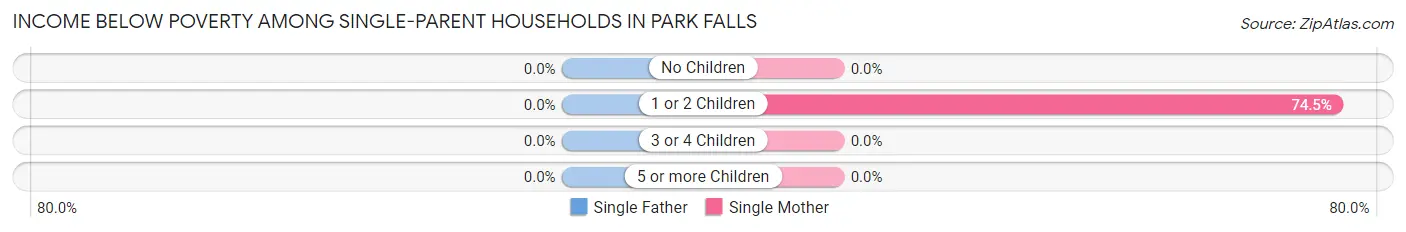
| Children | Single Father | Single Mother |
| No Children | 0 (0.0%) | 0 (0.0%) |
| 1 or 2 Children | 0 (0.0%) | 73 (74.5%) |
| 3 or 4 Children | 0 (0.0%) | 0 (0.0%) |
| 5 or more Children | 0 (0.0%) | 0 (0.0%) |
| Total | 0 (0.0%) | 73 (63.5%) |
Income Below Poverty Among Married-Couple vs Single-Parent Households in Park Falls
The poverty data for Park Falls shows that 33 of the married-couple family households (9.6%) and 73 of the single-parent households (44.0%) are living below the poverty level. Within the married-couple family households, those with 3 or 4 children have the highest poverty rate, with 13 households (34.2%) falling below the poverty line. Among the single-parent households, those with 1 or 2 children have the highest poverty rate, with 73 household (55.7%) living below poverty.
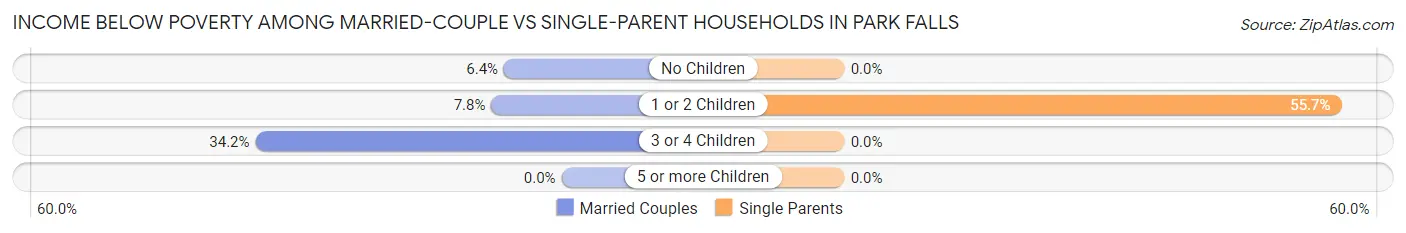
| Children | Married-Couple Families | Single-Parent Households |
| No Children | 16 (6.4%) | 0 (0.0%) |
| 1 or 2 Children | 4 (7.8%) | 73 (55.7%) |
| 3 or 4 Children | 13 (34.2%) | 0 (0.0%) |
| 5 or more Children | 0 (0.0%) | 0 (0.0%) |
| Total | 33 (9.6%) | 73 (44.0%) |
Race in Park Falls
The most populous races in Park Falls are White / Caucasian (2,160 | 90.4%), Two or more Races (166 | 7.0%), and Hispanic or Latino (67 | 2.8%).
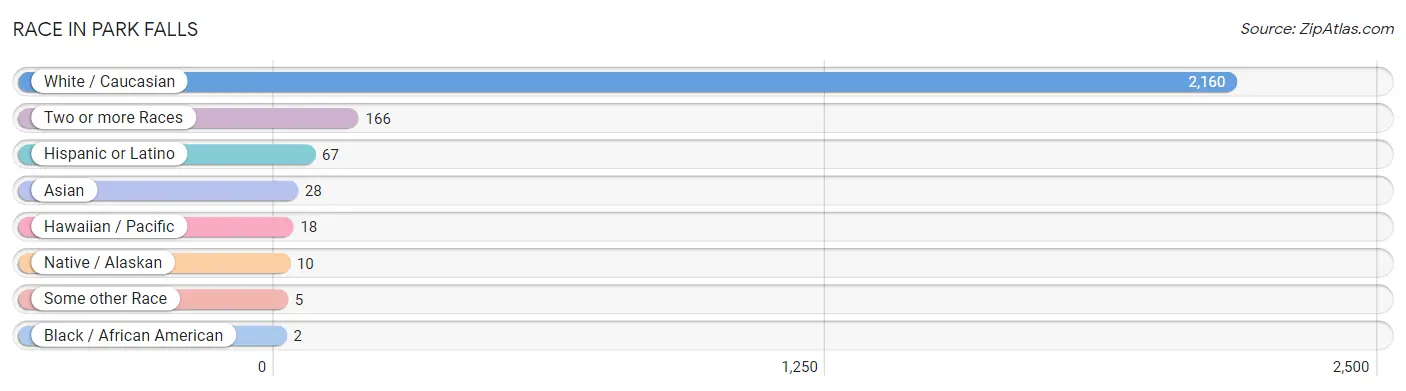
| Race | # Population | % Population |
| Asian | 28 | 1.2% |
| Black / African American | 2 | 0.1% |
| Hawaiian / Pacific | 18 | 0.7% |
| Hispanic or Latino | 67 | 2.8% |
| Native / Alaskan | 10 | 0.4% |
| White / Caucasian | 2,160 | 90.4% |
| Two or more Races | 166 | 7.0% |
| Some other Race | 5 | 0.2% |
| Total | 2,389 | 100.0% |
Ancestry in Park Falls
The most populous ancestries reported in Park Falls are German (1,063 | 44.5%), Irish (286 | 12.0%), English (260 | 10.9%), Norwegian (204 | 8.5%), and Polish (175 | 7.3%), together accounting for 83.2% of all Park Falls residents.
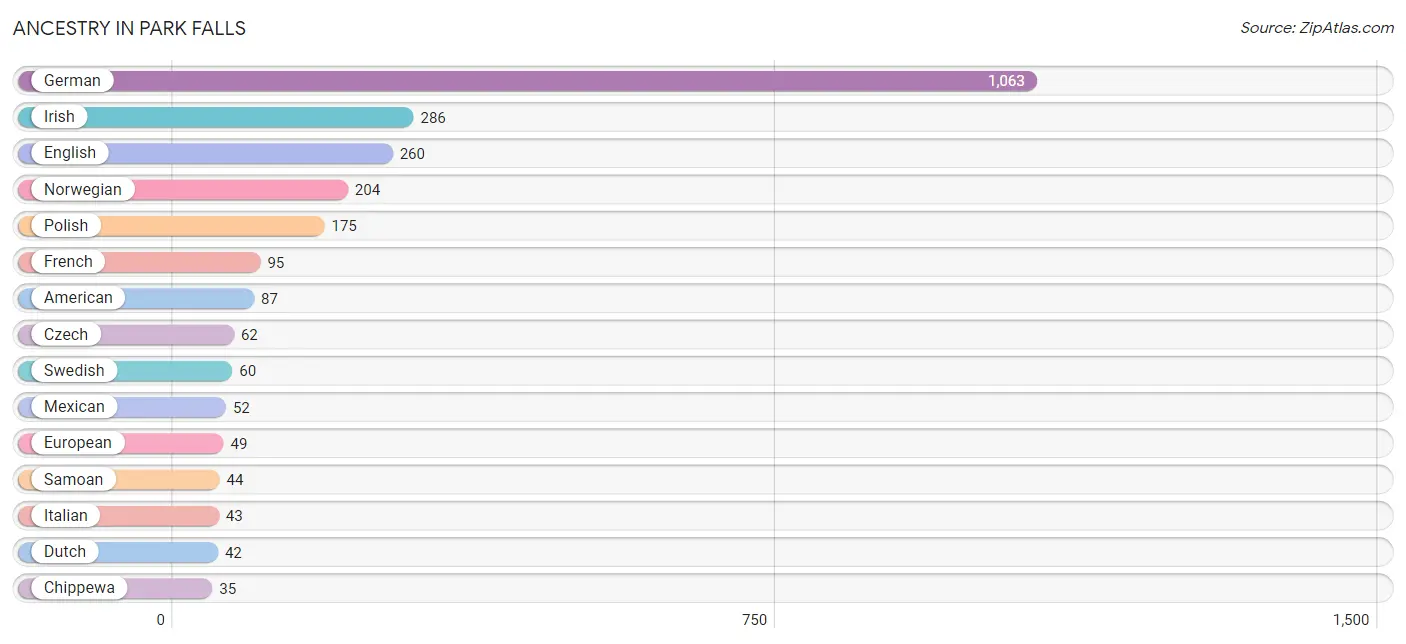
| Ancestry | # Population | % Population |
| American | 87 | 3.6% |
| Arab | 5 | 0.2% |
| Austrian | 13 | 0.5% |
| Belgian | 7 | 0.3% |
| British | 7 | 0.3% |
| Burmese | 4 | 0.2% |
| Chippewa | 35 | 1.5% |
| Croatian | 7 | 0.3% |
| Czech | 62 | 2.6% |
| Czechoslovakian | 4 | 0.2% |
| Danish | 23 | 1.0% |
| Dutch | 42 | 1.8% |
| English | 260 | 10.9% |
| European | 49 | 2.1% |
| Finnish | 24 | 1.0% |
| French | 95 | 4.0% |
| French Canadian | 19 | 0.8% |
| German | 1,063 | 44.5% |
| Hungarian | 5 | 0.2% |
| Indian (Asian) | 11 | 0.5% |
| Irish | 286 | 12.0% |
| Italian | 43 | 1.8% |
| Japanese | 9 | 0.4% |
| Korean | 8 | 0.3% |
| Mexican | 52 | 2.2% |
| Northern European | 8 | 0.3% |
| Norwegian | 204 | 8.5% |
| Polish | 175 | 7.3% |
| Puerto Rican | 15 | 0.6% |
| Russian | 3 | 0.1% |
| Samoan | 44 | 1.8% |
| Scandinavian | 26 | 1.1% |
| Scotch-Irish | 16 | 0.7% |
| Scottish | 5 | 0.2% |
| Slovene | 5 | 0.2% |
| Swedish | 60 | 2.5% |
| Swiss | 5 | 0.2% |
| Ukrainian | 7 | 0.3% | View All 38 Rows |
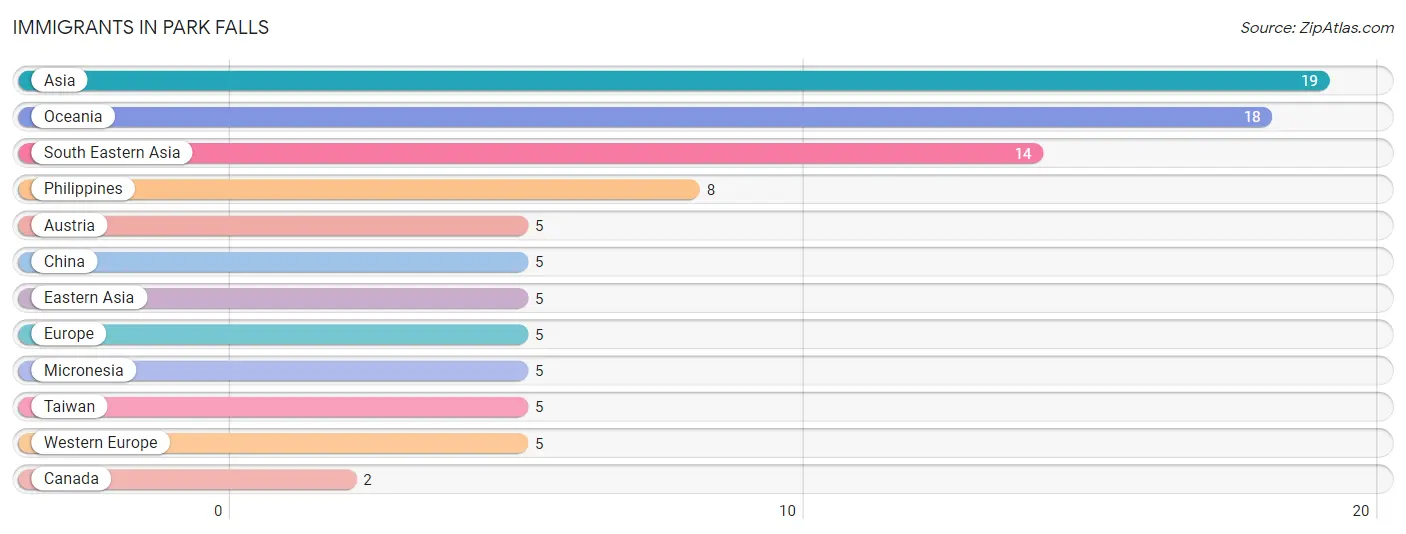
Immigrants in Park Falls
The most numerous immigrant groups reported in Park Falls came from Asia (19 | 0.8%), Oceania (18 | 0.7%), South Eastern Asia (14 | 0.6%), Philippines (8 | 0.3%), and Austria (5 | 0.2%), together accounting for 2.7% of all Park Falls residents.
| Immigration Origin | # Population | % Population |
| Asia | 19 | 0.8% |
| Austria | 5 | 0.2% |
| Canada | 2 | 0.1% |
| China | 5 | 0.2% |
| Eastern Asia | 5 | 0.2% |
| Europe | 5 | 0.2% |
| Micronesia | 5 | 0.2% |
| Oceania | 18 | 0.7% |
| Philippines | 8 | 0.3% |
| South Eastern Asia | 14 | 0.6% |
| Taiwan | 5 | 0.2% |
| Western Europe | 5 | 0.2% | View All 12 Rows |
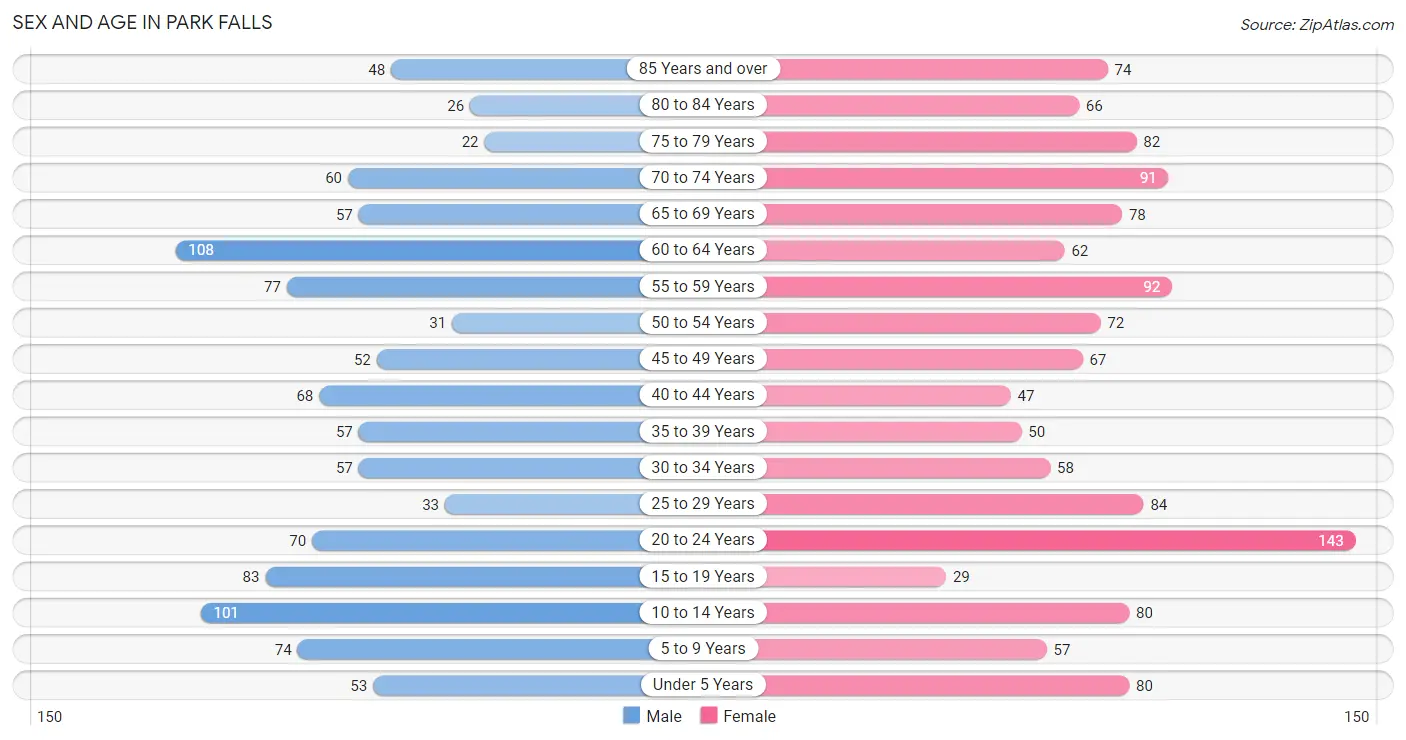
Sex and Age in Park Falls
Sex and Age in Park Falls
The most populous age groups in Park Falls are 60 to 64 Years (108 | 10.0%) for men and 20 to 24 Years (143 | 10.9%) for women.
| Age Bracket | Male | Female |
| Under 5 Years | 53 (4.9%) | 80 (6.1%) |
| 5 to 9 Years | 74 (6.9%) | 57 (4.3%) |
| 10 to 14 Years | 101 (9.4%) | 80 (6.1%) |
| 15 to 19 Years | 83 (7.7%) | 29 (2.2%) |
| 20 to 24 Years | 70 (6.5%) | 143 (10.9%) |
| 25 to 29 Years | 33 (3.1%) | 84 (6.4%) |
| 30 to 34 Years | 57 (5.3%) | 58 (4.4%) |
| 35 to 39 Years | 57 (5.3%) | 50 (3.8%) |
| 40 to 44 Years | 68 (6.3%) | 47 (3.6%) |
| 45 to 49 Years | 52 (4.8%) | 67 (5.1%) |
| 50 to 54 Years | 31 (2.9%) | 72 (5.5%) |
| 55 to 59 Years | 77 (7.1%) | 92 (7.0%) |
| 60 to 64 Years | 108 (10.0%) | 62 (4.7%) |
| 65 to 69 Years | 57 (5.3%) | 78 (5.9%) |
| 70 to 74 Years | 60 (5.6%) | 91 (6.9%) |
| 75 to 79 Years | 22 (2.0%) | 82 (6.2%) |
| 80 to 84 Years | 26 (2.4%) | 66 (5.0%) |
| 85 Years and over | 48 (4.5%) | 74 (5.6%) |
| Total | 1,077 (100.0%) | 1,312 (100.0%) |
Families and Households in Park Falls
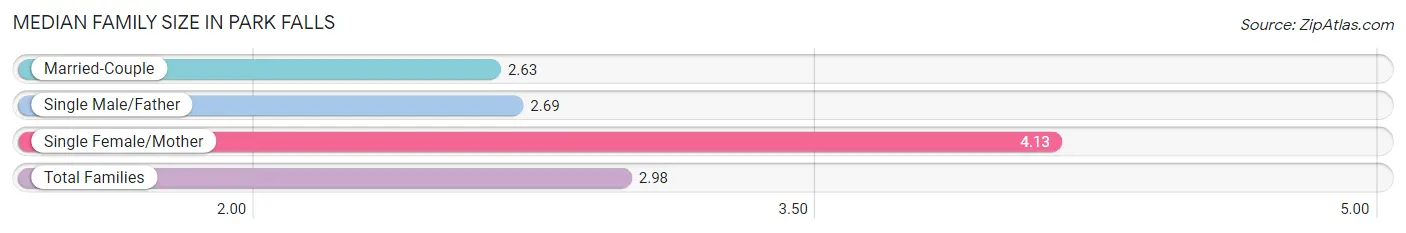
Median Family Size in Park Falls
The median family size in Park Falls is 2.98 persons per family, with single female/mother families (115 | 22.5%) accounting for the largest median family size of 4.13 persons per family. On the other hand, married-couple families (345 | 67.5%) represent the smallest median family size with 2.63 persons per family.
| Family Type | # Families | Family Size |
| Married-Couple | 345 (67.5%) | 2.63 |
| Single Male/Father | 51 (10.0%) | 2.69 |
| Single Female/Mother | 115 (22.5%) | 4.13 |
| Total Families | 511 (100.0%) | 2.98 |
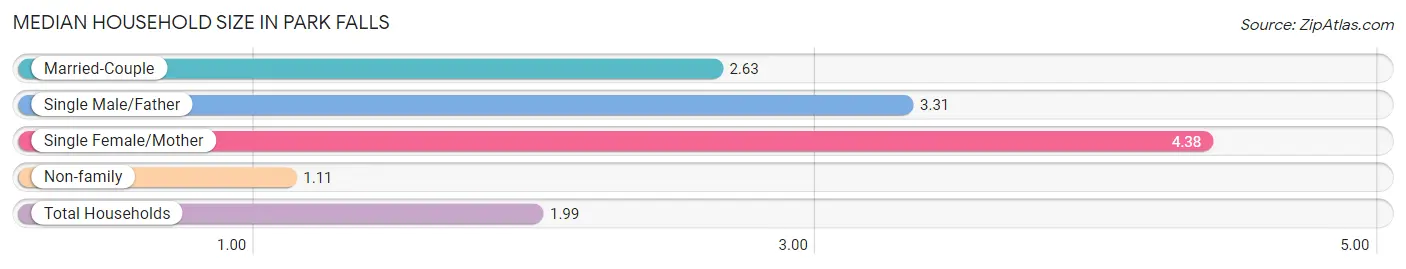
Median Household Size in Park Falls
The median household size in Park Falls is 1.99 persons per household, with single female/mother households (115 | 10.0%) accounting for the largest median household size of 4.38 persons per household. non-family households (639 | 55.6%) represent the smallest median household size with 1.11 persons per household.
| Household Type | # Households | Household Size |
| Married-Couple | 345 (30.0%) | 2.63 |
| Single Male/Father | 51 (4.4%) | 3.31 |
| Single Female/Mother | 115 (10.0%) | 4.38 |
| Non-family | 639 (55.6%) | 1.11 |
| Total Households | 1,150 (100.0%) | 1.99 |
Household Size by Marriage Status in Park Falls
Out of a total of 1,150 households in Park Falls, 511 (44.4%) are family households, while 639 (55.6%) are nonfamily households. The most numerous type of family households are 2-person households, comprising 270, and the most common type of nonfamily households are 1-person households, comprising 567.
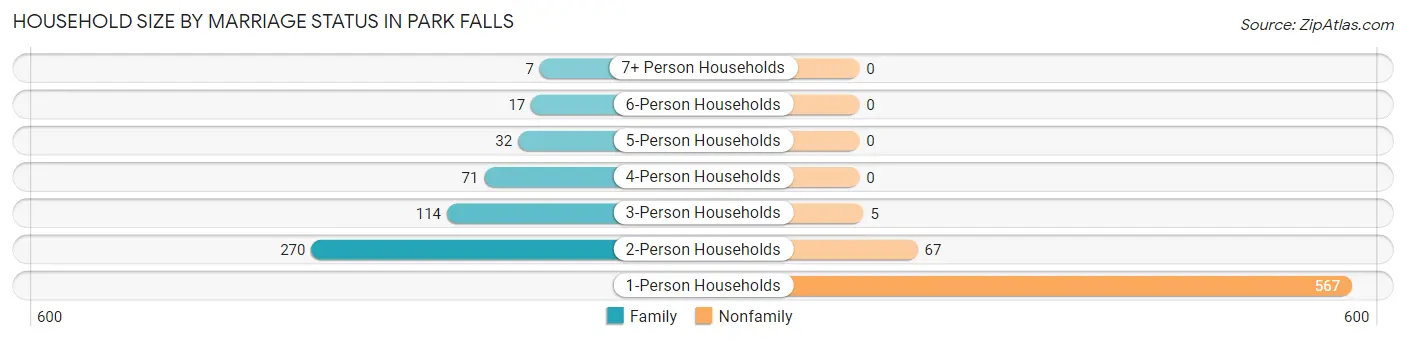
| Household Size | Family Households | Nonfamily Households |
| 1-Person Households | - | 567 (49.3%) |
| 2-Person Households | 270 (23.5%) | 67 (5.8%) |
| 3-Person Households | 114 (9.9%) | 5 (0.4%) |
| 4-Person Households | 71 (6.2%) | 0 (0.0%) |
| 5-Person Households | 32 (2.8%) | 0 (0.0%) |
| 6-Person Households | 17 (1.5%) | 0 (0.0%) |
| 7+ Person Households | 7 (0.6%) | 0 (0.0%) |
| Total | 511 (44.4%) | 639 (55.6%) |
Female Fertility in Park Falls
Fertility by Age in Park Falls
Average fertility rate in Park Falls is 22.0 births per 1,000 women. Women in the age bracket of 20 to 34 years have the highest fertility rate with 28.0 births per 1,000 women. Women in the age bracket of 20 to 34 years acount for 72.7% of all women with births.
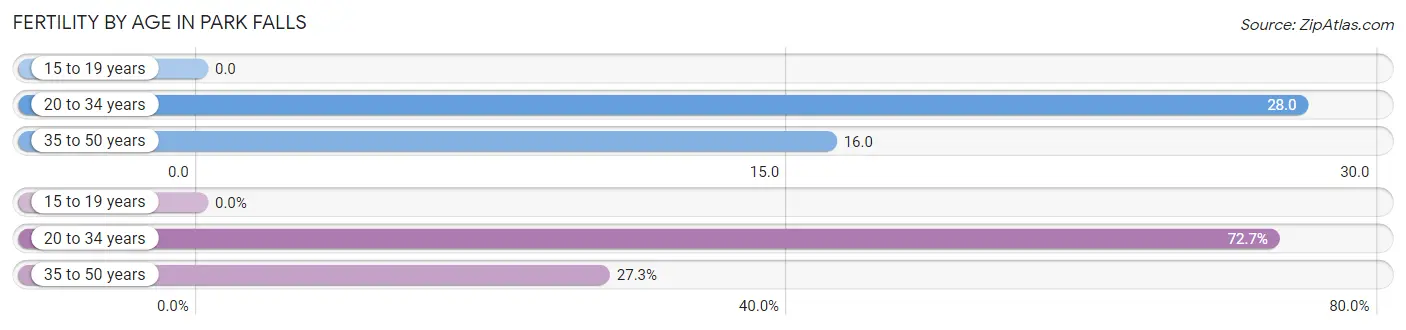
| Age Bracket | Women with Births | Births / 1,000 Women |
| 15 to 19 years | 0 (0.0%) | 0.0 |
| 20 to 34 years | 8 (72.7%) | 28.0 |
| 35 to 50 years | 3 (27.3%) | 16.0 |
| Total | 11 (100.0%) | 22.0 |
Fertility by Age by Marriage Status in Park Falls
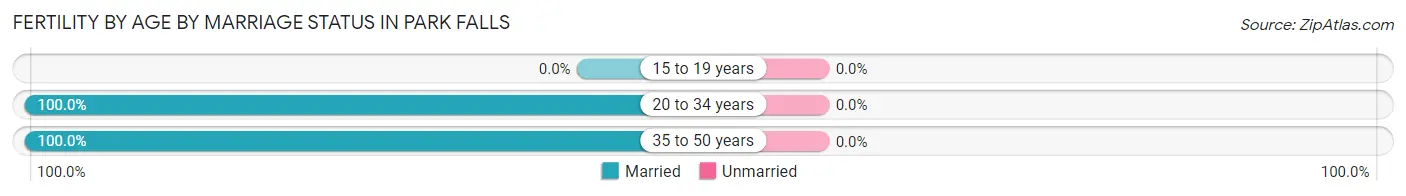
| Age Bracket | Married | Unmarried |
| 15 to 19 years | 0 (0.0%) | 0 (0.0%) |
| 20 to 34 years | 8 (100.0%) | 0 (0.0%) |
| 35 to 50 years | 3 (100.0%) | 0 (0.0%) |
| Total | 11 (100.0%) | 0 (0.0%) |
Fertility by Education in Park Falls
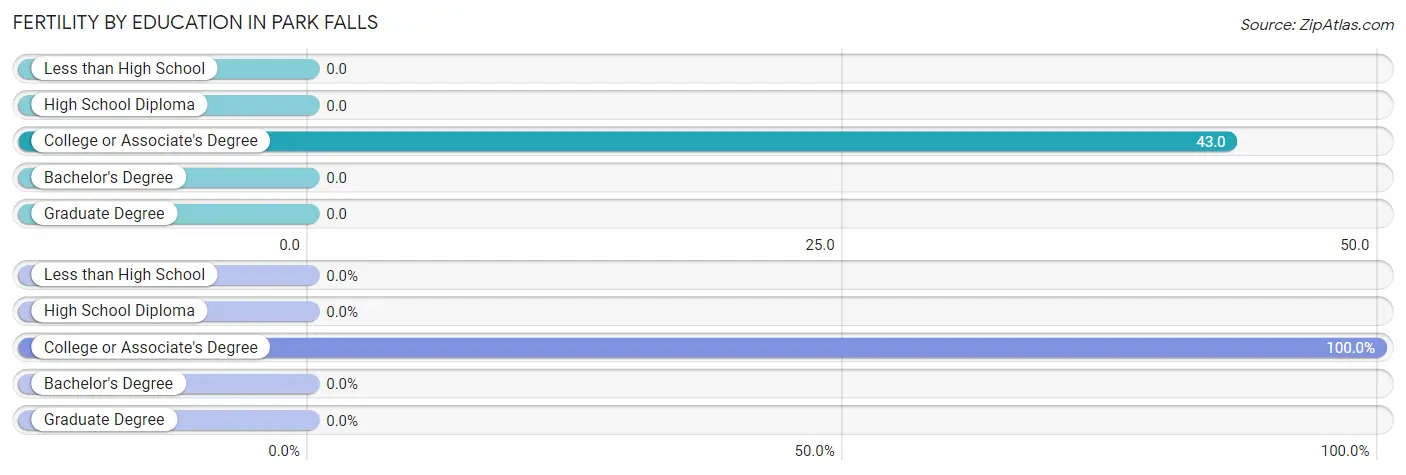
| Educational Attainment | Women with Births | Births / 1,000 Women |
| Less than High School | 0 (0.0%) | 0.0 |
| High School Diploma | 0 (0.0%) | 0.0 |
| College or Associate's Degree | 11 (100.0%) | 43.0 |
| Bachelor's Degree | 0 (0.0%) | 0.0 |
| Graduate Degree | 0 (0.0%) | 0.0 |
| Total | 11 (100.0%) | 22.0 |
Fertility by Education by Marriage Status in Park Falls
| Educational Attainment | Married | Unmarried |
| Less than High School | 0 (0.0%) | 0 (0.0%) |
| High School Diploma | 0 (0.0%) | 0 (0.0%) |
| College or Associate's Degree | 11 (100.0%) | 0 (0.0%) |
| Bachelor's Degree | 0 (0.0%) | 0 (0.0%) |
| Graduate Degree | 0 (0.0%) | 0 (0.0%) |
| Total | 11 (100.0%) | 0 (0.0%) |
Employment Characteristics in Park Falls
Employment by Class of Employer in Park Falls
Among the 890 employed individuals in Park Falls, private company employees (668 | 75.1%), local government employees (80 | 9.0%), and self-employed (incorporated) (51 | 5.7%) make up the most common classes of employment.
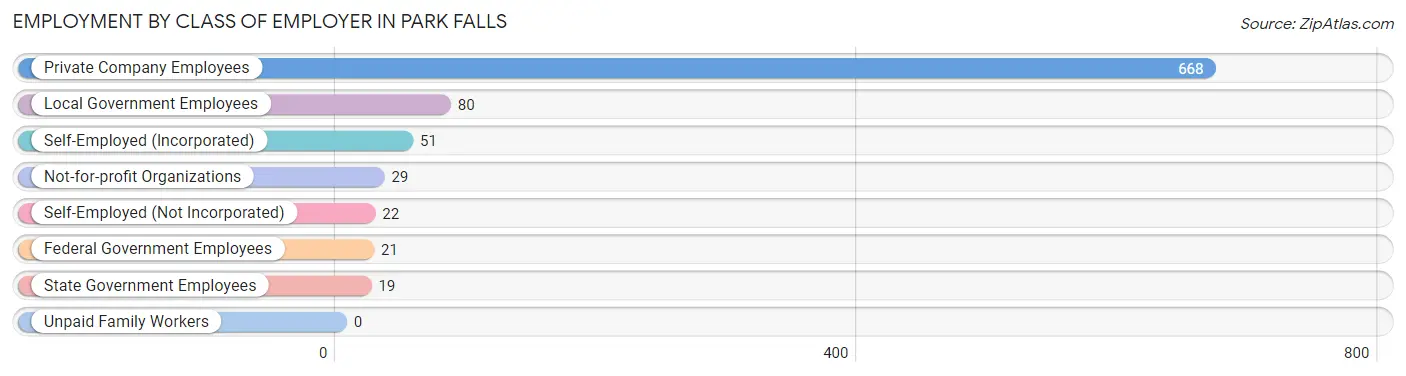
| Employer Class | # Employees | % Employees |
| Private Company Employees | 668 | 75.1% |
| Self-Employed (Incorporated) | 51 | 5.7% |
| Self-Employed (Not Incorporated) | 22 | 2.5% |
| Not-for-profit Organizations | 29 | 3.3% |
| Local Government Employees | 80 | 9.0% |
| State Government Employees | 19 | 2.1% |
| Federal Government Employees | 21 | 2.4% |
| Unpaid Family Workers | 0 | 0.0% |
| Total | 890 | 100.0% |
Employment Status by Age in Park Falls
According to the labor force statistics for Park Falls, out of the total population over 16 years of age (1,920), 47.8% or 918 individuals are in the labor force, with 2.7% or 25 of them unemployed. The age group with the highest labor force participation rate is 25 to 29 years, with 95.7% or 112 individuals in the labor force. Within the labor force, the 60 to 64 years age range has the highest percentage of unemployed individuals, with 9.2% or 7 of them being unemployed.
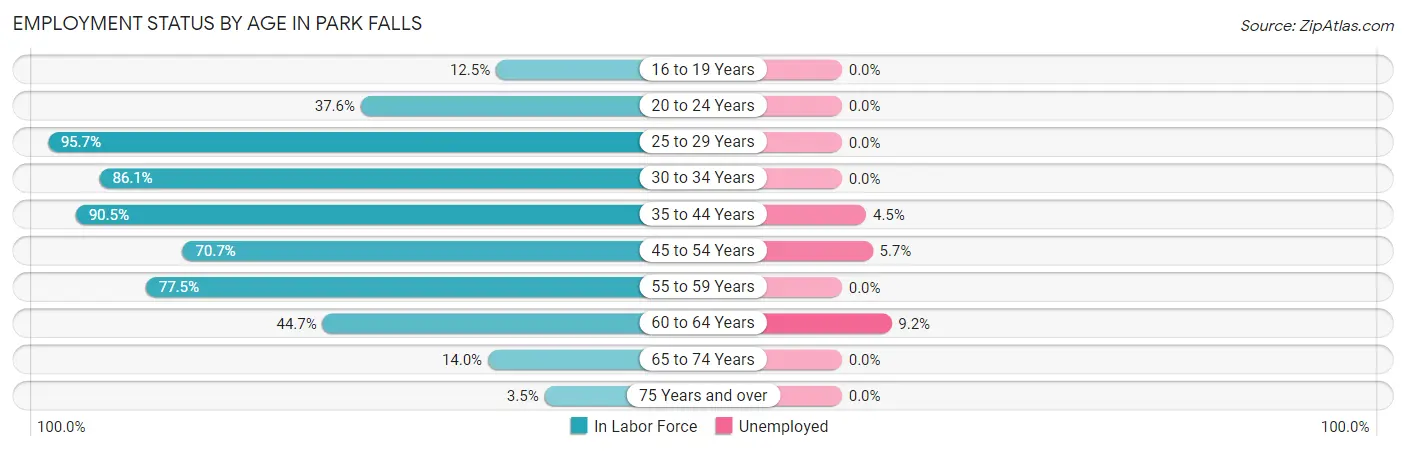
| Age Bracket | In Labor Force | Unemployed |
| 16 to 19 Years | 11 (12.5%) | 0 (0.0%) |
| 20 to 24 Years | 80 (37.6%) | 0 (0.0%) |
| 25 to 29 Years | 112 (95.7%) | 0 (0.0%) |
| 30 to 34 Years | 99 (86.1%) | 0 (0.0%) |
| 35 to 44 Years | 201 (90.5%) | 9 (4.5%) |
| 45 to 54 Years | 157 (70.7%) | 9 (5.7%) |
| 55 to 59 Years | 131 (77.5%) | 0 (0.0%) |
| 60 to 64 Years | 76 (44.7%) | 7 (9.2%) |
| 65 to 74 Years | 40 (14.0%) | 0 (0.0%) |
| 75 Years and over | 11 (3.5%) | 0 (0.0%) |
| Total | 918 (47.8%) | 25 (2.7%) |
Employment Status by Educational Attainment in Park Falls
According to labor force statistics for Park Falls, 76.5% of individuals (776) out of the total population between 25 and 64 years of age (1,015) are in the labor force, with 3.2% or 25 of them being unemployed. The group with the highest labor force participation rate are those with the educational attainment of bachelor's degree or higher, with 94.1% or 128 individuals in the labor force. Within the labor force, individuals with bachelor's degree or higher education have the highest percentage of unemployment, with 5.5% or 7 of them being unemployed.
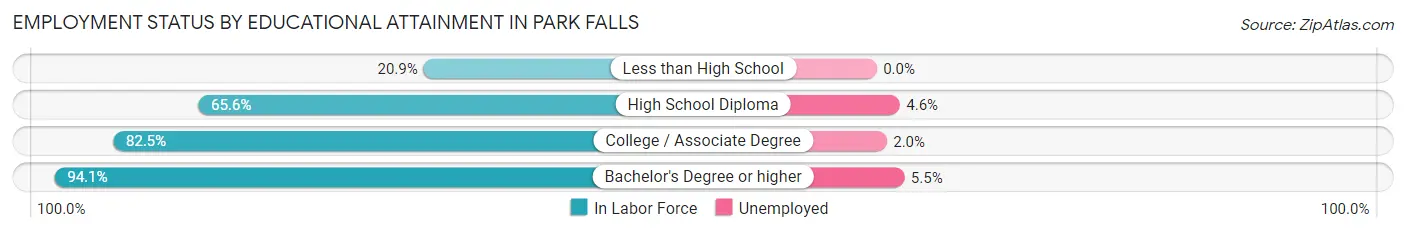
| Educational Attainment | In Labor Force | Unemployed |
| Less than High School | 9 (20.9%) | 0 (0.0%) |
| High School Diploma | 196 (65.6%) | 14 (4.6%) |
| College / Associate Degree | 443 (82.5%) | 11 (2.0%) |
| Bachelor's Degree or higher | 128 (94.1%) | 7 (5.5%) |
| Total | 776 (76.5%) | 32 (3.2%) |
Employment Occupations by Sex in Park Falls
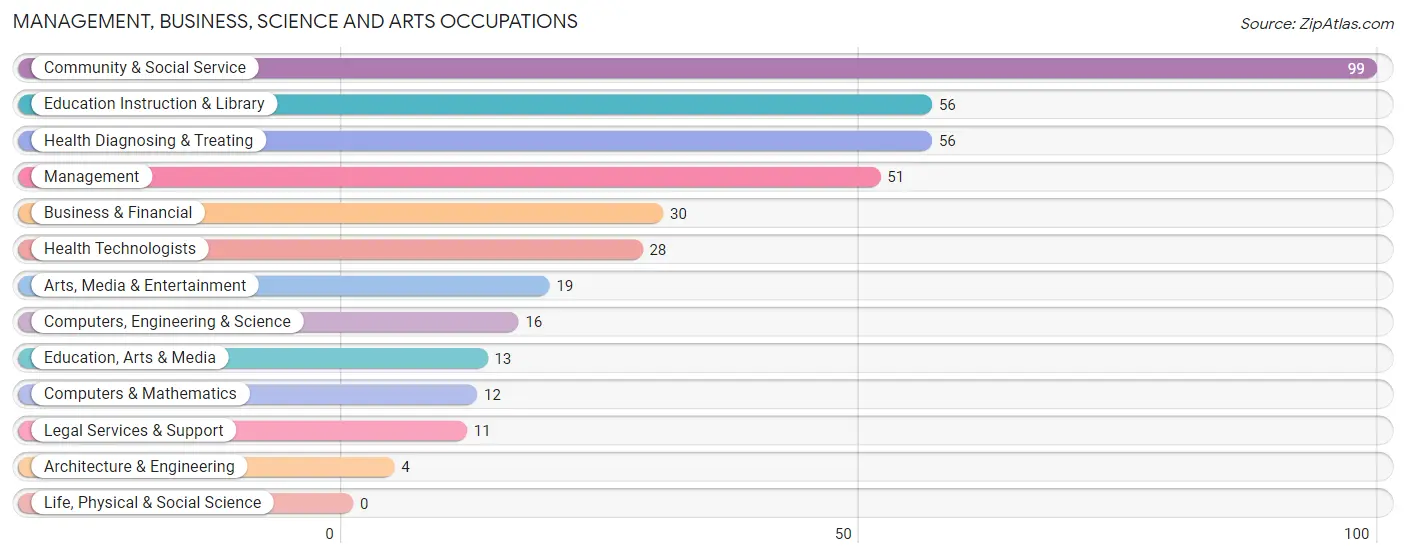
Management, Business, Science and Arts Occupations
The most common Management, Business, Science and Arts occupations in Park Falls are Community & Social Service (99 | 11.1%), Education Instruction & Library (56 | 6.3%), Health Diagnosing & Treating (56 | 6.3%), Management (51 | 5.7%), and Business & Financial (30 | 3.4%).
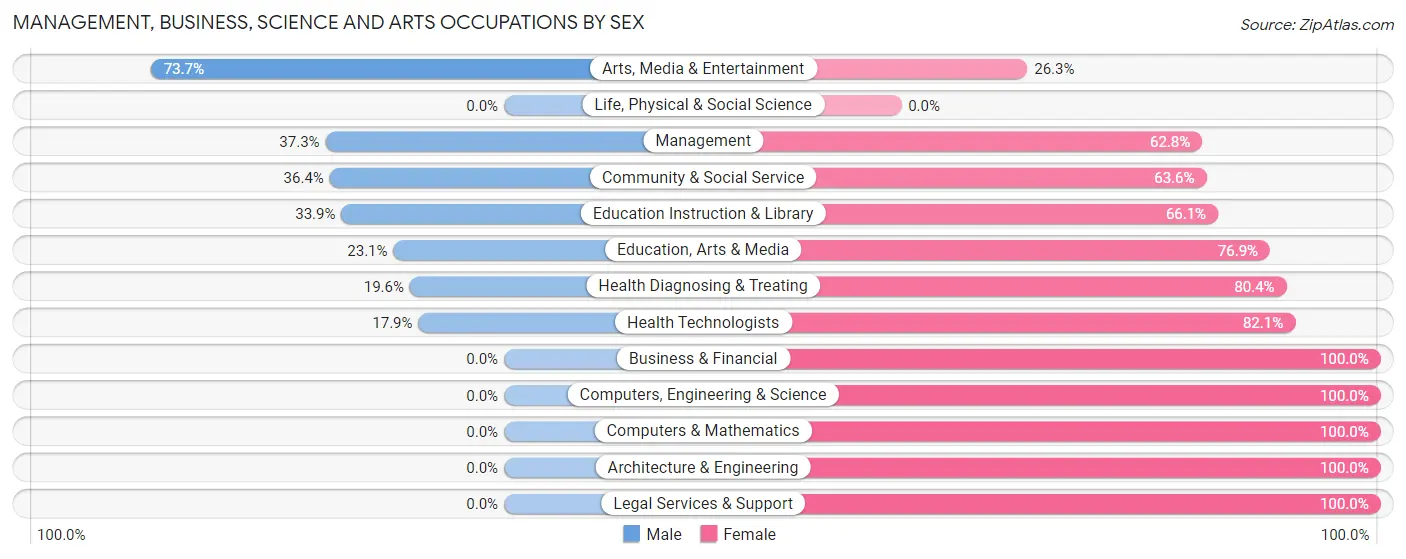
Management, Business, Science and Arts Occupations by Sex
Within the Management, Business, Science and Arts occupations in Park Falls, the most male-oriented occupations are Arts, Media & Entertainment (73.7%), Management (37.2%), and Community & Social Service (36.4%), while the most female-oriented occupations are Business & Financial (100.0%), Computers, Engineering & Science (100.0%), and Computers & Mathematics (100.0%).
| Occupation | Male | Female |
| Management | 19 (37.2%) | 32 (62.7%) |
| Business & Financial | 0 (0.0%) | 30 (100.0%) |
| Computers, Engineering & Science | 0 (0.0%) | 16 (100.0%) |
| Computers & Mathematics | 0 (0.0%) | 12 (100.0%) |
| Architecture & Engineering | 0 (0.0%) | 4 (100.0%) |
| Life, Physical & Social Science | 0 (0.0%) | 0 (0.0%) |
| Community & Social Service | 36 (36.4%) | 63 (63.6%) |
| Education, Arts & Media | 3 (23.1%) | 10 (76.9%) |
| Legal Services & Support | 0 (0.0%) | 11 (100.0%) |
| Education Instruction & Library | 19 (33.9%) | 37 (66.1%) |
| Arts, Media & Entertainment | 14 (73.7%) | 5 (26.3%) |
| Health Diagnosing & Treating | 11 (19.6%) | 45 (80.4%) |
| Health Technologists | 5 (17.9%) | 23 (82.1%) |
| Total (Category) | 66 (26.2%) | 186 (73.8%) |
| Total (Overall) | 399 (44.7%) | 494 (55.3%) |
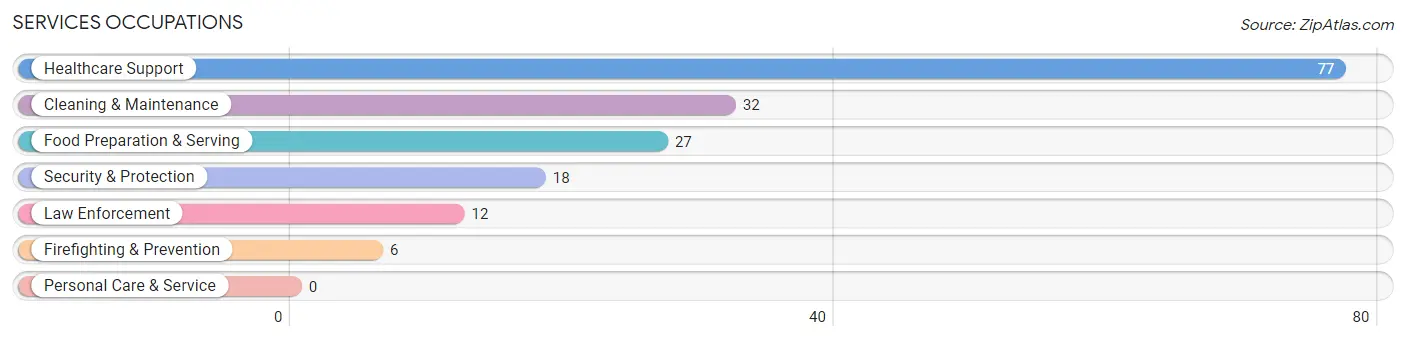
Services Occupations
The most common Services occupations in Park Falls are Healthcare Support (77 | 8.6%), Cleaning & Maintenance (32 | 3.6%), Food Preparation & Serving (27 | 3.0%), Security & Protection (18 | 2.0%), and Law Enforcement (12 | 1.3%).
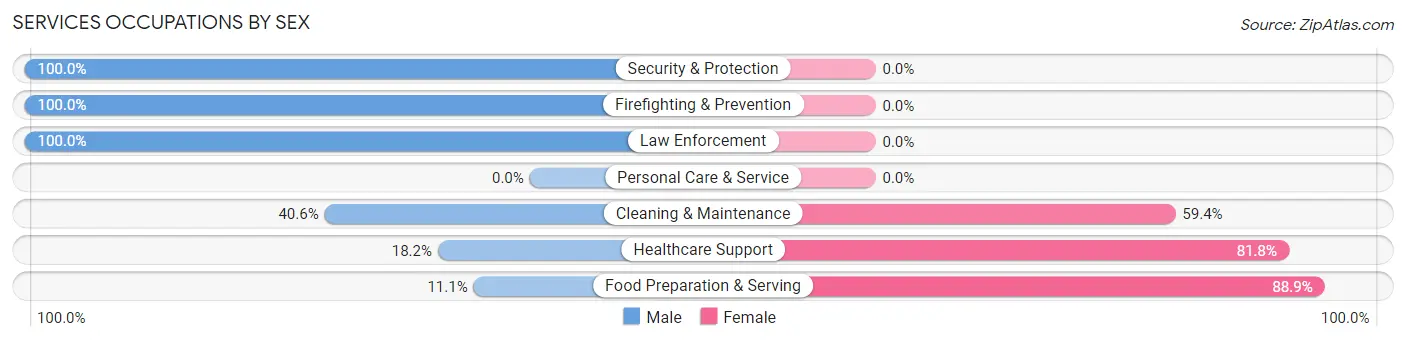
Services Occupations by Sex
Within the Services occupations in Park Falls, the most male-oriented occupations are Security & Protection (100.0%), Firefighting & Prevention (100.0%), and Law Enforcement (100.0%), while the most female-oriented occupations are Food Preparation & Serving (88.9%), Healthcare Support (81.8%), and Cleaning & Maintenance (59.4%).
| Occupation | Male | Female |
| Healthcare Support | 14 (18.2%) | 63 (81.8%) |
| Security & Protection | 18 (100.0%) | 0 (0.0%) |
| Firefighting & Prevention | 6 (100.0%) | 0 (0.0%) |
| Law Enforcement | 12 (100.0%) | 0 (0.0%) |
| Food Preparation & Serving | 3 (11.1%) | 24 (88.9%) |
| Cleaning & Maintenance | 13 (40.6%) | 19 (59.4%) |
| Personal Care & Service | 0 (0.0%) | 0 (0.0%) |
| Total (Category) | 48 (31.2%) | 106 (68.8%) |
| Total (Overall) | 399 (44.7%) | 494 (55.3%) |
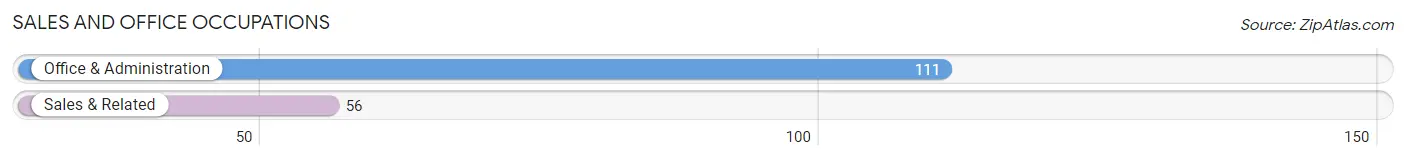
Sales and Office Occupations
The most common Sales and Office occupations in Park Falls are Office & Administration (111 | 12.4%), and Sales & Related (56 | 6.3%).
Sales and Office Occupations by Sex
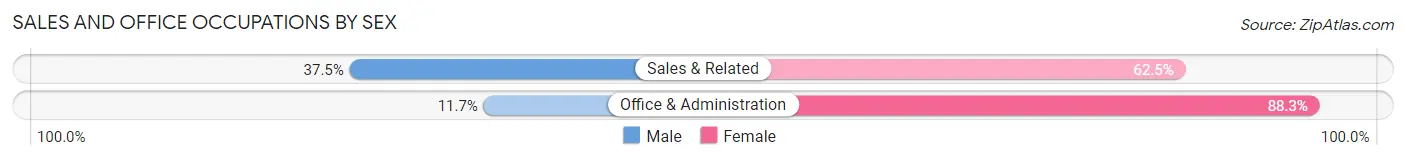
| Occupation | Male | Female |
| Sales & Related | 21 (37.5%) | 35 (62.5%) |
| Office & Administration | 13 (11.7%) | 98 (88.3%) |
| Total (Category) | 34 (20.4%) | 133 (79.6%) |
| Total (Overall) | 399 (44.7%) | 494 (55.3%) |
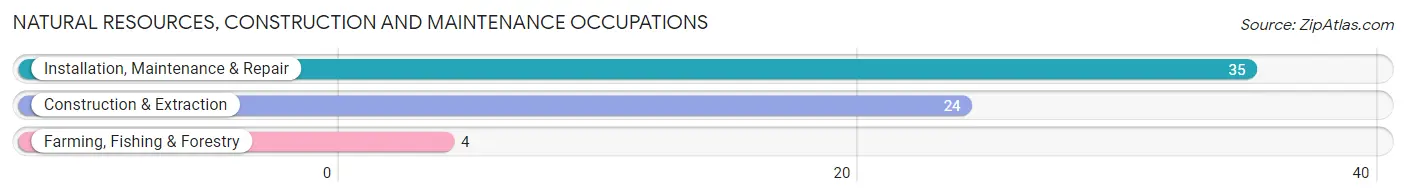
Natural Resources, Construction and Maintenance Occupations
The most common Natural Resources, Construction and Maintenance occupations in Park Falls are Installation, Maintenance & Repair (35 | 3.9%), Construction & Extraction (24 | 2.7%), and Farming, Fishing & Forestry (4 | 0.4%).
Natural Resources, Construction and Maintenance Occupations by Sex
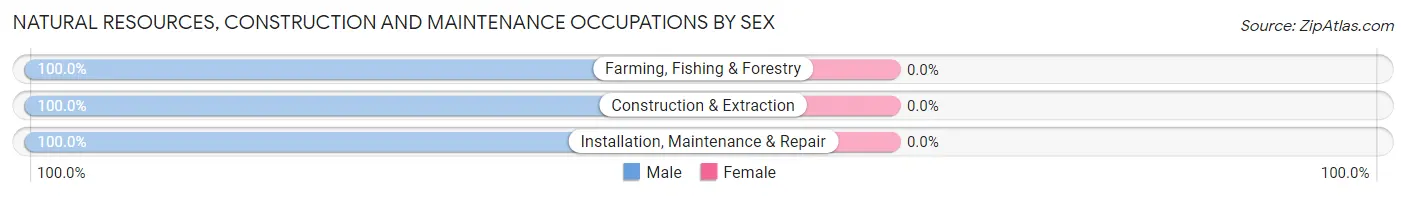
| Occupation | Male | Female |
| Farming, Fishing & Forestry | 4 (100.0%) | 0 (0.0%) |
| Construction & Extraction | 24 (100.0%) | 0 (0.0%) |
| Installation, Maintenance & Repair | 35 (100.0%) | 0 (0.0%) |
| Total (Category) | 63 (100.0%) | 0 (0.0%) |
| Total (Overall) | 399 (44.7%) | 494 (55.3%) |
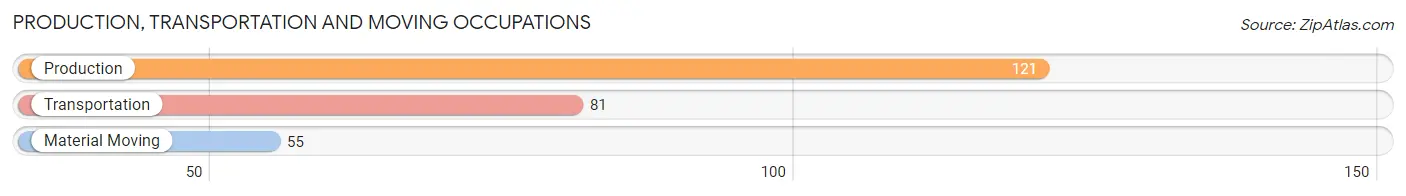
Production, Transportation and Moving Occupations
The most common Production, Transportation and Moving occupations in Park Falls are Production (121 | 13.6%), Transportation (81 | 9.1%), and Material Moving (55 | 6.2%).
Production, Transportation and Moving Occupations by Sex
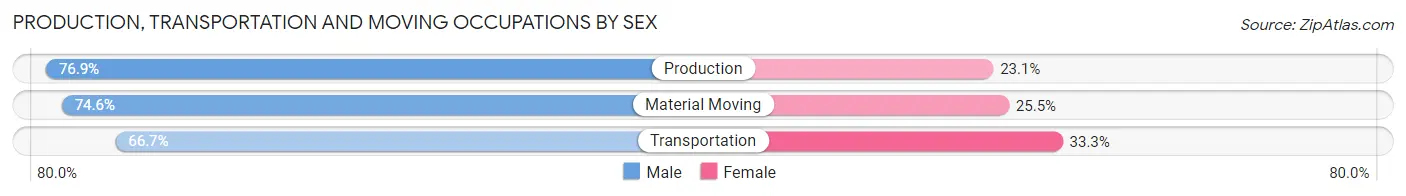
| Occupation | Male | Female |
| Production | 93 (76.9%) | 28 (23.1%) |
| Transportation | 54 (66.7%) | 27 (33.3%) |
| Material Moving | 41 (74.6%) | 14 (25.5%) |
| Total (Category) | 188 (73.2%) | 69 (26.9%) |
| Total (Overall) | 399 (44.7%) | 494 (55.3%) |
Employment Industries by Sex in Park Falls
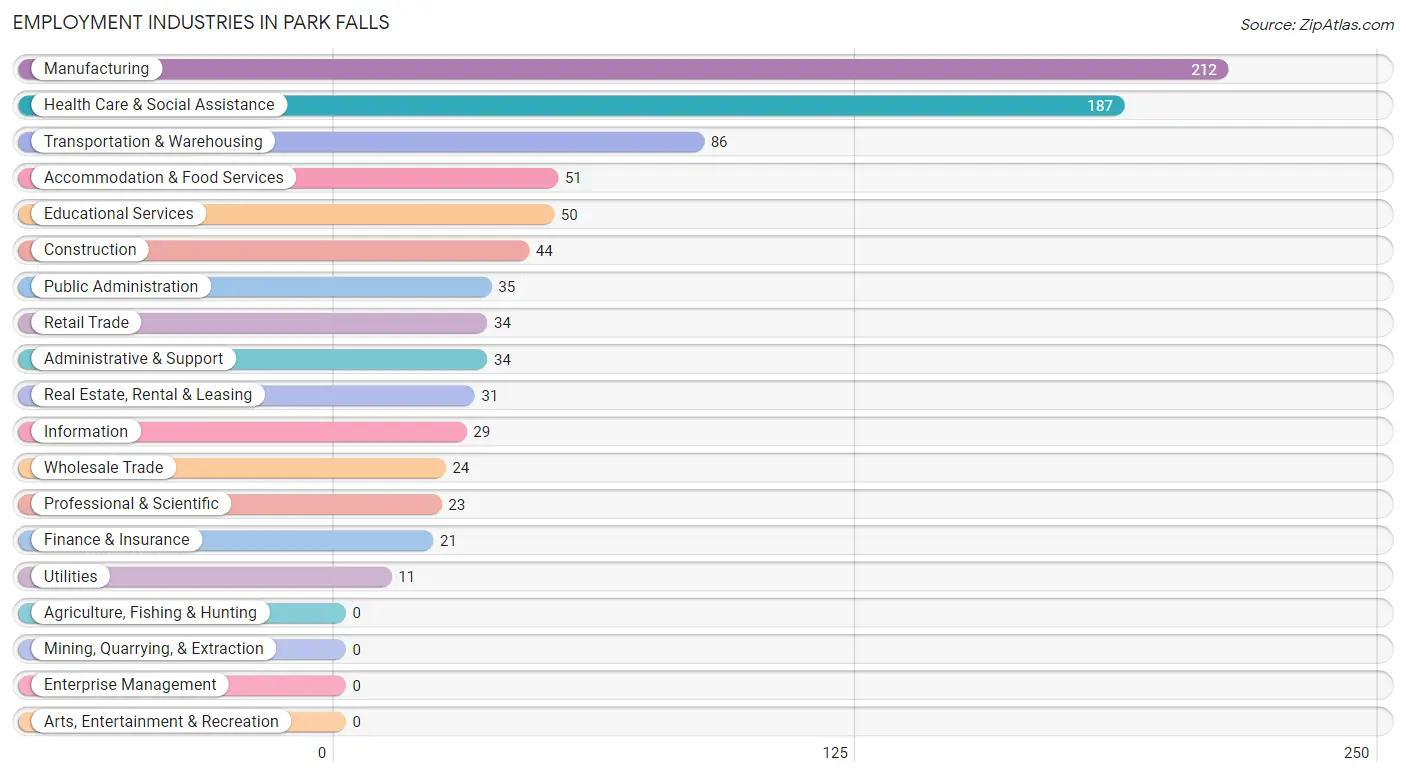
Employment Industries in Park Falls
The major employment industries in Park Falls include Manufacturing (212 | 23.7%), Health Care & Social Assistance (187 | 20.9%), Transportation & Warehousing (86 | 9.6%), Accommodation & Food Services (51 | 5.7%), and Educational Services (50 | 5.6%).
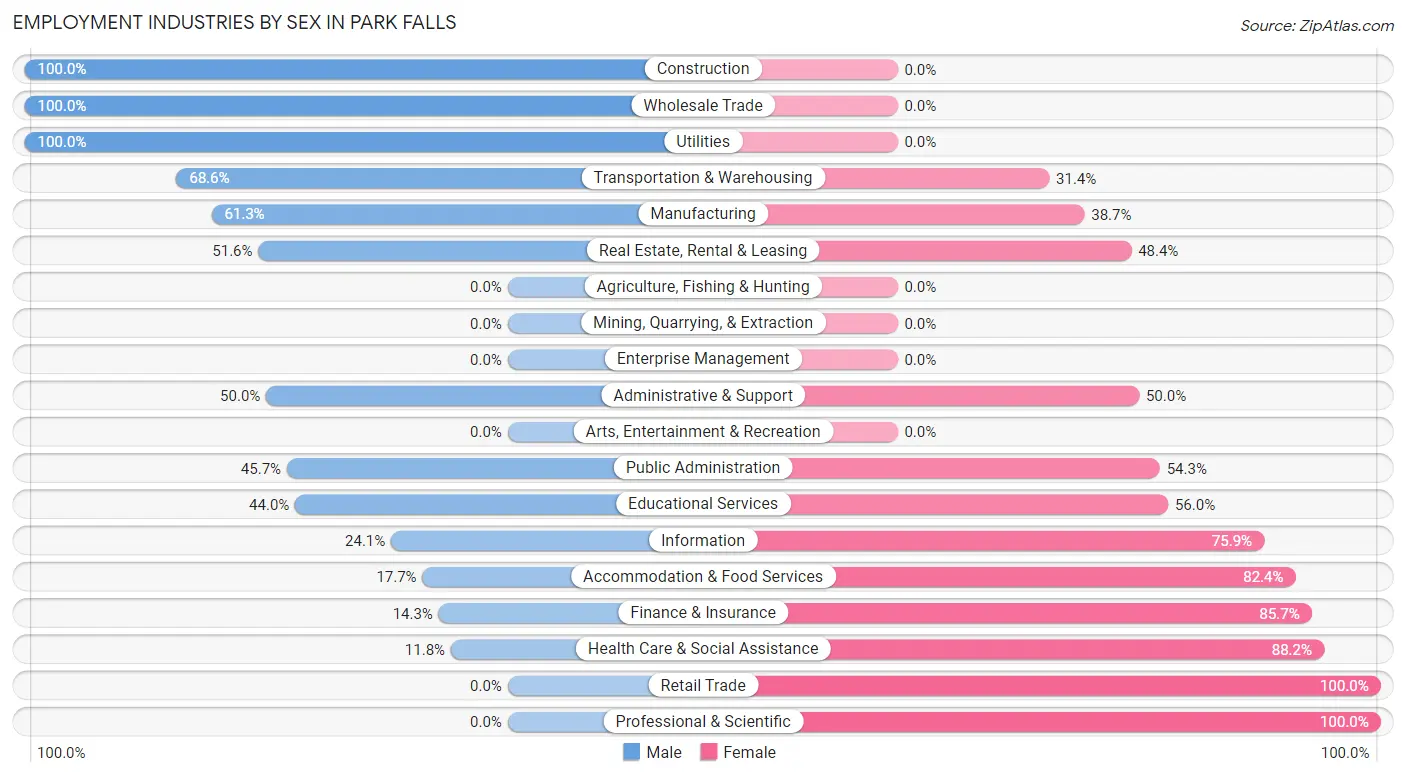
Employment Industries by Sex in Park Falls
The Park Falls industries that see more men than women are Construction (100.0%), Wholesale Trade (100.0%), and Utilities (100.0%), whereas the industries that tend to have a higher number of women are Retail Trade (100.0%), Professional & Scientific (100.0%), and Health Care & Social Assistance (88.2%).
| Industry | Male | Female |
| Agriculture, Fishing & Hunting | 0 (0.0%) | 0 (0.0%) |
| Mining, Quarrying, & Extraction | 0 (0.0%) | 0 (0.0%) |
| Construction | 44 (100.0%) | 0 (0.0%) |
| Manufacturing | 130 (61.3%) | 82 (38.7%) |
| Wholesale Trade | 24 (100.0%) | 0 (0.0%) |
| Retail Trade | 0 (0.0%) | 34 (100.0%) |
| Transportation & Warehousing | 59 (68.6%) | 27 (31.4%) |
| Utilities | 11 (100.0%) | 0 (0.0%) |
| Information | 7 (24.1%) | 22 (75.9%) |
| Finance & Insurance | 3 (14.3%) | 18 (85.7%) |
| Real Estate, Rental & Leasing | 16 (51.6%) | 15 (48.4%) |
| Professional & Scientific | 0 (0.0%) | 23 (100.0%) |
| Enterprise Management | 0 (0.0%) | 0 (0.0%) |
| Administrative & Support | 17 (50.0%) | 17 (50.0%) |
| Educational Services | 22 (44.0%) | 28 (56.0%) |
| Health Care & Social Assistance | 22 (11.8%) | 165 (88.2%) |
| Arts, Entertainment & Recreation | 0 (0.0%) | 0 (0.0%) |
| Accommodation & Food Services | 9 (17.6%) | 42 (82.4%) |
| Public Administration | 16 (45.7%) | 19 (54.3%) |
| Total | 399 (44.7%) | 494 (55.3%) |
Education in Park Falls
School Enrollment in Park Falls
The most common levels of schooling among the 479 students in Park Falls are middle school (143 | 29.8%), high school (115 | 24.0%), and elementary school (108 | 22.6%).
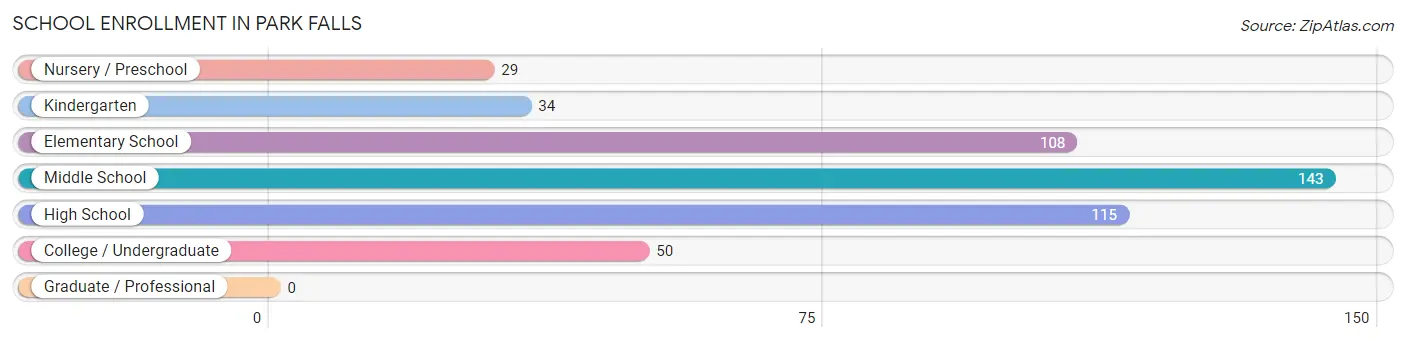
| School Level | # Students | % Students |
| Nursery / Preschool | 29 | 6.0% |
| Kindergarten | 34 | 7.1% |
| Elementary School | 108 | 22.6% |
| Middle School | 143 | 29.8% |
| High School | 115 | 24.0% |
| College / Undergraduate | 50 | 10.4% |
| Graduate / Professional | 0 | 0.0% |
| Total | 479 | 100.0% |
School Enrollment by Age by Funding Source in Park Falls
Out of a total of 479 students who are enrolled in schools in Park Falls, 14 (2.9%) attend a private institution, while the remaining 465 (97.1%) are enrolled in public schools. The age group of 3 to 4 year olds has the highest likelihood of being enrolled in private schools, with 4 (30.8% in the age bracket) enrolled. Conversely, the age group of 15 to 17 year olds has the lowest likelihood of being enrolled in a private school, with 89 (100.0% in the age bracket) attending a public institution.
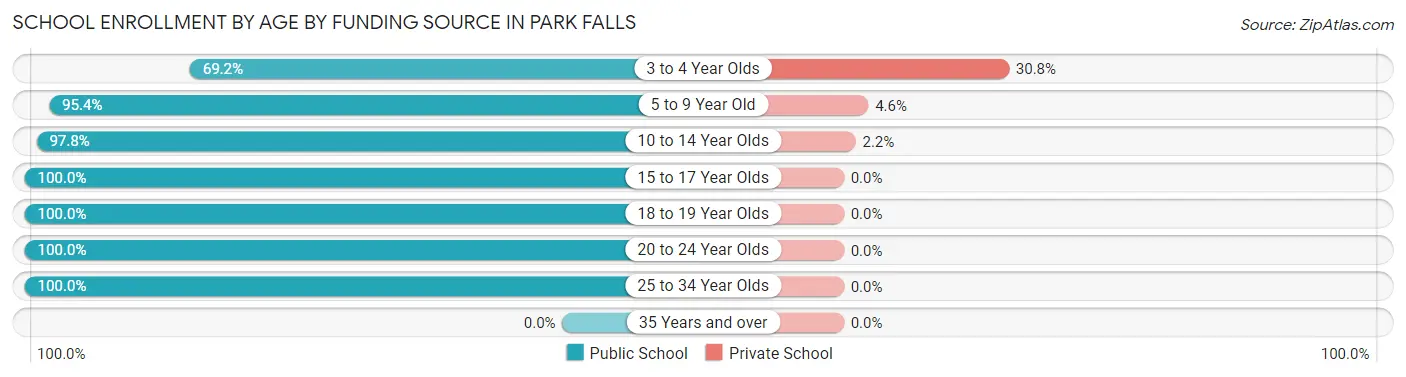
| Age Bracket | Public School | Private School |
| 3 to 4 Year Olds | 9 (69.2%) | 4 (30.8%) |
| 5 to 9 Year Old | 125 (95.4%) | 6 (4.6%) |
| 10 to 14 Year Olds | 177 (97.8%) | 4 (2.2%) |
| 15 to 17 Year Olds | 89 (100.0%) | 0 (0.0%) |
| 18 to 19 Year Olds | 15 (100.0%) | 0 (0.0%) |
| 20 to 24 Year Olds | 33 (100.0%) | 0 (0.0%) |
| 25 to 34 Year Olds | 17 (100.0%) | 0 (0.0%) |
| 35 Years and over | 0 (0.0%) | 0 (0.0%) |
| Total | 465 (97.1%) | 14 (2.9%) |
Educational Attainment by Field of Study in Park Falls
Education (56 | 29.3%), science & technology (36 | 18.9%), engineering (22 | 11.5%), arts & humanities (17 | 8.9%), and business (15 | 7.9%) are the most common fields of study among 191 individuals in Park Falls who have obtained a bachelor's degree or higher.
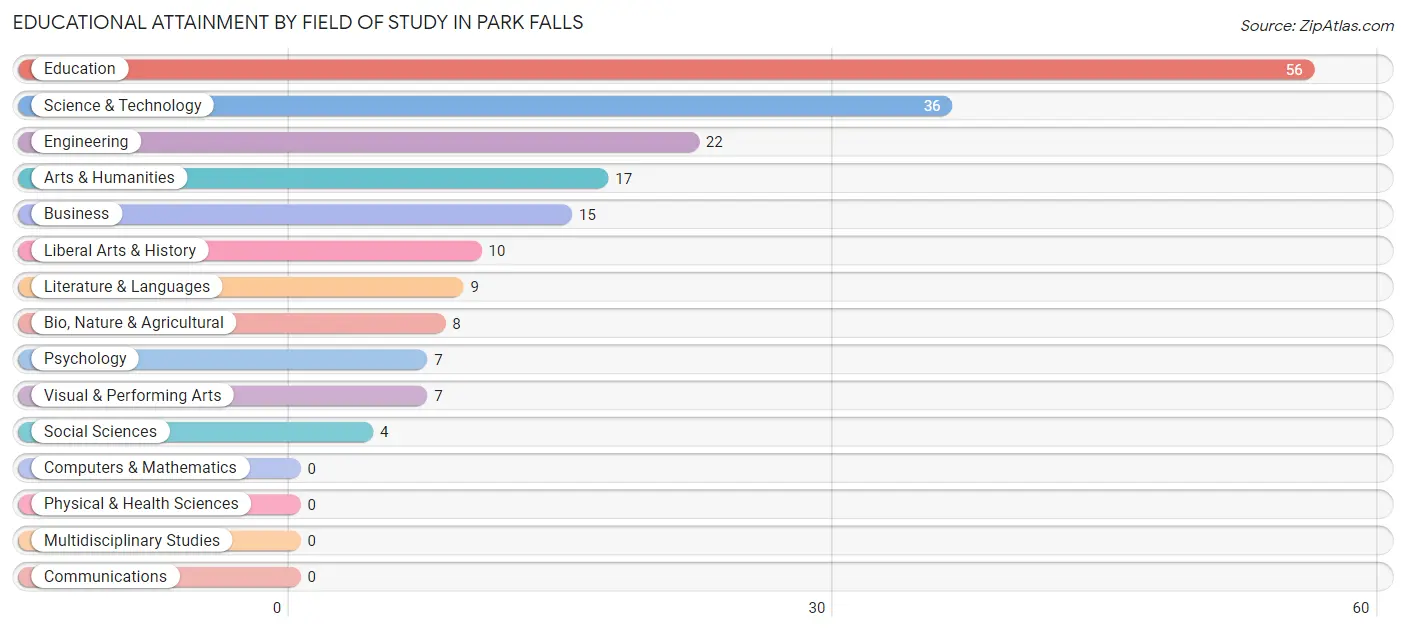
| Field of Study | # Graduates | % Graduates |
| Computers & Mathematics | 0 | 0.0% |
| Bio, Nature & Agricultural | 8 | 4.2% |
| Physical & Health Sciences | 0 | 0.0% |
| Psychology | 7 | 3.7% |
| Social Sciences | 4 | 2.1% |
| Engineering | 22 | 11.5% |
| Multidisciplinary Studies | 0 | 0.0% |
| Science & Technology | 36 | 18.9% |
| Business | 15 | 7.9% |
| Education | 56 | 29.3% |
| Literature & Languages | 9 | 4.7% |
| Liberal Arts & History | 10 | 5.2% |
| Visual & Performing Arts | 7 | 3.7% |
| Communications | 0 | 0.0% |
| Arts & Humanities | 17 | 8.9% |
| Total | 191 | 100.0% |
Transportation & Commute in Park Falls
Vehicle Availability by Sex in Park Falls
The most prevalent vehicle ownership categories in Park Falls are males with 2 vehicles (218, accounting for 54.6%) and females with 2 vehicles (225, making up 44.4%).
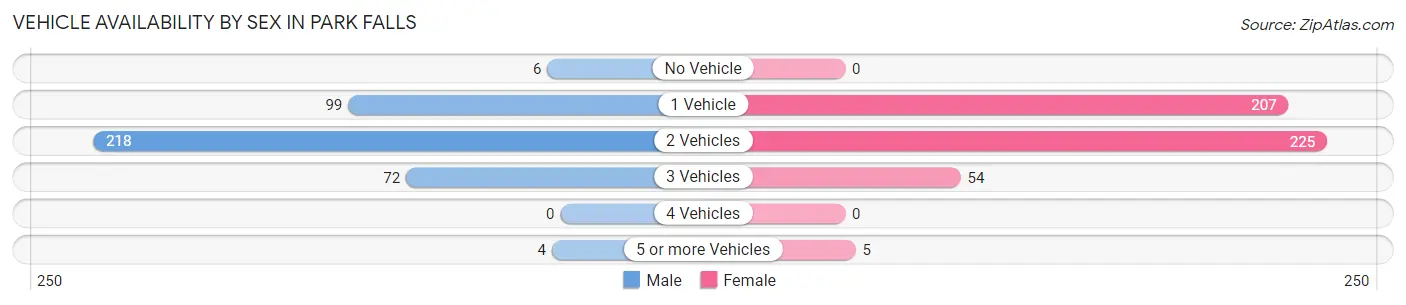
| Vehicles Available | Male | Female |
| No Vehicle | 6 (1.5%) | 0 (0.0%) |
| 1 Vehicle | 99 (24.8%) | 207 (42.2%) |
| 2 Vehicles | 218 (54.6%) | 225 (45.8%) |
| 3 Vehicles | 72 (18.0%) | 54 (11.0%) |
| 4 Vehicles | 0 (0.0%) | 0 (0.0%) |
| 5 or more Vehicles | 4 (1.0%) | 5 (1.0%) |
| Total | 399 (100.0%) | 491 (100.0%) |
Commute Time in Park Falls
The most frequently occuring commute durations in Park Falls are 5 to 9 minutes (314 commuters, 37.1%), less than 5 minutes (147 commuters, 17.4%), and 10 to 14 minutes (89 commuters, 10.5%).
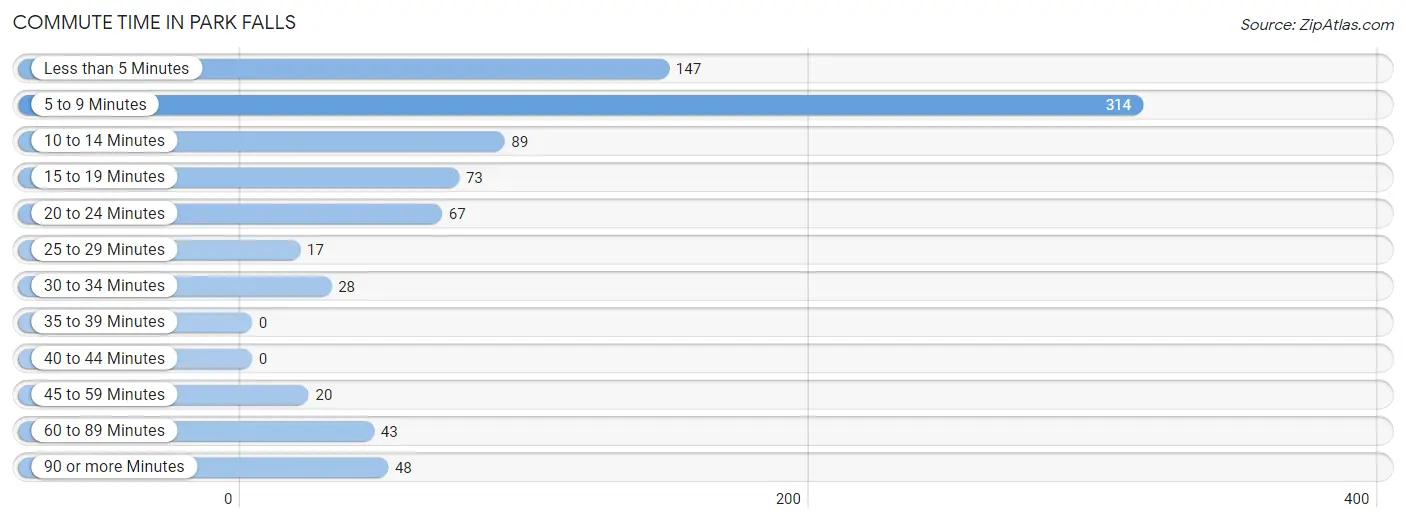
| Commute Time | # Commuters | % Commuters |
| Less than 5 Minutes | 147 | 17.4% |
| 5 to 9 Minutes | 314 | 37.1% |
| 10 to 14 Minutes | 89 | 10.5% |
| 15 to 19 Minutes | 73 | 8.6% |
| 20 to 24 Minutes | 67 | 7.9% |
| 25 to 29 Minutes | 17 | 2.0% |
| 30 to 34 Minutes | 28 | 3.3% |
| 35 to 39 Minutes | 0 | 0.0% |
| 40 to 44 Minutes | 0 | 0.0% |
| 45 to 59 Minutes | 20 | 2.4% |
| 60 to 89 Minutes | 43 | 5.1% |
| 90 or more Minutes | 48 | 5.7% |
Commute Time by Sex in Park Falls
The most common commute times in Park Falls are 5 to 9 minutes (124 commuters, 32.0%) for males and 5 to 9 minutes (190 commuters, 41.4%) for females.
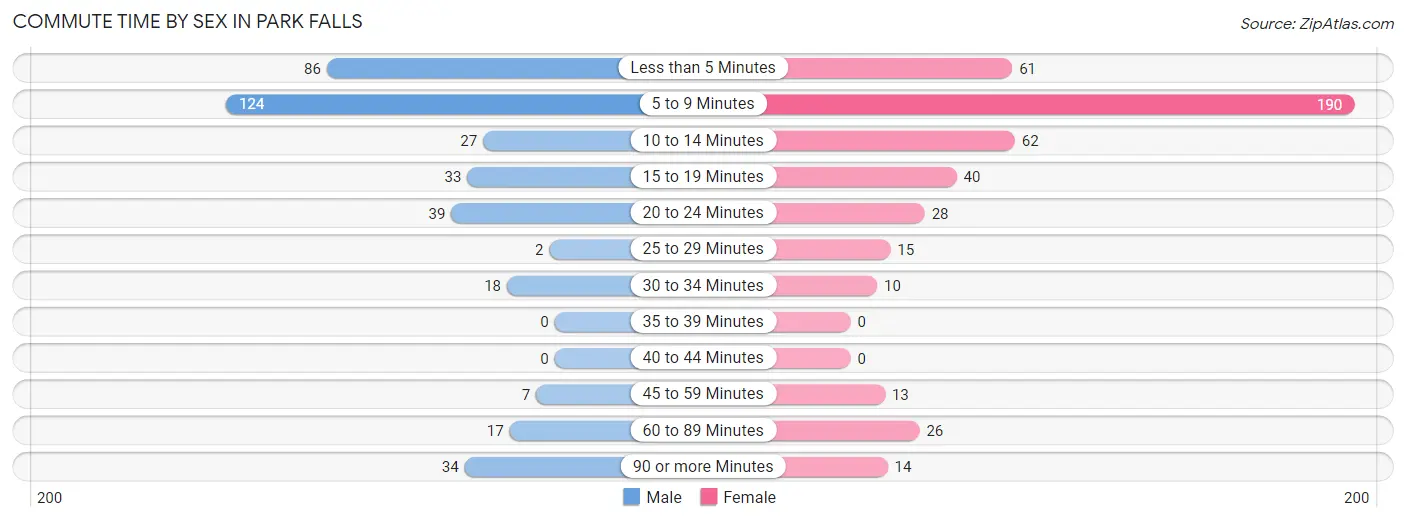
| Commute Time | Male | Female |
| Less than 5 Minutes | 86 (22.2%) | 61 (13.3%) |
| 5 to 9 Minutes | 124 (32.0%) | 190 (41.4%) |
| 10 to 14 Minutes | 27 (7.0%) | 62 (13.5%) |
| 15 to 19 Minutes | 33 (8.5%) | 40 (8.7%) |
| 20 to 24 Minutes | 39 (10.1%) | 28 (6.1%) |
| 25 to 29 Minutes | 2 (0.5%) | 15 (3.3%) |
| 30 to 34 Minutes | 18 (4.6%) | 10 (2.2%) |
| 35 to 39 Minutes | 0 (0.0%) | 0 (0.0%) |
| 40 to 44 Minutes | 0 (0.0%) | 0 (0.0%) |
| 45 to 59 Minutes | 7 (1.8%) | 13 (2.8%) |
| 60 to 89 Minutes | 17 (4.4%) | 26 (5.7%) |
| 90 or more Minutes | 34 (8.8%) | 14 (3.0%) |
Time of Departure to Work by Sex in Park Falls
The most frequent times of departure to work in Park Falls are 12:00 AM to 4:59 AM (77, 19.9%) for males and 7:30 AM to 7:59 AM (72, 15.7%) for females.
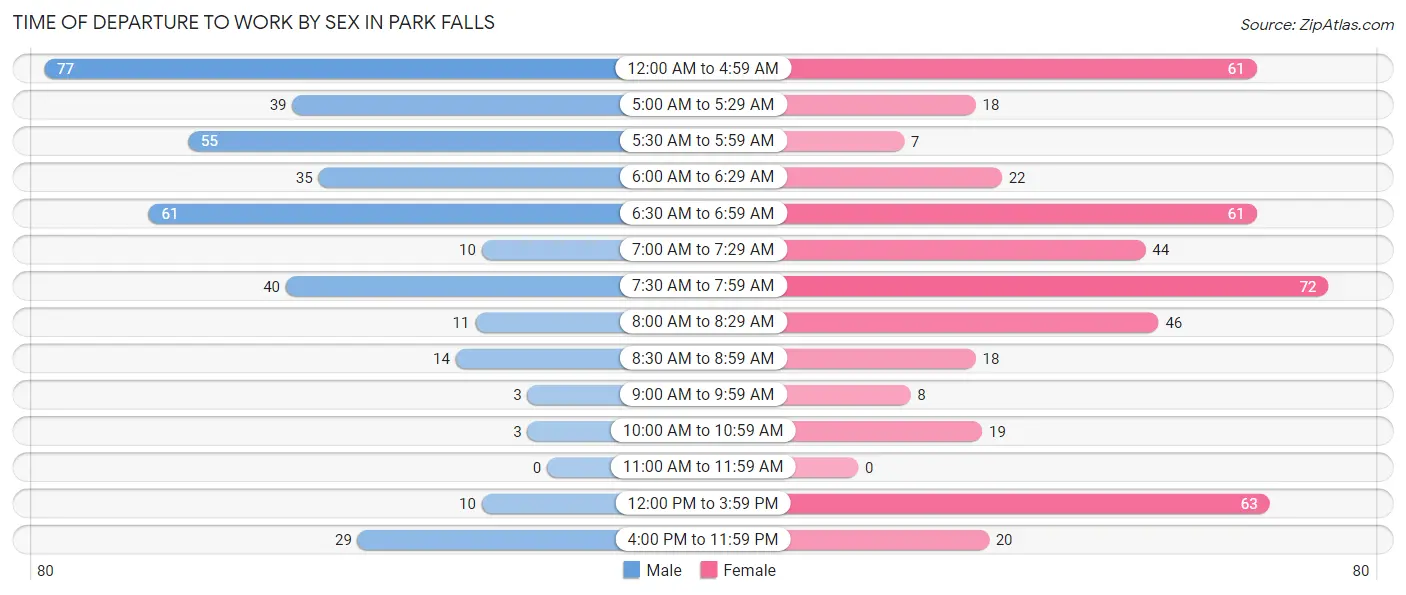
| Time of Departure | Male | Female |
| 12:00 AM to 4:59 AM | 77 (19.9%) | 61 (13.3%) |
| 5:00 AM to 5:29 AM | 39 (10.1%) | 18 (3.9%) |
| 5:30 AM to 5:59 AM | 55 (14.2%) | 7 (1.5%) |
| 6:00 AM to 6:29 AM | 35 (9.0%) | 22 (4.8%) |
| 6:30 AM to 6:59 AM | 61 (15.8%) | 61 (13.3%) |
| 7:00 AM to 7:29 AM | 10 (2.6%) | 44 (9.6%) |
| 7:30 AM to 7:59 AM | 40 (10.3%) | 72 (15.7%) |
| 8:00 AM to 8:29 AM | 11 (2.8%) | 46 (10.0%) |
| 8:30 AM to 8:59 AM | 14 (3.6%) | 18 (3.9%) |
| 9:00 AM to 9:59 AM | 3 (0.8%) | 8 (1.7%) |
| 10:00 AM to 10:59 AM | 3 (0.8%) | 19 (4.1%) |
| 11:00 AM to 11:59 AM | 0 (0.0%) | 0 (0.0%) |
| 12:00 PM to 3:59 PM | 10 (2.6%) | 63 (13.7%) |
| 4:00 PM to 11:59 PM | 29 (7.5%) | 20 (4.4%) |
| Total | 387 (100.0%) | 459 (100.0%) |
Housing Occupancy in Park Falls
Occupancy by Ownership in Park Falls
Of the total 1,150 dwellings in Park Falls, owner-occupied units account for 695 (60.4%), while renter-occupied units make up 455 (39.6%).
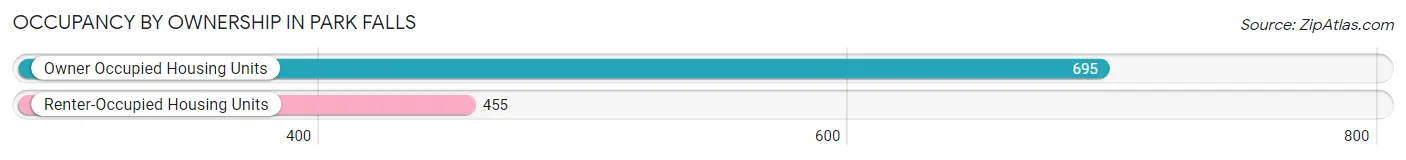
| Occupancy | # Housing Units | % Housing Units |
| Owner Occupied Housing Units | 695 | 60.4% |
| Renter-Occupied Housing Units | 455 | 39.6% |
| Total Occupied Housing Units | 1,150 | 100.0% |
Occupancy by Household Size in Park Falls
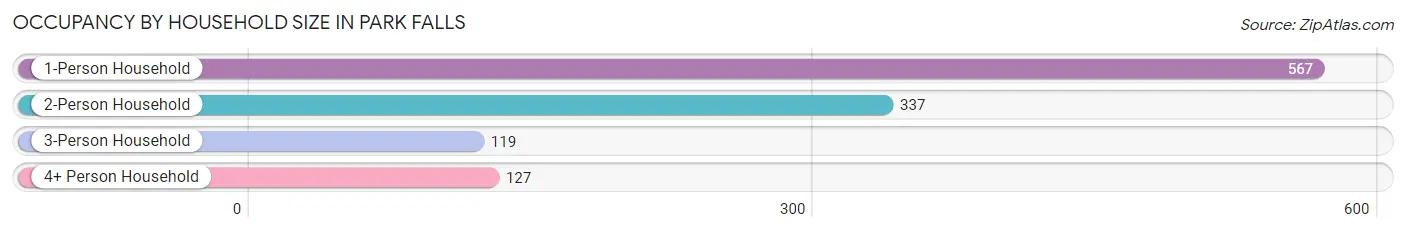
| Household Size | # Housing Units | % Housing Units |
| 1-Person Household | 567 | 49.3% |
| 2-Person Household | 337 | 29.3% |
| 3-Person Household | 119 | 10.3% |
| 4+ Person Household | 127 | 11.0% |
| Total Housing Units | 1,150 | 100.0% |
Occupancy by Ownership by Household Size in Park Falls
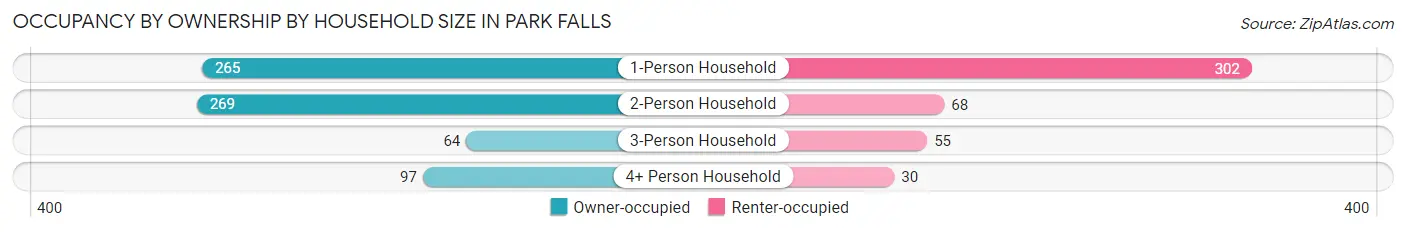
| Household Size | Owner-occupied | Renter-occupied |
| 1-Person Household | 265 (46.7%) | 302 (53.3%) |
| 2-Person Household | 269 (79.8%) | 68 (20.2%) |
| 3-Person Household | 64 (53.8%) | 55 (46.2%) |
| 4+ Person Household | 97 (76.4%) | 30 (23.6%) |
| Total Housing Units | 695 (60.4%) | 455 (39.6%) |
Occupancy by Educational Attainment in Park Falls
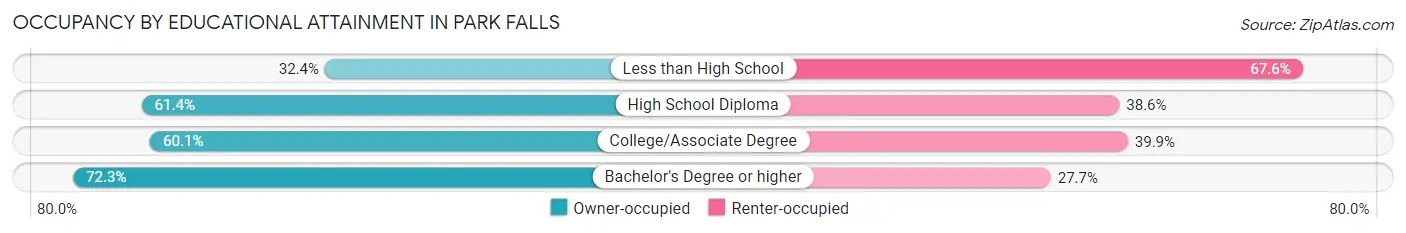
| Household Size | Owner-occupied | Renter-occupied |
| Less than High School | 23 (32.4%) | 48 (67.6%) |
| High School Diploma | 258 (61.4%) | 162 (38.6%) |
| College/Associate Degree | 307 (60.1%) | 204 (39.9%) |
| Bachelor's Degree or higher | 107 (72.3%) | 41 (27.7%) |
Occupancy by Age of Householder in Park Falls
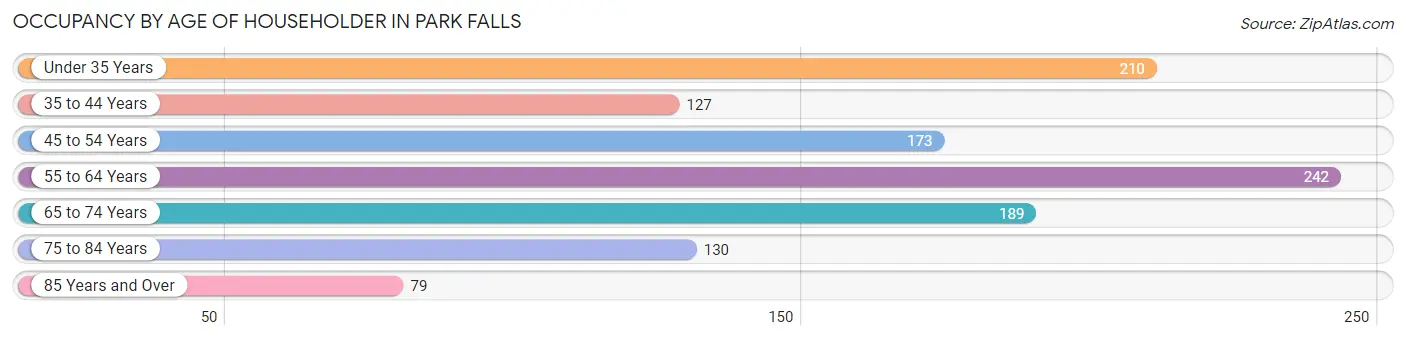
| Age Bracket | # Households | % Households |
| Under 35 Years | 210 | 18.3% |
| 35 to 44 Years | 127 | 11.0% |
| 45 to 54 Years | 173 | 15.0% |
| 55 to 64 Years | 242 | 21.0% |
| 65 to 74 Years | 189 | 16.4% |
| 75 to 84 Years | 130 | 11.3% |
| 85 Years and Over | 79 | 6.9% |
| Total | 1,150 | 100.0% |
Housing Finances in Park Falls
Median Income by Occupancy in Park Falls
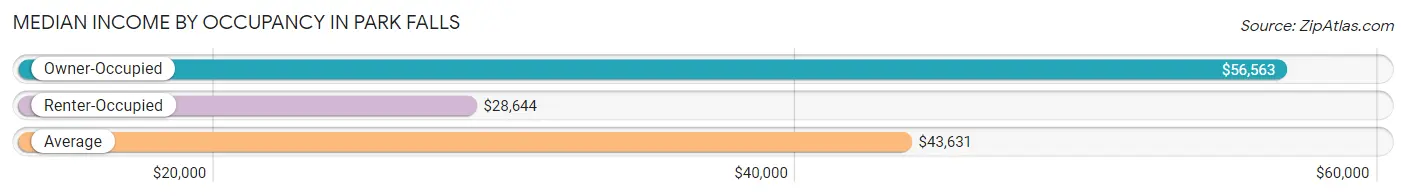
| Occupancy Type | # Households | Median Income |
| Owner-Occupied | 695 (60.4%) | $56,563 |
| Renter-Occupied | 455 (39.6%) | $28,644 |
| Average | 1,150 (100.0%) | $43,631 |
Occupancy by Householder Income Bracket in Park Falls
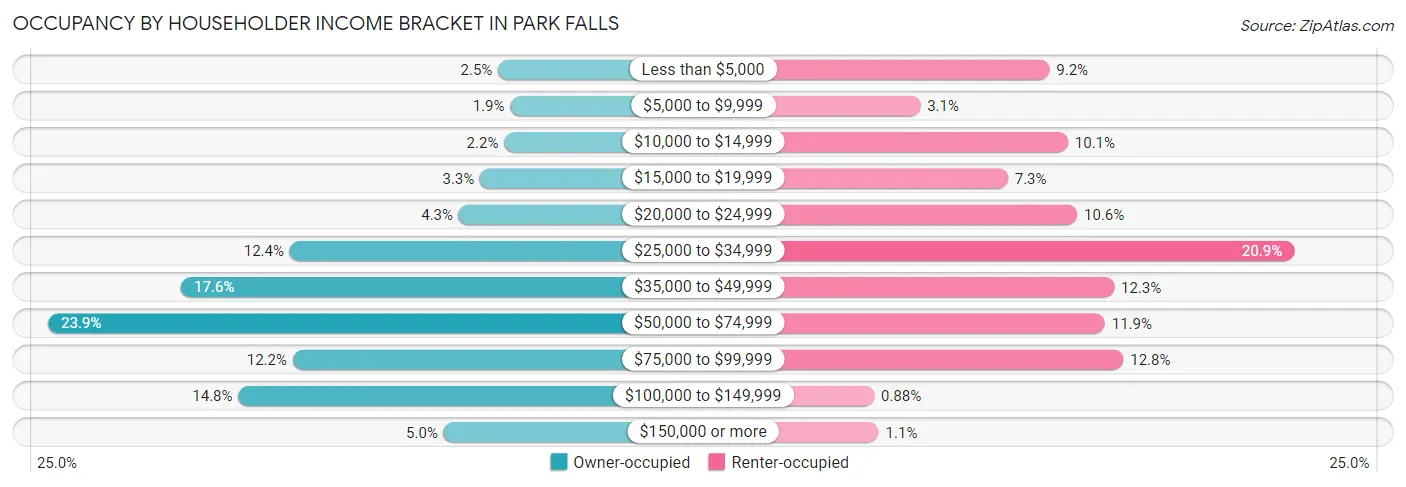
| Income Bracket | Owner-occupied | Renter-occupied |
| Less than $5,000 | 17 (2.5%) | 42 (9.2%) |
| $5,000 to $9,999 | 13 (1.9%) | 14 (3.1%) |
| $10,000 to $14,999 | 15 (2.2%) | 46 (10.1%) |
| $15,000 to $19,999 | 23 (3.3%) | 33 (7.2%) |
| $20,000 to $24,999 | 30 (4.3%) | 48 (10.5%) |
| $25,000 to $34,999 | 86 (12.4%) | 95 (20.9%) |
| $35,000 to $49,999 | 122 (17.5%) | 56 (12.3%) |
| $50,000 to $74,999 | 166 (23.9%) | 54 (11.9%) |
| $75,000 to $99,999 | 85 (12.2%) | 58 (12.8%) |
| $100,000 to $149,999 | 103 (14.8%) | 4 (0.9%) |
| $150,000 or more | 35 (5.0%) | 5 (1.1%) |
| Total | 695 (100.0%) | 455 (100.0%) |
Monthly Housing Cost Tiers in Park Falls
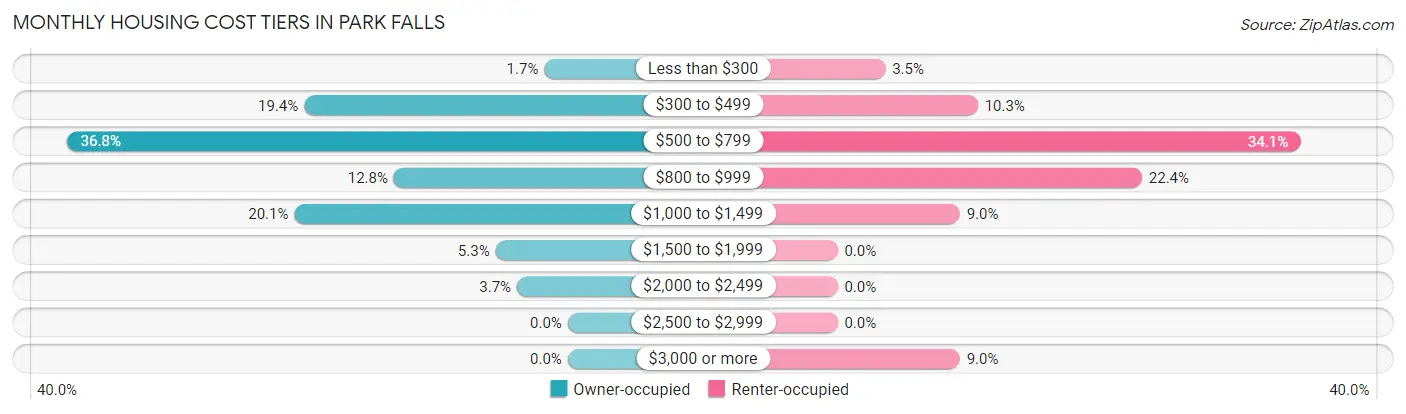
| Monthly Cost | Owner-occupied | Renter-occupied |
| Less than $300 | 12 (1.7%) | 16 (3.5%) |
| $300 to $499 | 135 (19.4%) | 47 (10.3%) |
| $500 to $799 | 256 (36.8%) | 155 (34.1%) |
| $800 to $999 | 89 (12.8%) | 102 (22.4%) |
| $1,000 to $1,499 | 140 (20.1%) | 41 (9.0%) |
| $1,500 to $1,999 | 37 (5.3%) | 0 (0.0%) |
| $2,000 to $2,499 | 26 (3.7%) | 0 (0.0%) |
| $2,500 to $2,999 | 0 (0.0%) | 0 (0.0%) |
| $3,000 or more | 0 (0.0%) | 41 (9.0%) |
| Total | 695 (100.0%) | 455 (100.0%) |
Physical Housing Characteristics in Park Falls
Housing Structures in Park Falls
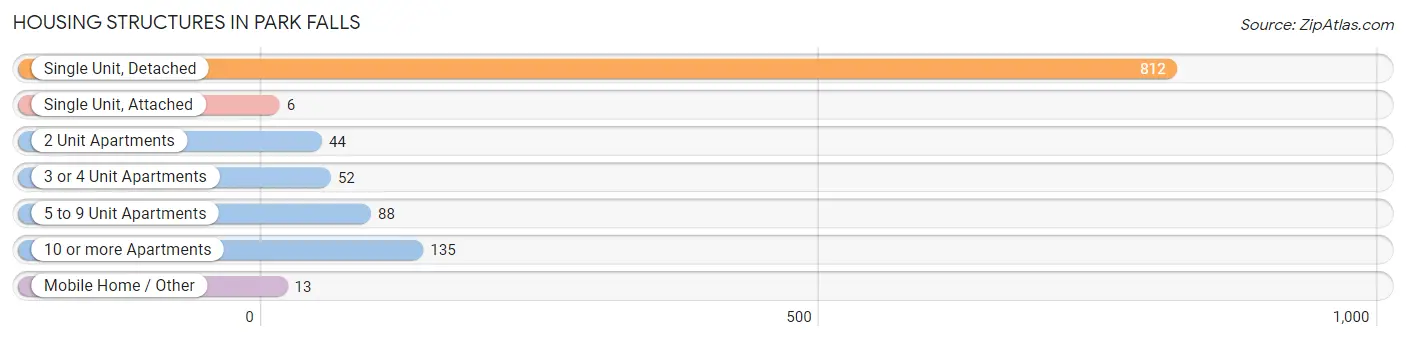
| Structure Type | # Housing Units | % Housing Units |
| Single Unit, Detached | 812 | 70.6% |
| Single Unit, Attached | 6 | 0.5% |
| 2 Unit Apartments | 44 | 3.8% |
| 3 or 4 Unit Apartments | 52 | 4.5% |
| 5 to 9 Unit Apartments | 88 | 7.6% |
| 10 or more Apartments | 135 | 11.7% |
| Mobile Home / Other | 13 | 1.1% |
| Total | 1,150 | 100.0% |
Housing Structures by Occupancy in Park Falls
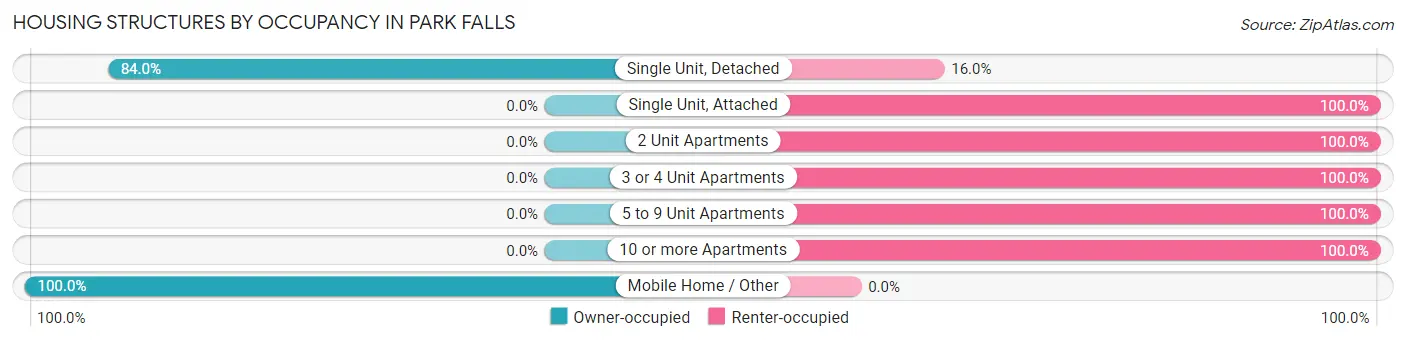
| Structure Type | Owner-occupied | Renter-occupied |
| Single Unit, Detached | 682 (84.0%) | 130 (16.0%) |
| Single Unit, Attached | 0 (0.0%) | 6 (100.0%) |
| 2 Unit Apartments | 0 (0.0%) | 44 (100.0%) |
| 3 or 4 Unit Apartments | 0 (0.0%) | 52 (100.0%) |
| 5 to 9 Unit Apartments | 0 (0.0%) | 88 (100.0%) |
| 10 or more Apartments | 0 (0.0%) | 135 (100.0%) |
| Mobile Home / Other | 13 (100.0%) | 0 (0.0%) |
| Total | 695 (60.4%) | 455 (39.6%) |
Housing Structures by Number of Rooms in Park Falls
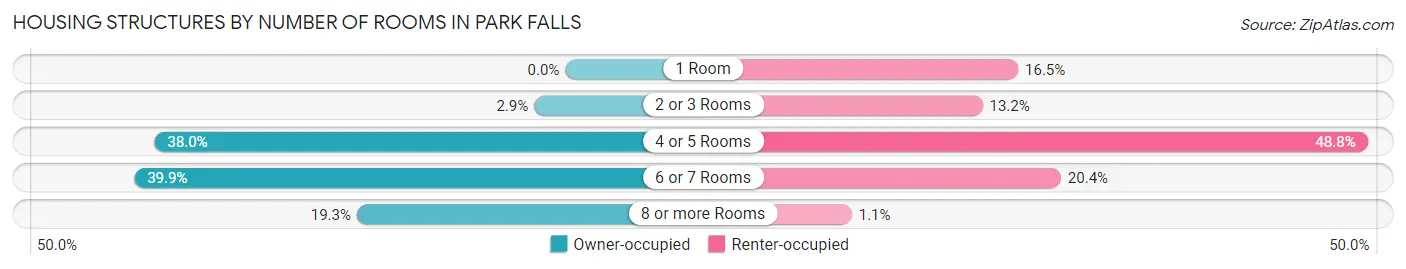
| Number of Rooms | Owner-occupied | Renter-occupied |
| 1 Room | 0 (0.0%) | 75 (16.5%) |
| 2 or 3 Rooms | 20 (2.9%) | 60 (13.2%) |
| 4 or 5 Rooms | 264 (38.0%) | 222 (48.8%) |
| 6 or 7 Rooms | 277 (39.9%) | 93 (20.4%) |
| 8 or more Rooms | 134 (19.3%) | 5 (1.1%) |
| Total | 695 (100.0%) | 455 (100.0%) |
Housing Structure by Heating Type in Park Falls
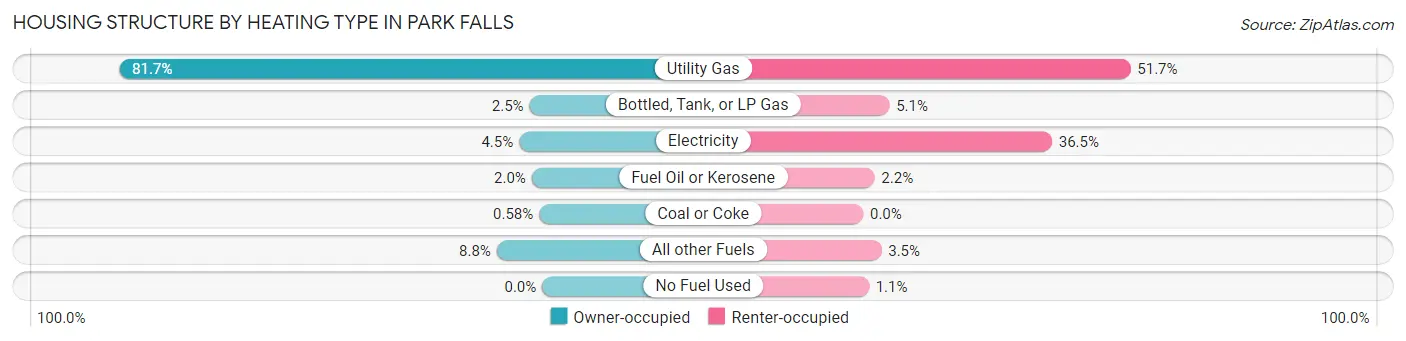
| Heating Type | Owner-occupied | Renter-occupied |
| Utility Gas | 568 (81.7%) | 235 (51.6%) |
| Bottled, Tank, or LP Gas | 17 (2.5%) | 23 (5.1%) |
| Electricity | 31 (4.5%) | 166 (36.5%) |
| Fuel Oil or Kerosene | 14 (2.0%) | 10 (2.2%) |
| Coal or Coke | 4 (0.6%) | 0 (0.0%) |
| All other Fuels | 61 (8.8%) | 16 (3.5%) |
| No Fuel Used | 0 (0.0%) | 5 (1.1%) |
| Total | 695 (100.0%) | 455 (100.0%) |
Household Vehicle Usage in Park Falls
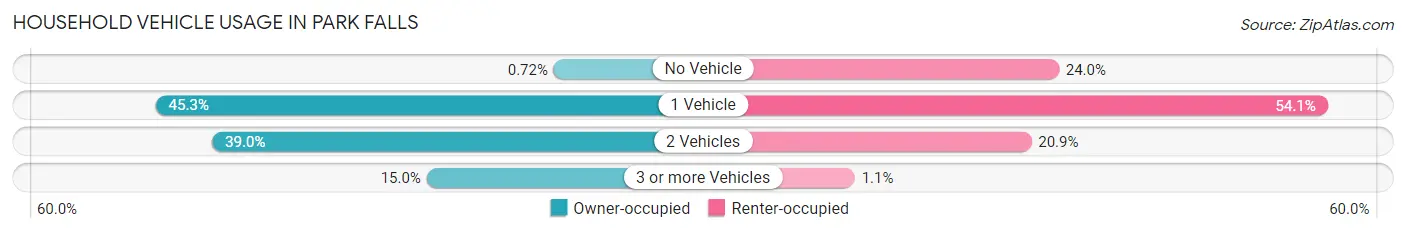
| Vehicles per Household | Owner-occupied | Renter-occupied |
| No Vehicle | 5 (0.7%) | 109 (24.0%) |
| 1 Vehicle | 315 (45.3%) | 246 (54.1%) |
| 2 Vehicles | 271 (39.0%) | 95 (20.9%) |
| 3 or more Vehicles | 104 (15.0%) | 5 (1.1%) |
| Total | 695 (100.0%) | 455 (100.0%) |
Real Estate & Mortgages in Park Falls
Real Estate and Mortgage Overview in Park Falls
| Characteristic | Without Mortgage | With Mortgage |
| Housing Units | 311 | 384 |
| Median Property Value | $81,600 | $78,300 |
| Median Household Income | $55,972 | $12 |
| Monthly Housing Costs | $525 | $0 |
| Real Estate Taxes | $1,529 | $57 |
Property Value by Mortgage Status in Park Falls
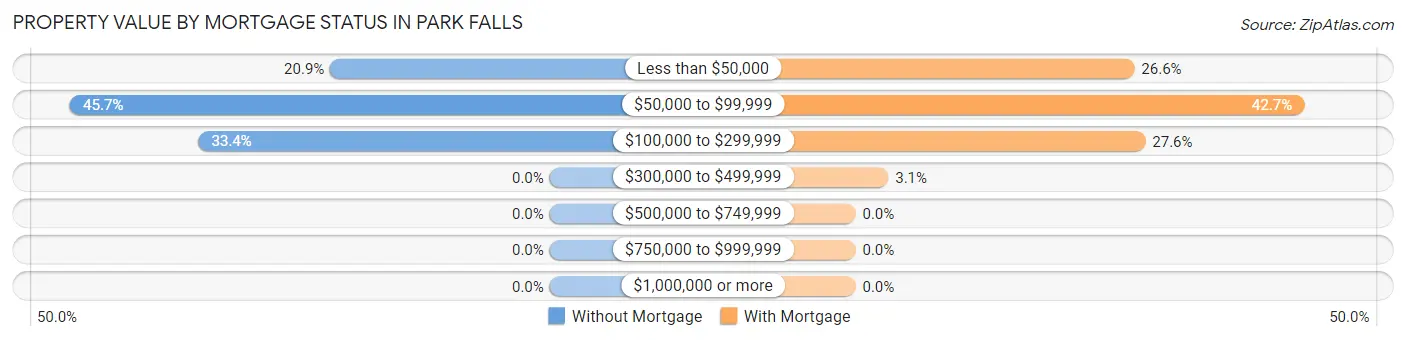
| Property Value | Without Mortgage | With Mortgage |
| Less than $50,000 | 65 (20.9%) | 102 (26.6%) |
| $50,000 to $99,999 | 142 (45.7%) | 164 (42.7%) |
| $100,000 to $299,999 | 104 (33.4%) | 106 (27.6%) |
| $300,000 to $499,999 | 0 (0.0%) | 12 (3.1%) |
| $500,000 to $749,999 | 0 (0.0%) | 0 (0.0%) |
| $750,000 to $999,999 | 0 (0.0%) | 0 (0.0%) |
| $1,000,000 or more | 0 (0.0%) | 0 (0.0%) |
| Total | 311 (100.0%) | 384 (100.0%) |
Household Income by Mortgage Status in Park Falls
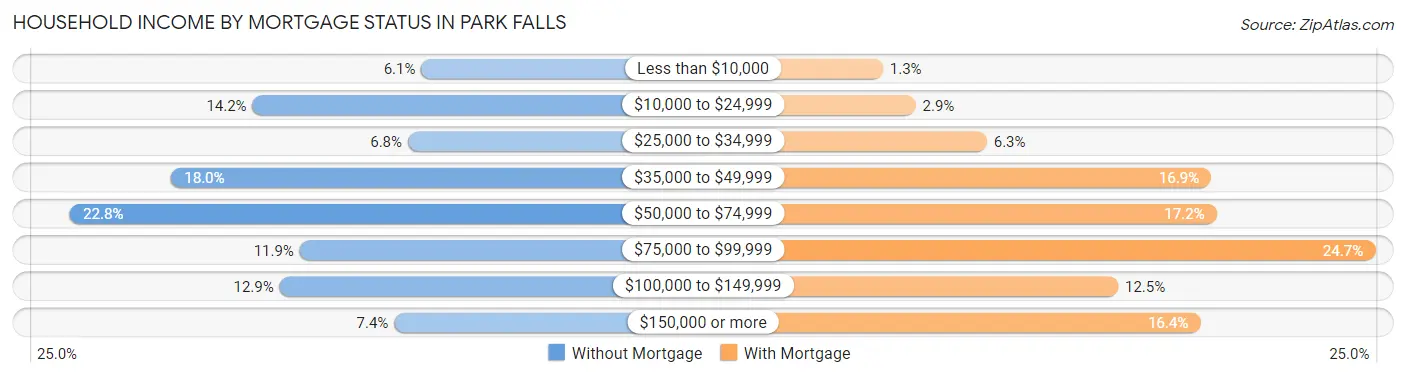
| Household Income | Without Mortgage | With Mortgage |
| Less than $10,000 | 19 (6.1%) | 5 (1.3%) |
| $10,000 to $24,999 | 44 (14.1%) | 11 (2.9%) |
| $25,000 to $34,999 | 21 (6.8%) | 24 (6.2%) |
| $35,000 to $49,999 | 56 (18.0%) | 65 (16.9%) |
| $50,000 to $74,999 | 71 (22.8%) | 66 (17.2%) |
| $75,000 to $99,999 | 37 (11.9%) | 95 (24.7%) |
| $100,000 to $149,999 | 40 (12.9%) | 48 (12.5%) |
| $150,000 or more | 23 (7.4%) | 63 (16.4%) |
| Total | 311 (100.0%) | 384 (100.0%) |
Property Value to Household Income Ratio in Park Falls
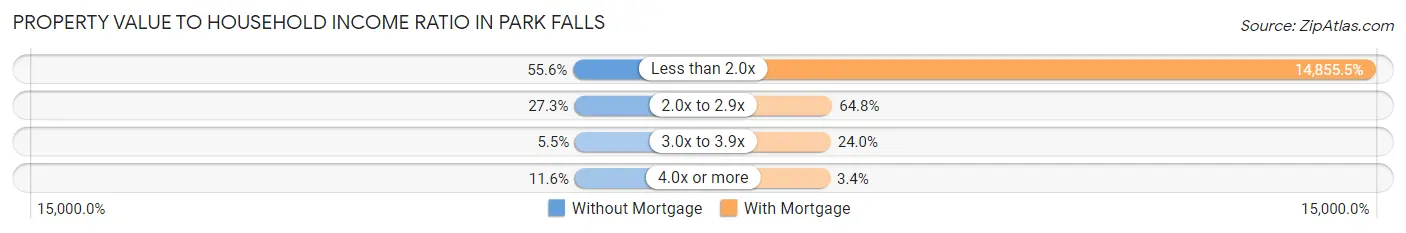
| Value-to-Income Ratio | Without Mortgage | With Mortgage |
| Less than 2.0x | 173 (55.6%) | 57,045 (14,855.5%) |
| 2.0x to 2.9x | 85 (27.3%) | 249 (64.8%) |
| 3.0x to 3.9x | 17 (5.5%) | 92 (24.0%) |
| 4.0x or more | 36 (11.6%) | 13 (3.4%) |
| Total | 311 (100.0%) | 384 (100.0%) |
Real Estate Taxes by Mortgage Status in Park Falls
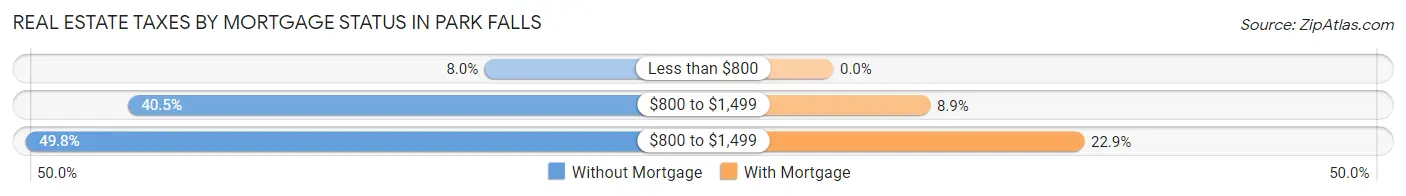
| Property Taxes | Without Mortgage | With Mortgage |
| Less than $800 | 25 (8.0%) | 0 (0.0%) |
| $800 to $1,499 | 126 (40.5%) | 34 (8.8%) |
| $800 to $1,499 | 155 (49.8%) | 88 (22.9%) |
| Total | 311 (100.0%) | 384 (100.0%) |
Health & Disability in Park Falls
Health Insurance Coverage by Age in Park Falls
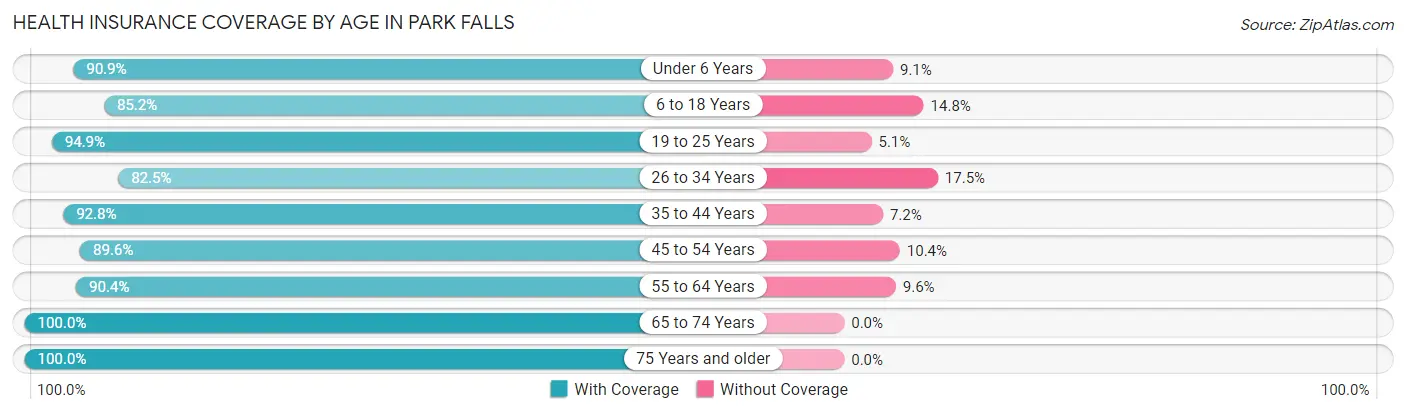
| Age Bracket | With Coverage | Without Coverage |
| Under 6 Years | 150 (90.9%) | 15 (9.1%) |
| 6 to 18 Years | 334 (85.2%) | 58 (14.8%) |
| 19 to 25 Years | 243 (94.9%) | 13 (5.1%) |
| 26 to 34 Years | 156 (82.5%) | 33 (17.5%) |
| 35 to 44 Years | 206 (92.8%) | 16 (7.2%) |
| 45 to 54 Years | 199 (89.6%) | 23 (10.4%) |
| 55 to 64 Years | 301 (90.4%) | 32 (9.6%) |
| 65 to 74 Years | 279 (100.0%) | 0 (0.0%) |
| 75 Years and older | 249 (100.0%) | 0 (0.0%) |
| Total | 2,117 (91.8%) | 190 (8.2%) |
Health Insurance Coverage by Citizenship Status in Park Falls
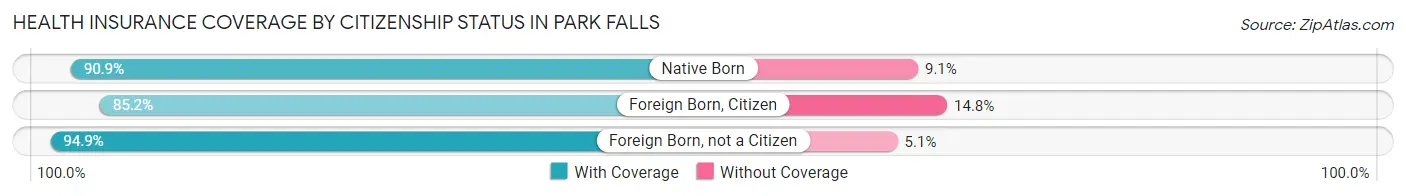
| Citizenship Status | With Coverage | Without Coverage |
| Native Born | 150 (90.9%) | 15 (9.1%) |
| Foreign Born, Citizen | 334 (85.2%) | 58 (14.8%) |
| Foreign Born, not a Citizen | 243 (94.9%) | 13 (5.1%) |
Health Insurance Coverage by Household Income in Park Falls
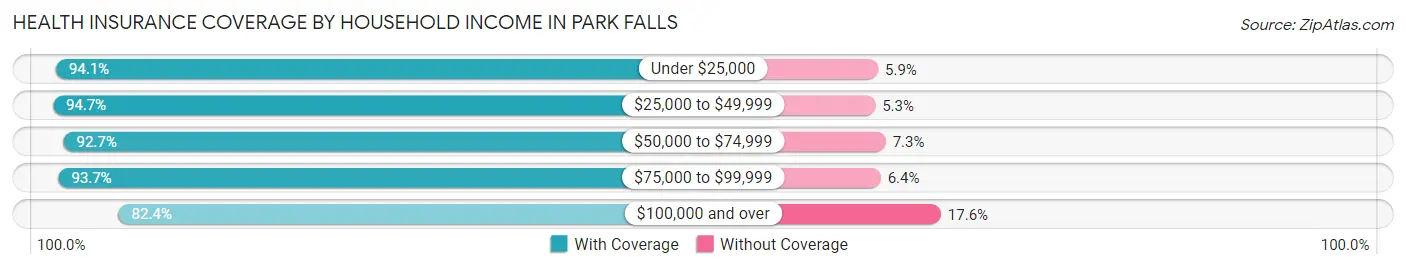
| Household Income | With Coverage | Without Coverage |
| Under $25,000 | 529 (94.1%) | 33 (5.9%) |
| $25,000 to $49,999 | 570 (94.7%) | 32 (5.3%) |
| $50,000 to $74,999 | 343 (92.7%) | 27 (7.3%) |
| $75,000 to $99,999 | 354 (93.6%) | 24 (6.4%) |
| $100,000 and over | 313 (82.4%) | 67 (17.6%) |
Public vs Private Health Insurance Coverage by Age in Park Falls
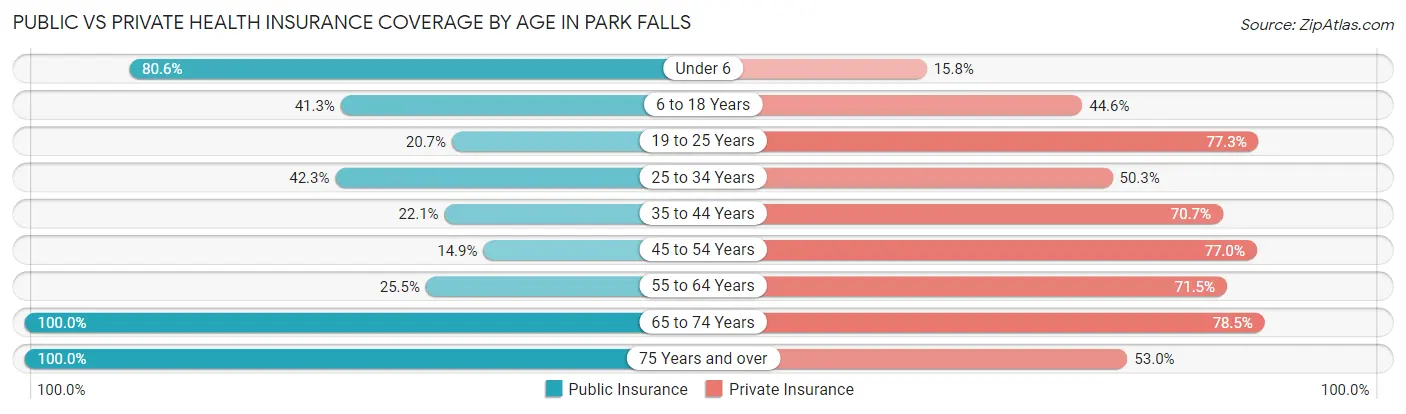
| Age Bracket | Public Insurance | Private Insurance |
| Under 6 | 133 (80.6%) | 26 (15.8%) |
| 6 to 18 Years | 162 (41.3%) | 175 (44.6%) |
| 19 to 25 Years | 53 (20.7%) | 198 (77.3%) |
| 25 to 34 Years | 80 (42.3%) | 95 (50.3%) |
| 35 to 44 Years | 49 (22.1%) | 157 (70.7%) |
| 45 to 54 Years | 33 (14.9%) | 171 (77.0%) |
| 55 to 64 Years | 85 (25.5%) | 238 (71.5%) |
| 65 to 74 Years | 279 (100.0%) | 219 (78.5%) |
| 75 Years and over | 249 (100.0%) | 132 (53.0%) |
| Total | 1,123 (48.7%) | 1,411 (61.2%) |
Disability Status by Sex by Age in Park Falls
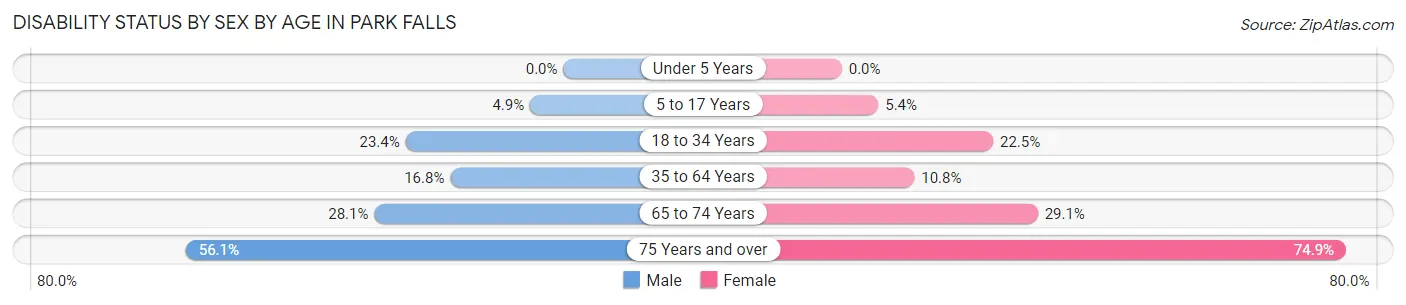
| Age Bracket | Male | Female |
| Under 5 Years | 0 (0.0%) | 0 (0.0%) |
| 5 to 17 Years | 12 (4.9%) | 9 (5.4%) |
| 18 to 34 Years | 41 (23.4%) | 64 (22.5%) |
| 35 to 64 Years | 65 (16.8%) | 42 (10.8%) |
| 65 to 74 Years | 32 (28.1%) | 48 (29.1%) |
| 75 Years and over | 37 (56.1%) | 137 (74.9%) |
Disability Class by Sex by Age in Park Falls
Disability Class: Hearing Difficulty
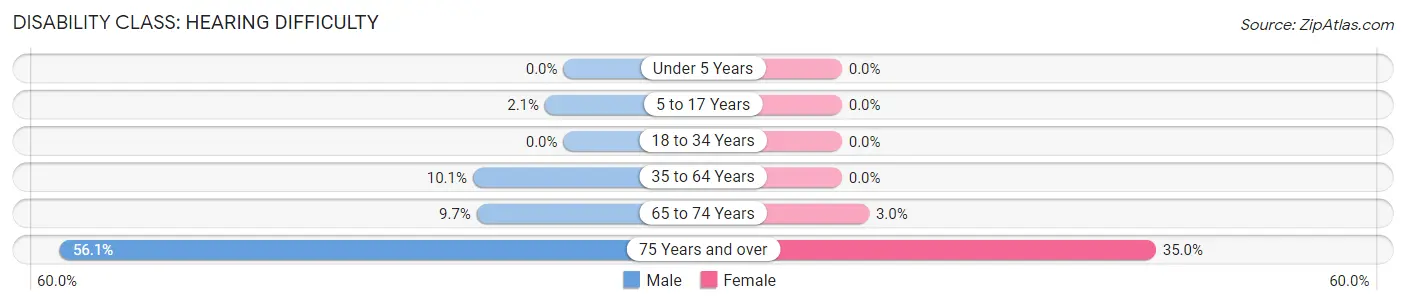
| Age Bracket | Male | Female |
| Under 5 Years | 0 (0.0%) | 0 (0.0%) |
| 5 to 17 Years | 5 (2.1%) | 0 (0.0%) |
| 18 to 34 Years | 0 (0.0%) | 0 (0.0%) |
| 35 to 64 Years | 39 (10.1%) | 0 (0.0%) |
| 65 to 74 Years | 11 (9.7%) | 5 (3.0%) |
| 75 Years and over | 37 (56.1%) | 64 (35.0%) |
Disability Class: Vision Difficulty
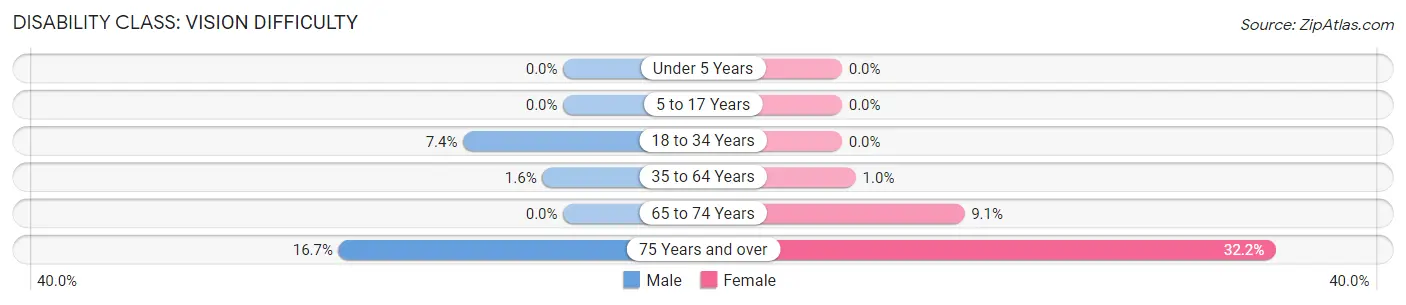
| Age Bracket | Male | Female |
| Under 5 Years | 0 (0.0%) | 0 (0.0%) |
| 5 to 17 Years | 0 (0.0%) | 0 (0.0%) |
| 18 to 34 Years | 13 (7.4%) | 0 (0.0%) |
| 35 to 64 Years | 6 (1.5%) | 4 (1.0%) |
| 65 to 74 Years | 0 (0.0%) | 15 (9.1%) |
| 75 Years and over | 11 (16.7%) | 59 (32.2%) |
Disability Class: Cognitive Difficulty
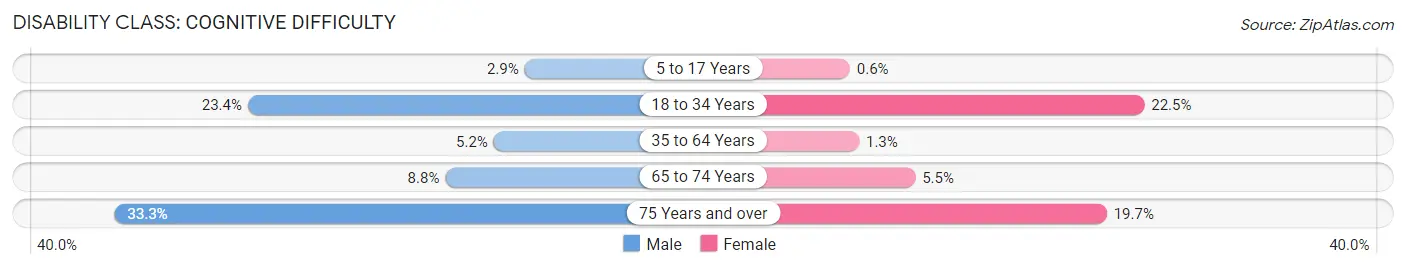
| Age Bracket | Male | Female |
| 5 to 17 Years | 7 (2.9%) | 1 (0.6%) |
| 18 to 34 Years | 41 (23.4%) | 64 (22.5%) |
| 35 to 64 Years | 20 (5.2%) | 5 (1.3%) |
| 65 to 74 Years | 10 (8.8%) | 9 (5.4%) |
| 75 Years and over | 22 (33.3%) | 36 (19.7%) |
Disability Class: Ambulatory Difficulty
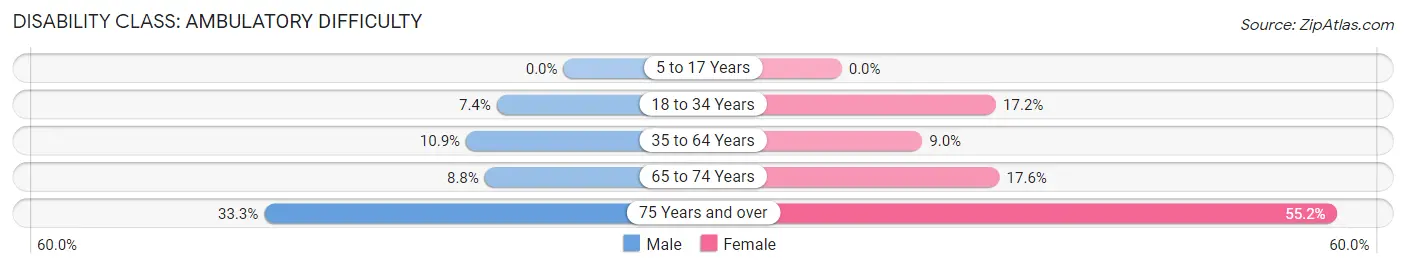
| Age Bracket | Male | Female |
| 5 to 17 Years | 0 (0.0%) | 0 (0.0%) |
| 18 to 34 Years | 13 (7.4%) | 49 (17.2%) |
| 35 to 64 Years | 42 (10.8%) | 35 (9.0%) |
| 65 to 74 Years | 10 (8.8%) | 29 (17.6%) |
| 75 Years and over | 22 (33.3%) | 101 (55.2%) |
Disability Class: Self-Care Difficulty
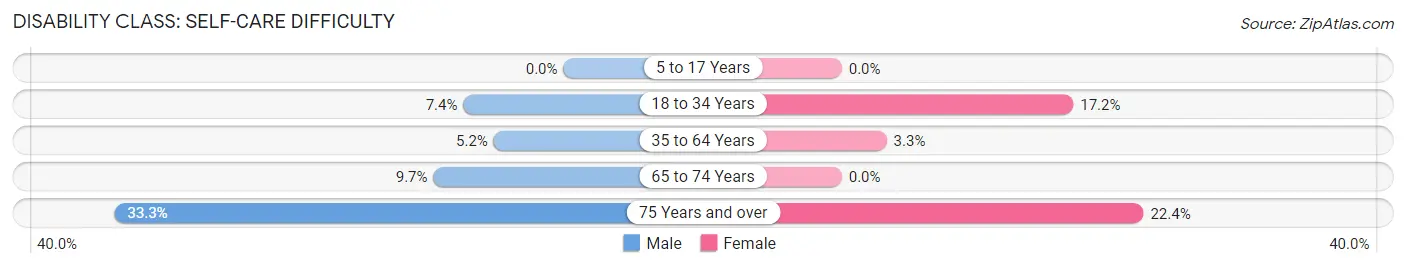
| Age Bracket | Male | Female |
| 5 to 17 Years | 0 (0.0%) | 0 (0.0%) |
| 18 to 34 Years | 13 (7.4%) | 49 (17.2%) |
| 35 to 64 Years | 20 (5.2%) | 13 (3.3%) |
| 65 to 74 Years | 11 (9.7%) | 0 (0.0%) |
| 75 Years and over | 22 (33.3%) | 41 (22.4%) |
Technology Access in Park Falls
Computing Device Access in Park Falls
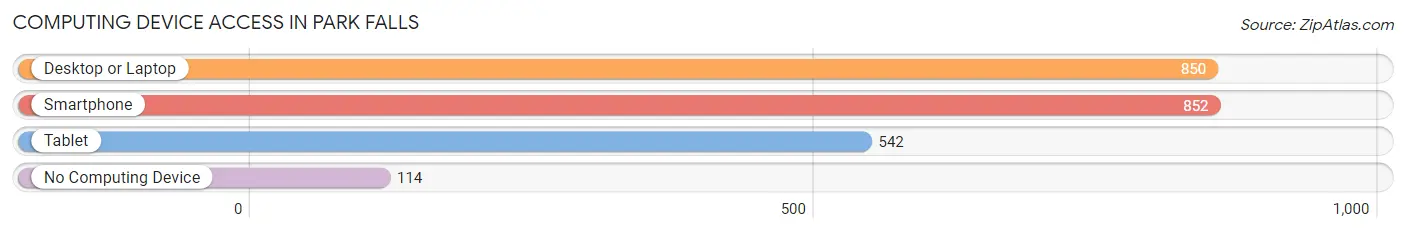
| Device Type | # Households | % Households |
| Desktop or Laptop | 850 | 73.9% |
| Smartphone | 852 | 74.1% |
| Tablet | 542 | 47.1% |
| No Computing Device | 114 | 9.9% |
| Total | 1,150 | 100.0% |
Internet Access in Park Falls
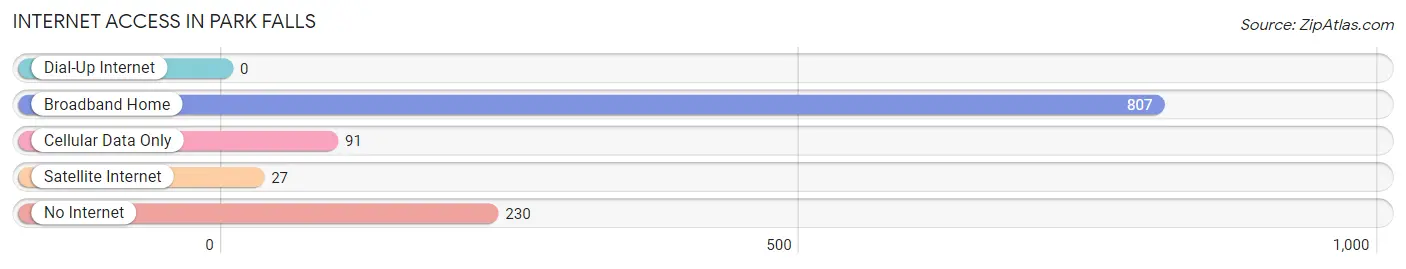
| Internet Type | # Households | % Households |
| Dial-Up Internet | 0 | 0.0% |
| Broadband Home | 807 | 70.2% |
| Cellular Data Only | 91 | 7.9% |
| Satellite Internet | 27 | 2.4% |
| No Internet | 230 | 20.0% |
| Total | 1,150 | 100.0% |
Park Falls Summary
History
The city of Park Falls, Wisconsin is located in Price County in the northern part of the state. It is situated on the Flambeau River, which is a tributary of the Chippewa River. The city was founded in 1883 by the Wisconsin Central Railroad, which was looking to expand its operations in the area. The city was named after the nearby Park Falls Rapids, which were created by the river.
The city was originally a logging town, and the lumber industry was the main source of employment for the early settlers. The city was also home to several sawmills, which provided lumber for the surrounding area. The lumber industry was the main source of income for the city until the early 1900s, when the industry began to decline.
In the early 1900s, the city began to diversify its economy. The city became a center for tourism, as it was located near several lakes and rivers. The city also became a center for manufacturing, as several factories were built in the area. The city also became a center for education, as several schools were built in the area.
Geography
Park Falls is located in Price County in the northern part of Wisconsin. It is situated on the Flambeau River, which is a tributary of the Chippewa River. The city is located in a heavily forested area, and the surrounding area is mostly rural. The city is located about 50 miles north of Wausau and about 100 miles northwest of Milwaukee.
The city has a total area of 4.2 square miles, all of which is land. The city is located at an elevation of 1,072 feet above sea level. The city has a humid continental climate, with cold winters and warm summers.
Economy
The economy of Park Falls is largely based on tourism and manufacturing. The city is home to several tourist attractions, including the Flambeau River State Forest, the Flambeau River State Park, and the Flambeau River Wildlife Area. The city is also home to several manufacturing companies, including a paper mill, a furniture factory, and a plastics factory.
The city is also home to several retail stores, restaurants, and other businesses. The city is served by the Park Falls Municipal Airport, which provides air service to the surrounding area.
Demographics
As of the 2010 census, the city of Park Falls had a population of 2,945. The racial makeup of the city was 97.2% White, 0.7% African American, 0.3% Native American, 0.3% Asian, 0.1% Pacific Islander, 0.3% from other races, and 1.2% from two or more races. Hispanic or Latino of any race were 1.2% of the population.
The median income for a household in the city was $35,938, and the median income for a family was $45,938. The per capita income for the city was $19,938. About 11.2% of families and 14.2% of the population were below the poverty line, including 19.2% of those under age 18 and 8.2% of those age 65 or over.
Common Questions
What is Per Capita Income in Park Falls?
Per Capita income in Park Falls is $28,337.
What is the Median Family Income in Park Falls?
Median Family Income in Park Falls is $54,464.
What is the Median Household income in Park Falls?
Median Household Income in Park Falls is $43,631.
What is Income or Wage Gap in Park Falls?
Income or Wage Gap in Park Falls is 16.2%.
Women in Park Falls earn 83.8 cents for every dollar earned by a man.
What is Family Income Deficit in Park Falls?
Family Income Deficit in Park Falls is $10,232.
Families that are below poverty line in Park Falls earn $10,232 less on average than the poverty threshold level.
What is Inequality or Gini Index in Park Falls?
Inequality or Gini Index in Park Falls is 0.43.
What is the Total Population of Park Falls?
Total Population of Park Falls is 2,389.
What is the Total Male Population of Park Falls?
Total Male Population of Park Falls is 1,077.
What is the Total Female Population of Park Falls?
Total Female Population of Park Falls is 1,312.
What is the Ratio of Males per 100 Females in Park Falls?
There are 82.09 Males per 100 Females in Park Falls.
What is the Ratio of Females per 100 Males in Park Falls?
There are 121.82 Females per 100 Males in Park Falls.
What is the Median Population Age in Park Falls?
Median Population Age in Park Falls is 44.4 Years.
What is the Average Family Size in Park Falls
Average Family Size in Park Falls is 3.0 People.
What is the Average Household Size in Park Falls
Average Household Size in Park Falls is 2.0 People.
How Large is the Labor Force in Park Falls?
There are 918 People in the Labor Forcein in Park Falls.
What is the Percentage of People in the Labor Force in Park Falls?
47.8% of People are in the Labor Force in Park Falls.
What is the Unemployment Rate in Park Falls?
Unemployment Rate in Park Falls is 2.7%.