Palmyra, WI Map & Demographics
Palmyra Map
Palmyra Overview
$34,165
PER CAPITA INCOME
$100,521
AVG FAMILY INCOME
$71,111
AVG HOUSEHOLD INCOME
29.4%
WAGE / INCOME GAP [ % ]
70.6¢/ $1
WAGE / INCOME GAP [ $ ]
0.37
INEQUALITY / GINI INDEX
2,097
TOTAL POPULATION
1,081
MALE POPULATION
1,016
FEMALE POPULATION
106.40
MALES / 100 FEMALES
93.99
FEMALES / 100 MALES
38.0
MEDIAN AGE
3.1
AVG FAMILY SIZE
2.5
AVG HOUSEHOLD SIZE
1,218
LABOR FORCE [ PEOPLE ]
68.0%
PERCENT IN LABOR FORCE
3.5%
UNEMPLOYMENT RATE
Palmyra Zip Codes
Palmyra Area Codes
Income in Palmyra
Income Overview in Palmyra
Per Capita Income in Palmyra is $34,165, while median incomes of families and households are $100,521 and $71,111 respectively.
| Characteristic | Number | Measure |
| Per Capita Income | 2,097 | $34,165 |
| Median Family Income | 513 | $100,521 |
| Mean Family Income | 513 | $94,019 |
| Median Household Income | 856 | $71,111 |
| Mean Household Income | 856 | $78,619 |
| Income Deficit | 513 | $0 |
| Wage / Income Gap (%) | 2,097 | 29.39% |
| Wage / Income Gap ($) | 2,097 | 70.61¢ per $1 |
| Gini / Inequality Index | 2,097 | 0.37 |
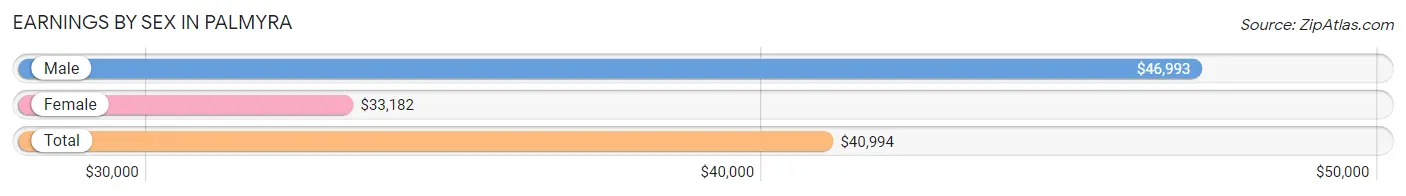
Earnings by Sex in Palmyra
Average Earnings in Palmyra are $40,994, $46,993 for men and $33,182 for women, a difference of 29.4%.
| Sex | Number | Average Earnings |
| Male | 739 (58.4%) | $46,993 |
| Female | 526 (41.6%) | $33,182 |
| Total | 1,265 (100.0%) | $40,994 |
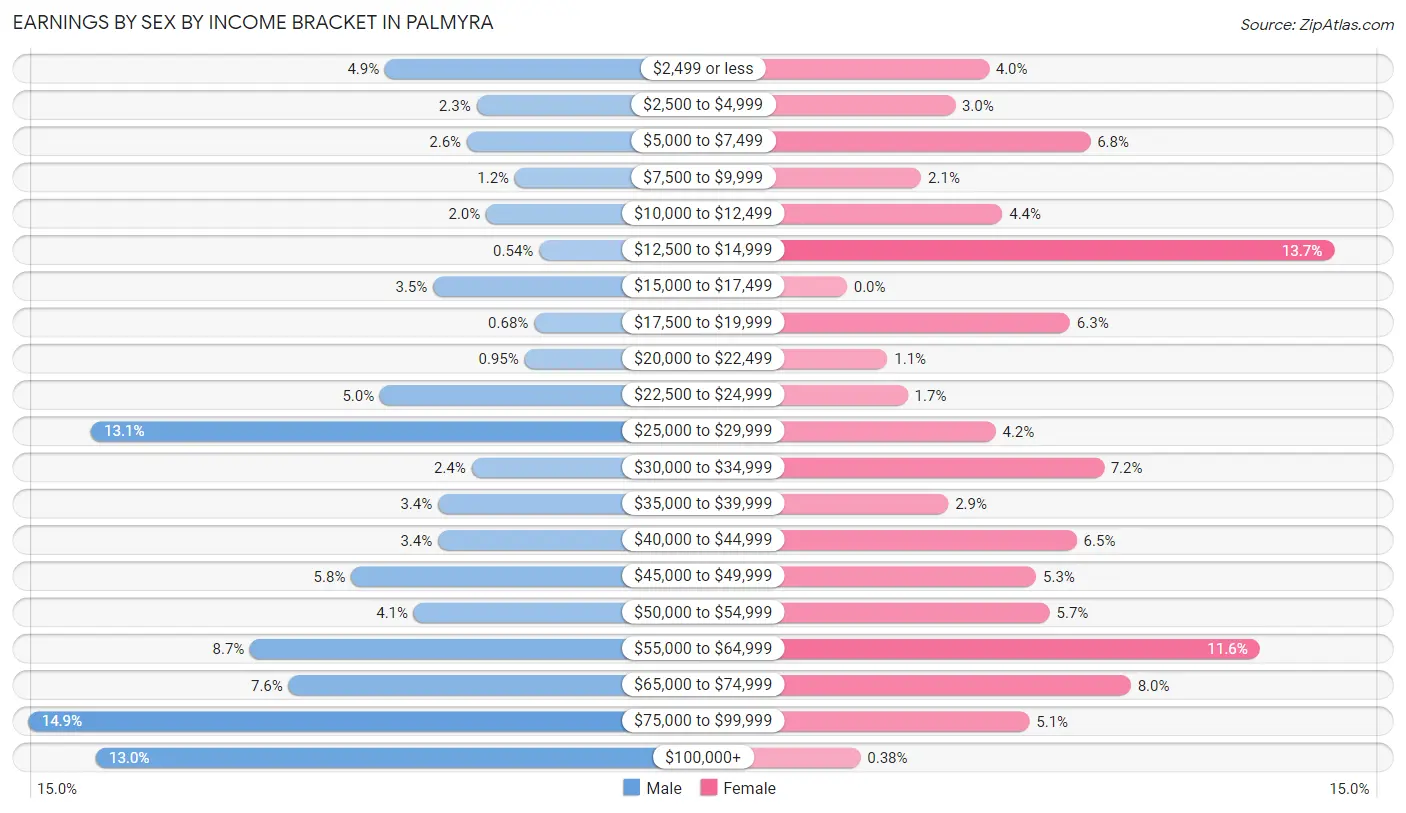
Earnings by Sex by Income Bracket in Palmyra
The most common earnings brackets in Palmyra are $75,000 to $99,999 for men (110 | 14.9%) and $12,500 to $14,999 for women (72 | 13.7%).
| Income | Male | Female |
| $2,499 or less | 36 (4.9%) | 21 (4.0%) |
| $2,500 to $4,999 | 17 (2.3%) | 16 (3.0%) |
| $5,000 to $7,499 | 19 (2.6%) | 36 (6.8%) |
| $7,500 to $9,999 | 9 (1.2%) | 11 (2.1%) |
| $10,000 to $12,499 | 15 (2.0%) | 23 (4.4%) |
| $12,500 to $14,999 | 4 (0.5%) | 72 (13.7%) |
| $15,000 to $17,499 | 26 (3.5%) | 0 (0.0%) |
| $17,500 to $19,999 | 5 (0.7%) | 33 (6.3%) |
| $20,000 to $22,499 | 7 (0.9%) | 6 (1.1%) |
| $22,500 to $24,999 | 37 (5.0%) | 9 (1.7%) |
| $25,000 to $29,999 | 97 (13.1%) | 22 (4.2%) |
| $30,000 to $34,999 | 18 (2.4%) | 38 (7.2%) |
| $35,000 to $39,999 | 25 (3.4%) | 15 (2.9%) |
| $40,000 to $44,999 | 25 (3.4%) | 34 (6.5%) |
| $45,000 to $49,999 | 43 (5.8%) | 28 (5.3%) |
| $50,000 to $54,999 | 30 (4.1%) | 30 (5.7%) |
| $55,000 to $64,999 | 64 (8.7%) | 61 (11.6%) |
| $65,000 to $74,999 | 56 (7.6%) | 42 (8.0%) |
| $75,000 to $99,999 | 110 (14.9%) | 27 (5.1%) |
| $100,000+ | 96 (13.0%) | 2 (0.4%) |
| Total | 739 (100.0%) | 526 (100.0%) |
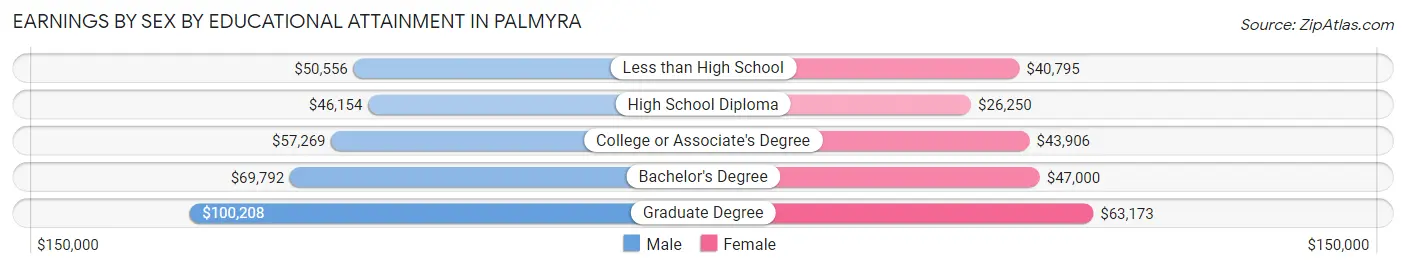
Earnings by Sex by Educational Attainment in Palmyra
Average earnings in Palmyra are $55,990 for men and $41,971 for women, a difference of 25.0%. Men with an educational attainment of graduate degree enjoy the highest average annual earnings of $100,208, while those with high school diploma education earn the least with $46,154. Women with an educational attainment of graduate degree earn the most with the average annual earnings of $63,173, while those with high school diploma education have the smallest earnings of $26,250.
| Educational Attainment | Male Income | Female Income |
| Less than High School | $50,556 | $40,795 |
| High School Diploma | $46,154 | $26,250 |
| College or Associate's Degree | $57,269 | $43,906 |
| Bachelor's Degree | $69,792 | $47,000 |
| Graduate Degree | $100,208 | $63,173 |
| Total | $55,990 | $41,971 |
Family Income in Palmyra
Family Income Brackets in Palmyra
According to the Palmyra family income data, there are 221 families falling into the $100,000 to $149,999 income range, which is the most common income bracket and makes up 43.1% of all families.
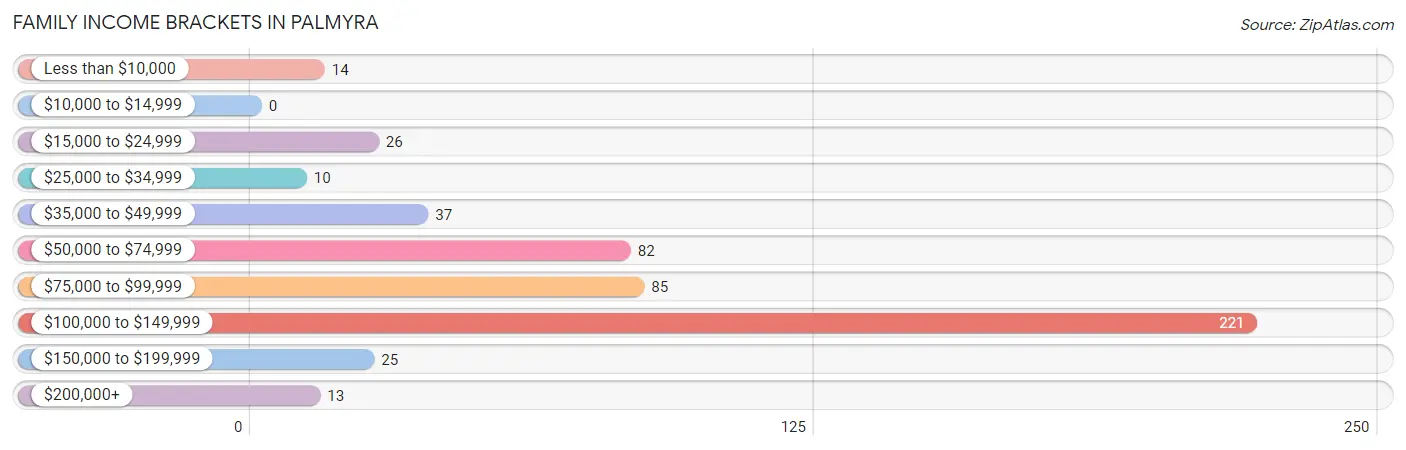
| Income Bracket | # Families | % Families |
| Less than $10,000 | 14 | 2.7% |
| $10,000 to $14,999 | 0 | 0.0% |
| $15,000 to $24,999 | 26 | 5.1% |
| $25,000 to $34,999 | 10 | 1.9% |
| $35,000 to $49,999 | 37 | 7.2% |
| $50,000 to $74,999 | 82 | 16.0% |
| $75,000 to $99,999 | 85 | 16.6% |
| $100,000 to $149,999 | 221 | 43.1% |
| $150,000 to $199,999 | 25 | 4.9% |
| $200,000+ | 13 | 2.5% |
Family Income by Famaliy Size in Palmyra
5-person families (58 | 11.3%) account for the highest median family income in Palmyra with $129,000 per family, while 2-person families (290 | 56.5%) have the highest median income of $44,584 per family member.
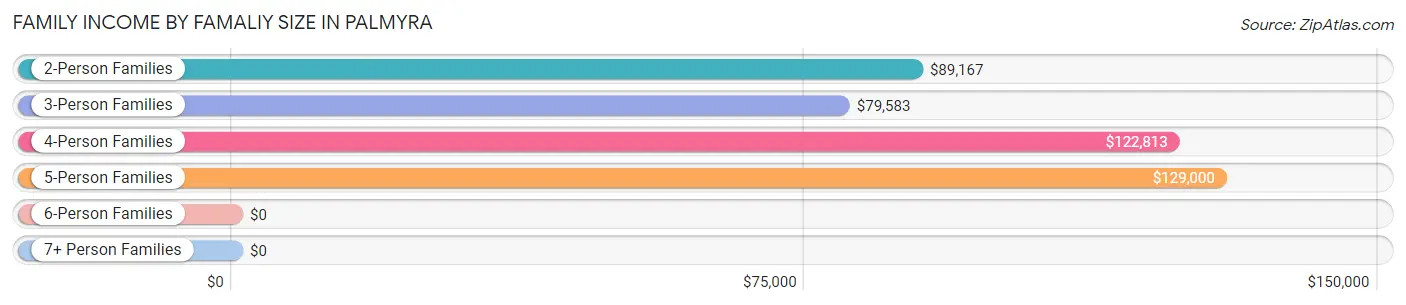
| Income Bracket | # Families | Median Income |
| 2-Person Families | 290 (56.5%) | $89,167 |
| 3-Person Families | 100 (19.5%) | $79,583 |
| 4-Person Families | 55 (10.7%) | $122,813 |
| 5-Person Families | 58 (11.3%) | $129,000 |
| 6-Person Families | 3 (0.6%) | $0 |
| 7+ Person Families | 7 (1.4%) | $0 |
| Total | 513 (100.0%) | $100,521 |
Family Income by Number of Earners in Palmyra
The median family income in Palmyra is $100,521, with families comprising 3+ earners (58) having the highest median family income of $145,278, while families with no earners (68) have the lowest median family income of $45,625, accounting for 11.3% and 13.3% of families, respectively.
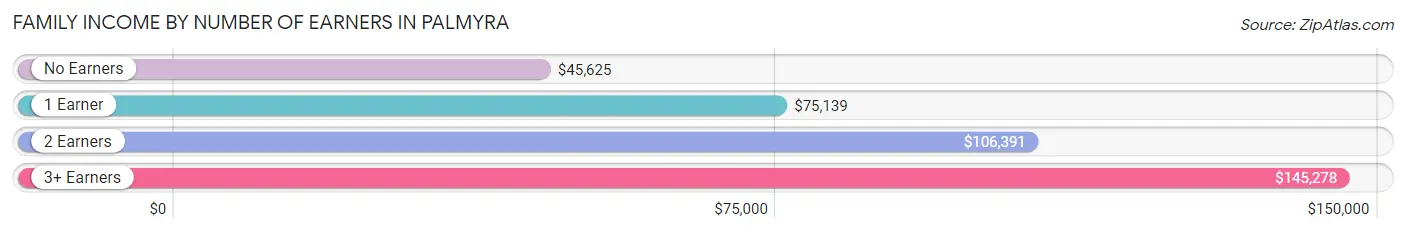
| Number of Earners | # Families | Median Income |
| No Earners | 68 (13.3%) | $45,625 |
| 1 Earner | 118 (23.0%) | $75,139 |
| 2 Earners | 269 (52.4%) | $106,391 |
| 3+ Earners | 58 (11.3%) | $145,278 |
| Total | 513 (100.0%) | $100,521 |
Household Income in Palmyra
Household Income Brackets in Palmyra
With 234 households falling in the category, the $100,000 to $149,999 income range is the most frequent in Palmyra, accounting for 27.3% of all households. In contrast, only 14 households (1.6%) fall into the less than $10,000 income bracket, making it the least populous group.
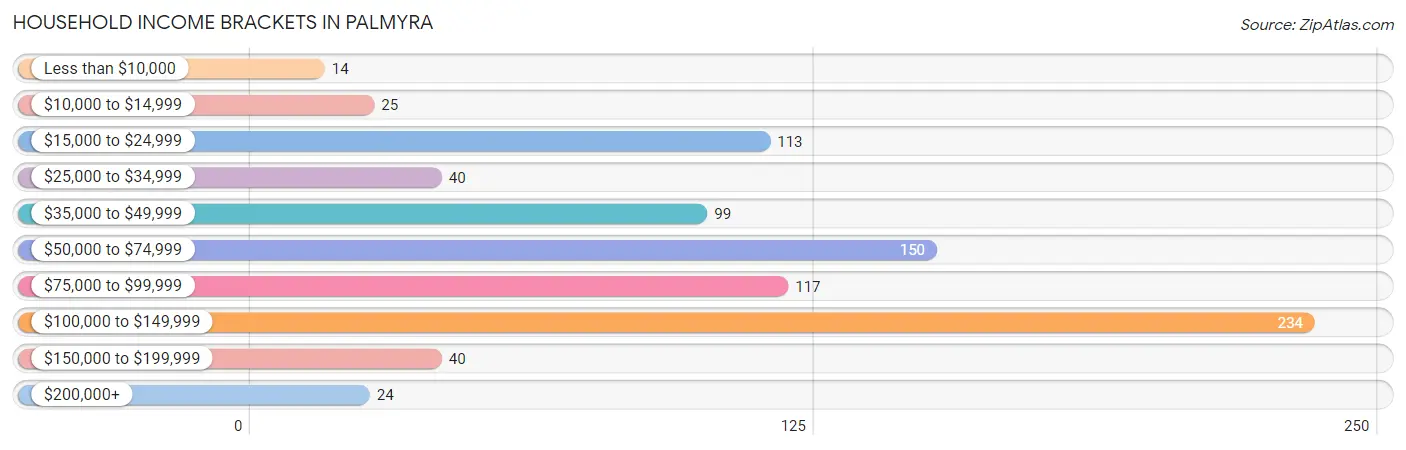
| Income Bracket | # Households | % Households |
| Less than $10,000 | 14 | 1.6% |
| $10,000 to $14,999 | 25 | 2.9% |
| $15,000 to $24,999 | 113 | 13.2% |
| $25,000 to $34,999 | 40 | 4.7% |
| $35,000 to $49,999 | 99 | 11.6% |
| $50,000 to $74,999 | 150 | 17.5% |
| $75,000 to $99,999 | 117 | 13.7% |
| $100,000 to $149,999 | 234 | 27.3% |
| $150,000 to $199,999 | 40 | 4.7% |
| $200,000+ | 24 | 2.8% |
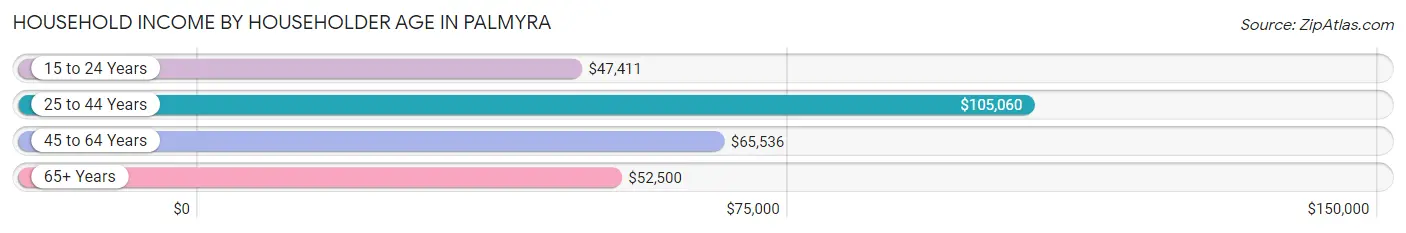
Household Income by Householder Age in Palmyra
The median household income in Palmyra is $71,111, with the highest median household income of $105,060 found in the 25 to 44 years age bracket for the primary householder. A total of 329 households (38.4%) fall into this category. Meanwhile, the 15 to 24 years age bracket for the primary householder has the lowest median household income of $47,411, with 55 households (6.4%) in this group.
| Income Bracket | # Households | Median Income |
| 15 to 24 Years | 55 (6.4%) | $47,411 |
| 25 to 44 Years | 329 (38.4%) | $105,060 |
| 45 to 64 Years | 300 (35.0%) | $65,536 |
| 65+ Years | 172 (20.1%) | $52,500 |
| Total | 856 (100.0%) | $71,111 |
Poverty in Palmyra
Income Below Poverty by Sex and Age in Palmyra
With 9.8% poverty level for males and 11.7% for females among the residents of Palmyra, 6 to 11 year old males and 12 to 14 year old females are the most vulnerable to poverty, with 18 males (32.1%) and 4 females (40.0%) in their respective age groups living below the poverty level.
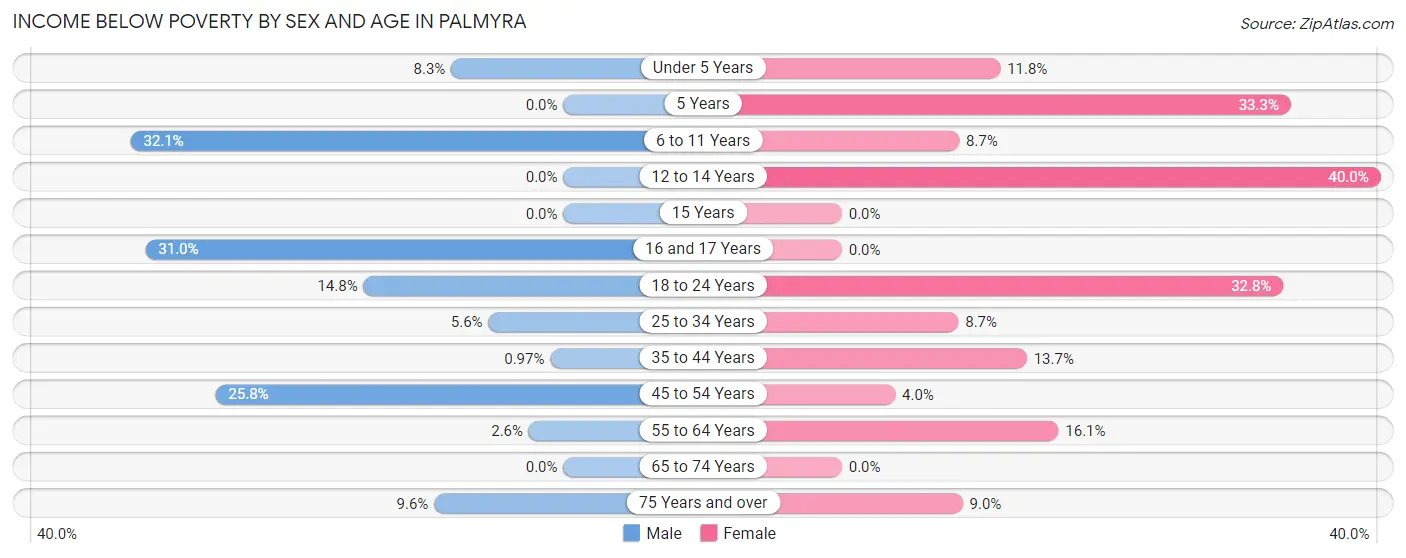
| Age Bracket | Male | Female |
| Under 5 Years | 3 (8.3%) | 4 (11.8%) |
| 5 Years | 0 (0.0%) | 2 (33.3%) |
| 6 to 11 Years | 18 (32.1%) | 6 (8.7%) |
| 12 to 14 Years | 0 (0.0%) | 4 (40.0%) |
| 15 Years | 0 (0.0%) | 0 (0.0%) |
| 16 and 17 Years | 9 (31.0%) | 0 (0.0%) |
| 18 to 24 Years | 19 (14.8%) | 39 (32.8%) |
| 25 to 34 Years | 5 (5.6%) | 9 (8.6%) |
| 35 to 44 Years | 3 (1.0%) | 21 (13.7%) |
| 45 to 54 Years | 39 (25.8%) | 4 (4.0%) |
| 55 to 64 Years | 3 (2.6%) | 23 (16.1%) |
| 65 to 74 Years | 0 (0.0%) | 0 (0.0%) |
| 75 Years and over | 7 (9.6%) | 7 (9.0%) |
| Total | 106 (9.8%) | 119 (11.7%) |
Income Above Poverty by Sex and Age in Palmyra
According to the poverty statistics in Palmyra, males aged 12 to 14 years and females aged 15 years are the age groups that are most secure financially, with 100.0% of males and 100.0% of females in these age groups living above the poverty line.
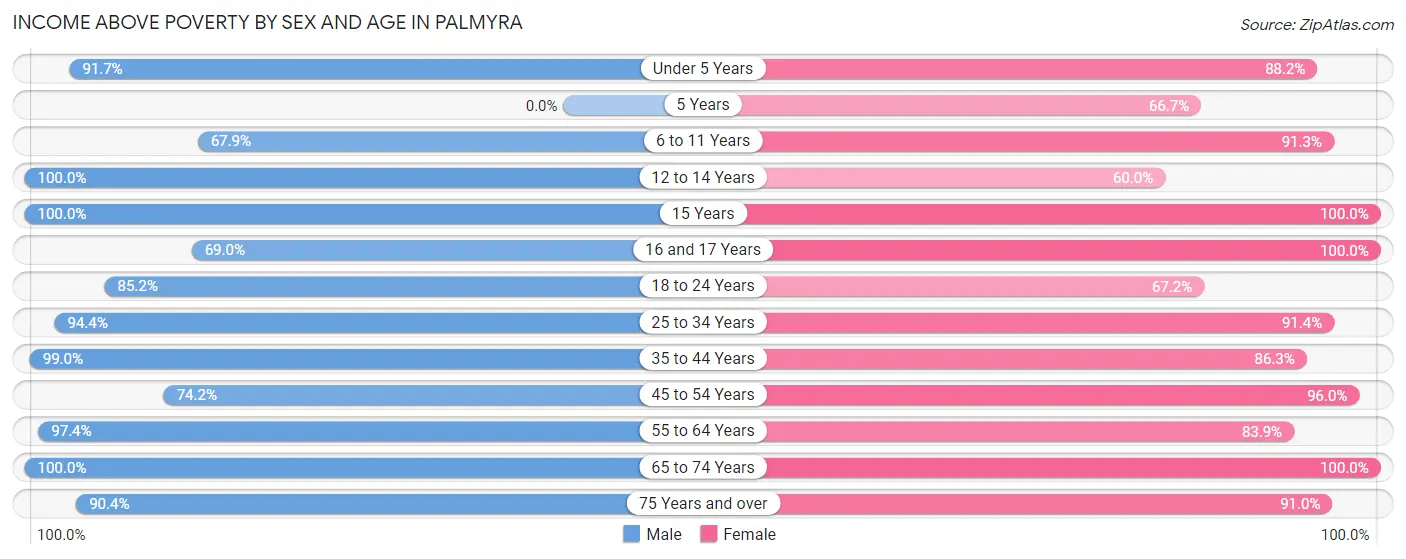
| Age Bracket | Male | Female |
| Under 5 Years | 33 (91.7%) | 30 (88.2%) |
| 5 Years | 0 (0.0%) | 4 (66.7%) |
| 6 to 11 Years | 38 (67.9%) | 63 (91.3%) |
| 12 to 14 Years | 29 (100.0%) | 6 (60.0%) |
| 15 Years | 5 (100.0%) | 61 (100.0%) |
| 16 and 17 Years | 20 (69.0%) | 45 (100.0%) |
| 18 to 24 Years | 109 (85.2%) | 80 (67.2%) |
| 25 to 34 Years | 85 (94.4%) | 95 (91.3%) |
| 35 to 44 Years | 307 (99.0%) | 132 (86.3%) |
| 45 to 54 Years | 112 (74.2%) | 97 (96.0%) |
| 55 to 64 Years | 114 (97.4%) | 120 (83.9%) |
| 65 to 74 Years | 57 (100.0%) | 93 (100.0%) |
| 75 Years and over | 66 (90.4%) | 71 (91.0%) |
| Total | 975 (90.2%) | 897 (88.3%) |
Income Below Poverty Among Married-Couple Families in Palmyra
The poverty statistics for married-couple families in Palmyra show that 4.6% or 16 of the total 351 families live below the poverty line. Families with 3 or 4 children have the highest poverty rate of 6.7%, comprising of 3 families. On the other hand, families with 5 or more children have the lowest poverty rate of 0.0%, which includes 0 families.
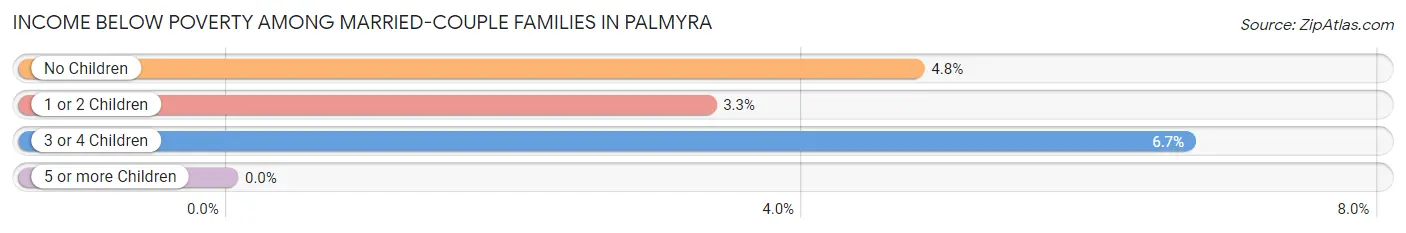
| Children | Above Poverty | Below Poverty |
| No Children | 199 (95.2%) | 10 (4.8%) |
| 1 or 2 Children | 87 (96.7%) | 3 (3.3%) |
| 3 or 4 Children | 42 (93.3%) | 3 (6.7%) |
| 5 or more Children | 7 (100.0%) | 0 (0.0%) |
| Total | 335 (95.4%) | 16 (4.6%) |
Income Below Poverty Among Single-Parent Households in Palmyra
According to the poverty data in Palmyra, 1.9% or 2 single-father households and 21.0% or 12 single-mother households are living below the poverty line. Among single-father households, those with 1 or 2 children have the highest poverty rate, with 2 households (13.3%) experiencing poverty. Likewise, among single-mother households, those with 1 or 2 children have the highest poverty rate, with 12 households (44.4%) falling below the poverty line.
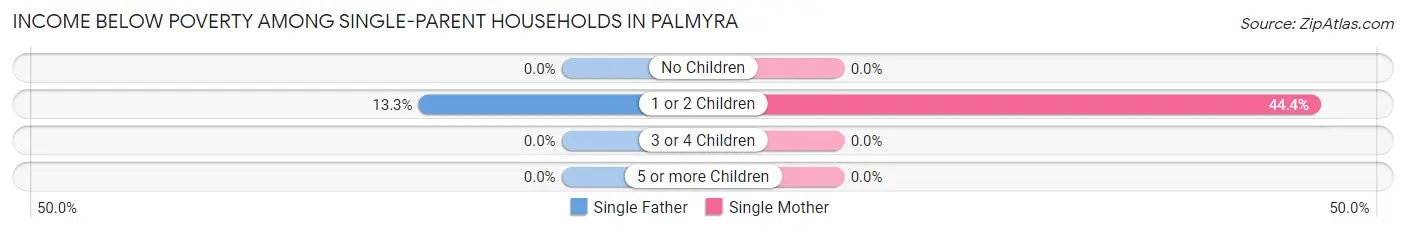
| Children | Single Father | Single Mother |
| No Children | 0 (0.0%) | 0 (0.0%) |
| 1 or 2 Children | 2 (13.3%) | 12 (44.4%) |
| 3 or 4 Children | 0 (0.0%) | 0 (0.0%) |
| 5 or more Children | 0 (0.0%) | 0 (0.0%) |
| Total | 2 (1.9%) | 12 (21.0%) |
Income Below Poverty Among Married-Couple vs Single-Parent Households in Palmyra
The poverty data for Palmyra shows that 16 of the married-couple family households (4.6%) and 14 of the single-parent households (8.6%) are living below the poverty level. Within the married-couple family households, those with 3 or 4 children have the highest poverty rate, with 3 households (6.7%) falling below the poverty line. Among the single-parent households, those with 1 or 2 children have the highest poverty rate, with 14 household (33.3%) living below poverty.
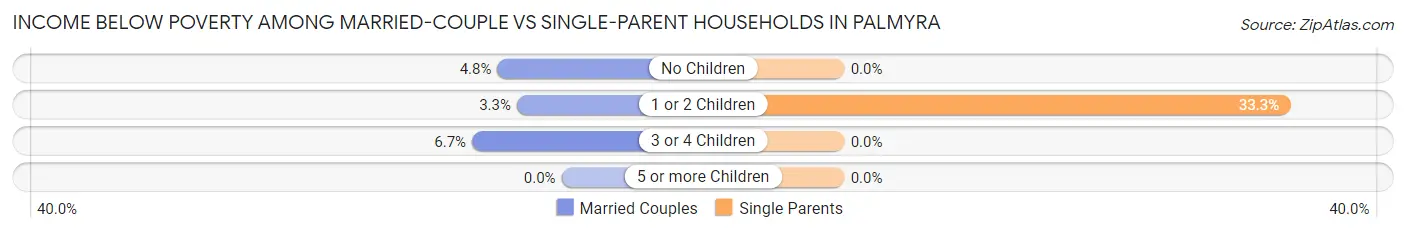
| Children | Married-Couple Families | Single-Parent Households |
| No Children | 10 (4.8%) | 0 (0.0%) |
| 1 or 2 Children | 3 (3.3%) | 14 (33.3%) |
| 3 or 4 Children | 3 (6.7%) | 0 (0.0%) |
| 5 or more Children | 0 (0.0%) | 0 (0.0%) |
| Total | 16 (4.6%) | 14 (8.6%) |
Race in Palmyra
The most populous races in Palmyra are White / Caucasian (1,949 | 92.9%), Hispanic or Latino (221 | 10.5%), and Two or more Races (74 | 3.5%).
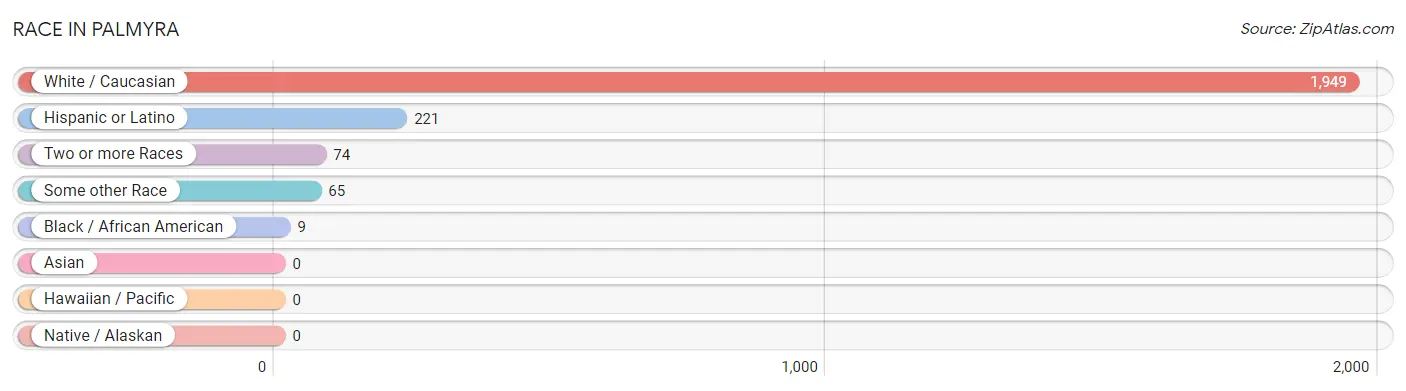
| Race | # Population | % Population |
| Asian | 0 | 0.0% |
| Black / African American | 9 | 0.4% |
| Hawaiian / Pacific | 0 | 0.0% |
| Hispanic or Latino | 221 | 10.5% |
| Native / Alaskan | 0 | 0.0% |
| White / Caucasian | 1,949 | 92.9% |
| Two or more Races | 74 | 3.5% |
| Some other Race | 65 | 3.1% |
| Total | 2,097 | 100.0% |
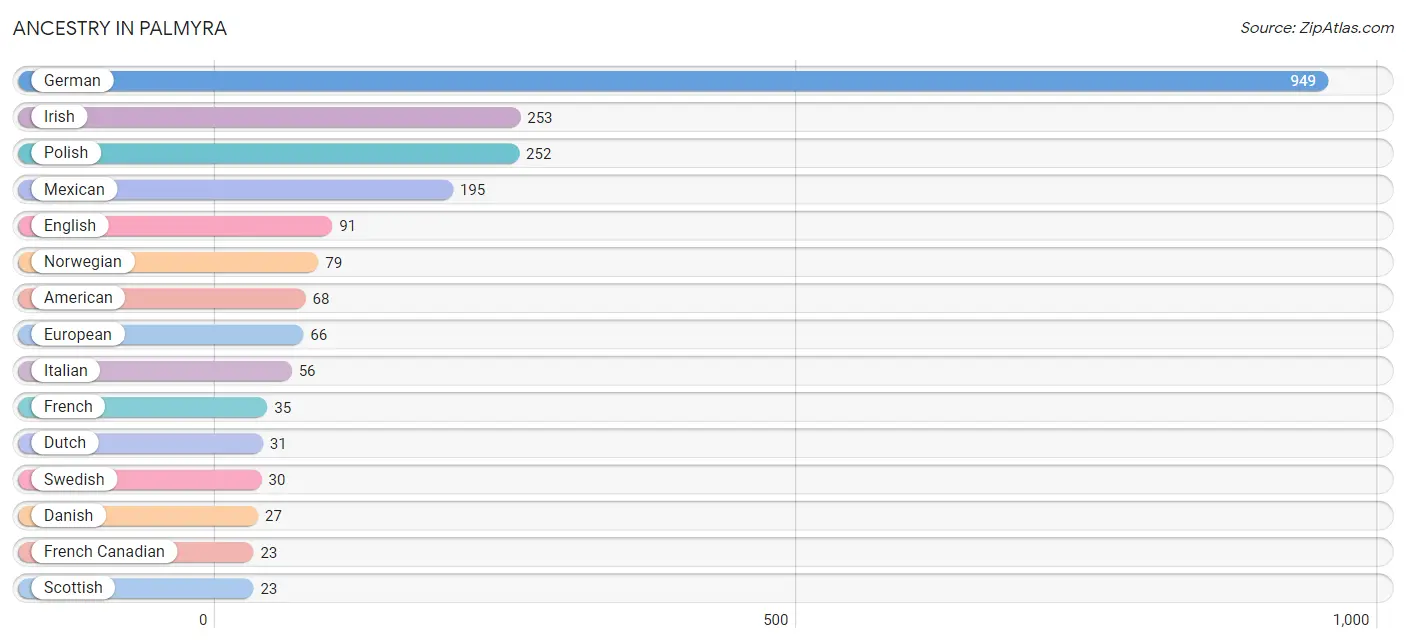
Ancestry in Palmyra
The most populous ancestries reported in Palmyra are German (949 | 45.3%), Irish (253 | 12.1%), Polish (252 | 12.0%), Mexican (195 | 9.3%), and English (91 | 4.3%), together accounting for 83.0% of all Palmyra residents.
| Ancestry | # Population | % Population |
| African | 9 | 0.4% |
| American | 68 | 3.2% |
| Australian | 17 | 0.8% |
| Austrian | 3 | 0.1% |
| Belgian | 4 | 0.2% |
| British | 2 | 0.1% |
| Central American | 7 | 0.3% |
| Comanche | 2 | 0.1% |
| Croatian | 8 | 0.4% |
| Czech | 21 | 1.0% |
| Danish | 27 | 1.3% |
| Dutch | 31 | 1.5% |
| Eastern European | 4 | 0.2% |
| English | 91 | 4.3% |
| European | 66 | 3.2% |
| French | 35 | 1.7% |
| French Canadian | 23 | 1.1% |
| German | 949 | 45.3% |
| Guatemalan | 7 | 0.3% |
| Hungarian | 5 | 0.2% |
| Iranian | 4 | 0.2% |
| Irish | 253 | 12.1% |
| Italian | 56 | 2.7% |
| Lithuanian | 8 | 0.4% |
| Mexican | 195 | 9.3% |
| Norwegian | 79 | 3.8% |
| Polish | 252 | 12.0% |
| Puerto Rican | 19 | 0.9% |
| Russian | 13 | 0.6% |
| Scottish | 23 | 1.1% |
| Serbian | 14 | 0.7% |
| Sri Lankan | 9 | 0.4% |
| Subsaharan African | 9 | 0.4% |
| Swedish | 30 | 1.4% |
| Swiss | 13 | 0.6% |
| Yugoslavian | 20 | 0.9% | View All 36 Rows |
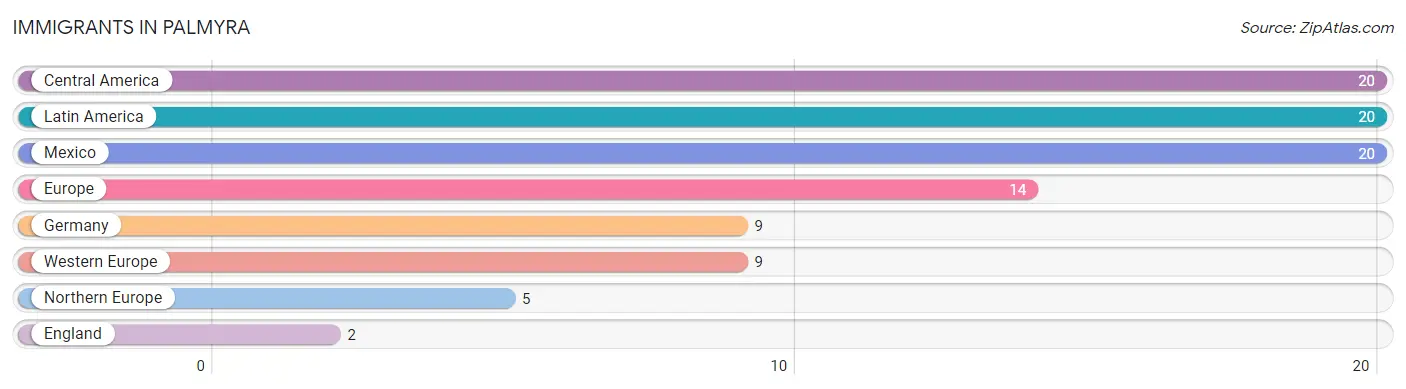
Immigrants in Palmyra
The most numerous immigrant groups reported in Palmyra came from Central America (20 | 0.9%), Latin America (20 | 0.9%), Mexico (20 | 0.9%), Europe (14 | 0.7%), and Germany (9 | 0.4%), together accounting for 3.9% of all Palmyra residents.
| Immigration Origin | # Population | % Population |
| Central America | 20 | 0.9% |
| England | 2 | 0.1% |
| Europe | 14 | 0.7% |
| Germany | 9 | 0.4% |
| Latin America | 20 | 0.9% |
| Mexico | 20 | 0.9% |
| Northern Europe | 5 | 0.2% |
| Western Europe | 9 | 0.4% | View All 8 Rows |
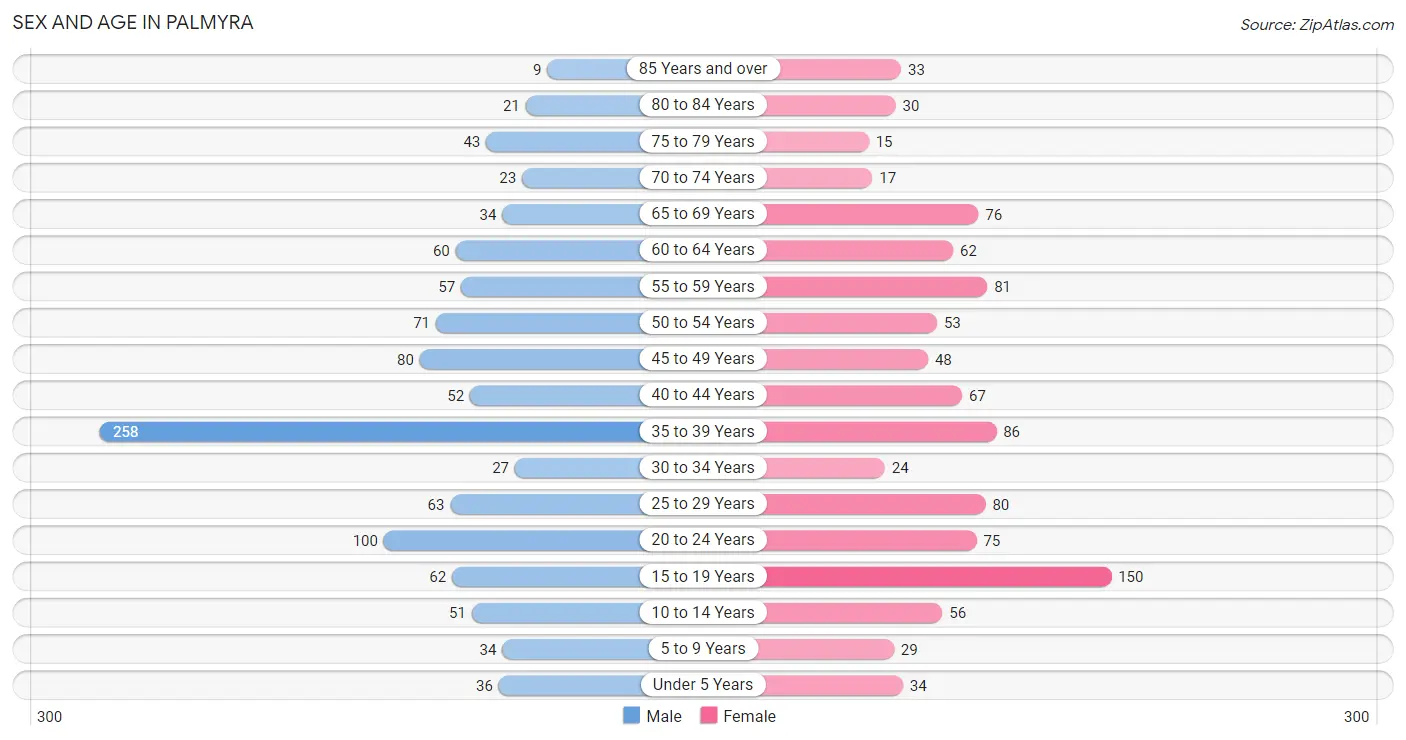
Sex and Age in Palmyra
Sex and Age in Palmyra
The most populous age groups in Palmyra are 35 to 39 Years (258 | 23.9%) for men and 15 to 19 Years (150 | 14.8%) for women.
| Age Bracket | Male | Female |
| Under 5 Years | 36 (3.3%) | 34 (3.4%) |
| 5 to 9 Years | 34 (3.2%) | 29 (2.9%) |
| 10 to 14 Years | 51 (4.7%) | 56 (5.5%) |
| 15 to 19 Years | 62 (5.7%) | 150 (14.8%) |
| 20 to 24 Years | 100 (9.2%) | 75 (7.4%) |
| 25 to 29 Years | 63 (5.8%) | 80 (7.9%) |
| 30 to 34 Years | 27 (2.5%) | 24 (2.4%) |
| 35 to 39 Years | 258 (23.9%) | 86 (8.5%) |
| 40 to 44 Years | 52 (4.8%) | 67 (6.6%) |
| 45 to 49 Years | 80 (7.4%) | 48 (4.7%) |
| 50 to 54 Years | 71 (6.6%) | 53 (5.2%) |
| 55 to 59 Years | 57 (5.3%) | 81 (8.0%) |
| 60 to 64 Years | 60 (5.6%) | 62 (6.1%) |
| 65 to 69 Years | 34 (3.2%) | 76 (7.5%) |
| 70 to 74 Years | 23 (2.1%) | 17 (1.7%) |
| 75 to 79 Years | 43 (4.0%) | 15 (1.5%) |
| 80 to 84 Years | 21 (1.9%) | 30 (2.9%) |
| 85 Years and over | 9 (0.8%) | 33 (3.3%) |
| Total | 1,081 (100.0%) | 1,016 (100.0%) |
Families and Households in Palmyra
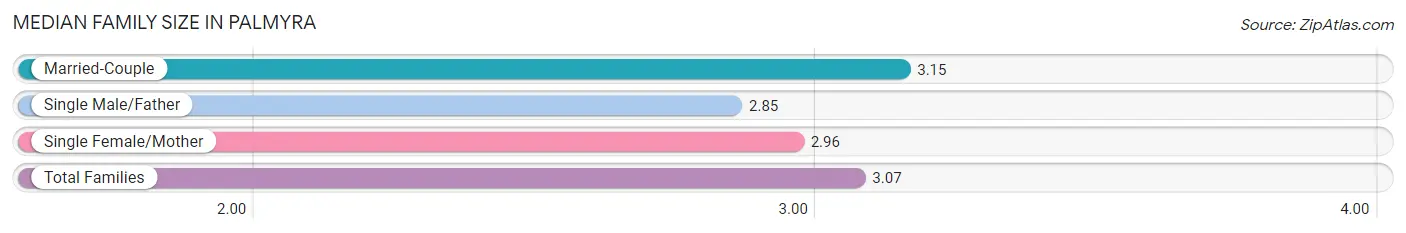
Median Family Size in Palmyra
The median family size in Palmyra is 3.07 persons per family, with married-couple families (351 | 68.4%) accounting for the largest median family size of 3.15 persons per family. On the other hand, single male/father families (105 | 20.5%) represent the smallest median family size with 2.85 persons per family.
| Family Type | # Families | Family Size |
| Married-Couple | 351 (68.4%) | 3.15 |
| Single Male/Father | 105 (20.5%) | 2.85 |
| Single Female/Mother | 57 (11.1%) | 2.96 |
| Total Families | 513 (100.0%) | 3.07 |
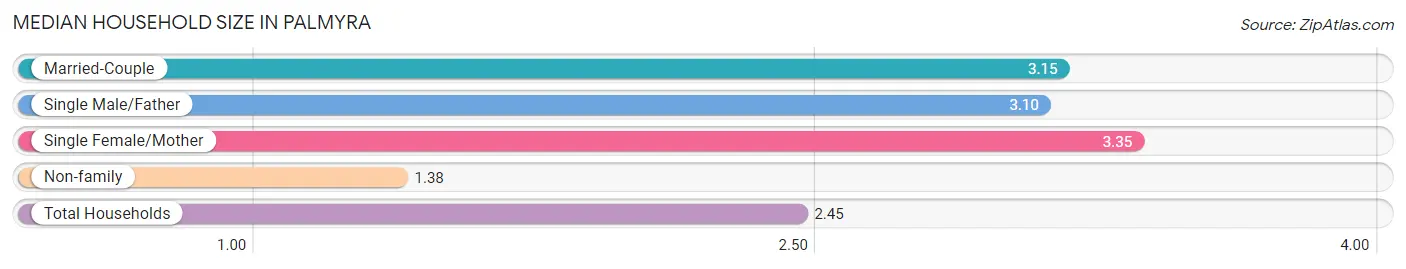
Median Household Size in Palmyra
The median household size in Palmyra is 2.45 persons per household, with single female/mother households (57 | 6.7%) accounting for the largest median household size of 3.35 persons per household. non-family households (343 | 40.1%) represent the smallest median household size with 1.38 persons per household.
| Household Type | # Households | Household Size |
| Married-Couple | 351 (41.0%) | 3.15 |
| Single Male/Father | 105 (12.3%) | 3.10 |
| Single Female/Mother | 57 (6.7%) | 3.35 |
| Non-family | 343 (40.1%) | 1.38 |
| Total Households | 856 (100.0%) | 2.45 |
Household Size by Marriage Status in Palmyra
Out of a total of 856 households in Palmyra, 513 (59.9%) are family households, while 343 (40.1%) are nonfamily households. The most numerous type of family households are 2-person households, comprising 269, and the most common type of nonfamily households are 1-person households, comprising 251.
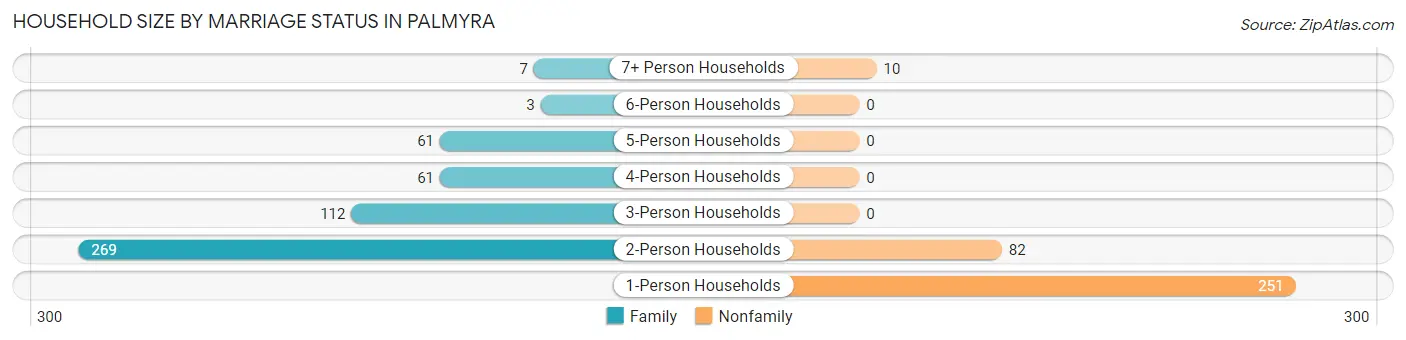
| Household Size | Family Households | Nonfamily Households |
| 1-Person Households | - | 251 (29.3%) |
| 2-Person Households | 269 (31.4%) | 82 (9.6%) |
| 3-Person Households | 112 (13.1%) | 0 (0.0%) |
| 4-Person Households | 61 (7.1%) | 0 (0.0%) |
| 5-Person Households | 61 (7.1%) | 0 (0.0%) |
| 6-Person Households | 3 (0.4%) | 0 (0.0%) |
| 7+ Person Households | 7 (0.8%) | 10 (1.2%) |
| Total | 513 (59.9%) | 343 (40.1%) |
Female Fertility in Palmyra
Fertility by Age in Palmyra
Average fertility rate in Palmyra is 90.0 births per 1,000 women. Women in the age bracket of 20 to 34 years have the highest fertility rate with 196.0 births per 1,000 women. Women in the age bracket of 20 to 34 years acount for 72.9% of all women with births.
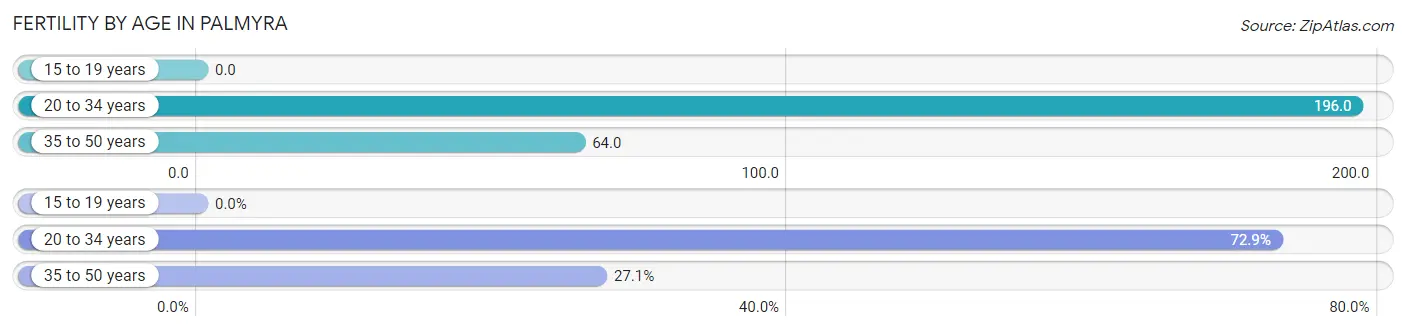
| Age Bracket | Women with Births | Births / 1,000 Women |
| 15 to 19 years | 0 (0.0%) | 0.0 |
| 20 to 34 years | 35 (72.9%) | 196.0 |
| 35 to 50 years | 13 (27.1%) | 64.0 |
| Total | 48 (100.0%) | 90.0 |
Fertility by Age by Marriage Status in Palmyra
93.8% of women with births (48) in Palmyra are married. The highest percentage of unmarried women with births falls into 20 to 34 years age bracket with 8.6% of them unmarried at the time of birth, while the lowest percentage of unmarried women with births belong to 35 to 50 years age bracket with 0.0% of them unmarried.
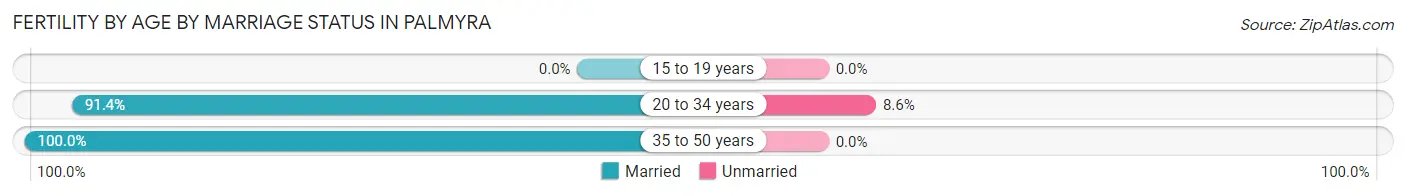
| Age Bracket | Married | Unmarried |
| 15 to 19 years | 0 (0.0%) | 0 (0.0%) |
| 20 to 34 years | 32 (91.4%) | 3 (8.6%) |
| 35 to 50 years | 13 (100.0%) | 0 (0.0%) |
| Total | 45 (93.8%) | 3 (6.2%) |
Fertility by Education in Palmyra
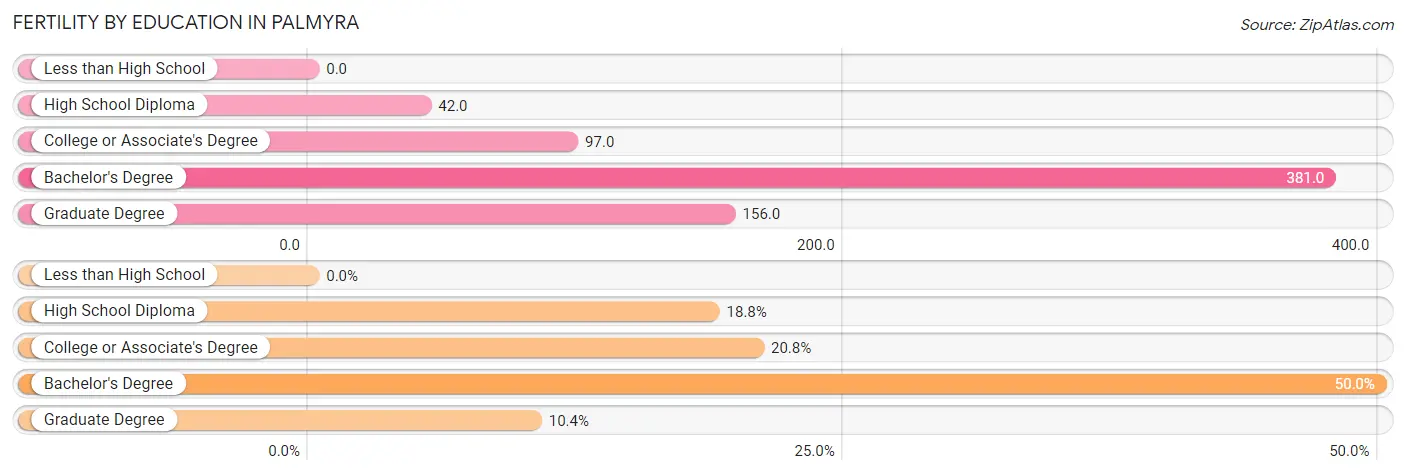
| Educational Attainment | Women with Births | Births / 1,000 Women |
| Less than High School | 0 (0.0%) | 0.0 |
| High School Diploma | 9 (18.8%) | 42.0 |
| College or Associate's Degree | 10 (20.8%) | 97.0 |
| Bachelor's Degree | 24 (50.0%) | 381.0 |
| Graduate Degree | 5 (10.4%) | 156.0 |
| Total | 48 (100.0%) | 90.0 |
Fertility by Education by Marriage Status in Palmyra
6.2% of women with births in Palmyra are unmarried. Women with the educational attainment of college or associate's degree are most likely to be married with 100.0% of them married at childbirth, while women with the educational attainment of high school diploma are least likely to be married with 33.3% of them unmarried at childbirth.
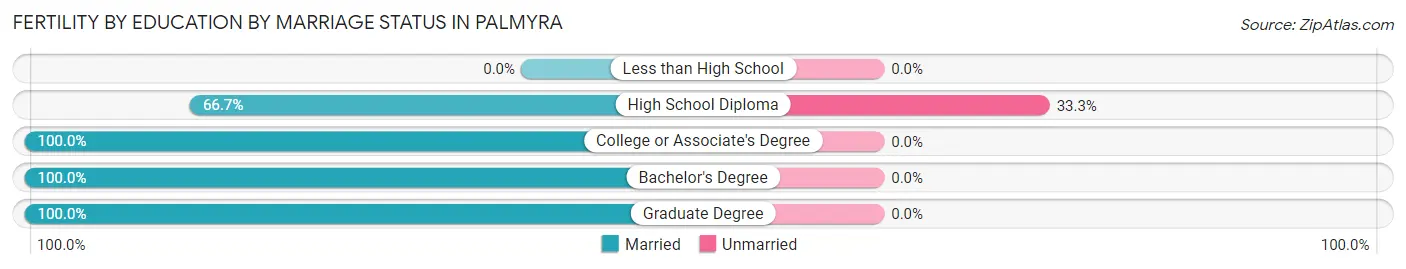
| Educational Attainment | Married | Unmarried |
| Less than High School | 0 (0.0%) | 0 (0.0%) |
| High School Diploma | 6 (66.7%) | 3 (33.3%) |
| College or Associate's Degree | 10 (100.0%) | 0 (0.0%) |
| Bachelor's Degree | 24 (100.0%) | 0 (0.0%) |
| Graduate Degree | 5 (100.0%) | 0 (0.0%) |
| Total | 45 (93.8%) | 3 (6.2%) |
Employment Characteristics in Palmyra
Employment by Class of Employer in Palmyra
Among the 1,166 employed individuals in Palmyra, private company employees (924 | 79.2%), local government employees (122 | 10.5%), and not-for-profit organizations (62 | 5.3%) make up the most common classes of employment.
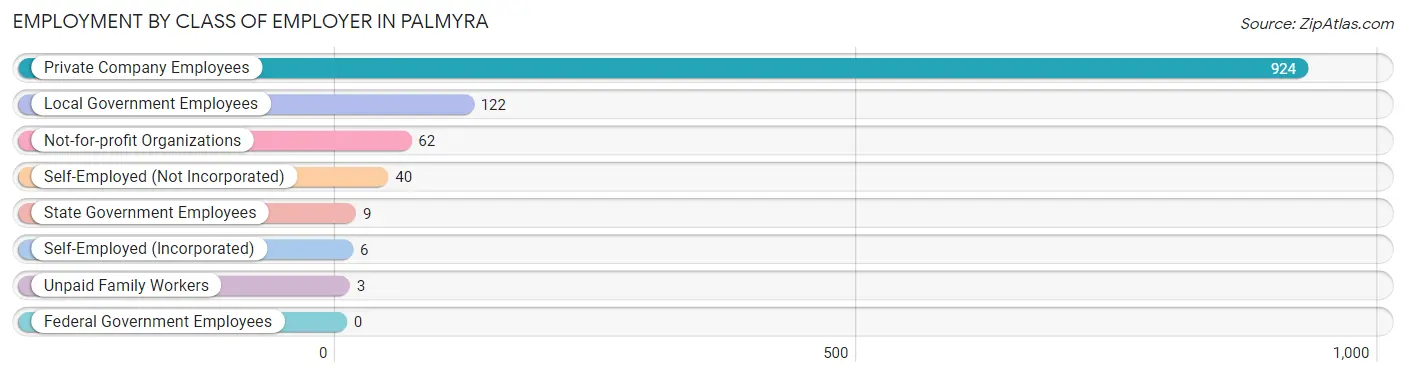
| Employer Class | # Employees | % Employees |
| Private Company Employees | 924 | 79.2% |
| Self-Employed (Incorporated) | 6 | 0.5% |
| Self-Employed (Not Incorporated) | 40 | 3.4% |
| Not-for-profit Organizations | 62 | 5.3% |
| Local Government Employees | 122 | 10.5% |
| State Government Employees | 9 | 0.8% |
| Federal Government Employees | 0 | 0.0% |
| Unpaid Family Workers | 3 | 0.3% |
| Total | 1,166 | 100.0% |
Employment Status by Age in Palmyra
According to the labor force statistics for Palmyra, out of the total population over 16 years of age (1,791), 68.0% or 1,218 individuals are in the labor force, with 3.5% or 43 of them unemployed. The age group with the highest labor force participation rate is 30 to 34 years, with 92.2% or 47 individuals in the labor force. Within the labor force, the 75 years and over age range has the highest percentage of unemployed individuals, with 14.3% or 1 of them being unemployed.
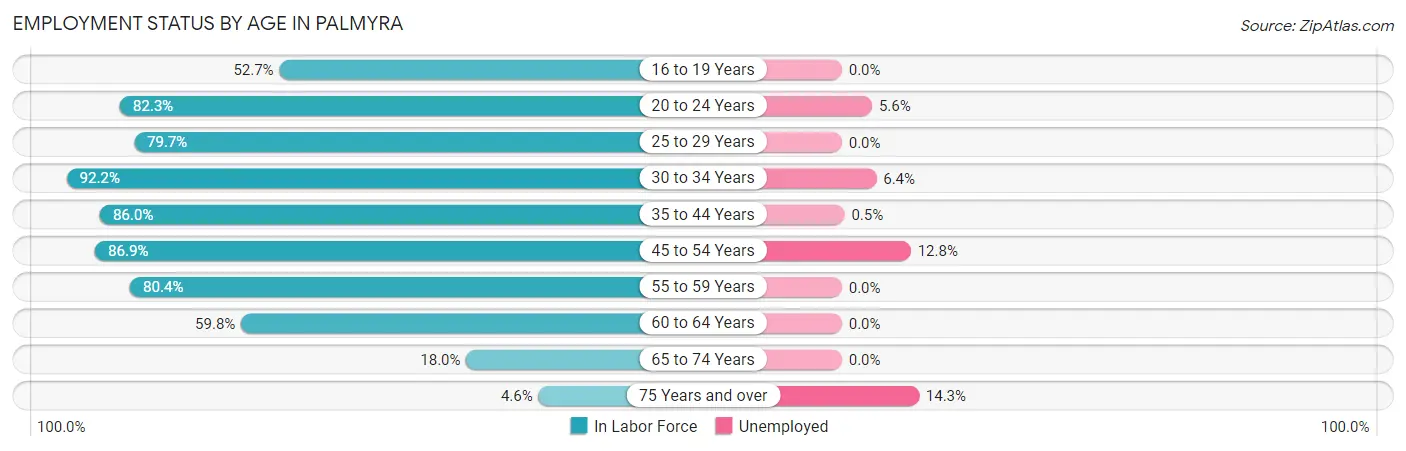
| Age Bracket | In Labor Force | Unemployed |
| 16 to 19 Years | 77 (52.7%) | 0 (0.0%) |
| 20 to 24 Years | 144 (82.3%) | 8 (5.6%) |
| 25 to 29 Years | 114 (79.7%) | 0 (0.0%) |
| 30 to 34 Years | 47 (92.2%) | 3 (6.4%) |
| 35 to 44 Years | 398 (86.0%) | 2 (0.5%) |
| 45 to 54 Years | 219 (86.9%) | 28 (12.8%) |
| 55 to 59 Years | 111 (80.4%) | 0 (0.0%) |
| 60 to 64 Years | 73 (59.8%) | 0 (0.0%) |
| 65 to 74 Years | 27 (18.0%) | 0 (0.0%) |
| 75 Years and over | 7 (4.6%) | 1 (14.3%) |
| Total | 1,218 (68.0%) | 43 (3.5%) |
Employment Status by Educational Attainment in Palmyra
According to labor force statistics for Palmyra, 82.3% of individuals (962) out of the total population between 25 and 64 years of age (1,169) are in the labor force, with 3.4% or 33 of them being unemployed. The group with the highest labor force participation rate are those with the educational attainment of bachelor's degree or higher, with 86.6% or 168 individuals in the labor force. Within the labor force, individuals with high school diploma education have the highest percentage of unemployment, with 6.8% or 31 of them being unemployed.
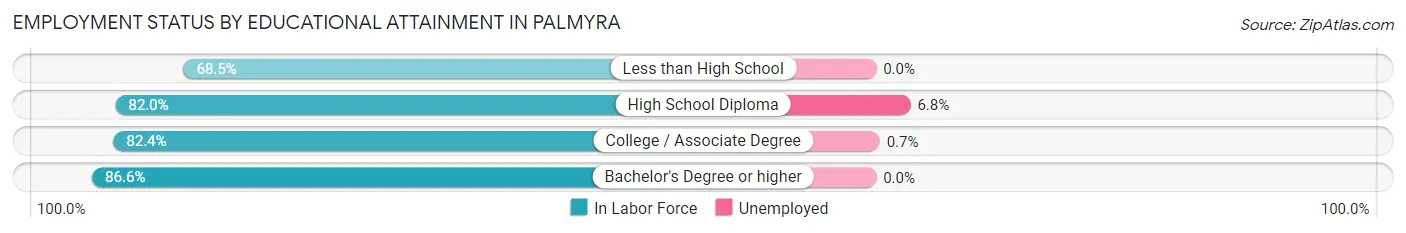
| Educational Attainment | In Labor Force | Unemployed |
| Less than High School | 37 (68.5%) | 0 (0.0%) |
| High School Diploma | 457 (82.0%) | 38 (6.8%) |
| College / Associate Degree | 300 (82.4%) | 3 (0.7%) |
| Bachelor's Degree or higher | 168 (86.6%) | 0 (0.0%) |
| Total | 962 (82.3%) | 40 (3.4%) |
Employment Occupations by Sex in Palmyra
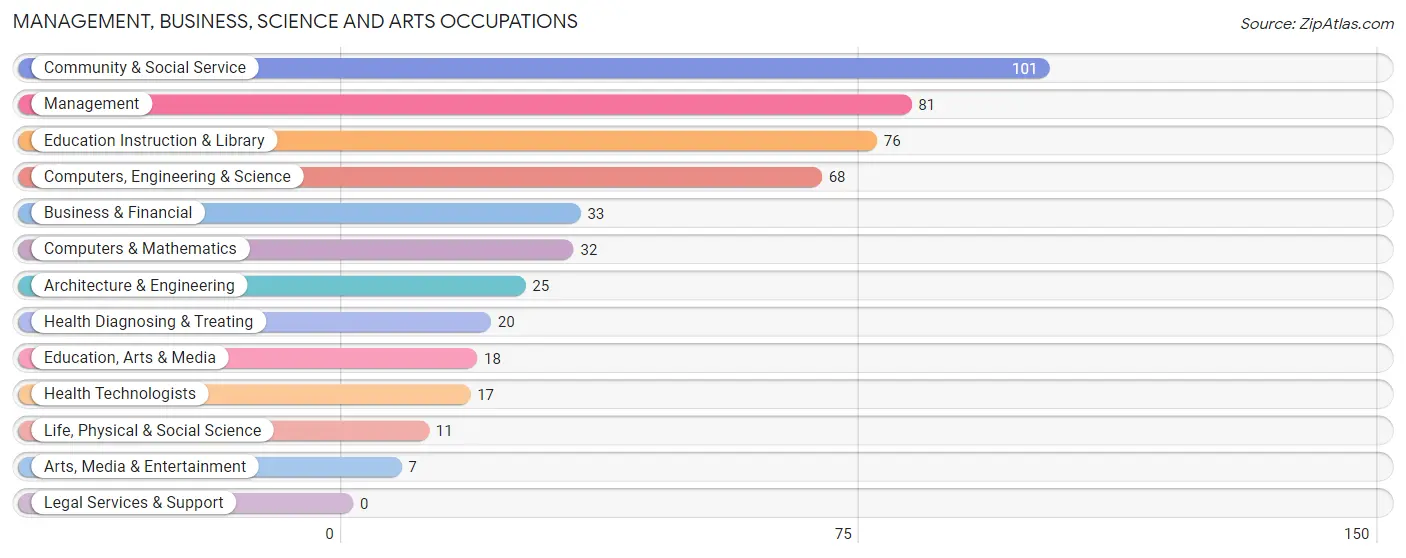
Management, Business, Science and Arts Occupations
The most common Management, Business, Science and Arts occupations in Palmyra are Community & Social Service (101 | 8.6%), Management (81 | 6.9%), Education Instruction & Library (76 | 6.5%), Computers, Engineering & Science (68 | 5.8%), and Business & Financial (33 | 2.8%).
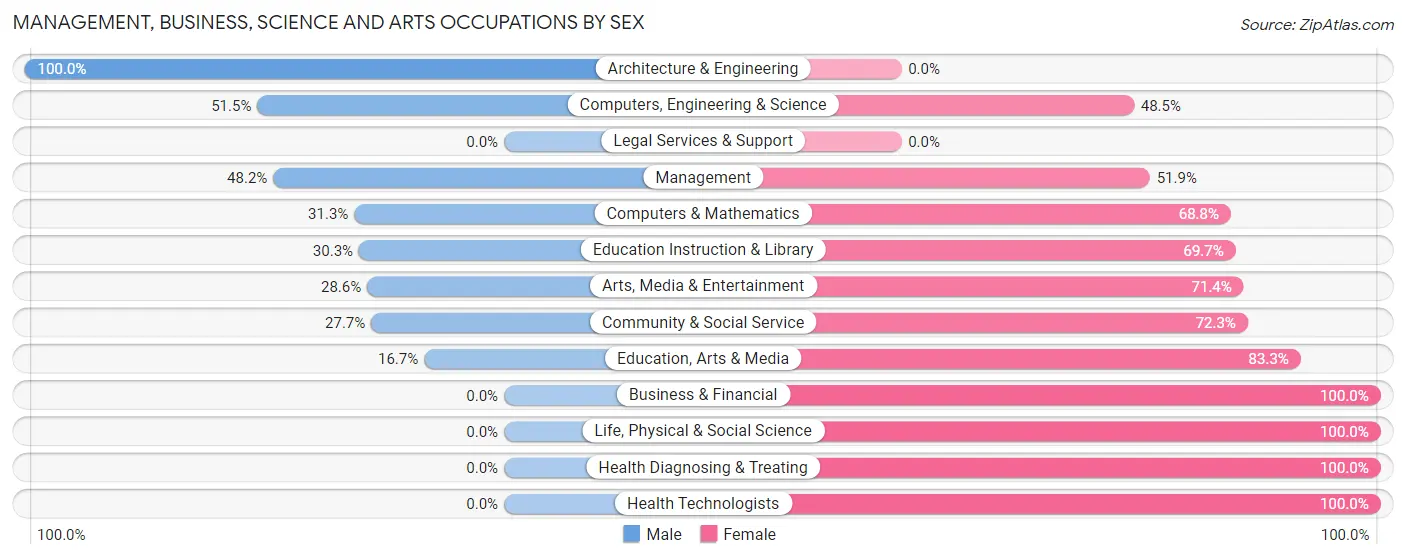
Management, Business, Science and Arts Occupations by Sex
Within the Management, Business, Science and Arts occupations in Palmyra, the most male-oriented occupations are Architecture & Engineering (100.0%), Computers, Engineering & Science (51.5%), and Management (48.1%), while the most female-oriented occupations are Business & Financial (100.0%), Life, Physical & Social Science (100.0%), and Health Diagnosing & Treating (100.0%).
| Occupation | Male | Female |
| Management | 39 (48.1%) | 42 (51.8%) |
| Business & Financial | 0 (0.0%) | 33 (100.0%) |
| Computers, Engineering & Science | 35 (51.5%) | 33 (48.5%) |
| Computers & Mathematics | 10 (31.2%) | 22 (68.8%) |
| Architecture & Engineering | 25 (100.0%) | 0 (0.0%) |
| Life, Physical & Social Science | 0 (0.0%) | 11 (100.0%) |
| Community & Social Service | 28 (27.7%) | 73 (72.3%) |
| Education, Arts & Media | 3 (16.7%) | 15 (83.3%) |
| Legal Services & Support | 0 (0.0%) | 0 (0.0%) |
| Education Instruction & Library | 23 (30.3%) | 53 (69.7%) |
| Arts, Media & Entertainment | 2 (28.6%) | 5 (71.4%) |
| Health Diagnosing & Treating | 0 (0.0%) | 20 (100.0%) |
| Health Technologists | 0 (0.0%) | 17 (100.0%) |
| Total (Category) | 102 (33.7%) | 201 (66.3%) |
| Total (Overall) | 707 (60.2%) | 468 (39.8%) |
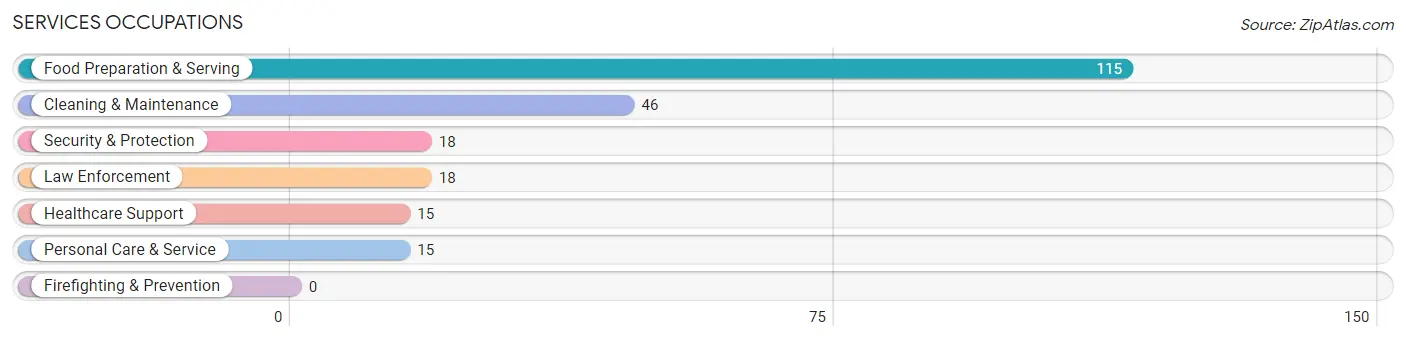
Services Occupations
The most common Services occupations in Palmyra are Food Preparation & Serving (115 | 9.8%), Cleaning & Maintenance (46 | 3.9%), Security & Protection (18 | 1.5%), Law Enforcement (18 | 1.5%), and Healthcare Support (15 | 1.3%).
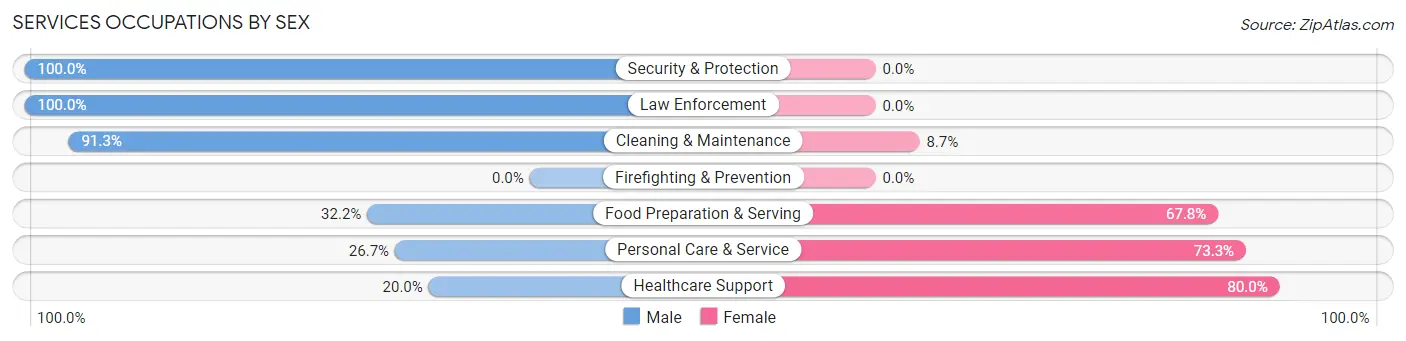
Services Occupations by Sex
Within the Services occupations in Palmyra, the most male-oriented occupations are Security & Protection (100.0%), Law Enforcement (100.0%), and Cleaning & Maintenance (91.3%), while the most female-oriented occupations are Healthcare Support (80.0%), Personal Care & Service (73.3%), and Food Preparation & Serving (67.8%).
| Occupation | Male | Female |
| Healthcare Support | 3 (20.0%) | 12 (80.0%) |
| Security & Protection | 18 (100.0%) | 0 (0.0%) |
| Firefighting & Prevention | 0 (0.0%) | 0 (0.0%) |
| Law Enforcement | 18 (100.0%) | 0 (0.0%) |
| Food Preparation & Serving | 37 (32.2%) | 78 (67.8%) |
| Cleaning & Maintenance | 42 (91.3%) | 4 (8.7%) |
| Personal Care & Service | 4 (26.7%) | 11 (73.3%) |
| Total (Category) | 104 (49.8%) | 105 (50.2%) |
| Total (Overall) | 707 (60.2%) | 468 (39.8%) |
Sales and Office Occupations
The most common Sales and Office occupations in Palmyra are Office & Administration (107 | 9.1%), and Sales & Related (38 | 3.2%).

Sales and Office Occupations by Sex
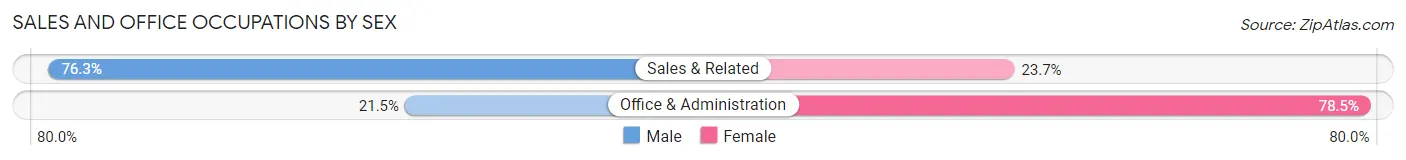
| Occupation | Male | Female |
| Sales & Related | 29 (76.3%) | 9 (23.7%) |
| Office & Administration | 23 (21.5%) | 84 (78.5%) |
| Total (Category) | 52 (35.9%) | 93 (64.1%) |
| Total (Overall) | 707 (60.2%) | 468 (39.8%) |
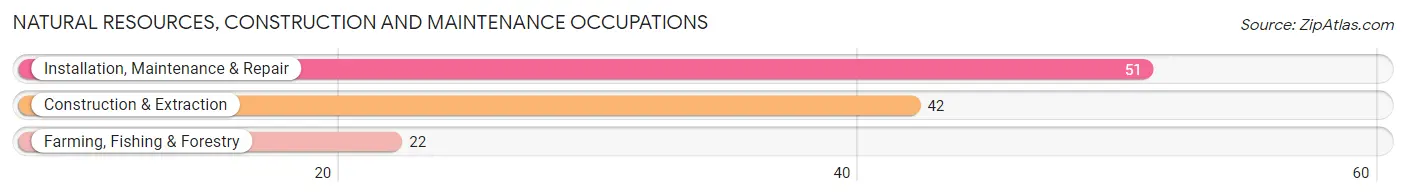
Natural Resources, Construction and Maintenance Occupations
The most common Natural Resources, Construction and Maintenance occupations in Palmyra are Installation, Maintenance & Repair (51 | 4.3%), Construction & Extraction (42 | 3.6%), and Farming, Fishing & Forestry (22 | 1.9%).
Natural Resources, Construction and Maintenance Occupations by Sex
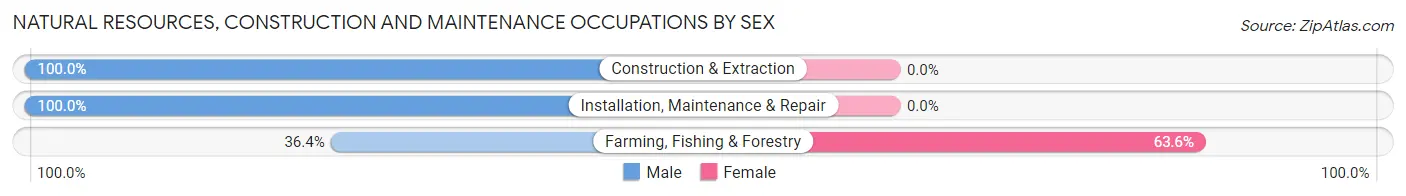
| Occupation | Male | Female |
| Farming, Fishing & Forestry | 8 (36.4%) | 14 (63.6%) |
| Construction & Extraction | 42 (100.0%) | 0 (0.0%) |
| Installation, Maintenance & Repair | 51 (100.0%) | 0 (0.0%) |
| Total (Category) | 101 (87.8%) | 14 (12.2%) |
| Total (Overall) | 707 (60.2%) | 468 (39.8%) |
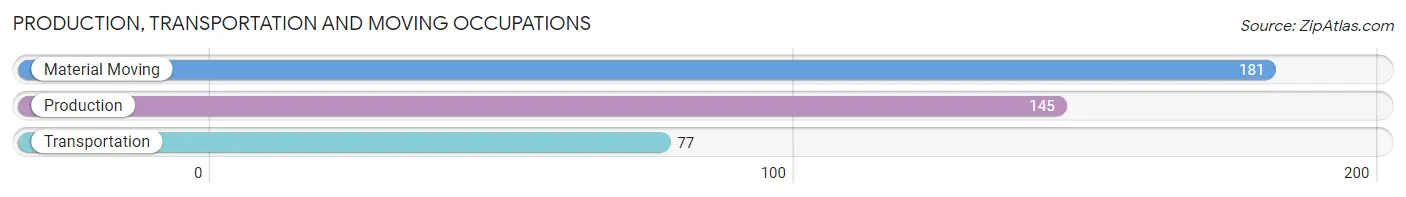
Production, Transportation and Moving Occupations
The most common Production, Transportation and Moving occupations in Palmyra are Material Moving (181 | 15.4%), Production (145 | 12.3%), and Transportation (77 | 6.6%).
Production, Transportation and Moving Occupations by Sex
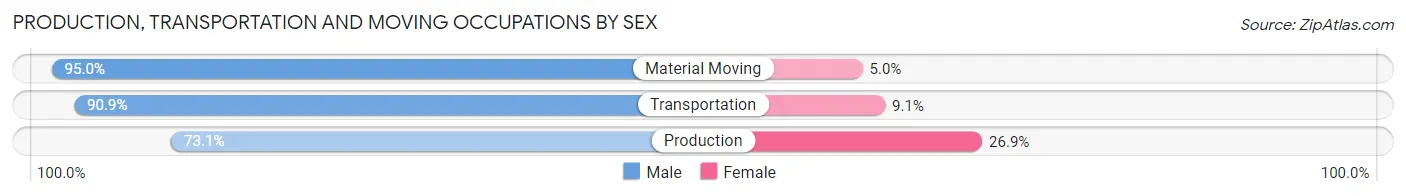
| Occupation | Male | Female |
| Production | 106 (73.1%) | 39 (26.9%) |
| Transportation | 70 (90.9%) | 7 (9.1%) |
| Material Moving | 172 (95.0%) | 9 (5.0%) |
| Total (Category) | 348 (86.4%) | 55 (13.7%) |
| Total (Overall) | 707 (60.2%) | 468 (39.8%) |
Employment Industries by Sex in Palmyra
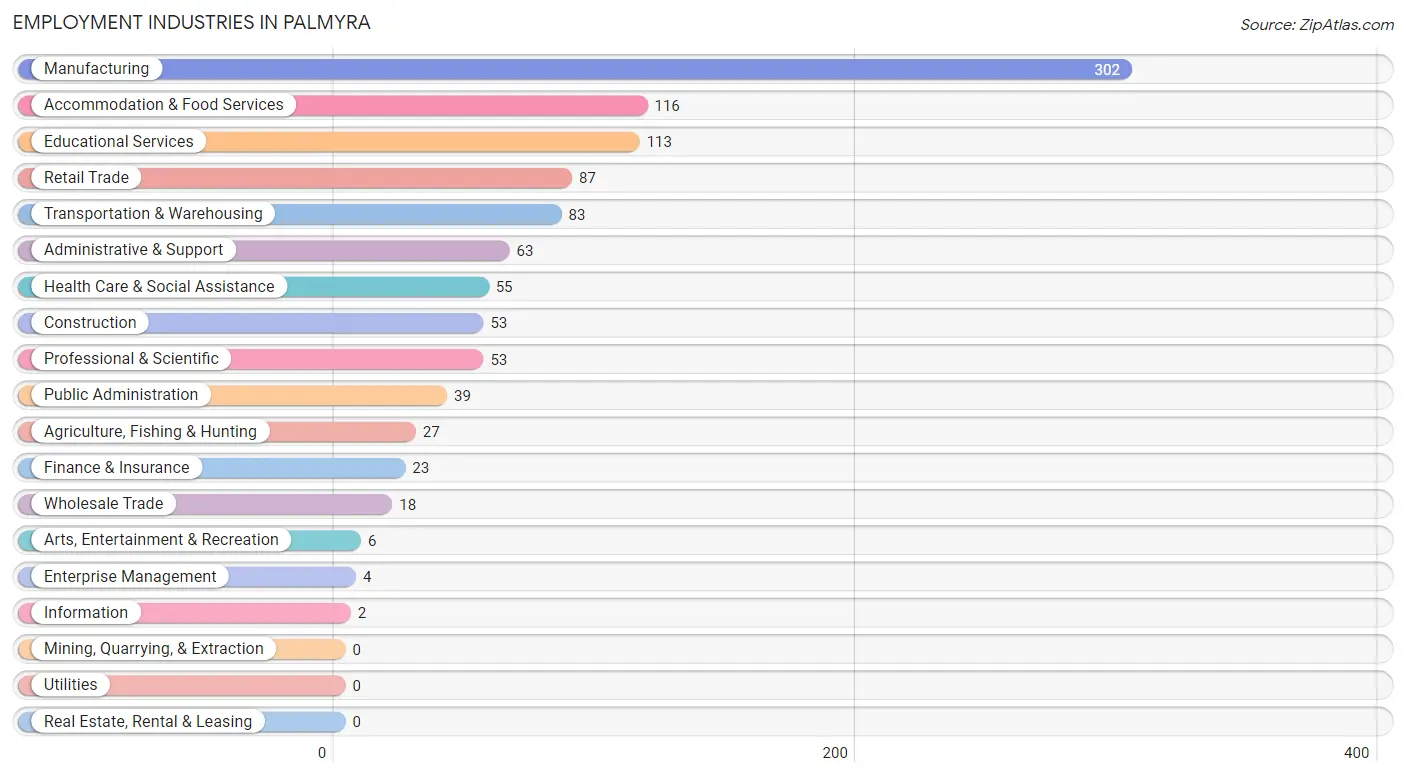
Employment Industries in Palmyra
The major employment industries in Palmyra include Manufacturing (302 | 25.7%), Accommodation & Food Services (116 | 9.9%), Educational Services (113 | 9.6%), Retail Trade (87 | 7.4%), and Transportation & Warehousing (83 | 7.1%).
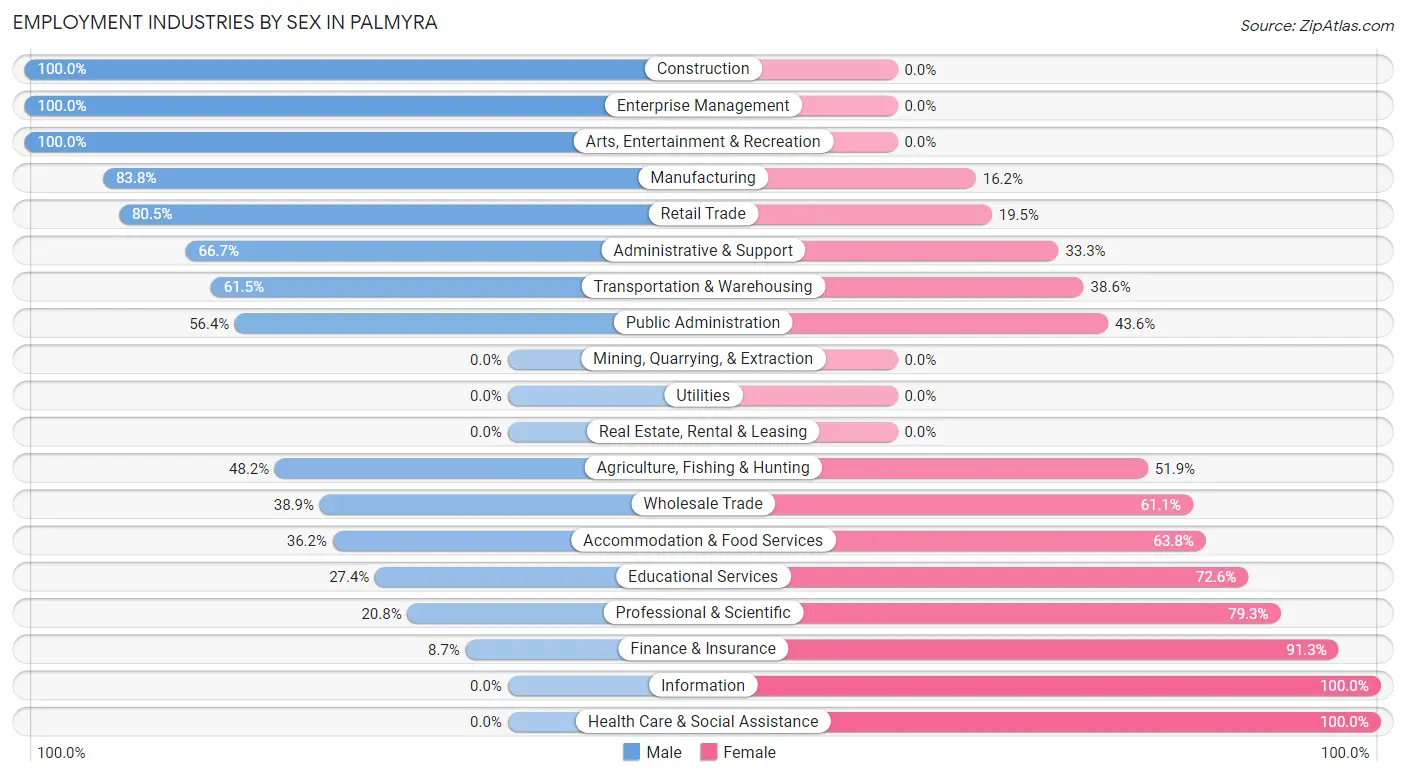
Employment Industries by Sex in Palmyra
The Palmyra industries that see more men than women are Construction (100.0%), Enterprise Management (100.0%), and Arts, Entertainment & Recreation (100.0%), whereas the industries that tend to have a higher number of women are Information (100.0%), Health Care & Social Assistance (100.0%), and Finance & Insurance (91.3%).
| Industry | Male | Female |
| Agriculture, Fishing & Hunting | 13 (48.1%) | 14 (51.8%) |
| Mining, Quarrying, & Extraction | 0 (0.0%) | 0 (0.0%) |
| Construction | 53 (100.0%) | 0 (0.0%) |
| Manufacturing | 253 (83.8%) | 49 (16.2%) |
| Wholesale Trade | 7 (38.9%) | 11 (61.1%) |
| Retail Trade | 70 (80.5%) | 17 (19.5%) |
| Transportation & Warehousing | 51 (61.5%) | 32 (38.6%) |
| Utilities | 0 (0.0%) | 0 (0.0%) |
| Information | 0 (0.0%) | 2 (100.0%) |
| Finance & Insurance | 2 (8.7%) | 21 (91.3%) |
| Real Estate, Rental & Leasing | 0 (0.0%) | 0 (0.0%) |
| Professional & Scientific | 11 (20.7%) | 42 (79.2%) |
| Enterprise Management | 4 (100.0%) | 0 (0.0%) |
| Administrative & Support | 42 (66.7%) | 21 (33.3%) |
| Educational Services | 31 (27.4%) | 82 (72.6%) |
| Health Care & Social Assistance | 0 (0.0%) | 55 (100.0%) |
| Arts, Entertainment & Recreation | 6 (100.0%) | 0 (0.0%) |
| Accommodation & Food Services | 42 (36.2%) | 74 (63.8%) |
| Public Administration | 22 (56.4%) | 17 (43.6%) |
| Total | 707 (60.2%) | 468 (39.8%) |
Education in Palmyra
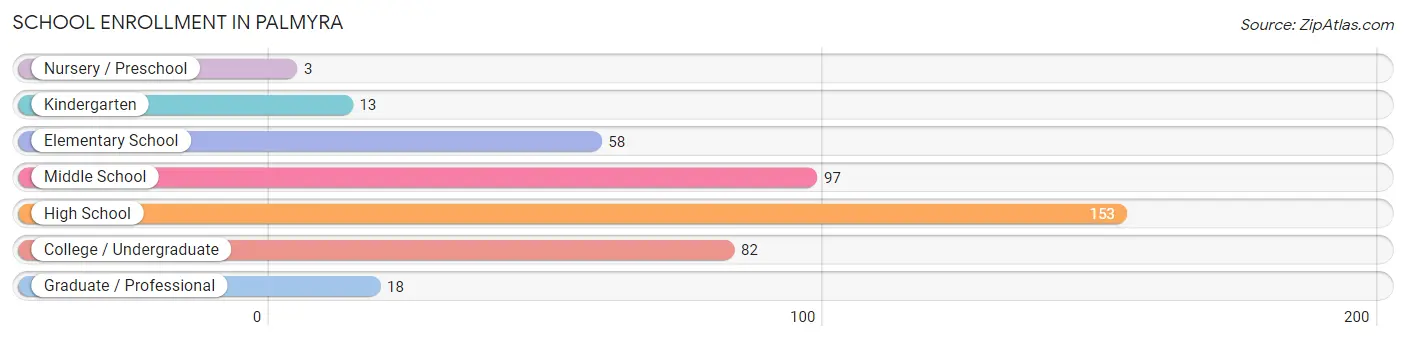
School Enrollment in Palmyra
The most common levels of schooling among the 424 students in Palmyra are high school (153 | 36.1%), middle school (97 | 22.9%), and college / undergraduate (82 | 19.3%).
| School Level | # Students | % Students |
| Nursery / Preschool | 3 | 0.7% |
| Kindergarten | 13 | 3.1% |
| Elementary School | 58 | 13.7% |
| Middle School | 97 | 22.9% |
| High School | 153 | 36.1% |
| College / Undergraduate | 82 | 19.3% |
| Graduate / Professional | 18 | 4.3% |
| Total | 424 | 100.0% |
School Enrollment by Age by Funding Source in Palmyra
Out of a total of 424 students who are enrolled in schools in Palmyra, 18 (4.2%) attend a private institution, while the remaining 406 (95.8%) are enrolled in public schools. The age group of 25 to 34 year olds has the highest likelihood of being enrolled in private schools, with 7 (31.8% in the age bracket) enrolled. Conversely, the age group of 3 to 4 year olds has the lowest likelihood of being enrolled in a private school, with 3 (100.0% in the age bracket) attending a public institution.
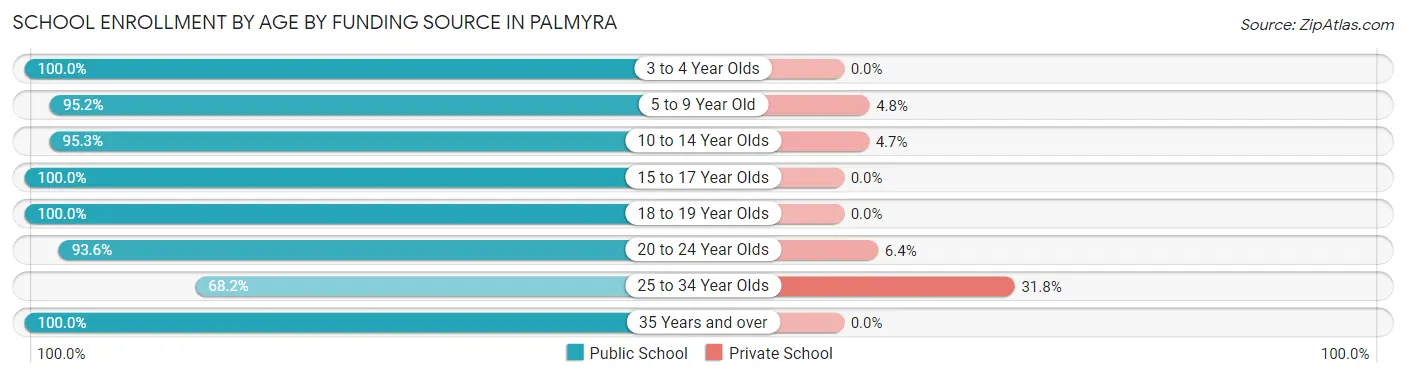
| Age Bracket | Public School | Private School |
| 3 to 4 Year Olds | 3 (100.0%) | 0 (0.0%) |
| 5 to 9 Year Old | 60 (95.2%) | 3 (4.8%) |
| 10 to 14 Year Olds | 102 (95.3%) | 5 (4.7%) |
| 15 to 17 Year Olds | 140 (100.0%) | 0 (0.0%) |
| 18 to 19 Year Olds | 32 (100.0%) | 0 (0.0%) |
| 20 to 24 Year Olds | 44 (93.6%) | 3 (6.4%) |
| 25 to 34 Year Olds | 15 (68.2%) | 7 (31.8%) |
| 35 Years and over | 10 (100.0%) | 0 (0.0%) |
| Total | 406 (95.8%) | 18 (4.2%) |
Educational Attainment by Field of Study in Palmyra
Education (87 | 37.0%), business (30 | 12.8%), arts & humanities (27 | 11.5%), computers & mathematics (21 | 8.9%), and social sciences (20 | 8.5%) are the most common fields of study among 235 individuals in Palmyra who have obtained a bachelor's degree or higher.
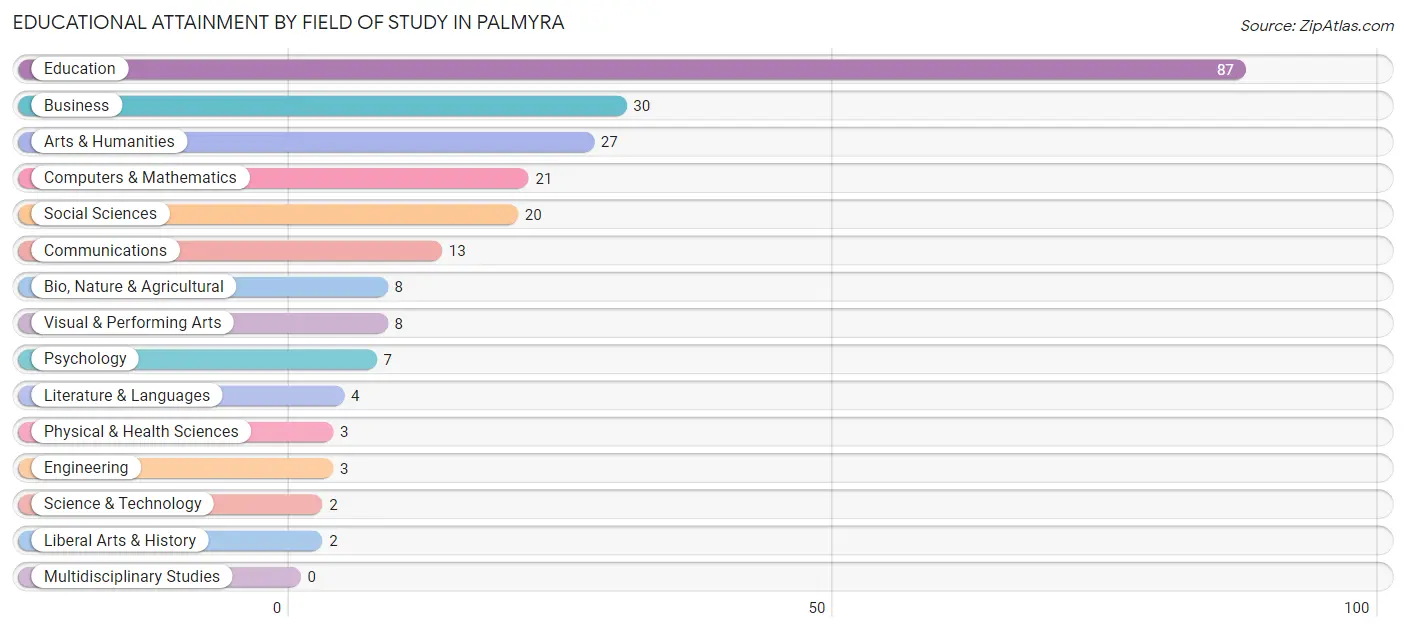
| Field of Study | # Graduates | % Graduates |
| Computers & Mathematics | 21 | 8.9% |
| Bio, Nature & Agricultural | 8 | 3.4% |
| Physical & Health Sciences | 3 | 1.3% |
| Psychology | 7 | 3.0% |
| Social Sciences | 20 | 8.5% |
| Engineering | 3 | 1.3% |
| Multidisciplinary Studies | 0 | 0.0% |
| Science & Technology | 2 | 0.9% |
| Business | 30 | 12.8% |
| Education | 87 | 37.0% |
| Literature & Languages | 4 | 1.7% |
| Liberal Arts & History | 2 | 0.9% |
| Visual & Performing Arts | 8 | 3.4% |
| Communications | 13 | 5.5% |
| Arts & Humanities | 27 | 11.5% |
| Total | 235 | 100.0% |
Transportation & Commute in Palmyra
Vehicle Availability by Sex in Palmyra
The most prevalent vehicle ownership categories in Palmyra are males with 2 vehicles (269, accounting for 38.5%) and females with 2 vehicles (233, making up 57.5%).
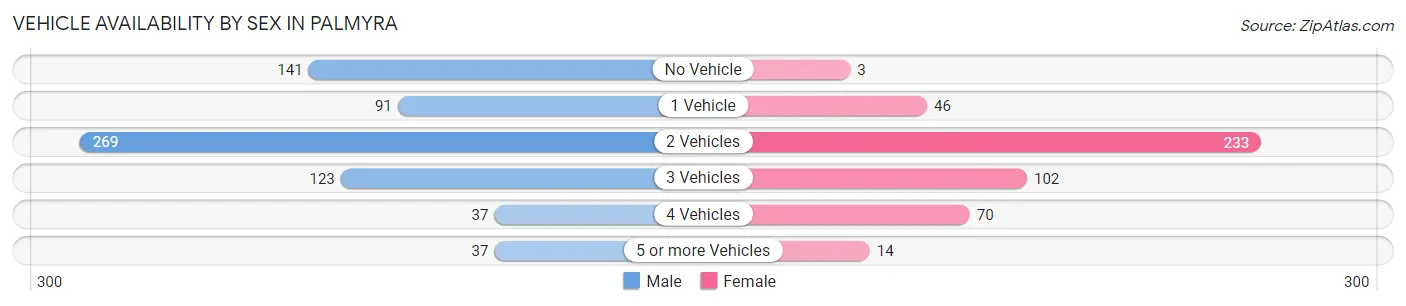
| Vehicles Available | Male | Female |
| No Vehicle | 141 (20.2%) | 3 (0.6%) |
| 1 Vehicle | 91 (13.0%) | 46 (9.8%) |
| 2 Vehicles | 269 (38.5%) | 233 (49.8%) |
| 3 Vehicles | 123 (17.6%) | 102 (21.8%) |
| 4 Vehicles | 37 (5.3%) | 70 (15.0%) |
| 5 or more Vehicles | 37 (5.3%) | 14 (3.0%) |
| Total | 698 (100.0%) | 468 (100.0%) |
Commute Time in Palmyra
The most frequently occuring commute durations in Palmyra are 30 to 34 minutes (189 commuters, 16.6%), 40 to 44 minutes (186 commuters, 16.4%), and 20 to 24 minutes (138 commuters, 12.1%).
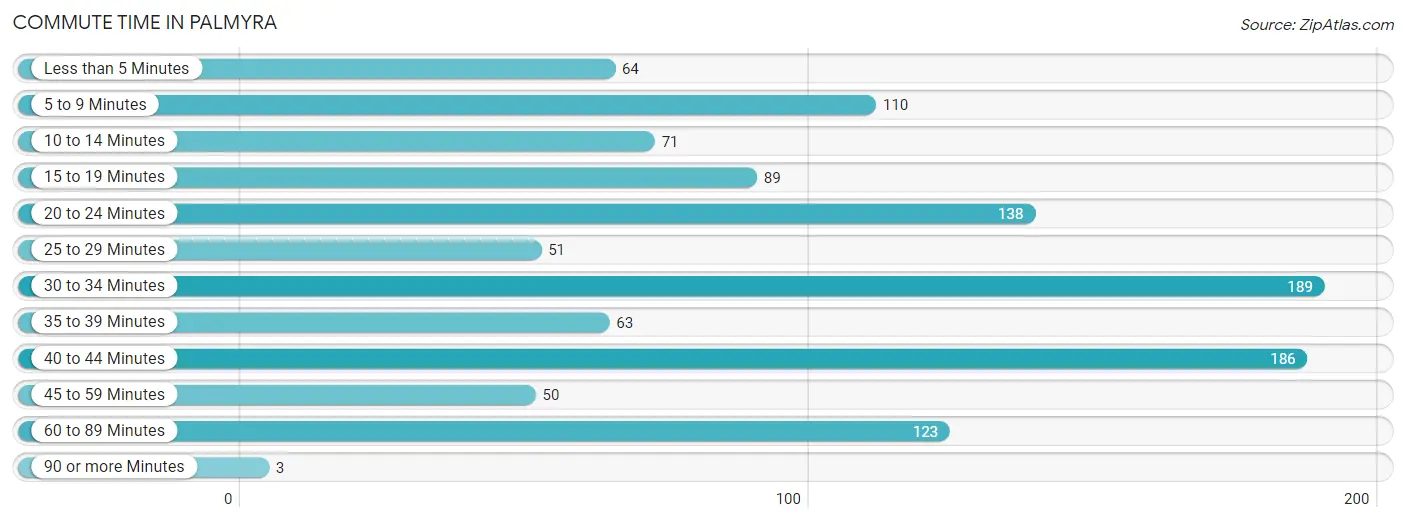
| Commute Time | # Commuters | % Commuters |
| Less than 5 Minutes | 64 | 5.6% |
| 5 to 9 Minutes | 110 | 9.7% |
| 10 to 14 Minutes | 71 | 6.2% |
| 15 to 19 Minutes | 89 | 7.8% |
| 20 to 24 Minutes | 138 | 12.1% |
| 25 to 29 Minutes | 51 | 4.5% |
| 30 to 34 Minutes | 189 | 16.6% |
| 35 to 39 Minutes | 63 | 5.5% |
| 40 to 44 Minutes | 186 | 16.4% |
| 45 to 59 Minutes | 50 | 4.4% |
| 60 to 89 Minutes | 123 | 10.8% |
| 90 or more Minutes | 3 | 0.3% |
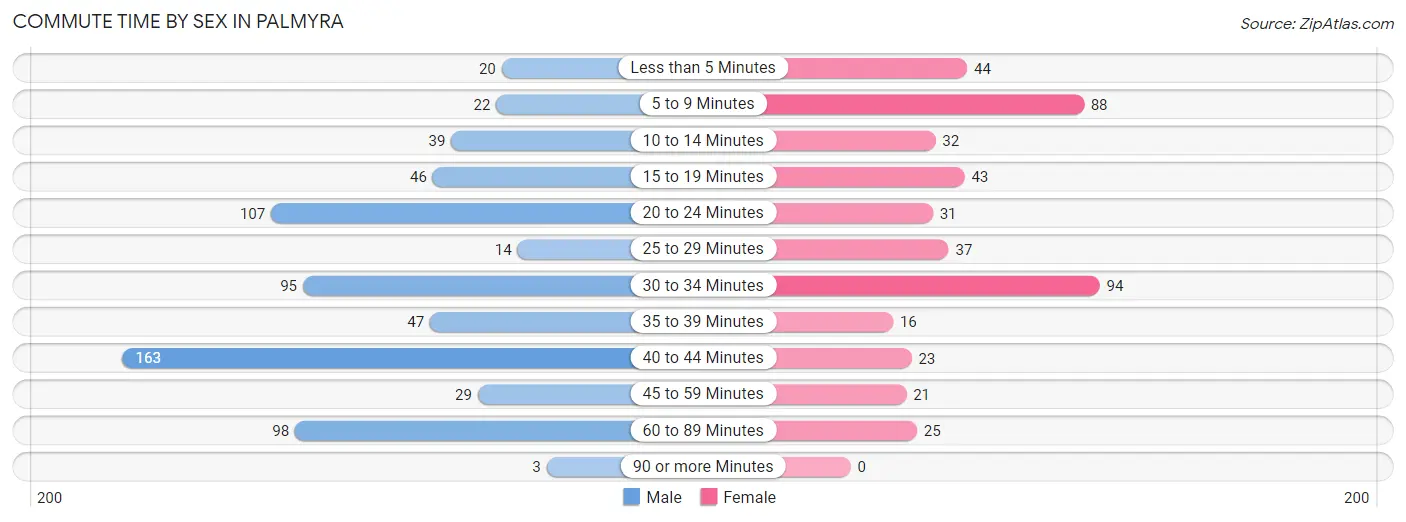
Commute Time by Sex in Palmyra
The most common commute times in Palmyra are 40 to 44 minutes (163 commuters, 23.9%) for males and 30 to 34 minutes (94 commuters, 20.7%) for females.
| Commute Time | Male | Female |
| Less than 5 Minutes | 20 (2.9%) | 44 (9.7%) |
| 5 to 9 Minutes | 22 (3.2%) | 88 (19.4%) |
| 10 to 14 Minutes | 39 (5.7%) | 32 (7.0%) |
| 15 to 19 Minutes | 46 (6.7%) | 43 (9.5%) |
| 20 to 24 Minutes | 107 (15.7%) | 31 (6.8%) |
| 25 to 29 Minutes | 14 (2.1%) | 37 (8.2%) |
| 30 to 34 Minutes | 95 (13.9%) | 94 (20.7%) |
| 35 to 39 Minutes | 47 (6.9%) | 16 (3.5%) |
| 40 to 44 Minutes | 163 (23.9%) | 23 (5.1%) |
| 45 to 59 Minutes | 29 (4.3%) | 21 (4.6%) |
| 60 to 89 Minutes | 98 (14.3%) | 25 (5.5%) |
| 90 or more Minutes | 3 (0.4%) | 0 (0.0%) |
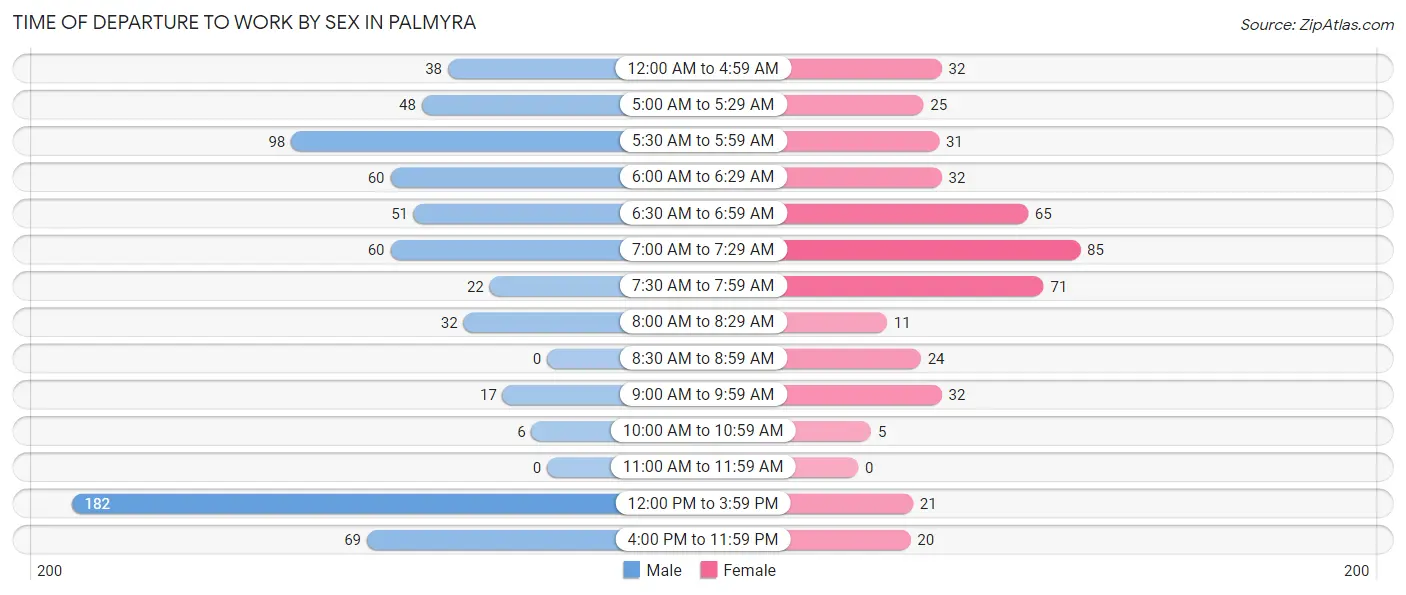
Time of Departure to Work by Sex in Palmyra
The most frequent times of departure to work in Palmyra are 12:00 PM to 3:59 PM (182, 26.7%) for males and 7:00 AM to 7:29 AM (85, 18.7%) for females.
| Time of Departure | Male | Female |
| 12:00 AM to 4:59 AM | 38 (5.6%) | 32 (7.0%) |
| 5:00 AM to 5:29 AM | 48 (7.0%) | 25 (5.5%) |
| 5:30 AM to 5:59 AM | 98 (14.3%) | 31 (6.8%) |
| 6:00 AM to 6:29 AM | 60 (8.8%) | 32 (7.0%) |
| 6:30 AM to 6:59 AM | 51 (7.5%) | 65 (14.3%) |
| 7:00 AM to 7:29 AM | 60 (8.8%) | 85 (18.7%) |
| 7:30 AM to 7:59 AM | 22 (3.2%) | 71 (15.6%) |
| 8:00 AM to 8:29 AM | 32 (4.7%) | 11 (2.4%) |
| 8:30 AM to 8:59 AM | 0 (0.0%) | 24 (5.3%) |
| 9:00 AM to 9:59 AM | 17 (2.5%) | 32 (7.0%) |
| 10:00 AM to 10:59 AM | 6 (0.9%) | 5 (1.1%) |
| 11:00 AM to 11:59 AM | 0 (0.0%) | 0 (0.0%) |
| 12:00 PM to 3:59 PM | 182 (26.7%) | 21 (4.6%) |
| 4:00 PM to 11:59 PM | 69 (10.1%) | 20 (4.4%) |
| Total | 683 (100.0%) | 454 (100.0%) |
Housing Occupancy in Palmyra
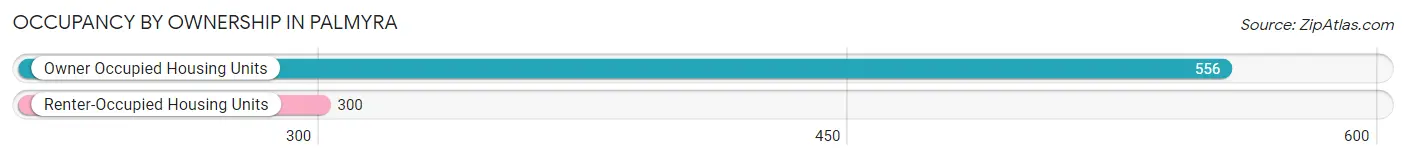
Occupancy by Ownership in Palmyra
Of the total 856 dwellings in Palmyra, owner-occupied units account for 556 (64.9%), while renter-occupied units make up 300 (35.0%).
| Occupancy | # Housing Units | % Housing Units |
| Owner Occupied Housing Units | 556 | 64.9% |
| Renter-Occupied Housing Units | 300 | 35.0% |
| Total Occupied Housing Units | 856 | 100.0% |
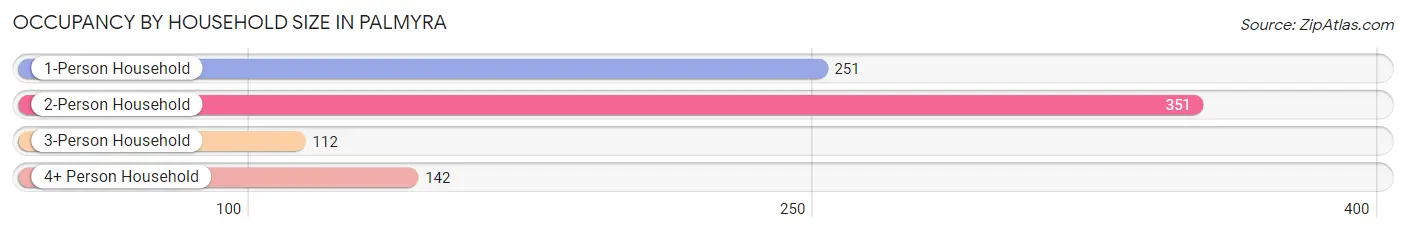
Occupancy by Household Size in Palmyra
| Household Size | # Housing Units | % Housing Units |
| 1-Person Household | 251 | 29.3% |
| 2-Person Household | 351 | 41.0% |
| 3-Person Household | 112 | 13.1% |
| 4+ Person Household | 142 | 16.6% |
| Total Housing Units | 856 | 100.0% |
Occupancy by Ownership by Household Size in Palmyra
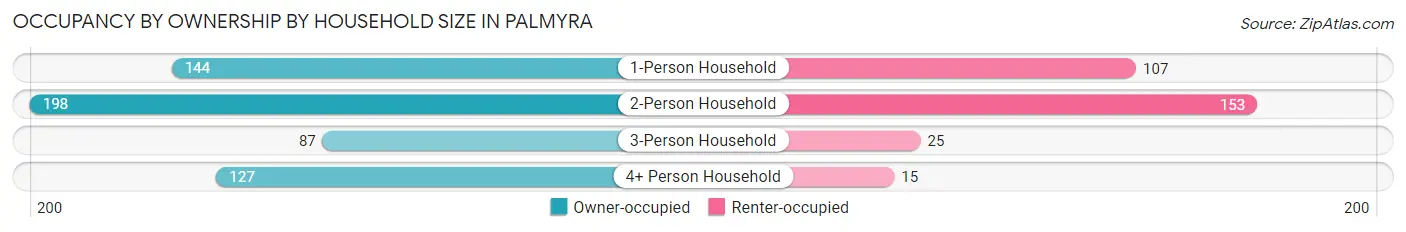
| Household Size | Owner-occupied | Renter-occupied |
| 1-Person Household | 144 (57.4%) | 107 (42.6%) |
| 2-Person Household | 198 (56.4%) | 153 (43.6%) |
| 3-Person Household | 87 (77.7%) | 25 (22.3%) |
| 4+ Person Household | 127 (89.4%) | 15 (10.6%) |
| Total Housing Units | 556 (64.9%) | 300 (35.0%) |
Occupancy by Educational Attainment in Palmyra
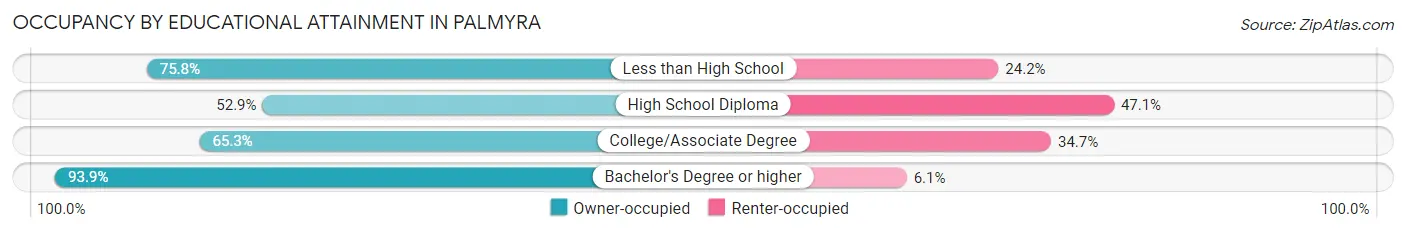
| Household Size | Owner-occupied | Renter-occupied |
| Less than High School | 50 (75.8%) | 16 (24.2%) |
| High School Diploma | 203 (52.9%) | 181 (47.1%) |
| College/Associate Degree | 179 (65.3%) | 95 (34.7%) |
| Bachelor's Degree or higher | 124 (93.9%) | 8 (6.1%) |
Occupancy by Age of Householder in Palmyra
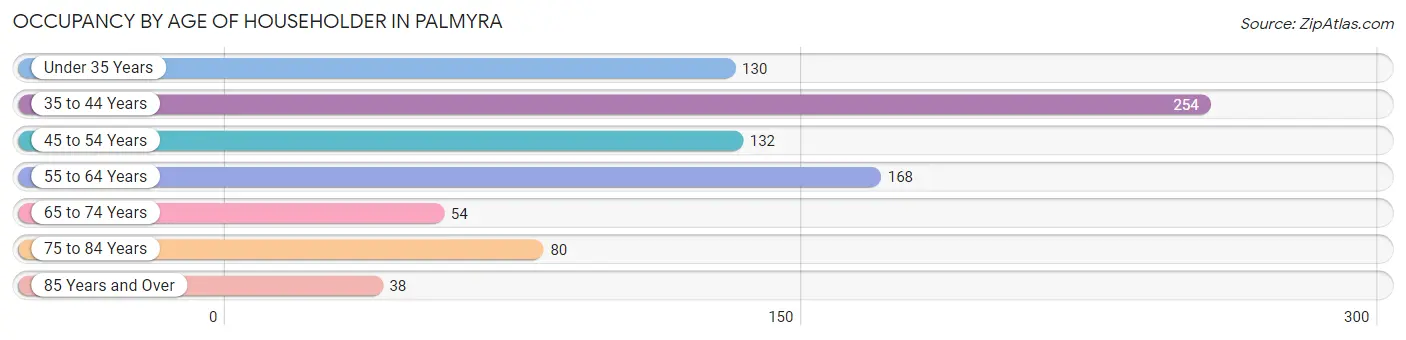
| Age Bracket | # Households | % Households |
| Under 35 Years | 130 | 15.2% |
| 35 to 44 Years | 254 | 29.7% |
| 45 to 54 Years | 132 | 15.4% |
| 55 to 64 Years | 168 | 19.6% |
| 65 to 74 Years | 54 | 6.3% |
| 75 to 84 Years | 80 | 9.3% |
| 85 Years and Over | 38 | 4.4% |
| Total | 856 | 100.0% |
Housing Finances in Palmyra
Median Income by Occupancy in Palmyra
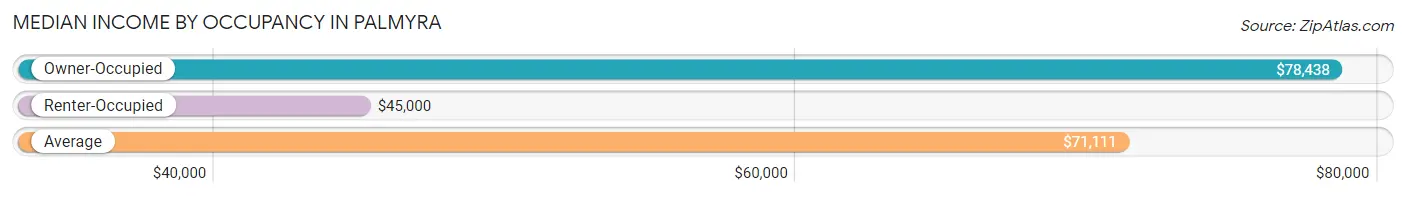
| Occupancy Type | # Households | Median Income |
| Owner-Occupied | 556 (64.9%) | $78,438 |
| Renter-Occupied | 300 (35.0%) | $45,000 |
| Average | 856 (100.0%) | $71,111 |
Occupancy by Householder Income Bracket in Palmyra
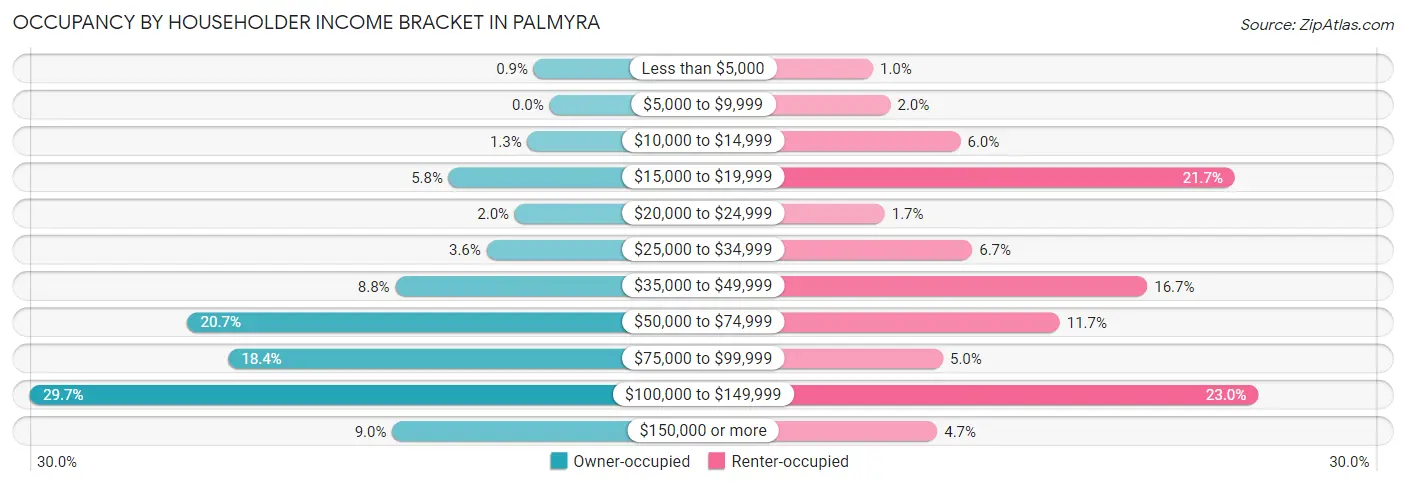
| Income Bracket | Owner-occupied | Renter-occupied |
| Less than $5,000 | 5 (0.9%) | 3 (1.0%) |
| $5,000 to $9,999 | 0 (0.0%) | 6 (2.0%) |
| $10,000 to $14,999 | 7 (1.3%) | 18 (6.0%) |
| $15,000 to $19,999 | 32 (5.8%) | 65 (21.7%) |
| $20,000 to $24,999 | 11 (2.0%) | 5 (1.7%) |
| $25,000 to $34,999 | 20 (3.6%) | 20 (6.7%) |
| $35,000 to $49,999 | 49 (8.8%) | 50 (16.7%) |
| $50,000 to $74,999 | 115 (20.7%) | 35 (11.7%) |
| $75,000 to $99,999 | 102 (18.3%) | 15 (5.0%) |
| $100,000 to $149,999 | 165 (29.7%) | 69 (23.0%) |
| $150,000 or more | 50 (9.0%) | 14 (4.7%) |
| Total | 556 (100.0%) | 300 (100.0%) |
Monthly Housing Cost Tiers in Palmyra
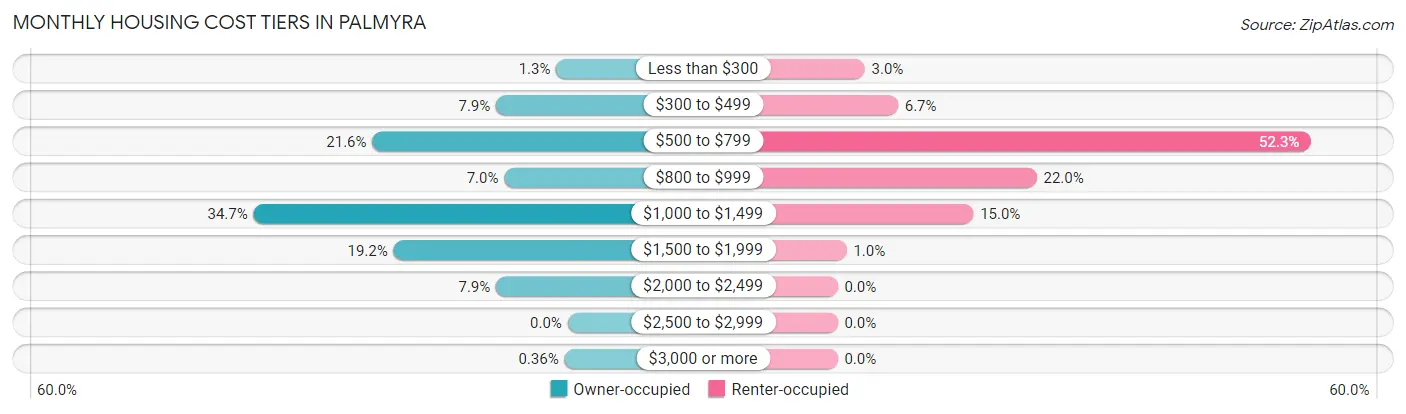
| Monthly Cost | Owner-occupied | Renter-occupied |
| Less than $300 | 7 (1.3%) | 9 (3.0%) |
| $300 to $499 | 44 (7.9%) | 20 (6.7%) |
| $500 to $799 | 120 (21.6%) | 157 (52.3%) |
| $800 to $999 | 39 (7.0%) | 66 (22.0%) |
| $1,000 to $1,499 | 193 (34.7%) | 45 (15.0%) |
| $1,500 to $1,999 | 107 (19.2%) | 3 (1.0%) |
| $2,000 to $2,499 | 44 (7.9%) | 0 (0.0%) |
| $2,500 to $2,999 | 0 (0.0%) | 0 (0.0%) |
| $3,000 or more | 2 (0.4%) | 0 (0.0%) |
| Total | 556 (100.0%) | 300 (100.0%) |
Physical Housing Characteristics in Palmyra
Housing Structures in Palmyra
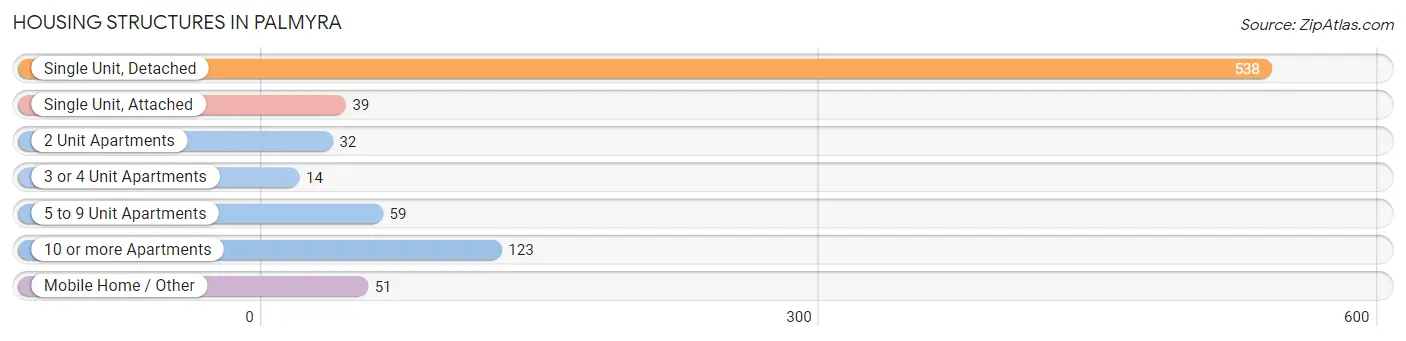
| Structure Type | # Housing Units | % Housing Units |
| Single Unit, Detached | 538 | 62.8% |
| Single Unit, Attached | 39 | 4.6% |
| 2 Unit Apartments | 32 | 3.7% |
| 3 or 4 Unit Apartments | 14 | 1.6% |
| 5 to 9 Unit Apartments | 59 | 6.9% |
| 10 or more Apartments | 123 | 14.4% |
| Mobile Home / Other | 51 | 6.0% |
| Total | 856 | 100.0% |
Housing Structures by Occupancy in Palmyra
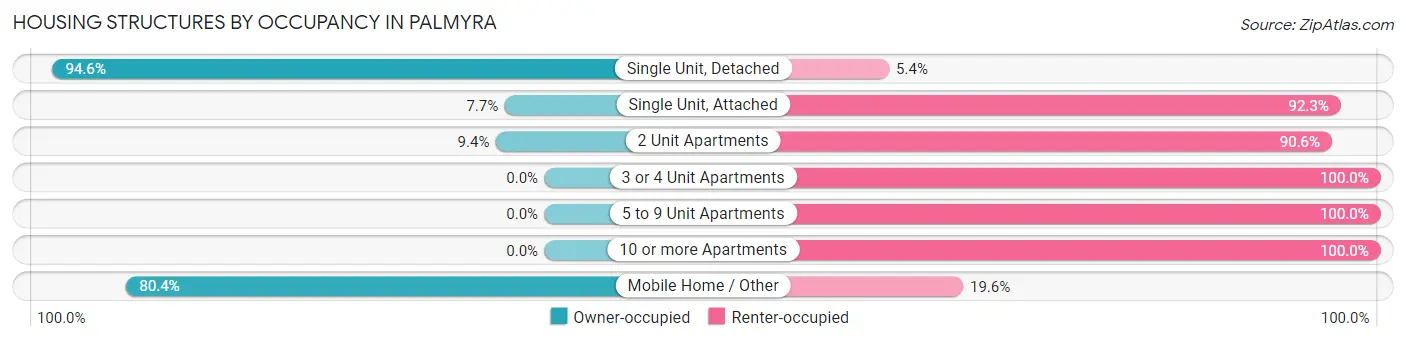
| Structure Type | Owner-occupied | Renter-occupied |
| Single Unit, Detached | 509 (94.6%) | 29 (5.4%) |
| Single Unit, Attached | 3 (7.7%) | 36 (92.3%) |
| 2 Unit Apartments | 3 (9.4%) | 29 (90.6%) |
| 3 or 4 Unit Apartments | 0 (0.0%) | 14 (100.0%) |
| 5 to 9 Unit Apartments | 0 (0.0%) | 59 (100.0%) |
| 10 or more Apartments | 0 (0.0%) | 123 (100.0%) |
| Mobile Home / Other | 41 (80.4%) | 10 (19.6%) |
| Total | 556 (64.9%) | 300 (35.0%) |
Housing Structures by Number of Rooms in Palmyra
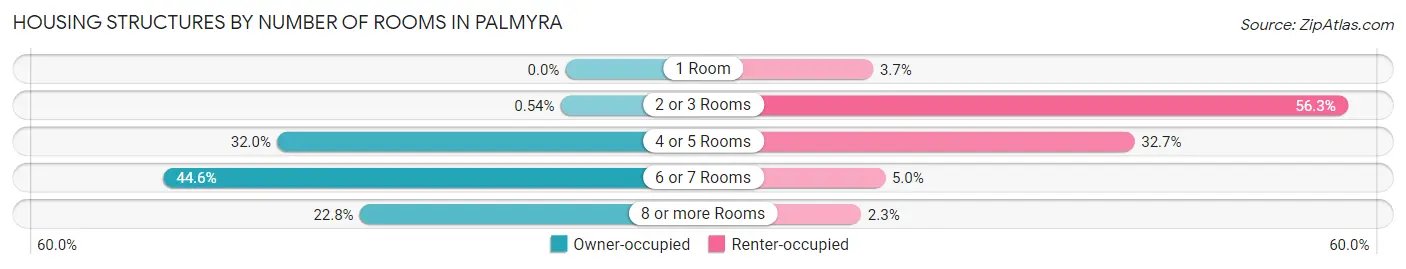
| Number of Rooms | Owner-occupied | Renter-occupied |
| 1 Room | 0 (0.0%) | 11 (3.7%) |
| 2 or 3 Rooms | 3 (0.5%) | 169 (56.3%) |
| 4 or 5 Rooms | 178 (32.0%) | 98 (32.7%) |
| 6 or 7 Rooms | 248 (44.6%) | 15 (5.0%) |
| 8 or more Rooms | 127 (22.8%) | 7 (2.3%) |
| Total | 556 (100.0%) | 300 (100.0%) |
Housing Structure by Heating Type in Palmyra
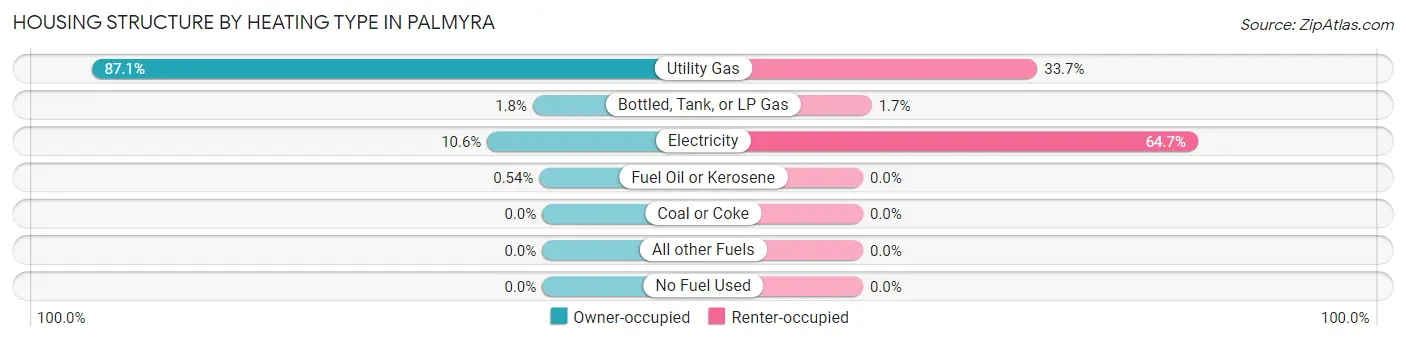
| Heating Type | Owner-occupied | Renter-occupied |
| Utility Gas | 484 (87.1%) | 101 (33.7%) |
| Bottled, Tank, or LP Gas | 10 (1.8%) | 5 (1.7%) |
| Electricity | 59 (10.6%) | 194 (64.7%) |
| Fuel Oil or Kerosene | 3 (0.5%) | 0 (0.0%) |
| Coal or Coke | 0 (0.0%) | 0 (0.0%) |
| All other Fuels | 0 (0.0%) | 0 (0.0%) |
| No Fuel Used | 0 (0.0%) | 0 (0.0%) |
| Total | 556 (100.0%) | 300 (100.0%) |
Household Vehicle Usage in Palmyra
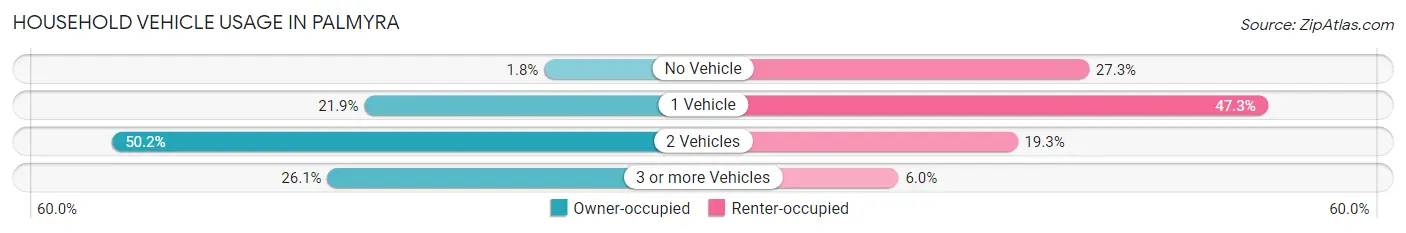
| Vehicles per Household | Owner-occupied | Renter-occupied |
| No Vehicle | 10 (1.8%) | 82 (27.3%) |
| 1 Vehicle | 122 (21.9%) | 142 (47.3%) |
| 2 Vehicles | 279 (50.2%) | 58 (19.3%) |
| 3 or more Vehicles | 145 (26.1%) | 18 (6.0%) |
| Total | 556 (100.0%) | 300 (100.0%) |
Real Estate & Mortgages in Palmyra
Real Estate and Mortgage Overview in Palmyra
| Characteristic | Without Mortgage | With Mortgage |
| Housing Units | 187 | 369 |
| Median Property Value | $156,100 | $195,200 |
| Median Household Income | $63,264 | $38 |
| Monthly Housing Costs | $603 | $2 |
| Real Estate Taxes | $2,682 | $11 |
Property Value by Mortgage Status in Palmyra
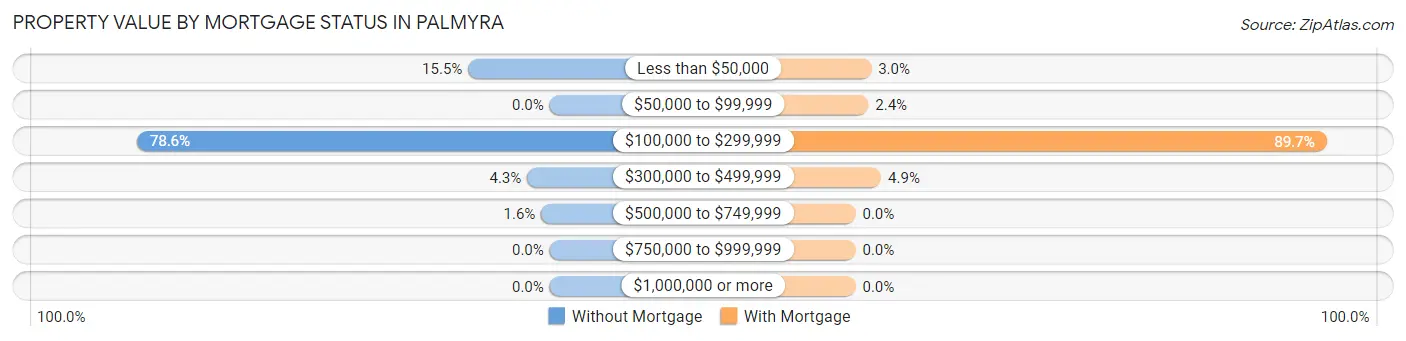
| Property Value | Without Mortgage | With Mortgage |
| Less than $50,000 | 29 (15.5%) | 11 (3.0%) |
| $50,000 to $99,999 | 0 (0.0%) | 9 (2.4%) |
| $100,000 to $299,999 | 147 (78.6%) | 331 (89.7%) |
| $300,000 to $499,999 | 8 (4.3%) | 18 (4.9%) |
| $500,000 to $749,999 | 3 (1.6%) | 0 (0.0%) |
| $750,000 to $999,999 | 0 (0.0%) | 0 (0.0%) |
| $1,000,000 or more | 0 (0.0%) | 0 (0.0%) |
| Total | 187 (100.0%) | 369 (100.0%) |
Household Income by Mortgage Status in Palmyra
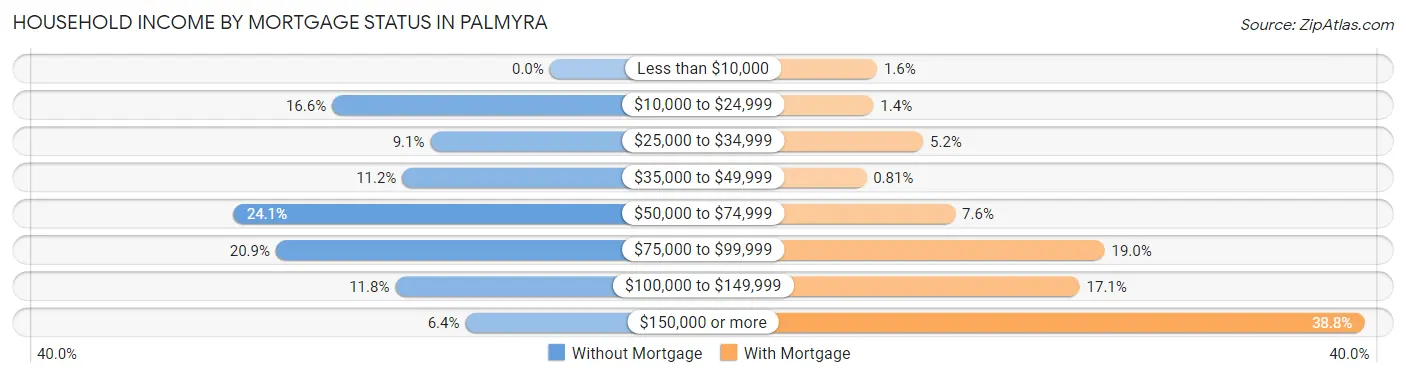
| Household Income | Without Mortgage | With Mortgage |
| Less than $10,000 | 0 (0.0%) | 6 (1.6%) |
| $10,000 to $24,999 | 31 (16.6%) | 5 (1.4%) |
| $25,000 to $34,999 | 17 (9.1%) | 19 (5.1%) |
| $35,000 to $49,999 | 21 (11.2%) | 3 (0.8%) |
| $50,000 to $74,999 | 45 (24.1%) | 28 (7.6%) |
| $75,000 to $99,999 | 39 (20.9%) | 70 (19.0%) |
| $100,000 to $149,999 | 22 (11.8%) | 63 (17.1%) |
| $150,000 or more | 12 (6.4%) | 143 (38.8%) |
| Total | 187 (100.0%) | 369 (100.0%) |
Property Value to Household Income Ratio in Palmyra
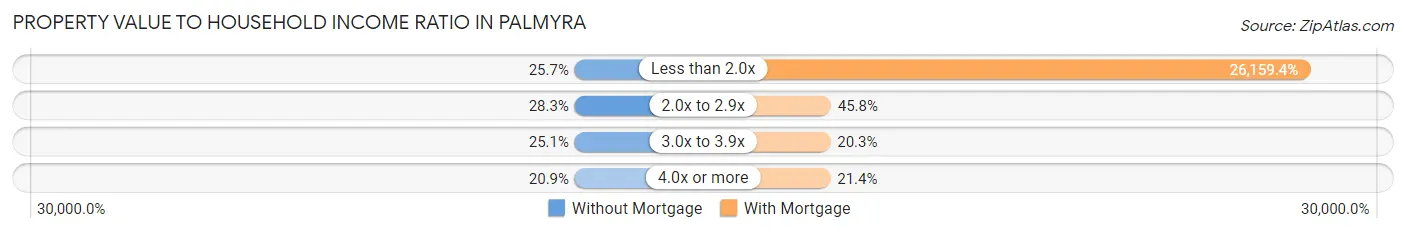
| Value-to-Income Ratio | Without Mortgage | With Mortgage |
| Less than 2.0x | 48 (25.7%) | 96,528 (26,159.4%) |
| 2.0x to 2.9x | 53 (28.3%) | 169 (45.8%) |
| 3.0x to 3.9x | 47 (25.1%) | 75 (20.3%) |
| 4.0x or more | 39 (20.9%) | 79 (21.4%) |
| Total | 187 (100.0%) | 369 (100.0%) |
Real Estate Taxes by Mortgage Status in Palmyra
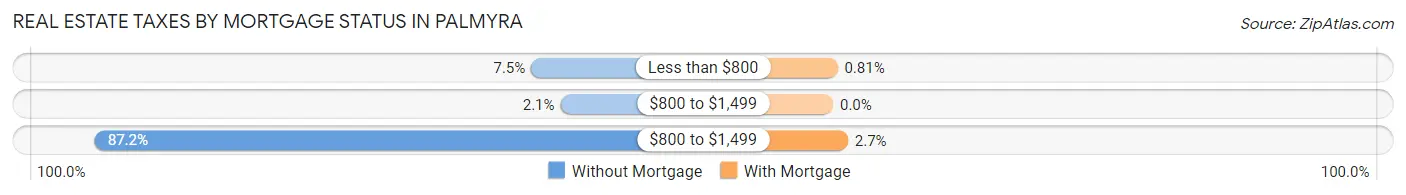
| Property Taxes | Without Mortgage | With Mortgage |
| Less than $800 | 14 (7.5%) | 3 (0.8%) |
| $800 to $1,499 | 4 (2.1%) | 0 (0.0%) |
| $800 to $1,499 | 163 (87.2%) | 10 (2.7%) |
| Total | 187 (100.0%) | 369 (100.0%) |
Health & Disability in Palmyra
Health Insurance Coverage by Age in Palmyra
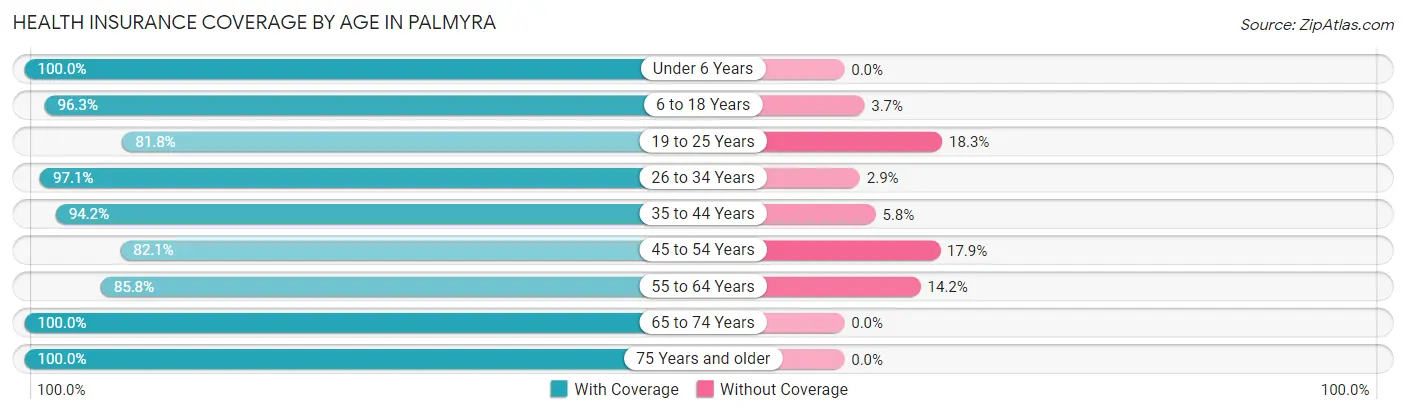
| Age Bracket | With Coverage | Without Coverage |
| Under 6 Years | 76 (100.0%) | 0 (0.0%) |
| 6 to 18 Years | 310 (96.3%) | 12 (3.7%) |
| 19 to 25 Years | 233 (81.8%) | 52 (18.2%) |
| 26 to 34 Years | 134 (97.1%) | 4 (2.9%) |
| 35 to 44 Years | 436 (94.2%) | 27 (5.8%) |
| 45 to 54 Years | 207 (82.1%) | 45 (17.9%) |
| 55 to 64 Years | 223 (85.8%) | 37 (14.2%) |
| 65 to 74 Years | 150 (100.0%) | 0 (0.0%) |
| 75 Years and older | 151 (100.0%) | 0 (0.0%) |
| Total | 1,920 (91.6%) | 177 (8.4%) |
Health Insurance Coverage by Citizenship Status in Palmyra
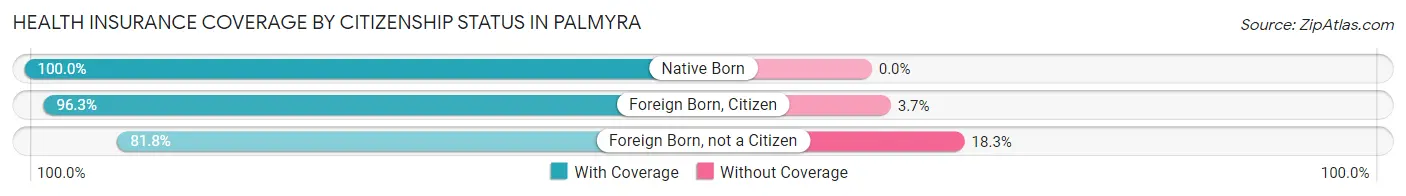
| Citizenship Status | With Coverage | Without Coverage |
| Native Born | 76 (100.0%) | 0 (0.0%) |
| Foreign Born, Citizen | 310 (96.3%) | 12 (3.7%) |
| Foreign Born, not a Citizen | 233 (81.8%) | 52 (18.2%) |
Health Insurance Coverage by Household Income in Palmyra
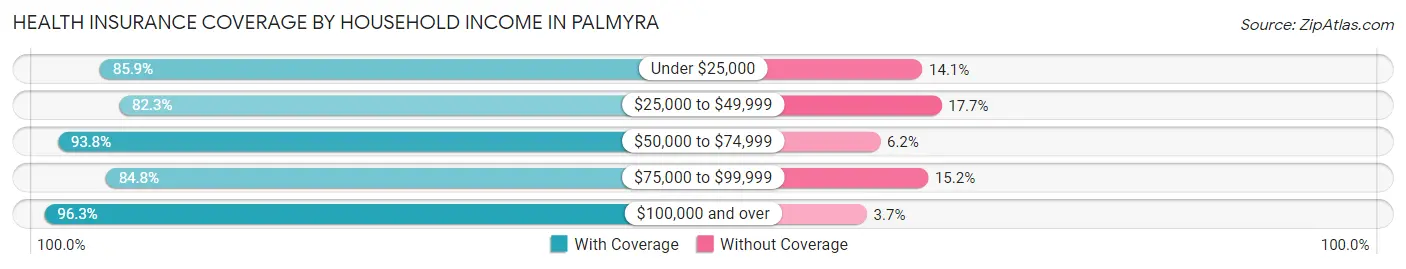
| Household Income | With Coverage | Without Coverage |
| Under $25,000 | 207 (85.9%) | 34 (14.1%) |
| $25,000 to $49,999 | 172 (82.3%) | 37 (17.7%) |
| $50,000 to $74,999 | 346 (93.8%) | 23 (6.2%) |
| $75,000 to $99,999 | 262 (84.8%) | 47 (15.2%) |
| $100,000 and over | 933 (96.3%) | 36 (3.7%) |
Public vs Private Health Insurance Coverage by Age in Palmyra
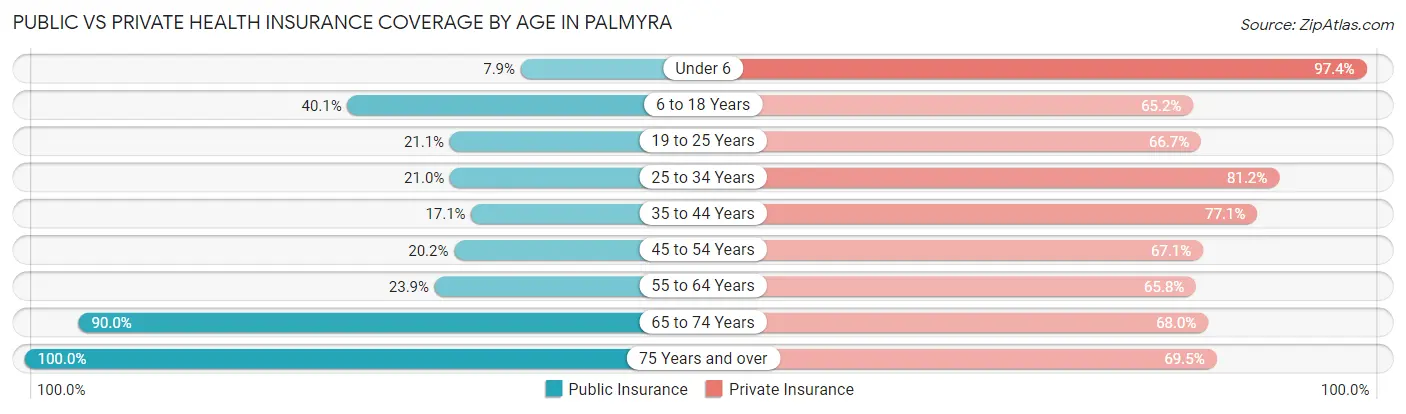
| Age Bracket | Public Insurance | Private Insurance |
| Under 6 | 6 (7.9%) | 74 (97.4%) |
| 6 to 18 Years | 129 (40.1%) | 210 (65.2%) |
| 19 to 25 Years | 60 (21.0%) | 190 (66.7%) |
| 25 to 34 Years | 29 (21.0%) | 112 (81.2%) |
| 35 to 44 Years | 79 (17.1%) | 357 (77.1%) |
| 45 to 54 Years | 51 (20.2%) | 169 (67.1%) |
| 55 to 64 Years | 62 (23.8%) | 171 (65.8%) |
| 65 to 74 Years | 135 (90.0%) | 102 (68.0%) |
| 75 Years and over | 151 (100.0%) | 105 (69.5%) |
| Total | 702 (33.5%) | 1,490 (71.1%) |
Disability Status by Sex by Age in Palmyra
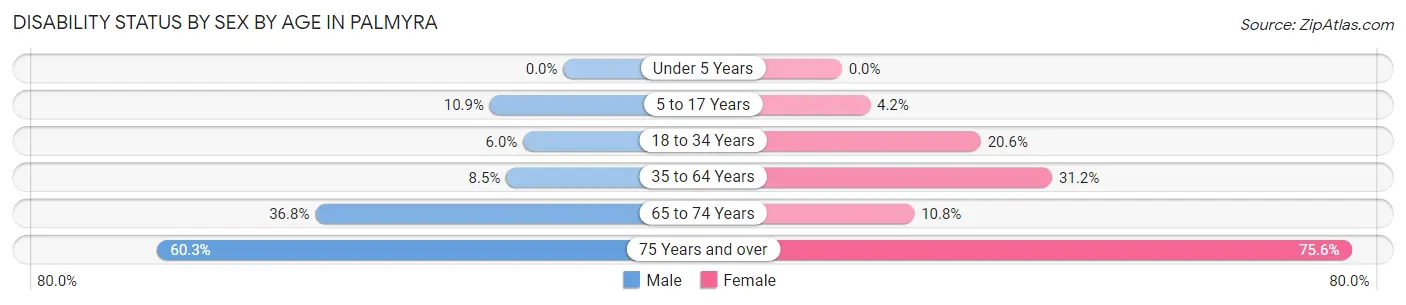
| Age Bracket | Male | Female |
| Under 5 Years | 0 (0.0%) | 0 (0.0%) |
| 5 to 17 Years | 13 (10.9%) | 8 (4.2%) |
| 18 to 34 Years | 13 (6.0%) | 46 (20.6%) |
| 35 to 64 Years | 49 (8.5%) | 124 (31.2%) |
| 65 to 74 Years | 21 (36.8%) | 10 (10.7%) |
| 75 Years and over | 44 (60.3%) | 59 (75.6%) |
Disability Class by Sex by Age in Palmyra
Disability Class: Hearing Difficulty
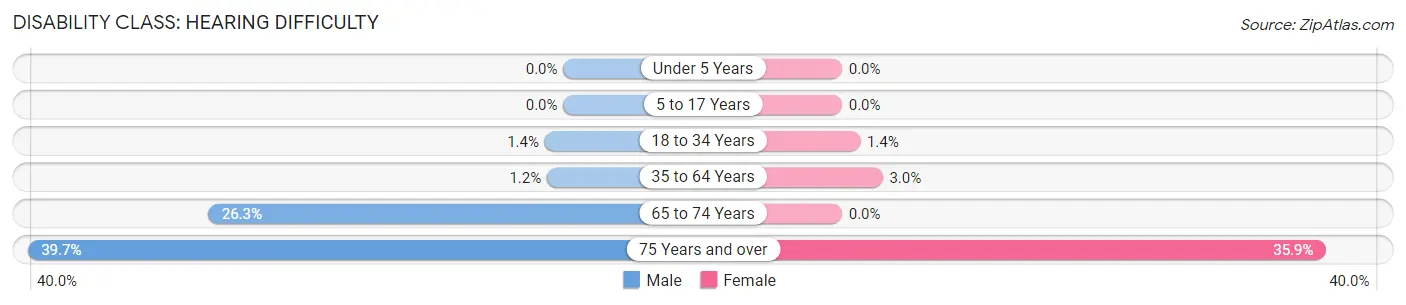
| Age Bracket | Male | Female |
| Under 5 Years | 0 (0.0%) | 0 (0.0%) |
| 5 to 17 Years | 0 (0.0%) | 0 (0.0%) |
| 18 to 34 Years | 3 (1.4%) | 3 (1.3%) |
| 35 to 64 Years | 7 (1.2%) | 12 (3.0%) |
| 65 to 74 Years | 15 (26.3%) | 0 (0.0%) |
| 75 Years and over | 29 (39.7%) | 28 (35.9%) |
Disability Class: Vision Difficulty
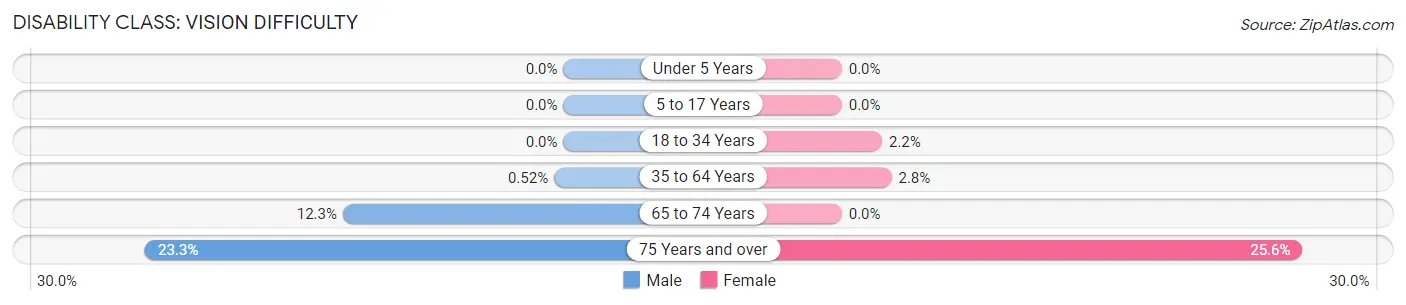
| Age Bracket | Male | Female |
| Under 5 Years | 0 (0.0%) | 0 (0.0%) |
| 5 to 17 Years | 0 (0.0%) | 0 (0.0%) |
| 18 to 34 Years | 0 (0.0%) | 5 (2.2%) |
| 35 to 64 Years | 3 (0.5%) | 11 (2.8%) |
| 65 to 74 Years | 7 (12.3%) | 0 (0.0%) |
| 75 Years and over | 17 (23.3%) | 20 (25.6%) |
Disability Class: Cognitive Difficulty
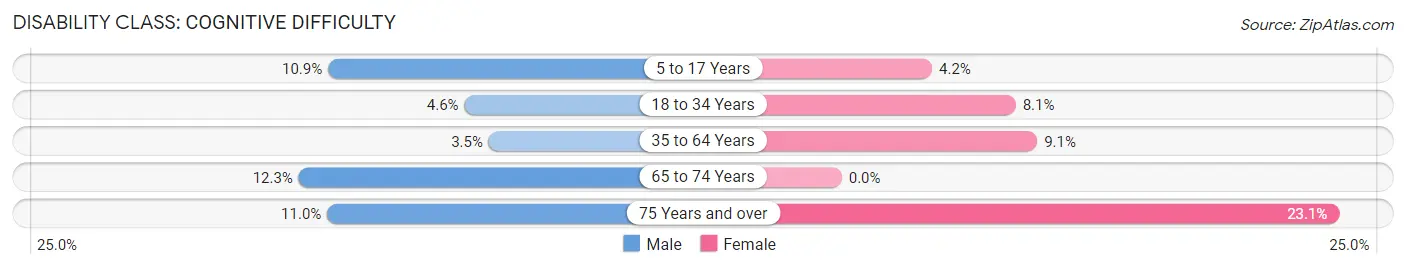
| Age Bracket | Male | Female |
| 5 to 17 Years | 13 (10.9%) | 8 (4.2%) |
| 18 to 34 Years | 10 (4.6%) | 18 (8.1%) |
| 35 to 64 Years | 20 (3.5%) | 36 (9.1%) |
| 65 to 74 Years | 7 (12.3%) | 0 (0.0%) |
| 75 Years and over | 8 (11.0%) | 18 (23.1%) |
Disability Class: Ambulatory Difficulty
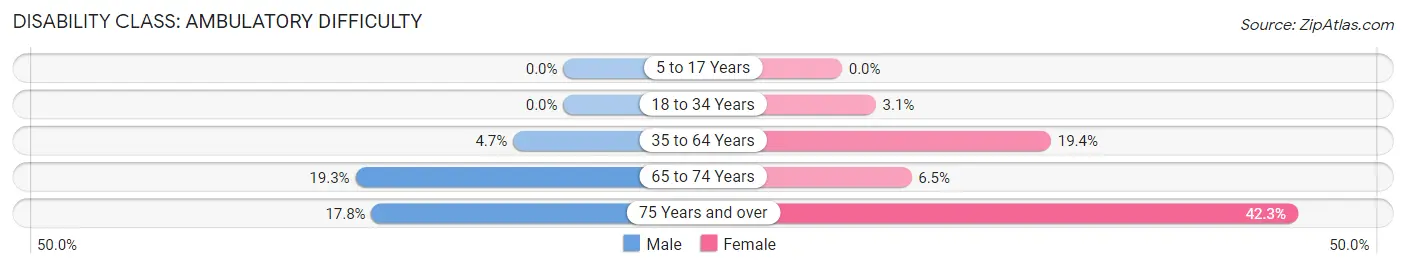
| Age Bracket | Male | Female |
| 5 to 17 Years | 0 (0.0%) | 0 (0.0%) |
| 18 to 34 Years | 0 (0.0%) | 7 (3.1%) |
| 35 to 64 Years | 27 (4.7%) | 77 (19.4%) |
| 65 to 74 Years | 11 (19.3%) | 6 (6.5%) |
| 75 Years and over | 13 (17.8%) | 33 (42.3%) |
Disability Class: Self-Care Difficulty
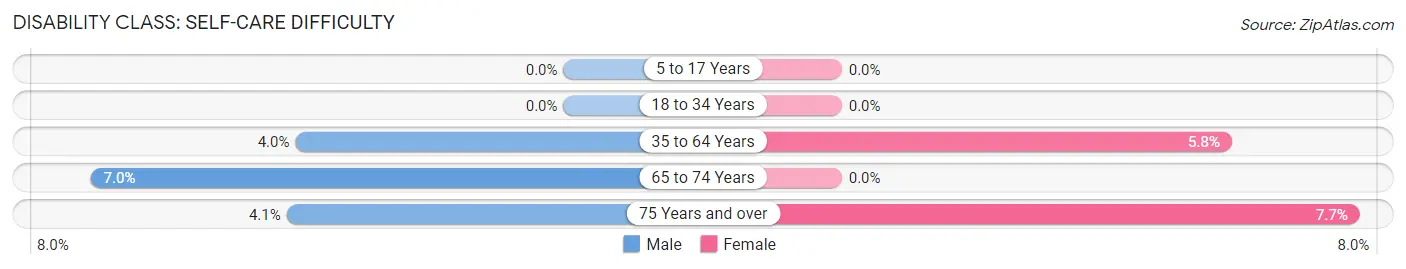
| Age Bracket | Male | Female |
| 5 to 17 Years | 0 (0.0%) | 0 (0.0%) |
| 18 to 34 Years | 0 (0.0%) | 0 (0.0%) |
| 35 to 64 Years | 23 (4.0%) | 23 (5.8%) |
| 65 to 74 Years | 4 (7.0%) | 0 (0.0%) |
| 75 Years and over | 3 (4.1%) | 6 (7.7%) |
Technology Access in Palmyra
Computing Device Access in Palmyra
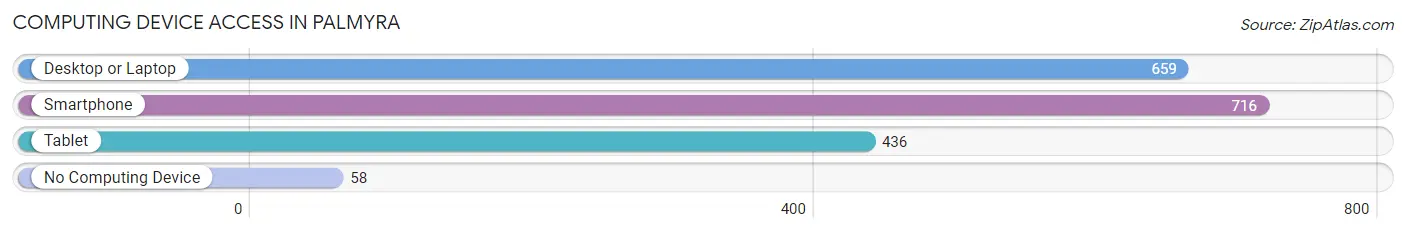
| Device Type | # Households | % Households |
| Desktop or Laptop | 659 | 77.0% |
| Smartphone | 716 | 83.6% |
| Tablet | 436 | 50.9% |
| No Computing Device | 58 | 6.8% |
| Total | 856 | 100.0% |
Internet Access in Palmyra
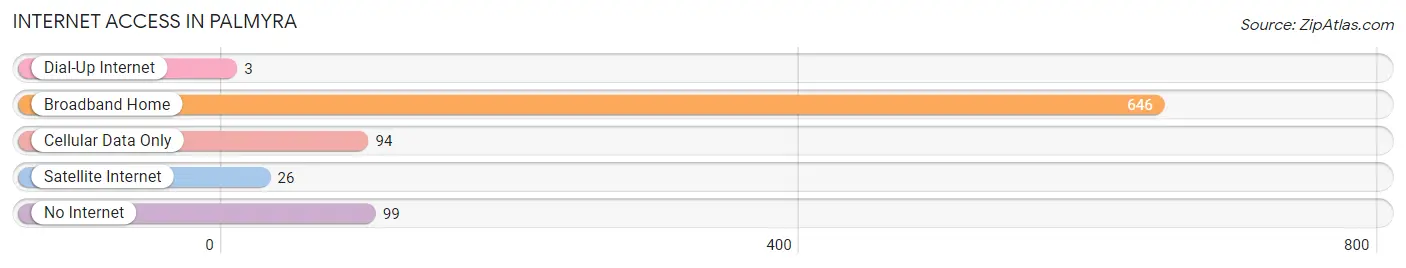
| Internet Type | # Households | % Households |
| Dial-Up Internet | 3 | 0.4% |
| Broadband Home | 646 | 75.5% |
| Cellular Data Only | 94 | 11.0% |
| Satellite Internet | 26 | 3.0% |
| No Internet | 99 | 11.6% |
| Total | 856 | 100.0% |
Palmyra Summary
Palmyra, Wisconsin is a small village located in the southeastern corner of Jefferson County, Wisconsin. It is situated on the banks of the Rock River, approximately 25 miles southwest of Milwaukee. The village has a population of approximately 2,500 people and covers an area of 1.3 square miles.
History
The area that is now Palmyra was first settled in 1836 by a group of settlers from New York. The village was originally known as “New York Settlement” and was later renamed Palmyra in 1845. The name was chosen to honor the ancient city of Palmyra in Syria.
The village was incorporated in 1846 and was primarily an agricultural community. The village was home to a number of small businesses, including a sawmill, a grist mill, a blacksmith shop, and a general store.
In the late 19th century, the village began to grow and develop. The railroad arrived in 1871, connecting Palmyra to the larger cities of Milwaukee and Madison. This allowed for the growth of industry and commerce in the village.
In the early 20th century, Palmyra experienced a period of growth and prosperity. The village was home to a number of factories, including a cheese factory, a canning factory, and a brickyard. The village also had a number of stores, restaurants, and other businesses.
Geography
Palmyra is located in the southeastern corner of Jefferson County, Wisconsin. It is situated on the banks of the Rock River, approximately 25 miles southwest of Milwaukee. The village has a total area of 1.3 square miles, all of which is land.
The village is located in a rural area and is surrounded by farmland. The terrain is mostly flat, with some rolling hills in the area. The climate is humid continental, with cold winters and warm summers.
Economy
The economy of Palmyra is largely based on agriculture and manufacturing. The village is home to a number of small businesses, including a sawmill, a grist mill, a blacksmith shop, and a general store.
The village is also home to a number of factories, including a cheese factory, a canning factory, and a brickyard. The village also has a number of stores, restaurants, and other businesses.
Demographics
As of the 2010 census, the population of Palmyra was 2,500. The racial makeup of the village was 97.2% White, 0.8% African American, 0.4% Native American, 0.4% Asian, and 1.2% from other races.
The median household income in Palmyra was $50,000, and the median family income was $56,000. The per capita income was $22,000. About 8.5% of the population was below the poverty line.
Palmyra is a small village with a rich history and a diverse economy. It is a great place to live and work, and it offers a variety of opportunities for those who are looking for a place to call home.
Common Questions
What is Per Capita Income in Palmyra?
Per Capita income in Palmyra is $34,165.
What is the Median Family Income in Palmyra?
Median Family Income in Palmyra is $100,521.
What is the Median Household income in Palmyra?
Median Household Income in Palmyra is $71,111.
What is Income or Wage Gap in Palmyra?
Income or Wage Gap in Palmyra is 29.4%.
Women in Palmyra earn 70.6 cents for every dollar earned by a man.
What is Inequality or Gini Index in Palmyra?
Inequality or Gini Index in Palmyra is 0.37.
What is the Total Population of Palmyra?
Total Population of Palmyra is 2,097.
What is the Total Male Population of Palmyra?
Total Male Population of Palmyra is 1,081.
What is the Total Female Population of Palmyra?
Total Female Population of Palmyra is 1,016.
What is the Ratio of Males per 100 Females in Palmyra?
There are 106.40 Males per 100 Females in Palmyra.
What is the Ratio of Females per 100 Males in Palmyra?
There are 93.99 Females per 100 Males in Palmyra.
What is the Median Population Age in Palmyra?
Median Population Age in Palmyra is 38.0 Years.
What is the Average Family Size in Palmyra
Average Family Size in Palmyra is 3.1 People.
What is the Average Household Size in Palmyra
Average Household Size in Palmyra is 2.5 People.
How Large is the Labor Force in Palmyra?
There are 1,218 People in the Labor Forcein in Palmyra.
What is the Percentage of People in the Labor Force in Palmyra?
68.0% of People are in the Labor Force in Palmyra.
What is the Unemployment Rate in Palmyra?
Unemployment Rate in Palmyra is 3.5%.