Packwaukee, WI Map & Demographics
Packwaukee Map
Packwaukee Overview
$24,145
PER CAPITA INCOME
$67,778
AVG FAMILY INCOME
$40,972
AVG HOUSEHOLD INCOME
0.29
INEQUALITY / GINI INDEX
208
TOTAL POPULATION
113
MALE POPULATION
95
FEMALE POPULATION
118.95
MALES / 100 FEMALES
84.07
FEMALES / 100 MALES
65.1
MEDIAN AGE
2.7
AVG FAMILY SIZE
2.0
AVG HOUSEHOLD SIZE
68
LABOR FORCE [ PEOPLE ]
39.5%
PERCENT IN LABOR FORCE
Packwaukee Zip Codes
Income in Packwaukee
Income Overview in Packwaukee
Per Capita Income in Packwaukee is $24,145, while median incomes of families and households are $67,778 and $40,972 respectively.
| Characteristic | Number | Measure |
| Per Capita Income | 208 | $24,145 |
| Median Family Income | 54 | $67,778 |
| Mean Family Income | 54 | $57,939 |
| Median Household Income | 106 | $40,972 |
| Mean Household Income | 106 | $47,070 |
| Income Deficit | 54 | $0 |
| Wage / Income Gap (%) | 208 | 0.00% |
| Wage / Income Gap ($) | 208 | 100.00¢ per $1 |
| Gini / Inequality Index | 208 | 0.29 |
Earnings by Sex in Packwaukee
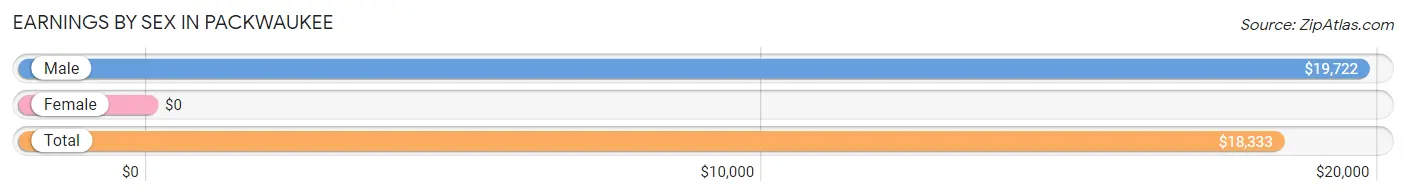
| Sex | Number | Average Earnings |
| Male | 42 (55.3%) | $19,722 |
| Female | 34 (44.7%) | $0 |
| Total | 76 (100.0%) | $18,333 |
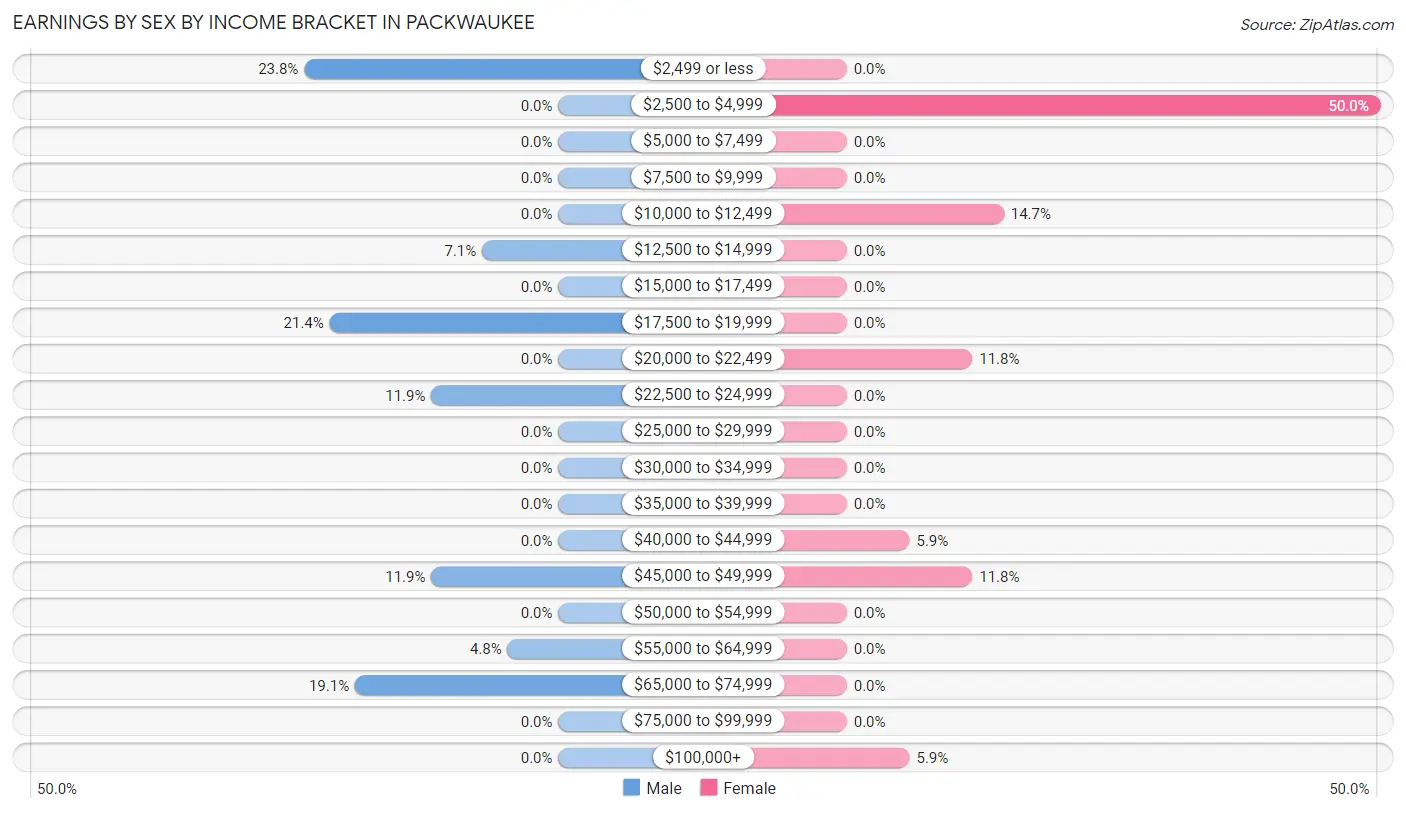
Earnings by Sex by Income Bracket in Packwaukee
The most common earnings brackets in Packwaukee are $2,499 or less for men (10 | 23.8%) and $2,500 to $4,999 for women (17 | 50.0%).
| Income | Male | Female |
| $2,499 or less | 10 (23.8%) | 0 (0.0%) |
| $2,500 to $4,999 | 0 (0.0%) | 17 (50.0%) |
| $5,000 to $7,499 | 0 (0.0%) | 0 (0.0%) |
| $7,500 to $9,999 | 0 (0.0%) | 0 (0.0%) |
| $10,000 to $12,499 | 0 (0.0%) | 5 (14.7%) |
| $12,500 to $14,999 | 3 (7.1%) | 0 (0.0%) |
| $15,000 to $17,499 | 0 (0.0%) | 0 (0.0%) |
| $17,500 to $19,999 | 9 (21.4%) | 0 (0.0%) |
| $20,000 to $22,499 | 0 (0.0%) | 4 (11.8%) |
| $22,500 to $24,999 | 5 (11.9%) | 0 (0.0%) |
| $25,000 to $29,999 | 0 (0.0%) | 0 (0.0%) |
| $30,000 to $34,999 | 0 (0.0%) | 0 (0.0%) |
| $35,000 to $39,999 | 0 (0.0%) | 0 (0.0%) |
| $40,000 to $44,999 | 0 (0.0%) | 2 (5.9%) |
| $45,000 to $49,999 | 5 (11.9%) | 4 (11.8%) |
| $50,000 to $54,999 | 0 (0.0%) | 0 (0.0%) |
| $55,000 to $64,999 | 2 (4.8%) | 0 (0.0%) |
| $65,000 to $74,999 | 8 (19.1%) | 0 (0.0%) |
| $75,000 to $99,999 | 0 (0.0%) | 0 (0.0%) |
| $100,000+ | 0 (0.0%) | 2 (5.9%) |
| Total | 42 (100.0%) | 34 (100.0%) |
Earnings by Sex by Educational Attainment in Packwaukee
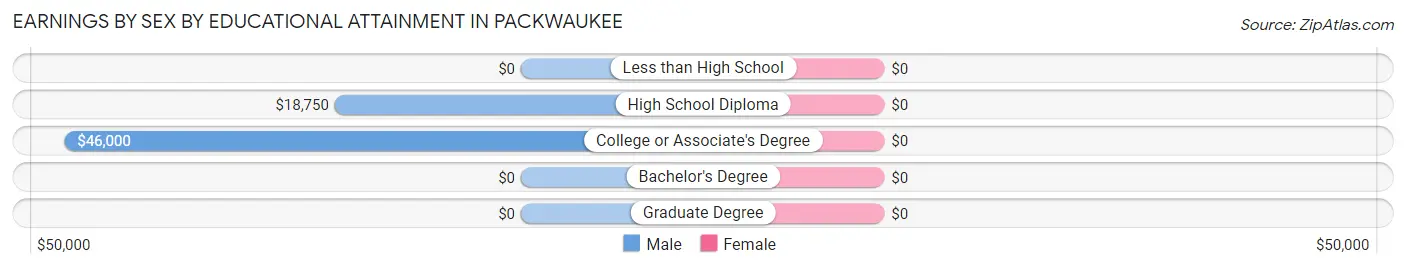
| Educational Attainment | Male Income | Female Income |
| Less than High School | - | - |
| High School Diploma | $18,750 | $0 |
| College or Associate's Degree | $46,000 | $0 |
| Bachelor's Degree | - | - |
| Graduate Degree | - | - |
| Total | $19,722 | $0 |
Family Income in Packwaukee
Family Income Brackets in Packwaukee
According to the Packwaukee family income data, there are 22 families falling into the $50,000 to $74,999 income range, which is the most common income bracket and makes up 40.7% of all families.
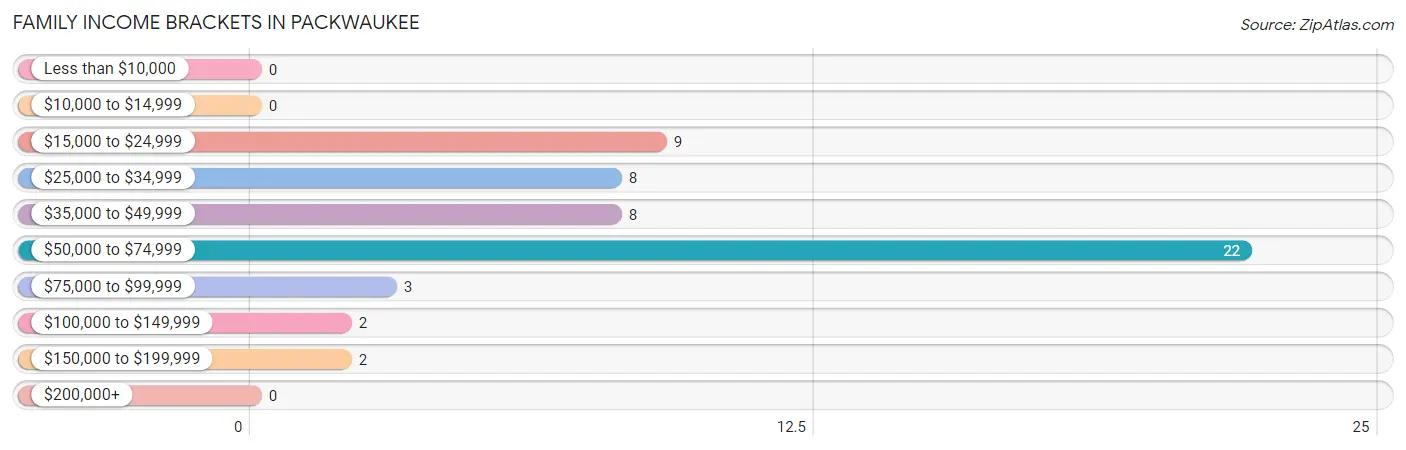
| Income Bracket | # Families | % Families |
| Less than $10,000 | 0 | 0.0% |
| $10,000 to $14,999 | 0 | 0.0% |
| $15,000 to $24,999 | 9 | 16.7% |
| $25,000 to $34,999 | 8 | 14.8% |
| $35,000 to $49,999 | 8 | 14.8% |
| $50,000 to $74,999 | 22 | 40.7% |
| $75,000 to $99,999 | 3 | 5.6% |
| $100,000 to $149,999 | 2 | 3.7% |
| $150,000 to $199,999 | 2 | 3.7% |
| $200,000+ | 0 | 0.0% |
Family Income by Famaliy Size in Packwaukee
2-person families (47 | 87.0%) account for the highest median family income in Packwaukee with $56,250 per family, while 2-person families (47 | 87.0%) have the highest median income of $28,125 per family member.
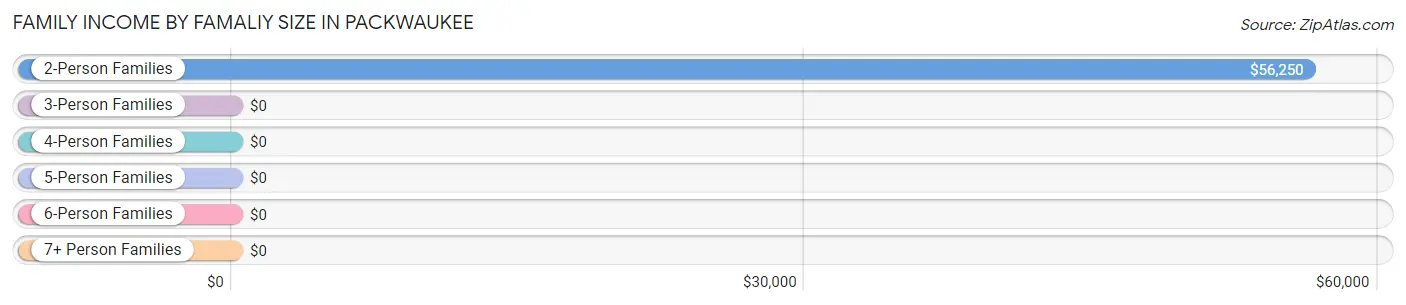
| Income Bracket | # Families | Median Income |
| 2-Person Families | 47 (87.0%) | $56,250 |
| 3-Person Families | 2 (3.7%) | $0 |
| 4-Person Families | 0 (0.0%) | $0 |
| 5-Person Families | 0 (0.0%) | $0 |
| 6-Person Families | 0 (0.0%) | $0 |
| 7+ Person Families | 5 (9.3%) | $0 |
| Total | 54 (100.0%) | $67,778 |
Family Income by Number of Earners in Packwaukee
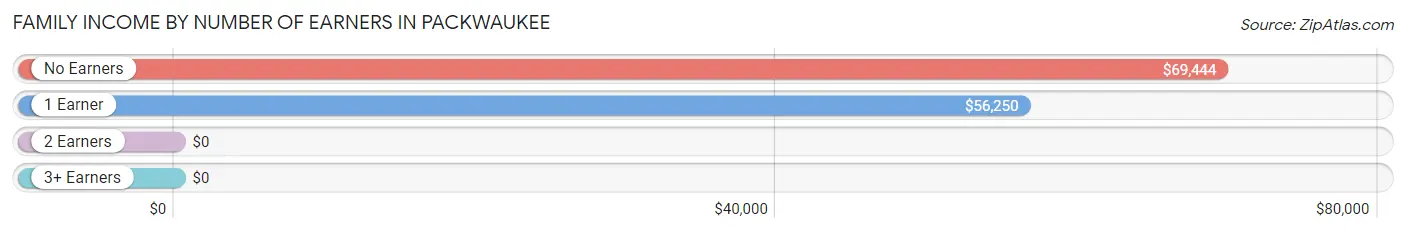
| Number of Earners | # Families | Median Income |
| No Earners | 18 (33.3%) | $69,444 |
| 1 Earner | 20 (37.0%) | $56,250 |
| 2 Earners | 16 (29.6%) | $0 |
| 3+ Earners | 0 (0.0%) | $0 |
| Total | 54 (100.0%) | $67,778 |
Household Income in Packwaukee
Household Income Brackets in Packwaukee
With 36 households falling in the category, the $35,000 to $49,999 income range is the most frequent in Packwaukee, accounting for 34.0% of all households.
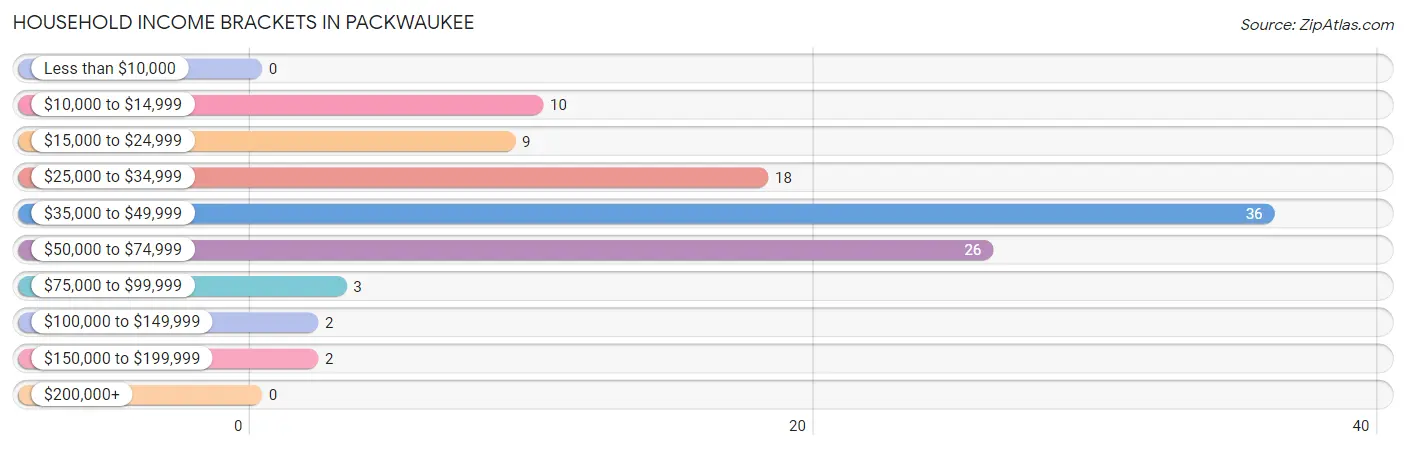
| Income Bracket | # Households | % Households |
| Less than $10,000 | 0 | 0.0% |
| $10,000 to $14,999 | 10 | 9.4% |
| $15,000 to $24,999 | 9 | 8.5% |
| $25,000 to $34,999 | 18 | 17.0% |
| $35,000 to $49,999 | 36 | 34.0% |
| $50,000 to $74,999 | 26 | 24.5% |
| $75,000 to $99,999 | 3 | 2.8% |
| $100,000 to $149,999 | 2 | 1.9% |
| $150,000 to $199,999 | 2 | 1.9% |
| $200,000+ | 0 | 0.0% |
Household Income by Householder Age in Packwaukee
The median household income in Packwaukee is $40,972, with the highest median household income of $41,250 found in the 45 to 64 years age bracket for the primary householder. A total of 30 households (28.3%) fall into this category.
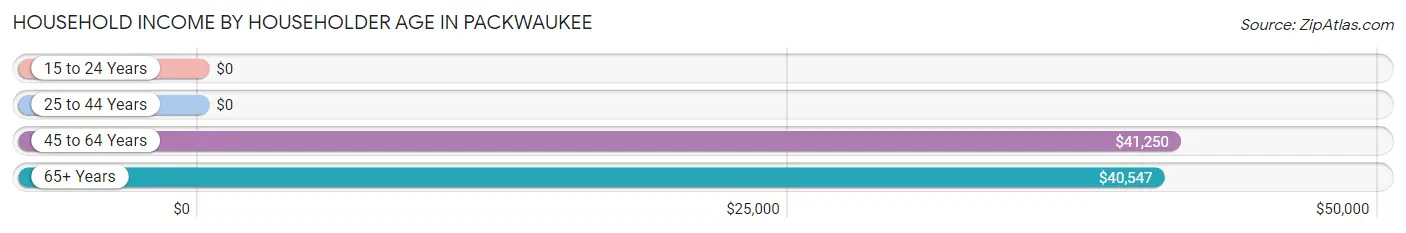
| Income Bracket | # Households | Median Income |
| 15 to 24 Years | 0 (0.0%) | $0 |
| 25 to 44 Years | 5 (4.7%) | $0 |
| 45 to 64 Years | 30 (28.3%) | $41,250 |
| 65+ Years | 71 (67.0%) | $40,547 |
| Total | 106 (100.0%) | $40,972 |
Poverty in Packwaukee
Income Below Poverty by Sex and Age in Packwaukee
With 8.8% poverty level for males and 11.6% for females among the residents of Packwaukee, 65 to 74 year old males and 75 year old and over females are the most vulnerable to poverty, with 10 males (20.4%) and 11 females (73.3%) in their respective age groups living below the poverty level.
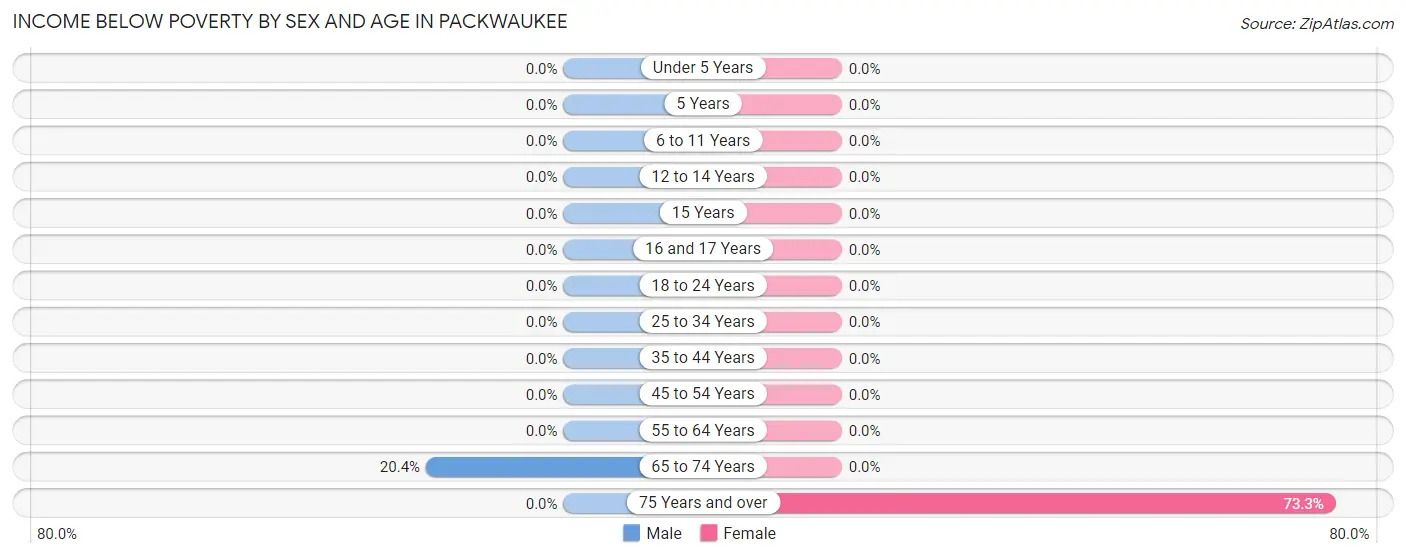
| Age Bracket | Male | Female |
| Under 5 Years | 0 (0.0%) | 0 (0.0%) |
| 5 Years | 0 (0.0%) | 0 (0.0%) |
| 6 to 11 Years | 0 (0.0%) | 0 (0.0%) |
| 12 to 14 Years | 0 (0.0%) | 0 (0.0%) |
| 15 Years | 0 (0.0%) | 0 (0.0%) |
| 16 and 17 Years | 0 (0.0%) | 0 (0.0%) |
| 18 to 24 Years | 0 (0.0%) | 0 (0.0%) |
| 25 to 34 Years | 0 (0.0%) | 0 (0.0%) |
| 35 to 44 Years | 0 (0.0%) | 0 (0.0%) |
| 45 to 54 Years | 0 (0.0%) | 0 (0.0%) |
| 55 to 64 Years | 0 (0.0%) | 0 (0.0%) |
| 65 to 74 Years | 10 (20.4%) | 0 (0.0%) |
| 75 Years and over | 0 (0.0%) | 11 (73.3%) |
| Total | 10 (8.8%) | 11 (11.6%) |
Income Above Poverty by Sex and Age in Packwaukee
According to the poverty statistics in Packwaukee, males aged under 5 years and females aged under 5 years are the age groups that are most secure financially, with 100.0% of males and 100.0% of females in these age groups living above the poverty line.
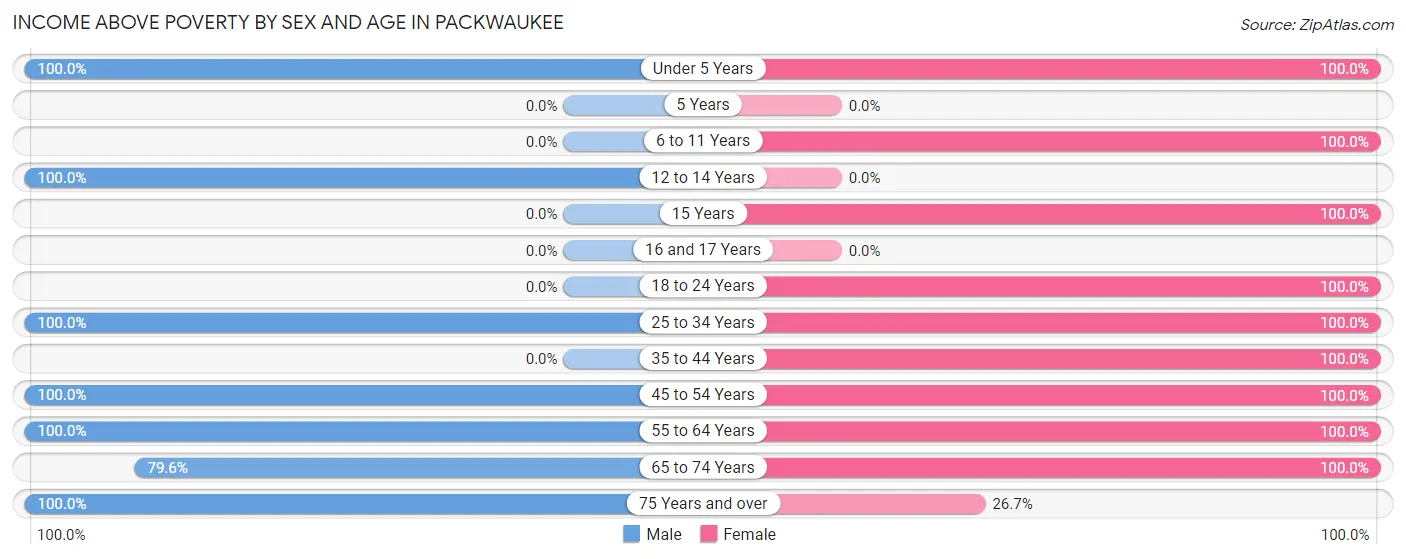
| Age Bracket | Male | Female |
| Under 5 Years | 13 (100.0%) | 2 (100.0%) |
| 5 Years | 0 (0.0%) | 0 (0.0%) |
| 6 to 11 Years | 0 (0.0%) | 10 (100.0%) |
| 12 to 14 Years | 6 (100.0%) | 0 (0.0%) |
| 15 Years | 0 (0.0%) | 5 (100.0%) |
| 16 and 17 Years | 0 (0.0%) | 0 (0.0%) |
| 18 to 24 Years | 0 (0.0%) | 9 (100.0%) |
| 25 to 34 Years | 5 (100.0%) | 7 (100.0%) |
| 35 to 44 Years | 0 (0.0%) | 2 (100.0%) |
| 45 to 54 Years | 12 (100.0%) | 2 (100.0%) |
| 55 to 64 Years | 13 (100.0%) | 15 (100.0%) |
| 65 to 74 Years | 39 (79.6%) | 28 (100.0%) |
| 75 Years and over | 15 (100.0%) | 4 (26.7%) |
| Total | 103 (91.1%) | 84 (88.4%) |
Income Below Poverty Among Married-Couple Families in Packwaukee
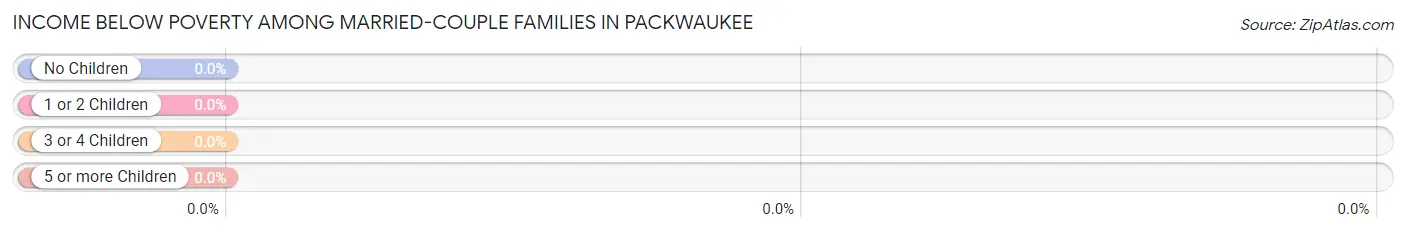
| Children | Above Poverty | Below Poverty |
| No Children | 38 (100.0%) | 0 (0.0%) |
| 1 or 2 Children | 0 (0.0%) | 0 (0.0%) |
| 3 or 4 Children | 0 (0.0%) | 0 (0.0%) |
| 5 or more Children | 5 (100.0%) | 0 (0.0%) |
| Total | 43 (100.0%) | 0 (0.0%) |
Income Below Poverty Among Single-Parent Households in Packwaukee
| Children | Single Father | Single Mother |
| No Children | 0 (0.0%) | 0 (0.0%) |
| 1 or 2 Children | 0 (0.0%) | 0 (0.0%) |
| 3 or 4 Children | 0 (0.0%) | 0 (0.0%) |
| 5 or more Children | 0 (0.0%) | 0 (0.0%) |
| Total | 0 (0.0%) | 0 (0.0%) |
Income Below Poverty Among Married-Couple vs Single-Parent Households in Packwaukee
| Children | Married-Couple Families | Single-Parent Households |
| No Children | 0 (0.0%) | 0 (0.0%) |
| 1 or 2 Children | 0 (0.0%) | 0 (0.0%) |
| 3 or 4 Children | 0 (0.0%) | 0 (0.0%) |
| 5 or more Children | 0 (0.0%) | 0 (0.0%) |
| Total | 0 (0.0%) | 0 (0.0%) |
Race in Packwaukee
The most populous races in Packwaukee are White / Caucasian (206 | 99.0%), Hispanic or Latino (46 | 22.1%), and Two or more Races (2 | 1.0%).
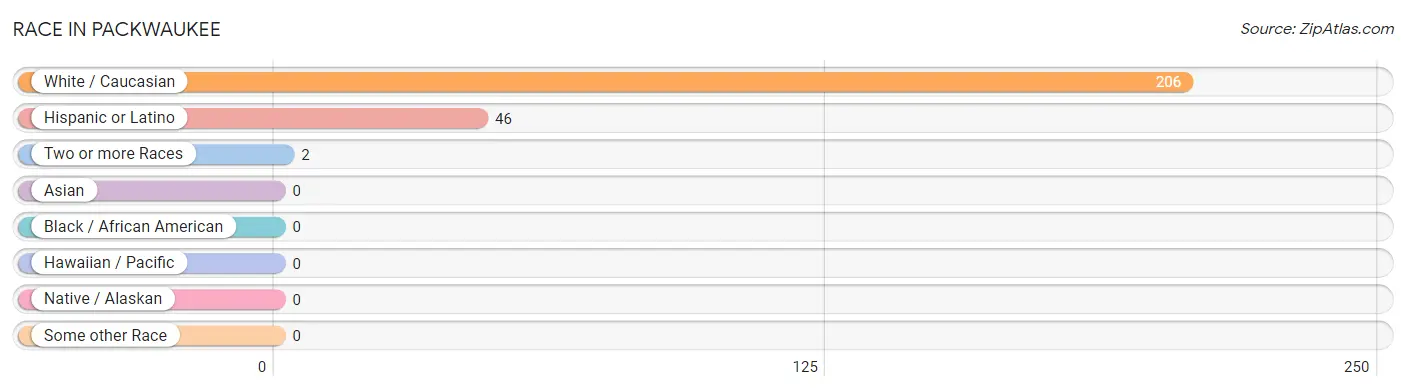
| Race | # Population | % Population |
| Asian | 0 | 0.0% |
| Black / African American | 0 | 0.0% |
| Hawaiian / Pacific | 0 | 0.0% |
| Hispanic or Latino | 46 | 22.1% |
| Native / Alaskan | 0 | 0.0% |
| White / Caucasian | 206 | 99.0% |
| Two or more Races | 2 | 1.0% |
| Some other Race | 0 | 0.0% |
| Total | 208 | 100.0% |
Ancestry in Packwaukee
The most populous ancestries reported in Packwaukee are German (82 | 39.4%), English (46 | 22.1%), Mexican (46 | 22.1%), Polish (20 | 9.6%), and Irish (14 | 6.7%), together accounting for 100.0% of all Packwaukee residents.
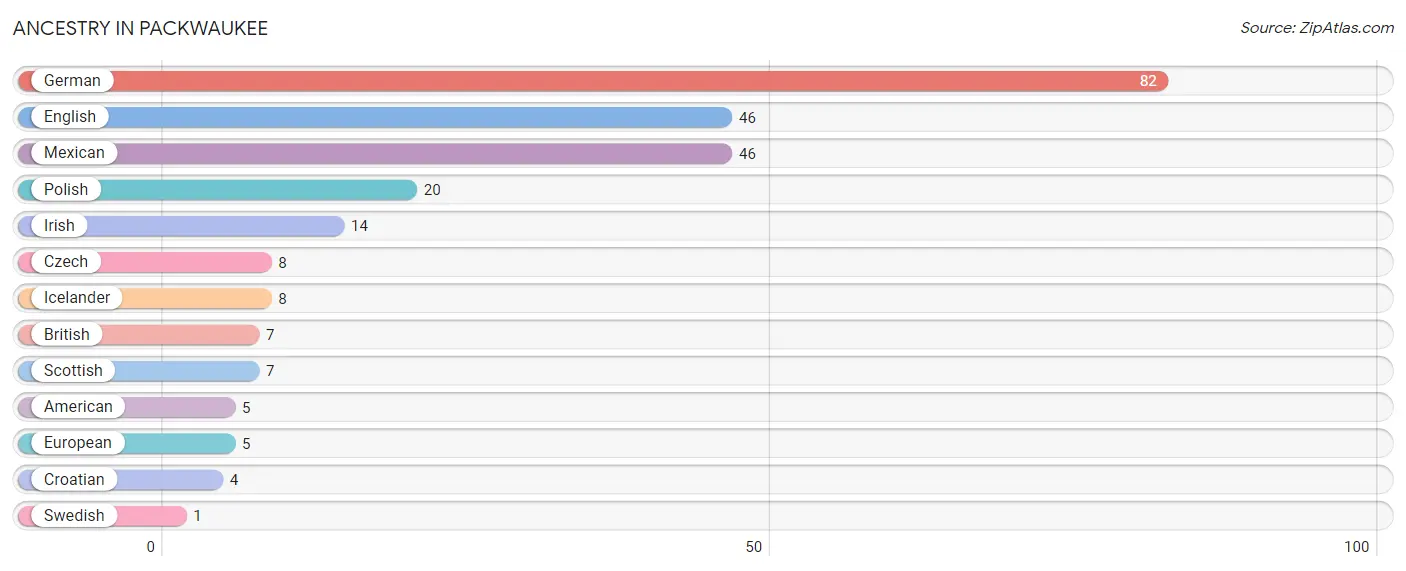
| Ancestry | # Population | % Population |
| American | 5 | 2.4% |
| British | 7 | 3.4% |
| Croatian | 4 | 1.9% |
| Czech | 8 | 3.8% |
| English | 46 | 22.1% |
| European | 5 | 2.4% |
| German | 82 | 39.4% |
| Icelander | 8 | 3.8% |
| Irish | 14 | 6.7% |
| Mexican | 46 | 22.1% |
| Polish | 20 | 9.6% |
| Scottish | 7 | 3.4% |
| Swedish | 1 | 0.5% | View All 13 Rows |
Immigrants in Packwaukee
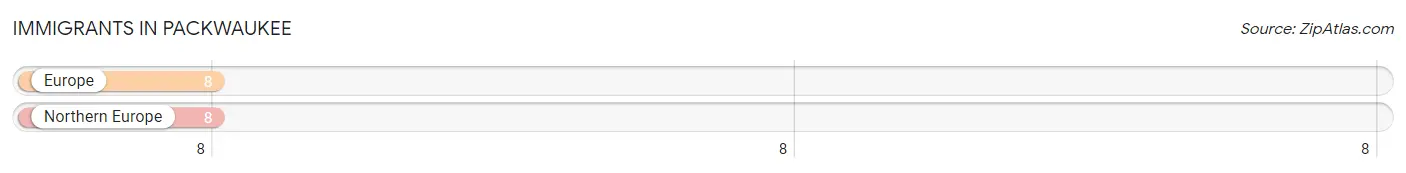
The most numerous immigrant groups reported in Packwaukee came from Europe (8 | 3.8%), and Northern Europe (8 | 3.8%), together accounting for 7.7% of all Packwaukee residents.
| Immigration Origin | # Population | % Population |
| Europe | 8 | 3.8% |
| Northern Europe | 8 | 3.8% | View All 2 Rows |
Sex and Age in Packwaukee
Sex and Age in Packwaukee
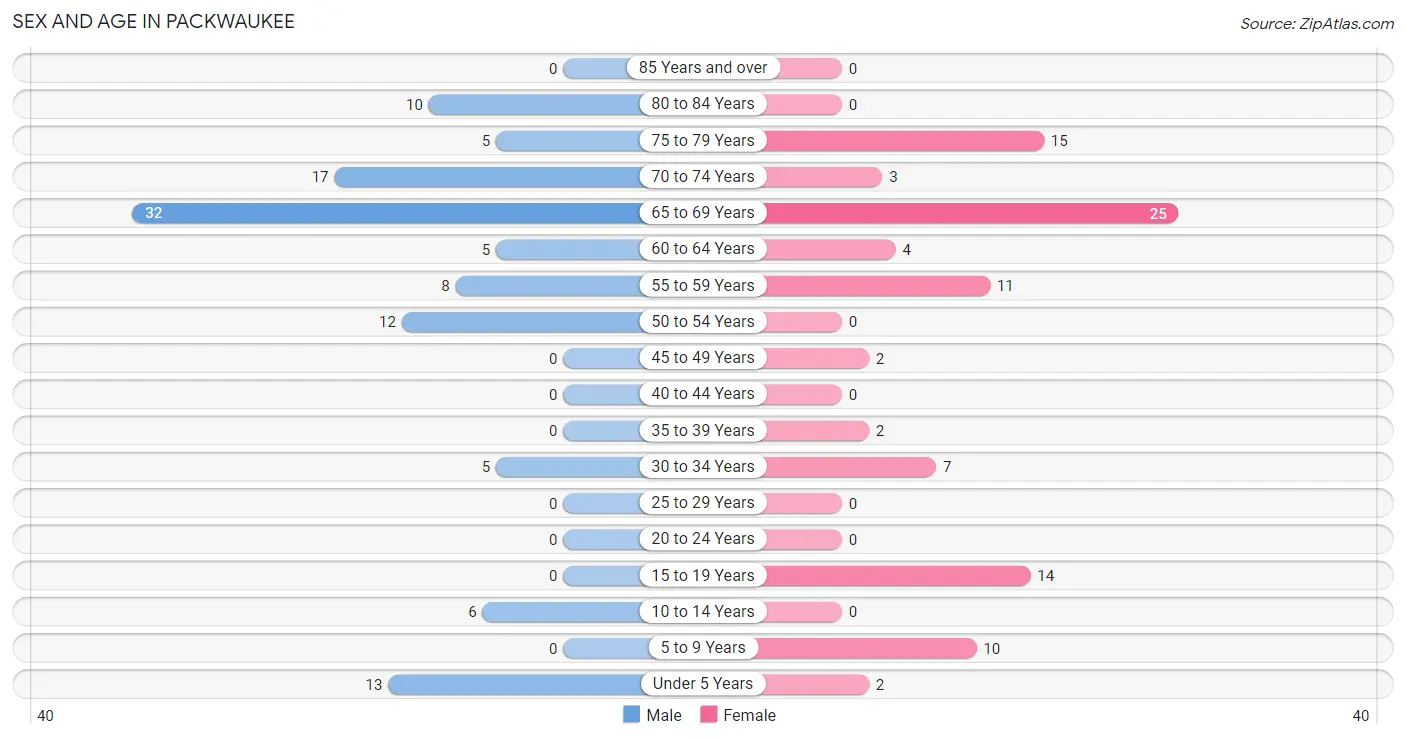
The most populous age groups in Packwaukee are 65 to 69 Years (32 | 28.3%) for men and 65 to 69 Years (25 | 26.3%) for women.
| Age Bracket | Male | Female |
| Under 5 Years | 13 (11.5%) | 2 (2.1%) |
| 5 to 9 Years | 0 (0.0%) | 10 (10.5%) |
| 10 to 14 Years | 6 (5.3%) | 0 (0.0%) |
| 15 to 19 Years | 0 (0.0%) | 14 (14.7%) |
| 20 to 24 Years | 0 (0.0%) | 0 (0.0%) |
| 25 to 29 Years | 0 (0.0%) | 0 (0.0%) |
| 30 to 34 Years | 5 (4.4%) | 7 (7.4%) |
| 35 to 39 Years | 0 (0.0%) | 2 (2.1%) |
| 40 to 44 Years | 0 (0.0%) | 0 (0.0%) |
| 45 to 49 Years | 0 (0.0%) | 2 (2.1%) |
| 50 to 54 Years | 12 (10.6%) | 0 (0.0%) |
| 55 to 59 Years | 8 (7.1%) | 11 (11.6%) |
| 60 to 64 Years | 5 (4.4%) | 4 (4.2%) |
| 65 to 69 Years | 32 (28.3%) | 25 (26.3%) |
| 70 to 74 Years | 17 (15.0%) | 3 (3.2%) |
| 75 to 79 Years | 5 (4.4%) | 15 (15.8%) |
| 80 to 84 Years | 10 (8.8%) | 0 (0.0%) |
| 85 Years and over | 0 (0.0%) | 0 (0.0%) |
| Total | 113 (100.0%) | 95 (100.0%) |
Families and Households in Packwaukee
Median Family Size in Packwaukee
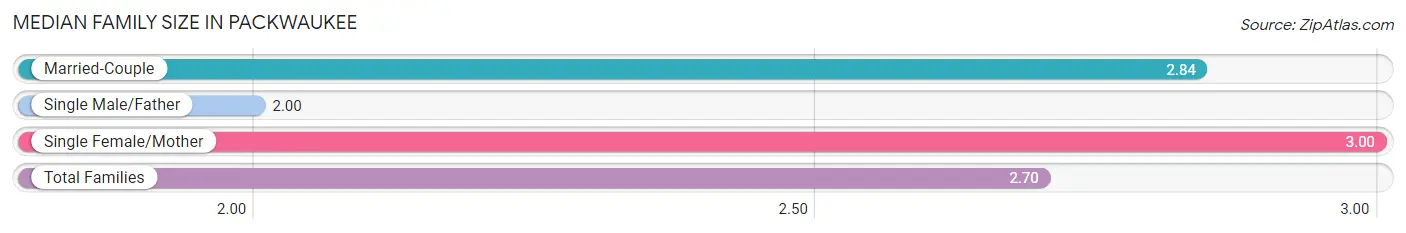
The median family size in Packwaukee is 2.70 persons per family, with single female/mother families (2 | 3.7%) accounting for the largest median family size of 3 persons per family. On the other hand, single male/father families (9 | 16.7%) represent the smallest median family size with 2.00 persons per family.
| Family Type | # Families | Family Size |
| Married-Couple | 43 (79.6%) | 2.84 |
| Single Male/Father | 9 (16.7%) | 2.00 |
| Single Female/Mother | 2 (3.7%) | 3.00 |
| Total Families | 54 (100.0%) | 2.70 |
Median Household Size in Packwaukee
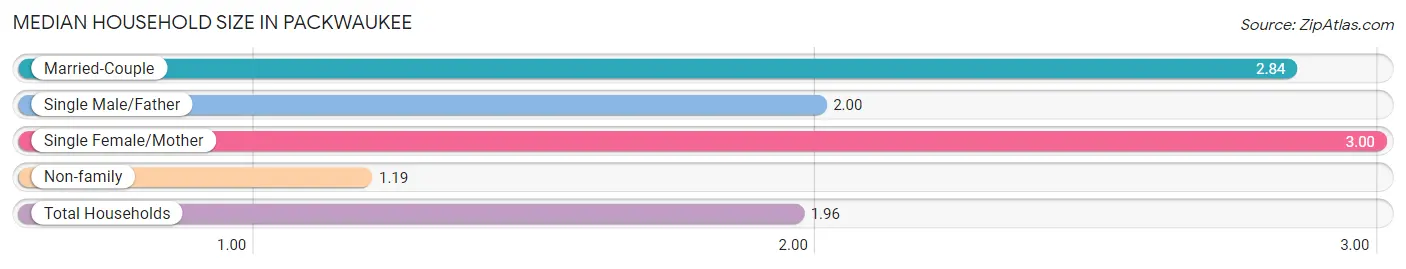
The median household size in Packwaukee is 1.96 persons per household, with single female/mother households (2 | 1.9%) accounting for the largest median household size of 3 persons per household. non-family households (52 | 49.1%) represent the smallest median household size with 1.19 persons per household.
| Household Type | # Households | Household Size |
| Married-Couple | 43 (40.6%) | 2.84 |
| Single Male/Father | 9 (8.5%) | 2.00 |
| Single Female/Mother | 2 (1.9%) | 3.00 |
| Non-family | 52 (49.1%) | 1.19 |
| Total Households | 106 (100.0%) | 1.96 |
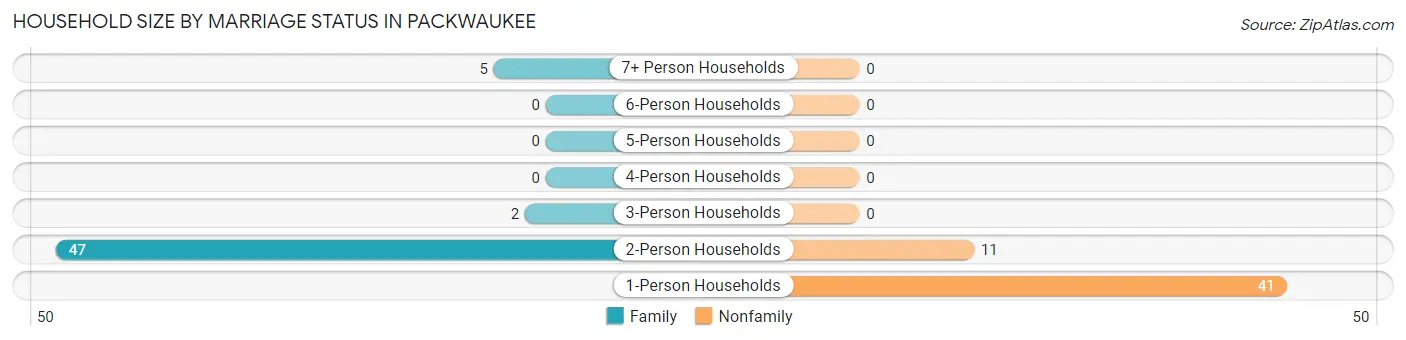
Household Size by Marriage Status in Packwaukee
Out of a total of 106 households in Packwaukee, 54 (50.9%) are family households, while 52 (49.1%) are nonfamily households. The most numerous type of family households are 2-person households, comprising 47, and the most common type of nonfamily households are 1-person households, comprising 41.
| Household Size | Family Households | Nonfamily Households |
| 1-Person Households | - | 41 (38.7%) |
| 2-Person Households | 47 (44.3%) | 11 (10.4%) |
| 3-Person Households | 2 (1.9%) | 0 (0.0%) |
| 4-Person Households | 0 (0.0%) | 0 (0.0%) |
| 5-Person Households | 0 (0.0%) | 0 (0.0%) |
| 6-Person Households | 0 (0.0%) | 0 (0.0%) |
| 7+ Person Households | 5 (4.7%) | 0 (0.0%) |
| Total | 54 (50.9%) | 52 (49.1%) |
Female Fertility in Packwaukee
Fertility by Age in Packwaukee
| Age Bracket | Women with Births | Births / 1,000 Women |
| 15 to 19 years | 0 (0.0%) | 0.0 |
| 20 to 34 years | 0 (0.0%) | 0.0 |
| 35 to 50 years | 0 (0.0%) | 0.0 |
| Total | 0 (0.0%) | 0.0 |
Fertility by Age by Marriage Status in Packwaukee
| Age Bracket | Married | Unmarried |
| 15 to 19 years | 0 (0.0%) | 0 (0.0%) |
| 20 to 34 years | 0 (0.0%) | 0 (0.0%) |
| 35 to 50 years | 0 (0.0%) | 0 (0.0%) |
| Total | 0 (0.0%) | 0 (0.0%) |
Fertility by Education in Packwaukee
| Educational Attainment | Women with Births | Births / 1,000 Women |
| Less than High School | 0 (0.0%) | 0.0 |
| High School Diploma | 0 (0.0%) | 0.0 |
| College or Associate's Degree | 0 (0.0%) | 0.0 |
| Bachelor's Degree | 0 (0.0%) | 0.0 |
| Graduate Degree | 0 (0.0%) | 0.0 |
| Total | 0 (0.0%) | 0.0 |
Fertility by Education by Marriage Status in Packwaukee
| Educational Attainment | Married | Unmarried |
| Less than High School | 0 (0.0%) | 0 (0.0%) |
| High School Diploma | 0 (0.0%) | 0 (0.0%) |
| College or Associate's Degree | 0 (0.0%) | 0 (0.0%) |
| Bachelor's Degree | 0 (0.0%) | 0 (0.0%) |
| Graduate Degree | 0 (0.0%) | 0 (0.0%) |
| Total | 0 (0.0%) | 0 (0.0%) |
Employment Characteristics in Packwaukee
Employment by Class of Employer in Packwaukee
Among the 68 employed individuals in Packwaukee, private company employees (47 | 69.1%), local government employees (10 | 14.7%), and self-employed (not incorporated) (9 | 13.2%) make up the most common classes of employment.
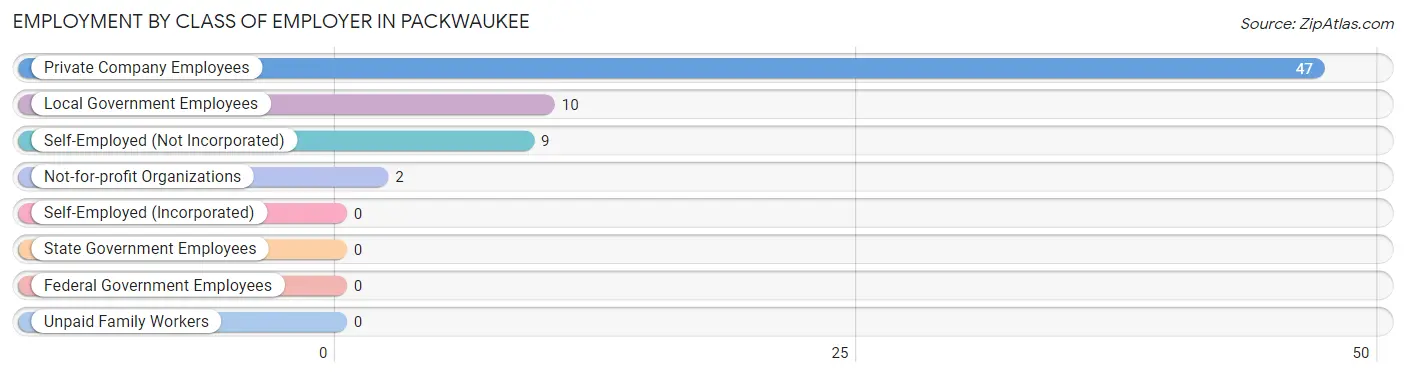
| Employer Class | # Employees | % Employees |
| Private Company Employees | 47 | 69.1% |
| Self-Employed (Incorporated) | 0 | 0.0% |
| Self-Employed (Not Incorporated) | 9 | 13.2% |
| Not-for-profit Organizations | 2 | 2.9% |
| Local Government Employees | 10 | 14.7% |
| State Government Employees | 0 | 0.0% |
| Federal Government Employees | 0 | 0.0% |
| Unpaid Family Workers | 0 | 0.0% |
| Total | 68 | 100.0% |
Employment Status by Age in Packwaukee
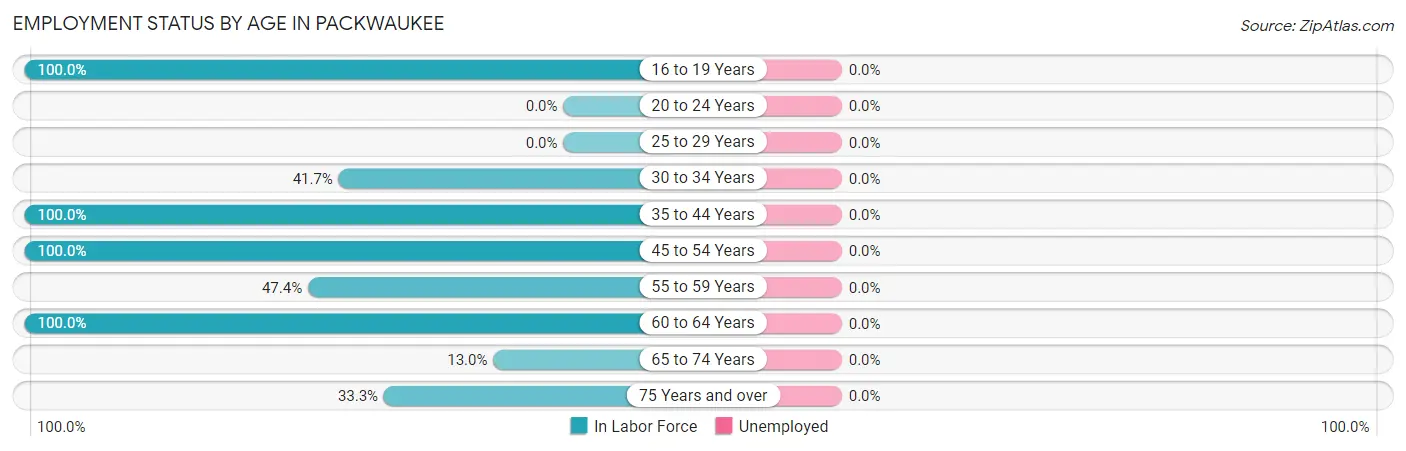
| Age Bracket | In Labor Force | Unemployed |
| 16 to 19 Years | 9 (100.0%) | 0 (0.0%) |
| 20 to 24 Years | 0 (0.0%) | 0 (0.0%) |
| 25 to 29 Years | 0 (0.0%) | 0 (0.0%) |
| 30 to 34 Years | 5 (41.7%) | 0 (0.0%) |
| 35 to 44 Years | 2 (100.0%) | 0 (0.0%) |
| 45 to 54 Years | 14 (100.0%) | 0 (0.0%) |
| 55 to 59 Years | 9 (47.4%) | 0 (0.0%) |
| 60 to 64 Years | 9 (100.0%) | 0 (0.0%) |
| 65 to 74 Years | 10 (13.0%) | 0 (0.0%) |
| 75 Years and over | 10 (33.3%) | 0 (0.0%) |
| Total | 68 (39.5%) | 0 (0.0%) |
Employment Status by Educational Attainment in Packwaukee
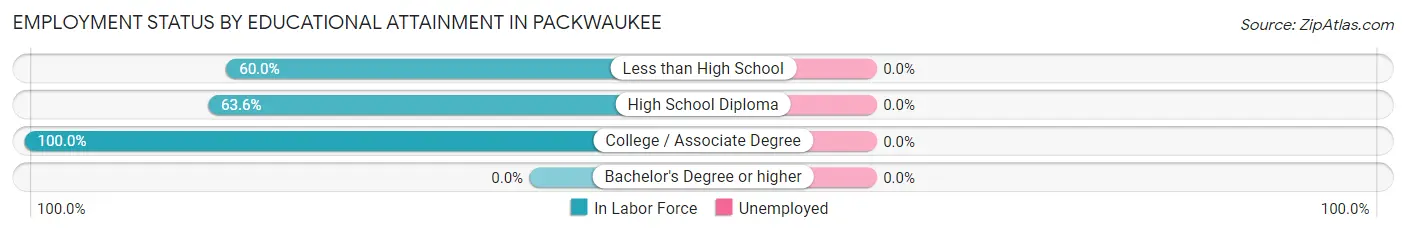
| Educational Attainment | In Labor Force | Unemployed |
| Less than High School | 3 (60.0%) | 0 (0.0%) |
| High School Diploma | 21 (63.6%) | 0 (0.0%) |
| College / Associate Degree | 15 (100.0%) | 0 (0.0%) |
| Bachelor's Degree or higher | 0 (0.0%) | 0 (0.0%) |
| Total | 39 (69.6%) | 0 (0.0%) |
Employment Occupations by Sex in Packwaukee
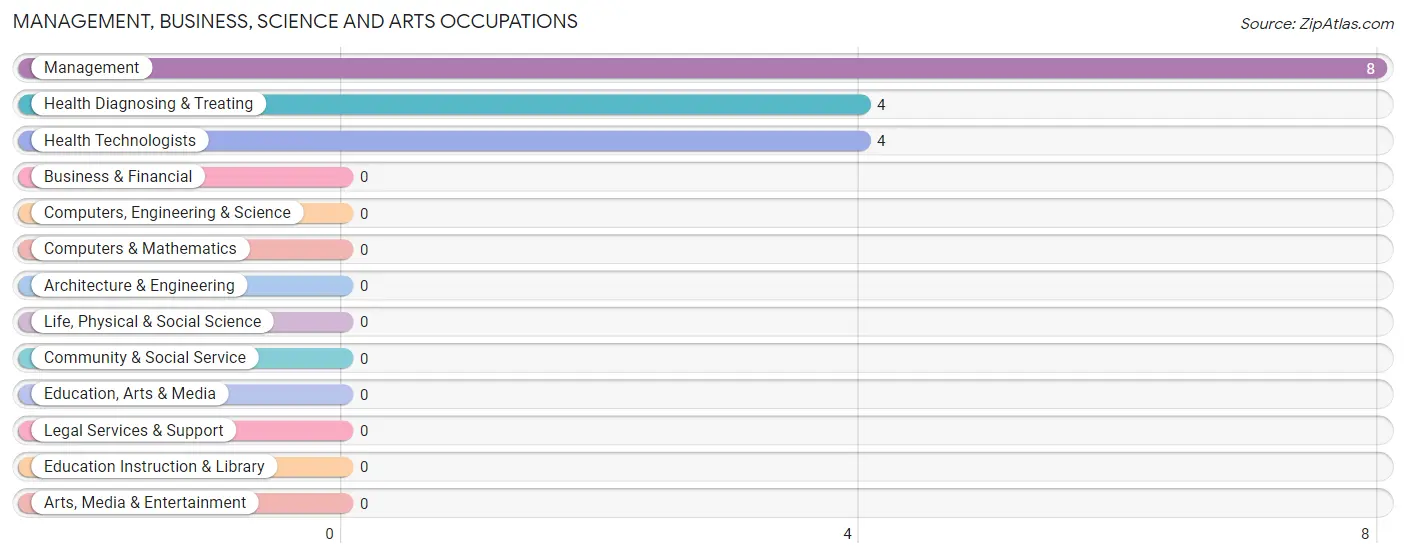
Management, Business, Science and Arts Occupations
The most common Management, Business, Science and Arts occupations in Packwaukee are Management (8 | 11.8%), Health Diagnosing & Treating (4 | 5.9%), and Health Technologists (4 | 5.9%).
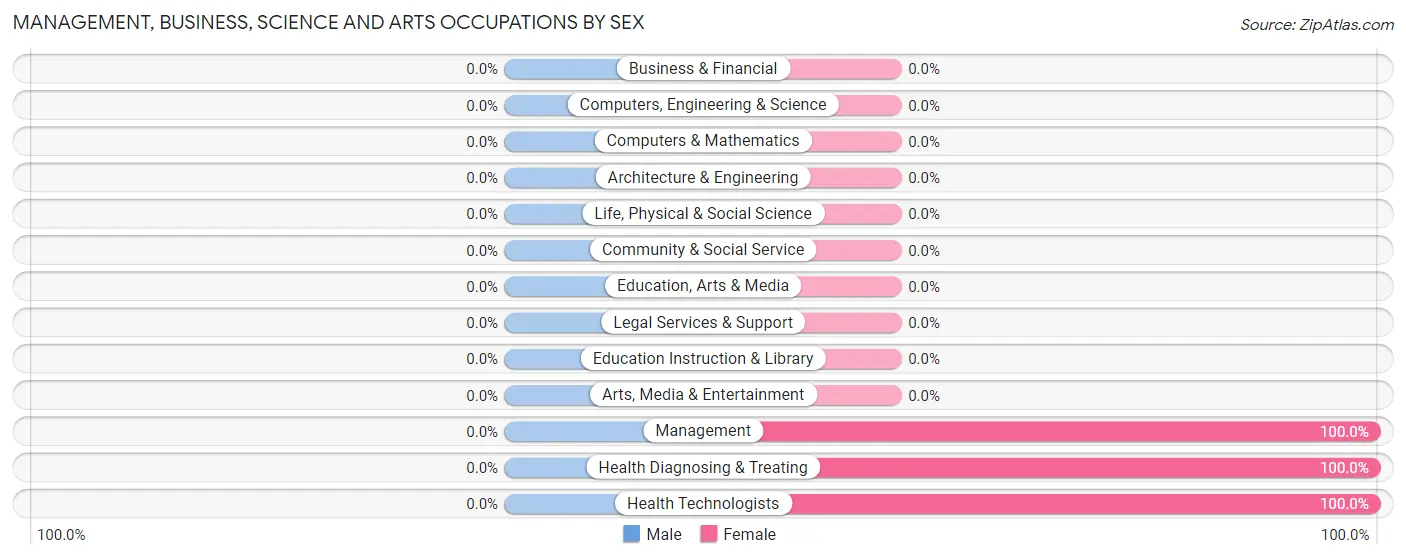
Management, Business, Science and Arts Occupations by Sex
| Occupation | Male | Female |
| Management | 0 (0.0%) | 8 (100.0%) |
| Business & Financial | 0 (0.0%) | 0 (0.0%) |
| Computers, Engineering & Science | 0 (0.0%) | 0 (0.0%) |
| Computers & Mathematics | 0 (0.0%) | 0 (0.0%) |
| Architecture & Engineering | 0 (0.0%) | 0 (0.0%) |
| Life, Physical & Social Science | 0 (0.0%) | 0 (0.0%) |
| Community & Social Service | 0 (0.0%) | 0 (0.0%) |
| Education, Arts & Media | 0 (0.0%) | 0 (0.0%) |
| Legal Services & Support | 0 (0.0%) | 0 (0.0%) |
| Education Instruction & Library | 0 (0.0%) | 0 (0.0%) |
| Arts, Media & Entertainment | 0 (0.0%) | 0 (0.0%) |
| Health Diagnosing & Treating | 0 (0.0%) | 4 (100.0%) |
| Health Technologists | 0 (0.0%) | 4 (100.0%) |
| Total (Category) | 0 (0.0%) | 12 (100.0%) |
| Total (Overall) | 39 (57.4%) | 29 (42.6%) |
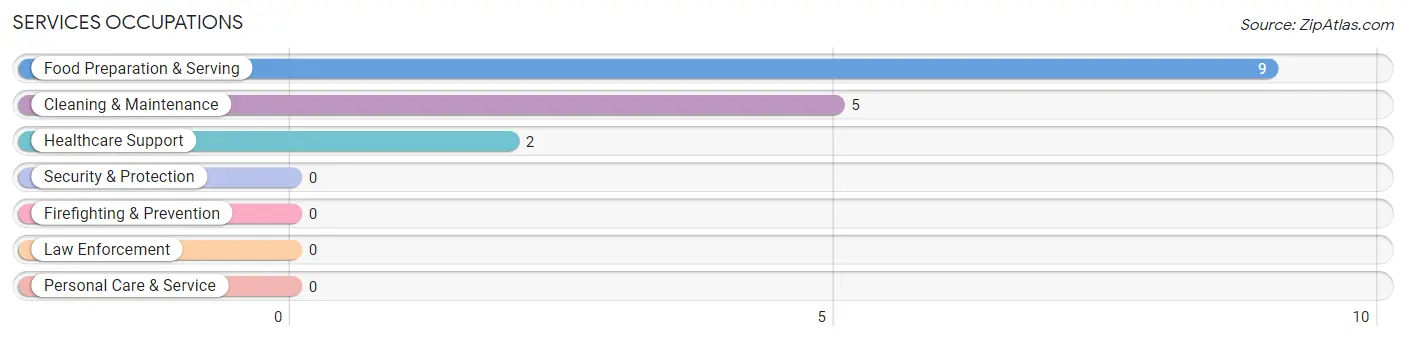
Services Occupations
The most common Services occupations in Packwaukee are Food Preparation & Serving (9 | 13.2%), Cleaning & Maintenance (5 | 7.3%), and Healthcare Support (2 | 2.9%).
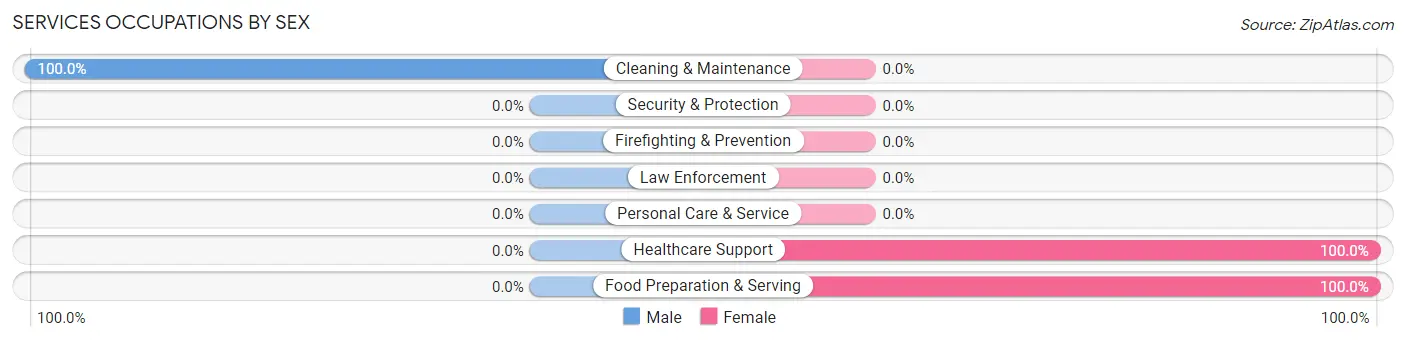
Services Occupations by Sex
| Occupation | Male | Female |
| Healthcare Support | 0 (0.0%) | 2 (100.0%) |
| Security & Protection | 0 (0.0%) | 0 (0.0%) |
| Firefighting & Prevention | 0 (0.0%) | 0 (0.0%) |
| Law Enforcement | 0 (0.0%) | 0 (0.0%) |
| Food Preparation & Serving | 0 (0.0%) | 9 (100.0%) |
| Cleaning & Maintenance | 5 (100.0%) | 0 (0.0%) |
| Personal Care & Service | 0 (0.0%) | 0 (0.0%) |
| Total (Category) | 5 (31.2%) | 11 (68.8%) |
| Total (Overall) | 39 (57.4%) | 29 (42.6%) |
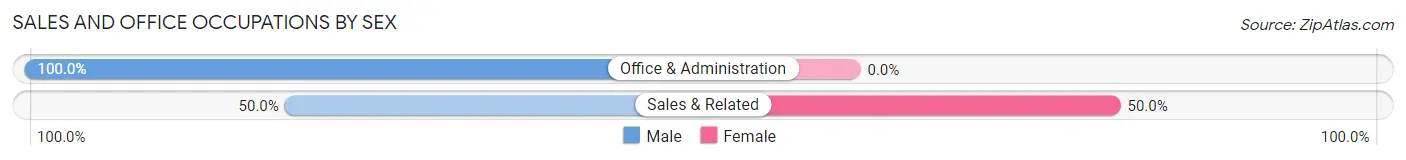
Sales and Office Occupations
The most common Sales and Office occupations in Packwaukee are Office & Administration (5 | 7.3%), and Sales & Related (4 | 5.9%).
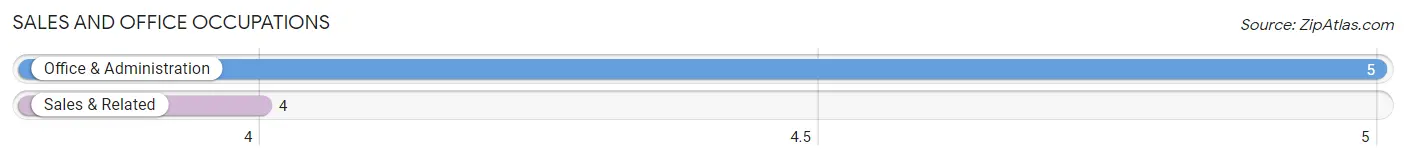
Sales and Office Occupations by Sex
| Occupation | Male | Female |
| Sales & Related | 2 (50.0%) | 2 (50.0%) |
| Office & Administration | 5 (100.0%) | 0 (0.0%) |
| Total (Category) | 7 (77.8%) | 2 (22.2%) |
| Total (Overall) | 39 (57.4%) | 29 (42.6%) |
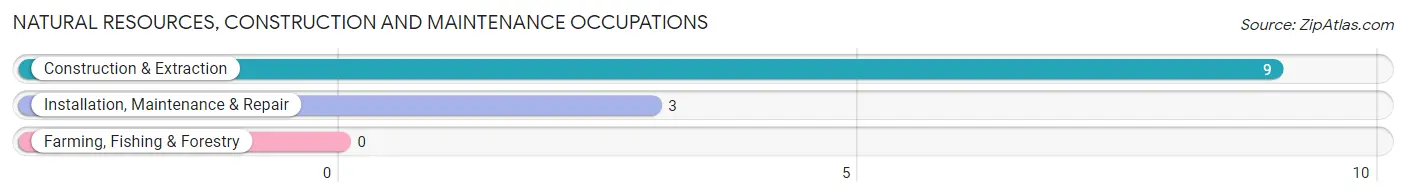
Natural Resources, Construction and Maintenance Occupations
The most common Natural Resources, Construction and Maintenance occupations in Packwaukee are Construction & Extraction (9 | 13.2%), and Installation, Maintenance & Repair (3 | 4.4%).
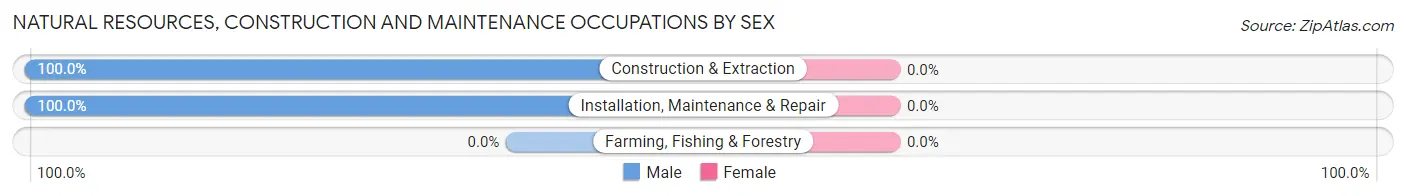
Natural Resources, Construction and Maintenance Occupations by Sex
| Occupation | Male | Female |
| Farming, Fishing & Forestry | 0 (0.0%) | 0 (0.0%) |
| Construction & Extraction | 9 (100.0%) | 0 (0.0%) |
| Installation, Maintenance & Repair | 3 (100.0%) | 0 (0.0%) |
| Total (Category) | 12 (100.0%) | 0 (0.0%) |
| Total (Overall) | 39 (57.4%) | 29 (42.6%) |
Production, Transportation and Moving Occupations
The most common Production, Transportation and Moving occupations in Packwaukee are Transportation (10 | 14.7%), Production (5 | 7.3%), and Material Moving (4 | 5.9%).
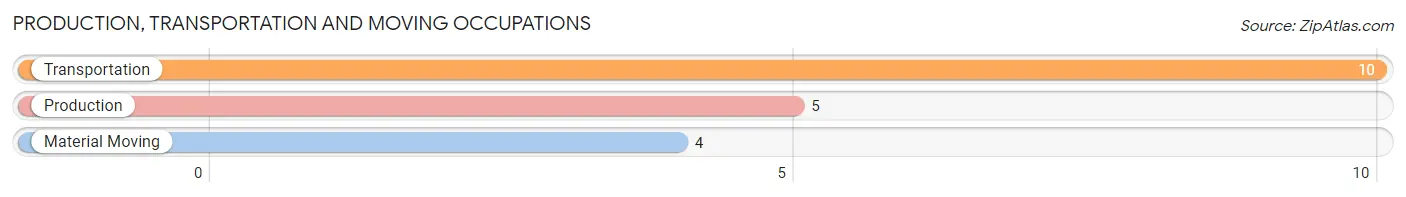
Production, Transportation and Moving Occupations by Sex
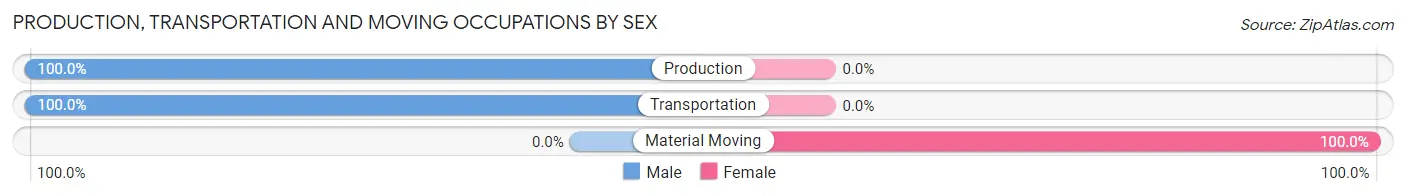
| Occupation | Male | Female |
| Production | 5 (100.0%) | 0 (0.0%) |
| Transportation | 10 (100.0%) | 0 (0.0%) |
| Material Moving | 0 (0.0%) | 4 (100.0%) |
| Total (Category) | 15 (78.9%) | 4 (21.0%) |
| Total (Overall) | 39 (57.4%) | 29 (42.6%) |
Employment Industries by Sex in Packwaukee
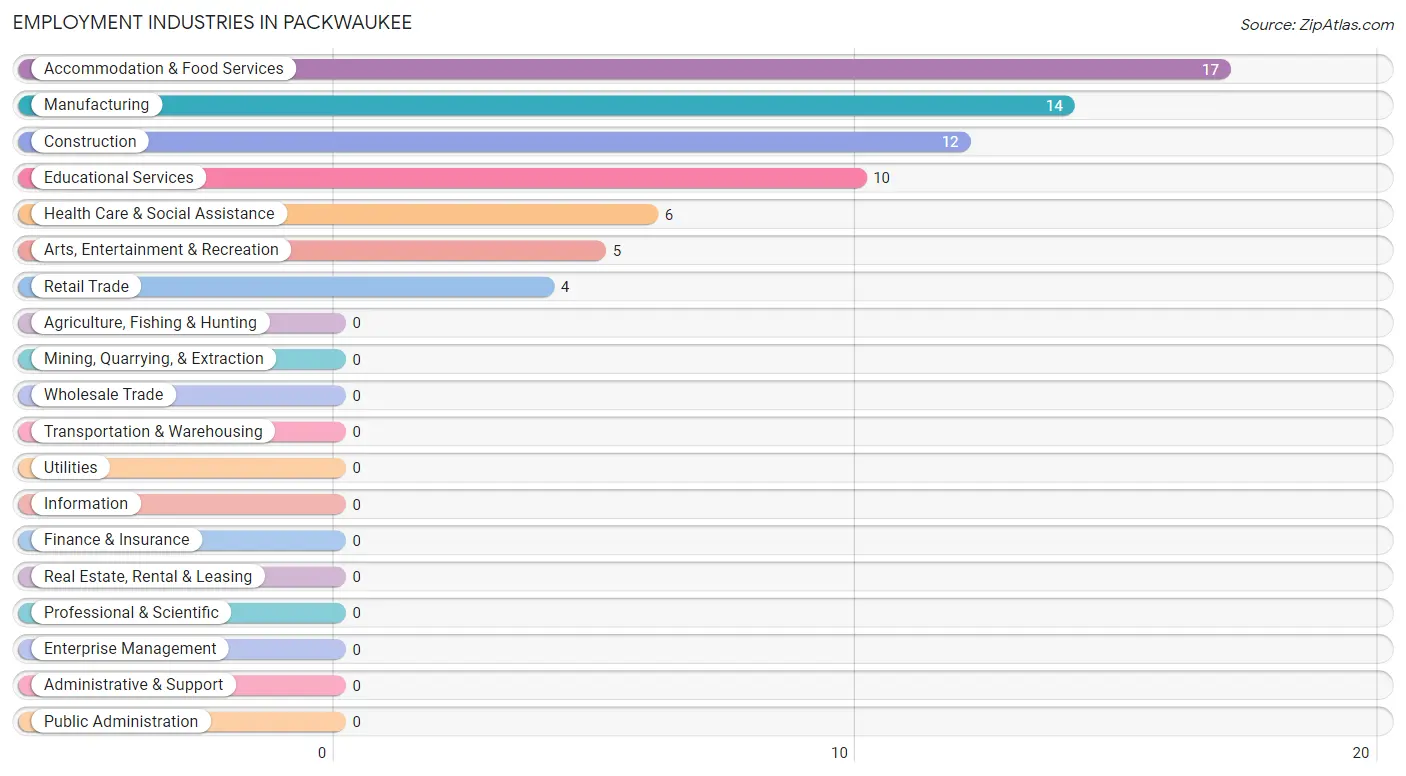
Employment Industries in Packwaukee
The major employment industries in Packwaukee include Accommodation & Food Services (17 | 25.0%), Manufacturing (14 | 20.6%), Construction (12 | 17.6%), Educational Services (10 | 14.7%), and Health Care & Social Assistance (6 | 8.8%).
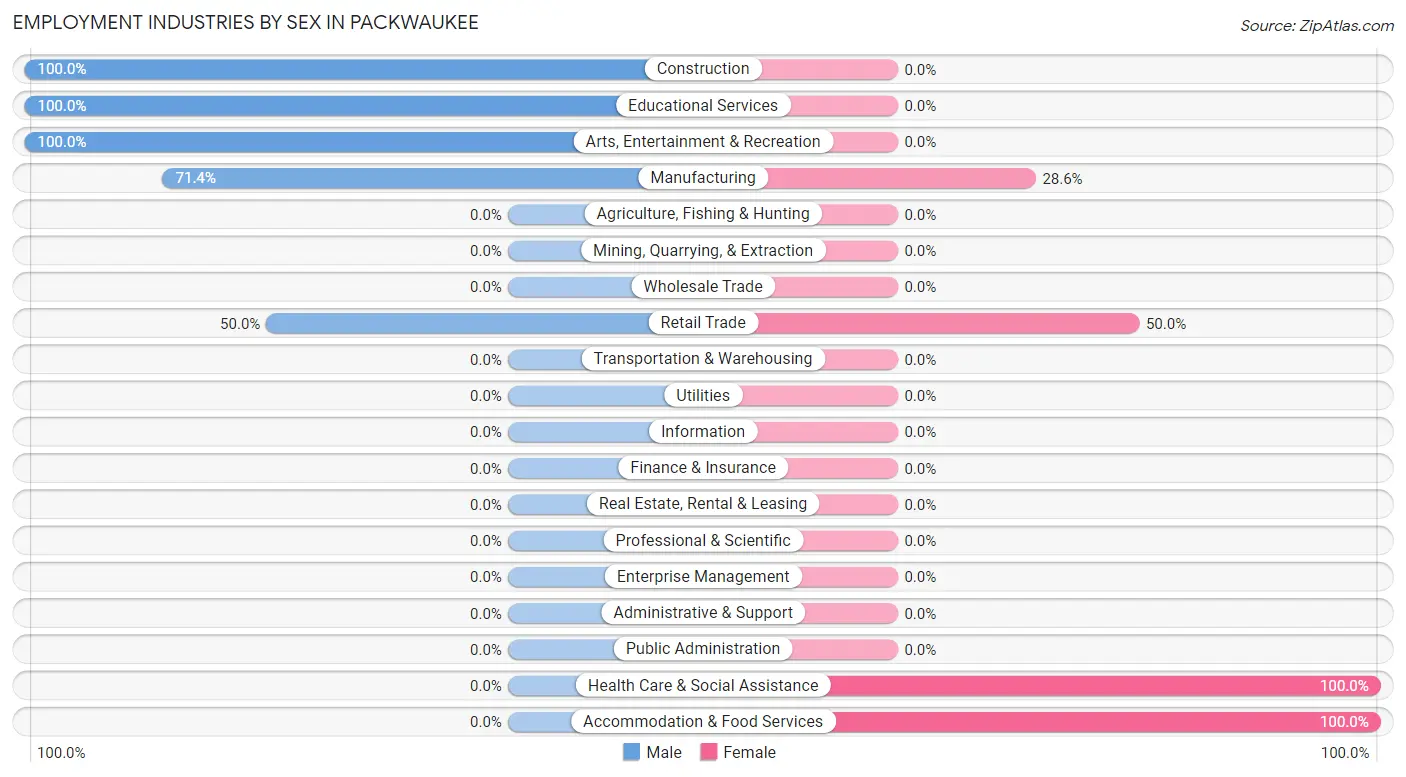
Employment Industries by Sex in Packwaukee
The Packwaukee industries that see more men than women are Construction (100.0%), Educational Services (100.0%), and Arts, Entertainment & Recreation (100.0%), whereas the industries that tend to have a higher number of women are Health Care & Social Assistance (100.0%), Accommodation & Food Services (100.0%), and Retail Trade (50.0%).
| Industry | Male | Female |
| Agriculture, Fishing & Hunting | 0 (0.0%) | 0 (0.0%) |
| Mining, Quarrying, & Extraction | 0 (0.0%) | 0 (0.0%) |
| Construction | 12 (100.0%) | 0 (0.0%) |
| Manufacturing | 10 (71.4%) | 4 (28.6%) |
| Wholesale Trade | 0 (0.0%) | 0 (0.0%) |
| Retail Trade | 2 (50.0%) | 2 (50.0%) |
| Transportation & Warehousing | 0 (0.0%) | 0 (0.0%) |
| Utilities | 0 (0.0%) | 0 (0.0%) |
| Information | 0 (0.0%) | 0 (0.0%) |
| Finance & Insurance | 0 (0.0%) | 0 (0.0%) |
| Real Estate, Rental & Leasing | 0 (0.0%) | 0 (0.0%) |
| Professional & Scientific | 0 (0.0%) | 0 (0.0%) |
| Enterprise Management | 0 (0.0%) | 0 (0.0%) |
| Administrative & Support | 0 (0.0%) | 0 (0.0%) |
| Educational Services | 10 (100.0%) | 0 (0.0%) |
| Health Care & Social Assistance | 0 (0.0%) | 6 (100.0%) |
| Arts, Entertainment & Recreation | 5 (100.0%) | 0 (0.0%) |
| Accommodation & Food Services | 0 (0.0%) | 17 (100.0%) |
| Public Administration | 0 (0.0%) | 0 (0.0%) |
| Total | 39 (57.4%) | 29 (42.6%) |
Education in Packwaukee
School Enrollment in Packwaukee
The most common levels of schooling among the 37 students in Packwaukee are elementary school (10 | 27.0%), college / undergraduate (9 | 24.3%), and kindergarten (7 | 18.9%).
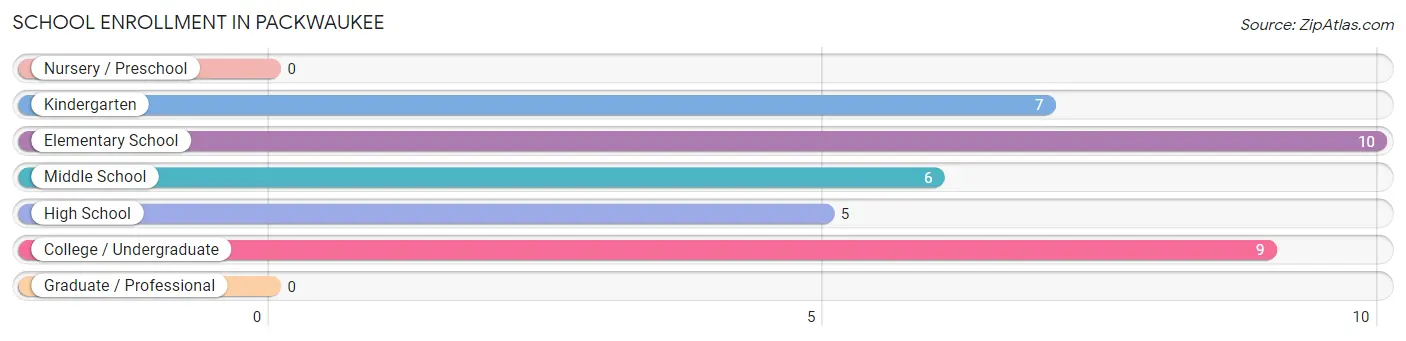
| School Level | # Students | % Students |
| Nursery / Preschool | 0 | 0.0% |
| Kindergarten | 7 | 18.9% |
| Elementary School | 10 | 27.0% |
| Middle School | 6 | 16.2% |
| High School | 5 | 13.5% |
| College / Undergraduate | 9 | 24.3% |
| Graduate / Professional | 0 | 0.0% |
| Total | 37 | 100.0% |
School Enrollment by Age by Funding Source in Packwaukee
Out of a total of 37 students who are enrolled in schools in Packwaukee, 9 (24.3%) attend a private institution, while the remaining 28 (75.7%) are enrolled in public schools. The age group of 18 to 19 year olds has the highest likelihood of being enrolled in private schools, with 9 (100.0% in the age bracket) enrolled. Conversely, the age group of 3 to 4 year olds has the lowest likelihood of being enrolled in a private school, with 7 (100.0% in the age bracket) attending a public institution.
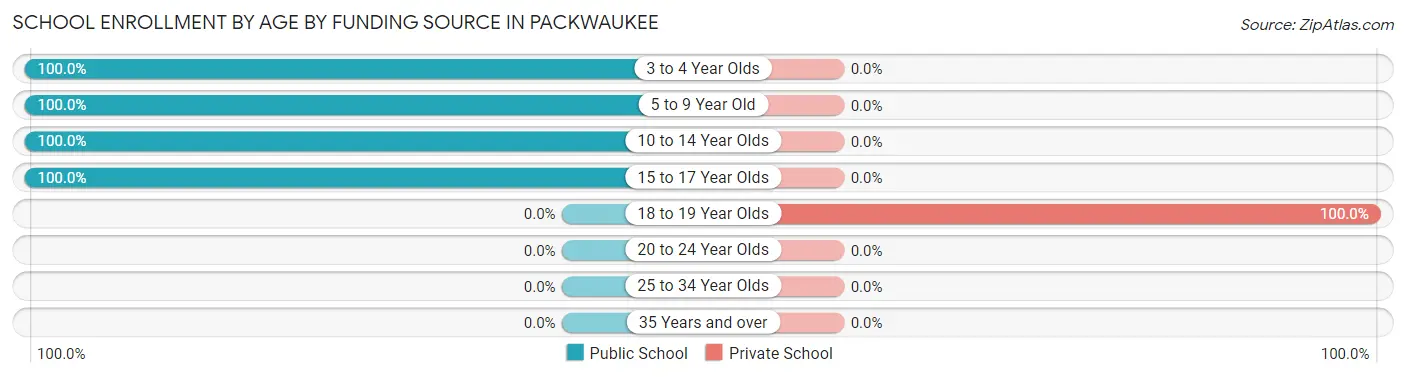
| Age Bracket | Public School | Private School |
| 3 to 4 Year Olds | 7 (100.0%) | 0 (0.0%) |
| 5 to 9 Year Old | 10 (100.0%) | 0 (0.0%) |
| 10 to 14 Year Olds | 6 (100.0%) | 0 (0.0%) |
| 15 to 17 Year Olds | 5 (100.0%) | 0 (0.0%) |
| 18 to 19 Year Olds | 0 (0.0%) | 9 (100.0%) |
| 20 to 24 Year Olds | 0 (0.0%) | 0 (0.0%) |
| 25 to 34 Year Olds | 0 (0.0%) | 0 (0.0%) |
| 35 Years and over | 0 (0.0%) | 0 (0.0%) |
| Total | 28 (75.7%) | 9 (24.3%) |
Educational Attainment by Field of Study in Packwaukee
Psychology (4 | 30.8%), social sciences (4 | 30.8%), business (4 | 30.8%), and education (1 | 7.7%) are the most common fields of study among 13 individuals in Packwaukee who have obtained a bachelor's degree or higher.
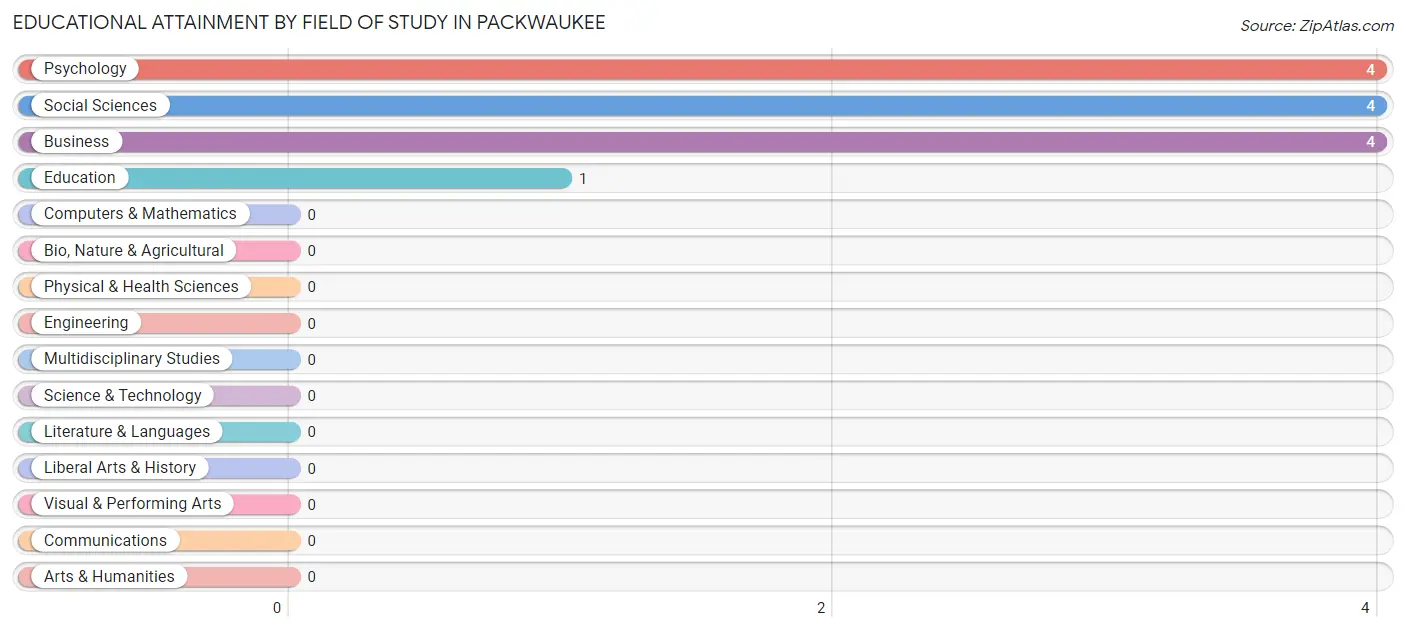
| Field of Study | # Graduates | % Graduates |
| Computers & Mathematics | 0 | 0.0% |
| Bio, Nature & Agricultural | 0 | 0.0% |
| Physical & Health Sciences | 0 | 0.0% |
| Psychology | 4 | 30.8% |
| Social Sciences | 4 | 30.8% |
| Engineering | 0 | 0.0% |
| Multidisciplinary Studies | 0 | 0.0% |
| Science & Technology | 0 | 0.0% |
| Business | 4 | 30.8% |
| Education | 1 | 7.7% |
| Literature & Languages | 0 | 0.0% |
| Liberal Arts & History | 0 | 0.0% |
| Visual & Performing Arts | 0 | 0.0% |
| Communications | 0 | 0.0% |
| Arts & Humanities | 0 | 0.0% |
| Total | 13 | 100.0% |
Transportation & Commute in Packwaukee
Vehicle Availability by Sex in Packwaukee
The most prevalent vehicle ownership categories in Packwaukee are males with 3 vehicles (14, accounting for 35.9%) and females with 3 vehicles (9, making up 48.3%).
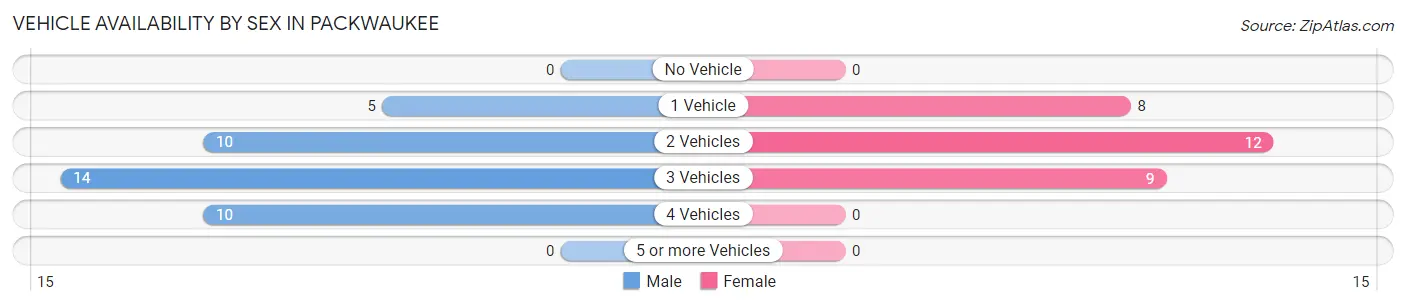
| Vehicles Available | Male | Female |
| No Vehicle | 0 (0.0%) | 0 (0.0%) |
| 1 Vehicle | 5 (12.8%) | 8 (27.6%) |
| 2 Vehicles | 10 (25.6%) | 12 (41.4%) |
| 3 Vehicles | 14 (35.9%) | 9 (31.0%) |
| 4 Vehicles | 10 (25.6%) | 0 (0.0%) |
| 5 or more Vehicles | 0 (0.0%) | 0 (0.0%) |
| Total | 39 (100.0%) | 29 (100.0%) |
Commute Time in Packwaukee
The most frequently occuring commute durations in Packwaukee are 20 to 24 minutes (15 commuters, 25.4%), 30 to 34 minutes (15 commuters, 25.4%), and 15 to 19 minutes (11 commuters, 18.6%).
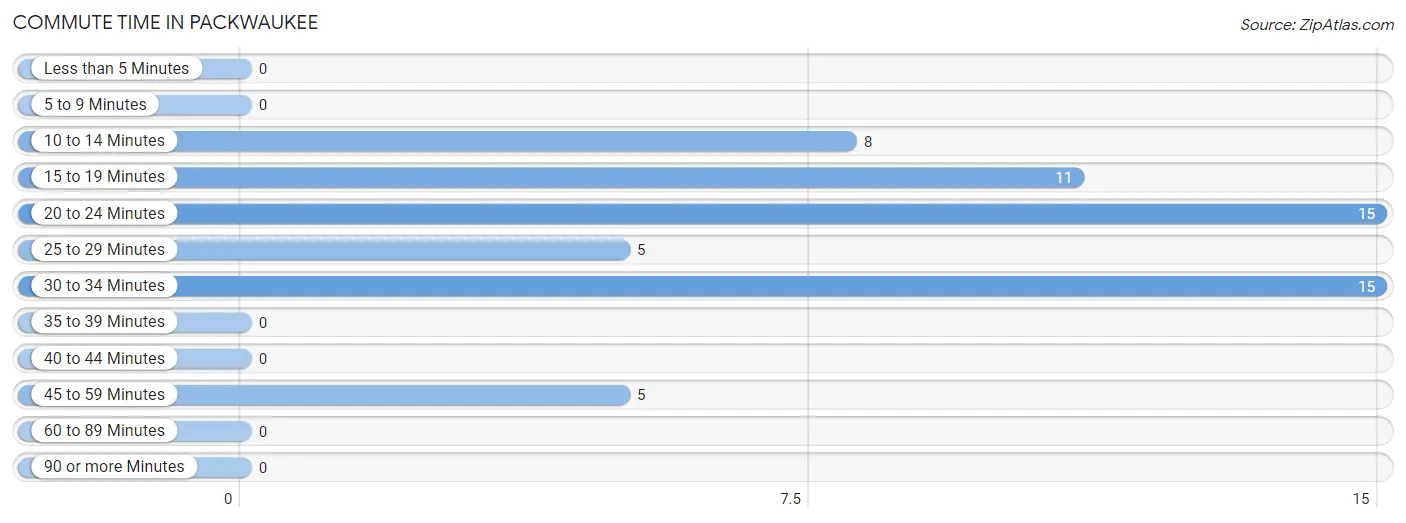
| Commute Time | # Commuters | % Commuters |
| Less than 5 Minutes | 0 | 0.0% |
| 5 to 9 Minutes | 0 | 0.0% |
| 10 to 14 Minutes | 8 | 13.6% |
| 15 to 19 Minutes | 11 | 18.6% |
| 20 to 24 Minutes | 15 | 25.4% |
| 25 to 29 Minutes | 5 | 8.5% |
| 30 to 34 Minutes | 15 | 25.4% |
| 35 to 39 Minutes | 0 | 0.0% |
| 40 to 44 Minutes | 0 | 0.0% |
| 45 to 59 Minutes | 5 | 8.5% |
| 60 to 89 Minutes | 0 | 0.0% |
| 90 or more Minutes | 0 | 0.0% |
Commute Time by Sex in Packwaukee
The most common commute times in Packwaukee are 30 to 34 minutes (15 commuters, 50.0%) for males and 20 to 24 minutes (15 commuters, 51.7%) for females.
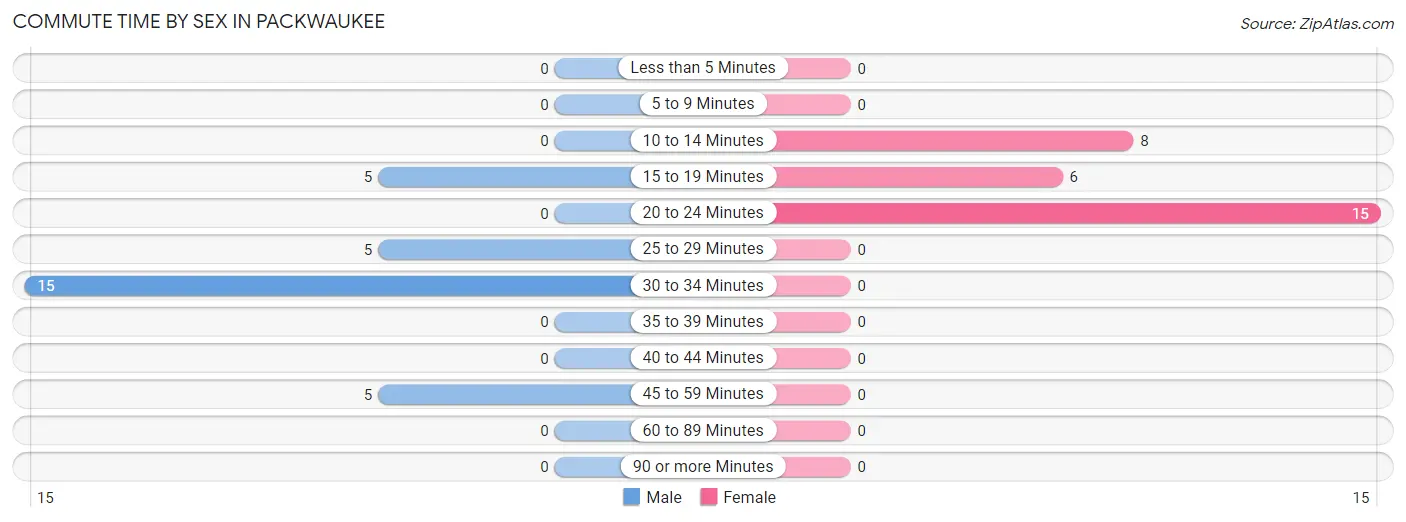
| Commute Time | Male | Female |
| Less than 5 Minutes | 0 (0.0%) | 0 (0.0%) |
| 5 to 9 Minutes | 0 (0.0%) | 0 (0.0%) |
| 10 to 14 Minutes | 0 (0.0%) | 8 (27.6%) |
| 15 to 19 Minutes | 5 (16.7%) | 6 (20.7%) |
| 20 to 24 Minutes | 0 (0.0%) | 15 (51.7%) |
| 25 to 29 Minutes | 5 (16.7%) | 0 (0.0%) |
| 30 to 34 Minutes | 15 (50.0%) | 0 (0.0%) |
| 35 to 39 Minutes | 0 (0.0%) | 0 (0.0%) |
| 40 to 44 Minutes | 0 (0.0%) | 0 (0.0%) |
| 45 to 59 Minutes | 5 (16.7%) | 0 (0.0%) |
| 60 to 89 Minutes | 0 (0.0%) | 0 (0.0%) |
| 90 or more Minutes | 0 (0.0%) | 0 (0.0%) |
Time of Departure to Work by Sex in Packwaukee
The most frequent times of departure to work in Packwaukee are 12:00 PM to 3:59 PM (10, 33.3%) for males and 7:30 AM to 7:59 AM (21, 72.4%) for females.
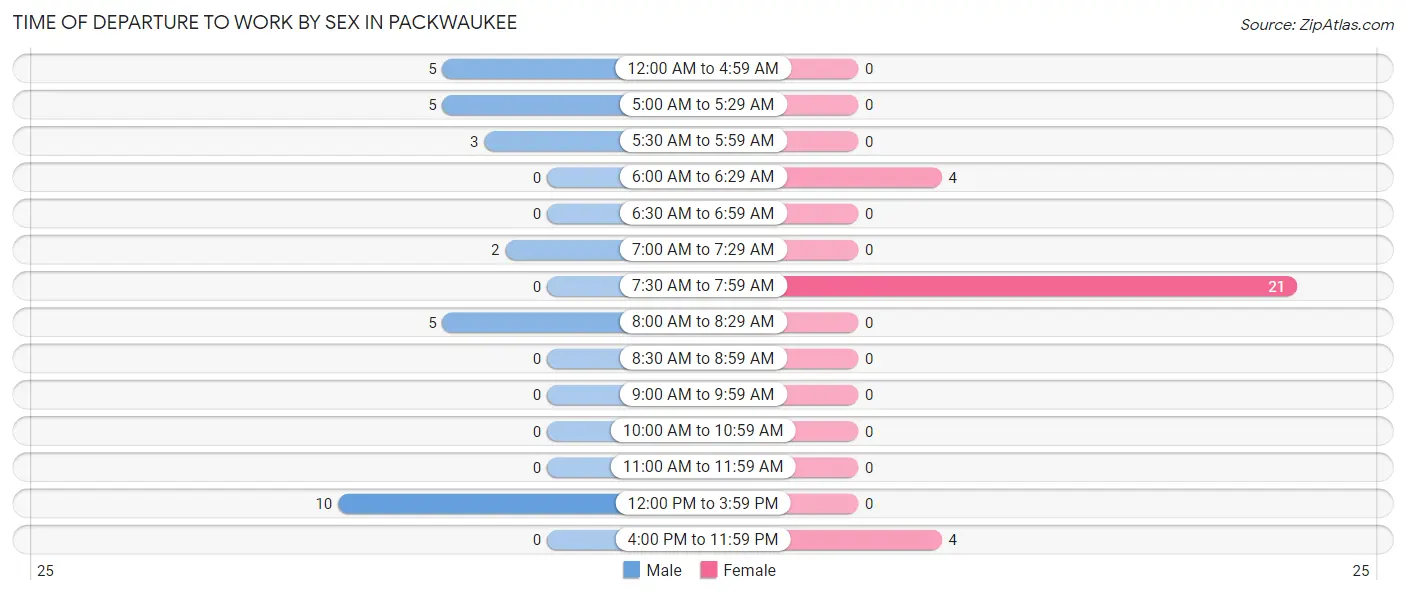
| Time of Departure | Male | Female |
| 12:00 AM to 4:59 AM | 5 (16.7%) | 0 (0.0%) |
| 5:00 AM to 5:29 AM | 5 (16.7%) | 0 (0.0%) |
| 5:30 AM to 5:59 AM | 3 (10.0%) | 0 (0.0%) |
| 6:00 AM to 6:29 AM | 0 (0.0%) | 4 (13.8%) |
| 6:30 AM to 6:59 AM | 0 (0.0%) | 0 (0.0%) |
| 7:00 AM to 7:29 AM | 2 (6.7%) | 0 (0.0%) |
| 7:30 AM to 7:59 AM | 0 (0.0%) | 21 (72.4%) |
| 8:00 AM to 8:29 AM | 5 (16.7%) | 0 (0.0%) |
| 8:30 AM to 8:59 AM | 0 (0.0%) | 0 (0.0%) |
| 9:00 AM to 9:59 AM | 0 (0.0%) | 0 (0.0%) |
| 10:00 AM to 10:59 AM | 0 (0.0%) | 0 (0.0%) |
| 11:00 AM to 11:59 AM | 0 (0.0%) | 0 (0.0%) |
| 12:00 PM to 3:59 PM | 10 (33.3%) | 0 (0.0%) |
| 4:00 PM to 11:59 PM | 0 (0.0%) | 4 (13.8%) |
| Total | 30 (100.0%) | 29 (100.0%) |
Housing Occupancy in Packwaukee
Occupancy by Ownership in Packwaukee
Of the total 106 dwellings in Packwaukee, owner-occupied units account for 86 (81.1%), while renter-occupied units make up 20 (18.9%).
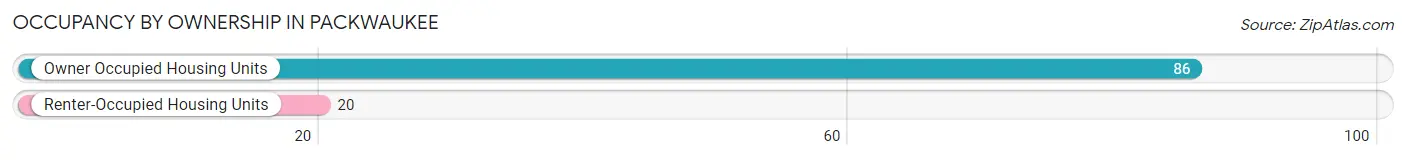
| Occupancy | # Housing Units | % Housing Units |
| Owner Occupied Housing Units | 86 | 81.1% |
| Renter-Occupied Housing Units | 20 | 18.9% |
| Total Occupied Housing Units | 106 | 100.0% |
Occupancy by Household Size in Packwaukee
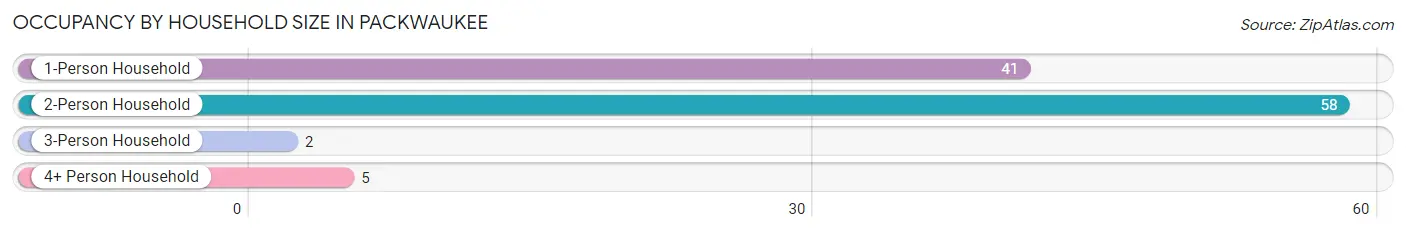
| Household Size | # Housing Units | % Housing Units |
| 1-Person Household | 41 | 38.7% |
| 2-Person Household | 58 | 54.7% |
| 3-Person Household | 2 | 1.9% |
| 4+ Person Household | 5 | 4.7% |
| Total Housing Units | 106 | 100.0% |
Occupancy by Ownership by Household Size in Packwaukee
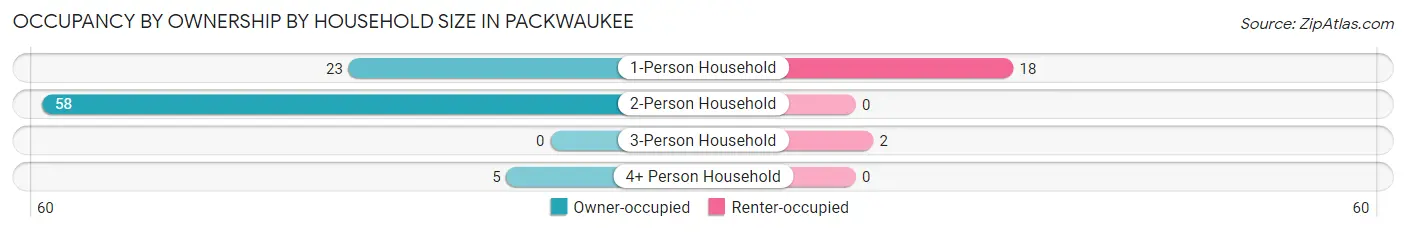
| Household Size | Owner-occupied | Renter-occupied |
| 1-Person Household | 23 (56.1%) | 18 (43.9%) |
| 2-Person Household | 58 (100.0%) | 0 (0.0%) |
| 3-Person Household | 0 (0.0%) | 2 (100.0%) |
| 4+ Person Household | 5 (100.0%) | 0 (0.0%) |
| Total Housing Units | 86 (81.1%) | 20 (18.9%) |
Occupancy by Educational Attainment in Packwaukee
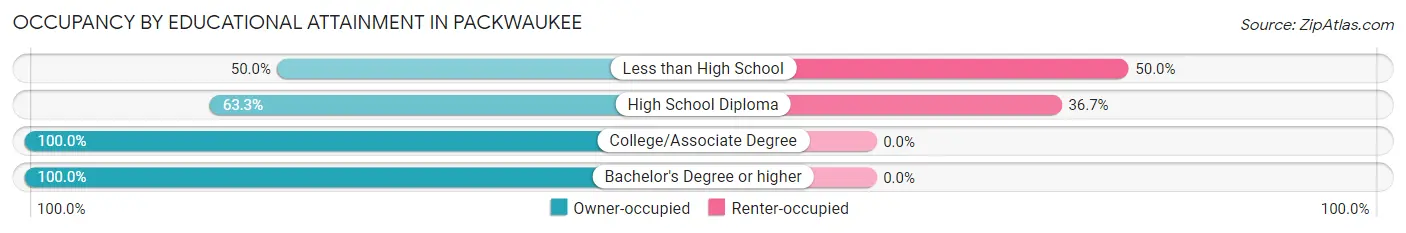
| Household Size | Owner-occupied | Renter-occupied |
| Less than High School | 2 (50.0%) | 2 (50.0%) |
| High School Diploma | 31 (63.3%) | 18 (36.7%) |
| College/Associate Degree | 44 (100.0%) | 0 (0.0%) |
| Bachelor's Degree or higher | 9 (100.0%) | 0 (0.0%) |
Occupancy by Age of Householder in Packwaukee
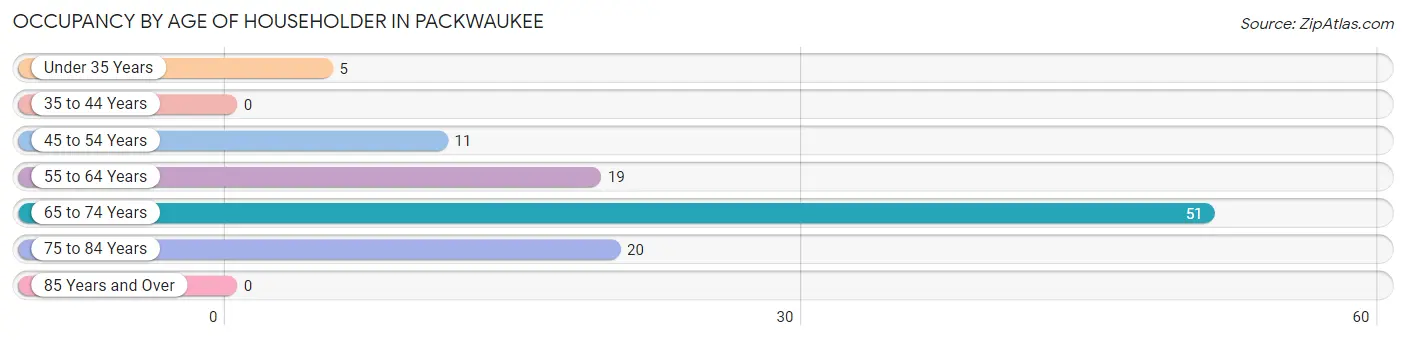
| Age Bracket | # Households | % Households |
| Under 35 Years | 5 | 4.7% |
| 35 to 44 Years | 0 | 0.0% |
| 45 to 54 Years | 11 | 10.4% |
| 55 to 64 Years | 19 | 17.9% |
| 65 to 74 Years | 51 | 48.1% |
| 75 to 84 Years | 20 | 18.9% |
| 85 Years and Over | 0 | 0.0% |
| Total | 106 | 100.0% |
Housing Finances in Packwaukee
Median Income by Occupancy in Packwaukee
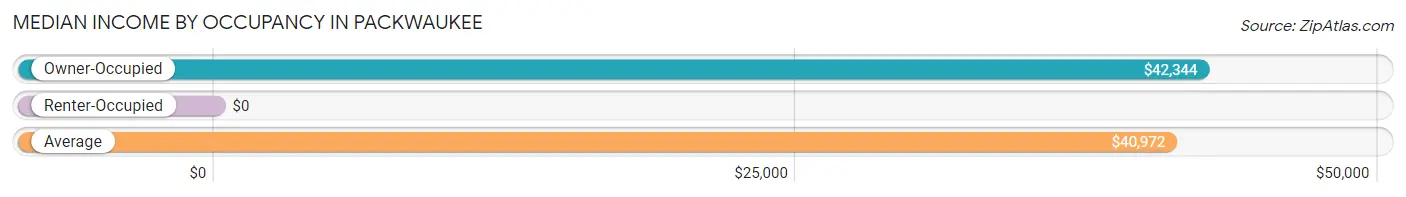
| Occupancy Type | # Households | Median Income |
| Owner-Occupied | 86 (81.1%) | $42,344 |
| Renter-Occupied | 20 (18.9%) | $0 |
| Average | 106 (100.0%) | $40,972 |
Occupancy by Householder Income Bracket in Packwaukee
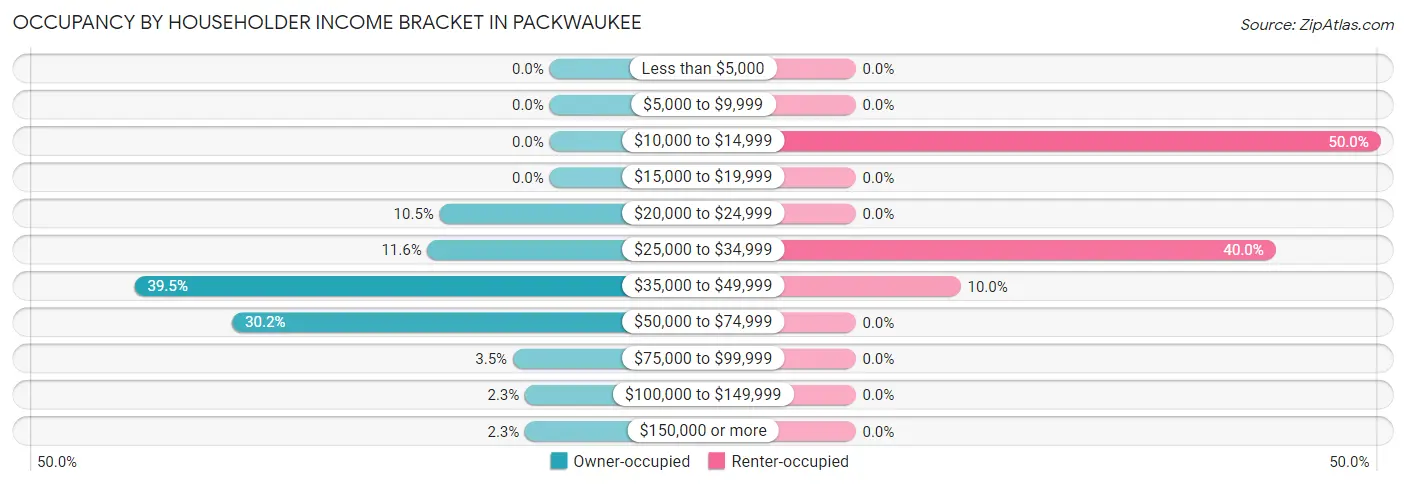
| Income Bracket | Owner-occupied | Renter-occupied |
| Less than $5,000 | 0 (0.0%) | 0 (0.0%) |
| $5,000 to $9,999 | 0 (0.0%) | 0 (0.0%) |
| $10,000 to $14,999 | 0 (0.0%) | 10 (50.0%) |
| $15,000 to $19,999 | 0 (0.0%) | 0 (0.0%) |
| $20,000 to $24,999 | 9 (10.5%) | 0 (0.0%) |
| $25,000 to $34,999 | 10 (11.6%) | 8 (40.0%) |
| $35,000 to $49,999 | 34 (39.5%) | 2 (10.0%) |
| $50,000 to $74,999 | 26 (30.2%) | 0 (0.0%) |
| $75,000 to $99,999 | 3 (3.5%) | 0 (0.0%) |
| $100,000 to $149,999 | 2 (2.3%) | 0 (0.0%) |
| $150,000 or more | 2 (2.3%) | 0 (0.0%) |
| Total | 86 (100.0%) | 20 (100.0%) |
Monthly Housing Cost Tiers in Packwaukee
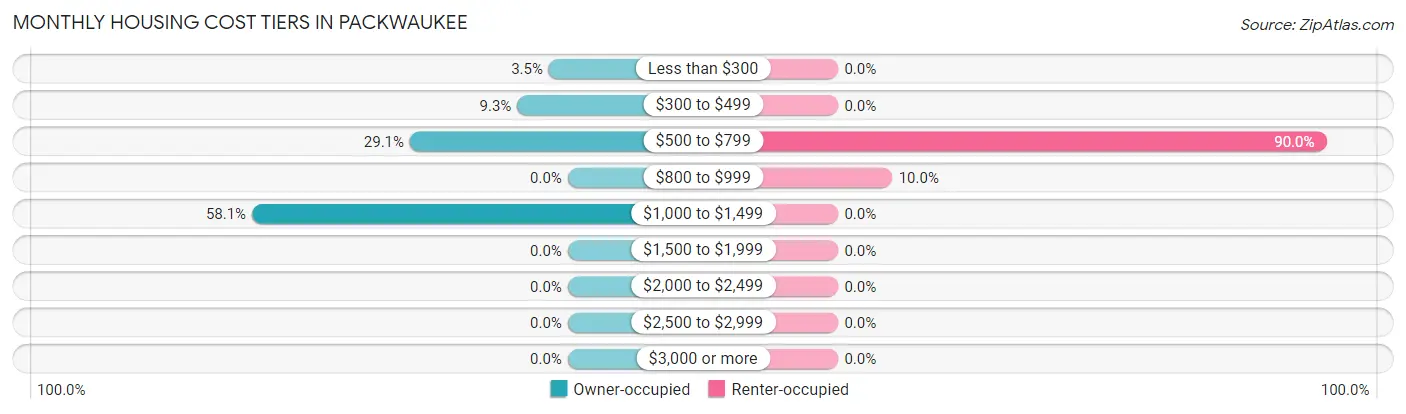
| Monthly Cost | Owner-occupied | Renter-occupied |
| Less than $300 | 3 (3.5%) | 0 (0.0%) |
| $300 to $499 | 8 (9.3%) | 0 (0.0%) |
| $500 to $799 | 25 (29.1%) | 18 (90.0%) |
| $800 to $999 | 0 (0.0%) | 2 (10.0%) |
| $1,000 to $1,499 | 50 (58.1%) | 0 (0.0%) |
| $1,500 to $1,999 | 0 (0.0%) | 0 (0.0%) |
| $2,000 to $2,499 | 0 (0.0%) | 0 (0.0%) |
| $2,500 to $2,999 | 0 (0.0%) | 0 (0.0%) |
| $3,000 or more | 0 (0.0%) | 0 (0.0%) |
| Total | 86 (100.0%) | 20 (100.0%) |
Physical Housing Characteristics in Packwaukee
Housing Structures in Packwaukee
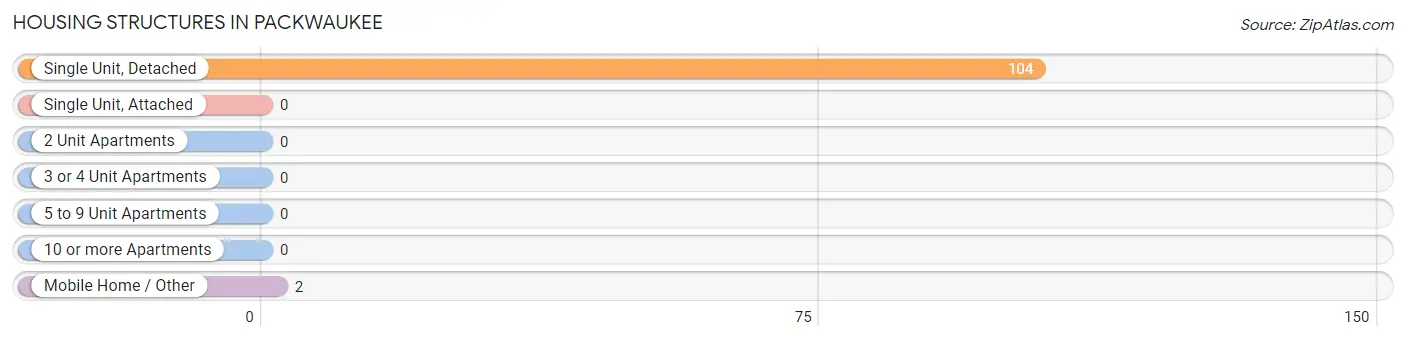
| Structure Type | # Housing Units | % Housing Units |
| Single Unit, Detached | 104 | 98.1% |
| Single Unit, Attached | 0 | 0.0% |
| 2 Unit Apartments | 0 | 0.0% |
| 3 or 4 Unit Apartments | 0 | 0.0% |
| 5 to 9 Unit Apartments | 0 | 0.0% |
| 10 or more Apartments | 0 | 0.0% |
| Mobile Home / Other | 2 | 1.9% |
| Total | 106 | 100.0% |
Housing Structures by Occupancy in Packwaukee
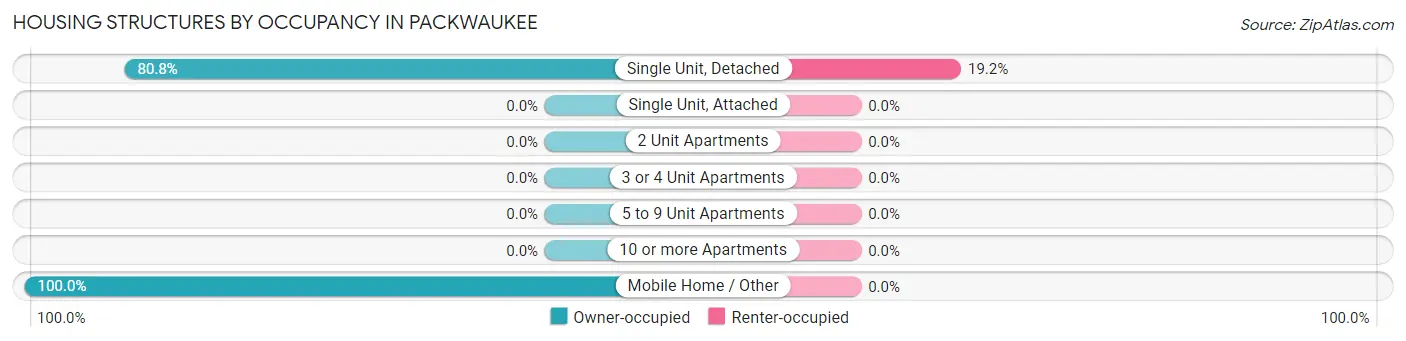
| Structure Type | Owner-occupied | Renter-occupied |
| Single Unit, Detached | 84 (80.8%) | 20 (19.2%) |
| Single Unit, Attached | 0 (0.0%) | 0 (0.0%) |
| 2 Unit Apartments | 0 (0.0%) | 0 (0.0%) |
| 3 or 4 Unit Apartments | 0 (0.0%) | 0 (0.0%) |
| 5 to 9 Unit Apartments | 0 (0.0%) | 0 (0.0%) |
| 10 or more Apartments | 0 (0.0%) | 0 (0.0%) |
| Mobile Home / Other | 2 (100.0%) | 0 (0.0%) |
| Total | 86 (81.1%) | 20 (18.9%) |
Housing Structures by Number of Rooms in Packwaukee
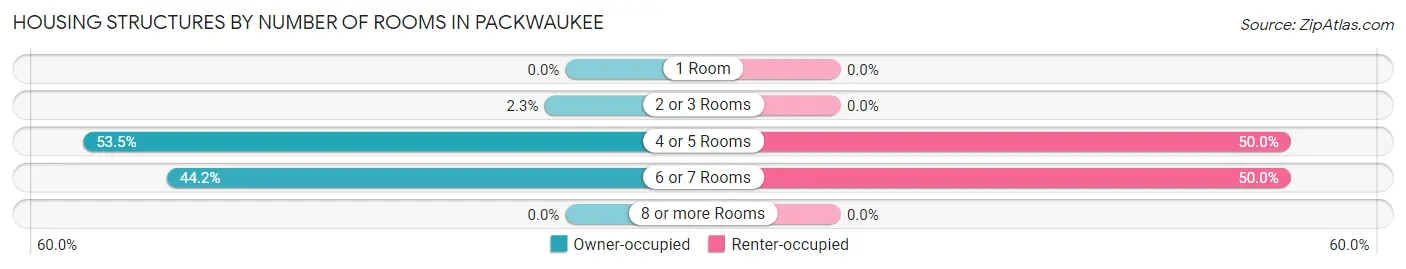
| Number of Rooms | Owner-occupied | Renter-occupied |
| 1 Room | 0 (0.0%) | 0 (0.0%) |
| 2 or 3 Rooms | 2 (2.3%) | 0 (0.0%) |
| 4 or 5 Rooms | 46 (53.5%) | 10 (50.0%) |
| 6 or 7 Rooms | 38 (44.2%) | 10 (50.0%) |
| 8 or more Rooms | 0 (0.0%) | 0 (0.0%) |
| Total | 86 (100.0%) | 20 (100.0%) |
Housing Structure by Heating Type in Packwaukee
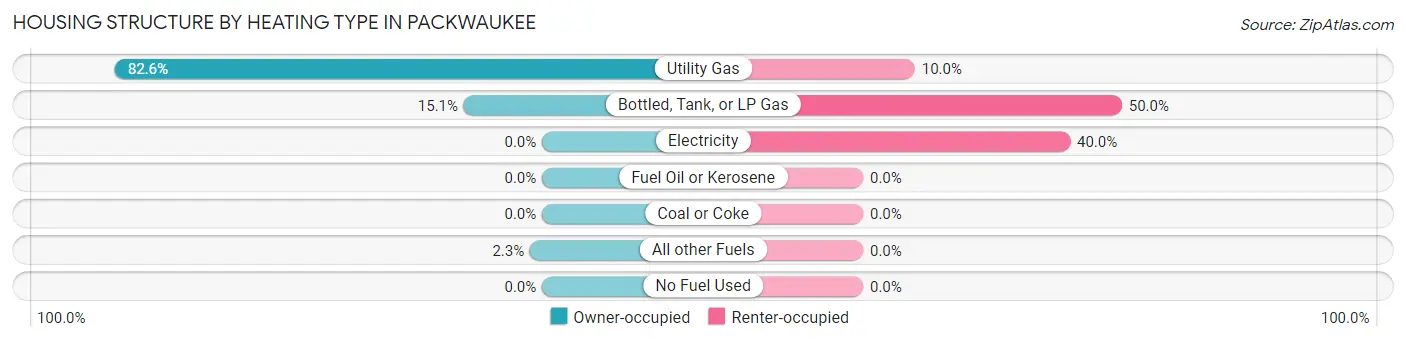
| Heating Type | Owner-occupied | Renter-occupied |
| Utility Gas | 71 (82.6%) | 2 (10.0%) |
| Bottled, Tank, or LP Gas | 13 (15.1%) | 10 (50.0%) |
| Electricity | 0 (0.0%) | 8 (40.0%) |
| Fuel Oil or Kerosene | 0 (0.0%) | 0 (0.0%) |
| Coal or Coke | 0 (0.0%) | 0 (0.0%) |
| All other Fuels | 2 (2.3%) | 0 (0.0%) |
| No Fuel Used | 0 (0.0%) | 0 (0.0%) |
| Total | 86 (100.0%) | 20 (100.0%) |
Household Vehicle Usage in Packwaukee
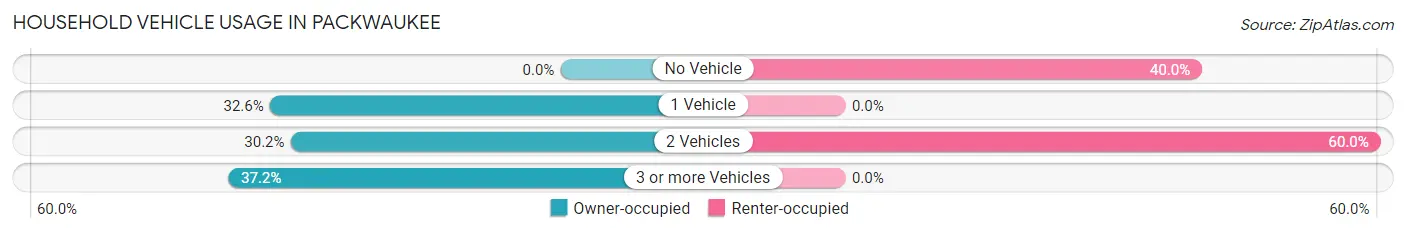
| Vehicles per Household | Owner-occupied | Renter-occupied |
| No Vehicle | 0 (0.0%) | 8 (40.0%) |
| 1 Vehicle | 28 (32.6%) | 0 (0.0%) |
| 2 Vehicles | 26 (30.2%) | 12 (60.0%) |
| 3 or more Vehicles | 32 (37.2%) | 0 (0.0%) |
| Total | 86 (100.0%) | 20 (100.0%) |
Real Estate & Mortgages in Packwaukee
Real Estate and Mortgage Overview in Packwaukee
| Characteristic | Without Mortgage | With Mortgage |
| Housing Units | 27 | 59 |
| Median Property Value | $166,300 | $151,300 |
| Median Household Income | - | - |
| Monthly Housing Costs | $536 | $0 |
| Real Estate Taxes | $3,156 | $0 |
Property Value by Mortgage Status in Packwaukee
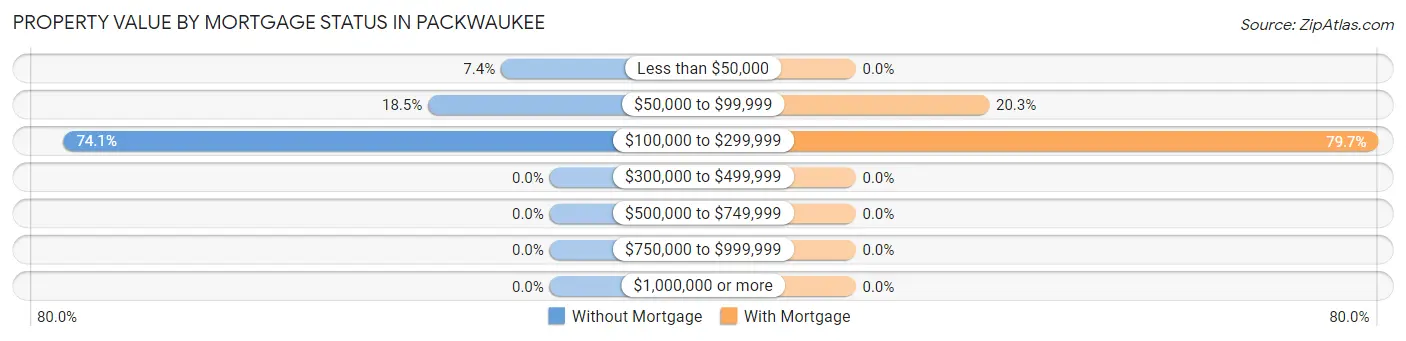
| Property Value | Without Mortgage | With Mortgage |
| Less than $50,000 | 2 (7.4%) | 0 (0.0%) |
| $50,000 to $99,999 | 5 (18.5%) | 12 (20.3%) |
| $100,000 to $299,999 | 20 (74.1%) | 47 (79.7%) |
| $300,000 to $499,999 | 0 (0.0%) | 0 (0.0%) |
| $500,000 to $749,999 | 0 (0.0%) | 0 (0.0%) |
| $750,000 to $999,999 | 0 (0.0%) | 0 (0.0%) |
| $1,000,000 or more | 0 (0.0%) | 0 (0.0%) |
| Total | 27 (100.0%) | 59 (100.0%) |
Household Income by Mortgage Status in Packwaukee
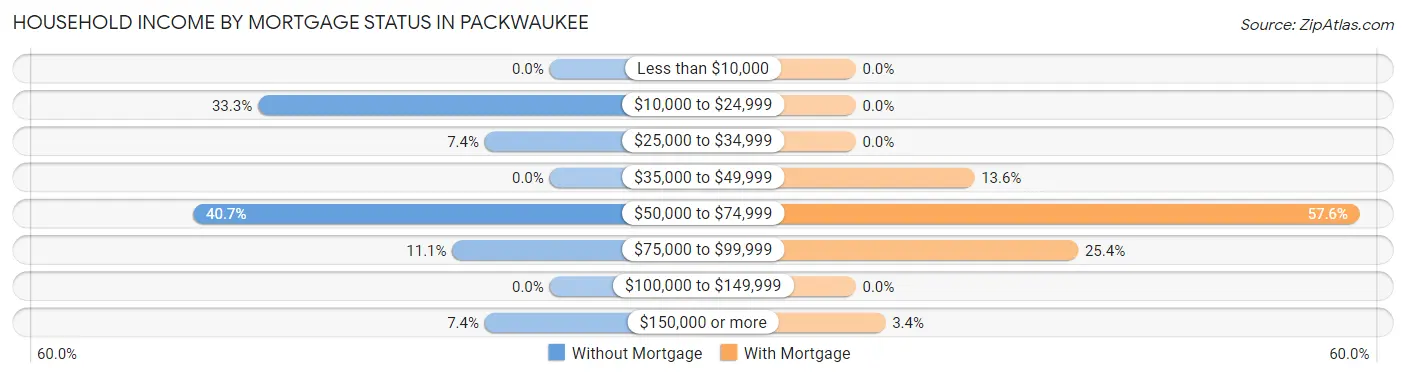
| Household Income | Without Mortgage | With Mortgage |
| Less than $10,000 | 0 (0.0%) | 0 (0.0%) |
| $10,000 to $24,999 | 9 (33.3%) | 0 (0.0%) |
| $25,000 to $34,999 | 2 (7.4%) | 0 (0.0%) |
| $35,000 to $49,999 | 0 (0.0%) | 8 (13.6%) |
| $50,000 to $74,999 | 11 (40.7%) | 34 (57.6%) |
| $75,000 to $99,999 | 3 (11.1%) | 15 (25.4%) |
| $100,000 to $149,999 | 0 (0.0%) | 0 (0.0%) |
| $150,000 or more | 2 (7.4%) | 2 (3.4%) |
| Total | 27 (100.0%) | 59 (100.0%) |
Property Value to Household Income Ratio in Packwaukee
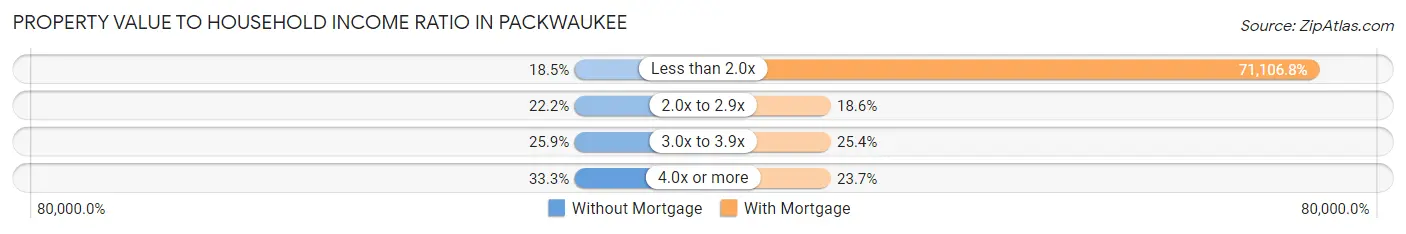
| Value-to-Income Ratio | Without Mortgage | With Mortgage |
| Less than 2.0x | 5 (18.5%) | 41,953 (71,106.8%) |
| 2.0x to 2.9x | 6 (22.2%) | 11 (18.6%) |
| 3.0x to 3.9x | 7 (25.9%) | 15 (25.4%) |
| 4.0x or more | 9 (33.3%) | 14 (23.7%) |
| Total | 27 (100.0%) | 59 (100.0%) |
Real Estate Taxes by Mortgage Status in Packwaukee
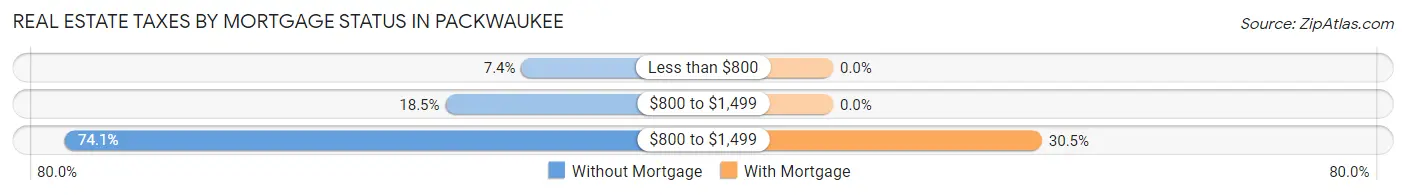
| Property Taxes | Without Mortgage | With Mortgage |
| Less than $800 | 2 (7.4%) | 0 (0.0%) |
| $800 to $1,499 | 5 (18.5%) | 0 (0.0%) |
| $800 to $1,499 | 20 (74.1%) | 18 (30.5%) |
| Total | 27 (100.0%) | 59 (100.0%) |
Health & Disability in Packwaukee
Health Insurance Coverage by Age in Packwaukee
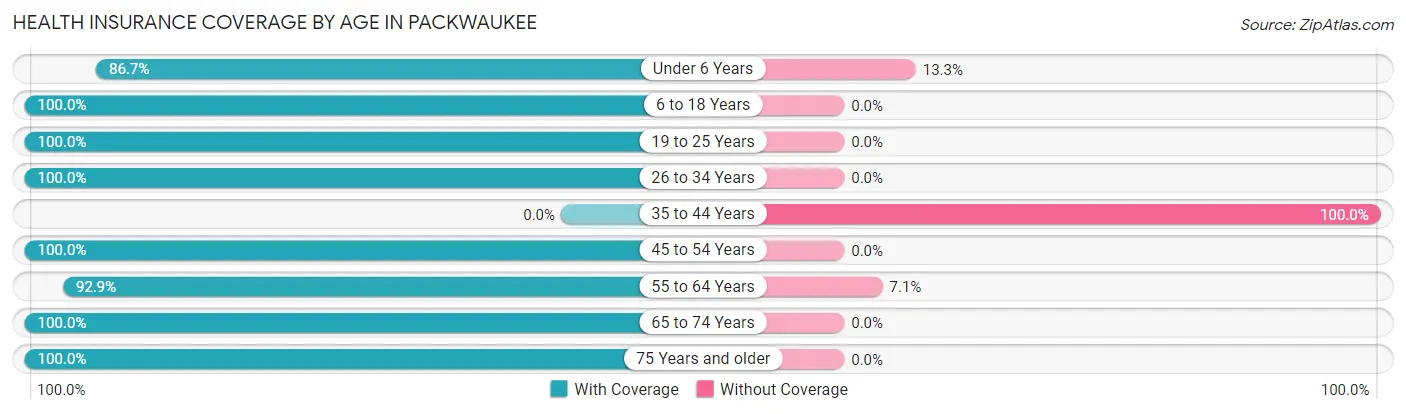
| Age Bracket | With Coverage | Without Coverage |
| Under 6 Years | 13 (86.7%) | 2 (13.3%) |
| 6 to 18 Years | 21 (100.0%) | 0 (0.0%) |
| 19 to 25 Years | 9 (100.0%) | 0 (0.0%) |
| 26 to 34 Years | 12 (100.0%) | 0 (0.0%) |
| 35 to 44 Years | 0 (0.0%) | 2 (100.0%) |
| 45 to 54 Years | 14 (100.0%) | 0 (0.0%) |
| 55 to 64 Years | 26 (92.9%) | 2 (7.1%) |
| 65 to 74 Years | 77 (100.0%) | 0 (0.0%) |
| 75 Years and older | 30 (100.0%) | 0 (0.0%) |
| Total | 202 (97.1%) | 6 (2.9%) |
Health Insurance Coverage by Citizenship Status in Packwaukee
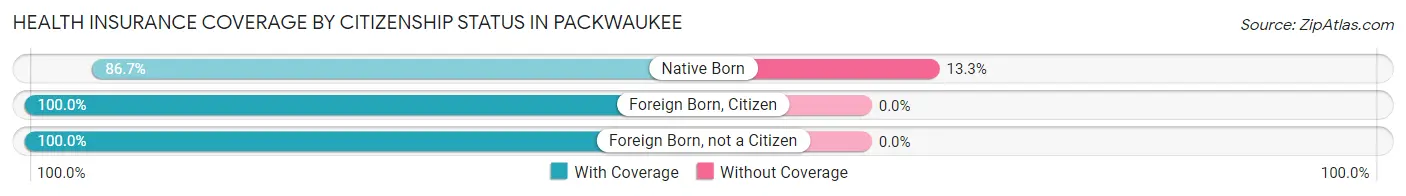
| Citizenship Status | With Coverage | Without Coverage |
| Native Born | 13 (86.7%) | 2 (13.3%) |
| Foreign Born, Citizen | 21 (100.0%) | 0 (0.0%) |
| Foreign Born, not a Citizen | 9 (100.0%) | 0 (0.0%) |
Health Insurance Coverage by Household Income in Packwaukee
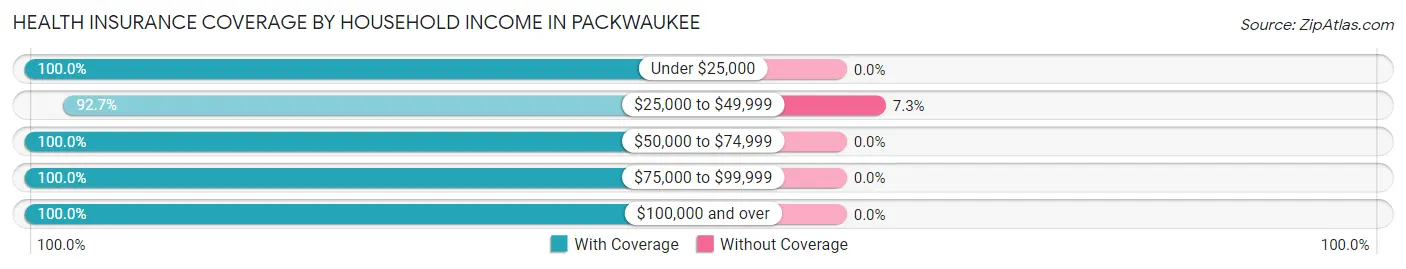
| Household Income | With Coverage | Without Coverage |
| Under $25,000 | 28 (100.0%) | 0 (0.0%) |
| $25,000 to $49,999 | 76 (92.7%) | 6 (7.3%) |
| $50,000 to $74,999 | 81 (100.0%) | 0 (0.0%) |
| $75,000 to $99,999 | 7 (100.0%) | 0 (0.0%) |
| $100,000 and over | 10 (100.0%) | 0 (0.0%) |
Public vs Private Health Insurance Coverage by Age in Packwaukee
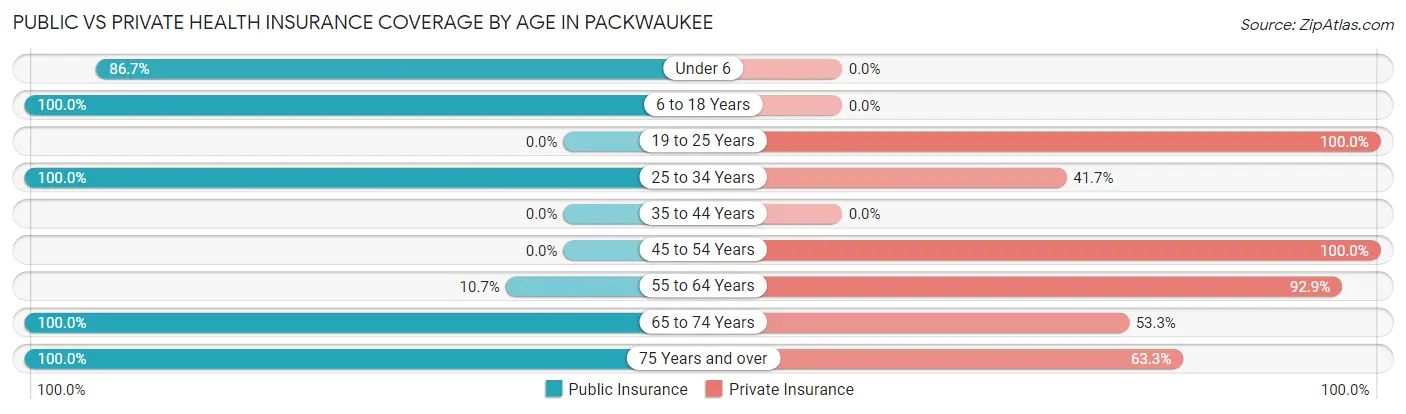
| Age Bracket | Public Insurance | Private Insurance |
| Under 6 | 13 (86.7%) | 0 (0.0%) |
| 6 to 18 Years | 21 (100.0%) | 0 (0.0%) |
| 19 to 25 Years | 0 (0.0%) | 9 (100.0%) |
| 25 to 34 Years | 12 (100.0%) | 5 (41.7%) |
| 35 to 44 Years | 0 (0.0%) | 0 (0.0%) |
| 45 to 54 Years | 0 (0.0%) | 14 (100.0%) |
| 55 to 64 Years | 3 (10.7%) | 26 (92.9%) |
| 65 to 74 Years | 77 (100.0%) | 41 (53.2%) |
| 75 Years and over | 30 (100.0%) | 19 (63.3%) |
| Total | 156 (75.0%) | 114 (54.8%) |
Disability Status by Sex by Age in Packwaukee
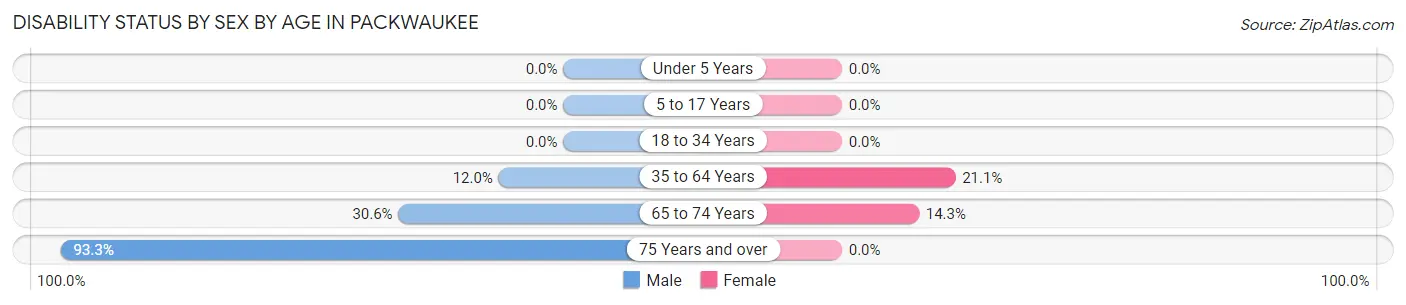
| Age Bracket | Male | Female |
| Under 5 Years | 0 (0.0%) | 0 (0.0%) |
| 5 to 17 Years | 0 (0.0%) | 0 (0.0%) |
| 18 to 34 Years | 0 (0.0%) | 0 (0.0%) |
| 35 to 64 Years | 3 (12.0%) | 4 (21.0%) |
| 65 to 74 Years | 15 (30.6%) | 4 (14.3%) |
| 75 Years and over | 14 (93.3%) | 0 (0.0%) |
Disability Class by Sex by Age in Packwaukee
Disability Class: Hearing Difficulty
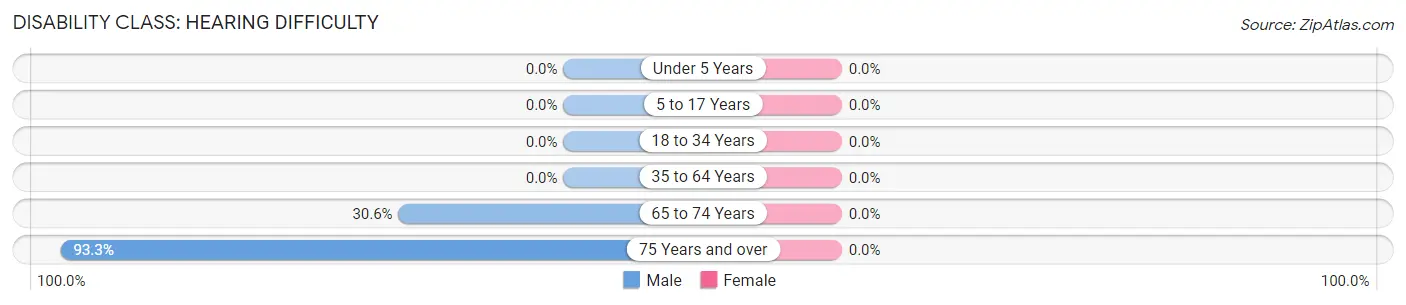
| Age Bracket | Male | Female |
| Under 5 Years | 0 (0.0%) | 0 (0.0%) |
| 5 to 17 Years | 0 (0.0%) | 0 (0.0%) |
| 18 to 34 Years | 0 (0.0%) | 0 (0.0%) |
| 35 to 64 Years | 0 (0.0%) | 0 (0.0%) |
| 65 to 74 Years | 15 (30.6%) | 0 (0.0%) |
| 75 Years and over | 14 (93.3%) | 0 (0.0%) |
Disability Class: Vision Difficulty
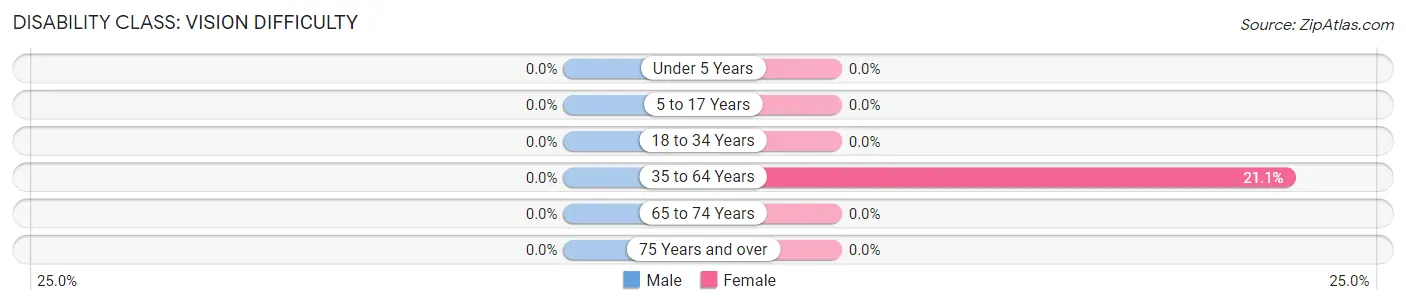
| Age Bracket | Male | Female |
| Under 5 Years | 0 (0.0%) | 0 (0.0%) |
| 5 to 17 Years | 0 (0.0%) | 0 (0.0%) |
| 18 to 34 Years | 0 (0.0%) | 0 (0.0%) |
| 35 to 64 Years | 0 (0.0%) | 4 (21.0%) |
| 65 to 74 Years | 0 (0.0%) | 0 (0.0%) |
| 75 Years and over | 0 (0.0%) | 0 (0.0%) |
Disability Class: Cognitive Difficulty
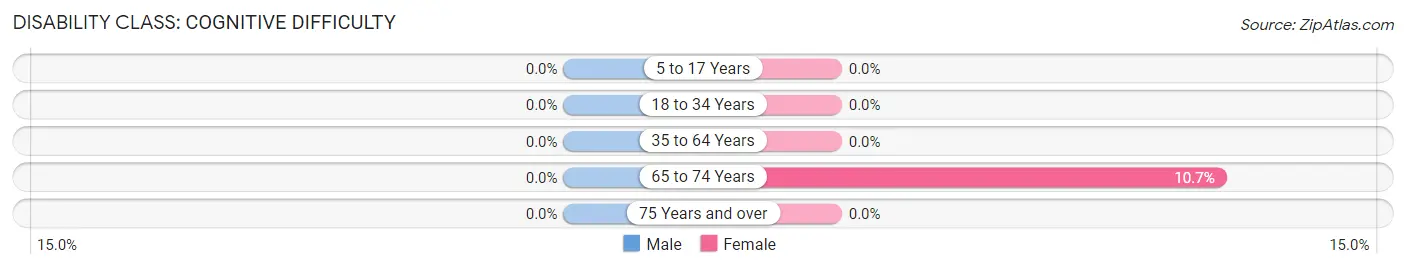
| Age Bracket | Male | Female |
| 5 to 17 Years | 0 (0.0%) | 0 (0.0%) |
| 18 to 34 Years | 0 (0.0%) | 0 (0.0%) |
| 35 to 64 Years | 0 (0.0%) | 0 (0.0%) |
| 65 to 74 Years | 0 (0.0%) | 3 (10.7%) |
| 75 Years and over | 0 (0.0%) | 0 (0.0%) |
Disability Class: Ambulatory Difficulty
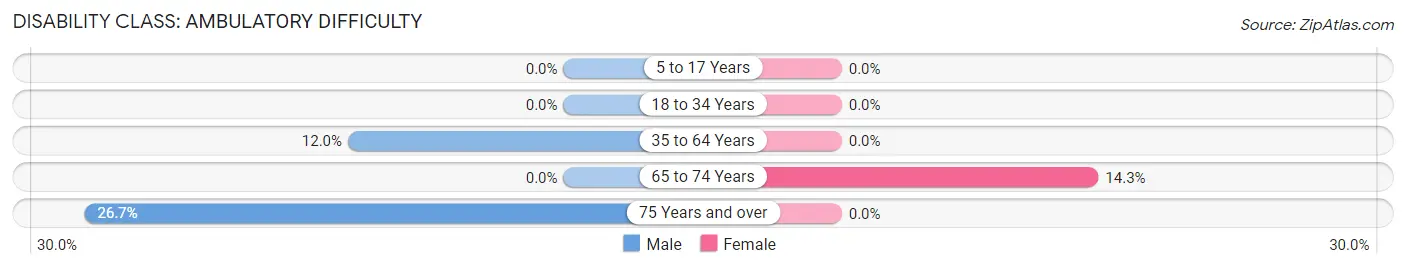
| Age Bracket | Male | Female |
| 5 to 17 Years | 0 (0.0%) | 0 (0.0%) |
| 18 to 34 Years | 0 (0.0%) | 0 (0.0%) |
| 35 to 64 Years | 3 (12.0%) | 0 (0.0%) |
| 65 to 74 Years | 0 (0.0%) | 4 (14.3%) |
| 75 Years and over | 4 (26.7%) | 0 (0.0%) |
Disability Class: Self-Care Difficulty
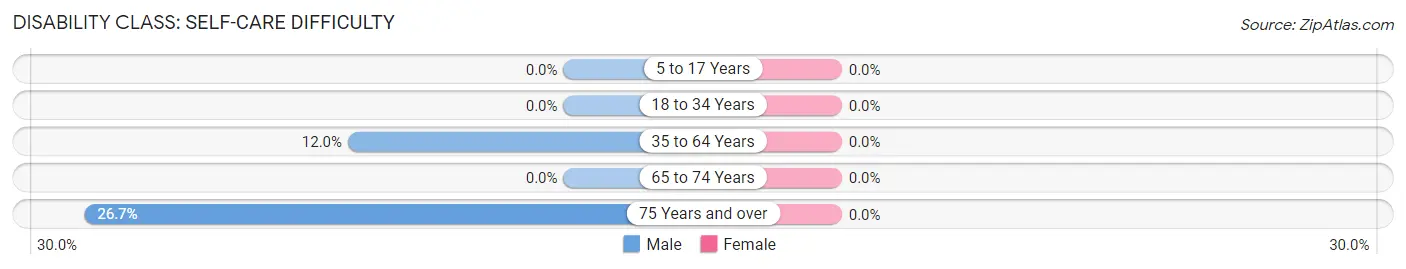
| Age Bracket | Male | Female |
| 5 to 17 Years | 0 (0.0%) | 0 (0.0%) |
| 18 to 34 Years | 0 (0.0%) | 0 (0.0%) |
| 35 to 64 Years | 3 (12.0%) | 0 (0.0%) |
| 65 to 74 Years | 0 (0.0%) | 0 (0.0%) |
| 75 Years and over | 4 (26.7%) | 0 (0.0%) |
Technology Access in Packwaukee
Computing Device Access in Packwaukee
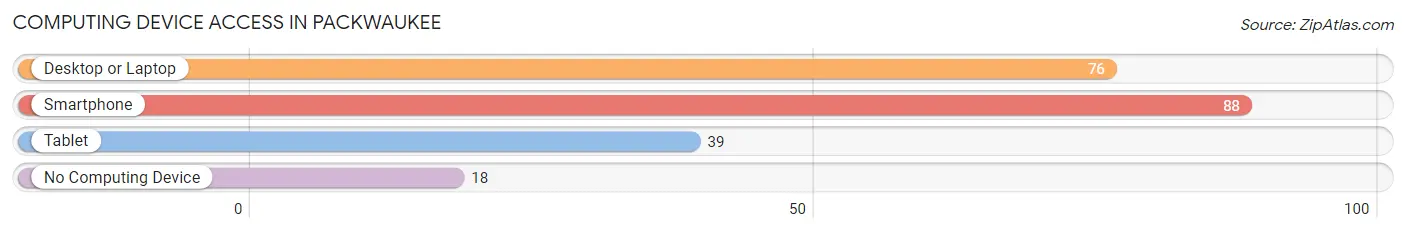
| Device Type | # Households | % Households |
| Desktop or Laptop | 76 | 71.7% |
| Smartphone | 88 | 83.0% |
| Tablet | 39 | 36.8% |
| No Computing Device | 18 | 17.0% |
| Total | 106 | 100.0% |
Internet Access in Packwaukee
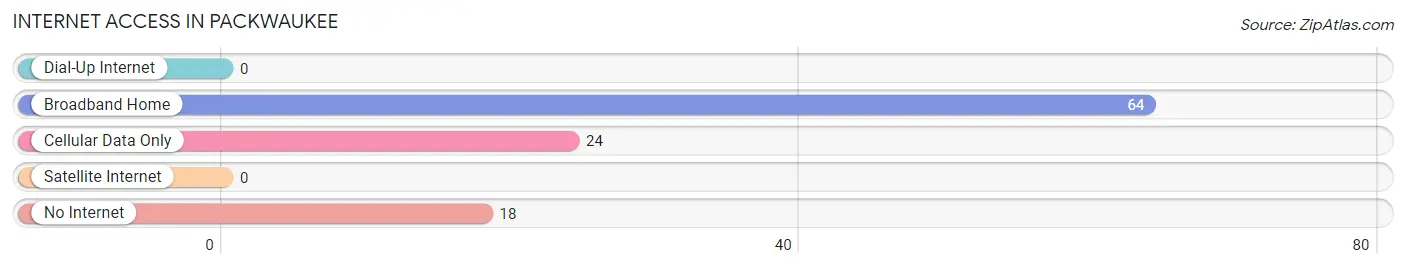
| Internet Type | # Households | % Households |
| Dial-Up Internet | 0 | 0.0% |
| Broadband Home | 64 | 60.4% |
| Cellular Data Only | 24 | 22.6% |
| Satellite Internet | 0 | 0.0% |
| No Internet | 18 | 17.0% |
| Total | 106 | 100.0% |
Packwaukee Summary
Packwaukee is a small unincorporated community located in Marquette County, Wisconsin, United States. It is situated on the western shore of Lake Puckaway, a large lake in the area. The population of Packwaukee was estimated to be around 500 people in 2000.
History
Packwaukee was first settled in the early 1800s by a group of French-Canadian fur traders. The town was named after the lake, which was named after the Puckaway Indians, a Native American tribe that lived in the area. The town was officially incorporated in 1856.
In the late 1800s, Packwaukee became a popular tourist destination due to its proximity to Lake Puckaway. The town was home to several resorts, including the Packwaukee Hotel, which was built in 1891. The hotel was a popular destination for wealthy tourists from Milwaukee and Chicago.
In the early 1900s, Packwaukee began to decline in popularity as a tourist destination. The town’s economy shifted to focus on agriculture and fishing. The town was also home to several small businesses, including a sawmill, a cheese factory, and a canning factory.
Geography
Packwaukee is located in the western part of Marquette County, Wisconsin. The town is situated on the western shore of Lake Puckaway, a large lake in the area. The lake is approximately 5,000 acres in size and is a popular destination for fishing, boating, and swimming.
The town is surrounded by rolling hills and farmland. The nearest major city is Milwaukee, which is approximately 70 miles away.
Economy
The economy of Packwaukee is largely based on agriculture and fishing. The town is home to several small farms, which produce a variety of crops, including corn, soybeans, and hay. The town is also home to several small fishing businesses, which harvest a variety of fish from Lake Puckaway.
The town is also home to several small businesses, including a sawmill, a cheese factory, and a canning factory.
Demographics
The population of Packwaukee was estimated to be around 500 people in 2000. The town is predominantly white, with a small Hispanic population. The median household income in the town is approximately $35,000. The town has a high rate of poverty, with approximately 25% of the population living below the poverty line.
Conclusion
Packwaukee is a small unincorporated community located in Marquette County, Wisconsin. The town was first settled in the early 1800s by a group of French-Canadian fur traders and was officially incorporated in 1856. The town’s economy is largely based on agriculture and fishing, and the population was estimated to be around 500 people in 2000. Packwaukee is predominantly white, with a small Hispanic population, and has a high rate of poverty.
Common Questions
What is Per Capita Income in Packwaukee?
Per Capita income in Packwaukee is $24,145.
What is the Median Family Income in Packwaukee?
Median Family Income in Packwaukee is $67,778.
What is the Median Household income in Packwaukee?
Median Household Income in Packwaukee is $40,972.
What is Inequality or Gini Index in Packwaukee?
Inequality or Gini Index in Packwaukee is 0.29.
What is the Total Population of Packwaukee?
Total Population of Packwaukee is 208.
What is the Total Male Population of Packwaukee?
Total Male Population of Packwaukee is 113.
What is the Total Female Population of Packwaukee?
Total Female Population of Packwaukee is 95.
What is the Ratio of Males per 100 Females in Packwaukee?
There are 118.95 Males per 100 Females in Packwaukee.
What is the Ratio of Females per 100 Males in Packwaukee?
There are 84.07 Females per 100 Males in Packwaukee.
What is the Median Population Age in Packwaukee?
Median Population Age in Packwaukee is 65.1 Years.
What is the Average Family Size in Packwaukee
Average Family Size in Packwaukee is 2.7 People.
What is the Average Household Size in Packwaukee
Average Household Size in Packwaukee is 2.0 People.
How Large is the Labor Force in Packwaukee?
There are 68 People in the Labor Forcein in Packwaukee.
What is the Percentage of People in the Labor Force in Packwaukee?
39.5% of People are in the Labor Force in Packwaukee.