Osceola, WI Map & Demographics
Osceola Map
Osceola Overview
$29,996
PER CAPITA INCOME
$68,750
AVG FAMILY INCOME
$51,667
AVG HOUSEHOLD INCOME
37.3%
WAGE / INCOME GAP [ % ]
62.7¢/ $1
WAGE / INCOME GAP [ $ ]
$10,274
FAMILY INCOME DEFICIT
0.39
INEQUALITY / GINI INDEX
2,785
TOTAL POPULATION
1,311
MALE POPULATION
1,474
FEMALE POPULATION
88.94
MALES / 100 FEMALES
112.43
FEMALES / 100 MALES
41.0
MEDIAN AGE
2.7
AVG FAMILY SIZE
2.0
AVG HOUSEHOLD SIZE
1,477
LABOR FORCE [ PEOPLE ]
66.8%
PERCENT IN LABOR FORCE
8.8%
UNEMPLOYMENT RATE
Osceola Zip Codes
Osceola Area Codes
Income in Osceola
Income Overview in Osceola
Per Capita Income in Osceola is $29,996, while median incomes of families and households are $68,750 and $51,667 respectively.
| Characteristic | Number | Measure |
| Per Capita Income | 2,785 | $29,996 |
| Median Family Income | 724 | $68,750 |
| Mean Family Income | 724 | $74,789 |
| Median Household Income | 1,342 | $51,667 |
| Mean Household Income | 1,342 | $63,003 |
| Income Deficit | 724 | $10,274 |
| Wage / Income Gap (%) | 2,785 | 37.26% |
| Wage / Income Gap ($) | 2,785 | 62.74¢ per $1 |
| Gini / Inequality Index | 2,785 | 0.39 |
Earnings by Sex in Osceola
Average Earnings in Osceola are $36,893, $46,800 for men and $29,361 for women, a difference of 37.3%.
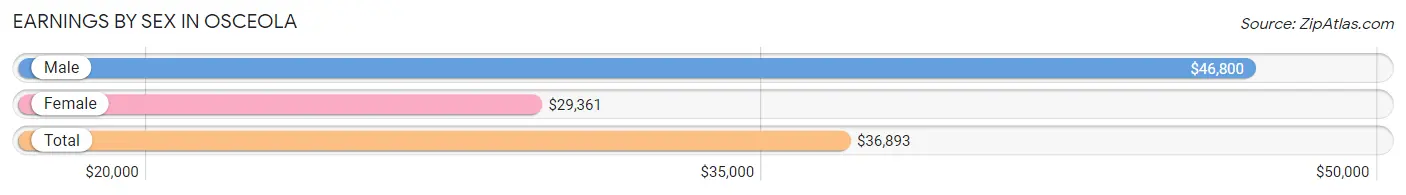
| Sex | Number | Average Earnings |
| Male | 730 (48.4%) | $46,800 |
| Female | 777 (51.6%) | $29,361 |
| Total | 1,507 (100.0%) | $36,893 |
Earnings by Sex by Income Bracket in Osceola
The most common earnings brackets in Osceola are $65,000 to $74,999 for men (123 | 16.9%) and $25,000 to $29,999 for women (94 | 12.1%).
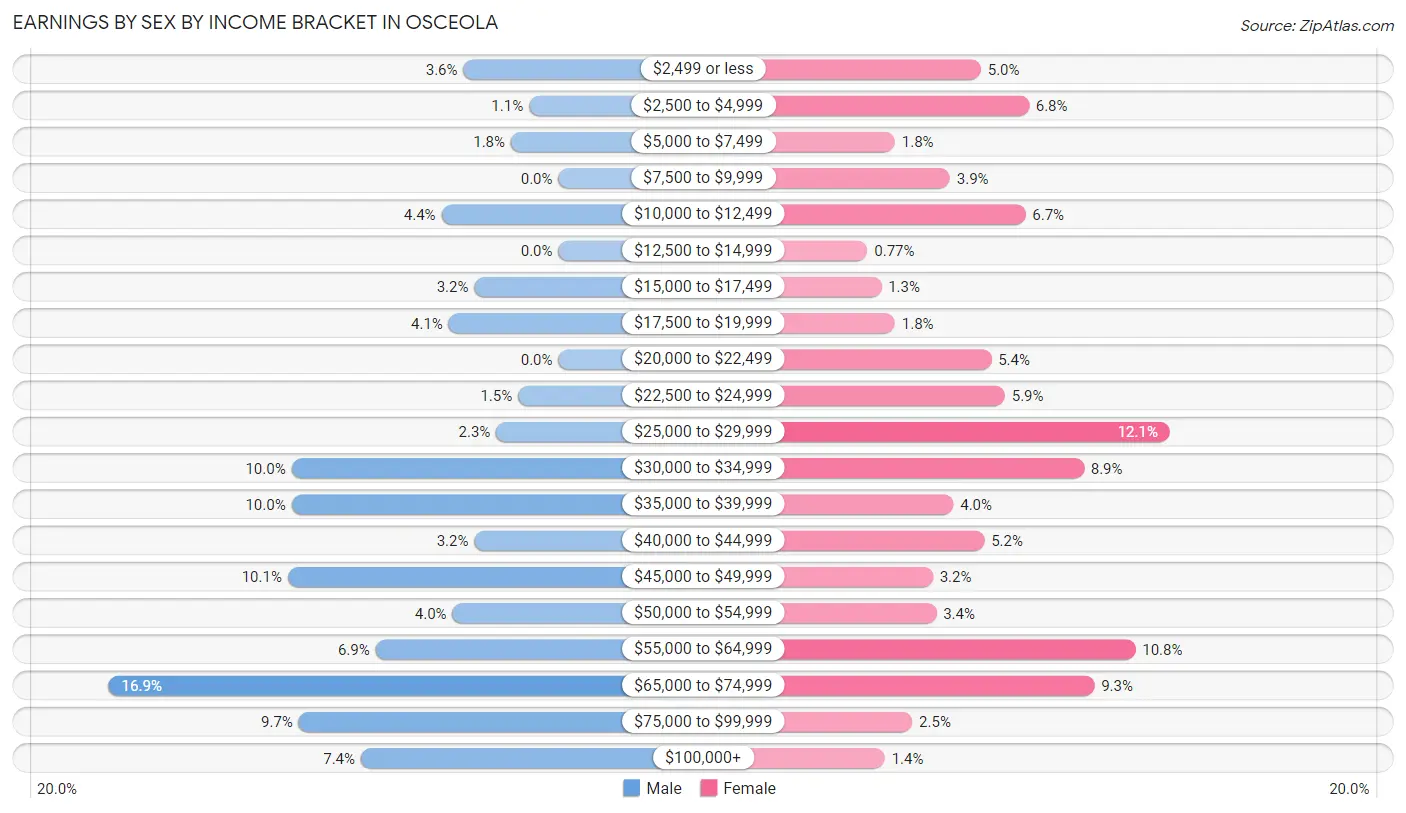
| Income | Male | Female |
| $2,499 or less | 26 (3.6%) | 39 (5.0%) |
| $2,500 to $4,999 | 8 (1.1%) | 53 (6.8%) |
| $5,000 to $7,499 | 13 (1.8%) | 14 (1.8%) |
| $7,500 to $9,999 | 0 (0.0%) | 30 (3.9%) |
| $10,000 to $12,499 | 32 (4.4%) | 52 (6.7%) |
| $12,500 to $14,999 | 0 (0.0%) | 6 (0.8%) |
| $15,000 to $17,499 | 23 (3.2%) | 10 (1.3%) |
| $17,500 to $19,999 | 30 (4.1%) | 14 (1.8%) |
| $20,000 to $22,499 | 0 (0.0%) | 42 (5.4%) |
| $22,500 to $24,999 | 11 (1.5%) | 46 (5.9%) |
| $25,000 to $29,999 | 17 (2.3%) | 94 (12.1%) |
| $30,000 to $34,999 | 73 (10.0%) | 69 (8.9%) |
| $35,000 to $39,999 | 73 (10.0%) | 31 (4.0%) |
| $40,000 to $44,999 | 23 (3.2%) | 40 (5.1%) |
| $45,000 to $49,999 | 74 (10.1%) | 25 (3.2%) |
| $50,000 to $54,999 | 29 (4.0%) | 26 (3.4%) |
| $55,000 to $64,999 | 50 (6.9%) | 84 (10.8%) |
| $65,000 to $74,999 | 123 (16.9%) | 72 (9.3%) |
| $75,000 to $99,999 | 71 (9.7%) | 19 (2.5%) |
| $100,000+ | 54 (7.4%) | 11 (1.4%) |
| Total | 730 (100.0%) | 777 (100.0%) |
Earnings by Sex by Educational Attainment in Osceola
Average earnings in Osceola are $48,177 for men and $33,641 for women, a difference of 30.2%. Men with an educational attainment of bachelor's degree enjoy the highest average annual earnings of $71,667, while those with college or associate's degree education earn the least with $46,000. Women with an educational attainment of bachelor's degree earn the most with the average annual earnings of $48,807, while those with college or associate's degree education have the smallest earnings of $26,563.
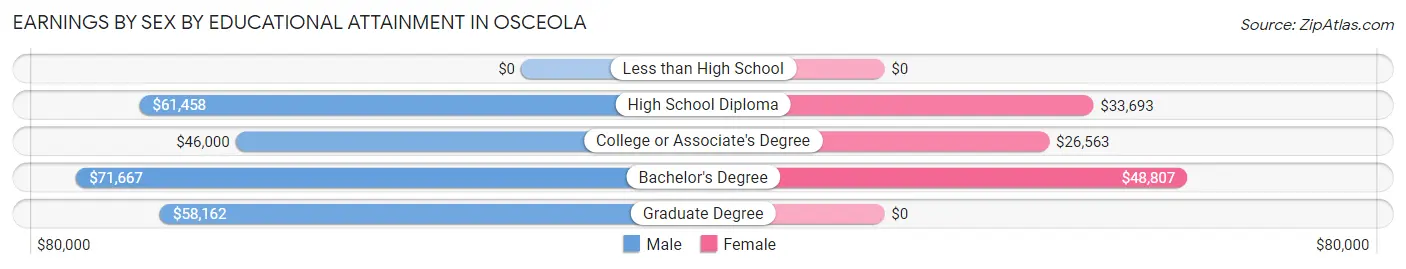
| Educational Attainment | Male Income | Female Income |
| Less than High School | - | - |
| High School Diploma | $61,458 | $33,693 |
| College or Associate's Degree | $46,000 | $26,563 |
| Bachelor's Degree | $71,667 | $48,807 |
| Graduate Degree | $58,162 | $0 |
| Total | $48,177 | $33,641 |
Family Income in Osceola
Family Income Brackets in Osceola
According to the Osceola family income data, there are 165 families falling into the $100,000 to $149,999 income range, which is the most common income bracket and makes up 22.8% of all families. Conversely, the $10,000 to $14,999 income bracket is the least frequent group with only 9 families (1.2%) belonging to this category.
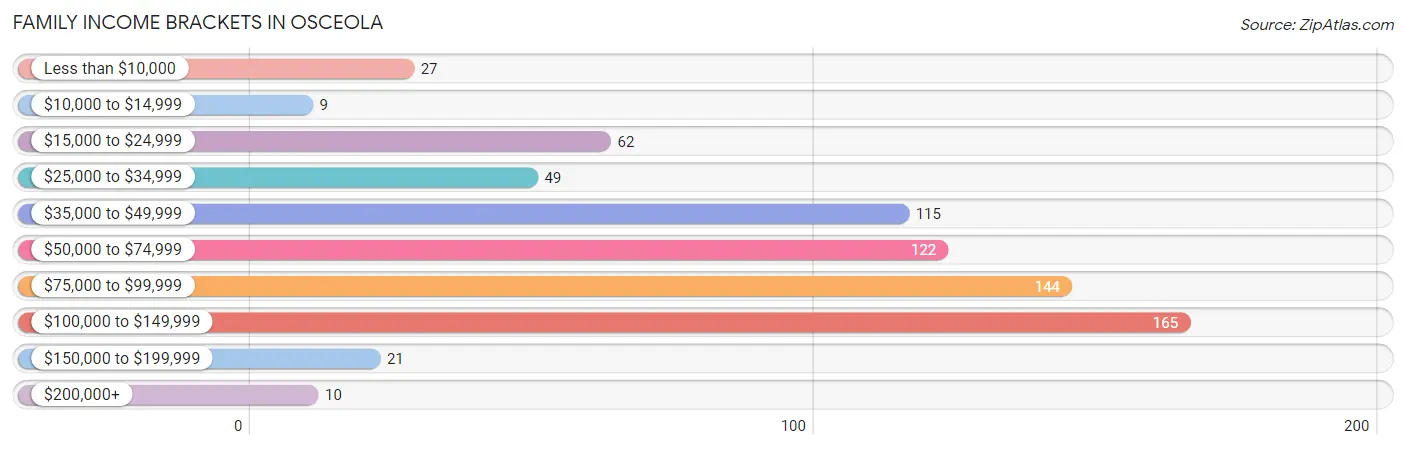
| Income Bracket | # Families | % Families |
| Less than $10,000 | 27 | 3.7% |
| $10,000 to $14,999 | 9 | 1.2% |
| $15,000 to $24,999 | 62 | 8.6% |
| $25,000 to $34,999 | 49 | 6.8% |
| $35,000 to $49,999 | 115 | 15.9% |
| $50,000 to $74,999 | 122 | 16.9% |
| $75,000 to $99,999 | 144 | 19.9% |
| $100,000 to $149,999 | 165 | 22.8% |
| $150,000 to $199,999 | 21 | 2.9% |
| $200,000+ | 10 | 1.4% |
Family Income by Famaliy Size in Osceola
5-person families (57 | 7.9%) account for the highest median family income in Osceola with $108,359 per family, while 2-person families (447 | 61.7%) have the highest median income of $32,238 per family member.
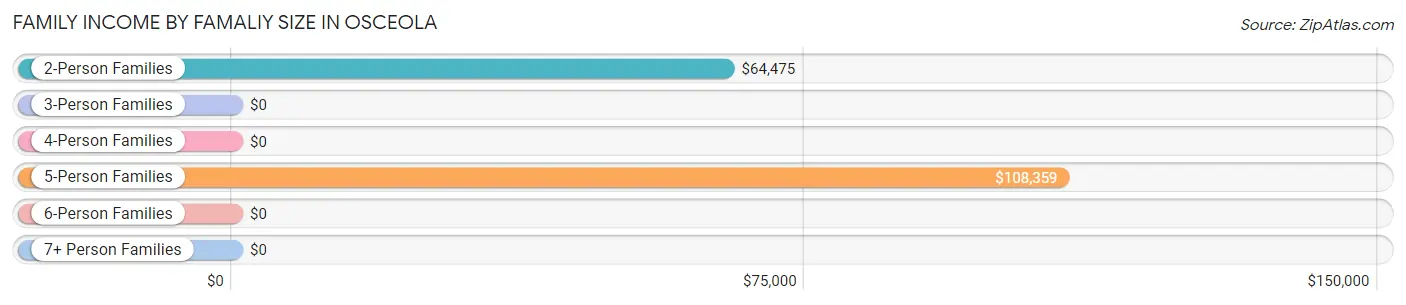
| Income Bracket | # Families | Median Income |
| 2-Person Families | 447 (61.7%) | $64,475 |
| 3-Person Families | 84 (11.6%) | $0 |
| 4-Person Families | 117 (16.2%) | $0 |
| 5-Person Families | 57 (7.9%) | $108,359 |
| 6-Person Families | 19 (2.6%) | $0 |
| 7+ Person Families | 0 (0.0%) | $0 |
| Total | 724 (100.0%) | $68,750 |
Family Income by Number of Earners in Osceola
The median family income in Osceola is $68,750, with families comprising 3+ earners (58) having the highest median family income of $131,528, while families with 1 earner (182) have the lowest median family income of $36,579, accounting for 8.0% and 25.1% of families, respectively.
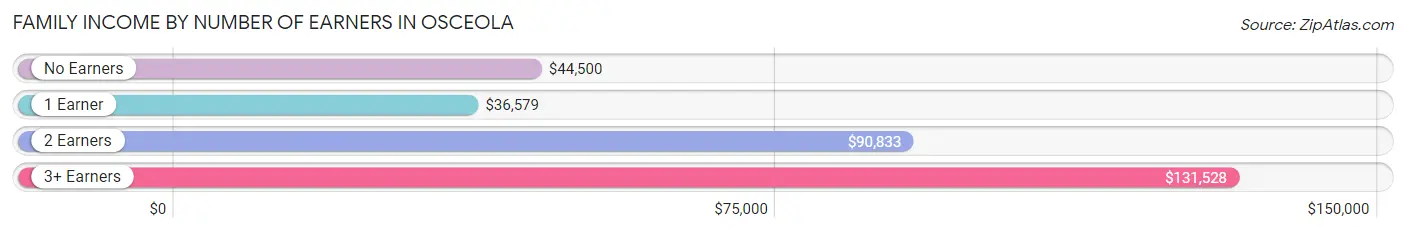
| Number of Earners | # Families | Median Income |
| No Earners | 172 (23.8%) | $44,500 |
| 1 Earner | 182 (25.1%) | $36,579 |
| 2 Earners | 312 (43.1%) | $90,833 |
| 3+ Earners | 58 (8.0%) | $131,528 |
| Total | 724 (100.0%) | $68,750 |
Household Income in Osceola
Household Income Brackets in Osceola
With 224 households falling in the category, the $100,000 to $149,999 income range is the most frequent in Osceola, accounting for 16.7% of all households. In contrast, only 15 households (1.1%) fall into the $200,000+ income bracket, making it the least populous group.
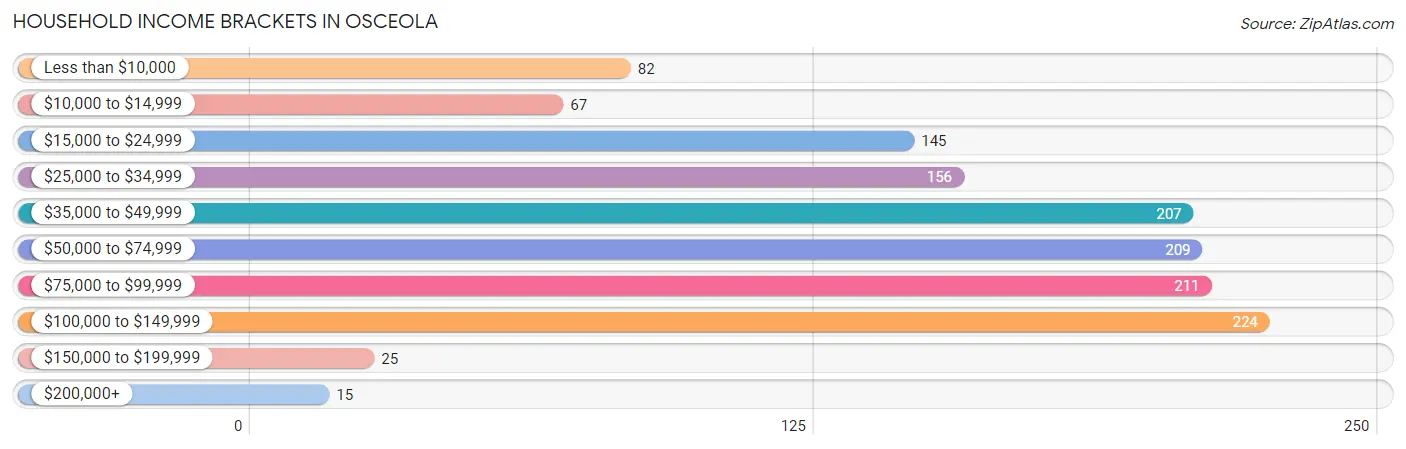
| Income Bracket | # Households | % Households |
| Less than $10,000 | 82 | 6.1% |
| $10,000 to $14,999 | 67 | 5.0% |
| $15,000 to $24,999 | 145 | 10.8% |
| $25,000 to $34,999 | 156 | 11.6% |
| $35,000 to $49,999 | 207 | 15.4% |
| $50,000 to $74,999 | 209 | 15.6% |
| $75,000 to $99,999 | 211 | 15.7% |
| $100,000 to $149,999 | 224 | 16.7% |
| $150,000 to $199,999 | 25 | 1.9% |
| $200,000+ | 15 | 1.1% |
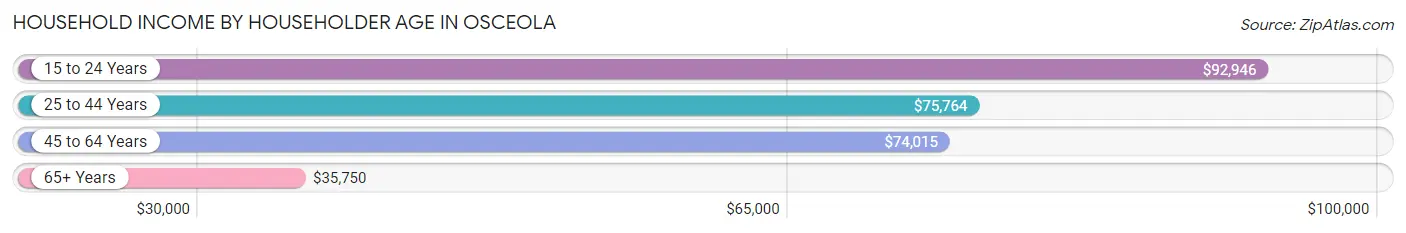
Household Income by Householder Age in Osceola
The median household income in Osceola is $51,667, with the highest median household income of $92,946 found in the 15 to 24 years age bracket for the primary householder. A total of 64 households (4.8%) fall into this category. Meanwhile, the 65+ years age bracket for the primary householder has the lowest median household income of $35,750, with 453 households (33.8%) in this group.
| Income Bracket | # Households | Median Income |
| 15 to 24 Years | 64 (4.8%) | $92,946 |
| 25 to 44 Years | 369 (27.5%) | $75,764 |
| 45 to 64 Years | 456 (34.0%) | $74,015 |
| 65+ Years | 453 (33.8%) | $35,750 |
| Total | 1,342 (100.0%) | $51,667 |
Poverty in Osceola
Income Below Poverty by Sex and Age in Osceola
With 15.3% poverty level for males and 18.6% for females among the residents of Osceola, 6 to 11 year old males and 15 year old females are the most vulnerable to poverty, with 60 males (42.5%) and 6 females (54.5%) in their respective age groups living below the poverty level.
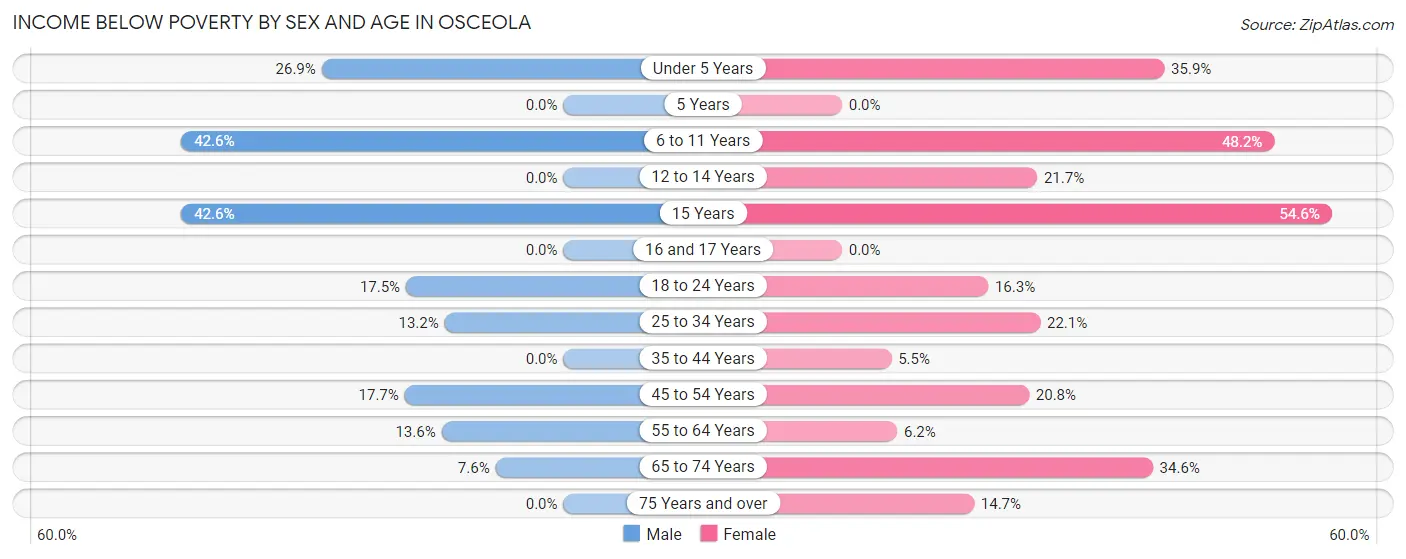
| Age Bracket | Male | Female |
| Under 5 Years | 21 (26.9%) | 28 (35.9%) |
| 5 Years | 0 (0.0%) | 0 (0.0%) |
| 6 to 11 Years | 60 (42.5%) | 26 (48.1%) |
| 12 to 14 Years | 0 (0.0%) | 5 (21.7%) |
| 15 Years | 20 (42.5%) | 6 (54.5%) |
| 16 and 17 Years | 0 (0.0%) | 0 (0.0%) |
| 18 to 24 Years | 17 (17.5%) | 14 (16.3%) |
| 25 to 34 Years | 25 (13.2%) | 51 (22.1%) |
| 35 to 44 Years | 0 (0.0%) | 6 (5.5%) |
| 45 to 54 Years | 29 (17.7%) | 40 (20.8%) |
| 55 to 64 Years | 19 (13.6%) | 15 (6.1%) |
| 65 to 74 Years | 9 (7.6%) | 45 (34.6%) |
| 75 Years and over | 0 (0.0%) | 30 (14.7%) |
| Total | 200 (15.3%) | 266 (18.6%) |
Income Above Poverty by Sex and Age in Osceola
According to the poverty statistics in Osceola, males aged 5 years and females aged 5 years are the age groups that are most secure financially, with 100.0% of males and 100.0% of females in these age groups living above the poverty line.
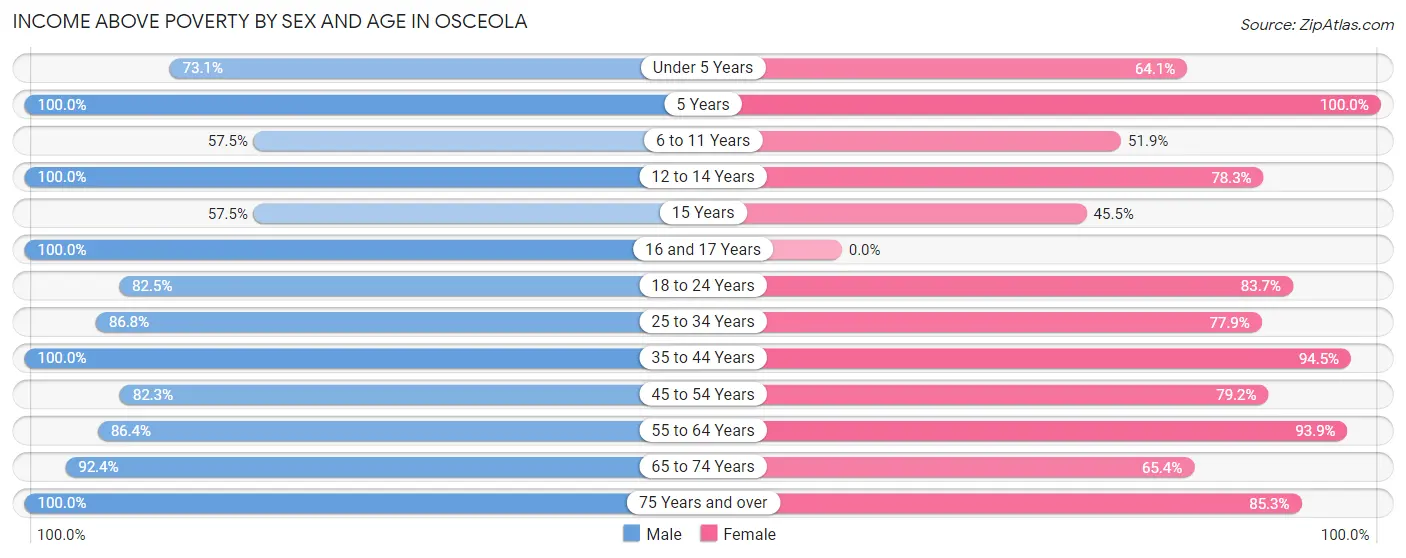
| Age Bracket | Male | Female |
| Under 5 Years | 57 (73.1%) | 50 (64.1%) |
| 5 Years | 9 (100.0%) | 65 (100.0%) |
| 6 to 11 Years | 81 (57.5%) | 28 (51.8%) |
| 12 to 14 Years | 68 (100.0%) | 18 (78.3%) |
| 15 Years | 27 (57.5%) | 5 (45.5%) |
| 16 and 17 Years | 37 (100.0%) | 0 (0.0%) |
| 18 to 24 Years | 80 (82.5%) | 72 (83.7%) |
| 25 to 34 Years | 164 (86.8%) | 180 (77.9%) |
| 35 to 44 Years | 150 (100.0%) | 103 (94.5%) |
| 45 to 54 Years | 135 (82.3%) | 152 (79.2%) |
| 55 to 64 Years | 121 (86.4%) | 229 (93.9%) |
| 65 to 74 Years | 110 (92.4%) | 85 (65.4%) |
| 75 Years and over | 69 (100.0%) | 174 (85.3%) |
| Total | 1,108 (84.7%) | 1,161 (81.4%) |
Income Below Poverty Among Married-Couple Families in Osceola
The poverty statistics for married-couple families in Osceola show that 5.0% or 27 of the total 544 families live below the poverty line. Families with 3 or 4 children have the highest poverty rate of 12.0%, comprising of 6 families. On the other hand, families with 1 or 2 children have the lowest poverty rate of 0.0%, which includes 0 families.
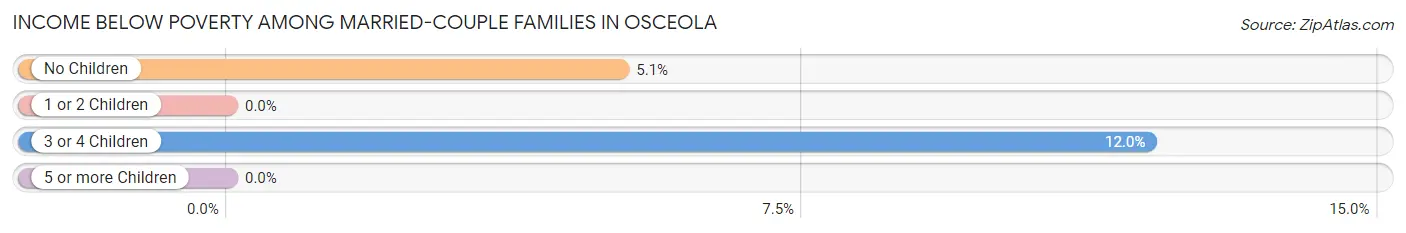
| Children | Above Poverty | Below Poverty |
| No Children | 390 (94.9%) | 21 (5.1%) |
| 1 or 2 Children | 83 (100.0%) | 0 (0.0%) |
| 3 or 4 Children | 44 (88.0%) | 6 (12.0%) |
| 5 or more Children | 0 (0.0%) | 0 (0.0%) |
| Total | 517 (95.0%) | 27 (5.0%) |
Income Below Poverty Among Single-Parent Households in Osceola
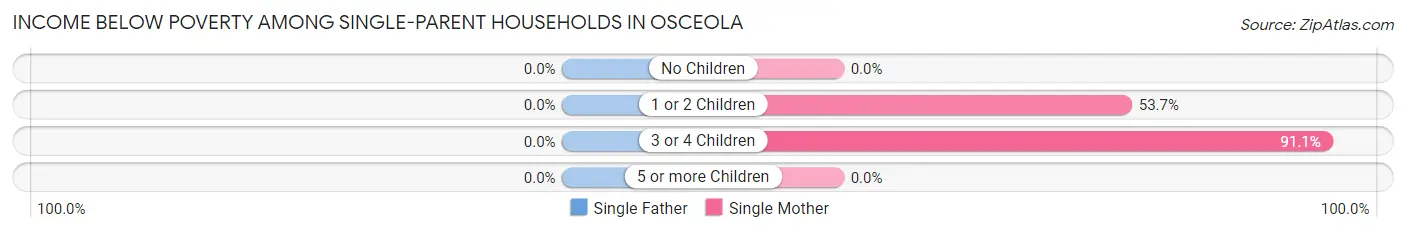
| Children | Single Father | Single Mother |
| No Children | 0 (0.0%) | 0 (0.0%) |
| 1 or 2 Children | 0 (0.0%) | 22 (53.7%) |
| 3 or 4 Children | 0 (0.0%) | 51 (91.1%) |
| 5 or more Children | 0 (0.0%) | 0 (0.0%) |
| Total | 0 (0.0%) | 73 (61.9%) |
Income Below Poverty Among Married-Couple vs Single-Parent Households in Osceola
The poverty data for Osceola shows that 27 of the married-couple family households (5.0%) and 73 of the single-parent households (40.6%) are living below the poverty level. Within the married-couple family households, those with 3 or 4 children have the highest poverty rate, with 6 households (12.0%) falling below the poverty line. Among the single-parent households, those with 3 or 4 children have the highest poverty rate, with 51 household (83.6%) living below poverty.
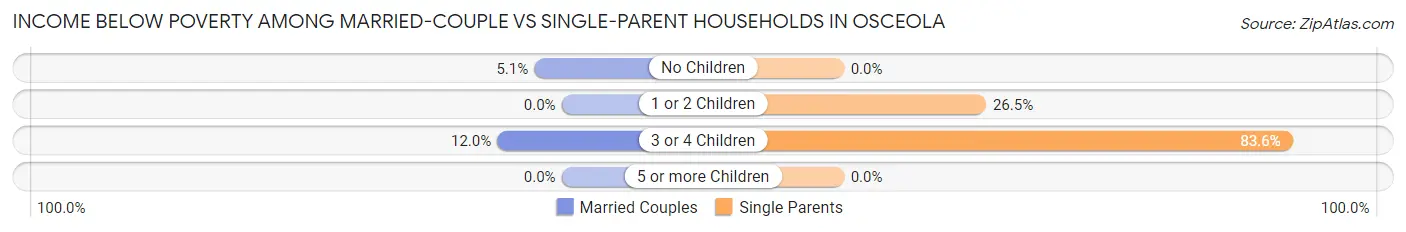
| Children | Married-Couple Families | Single-Parent Households |
| No Children | 21 (5.1%) | 0 (0.0%) |
| 1 or 2 Children | 0 (0.0%) | 22 (26.5%) |
| 3 or 4 Children | 6 (12.0%) | 51 (83.6%) |
| 5 or more Children | 0 (0.0%) | 0 (0.0%) |
| Total | 27 (5.0%) | 73 (40.6%) |
Race in Osceola
The most populous races in Osceola are White / Caucasian (2,596 | 93.2%), Two or more Races (113 | 4.1%), and Hispanic or Latino (102 | 3.7%).
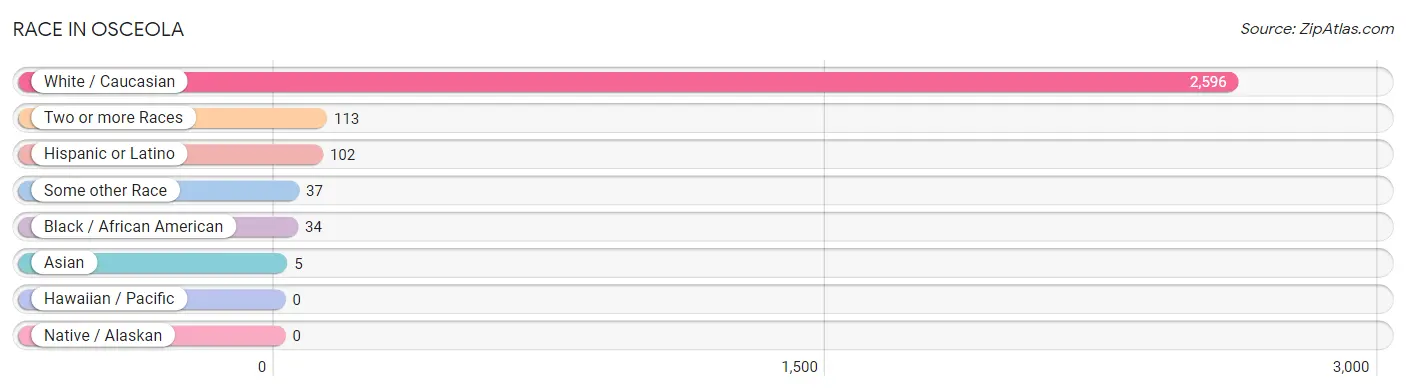
| Race | # Population | % Population |
| Asian | 5 | 0.2% |
| Black / African American | 34 | 1.2% |
| Hawaiian / Pacific | 0 | 0.0% |
| Hispanic or Latino | 102 | 3.7% |
| Native / Alaskan | 0 | 0.0% |
| White / Caucasian | 2,596 | 93.2% |
| Two or more Races | 113 | 4.1% |
| Some other Race | 37 | 1.3% |
| Total | 2,785 | 100.0% |
Ancestry in Osceola
The most populous ancestries reported in Osceola are German (785 | 28.2%), Norwegian (348 | 12.5%), American (339 | 12.2%), Irish (236 | 8.5%), and Swedish (228 | 8.2%), together accounting for 69.5% of all Osceola residents.
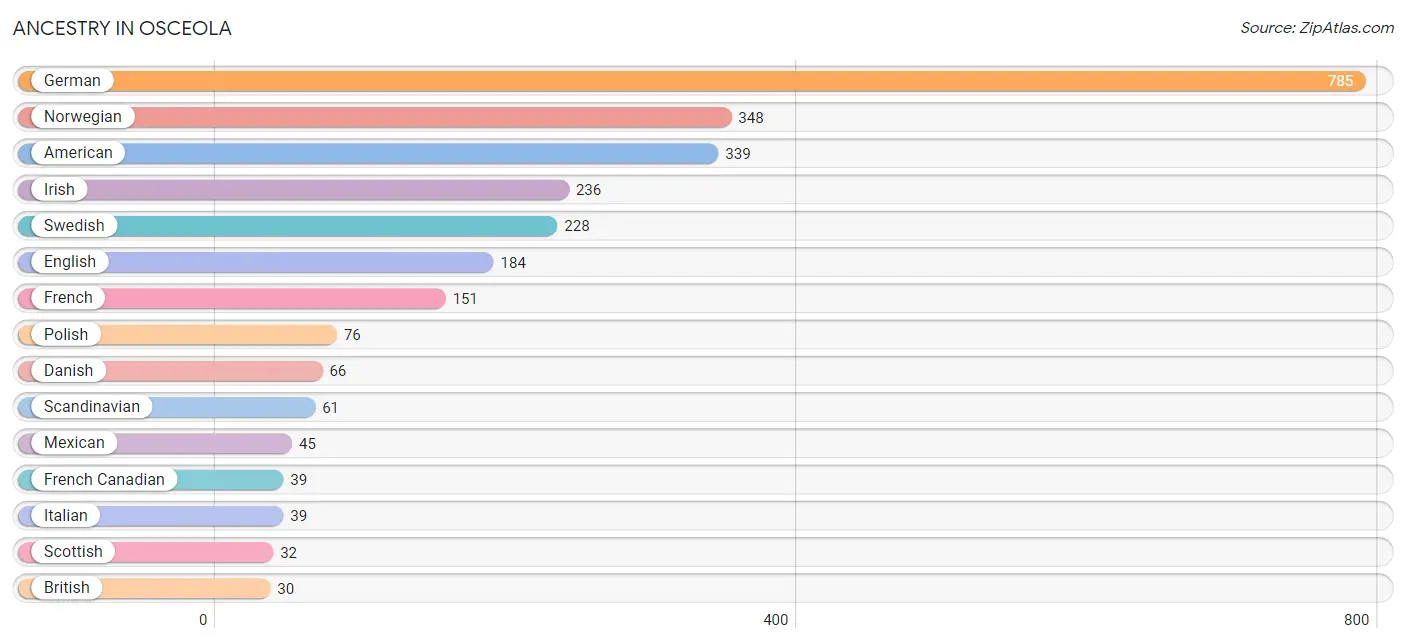
| Ancestry | # Population | % Population |
| African | 5 | 0.2% |
| American | 339 | 12.2% |
| Arab | 3 | 0.1% |
| Austrian | 5 | 0.2% |
| Blackfeet | 5 | 0.2% |
| British | 30 | 1.1% |
| Canadian | 5 | 0.2% |
| Celtic | 6 | 0.2% |
| Chippewa | 12 | 0.4% |
| Cuban | 12 | 0.4% |
| Czech | 24 | 0.9% |
| Danish | 66 | 2.4% |
| Dutch | 9 | 0.3% |
| English | 184 | 6.6% |
| European | 27 | 1.0% |
| Finnish | 24 | 0.9% |
| French | 151 | 5.4% |
| French Canadian | 39 | 1.4% |
| German | 785 | 28.2% |
| Irish | 236 | 8.5% |
| Israeli | 11 | 0.4% |
| Italian | 39 | 1.4% |
| Mexican | 45 | 1.6% |
| Moroccan | 3 | 0.1% |
| Norwegian | 348 | 12.5% |
| Pakistani | 5 | 0.2% |
| Polish | 76 | 2.7% |
| Puerto Rican | 24 | 0.9% |
| Russian | 12 | 0.4% |
| Scandinavian | 61 | 2.2% |
| Scottish | 32 | 1.1% |
| Spanish | 21 | 0.7% |
| Subsaharan African | 5 | 0.2% |
| Swedish | 228 | 8.2% |
| Welsh | 20 | 0.7% | View All 35 Rows |
Immigrants in Osceola
The most numerous immigrant groups reported in Osceola came from Europe (7 | 0.3%), Southern Europe (7 | 0.3%), Spain (7 | 0.3%), Asia (5 | 0.2%), and Canada (5 | 0.2%), together accounting for 1.1% of all Osceola residents.
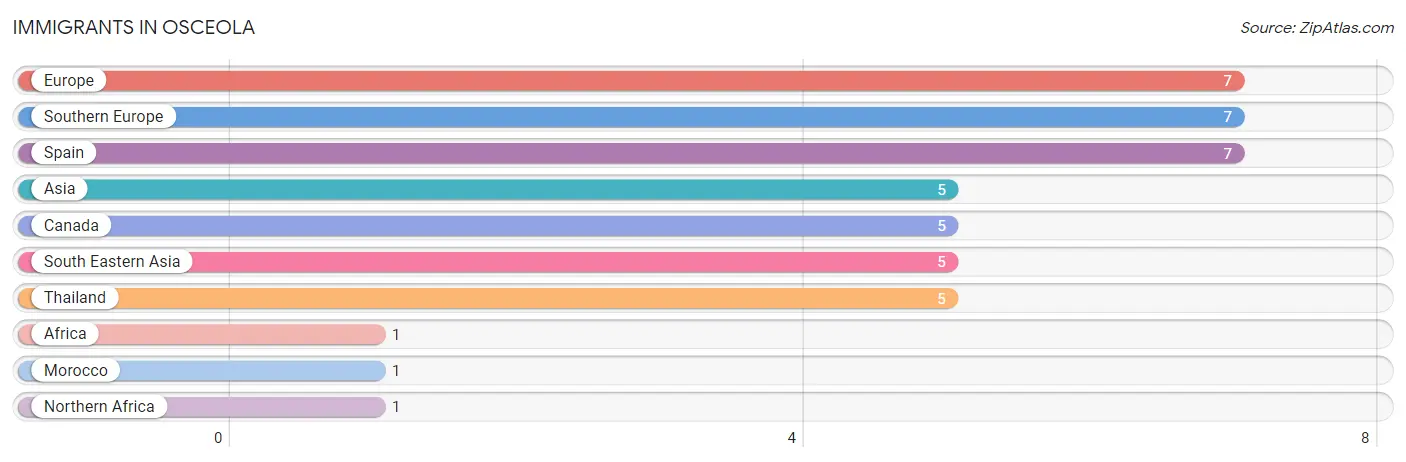
| Immigration Origin | # Population | % Population |
| Africa | 1 | 0.0% |
| Asia | 5 | 0.2% |
| Canada | 5 | 0.2% |
| Europe | 7 | 0.3% |
| Morocco | 1 | 0.0% |
| Northern Africa | 1 | 0.0% |
| South Eastern Asia | 5 | 0.2% |
| Southern Europe | 7 | 0.3% |
| Spain | 7 | 0.3% |
| Thailand | 5 | 0.2% | View All 10 Rows |
Sex and Age in Osceola
Sex and Age in Osceola
The most populous age groups in Osceola are 25 to 29 Years (137 | 10.4%) for men and 60 to 64 Years (158 | 10.7%) for women.
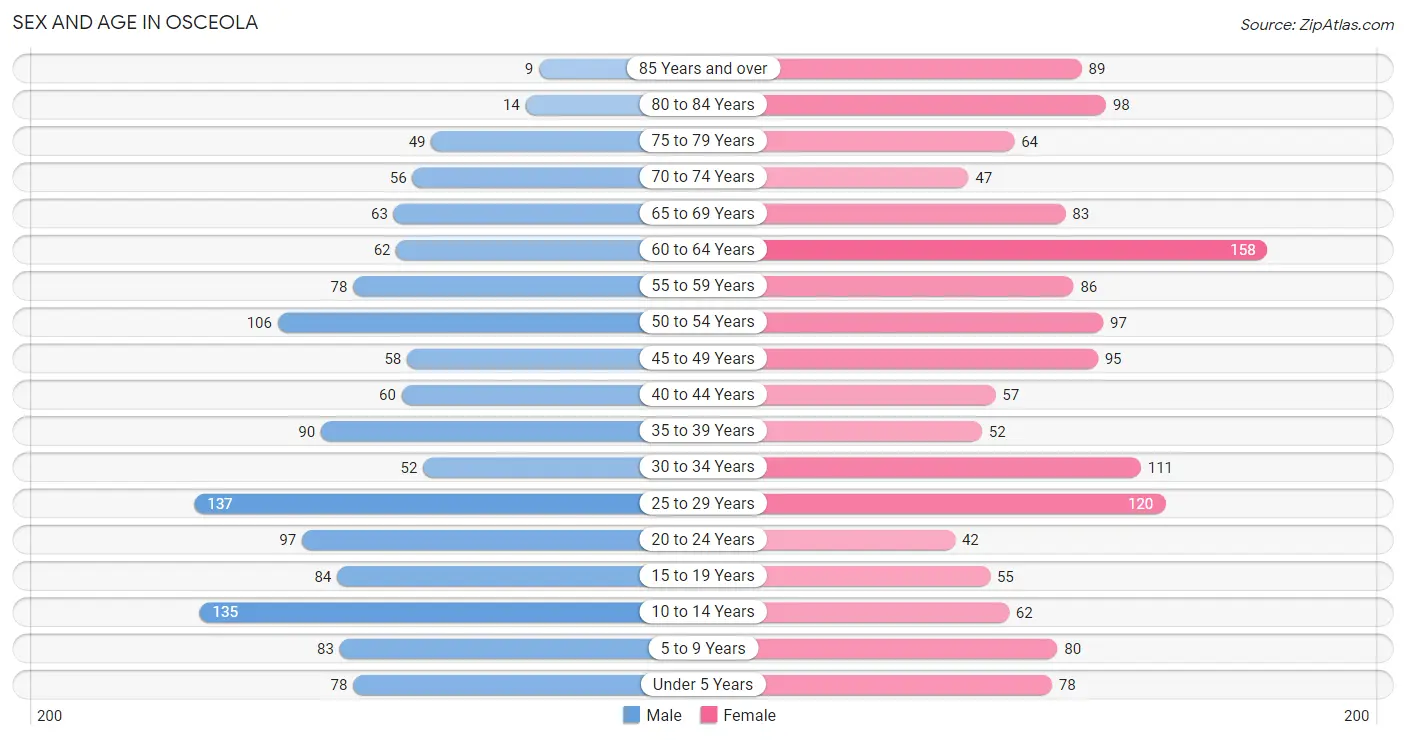
| Age Bracket | Male | Female |
| Under 5 Years | 78 (5.9%) | 78 (5.3%) |
| 5 to 9 Years | 83 (6.3%) | 80 (5.4%) |
| 10 to 14 Years | 135 (10.3%) | 62 (4.2%) |
| 15 to 19 Years | 84 (6.4%) | 55 (3.7%) |
| 20 to 24 Years | 97 (7.4%) | 42 (2.9%) |
| 25 to 29 Years | 137 (10.4%) | 120 (8.1%) |
| 30 to 34 Years | 52 (4.0%) | 111 (7.5%) |
| 35 to 39 Years | 90 (6.9%) | 52 (3.5%) |
| 40 to 44 Years | 60 (4.6%) | 57 (3.9%) |
| 45 to 49 Years | 58 (4.4%) | 95 (6.5%) |
| 50 to 54 Years | 106 (8.1%) | 97 (6.6%) |
| 55 to 59 Years | 78 (5.9%) | 86 (5.8%) |
| 60 to 64 Years | 62 (4.7%) | 158 (10.7%) |
| 65 to 69 Years | 63 (4.8%) | 83 (5.6%) |
| 70 to 74 Years | 56 (4.3%) | 47 (3.2%) |
| 75 to 79 Years | 49 (3.7%) | 64 (4.3%) |
| 80 to 84 Years | 14 (1.1%) | 98 (6.7%) |
| 85 Years and over | 9 (0.7%) | 89 (6.0%) |
| Total | 1,311 (100.0%) | 1,474 (100.0%) |
Families and Households in Osceola
Median Family Size in Osceola
The median family size in Osceola is 2.73 persons per family, with single female/mother families (118 | 16.3%) accounting for the largest median family size of 3.19 persons per family. On the other hand, married-couple families (544 | 75.1%) represent the smallest median family size with 2.59 persons per family.
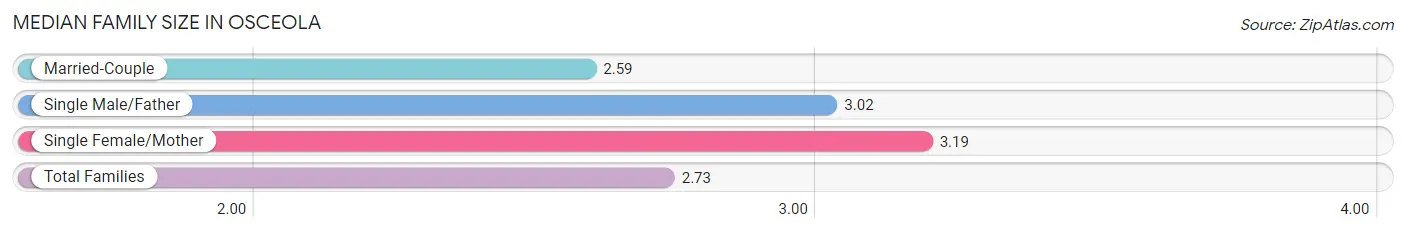
| Family Type | # Families | Family Size |
| Married-Couple | 544 (75.1%) | 2.59 |
| Single Male/Father | 62 (8.6%) | 3.02 |
| Single Female/Mother | 118 (16.3%) | 3.19 |
| Total Families | 724 (100.0%) | 2.73 |
Median Household Size in Osceola
The median household size in Osceola is 2.04 persons per household, with single female/mother households (118 | 8.8%) accounting for the largest median household size of 3.36 persons per household. non-family households (618 | 46.1%) represent the smallest median household size with 1.17 persons per household.
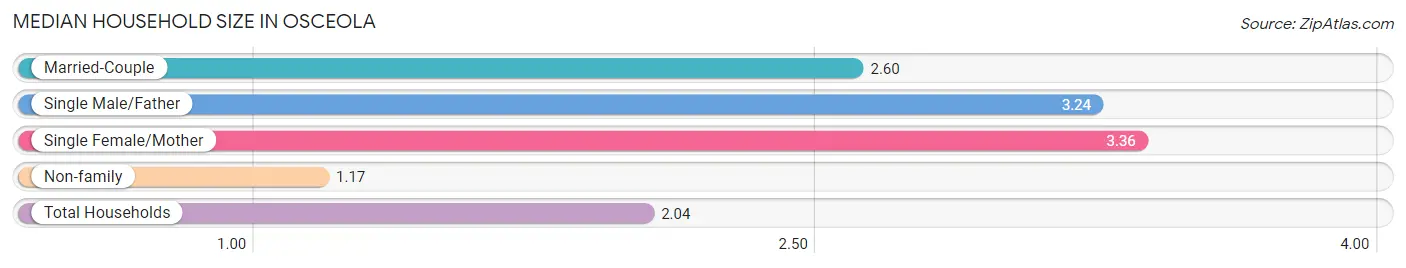
| Household Type | # Households | Household Size |
| Married-Couple | 544 (40.5%) | 2.60 |
| Single Male/Father | 62 (4.6%) | 3.24 |
| Single Female/Mother | 118 (8.8%) | 3.36 |
| Non-family | 618 (46.1%) | 1.17 |
| Total Households | 1,342 (100.0%) | 2.04 |
Household Size by Marriage Status in Osceola
Out of a total of 1,342 households in Osceola, 724 (53.9%) are family households, while 618 (46.1%) are nonfamily households. The most numerous type of family households are 2-person households, comprising 434, and the most common type of nonfamily households are 1-person households, comprising 520.
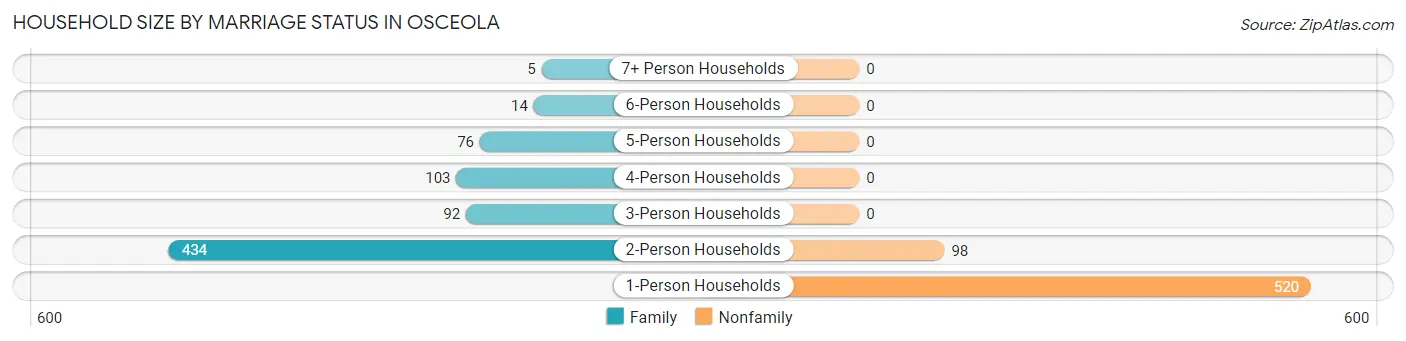
| Household Size | Family Households | Nonfamily Households |
| 1-Person Households | - | 520 (38.8%) |
| 2-Person Households | 434 (32.3%) | 98 (7.3%) |
| 3-Person Households | 92 (6.9%) | 0 (0.0%) |
| 4-Person Households | 103 (7.7%) | 0 (0.0%) |
| 5-Person Households | 76 (5.7%) | 0 (0.0%) |
| 6-Person Households | 14 (1.0%) | 0 (0.0%) |
| 7+ Person Households | 5 (0.4%) | 0 (0.0%) |
| Total | 724 (53.9%) | 618 (46.1%) |
Female Fertility in Osceola
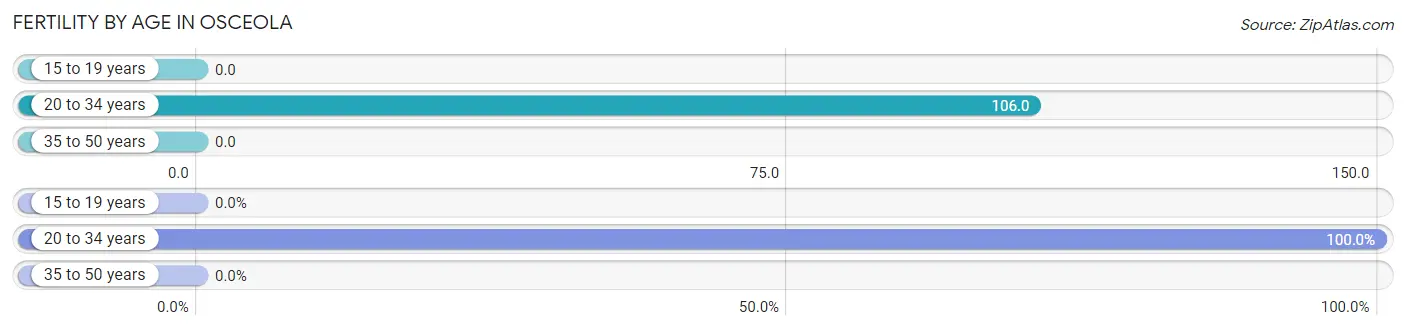
Fertility by Age in Osceola
Average fertility rate in Osceola is 52.0 births per 1,000 women. Women in the age bracket of 20 to 34 years have the highest fertility rate with 106.0 births per 1,000 women. Women in the age bracket of 20 to 34 years acount for 100.0% of all women with births.
| Age Bracket | Women with Births | Births / 1,000 Women |
| 15 to 19 years | 0 (0.0%) | 0.0 |
| 20 to 34 years | 29 (100.0%) | 106.0 |
| 35 to 50 years | 0 (0.0%) | 0.0 |
| Total | 29 (100.0%) | 52.0 |
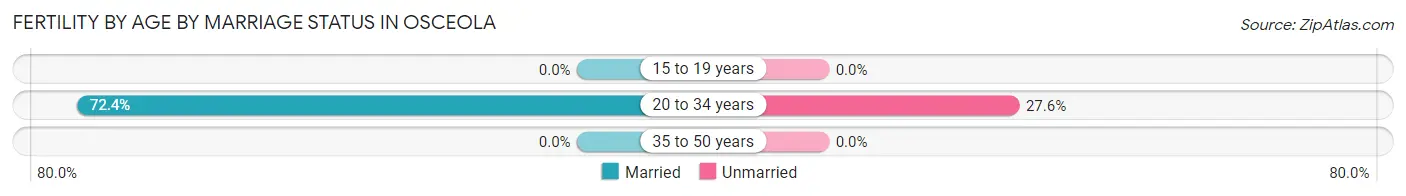
Fertility by Age by Marriage Status in Osceola
72.4% of women with births (29) in Osceola are married. The highest percentage of unmarried women with births falls into 20 to 34 years age bracket with 27.6% of them unmarried at the time of birth, while the lowest percentage of unmarried women with births belong to 20 to 34 years age bracket with 27.6% of them unmarried.
| Age Bracket | Married | Unmarried |
| 15 to 19 years | 0 (0.0%) | 0 (0.0%) |
| 20 to 34 years | 21 (72.4%) | 8 (27.6%) |
| 35 to 50 years | 0 (0.0%) | 0 (0.0%) |
| Total | 21 (72.4%) | 8 (27.6%) |
Fertility by Education in Osceola
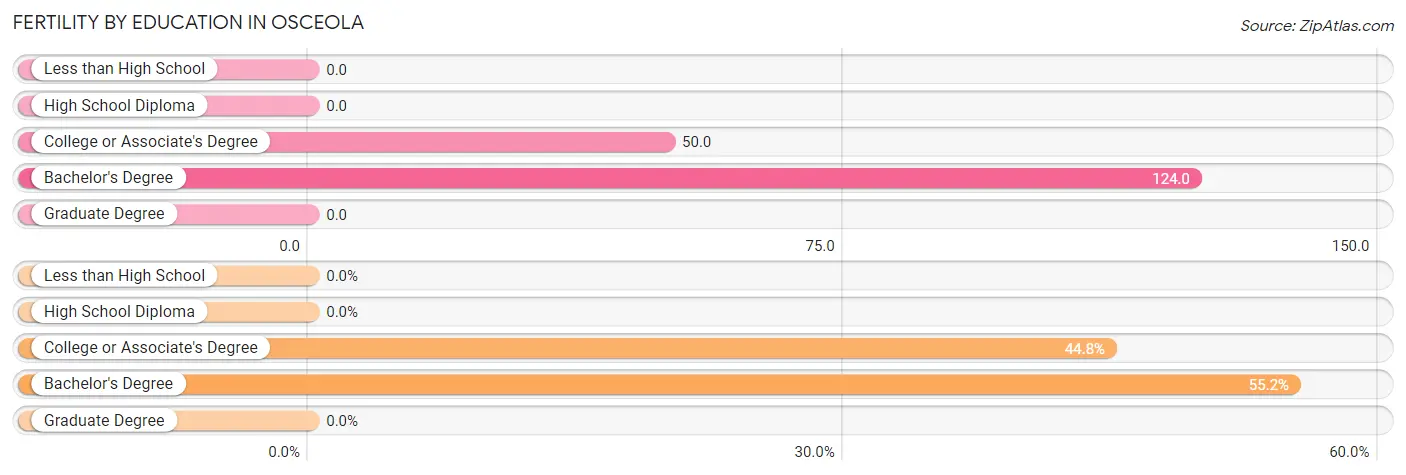
| Educational Attainment | Women with Births | Births / 1,000 Women |
| Less than High School | 0 (0.0%) | 0.0 |
| High School Diploma | 0 (0.0%) | 0.0 |
| College or Associate's Degree | 13 (44.8%) | 50.0 |
| Bachelor's Degree | 16 (55.2%) | 124.0 |
| Graduate Degree | 0 (0.0%) | 0.0 |
| Total | 29 (100.0%) | 52.0 |
Fertility by Education by Marriage Status in Osceola
27.6% of women with births in Osceola are unmarried. Women with the educational attainment of bachelor's degree are most likely to be married with 100.0% of them married at childbirth, while women with the educational attainment of college or associate's degree are least likely to be married with 61.5% of them unmarried at childbirth.
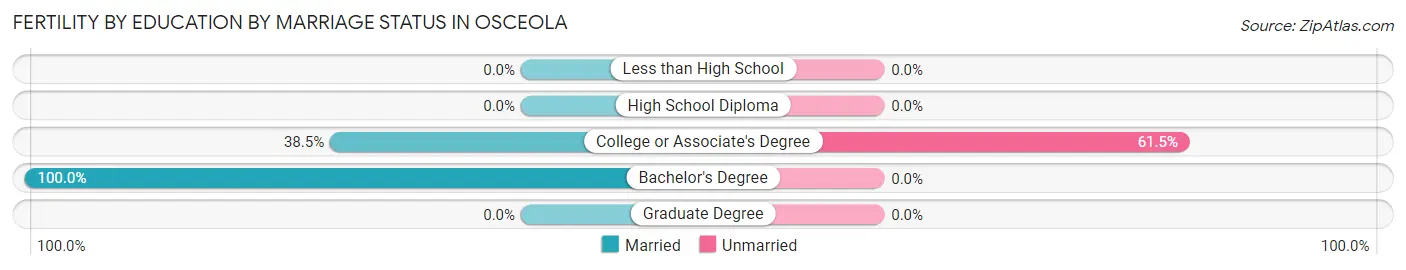
| Educational Attainment | Married | Unmarried |
| Less than High School | 0 (0.0%) | 0 (0.0%) |
| High School Diploma | 0 (0.0%) | 0 (0.0%) |
| College or Associate's Degree | 5 (38.5%) | 8 (61.5%) |
| Bachelor's Degree | 16 (100.0%) | 0 (0.0%) |
| Graduate Degree | 0 (0.0%) | 0 (0.0%) |
| Total | 21 (72.4%) | 8 (27.6%) |
Employment Characteristics in Osceola
Employment by Class of Employer in Osceola
Among the 1,327 employed individuals in Osceola, private company employees (981 | 73.9%), not-for-profit organizations (113 | 8.5%), and local government employees (84 | 6.3%) make up the most common classes of employment.
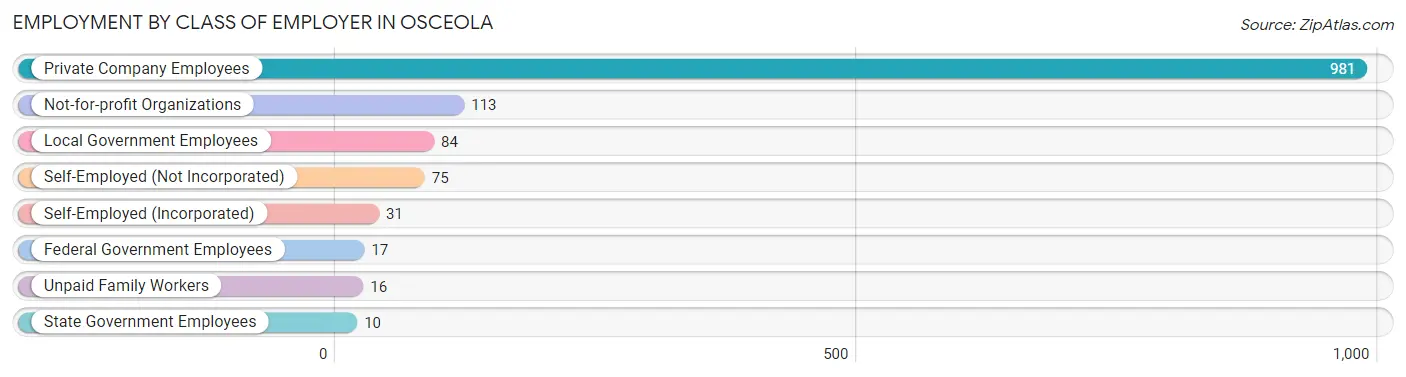
| Employer Class | # Employees | % Employees |
| Private Company Employees | 981 | 73.9% |
| Self-Employed (Incorporated) | 31 | 2.3% |
| Self-Employed (Not Incorporated) | 75 | 5.7% |
| Not-for-profit Organizations | 113 | 8.5% |
| Local Government Employees | 84 | 6.3% |
| State Government Employees | 10 | 0.7% |
| Federal Government Employees | 17 | 1.3% |
| Unpaid Family Workers | 16 | 1.2% |
| Total | 1,327 | 100.0% |
Employment Status by Age in Osceola
According to the labor force statistics for Osceola, out of the total population over 16 years of age (2,211), 66.8% or 1,477 individuals are in the labor force, with 8.8% or 130 of them unemployed. The age group with the highest labor force participation rate is 30 to 34 years, with 97.5% or 159 individuals in the labor force. Within the labor force, the 30 to 34 years age range has the highest percentage of unemployed individuals, with 30.8% or 49 of them being unemployed.
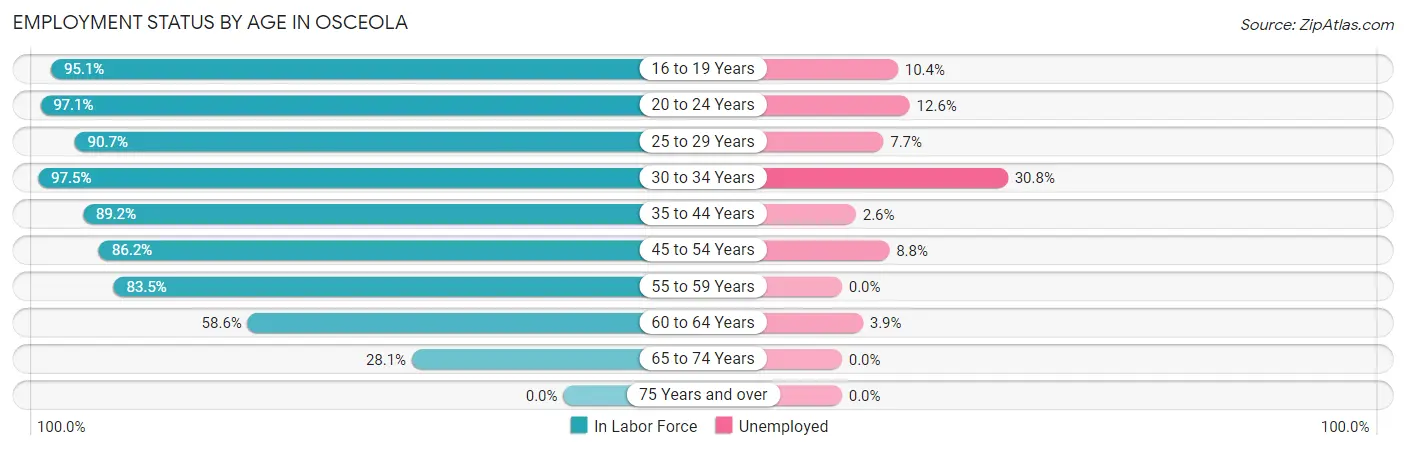
| Age Bracket | In Labor Force | Unemployed |
| 16 to 19 Years | 77 (95.1%) | 8 (10.4%) |
| 20 to 24 Years | 135 (97.1%) | 17 (12.6%) |
| 25 to 29 Years | 233 (90.7%) | 18 (7.7%) |
| 30 to 34 Years | 159 (97.5%) | 49 (30.8%) |
| 35 to 44 Years | 231 (89.2%) | 6 (2.6%) |
| 45 to 54 Years | 307 (86.2%) | 27 (8.8%) |
| 55 to 59 Years | 137 (83.5%) | 0 (0.0%) |
| 60 to 64 Years | 129 (58.6%) | 5 (3.9%) |
| 65 to 74 Years | 70 (28.1%) | 0 (0.0%) |
| 75 Years and over | 0 (0.0%) | 0 (0.0%) |
| Total | 1,477 (66.8%) | 130 (8.8%) |
Employment Status by Educational Attainment in Osceola
According to labor force statistics for Osceola, 84.3% of individuals (1,196) out of the total population between 25 and 64 years of age (1,419) are in the labor force, with 8.8% or 105 of them being unemployed. The group with the highest labor force participation rate are those with the educational attainment of college / associate degree, with 91.6% or 624 individuals in the labor force. Within the labor force, individuals with less than high school education have the highest percentage of unemployment, with 52.2% or 24 of them being unemployed.
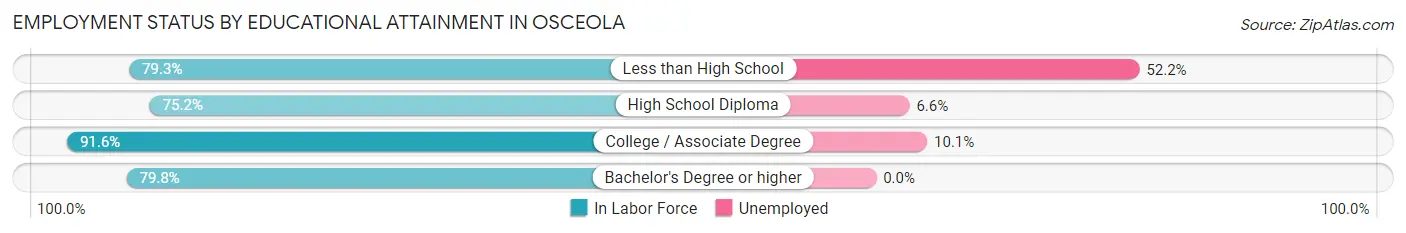
| Educational Attainment | In Labor Force | Unemployed |
| Less than High School | 46 (79.3%) | 30 (52.2%) |
| High School Diploma | 273 (75.2%) | 24 (6.6%) |
| College / Associate Degree | 624 (91.6%) | 69 (10.1%) |
| Bachelor's Degree or higher | 253 (79.8%) | 0 (0.0%) |
| Total | 1,196 (84.3%) | 125 (8.8%) |
Employment Occupations by Sex in Osceola
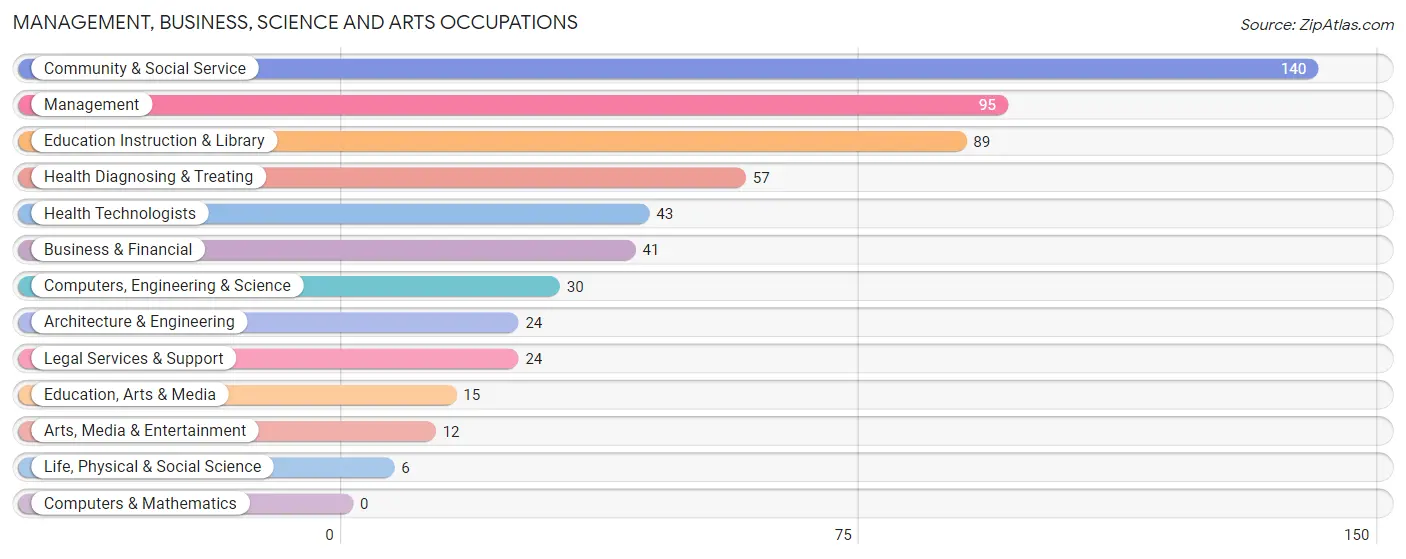
Management, Business, Science and Arts Occupations
The most common Management, Business, Science and Arts occupations in Osceola are Community & Social Service (140 | 10.4%), Management (95 | 7.0%), Education Instruction & Library (89 | 6.6%), Health Diagnosing & Treating (57 | 4.2%), and Health Technologists (43 | 3.2%).
Management, Business, Science and Arts Occupations by Sex
Within the Management, Business, Science and Arts occupations in Osceola, the most male-oriented occupations are Architecture & Engineering (100.0%), Computers, Engineering & Science (80.0%), and Arts, Media & Entertainment (41.7%), while the most female-oriented occupations are Life, Physical & Social Science (100.0%), Education, Arts & Media (93.3%), and Business & Financial (87.8%).
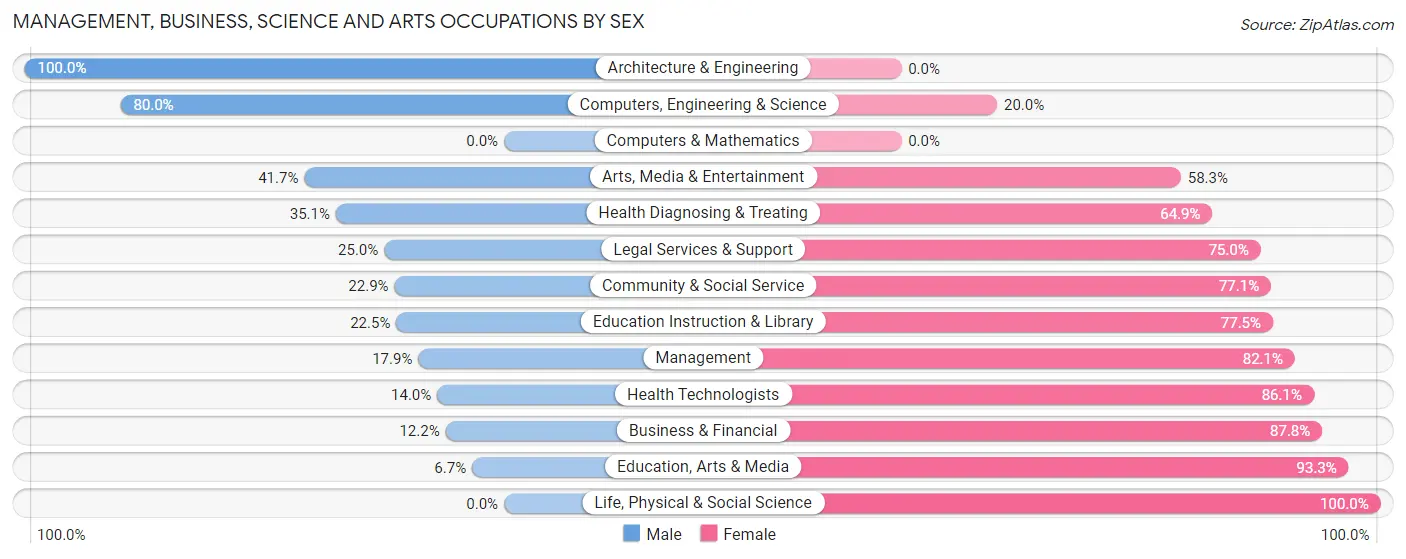
| Occupation | Male | Female |
| Management | 17 (17.9%) | 78 (82.1%) |
| Business & Financial | 5 (12.2%) | 36 (87.8%) |
| Computers, Engineering & Science | 24 (80.0%) | 6 (20.0%) |
| Computers & Mathematics | 0 (0.0%) | 0 (0.0%) |
| Architecture & Engineering | 24 (100.0%) | 0 (0.0%) |
| Life, Physical & Social Science | 0 (0.0%) | 6 (100.0%) |
| Community & Social Service | 32 (22.9%) | 108 (77.1%) |
| Education, Arts & Media | 1 (6.7%) | 14 (93.3%) |
| Legal Services & Support | 6 (25.0%) | 18 (75.0%) |
| Education Instruction & Library | 20 (22.5%) | 69 (77.5%) |
| Arts, Media & Entertainment | 5 (41.7%) | 7 (58.3%) |
| Health Diagnosing & Treating | 20 (35.1%) | 37 (64.9%) |
| Health Technologists | 6 (14.0%) | 37 (86.1%) |
| Total (Category) | 98 (27.0%) | 265 (73.0%) |
| Total (Overall) | 650 (48.2%) | 698 (51.8%) |
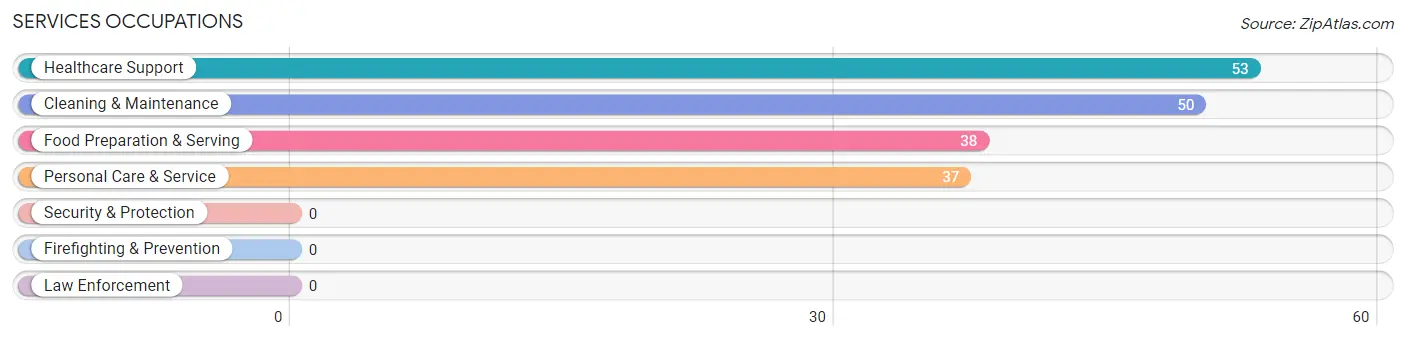
Services Occupations
The most common Services occupations in Osceola are Healthcare Support (53 | 3.9%), Cleaning & Maintenance (50 | 3.7%), Food Preparation & Serving (38 | 2.8%), and Personal Care & Service (37 | 2.7%).
Services Occupations by Sex
Within the Services occupations in Osceola, the most male-oriented occupations are Food Preparation & Serving (81.6%), and Cleaning & Maintenance (30.0%), while the most female-oriented occupations are Healthcare Support (100.0%), Personal Care & Service (100.0%), and Cleaning & Maintenance (70.0%).
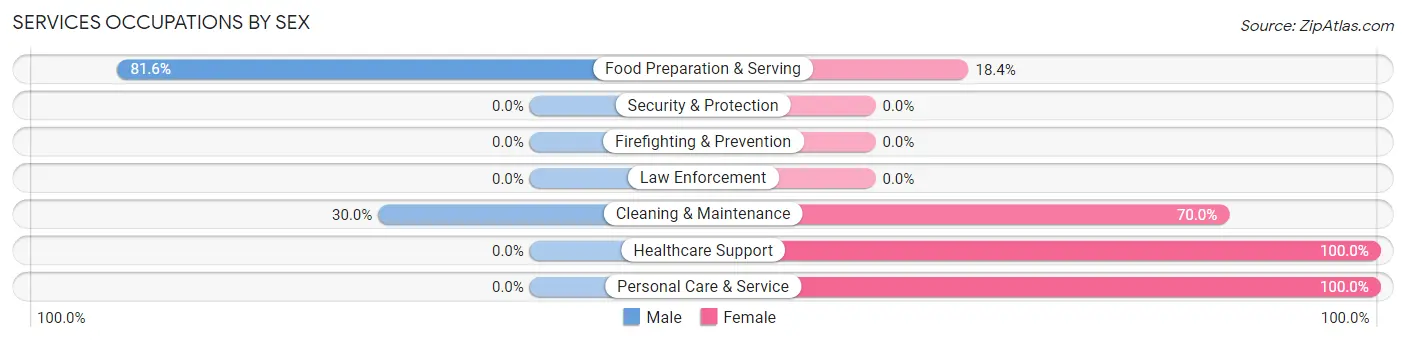
| Occupation | Male | Female |
| Healthcare Support | 0 (0.0%) | 53 (100.0%) |
| Security & Protection | 0 (0.0%) | 0 (0.0%) |
| Firefighting & Prevention | 0 (0.0%) | 0 (0.0%) |
| Law Enforcement | 0 (0.0%) | 0 (0.0%) |
| Food Preparation & Serving | 31 (81.6%) | 7 (18.4%) |
| Cleaning & Maintenance | 15 (30.0%) | 35 (70.0%) |
| Personal Care & Service | 0 (0.0%) | 37 (100.0%) |
| Total (Category) | 46 (25.8%) | 132 (74.2%) |
| Total (Overall) | 650 (48.2%) | 698 (51.8%) |
Sales and Office Occupations
The most common Sales and Office occupations in Osceola are Office & Administration (120 | 8.9%), and Sales & Related (78 | 5.8%).

Sales and Office Occupations by Sex

| Occupation | Male | Female |
| Sales & Related | 45 (57.7%) | 33 (42.3%) |
| Office & Administration | 11 (9.2%) | 109 (90.8%) |
| Total (Category) | 56 (28.3%) | 142 (71.7%) |
| Total (Overall) | 650 (48.2%) | 698 (51.8%) |
Natural Resources, Construction and Maintenance Occupations
The most common Natural Resources, Construction and Maintenance occupations in Osceola are Construction & Extraction (82 | 6.1%), and Installation, Maintenance & Repair (19 | 1.4%).

Natural Resources, Construction and Maintenance Occupations by Sex

| Occupation | Male | Female |
| Farming, Fishing & Forestry | 0 (0.0%) | 0 (0.0%) |
| Construction & Extraction | 76 (92.7%) | 6 (7.3%) |
| Installation, Maintenance & Repair | 19 (100.0%) | 0 (0.0%) |
| Total (Category) | 95 (94.1%) | 6 (5.9%) |
| Total (Overall) | 650 (48.2%) | 698 (51.8%) |
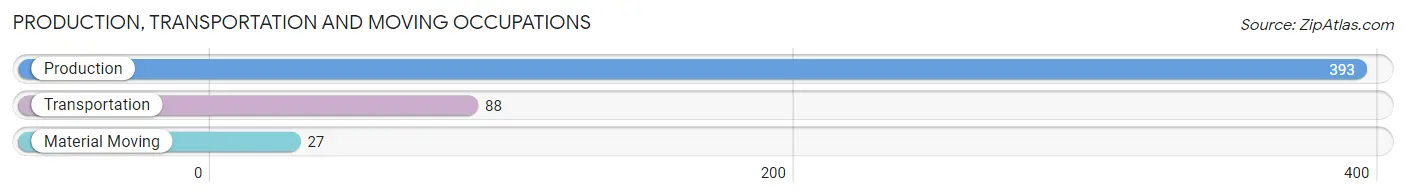
Production, Transportation and Moving Occupations
The most common Production, Transportation and Moving occupations in Osceola are Production (393 | 29.1%), Transportation (88 | 6.5%), and Material Moving (27 | 2.0%).
Production, Transportation and Moving Occupations by Sex
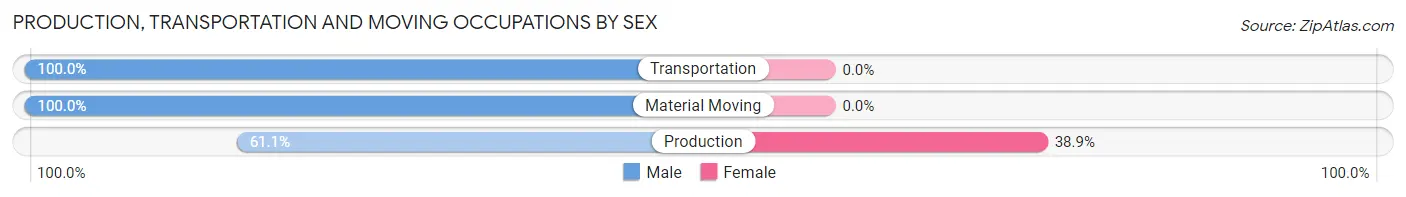
| Occupation | Male | Female |
| Production | 240 (61.1%) | 153 (38.9%) |
| Transportation | 88 (100.0%) | 0 (0.0%) |
| Material Moving | 27 (100.0%) | 0 (0.0%) |
| Total (Category) | 355 (69.9%) | 153 (30.1%) |
| Total (Overall) | 650 (48.2%) | 698 (51.8%) |
Employment Industries by Sex in Osceola
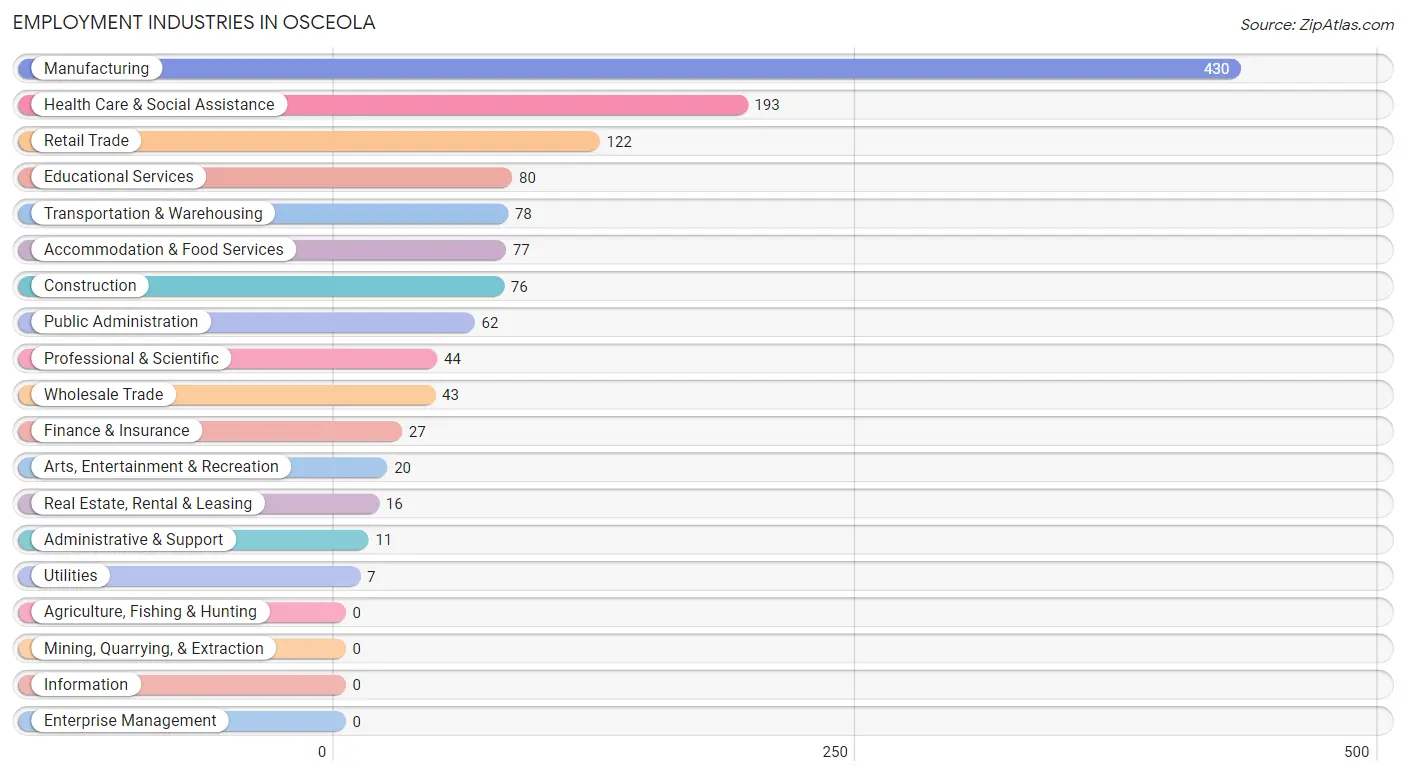
Employment Industries in Osceola
The major employment industries in Osceola include Manufacturing (430 | 31.9%), Health Care & Social Assistance (193 | 14.3%), Retail Trade (122 | 9.0%), Educational Services (80 | 5.9%), and Transportation & Warehousing (78 | 5.8%).
Employment Industries by Sex in Osceola
The Osceola industries that see more men than women are Utilities (100.0%), Administrative & Support (100.0%), and Construction (92.1%), whereas the industries that tend to have a higher number of women are Finance & Insurance (100.0%), Real Estate, Rental & Leasing (100.0%), and Health Care & Social Assistance (89.6%).
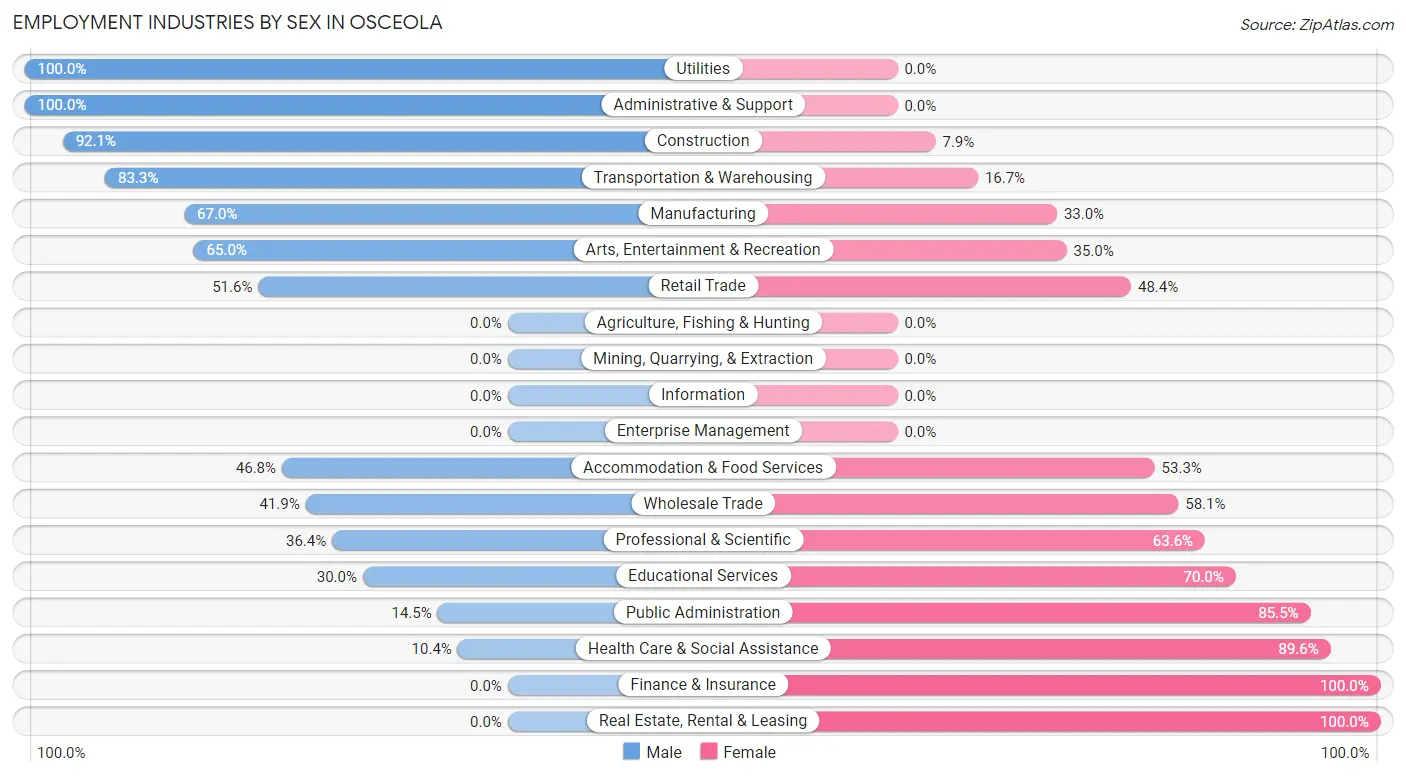
| Industry | Male | Female |
| Agriculture, Fishing & Hunting | 0 (0.0%) | 0 (0.0%) |
| Mining, Quarrying, & Extraction | 0 (0.0%) | 0 (0.0%) |
| Construction | 70 (92.1%) | 6 (7.9%) |
| Manufacturing | 288 (67.0%) | 142 (33.0%) |
| Wholesale Trade | 18 (41.9%) | 25 (58.1%) |
| Retail Trade | 63 (51.6%) | 59 (48.4%) |
| Transportation & Warehousing | 65 (83.3%) | 13 (16.7%) |
| Utilities | 7 (100.0%) | 0 (0.0%) |
| Information | 0 (0.0%) | 0 (0.0%) |
| Finance & Insurance | 0 (0.0%) | 27 (100.0%) |
| Real Estate, Rental & Leasing | 0 (0.0%) | 16 (100.0%) |
| Professional & Scientific | 16 (36.4%) | 28 (63.6%) |
| Enterprise Management | 0 (0.0%) | 0 (0.0%) |
| Administrative & Support | 11 (100.0%) | 0 (0.0%) |
| Educational Services | 24 (30.0%) | 56 (70.0%) |
| Health Care & Social Assistance | 20 (10.4%) | 173 (89.6%) |
| Arts, Entertainment & Recreation | 13 (65.0%) | 7 (35.0%) |
| Accommodation & Food Services | 36 (46.8%) | 41 (53.2%) |
| Public Administration | 9 (14.5%) | 53 (85.5%) |
| Total | 650 (48.2%) | 698 (51.8%) |
Education in Osceola
School Enrollment in Osceola
The most common levels of schooling among the 528 students in Osceola are middle school (163 | 30.9%), high school (104 | 19.7%), and elementary school (96 | 18.2%).
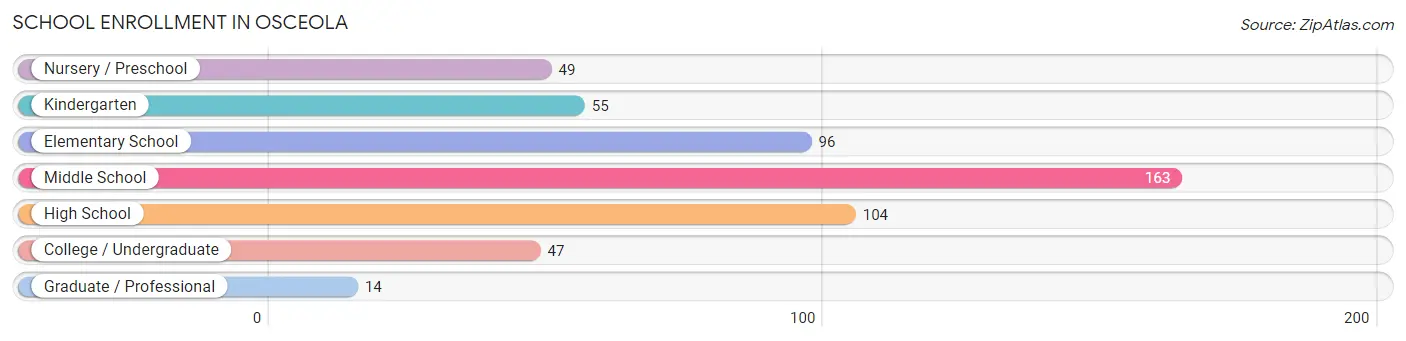
| School Level | # Students | % Students |
| Nursery / Preschool | 49 | 9.3% |
| Kindergarten | 55 | 10.4% |
| Elementary School | 96 | 18.2% |
| Middle School | 163 | 30.9% |
| High School | 104 | 19.7% |
| College / Undergraduate | 47 | 8.9% |
| Graduate / Professional | 14 | 2.6% |
| Total | 528 | 100.0% |
School Enrollment by Age by Funding Source in Osceola
Out of a total of 528 students who are enrolled in schools in Osceola, 48 (9.1%) attend a private institution, while the remaining 480 (90.9%) are enrolled in public schools. The age group of 35 years and over has the highest likelihood of being enrolled in private schools, with 10 (100.0% in the age bracket) enrolled. Conversely, the age group of 3 to 4 year olds has the lowest likelihood of being enrolled in a private school, with 21 (100.0% in the age bracket) attending a public institution.
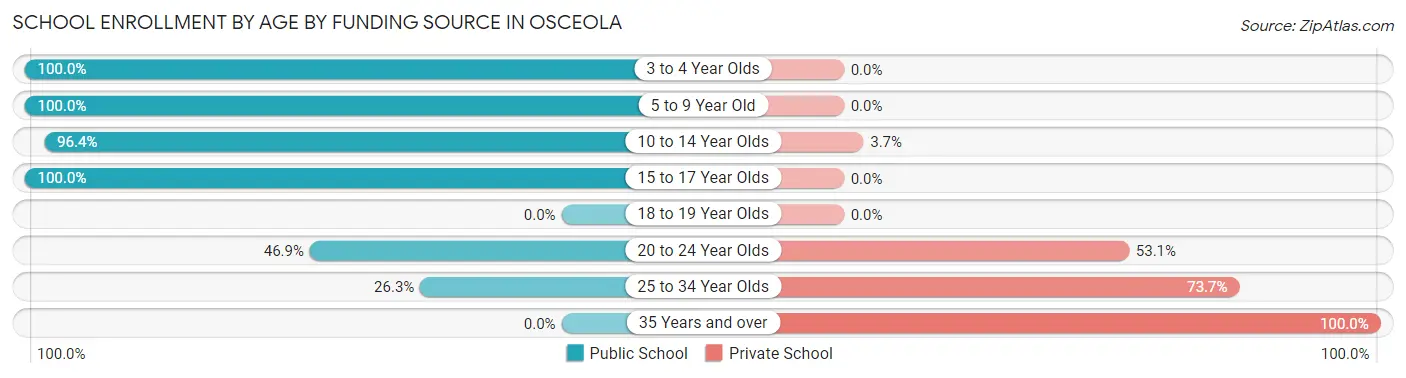
| Age Bracket | Public School | Private School |
| 3 to 4 Year Olds | 21 (100.0%) | 0 (0.0%) |
| 5 to 9 Year Old | 159 (100.0%) | 0 (0.0%) |
| 10 to 14 Year Olds | 185 (96.4%) | 7 (3.6%) |
| 15 to 17 Year Olds | 95 (100.0%) | 0 (0.0%) |
| 18 to 19 Year Olds | 0 (0.0%) | 0 (0.0%) |
| 20 to 24 Year Olds | 15 (46.9%) | 17 (53.1%) |
| 25 to 34 Year Olds | 5 (26.3%) | 14 (73.7%) |
| 35 Years and over | 0 (0.0%) | 10 (100.0%) |
| Total | 480 (90.9%) | 48 (9.1%) |
Educational Attainment by Field of Study in Osceola
Education (100 | 24.1%), science & technology (59 | 14.2%), business (48 | 11.6%), visual & performing arts (40 | 9.6%), and social sciences (28 | 6.8%) are the most common fields of study among 415 individuals in Osceola who have obtained a bachelor's degree or higher.
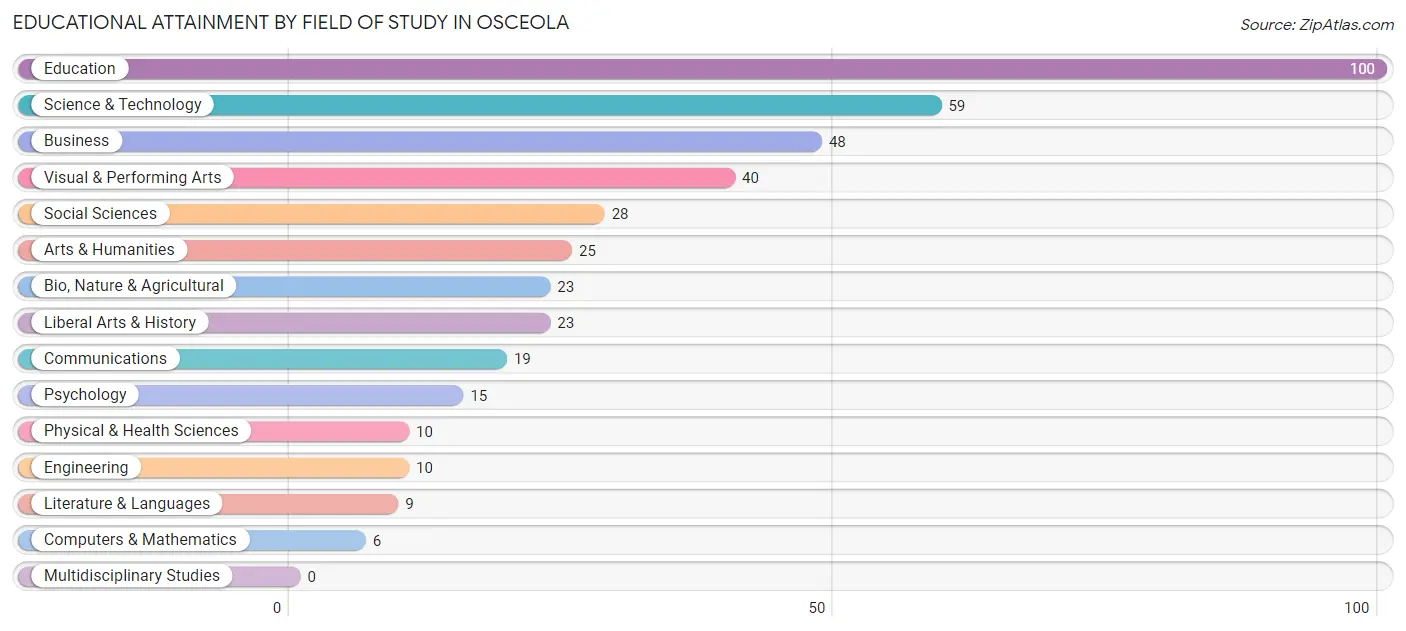
| Field of Study | # Graduates | % Graduates |
| Computers & Mathematics | 6 | 1.5% |
| Bio, Nature & Agricultural | 23 | 5.5% |
| Physical & Health Sciences | 10 | 2.4% |
| Psychology | 15 | 3.6% |
| Social Sciences | 28 | 6.8% |
| Engineering | 10 | 2.4% |
| Multidisciplinary Studies | 0 | 0.0% |
| Science & Technology | 59 | 14.2% |
| Business | 48 | 11.6% |
| Education | 100 | 24.1% |
| Literature & Languages | 9 | 2.2% |
| Liberal Arts & History | 23 | 5.5% |
| Visual & Performing Arts | 40 | 9.6% |
| Communications | 19 | 4.6% |
| Arts & Humanities | 25 | 6.0% |
| Total | 415 | 100.0% |
Transportation & Commute in Osceola
Vehicle Availability by Sex in Osceola
The most prevalent vehicle ownership categories in Osceola are males with 2 vehicles (383, accounting for 59.3%) and females with 2 vehicles (281, making up 56.2%).
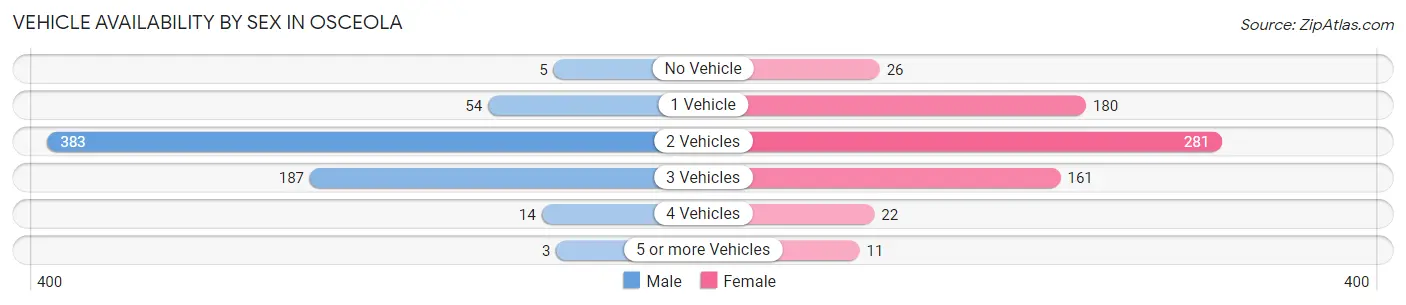
| Vehicles Available | Male | Female |
| No Vehicle | 5 (0.8%) | 26 (3.8%) |
| 1 Vehicle | 54 (8.4%) | 180 (26.4%) |
| 2 Vehicles | 383 (59.3%) | 281 (41.3%) |
| 3 Vehicles | 187 (28.9%) | 161 (23.6%) |
| 4 Vehicles | 14 (2.2%) | 22 (3.2%) |
| 5 or more Vehicles | 3 (0.5%) | 11 (1.6%) |
| Total | 646 (100.0%) | 681 (100.0%) |
Commute Time in Osceola
The most frequently occuring commute durations in Osceola are 5 to 9 minutes (358 commuters, 28.6%), 45 to 59 minutes (224 commuters, 17.9%), and 30 to 34 minutes (176 commuters, 14.1%).
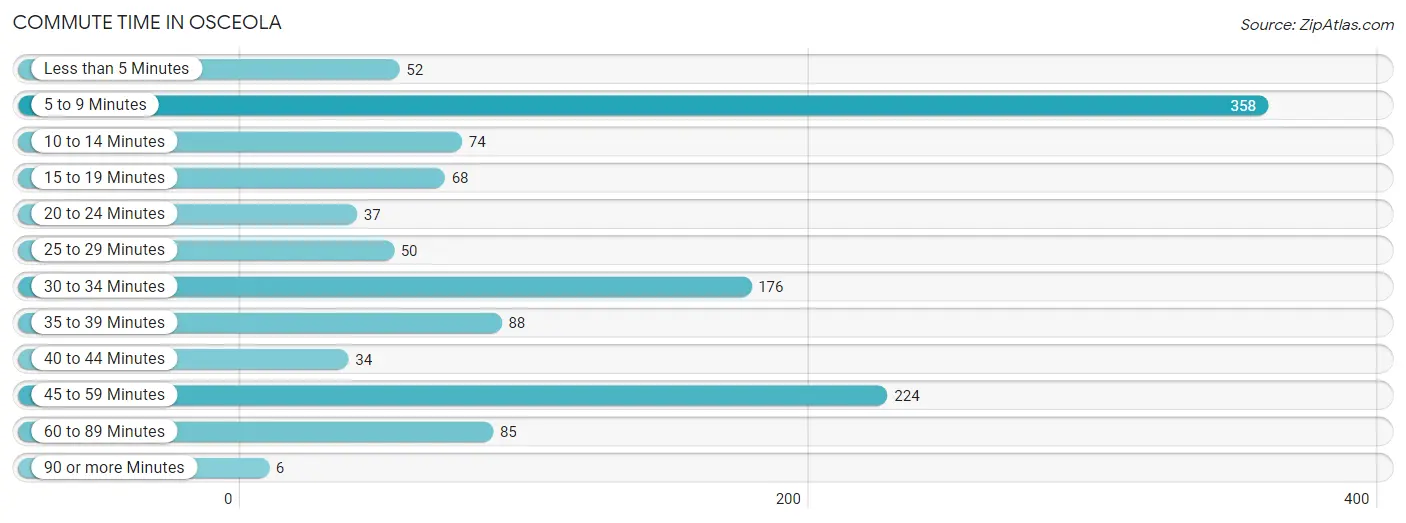
| Commute Time | # Commuters | % Commuters |
| Less than 5 Minutes | 52 | 4.2% |
| 5 to 9 Minutes | 358 | 28.6% |
| 10 to 14 Minutes | 74 | 5.9% |
| 15 to 19 Minutes | 68 | 5.4% |
| 20 to 24 Minutes | 37 | 3.0% |
| 25 to 29 Minutes | 50 | 4.0% |
| 30 to 34 Minutes | 176 | 14.1% |
| 35 to 39 Minutes | 88 | 7.0% |
| 40 to 44 Minutes | 34 | 2.7% |
| 45 to 59 Minutes | 224 | 17.9% |
| 60 to 89 Minutes | 85 | 6.8% |
| 90 or more Minutes | 6 | 0.5% |
Commute Time by Sex in Osceola
The most common commute times in Osceola are 5 to 9 minutes (234 commuters, 36.6%) for males and 30 to 34 minutes (136 commuters, 22.2%) for females.
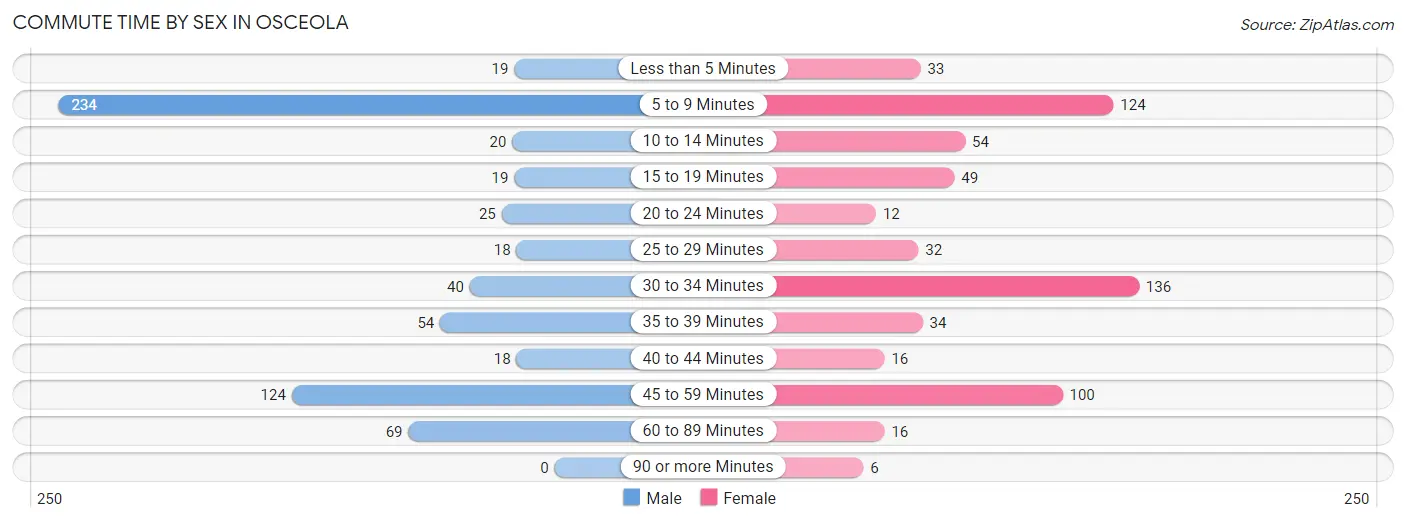
| Commute Time | Male | Female |
| Less than 5 Minutes | 19 (3.0%) | 33 (5.4%) |
| 5 to 9 Minutes | 234 (36.6%) | 124 (20.3%) |
| 10 to 14 Minutes | 20 (3.1%) | 54 (8.8%) |
| 15 to 19 Minutes | 19 (3.0%) | 49 (8.0%) |
| 20 to 24 Minutes | 25 (3.9%) | 12 (2.0%) |
| 25 to 29 Minutes | 18 (2.8%) | 32 (5.2%) |
| 30 to 34 Minutes | 40 (6.2%) | 136 (22.2%) |
| 35 to 39 Minutes | 54 (8.4%) | 34 (5.6%) |
| 40 to 44 Minutes | 18 (2.8%) | 16 (2.6%) |
| 45 to 59 Minutes | 124 (19.4%) | 100 (16.3%) |
| 60 to 89 Minutes | 69 (10.8%) | 16 (2.6%) |
| 90 or more Minutes | 0 (0.0%) | 6 (1.0%) |
Time of Departure to Work by Sex in Osceola
The most frequent times of departure to work in Osceola are 5:30 AM to 5:59 AM (135, 21.1%) for males and 6:30 AM to 6:59 AM (117, 19.1%) for females.
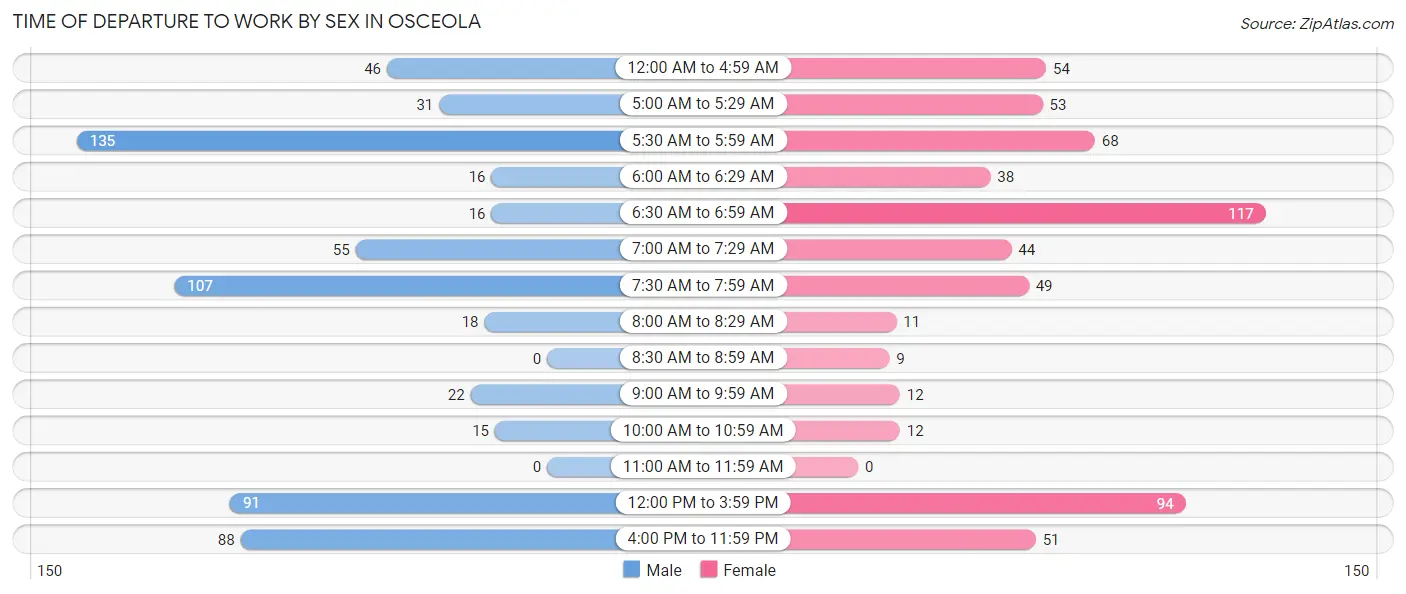
| Time of Departure | Male | Female |
| 12:00 AM to 4:59 AM | 46 (7.2%) | 54 (8.8%) |
| 5:00 AM to 5:29 AM | 31 (4.8%) | 53 (8.7%) |
| 5:30 AM to 5:59 AM | 135 (21.1%) | 68 (11.1%) |
| 6:00 AM to 6:29 AM | 16 (2.5%) | 38 (6.2%) |
| 6:30 AM to 6:59 AM | 16 (2.5%) | 117 (19.1%) |
| 7:00 AM to 7:29 AM | 55 (8.6%) | 44 (7.2%) |
| 7:30 AM to 7:59 AM | 107 (16.7%) | 49 (8.0%) |
| 8:00 AM to 8:29 AM | 18 (2.8%) | 11 (1.8%) |
| 8:30 AM to 8:59 AM | 0 (0.0%) | 9 (1.5%) |
| 9:00 AM to 9:59 AM | 22 (3.4%) | 12 (2.0%) |
| 10:00 AM to 10:59 AM | 15 (2.3%) | 12 (2.0%) |
| 11:00 AM to 11:59 AM | 0 (0.0%) | 0 (0.0%) |
| 12:00 PM to 3:59 PM | 91 (14.2%) | 94 (15.4%) |
| 4:00 PM to 11:59 PM | 88 (13.8%) | 51 (8.3%) |
| Total | 640 (100.0%) | 612 (100.0%) |
Housing Occupancy in Osceola
Occupancy by Ownership in Osceola
Of the total 1,342 dwellings in Osceola, owner-occupied units account for 720 (53.6%), while renter-occupied units make up 622 (46.4%).
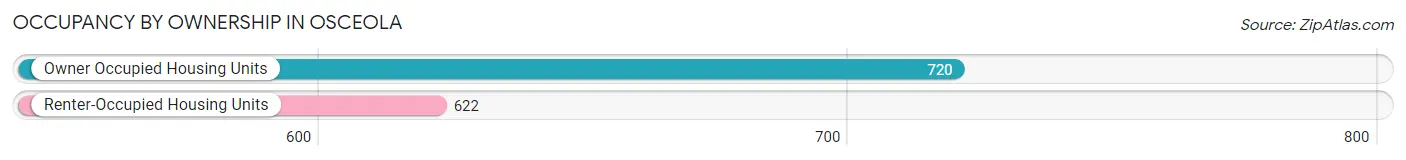
| Occupancy | # Housing Units | % Housing Units |
| Owner Occupied Housing Units | 720 | 53.6% |
| Renter-Occupied Housing Units | 622 | 46.4% |
| Total Occupied Housing Units | 1,342 | 100.0% |
Occupancy by Household Size in Osceola
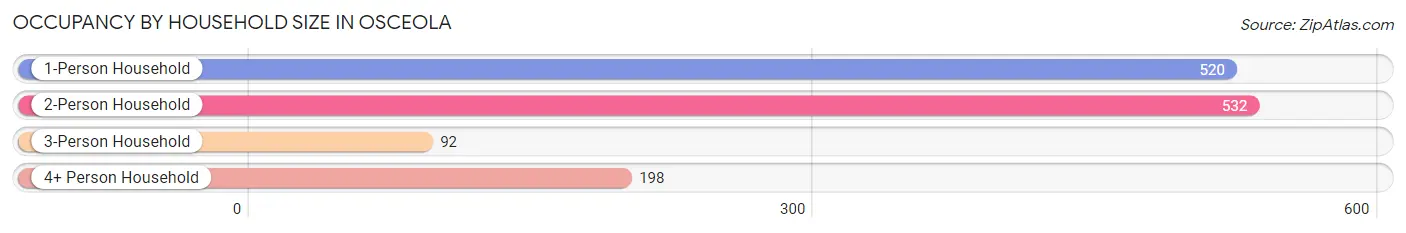
| Household Size | # Housing Units | % Housing Units |
| 1-Person Household | 520 | 38.8% |
| 2-Person Household | 532 | 39.6% |
| 3-Person Household | 92 | 6.9% |
| 4+ Person Household | 198 | 14.7% |
| Total Housing Units | 1,342 | 100.0% |
Occupancy by Ownership by Household Size in Osceola
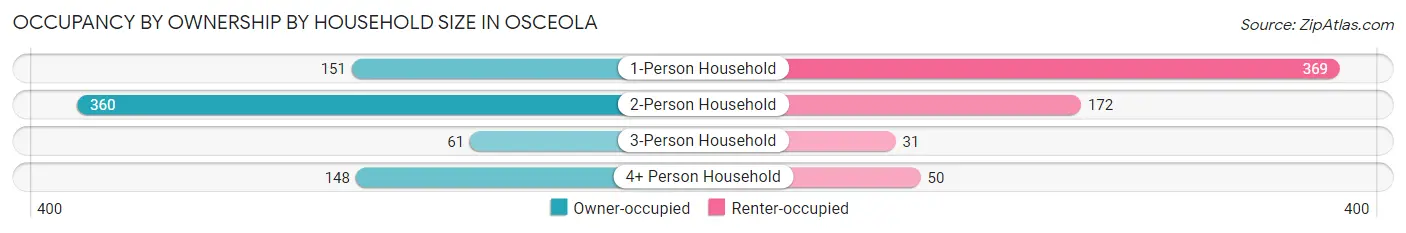
| Household Size | Owner-occupied | Renter-occupied |
| 1-Person Household | 151 (29.0%) | 369 (71.0%) |
| 2-Person Household | 360 (67.7%) | 172 (32.3%) |
| 3-Person Household | 61 (66.3%) | 31 (33.7%) |
| 4+ Person Household | 148 (74.8%) | 50 (25.3%) |
| Total Housing Units | 720 (53.6%) | 622 (46.4%) |
Occupancy by Educational Attainment in Osceola
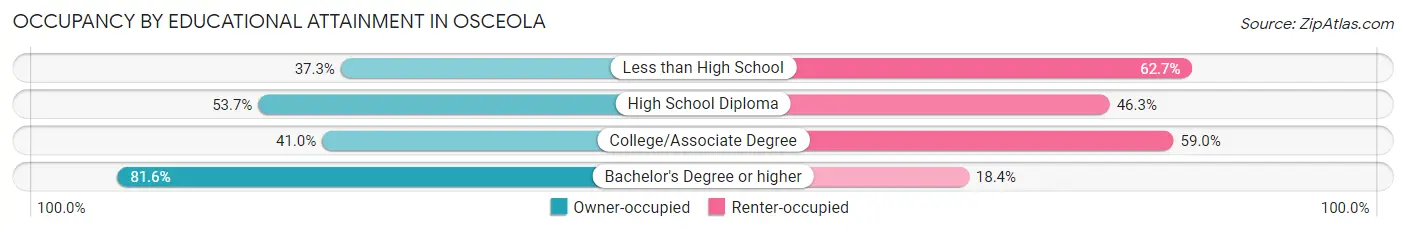
| Household Size | Owner-occupied | Renter-occupied |
| Less than High School | 28 (37.3%) | 47 (62.7%) |
| High School Diploma | 262 (53.7%) | 226 (46.3%) |
| College/Associate Degree | 208 (41.0%) | 299 (59.0%) |
| Bachelor's Degree or higher | 222 (81.6%) | 50 (18.4%) |
Occupancy by Age of Householder in Osceola
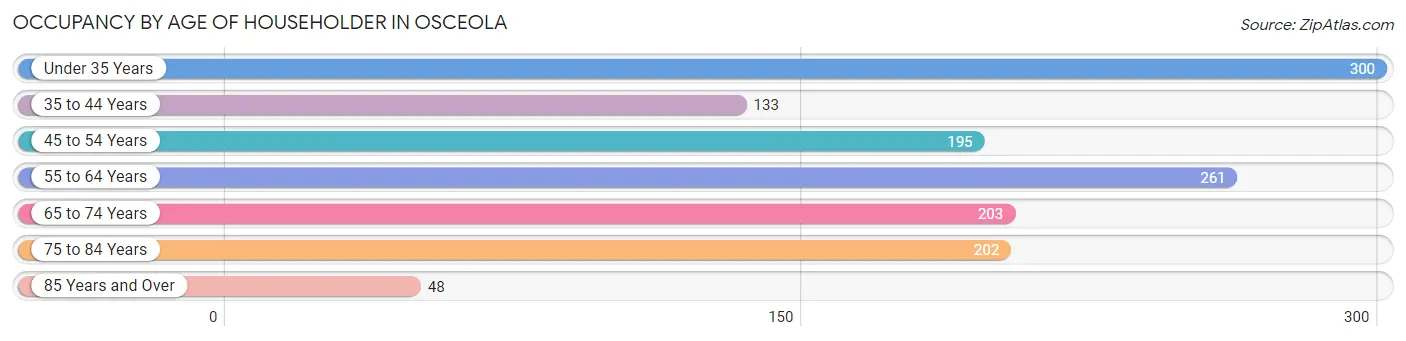
| Age Bracket | # Households | % Households |
| Under 35 Years | 300 | 22.4% |
| 35 to 44 Years | 133 | 9.9% |
| 45 to 54 Years | 195 | 14.5% |
| 55 to 64 Years | 261 | 19.5% |
| 65 to 74 Years | 203 | 15.1% |
| 75 to 84 Years | 202 | 15.0% |
| 85 Years and Over | 48 | 3.6% |
| Total | 1,342 | 100.0% |
Housing Finances in Osceola
Median Income by Occupancy in Osceola
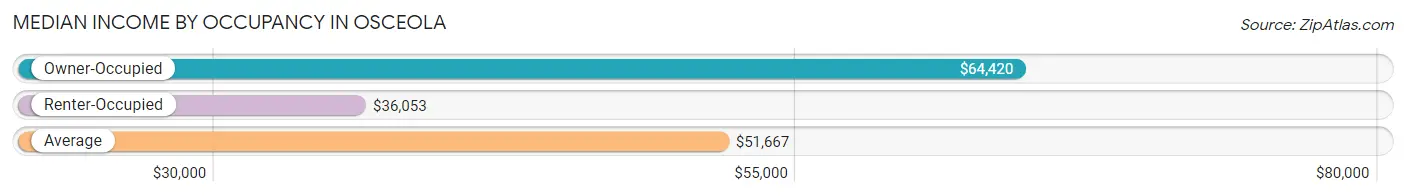
| Occupancy Type | # Households | Median Income |
| Owner-Occupied | 720 (53.6%) | $64,420 |
| Renter-Occupied | 622 (46.4%) | $36,053 |
| Average | 1,342 (100.0%) | $51,667 |
Occupancy by Householder Income Bracket in Osceola
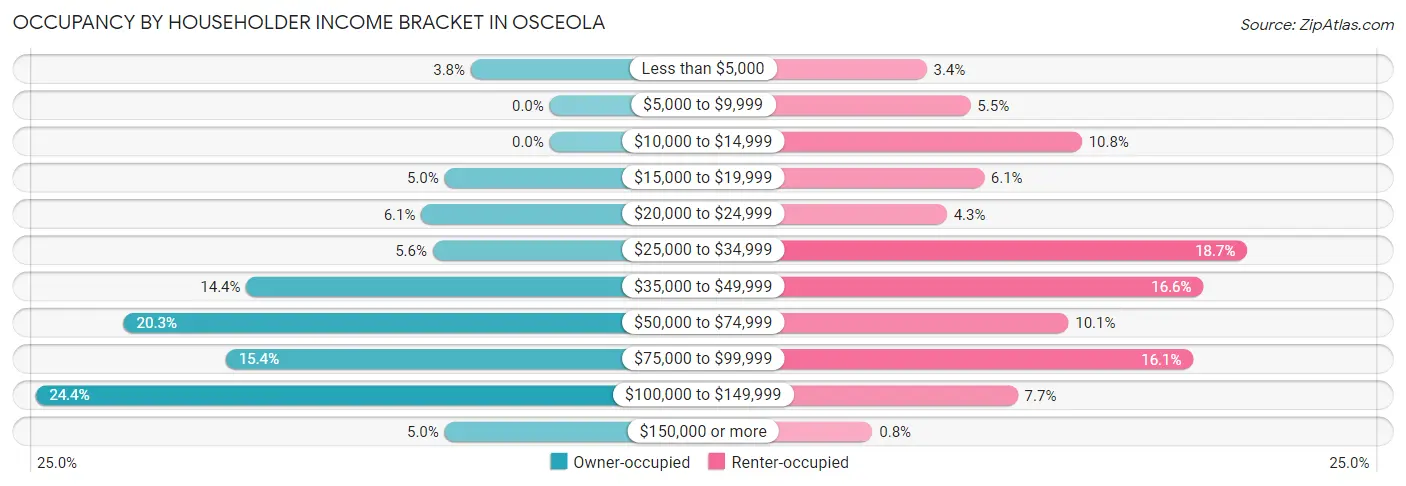
| Income Bracket | Owner-occupied | Renter-occupied |
| Less than $5,000 | 27 (3.7%) | 21 (3.4%) |
| $5,000 to $9,999 | 0 (0.0%) | 34 (5.5%) |
| $10,000 to $14,999 | 0 (0.0%) | 67 (10.8%) |
| $15,000 to $19,999 | 36 (5.0%) | 38 (6.1%) |
| $20,000 to $24,999 | 44 (6.1%) | 27 (4.3%) |
| $25,000 to $34,999 | 40 (5.6%) | 116 (18.6%) |
| $35,000 to $49,999 | 104 (14.4%) | 103 (16.6%) |
| $50,000 to $74,999 | 146 (20.3%) | 63 (10.1%) |
| $75,000 to $99,999 | 111 (15.4%) | 100 (16.1%) |
| $100,000 to $149,999 | 176 (24.4%) | 48 (7.7%) |
| $150,000 or more | 36 (5.0%) | 5 (0.8%) |
| Total | 720 (100.0%) | 622 (100.0%) |
Monthly Housing Cost Tiers in Osceola
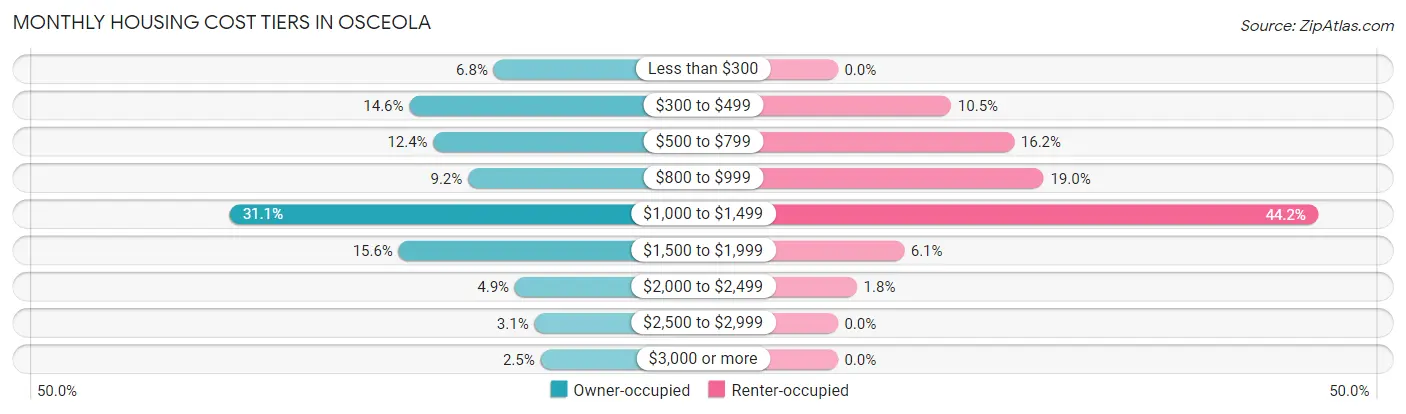
| Monthly Cost | Owner-occupied | Renter-occupied |
| Less than $300 | 49 (6.8%) | 0 (0.0%) |
| $300 to $499 | 105 (14.6%) | 65 (10.4%) |
| $500 to $799 | 89 (12.4%) | 101 (16.2%) |
| $800 to $999 | 66 (9.2%) | 118 (19.0%) |
| $1,000 to $1,499 | 224 (31.1%) | 275 (44.2%) |
| $1,500 to $1,999 | 112 (15.6%) | 38 (6.1%) |
| $2,000 to $2,499 | 35 (4.9%) | 11 (1.8%) |
| $2,500 to $2,999 | 22 (3.1%) | 0 (0.0%) |
| $3,000 or more | 18 (2.5%) | 0 (0.0%) |
| Total | 720 (100.0%) | 622 (100.0%) |
Physical Housing Characteristics in Osceola
Housing Structures in Osceola
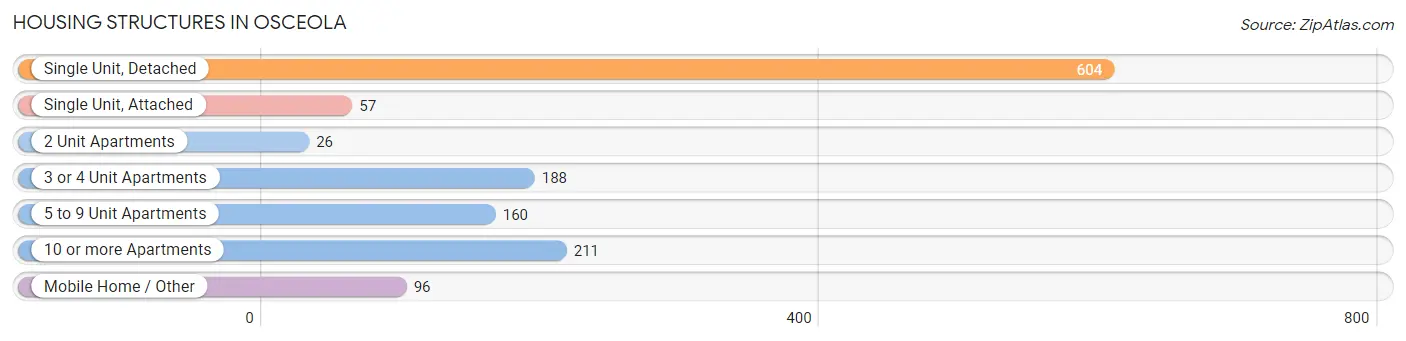
| Structure Type | # Housing Units | % Housing Units |
| Single Unit, Detached | 604 | 45.0% |
| Single Unit, Attached | 57 | 4.3% |
| 2 Unit Apartments | 26 | 1.9% |
| 3 or 4 Unit Apartments | 188 | 14.0% |
| 5 to 9 Unit Apartments | 160 | 11.9% |
| 10 or more Apartments | 211 | 15.7% |
| Mobile Home / Other | 96 | 7.1% |
| Total | 1,342 | 100.0% |
Housing Structures by Occupancy in Osceola
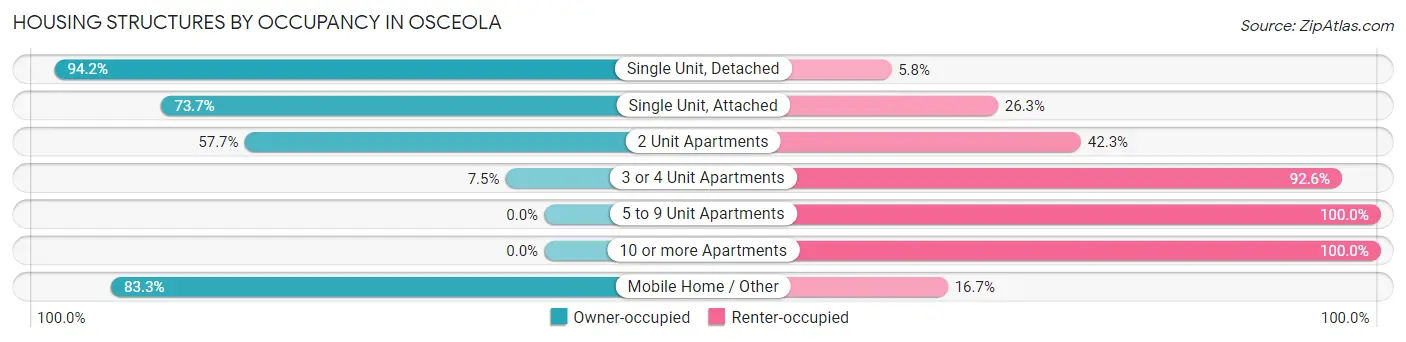
| Structure Type | Owner-occupied | Renter-occupied |
| Single Unit, Detached | 569 (94.2%) | 35 (5.8%) |
| Single Unit, Attached | 42 (73.7%) | 15 (26.3%) |
| 2 Unit Apartments | 15 (57.7%) | 11 (42.3%) |
| 3 or 4 Unit Apartments | 14 (7.4%) | 174 (92.5%) |
| 5 to 9 Unit Apartments | 0 (0.0%) | 160 (100.0%) |
| 10 or more Apartments | 0 (0.0%) | 211 (100.0%) |
| Mobile Home / Other | 80 (83.3%) | 16 (16.7%) |
| Total | 720 (53.6%) | 622 (46.4%) |
Housing Structures by Number of Rooms in Osceola
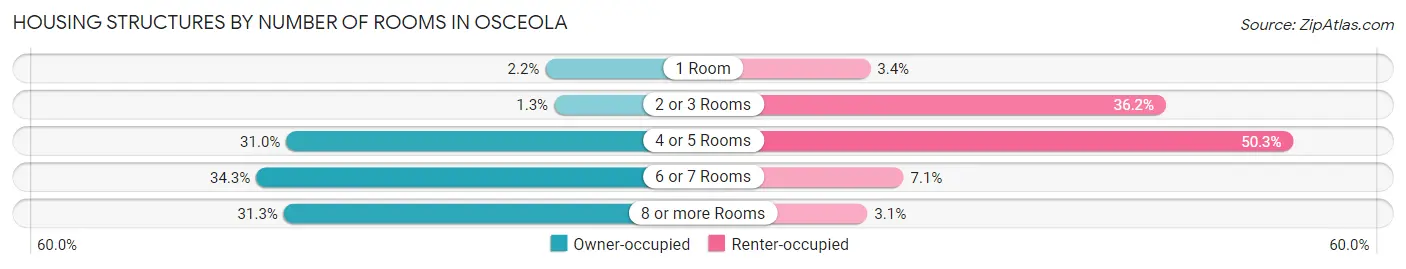
| Number of Rooms | Owner-occupied | Renter-occupied |
| 1 Room | 16 (2.2%) | 21 (3.4%) |
| 2 or 3 Rooms | 9 (1.3%) | 225 (36.2%) |
| 4 or 5 Rooms | 223 (31.0%) | 313 (50.3%) |
| 6 or 7 Rooms | 247 (34.3%) | 44 (7.1%) |
| 8 or more Rooms | 225 (31.2%) | 19 (3.0%) |
| Total | 720 (100.0%) | 622 (100.0%) |
Housing Structure by Heating Type in Osceola
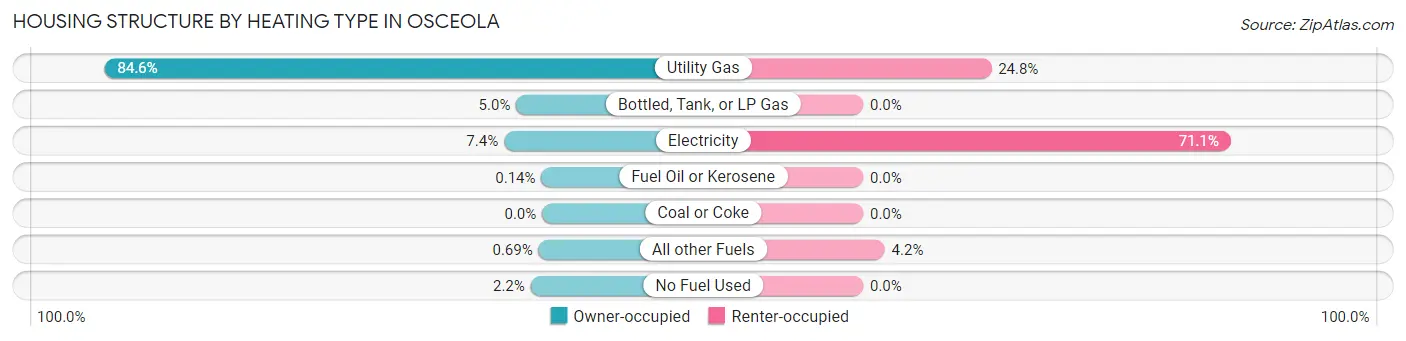
| Heating Type | Owner-occupied | Renter-occupied |
| Utility Gas | 609 (84.6%) | 154 (24.8%) |
| Bottled, Tank, or LP Gas | 36 (5.0%) | 0 (0.0%) |
| Electricity | 53 (7.4%) | 442 (71.1%) |
| Fuel Oil or Kerosene | 1 (0.1%) | 0 (0.0%) |
| Coal or Coke | 0 (0.0%) | 0 (0.0%) |
| All other Fuels | 5 (0.7%) | 26 (4.2%) |
| No Fuel Used | 16 (2.2%) | 0 (0.0%) |
| Total | 720 (100.0%) | 622 (100.0%) |
Household Vehicle Usage in Osceola
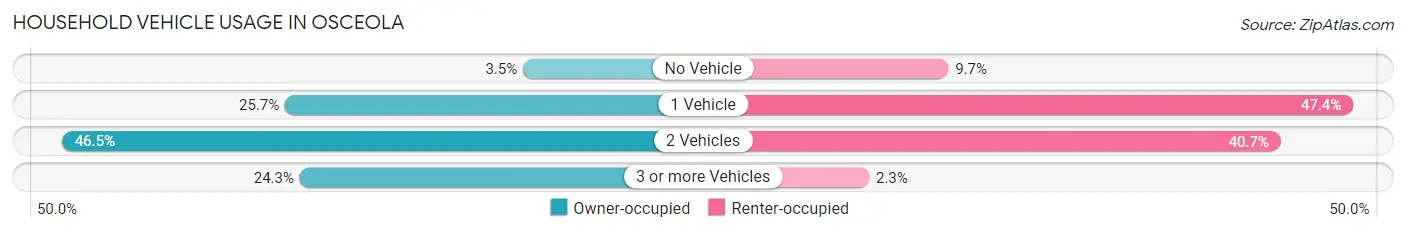
| Vehicles per Household | Owner-occupied | Renter-occupied |
| No Vehicle | 25 (3.5%) | 60 (9.7%) |
| 1 Vehicle | 185 (25.7%) | 295 (47.4%) |
| 2 Vehicles | 335 (46.5%) | 253 (40.7%) |
| 3 or more Vehicles | 175 (24.3%) | 14 (2.2%) |
| Total | 720 (100.0%) | 622 (100.0%) |
Real Estate & Mortgages in Osceola
Real Estate and Mortgage Overview in Osceola
| Characteristic | Without Mortgage | With Mortgage |
| Housing Units | 330 | 390 |
| Median Property Value | $181,700 | $215,000 |
| Median Household Income | $50,625 | $26 |
| Monthly Housing Costs | $528 | $18 |
| Real Estate Taxes | $2,628 | $0 |
Property Value by Mortgage Status in Osceola
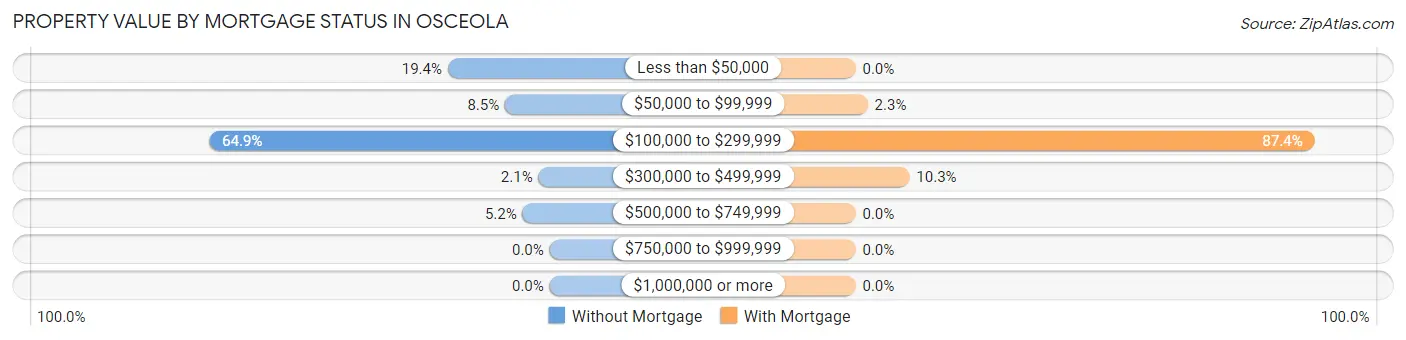
| Property Value | Without Mortgage | With Mortgage |
| Less than $50,000 | 64 (19.4%) | 0 (0.0%) |
| $50,000 to $99,999 | 28 (8.5%) | 9 (2.3%) |
| $100,000 to $299,999 | 214 (64.8%) | 341 (87.4%) |
| $300,000 to $499,999 | 7 (2.1%) | 40 (10.3%) |
| $500,000 to $749,999 | 17 (5.1%) | 0 (0.0%) |
| $750,000 to $999,999 | 0 (0.0%) | 0 (0.0%) |
| $1,000,000 or more | 0 (0.0%) | 0 (0.0%) |
| Total | 330 (100.0%) | 390 (100.0%) |
Household Income by Mortgage Status in Osceola
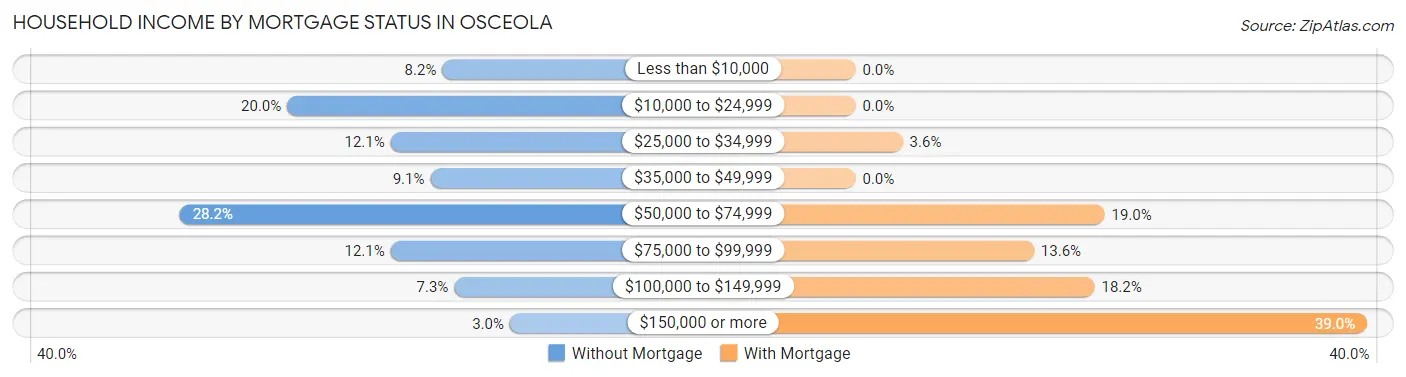
| Household Income | Without Mortgage | With Mortgage |
| Less than $10,000 | 27 (8.2%) | 0 (0.0%) |
| $10,000 to $24,999 | 66 (20.0%) | 0 (0.0%) |
| $25,000 to $34,999 | 40 (12.1%) | 14 (3.6%) |
| $35,000 to $49,999 | 30 (9.1%) | 0 (0.0%) |
| $50,000 to $74,999 | 93 (28.2%) | 74 (19.0%) |
| $75,000 to $99,999 | 40 (12.1%) | 53 (13.6%) |
| $100,000 to $149,999 | 24 (7.3%) | 71 (18.2%) |
| $150,000 or more | 10 (3.0%) | 152 (39.0%) |
| Total | 330 (100.0%) | 390 (100.0%) |
Property Value to Household Income Ratio in Osceola
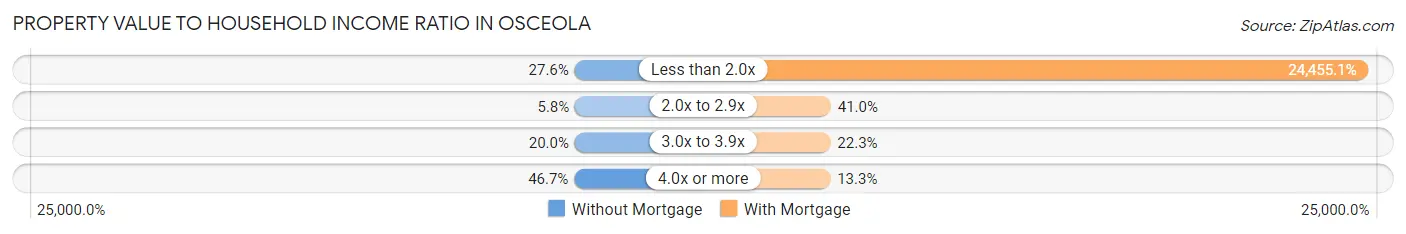
| Value-to-Income Ratio | Without Mortgage | With Mortgage |
| Less than 2.0x | 91 (27.6%) | 95,375 (24,455.1%) |
| 2.0x to 2.9x | 19 (5.8%) | 160 (41.0%) |
| 3.0x to 3.9x | 66 (20.0%) | 87 (22.3%) |
| 4.0x or more | 154 (46.7%) | 52 (13.3%) |
| Total | 330 (100.0%) | 390 (100.0%) |
Real Estate Taxes by Mortgage Status in Osceola
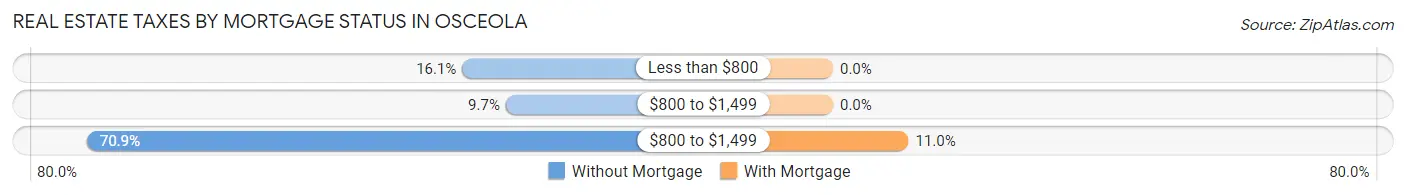
| Property Taxes | Without Mortgage | With Mortgage |
| Less than $800 | 53 (16.1%) | 0 (0.0%) |
| $800 to $1,499 | 32 (9.7%) | 0 (0.0%) |
| $800 to $1,499 | 234 (70.9%) | 43 (11.0%) |
| Total | 330 (100.0%) | 390 (100.0%) |
Health & Disability in Osceola
Health Insurance Coverage by Age in Osceola
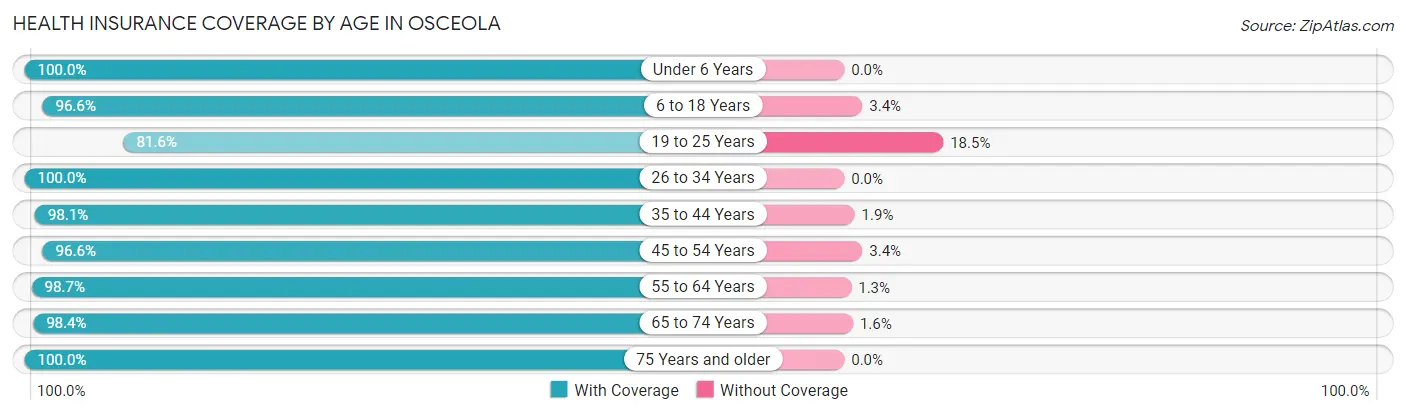
| Age Bracket | With Coverage | Without Coverage |
| Under 6 Years | 230 (100.0%) | 0 (0.0%) |
| 6 to 18 Years | 374 (96.6%) | 13 (3.4%) |
| 19 to 25 Years | 221 (81.6%) | 50 (18.4%) |
| 26 to 34 Years | 326 (100.0%) | 0 (0.0%) |
| 35 to 44 Years | 254 (98.1%) | 5 (1.9%) |
| 45 to 54 Years | 344 (96.6%) | 12 (3.4%) |
| 55 to 64 Years | 379 (98.7%) | 5 (1.3%) |
| 65 to 74 Years | 245 (98.4%) | 4 (1.6%) |
| 75 Years and older | 273 (100.0%) | 0 (0.0%) |
| Total | 2,646 (96.8%) | 89 (3.3%) |
Health Insurance Coverage by Citizenship Status in Osceola
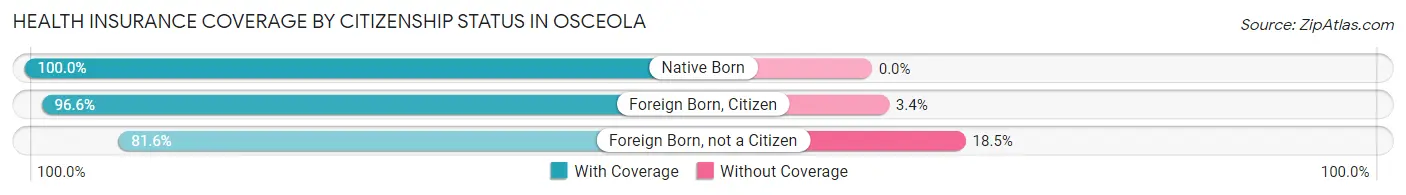
| Citizenship Status | With Coverage | Without Coverage |
| Native Born | 230 (100.0%) | 0 (0.0%) |
| Foreign Born, Citizen | 374 (96.6%) | 13 (3.4%) |
| Foreign Born, not a Citizen | 221 (81.6%) | 50 (18.4%) |
Health Insurance Coverage by Household Income in Osceola
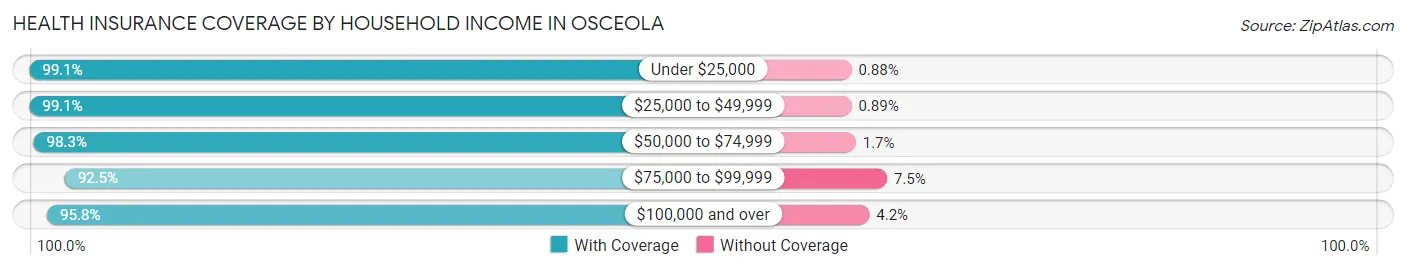
| Household Income | With Coverage | Without Coverage |
| Under $25,000 | 453 (99.1%) | 4 (0.9%) |
| $25,000 to $49,999 | 558 (99.1%) | 5 (0.9%) |
| $50,000 to $74,999 | 407 (98.3%) | 7 (1.7%) |
| $75,000 to $99,999 | 504 (92.5%) | 41 (7.5%) |
| $100,000 and over | 724 (95.8%) | 32 (4.2%) |
Public vs Private Health Insurance Coverage by Age in Osceola
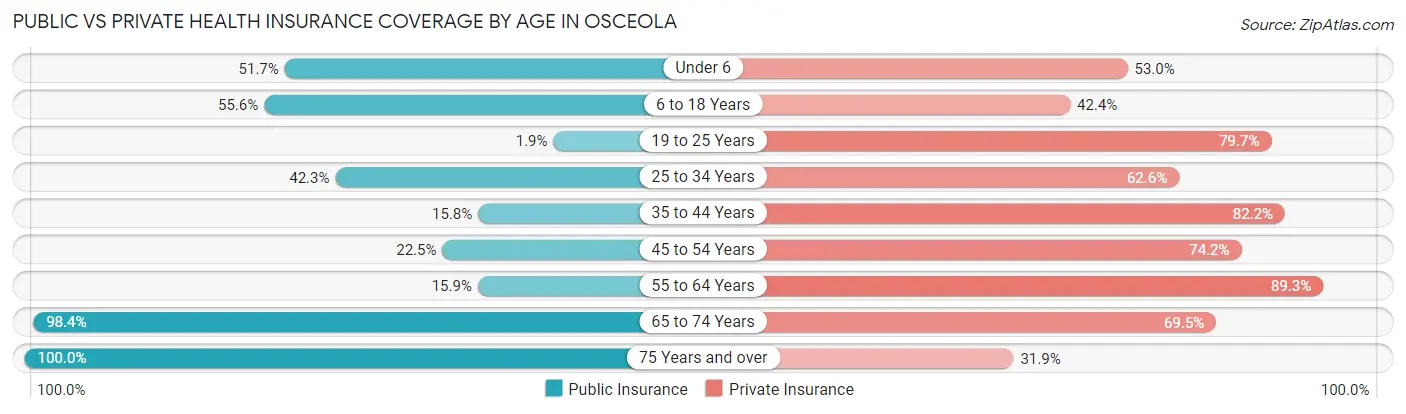
| Age Bracket | Public Insurance | Private Insurance |
| Under 6 | 119 (51.7%) | 122 (53.0%) |
| 6 to 18 Years | 215 (55.6%) | 164 (42.4%) |
| 19 to 25 Years | 5 (1.8%) | 216 (79.7%) |
| 25 to 34 Years | 138 (42.3%) | 204 (62.6%) |
| 35 to 44 Years | 41 (15.8%) | 213 (82.2%) |
| 45 to 54 Years | 80 (22.5%) | 264 (74.2%) |
| 55 to 64 Years | 61 (15.9%) | 343 (89.3%) |
| 65 to 74 Years | 245 (98.4%) | 173 (69.5%) |
| 75 Years and over | 273 (100.0%) | 87 (31.9%) |
| Total | 1,177 (43.0%) | 1,786 (65.3%) |
Disability Status by Sex by Age in Osceola
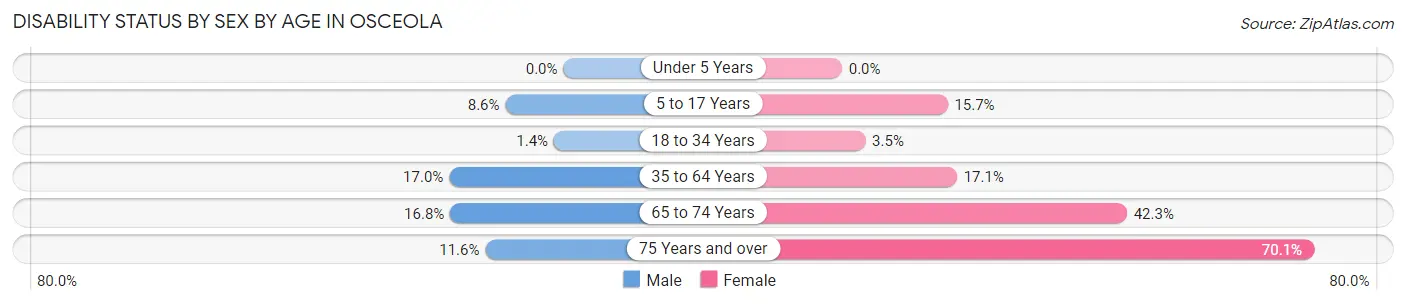
| Age Bracket | Male | Female |
| Under 5 Years | 0 (0.0%) | 0 (0.0%) |
| 5 to 17 Years | 26 (8.6%) | 24 (15.7%) |
| 18 to 34 Years | 4 (1.4%) | 11 (3.5%) |
| 35 to 64 Years | 77 (17.0%) | 93 (17.1%) |
| 65 to 74 Years | 20 (16.8%) | 55 (42.3%) |
| 75 Years and over | 8 (11.6%) | 143 (70.1%) |
Disability Class by Sex by Age in Osceola
Disability Class: Hearing Difficulty
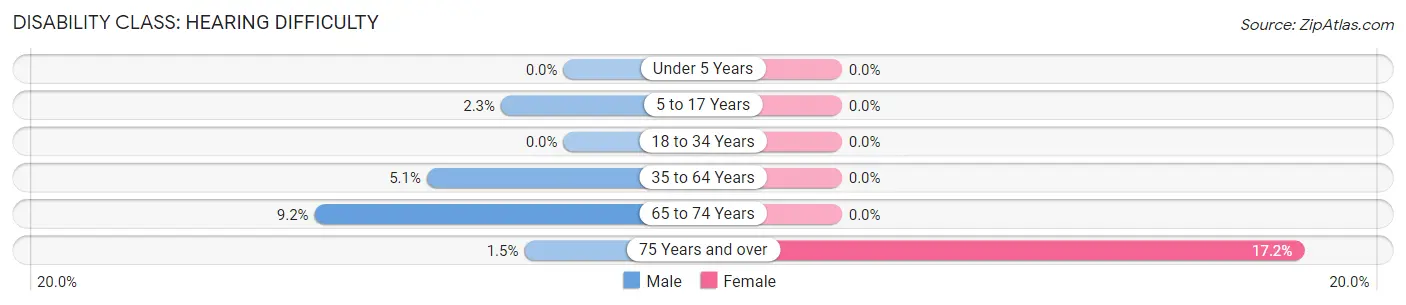
| Age Bracket | Male | Female |
| Under 5 Years | 0 (0.0%) | 0 (0.0%) |
| 5 to 17 Years | 7 (2.3%) | 0 (0.0%) |
| 18 to 34 Years | 0 (0.0%) | 0 (0.0%) |
| 35 to 64 Years | 23 (5.1%) | 0 (0.0%) |
| 65 to 74 Years | 11 (9.2%) | 0 (0.0%) |
| 75 Years and over | 1 (1.5%) | 35 (17.2%) |
Disability Class: Vision Difficulty
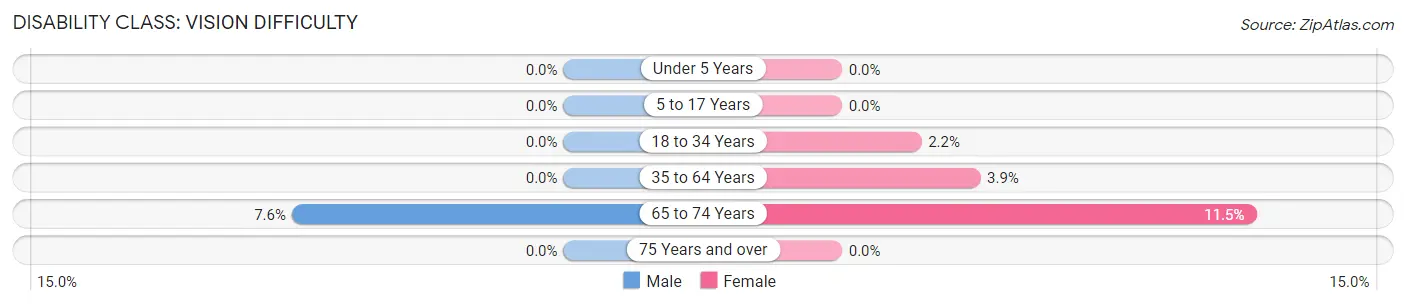
| Age Bracket | Male | Female |
| Under 5 Years | 0 (0.0%) | 0 (0.0%) |
| 5 to 17 Years | 0 (0.0%) | 0 (0.0%) |
| 18 to 34 Years | 0 (0.0%) | 7 (2.2%) |
| 35 to 64 Years | 0 (0.0%) | 21 (3.8%) |
| 65 to 74 Years | 9 (7.6%) | 15 (11.5%) |
| 75 Years and over | 0 (0.0%) | 0 (0.0%) |
Disability Class: Cognitive Difficulty
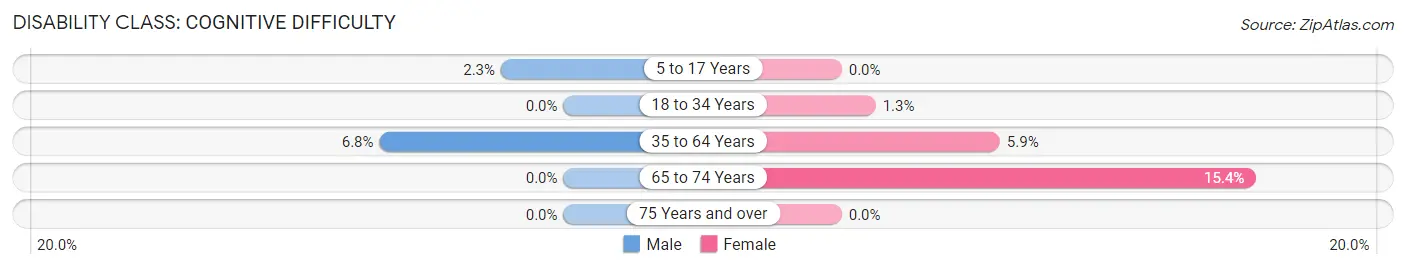
| Age Bracket | Male | Female |
| 5 to 17 Years | 7 (2.3%) | 0 (0.0%) |
| 18 to 34 Years | 0 (0.0%) | 4 (1.3%) |
| 35 to 64 Years | 31 (6.8%) | 32 (5.9%) |
| 65 to 74 Years | 0 (0.0%) | 20 (15.4%) |
| 75 Years and over | 0 (0.0%) | 0 (0.0%) |
Disability Class: Ambulatory Difficulty
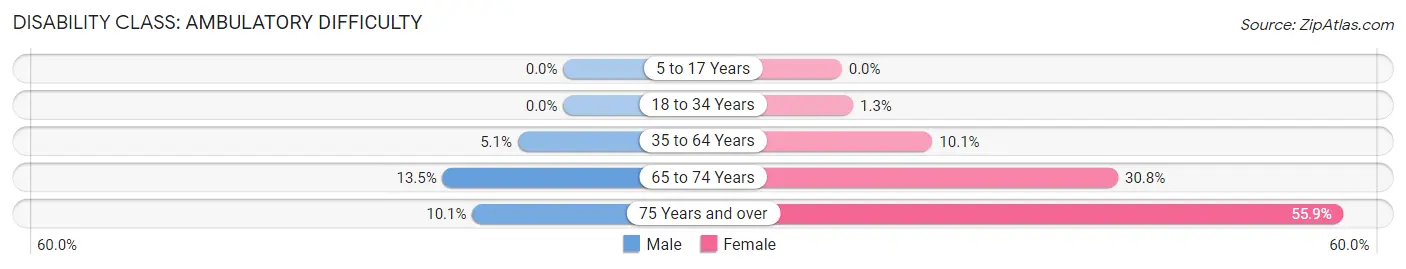
| Age Bracket | Male | Female |
| 5 to 17 Years | 0 (0.0%) | 0 (0.0%) |
| 18 to 34 Years | 0 (0.0%) | 4 (1.3%) |
| 35 to 64 Years | 23 (5.1%) | 55 (10.1%) |
| 65 to 74 Years | 16 (13.5%) | 40 (30.8%) |
| 75 Years and over | 7 (10.1%) | 114 (55.9%) |
Disability Class: Self-Care Difficulty
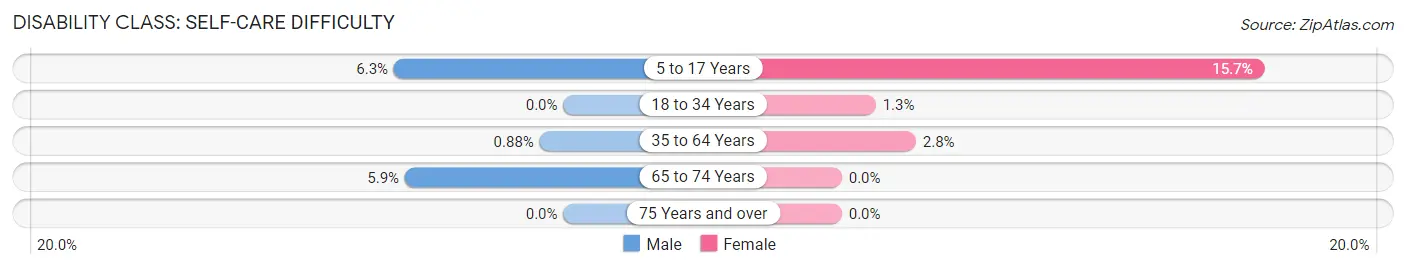
| Age Bracket | Male | Female |
| 5 to 17 Years | 19 (6.3%) | 24 (15.7%) |
| 18 to 34 Years | 0 (0.0%) | 4 (1.3%) |
| 35 to 64 Years | 4 (0.9%) | 15 (2.8%) |
| 65 to 74 Years | 7 (5.9%) | 0 (0.0%) |
| 75 Years and over | 0 (0.0%) | 0 (0.0%) |
Technology Access in Osceola
Computing Device Access in Osceola
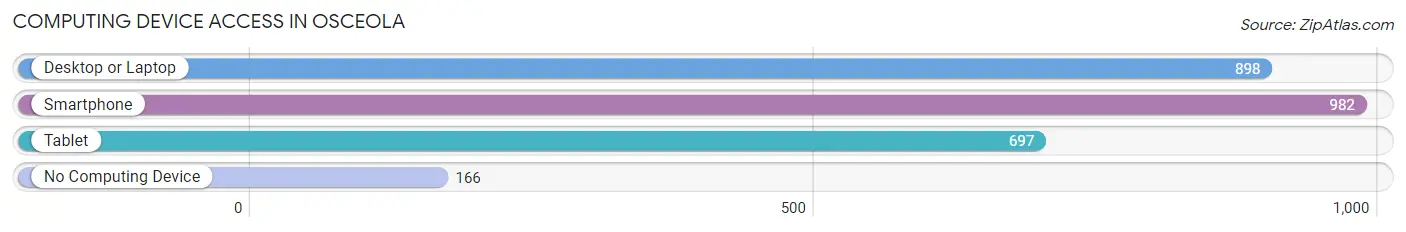
| Device Type | # Households | % Households |
| Desktop or Laptop | 898 | 66.9% |
| Smartphone | 982 | 73.2% |
| Tablet | 697 | 51.9% |
| No Computing Device | 166 | 12.4% |
| Total | 1,342 | 100.0% |
Internet Access in Osceola
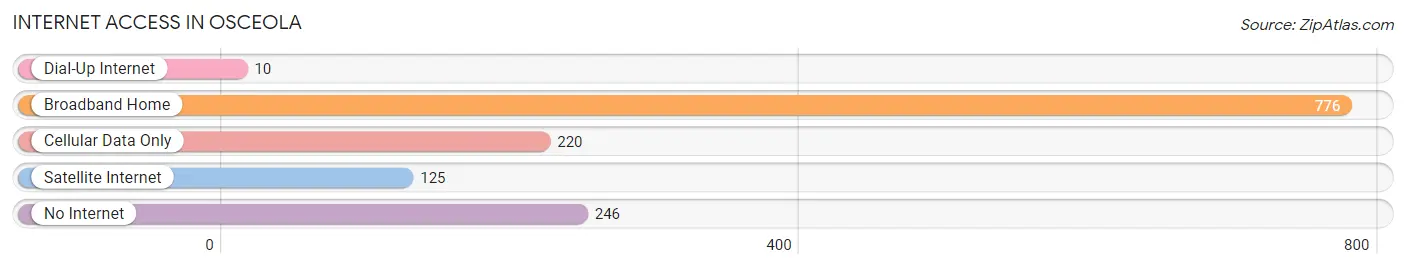
| Internet Type | # Households | % Households |
| Dial-Up Internet | 10 | 0.7% |
| Broadband Home | 776 | 57.8% |
| Cellular Data Only | 220 | 16.4% |
| Satellite Internet | 125 | 9.3% |
| No Internet | 246 | 18.3% |
| Total | 1,342 | 100.0% |
Osceola Summary
Osceola, Wisconsin is a small town located in St. Croix County, Wisconsin, United States. It is situated on the banks of the St. Croix River, which forms the border between Wisconsin and Minnesota. The population of Osceola was 1,845 at the 2010 census.
History
Osceola was founded in 1854 by settlers from New England. The town was named after the Seminole leader Osceola, who had died in 1838. The town was originally part of the St. Croix Indian Reservation, and the first settlers were mostly of English and Scottish descent.
The first post office in Osceola was established in 1855, and the first school was built in 1856. The first church was built in 1858, and the first newspaper was established in 1859.
In 1864, the St. Croix Indian Reservation was dissolved, and the land was opened up for settlement. The town of Osceola was officially incorporated in 1868.
Geography
Osceola is located at 45°25'N 92°37'W (45.4133, -92.6167). According to the United States Census Bureau, the town has a total area of 2.2 square miles (5.7 km2), all of it land.
Economy
Osceola is a small town with a limited economy. The main industries in the area are agriculture, tourism, and manufacturing.
Agriculture is the main industry in Osceola. The town is home to several dairy farms, as well as a number of other farms that produce corn, soybeans, and other crops.
Tourism is also an important part of the local economy. Osceola is located on the St. Croix River, which is a popular destination for boaters, fishermen, and other outdoor enthusiasts. The town also has several parks and recreational areas, including the Osceola Nature Preserve.
Manufacturing is also an important part of the local economy. Osceola is home to several small manufacturing companies, including a furniture manufacturer, a plastics manufacturer, and a metal fabrication company.
Demographics
As of the 2010 census, there were 1,845 people, 745 households, and 486 families residing in the town. The population density was 830.9 people per square mile (321.7/km2). There were 809 housing units at an average density of 363.3 per square mile (140.5/km2). The racial makeup of the town was 97.2% White, 0.3% African American, 0.3% Native American, 0.3% Asian, 0.2% from other races, and 1.7% from two or more races. Hispanic or Latino of any race were 1.2% of the population.
There were 745 households, out of which 28.2% had children under the age of 18 living with them, 51.2% were married couples living together, 8.7% had a female householder with no husband present, and 35.7% were non-families. 30.2% of all households were made up of individuals, and 14.2% had someone living alone who was 65 years of age or older. The average household size was 2.41 and the average family size was 3.02.
In the town, the population was spread out, with 24.2% under the age of 18, 6.7% from 18 to 24, 25.2% from 25 to 44, 25.2% from 45 to 64, and 18.7% who were 65 years of age or older. The median age was 40 years. For every 100 females, there were 95.2 males. For every 100 females age 18 and over, there were 92.2 males.
The median income for a household in the town was $41,250, and the median income for a family was $50,000. Males had a median income of $35,000 versus $25,000 for females. The per capita income for the town was $20,945. About 4.2% of families and 6.2% of the population were below the poverty line, including 8.2% of those under age 18 and 6.2% of those age 65 or over.
Common Questions
What is Per Capita Income in Osceola?
Per Capita income in Osceola is $29,996.
What is the Median Family Income in Osceola?
Median Family Income in Osceola is $68,750.
What is the Median Household income in Osceola?
Median Household Income in Osceola is $51,667.
What is Income or Wage Gap in Osceola?
Income or Wage Gap in Osceola is 37.3%.
Women in Osceola earn 62.7 cents for every dollar earned by a man.
What is Family Income Deficit in Osceola?
Family Income Deficit in Osceola is $10,274.
Families that are below poverty line in Osceola earn $10,274 less on average than the poverty threshold level.
What is Inequality or Gini Index in Osceola?
Inequality or Gini Index in Osceola is 0.39.
What is the Total Population of Osceola?
Total Population of Osceola is 2,785.
What is the Total Male Population of Osceola?
Total Male Population of Osceola is 1,311.
What is the Total Female Population of Osceola?
Total Female Population of Osceola is 1,474.
What is the Ratio of Males per 100 Females in Osceola?
There are 88.94 Males per 100 Females in Osceola.
What is the Ratio of Females per 100 Males in Osceola?
There are 112.43 Females per 100 Males in Osceola.
What is the Median Population Age in Osceola?
Median Population Age in Osceola is 41.0 Years.
What is the Average Family Size in Osceola
Average Family Size in Osceola is 2.7 People.
What is the Average Household Size in Osceola
Average Household Size in Osceola is 2.0 People.
How Large is the Labor Force in Osceola?
There are 1,477 People in the Labor Forcein in Osceola.
What is the Percentage of People in the Labor Force in Osceola?
66.8% of People are in the Labor Force in Osceola.
What is the Unemployment Rate in Osceola?
Unemployment Rate in Osceola is 8.8%.