Omro, WI Map & Demographics
Omro Map
Omro Overview
$33,076
PER CAPITA INCOME
$88,696
AVG FAMILY INCOME
$65,150
AVG HOUSEHOLD INCOME
29.9%
WAGE / INCOME GAP [ % ]
70.1¢/ $1
WAGE / INCOME GAP [ $ ]
0.38
INEQUALITY / GINI INDEX
3,639
TOTAL POPULATION
1,794
MALE POPULATION
1,845
FEMALE POPULATION
97.24
MALES / 100 FEMALES
102.84
FEMALES / 100 MALES
41.5
MEDIAN AGE
2.8
AVG FAMILY SIZE
2.2
AVG HOUSEHOLD SIZE
1,975
LABOR FORCE [ PEOPLE ]
67.6%
PERCENT IN LABOR FORCE
1.7%
UNEMPLOYMENT RATE
Omro Zip Codes
Omro Area Codes
Income in Omro
Income Overview in Omro
Per Capita Income in Omro is $33,076, while median incomes of families and households are $88,696 and $65,150 respectively.
| Characteristic | Number | Measure |
| Per Capita Income | 3,639 | $33,076 |
| Median Family Income | 1,046 | $88,696 |
| Mean Family Income | 1,046 | $94,092 |
| Median Household Income | 1,614 | $65,150 |
| Mean Household Income | 1,614 | $76,331 |
| Income Deficit | 1,046 | $0 |
| Wage / Income Gap (%) | 3,639 | 29.85% |
| Wage / Income Gap ($) | 3,639 | 70.15¢ per $1 |
| Gini / Inequality Index | 3,639 | 0.38 |
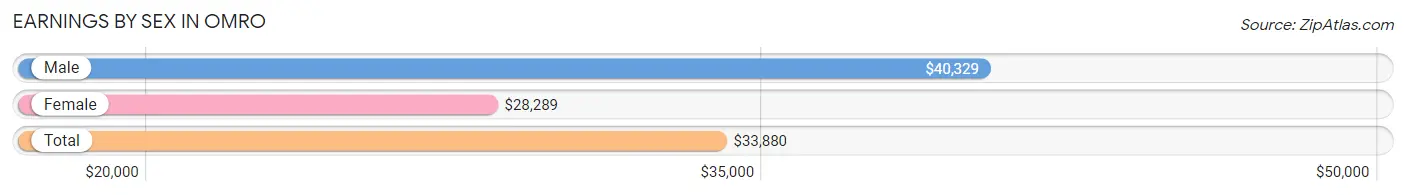
Earnings by Sex in Omro
Average Earnings in Omro are $33,880, $40,329 for men and $28,289 for women, a difference of 29.8%.
| Sex | Number | Average Earnings |
| Male | 1,010 (48.3%) | $40,329 |
| Female | 1,080 (51.7%) | $28,289 |
| Total | 2,090 (100.0%) | $33,880 |
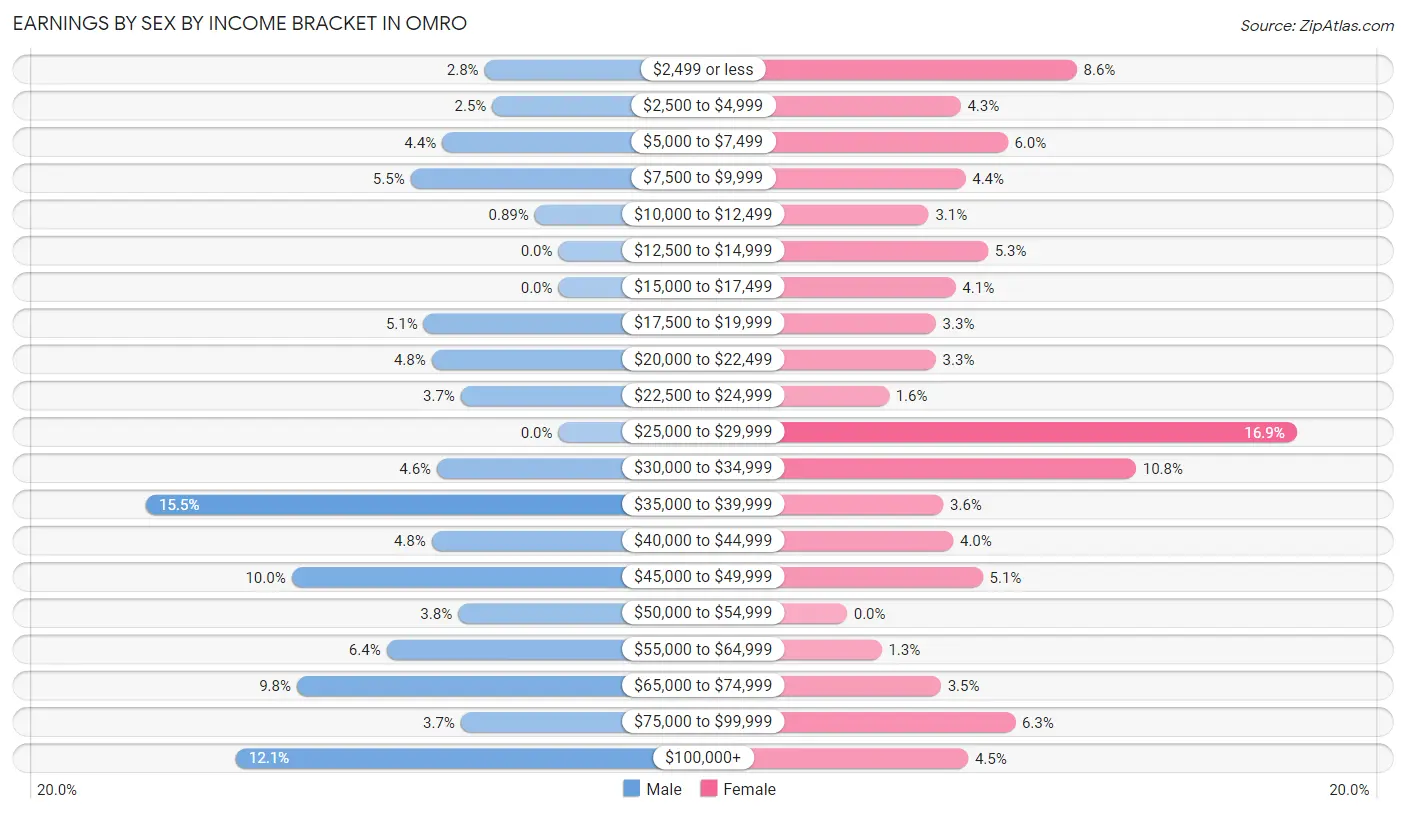
Earnings by Sex by Income Bracket in Omro
The most common earnings brackets in Omro are $35,000 to $39,999 for men (156 | 15.4%) and $25,000 to $29,999 for women (182 | 16.9%).
| Income | Male | Female |
| $2,499 or less | 28 (2.8%) | 93 (8.6%) |
| $2,500 to $4,999 | 25 (2.5%) | 46 (4.3%) |
| $5,000 to $7,499 | 44 (4.4%) | 65 (6.0%) |
| $7,500 to $9,999 | 56 (5.5%) | 48 (4.4%) |
| $10,000 to $12,499 | 9 (0.9%) | 33 (3.1%) |
| $12,500 to $14,999 | 0 (0.0%) | 57 (5.3%) |
| $15,000 to $17,499 | 0 (0.0%) | 44 (4.1%) |
| $17,500 to $19,999 | 51 (5.1%) | 36 (3.3%) |
| $20,000 to $22,499 | 48 (4.8%) | 36 (3.3%) |
| $22,500 to $24,999 | 37 (3.7%) | 17 (1.6%) |
| $25,000 to $29,999 | 0 (0.0%) | 182 (16.9%) |
| $30,000 to $34,999 | 46 (4.5%) | 117 (10.8%) |
| $35,000 to $39,999 | 156 (15.4%) | 39 (3.6%) |
| $40,000 to $44,999 | 48 (4.8%) | 43 (4.0%) |
| $45,000 to $49,999 | 101 (10.0%) | 55 (5.1%) |
| $50,000 to $54,999 | 38 (3.8%) | 0 (0.0%) |
| $55,000 to $64,999 | 65 (6.4%) | 14 (1.3%) |
| $65,000 to $74,999 | 99 (9.8%) | 38 (3.5%) |
| $75,000 to $99,999 | 37 (3.7%) | 68 (6.3%) |
| $100,000+ | 122 (12.1%) | 49 (4.5%) |
| Total | 1,010 (100.0%) | 1,080 (100.0%) |
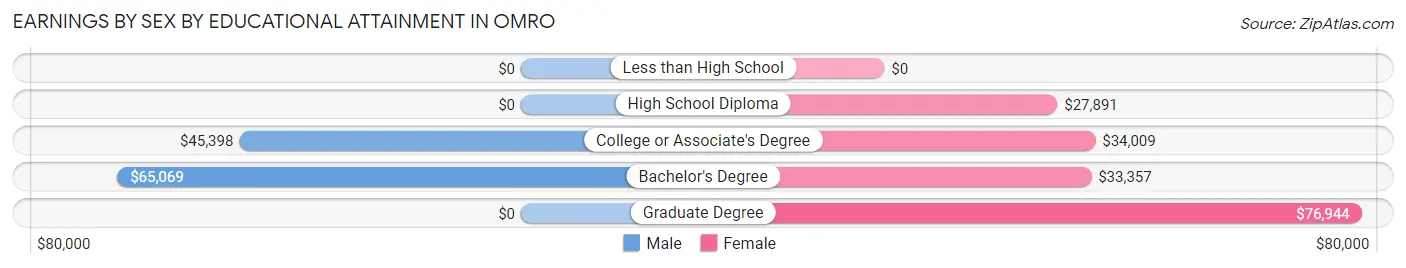
Earnings by Sex by Educational Attainment in Omro
Average earnings in Omro are $46,462 for men and $29,569 for women, a difference of 36.4%. Men with an educational attainment of bachelor's degree enjoy the highest average annual earnings of $65,069, while those with college or associate's degree education earn the least with $45,398. Women with an educational attainment of graduate degree earn the most with the average annual earnings of $76,944, while those with high school diploma education have the smallest earnings of $27,891.
| Educational Attainment | Male Income | Female Income |
| Less than High School | - | - |
| High School Diploma | - | - |
| College or Associate's Degree | $45,398 | $34,009 |
| Bachelor's Degree | $65,069 | $33,357 |
| Graduate Degree | - | - |
| Total | $46,462 | $29,569 |
Family Income in Omro
Family Income Brackets in Omro
According to the Omro family income data, there are 253 families falling into the $75,000 to $99,999 income range, which is the most common income bracket and makes up 24.2% of all families.
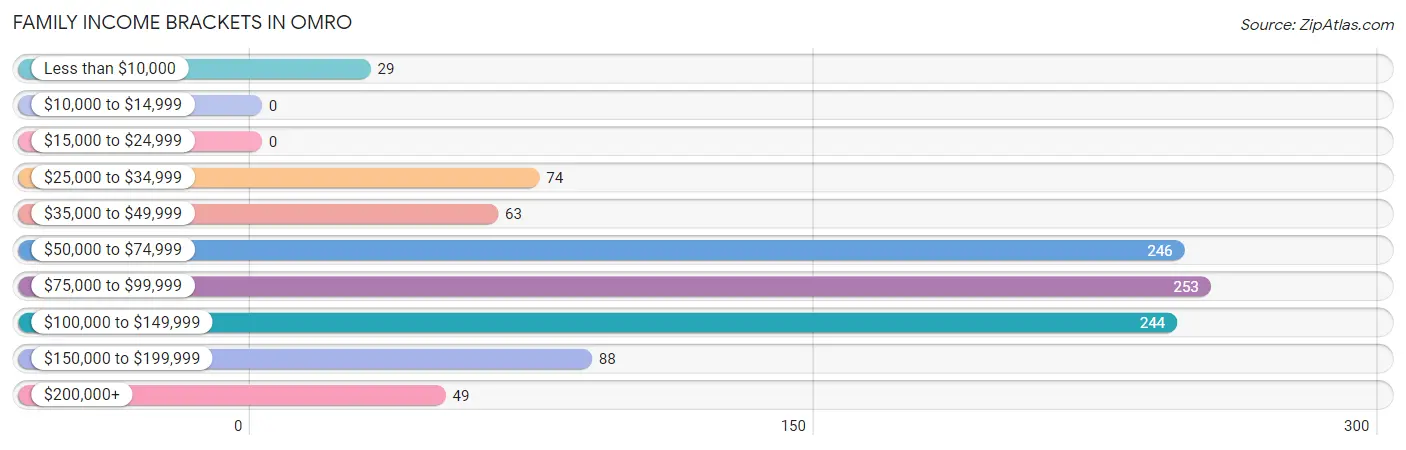
| Income Bracket | # Families | % Families |
| Less than $10,000 | 29 | 2.8% |
| $10,000 to $14,999 | 0 | 0.0% |
| $15,000 to $24,999 | 0 | 0.0% |
| $25,000 to $34,999 | 74 | 7.1% |
| $35,000 to $49,999 | 63 | 6.0% |
| $50,000 to $74,999 | 246 | 23.5% |
| $75,000 to $99,999 | 253 | 24.2% |
| $100,000 to $149,999 | 244 | 23.3% |
| $150,000 to $199,999 | 88 | 8.4% |
| $200,000+ | 49 | 4.7% |
Family Income by Famaliy Size in Omro
5-person families (88 | 8.4%) account for the highest median family income in Omro with $111,250 per family, while 2-person families (555 | 53.1%) have the highest median income of $43,940 per family member.
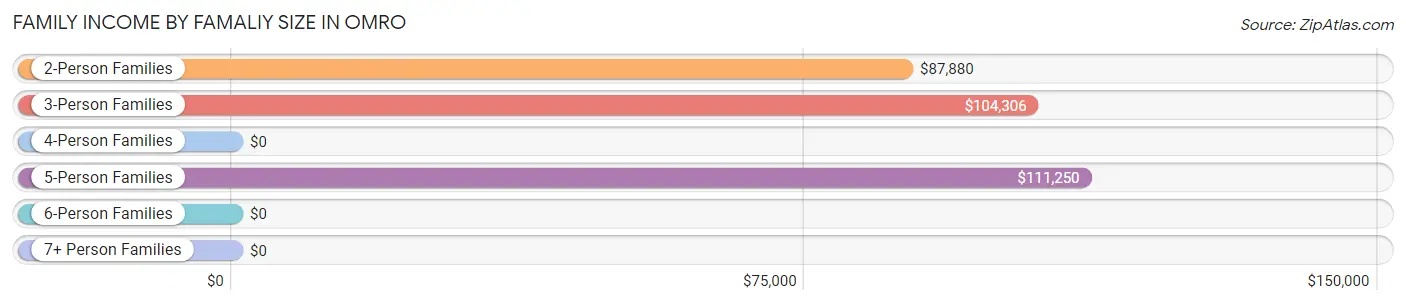
| Income Bracket | # Families | Median Income |
| 2-Person Families | 555 (53.1%) | $87,880 |
| 3-Person Families | 247 (23.6%) | $104,306 |
| 4-Person Families | 134 (12.8%) | $0 |
| 5-Person Families | 88 (8.4%) | $111,250 |
| 6-Person Families | 0 (0.0%) | $0 |
| 7+ Person Families | 22 (2.1%) | $0 |
| Total | 1,046 (100.0%) | $88,696 |
Family Income by Number of Earners in Omro
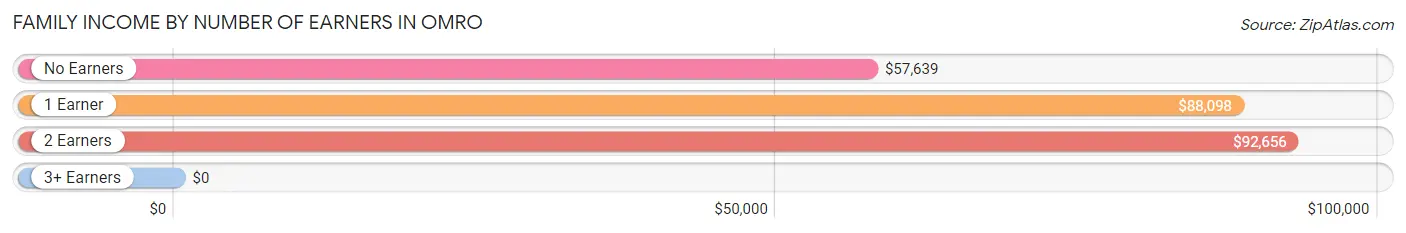
| Number of Earners | # Families | Median Income |
| No Earners | 124 (11.8%) | $57,639 |
| 1 Earner | 285 (27.3%) | $88,098 |
| 2 Earners | 572 (54.7%) | $92,656 |
| 3+ Earners | 65 (6.2%) | $0 |
| Total | 1,046 (100.0%) | $88,696 |
Household Income in Omro
Household Income Brackets in Omro
With 383 households falling in the category, the $50,000 to $74,999 income range is the most frequent in Omro, accounting for 23.7% of all households. In contrast, only 39 households (2.4%) fall into the less than $10,000 income bracket, making it the least populous group.
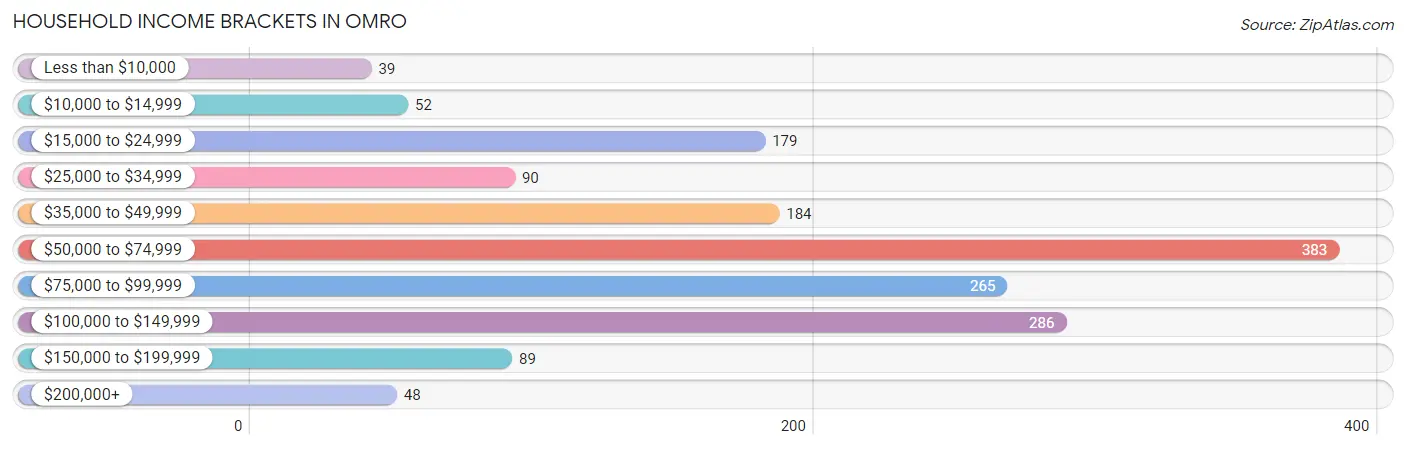
| Income Bracket | # Households | % Households |
| Less than $10,000 | 39 | 2.4% |
| $10,000 to $14,999 | 52 | 3.2% |
| $15,000 to $24,999 | 179 | 11.1% |
| $25,000 to $34,999 | 90 | 5.6% |
| $35,000 to $49,999 | 184 | 11.4% |
| $50,000 to $74,999 | 383 | 23.7% |
| $75,000 to $99,999 | 265 | 16.4% |
| $100,000 to $149,999 | 286 | 17.7% |
| $150,000 to $199,999 | 89 | 5.5% |
| $200,000+ | 48 | 3.0% |
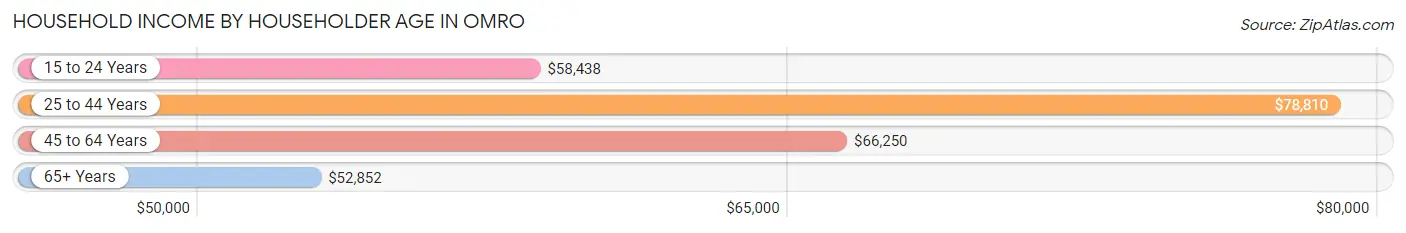
Household Income by Householder Age in Omro
The median household income in Omro is $65,150, with the highest median household income of $78,810 found in the 25 to 44 years age bracket for the primary householder. A total of 372 households (23.1%) fall into this category. Meanwhile, the 65+ years age bracket for the primary householder has the lowest median household income of $52,852, with 530 households (32.8%) in this group.
| Income Bracket | # Households | Median Income |
| 15 to 24 Years | 48 (3.0%) | $58,438 |
| 25 to 44 Years | 372 (23.1%) | $78,810 |
| 45 to 64 Years | 664 (41.1%) | $66,250 |
| 65+ Years | 530 (32.8%) | $52,852 |
| Total | 1,614 (100.0%) | $65,150 |
Poverty in Omro
Income Below Poverty by Sex and Age in Omro
With 3.2% poverty level for males and 4.4% for females among the residents of Omro, 45 to 54 year old males and 75 year old and over females are the most vulnerable to poverty, with 29 males (7.7%) and 25 females (17.7%) in their respective age groups living below the poverty level.
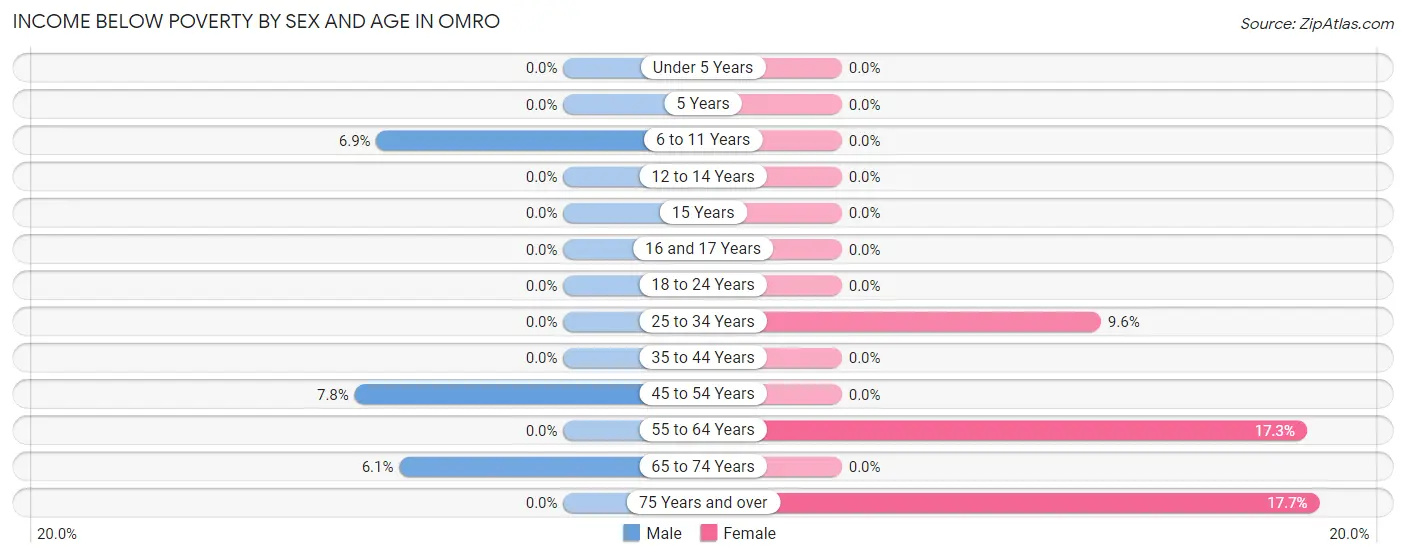
| Age Bracket | Male | Female |
| Under 5 Years | 0 (0.0%) | 0 (0.0%) |
| 5 Years | 0 (0.0%) | 0 (0.0%) |
| 6 to 11 Years | 15 (6.9%) | 0 (0.0%) |
| 12 to 14 Years | 0 (0.0%) | 0 (0.0%) |
| 15 Years | 0 (0.0%) | 0 (0.0%) |
| 16 and 17 Years | 0 (0.0%) | 0 (0.0%) |
| 18 to 24 Years | 0 (0.0%) | 0 (0.0%) |
| 25 to 34 Years | 0 (0.0%) | 15 (9.6%) |
| 35 to 44 Years | 0 (0.0%) | 0 (0.0%) |
| 45 to 54 Years | 29 (7.7%) | 0 (0.0%) |
| 55 to 64 Years | 0 (0.0%) | 39 (17.3%) |
| 65 to 74 Years | 14 (6.1%) | 0 (0.0%) |
| 75 Years and over | 0 (0.0%) | 25 (17.7%) |
| Total | 58 (3.2%) | 79 (4.4%) |
Income Above Poverty by Sex and Age in Omro
According to the poverty statistics in Omro, males aged under 5 years and females aged under 5 years are the age groups that are most secure financially, with 100.0% of males and 100.0% of females in these age groups living above the poverty line.
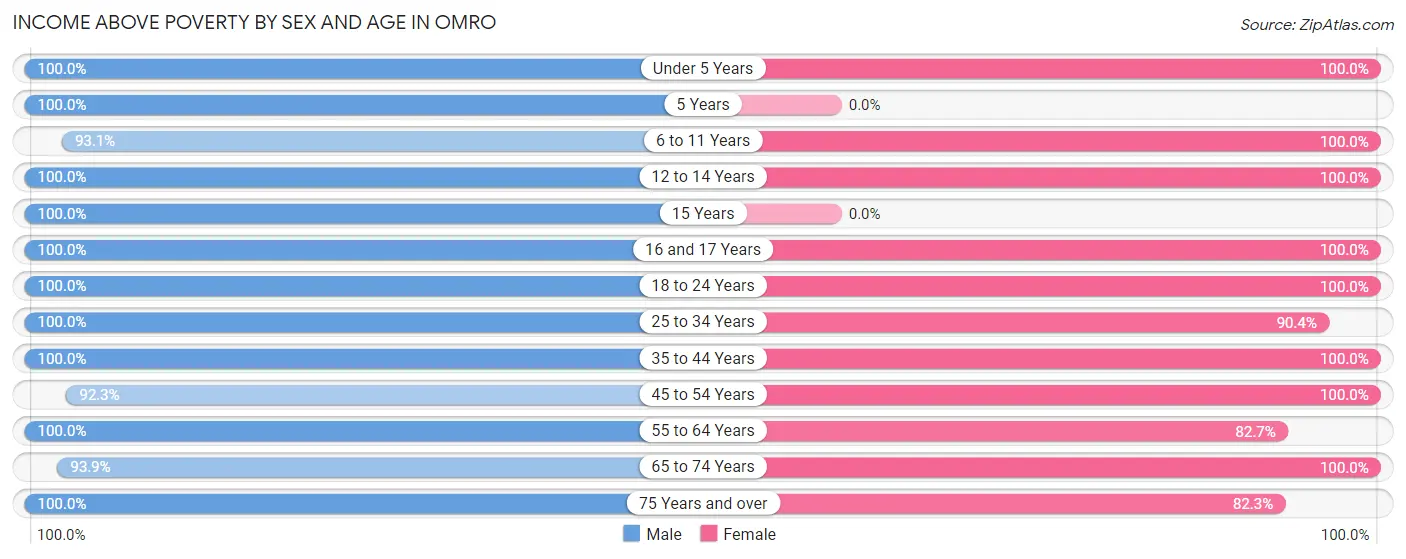
| Age Bracket | Male | Female |
| Under 5 Years | 96 (100.0%) | 70 (100.0%) |
| 5 Years | 63 (100.0%) | 0 (0.0%) |
| 6 to 11 Years | 201 (93.1%) | 136 (100.0%) |
| 12 to 14 Years | 47 (100.0%) | 74 (100.0%) |
| 15 Years | 15 (100.0%) | 0 (0.0%) |
| 16 and 17 Years | 16 (100.0%) | 64 (100.0%) |
| 18 to 24 Years | 139 (100.0%) | 155 (100.0%) |
| 25 to 34 Years | 161 (100.0%) | 141 (90.4%) |
| 35 to 44 Years | 183 (100.0%) | 270 (100.0%) |
| 45 to 54 Years | 345 (92.2%) | 233 (100.0%) |
| 55 to 64 Years | 201 (100.0%) | 187 (82.7%) |
| 65 to 74 Years | 216 (93.9%) | 280 (100.0%) |
| 75 Years and over | 53 (100.0%) | 116 (82.3%) |
| Total | 1,736 (96.8%) | 1,726 (95.6%) |
Income Below Poverty Among Married-Couple Families in Omro
The poverty statistics for married-couple families in Omro show that 1.8% or 14 of the total 791 families live below the poverty line. Families with no children have the highest poverty rate of 2.9%, comprising of 14 families. On the other hand, families with 1 or 2 children have the lowest poverty rate of 0.0%, which includes 0 families.
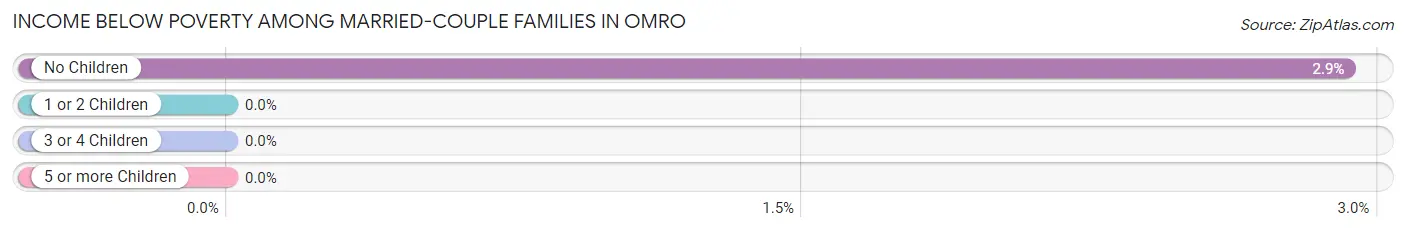
| Children | Above Poverty | Below Poverty |
| No Children | 465 (97.1%) | 14 (2.9%) |
| 1 or 2 Children | 224 (100.0%) | 0 (0.0%) |
| 3 or 4 Children | 88 (100.0%) | 0 (0.0%) |
| 5 or more Children | 0 (0.0%) | 0 (0.0%) |
| Total | 777 (98.2%) | 14 (1.8%) |
Income Below Poverty Among Single-Parent Households in Omro
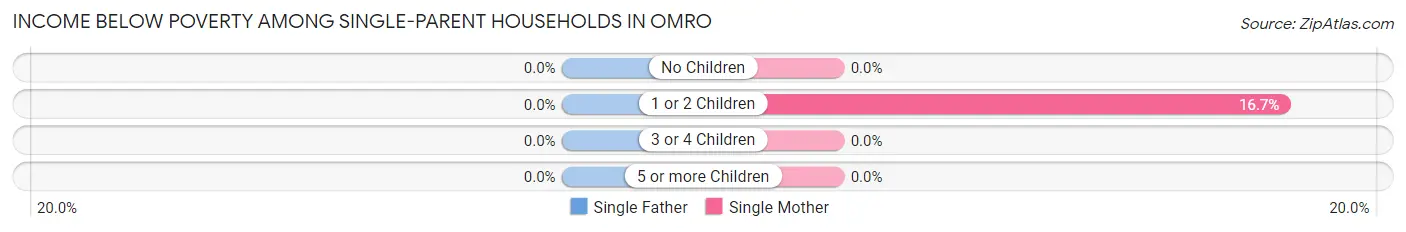
| Children | Single Father | Single Mother |
| No Children | 0 (0.0%) | 0 (0.0%) |
| 1 or 2 Children | 0 (0.0%) | 15 (16.7%) |
| 3 or 4 Children | 0 (0.0%) | 0 (0.0%) |
| 5 or more Children | 0 (0.0%) | 0 (0.0%) |
| Total | 0 (0.0%) | 15 (6.9%) |
Income Below Poverty Among Married-Couple vs Single-Parent Households in Omro
The poverty data for Omro shows that 14 of the married-couple family households (1.8%) and 15 of the single-parent households (5.9%) are living below the poverty level. Within the married-couple family households, those with no children have the highest poverty rate, with 14 households (2.9%) falling below the poverty line. Among the single-parent households, those with 1 or 2 children have the highest poverty rate, with 15 household (14.7%) living below poverty.
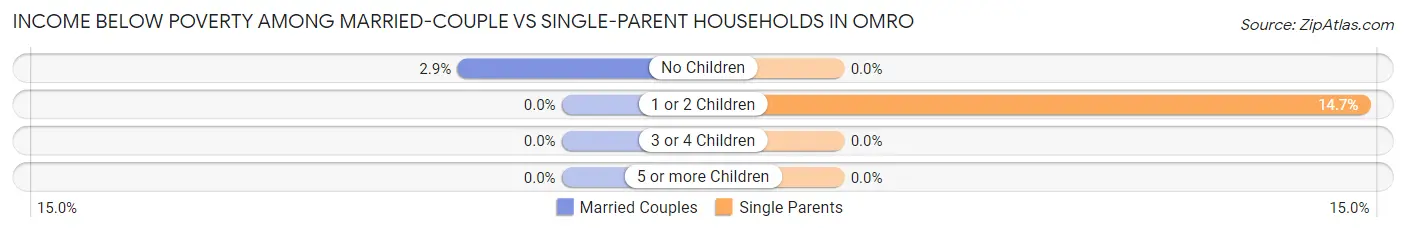
| Children | Married-Couple Families | Single-Parent Households |
| No Children | 14 (2.9%) | 0 (0.0%) |
| 1 or 2 Children | 0 (0.0%) | 15 (14.7%) |
| 3 or 4 Children | 0 (0.0%) | 0 (0.0%) |
| 5 or more Children | 0 (0.0%) | 0 (0.0%) |
| Total | 14 (1.8%) | 15 (5.9%) |
Race in Omro
The most populous races in Omro are White / Caucasian (3,550 | 97.6%), Some other Race (67 | 1.8%), and Hispanic or Latino (46 | 1.3%).
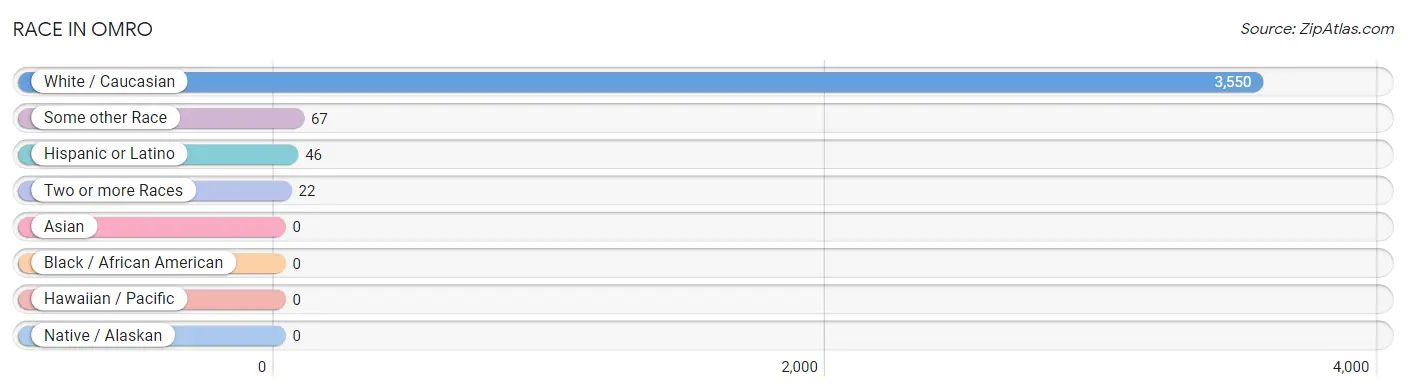
| Race | # Population | % Population |
| Asian | 0 | 0.0% |
| Black / African American | 0 | 0.0% |
| Hawaiian / Pacific | 0 | 0.0% |
| Hispanic or Latino | 46 | 1.3% |
| Native / Alaskan | 0 | 0.0% |
| White / Caucasian | 3,550 | 97.6% |
| Two or more Races | 22 | 0.6% |
| Some other Race | 67 | 1.8% |
| Total | 3,639 | 100.0% |
Ancestry in Omro
The most populous ancestries reported in Omro are German (1,638 | 45.0%), Irish (541 | 14.9%), English (540 | 14.8%), Norwegian (397 | 10.9%), and Polish (264 | 7.2%), together accounting for 92.9% of all Omro residents.
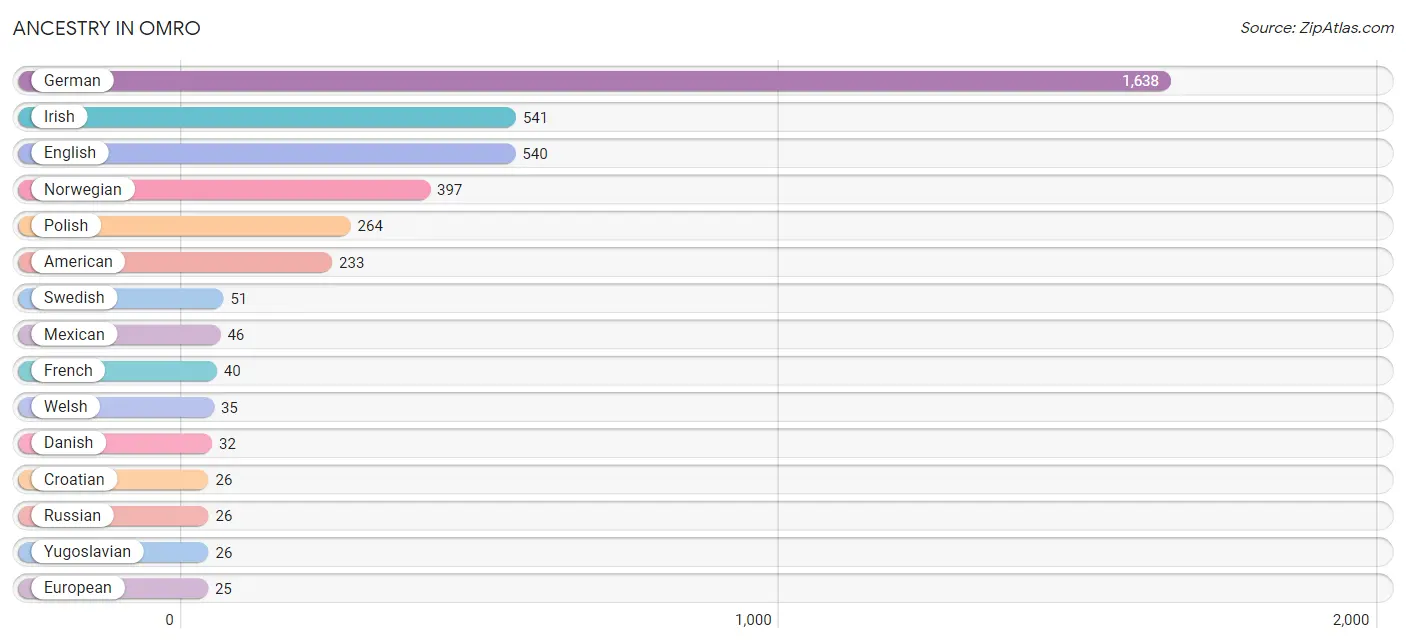
| Ancestry | # Population | % Population |
| American | 233 | 6.4% |
| Belgian | 15 | 0.4% |
| British | 12 | 0.3% |
| Canadian | 22 | 0.6% |
| Creek | 12 | 0.3% |
| Croatian | 26 | 0.7% |
| Czech | 15 | 0.4% |
| Danish | 32 | 0.9% |
| Dutch | 24 | 0.7% |
| English | 540 | 14.8% |
| European | 25 | 0.7% |
| French | 40 | 1.1% |
| French American Indian | 10 | 0.3% |
| French Canadian | 14 | 0.4% |
| German | 1,638 | 45.0% |
| Irish | 541 | 14.9% |
| Italian | 23 | 0.6% |
| Mexican | 46 | 1.3% |
| Norwegian | 397 | 10.9% |
| Polish | 264 | 7.2% |
| Russian | 26 | 0.7% |
| Scotch-Irish | 16 | 0.4% |
| Scottish | 20 | 0.5% |
| Swedish | 51 | 1.4% |
| Swiss | 11 | 0.3% |
| Welsh | 35 | 1.0% |
| Yugoslavian | 26 | 0.7% | View All 27 Rows |
Immigrants in Omro
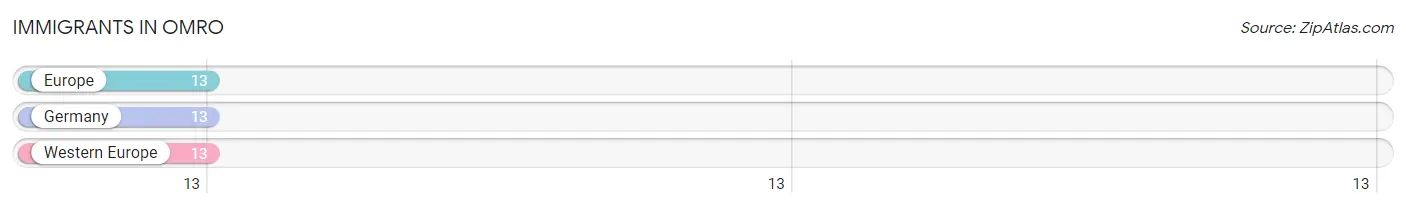
The most numerous immigrant groups reported in Omro came from Europe (13 | 0.4%), Germany (13 | 0.4%), and Western Europe (13 | 0.4%), together accounting for 1.1% of all Omro residents.
| Immigration Origin | # Population | % Population |
| Europe | 13 | 0.4% |
| Germany | 13 | 0.4% |
| Western Europe | 13 | 0.4% | View All 3 Rows |
Sex and Age in Omro
Sex and Age in Omro
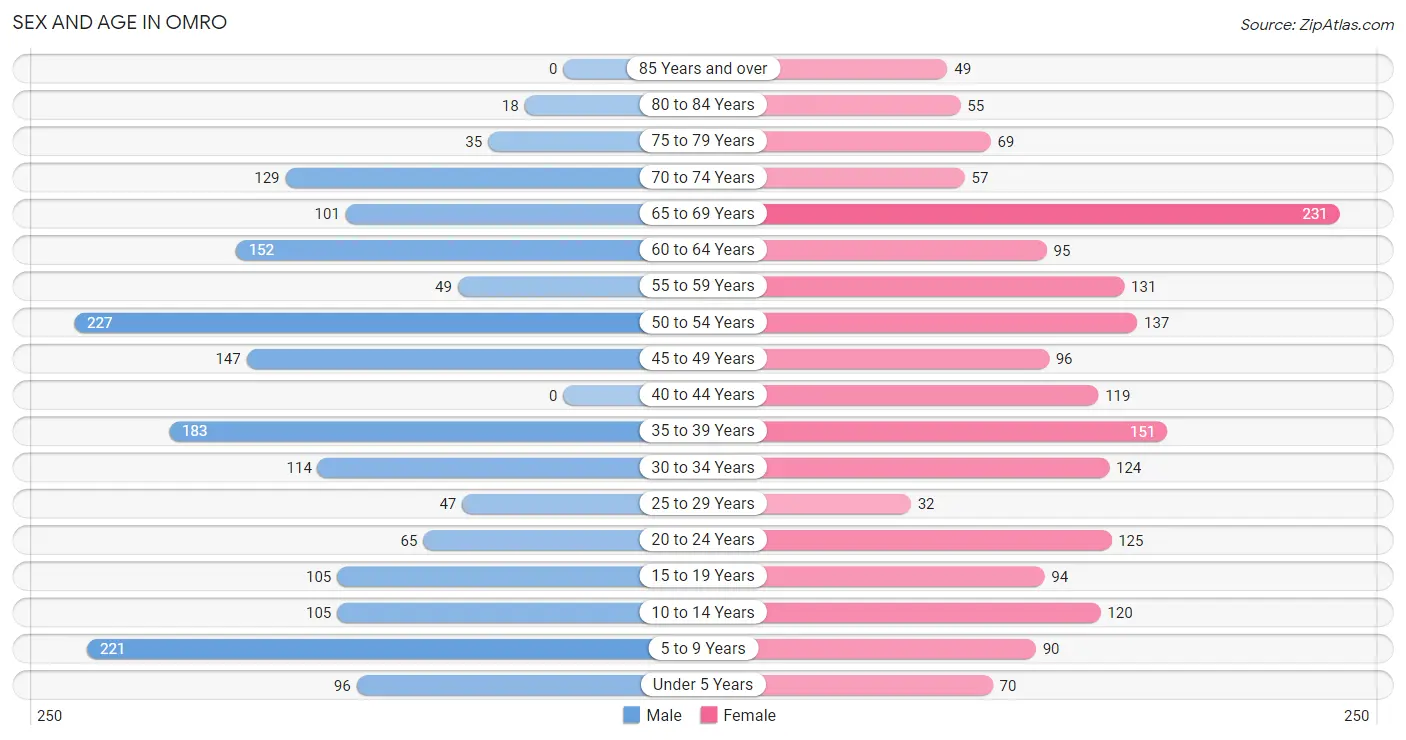
The most populous age groups in Omro are 50 to 54 Years (227 | 12.7%) for men and 65 to 69 Years (231 | 12.5%) for women.
| Age Bracket | Male | Female |
| Under 5 Years | 96 (5.3%) | 70 (3.8%) |
| 5 to 9 Years | 221 (12.3%) | 90 (4.9%) |
| 10 to 14 Years | 105 (5.9%) | 120 (6.5%) |
| 15 to 19 Years | 105 (5.9%) | 94 (5.1%) |
| 20 to 24 Years | 65 (3.6%) | 125 (6.8%) |
| 25 to 29 Years | 47 (2.6%) | 32 (1.7%) |
| 30 to 34 Years | 114 (6.4%) | 124 (6.7%) |
| 35 to 39 Years | 183 (10.2%) | 151 (8.2%) |
| 40 to 44 Years | 0 (0.0%) | 119 (6.5%) |
| 45 to 49 Years | 147 (8.2%) | 96 (5.2%) |
| 50 to 54 Years | 227 (12.7%) | 137 (7.4%) |
| 55 to 59 Years | 49 (2.7%) | 131 (7.1%) |
| 60 to 64 Years | 152 (8.5%) | 95 (5.1%) |
| 65 to 69 Years | 101 (5.6%) | 231 (12.5%) |
| 70 to 74 Years | 129 (7.2%) | 57 (3.1%) |
| 75 to 79 Years | 35 (1.9%) | 69 (3.7%) |
| 80 to 84 Years | 18 (1.0%) | 55 (3.0%) |
| 85 Years and over | 0 (0.0%) | 49 (2.7%) |
| Total | 1,794 (100.0%) | 1,845 (100.0%) |
Families and Households in Omro
Median Family Size in Omro
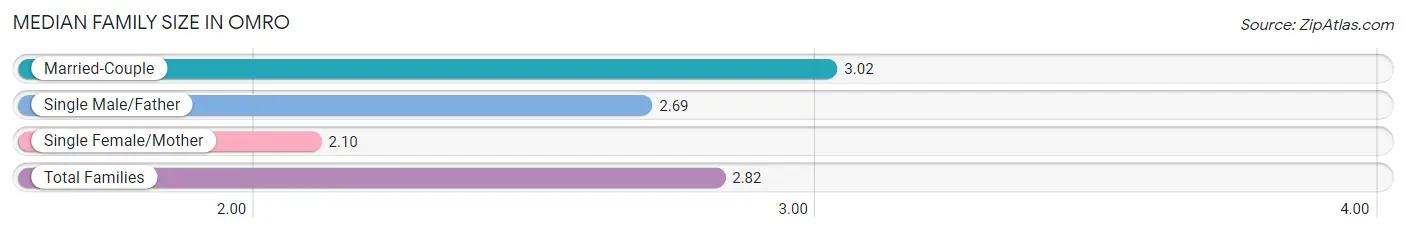
The median family size in Omro is 2.82 persons per family, with married-couple families (791 | 75.6%) accounting for the largest median family size of 3.02 persons per family. On the other hand, single female/mother families (216 | 20.6%) represent the smallest median family size with 2.10 persons per family.
| Family Type | # Families | Family Size |
| Married-Couple | 791 (75.6%) | 3.02 |
| Single Male/Father | 39 (3.7%) | 2.69 |
| Single Female/Mother | 216 (20.6%) | 2.10 |
| Total Families | 1,046 (100.0%) | 2.82 |
Median Household Size in Omro
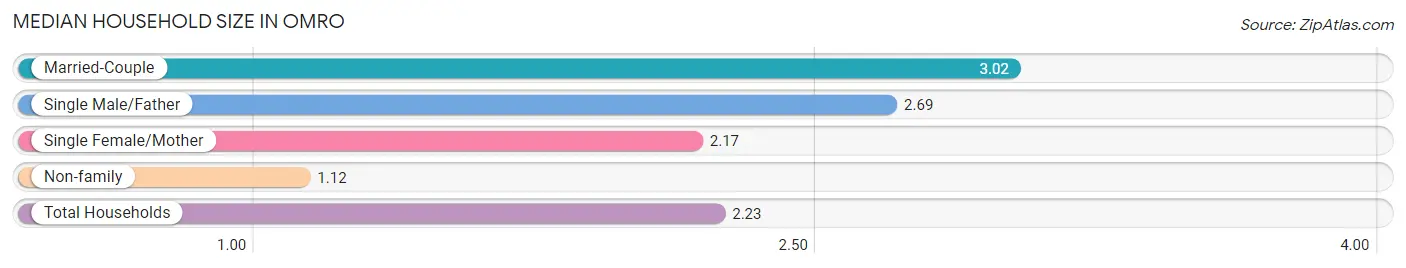
The median household size in Omro is 2.23 persons per household, with married-couple households (791 | 49.0%) accounting for the largest median household size of 3.02 persons per household. non-family households (568 | 35.2%) represent the smallest median household size with 1.12 persons per household.
| Household Type | # Households | Household Size |
| Married-Couple | 791 (49.0%) | 3.02 |
| Single Male/Father | 39 (2.4%) | 2.69 |
| Single Female/Mother | 216 (13.4%) | 2.17 |
| Non-family | 568 (35.2%) | 1.12 |
| Total Households | 1,614 (100.0%) | 2.23 |
Household Size by Marriage Status in Omro
Out of a total of 1,614 households in Omro, 1,046 (64.8%) are family households, while 568 (35.2%) are nonfamily households. The most numerous type of family households are 2-person households, comprising 540, and the most common type of nonfamily households are 1-person households, comprising 513.
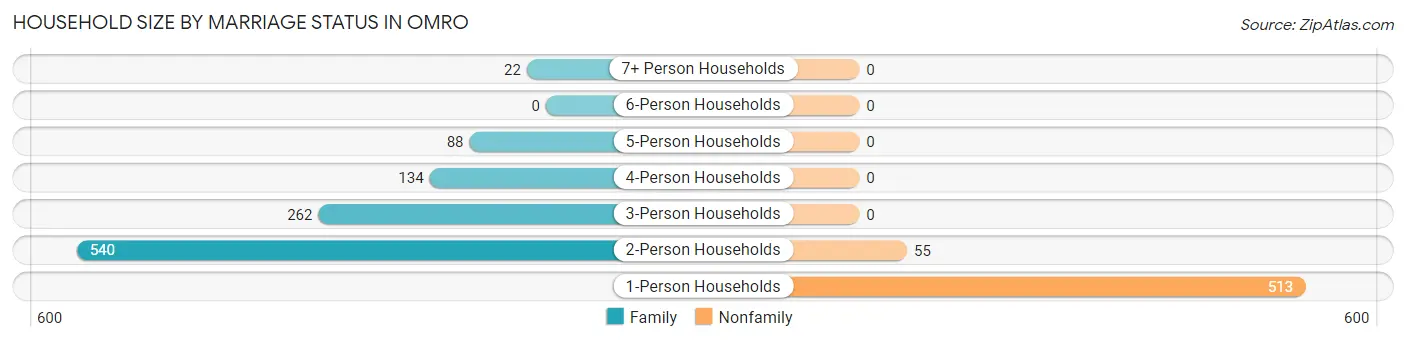
| Household Size | Family Households | Nonfamily Households |
| 1-Person Households | - | 513 (31.8%) |
| 2-Person Households | 540 (33.5%) | 55 (3.4%) |
| 3-Person Households | 262 (16.2%) | 0 (0.0%) |
| 4-Person Households | 134 (8.3%) | 0 (0.0%) |
| 5-Person Households | 88 (5.4%) | 0 (0.0%) |
| 6-Person Households | 0 (0.0%) | 0 (0.0%) |
| 7+ Person Households | 22 (1.4%) | 0 (0.0%) |
| Total | 1,046 (64.8%) | 568 (35.2%) |
Female Fertility in Omro
Fertility by Age in Omro
| Age Bracket | Women with Births | Births / 1,000 Women |
| 15 to 19 years | 0 (0.0%) | 0.0 |
| 20 to 34 years | 0 (0.0%) | 0.0 |
| 35 to 50 years | 0 (0.0%) | 0.0 |
| Total | 0 (0.0%) | 0.0 |
Fertility by Age by Marriage Status in Omro
| Age Bracket | Married | Unmarried |
| 15 to 19 years | 0 (0.0%) | 0 (0.0%) |
| 20 to 34 years | 0 (0.0%) | 0 (0.0%) |
| 35 to 50 years | 0 (0.0%) | 0 (0.0%) |
| Total | 0 (0.0%) | 0 (0.0%) |
Fertility by Education in Omro
| Educational Attainment | Women with Births | Births / 1,000 Women |
| Less than High School | 0 (0.0%) | 0.0 |
| High School Diploma | 0 (0.0%) | 0.0 |
| College or Associate's Degree | 0 (0.0%) | 0.0 |
| Bachelor's Degree | 0 (0.0%) | 0.0 |
| Graduate Degree | 0 (0.0%) | 0.0 |
| Total | 0 (0.0%) | 0.0 |
Fertility by Education by Marriage Status in Omro
| Educational Attainment | Married | Unmarried |
| Less than High School | 0 (0.0%) | 0 (0.0%) |
| High School Diploma | 0 (0.0%) | 0 (0.0%) |
| College or Associate's Degree | 0 (0.0%) | 0 (0.0%) |
| Bachelor's Degree | 0 (0.0%) | 0 (0.0%) |
| Graduate Degree | 0 (0.0%) | 0 (0.0%) |
| Total | 0 (0.0%) | 0 (0.0%) |
Employment Characteristics in Omro
Employment by Class of Employer in Omro
Among the 1,916 employed individuals in Omro, private company employees (1,545 | 80.6%), not-for-profit organizations (170 | 8.9%), and local government employees (107 | 5.6%) make up the most common classes of employment.
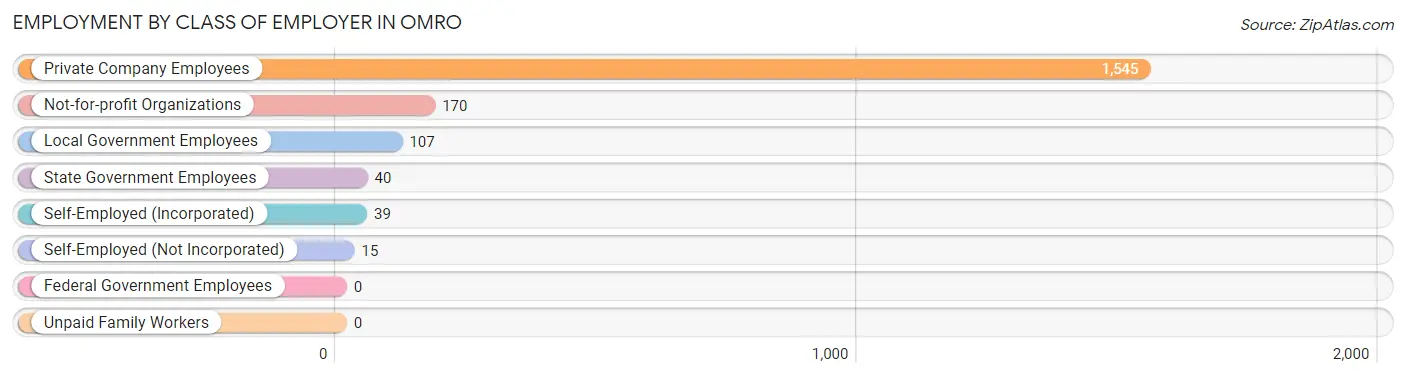
| Employer Class | # Employees | % Employees |
| Private Company Employees | 1,545 | 80.6% |
| Self-Employed (Incorporated) | 39 | 2.0% |
| Self-Employed (Not Incorporated) | 15 | 0.8% |
| Not-for-profit Organizations | 170 | 8.9% |
| Local Government Employees | 107 | 5.6% |
| State Government Employees | 40 | 2.1% |
| Federal Government Employees | 0 | 0.0% |
| Unpaid Family Workers | 0 | 0.0% |
| Total | 1,916 | 100.0% |
Employment Status by Age in Omro
According to the labor force statistics for Omro, out of the total population over 16 years of age (2,922), 67.6% or 1,975 individuals are in the labor force, with 1.7% or 34 of them unemployed. The age group with the highest labor force participation rate is 16 to 19 years, with 100.0% or 184 individuals in the labor force. Within the labor force, the 16 to 19 years age range has the highest percentage of unemployed individuals, with 8.7% or 16 of them being unemployed.
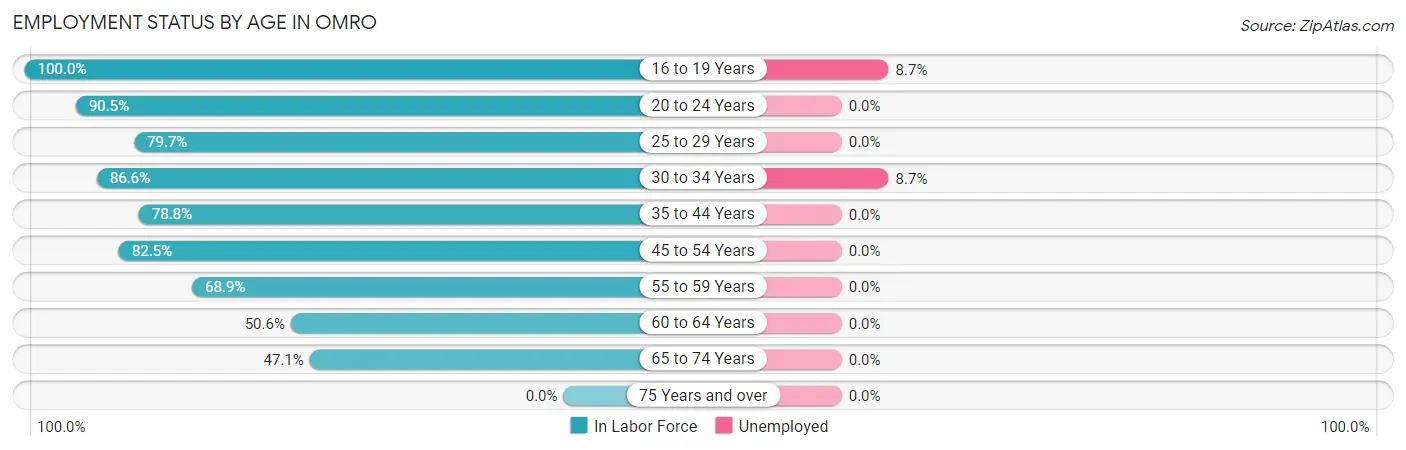
| Age Bracket | In Labor Force | Unemployed |
| 16 to 19 Years | 184 (100.0%) | 16 (8.7%) |
| 20 to 24 Years | 172 (90.5%) | 0 (0.0%) |
| 25 to 29 Years | 63 (79.7%) | 0 (0.0%) |
| 30 to 34 Years | 206 (86.6%) | 18 (8.7%) |
| 35 to 44 Years | 357 (78.8%) | 0 (0.0%) |
| 45 to 54 Years | 501 (82.5%) | 0 (0.0%) |
| 55 to 59 Years | 124 (68.9%) | 0 (0.0%) |
| 60 to 64 Years | 125 (50.6%) | 0 (0.0%) |
| 65 to 74 Years | 244 (47.1%) | 0 (0.0%) |
| 75 Years and over | 0 (0.0%) | 0 (0.0%) |
| Total | 1,975 (67.6%) | 34 (1.7%) |
Employment Status by Educational Attainment in Omro
According to labor force statistics for Omro, 76.3% of individuals (1,376) out of the total population between 25 and 64 years of age (1,804) are in the labor force, with 1.3% or 18 of them being unemployed. The group with the highest labor force participation rate are those with the educational attainment of bachelor's degree or higher, with 85.3% or 492 individuals in the labor force. Within the labor force, individuals with high school diploma education have the highest percentage of unemployment, with 8.1% or 18 of them being unemployed.
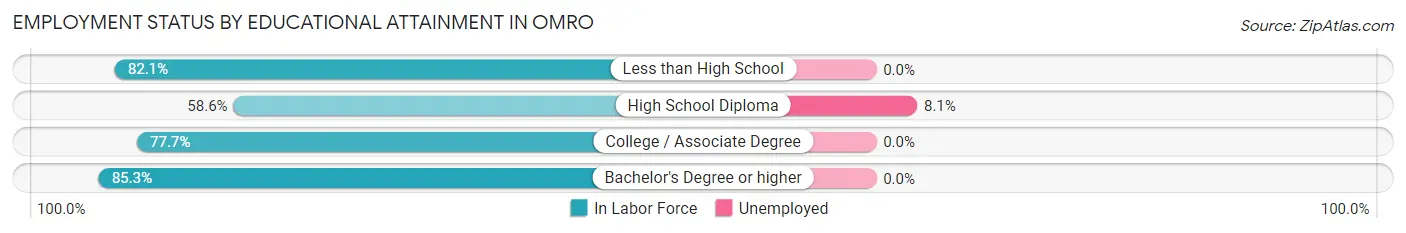
| Educational Attainment | In Labor Force | Unemployed |
| Less than High School | 46 (82.1%) | 0 (0.0%) |
| High School Diploma | 221 (58.6%) | 31 (8.1%) |
| College / Associate Degree | 617 (77.7%) | 0 (0.0%) |
| Bachelor's Degree or higher | 492 (85.3%) | 0 (0.0%) |
| Total | 1,376 (76.3%) | 23 (1.3%) |
Employment Occupations by Sex in Omro
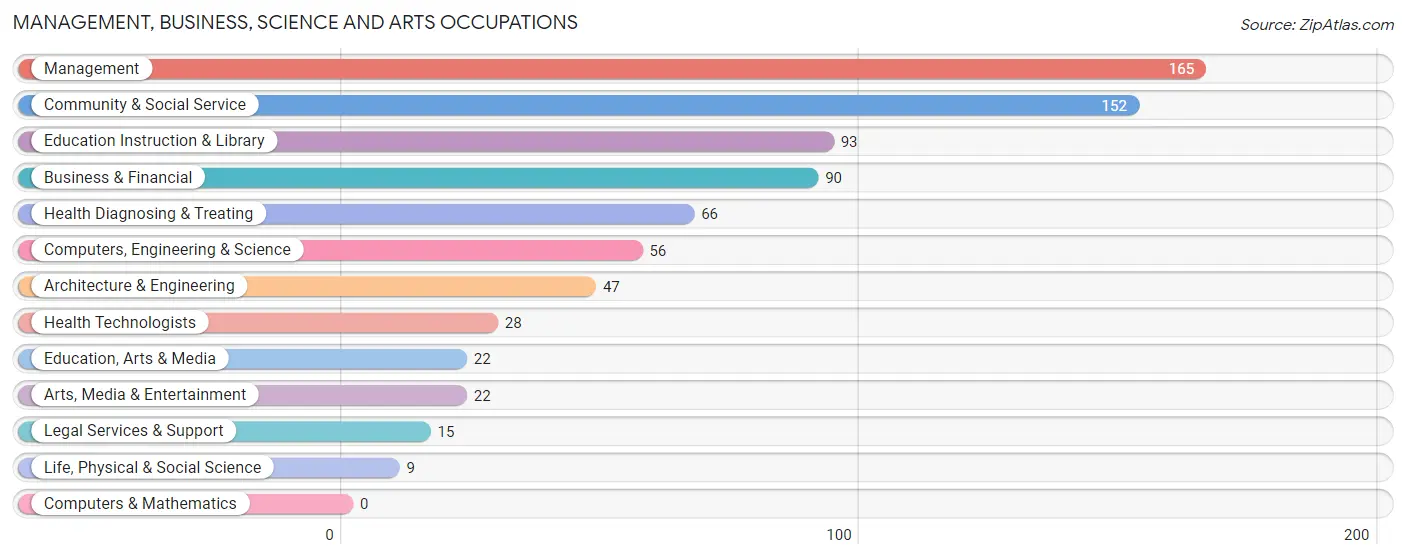
Management, Business, Science and Arts Occupations
The most common Management, Business, Science and Arts occupations in Omro are Management (165 | 8.5%), Community & Social Service (152 | 7.8%), Education Instruction & Library (93 | 4.8%), Business & Financial (90 | 4.6%), and Health Diagnosing & Treating (66 | 3.4%).
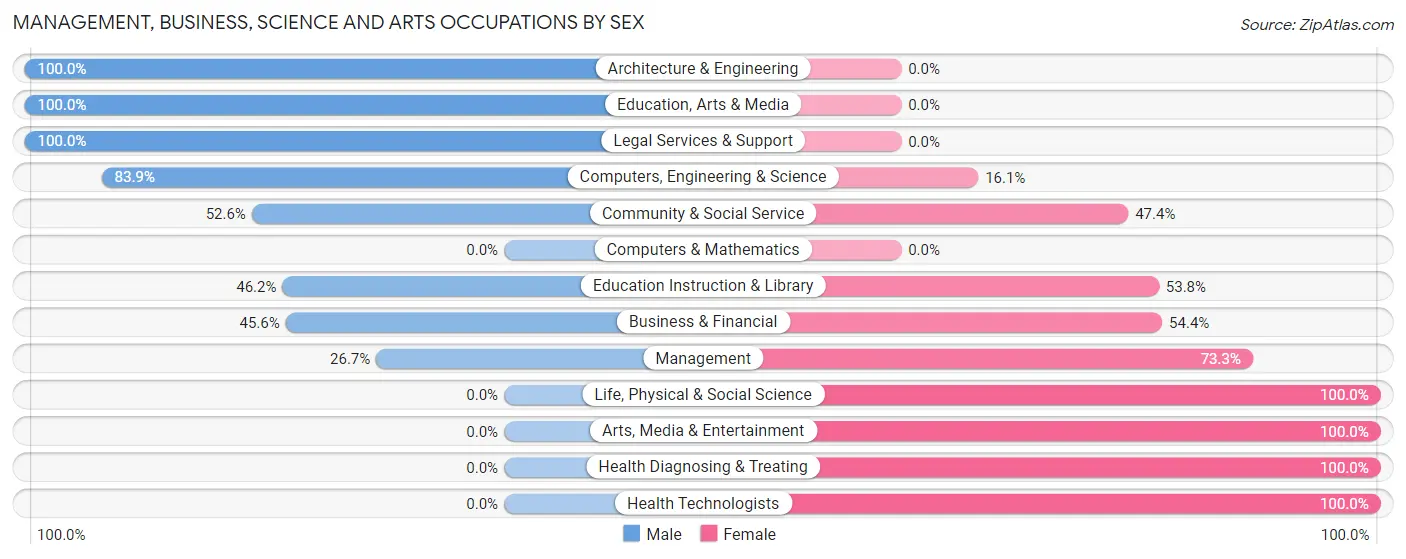
Management, Business, Science and Arts Occupations by Sex
Within the Management, Business, Science and Arts occupations in Omro, the most male-oriented occupations are Architecture & Engineering (100.0%), Education, Arts & Media (100.0%), and Legal Services & Support (100.0%), while the most female-oriented occupations are Life, Physical & Social Science (100.0%), Arts, Media & Entertainment (100.0%), and Health Diagnosing & Treating (100.0%).
| Occupation | Male | Female |
| Management | 44 (26.7%) | 121 (73.3%) |
| Business & Financial | 41 (45.6%) | 49 (54.4%) |
| Computers, Engineering & Science | 47 (83.9%) | 9 (16.1%) |
| Computers & Mathematics | 0 (0.0%) | 0 (0.0%) |
| Architecture & Engineering | 47 (100.0%) | 0 (0.0%) |
| Life, Physical & Social Science | 0 (0.0%) | 9 (100.0%) |
| Community & Social Service | 80 (52.6%) | 72 (47.4%) |
| Education, Arts & Media | 22 (100.0%) | 0 (0.0%) |
| Legal Services & Support | 15 (100.0%) | 0 (0.0%) |
| Education Instruction & Library | 43 (46.2%) | 50 (53.8%) |
| Arts, Media & Entertainment | 0 (0.0%) | 22 (100.0%) |
| Health Diagnosing & Treating | 0 (0.0%) | 66 (100.0%) |
| Health Technologists | 0 (0.0%) | 28 (100.0%) |
| Total (Category) | 212 (40.1%) | 317 (59.9%) |
| Total (Overall) | 944 (48.6%) | 998 (51.4%) |
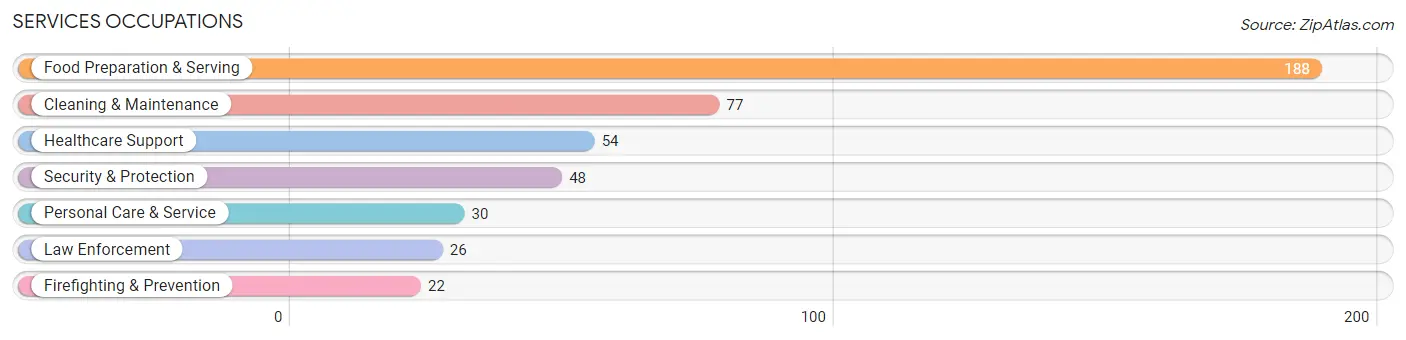
Services Occupations
The most common Services occupations in Omro are Food Preparation & Serving (188 | 9.7%), Cleaning & Maintenance (77 | 4.0%), Healthcare Support (54 | 2.8%), Security & Protection (48 | 2.5%), and Personal Care & Service (30 | 1.5%).
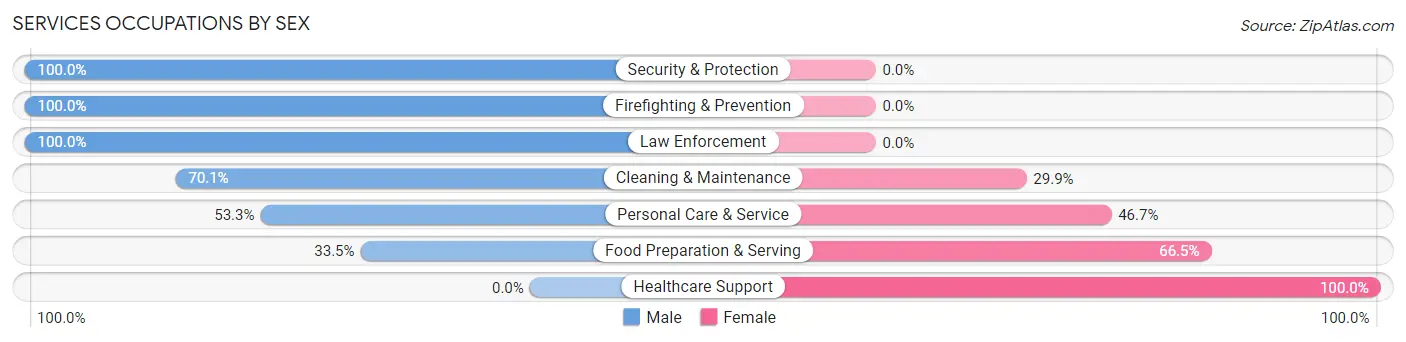
Services Occupations by Sex
Within the Services occupations in Omro, the most male-oriented occupations are Security & Protection (100.0%), Firefighting & Prevention (100.0%), and Law Enforcement (100.0%), while the most female-oriented occupations are Healthcare Support (100.0%), Food Preparation & Serving (66.5%), and Personal Care & Service (46.7%).
| Occupation | Male | Female |
| Healthcare Support | 0 (0.0%) | 54 (100.0%) |
| Security & Protection | 48 (100.0%) | 0 (0.0%) |
| Firefighting & Prevention | 22 (100.0%) | 0 (0.0%) |
| Law Enforcement | 26 (100.0%) | 0 (0.0%) |
| Food Preparation & Serving | 63 (33.5%) | 125 (66.5%) |
| Cleaning & Maintenance | 54 (70.1%) | 23 (29.9%) |
| Personal Care & Service | 16 (53.3%) | 14 (46.7%) |
| Total (Category) | 181 (45.6%) | 216 (54.4%) |
| Total (Overall) | 944 (48.6%) | 998 (51.4%) |
Sales and Office Occupations
The most common Sales and Office occupations in Omro are Office & Administration (236 | 12.1%), and Sales & Related (197 | 10.1%).
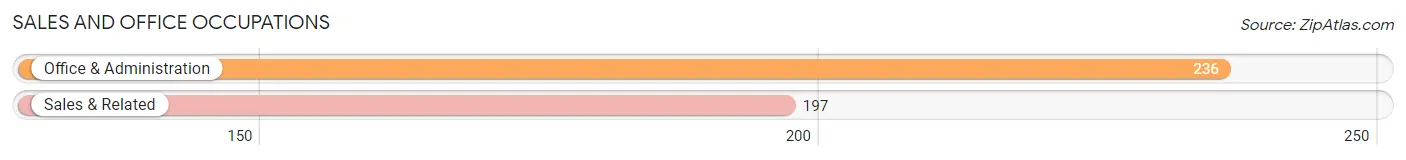
Sales and Office Occupations by Sex

| Occupation | Male | Female |
| Sales & Related | 120 (60.9%) | 77 (39.1%) |
| Office & Administration | 16 (6.8%) | 220 (93.2%) |
| Total (Category) | 136 (31.4%) | 297 (68.6%) |
| Total (Overall) | 944 (48.6%) | 998 (51.4%) |
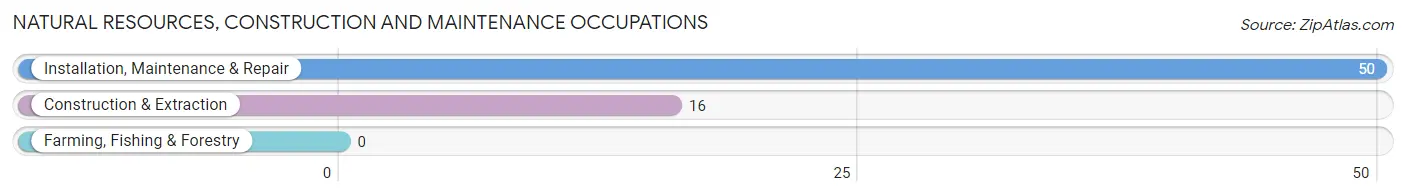
Natural Resources, Construction and Maintenance Occupations
The most common Natural Resources, Construction and Maintenance occupations in Omro are Installation, Maintenance & Repair (50 | 2.6%), and Construction & Extraction (16 | 0.8%).
Natural Resources, Construction and Maintenance Occupations by Sex
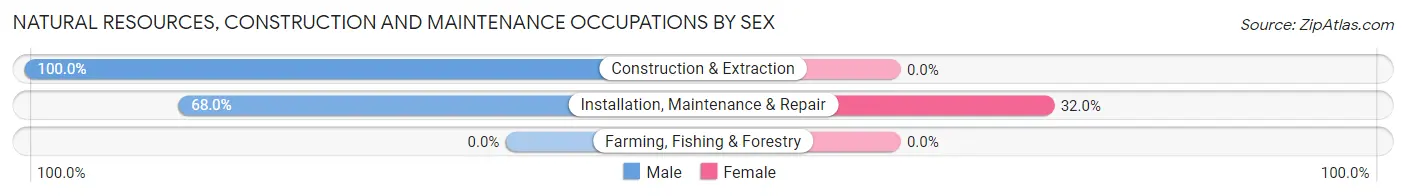
| Occupation | Male | Female |
| Farming, Fishing & Forestry | 0 (0.0%) | 0 (0.0%) |
| Construction & Extraction | 16 (100.0%) | 0 (0.0%) |
| Installation, Maintenance & Repair | 34 (68.0%) | 16 (32.0%) |
| Total (Category) | 50 (75.8%) | 16 (24.2%) |
| Total (Overall) | 944 (48.6%) | 998 (51.4%) |
Production, Transportation and Moving Occupations
The most common Production, Transportation and Moving occupations in Omro are Production (382 | 19.7%), Material Moving (105 | 5.4%), and Transportation (30 | 1.5%).
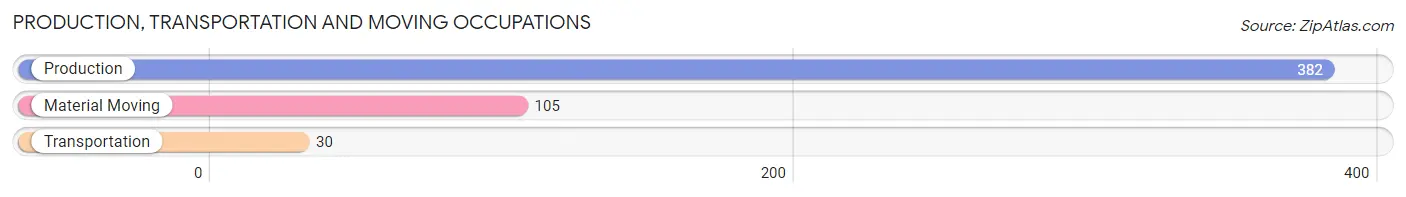
Production, Transportation and Moving Occupations by Sex
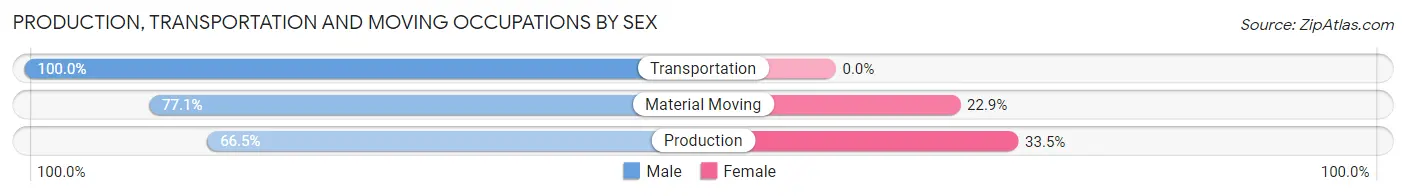
| Occupation | Male | Female |
| Production | 254 (66.5%) | 128 (33.5%) |
| Transportation | 30 (100.0%) | 0 (0.0%) |
| Material Moving | 81 (77.1%) | 24 (22.9%) |
| Total (Category) | 365 (70.6%) | 152 (29.4%) |
| Total (Overall) | 944 (48.6%) | 998 (51.4%) |
Employment Industries by Sex in Omro
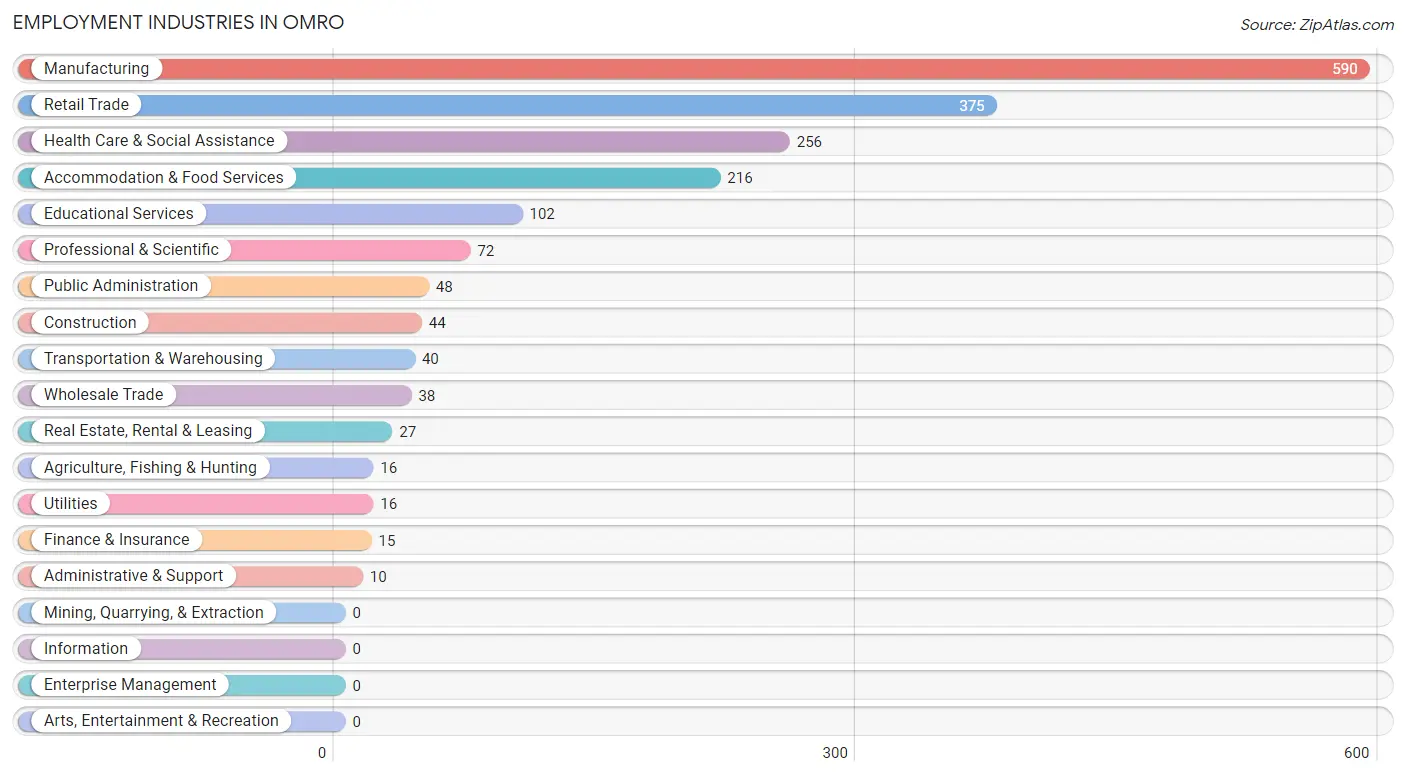
Employment Industries in Omro
The major employment industries in Omro include Manufacturing (590 | 30.4%), Retail Trade (375 | 19.3%), Health Care & Social Assistance (256 | 13.2%), Accommodation & Food Services (216 | 11.1%), and Educational Services (102 | 5.2%).
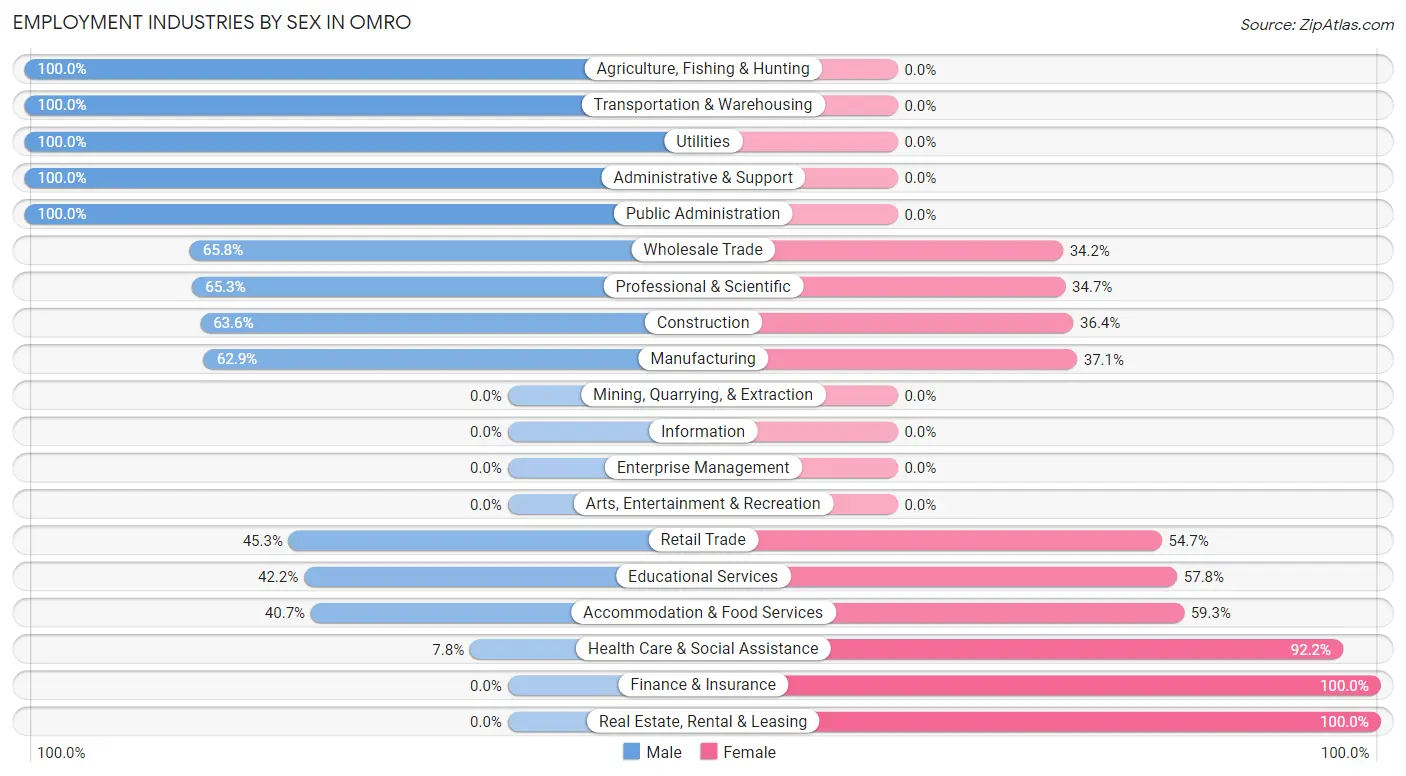
Employment Industries by Sex in Omro
The Omro industries that see more men than women are Agriculture, Fishing & Hunting (100.0%), Transportation & Warehousing (100.0%), and Utilities (100.0%), whereas the industries that tend to have a higher number of women are Finance & Insurance (100.0%), Real Estate, Rental & Leasing (100.0%), and Health Care & Social Assistance (92.2%).
| Industry | Male | Female |
| Agriculture, Fishing & Hunting | 16 (100.0%) | 0 (0.0%) |
| Mining, Quarrying, & Extraction | 0 (0.0%) | 0 (0.0%) |
| Construction | 28 (63.6%) | 16 (36.4%) |
| Manufacturing | 371 (62.9%) | 219 (37.1%) |
| Wholesale Trade | 25 (65.8%) | 13 (34.2%) |
| Retail Trade | 170 (45.3%) | 205 (54.7%) |
| Transportation & Warehousing | 40 (100.0%) | 0 (0.0%) |
| Utilities | 16 (100.0%) | 0 (0.0%) |
| Information | 0 (0.0%) | 0 (0.0%) |
| Finance & Insurance | 0 (0.0%) | 15 (100.0%) |
| Real Estate, Rental & Leasing | 0 (0.0%) | 27 (100.0%) |
| Professional & Scientific | 47 (65.3%) | 25 (34.7%) |
| Enterprise Management | 0 (0.0%) | 0 (0.0%) |
| Administrative & Support | 10 (100.0%) | 0 (0.0%) |
| Educational Services | 43 (42.2%) | 59 (57.8%) |
| Health Care & Social Assistance | 20 (7.8%) | 236 (92.2%) |
| Arts, Entertainment & Recreation | 0 (0.0%) | 0 (0.0%) |
| Accommodation & Food Services | 88 (40.7%) | 128 (59.3%) |
| Public Administration | 48 (100.0%) | 0 (0.0%) |
| Total | 944 (48.6%) | 998 (51.4%) |
Education in Omro
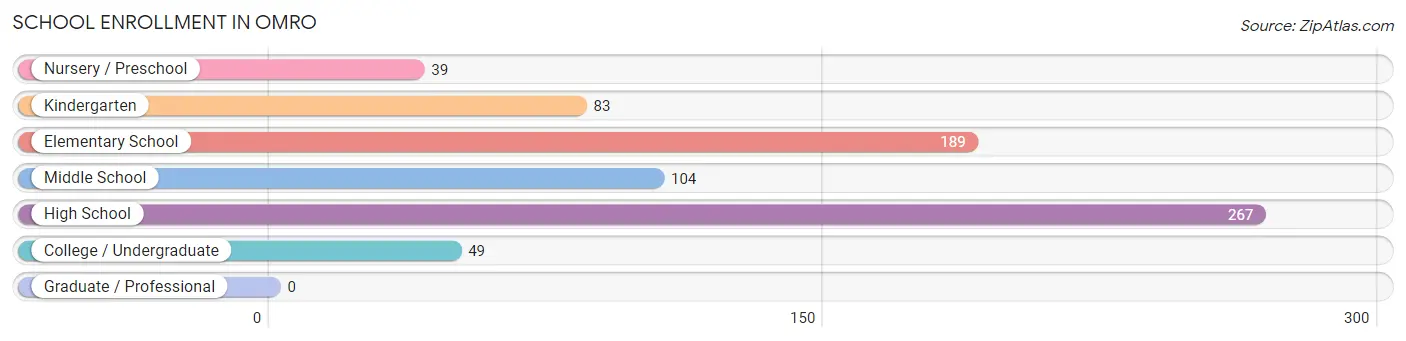
School Enrollment in Omro
The most common levels of schooling among the 731 students in Omro are high school (267 | 36.5%), elementary school (189 | 25.9%), and middle school (104 | 14.2%).
| School Level | # Students | % Students |
| Nursery / Preschool | 39 | 5.3% |
| Kindergarten | 83 | 11.4% |
| Elementary School | 189 | 25.9% |
| Middle School | 104 | 14.2% |
| High School | 267 | 36.5% |
| College / Undergraduate | 49 | 6.7% |
| Graduate / Professional | 0 | 0.0% |
| Total | 731 | 100.0% |
School Enrollment by Age by Funding Source in Omro
Out of a total of 731 students who are enrolled in schools in Omro, 38 (5.2%) attend a private institution, while the remaining 693 (94.8%) are enrolled in public schools. The age group of 10 to 14 year olds has the highest likelihood of being enrolled in private schools, with 38 (16.9% in the age bracket) enrolled. Conversely, the age group of 5 to 9 year old has the lowest likelihood of being enrolled in a private school, with 311 (100.0% in the age bracket) attending a public institution.
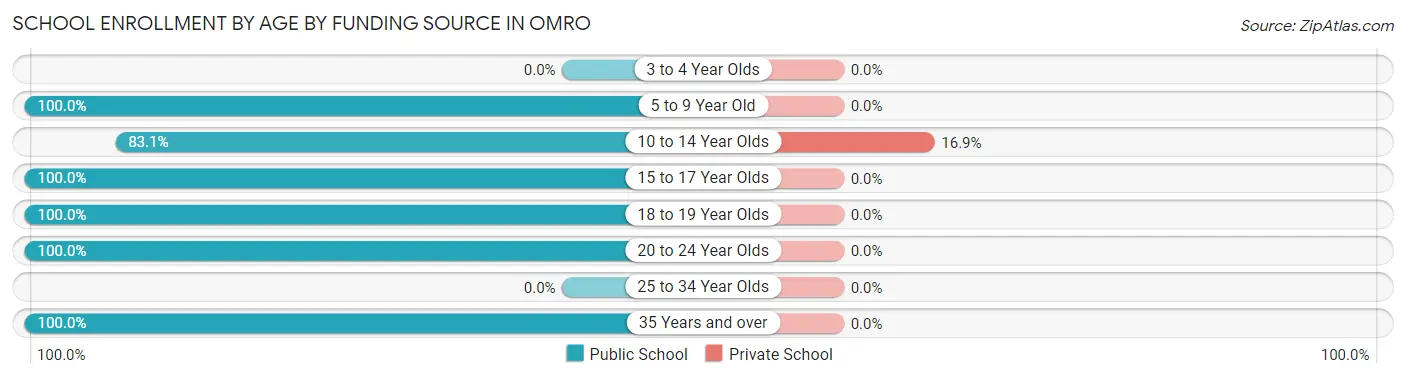
| Age Bracket | Public School | Private School |
| 3 to 4 Year Olds | 0 (0.0%) | 0 (0.0%) |
| 5 to 9 Year Old | 311 (100.0%) | 0 (0.0%) |
| 10 to 14 Year Olds | 187 (83.1%) | 38 (16.9%) |
| 15 to 17 Year Olds | 95 (100.0%) | 0 (0.0%) |
| 18 to 19 Year Olds | 51 (100.0%) | 0 (0.0%) |
| 20 to 24 Year Olds | 18 (100.0%) | 0 (0.0%) |
| 25 to 34 Year Olds | 0 (0.0%) | 0 (0.0%) |
| 35 Years and over | 31 (100.0%) | 0 (0.0%) |
| Total | 693 (94.8%) | 38 (5.2%) |
Educational Attainment by Field of Study in Omro
Business (142 | 19.2%), liberal arts & history (103 | 13.9%), education (97 | 13.1%), social sciences (96 | 13.0%), and arts & humanities (85 | 11.5%) are the most common fields of study among 740 individuals in Omro who have obtained a bachelor's degree or higher.
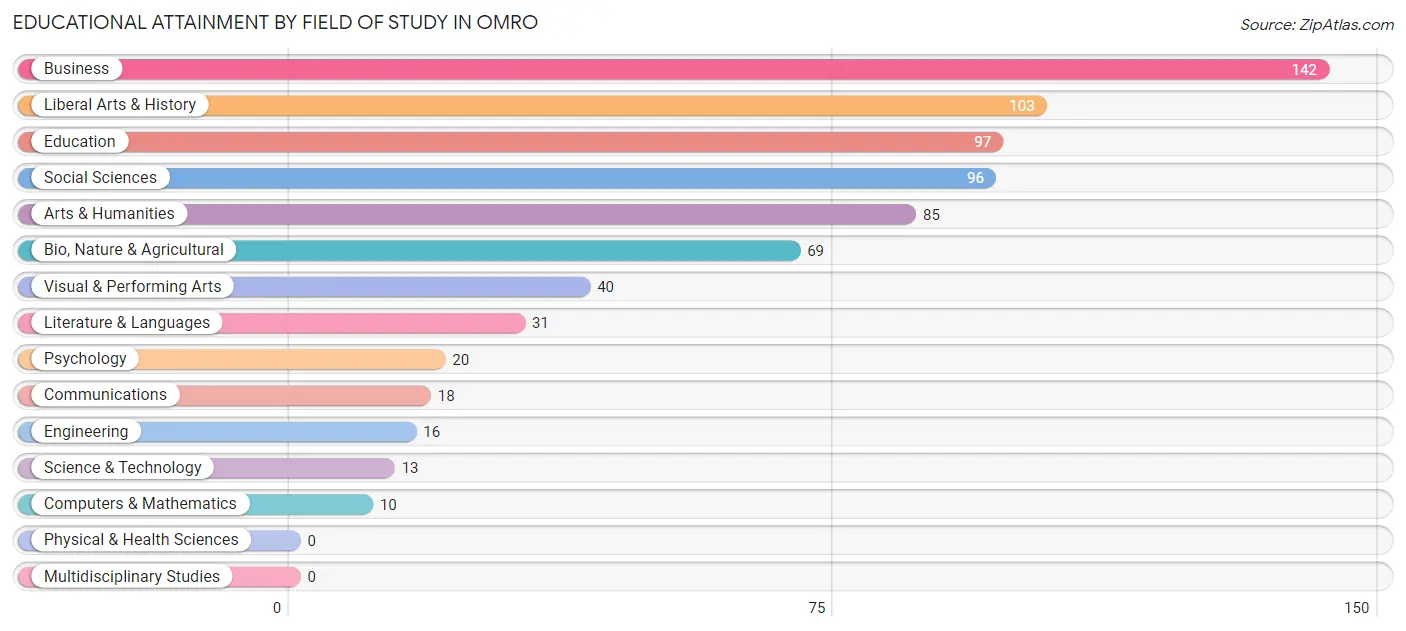
| Field of Study | # Graduates | % Graduates |
| Computers & Mathematics | 10 | 1.3% |
| Bio, Nature & Agricultural | 69 | 9.3% |
| Physical & Health Sciences | 0 | 0.0% |
| Psychology | 20 | 2.7% |
| Social Sciences | 96 | 13.0% |
| Engineering | 16 | 2.2% |
| Multidisciplinary Studies | 0 | 0.0% |
| Science & Technology | 13 | 1.8% |
| Business | 142 | 19.2% |
| Education | 97 | 13.1% |
| Literature & Languages | 31 | 4.2% |
| Liberal Arts & History | 103 | 13.9% |
| Visual & Performing Arts | 40 | 5.4% |
| Communications | 18 | 2.4% |
| Arts & Humanities | 85 | 11.5% |
| Total | 740 | 100.0% |
Transportation & Commute in Omro
Vehicle Availability by Sex in Omro
The most prevalent vehicle ownership categories in Omro are males with 2 vehicles (481, accounting for 52.4%) and females with 2 vehicles (624, making up 48.2%).
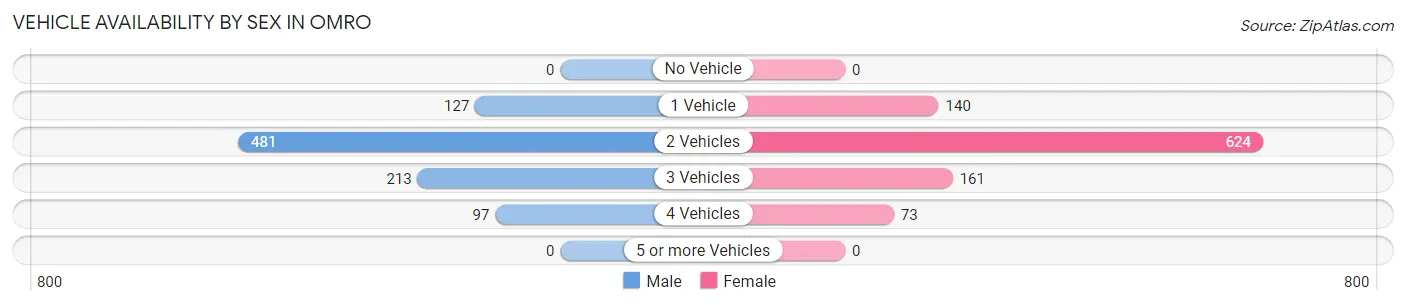
| Vehicles Available | Male | Female |
| No Vehicle | 0 (0.0%) | 0 (0.0%) |
| 1 Vehicle | 127 (13.8%) | 140 (14.0%) |
| 2 Vehicles | 481 (52.4%) | 624 (62.5%) |
| 3 Vehicles | 213 (23.2%) | 161 (16.1%) |
| 4 Vehicles | 97 (10.6%) | 73 (7.3%) |
| 5 or more Vehicles | 0 (0.0%) | 0 (0.0%) |
| Total | 918 (100.0%) | 998 (100.0%) |
Commute Time in Omro
The most frequently occuring commute durations in Omro are 15 to 19 minutes (667 commuters, 36.6%), 20 to 24 minutes (297 commuters, 16.3%), and 30 to 34 minutes (215 commuters, 11.8%).
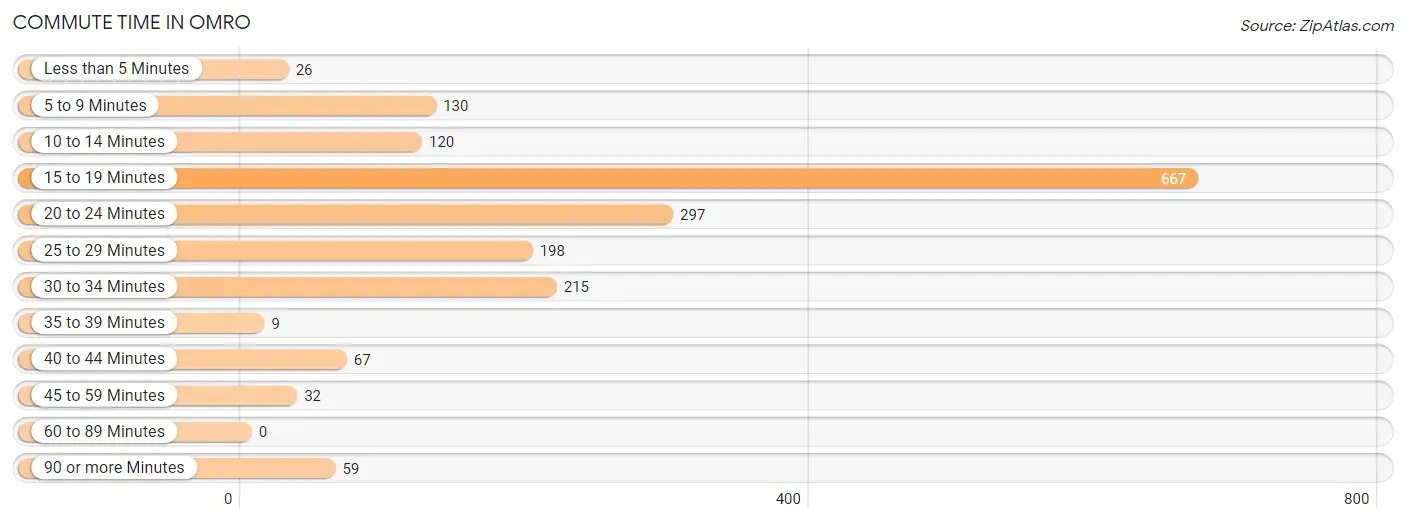
| Commute Time | # Commuters | % Commuters |
| Less than 5 Minutes | 26 | 1.4% |
| 5 to 9 Minutes | 130 | 7.1% |
| 10 to 14 Minutes | 120 | 6.6% |
| 15 to 19 Minutes | 667 | 36.6% |
| 20 to 24 Minutes | 297 | 16.3% |
| 25 to 29 Minutes | 198 | 10.9% |
| 30 to 34 Minutes | 215 | 11.8% |
| 35 to 39 Minutes | 9 | 0.5% |
| 40 to 44 Minutes | 67 | 3.7% |
| 45 to 59 Minutes | 32 | 1.8% |
| 60 to 89 Minutes | 0 | 0.0% |
| 90 or more Minutes | 59 | 3.2% |
Commute Time by Sex in Omro
The most common commute times in Omro are 15 to 19 minutes (303 commuters, 35.0%) for males and 15 to 19 minutes (364 commuters, 38.2%) for females.
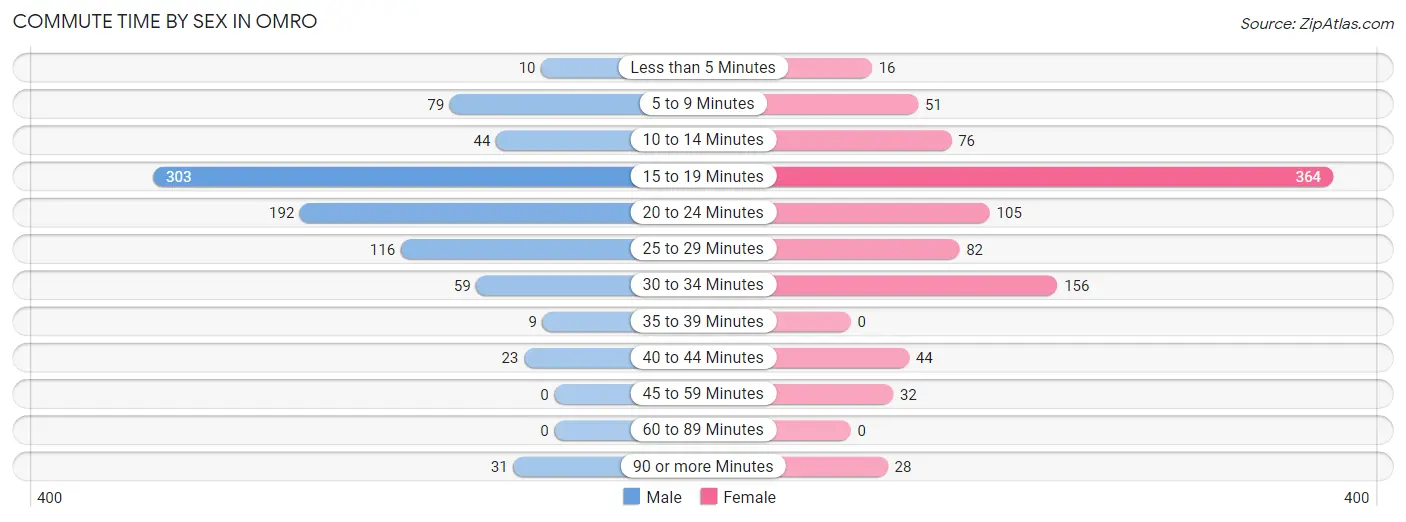
| Commute Time | Male | Female |
| Less than 5 Minutes | 10 (1.1%) | 16 (1.7%) |
| 5 to 9 Minutes | 79 (9.1%) | 51 (5.3%) |
| 10 to 14 Minutes | 44 (5.1%) | 76 (8.0%) |
| 15 to 19 Minutes | 303 (35.0%) | 364 (38.2%) |
| 20 to 24 Minutes | 192 (22.2%) | 105 (11.0%) |
| 25 to 29 Minutes | 116 (13.4%) | 82 (8.6%) |
| 30 to 34 Minutes | 59 (6.8%) | 156 (16.4%) |
| 35 to 39 Minutes | 9 (1.0%) | 0 (0.0%) |
| 40 to 44 Minutes | 23 (2.7%) | 44 (4.6%) |
| 45 to 59 Minutes | 0 (0.0%) | 32 (3.4%) |
| 60 to 89 Minutes | 0 (0.0%) | 0 (0.0%) |
| 90 or more Minutes | 31 (3.6%) | 28 (2.9%) |
Time of Departure to Work by Sex in Omro
The most frequent times of departure to work in Omro are 12:00 PM to 3:59 PM (178, 20.5%) for males and 6:30 AM to 6:59 AM (282, 29.6%) for females.
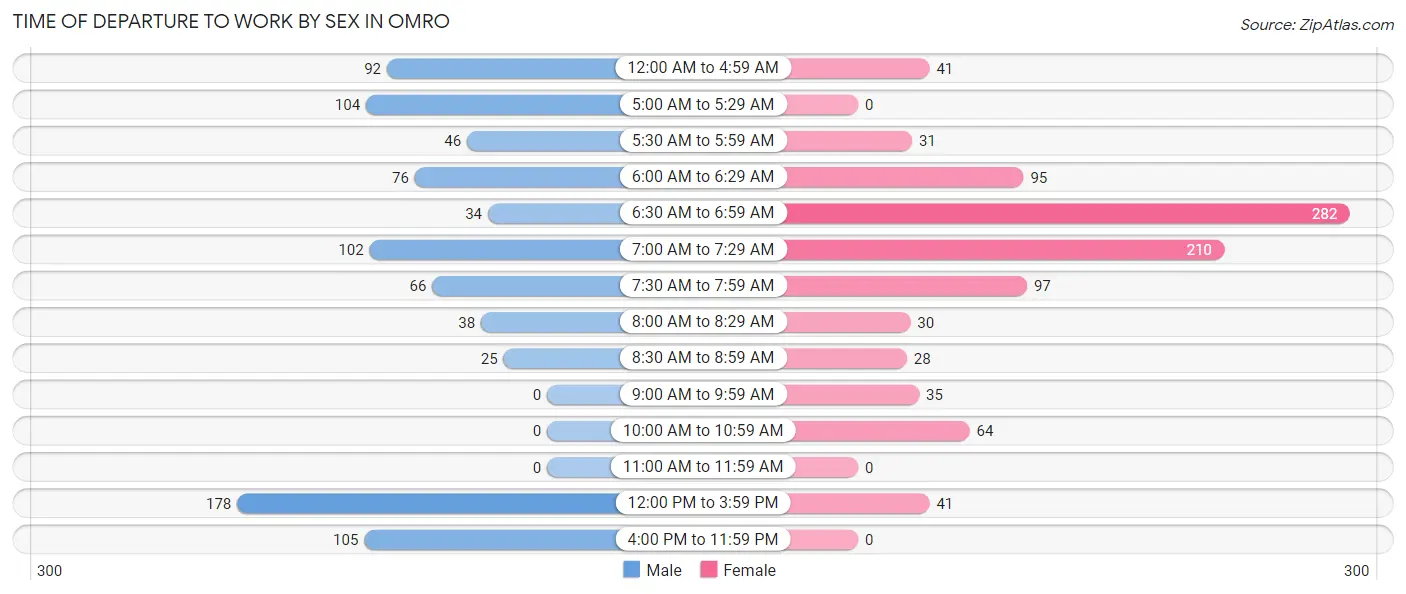
| Time of Departure | Male | Female |
| 12:00 AM to 4:59 AM | 92 (10.6%) | 41 (4.3%) |
| 5:00 AM to 5:29 AM | 104 (12.0%) | 0 (0.0%) |
| 5:30 AM to 5:59 AM | 46 (5.3%) | 31 (3.3%) |
| 6:00 AM to 6:29 AM | 76 (8.8%) | 95 (10.0%) |
| 6:30 AM to 6:59 AM | 34 (3.9%) | 282 (29.6%) |
| 7:00 AM to 7:29 AM | 102 (11.8%) | 210 (22.0%) |
| 7:30 AM to 7:59 AM | 66 (7.6%) | 97 (10.2%) |
| 8:00 AM to 8:29 AM | 38 (4.4%) | 30 (3.1%) |
| 8:30 AM to 8:59 AM | 25 (2.9%) | 28 (2.9%) |
| 9:00 AM to 9:59 AM | 0 (0.0%) | 35 (3.7%) |
| 10:00 AM to 10:59 AM | 0 (0.0%) | 64 (6.7%) |
| 11:00 AM to 11:59 AM | 0 (0.0%) | 0 (0.0%) |
| 12:00 PM to 3:59 PM | 178 (20.5%) | 41 (4.3%) |
| 4:00 PM to 11:59 PM | 105 (12.1%) | 0 (0.0%) |
| Total | 866 (100.0%) | 954 (100.0%) |
Housing Occupancy in Omro
Occupancy by Ownership in Omro
Of the total 1,614 dwellings in Omro, owner-occupied units account for 1,156 (71.6%), while renter-occupied units make up 458 (28.4%).
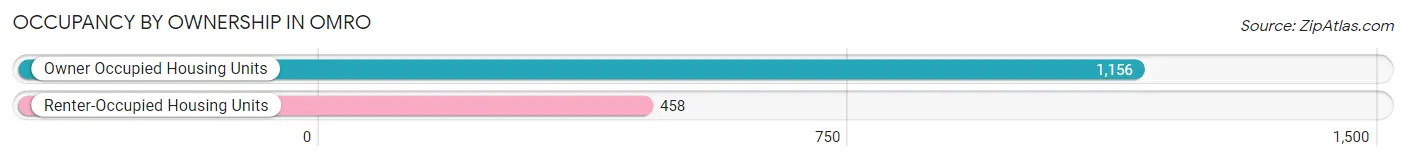
| Occupancy | # Housing Units | % Housing Units |
| Owner Occupied Housing Units | 1,156 | 71.6% |
| Renter-Occupied Housing Units | 458 | 28.4% |
| Total Occupied Housing Units | 1,614 | 100.0% |
Occupancy by Household Size in Omro
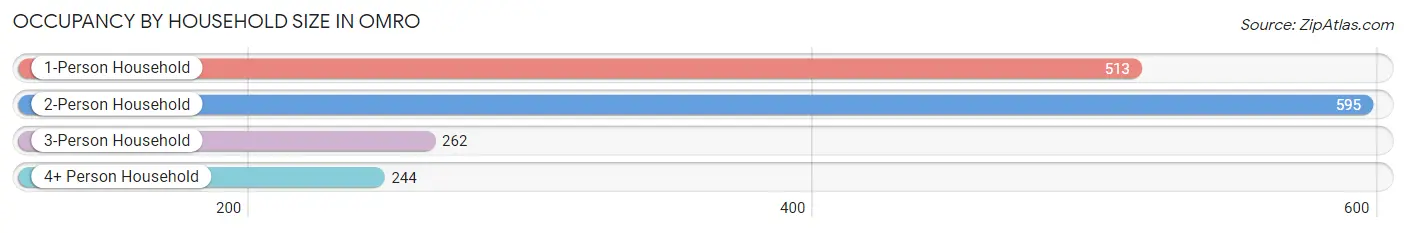
| Household Size | # Housing Units | % Housing Units |
| 1-Person Household | 513 | 31.8% |
| 2-Person Household | 595 | 36.9% |
| 3-Person Household | 262 | 16.2% |
| 4+ Person Household | 244 | 15.1% |
| Total Housing Units | 1,614 | 100.0% |
Occupancy by Ownership by Household Size in Omro
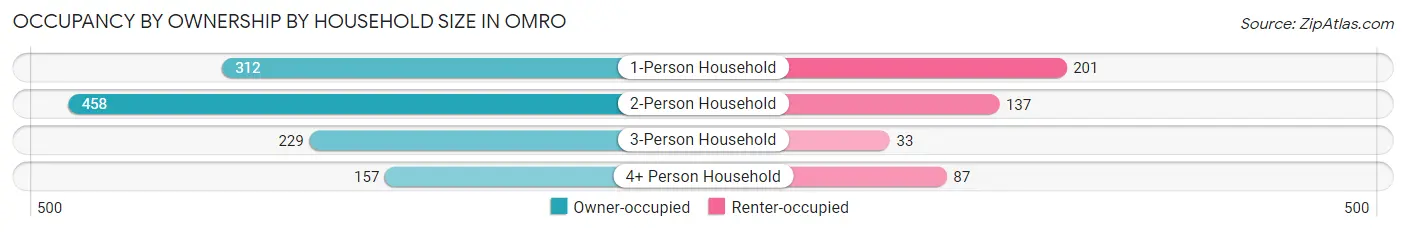
| Household Size | Owner-occupied | Renter-occupied |
| 1-Person Household | 312 (60.8%) | 201 (39.2%) |
| 2-Person Household | 458 (77.0%) | 137 (23.0%) |
| 3-Person Household | 229 (87.4%) | 33 (12.6%) |
| 4+ Person Household | 157 (64.3%) | 87 (35.7%) |
| Total Housing Units | 1,156 (71.6%) | 458 (28.4%) |
Occupancy by Educational Attainment in Omro
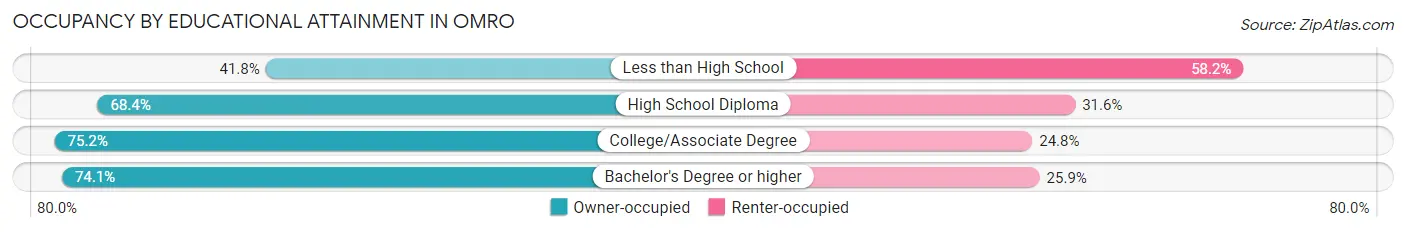
| Household Size | Owner-occupied | Renter-occupied |
| Less than High School | 28 (41.8%) | 39 (58.2%) |
| High School Diploma | 310 (68.4%) | 143 (31.6%) |
| College/Associate Degree | 498 (75.2%) | 164 (24.8%) |
| Bachelor's Degree or higher | 320 (74.1%) | 112 (25.9%) |
Occupancy by Age of Householder in Omro
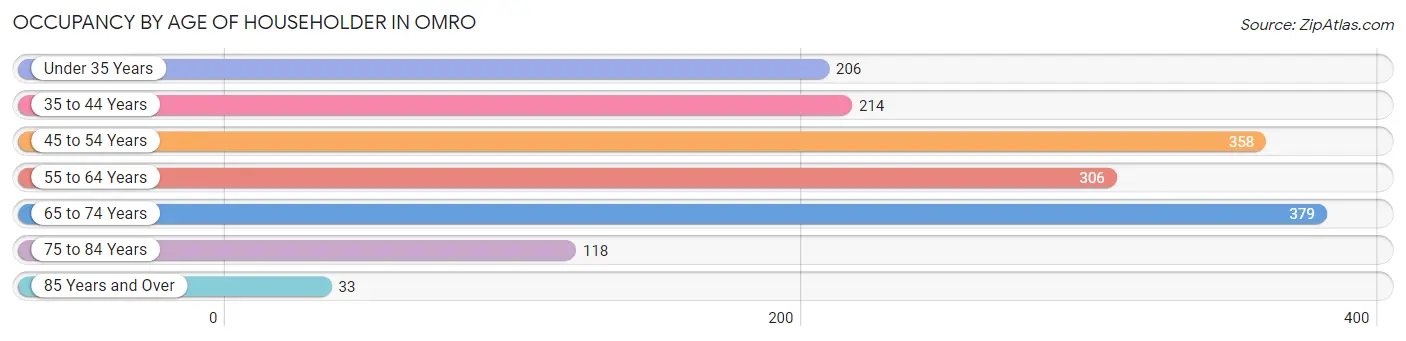
| Age Bracket | # Households | % Households |
| Under 35 Years | 206 | 12.8% |
| 35 to 44 Years | 214 | 13.3% |
| 45 to 54 Years | 358 | 22.2% |
| 55 to 64 Years | 306 | 19.0% |
| 65 to 74 Years | 379 | 23.5% |
| 75 to 84 Years | 118 | 7.3% |
| 85 Years and Over | 33 | 2.0% |
| Total | 1,614 | 100.0% |
Housing Finances in Omro
Median Income by Occupancy in Omro
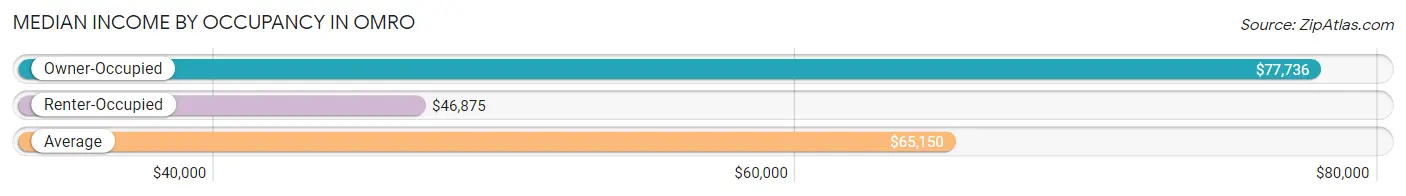
| Occupancy Type | # Households | Median Income |
| Owner-Occupied | 1,156 (71.6%) | $77,736 |
| Renter-Occupied | 458 (28.4%) | $46,875 |
| Average | 1,614 (100.0%) | $65,150 |
Occupancy by Householder Income Bracket in Omro
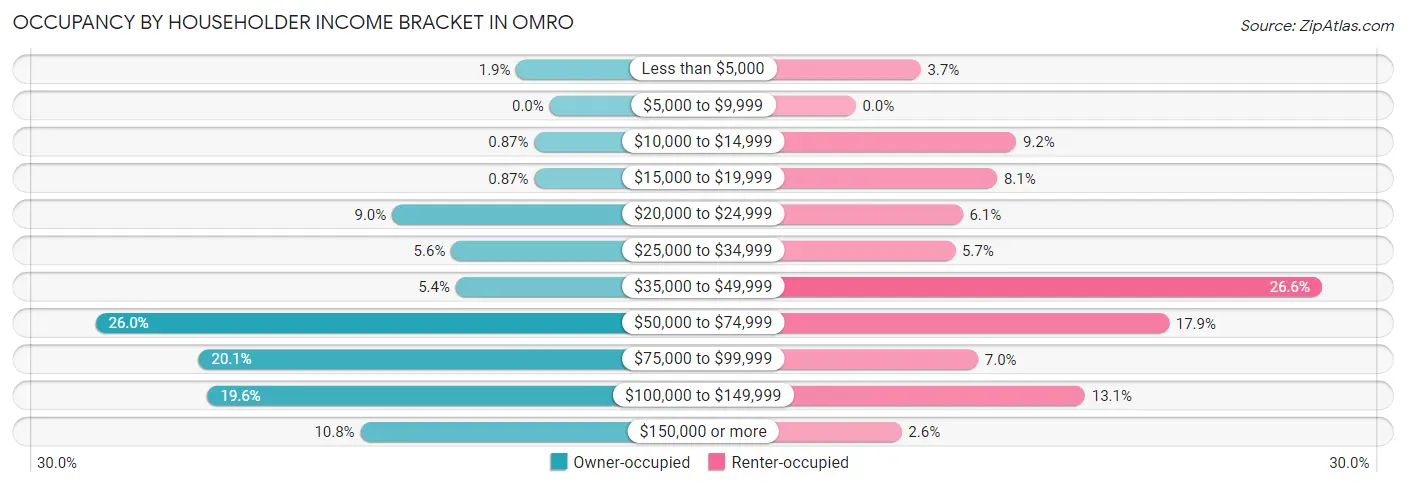
| Income Bracket | Owner-occupied | Renter-occupied |
| Less than $5,000 | 22 (1.9%) | 17 (3.7%) |
| $5,000 to $9,999 | 0 (0.0%) | 0 (0.0%) |
| $10,000 to $14,999 | 10 (0.9%) | 42 (9.2%) |
| $15,000 to $19,999 | 10 (0.9%) | 37 (8.1%) |
| $20,000 to $24,999 | 104 (9.0%) | 28 (6.1%) |
| $25,000 to $34,999 | 65 (5.6%) | 26 (5.7%) |
| $35,000 to $49,999 | 62 (5.4%) | 122 (26.6%) |
| $50,000 to $74,999 | 300 (26.0%) | 82 (17.9%) |
| $75,000 to $99,999 | 232 (20.1%) | 32 (7.0%) |
| $100,000 to $149,999 | 226 (19.6%) | 60 (13.1%) |
| $150,000 or more | 125 (10.8%) | 12 (2.6%) |
| Total | 1,156 (100.0%) | 458 (100.0%) |
Monthly Housing Cost Tiers in Omro
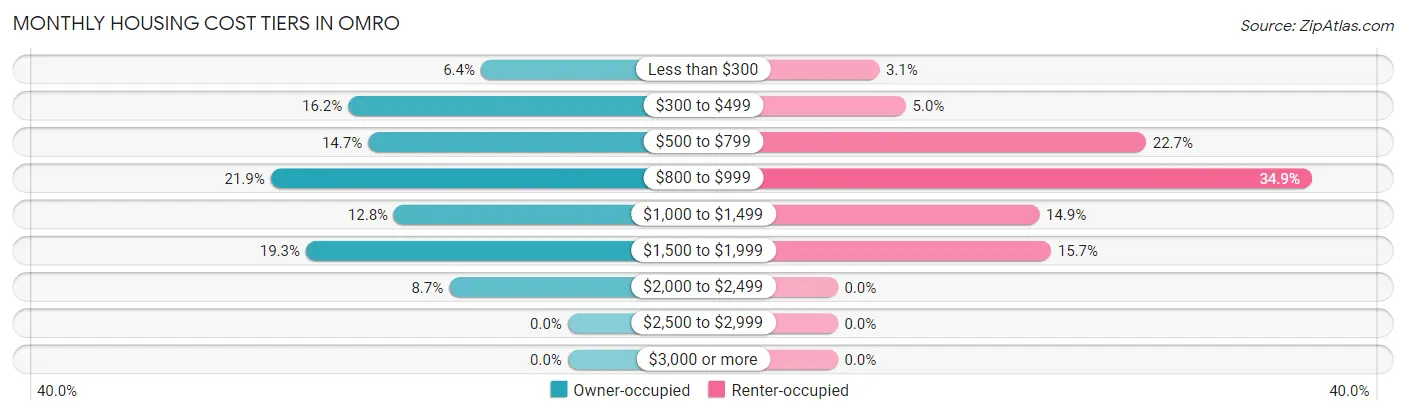
| Monthly Cost | Owner-occupied | Renter-occupied |
| Less than $300 | 74 (6.4%) | 14 (3.1%) |
| $300 to $499 | 187 (16.2%) | 23 (5.0%) |
| $500 to $799 | 170 (14.7%) | 104 (22.7%) |
| $800 to $999 | 253 (21.9%) | 160 (34.9%) |
| $1,000 to $1,499 | 148 (12.8%) | 68 (14.8%) |
| $1,500 to $1,999 | 223 (19.3%) | 72 (15.7%) |
| $2,000 to $2,499 | 101 (8.7%) | 0 (0.0%) |
| $2,500 to $2,999 | 0 (0.0%) | 0 (0.0%) |
| $3,000 or more | 0 (0.0%) | 0 (0.0%) |
| Total | 1,156 (100.0%) | 458 (100.0%) |
Physical Housing Characteristics in Omro
Housing Structures in Omro
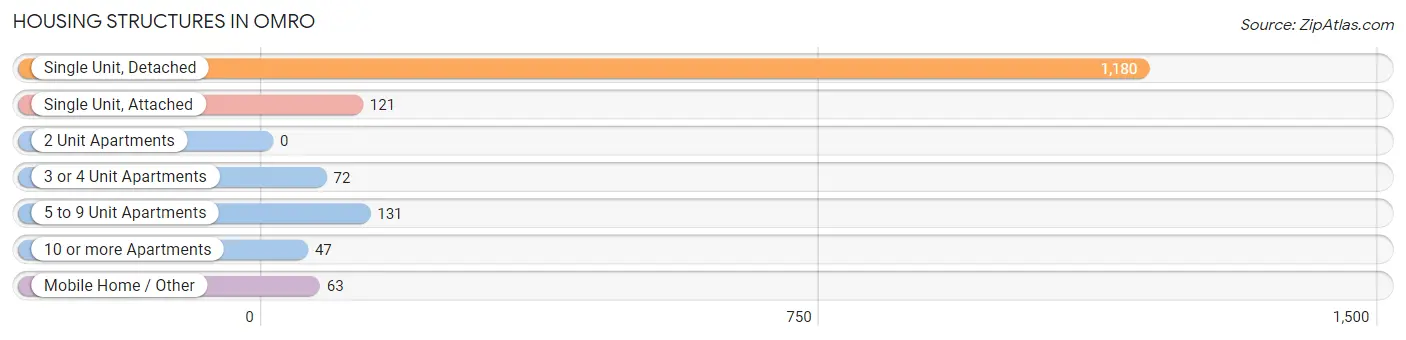
| Structure Type | # Housing Units | % Housing Units |
| Single Unit, Detached | 1,180 | 73.1% |
| Single Unit, Attached | 121 | 7.5% |
| 2 Unit Apartments | 0 | 0.0% |
| 3 or 4 Unit Apartments | 72 | 4.5% |
| 5 to 9 Unit Apartments | 131 | 8.1% |
| 10 or more Apartments | 47 | 2.9% |
| Mobile Home / Other | 63 | 3.9% |
| Total | 1,614 | 100.0% |
Housing Structures by Occupancy in Omro
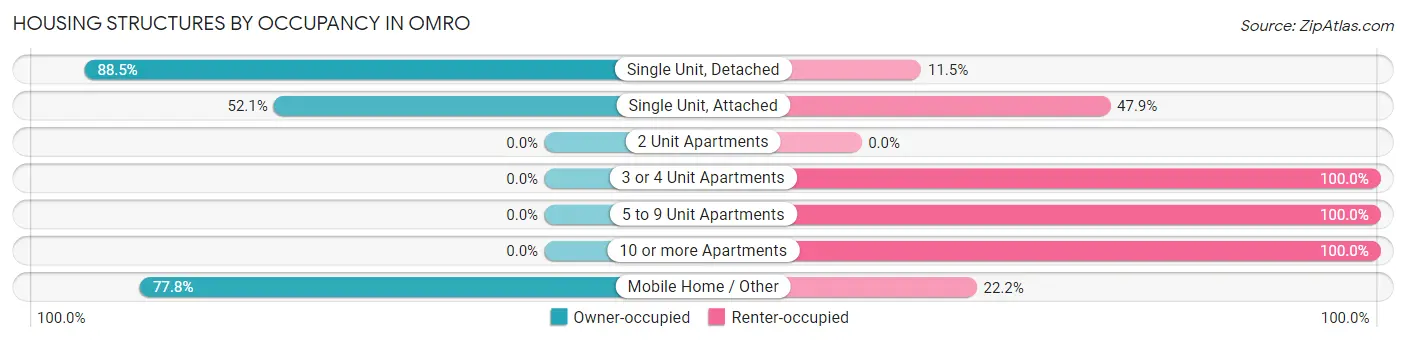
| Structure Type | Owner-occupied | Renter-occupied |
| Single Unit, Detached | 1,044 (88.5%) | 136 (11.5%) |
| Single Unit, Attached | 63 (52.1%) | 58 (47.9%) |
| 2 Unit Apartments | 0 (0.0%) | 0 (0.0%) |
| 3 or 4 Unit Apartments | 0 (0.0%) | 72 (100.0%) |
| 5 to 9 Unit Apartments | 0 (0.0%) | 131 (100.0%) |
| 10 or more Apartments | 0 (0.0%) | 47 (100.0%) |
| Mobile Home / Other | 49 (77.8%) | 14 (22.2%) |
| Total | 1,156 (71.6%) | 458 (28.4%) |
Housing Structures by Number of Rooms in Omro
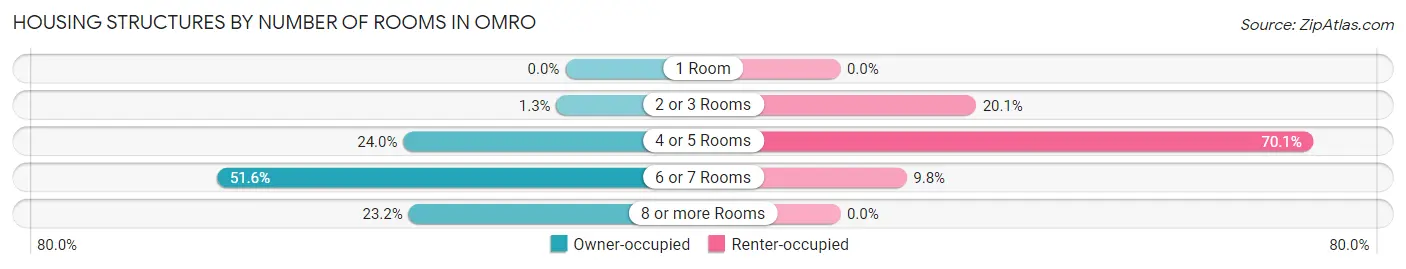
| Number of Rooms | Owner-occupied | Renter-occupied |
| 1 Room | 0 (0.0%) | 0 (0.0%) |
| 2 or 3 Rooms | 15 (1.3%) | 92 (20.1%) |
| 4 or 5 Rooms | 277 (24.0%) | 321 (70.1%) |
| 6 or 7 Rooms | 596 (51.6%) | 45 (9.8%) |
| 8 or more Rooms | 268 (23.2%) | 0 (0.0%) |
| Total | 1,156 (100.0%) | 458 (100.0%) |
Housing Structure by Heating Type in Omro
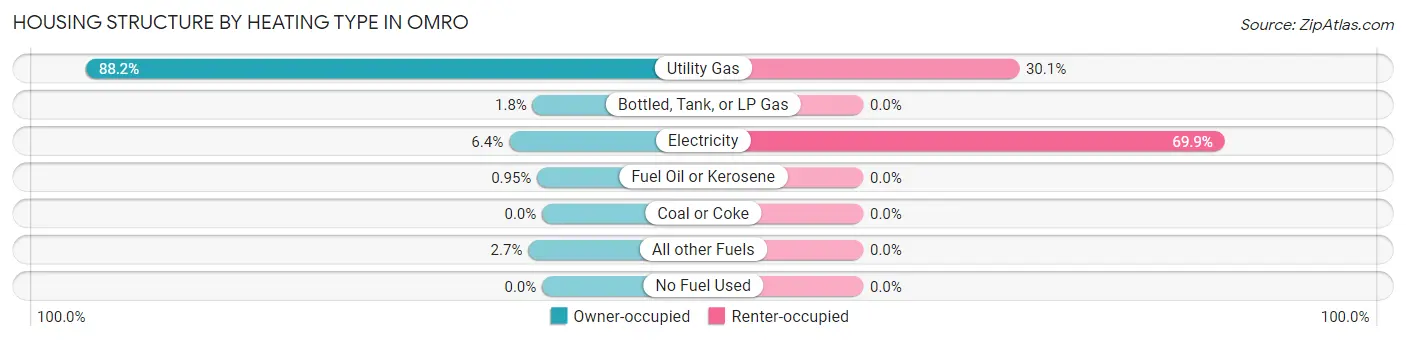
| Heating Type | Owner-occupied | Renter-occupied |
| Utility Gas | 1,019 (88.1%) | 138 (30.1%) |
| Bottled, Tank, or LP Gas | 21 (1.8%) | 0 (0.0%) |
| Electricity | 74 (6.4%) | 320 (69.9%) |
| Fuel Oil or Kerosene | 11 (0.9%) | 0 (0.0%) |
| Coal or Coke | 0 (0.0%) | 0 (0.0%) |
| All other Fuels | 31 (2.7%) | 0 (0.0%) |
| No Fuel Used | 0 (0.0%) | 0 (0.0%) |
| Total | 1,156 (100.0%) | 458 (100.0%) |
Household Vehicle Usage in Omro
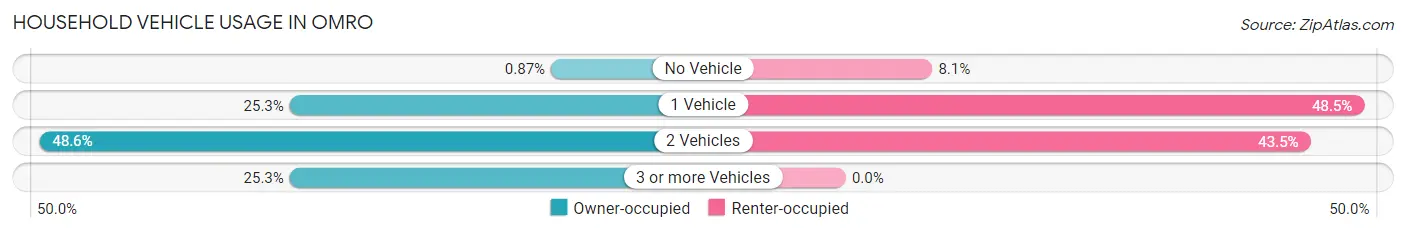
| Vehicles per Household | Owner-occupied | Renter-occupied |
| No Vehicle | 10 (0.9%) | 37 (8.1%) |
| 1 Vehicle | 292 (25.3%) | 222 (48.5%) |
| 2 Vehicles | 562 (48.6%) | 199 (43.4%) |
| 3 or more Vehicles | 292 (25.3%) | 0 (0.0%) |
| Total | 1,156 (100.0%) | 458 (100.0%) |
Real Estate & Mortgages in Omro
Real Estate and Mortgage Overview in Omro
| Characteristic | Without Mortgage | With Mortgage |
| Housing Units | 553 | 603 |
| Median Property Value | $121,300 | $188,000 |
| Median Household Income | $53,016 | $115 |
| Monthly Housing Costs | $542 | $0 |
| Real Estate Taxes | $3,214 | $0 |
Property Value by Mortgage Status in Omro
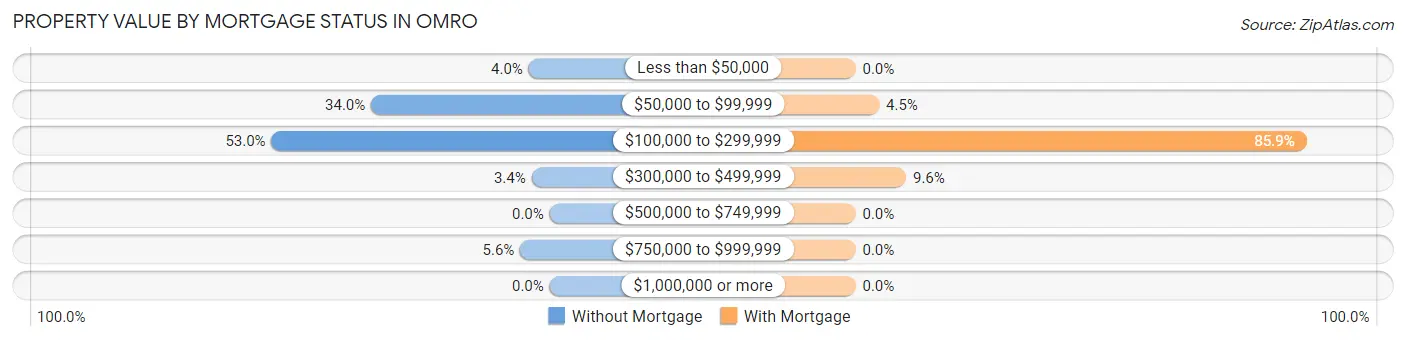
| Property Value | Without Mortgage | With Mortgage |
| Less than $50,000 | 22 (4.0%) | 0 (0.0%) |
| $50,000 to $99,999 | 188 (34.0%) | 27 (4.5%) |
| $100,000 to $299,999 | 293 (53.0%) | 518 (85.9%) |
| $300,000 to $499,999 | 19 (3.4%) | 58 (9.6%) |
| $500,000 to $749,999 | 0 (0.0%) | 0 (0.0%) |
| $750,000 to $999,999 | 31 (5.6%) | 0 (0.0%) |
| $1,000,000 or more | 0 (0.0%) | 0 (0.0%) |
| Total | 553 (100.0%) | 603 (100.0%) |
Household Income by Mortgage Status in Omro
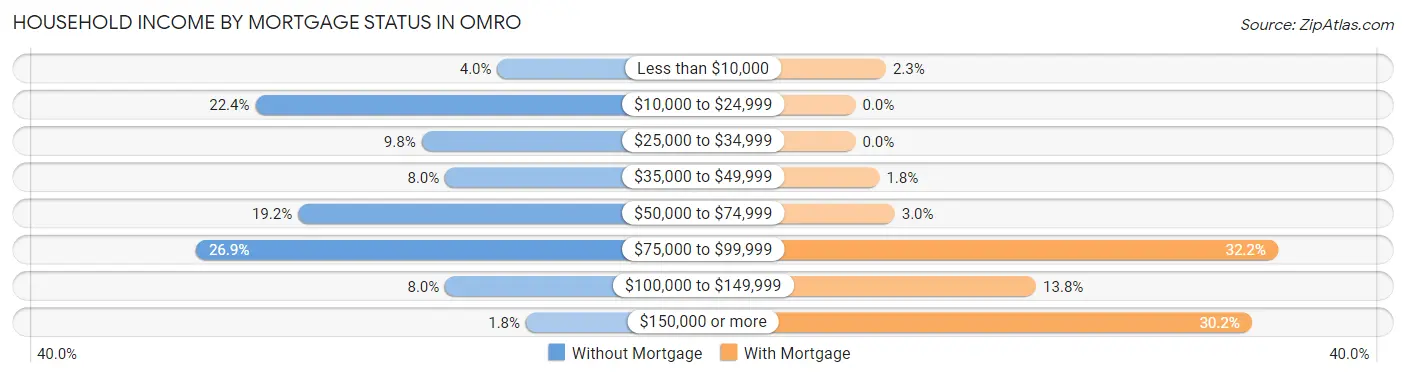
| Household Income | Without Mortgage | With Mortgage |
| Less than $10,000 | 22 (4.0%) | 14 (2.3%) |
| $10,000 to $24,999 | 124 (22.4%) | 0 (0.0%) |
| $25,000 to $34,999 | 54 (9.8%) | 0 (0.0%) |
| $35,000 to $49,999 | 44 (8.0%) | 11 (1.8%) |
| $50,000 to $74,999 | 106 (19.2%) | 18 (3.0%) |
| $75,000 to $99,999 | 149 (26.9%) | 194 (32.2%) |
| $100,000 to $149,999 | 44 (8.0%) | 83 (13.8%) |
| $150,000 or more | 10 (1.8%) | 182 (30.2%) |
| Total | 553 (100.0%) | 603 (100.0%) |
Property Value to Household Income Ratio in Omro
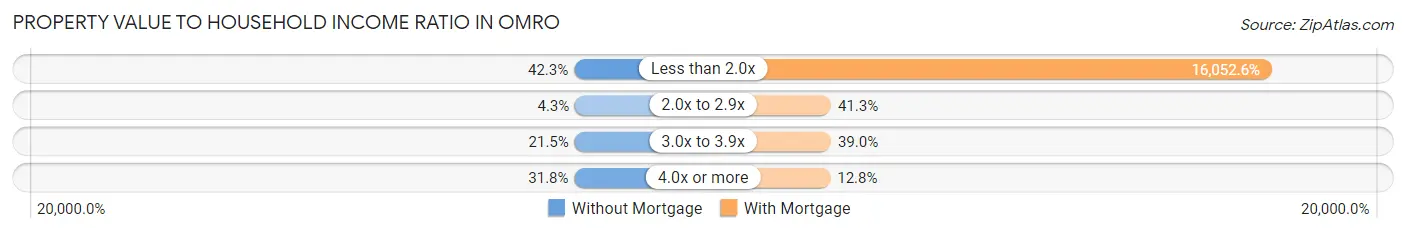
| Value-to-Income Ratio | Without Mortgage | With Mortgage |
| Less than 2.0x | 234 (42.3%) | 96,797 (16,052.6%) |
| 2.0x to 2.9x | 24 (4.3%) | 249 (41.3%) |
| 3.0x to 3.9x | 119 (21.5%) | 235 (39.0%) |
| 4.0x or more | 176 (31.8%) | 77 (12.8%) |
| Total | 553 (100.0%) | 603 (100.0%) |
Real Estate Taxes by Mortgage Status in Omro
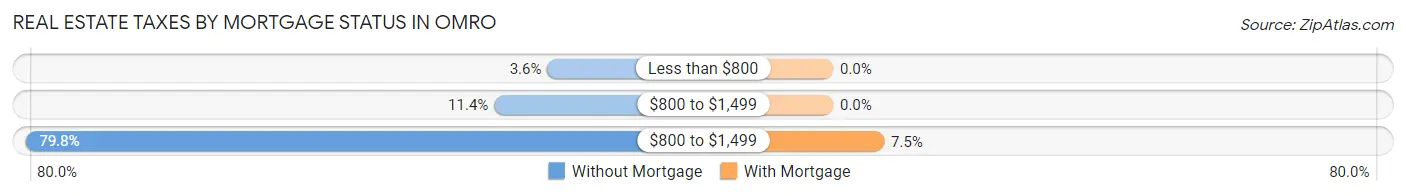
| Property Taxes | Without Mortgage | With Mortgage |
| Less than $800 | 20 (3.6%) | 0 (0.0%) |
| $800 to $1,499 | 63 (11.4%) | 0 (0.0%) |
| $800 to $1,499 | 441 (79.7%) | 45 (7.5%) |
| Total | 553 (100.0%) | 603 (100.0%) |
Health & Disability in Omro
Health Insurance Coverage by Age in Omro
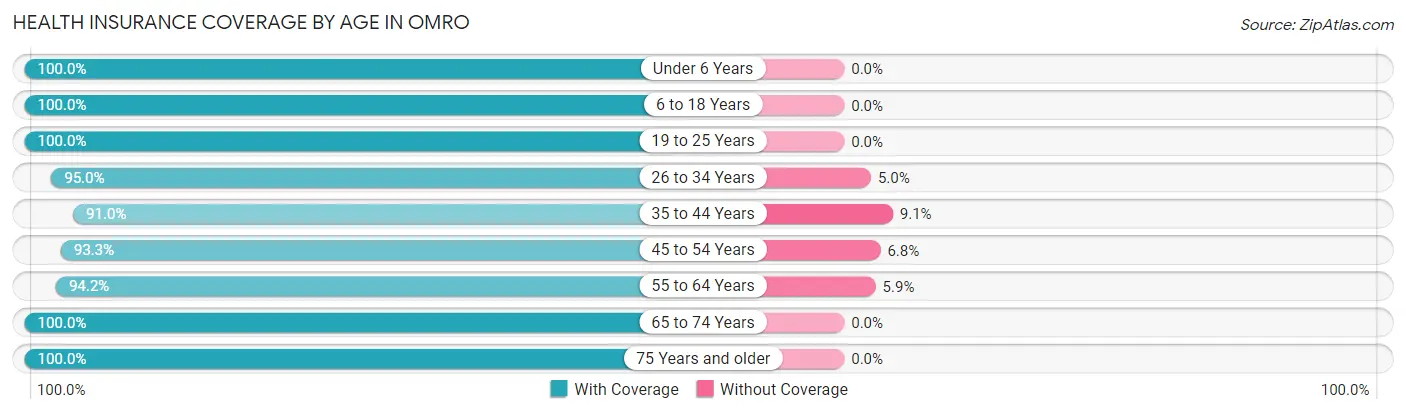
| Age Bracket | With Coverage | Without Coverage |
| Under 6 Years | 229 (100.0%) | 0 (0.0%) |
| 6 to 18 Years | 635 (100.0%) | 0 (0.0%) |
| 19 to 25 Years | 243 (100.0%) | 0 (0.0%) |
| 26 to 34 Years | 286 (95.0%) | 15 (5.0%) |
| 35 to 44 Years | 412 (90.9%) | 41 (9.0%) |
| 45 to 54 Years | 566 (93.2%) | 41 (6.8%) |
| 55 to 64 Years | 402 (94.2%) | 25 (5.9%) |
| 65 to 74 Years | 510 (100.0%) | 0 (0.0%) |
| 75 Years and older | 194 (100.0%) | 0 (0.0%) |
| Total | 3,477 (96.6%) | 122 (3.4%) |
Health Insurance Coverage by Citizenship Status in Omro
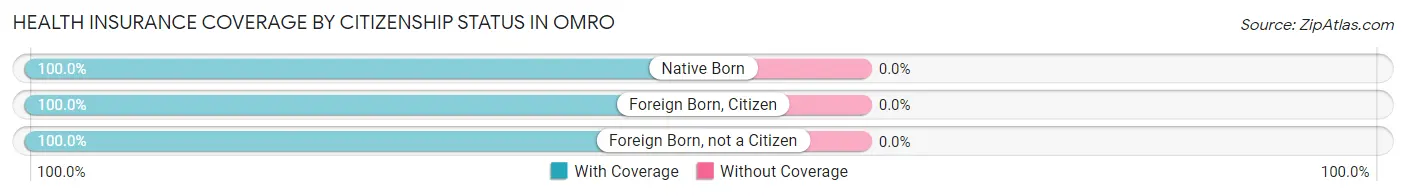
| Citizenship Status | With Coverage | Without Coverage |
| Native Born | 229 (100.0%) | 0 (0.0%) |
| Foreign Born, Citizen | 635 (100.0%) | 0 (0.0%) |
| Foreign Born, not a Citizen | 243 (100.0%) | 0 (0.0%) |
Health Insurance Coverage by Household Income in Omro
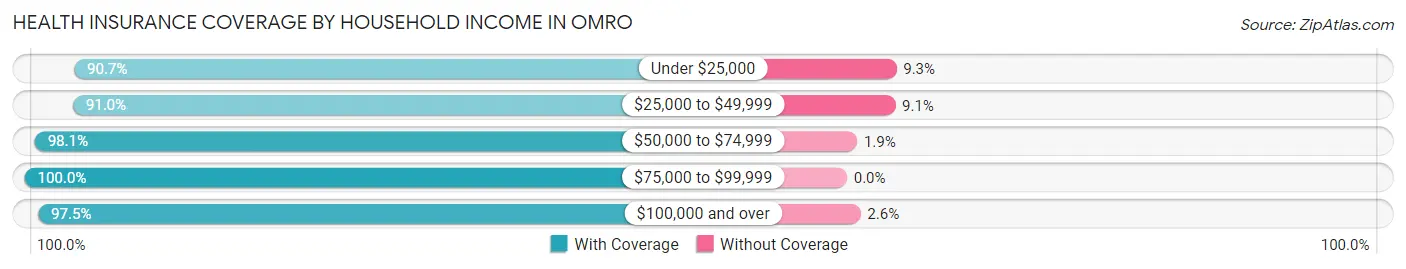
| Household Income | With Coverage | Without Coverage |
| Under $25,000 | 284 (90.7%) | 29 (9.3%) |
| $25,000 to $49,999 | 402 (90.9%) | 40 (9.0%) |
| $50,000 to $74,999 | 977 (98.1%) | 19 (1.9%) |
| $75,000 to $99,999 | 517 (100.0%) | 0 (0.0%) |
| $100,000 and over | 1,297 (97.5%) | 34 (2.5%) |
Public vs Private Health Insurance Coverage by Age in Omro
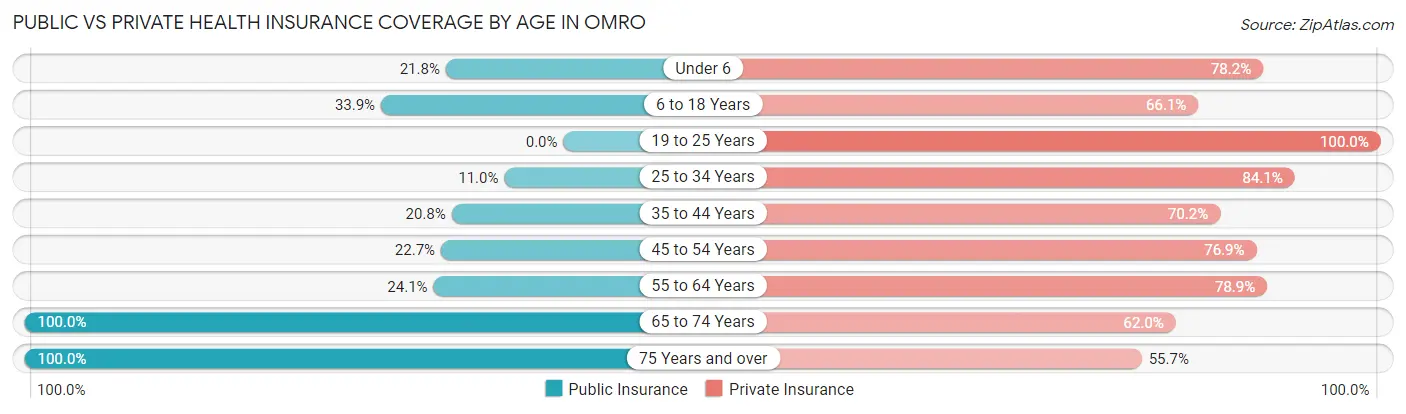
| Age Bracket | Public Insurance | Private Insurance |
| Under 6 | 50 (21.8%) | 179 (78.2%) |
| 6 to 18 Years | 215 (33.9%) | 420 (66.1%) |
| 19 to 25 Years | 0 (0.0%) | 243 (100.0%) |
| 25 to 34 Years | 33 (11.0%) | 253 (84.1%) |
| 35 to 44 Years | 94 (20.7%) | 318 (70.2%) |
| 45 to 54 Years | 138 (22.7%) | 467 (76.9%) |
| 55 to 64 Years | 103 (24.1%) | 337 (78.9%) |
| 65 to 74 Years | 510 (100.0%) | 316 (62.0%) |
| 75 Years and over | 194 (100.0%) | 108 (55.7%) |
| Total | 1,337 (37.1%) | 2,641 (73.4%) |
Disability Status by Sex by Age in Omro
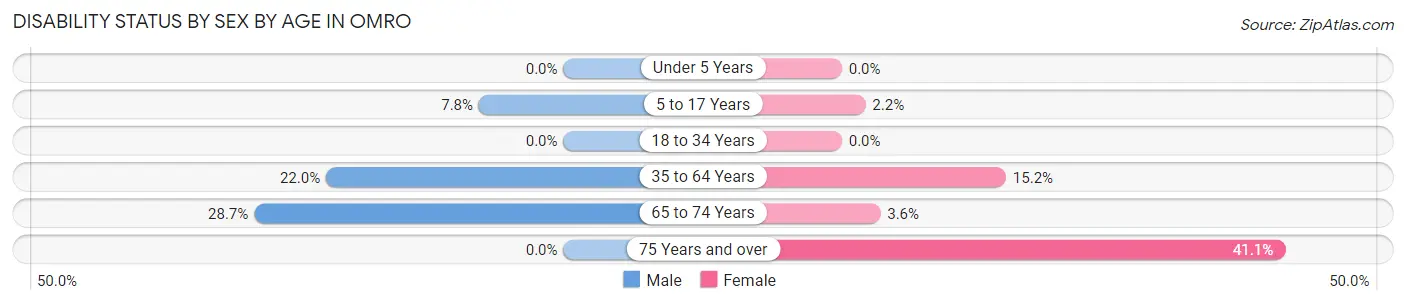
| Age Bracket | Male | Female |
| Under 5 Years | 0 (0.0%) | 0 (0.0%) |
| 5 to 17 Years | 28 (7.8%) | 6 (2.2%) |
| 18 to 34 Years | 0 (0.0%) | 0 (0.0%) |
| 35 to 64 Years | 167 (22.0%) | 111 (15.2%) |
| 65 to 74 Years | 66 (28.7%) | 10 (3.6%) |
| 75 Years and over | 0 (0.0%) | 58 (41.1%) |
Disability Class by Sex by Age in Omro
Disability Class: Hearing Difficulty
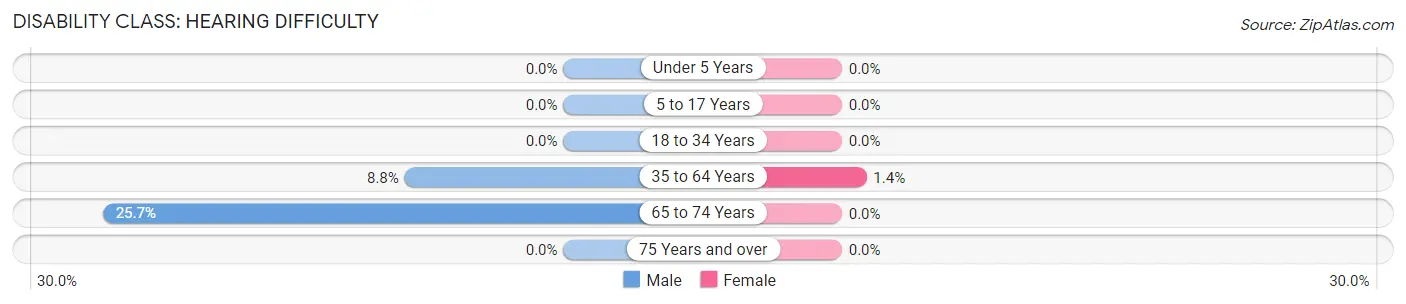
| Age Bracket | Male | Female |
| Under 5 Years | 0 (0.0%) | 0 (0.0%) |
| 5 to 17 Years | 0 (0.0%) | 0 (0.0%) |
| 18 to 34 Years | 0 (0.0%) | 0 (0.0%) |
| 35 to 64 Years | 67 (8.8%) | 10 (1.4%) |
| 65 to 74 Years | 59 (25.7%) | 0 (0.0%) |
| 75 Years and over | 0 (0.0%) | 0 (0.0%) |
Disability Class: Vision Difficulty
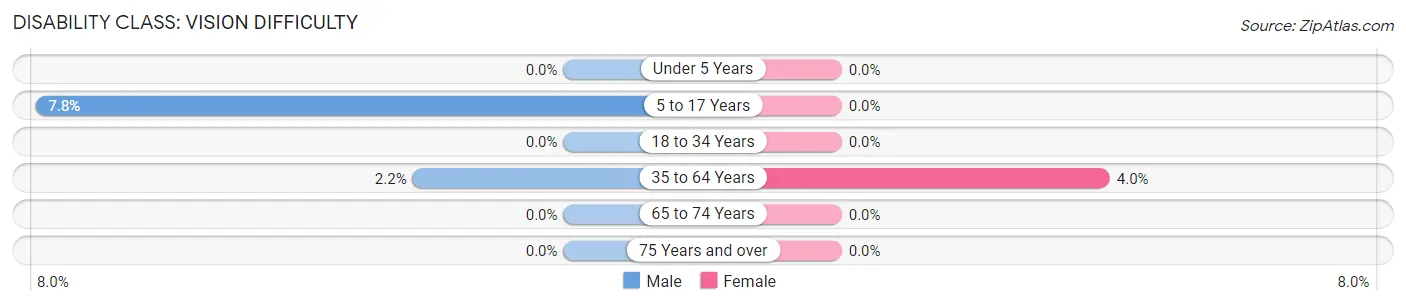
| Age Bracket | Male | Female |
| Under 5 Years | 0 (0.0%) | 0 (0.0%) |
| 5 to 17 Years | 28 (7.8%) | 0 (0.0%) |
| 18 to 34 Years | 0 (0.0%) | 0 (0.0%) |
| 35 to 64 Years | 17 (2.2%) | 29 (4.0%) |
| 65 to 74 Years | 0 (0.0%) | 0 (0.0%) |
| 75 Years and over | 0 (0.0%) | 0 (0.0%) |
Disability Class: Cognitive Difficulty
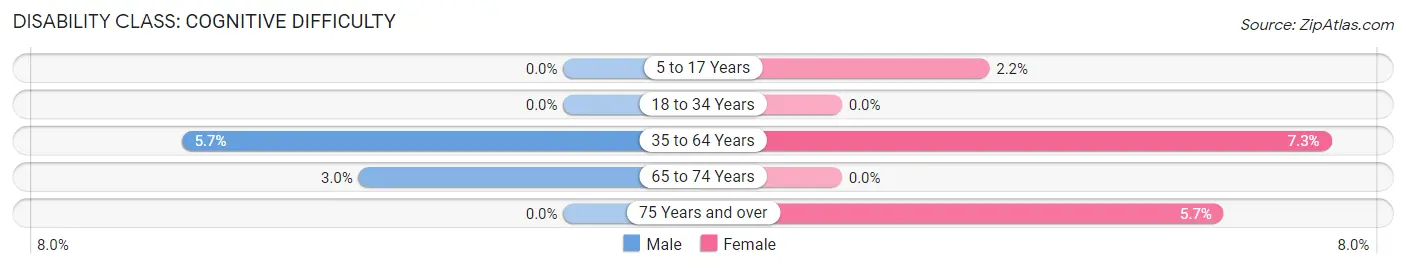
| Age Bracket | Male | Female |
| 5 to 17 Years | 0 (0.0%) | 6 (2.2%) |
| 18 to 34 Years | 0 (0.0%) | 0 (0.0%) |
| 35 to 64 Years | 43 (5.7%) | 53 (7.3%) |
| 65 to 74 Years | 7 (3.0%) | 0 (0.0%) |
| 75 Years and over | 0 (0.0%) | 8 (5.7%) |
Disability Class: Ambulatory Difficulty
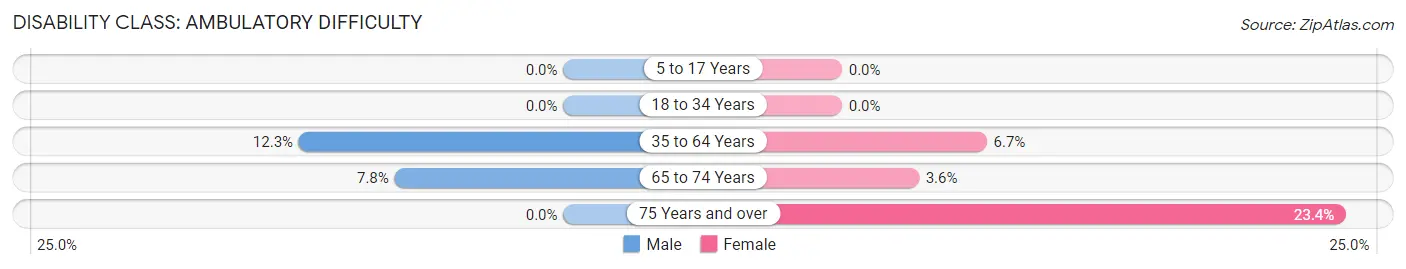
| Age Bracket | Male | Female |
| 5 to 17 Years | 0 (0.0%) | 0 (0.0%) |
| 18 to 34 Years | 0 (0.0%) | 0 (0.0%) |
| 35 to 64 Years | 93 (12.3%) | 49 (6.7%) |
| 65 to 74 Years | 18 (7.8%) | 10 (3.6%) |
| 75 Years and over | 0 (0.0%) | 33 (23.4%) |
Disability Class: Self-Care Difficulty
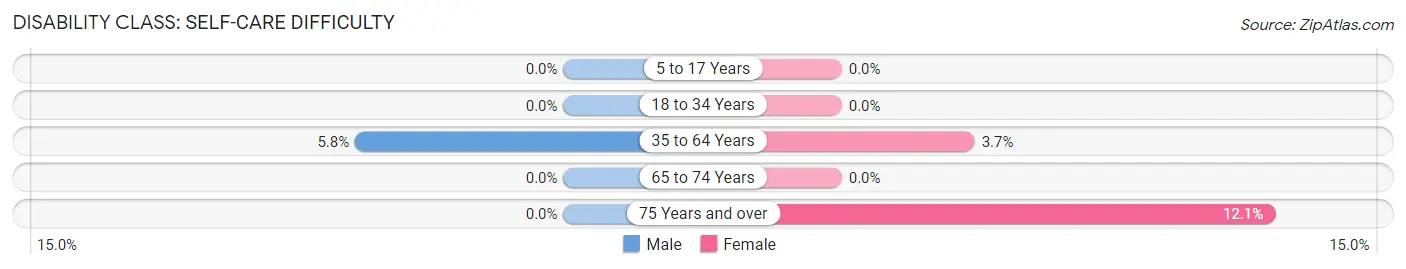
| Age Bracket | Male | Female |
| 5 to 17 Years | 0 (0.0%) | 0 (0.0%) |
| 18 to 34 Years | 0 (0.0%) | 0 (0.0%) |
| 35 to 64 Years | 44 (5.8%) | 27 (3.7%) |
| 65 to 74 Years | 0 (0.0%) | 0 (0.0%) |
| 75 Years and over | 0 (0.0%) | 17 (12.1%) |
Technology Access in Omro
Computing Device Access in Omro
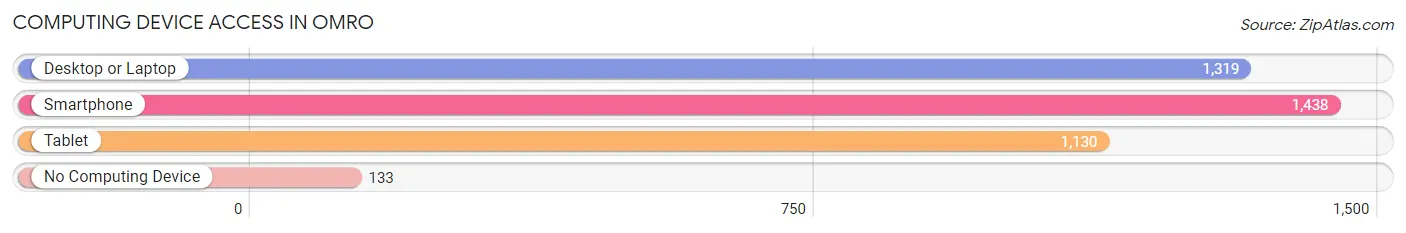
| Device Type | # Households | % Households |
| Desktop or Laptop | 1,319 | 81.7% |
| Smartphone | 1,438 | 89.1% |
| Tablet | 1,130 | 70.0% |
| No Computing Device | 133 | 8.2% |
| Total | 1,614 | 100.0% |
Internet Access in Omro
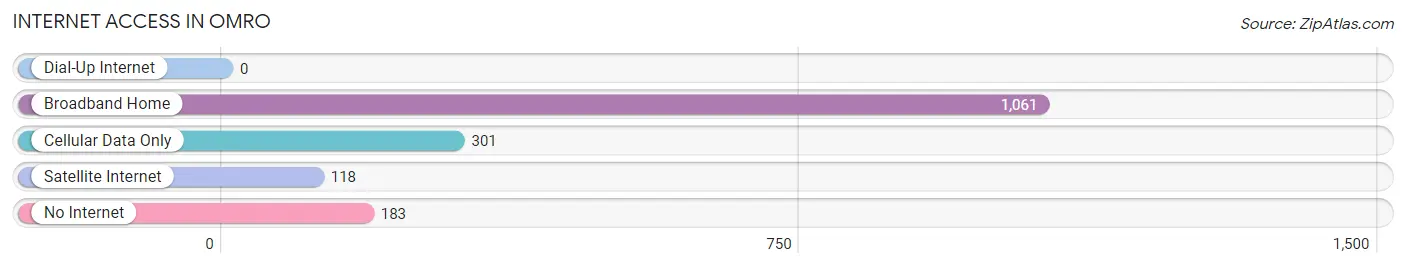
| Internet Type | # Households | % Households |
| Dial-Up Internet | 0 | 0.0% |
| Broadband Home | 1,061 | 65.7% |
| Cellular Data Only | 301 | 18.6% |
| Satellite Internet | 118 | 7.3% |
| No Internet | 183 | 11.3% |
| Total | 1,614 | 100.0% |
Omro Summary
Omro, Wisconsin is a small city located in Winnebago County, Wisconsin. It is situated on the Fox River, about 25 miles southwest of Green Bay. The city has a population of 3,711 people, according to the 2010 census.
History
Omro was first settled in 1848 by a group of German immigrants. The city was originally known as “Omro Station”, and was named after the nearby Omro Indian Agency. The city was officially incorporated in 1883.
In the late 19th century, Omro was a major center for the lumber industry. The city was home to several sawmills, and the lumber was used to build homes and other structures throughout the region.
In the early 20th century, Omro was a major center for the dairy industry. The city was home to several cheese factories, and the milk was used to make cheese and other dairy products.
Geography
Omro is located in the Fox Valley region of Wisconsin. The city is situated on the Fox River, about 25 miles southwest of Green Bay. The city is surrounded by rolling hills and farmland.
The climate in Omro is classified as humid continental, with warm summers and cold winters. The average temperature in the summer is around 70 degrees Fahrenheit, and the average temperature in the winter is around 20 degrees Fahrenheit.
Economy
Omro’s economy is largely based on agriculture and manufacturing. The city is home to several dairy farms, as well as several manufacturing companies. The city is also home to several retail stores, restaurants, and other businesses.
Demographics
According to the 2010 census, Omro has a population of 3,711 people. The racial makeup of the city is 94.3% White, 0.7% African American, 0.3% Native American, 0.4% Asian, 0.1% Pacific Islander, 2.2% from other races, and 2.1% from two or more races.
The median household income in Omro is $45,945, and the median family income is $54,945. The per capita income in the city is $21,945.
Conclusion
Omro, Wisconsin is a small city located in Winnebago County, Wisconsin. It is situated on the Fox River, about 25 miles southwest of Green Bay. The city has a population of 3,711 people, according to the 2010 census. The city’s economy is largely based on agriculture and manufacturing, and the median household income is $45,945. The racial makeup of the city is 94.3% White, 0.7% African American, 0.3% Native American, 0.4% Asian, 0.1% Pacific Islander, 2.2% from other races, and 2.1% from two or more races.
Common Questions
What is Per Capita Income in Omro?
Per Capita income in Omro is $33,076.
What is the Median Family Income in Omro?
Median Family Income in Omro is $88,696.
What is the Median Household income in Omro?
Median Household Income in Omro is $65,150.
What is Income or Wage Gap in Omro?
Income or Wage Gap in Omro is 29.9%.
Women in Omro earn 70.1 cents for every dollar earned by a man.
What is Inequality or Gini Index in Omro?
Inequality or Gini Index in Omro is 0.38.
What is the Total Population of Omro?
Total Population of Omro is 3,639.
What is the Total Male Population of Omro?
Total Male Population of Omro is 1,794.
What is the Total Female Population of Omro?
Total Female Population of Omro is 1,845.
What is the Ratio of Males per 100 Females in Omro?
There are 97.24 Males per 100 Females in Omro.
What is the Ratio of Females per 100 Males in Omro?
There are 102.84 Females per 100 Males in Omro.
What is the Median Population Age in Omro?
Median Population Age in Omro is 41.5 Years.
What is the Average Family Size in Omro
Average Family Size in Omro is 2.8 People.
What is the Average Household Size in Omro
Average Household Size in Omro is 2.2 People.
How Large is the Labor Force in Omro?
There are 1,975 People in the Labor Forcein in Omro.
What is the Percentage of People in the Labor Force in Omro?
67.6% of People are in the Labor Force in Omro.
What is the Unemployment Rate in Omro?
Unemployment Rate in Omro is 1.7%.