Oconto Falls, WI Map & Demographics
Oconto Falls Map
Oconto Falls Overview
$26,978
PER CAPITA INCOME
$65,821
AVG FAMILY INCOME
$47,941
AVG HOUSEHOLD INCOME
26.0%
WAGE / INCOME GAP [ % ]
74.0¢/ $1
WAGE / INCOME GAP [ $ ]
$16,786
FAMILY INCOME DEFICIT
0.40
INEQUALITY / GINI INDEX
2,959
TOTAL POPULATION
1,302
MALE POPULATION
1,657
FEMALE POPULATION
78.58
MALES / 100 FEMALES
127.27
FEMALES / 100 MALES
38.8
MEDIAN AGE
2.9
AVG FAMILY SIZE
2.3
AVG HOUSEHOLD SIZE
1,374
LABOR FORCE [ PEOPLE ]
58.6%
PERCENT IN LABOR FORCE
0.7%
UNEMPLOYMENT RATE
Oconto Falls Zip Codes
Oconto Falls Area Codes
Income in Oconto Falls
Income Overview in Oconto Falls
Per Capita Income in Oconto Falls is $26,978, while median incomes of families and households are $65,821 and $47,941 respectively.
| Characteristic | Number | Measure |
| Per Capita Income | 2,959 | $26,978 |
| Median Family Income | 663 | $65,821 |
| Mean Family Income | 663 | $72,923 |
| Median Household Income | 1,268 | $47,941 |
| Mean Household Income | 1,268 | $59,483 |
| Income Deficit | 663 | $16,786 |
| Wage / Income Gap (%) | 2,959 | 25.95% |
| Wage / Income Gap ($) | 2,959 | 74.05¢ per $1 |
| Gini / Inequality Index | 2,959 | 0.40 |
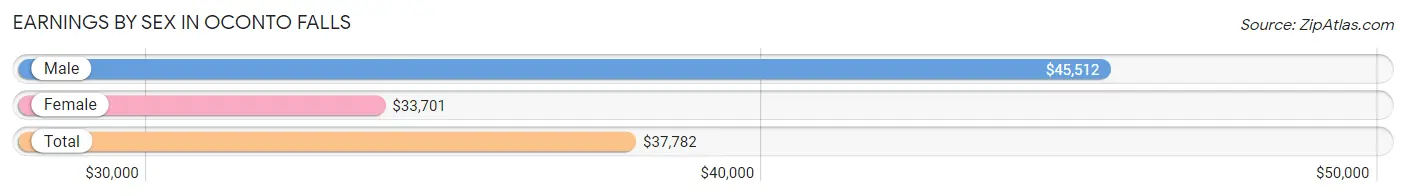
Earnings by Sex in Oconto Falls
Average Earnings in Oconto Falls are $37,782, $45,512 for men and $33,701 for women, a difference of 26.0%.
| Sex | Number | Average Earnings |
| Male | 781 (49.4%) | $45,512 |
| Female | 801 (50.6%) | $33,701 |
| Total | 1,582 (100.0%) | $37,782 |
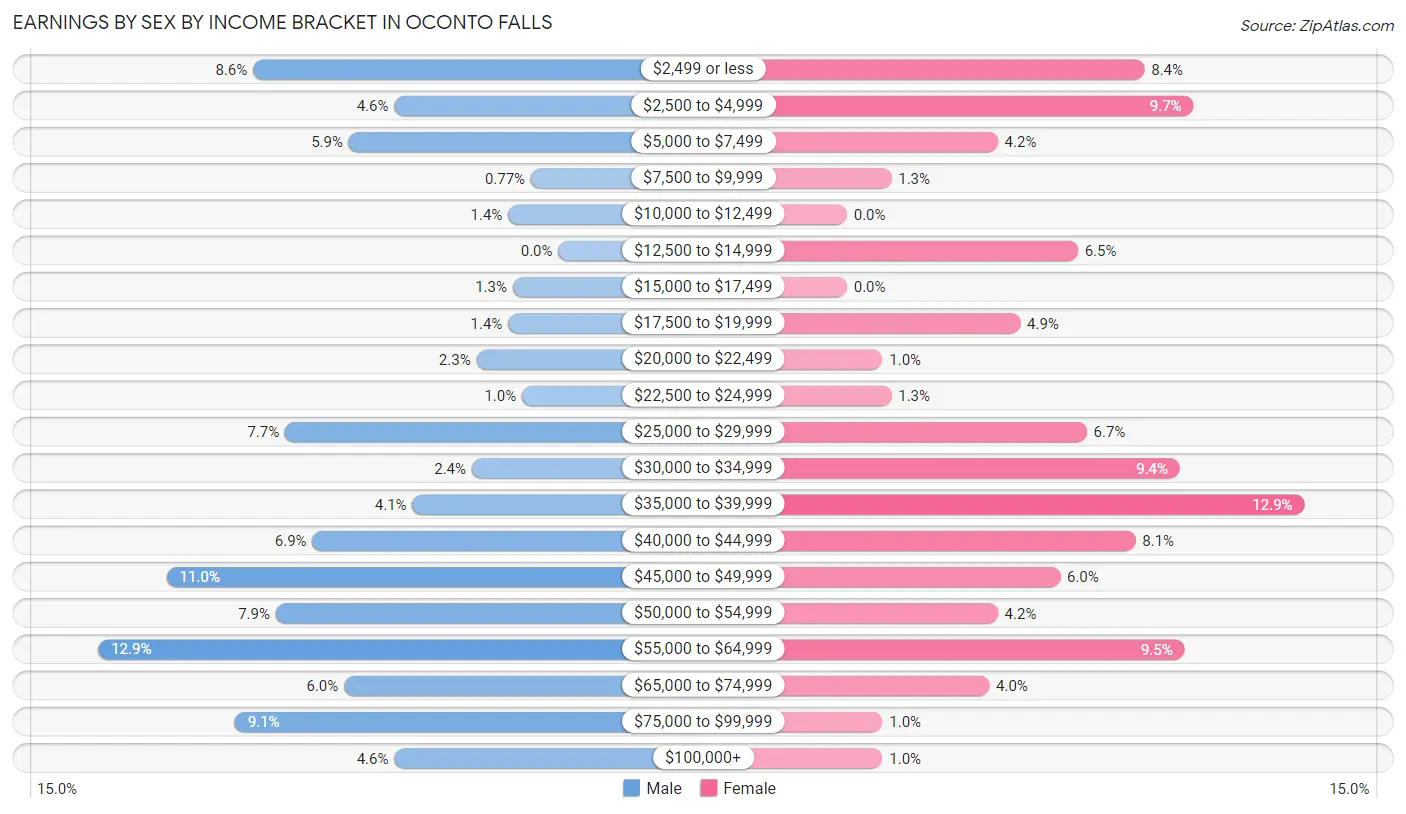
Earnings by Sex by Income Bracket in Oconto Falls
The most common earnings brackets in Oconto Falls are $55,000 to $64,999 for men (101 | 12.9%) and $35,000 to $39,999 for women (103 | 12.9%).
| Income | Male | Female |
| $2,499 or less | 67 (8.6%) | 67 (8.4%) |
| $2,500 to $4,999 | 36 (4.6%) | 78 (9.7%) |
| $5,000 to $7,499 | 46 (5.9%) | 34 (4.2%) |
| $7,500 to $9,999 | 6 (0.8%) | 10 (1.3%) |
| $10,000 to $12,499 | 11 (1.4%) | 0 (0.0%) |
| $12,500 to $14,999 | 0 (0.0%) | 52 (6.5%) |
| $15,000 to $17,499 | 10 (1.3%) | 0 (0.0%) |
| $17,500 to $19,999 | 11 (1.4%) | 39 (4.9%) |
| $20,000 to $22,499 | 18 (2.3%) | 8 (1.0%) |
| $22,500 to $24,999 | 8 (1.0%) | 10 (1.3%) |
| $25,000 to $29,999 | 60 (7.7%) | 54 (6.7%) |
| $30,000 to $34,999 | 19 (2.4%) | 75 (9.4%) |
| $35,000 to $39,999 | 32 (4.1%) | 103 (12.9%) |
| $40,000 to $44,999 | 54 (6.9%) | 65 (8.1%) |
| $45,000 to $49,999 | 86 (11.0%) | 48 (6.0%) |
| $50,000 to $54,999 | 62 (7.9%) | 34 (4.2%) |
| $55,000 to $64,999 | 101 (12.9%) | 76 (9.5%) |
| $65,000 to $74,999 | 47 (6.0%) | 32 (4.0%) |
| $75,000 to $99,999 | 71 (9.1%) | 8 (1.0%) |
| $100,000+ | 36 (4.6%) | 8 (1.0%) |
| Total | 781 (100.0%) | 801 (100.0%) |
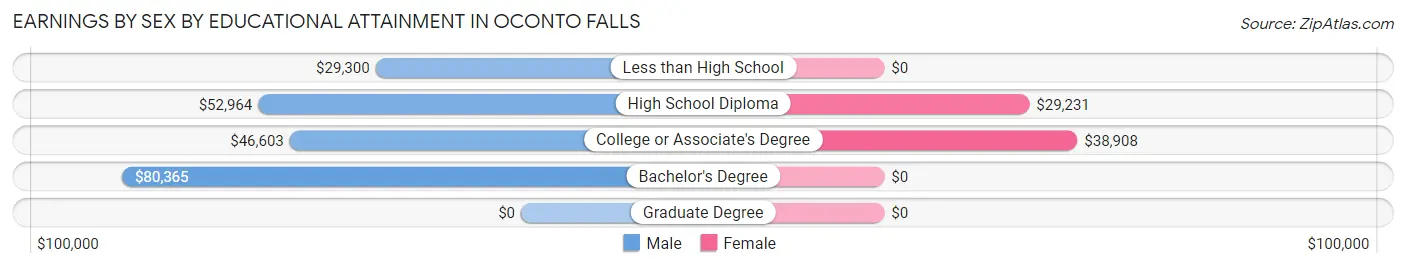
Earnings by Sex by Educational Attainment in Oconto Falls
Average earnings in Oconto Falls are $47,054 for men and $36,902 for women, a difference of 21.6%. Men with an educational attainment of bachelor's degree enjoy the highest average annual earnings of $80,365, while those with less than high school education earn the least with $29,300. Women with an educational attainment of college or associate's degree earn the most with the average annual earnings of $38,908, while those with high school diploma education have the smallest earnings of $29,231.
| Educational Attainment | Male Income | Female Income |
| Less than High School | $29,300 | $0 |
| High School Diploma | $52,964 | $29,231 |
| College or Associate's Degree | $46,603 | $38,908 |
| Bachelor's Degree | $80,365 | $0 |
| Graduate Degree | - | - |
| Total | $47,054 | $36,902 |
Family Income in Oconto Falls
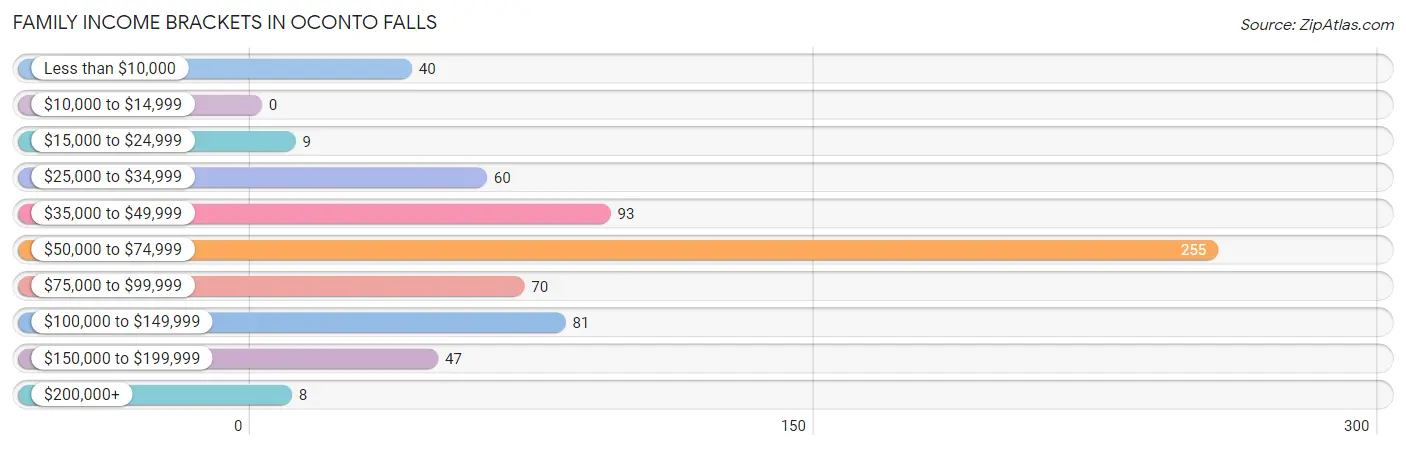
Family Income Brackets in Oconto Falls
According to the Oconto Falls family income data, there are 255 families falling into the $50,000 to $74,999 income range, which is the most common income bracket and makes up 38.5% of all families.
| Income Bracket | # Families | % Families |
| Less than $10,000 | 40 | 6.0% |
| $10,000 to $14,999 | 0 | 0.0% |
| $15,000 to $24,999 | 9 | 1.4% |
| $25,000 to $34,999 | 60 | 9.0% |
| $35,000 to $49,999 | 93 | 14.0% |
| $50,000 to $74,999 | 255 | 38.5% |
| $75,000 to $99,999 | 70 | 10.6% |
| $100,000 to $149,999 | 81 | 12.2% |
| $150,000 to $199,999 | 47 | 7.1% |
| $200,000+ | 8 | 1.2% |
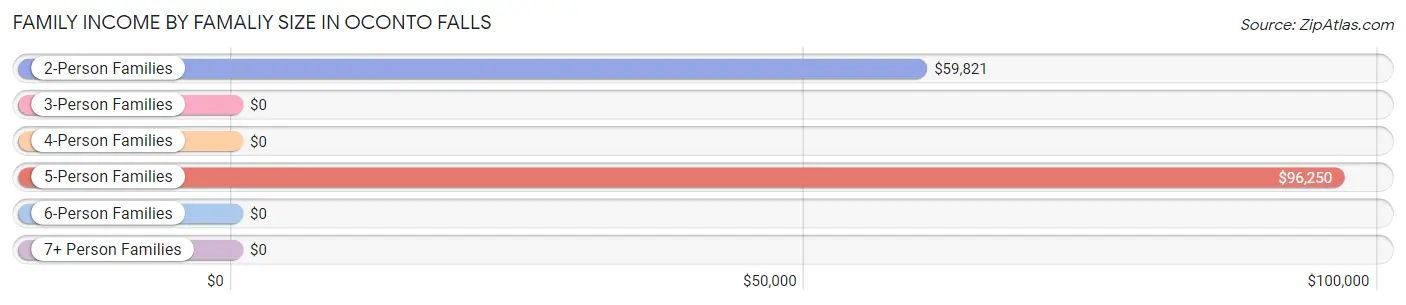
Family Income by Famaliy Size in Oconto Falls
5-person families (51 | 7.7%) account for the highest median family income in Oconto Falls with $96,250 per family, while 2-person families (316 | 47.7%) have the highest median income of $29,910 per family member.
| Income Bracket | # Families | Median Income |
| 2-Person Families | 316 (47.7%) | $59,821 |
| 3-Person Families | 124 (18.7%) | $0 |
| 4-Person Families | 149 (22.5%) | $0 |
| 5-Person Families | 51 (7.7%) | $96,250 |
| 6-Person Families | 23 (3.5%) | $0 |
| 7+ Person Families | 0 (0.0%) | $0 |
| Total | 663 (100.0%) | $65,821 |
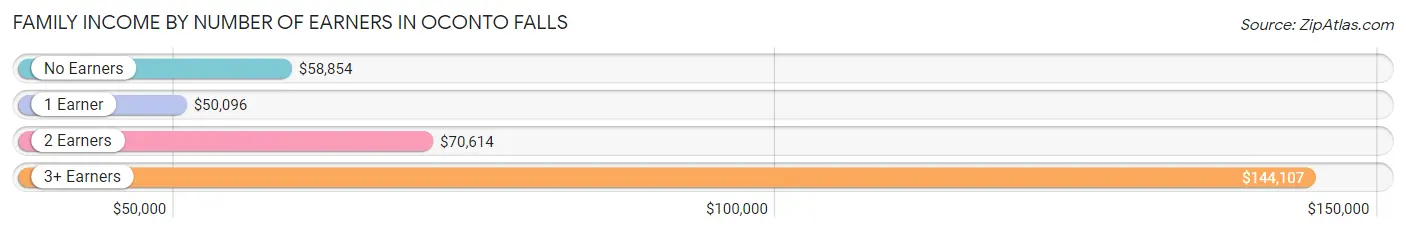
Family Income by Number of Earners in Oconto Falls
The median family income in Oconto Falls is $65,821, with families comprising 3+ earners (47) having the highest median family income of $144,107, while families with 1 earner (225) have the lowest median family income of $50,096, accounting for 7.1% and 33.9% of families, respectively.
| Number of Earners | # Families | Median Income |
| No Earners | 87 (13.1%) | $58,854 |
| 1 Earner | 225 (33.9%) | $50,096 |
| 2 Earners | 304 (45.9%) | $70,614 |
| 3+ Earners | 47 (7.1%) | $144,107 |
| Total | 663 (100.0%) | $65,821 |
Household Income in Oconto Falls
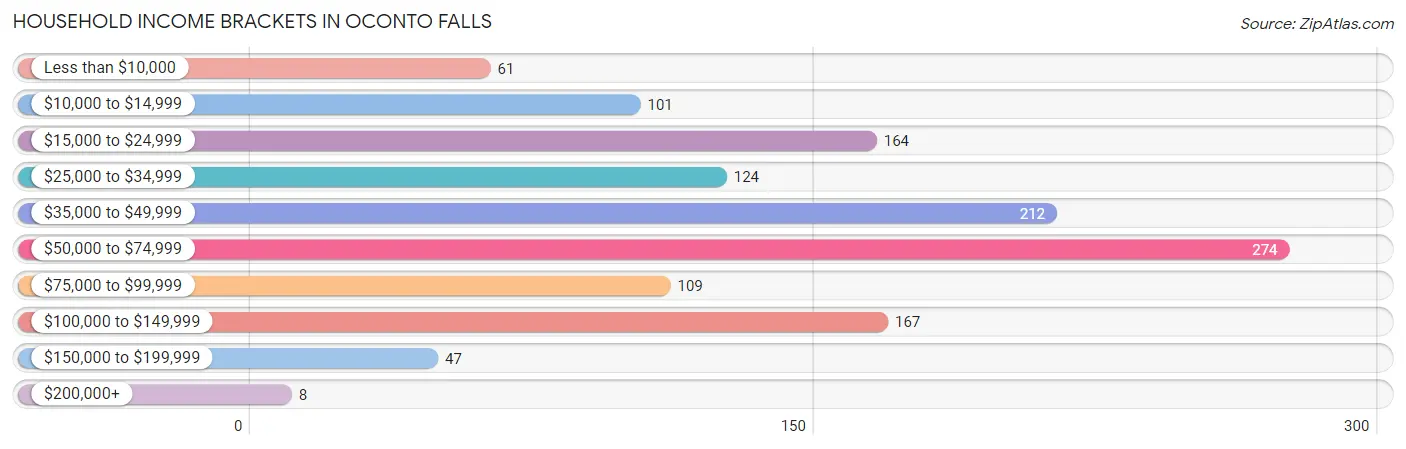
Household Income Brackets in Oconto Falls
With 274 households falling in the category, the $50,000 to $74,999 income range is the most frequent in Oconto Falls, accounting for 21.6% of all households. In contrast, only 8 households (0.6%) fall into the $200,000+ income bracket, making it the least populous group.
| Income Bracket | # Households | % Households |
| Less than $10,000 | 61 | 4.8% |
| $10,000 to $14,999 | 101 | 8.0% |
| $15,000 to $24,999 | 164 | 12.9% |
| $25,000 to $34,999 | 124 | 9.8% |
| $35,000 to $49,999 | 212 | 16.7% |
| $50,000 to $74,999 | 274 | 21.6% |
| $75,000 to $99,999 | 109 | 8.6% |
| $100,000 to $149,999 | 167 | 13.2% |
| $150,000 to $199,999 | 47 | 3.7% |
| $200,000+ | 8 | 0.6% |
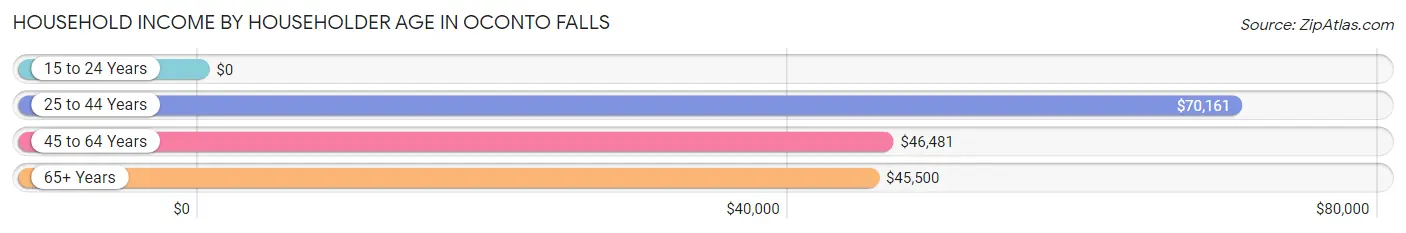
Household Income by Householder Age in Oconto Falls
The median household income in Oconto Falls is $47,941, with the highest median household income of $70,161 found in the 25 to 44 years age bracket for the primary householder. A total of 434 households (34.2%) fall into this category. Meanwhile, the 15 to 24 years age bracket for the primary householder has the lowest median household income of $0, with 92 households (7.3%) in this group.
| Income Bracket | # Households | Median Income |
| 15 to 24 Years | 92 (7.3%) | $0 |
| 25 to 44 Years | 434 (34.2%) | $70,161 |
| 45 to 64 Years | 492 (38.8%) | $46,481 |
| 65+ Years | 250 (19.7%) | $45,500 |
| Total | 1,268 (100.0%) | $47,941 |
Poverty in Oconto Falls
Income Below Poverty by Sex and Age in Oconto Falls
With 15.1% poverty level for males and 15.4% for females among the residents of Oconto Falls, 5 year old males and 25 to 34 year old females are the most vulnerable to poverty, with 7 males (100.0%) and 49 females (39.2%) in their respective age groups living below the poverty level.
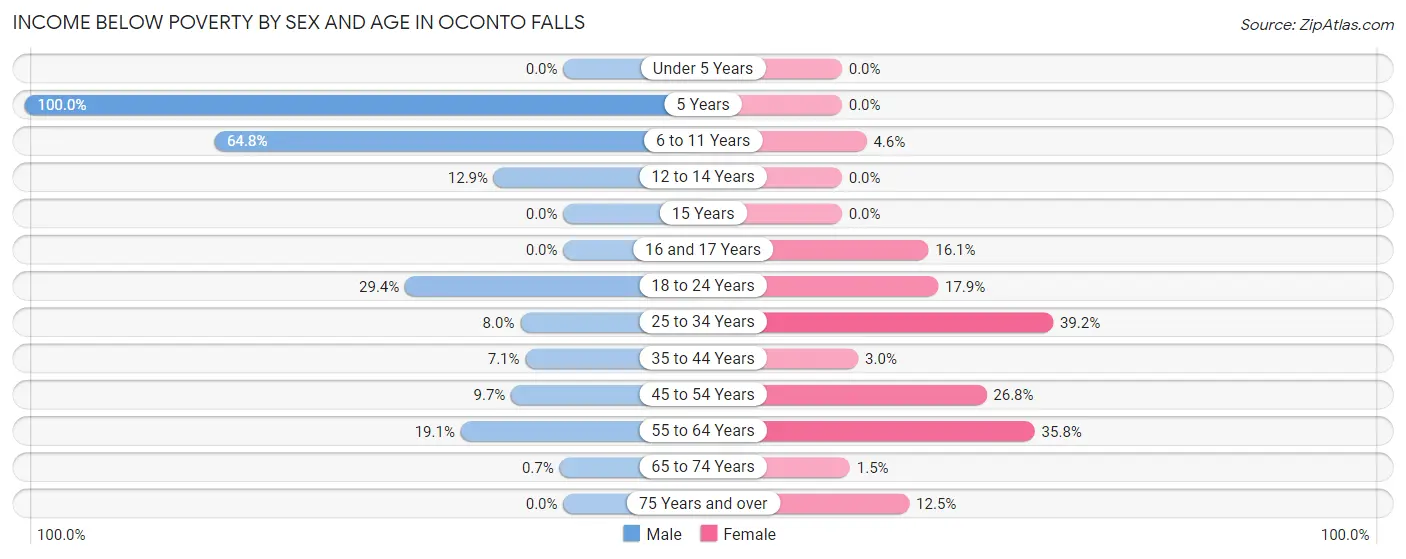
| Age Bracket | Male | Female |
| Under 5 Years | 0 (0.0%) | 0 (0.0%) |
| 5 Years | 7 (100.0%) | 0 (0.0%) |
| 6 to 11 Years | 59 (64.8%) | 7 (4.6%) |
| 12 to 14 Years | 16 (12.9%) | 0 (0.0%) |
| 15 Years | 0 (0.0%) | 0 (0.0%) |
| 16 and 17 Years | 0 (0.0%) | 9 (16.1%) |
| 18 to 24 Years | 42 (29.4%) | 35 (17.9%) |
| 25 to 34 Years | 10 (8.0%) | 49 (39.2%) |
| 35 to 44 Years | 16 (7.0%) | 8 (3.0%) |
| 45 to 54 Years | 9 (9.7%) | 66 (26.8%) |
| 55 to 64 Years | 32 (19.1%) | 58 (35.8%) |
| 65 to 74 Years | 1 (0.7%) | 2 (1.5%) |
| 75 Years and over | 0 (0.0%) | 10 (12.5%) |
| Total | 192 (15.1%) | 244 (15.4%) |
Income Above Poverty by Sex and Age in Oconto Falls
According to the poverty statistics in Oconto Falls, males aged under 5 years and females aged under 5 years are the age groups that are most secure financially, with 100.0% of males and 100.0% of females in these age groups living above the poverty line.
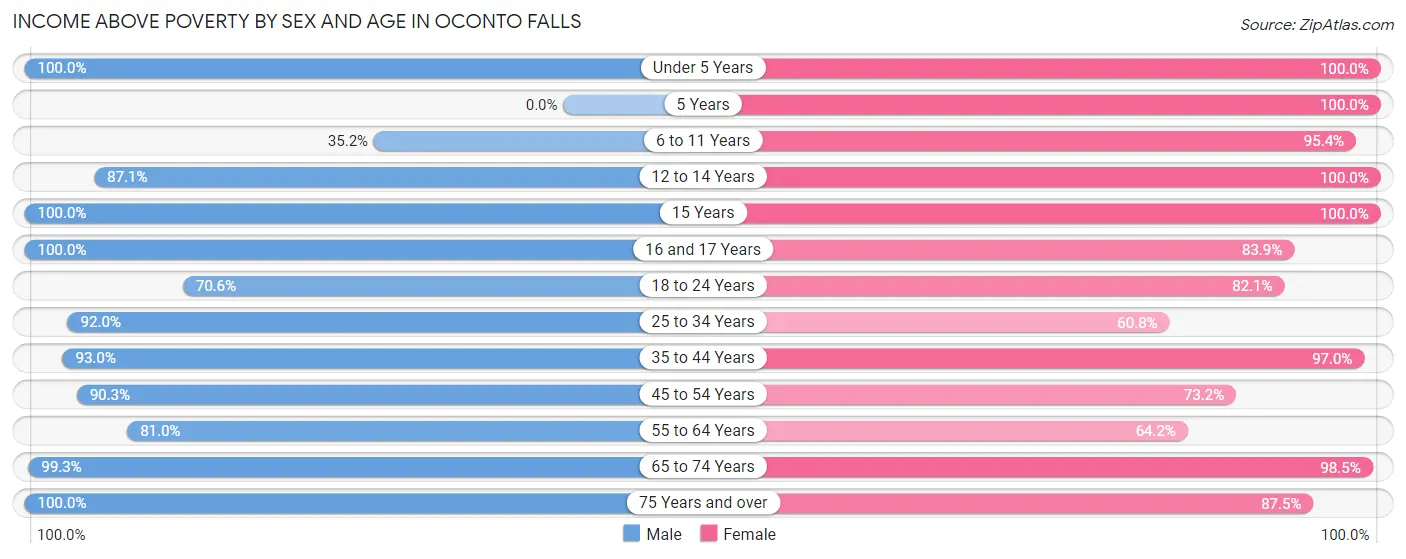
| Age Bracket | Male | Female |
| Under 5 Years | 32 (100.0%) | 44 (100.0%) |
| 5 Years | 0 (0.0%) | 10 (100.0%) |
| 6 to 11 Years | 32 (35.2%) | 146 (95.4%) |
| 12 to 14 Years | 108 (87.1%) | 93 (100.0%) |
| 15 Years | 16 (100.0%) | 23 (100.0%) |
| 16 and 17 Years | 67 (100.0%) | 47 (83.9%) |
| 18 to 24 Years | 101 (70.6%) | 161 (82.1%) |
| 25 to 34 Years | 115 (92.0%) | 76 (60.8%) |
| 35 to 44 Years | 211 (92.9%) | 255 (97.0%) |
| 45 to 54 Years | 84 (90.3%) | 180 (73.2%) |
| 55 to 64 Years | 136 (80.9%) | 104 (64.2%) |
| 65 to 74 Years | 142 (99.3%) | 131 (98.5%) |
| 75 Years and over | 38 (100.0%) | 70 (87.5%) |
| Total | 1,082 (84.9%) | 1,340 (84.6%) |
Income Below Poverty Among Married-Couple Families in Oconto Falls
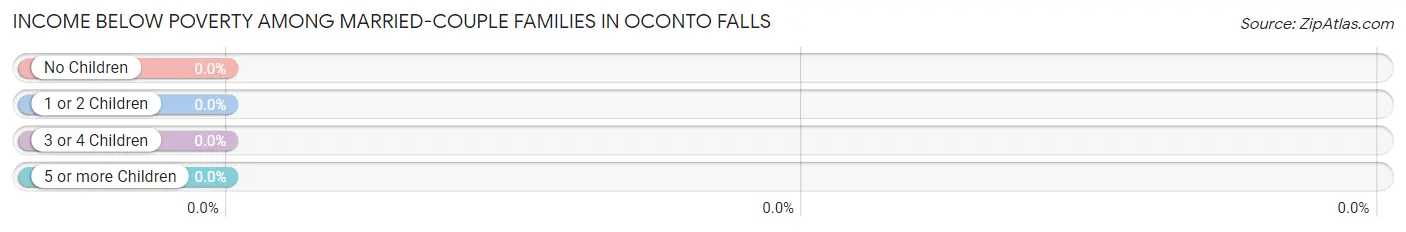
| Children | Above Poverty | Below Poverty |
| No Children | 207 (100.0%) | 0 (0.0%) |
| 1 or 2 Children | 133 (100.0%) | 0 (0.0%) |
| 3 or 4 Children | 36 (100.0%) | 0 (0.0%) |
| 5 or more Children | 0 (0.0%) | 0 (0.0%) |
| Total | 376 (100.0%) | 0 (0.0%) |
Income Below Poverty Among Single-Parent Households in Oconto Falls
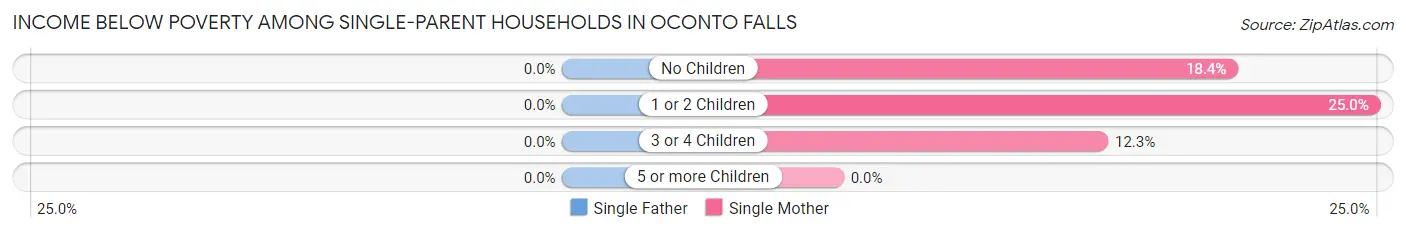
| Children | Single Father | Single Mother |
| No Children | 0 (0.0%) | 9 (18.4%) |
| 1 or 2 Children | 0 (0.0%) | 32 (25.0%) |
| 3 or 4 Children | 0 (0.0%) | 8 (12.3%) |
| 5 or more Children | 0 (0.0%) | 0 (0.0%) |
| Total | 0 (0.0%) | 49 (20.3%) |
Income Below Poverty Among Married-Couple vs Single-Parent Households in Oconto Falls
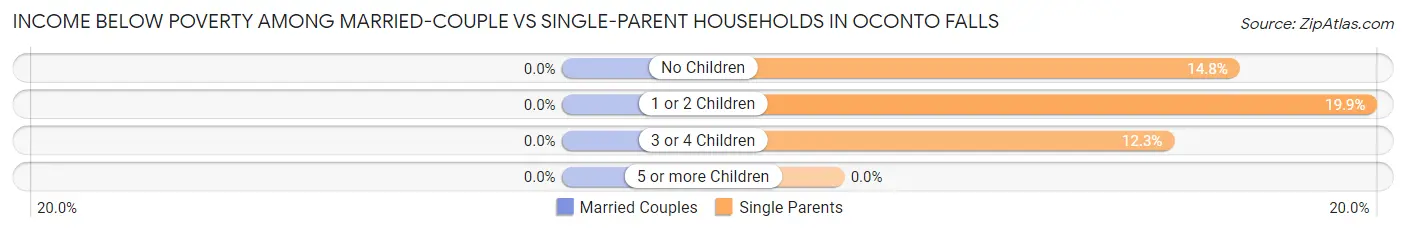
| Children | Married-Couple Families | Single-Parent Households |
| No Children | 0 (0.0%) | 9 (14.7%) |
| 1 or 2 Children | 0 (0.0%) | 32 (19.9%) |
| 3 or 4 Children | 0 (0.0%) | 8 (12.3%) |
| 5 or more Children | 0 (0.0%) | 0 (0.0%) |
| Total | 0 (0.0%) | 49 (17.1%) |
Race in Oconto Falls
The most populous races in Oconto Falls are White / Caucasian (2,824 | 95.4%), Two or more Races (110 | 3.7%), and Native / Alaskan (12 | 0.4%).
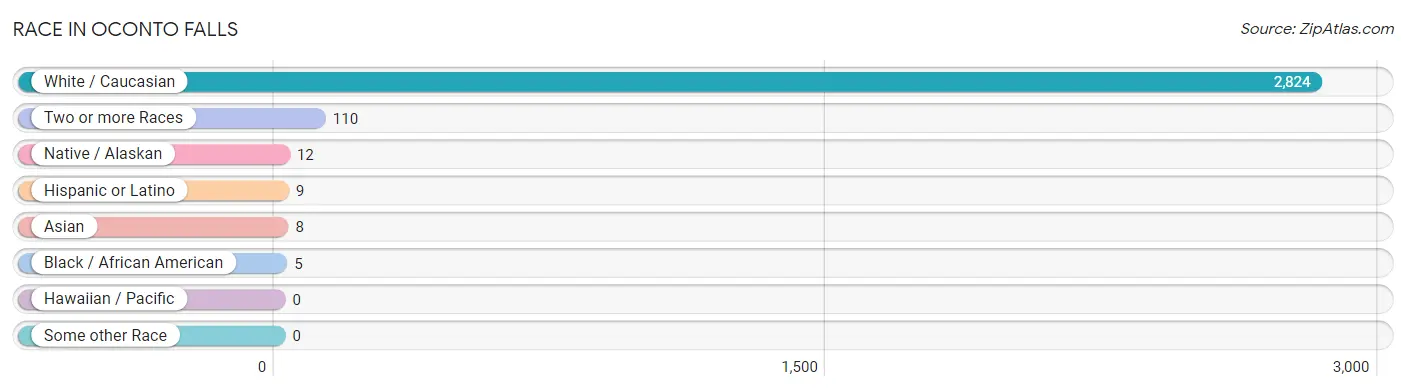
| Race | # Population | % Population |
| Asian | 8 | 0.3% |
| Black / African American | 5 | 0.2% |
| Hawaiian / Pacific | 0 | 0.0% |
| Hispanic or Latino | 9 | 0.3% |
| Native / Alaskan | 12 | 0.4% |
| White / Caucasian | 2,824 | 95.4% |
| Two or more Races | 110 | 3.7% |
| Some other Race | 0 | 0.0% |
| Total | 2,959 | 100.0% |
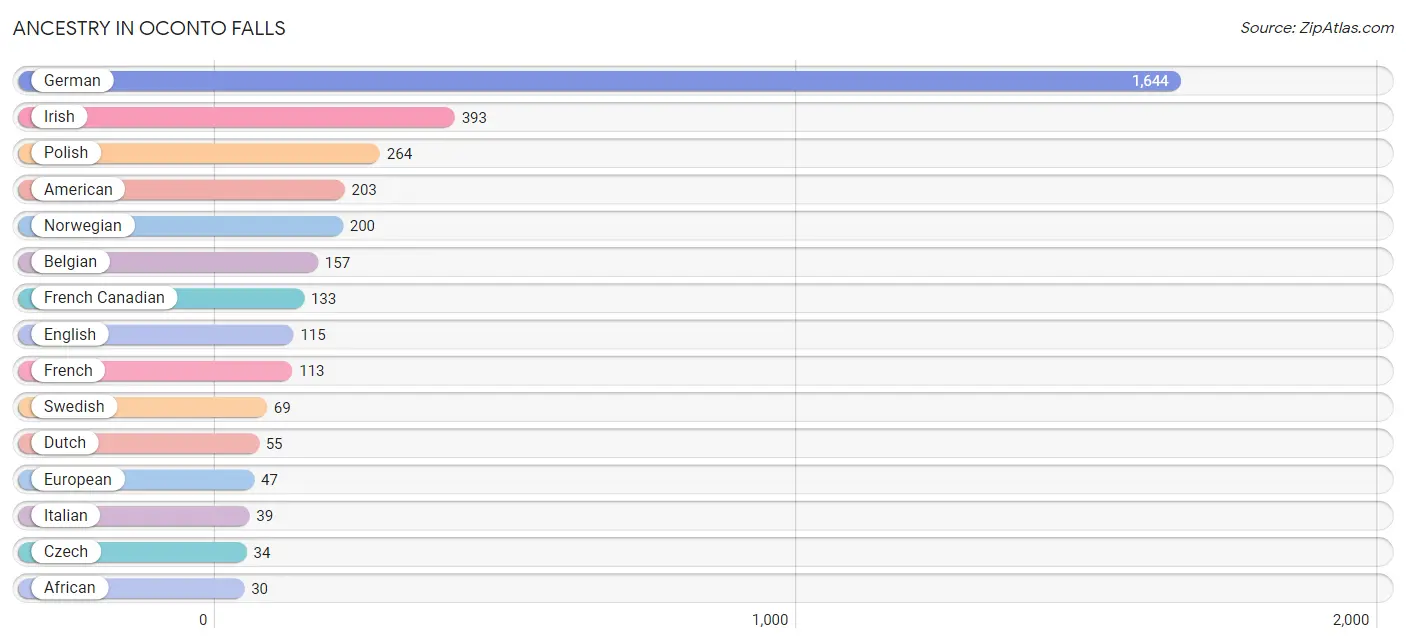
Ancestry in Oconto Falls
The most populous ancestries reported in Oconto Falls are German (1,644 | 55.6%), Irish (393 | 13.3%), Polish (264 | 8.9%), American (203 | 6.9%), and Norwegian (200 | 6.8%), together accounting for 91.4% of all Oconto Falls residents.
| Ancestry | # Population | % Population |
| African | 30 | 1.0% |
| American | 203 | 6.9% |
| Belgian | 157 | 5.3% |
| British | 1 | 0.0% |
| Canadian | 10 | 0.3% |
| Chippewa | 28 | 0.9% |
| Czech | 34 | 1.1% |
| Danish | 21 | 0.7% |
| Dutch | 55 | 1.9% |
| English | 115 | 3.9% |
| European | 47 | 1.6% |
| Finnish | 22 | 0.7% |
| French | 113 | 3.8% |
| French Canadian | 133 | 4.5% |
| German | 1,644 | 55.6% |
| Greek | 25 | 0.8% |
| Indian (Asian) | 8 | 0.3% |
| Irish | 393 | 13.3% |
| Italian | 39 | 1.3% |
| Menominee | 24 | 0.8% |
| Mexican | 9 | 0.3% |
| Norwegian | 200 | 6.8% |
| Polish | 264 | 8.9% |
| Russian | 11 | 0.4% |
| Scottish | 16 | 0.5% |
| Slovak | 19 | 0.6% |
| Subsaharan African | 30 | 1.0% |
| Swedish | 69 | 2.3% | View All 28 Rows |
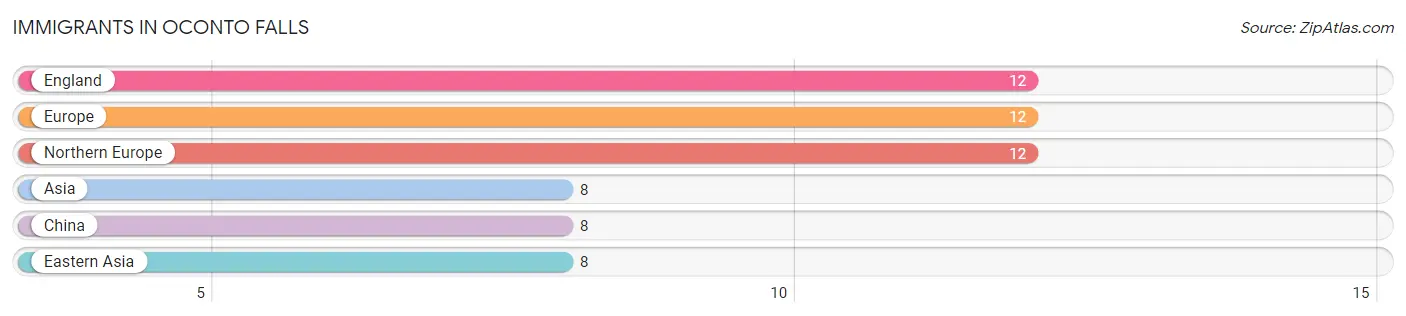
Immigrants in Oconto Falls
The most numerous immigrant groups reported in Oconto Falls came from England (12 | 0.4%), Europe (12 | 0.4%), Northern Europe (12 | 0.4%), Asia (8 | 0.3%), and China (8 | 0.3%), together accounting for 1.8% of all Oconto Falls residents.
| Immigration Origin | # Population | % Population |
| Asia | 8 | 0.3% |
| China | 8 | 0.3% |
| Eastern Asia | 8 | 0.3% |
| England | 12 | 0.4% |
| Europe | 12 | 0.4% |
| Northern Europe | 12 | 0.4% | View All 6 Rows |
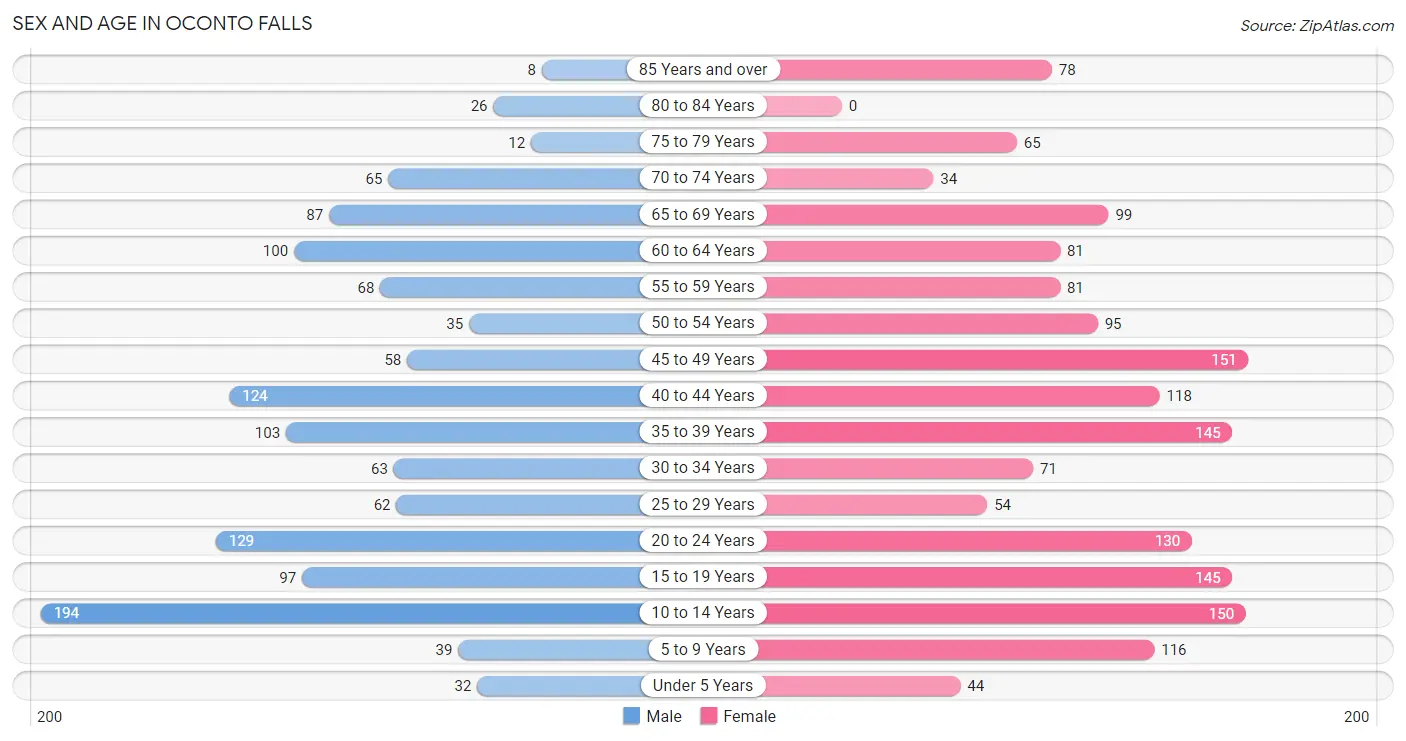
Sex and Age in Oconto Falls
Sex and Age in Oconto Falls
The most populous age groups in Oconto Falls are 10 to 14 Years (194 | 14.9%) for men and 45 to 49 Years (151 | 9.1%) for women.
| Age Bracket | Male | Female |
| Under 5 Years | 32 (2.5%) | 44 (2.7%) |
| 5 to 9 Years | 39 (3.0%) | 116 (7.0%) |
| 10 to 14 Years | 194 (14.9%) | 150 (9.0%) |
| 15 to 19 Years | 97 (7.4%) | 145 (8.7%) |
| 20 to 24 Years | 129 (9.9%) | 130 (7.9%) |
| 25 to 29 Years | 62 (4.8%) | 54 (3.3%) |
| 30 to 34 Years | 63 (4.8%) | 71 (4.3%) |
| 35 to 39 Years | 103 (7.9%) | 145 (8.7%) |
| 40 to 44 Years | 124 (9.5%) | 118 (7.1%) |
| 45 to 49 Years | 58 (4.4%) | 151 (9.1%) |
| 50 to 54 Years | 35 (2.7%) | 95 (5.7%) |
| 55 to 59 Years | 68 (5.2%) | 81 (4.9%) |
| 60 to 64 Years | 100 (7.7%) | 81 (4.9%) |
| 65 to 69 Years | 87 (6.7%) | 99 (6.0%) |
| 70 to 74 Years | 65 (5.0%) | 34 (2.1%) |
| 75 to 79 Years | 12 (0.9%) | 65 (3.9%) |
| 80 to 84 Years | 26 (2.0%) | 0 (0.0%) |
| 85 Years and over | 8 (0.6%) | 78 (4.7%) |
| Total | 1,302 (100.0%) | 1,657 (100.0%) |
Families and Households in Oconto Falls
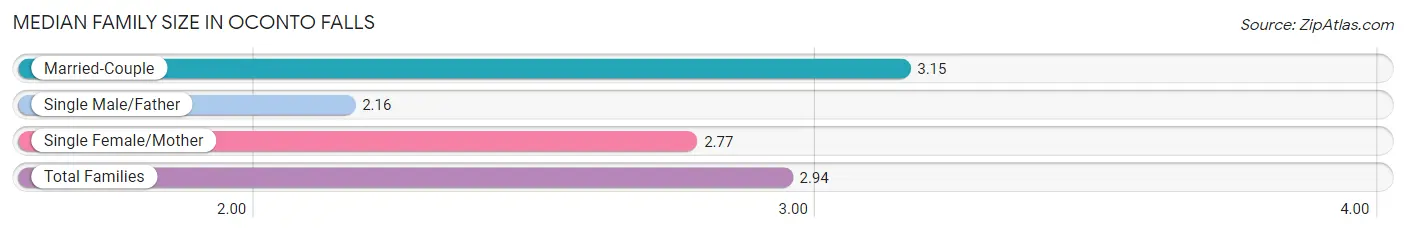
Median Family Size in Oconto Falls
The median family size in Oconto Falls is 2.94 persons per family, with married-couple families (376 | 56.7%) accounting for the largest median family size of 3.15 persons per family. On the other hand, single male/father families (45 | 6.8%) represent the smallest median family size with 2.16 persons per family.
| Family Type | # Families | Family Size |
| Married-Couple | 376 (56.7%) | 3.15 |
| Single Male/Father | 45 (6.8%) | 2.16 |
| Single Female/Mother | 242 (36.5%) | 2.77 |
| Total Families | 663 (100.0%) | 2.94 |
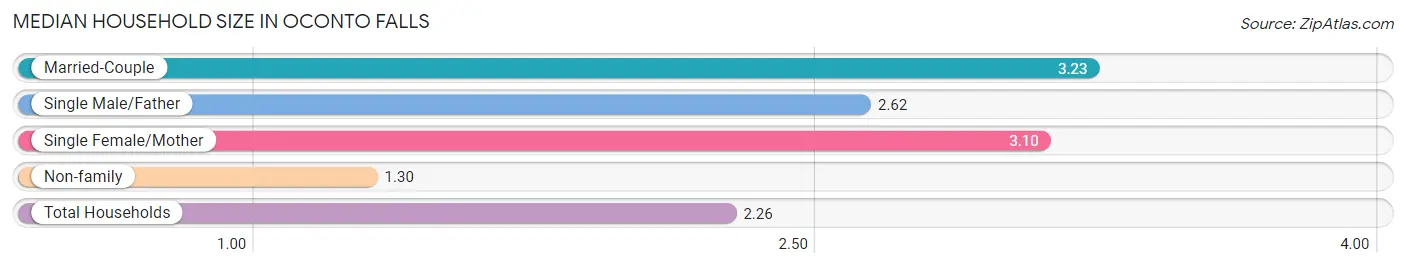
Median Household Size in Oconto Falls
The median household size in Oconto Falls is 2.26 persons per household, with married-couple households (376 | 29.6%) accounting for the largest median household size of 3.23 persons per household. non-family households (605 | 47.7%) represent the smallest median household size with 1.30 persons per household.
| Household Type | # Households | Household Size |
| Married-Couple | 376 (29.6%) | 3.23 |
| Single Male/Father | 45 (3.5%) | 2.62 |
| Single Female/Mother | 242 (19.1%) | 3.10 |
| Non-family | 605 (47.7%) | 1.30 |
| Total Households | 1,268 (100.0%) | 2.26 |
Household Size by Marriage Status in Oconto Falls
Out of a total of 1,268 households in Oconto Falls, 663 (52.3%) are family households, while 605 (47.7%) are nonfamily households. The most numerous type of family households are 2-person households, comprising 263, and the most common type of nonfamily households are 1-person households, comprising 456.
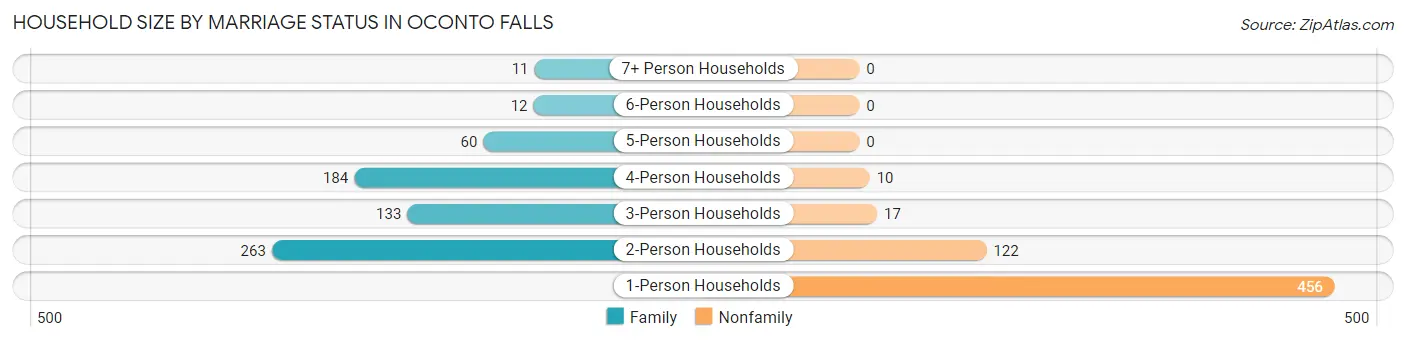
| Household Size | Family Households | Nonfamily Households |
| 1-Person Households | - | 456 (36.0%) |
| 2-Person Households | 263 (20.7%) | 122 (9.6%) |
| 3-Person Households | 133 (10.5%) | 17 (1.3%) |
| 4-Person Households | 184 (14.5%) | 10 (0.8%) |
| 5-Person Households | 60 (4.7%) | 0 (0.0%) |
| 6-Person Households | 12 (0.9%) | 0 (0.0%) |
| 7+ Person Households | 11 (0.9%) | 0 (0.0%) |
| Total | 663 (52.3%) | 605 (47.7%) |
Female Fertility in Oconto Falls
Fertility by Age in Oconto Falls
Average fertility rate in Oconto Falls is 36.0 births per 1,000 women. Women in the age bracket of 20 to 34 years have the highest fertility rate with 118.0 births per 1,000 women. Women in the age bracket of 20 to 34 years acount for 100.0% of all women with births.
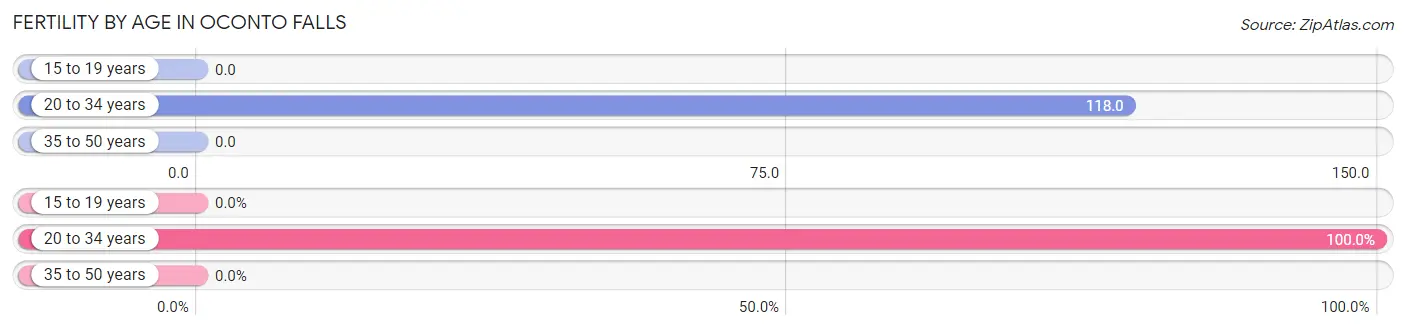
| Age Bracket | Women with Births | Births / 1,000 Women |
| 15 to 19 years | 0 (0.0%) | 0.0 |
| 20 to 34 years | 30 (100.0%) | 118.0 |
| 35 to 50 years | 0 (0.0%) | 0.0 |
| Total | 30 (100.0%) | 36.0 |
Fertility by Age by Marriage Status in Oconto Falls
23.3% of women with births (30) in Oconto Falls are married. The highest percentage of unmarried women with births falls into 20 to 34 years age bracket with 76.7% of them unmarried at the time of birth, while the lowest percentage of unmarried women with births belong to 20 to 34 years age bracket with 76.7% of them unmarried.
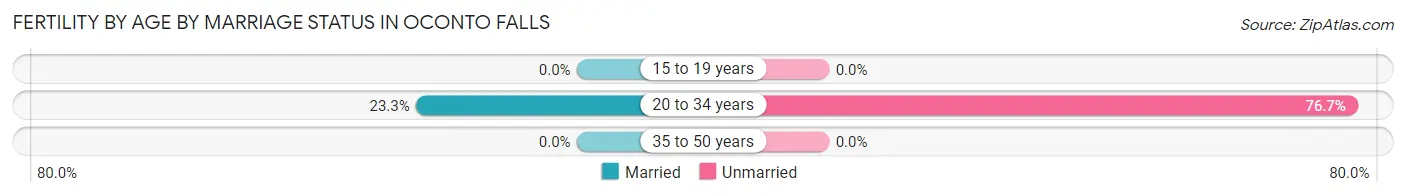
| Age Bracket | Married | Unmarried |
| 15 to 19 years | 0 (0.0%) | 0 (0.0%) |
| 20 to 34 years | 7 (23.3%) | 23 (76.7%) |
| 35 to 50 years | 0 (0.0%) | 0 (0.0%) |
| Total | 7 (23.3%) | 23 (76.7%) |
Fertility by Education in Oconto Falls
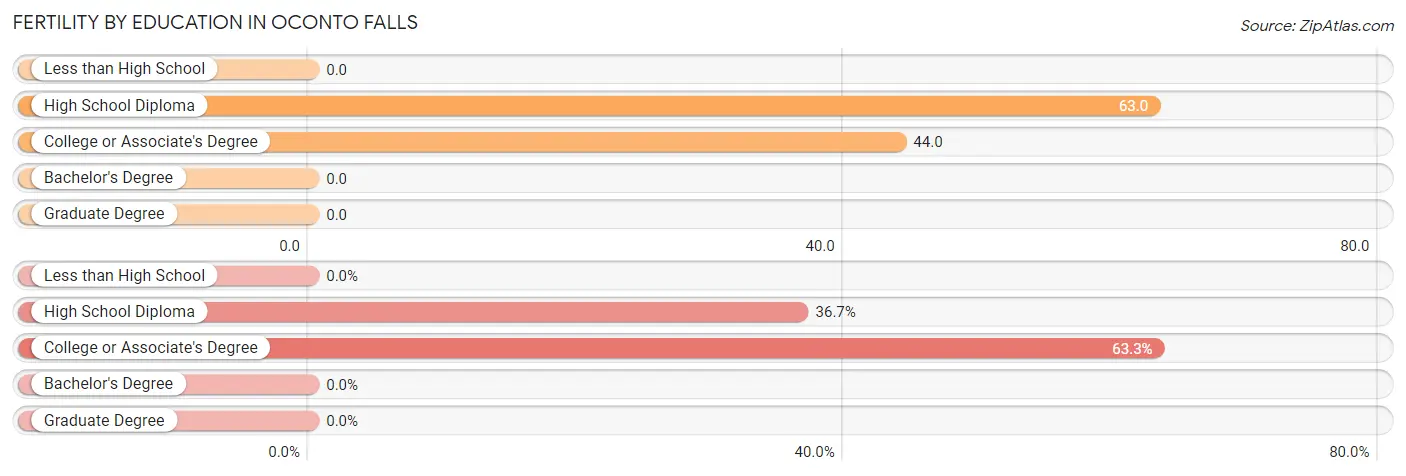
| Educational Attainment | Women with Births | Births / 1,000 Women |
| Less than High School | 0 (0.0%) | 0.0 |
| High School Diploma | 11 (36.7%) | 63.0 |
| College or Associate's Degree | 19 (63.3%) | 44.0 |
| Bachelor's Degree | 0 (0.0%) | 0.0 |
| Graduate Degree | 0 (0.0%) | 0.0 |
| Total | 30 (100.0%) | 36.0 |
Fertility by Education by Marriage Status in Oconto Falls
76.7% of women with births in Oconto Falls are unmarried. Women with the educational attainment of college or associate's degree are most likely to be married with 36.8% of them married at childbirth, while women with the educational attainment of high school diploma are least likely to be married with 100.0% of them unmarried at childbirth.
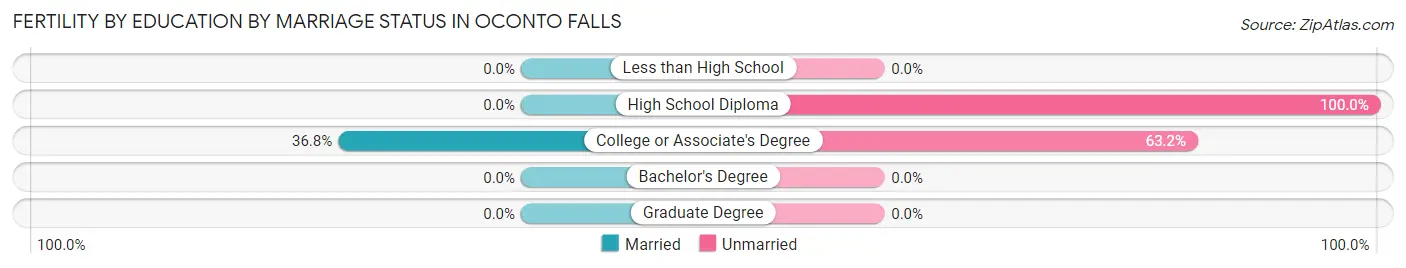
| Educational Attainment | Married | Unmarried |
| Less than High School | 0 (0.0%) | 0 (0.0%) |
| High School Diploma | 0 (0.0%) | 11 (100.0%) |
| College or Associate's Degree | 7 (36.8%) | 12 (63.2%) |
| Bachelor's Degree | 0 (0.0%) | 0 (0.0%) |
| Graduate Degree | 0 (0.0%) | 0 (0.0%) |
| Total | 7 (23.3%) | 23 (76.7%) |
Employment Characteristics in Oconto Falls
Employment by Class of Employer in Oconto Falls
Among the 1,340 employed individuals in Oconto Falls, private company employees (1,088 | 81.2%), not-for-profit organizations (104 | 7.8%), and self-employed (not incorporated) (64 | 4.8%) make up the most common classes of employment.
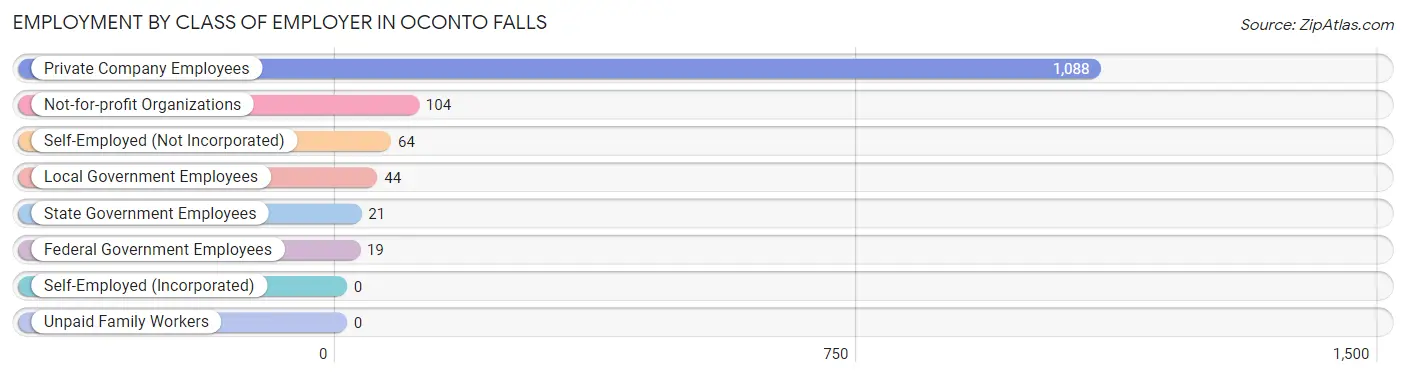
| Employer Class | # Employees | % Employees |
| Private Company Employees | 1,088 | 81.2% |
| Self-Employed (Incorporated) | 0 | 0.0% |
| Self-Employed (Not Incorporated) | 64 | 4.8% |
| Not-for-profit Organizations | 104 | 7.8% |
| Local Government Employees | 44 | 3.3% |
| State Government Employees | 21 | 1.6% |
| Federal Government Employees | 19 | 1.4% |
| Unpaid Family Workers | 0 | 0.0% |
| Total | 1,340 | 100.0% |
Employment Status by Age in Oconto Falls
According to the labor force statistics for Oconto Falls, out of the total population over 16 years of age (2,345), 58.6% or 1,374 individuals are in the labor force, with 0.7% or 10 of them unemployed. The age group with the highest labor force participation rate is 25 to 29 years, with 91.4% or 106 individuals in the labor force. Within the labor force, the 20 to 24 years age range has the highest percentage of unemployed individuals, with 5.1% or 10 of them being unemployed.
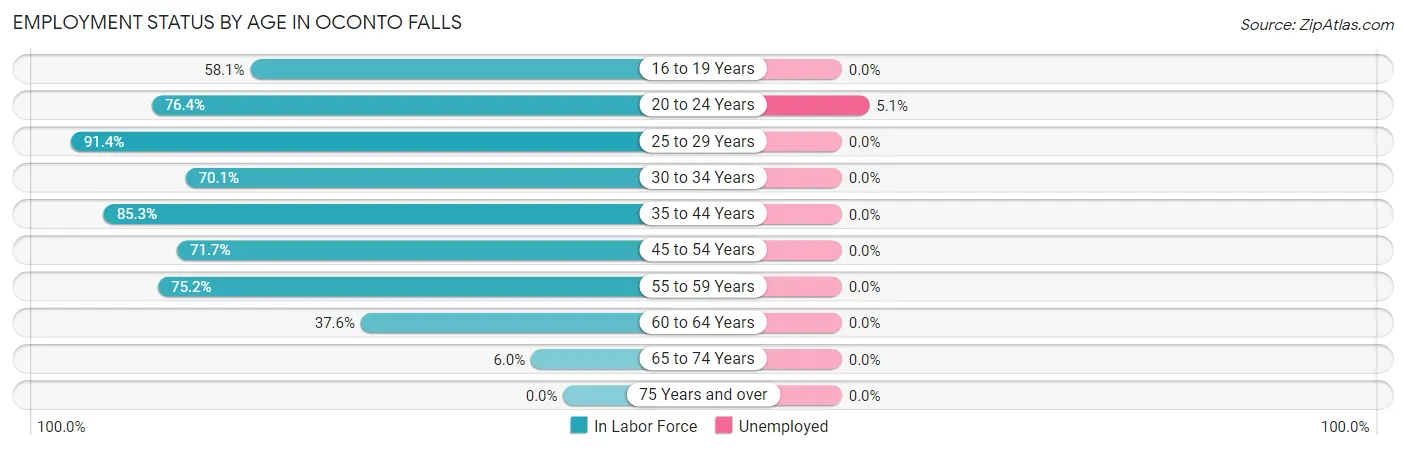
| Age Bracket | In Labor Force | Unemployed |
| 16 to 19 Years | 118 (58.1%) | 0 (0.0%) |
| 20 to 24 Years | 198 (76.4%) | 10 (5.1%) |
| 25 to 29 Years | 106 (91.4%) | 0 (0.0%) |
| 30 to 34 Years | 94 (70.1%) | 0 (0.0%) |
| 35 to 44 Years | 418 (85.3%) | 0 (0.0%) |
| 45 to 54 Years | 243 (71.7%) | 0 (0.0%) |
| 55 to 59 Years | 112 (75.2%) | 0 (0.0%) |
| 60 to 64 Years | 68 (37.6%) | 0 (0.0%) |
| 65 to 74 Years | 17 (6.0%) | 0 (0.0%) |
| 75 Years and over | 0 (0.0%) | 0 (0.0%) |
| Total | 1,374 (58.6%) | 10 (0.7%) |
Employment Status by Educational Attainment in Oconto Falls
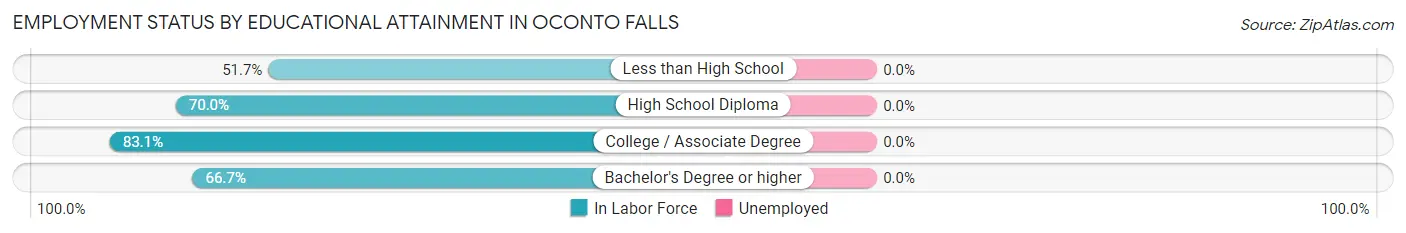
| Educational Attainment | In Labor Force | Unemployed |
| Less than High School | 89 (51.7%) | 0 (0.0%) |
| High School Diploma | 290 (70.0%) | 0 (0.0%) |
| College / Associate Degree | 574 (83.1%) | 0 (0.0%) |
| Bachelor's Degree or higher | 88 (66.7%) | 0 (0.0%) |
| Total | 1,041 (73.9%) | 0 (0.0%) |
Employment Occupations by Sex in Oconto Falls
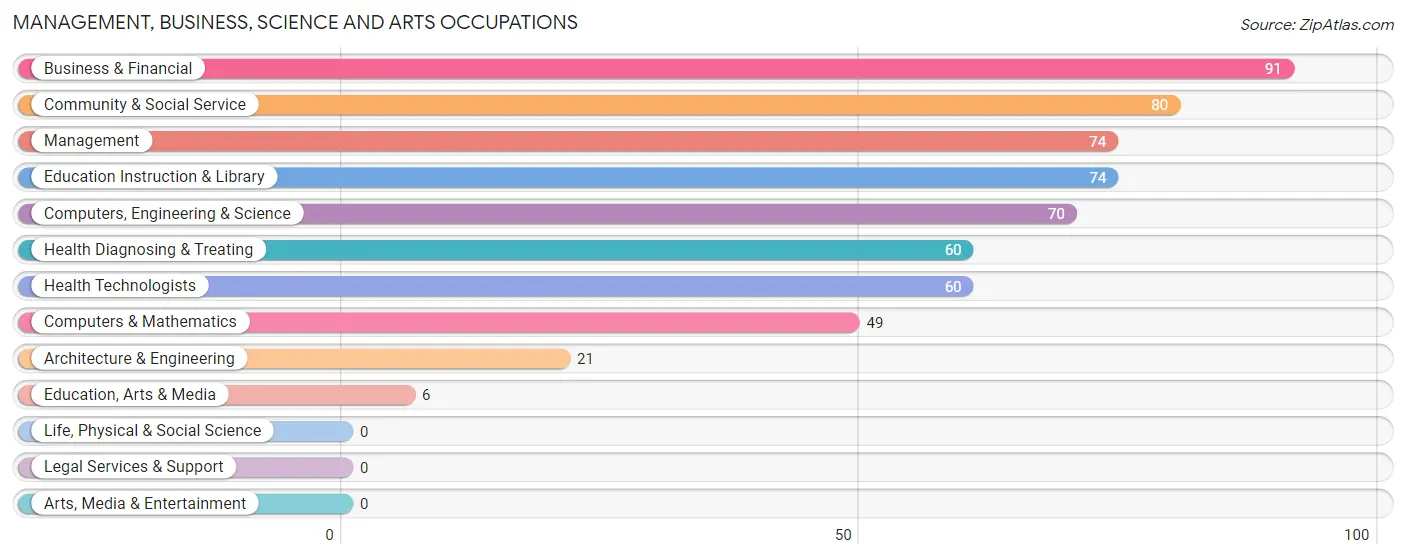
Management, Business, Science and Arts Occupations
The most common Management, Business, Science and Arts occupations in Oconto Falls are Business & Financial (91 | 6.7%), Community & Social Service (80 | 5.9%), Management (74 | 5.4%), Education Instruction & Library (74 | 5.4%), and Computers, Engineering & Science (70 | 5.1%).
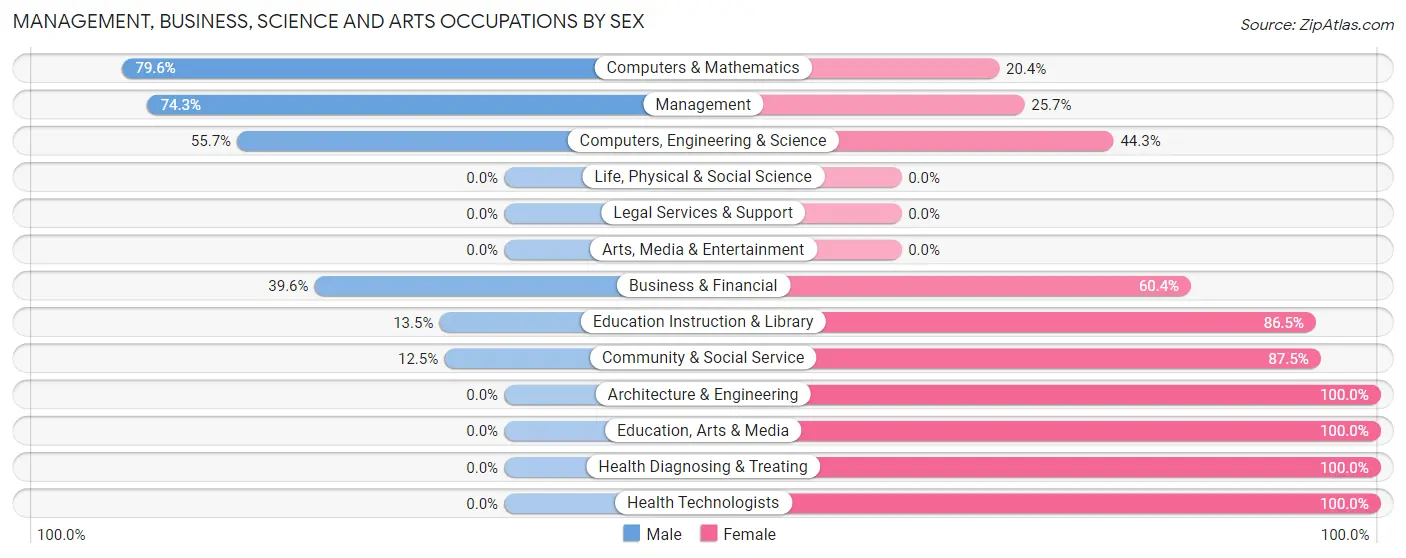
Management, Business, Science and Arts Occupations by Sex
Within the Management, Business, Science and Arts occupations in Oconto Falls, the most male-oriented occupations are Computers & Mathematics (79.6%), Management (74.3%), and Computers, Engineering & Science (55.7%), while the most female-oriented occupations are Architecture & Engineering (100.0%), Education, Arts & Media (100.0%), and Health Diagnosing & Treating (100.0%).
| Occupation | Male | Female |
| Management | 55 (74.3%) | 19 (25.7%) |
| Business & Financial | 36 (39.6%) | 55 (60.4%) |
| Computers, Engineering & Science | 39 (55.7%) | 31 (44.3%) |
| Computers & Mathematics | 39 (79.6%) | 10 (20.4%) |
| Architecture & Engineering | 0 (0.0%) | 21 (100.0%) |
| Life, Physical & Social Science | 0 (0.0%) | 0 (0.0%) |
| Community & Social Service | 10 (12.5%) | 70 (87.5%) |
| Education, Arts & Media | 0 (0.0%) | 6 (100.0%) |
| Legal Services & Support | 0 (0.0%) | 0 (0.0%) |
| Education Instruction & Library | 10 (13.5%) | 64 (86.5%) |
| Arts, Media & Entertainment | 0 (0.0%) | 0 (0.0%) |
| Health Diagnosing & Treating | 0 (0.0%) | 60 (100.0%) |
| Health Technologists | 0 (0.0%) | 60 (100.0%) |
| Total (Category) | 140 (37.3%) | 235 (62.7%) |
| Total (Overall) | 701 (51.4%) | 663 (48.6%) |
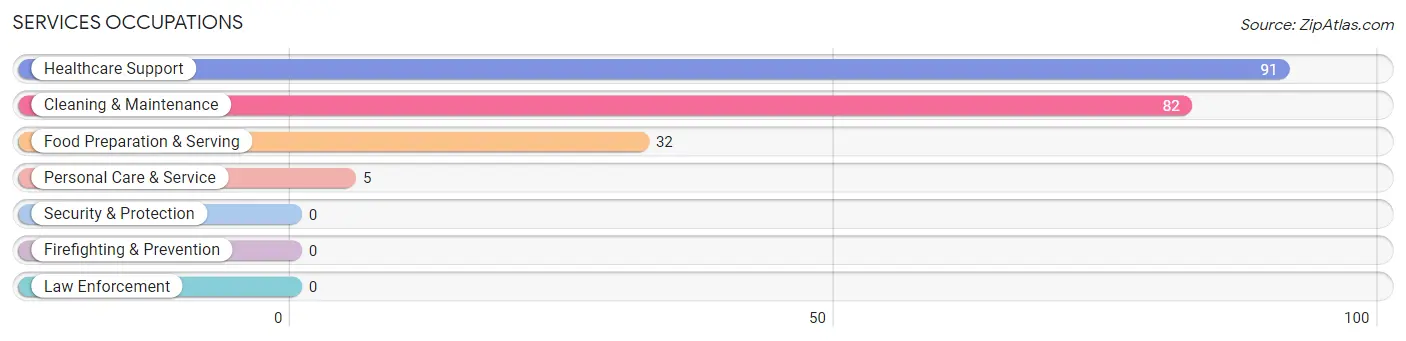
Services Occupations
The most common Services occupations in Oconto Falls are Healthcare Support (91 | 6.7%), Cleaning & Maintenance (82 | 6.0%), Food Preparation & Serving (32 | 2.4%), and Personal Care & Service (5 | 0.4%).
Services Occupations by Sex
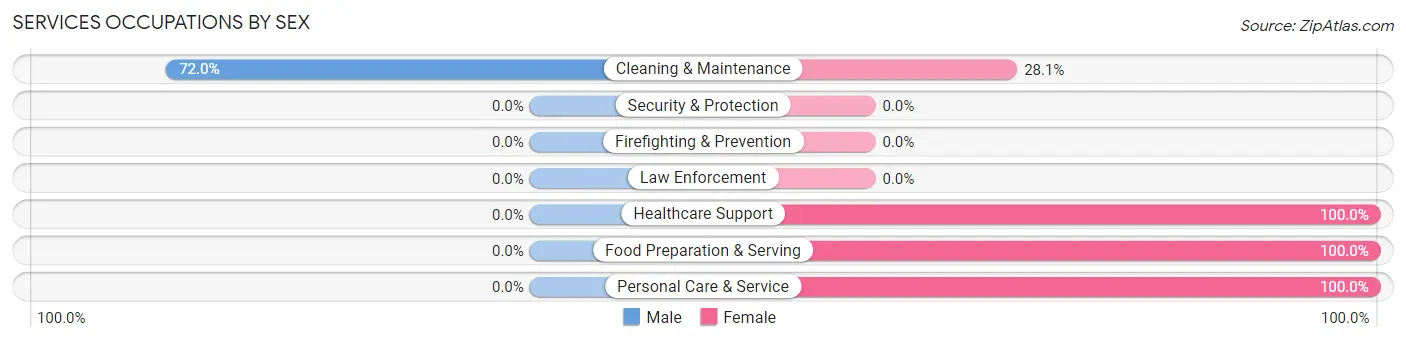
| Occupation | Male | Female |
| Healthcare Support | 0 (0.0%) | 91 (100.0%) |
| Security & Protection | 0 (0.0%) | 0 (0.0%) |
| Firefighting & Prevention | 0 (0.0%) | 0 (0.0%) |
| Law Enforcement | 0 (0.0%) | 0 (0.0%) |
| Food Preparation & Serving | 0 (0.0%) | 32 (100.0%) |
| Cleaning & Maintenance | 59 (72.0%) | 23 (28.1%) |
| Personal Care & Service | 0 (0.0%) | 5 (100.0%) |
| Total (Category) | 59 (28.1%) | 151 (71.9%) |
| Total (Overall) | 701 (51.4%) | 663 (48.6%) |
Sales and Office Occupations
The most common Sales and Office occupations in Oconto Falls are Office & Administration (91 | 6.7%), and Sales & Related (49 | 3.6%).
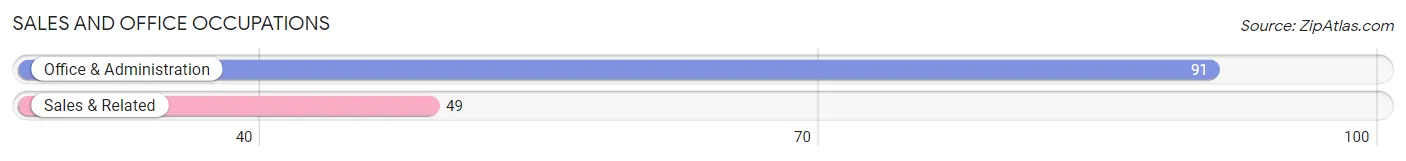
Sales and Office Occupations by Sex

| Occupation | Male | Female |
| Sales & Related | 30 (61.2%) | 19 (38.8%) |
| Office & Administration | 0 (0.0%) | 91 (100.0%) |
| Total (Category) | 30 (21.4%) | 110 (78.6%) |
| Total (Overall) | 701 (51.4%) | 663 (48.6%) |
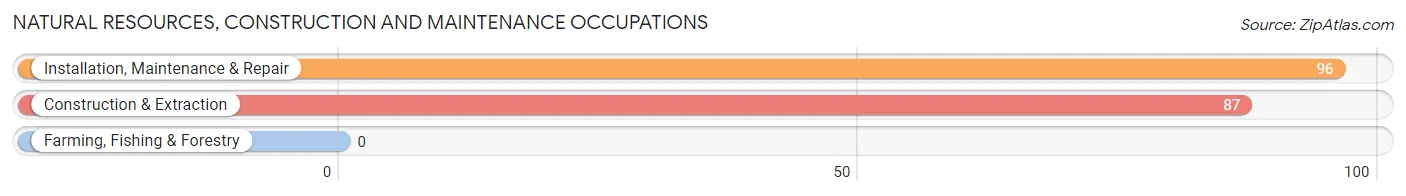
Natural Resources, Construction and Maintenance Occupations
The most common Natural Resources, Construction and Maintenance occupations in Oconto Falls are Installation, Maintenance & Repair (96 | 7.0%), and Construction & Extraction (87 | 6.4%).
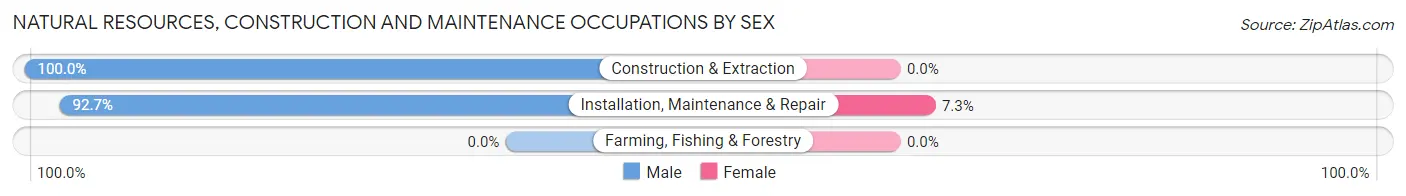
Natural Resources, Construction and Maintenance Occupations by Sex
| Occupation | Male | Female |
| Farming, Fishing & Forestry | 0 (0.0%) | 0 (0.0%) |
| Construction & Extraction | 87 (100.0%) | 0 (0.0%) |
| Installation, Maintenance & Repair | 89 (92.7%) | 7 (7.3%) |
| Total (Category) | 176 (96.2%) | 7 (3.8%) |
| Total (Overall) | 701 (51.4%) | 663 (48.6%) |
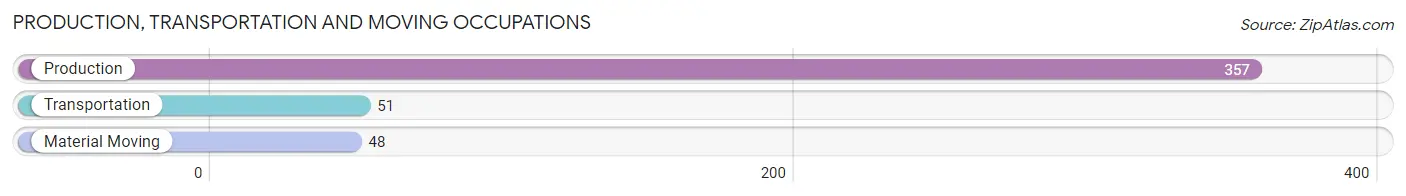
Production, Transportation and Moving Occupations
The most common Production, Transportation and Moving occupations in Oconto Falls are Production (357 | 26.2%), Transportation (51 | 3.7%), and Material Moving (48 | 3.5%).
Production, Transportation and Moving Occupations by Sex
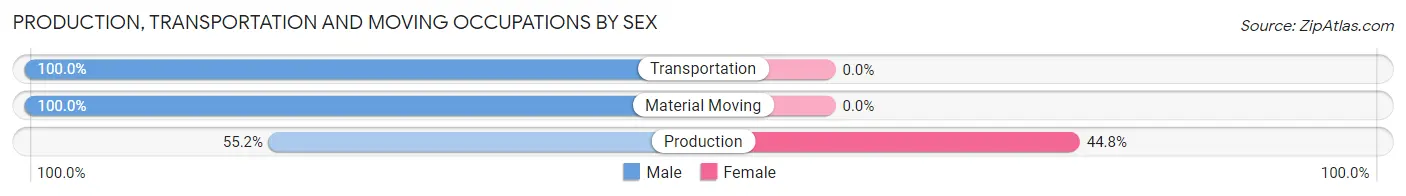
| Occupation | Male | Female |
| Production | 197 (55.2%) | 160 (44.8%) |
| Transportation | 51 (100.0%) | 0 (0.0%) |
| Material Moving | 48 (100.0%) | 0 (0.0%) |
| Total (Category) | 296 (64.9%) | 160 (35.1%) |
| Total (Overall) | 701 (51.4%) | 663 (48.6%) |
Employment Industries by Sex in Oconto Falls
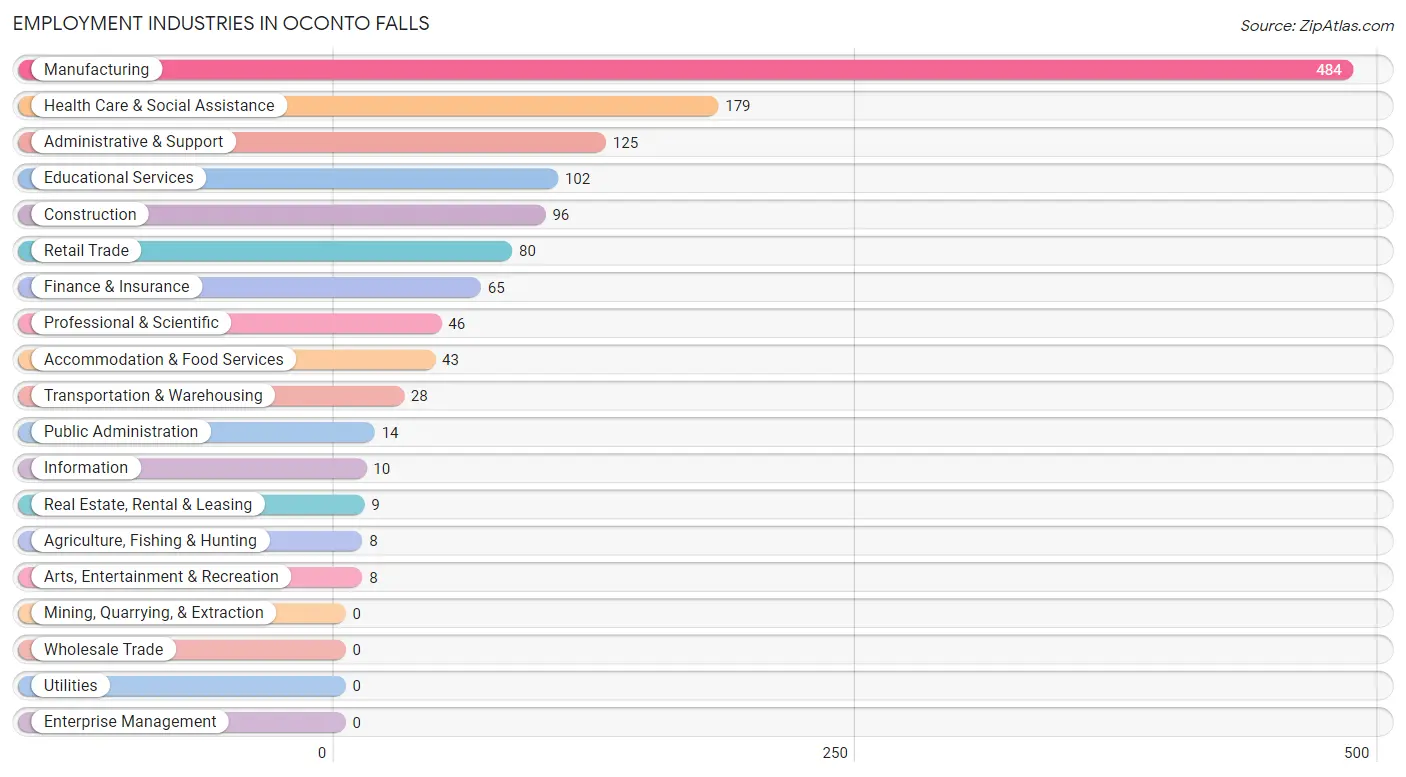
Employment Industries in Oconto Falls
The major employment industries in Oconto Falls include Manufacturing (484 | 35.5%), Health Care & Social Assistance (179 | 13.1%), Administrative & Support (125 | 9.2%), Educational Services (102 | 7.5%), and Construction (96 | 7.0%).
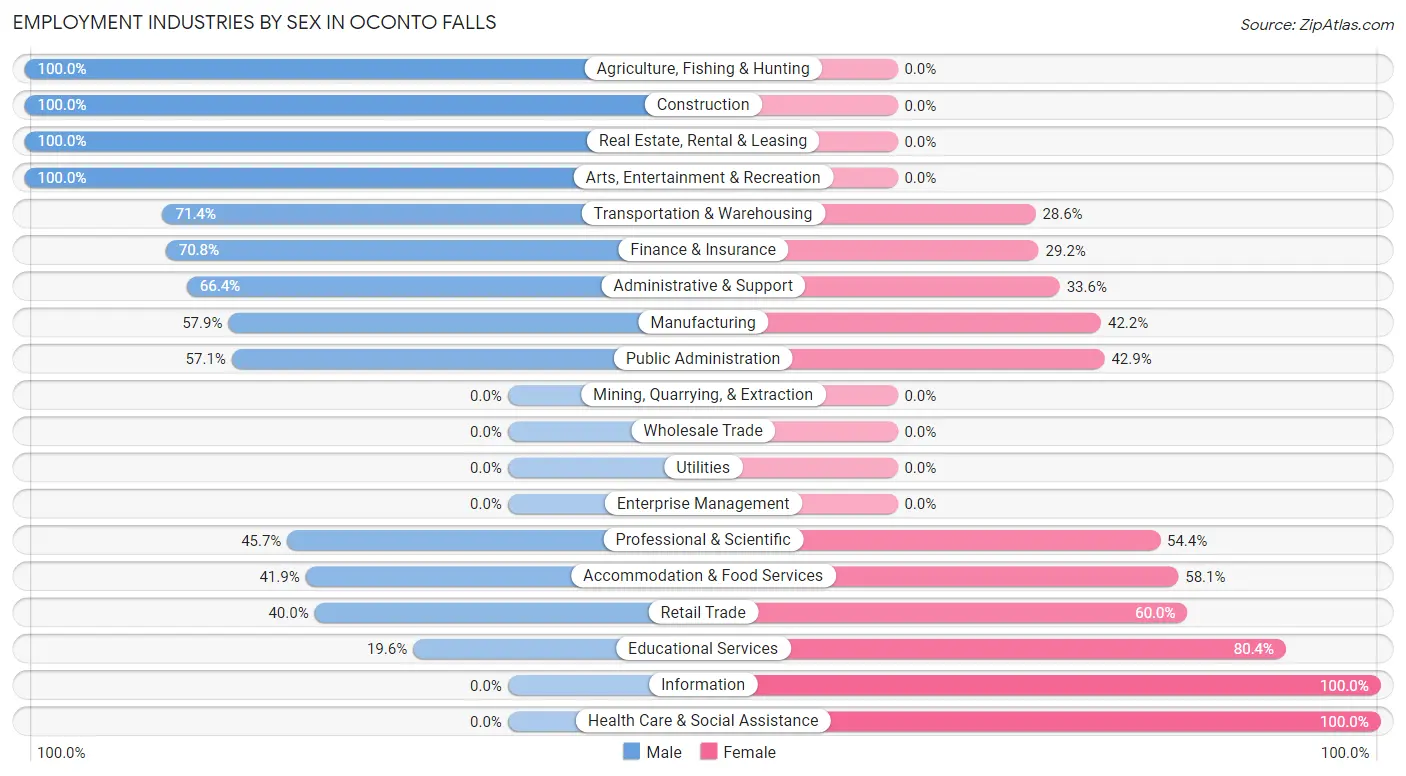
Employment Industries by Sex in Oconto Falls
The Oconto Falls industries that see more men than women are Agriculture, Fishing & Hunting (100.0%), Construction (100.0%), and Real Estate, Rental & Leasing (100.0%), whereas the industries that tend to have a higher number of women are Information (100.0%), Health Care & Social Assistance (100.0%), and Educational Services (80.4%).
| Industry | Male | Female |
| Agriculture, Fishing & Hunting | 8 (100.0%) | 0 (0.0%) |
| Mining, Quarrying, & Extraction | 0 (0.0%) | 0 (0.0%) |
| Construction | 96 (100.0%) | 0 (0.0%) |
| Manufacturing | 280 (57.9%) | 204 (42.1%) |
| Wholesale Trade | 0 (0.0%) | 0 (0.0%) |
| Retail Trade | 32 (40.0%) | 48 (60.0%) |
| Transportation & Warehousing | 20 (71.4%) | 8 (28.6%) |
| Utilities | 0 (0.0%) | 0 (0.0%) |
| Information | 0 (0.0%) | 10 (100.0%) |
| Finance & Insurance | 46 (70.8%) | 19 (29.2%) |
| Real Estate, Rental & Leasing | 9 (100.0%) | 0 (0.0%) |
| Professional & Scientific | 21 (45.7%) | 25 (54.3%) |
| Enterprise Management | 0 (0.0%) | 0 (0.0%) |
| Administrative & Support | 83 (66.4%) | 42 (33.6%) |
| Educational Services | 20 (19.6%) | 82 (80.4%) |
| Health Care & Social Assistance | 0 (0.0%) | 179 (100.0%) |
| Arts, Entertainment & Recreation | 8 (100.0%) | 0 (0.0%) |
| Accommodation & Food Services | 18 (41.9%) | 25 (58.1%) |
| Public Administration | 8 (57.1%) | 6 (42.9%) |
| Total | 701 (51.4%) | 663 (48.6%) |
Education in Oconto Falls
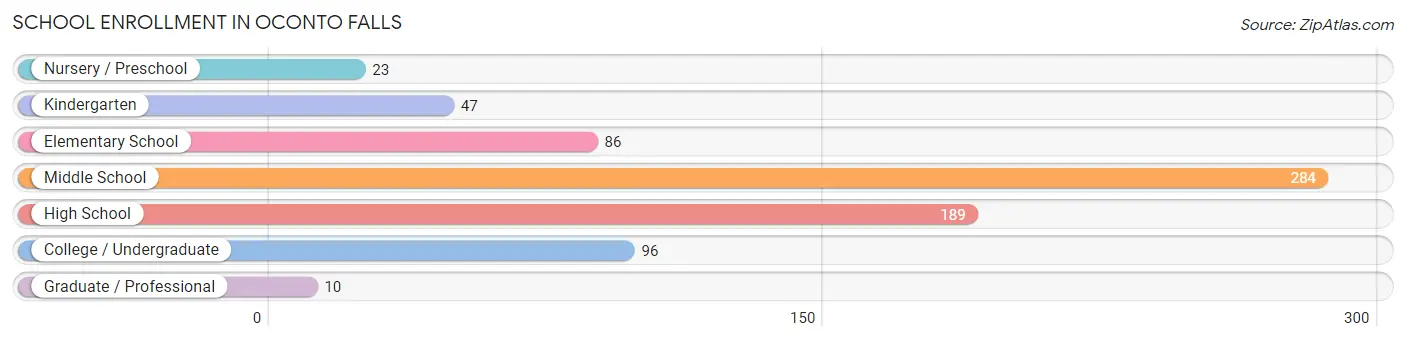
School Enrollment in Oconto Falls
The most common levels of schooling among the 735 students in Oconto Falls are middle school (284 | 38.6%), high school (189 | 25.7%), and college / undergraduate (96 | 13.1%).
| School Level | # Students | % Students |
| Nursery / Preschool | 23 | 3.1% |
| Kindergarten | 47 | 6.4% |
| Elementary School | 86 | 11.7% |
| Middle School | 284 | 38.6% |
| High School | 189 | 25.7% |
| College / Undergraduate | 96 | 13.1% |
| Graduate / Professional | 10 | 1.4% |
| Total | 735 | 100.0% |
School Enrollment by Age by Funding Source in Oconto Falls
Out of a total of 735 students who are enrolled in schools in Oconto Falls, 49 (6.7%) attend a private institution, while the remaining 686 (93.3%) are enrolled in public schools. The age group of 5 to 9 year old has the highest likelihood of being enrolled in private schools, with 24 (18.3% in the age bracket) enrolled. Conversely, the age group of 3 to 4 year olds has the lowest likelihood of being enrolled in a private school, with 16 (100.0% in the age bracket) attending a public institution.
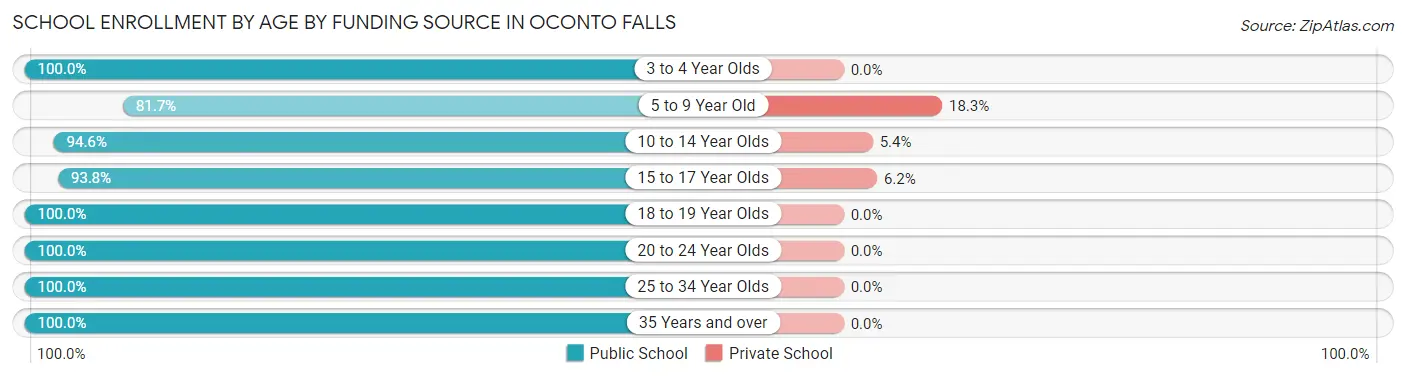
| Age Bracket | Public School | Private School |
| 3 to 4 Year Olds | 16 (100.0%) | 0 (0.0%) |
| 5 to 9 Year Old | 107 (81.7%) | 24 (18.3%) |
| 10 to 14 Year Olds | 297 (94.6%) | 17 (5.4%) |
| 15 to 17 Year Olds | 121 (93.8%) | 8 (6.2%) |
| 18 to 19 Year Olds | 64 (100.0%) | 0 (0.0%) |
| 20 to 24 Year Olds | 29 (100.0%) | 0 (0.0%) |
| 25 to 34 Year Olds | 19 (100.0%) | 0 (0.0%) |
| 35 Years and over | 33 (100.0%) | 0 (0.0%) |
| Total | 686 (93.3%) | 49 (6.7%) |
Educational Attainment by Field of Study in Oconto Falls
Education (101 | 31.0%), science & technology (77 | 23.6%), business (49 | 15.0%), literature & languages (25 | 7.7%), and communications (15 | 4.6%) are the most common fields of study among 326 individuals in Oconto Falls who have obtained a bachelor's degree or higher.
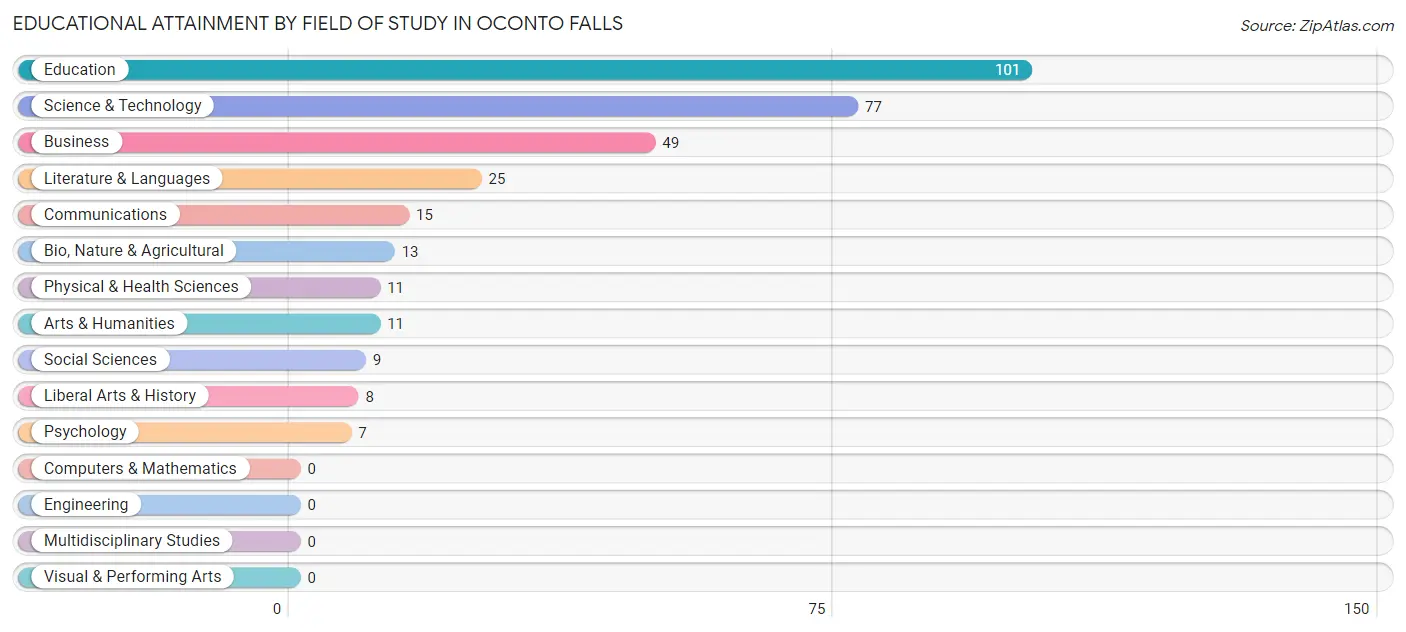
| Field of Study | # Graduates | % Graduates |
| Computers & Mathematics | 0 | 0.0% |
| Bio, Nature & Agricultural | 13 | 4.0% |
| Physical & Health Sciences | 11 | 3.4% |
| Psychology | 7 | 2.1% |
| Social Sciences | 9 | 2.8% |
| Engineering | 0 | 0.0% |
| Multidisciplinary Studies | 0 | 0.0% |
| Science & Technology | 77 | 23.6% |
| Business | 49 | 15.0% |
| Education | 101 | 31.0% |
| Literature & Languages | 25 | 7.7% |
| Liberal Arts & History | 8 | 2.5% |
| Visual & Performing Arts | 0 | 0.0% |
| Communications | 15 | 4.6% |
| Arts & Humanities | 11 | 3.4% |
| Total | 326 | 100.0% |
Transportation & Commute in Oconto Falls
Vehicle Availability by Sex in Oconto Falls
The most prevalent vehicle ownership categories in Oconto Falls are males with 2 vehicles (319, accounting for 46.0%) and females with 2 vehicles (298, making up 49.4%).
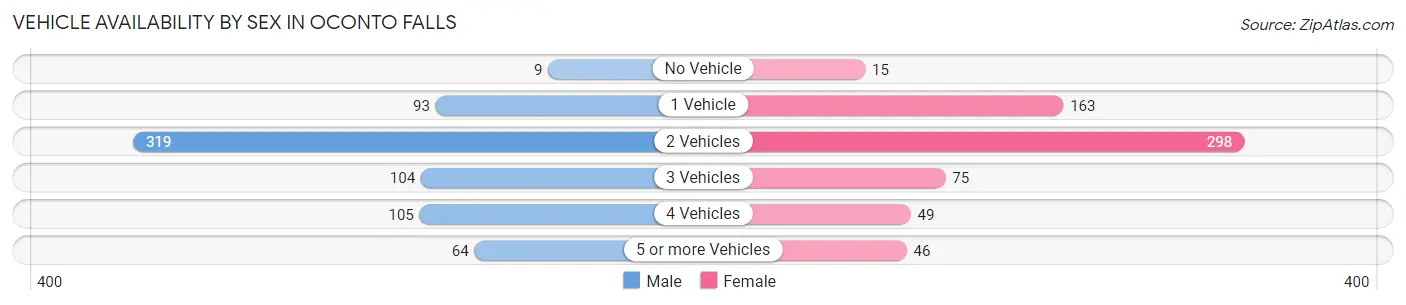
| Vehicles Available | Male | Female |
| No Vehicle | 9 (1.3%) | 15 (2.3%) |
| 1 Vehicle | 93 (13.4%) | 163 (25.2%) |
| 2 Vehicles | 319 (46.0%) | 298 (46.1%) |
| 3 Vehicles | 104 (15.0%) | 75 (11.6%) |
| 4 Vehicles | 105 (15.1%) | 49 (7.6%) |
| 5 or more Vehicles | 64 (9.2%) | 46 (7.1%) |
| Total | 694 (100.0%) | 646 (100.0%) |
Commute Time in Oconto Falls
The most frequently occuring commute durations in Oconto Falls are 35 to 39 minutes (219 commuters, 17.3%), 5 to 9 minutes (200 commuters, 15.8%), and 45 to 59 minutes (190 commuters, 15.0%).
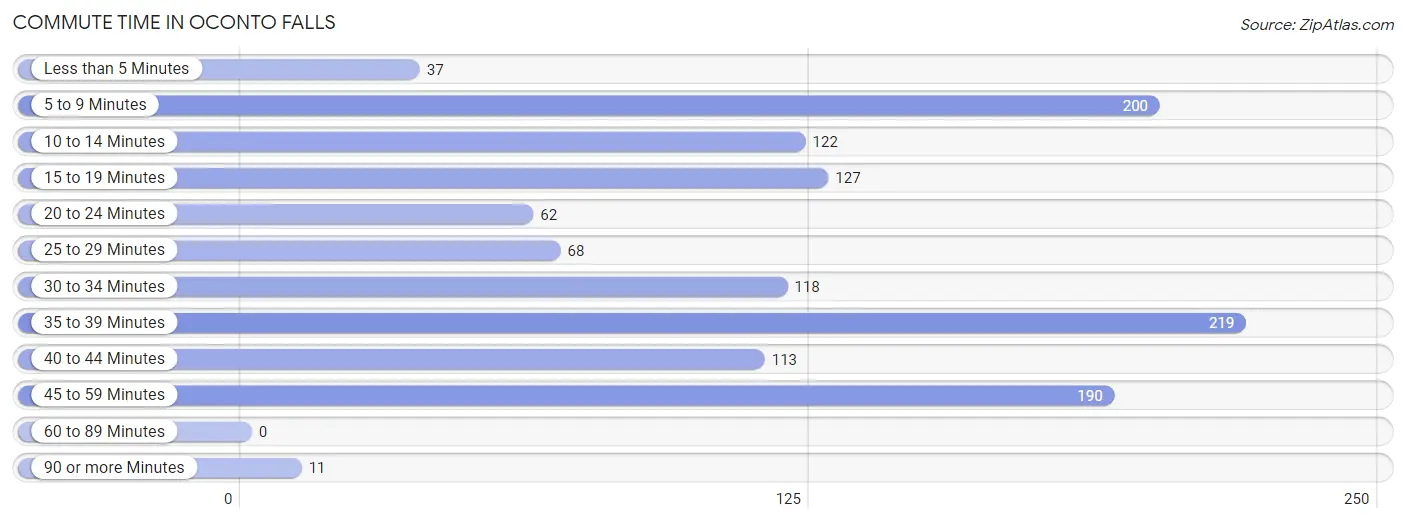
| Commute Time | # Commuters | % Commuters |
| Less than 5 Minutes | 37 | 2.9% |
| 5 to 9 Minutes | 200 | 15.8% |
| 10 to 14 Minutes | 122 | 9.6% |
| 15 to 19 Minutes | 127 | 10.0% |
| 20 to 24 Minutes | 62 | 4.9% |
| 25 to 29 Minutes | 68 | 5.4% |
| 30 to 34 Minutes | 118 | 9.3% |
| 35 to 39 Minutes | 219 | 17.3% |
| 40 to 44 Minutes | 113 | 8.9% |
| 45 to 59 Minutes | 190 | 15.0% |
| 60 to 89 Minutes | 0 | 0.0% |
| 90 or more Minutes | 11 | 0.9% |
Commute Time by Sex in Oconto Falls
The most common commute times in Oconto Falls are 40 to 44 minutes (113 commuters, 16.6%) for males and 35 to 39 minutes (131 commuters, 22.4%) for females.
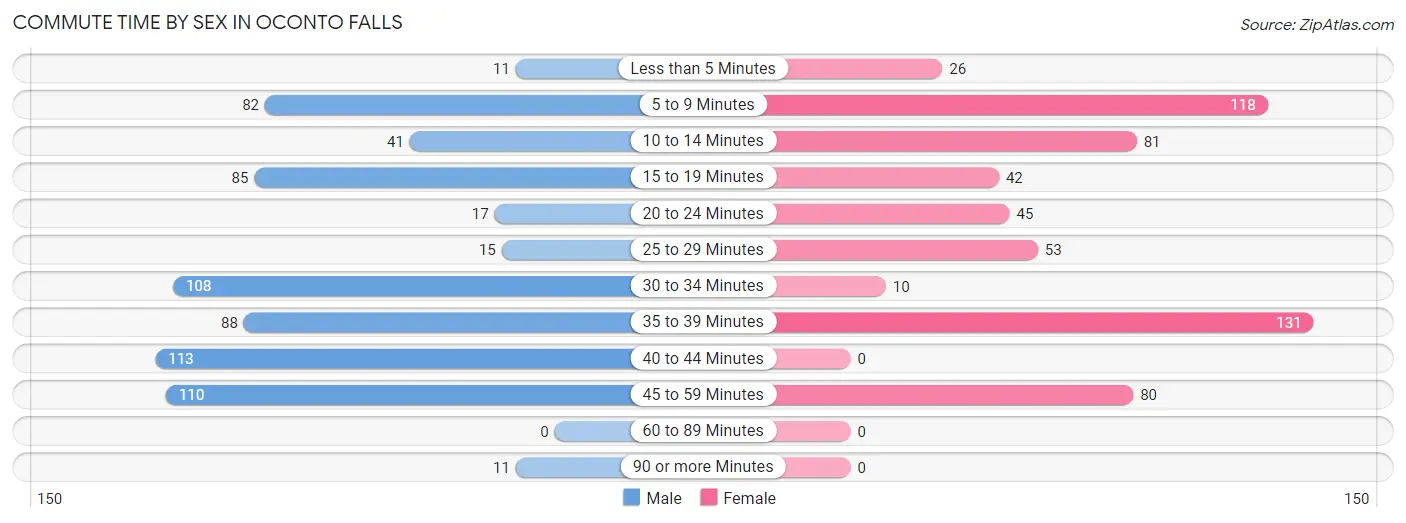
| Commute Time | Male | Female |
| Less than 5 Minutes | 11 (1.6%) | 26 (4.4%) |
| 5 to 9 Minutes | 82 (12.0%) | 118 (20.1%) |
| 10 to 14 Minutes | 41 (6.0%) | 81 (13.8%) |
| 15 to 19 Minutes | 85 (12.5%) | 42 (7.2%) |
| 20 to 24 Minutes | 17 (2.5%) | 45 (7.7%) |
| 25 to 29 Minutes | 15 (2.2%) | 53 (9.0%) |
| 30 to 34 Minutes | 108 (15.9%) | 10 (1.7%) |
| 35 to 39 Minutes | 88 (12.9%) | 131 (22.4%) |
| 40 to 44 Minutes | 113 (16.6%) | 0 (0.0%) |
| 45 to 59 Minutes | 110 (16.2%) | 80 (13.7%) |
| 60 to 89 Minutes | 0 (0.0%) | 0 (0.0%) |
| 90 or more Minutes | 11 (1.6%) | 0 (0.0%) |
Time of Departure to Work by Sex in Oconto Falls
The most frequent times of departure to work in Oconto Falls are 5:00 AM to 5:29 AM (128, 18.8%) for males and 7:30 AM to 7:59 AM (120, 20.5%) for females.
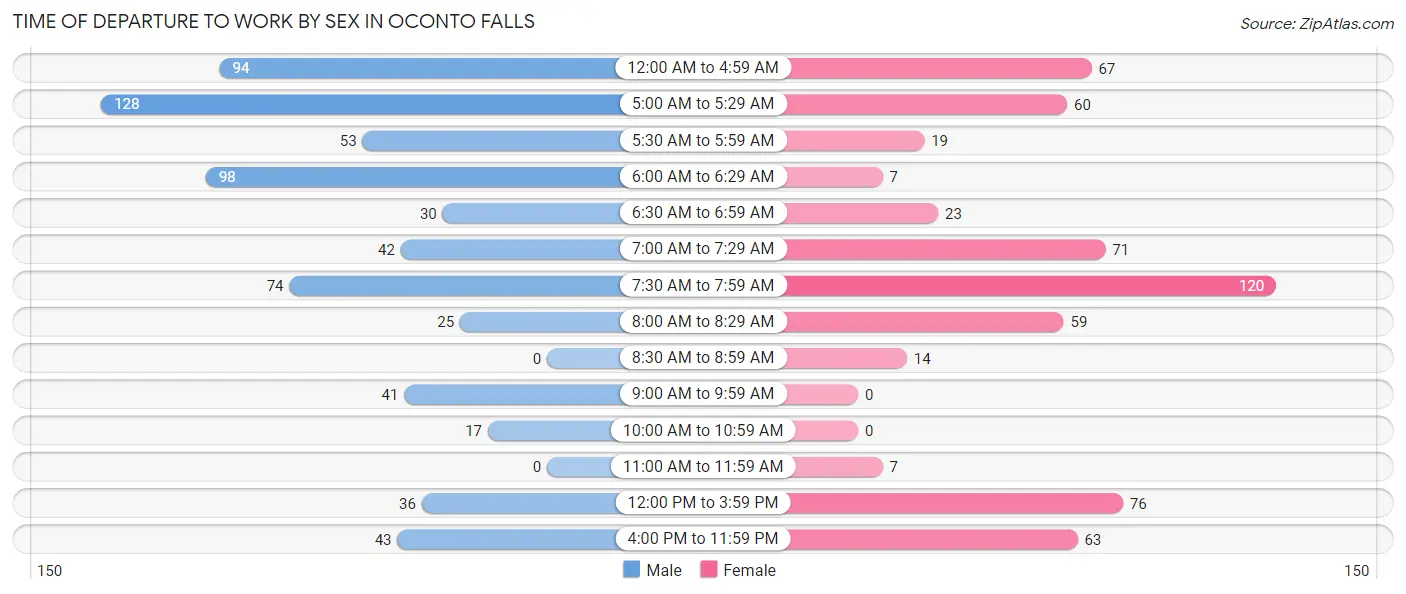
| Time of Departure | Male | Female |
| 12:00 AM to 4:59 AM | 94 (13.8%) | 67 (11.4%) |
| 5:00 AM to 5:29 AM | 128 (18.8%) | 60 (10.2%) |
| 5:30 AM to 5:59 AM | 53 (7.8%) | 19 (3.2%) |
| 6:00 AM to 6:29 AM | 98 (14.4%) | 7 (1.2%) |
| 6:30 AM to 6:59 AM | 30 (4.4%) | 23 (3.9%) |
| 7:00 AM to 7:29 AM | 42 (6.2%) | 71 (12.1%) |
| 7:30 AM to 7:59 AM | 74 (10.9%) | 120 (20.5%) |
| 8:00 AM to 8:29 AM | 25 (3.7%) | 59 (10.1%) |
| 8:30 AM to 8:59 AM | 0 (0.0%) | 14 (2.4%) |
| 9:00 AM to 9:59 AM | 41 (6.0%) | 0 (0.0%) |
| 10:00 AM to 10:59 AM | 17 (2.5%) | 0 (0.0%) |
| 11:00 AM to 11:59 AM | 0 (0.0%) | 7 (1.2%) |
| 12:00 PM to 3:59 PM | 36 (5.3%) | 76 (13.0%) |
| 4:00 PM to 11:59 PM | 43 (6.3%) | 63 (10.7%) |
| Total | 681 (100.0%) | 586 (100.0%) |
Housing Occupancy in Oconto Falls
Occupancy by Ownership in Oconto Falls
Of the total 1,268 dwellings in Oconto Falls, owner-occupied units account for 700 (55.2%), while renter-occupied units make up 568 (44.8%).
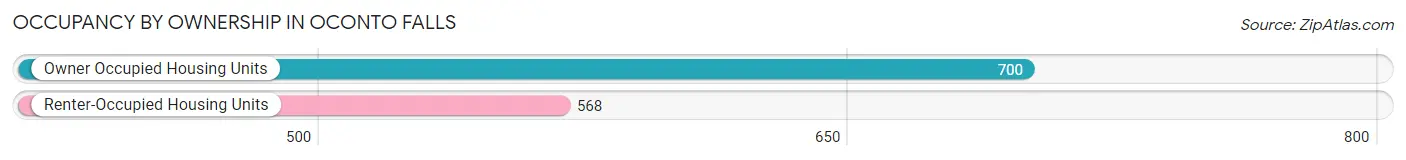
| Occupancy | # Housing Units | % Housing Units |
| Owner Occupied Housing Units | 700 | 55.2% |
| Renter-Occupied Housing Units | 568 | 44.8% |
| Total Occupied Housing Units | 1,268 | 100.0% |
Occupancy by Household Size in Oconto Falls
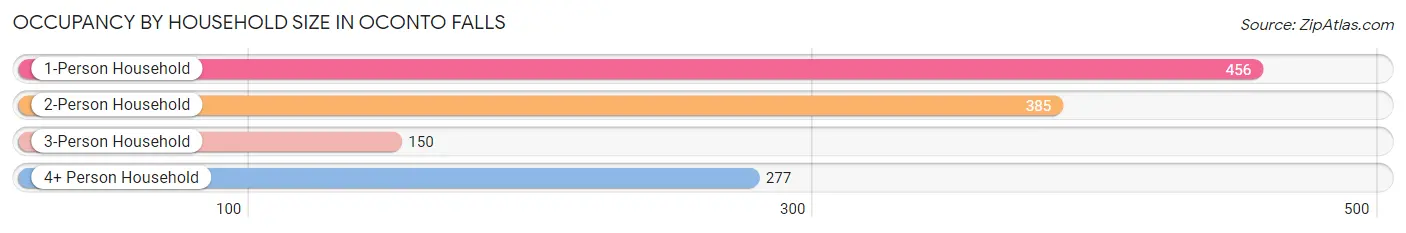
| Household Size | # Housing Units | % Housing Units |
| 1-Person Household | 456 | 36.0% |
| 2-Person Household | 385 | 30.4% |
| 3-Person Household | 150 | 11.8% |
| 4+ Person Household | 277 | 21.8% |
| Total Housing Units | 1,268 | 100.0% |
Occupancy by Ownership by Household Size in Oconto Falls
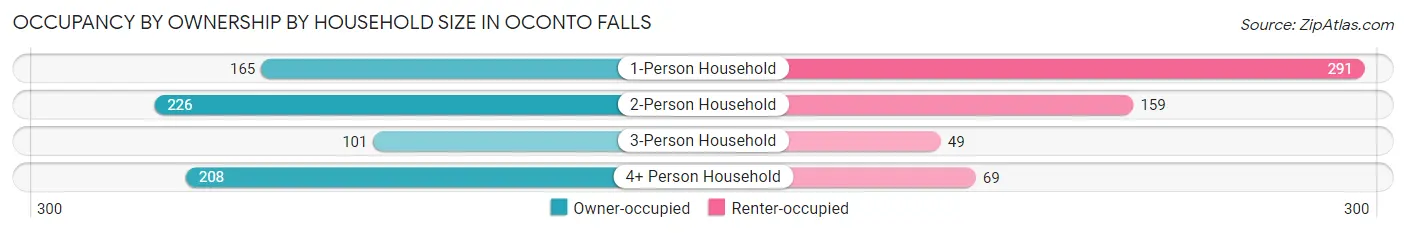
| Household Size | Owner-occupied | Renter-occupied |
| 1-Person Household | 165 (36.2%) | 291 (63.8%) |
| 2-Person Household | 226 (58.7%) | 159 (41.3%) |
| 3-Person Household | 101 (67.3%) | 49 (32.7%) |
| 4+ Person Household | 208 (75.1%) | 69 (24.9%) |
| Total Housing Units | 700 (55.2%) | 568 (44.8%) |
Occupancy by Educational Attainment in Oconto Falls
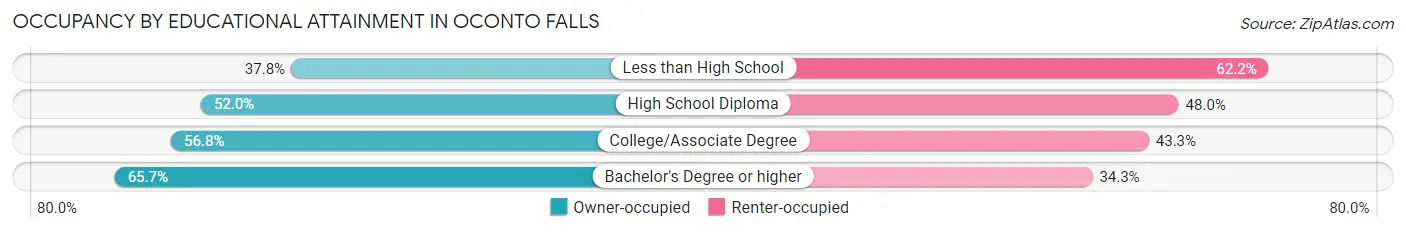
| Household Size | Owner-occupied | Renter-occupied |
| Less than High School | 37 (37.8%) | 61 (62.2%) |
| High School Diploma | 180 (52.0%) | 166 (48.0%) |
| College/Associate Degree | 370 (56.8%) | 282 (43.2%) |
| Bachelor's Degree or higher | 113 (65.7%) | 59 (34.3%) |
Occupancy by Age of Householder in Oconto Falls
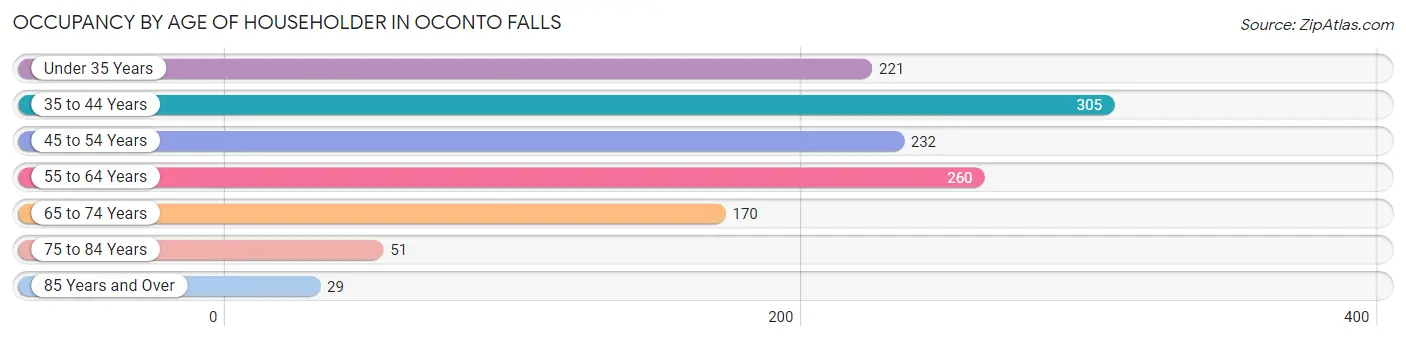
| Age Bracket | # Households | % Households |
| Under 35 Years | 221 | 17.4% |
| 35 to 44 Years | 305 | 24.0% |
| 45 to 54 Years | 232 | 18.3% |
| 55 to 64 Years | 260 | 20.5% |
| 65 to 74 Years | 170 | 13.4% |
| 75 to 84 Years | 51 | 4.0% |
| 85 Years and Over | 29 | 2.3% |
| Total | 1,268 | 100.0% |
Housing Finances in Oconto Falls
Median Income by Occupancy in Oconto Falls
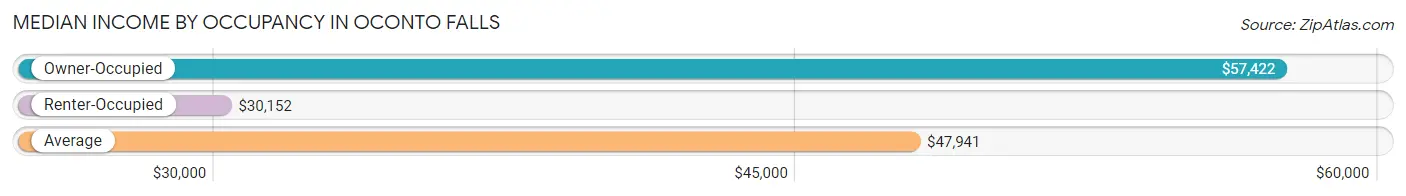
| Occupancy Type | # Households | Median Income |
| Owner-Occupied | 700 (55.2%) | $57,422 |
| Renter-Occupied | 568 (44.8%) | $30,152 |
| Average | 1,268 (100.0%) | $47,941 |
Occupancy by Householder Income Bracket in Oconto Falls
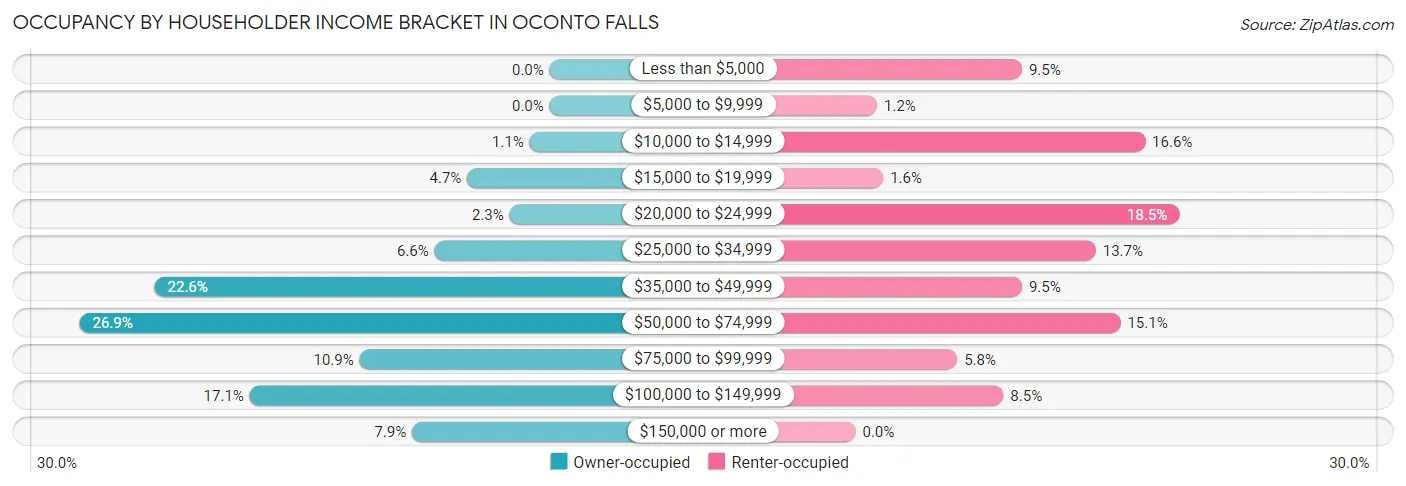
| Income Bracket | Owner-occupied | Renter-occupied |
| Less than $5,000 | 0 (0.0%) | 54 (9.5%) |
| $5,000 to $9,999 | 0 (0.0%) | 7 (1.2%) |
| $10,000 to $14,999 | 8 (1.1%) | 94 (16.6%) |
| $15,000 to $19,999 | 33 (4.7%) | 9 (1.6%) |
| $20,000 to $24,999 | 16 (2.3%) | 105 (18.5%) |
| $25,000 to $34,999 | 46 (6.6%) | 78 (13.7%) |
| $35,000 to $49,999 | 158 (22.6%) | 54 (9.5%) |
| $50,000 to $74,999 | 188 (26.9%) | 86 (15.1%) |
| $75,000 to $99,999 | 76 (10.9%) | 33 (5.8%) |
| $100,000 to $149,999 | 120 (17.1%) | 48 (8.5%) |
| $150,000 or more | 55 (7.9%) | 0 (0.0%) |
| Total | 700 (100.0%) | 568 (100.0%) |
Monthly Housing Cost Tiers in Oconto Falls
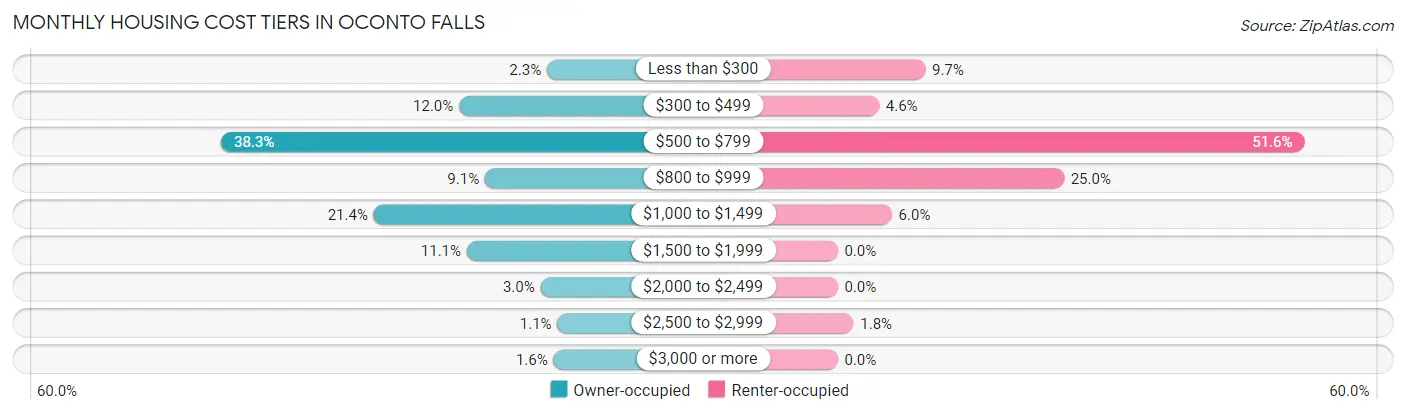
| Monthly Cost | Owner-occupied | Renter-occupied |
| Less than $300 | 16 (2.3%) | 55 (9.7%) |
| $300 to $499 | 84 (12.0%) | 26 (4.6%) |
| $500 to $799 | 268 (38.3%) | 293 (51.6%) |
| $800 to $999 | 64 (9.1%) | 142 (25.0%) |
| $1,000 to $1,499 | 150 (21.4%) | 34 (6.0%) |
| $1,500 to $1,999 | 78 (11.1%) | 0 (0.0%) |
| $2,000 to $2,499 | 21 (3.0%) | 0 (0.0%) |
| $2,500 to $2,999 | 8 (1.1%) | 10 (1.8%) |
| $3,000 or more | 11 (1.6%) | 0 (0.0%) |
| Total | 700 (100.0%) | 568 (100.0%) |
Physical Housing Characteristics in Oconto Falls
Housing Structures in Oconto Falls
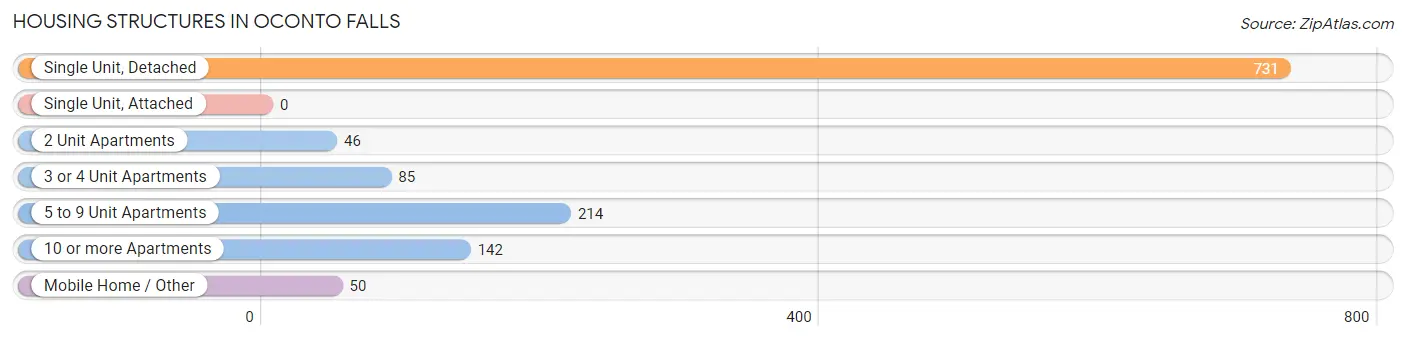
| Structure Type | # Housing Units | % Housing Units |
| Single Unit, Detached | 731 | 57.7% |
| Single Unit, Attached | 0 | 0.0% |
| 2 Unit Apartments | 46 | 3.6% |
| 3 or 4 Unit Apartments | 85 | 6.7% |
| 5 to 9 Unit Apartments | 214 | 16.9% |
| 10 or more Apartments | 142 | 11.2% |
| Mobile Home / Other | 50 | 3.9% |
| Total | 1,268 | 100.0% |
Housing Structures by Occupancy in Oconto Falls
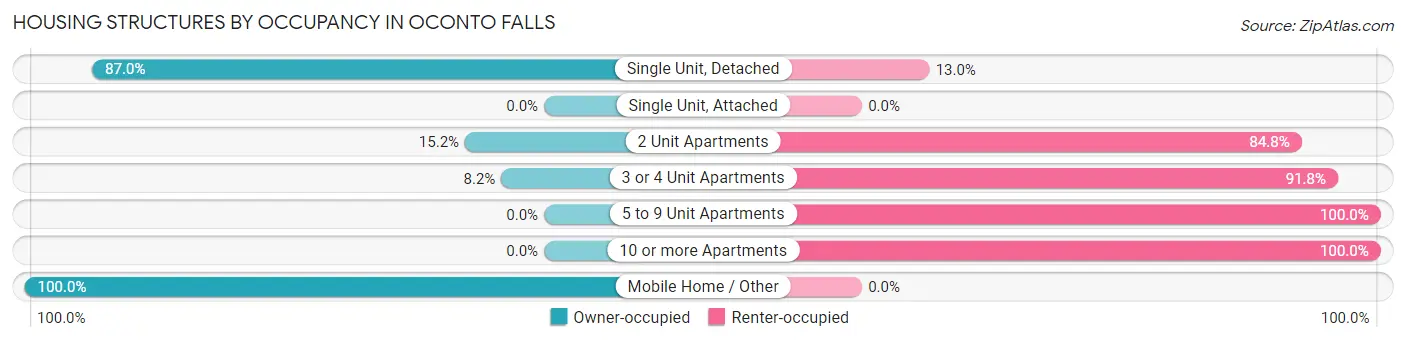
| Structure Type | Owner-occupied | Renter-occupied |
| Single Unit, Detached | 636 (87.0%) | 95 (13.0%) |
| Single Unit, Attached | 0 (0.0%) | 0 (0.0%) |
| 2 Unit Apartments | 7 (15.2%) | 39 (84.8%) |
| 3 or 4 Unit Apartments | 7 (8.2%) | 78 (91.8%) |
| 5 to 9 Unit Apartments | 0 (0.0%) | 214 (100.0%) |
| 10 or more Apartments | 0 (0.0%) | 142 (100.0%) |
| Mobile Home / Other | 50 (100.0%) | 0 (0.0%) |
| Total | 700 (55.2%) | 568 (44.8%) |
Housing Structures by Number of Rooms in Oconto Falls
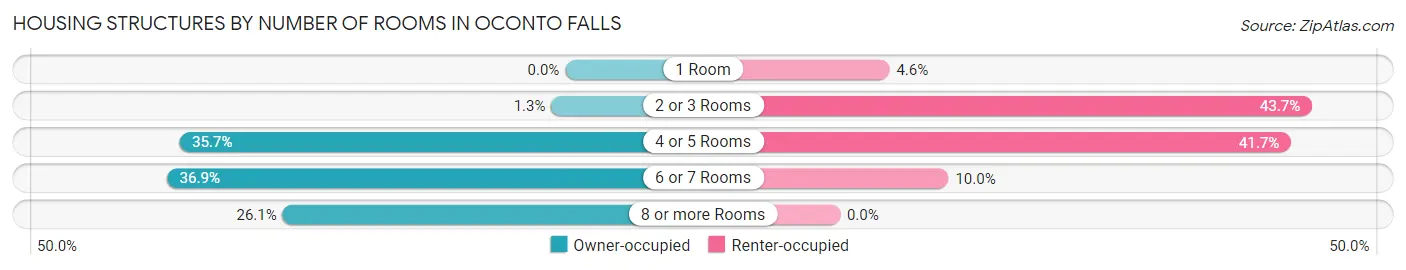
| Number of Rooms | Owner-occupied | Renter-occupied |
| 1 Room | 0 (0.0%) | 26 (4.6%) |
| 2 or 3 Rooms | 9 (1.3%) | 248 (43.7%) |
| 4 or 5 Rooms | 250 (35.7%) | 237 (41.7%) |
| 6 or 7 Rooms | 258 (36.9%) | 57 (10.0%) |
| 8 or more Rooms | 183 (26.1%) | 0 (0.0%) |
| Total | 700 (100.0%) | 568 (100.0%) |
Housing Structure by Heating Type in Oconto Falls
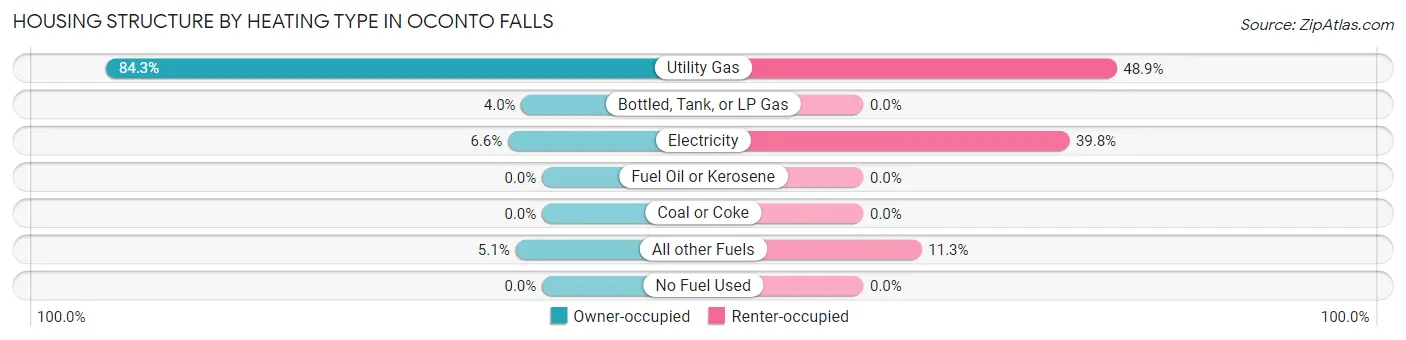
| Heating Type | Owner-occupied | Renter-occupied |
| Utility Gas | 590 (84.3%) | 278 (48.9%) |
| Bottled, Tank, or LP Gas | 28 (4.0%) | 0 (0.0%) |
| Electricity | 46 (6.6%) | 226 (39.8%) |
| Fuel Oil or Kerosene | 0 (0.0%) | 0 (0.0%) |
| Coal or Coke | 0 (0.0%) | 0 (0.0%) |
| All other Fuels | 36 (5.1%) | 64 (11.3%) |
| No Fuel Used | 0 (0.0%) | 0 (0.0%) |
| Total | 700 (100.0%) | 568 (100.0%) |
Household Vehicle Usage in Oconto Falls
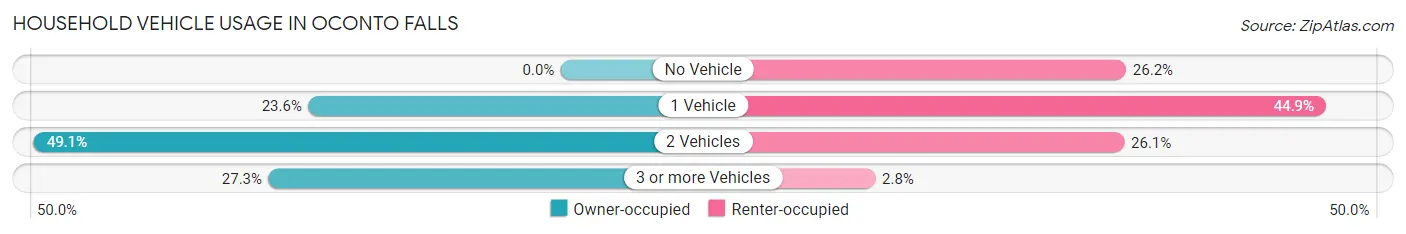
| Vehicles per Household | Owner-occupied | Renter-occupied |
| No Vehicle | 0 (0.0%) | 149 (26.2%) |
| 1 Vehicle | 165 (23.6%) | 255 (44.9%) |
| 2 Vehicles | 344 (49.1%) | 148 (26.1%) |
| 3 or more Vehicles | 191 (27.3%) | 16 (2.8%) |
| Total | 700 (100.0%) | 568 (100.0%) |
Real Estate & Mortgages in Oconto Falls
Real Estate and Mortgage Overview in Oconto Falls
| Characteristic | Without Mortgage | With Mortgage |
| Housing Units | 364 | 336 |
| Median Property Value | $138,700 | $136,600 |
| Median Household Income | $51,058 | $41 |
| Monthly Housing Costs | $586 | $0 |
| Real Estate Taxes | $2,634 | $0 |
Property Value by Mortgage Status in Oconto Falls
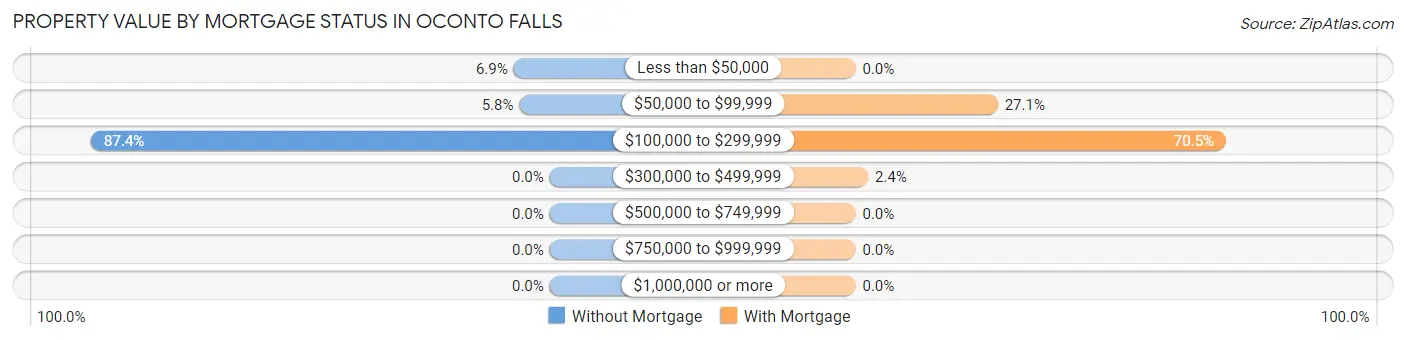
| Property Value | Without Mortgage | With Mortgage |
| Less than $50,000 | 25 (6.9%) | 0 (0.0%) |
| $50,000 to $99,999 | 21 (5.8%) | 91 (27.1%) |
| $100,000 to $299,999 | 318 (87.4%) | 237 (70.5%) |
| $300,000 to $499,999 | 0 (0.0%) | 8 (2.4%) |
| $500,000 to $749,999 | 0 (0.0%) | 0 (0.0%) |
| $750,000 to $999,999 | 0 (0.0%) | 0 (0.0%) |
| $1,000,000 or more | 0 (0.0%) | 0 (0.0%) |
| Total | 364 (100.0%) | 336 (100.0%) |
Household Income by Mortgage Status in Oconto Falls
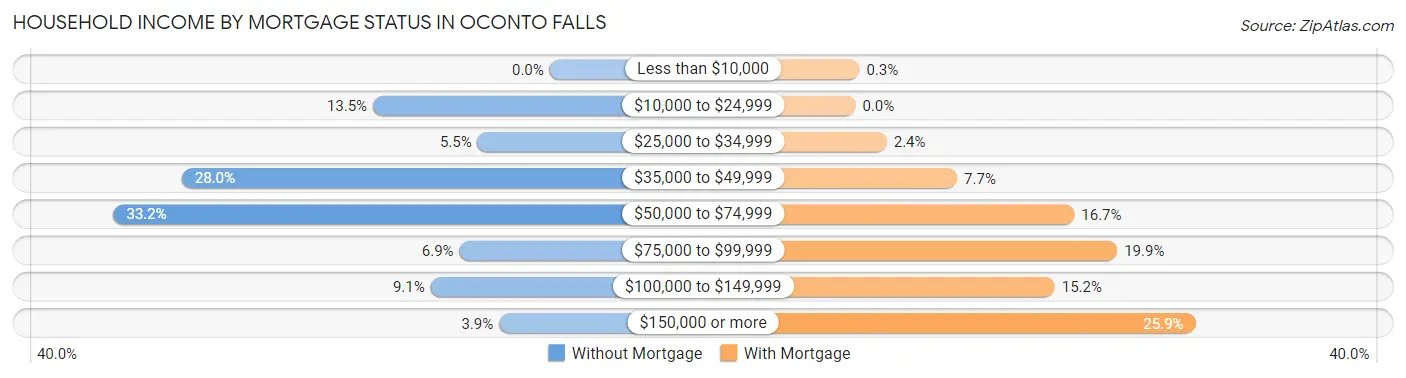
| Household Income | Without Mortgage | With Mortgage |
| Less than $10,000 | 0 (0.0%) | 1 (0.3%) |
| $10,000 to $24,999 | 49 (13.5%) | 0 (0.0%) |
| $25,000 to $34,999 | 20 (5.5%) | 8 (2.4%) |
| $35,000 to $49,999 | 102 (28.0%) | 26 (7.7%) |
| $50,000 to $74,999 | 121 (33.2%) | 56 (16.7%) |
| $75,000 to $99,999 | 25 (6.9%) | 67 (19.9%) |
| $100,000 to $149,999 | 33 (9.1%) | 51 (15.2%) |
| $150,000 or more | 14 (3.8%) | 87 (25.9%) |
| Total | 364 (100.0%) | 336 (100.0%) |
Property Value to Household Income Ratio in Oconto Falls
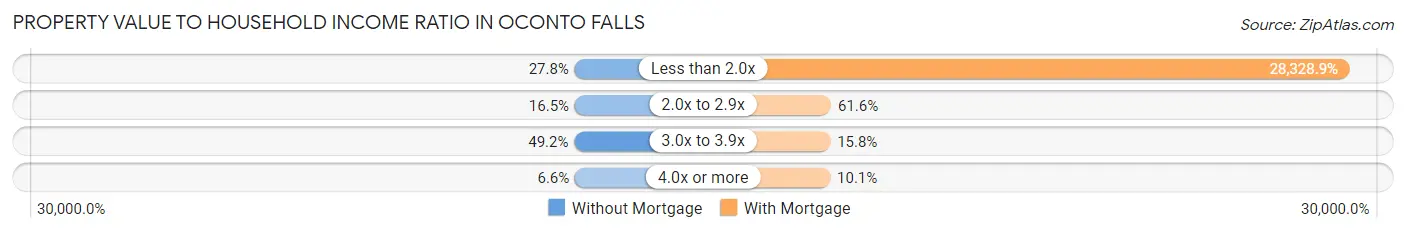
| Value-to-Income Ratio | Without Mortgage | With Mortgage |
| Less than 2.0x | 101 (27.8%) | 95,185 (28,328.9%) |
| 2.0x to 2.9x | 60 (16.5%) | 207 (61.6%) |
| 3.0x to 3.9x | 179 (49.2%) | 53 (15.8%) |
| 4.0x or more | 24 (6.6%) | 34 (10.1%) |
| Total | 364 (100.0%) | 336 (100.0%) |
Real Estate Taxes by Mortgage Status in Oconto Falls
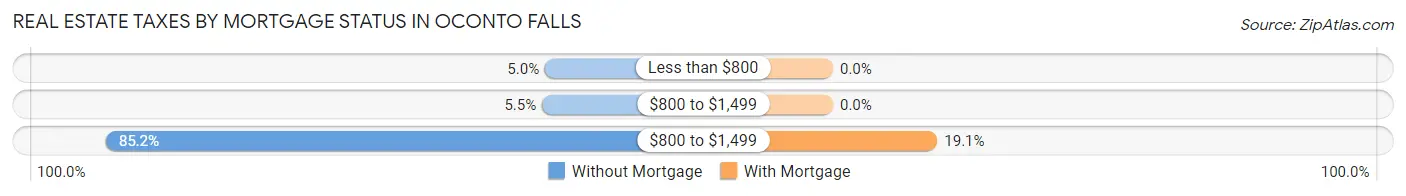
| Property Taxes | Without Mortgage | With Mortgage |
| Less than $800 | 18 (5.0%) | 0 (0.0%) |
| $800 to $1,499 | 20 (5.5%) | 0 (0.0%) |
| $800 to $1,499 | 310 (85.2%) | 64 (19.1%) |
| Total | 364 (100.0%) | 336 (100.0%) |
Health & Disability in Oconto Falls
Health Insurance Coverage by Age in Oconto Falls
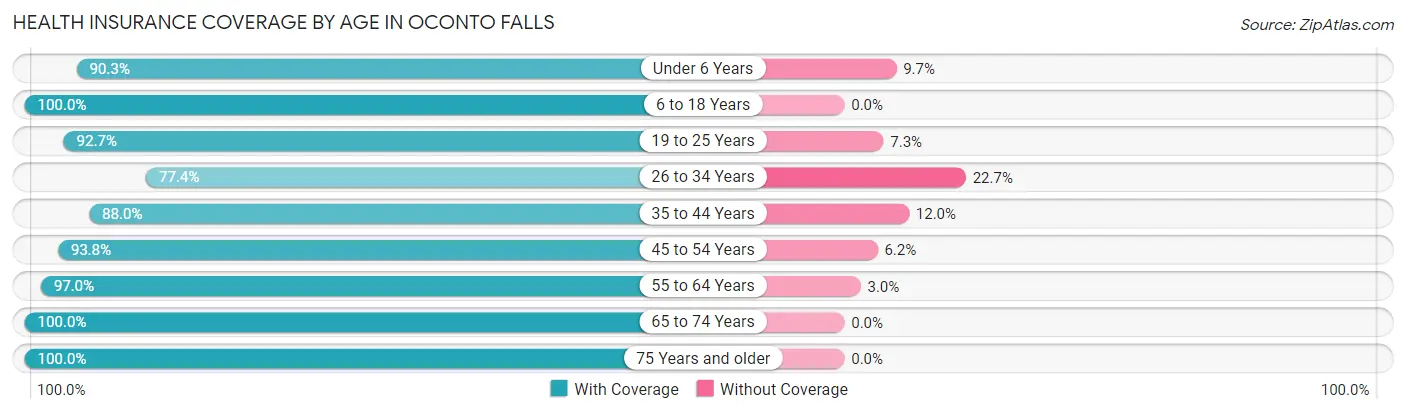
| Age Bracket | With Coverage | Without Coverage |
| Under 6 Years | 84 (90.3%) | 9 (9.7%) |
| 6 to 18 Years | 683 (100.0%) | 0 (0.0%) |
| 19 to 25 Years | 293 (92.7%) | 23 (7.3%) |
| 26 to 34 Years | 181 (77.3%) | 53 (22.7%) |
| 35 to 44 Years | 431 (88.0%) | 59 (12.0%) |
| 45 to 54 Years | 318 (93.8%) | 21 (6.2%) |
| 55 to 64 Years | 320 (97.0%) | 10 (3.0%) |
| 65 to 74 Years | 276 (100.0%) | 0 (0.0%) |
| 75 Years and older | 118 (100.0%) | 0 (0.0%) |
| Total | 2,704 (93.9%) | 175 (6.1%) |
Health Insurance Coverage by Citizenship Status in Oconto Falls
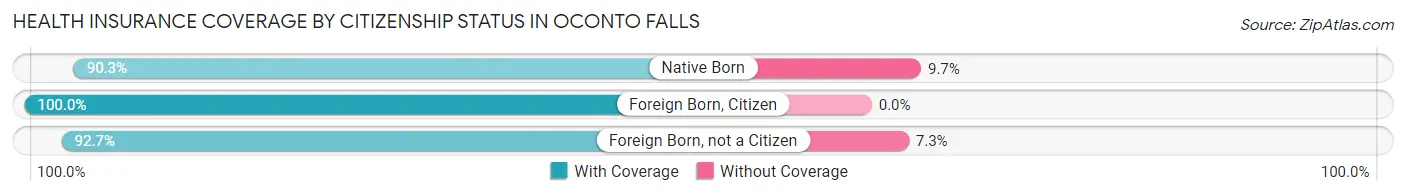
| Citizenship Status | With Coverage | Without Coverage |
| Native Born | 84 (90.3%) | 9 (9.7%) |
| Foreign Born, Citizen | 683 (100.0%) | 0 (0.0%) |
| Foreign Born, not a Citizen | 293 (92.7%) | 23 (7.3%) |
Health Insurance Coverage by Household Income in Oconto Falls
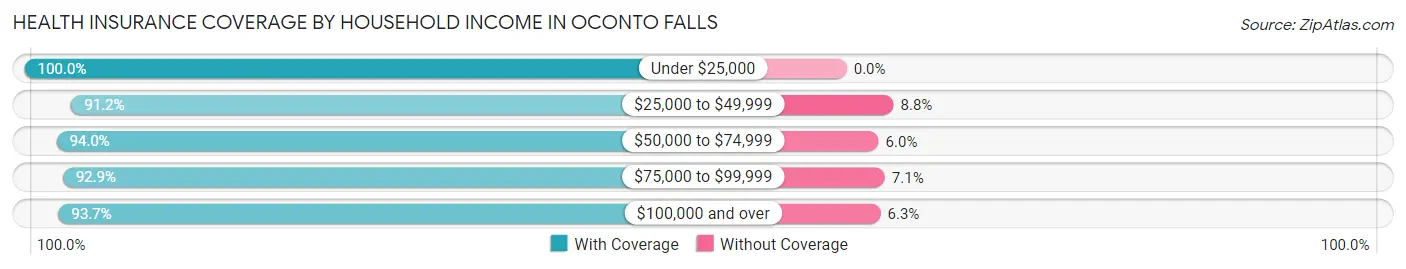
| Household Income | With Coverage | Without Coverage |
| Under $25,000 | 401 (100.0%) | 0 (0.0%) |
| $25,000 to $49,999 | 707 (91.2%) | 68 (8.8%) |
| $50,000 to $74,999 | 598 (94.0%) | 38 (6.0%) |
| $75,000 to $99,999 | 234 (92.9%) | 18 (7.1%) |
| $100,000 and over | 755 (93.7%) | 51 (6.3%) |
Public vs Private Health Insurance Coverage by Age in Oconto Falls
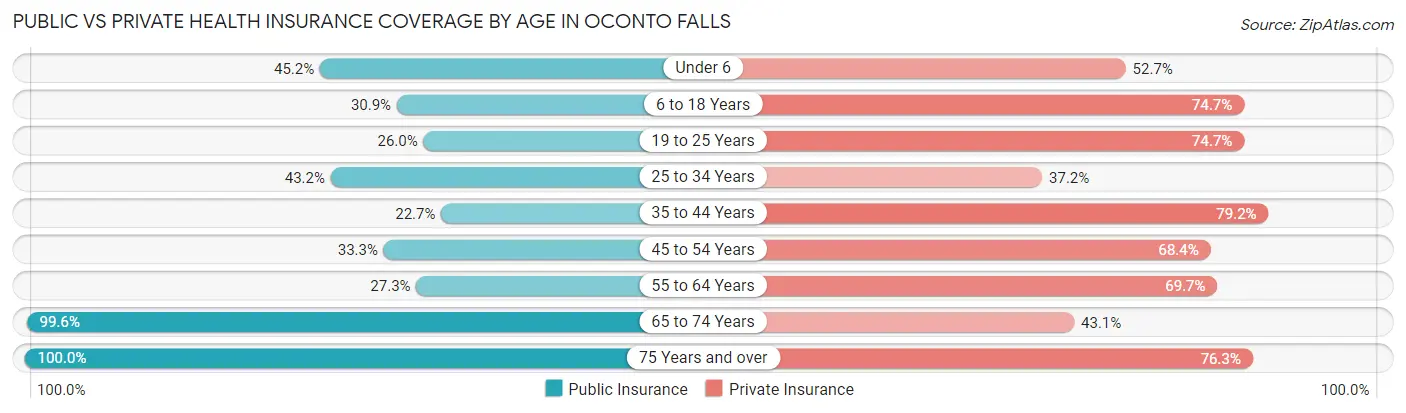
| Age Bracket | Public Insurance | Private Insurance |
| Under 6 | 42 (45.2%) | 49 (52.7%) |
| 6 to 18 Years | 211 (30.9%) | 510 (74.7%) |
| 19 to 25 Years | 82 (26.0%) | 236 (74.7%) |
| 25 to 34 Years | 101 (43.2%) | 87 (37.2%) |
| 35 to 44 Years | 111 (22.7%) | 388 (79.2%) |
| 45 to 54 Years | 113 (33.3%) | 232 (68.4%) |
| 55 to 64 Years | 90 (27.3%) | 230 (69.7%) |
| 65 to 74 Years | 275 (99.6%) | 119 (43.1%) |
| 75 Years and over | 118 (100.0%) | 90 (76.3%) |
| Total | 1,143 (39.7%) | 1,941 (67.4%) |
Disability Status by Sex by Age in Oconto Falls
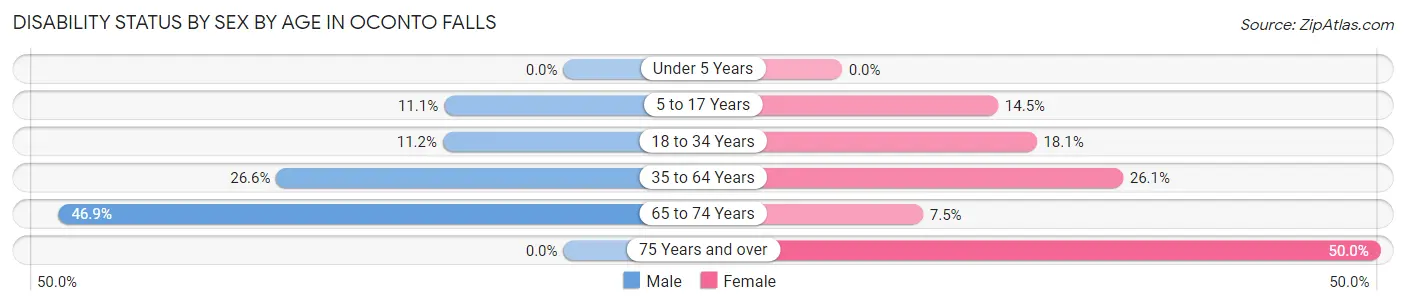
| Age Bracket | Male | Female |
| Under 5 Years | 0 (0.0%) | 0 (0.0%) |
| 5 to 17 Years | 35 (11.1%) | 50 (14.5%) |
| 18 to 34 Years | 30 (11.2%) | 58 (18.1%) |
| 35 to 64 Years | 130 (26.6%) | 175 (26.1%) |
| 65 to 74 Years | 67 (46.9%) | 10 (7.5%) |
| 75 Years and over | 0 (0.0%) | 40 (50.0%) |
Disability Class by Sex by Age in Oconto Falls
Disability Class: Hearing Difficulty
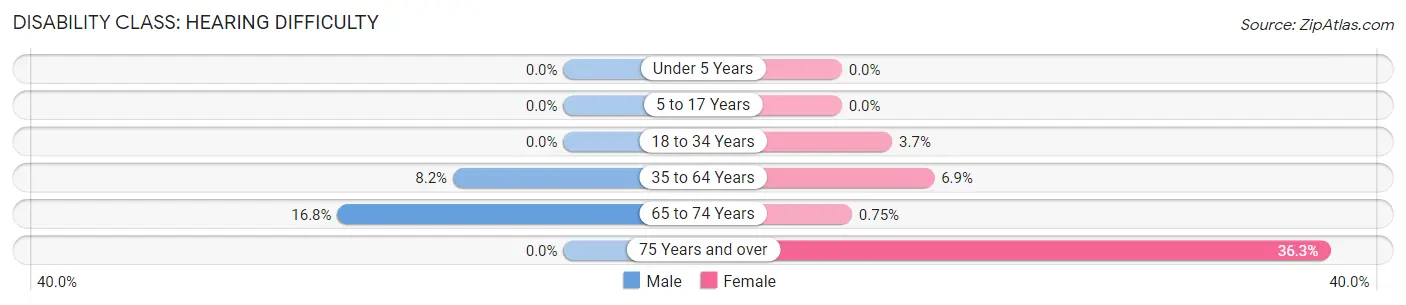
| Age Bracket | Male | Female |
| Under 5 Years | 0 (0.0%) | 0 (0.0%) |
| 5 to 17 Years | 0 (0.0%) | 0 (0.0%) |
| 18 to 34 Years | 0 (0.0%) | 12 (3.7%) |
| 35 to 64 Years | 40 (8.2%) | 46 (6.9%) |
| 65 to 74 Years | 24 (16.8%) | 1 (0.7%) |
| 75 Years and over | 0 (0.0%) | 29 (36.2%) |
Disability Class: Vision Difficulty
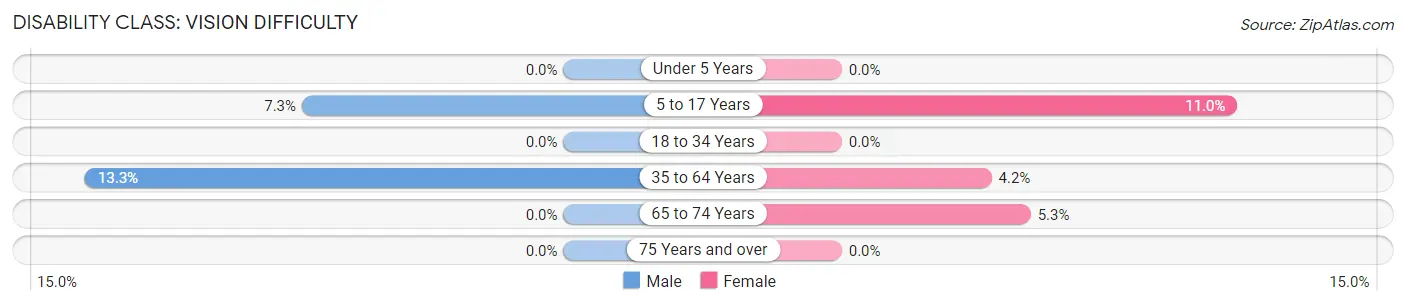
| Age Bracket | Male | Female |
| Under 5 Years | 0 (0.0%) | 0 (0.0%) |
| 5 to 17 Years | 23 (7.3%) | 38 (11.0%) |
| 18 to 34 Years | 0 (0.0%) | 0 (0.0%) |
| 35 to 64 Years | 65 (13.3%) | 28 (4.2%) |
| 65 to 74 Years | 0 (0.0%) | 7 (5.3%) |
| 75 Years and over | 0 (0.0%) | 0 (0.0%) |
Disability Class: Cognitive Difficulty
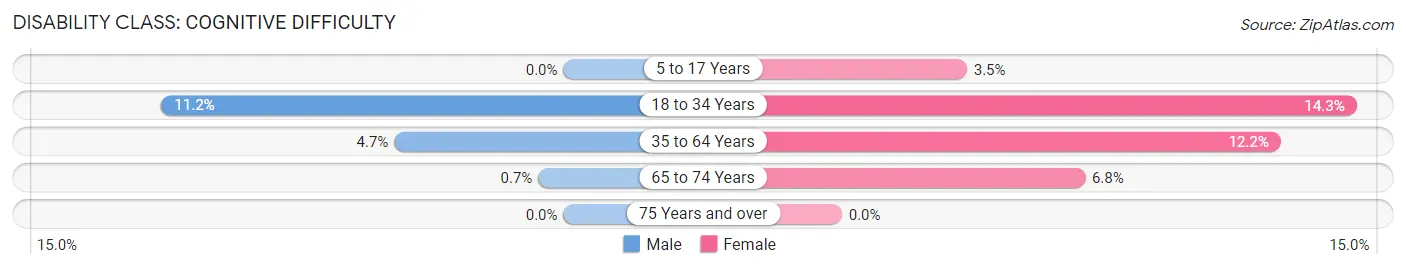
| Age Bracket | Male | Female |
| 5 to 17 Years | 0 (0.0%) | 12 (3.5%) |
| 18 to 34 Years | 30 (11.2%) | 46 (14.3%) |
| 35 to 64 Years | 23 (4.7%) | 82 (12.2%) |
| 65 to 74 Years | 1 (0.7%) | 9 (6.8%) |
| 75 Years and over | 0 (0.0%) | 0 (0.0%) |
Disability Class: Ambulatory Difficulty
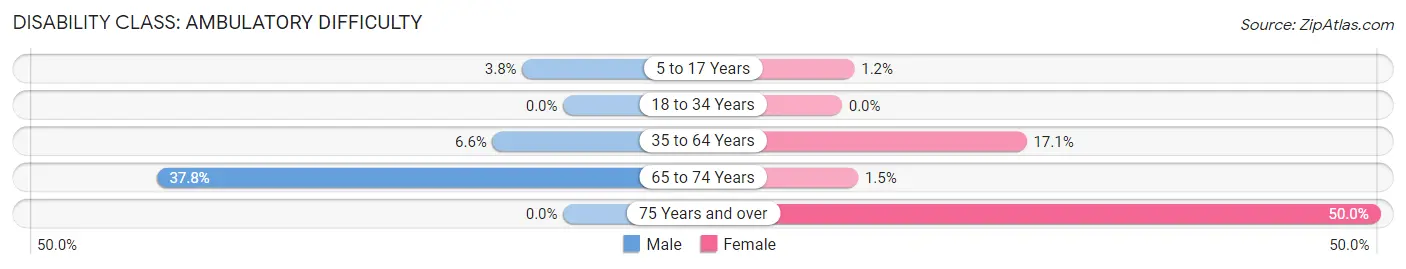
| Age Bracket | Male | Female |
| 5 to 17 Years | 12 (3.8%) | 4 (1.2%) |
| 18 to 34 Years | 0 (0.0%) | 0 (0.0%) |
| 35 to 64 Years | 32 (6.6%) | 115 (17.1%) |
| 65 to 74 Years | 54 (37.8%) | 2 (1.5%) |
| 75 Years and over | 0 (0.0%) | 40 (50.0%) |
Disability Class: Self-Care Difficulty
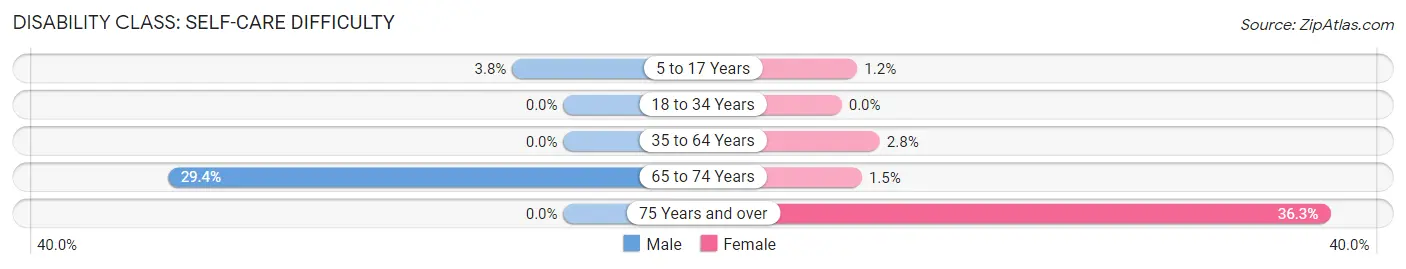
| Age Bracket | Male | Female |
| 5 to 17 Years | 12 (3.8%) | 4 (1.2%) |
| 18 to 34 Years | 0 (0.0%) | 0 (0.0%) |
| 35 to 64 Years | 0 (0.0%) | 19 (2.8%) |
| 65 to 74 Years | 42 (29.4%) | 2 (1.5%) |
| 75 Years and over | 0 (0.0%) | 29 (36.2%) |
Technology Access in Oconto Falls
Computing Device Access in Oconto Falls
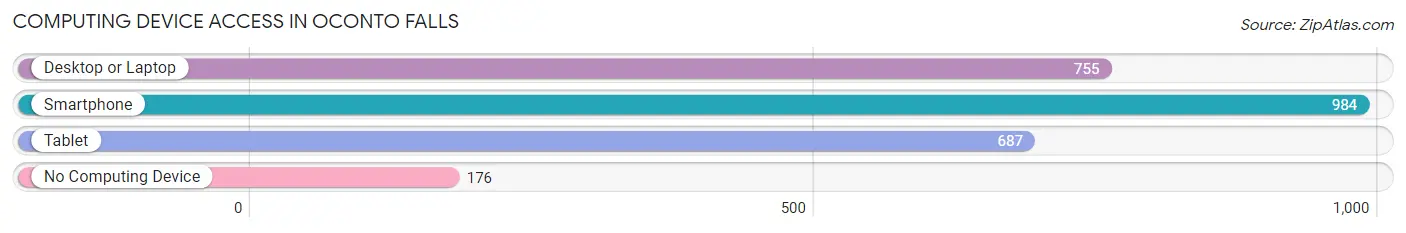
| Device Type | # Households | % Households |
| Desktop or Laptop | 755 | 59.5% |
| Smartphone | 984 | 77.6% |
| Tablet | 687 | 54.2% |
| No Computing Device | 176 | 13.9% |
| Total | 1,268 | 100.0% |
Internet Access in Oconto Falls
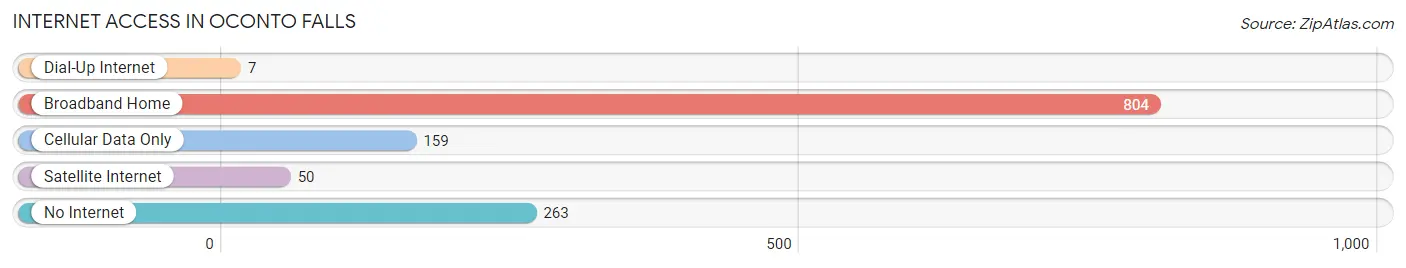
| Internet Type | # Households | % Households |
| Dial-Up Internet | 7 | 0.5% |
| Broadband Home | 804 | 63.4% |
| Cellular Data Only | 159 | 12.5% |
| Satellite Internet | 50 | 3.9% |
| No Internet | 263 | 20.7% |
| Total | 1,268 | 100.0% |
Oconto Falls Summary
Oconto Falls, Wisconsin is a small city located in Oconto County, Wisconsin. It is situated on the banks of the Oconto River, approximately 30 miles northeast of Green Bay. The city has a population of approximately 3,000 people and is the county seat of Oconto County.
History
The area that is now Oconto Falls was first settled in the early 1800s by French-Canadian fur traders. The first permanent settlers arrived in the area in 1836 and the town was officially founded in 1848. The town was named after the Oconto River, which was named by the French-Canadian fur traders.
The city was incorporated in 1872 and was initially a lumber town. The lumber industry was the main source of income for the city until the early 1900s when the industry began to decline. The city then shifted its focus to agriculture and tourism.
Geography
Oconto Falls is located in the northeastern part of Wisconsin, approximately 30 miles northeast of Green Bay. The city is situated on the banks of the Oconto River and is surrounded by rolling hills and forests. The city has a total area of 2.2 square miles, all of which is land.
The climate in Oconto Falls is classified as humid continental, with warm summers and cold winters. The average temperature in the summer is around 70 degrees Fahrenheit and the average temperature in the winter is around 20 degrees Fahrenheit.
Economy
The economy of Oconto Falls is largely based on agriculture and tourism. The city is home to several farms that produce a variety of crops, including corn, soybeans, and hay. The city is also home to several tourist attractions, including the Oconto Falls Historical Society Museum, the Oconto Falls Dam, and the Oconto Falls State Park.
The city is also home to several small businesses, including restaurants, retail stores, and service providers. The city is also home to several manufacturing companies, including a paper mill and a plastics factory.
Demographics
As of the 2010 census, the population of Oconto Falls was 3,037. The racial makeup of the city was 97.2% White, 0.7% African American, 0.3% Native American, 0.3% Asian, 0.1% Pacific Islander, 0.3% from other races, and 1.2% from two or more races. Hispanic or Latino of any race were 1.2% of the population.
The median household income in Oconto Falls was $41,944 and the median family income was $50,938. The per capita income for the city was $20,845. About 11.2% of families and 14.2% of the population were below the poverty line, including 19.2% of those under age 18 and 8.2% of those age 65 or over.
Common Questions
What is Per Capita Income in Oconto Falls?
Per Capita income in Oconto Falls is $26,978.
What is the Median Family Income in Oconto Falls?
Median Family Income in Oconto Falls is $65,821.
What is the Median Household income in Oconto Falls?
Median Household Income in Oconto Falls is $47,941.
What is Income or Wage Gap in Oconto Falls?
Income or Wage Gap in Oconto Falls is 26.0%.
Women in Oconto Falls earn 74.0 cents for every dollar earned by a man.
What is Family Income Deficit in Oconto Falls?
Family Income Deficit in Oconto Falls is $16,786.
Families that are below poverty line in Oconto Falls earn $16,786 less on average than the poverty threshold level.
What is Inequality or Gini Index in Oconto Falls?
Inequality or Gini Index in Oconto Falls is 0.40.
What is the Total Population of Oconto Falls?
Total Population of Oconto Falls is 2,959.
What is the Total Male Population of Oconto Falls?
Total Male Population of Oconto Falls is 1,302.
What is the Total Female Population of Oconto Falls?
Total Female Population of Oconto Falls is 1,657.
What is the Ratio of Males per 100 Females in Oconto Falls?
There are 78.58 Males per 100 Females in Oconto Falls.
What is the Ratio of Females per 100 Males in Oconto Falls?
There are 127.27 Females per 100 Males in Oconto Falls.
What is the Median Population Age in Oconto Falls?
Median Population Age in Oconto Falls is 38.8 Years.
What is the Average Family Size in Oconto Falls
Average Family Size in Oconto Falls is 2.9 People.
What is the Average Household Size in Oconto Falls
Average Household Size in Oconto Falls is 2.3 People.
How Large is the Labor Force in Oconto Falls?
There are 1,374 People in the Labor Forcein in Oconto Falls.
What is the Percentage of People in the Labor Force in Oconto Falls?
58.6% of People are in the Labor Force in Oconto Falls.
What is the Unemployment Rate in Oconto Falls?
Unemployment Rate in Oconto Falls is 0.7%.