Niagara, WI Map & Demographics
Niagara Map
Niagara Overview
$29,462
PER CAPITA INCOME
$59,856
AVG FAMILY INCOME
$51,667
AVG HOUSEHOLD INCOME
26.2%
WAGE / INCOME GAP [ % ]
73.8¢/ $1
WAGE / INCOME GAP [ $ ]
0.37
INEQUALITY / GINI INDEX
1,423
TOTAL POPULATION
654
MALE POPULATION
769
FEMALE POPULATION
85.05
MALES / 100 FEMALES
117.58
FEMALES / 100 MALES
47.8
MEDIAN AGE
2.8
AVG FAMILY SIZE
2.2
AVG HOUSEHOLD SIZE
668
LABOR FORCE [ PEOPLE ]
56.2%
PERCENT IN LABOR FORCE
6.1%
UNEMPLOYMENT RATE
Niagara Zip Codes
Niagara Area Codes
Income in Niagara
Income Overview in Niagara
Per Capita Income in Niagara is $29,462, while median incomes of families and households are $59,856 and $51,667 respectively.
| Characteristic | Number | Measure |
| Per Capita Income | 1,423 | $29,462 |
| Median Family Income | 373 | $59,856 |
| Mean Family Income | 373 | $71,587 |
| Median Household Income | 652 | $51,667 |
| Mean Household Income | 652 | $60,608 |
| Income Deficit | 373 | $0 |
| Wage / Income Gap (%) | 1,423 | 26.20% |
| Wage / Income Gap ($) | 1,423 | 73.80¢ per $1 |
| Gini / Inequality Index | 1,423 | 0.37 |
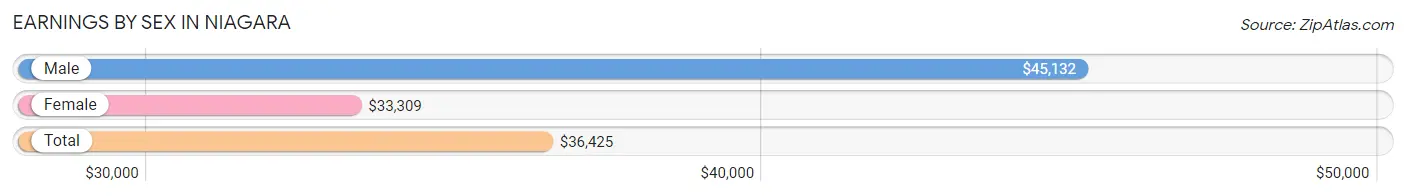
Earnings by Sex in Niagara
Average Earnings in Niagara are $36,425, $45,132 for men and $33,309 for women, a difference of 26.2%.
| Sex | Number | Average Earnings |
| Male | 306 (43.0%) | $45,132 |
| Female | 405 (57.0%) | $33,309 |
| Total | 711 (100.0%) | $36,425 |
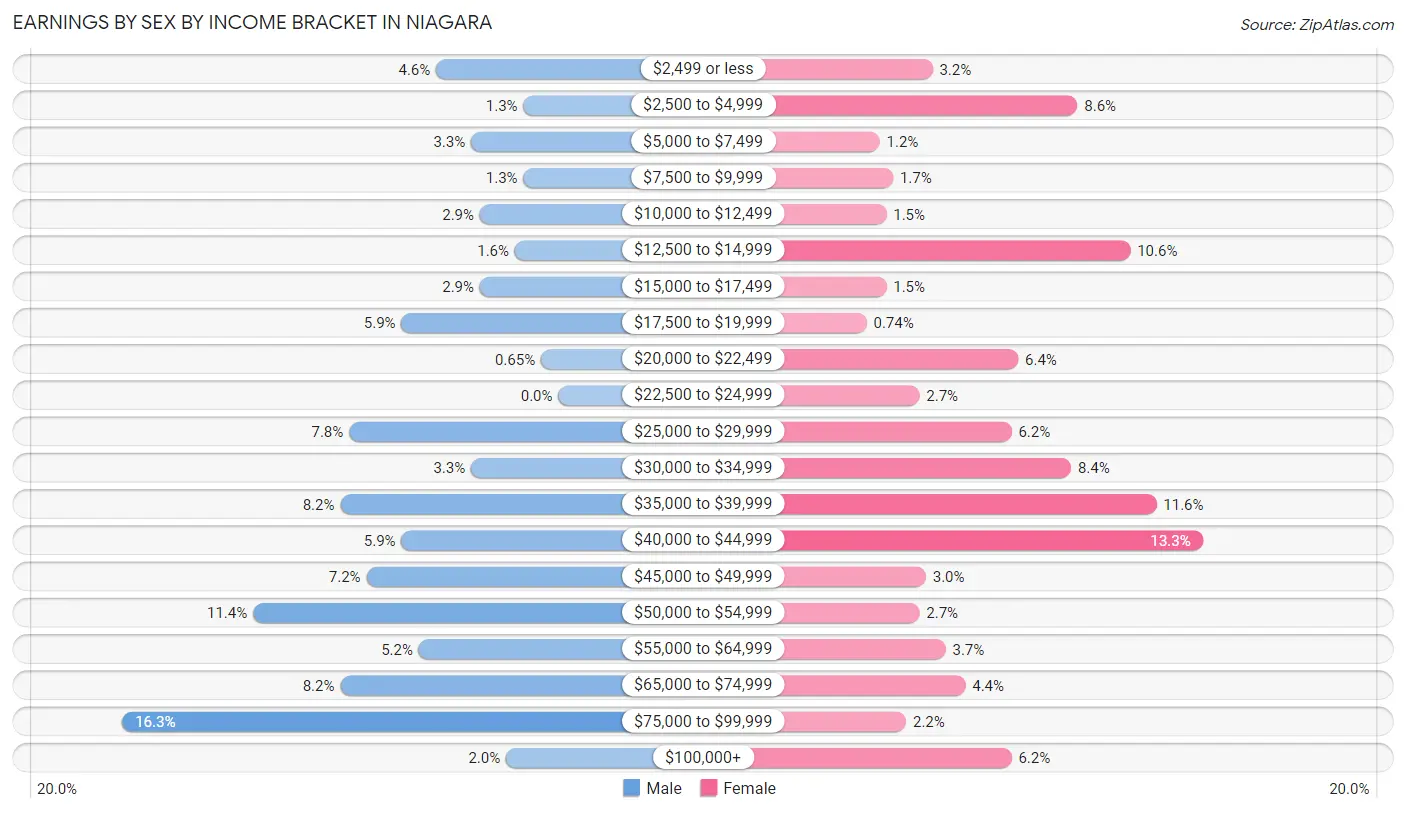
Earnings by Sex by Income Bracket in Niagara
The most common earnings brackets in Niagara are $75,000 to $99,999 for men (50 | 16.3%) and $40,000 to $44,999 for women (54 | 13.3%).
| Income | Male | Female |
| $2,499 or less | 14 (4.6%) | 13 (3.2%) |
| $2,500 to $4,999 | 4 (1.3%) | 35 (8.6%) |
| $5,000 to $7,499 | 10 (3.3%) | 5 (1.2%) |
| $7,500 to $9,999 | 4 (1.3%) | 7 (1.7%) |
| $10,000 to $12,499 | 9 (2.9%) | 6 (1.5%) |
| $12,500 to $14,999 | 5 (1.6%) | 43 (10.6%) |
| $15,000 to $17,499 | 9 (2.9%) | 6 (1.5%) |
| $17,500 to $19,999 | 18 (5.9%) | 3 (0.7%) |
| $20,000 to $22,499 | 2 (0.6%) | 26 (6.4%) |
| $22,500 to $24,999 | 0 (0.0%) | 11 (2.7%) |
| $25,000 to $29,999 | 24 (7.8%) | 25 (6.2%) |
| $30,000 to $34,999 | 10 (3.3%) | 34 (8.4%) |
| $35,000 to $39,999 | 25 (8.2%) | 47 (11.6%) |
| $40,000 to $44,999 | 18 (5.9%) | 54 (13.3%) |
| $45,000 to $49,999 | 22 (7.2%) | 12 (3.0%) |
| $50,000 to $54,999 | 35 (11.4%) | 11 (2.7%) |
| $55,000 to $64,999 | 16 (5.2%) | 15 (3.7%) |
| $65,000 to $74,999 | 25 (8.2%) | 18 (4.4%) |
| $75,000 to $99,999 | 50 (16.3%) | 9 (2.2%) |
| $100,000+ | 6 (2.0%) | 25 (6.2%) |
| Total | 306 (100.0%) | 405 (100.0%) |
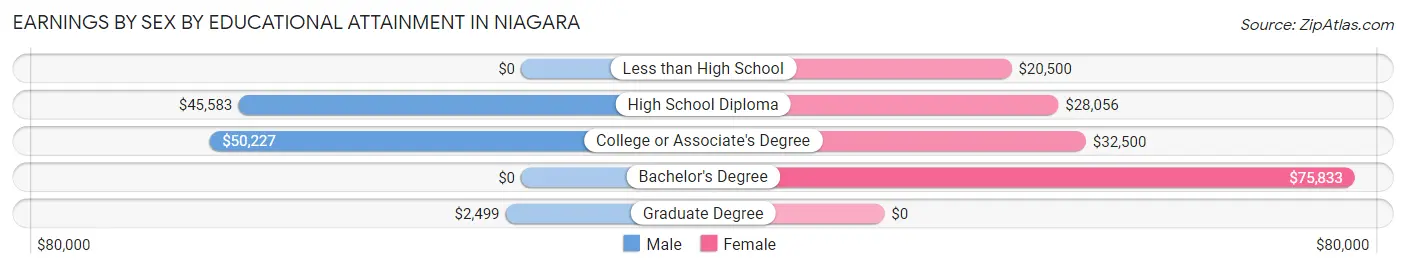
Earnings by Sex by Educational Attainment in Niagara
Average earnings in Niagara are $45,921 for men and $32,868 for women, a difference of 28.4%. Men with an educational attainment of college or associate's degree enjoy the highest average annual earnings of $50,227, while those with graduate degree education earn the least with $2,499. Women with an educational attainment of bachelor's degree earn the most with the average annual earnings of $75,833, while those with less than high school education have the smallest earnings of $20,500.
| Educational Attainment | Male Income | Female Income |
| Less than High School | - | - |
| High School Diploma | $45,583 | $28,056 |
| College or Associate's Degree | $50,227 | $32,500 |
| Bachelor's Degree | - | - |
| Graduate Degree | $2,499 | $0 |
| Total | $45,921 | $32,868 |
Family Income in Niagara
Family Income Brackets in Niagara
According to the Niagara family income data, there are 111 families falling into the $50,000 to $74,999 income range, which is the most common income bracket and makes up 29.8% of all families. Conversely, the $200,000+ income bracket is the least frequent group with only 8 families (2.1%) belonging to this category.
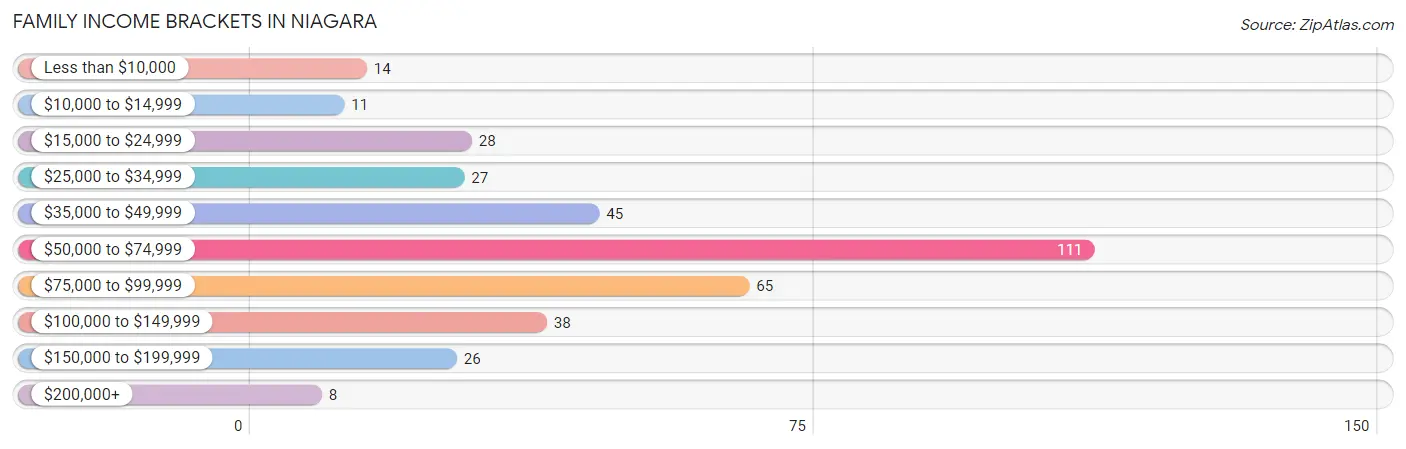
| Income Bracket | # Families | % Families |
| Less than $10,000 | 14 | 3.8% |
| $10,000 to $14,999 | 11 | 2.9% |
| $15,000 to $24,999 | 28 | 7.5% |
| $25,000 to $34,999 | 27 | 7.2% |
| $35,000 to $49,999 | 45 | 12.1% |
| $50,000 to $74,999 | 111 | 29.8% |
| $75,000 to $99,999 | 65 | 17.4% |
| $100,000 to $149,999 | 38 | 10.2% |
| $150,000 to $199,999 | 26 | 7.0% |
| $200,000+ | 8 | 2.1% |
Family Income by Famaliy Size in Niagara
5-person families (29 | 7.8%) account for the highest median family income in Niagara with $78,750 per family, while 2-person families (246 | 65.9%) have the highest median income of $29,688 per family member.
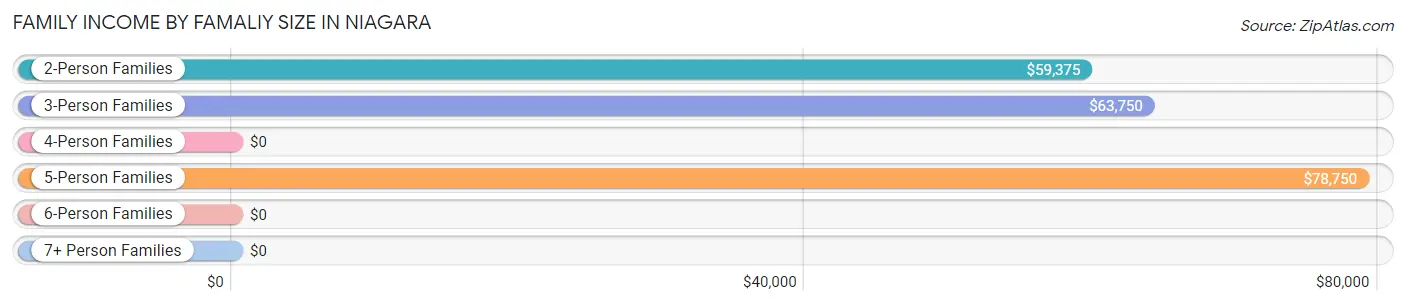
| Income Bracket | # Families | Median Income |
| 2-Person Families | 246 (65.9%) | $59,375 |
| 3-Person Families | 51 (13.7%) | $63,750 |
| 4-Person Families | 43 (11.5%) | $0 |
| 5-Person Families | 29 (7.8%) | $78,750 |
| 6-Person Families | 1 (0.3%) | $0 |
| 7+ Person Families | 3 (0.8%) | $0 |
| Total | 373 (100.0%) | $59,856 |
Family Income by Number of Earners in Niagara
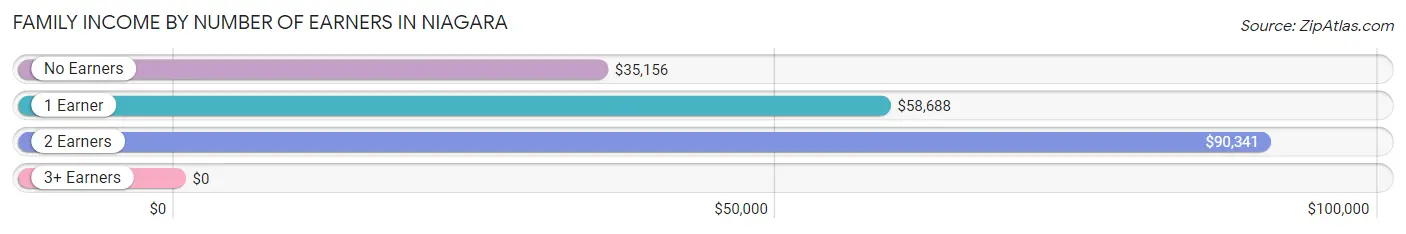
| Number of Earners | # Families | Median Income |
| No Earners | 93 (24.9%) | $35,156 |
| 1 Earner | 121 (32.4%) | $58,688 |
| 2 Earners | 131 (35.1%) | $90,341 |
| 3+ Earners | 28 (7.5%) | $0 |
| Total | 373 (100.0%) | $59,856 |
Household Income in Niagara
Household Income Brackets in Niagara
With 163 households falling in the category, the $50,000 to $74,999 income range is the most frequent in Niagara, accounting for 25.0% of all households. In contrast, only 8 households (1.2%) fall into the $200,000+ income bracket, making it the least populous group.
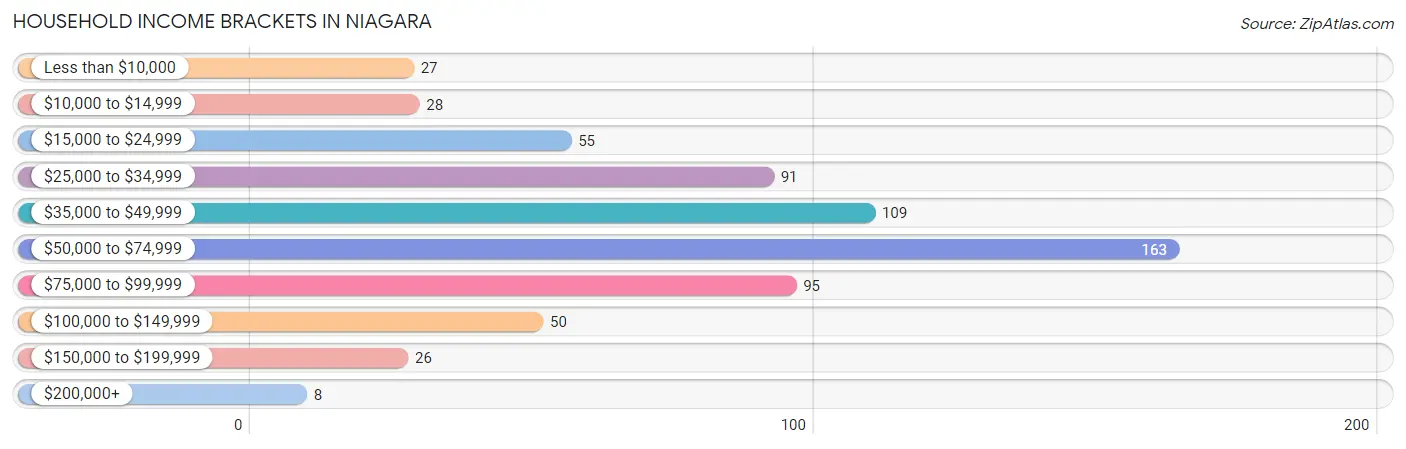
| Income Bracket | # Households | % Households |
| Less than $10,000 | 27 | 4.1% |
| $10,000 to $14,999 | 28 | 4.3% |
| $15,000 to $24,999 | 55 | 8.4% |
| $25,000 to $34,999 | 91 | 14.0% |
| $35,000 to $49,999 | 109 | 16.7% |
| $50,000 to $74,999 | 163 | 25.0% |
| $75,000 to $99,999 | 95 | 14.6% |
| $100,000 to $149,999 | 50 | 7.7% |
| $150,000 to $199,999 | 26 | 4.0% |
| $200,000+ | 8 | 1.2% |
Household Income by Householder Age in Niagara
The median household income in Niagara is $51,667, with the highest median household income of $71,875 found in the 25 to 44 years age bracket for the primary householder. A total of 123 households (18.9%) fall into this category. Meanwhile, the 65+ years age bracket for the primary householder has the lowest median household income of $37,917, with 208 households (31.9%) in this group.
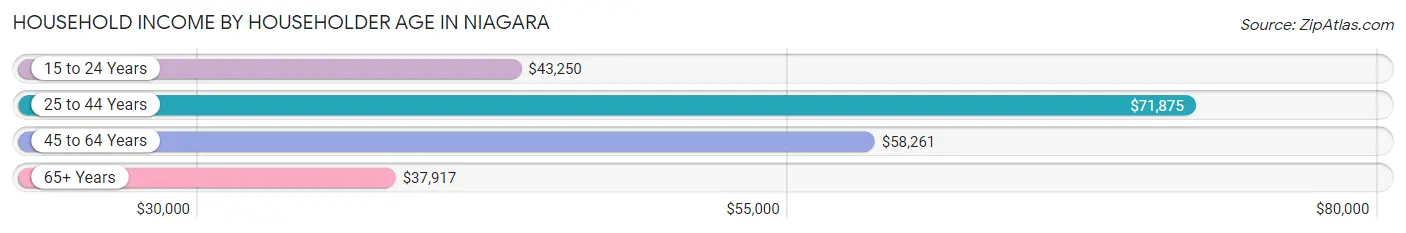
| Income Bracket | # Households | Median Income |
| 15 to 24 Years | 15 (2.3%) | $43,250 |
| 25 to 44 Years | 123 (18.9%) | $71,875 |
| 45 to 64 Years | 306 (46.9%) | $58,261 |
| 65+ Years | 208 (31.9%) | $37,917 |
| Total | 652 (100.0%) | $51,667 |
Poverty in Niagara
Income Below Poverty by Sex and Age in Niagara
With 13.1% poverty level for males and 13.9% for females among the residents of Niagara, 15 year old males and under 5 year old females are the most vulnerable to poverty, with 2 males (66.7%) and 9 females (42.9%) in their respective age groups living below the poverty level.
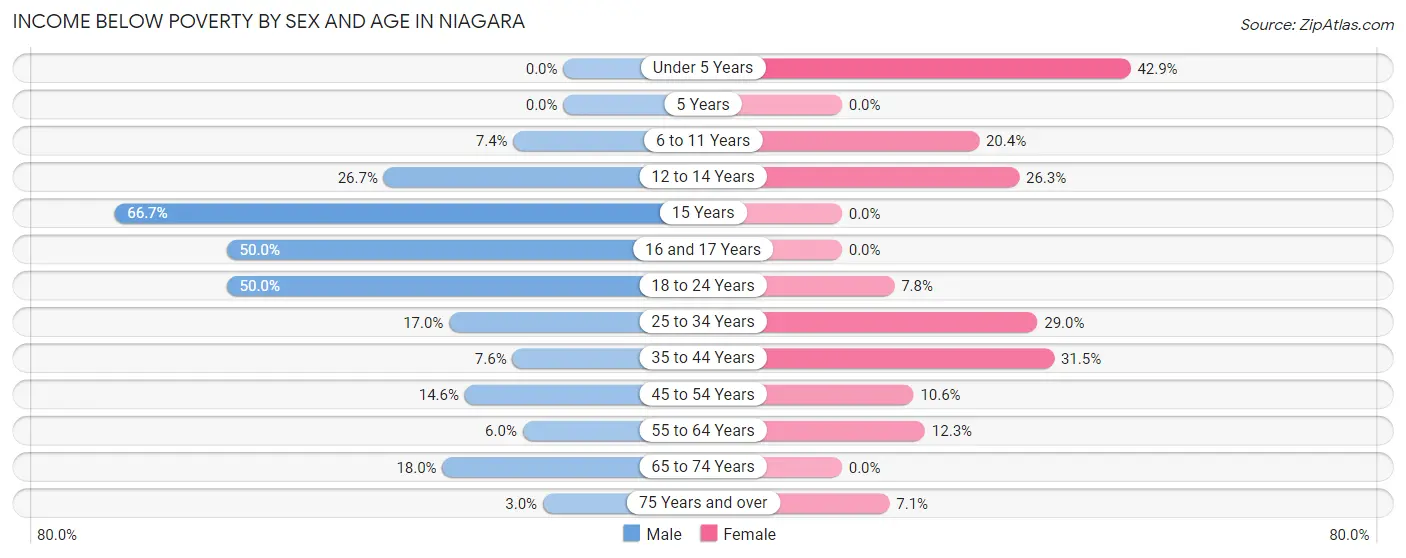
| Age Bracket | Male | Female |
| Under 5 Years | 0 (0.0%) | 9 (42.9%) |
| 5 Years | 0 (0.0%) | 0 (0.0%) |
| 6 to 11 Years | 4 (7.4%) | 11 (20.4%) |
| 12 to 14 Years | 4 (26.7%) | 5 (26.3%) |
| 15 Years | 2 (66.7%) | 0 (0.0%) |
| 16 and 17 Years | 6 (50.0%) | 0 (0.0%) |
| 18 to 24 Years | 13 (50.0%) | 6 (7.8%) |
| 25 to 34 Years | 10 (17.0%) | 18 (29.0%) |
| 35 to 44 Years | 4 (7.5%) | 23 (31.5%) |
| 45 to 54 Years | 18 (14.6%) | 10 (10.6%) |
| 55 to 64 Years | 7 (6.0%) | 19 (12.3%) |
| 65 to 74 Years | 14 (17.9%) | 0 (0.0%) |
| 75 Years and over | 2 (3.0%) | 6 (7.1%) |
| Total | 84 (13.1%) | 107 (13.9%) |
Income Above Poverty by Sex and Age in Niagara
According to the poverty statistics in Niagara, males aged under 5 years and females aged 15 years are the age groups that are most secure financially, with 100.0% of males and 100.0% of females in these age groups living above the poverty line.
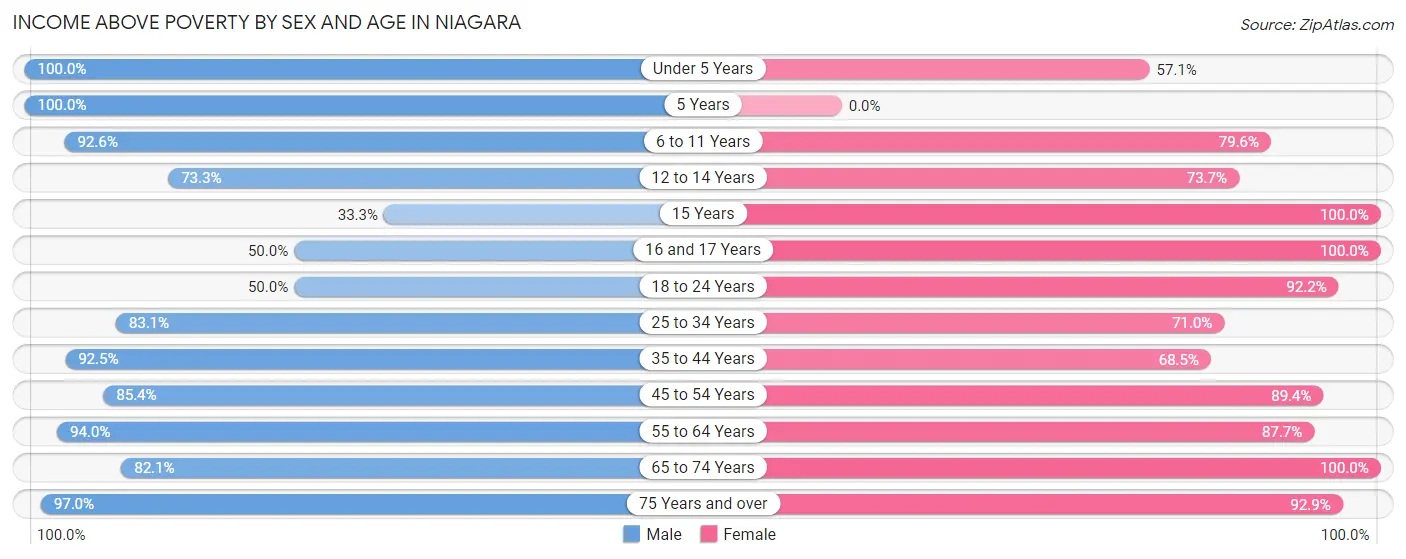
| Age Bracket | Male | Female |
| Under 5 Years | 20 (100.0%) | 12 (57.1%) |
| 5 Years | 16 (100.0%) | 0 (0.0%) |
| 6 to 11 Years | 50 (92.6%) | 43 (79.6%) |
| 12 to 14 Years | 11 (73.3%) | 14 (73.7%) |
| 15 Years | 1 (33.3%) | 28 (100.0%) |
| 16 and 17 Years | 6 (50.0%) | 37 (100.0%) |
| 18 to 24 Years | 13 (50.0%) | 71 (92.2%) |
| 25 to 34 Years | 49 (83.1%) | 44 (71.0%) |
| 35 to 44 Years | 49 (92.4%) | 50 (68.5%) |
| 45 to 54 Years | 105 (85.4%) | 84 (89.4%) |
| 55 to 64 Years | 109 (94.0%) | 135 (87.7%) |
| 65 to 74 Years | 64 (82.1%) | 65 (100.0%) |
| 75 Years and over | 64 (97.0%) | 79 (92.9%) |
| Total | 557 (86.9%) | 662 (86.1%) |
Income Below Poverty Among Married-Couple Families in Niagara
The poverty statistics for married-couple families in Niagara show that 4.1% or 11 of the total 266 families live below the poverty line. Families with no children have the highest poverty rate of 4.6%, comprising of 10 families. On the other hand, families with 1 or 2 children have the lowest poverty rate of 0.0%, which includes 0 families.
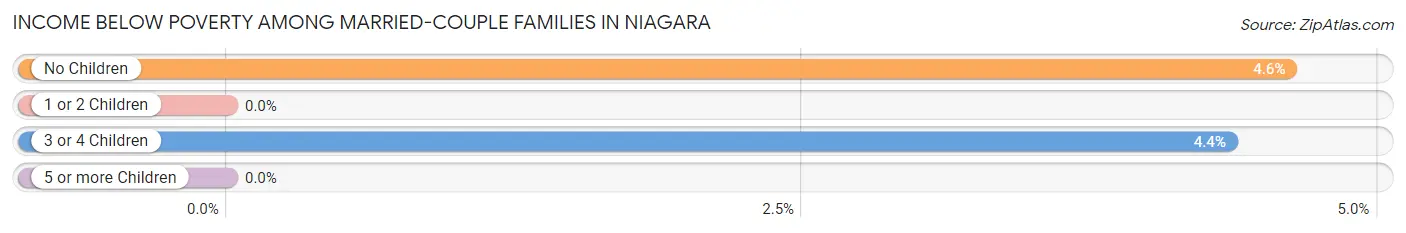
| Children | Above Poverty | Below Poverty |
| No Children | 207 (95.4%) | 10 (4.6%) |
| 1 or 2 Children | 23 (100.0%) | 0 (0.0%) |
| 3 or 4 Children | 22 (95.7%) | 1 (4.3%) |
| 5 or more Children | 3 (100.0%) | 0 (0.0%) |
| Total | 255 (95.9%) | 11 (4.1%) |
Income Below Poverty Among Single-Parent Households in Niagara
According to the poverty data in Niagara, 8.3% or 3 single-father households and 40.8% or 29 single-mother households are living below the poverty line. Among single-father households, those with no children have the highest poverty rate, with 3 households (42.9%) experiencing poverty. Likewise, among single-mother households, those with 1 or 2 children have the highest poverty rate, with 29 households (58.0%) falling below the poverty line.
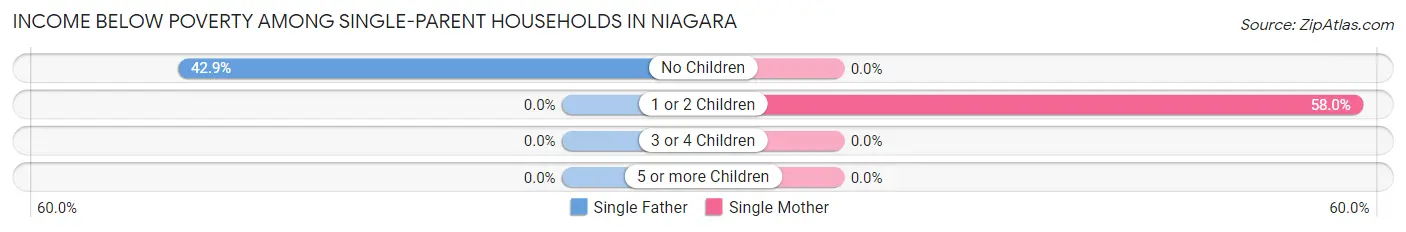
| Children | Single Father | Single Mother |
| No Children | 3 (42.9%) | 0 (0.0%) |
| 1 or 2 Children | 0 (0.0%) | 29 (58.0%) |
| 3 or 4 Children | 0 (0.0%) | 0 (0.0%) |
| 5 or more Children | 0 (0.0%) | 0 (0.0%) |
| Total | 3 (8.3%) | 29 (40.8%) |
Income Below Poverty Among Married-Couple vs Single-Parent Households in Niagara
The poverty data for Niagara shows that 11 of the married-couple family households (4.1%) and 32 of the single-parent households (29.9%) are living below the poverty level. Within the married-couple family households, those with no children have the highest poverty rate, with 10 households (4.6%) falling below the poverty line. Among the single-parent households, those with 1 or 2 children have the highest poverty rate, with 29 household (36.7%) living below poverty.
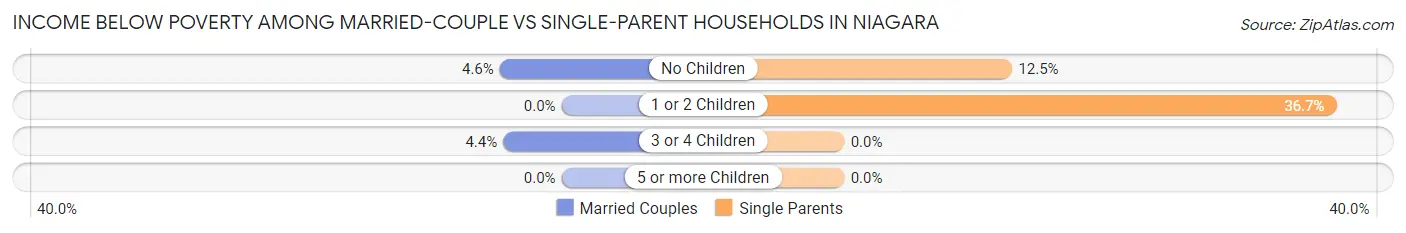
| Children | Married-Couple Families | Single-Parent Households |
| No Children | 10 (4.6%) | 3 (12.5%) |
| 1 or 2 Children | 0 (0.0%) | 29 (36.7%) |
| 3 or 4 Children | 1 (4.3%) | 0 (0.0%) |
| 5 or more Children | 0 (0.0%) | 0 (0.0%) |
| Total | 11 (4.1%) | 32 (29.9%) |
Race in Niagara
The most populous races in Niagara are White / Caucasian (1,363 | 95.8%), Two or more Races (47 | 3.3%), and Hispanic or Latino (15 | 1.1%).
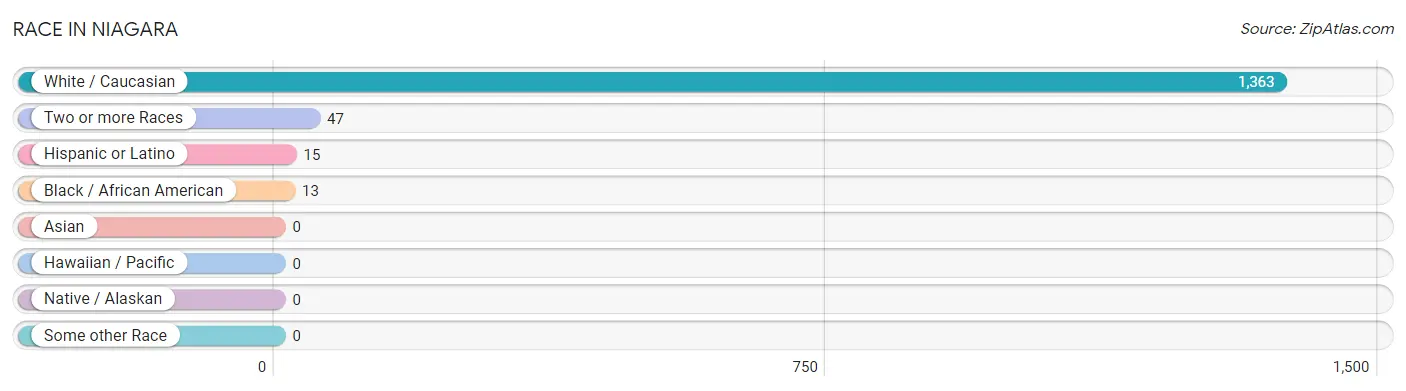
| Race | # Population | % Population |
| Asian | 0 | 0.0% |
| Black / African American | 13 | 0.9% |
| Hawaiian / Pacific | 0 | 0.0% |
| Hispanic or Latino | 15 | 1.1% |
| Native / Alaskan | 0 | 0.0% |
| White / Caucasian | 1,363 | 95.8% |
| Two or more Races | 47 | 3.3% |
| Some other Race | 0 | 0.0% |
| Total | 1,423 | 100.0% |
Ancestry in Niagara
The most populous ancestries reported in Niagara are German (380 | 26.7%), French (248 | 17.4%), Polish (213 | 15.0%), Italian (130 | 9.1%), and Irish (97 | 6.8%), together accounting for 75.1% of all Niagara residents.
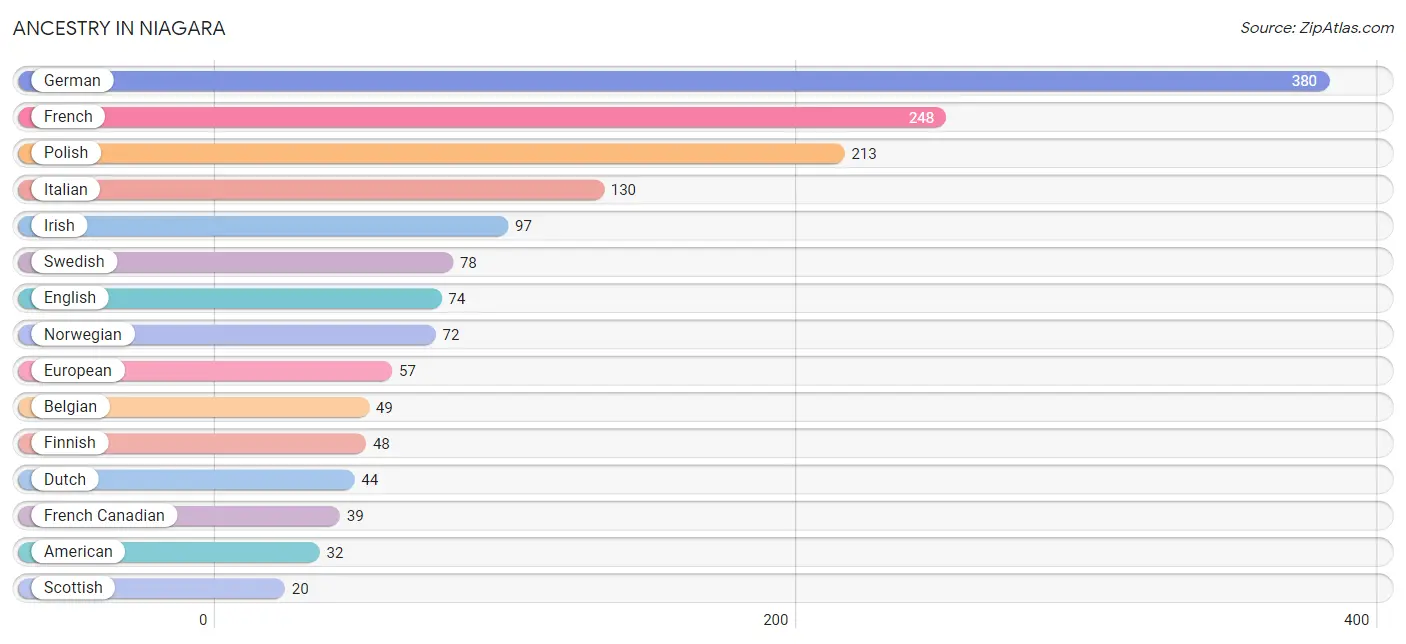
| Ancestry | # Population | % Population |
| American | 32 | 2.2% |
| Belgian | 49 | 3.4% |
| Croatian | 10 | 0.7% |
| Czech | 15 | 1.1% |
| Danish | 14 | 1.0% |
| Dutch | 44 | 3.1% |
| English | 74 | 5.2% |
| European | 57 | 4.0% |
| Finnish | 48 | 3.4% |
| French | 248 | 17.4% |
| French Canadian | 39 | 2.7% |
| German | 380 | 26.7% |
| Irish | 97 | 6.8% |
| Italian | 130 | 9.1% |
| Luxembourger | 4 | 0.3% |
| Mexican | 12 | 0.8% |
| Norwegian | 72 | 5.1% |
| Polish | 213 | 15.0% |
| Puerto Rican | 3 | 0.2% |
| Russian | 2 | 0.1% |
| Scandinavian | 5 | 0.4% |
| Scottish | 20 | 1.4% |
| Slavic | 2 | 0.1% |
| Swedish | 78 | 5.5% |
| Swiss | 2 | 0.1% |
| Welsh | 7 | 0.5% | View All 26 Rows |
Immigrants in Niagara
The most numerous immigrant groups reported in Niagara came from Europe (14 | 1.0%), Germany (10 | 0.7%), Western Europe (10 | 0.7%), Northern Europe (4 | 0.3%), and Canada (2 | 0.1%), together accounting for 2.8% of all Niagara residents.
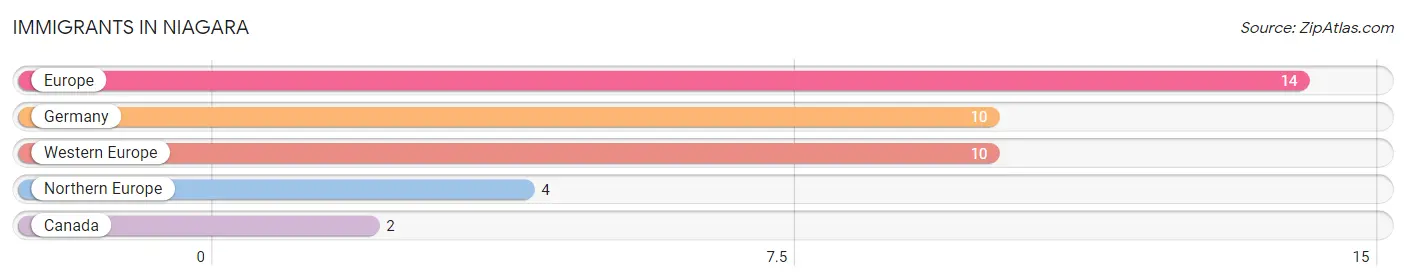
| Immigration Origin | # Population | % Population |
| Canada | 2 | 0.1% |
| Europe | 14 | 1.0% |
| Germany | 10 | 0.7% |
| Northern Europe | 4 | 0.3% |
| Western Europe | 10 | 0.7% | View All 5 Rows |
Sex and Age in Niagara
Sex and Age in Niagara
The most populous age groups in Niagara are 45 to 49 Years (80 | 12.2%) for men and 55 to 59 Years (78 | 10.1%) for women.
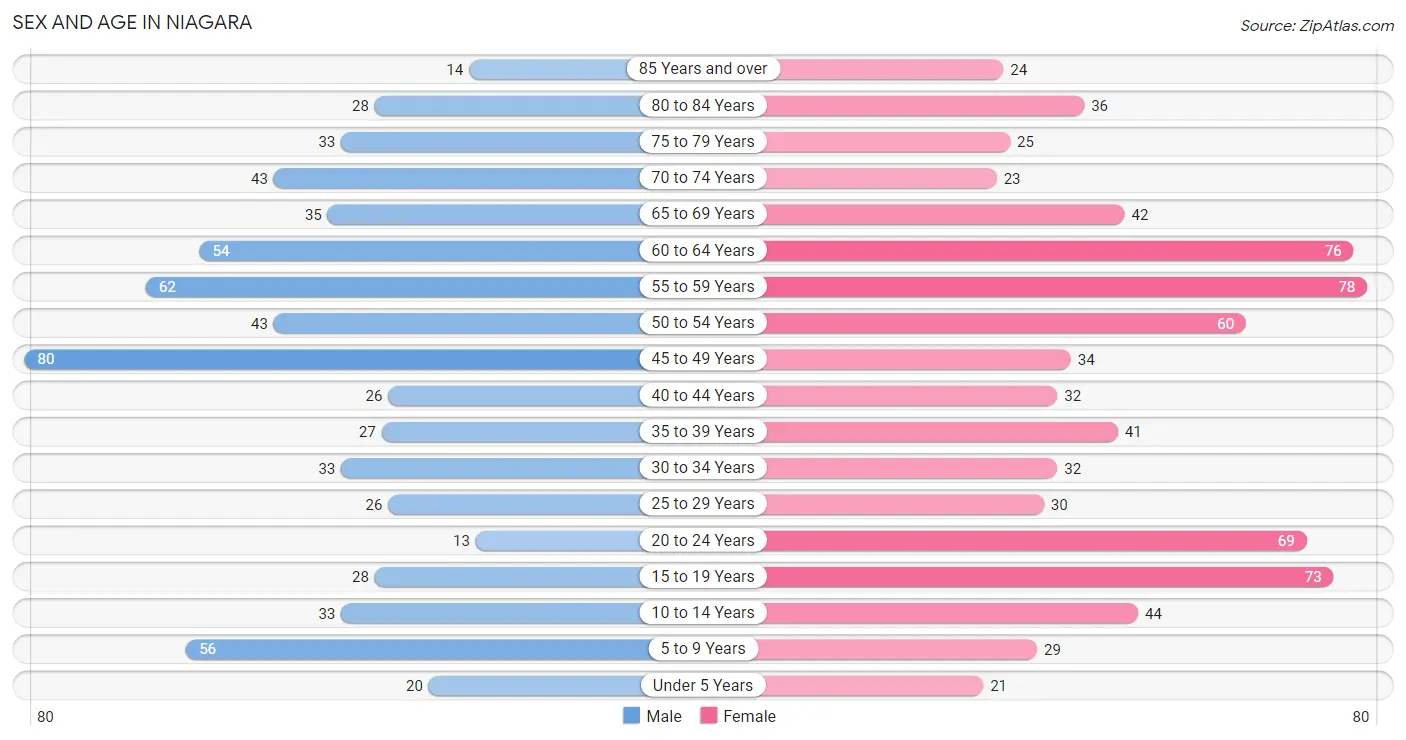
| Age Bracket | Male | Female |
| Under 5 Years | 20 (3.1%) | 21 (2.7%) |
| 5 to 9 Years | 56 (8.6%) | 29 (3.8%) |
| 10 to 14 Years | 33 (5.1%) | 44 (5.7%) |
| 15 to 19 Years | 28 (4.3%) | 73 (9.5%) |
| 20 to 24 Years | 13 (2.0%) | 69 (9.0%) |
| 25 to 29 Years | 26 (4.0%) | 30 (3.9%) |
| 30 to 34 Years | 33 (5.1%) | 32 (4.2%) |
| 35 to 39 Years | 27 (4.1%) | 41 (5.3%) |
| 40 to 44 Years | 26 (4.0%) | 32 (4.2%) |
| 45 to 49 Years | 80 (12.2%) | 34 (4.4%) |
| 50 to 54 Years | 43 (6.6%) | 60 (7.8%) |
| 55 to 59 Years | 62 (9.5%) | 78 (10.1%) |
| 60 to 64 Years | 54 (8.3%) | 76 (9.9%) |
| 65 to 69 Years | 35 (5.3%) | 42 (5.5%) |
| 70 to 74 Years | 43 (6.6%) | 23 (3.0%) |
| 75 to 79 Years | 33 (5.1%) | 25 (3.3%) |
| 80 to 84 Years | 28 (4.3%) | 36 (4.7%) |
| 85 Years and over | 14 (2.1%) | 24 (3.1%) |
| Total | 654 (100.0%) | 769 (100.0%) |
Families and Households in Niagara
Median Family Size in Niagara
The median family size in Niagara is 2.80 persons per family, with single female/mother families (71 | 19.0%) accounting for the largest median family size of 3.38 persons per family. On the other hand, single male/father families (36 | 9.7%) represent the smallest median family size with 2.50 persons per family.
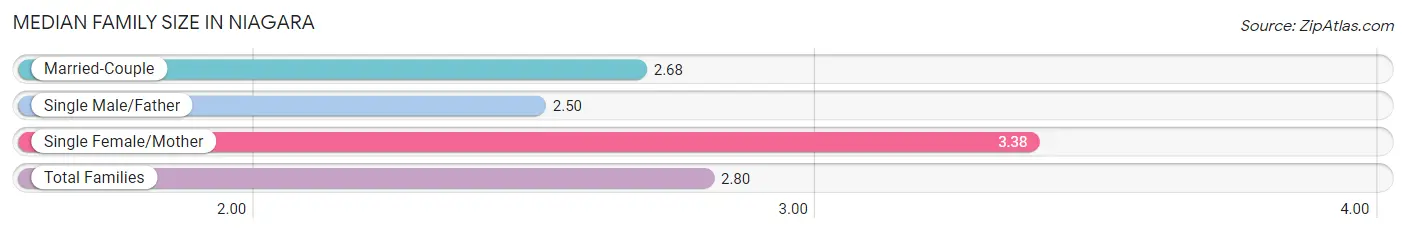
| Family Type | # Families | Family Size |
| Married-Couple | 266 (71.3%) | 2.68 |
| Single Male/Father | 36 (9.7%) | 2.50 |
| Single Female/Mother | 71 (19.0%) | 3.38 |
| Total Families | 373 (100.0%) | 2.80 |
Median Household Size in Niagara
The median household size in Niagara is 2.17 persons per household, with single female/mother households (71 | 10.9%) accounting for the largest median household size of 3.42 persons per household. non-family households (279 | 42.8%) represent the smallest median household size with 1.24 persons per household.
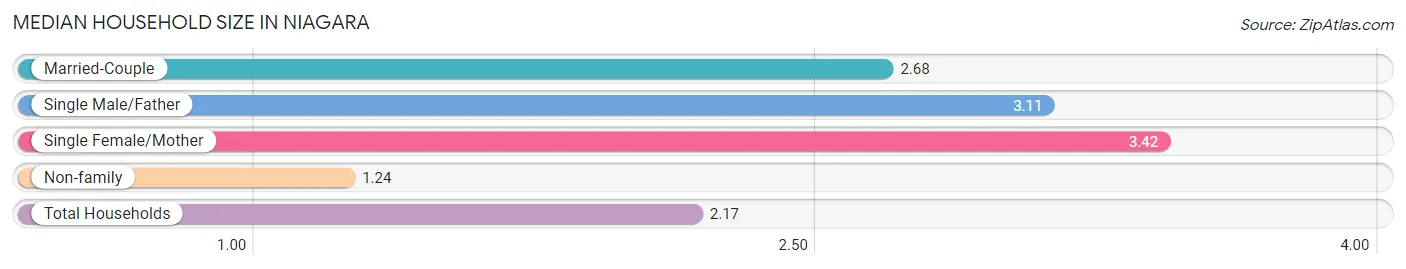
| Household Type | # Households | Household Size |
| Married-Couple | 266 (40.8%) | 2.68 |
| Single Male/Father | 36 (5.5%) | 3.11 |
| Single Female/Mother | 71 (10.9%) | 3.42 |
| Non-family | 279 (42.8%) | 1.24 |
| Total Households | 652 (100.0%) | 2.17 |
Household Size by Marriage Status in Niagara
Out of a total of 652 households in Niagara, 373 (57.2%) are family households, while 279 (42.8%) are nonfamily households. The most numerous type of family households are 2-person households, comprising 246, and the most common type of nonfamily households are 1-person households, comprising 226.
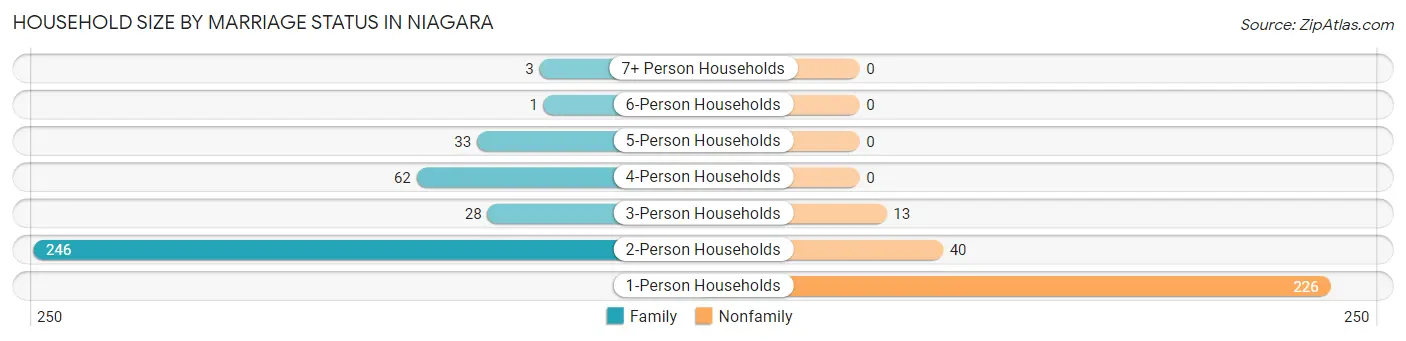
| Household Size | Family Households | Nonfamily Households |
| 1-Person Households | - | 226 (34.7%) |
| 2-Person Households | 246 (37.7%) | 40 (6.1%) |
| 3-Person Households | 28 (4.3%) | 13 (2.0%) |
| 4-Person Households | 62 (9.5%) | 0 (0.0%) |
| 5-Person Households | 33 (5.1%) | 0 (0.0%) |
| 6-Person Households | 1 (0.2%) | 0 (0.0%) |
| 7+ Person Households | 3 (0.5%) | 0 (0.0%) |
| Total | 373 (57.2%) | 279 (42.8%) |
Female Fertility in Niagara
Fertility by Age in Niagara
Average fertility rate in Niagara is 44.0 births per 1,000 women. Women in the age bracket of 20 to 34 years have the highest fertility rate with 107.0 births per 1,000 women. Women in the age bracket of 20 to 34 years acount for 100.0% of all women with births.
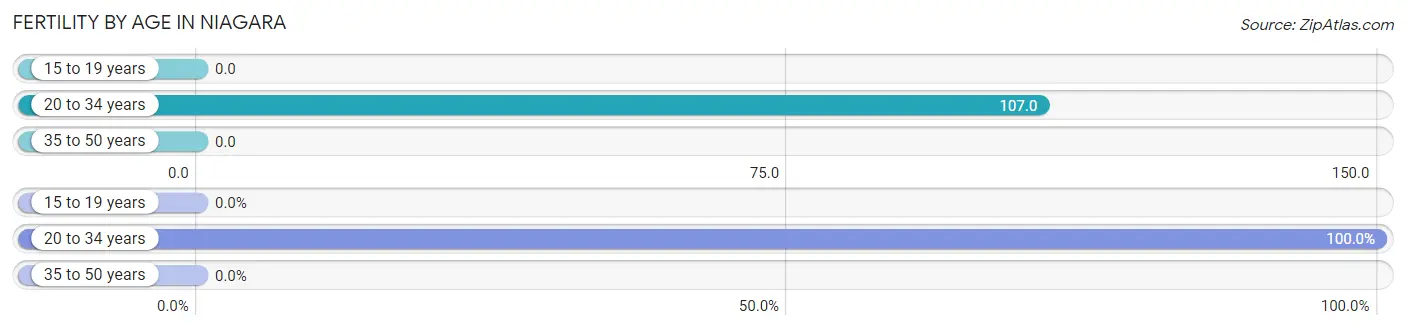
| Age Bracket | Women with Births | Births / 1,000 Women |
| 15 to 19 years | 0 (0.0%) | 0.0 |
| 20 to 34 years | 14 (100.0%) | 107.0 |
| 35 to 50 years | 0 (0.0%) | 0.0 |
| Total | 14 (100.0%) | 44.0 |
Fertility by Age by Marriage Status in Niagara
21.4% of women with births (14) in Niagara are married. The highest percentage of unmarried women with births falls into 20 to 34 years age bracket with 78.6% of them unmarried at the time of birth, while the lowest percentage of unmarried women with births belong to 20 to 34 years age bracket with 78.6% of them unmarried.
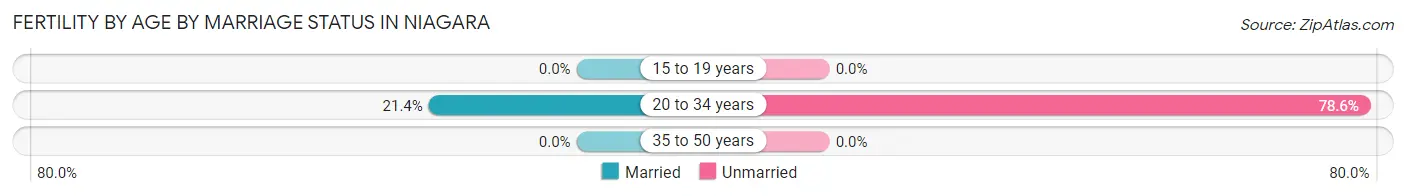
| Age Bracket | Married | Unmarried |
| 15 to 19 years | 0 (0.0%) | 0 (0.0%) |
| 20 to 34 years | 3 (21.4%) | 11 (78.6%) |
| 35 to 50 years | 0 (0.0%) | 0 (0.0%) |
| Total | 3 (21.4%) | 11 (78.6%) |
Fertility by Education in Niagara
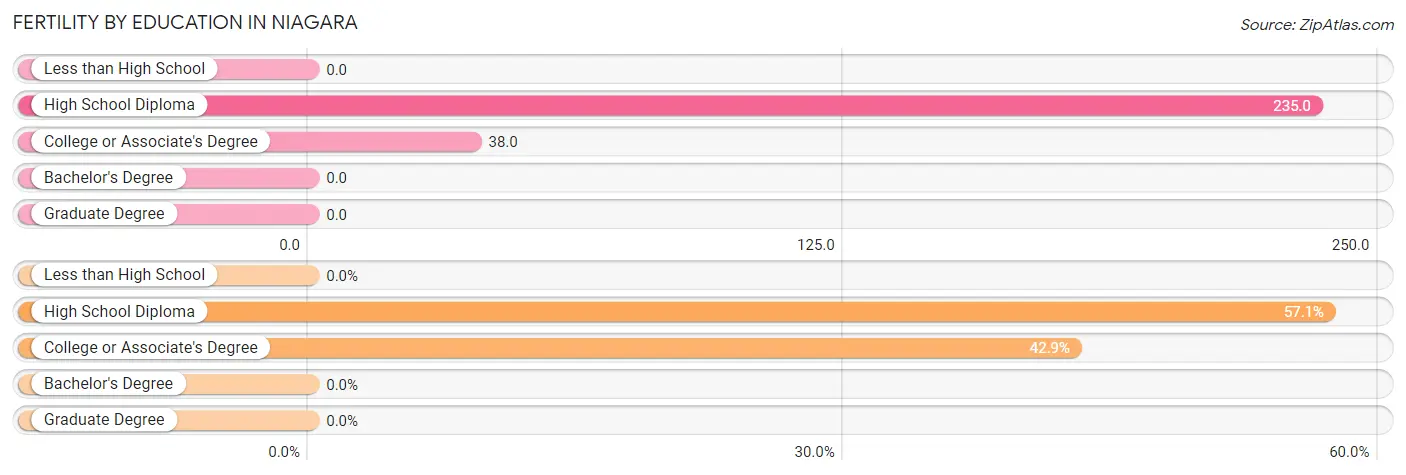
| Educational Attainment | Women with Births | Births / 1,000 Women |
| Less than High School | 0 (0.0%) | 0.0 |
| High School Diploma | 8 (57.1%) | 235.0 |
| College or Associate's Degree | 6 (42.9%) | 38.0 |
| Bachelor's Degree | 0 (0.0%) | 0.0 |
| Graduate Degree | 0 (0.0%) | 0.0 |
| Total | 14 (100.0%) | 44.0 |
Fertility by Education by Marriage Status in Niagara
78.6% of women with births in Niagara are unmarried. Women with the educational attainment of college or associate's degree are most likely to be married with 50.0% of them married at childbirth, while women with the educational attainment of high school diploma are least likely to be married with 100.0% of them unmarried at childbirth.
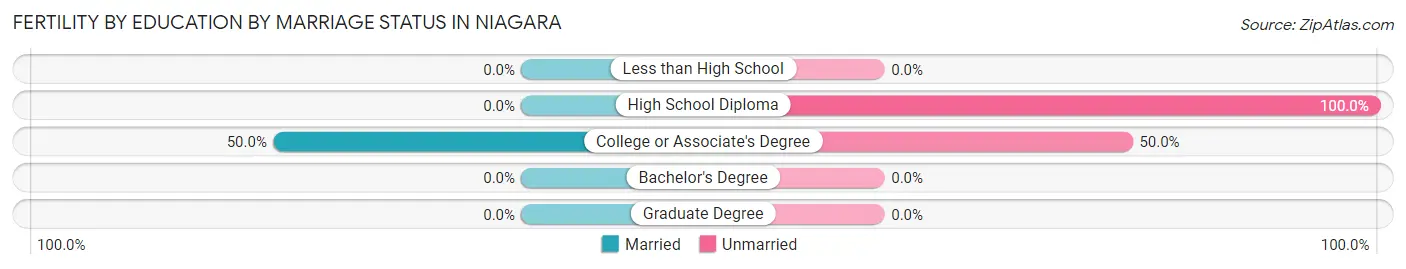
| Educational Attainment | Married | Unmarried |
| Less than High School | 0 (0.0%) | 0 (0.0%) |
| High School Diploma | 0 (0.0%) | 8 (100.0%) |
| College or Associate's Degree | 3 (50.0%) | 3 (50.0%) |
| Bachelor's Degree | 0 (0.0%) | 0 (0.0%) |
| Graduate Degree | 0 (0.0%) | 0 (0.0%) |
| Total | 3 (21.4%) | 11 (78.6%) |
Employment Characteristics in Niagara
Employment by Class of Employer in Niagara
Among the 627 employed individuals in Niagara, private company employees (420 | 67.0%), local government employees (73 | 11.6%), and not-for-profit organizations (51 | 8.1%) make up the most common classes of employment.
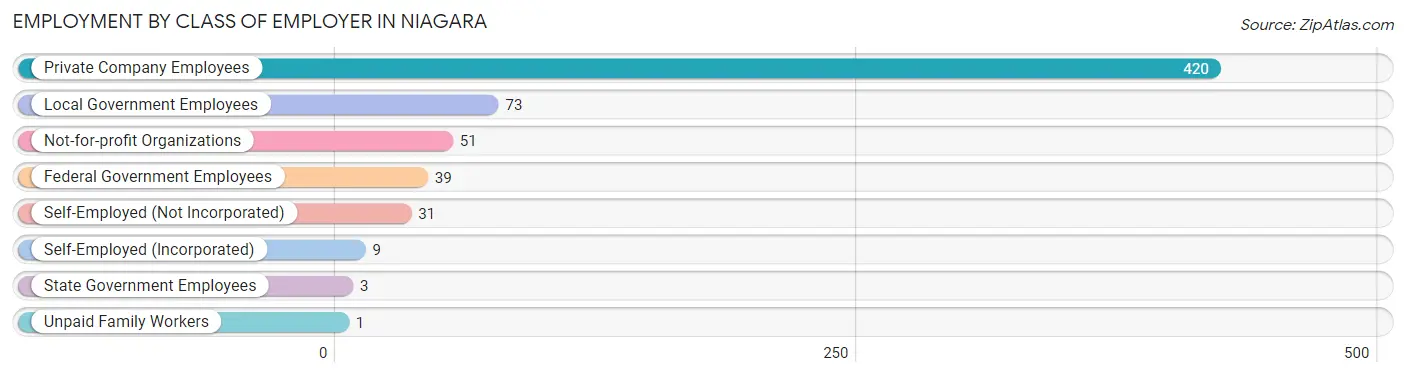
| Employer Class | # Employees | % Employees |
| Private Company Employees | 420 | 67.0% |
| Self-Employed (Incorporated) | 9 | 1.4% |
| Self-Employed (Not Incorporated) | 31 | 4.9% |
| Not-for-profit Organizations | 51 | 8.1% |
| Local Government Employees | 73 | 11.6% |
| State Government Employees | 3 | 0.5% |
| Federal Government Employees | 39 | 6.2% |
| Unpaid Family Workers | 1 | 0.2% |
| Total | 627 | 100.0% |
Employment Status by Age in Niagara
According to the labor force statistics for Niagara, out of the total population over 16 years of age (1,189), 56.2% or 668 individuals are in the labor force, with 6.1% or 41 of them unemployed. The age group with the highest labor force participation rate is 20 to 24 years, with 100.0% or 82 individuals in the labor force. Within the labor force, the 16 to 19 years age range has the highest percentage of unemployed individuals, with 38.5% or 10 of them being unemployed.
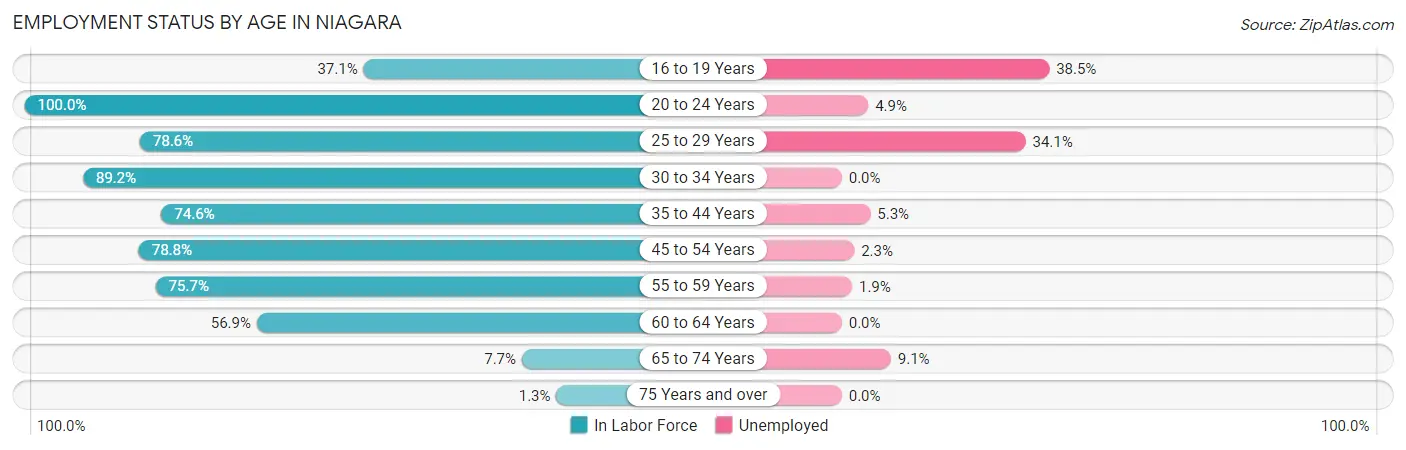
| Age Bracket | In Labor Force | Unemployed |
| 16 to 19 Years | 26 (37.1%) | 10 (38.5%) |
| 20 to 24 Years | 82 (100.0%) | 4 (4.9%) |
| 25 to 29 Years | 44 (78.6%) | 15 (34.1%) |
| 30 to 34 Years | 58 (89.2%) | 0 (0.0%) |
| 35 to 44 Years | 94 (74.6%) | 5 (5.3%) |
| 45 to 54 Years | 171 (78.8%) | 4 (2.3%) |
| 55 to 59 Years | 106 (75.7%) | 2 (1.9%) |
| 60 to 64 Years | 74 (56.9%) | 0 (0.0%) |
| 65 to 74 Years | 11 (7.7%) | 1 (9.1%) |
| 75 Years and over | 2 (1.3%) | 0 (0.0%) |
| Total | 668 (56.2%) | 41 (6.1%) |
Employment Status by Educational Attainment in Niagara
According to labor force statistics for Niagara, 74.5% of individuals (547) out of the total population between 25 and 64 years of age (734) are in the labor force, with 4.8% or 26 of them being unemployed. The group with the highest labor force participation rate are those with the educational attainment of bachelor's degree or higher, with 81.9% or 86 individuals in the labor force. Within the labor force, individuals with high school diploma education have the highest percentage of unemployment, with 6.9% or 12 of them being unemployed.
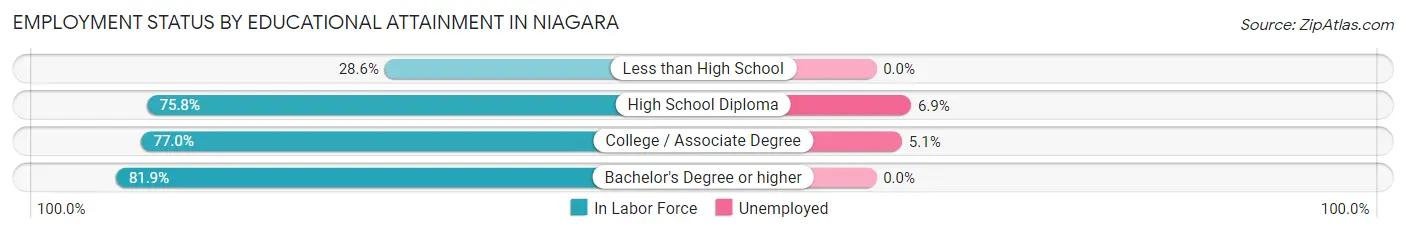
| Educational Attainment | In Labor Force | Unemployed |
| Less than High School | 12 (28.6%) | 0 (0.0%) |
| High School Diploma | 175 (75.8%) | 16 (6.9%) |
| College / Associate Degree | 274 (77.0%) | 18 (5.1%) |
| Bachelor's Degree or higher | 86 (81.9%) | 0 (0.0%) |
| Total | 547 (74.5%) | 35 (4.8%) |
Employment Occupations by Sex in Niagara
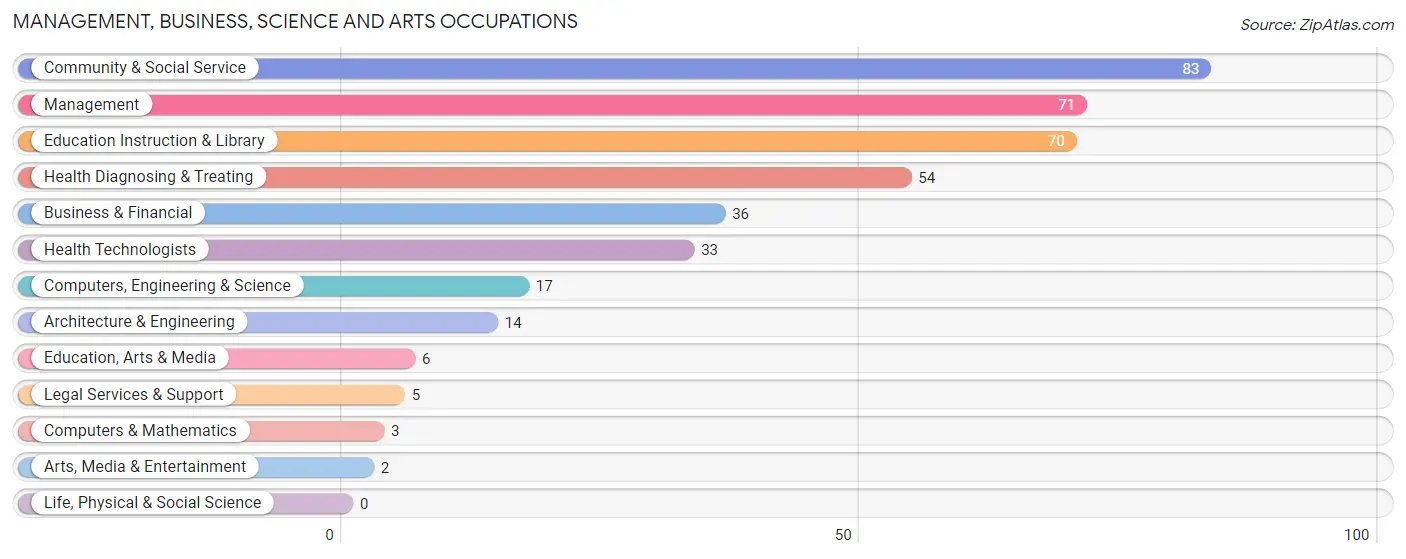
Management, Business, Science and Arts Occupations
The most common Management, Business, Science and Arts occupations in Niagara are Community & Social Service (83 | 13.2%), Management (71 | 11.3%), Education Instruction & Library (70 | 11.2%), Health Diagnosing & Treating (54 | 8.6%), and Business & Financial (36 | 5.7%).
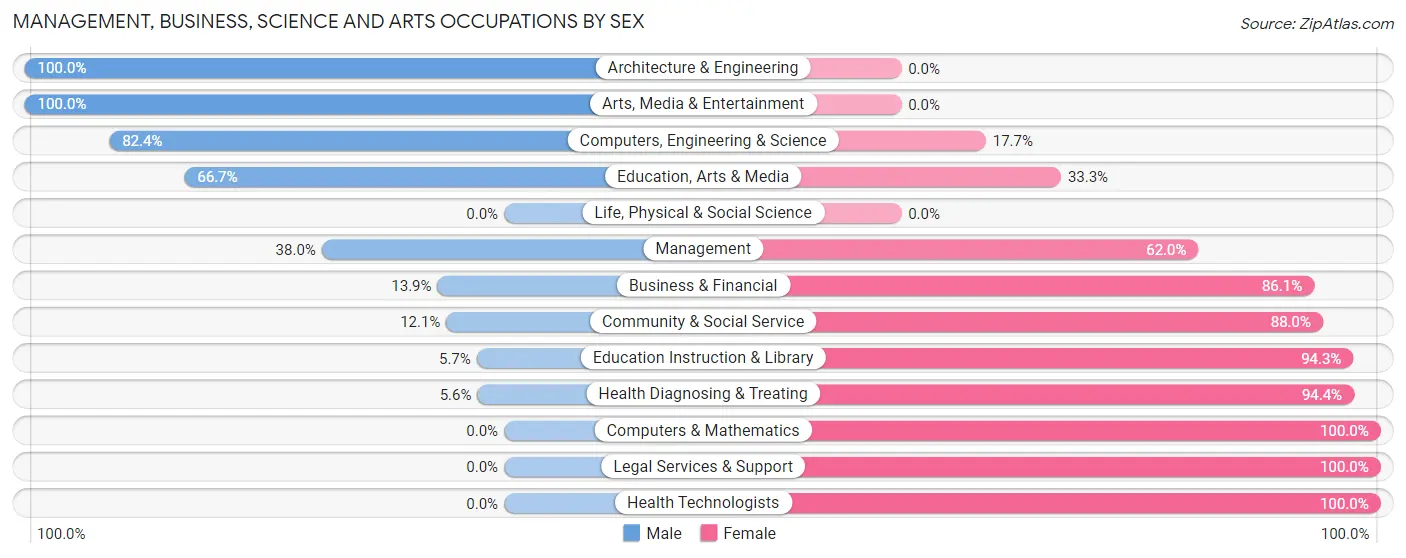
Management, Business, Science and Arts Occupations by Sex
Within the Management, Business, Science and Arts occupations in Niagara, the most male-oriented occupations are Architecture & Engineering (100.0%), Arts, Media & Entertainment (100.0%), and Computers, Engineering & Science (82.4%), while the most female-oriented occupations are Computers & Mathematics (100.0%), Legal Services & Support (100.0%), and Health Technologists (100.0%).
| Occupation | Male | Female |
| Management | 27 (38.0%) | 44 (62.0%) |
| Business & Financial | 5 (13.9%) | 31 (86.1%) |
| Computers, Engineering & Science | 14 (82.4%) | 3 (17.6%) |
| Computers & Mathematics | 0 (0.0%) | 3 (100.0%) |
| Architecture & Engineering | 14 (100.0%) | 0 (0.0%) |
| Life, Physical & Social Science | 0 (0.0%) | 0 (0.0%) |
| Community & Social Service | 10 (12.0%) | 73 (87.9%) |
| Education, Arts & Media | 4 (66.7%) | 2 (33.3%) |
| Legal Services & Support | 0 (0.0%) | 5 (100.0%) |
| Education Instruction & Library | 4 (5.7%) | 66 (94.3%) |
| Arts, Media & Entertainment | 2 (100.0%) | 0 (0.0%) |
| Health Diagnosing & Treating | 3 (5.6%) | 51 (94.4%) |
| Health Technologists | 0 (0.0%) | 33 (100.0%) |
| Total (Category) | 59 (22.6%) | 202 (77.4%) |
| Total (Overall) | 280 (44.7%) | 347 (55.3%) |
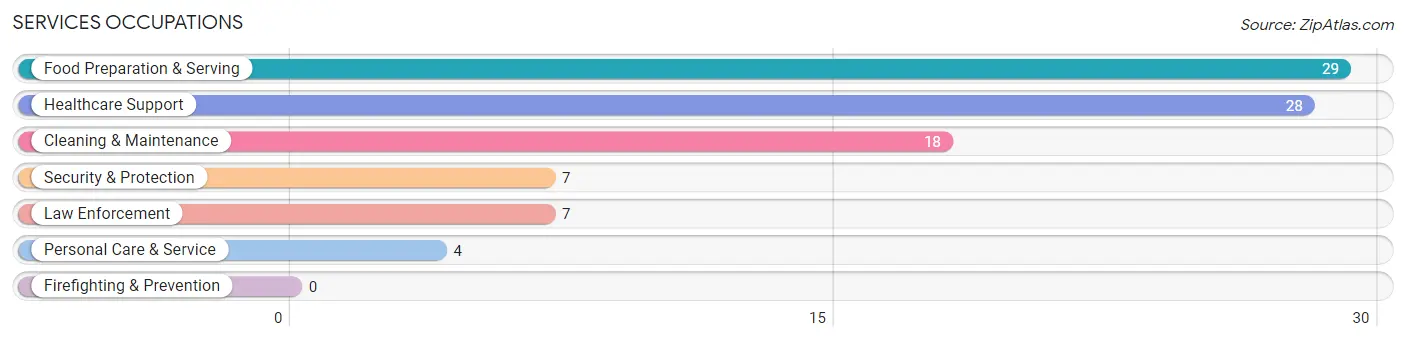
Services Occupations
The most common Services occupations in Niagara are Food Preparation & Serving (29 | 4.6%), Healthcare Support (28 | 4.5%), Cleaning & Maintenance (18 | 2.9%), Security & Protection (7 | 1.1%), and Law Enforcement (7 | 1.1%).
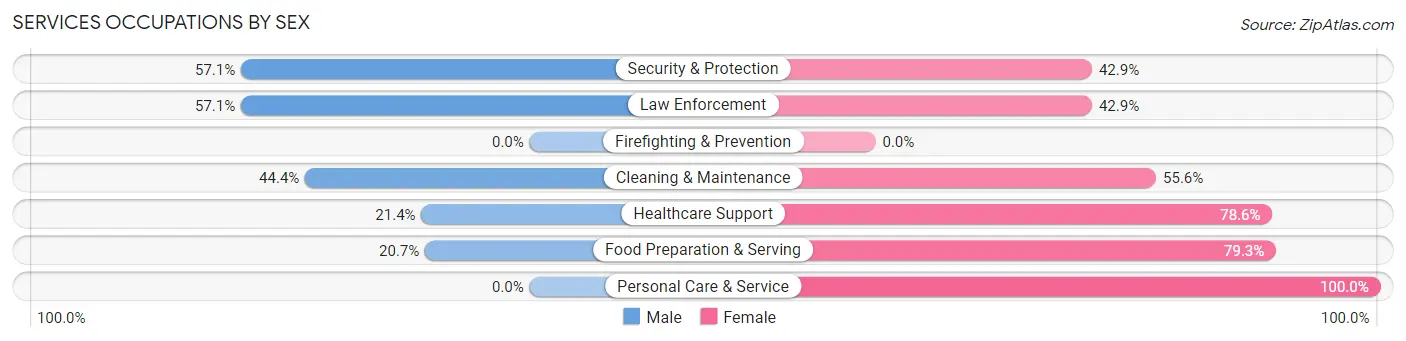
Services Occupations by Sex
Within the Services occupations in Niagara, the most male-oriented occupations are Security & Protection (57.1%), Law Enforcement (57.1%), and Cleaning & Maintenance (44.4%), while the most female-oriented occupations are Personal Care & Service (100.0%), Food Preparation & Serving (79.3%), and Healthcare Support (78.6%).
| Occupation | Male | Female |
| Healthcare Support | 6 (21.4%) | 22 (78.6%) |
| Security & Protection | 4 (57.1%) | 3 (42.9%) |
| Firefighting & Prevention | 0 (0.0%) | 0 (0.0%) |
| Law Enforcement | 4 (57.1%) | 3 (42.9%) |
| Food Preparation & Serving | 6 (20.7%) | 23 (79.3%) |
| Cleaning & Maintenance | 8 (44.4%) | 10 (55.6%) |
| Personal Care & Service | 0 (0.0%) | 4 (100.0%) |
| Total (Category) | 24 (27.9%) | 62 (72.1%) |
| Total (Overall) | 280 (44.7%) | 347 (55.3%) |
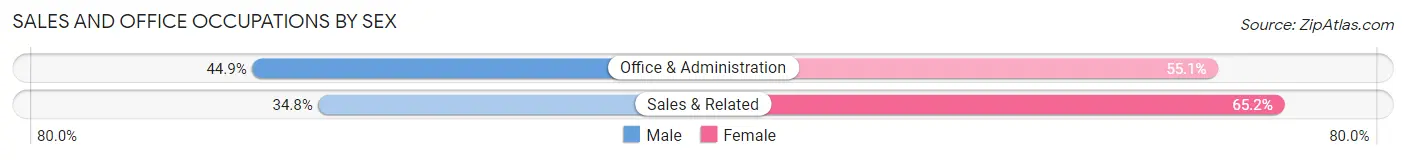
Sales and Office Occupations
The most common Sales and Office occupations in Niagara are Office & Administration (89 | 14.2%), and Sales & Related (23 | 3.7%).
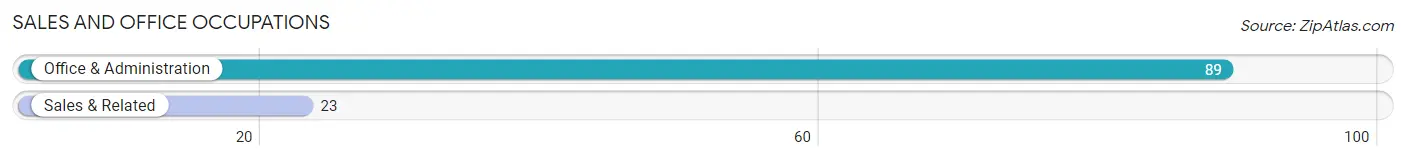
Sales and Office Occupations by Sex
| Occupation | Male | Female |
| Sales & Related | 8 (34.8%) | 15 (65.2%) |
| Office & Administration | 40 (44.9%) | 49 (55.1%) |
| Total (Category) | 48 (42.9%) | 64 (57.1%) |
| Total (Overall) | 280 (44.7%) | 347 (55.3%) |
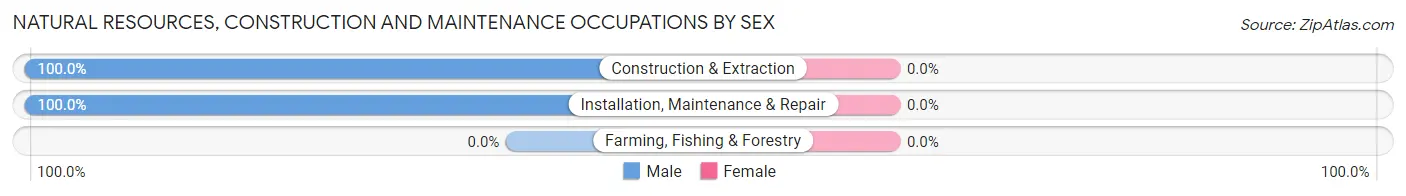
Natural Resources, Construction and Maintenance Occupations
The most common Natural Resources, Construction and Maintenance occupations in Niagara are Construction & Extraction (28 | 4.5%), and Installation, Maintenance & Repair (12 | 1.9%).
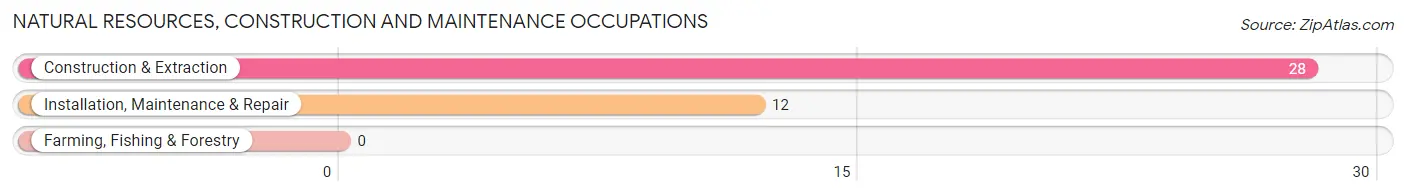
Natural Resources, Construction and Maintenance Occupations by Sex
| Occupation | Male | Female |
| Farming, Fishing & Forestry | 0 (0.0%) | 0 (0.0%) |
| Construction & Extraction | 28 (100.0%) | 0 (0.0%) |
| Installation, Maintenance & Repair | 12 (100.0%) | 0 (0.0%) |
| Total (Category) | 40 (100.0%) | 0 (0.0%) |
| Total (Overall) | 280 (44.7%) | 347 (55.3%) |
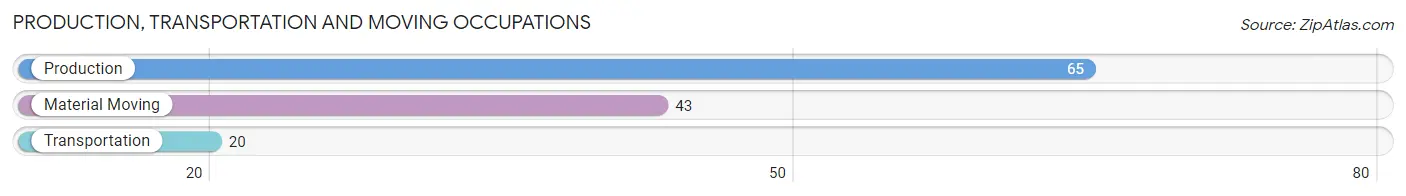
Production, Transportation and Moving Occupations
The most common Production, Transportation and Moving occupations in Niagara are Production (65 | 10.4%), Material Moving (43 | 6.9%), and Transportation (20 | 3.2%).
Production, Transportation and Moving Occupations by Sex
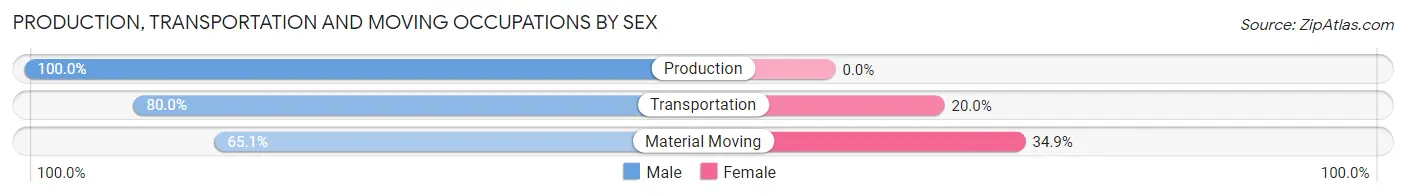
| Occupation | Male | Female |
| Production | 65 (100.0%) | 0 (0.0%) |
| Transportation | 16 (80.0%) | 4 (20.0%) |
| Material Moving | 28 (65.1%) | 15 (34.9%) |
| Total (Category) | 109 (85.2%) | 19 (14.8%) |
| Total (Overall) | 280 (44.7%) | 347 (55.3%) |
Employment Industries by Sex in Niagara
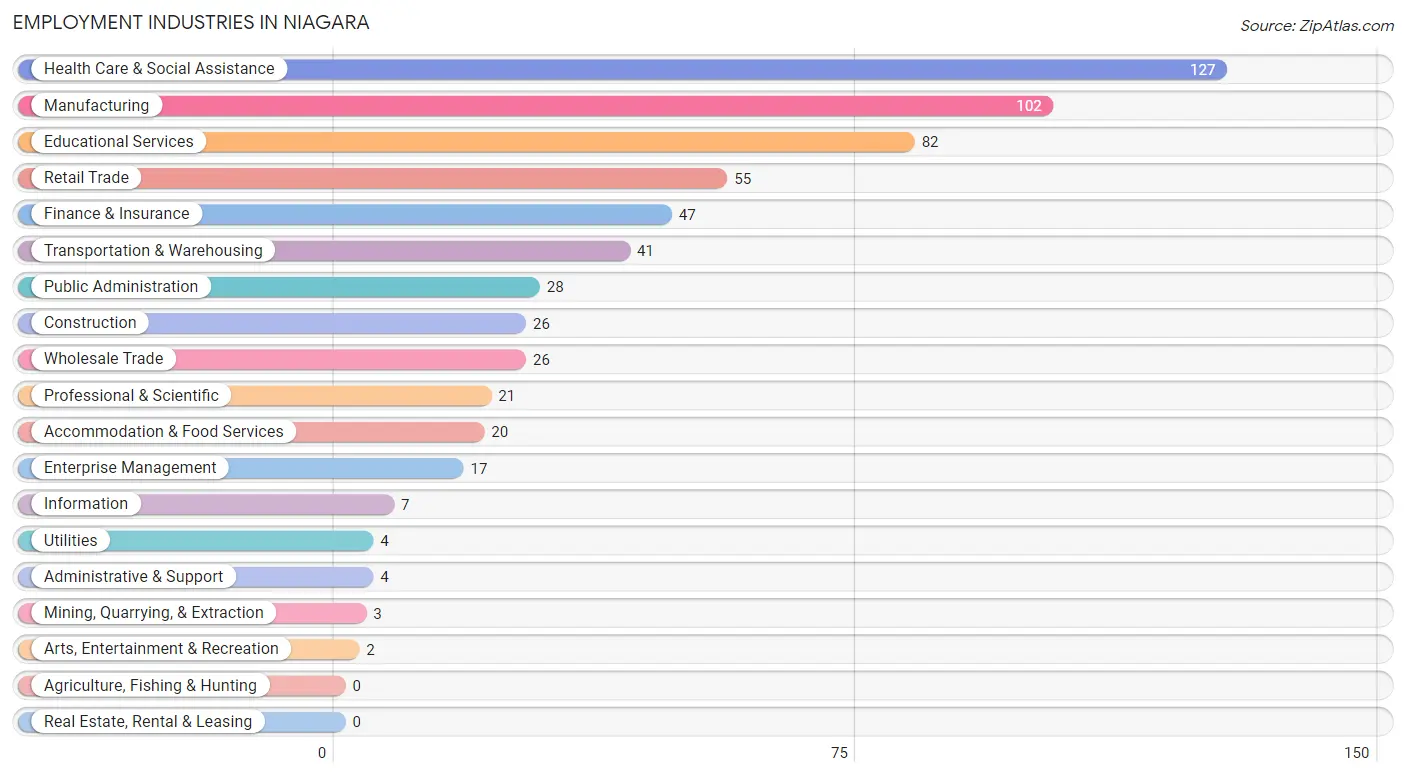
Employment Industries in Niagara
The major employment industries in Niagara include Health Care & Social Assistance (127 | 20.3%), Manufacturing (102 | 16.3%), Educational Services (82 | 13.1%), Retail Trade (55 | 8.8%), and Finance & Insurance (47 | 7.5%).
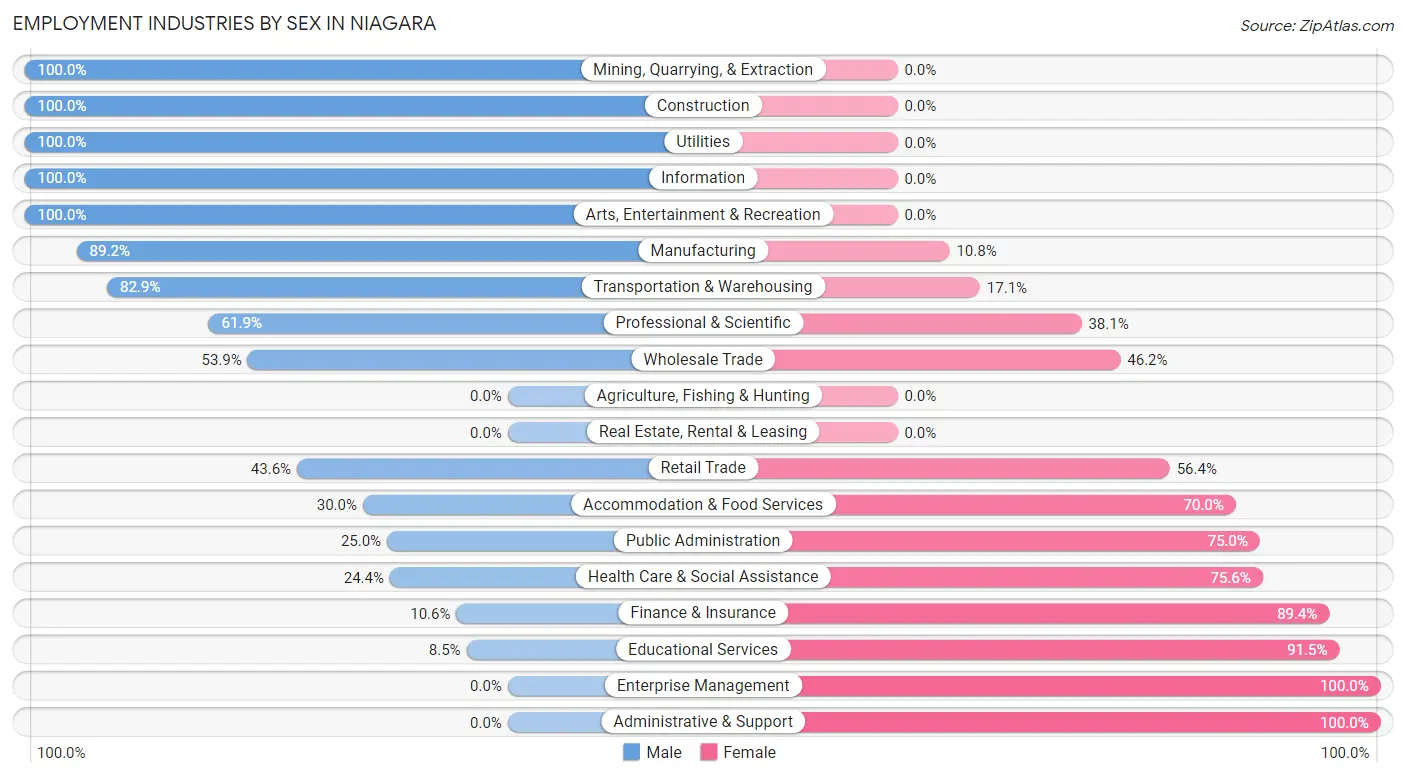
Employment Industries by Sex in Niagara
The Niagara industries that see more men than women are Mining, Quarrying, & Extraction (100.0%), Construction (100.0%), and Utilities (100.0%), whereas the industries that tend to have a higher number of women are Enterprise Management (100.0%), Administrative & Support (100.0%), and Educational Services (91.5%).
| Industry | Male | Female |
| Agriculture, Fishing & Hunting | 0 (0.0%) | 0 (0.0%) |
| Mining, Quarrying, & Extraction | 3 (100.0%) | 0 (0.0%) |
| Construction | 26 (100.0%) | 0 (0.0%) |
| Manufacturing | 91 (89.2%) | 11 (10.8%) |
| Wholesale Trade | 14 (53.8%) | 12 (46.2%) |
| Retail Trade | 24 (43.6%) | 31 (56.4%) |
| Transportation & Warehousing | 34 (82.9%) | 7 (17.1%) |
| Utilities | 4 (100.0%) | 0 (0.0%) |
| Information | 7 (100.0%) | 0 (0.0%) |
| Finance & Insurance | 5 (10.6%) | 42 (89.4%) |
| Real Estate, Rental & Leasing | 0 (0.0%) | 0 (0.0%) |
| Professional & Scientific | 13 (61.9%) | 8 (38.1%) |
| Enterprise Management | 0 (0.0%) | 17 (100.0%) |
| Administrative & Support | 0 (0.0%) | 4 (100.0%) |
| Educational Services | 7 (8.5%) | 75 (91.5%) |
| Health Care & Social Assistance | 31 (24.4%) | 96 (75.6%) |
| Arts, Entertainment & Recreation | 2 (100.0%) | 0 (0.0%) |
| Accommodation & Food Services | 6 (30.0%) | 14 (70.0%) |
| Public Administration | 7 (25.0%) | 21 (75.0%) |
| Total | 280 (44.7%) | 347 (55.3%) |
Education in Niagara
School Enrollment in Niagara
The most common levels of schooling among the 285 students in Niagara are high school (108 | 37.9%), elementary school (70 | 24.6%), and middle school (59 | 20.7%).
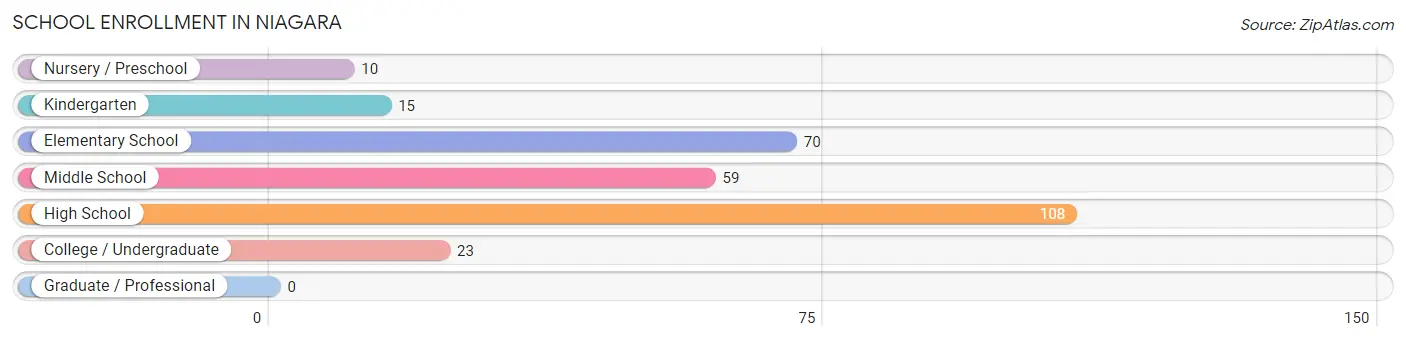
| School Level | # Students | % Students |
| Nursery / Preschool | 10 | 3.5% |
| Kindergarten | 15 | 5.3% |
| Elementary School | 70 | 24.6% |
| Middle School | 59 | 20.7% |
| High School | 108 | 37.9% |
| College / Undergraduate | 23 | 8.1% |
| Graduate / Professional | 0 | 0.0% |
| Total | 285 | 100.0% |
School Enrollment by Age by Funding Source in Niagara
Out of a total of 285 students who are enrolled in schools in Niagara, 4 (1.4%) attend a private institution, while the remaining 281 (98.6%) are enrolled in public schools. The age group of 5 to 9 year old has the highest likelihood of being enrolled in private schools, with 4 (4.7% in the age bracket) enrolled. Conversely, the age group of 3 to 4 year olds has the lowest likelihood of being enrolled in a private school, with 4 (100.0% in the age bracket) attending a public institution.
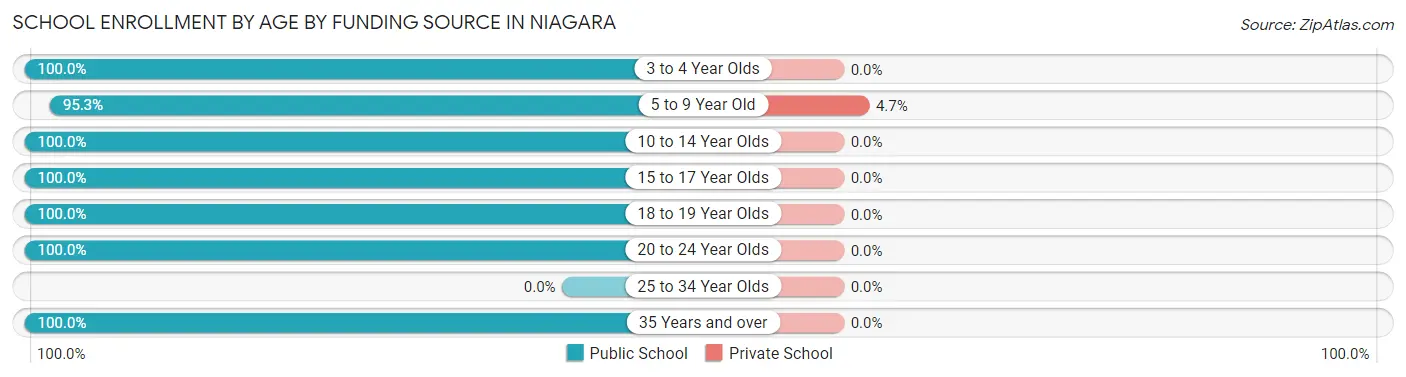
| Age Bracket | Public School | Private School |
| 3 to 4 Year Olds | 4 (100.0%) | 0 (0.0%) |
| 5 to 9 Year Old | 81 (95.3%) | 4 (4.7%) |
| 10 to 14 Year Olds | 77 (100.0%) | 0 (0.0%) |
| 15 to 17 Year Olds | 80 (100.0%) | 0 (0.0%) |
| 18 to 19 Year Olds | 16 (100.0%) | 0 (0.0%) |
| 20 to 24 Year Olds | 6 (100.0%) | 0 (0.0%) |
| 25 to 34 Year Olds | 0 (0.0%) | 0 (0.0%) |
| 35 Years and over | 17 (100.0%) | 0 (0.0%) |
| Total | 281 (98.6%) | 4 (1.4%) |
Educational Attainment by Field of Study in Niagara
Science & technology (29 | 19.7%), business (29 | 19.7%), arts & humanities (22 | 15.0%), education (17 | 11.6%), and engineering (12 | 8.2%) are the most common fields of study among 147 individuals in Niagara who have obtained a bachelor's degree or higher.
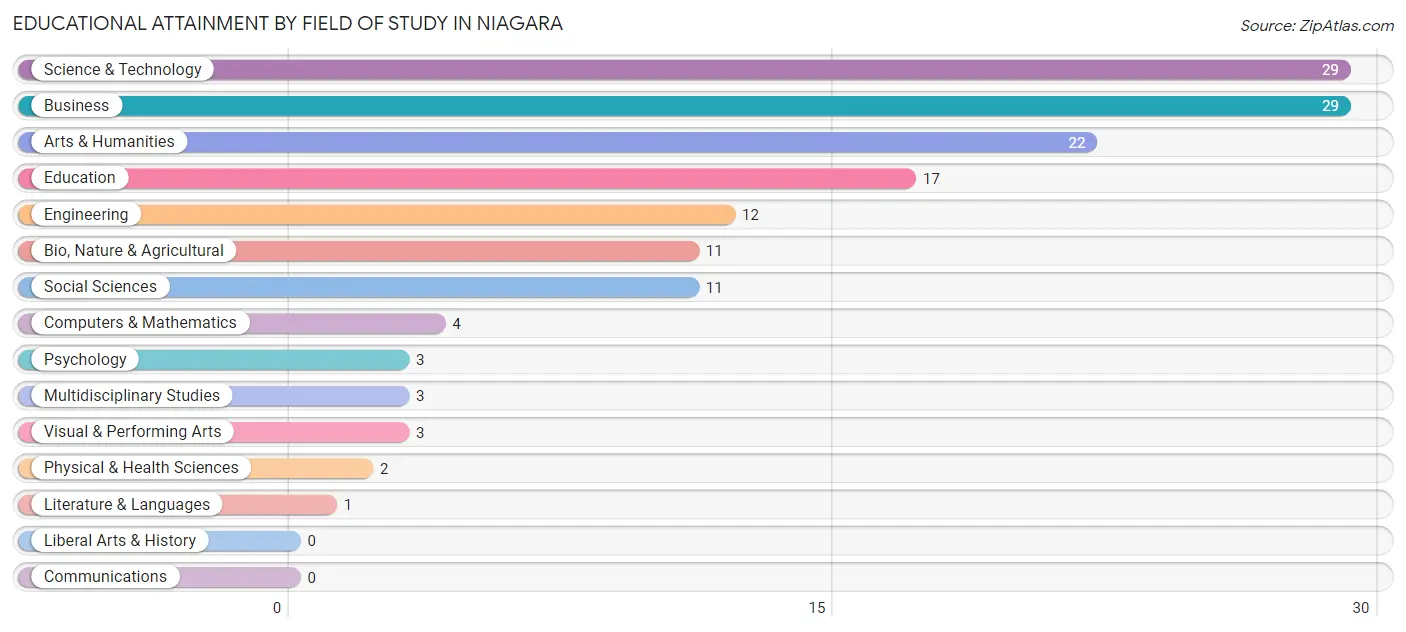
| Field of Study | # Graduates | % Graduates |
| Computers & Mathematics | 4 | 2.7% |
| Bio, Nature & Agricultural | 11 | 7.5% |
| Physical & Health Sciences | 2 | 1.4% |
| Psychology | 3 | 2.0% |
| Social Sciences | 11 | 7.5% |
| Engineering | 12 | 8.2% |
| Multidisciplinary Studies | 3 | 2.0% |
| Science & Technology | 29 | 19.7% |
| Business | 29 | 19.7% |
| Education | 17 | 11.6% |
| Literature & Languages | 1 | 0.7% |
| Liberal Arts & History | 0 | 0.0% |
| Visual & Performing Arts | 3 | 2.0% |
| Communications | 0 | 0.0% |
| Arts & Humanities | 22 | 15.0% |
| Total | 147 | 100.0% |
Transportation & Commute in Niagara
Vehicle Availability by Sex in Niagara
The most prevalent vehicle ownership categories in Niagara are males with 2 vehicles (138, accounting for 49.3%) and females with 2 vehicles (190, making up 39.8%).
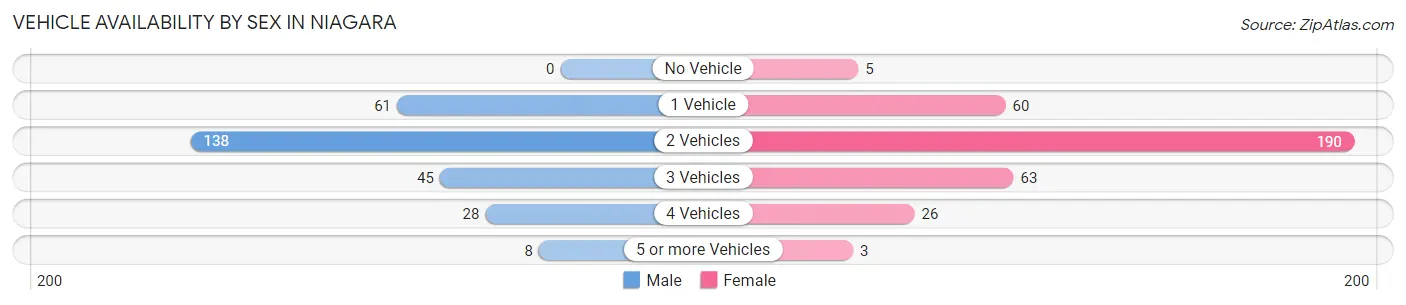
| Vehicles Available | Male | Female |
| No Vehicle | 0 (0.0%) | 5 (1.4%) |
| 1 Vehicle | 61 (21.8%) | 60 (17.3%) |
| 2 Vehicles | 138 (49.3%) | 190 (54.8%) |
| 3 Vehicles | 45 (16.1%) | 63 (18.2%) |
| 4 Vehicles | 28 (10.0%) | 26 (7.5%) |
| 5 or more Vehicles | 8 (2.9%) | 3 (0.9%) |
| Total | 280 (100.0%) | 347 (100.0%) |
Commute Time in Niagara
The most frequently occuring commute durations in Niagara are 15 to 19 minutes (178 commuters, 32.2%), 10 to 14 minutes (104 commuters, 18.8%), and 5 to 9 minutes (72 commuters, 13.0%).
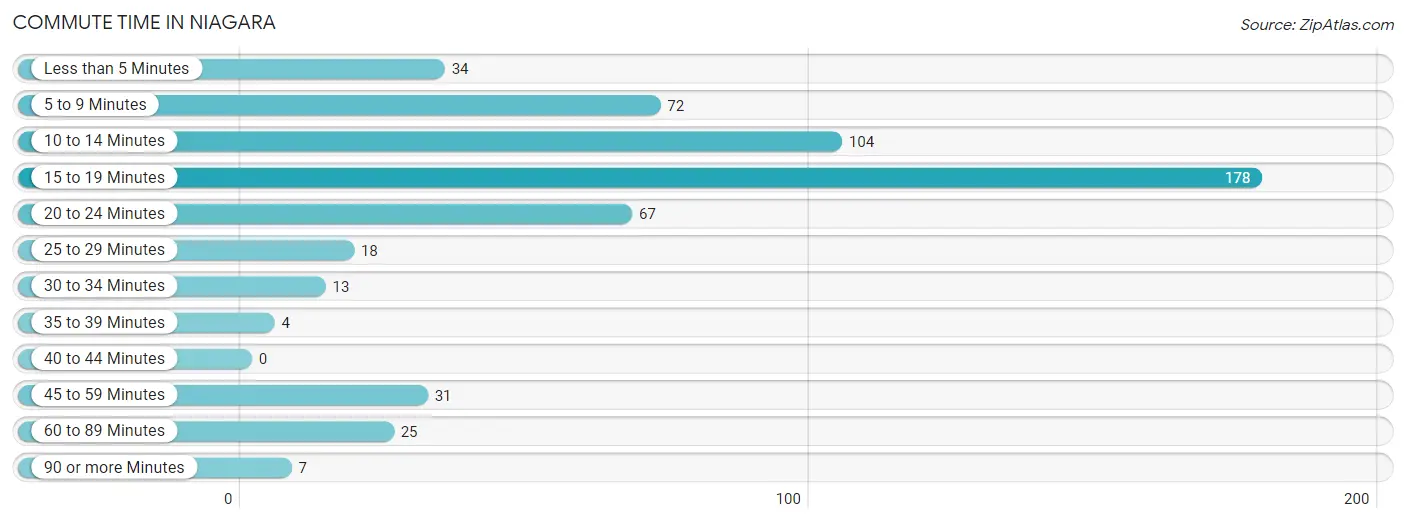
| Commute Time | # Commuters | % Commuters |
| Less than 5 Minutes | 34 | 6.1% |
| 5 to 9 Minutes | 72 | 13.0% |
| 10 to 14 Minutes | 104 | 18.8% |
| 15 to 19 Minutes | 178 | 32.2% |
| 20 to 24 Minutes | 67 | 12.1% |
| 25 to 29 Minutes | 18 | 3.3% |
| 30 to 34 Minutes | 13 | 2.4% |
| 35 to 39 Minutes | 4 | 0.7% |
| 40 to 44 Minutes | 0 | 0.0% |
| 45 to 59 Minutes | 31 | 5.6% |
| 60 to 89 Minutes | 25 | 4.5% |
| 90 or more Minutes | 7 | 1.3% |
Commute Time by Sex in Niagara
The most common commute times in Niagara are 10 to 14 minutes (62 commuters, 24.0%) for males and 15 to 19 minutes (122 commuters, 41.4%) for females.
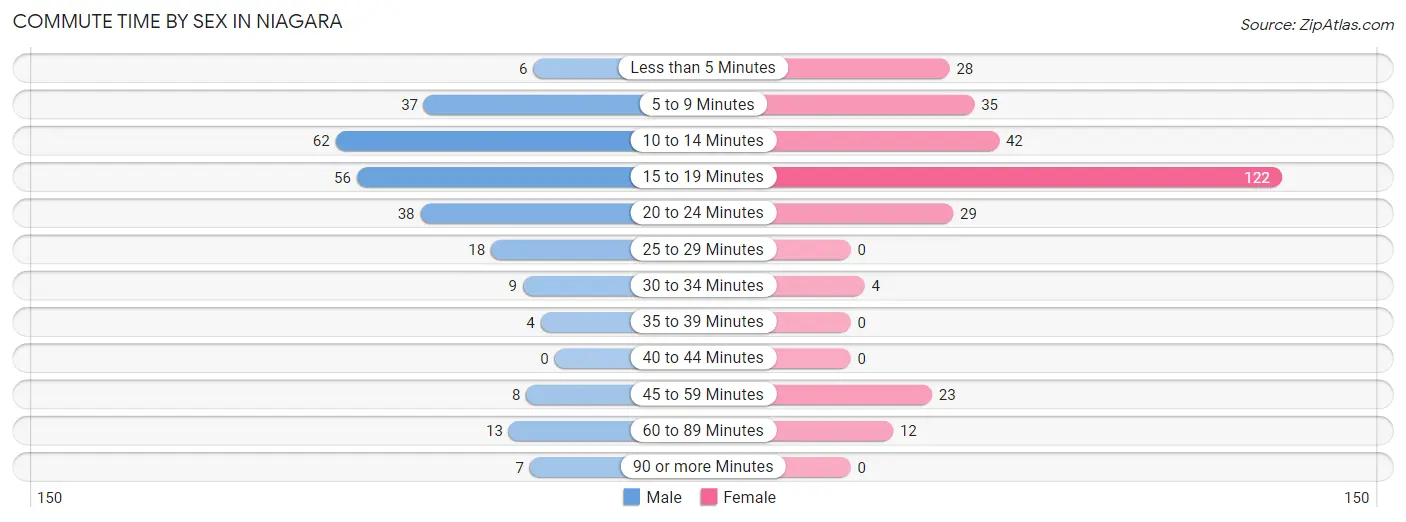
| Commute Time | Male | Female |
| Less than 5 Minutes | 6 (2.3%) | 28 (9.5%) |
| 5 to 9 Minutes | 37 (14.3%) | 35 (11.9%) |
| 10 to 14 Minutes | 62 (24.0%) | 42 (14.2%) |
| 15 to 19 Minutes | 56 (21.7%) | 122 (41.4%) |
| 20 to 24 Minutes | 38 (14.7%) | 29 (9.8%) |
| 25 to 29 Minutes | 18 (7.0%) | 0 (0.0%) |
| 30 to 34 Minutes | 9 (3.5%) | 4 (1.4%) |
| 35 to 39 Minutes | 4 (1.5%) | 0 (0.0%) |
| 40 to 44 Minutes | 0 (0.0%) | 0 (0.0%) |
| 45 to 59 Minutes | 8 (3.1%) | 23 (7.8%) |
| 60 to 89 Minutes | 13 (5.0%) | 12 (4.1%) |
| 90 or more Minutes | 7 (2.7%) | 0 (0.0%) |
Time of Departure to Work by Sex in Niagara
The most frequent times of departure to work in Niagara are 6:30 AM to 6:59 AM (49, 19.0%) for males and 7:30 AM to 7:59 AM (83, 28.1%) for females.
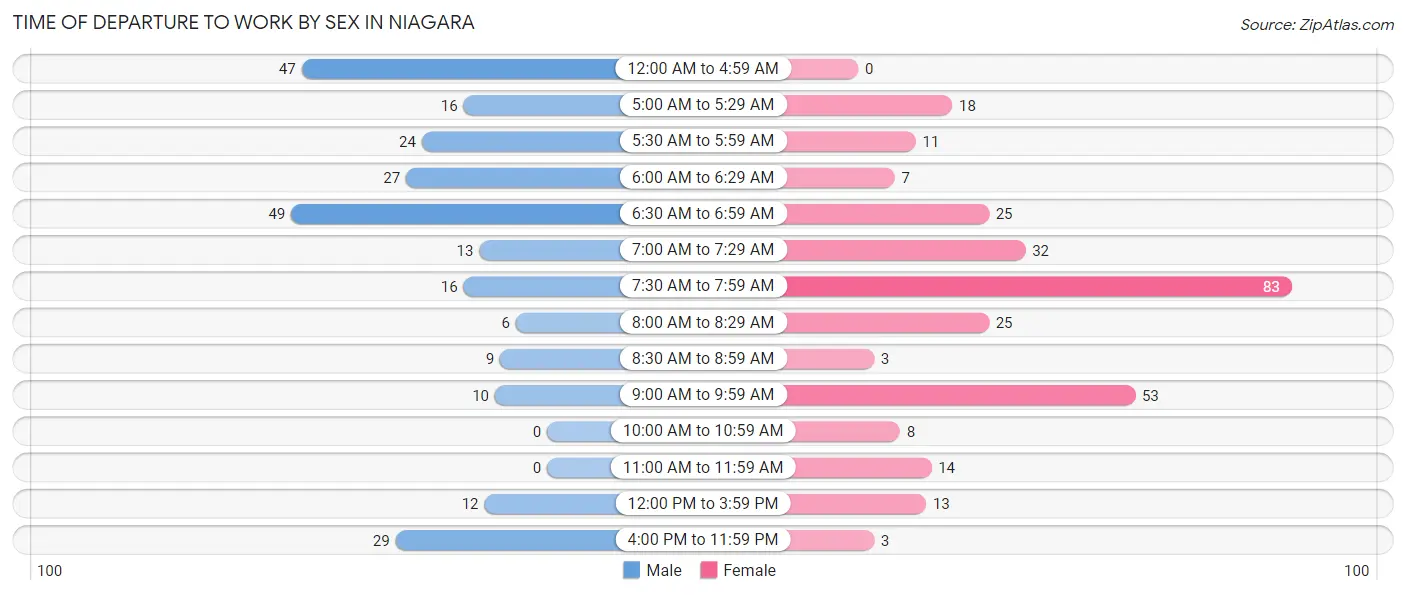
| Time of Departure | Male | Female |
| 12:00 AM to 4:59 AM | 47 (18.2%) | 0 (0.0%) |
| 5:00 AM to 5:29 AM | 16 (6.2%) | 18 (6.1%) |
| 5:30 AM to 5:59 AM | 24 (9.3%) | 11 (3.7%) |
| 6:00 AM to 6:29 AM | 27 (10.5%) | 7 (2.4%) |
| 6:30 AM to 6:59 AM | 49 (19.0%) | 25 (8.5%) |
| 7:00 AM to 7:29 AM | 13 (5.0%) | 32 (10.8%) |
| 7:30 AM to 7:59 AM | 16 (6.2%) | 83 (28.1%) |
| 8:00 AM to 8:29 AM | 6 (2.3%) | 25 (8.5%) |
| 8:30 AM to 8:59 AM | 9 (3.5%) | 3 (1.0%) |
| 9:00 AM to 9:59 AM | 10 (3.9%) | 53 (18.0%) |
| 10:00 AM to 10:59 AM | 0 (0.0%) | 8 (2.7%) |
| 11:00 AM to 11:59 AM | 0 (0.0%) | 14 (4.8%) |
| 12:00 PM to 3:59 PM | 12 (4.6%) | 13 (4.4%) |
| 4:00 PM to 11:59 PM | 29 (11.2%) | 3 (1.0%) |
| Total | 258 (100.0%) | 295 (100.0%) |
Housing Occupancy in Niagara
Occupancy by Ownership in Niagara
Of the total 652 dwellings in Niagara, owner-occupied units account for 517 (79.3%), while renter-occupied units make up 135 (20.7%).
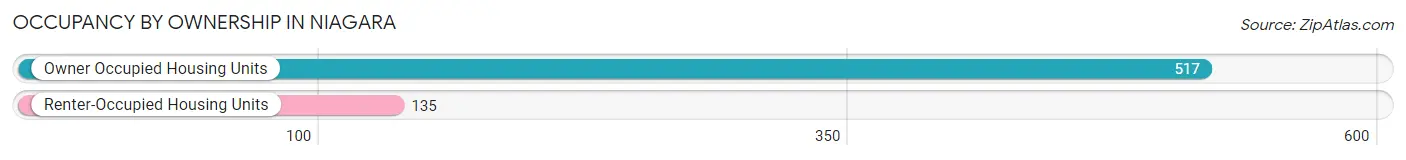
| Occupancy | # Housing Units | % Housing Units |
| Owner Occupied Housing Units | 517 | 79.3% |
| Renter-Occupied Housing Units | 135 | 20.7% |
| Total Occupied Housing Units | 652 | 100.0% |
Occupancy by Household Size in Niagara
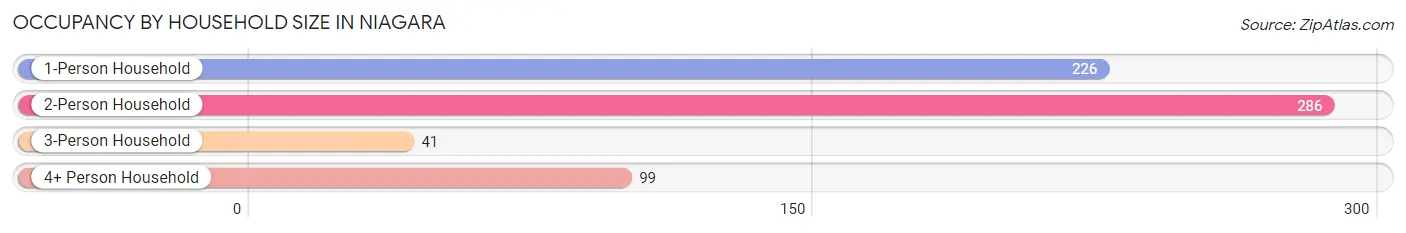
| Household Size | # Housing Units | % Housing Units |
| 1-Person Household | 226 | 34.7% |
| 2-Person Household | 286 | 43.9% |
| 3-Person Household | 41 | 6.3% |
| 4+ Person Household | 99 | 15.2% |
| Total Housing Units | 652 | 100.0% |
Occupancy by Ownership by Household Size in Niagara
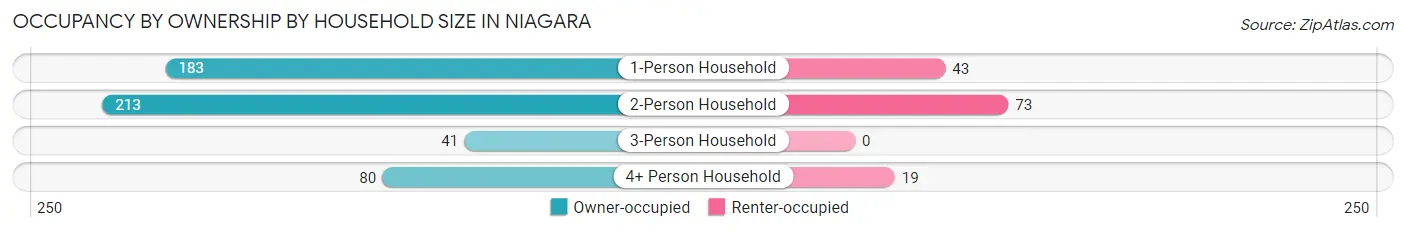
| Household Size | Owner-occupied | Renter-occupied |
| 1-Person Household | 183 (81.0%) | 43 (19.0%) |
| 2-Person Household | 213 (74.5%) | 73 (25.5%) |
| 3-Person Household | 41 (100.0%) | 0 (0.0%) |
| 4+ Person Household | 80 (80.8%) | 19 (19.2%) |
| Total Housing Units | 517 (79.3%) | 135 (20.7%) |
Occupancy by Educational Attainment in Niagara
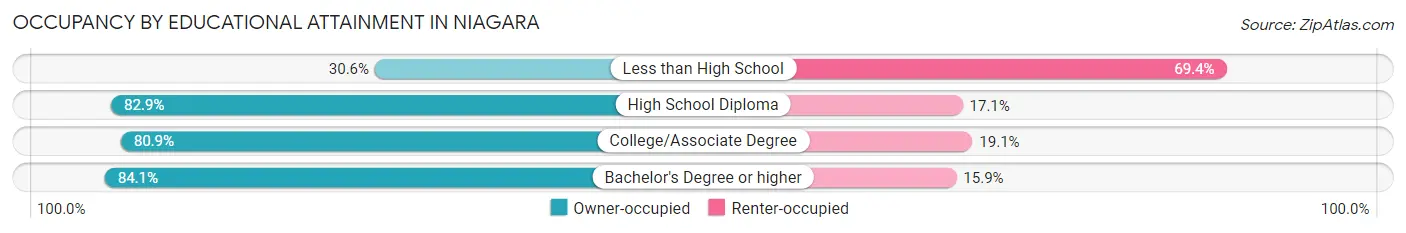
| Household Size | Owner-occupied | Renter-occupied |
| Less than High School | 11 (30.6%) | 25 (69.4%) |
| High School Diploma | 203 (82.9%) | 42 (17.1%) |
| College/Associate Degree | 229 (80.9%) | 54 (19.1%) |
| Bachelor's Degree or higher | 74 (84.1%) | 14 (15.9%) |
Occupancy by Age of Householder in Niagara
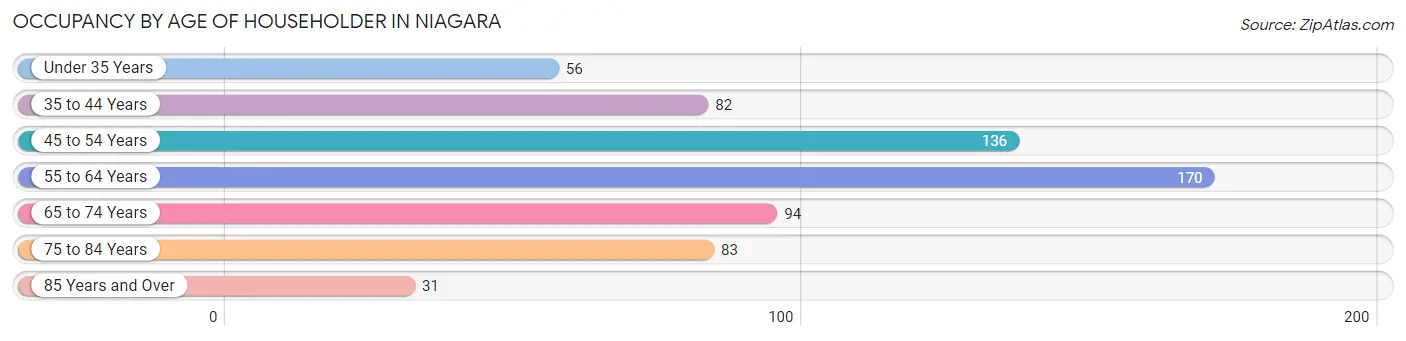
| Age Bracket | # Households | % Households |
| Under 35 Years | 56 | 8.6% |
| 35 to 44 Years | 82 | 12.6% |
| 45 to 54 Years | 136 | 20.9% |
| 55 to 64 Years | 170 | 26.1% |
| 65 to 74 Years | 94 | 14.4% |
| 75 to 84 Years | 83 | 12.7% |
| 85 Years and Over | 31 | 4.8% |
| Total | 652 | 100.0% |
Housing Finances in Niagara
Median Income by Occupancy in Niagara
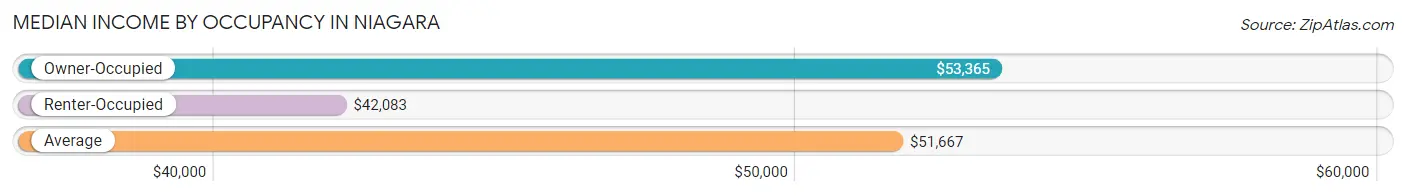
| Occupancy Type | # Households | Median Income |
| Owner-Occupied | 517 (79.3%) | $53,365 |
| Renter-Occupied | 135 (20.7%) | $42,083 |
| Average | 652 (100.0%) | $51,667 |
Occupancy by Householder Income Bracket in Niagara
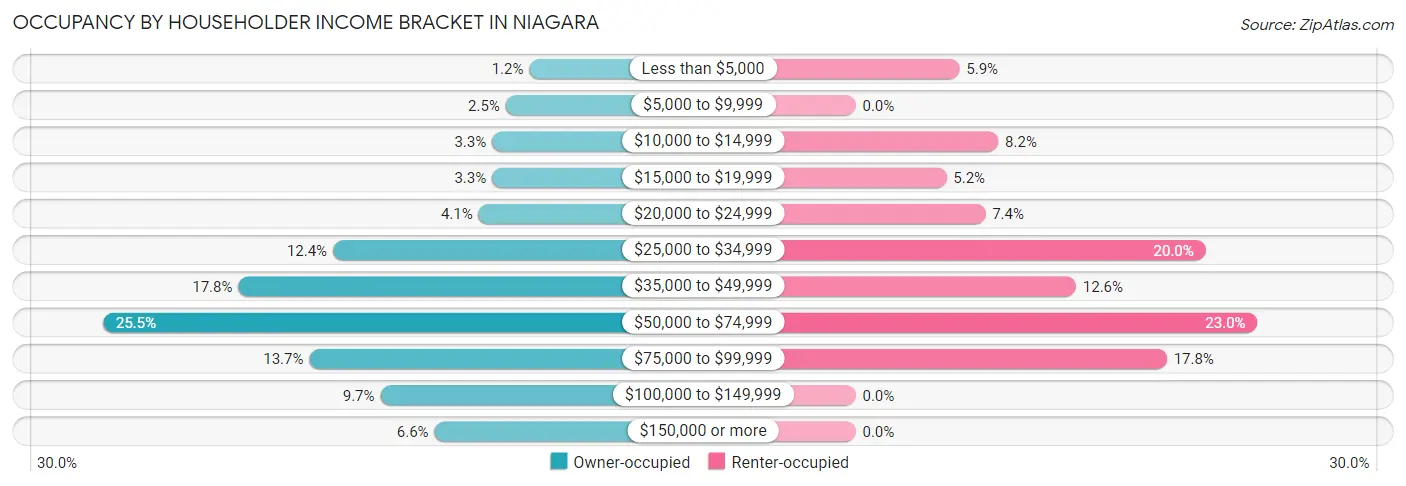
| Income Bracket | Owner-occupied | Renter-occupied |
| Less than $5,000 | 6 (1.2%) | 8 (5.9%) |
| $5,000 to $9,999 | 13 (2.5%) | 0 (0.0%) |
| $10,000 to $14,999 | 17 (3.3%) | 11 (8.2%) |
| $15,000 to $19,999 | 17 (3.3%) | 7 (5.2%) |
| $20,000 to $24,999 | 21 (4.1%) | 10 (7.4%) |
| $25,000 to $34,999 | 64 (12.4%) | 27 (20.0%) |
| $35,000 to $49,999 | 92 (17.8%) | 17 (12.6%) |
| $50,000 to $74,999 | 132 (25.5%) | 31 (23.0%) |
| $75,000 to $99,999 | 71 (13.7%) | 24 (17.8%) |
| $100,000 to $149,999 | 50 (9.7%) | 0 (0.0%) |
| $150,000 or more | 34 (6.6%) | 0 (0.0%) |
| Total | 517 (100.0%) | 135 (100.0%) |
Monthly Housing Cost Tiers in Niagara
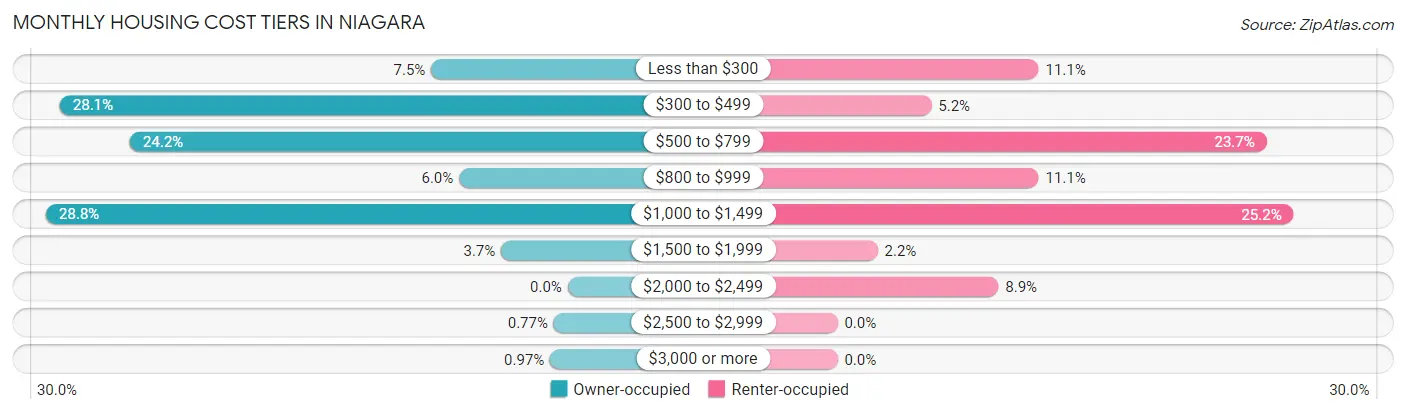
| Monthly Cost | Owner-occupied | Renter-occupied |
| Less than $300 | 39 (7.5%) | 15 (11.1%) |
| $300 to $499 | 145 (28.1%) | 7 (5.2%) |
| $500 to $799 | 125 (24.2%) | 32 (23.7%) |
| $800 to $999 | 31 (6.0%) | 15 (11.1%) |
| $1,000 to $1,499 | 149 (28.8%) | 34 (25.2%) |
| $1,500 to $1,999 | 19 (3.7%) | 3 (2.2%) |
| $2,000 to $2,499 | 0 (0.0%) | 12 (8.9%) |
| $2,500 to $2,999 | 4 (0.8%) | 0 (0.0%) |
| $3,000 or more | 5 (1.0%) | 0 (0.0%) |
| Total | 517 (100.0%) | 135 (100.0%) |
Physical Housing Characteristics in Niagara
Housing Structures in Niagara
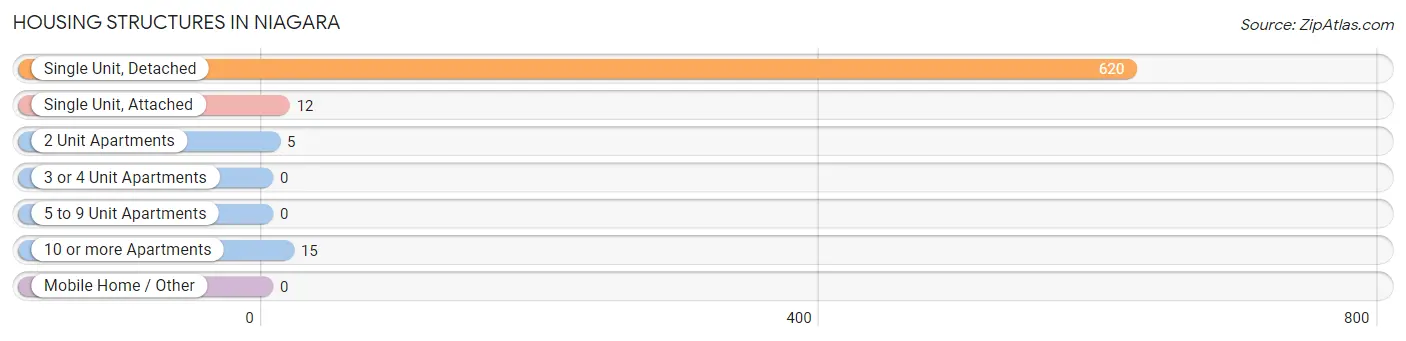
| Structure Type | # Housing Units | % Housing Units |
| Single Unit, Detached | 620 | 95.1% |
| Single Unit, Attached | 12 | 1.8% |
| 2 Unit Apartments | 5 | 0.8% |
| 3 or 4 Unit Apartments | 0 | 0.0% |
| 5 to 9 Unit Apartments | 0 | 0.0% |
| 10 or more Apartments | 15 | 2.3% |
| Mobile Home / Other | 0 | 0.0% |
| Total | 652 | 100.0% |
Housing Structures by Occupancy in Niagara
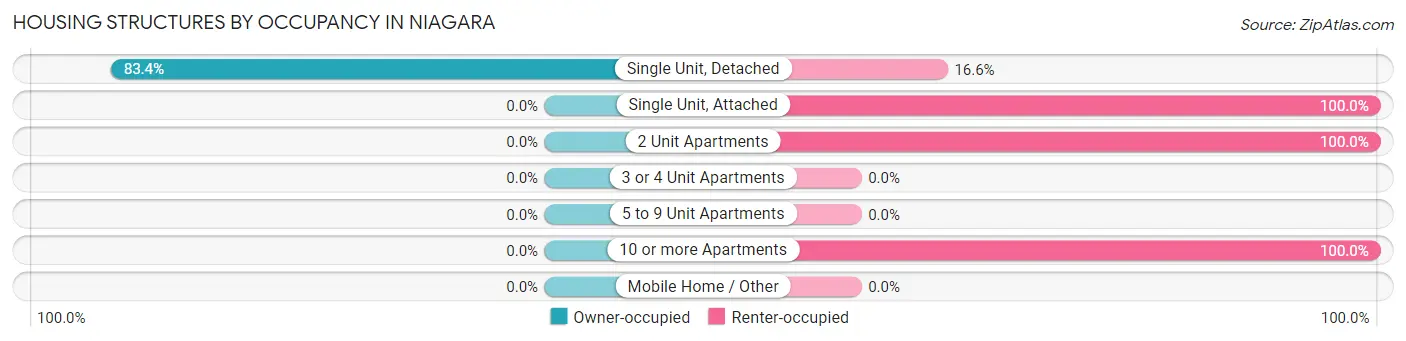
| Structure Type | Owner-occupied | Renter-occupied |
| Single Unit, Detached | 517 (83.4%) | 103 (16.6%) |
| Single Unit, Attached | 0 (0.0%) | 12 (100.0%) |
| 2 Unit Apartments | 0 (0.0%) | 5 (100.0%) |
| 3 or 4 Unit Apartments | 0 (0.0%) | 0 (0.0%) |
| 5 to 9 Unit Apartments | 0 (0.0%) | 0 (0.0%) |
| 10 or more Apartments | 0 (0.0%) | 15 (100.0%) |
| Mobile Home / Other | 0 (0.0%) | 0 (0.0%) |
| Total | 517 (79.3%) | 135 (20.7%) |
Housing Structures by Number of Rooms in Niagara
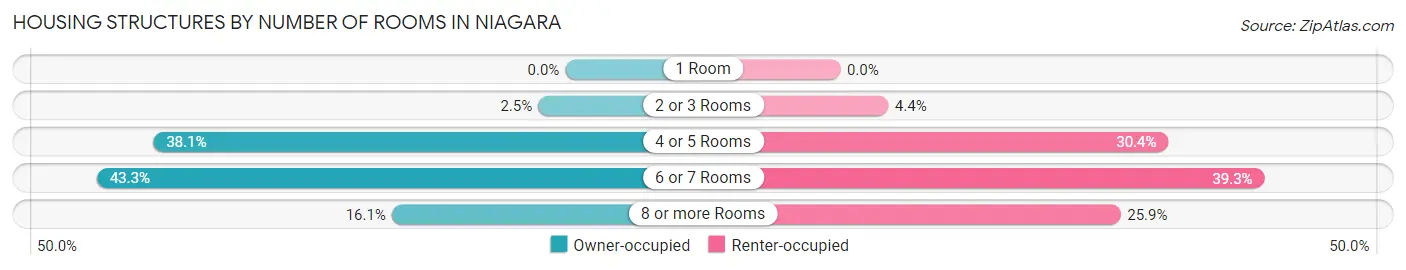
| Number of Rooms | Owner-occupied | Renter-occupied |
| 1 Room | 0 (0.0%) | 0 (0.0%) |
| 2 or 3 Rooms | 13 (2.5%) | 6 (4.4%) |
| 4 or 5 Rooms | 197 (38.1%) | 41 (30.4%) |
| 6 or 7 Rooms | 224 (43.3%) | 53 (39.3%) |
| 8 or more Rooms | 83 (16.1%) | 35 (25.9%) |
| Total | 517 (100.0%) | 135 (100.0%) |
Housing Structure by Heating Type in Niagara
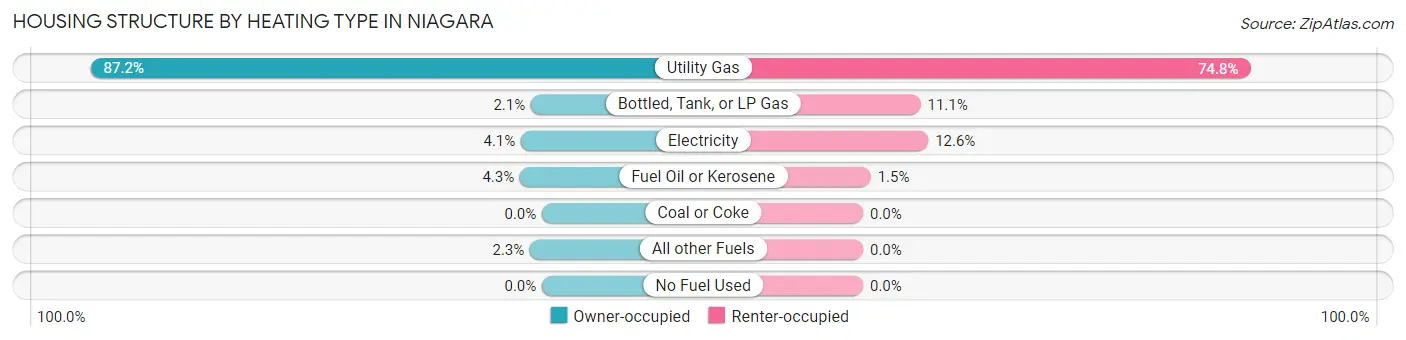
| Heating Type | Owner-occupied | Renter-occupied |
| Utility Gas | 451 (87.2%) | 101 (74.8%) |
| Bottled, Tank, or LP Gas | 11 (2.1%) | 15 (11.1%) |
| Electricity | 21 (4.1%) | 17 (12.6%) |
| Fuel Oil or Kerosene | 22 (4.3%) | 2 (1.5%) |
| Coal or Coke | 0 (0.0%) | 0 (0.0%) |
| All other Fuels | 12 (2.3%) | 0 (0.0%) |
| No Fuel Used | 0 (0.0%) | 0 (0.0%) |
| Total | 517 (100.0%) | 135 (100.0%) |
Household Vehicle Usage in Niagara
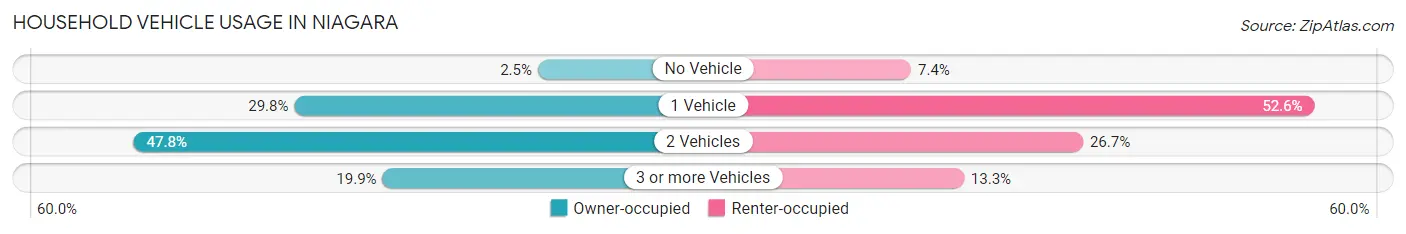
| Vehicles per Household | Owner-occupied | Renter-occupied |
| No Vehicle | 13 (2.5%) | 10 (7.4%) |
| 1 Vehicle | 154 (29.8%) | 71 (52.6%) |
| 2 Vehicles | 247 (47.8%) | 36 (26.7%) |
| 3 or more Vehicles | 103 (19.9%) | 18 (13.3%) |
| Total | 517 (100.0%) | 135 (100.0%) |
Real Estate & Mortgages in Niagara
Real Estate and Mortgage Overview in Niagara
| Characteristic | Without Mortgage | With Mortgage |
| Housing Units | 283 | 234 |
| Median Property Value | $59,900 | $119,800 |
| Median Household Income | $45,268 | $34 |
| Monthly Housing Costs | $462 | $0 |
| Real Estate Taxes | $1,244 | $0 |
Property Value by Mortgage Status in Niagara
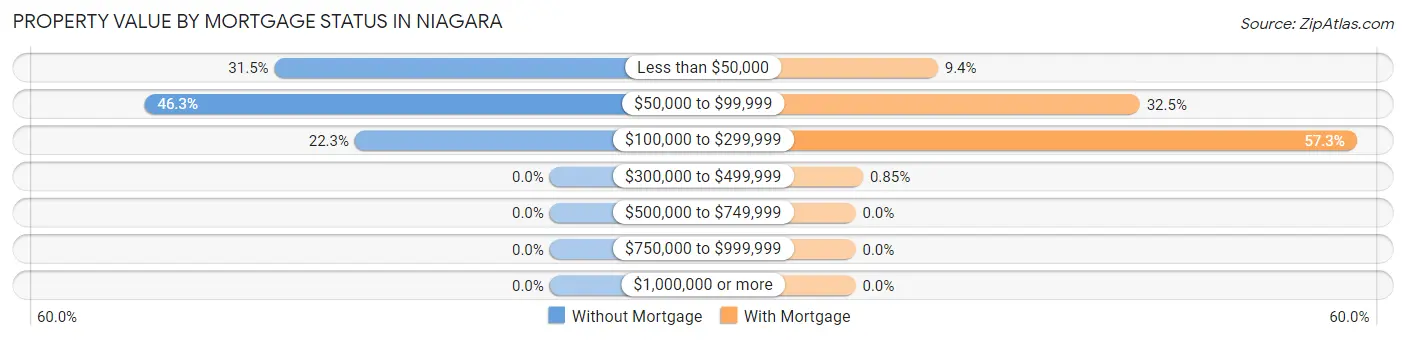
| Property Value | Without Mortgage | With Mortgage |
| Less than $50,000 | 89 (31.5%) | 22 (9.4%) |
| $50,000 to $99,999 | 131 (46.3%) | 76 (32.5%) |
| $100,000 to $299,999 | 63 (22.3%) | 134 (57.3%) |
| $300,000 to $499,999 | 0 (0.0%) | 2 (0.9%) |
| $500,000 to $749,999 | 0 (0.0%) | 0 (0.0%) |
| $750,000 to $999,999 | 0 (0.0%) | 0 (0.0%) |
| $1,000,000 or more | 0 (0.0%) | 0 (0.0%) |
| Total | 283 (100.0%) | 234 (100.0%) |
Household Income by Mortgage Status in Niagara
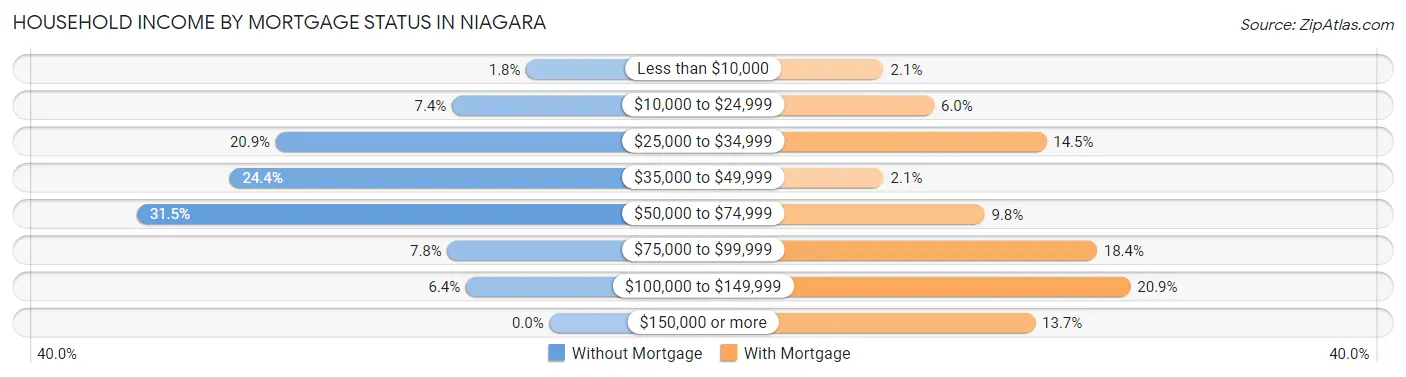
| Household Income | Without Mortgage | With Mortgage |
| Less than $10,000 | 5 (1.8%) | 5 (2.1%) |
| $10,000 to $24,999 | 21 (7.4%) | 14 (6.0%) |
| $25,000 to $34,999 | 59 (20.8%) | 34 (14.5%) |
| $35,000 to $49,999 | 69 (24.4%) | 5 (2.1%) |
| $50,000 to $74,999 | 89 (31.5%) | 23 (9.8%) |
| $75,000 to $99,999 | 22 (7.8%) | 43 (18.4%) |
| $100,000 to $149,999 | 18 (6.4%) | 49 (20.9%) |
| $150,000 or more | 0 (0.0%) | 32 (13.7%) |
| Total | 283 (100.0%) | 234 (100.0%) |
Property Value to Household Income Ratio in Niagara
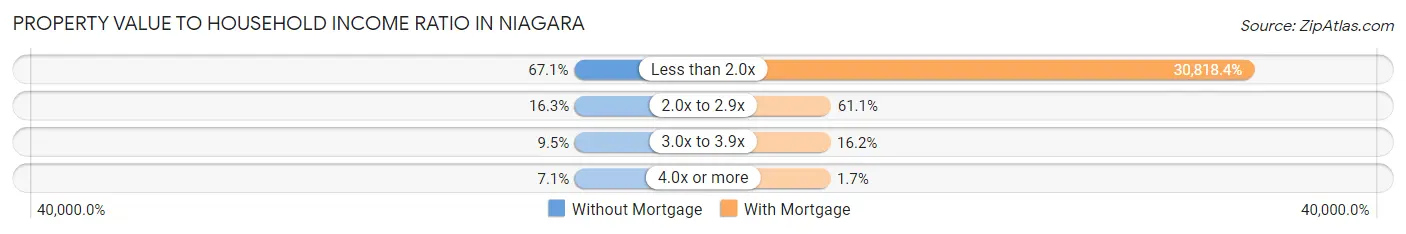
| Value-to-Income Ratio | Without Mortgage | With Mortgage |
| Less than 2.0x | 190 (67.1%) | 72,115 (30,818.4%) |
| 2.0x to 2.9x | 46 (16.3%) | 143 (61.1%) |
| 3.0x to 3.9x | 27 (9.5%) | 38 (16.2%) |
| 4.0x or more | 20 (7.1%) | 4 (1.7%) |
| Total | 283 (100.0%) | 234 (100.0%) |
Real Estate Taxes by Mortgage Status in Niagara
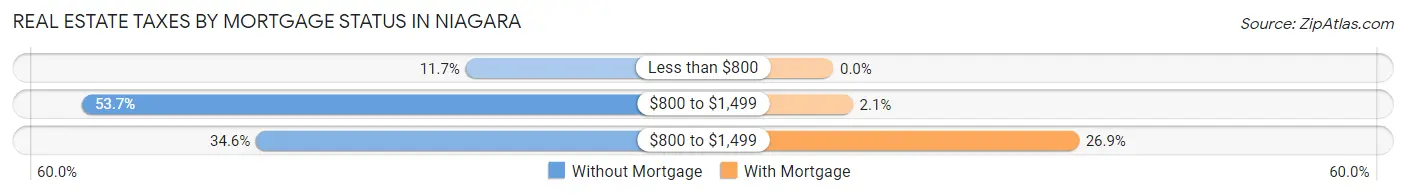
| Property Taxes | Without Mortgage | With Mortgage |
| Less than $800 | 33 (11.7%) | 0 (0.0%) |
| $800 to $1,499 | 152 (53.7%) | 5 (2.1%) |
| $800 to $1,499 | 98 (34.6%) | 63 (26.9%) |
| Total | 283 (100.0%) | 234 (100.0%) |
Health & Disability in Niagara
Health Insurance Coverage by Age in Niagara
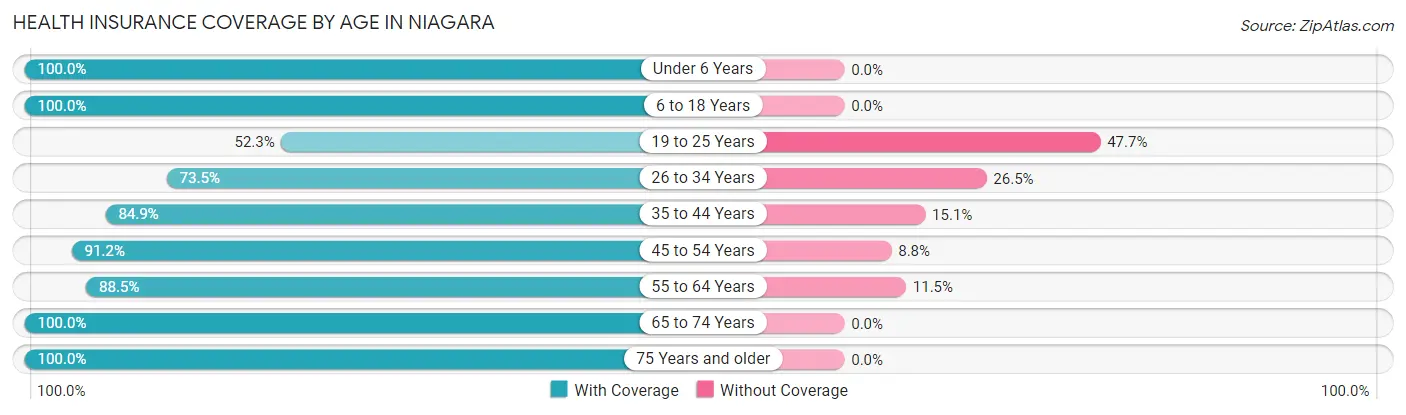
| Age Bracket | With Coverage | Without Coverage |
| Under 6 Years | 57 (100.0%) | 0 (0.0%) |
| 6 to 18 Years | 245 (100.0%) | 0 (0.0%) |
| 19 to 25 Years | 46 (52.3%) | 42 (47.7%) |
| 26 to 34 Years | 86 (73.5%) | 31 (26.5%) |
| 35 to 44 Years | 107 (84.9%) | 19 (15.1%) |
| 45 to 54 Years | 198 (91.2%) | 19 (8.8%) |
| 55 to 64 Years | 239 (88.5%) | 31 (11.5%) |
| 65 to 74 Years | 143 (100.0%) | 0 (0.0%) |
| 75 Years and older | 151 (100.0%) | 0 (0.0%) |
| Total | 1,272 (90.0%) | 142 (10.0%) |
Health Insurance Coverage by Citizenship Status in Niagara
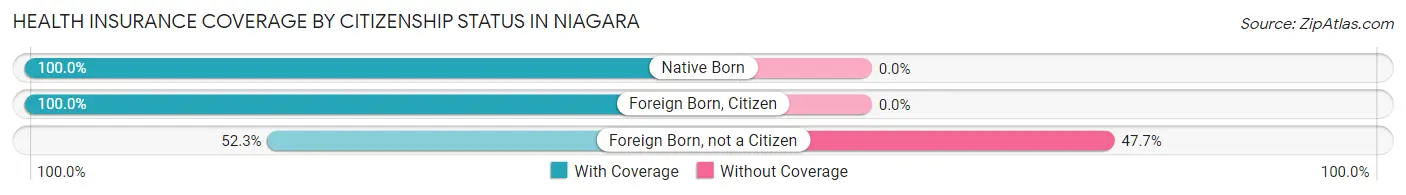
| Citizenship Status | With Coverage | Without Coverage |
| Native Born | 57 (100.0%) | 0 (0.0%) |
| Foreign Born, Citizen | 245 (100.0%) | 0 (0.0%) |
| Foreign Born, not a Citizen | 46 (52.3%) | 42 (47.7%) |
Health Insurance Coverage by Household Income in Niagara
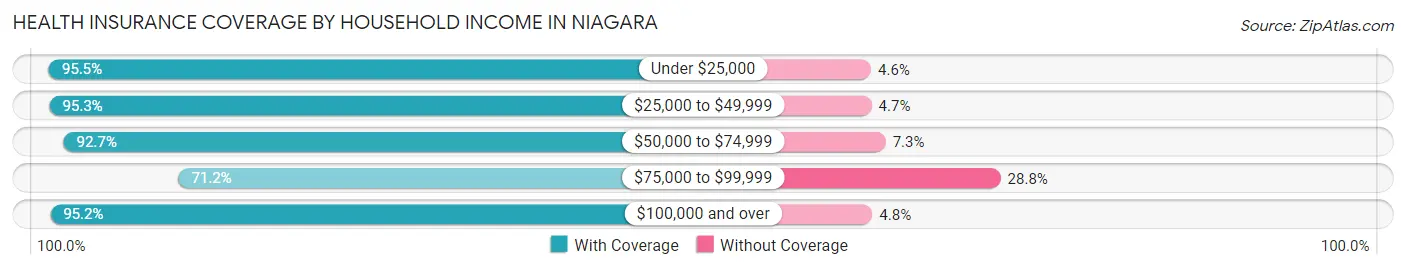
| Household Income | With Coverage | Without Coverage |
| Under $25,000 | 168 (95.5%) | 8 (4.5%) |
| $25,000 to $49,999 | 348 (95.3%) | 17 (4.7%) |
| $50,000 to $74,999 | 343 (92.7%) | 27 (7.3%) |
| $75,000 to $99,999 | 195 (71.2%) | 79 (28.8%) |
| $100,000 and over | 218 (95.2%) | 11 (4.8%) |
Public vs Private Health Insurance Coverage by Age in Niagara
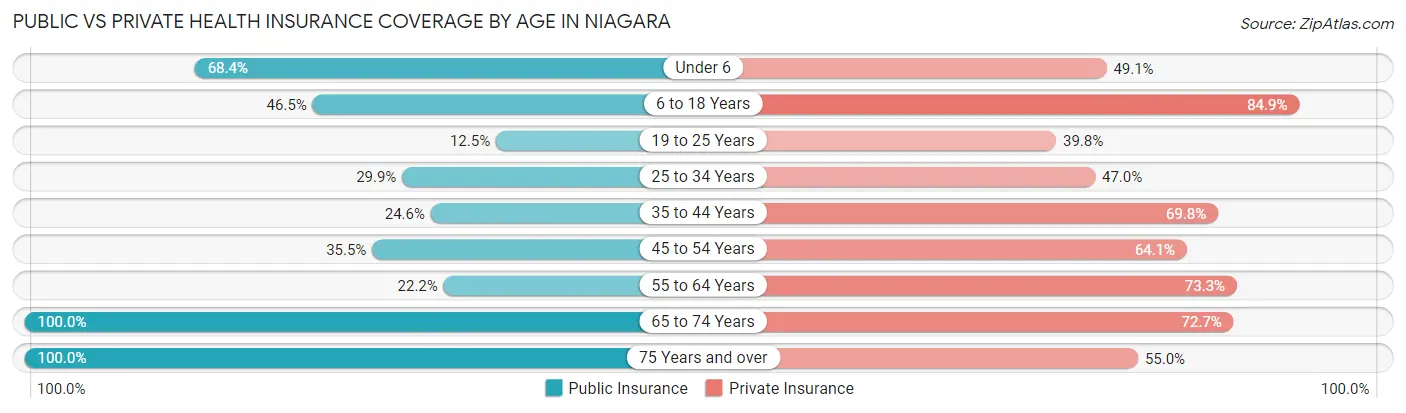
| Age Bracket | Public Insurance | Private Insurance |
| Under 6 | 39 (68.4%) | 28 (49.1%) |
| 6 to 18 Years | 114 (46.5%) | 208 (84.9%) |
| 19 to 25 Years | 11 (12.5%) | 35 (39.8%) |
| 25 to 34 Years | 35 (29.9%) | 55 (47.0%) |
| 35 to 44 Years | 31 (24.6%) | 88 (69.8%) |
| 45 to 54 Years | 77 (35.5%) | 139 (64.1%) |
| 55 to 64 Years | 60 (22.2%) | 198 (73.3%) |
| 65 to 74 Years | 143 (100.0%) | 104 (72.7%) |
| 75 Years and over | 151 (100.0%) | 83 (55.0%) |
| Total | 661 (46.8%) | 938 (66.3%) |
Disability Status by Sex by Age in Niagara
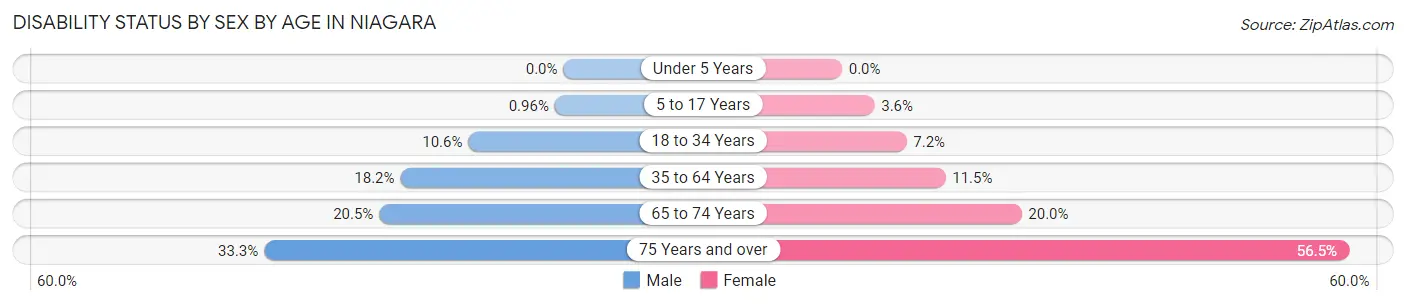
| Age Bracket | Male | Female |
| Under 5 Years | 0 (0.0%) | 0 (0.0%) |
| 5 to 17 Years | 1 (1.0%) | 5 (3.6%) |
| 18 to 34 Years | 9 (10.6%) | 10 (7.2%) |
| 35 to 64 Years | 53 (18.1%) | 37 (11.5%) |
| 65 to 74 Years | 16 (20.5%) | 13 (20.0%) |
| 75 Years and over | 22 (33.3%) | 48 (56.5%) |
Disability Class by Sex by Age in Niagara
Disability Class: Hearing Difficulty
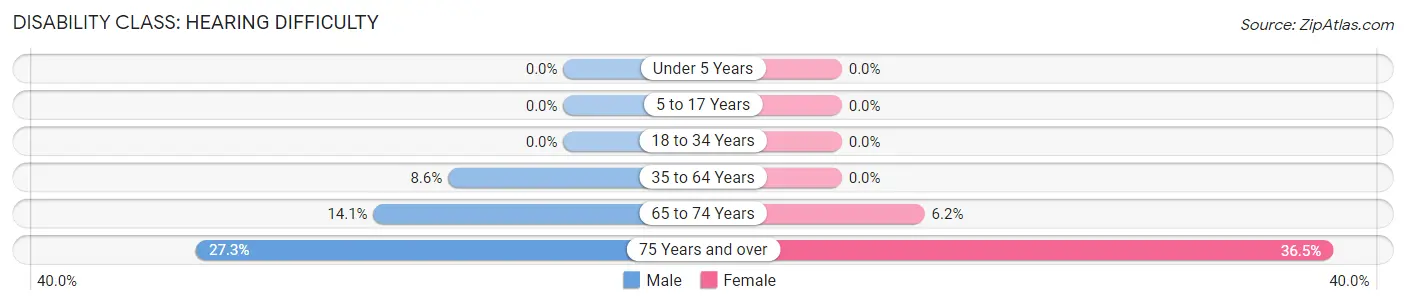
| Age Bracket | Male | Female |
| Under 5 Years | 0 (0.0%) | 0 (0.0%) |
| 5 to 17 Years | 0 (0.0%) | 0 (0.0%) |
| 18 to 34 Years | 0 (0.0%) | 0 (0.0%) |
| 35 to 64 Years | 25 (8.6%) | 0 (0.0%) |
| 65 to 74 Years | 11 (14.1%) | 4 (6.1%) |
| 75 Years and over | 18 (27.3%) | 31 (36.5%) |
Disability Class: Vision Difficulty
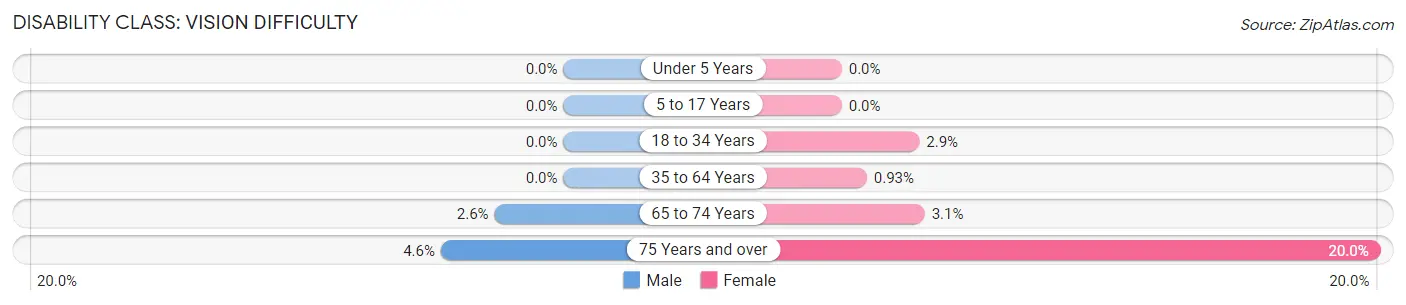
| Age Bracket | Male | Female |
| Under 5 Years | 0 (0.0%) | 0 (0.0%) |
| 5 to 17 Years | 0 (0.0%) | 0 (0.0%) |
| 18 to 34 Years | 0 (0.0%) | 4 (2.9%) |
| 35 to 64 Years | 0 (0.0%) | 3 (0.9%) |
| 65 to 74 Years | 2 (2.6%) | 2 (3.1%) |
| 75 Years and over | 3 (4.5%) | 17 (20.0%) |
Disability Class: Cognitive Difficulty
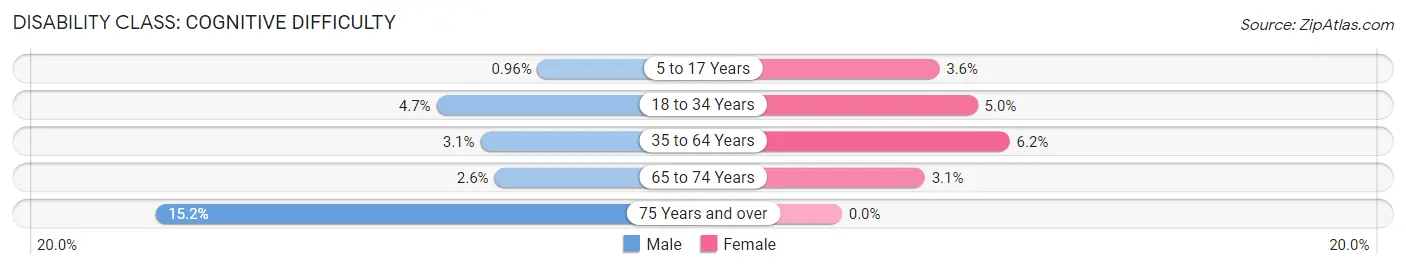
| Age Bracket | Male | Female |
| 5 to 17 Years | 1 (1.0%) | 5 (3.6%) |
| 18 to 34 Years | 4 (4.7%) | 7 (5.0%) |
| 35 to 64 Years | 9 (3.1%) | 20 (6.2%) |
| 65 to 74 Years | 2 (2.6%) | 2 (3.1%) |
| 75 Years and over | 10 (15.1%) | 0 (0.0%) |
Disability Class: Ambulatory Difficulty
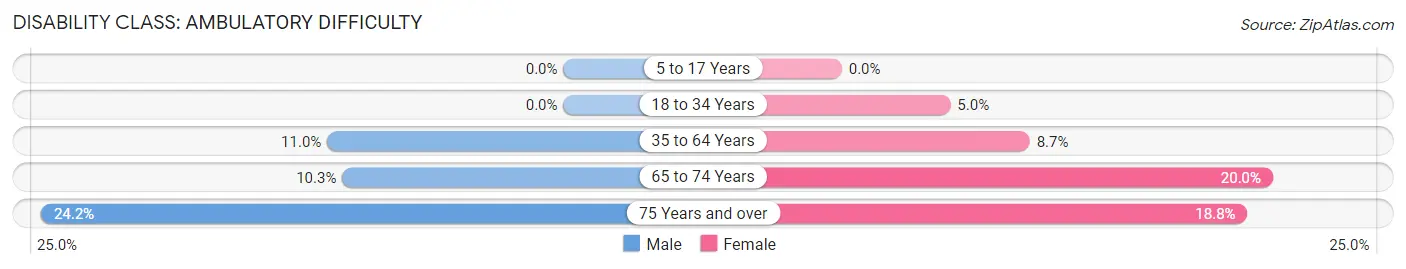
| Age Bracket | Male | Female |
| 5 to 17 Years | 0 (0.0%) | 0 (0.0%) |
| 18 to 34 Years | 0 (0.0%) | 7 (5.0%) |
| 35 to 64 Years | 32 (11.0%) | 28 (8.7%) |
| 65 to 74 Years | 8 (10.3%) | 13 (20.0%) |
| 75 Years and over | 16 (24.2%) | 16 (18.8%) |
Disability Class: Self-Care Difficulty
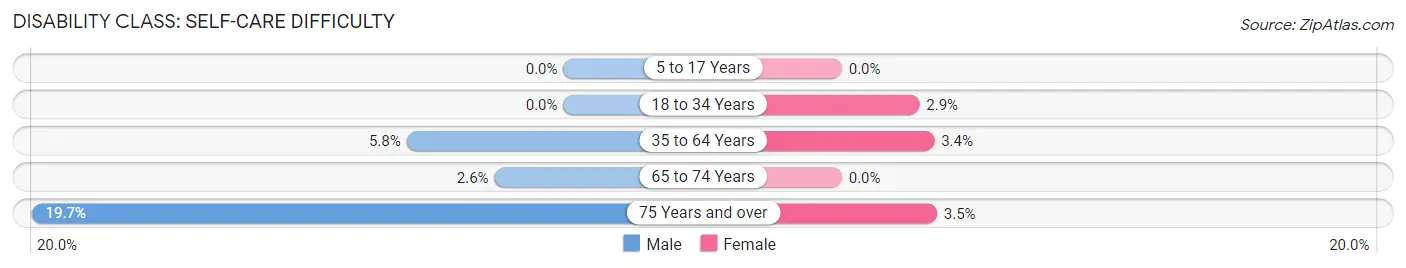
| Age Bracket | Male | Female |
| 5 to 17 Years | 0 (0.0%) | 0 (0.0%) |
| 18 to 34 Years | 0 (0.0%) | 4 (2.9%) |
| 35 to 64 Years | 17 (5.8%) | 11 (3.4%) |
| 65 to 74 Years | 2 (2.6%) | 0 (0.0%) |
| 75 Years and over | 13 (19.7%) | 3 (3.5%) |
Technology Access in Niagara
Computing Device Access in Niagara
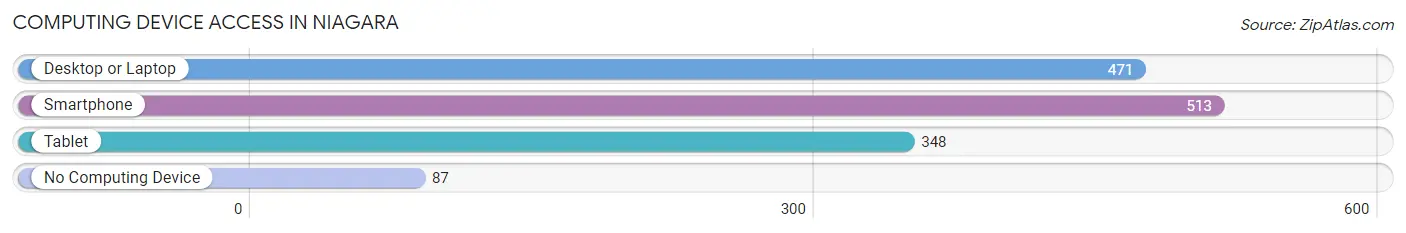
| Device Type | # Households | % Households |
| Desktop or Laptop | 471 | 72.2% |
| Smartphone | 513 | 78.7% |
| Tablet | 348 | 53.4% |
| No Computing Device | 87 | 13.3% |
| Total | 652 | 100.0% |
Internet Access in Niagara
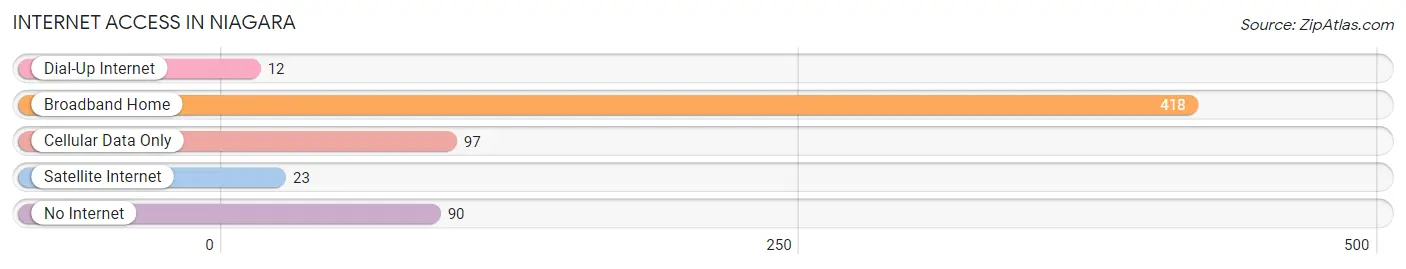
| Internet Type | # Households | % Households |
| Dial-Up Internet | 12 | 1.8% |
| Broadband Home | 418 | 64.1% |
| Cellular Data Only | 97 | 14.9% |
| Satellite Internet | 23 | 3.5% |
| No Internet | 90 | 13.8% |
| Total | 652 | 100.0% |
Niagara Summary
Niagara, Wisconsin is a small town located in Marinette County, Wisconsin. It is situated on the banks of the Menominee River, which forms the border between Wisconsin and Michigan. The town was founded in 1854 and is the oldest settlement in Marinette County. The population of Niagara was 1,845 as of the 2010 census.
History
The area that is now Niagara was originally inhabited by the Menominee Native American tribe. The first white settlers arrived in the area in 1854, led by William H. Smith. Smith and his family were the first permanent settlers in the area, and they established a trading post and a sawmill. The town was officially founded in 1856 and was named after the Niagara River in New York.
In 1871, the Wisconsin Central Railroad arrived in Niagara, connecting the town to the rest of the state. This allowed for the development of the lumber industry in the area, which was the main source of income for the town. The lumber industry was so successful that by the early 1900s, Niagara was the largest lumber producer in the state.
The lumber industry declined in the early 20th century, and the town began to focus on other industries such as tourism and manufacturing. The town also became a popular destination for outdoor recreation, such as fishing, hunting, and camping.
Geography
Niagara is located in Marinette County, Wisconsin, on the banks of the Menominee River. The town is situated on the western edge of the state, near the border with Michigan. The town is located in the Central Plain region of Wisconsin, which is characterized by flat terrain and rolling hills.
The town is surrounded by forests and lakes, and is home to several state parks and wildlife areas. The nearest major city is Green Bay, which is located about 50 miles to the south.
Economy
The economy of Niagara is largely based on tourism and manufacturing. The town is home to several tourist attractions, such as the Niagara Escarpment State Park and the Menominee River State Park. The town is also home to several manufacturing companies, such as the Niagara Paper Company and the Niagara Plastics Company.
The town is also home to several small businesses, such as restaurants, shops, and hotels. The town is also home to several farms, which produce a variety of crops and livestock.
Demographics
As of the 2010 census, the population of Niagara was 1,845. The racial makeup of the town was 97.3% White, 0.3% African American, 0.2% Native American, 0.3% Asian, 0.1% Pacific Islander, 0.7% from other races, and 1.2% from two or more races. Hispanic or Latino of any race were 1.7% of the population.
The median household income in Niagara was $37,917, and the median family income was $45,938. The per capita income in the town was $19,945. About 11.2% of the population was below the poverty line.
Common Questions
What is Per Capita Income in Niagara?
Per Capita income in Niagara is $29,462.
What is the Median Family Income in Niagara?
Median Family Income in Niagara is $59,856.
What is the Median Household income in Niagara?
Median Household Income in Niagara is $51,667.
What is Income or Wage Gap in Niagara?
Income or Wage Gap in Niagara is 26.2%.
Women in Niagara earn 73.8 cents for every dollar earned by a man.
What is Inequality or Gini Index in Niagara?
Inequality or Gini Index in Niagara is 0.37.
What is the Total Population of Niagara?
Total Population of Niagara is 1,423.
What is the Total Male Population of Niagara?
Total Male Population of Niagara is 654.
What is the Total Female Population of Niagara?
Total Female Population of Niagara is 769.
What is the Ratio of Males per 100 Females in Niagara?
There are 85.05 Males per 100 Females in Niagara.
What is the Ratio of Females per 100 Males in Niagara?
There are 117.58 Females per 100 Males in Niagara.
What is the Median Population Age in Niagara?
Median Population Age in Niagara is 47.8 Years.
What is the Average Family Size in Niagara
Average Family Size in Niagara is 2.8 People.
What is the Average Household Size in Niagara
Average Household Size in Niagara is 2.2 People.
How Large is the Labor Force in Niagara?
There are 668 People in the Labor Forcein in Niagara.
What is the Percentage of People in the Labor Force in Niagara?
56.2% of People are in the Labor Force in Niagara.
What is the Unemployment Rate in Niagara?
Unemployment Rate in Niagara is 6.1%.