New London, WI Map & Demographics
New London Map
New London Overview
$28,076
PER CAPITA INCOME
$60,617
AVG FAMILY INCOME
$53,580
AVG HOUSEHOLD INCOME
45.1%
WAGE / INCOME GAP [ % ]
54.9¢/ $1
WAGE / INCOME GAP [ $ ]
0.41
INEQUALITY / GINI INDEX
7,342
TOTAL POPULATION
3,480
MALE POPULATION
3,862
FEMALE POPULATION
90.11
MALES / 100 FEMALES
110.98
FEMALES / 100 MALES
36.5
MEDIAN AGE
3.0
AVG FAMILY SIZE
2.3
AVG HOUSEHOLD SIZE
3,498
LABOR FORCE [ PEOPLE ]
62.8%
PERCENT IN LABOR FORCE
1.0%
UNEMPLOYMENT RATE
New London Zip Codes
New London Area Codes
Income in New London
Income Overview in New London
Per Capita Income in New London is $28,076, while median incomes of families and households are $60,617 and $53,580 respectively.
| Characteristic | Number | Measure |
| Per Capita Income | 7,342 | $28,076 |
| Median Family Income | 1,817 | $60,617 |
| Mean Family Income | 1,817 | $73,392 |
| Median Household Income | 3,163 | $53,580 |
| Mean Household Income | 3,163 | $65,082 |
| Income Deficit | 1,817 | $0 |
| Wage / Income Gap (%) | 7,342 | 45.09% |
| Wage / Income Gap ($) | 7,342 | 54.91¢ per $1 |
| Gini / Inequality Index | 7,342 | 0.41 |
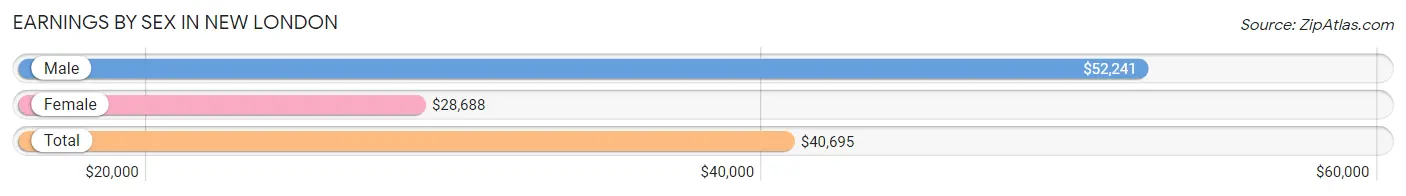
Earnings by Sex in New London
Average Earnings in New London are $40,695, $52,241 for men and $28,688 for women, a difference of 45.1%.
| Sex | Number | Average Earnings |
| Male | 1,904 (49.4%) | $52,241 |
| Female | 1,950 (50.6%) | $28,688 |
| Total | 3,854 (100.0%) | $40,695 |
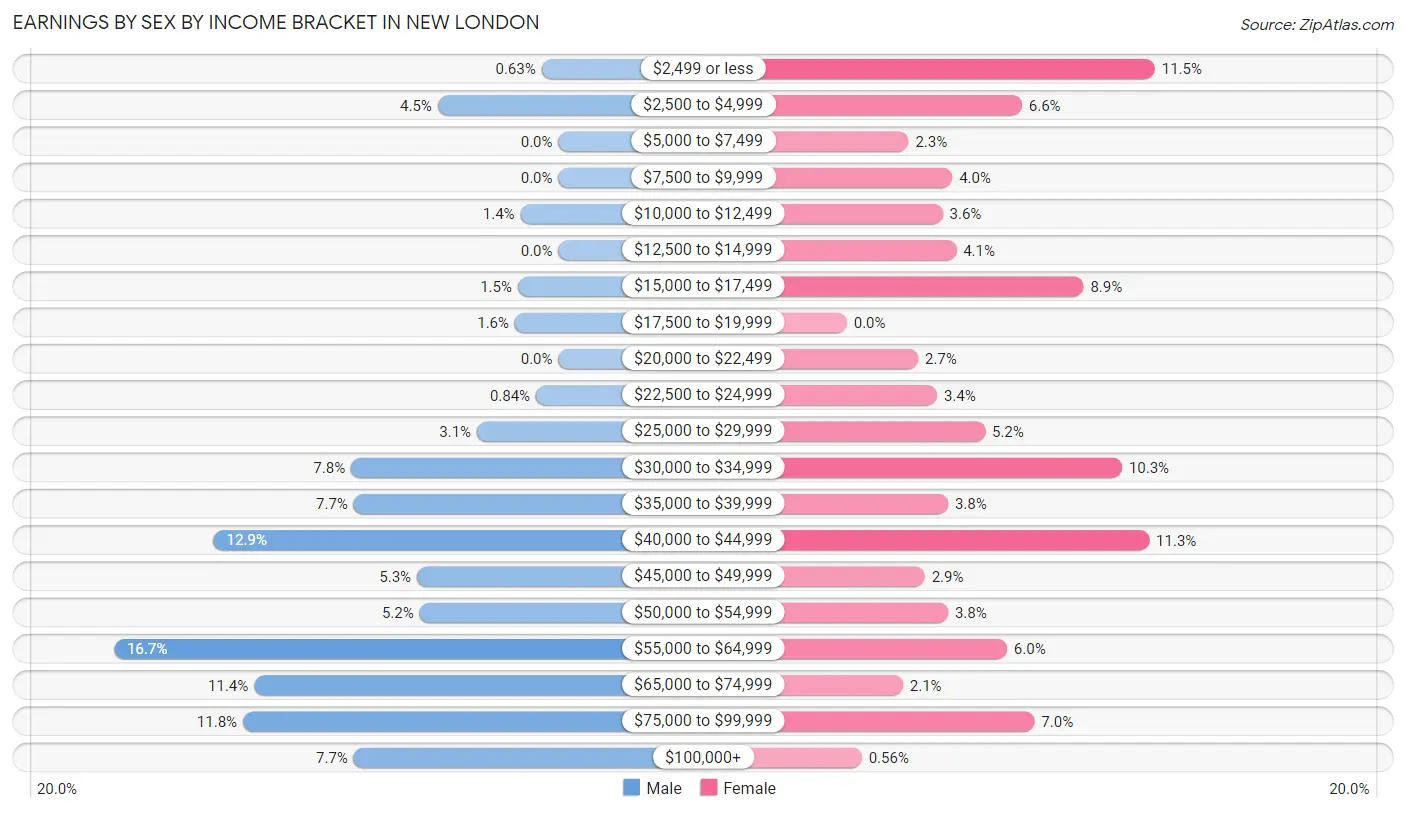
Earnings by Sex by Income Bracket in New London
The most common earnings brackets in New London are $55,000 to $64,999 for men (317 | 16.7%) and $2,499 or less for women (225 | 11.5%).
| Income | Male | Female |
| $2,499 or less | 12 (0.6%) | 225 (11.5%) |
| $2,500 to $4,999 | 86 (4.5%) | 128 (6.6%) |
| $5,000 to $7,499 | 0 (0.0%) | 45 (2.3%) |
| $7,500 to $9,999 | 0 (0.0%) | 77 (4.0%) |
| $10,000 to $12,499 | 27 (1.4%) | 70 (3.6%) |
| $12,500 to $14,999 | 0 (0.0%) | 80 (4.1%) |
| $15,000 to $17,499 | 29 (1.5%) | 173 (8.9%) |
| $17,500 to $19,999 | 31 (1.6%) | 0 (0.0%) |
| $20,000 to $22,499 | 0 (0.0%) | 52 (2.7%) |
| $22,500 to $24,999 | 16 (0.8%) | 66 (3.4%) |
| $25,000 to $29,999 | 58 (3.0%) | 101 (5.2%) |
| $30,000 to $34,999 | 148 (7.8%) | 201 (10.3%) |
| $35,000 to $39,999 | 146 (7.7%) | 74 (3.8%) |
| $40,000 to $44,999 | 246 (12.9%) | 221 (11.3%) |
| $45,000 to $49,999 | 101 (5.3%) | 57 (2.9%) |
| $50,000 to $54,999 | 99 (5.2%) | 74 (3.8%) |
| $55,000 to $64,999 | 317 (16.7%) | 117 (6.0%) |
| $65,000 to $74,999 | 217 (11.4%) | 41 (2.1%) |
| $75,000 to $99,999 | 225 (11.8%) | 137 (7.0%) |
| $100,000+ | 146 (7.7%) | 11 (0.6%) |
| Total | 1,904 (100.0%) | 1,950 (100.0%) |
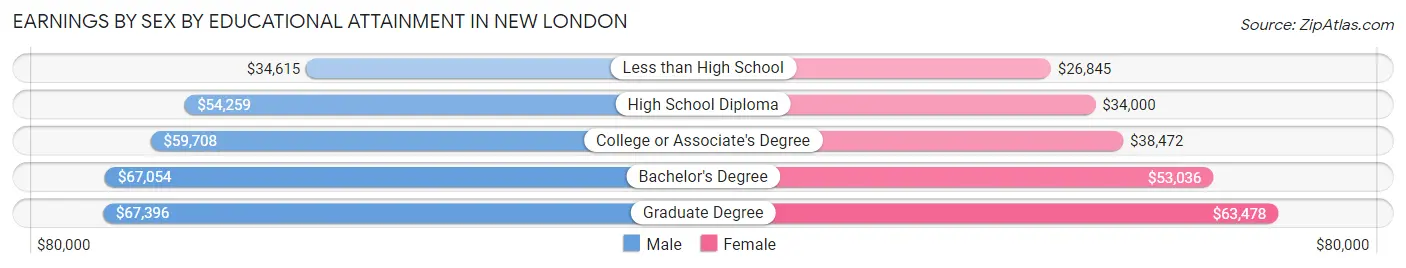
Earnings by Sex by Educational Attainment in New London
Average earnings in New London are $56,331 for men and $34,656 for women, a difference of 38.5%. Men with an educational attainment of graduate degree enjoy the highest average annual earnings of $67,396, while those with less than high school education earn the least with $34,615. Women with an educational attainment of graduate degree earn the most with the average annual earnings of $63,478, while those with less than high school education have the smallest earnings of $26,845.
| Educational Attainment | Male Income | Female Income |
| Less than High School | $34,615 | $26,845 |
| High School Diploma | $54,259 | $34,000 |
| College or Associate's Degree | $59,708 | $38,472 |
| Bachelor's Degree | $67,054 | $53,036 |
| Graduate Degree | $67,396 | $63,478 |
| Total | $56,331 | $34,656 |
Family Income in New London
Family Income Brackets in New London
According to the New London family income data, there are 452 families falling into the $50,000 to $74,999 income range, which is the most common income bracket and makes up 24.9% of all families. Conversely, the $200,000+ income bracket is the least frequent group with only 33 families (1.8%) belonging to this category.
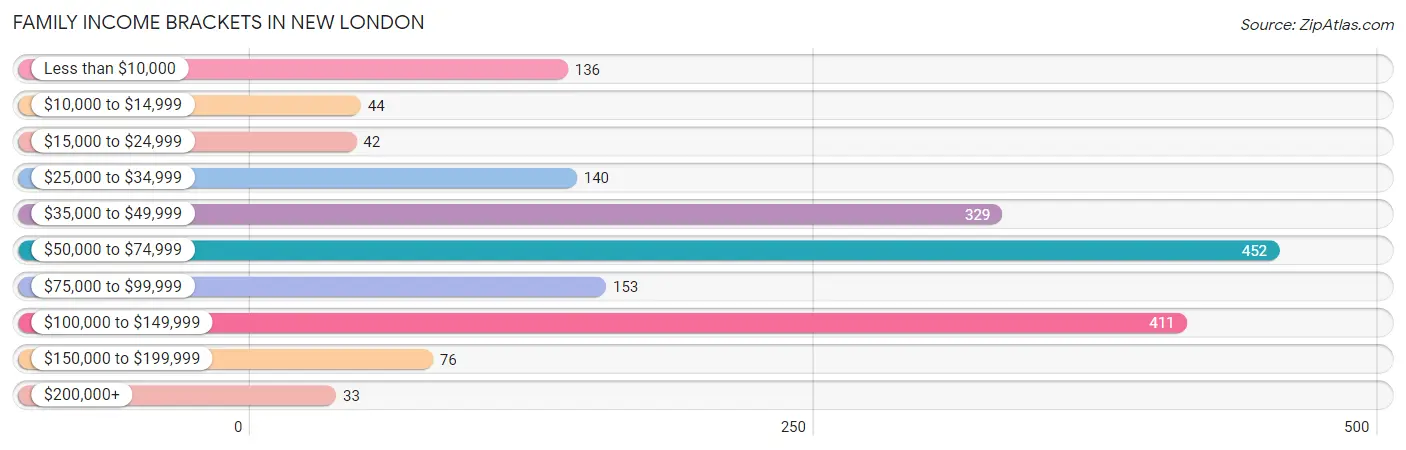
| Income Bracket | # Families | % Families |
| Less than $10,000 | 136 | 7.5% |
| $10,000 to $14,999 | 44 | 2.4% |
| $15,000 to $24,999 | 42 | 2.3% |
| $25,000 to $34,999 | 140 | 7.7% |
| $35,000 to $49,999 | 329 | 18.1% |
| $50,000 to $74,999 | 452 | 24.9% |
| $75,000 to $99,999 | 153 | 8.4% |
| $100,000 to $149,999 | 411 | 22.6% |
| $150,000 to $199,999 | 76 | 4.2% |
| $200,000+ | 33 | 1.8% |
Family Income by Famaliy Size in New London
7+ person families (112 | 6.2%) account for the highest median family income in New London with $147,500 per family, while 2-person families (834 | 45.9%) have the highest median income of $31,856 per family member.
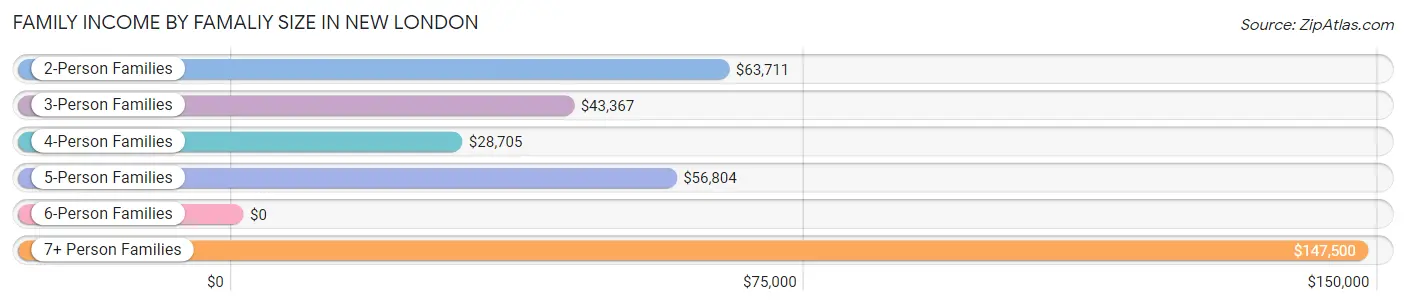
| Income Bracket | # Families | Median Income |
| 2-Person Families | 834 (45.9%) | $63,711 |
| 3-Person Families | 494 (27.2%) | $43,367 |
| 4-Person Families | 169 (9.3%) | $28,705 |
| 5-Person Families | 208 (11.5%) | $56,804 |
| 6-Person Families | 0 (0.0%) | $0 |
| 7+ Person Families | 112 (6.2%) | $147,500 |
| Total | 1,817 (100.0%) | $60,617 |
Family Income by Number of Earners in New London
The median family income in New London is $60,617, with families comprising 3+ earners (206) having the highest median family income of $147,576, while families with 1 earner (859) have the lowest median family income of $42,307, accounting for 11.3% and 47.3% of families, respectively.
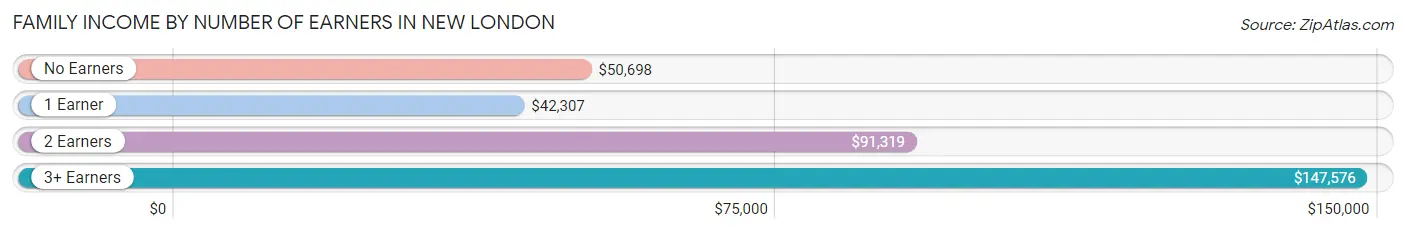
| Number of Earners | # Families | Median Income |
| No Earners | 212 (11.7%) | $50,698 |
| 1 Earner | 859 (47.3%) | $42,307 |
| 2 Earners | 540 (29.7%) | $91,319 |
| 3+ Earners | 206 (11.3%) | $147,576 |
| Total | 1,817 (100.0%) | $60,617 |
Household Income in New London
Household Income Brackets in New London
With 746 households falling in the category, the $50,000 to $74,999 income range is the most frequent in New London, accounting for 23.6% of all households. In contrast, only 32 households (1.0%) fall into the $200,000+ income bracket, making it the least populous group.
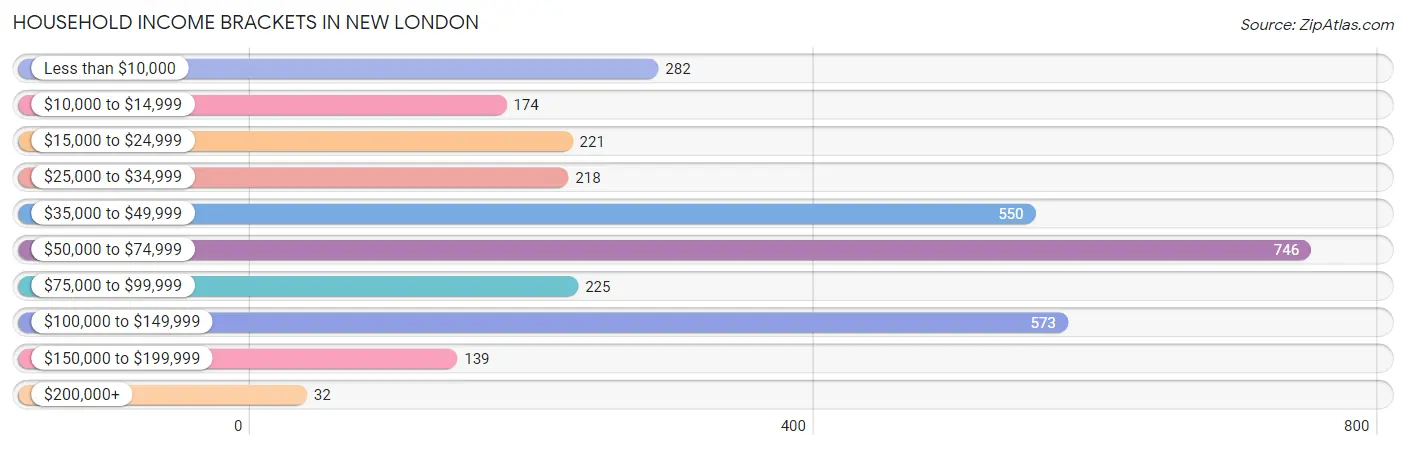
| Income Bracket | # Households | % Households |
| Less than $10,000 | 282 | 8.9% |
| $10,000 to $14,999 | 174 | 5.5% |
| $15,000 to $24,999 | 221 | 7.0% |
| $25,000 to $34,999 | 218 | 6.9% |
| $35,000 to $49,999 | 550 | 17.4% |
| $50,000 to $74,999 | 746 | 23.6% |
| $75,000 to $99,999 | 225 | 7.1% |
| $100,000 to $149,999 | 573 | 18.1% |
| $150,000 to $199,999 | 139 | 4.4% |
| $200,000+ | 32 | 1.0% |
Household Income by Householder Age in New London
The median household income in New London is $53,580, with the highest median household income of $67,296 found in the 15 to 24 years age bracket for the primary householder. A total of 162 households (5.1%) fall into this category. Meanwhile, the 65+ years age bracket for the primary householder has the lowest median household income of $27,969, with 826 households (26.1%) in this group.
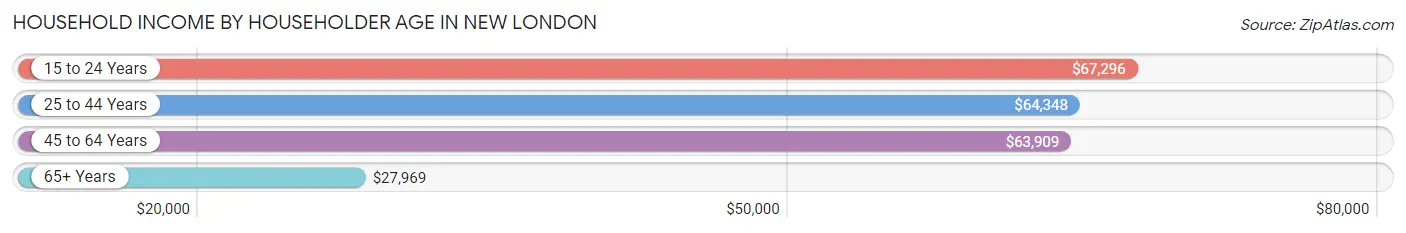
| Income Bracket | # Households | Median Income |
| 15 to 24 Years | 162 (5.1%) | $67,296 |
| 25 to 44 Years | 1,202 (38.0%) | $64,348 |
| 45 to 64 Years | 973 (30.8%) | $63,909 |
| 65+ Years | 826 (26.1%) | $27,969 |
| Total | 3,163 (100.0%) | $53,580 |
Poverty in New London
Income Below Poverty by Sex and Age in New London
With 14.7% poverty level for males and 19.9% for females among the residents of New London, 75 year old and over males and 5 year old females are the most vulnerable to poverty, with 89 males (56.0%) and 11 females (100.0%) in their respective age groups living below the poverty level.
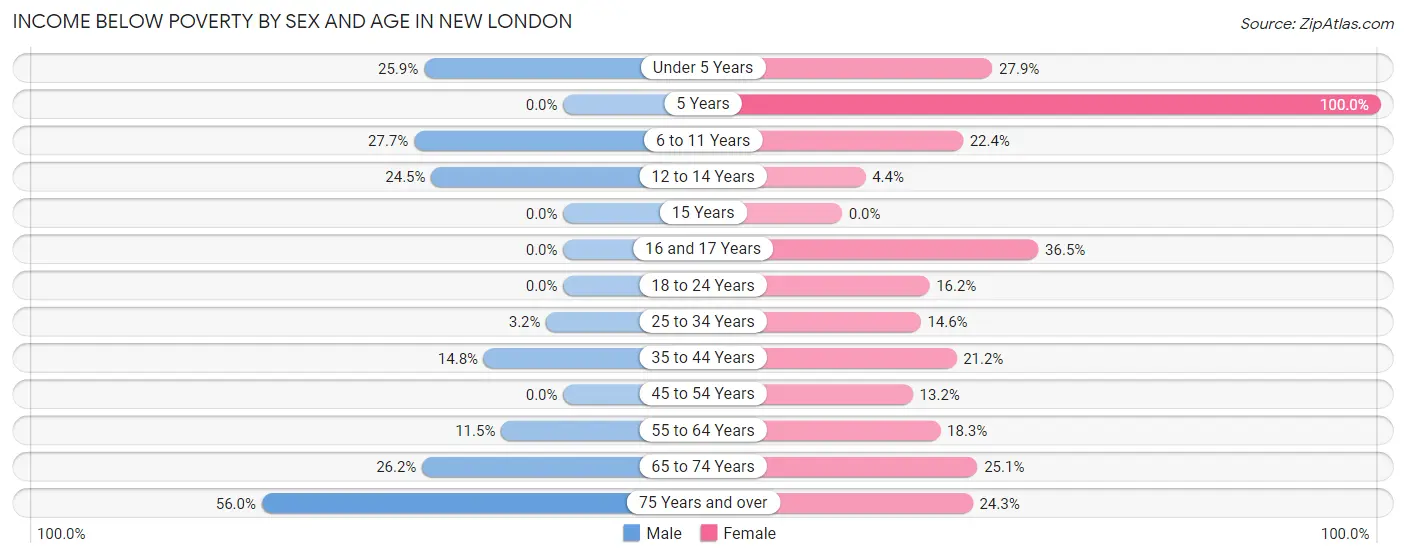
| Age Bracket | Male | Female |
| Under 5 Years | 75 (25.9%) | 36 (27.9%) |
| 5 Years | 0 (0.0%) | 11 (100.0%) |
| 6 to 11 Years | 100 (27.7%) | 70 (22.4%) |
| 12 to 14 Years | 61 (24.5%) | 10 (4.3%) |
| 15 Years | 0 (0.0%) | 0 (0.0%) |
| 16 and 17 Years | 0 (0.0%) | 74 (36.4%) |
| 18 to 24 Years | 0 (0.0%) | 48 (16.2%) |
| 25 to 34 Years | 14 (3.2%) | 53 (14.6%) |
| 35 to 44 Years | 72 (14.7%) | 138 (21.2%) |
| 45 to 54 Years | 0 (0.0%) | 33 (13.2%) |
| 55 to 64 Years | 46 (11.5%) | 100 (18.2%) |
| 65 to 74 Years | 49 (26.2%) | 93 (25.1%) |
| 75 Years and over | 89 (56.0%) | 90 (24.3%) |
| Total | 506 (14.7%) | 756 (19.9%) |
Income Above Poverty by Sex and Age in New London
According to the poverty statistics in New London, males aged 5 years and females aged 15 years are the age groups that are most secure financially, with 100.0% of males and 100.0% of females in these age groups living above the poverty line.
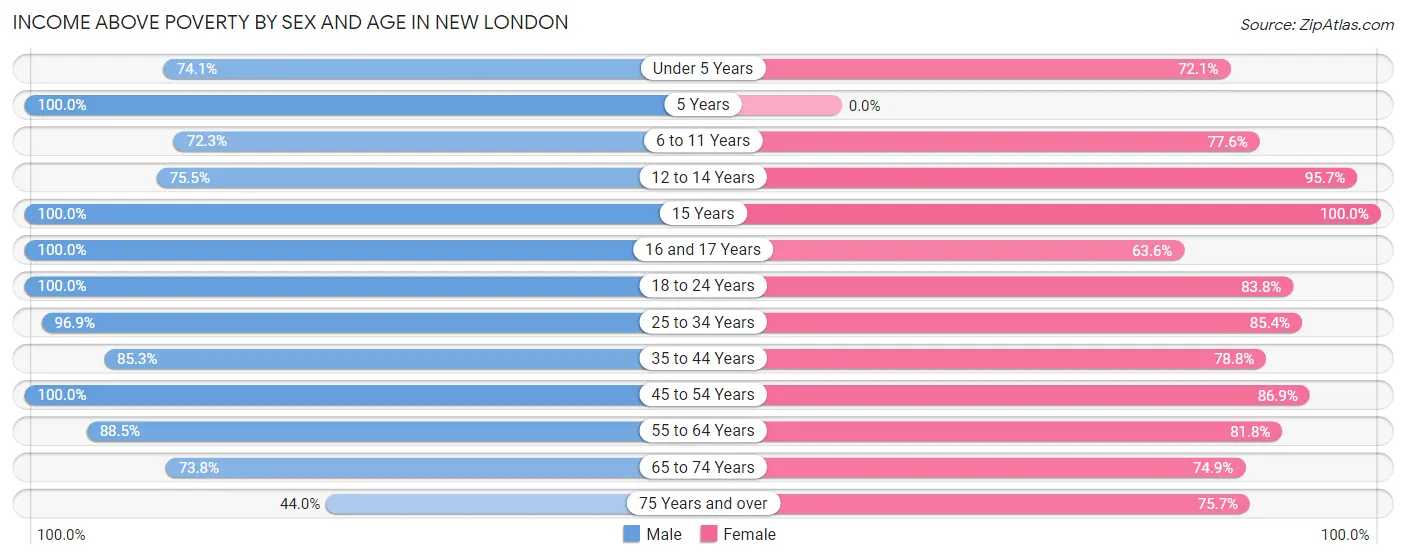
| Age Bracket | Male | Female |
| Under 5 Years | 215 (74.1%) | 93 (72.1%) |
| 5 Years | 77 (100.0%) | 0 (0.0%) |
| 6 to 11 Years | 261 (72.3%) | 242 (77.6%) |
| 12 to 14 Years | 188 (75.5%) | 220 (95.7%) |
| 15 Years | 15 (100.0%) | 66 (100.0%) |
| 16 and 17 Years | 119 (100.0%) | 129 (63.5%) |
| 18 to 24 Years | 233 (100.0%) | 248 (83.8%) |
| 25 to 34 Years | 430 (96.9%) | 310 (85.4%) |
| 35 to 44 Years | 416 (85.3%) | 512 (78.8%) |
| 45 to 54 Years | 412 (100.0%) | 218 (86.9%) |
| 55 to 64 Years | 353 (88.5%) | 448 (81.8%) |
| 65 to 74 Years | 138 (73.8%) | 277 (74.9%) |
| 75 Years and over | 70 (44.0%) | 281 (75.7%) |
| Total | 2,927 (85.3%) | 3,044 (80.1%) |
Income Below Poverty Among Married-Couple Families in New London
The poverty statistics for married-couple families in New London show that 7.2% or 72 of the total 1,003 families live below the poverty line. Families with no children have the highest poverty rate of 9.0%, comprising of 56 families. On the other hand, families with 3 or 4 children have the lowest poverty rate of 0.0%, which includes 0 families.
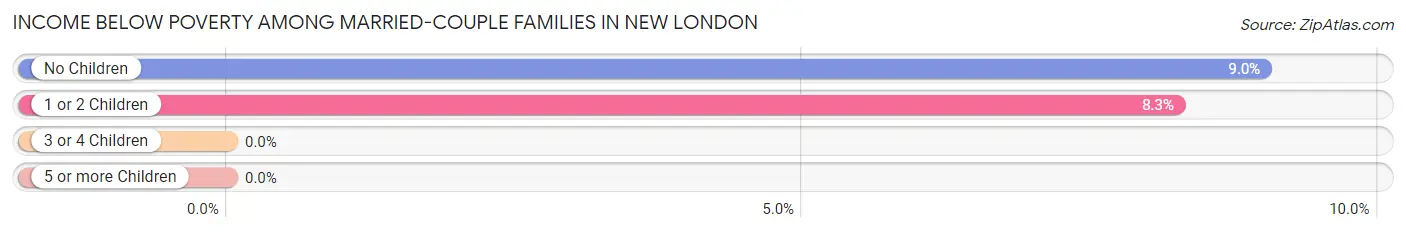
| Children | Above Poverty | Below Poverty |
| No Children | 566 (91.0%) | 56 (9.0%) |
| 1 or 2 Children | 178 (91.7%) | 16 (8.3%) |
| 3 or 4 Children | 184 (100.0%) | 0 (0.0%) |
| 5 or more Children | 3 (100.0%) | 0 (0.0%) |
| Total | 931 (92.8%) | 72 (7.2%) |
Income Below Poverty Among Single-Parent Households in New London
According to the poverty data in New London, 17.1% or 49 single-father households and 33.7% or 178 single-mother households are living below the poverty line. Among single-father households, those with no children have the highest poverty rate, with 49 households (30.1%) experiencing poverty. Likewise, among single-mother households, those with 3 or 4 children have the highest poverty rate, with 118 households (59.9%) falling below the poverty line.
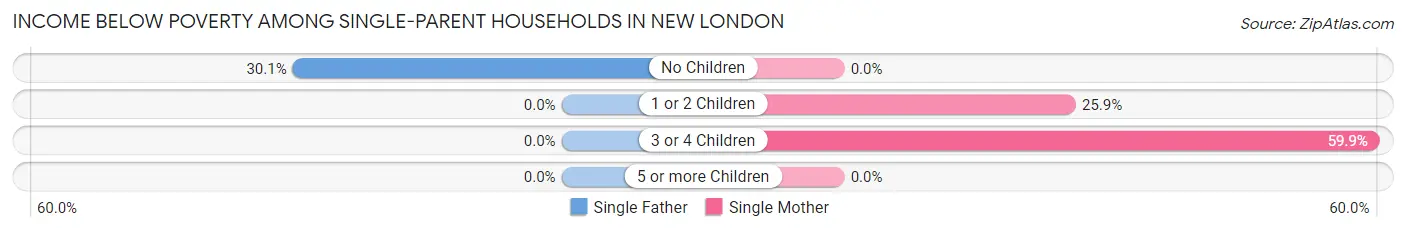
| Children | Single Father | Single Mother |
| No Children | 49 (30.1%) | 0 (0.0%) |
| 1 or 2 Children | 0 (0.0%) | 60 (25.9%) |
| 3 or 4 Children | 0 (0.0%) | 118 (59.9%) |
| 5 or more Children | 0 (0.0%) | 0 (0.0%) |
| Total | 49 (17.1%) | 178 (33.7%) |
Income Below Poverty Among Married-Couple vs Single-Parent Households in New London
The poverty data for New London shows that 72 of the married-couple family households (7.2%) and 227 of the single-parent households (27.9%) are living below the poverty level. Within the married-couple family households, those with no children have the highest poverty rate, with 56 households (9.0%) falling below the poverty line. Among the single-parent households, those with 3 or 4 children have the highest poverty rate, with 118 household (59.9%) living below poverty.
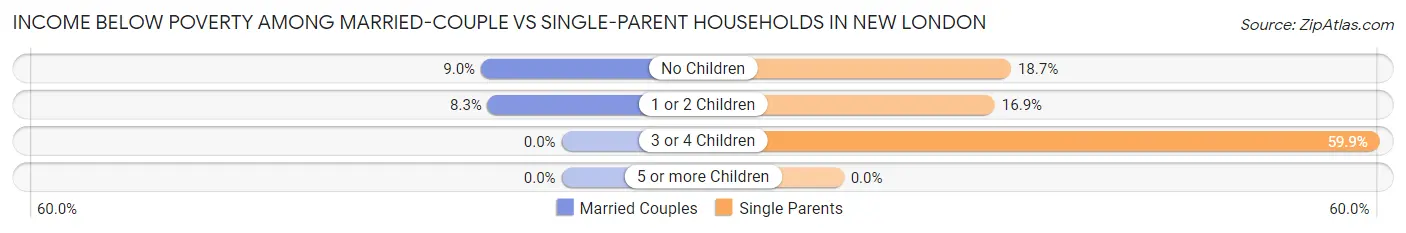
| Children | Married-Couple Families | Single-Parent Households |
| No Children | 56 (9.0%) | 49 (18.7%) |
| 1 or 2 Children | 16 (8.3%) | 60 (16.9%) |
| 3 or 4 Children | 0 (0.0%) | 118 (59.9%) |
| 5 or more Children | 0 (0.0%) | 0 (0.0%) |
| Total | 72 (7.2%) | 227 (27.9%) |
Race in New London
The most populous races in New London are White / Caucasian (6,368 | 86.7%), Hispanic or Latino (653 | 8.9%), and Some other Race (505 | 6.9%).
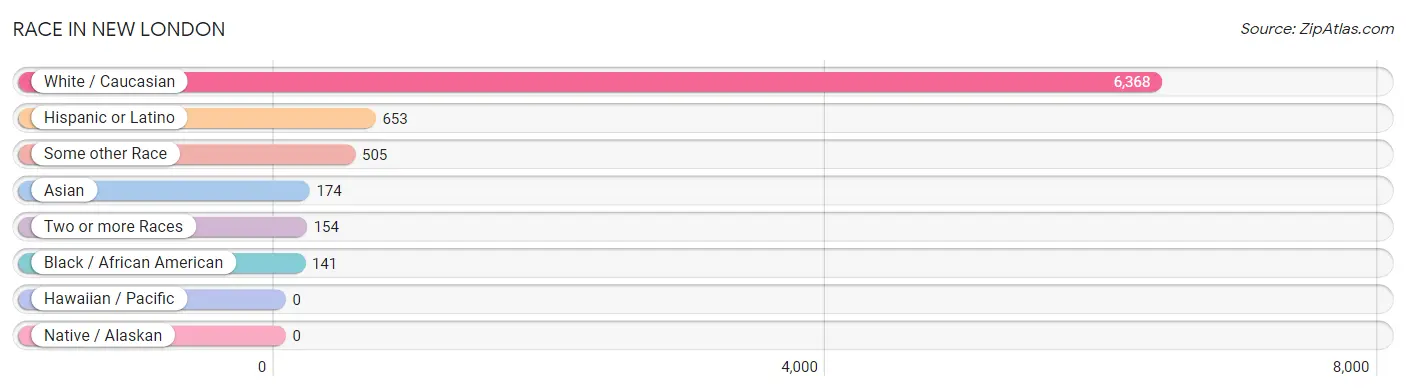
| Race | # Population | % Population |
| Asian | 174 | 2.4% |
| Black / African American | 141 | 1.9% |
| Hawaiian / Pacific | 0 | 0.0% |
| Hispanic or Latino | 653 | 8.9% |
| Native / Alaskan | 0 | 0.0% |
| White / Caucasian | 6,368 | 86.7% |
| Two or more Races | 154 | 2.1% |
| Some other Race | 505 | 6.9% |
| Total | 7,342 | 100.0% |
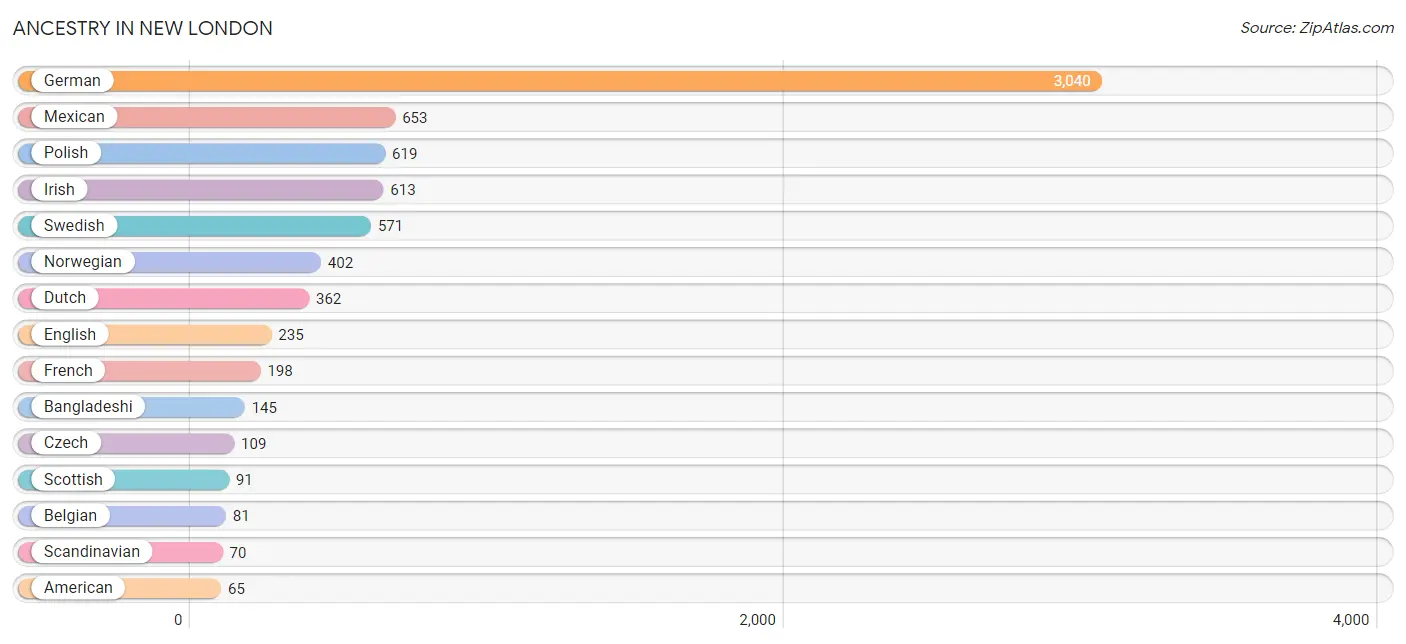
Ancestry in New London
The most populous ancestries reported in New London are German (3,040 | 41.4%), Mexican (653 | 8.9%), Polish (619 | 8.4%), Irish (613 | 8.4%), and Swedish (571 | 7.8%), together accounting for 74.9% of all New London residents.
| Ancestry | # Population | % Population |
| American | 65 | 0.9% |
| Arab | 13 | 0.2% |
| Bangladeshi | 145 | 2.0% |
| Belgian | 81 | 1.1% |
| Canadian | 22 | 0.3% |
| Czech | 109 | 1.5% |
| Czechoslovakian | 17 | 0.2% |
| Dutch | 362 | 4.9% |
| English | 235 | 3.2% |
| French | 198 | 2.7% |
| French American Indian | 22 | 0.3% |
| French Canadian | 45 | 0.6% |
| German | 3,040 | 41.4% |
| Irish | 613 | 8.4% |
| Italian | 17 | 0.2% |
| Korean | 22 | 0.3% |
| Lebanese | 13 | 0.2% |
| Mexican | 653 | 8.9% |
| Northern European | 45 | 0.6% |
| Norwegian | 402 | 5.5% |
| Polish | 619 | 8.4% |
| Scandinavian | 70 | 0.9% |
| Scotch-Irish | 28 | 0.4% |
| Scottish | 91 | 1.2% |
| Swedish | 571 | 7.8% |
| Swiss | 14 | 0.2% |
| Welsh | 33 | 0.4% | View All 27 Rows |
Immigrants in New London
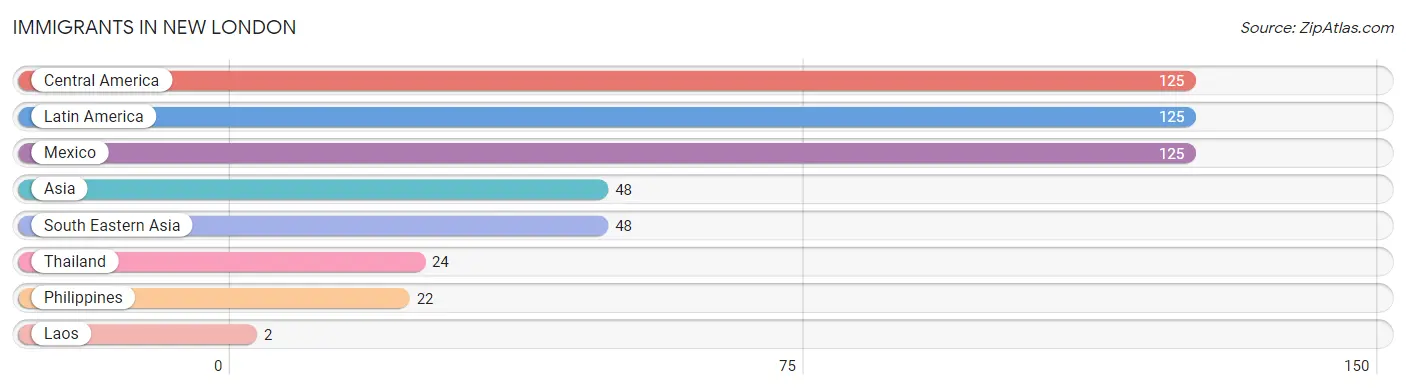
The most numerous immigrant groups reported in New London came from Central America (125 | 1.7%), Latin America (125 | 1.7%), Mexico (125 | 1.7%), Asia (48 | 0.6%), and South Eastern Asia (48 | 0.6%), together accounting for 6.4% of all New London residents.
| Immigration Origin | # Population | % Population |
| Asia | 48 | 0.6% |
| Central America | 125 | 1.7% |
| Laos | 2 | 0.0% |
| Latin America | 125 | 1.7% |
| Mexico | 125 | 1.7% |
| Philippines | 22 | 0.3% |
| South Eastern Asia | 48 | 0.6% |
| Thailand | 24 | 0.3% | View All 8 Rows |
Sex and Age in New London
Sex and Age in New London
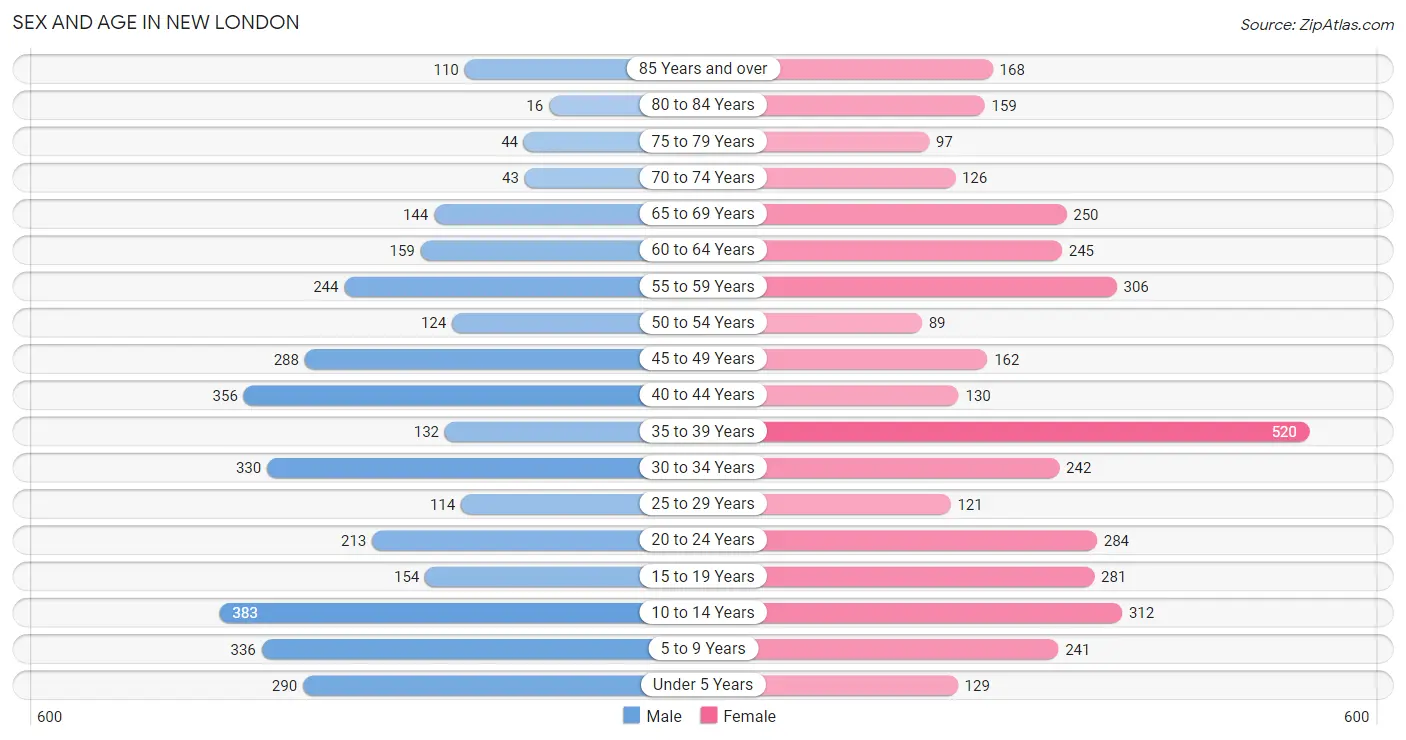
The most populous age groups in New London are 10 to 14 Years (383 | 11.0%) for men and 35 to 39 Years (520 | 13.5%) for women.
| Age Bracket | Male | Female |
| Under 5 Years | 290 (8.3%) | 129 (3.3%) |
| 5 to 9 Years | 336 (9.7%) | 241 (6.2%) |
| 10 to 14 Years | 383 (11.0%) | 312 (8.1%) |
| 15 to 19 Years | 154 (4.4%) | 281 (7.3%) |
| 20 to 24 Years | 213 (6.1%) | 284 (7.3%) |
| 25 to 29 Years | 114 (3.3%) | 121 (3.1%) |
| 30 to 34 Years | 330 (9.5%) | 242 (6.3%) |
| 35 to 39 Years | 132 (3.8%) | 520 (13.5%) |
| 40 to 44 Years | 356 (10.2%) | 130 (3.4%) |
| 45 to 49 Years | 288 (8.3%) | 162 (4.2%) |
| 50 to 54 Years | 124 (3.6%) | 89 (2.3%) |
| 55 to 59 Years | 244 (7.0%) | 306 (7.9%) |
| 60 to 64 Years | 159 (4.6%) | 245 (6.3%) |
| 65 to 69 Years | 144 (4.1%) | 250 (6.5%) |
| 70 to 74 Years | 43 (1.2%) | 126 (3.3%) |
| 75 to 79 Years | 44 (1.3%) | 97 (2.5%) |
| 80 to 84 Years | 16 (0.5%) | 159 (4.1%) |
| 85 Years and over | 110 (3.2%) | 168 (4.3%) |
| Total | 3,480 (100.0%) | 3,862 (100.0%) |
Families and Households in New London
Median Family Size in New London
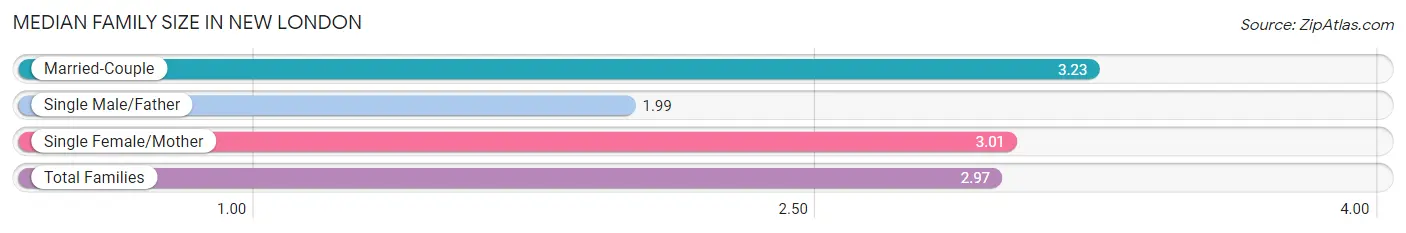
The median family size in New London is 2.97 persons per family, with married-couple families (1,003 | 55.2%) accounting for the largest median family size of 3.23 persons per family. On the other hand, single male/father families (286 | 15.7%) represent the smallest median family size with 1.99 persons per family.
| Family Type | # Families | Family Size |
| Married-Couple | 1,003 (55.2%) | 3.23 |
| Single Male/Father | 286 (15.7%) | 1.99 |
| Single Female/Mother | 528 (29.1%) | 3.01 |
| Total Families | 1,817 (100.0%) | 2.97 |
Median Household Size in New London
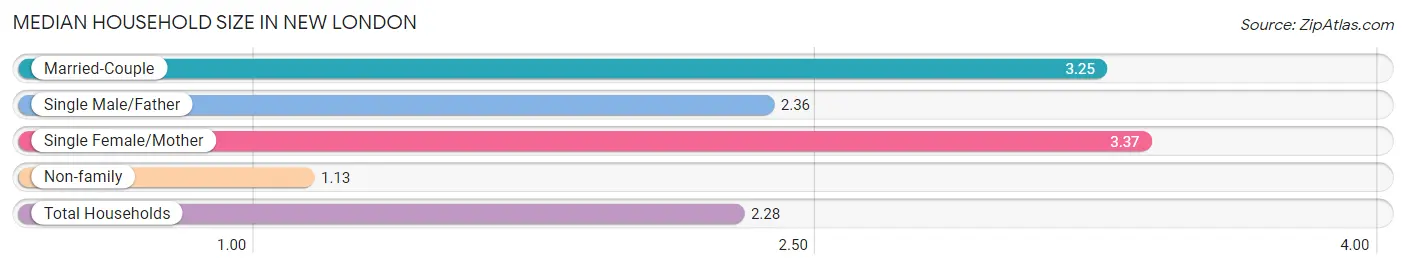
The median household size in New London is 2.28 persons per household, with single female/mother households (528 | 16.7%) accounting for the largest median household size of 3.37 persons per household. non-family households (1,346 | 42.5%) represent the smallest median household size with 1.13 persons per household.
| Household Type | # Households | Household Size |
| Married-Couple | 1,003 (31.7%) | 3.25 |
| Single Male/Father | 286 (9.0%) | 2.36 |
| Single Female/Mother | 528 (16.7%) | 3.37 |
| Non-family | 1,346 (42.5%) | 1.13 |
| Total Households | 3,163 (100.0%) | 2.28 |
Household Size by Marriage Status in New London
Out of a total of 3,163 households in New London, 1,817 (57.5%) are family households, while 1,346 (42.5%) are nonfamily households. The most numerous type of family households are 2-person households, comprising 764, and the most common type of nonfamily households are 1-person households, comprising 1,144.
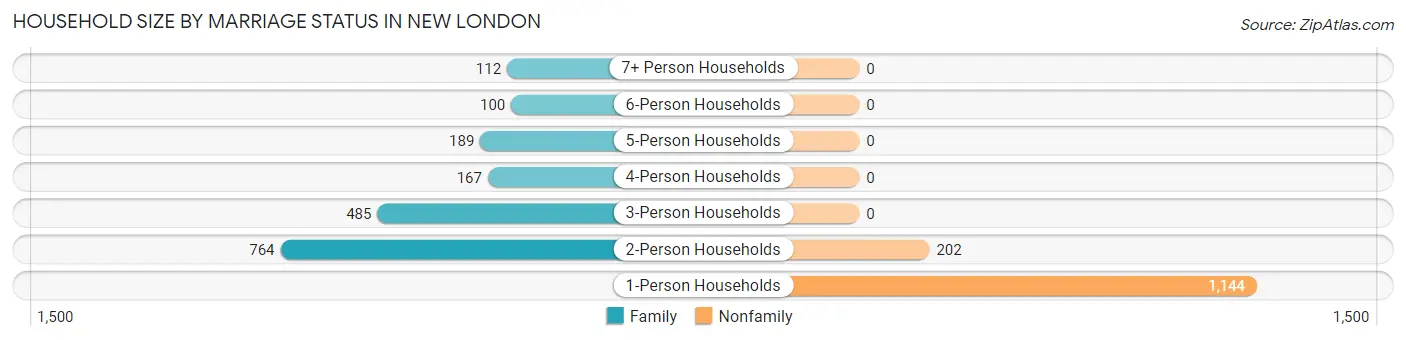
| Household Size | Family Households | Nonfamily Households |
| 1-Person Households | - | 1,144 (36.2%) |
| 2-Person Households | 764 (24.1%) | 202 (6.4%) |
| 3-Person Households | 485 (15.3%) | 0 (0.0%) |
| 4-Person Households | 167 (5.3%) | 0 (0.0%) |
| 5-Person Households | 189 (6.0%) | 0 (0.0%) |
| 6-Person Households | 100 (3.2%) | 0 (0.0%) |
| 7+ Person Households | 112 (3.5%) | 0 (0.0%) |
| Total | 1,817 (57.5%) | 1,346 (42.5%) |
Female Fertility in New London
Fertility by Age in New London
Average fertility rate in New London is 36.0 births per 1,000 women. Women in the age bracket of 20 to 34 years have the highest fertility rate with 97.0 births per 1,000 women. Women in the age bracket of 20 to 34 years acount for 100.0% of all women with births.
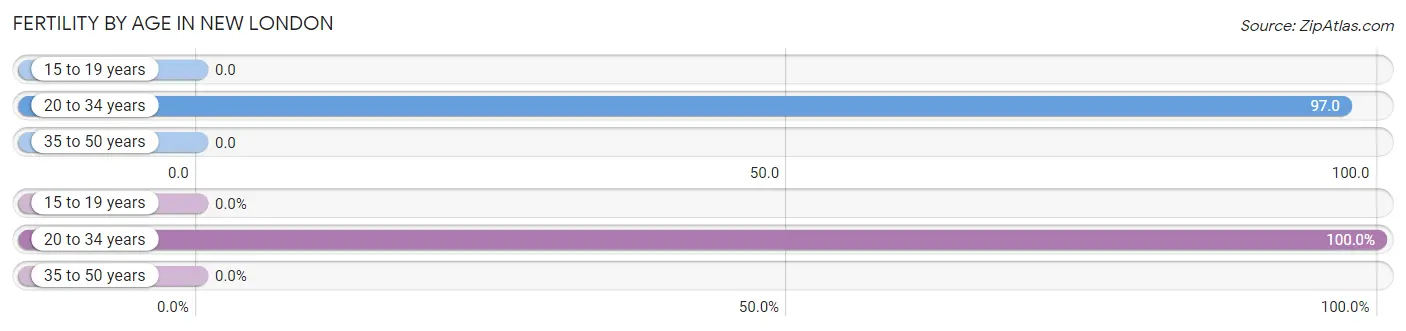
| Age Bracket | Women with Births | Births / 1,000 Women |
| 15 to 19 years | 0 (0.0%) | 0.0 |
| 20 to 34 years | 63 (100.0%) | 97.0 |
| 35 to 50 years | 0 (0.0%) | 0.0 |
| Total | 63 (100.0%) | 36.0 |
Fertility by Age by Marriage Status in New London
39.7% of women with births (63) in New London are married. The highest percentage of unmarried women with births falls into 20 to 34 years age bracket with 60.3% of them unmarried at the time of birth, while the lowest percentage of unmarried women with births belong to 20 to 34 years age bracket with 60.3% of them unmarried.
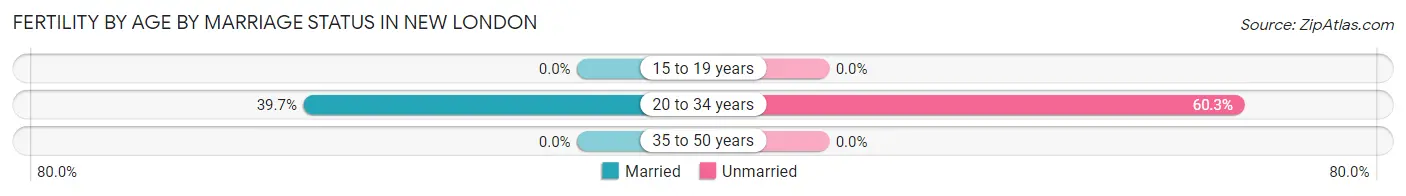
| Age Bracket | Married | Unmarried |
| 15 to 19 years | 0 (0.0%) | 0 (0.0%) |
| 20 to 34 years | 25 (39.7%) | 38 (60.3%) |
| 35 to 50 years | 0 (0.0%) | 0 (0.0%) |
| Total | 25 (39.7%) | 38 (60.3%) |
Fertility by Education in New London
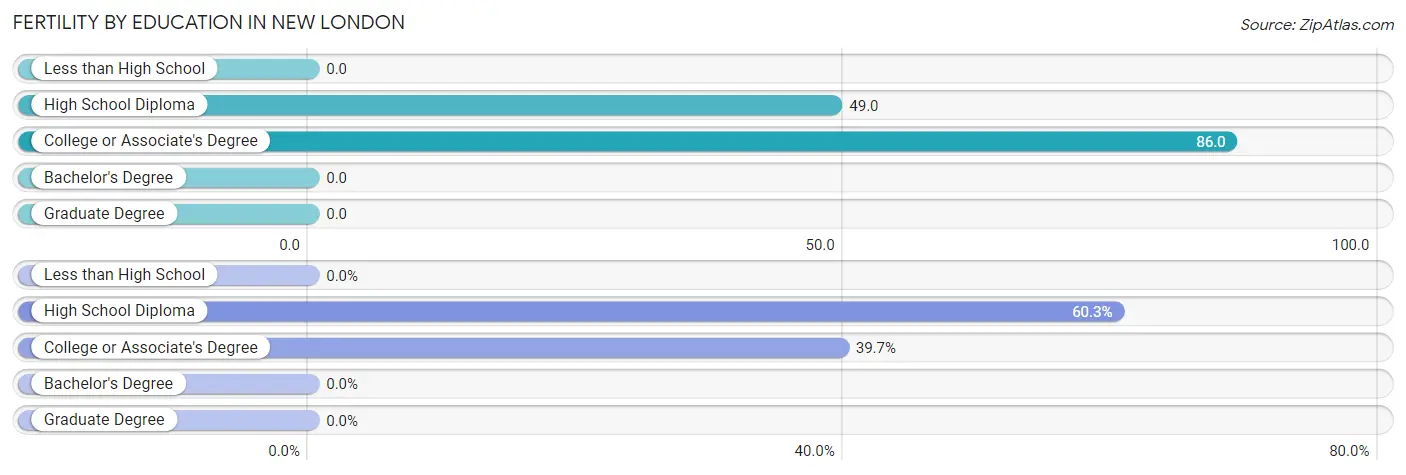
| Educational Attainment | Women with Births | Births / 1,000 Women |
| Less than High School | 0 (0.0%) | 0.0 |
| High School Diploma | 38 (60.3%) | 49.0 |
| College or Associate's Degree | 25 (39.7%) | 86.0 |
| Bachelor's Degree | 0 (0.0%) | 0.0 |
| Graduate Degree | 0 (0.0%) | 0.0 |
| Total | 63 (100.0%) | 36.0 |
Fertility by Education by Marriage Status in New London
60.3% of women with births in New London are unmarried. Women with the educational attainment of college or associate's degree are most likely to be married with 100.0% of them married at childbirth, while women with the educational attainment of high school diploma are least likely to be married with 100.0% of them unmarried at childbirth.
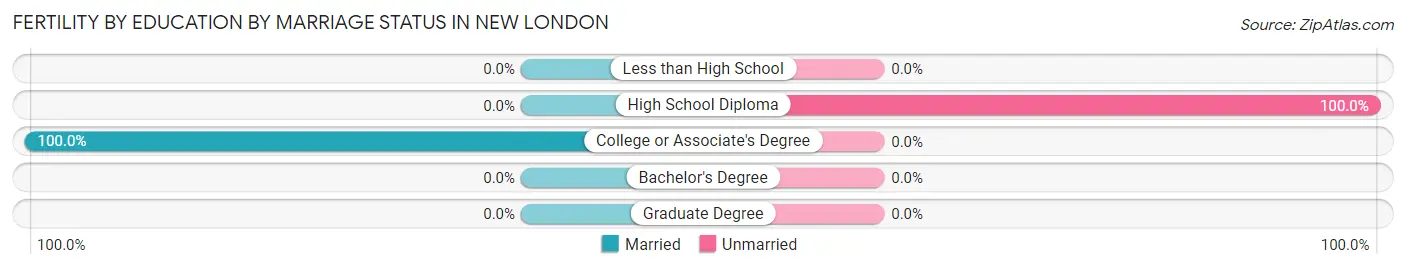
| Educational Attainment | Married | Unmarried |
| Less than High School | 0 (0.0%) | 0 (0.0%) |
| High School Diploma | 0 (0.0%) | 38 (100.0%) |
| College or Associate's Degree | 25 (100.0%) | 0 (0.0%) |
| Bachelor's Degree | 0 (0.0%) | 0 (0.0%) |
| Graduate Degree | 0 (0.0%) | 0 (0.0%) |
| Total | 25 (39.7%) | 38 (60.3%) |
Employment Characteristics in New London
Employment by Class of Employer in New London
Among the 3,352 employed individuals in New London, private company employees (2,608 | 77.8%), local government employees (203 | 6.1%), and state government employees (162 | 4.8%) make up the most common classes of employment.
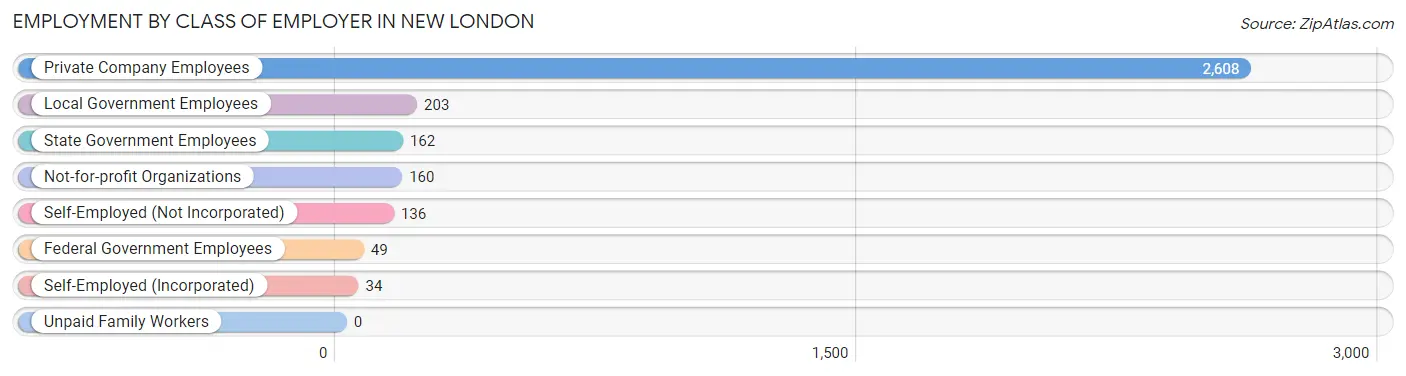
| Employer Class | # Employees | % Employees |
| Private Company Employees | 2,608 | 77.8% |
| Self-Employed (Incorporated) | 34 | 1.0% |
| Self-Employed (Not Incorporated) | 136 | 4.1% |
| Not-for-profit Organizations | 160 | 4.8% |
| Local Government Employees | 203 | 6.1% |
| State Government Employees | 162 | 4.8% |
| Federal Government Employees | 49 | 1.5% |
| Unpaid Family Workers | 0 | 0.0% |
| Total | 3,352 | 100.0% |
Employment Status by Age in New London
According to the labor force statistics for New London, out of the total population over 16 years of age (5,570), 62.8% or 3,498 individuals are in the labor force, with 1.0% or 35 of them unemployed. The age group with the highest labor force participation rate is 25 to 29 years, with 100.0% or 235 individuals in the labor force. Within the labor force, the 60 to 64 years age range has the highest percentage of unemployed individuals, with 6.0% or 14 of them being unemployed.
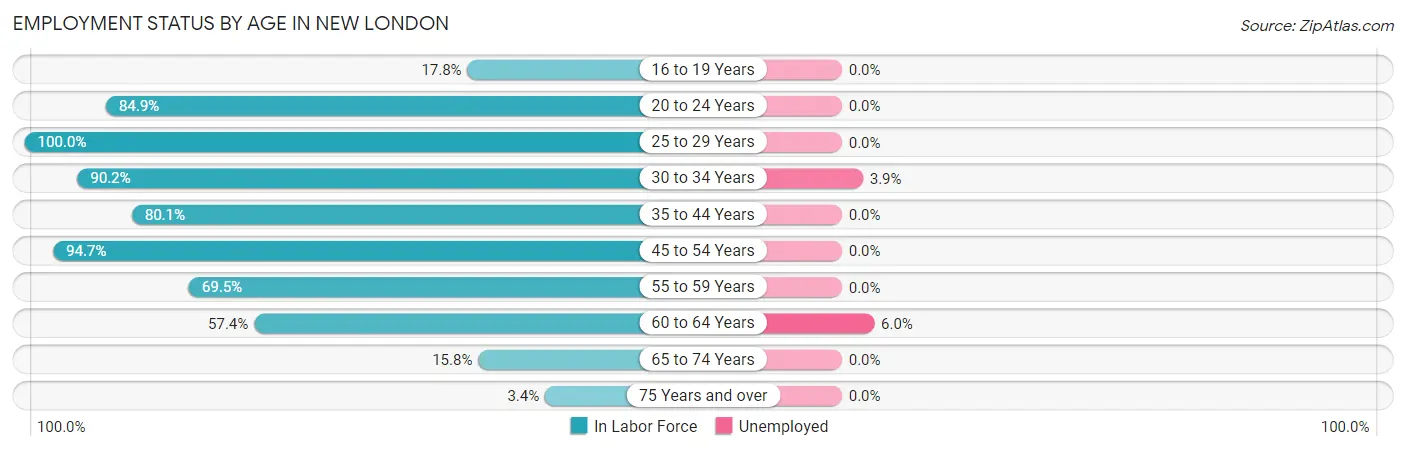
| Age Bracket | In Labor Force | Unemployed |
| 16 to 19 Years | 63 (17.8%) | 0 (0.0%) |
| 20 to 24 Years | 422 (84.9%) | 0 (0.0%) |
| 25 to 29 Years | 235 (100.0%) | 0 (0.0%) |
| 30 to 34 Years | 516 (90.2%) | 20 (3.9%) |
| 35 to 44 Years | 912 (80.1%) | 0 (0.0%) |
| 45 to 54 Years | 628 (94.7%) | 0 (0.0%) |
| 55 to 59 Years | 382 (69.5%) | 0 (0.0%) |
| 60 to 64 Years | 232 (57.4%) | 14 (6.0%) |
| 65 to 74 Years | 89 (15.8%) | 0 (0.0%) |
| 75 Years and over | 20 (3.4%) | 0 (0.0%) |
| Total | 3,498 (62.8%) | 35 (1.0%) |
Employment Status by Educational Attainment in New London
According to labor force statistics for New London, 81.5% of individuals (2,903) out of the total population between 25 and 64 years of age (3,562) are in the labor force, with 1.2% or 35 of them being unemployed. The group with the highest labor force participation rate are those with the educational attainment of bachelor's degree or higher, with 88.8% or 570 individuals in the labor force. Within the labor force, individuals with high school diploma education have the highest percentage of unemployment, with 2.4% or 34 of them being unemployed.
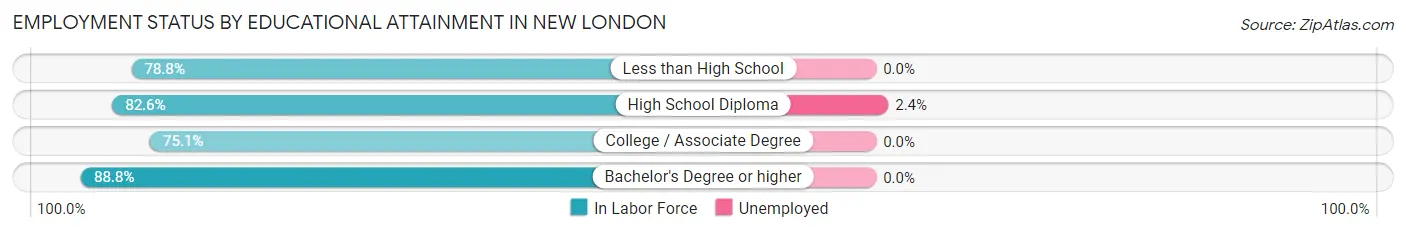
| Educational Attainment | In Labor Force | Unemployed |
| Less than High School | 257 (78.8%) | 0 (0.0%) |
| High School Diploma | 1,427 (82.6%) | 41 (2.4%) |
| College / Associate Degree | 651 (75.1%) | 0 (0.0%) |
| Bachelor's Degree or higher | 570 (88.8%) | 0 (0.0%) |
| Total | 2,903 (81.5%) | 43 (1.2%) |
Employment Occupations by Sex in New London
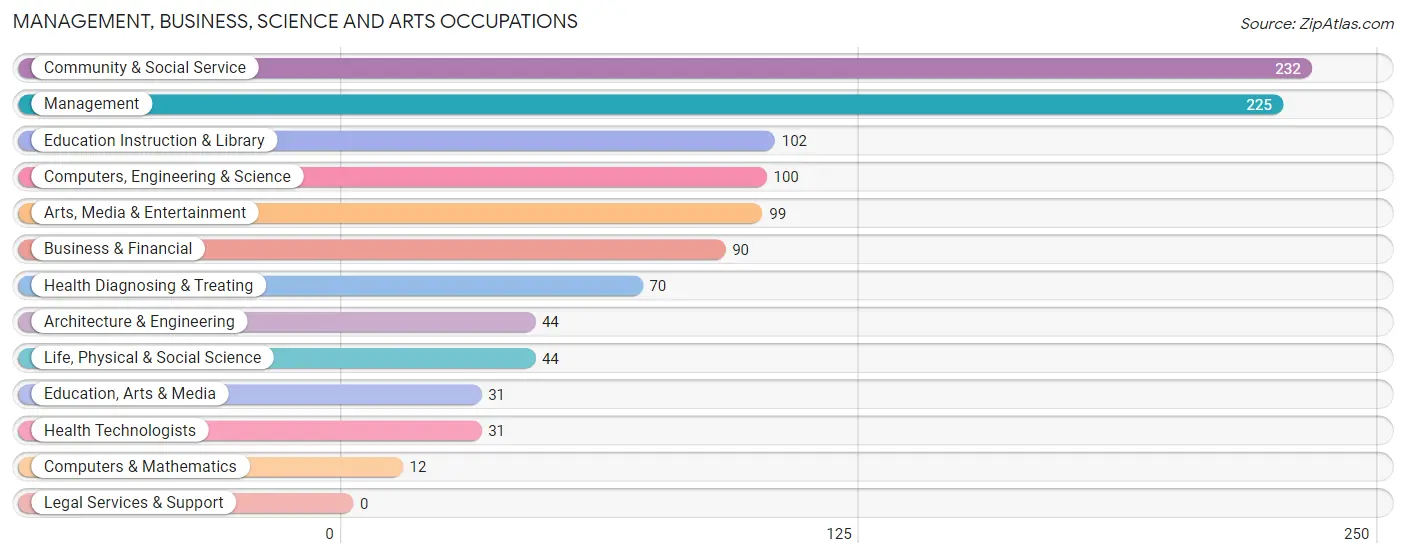
Management, Business, Science and Arts Occupations
The most common Management, Business, Science and Arts occupations in New London are Community & Social Service (232 | 6.7%), Management (225 | 6.5%), Education Instruction & Library (102 | 2.9%), Computers, Engineering & Science (100 | 2.9%), and Arts, Media & Entertainment (99 | 2.9%).
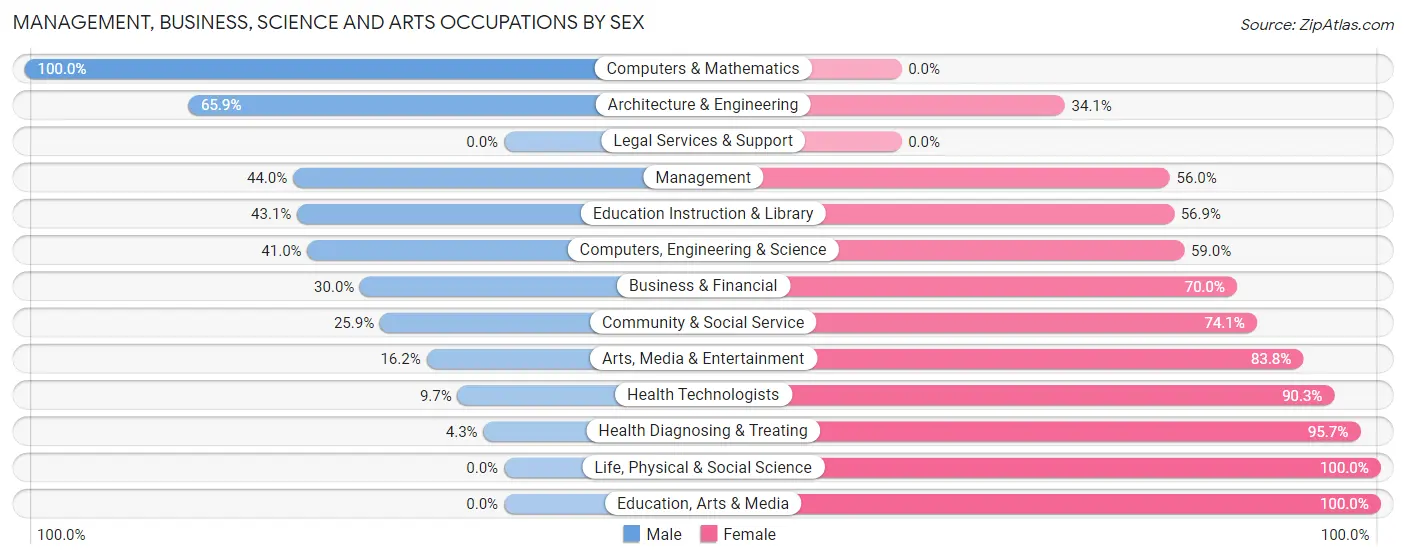
Management, Business, Science and Arts Occupations by Sex
Within the Management, Business, Science and Arts occupations in New London, the most male-oriented occupations are Computers & Mathematics (100.0%), Architecture & Engineering (65.9%), and Management (44.0%), while the most female-oriented occupations are Life, Physical & Social Science (100.0%), Education, Arts & Media (100.0%), and Health Diagnosing & Treating (95.7%).
| Occupation | Male | Female |
| Management | 99 (44.0%) | 126 (56.0%) |
| Business & Financial | 27 (30.0%) | 63 (70.0%) |
| Computers, Engineering & Science | 41 (41.0%) | 59 (59.0%) |
| Computers & Mathematics | 12 (100.0%) | 0 (0.0%) |
| Architecture & Engineering | 29 (65.9%) | 15 (34.1%) |
| Life, Physical & Social Science | 0 (0.0%) | 44 (100.0%) |
| Community & Social Service | 60 (25.9%) | 172 (74.1%) |
| Education, Arts & Media | 0 (0.0%) | 31 (100.0%) |
| Legal Services & Support | 0 (0.0%) | 0 (0.0%) |
| Education Instruction & Library | 44 (43.1%) | 58 (56.9%) |
| Arts, Media & Entertainment | 16 (16.2%) | 83 (83.8%) |
| Health Diagnosing & Treating | 3 (4.3%) | 67 (95.7%) |
| Health Technologists | 3 (9.7%) | 28 (90.3%) |
| Total (Category) | 230 (32.1%) | 487 (67.9%) |
| Total (Overall) | 1,792 (51.7%) | 1,672 (48.3%) |
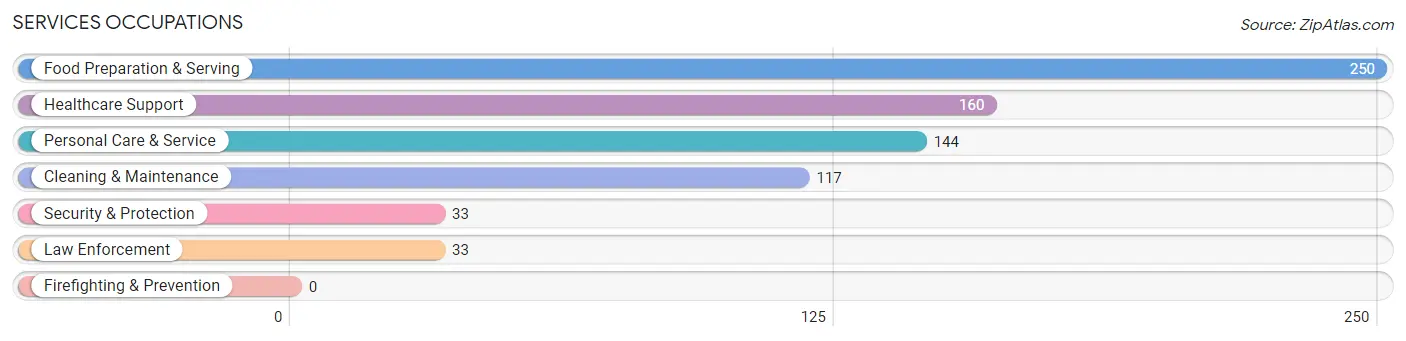
Services Occupations
The most common Services occupations in New London are Food Preparation & Serving (250 | 7.2%), Healthcare Support (160 | 4.6%), Personal Care & Service (144 | 4.2%), Cleaning & Maintenance (117 | 3.4%), and Security & Protection (33 | 0.9%).
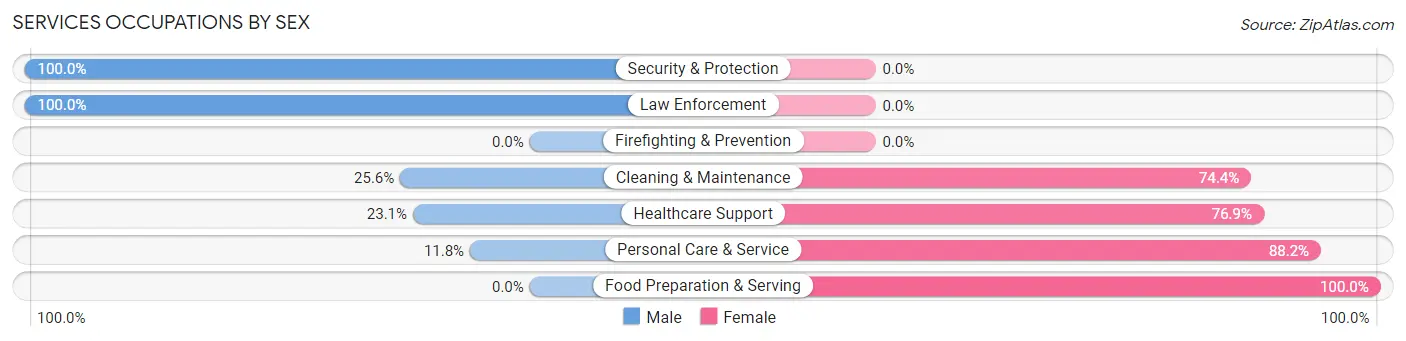
Services Occupations by Sex
Within the Services occupations in New London, the most male-oriented occupations are Security & Protection (100.0%), Law Enforcement (100.0%), and Cleaning & Maintenance (25.6%), while the most female-oriented occupations are Food Preparation & Serving (100.0%), Personal Care & Service (88.2%), and Healthcare Support (76.9%).
| Occupation | Male | Female |
| Healthcare Support | 37 (23.1%) | 123 (76.9%) |
| Security & Protection | 33 (100.0%) | 0 (0.0%) |
| Firefighting & Prevention | 0 (0.0%) | 0 (0.0%) |
| Law Enforcement | 33 (100.0%) | 0 (0.0%) |
| Food Preparation & Serving | 0 (0.0%) | 250 (100.0%) |
| Cleaning & Maintenance | 30 (25.6%) | 87 (74.4%) |
| Personal Care & Service | 17 (11.8%) | 127 (88.2%) |
| Total (Category) | 117 (16.6%) | 587 (83.4%) |
| Total (Overall) | 1,792 (51.7%) | 1,672 (48.3%) |
Sales and Office Occupations
The most common Sales and Office occupations in New London are Sales & Related (368 | 10.6%), and Office & Administration (366 | 10.6%).

Sales and Office Occupations by Sex

| Occupation | Male | Female |
| Sales & Related | 236 (64.1%) | 132 (35.9%) |
| Office & Administration | 17 (4.6%) | 349 (95.4%) |
| Total (Category) | 253 (34.5%) | 481 (65.5%) |
| Total (Overall) | 1,792 (51.7%) | 1,672 (48.3%) |
Natural Resources, Construction and Maintenance Occupations
The most common Natural Resources, Construction and Maintenance occupations in New London are Construction & Extraction (162 | 4.7%), and Installation, Maintenance & Repair (83 | 2.4%).
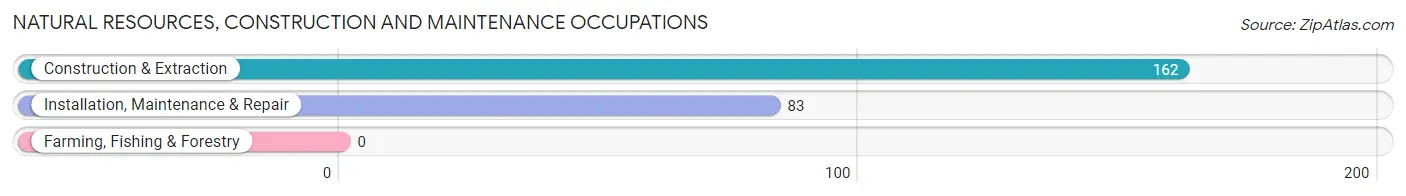
Natural Resources, Construction and Maintenance Occupations by Sex
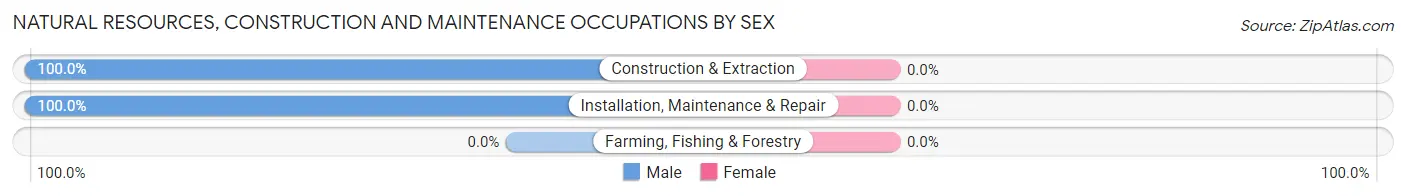
| Occupation | Male | Female |
| Farming, Fishing & Forestry | 0 (0.0%) | 0 (0.0%) |
| Construction & Extraction | 162 (100.0%) | 0 (0.0%) |
| Installation, Maintenance & Repair | 83 (100.0%) | 0 (0.0%) |
| Total (Category) | 245 (100.0%) | 0 (0.0%) |
| Total (Overall) | 1,792 (51.7%) | 1,672 (48.3%) |
Production, Transportation and Moving Occupations
The most common Production, Transportation and Moving occupations in New London are Production (722 | 20.8%), Material Moving (217 | 6.3%), and Transportation (125 | 3.6%).
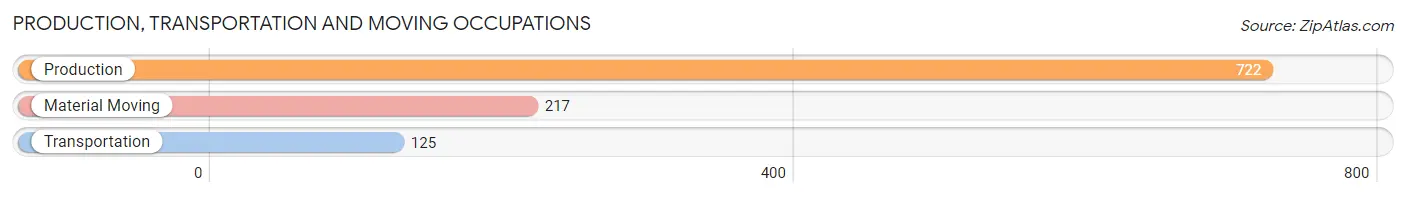
Production, Transportation and Moving Occupations by Sex
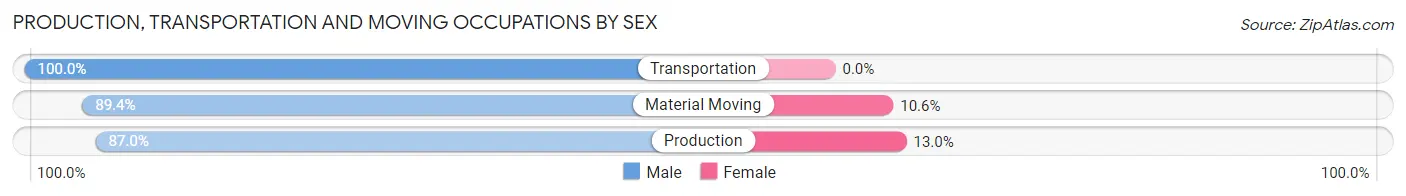
| Occupation | Male | Female |
| Production | 628 (87.0%) | 94 (13.0%) |
| Transportation | 125 (100.0%) | 0 (0.0%) |
| Material Moving | 194 (89.4%) | 23 (10.6%) |
| Total (Category) | 947 (89.0%) | 117 (11.0%) |
| Total (Overall) | 1,792 (51.7%) | 1,672 (48.3%) |
Employment Industries by Sex in New London
Employment Industries in New London
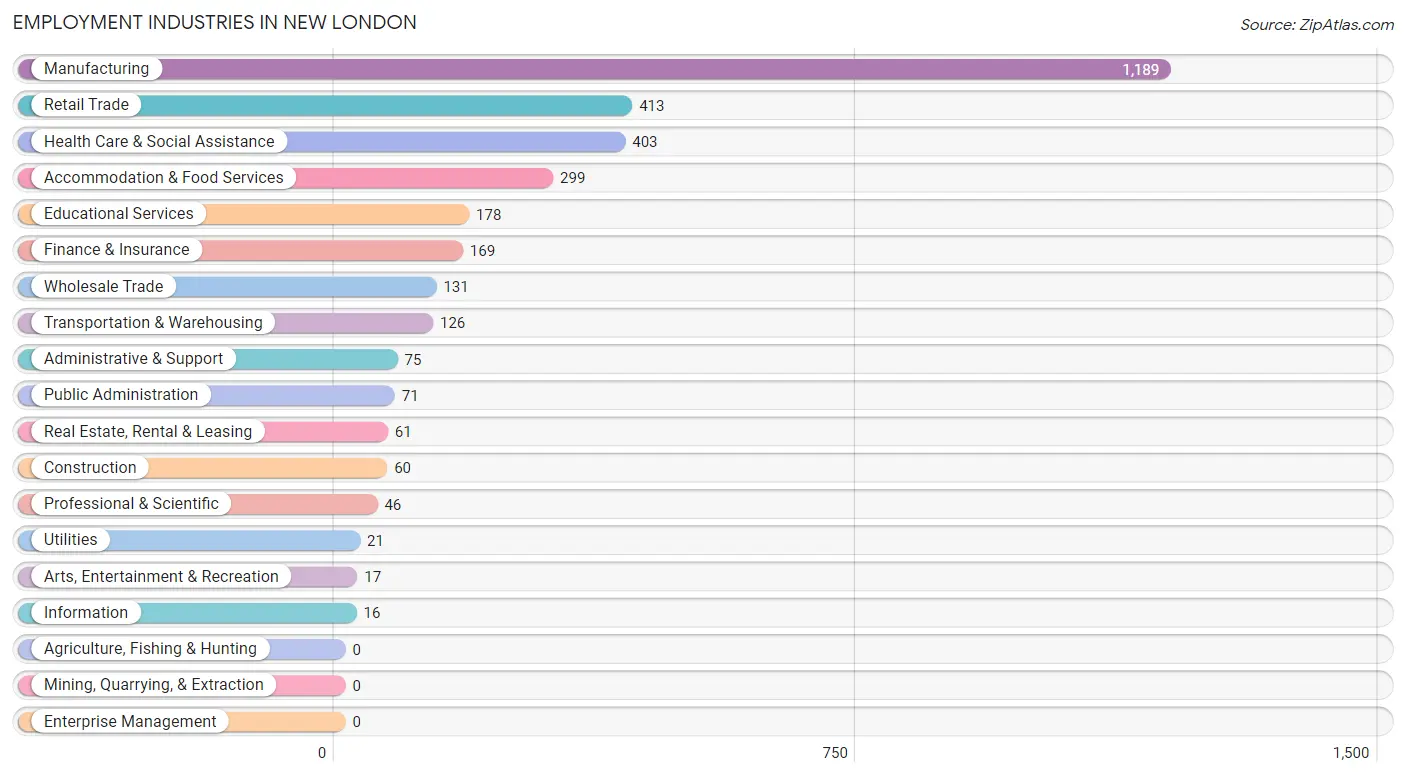
The major employment industries in New London include Manufacturing (1,189 | 34.3%), Retail Trade (413 | 11.9%), Health Care & Social Assistance (403 | 11.6%), Accommodation & Food Services (299 | 8.6%), and Educational Services (178 | 5.1%).
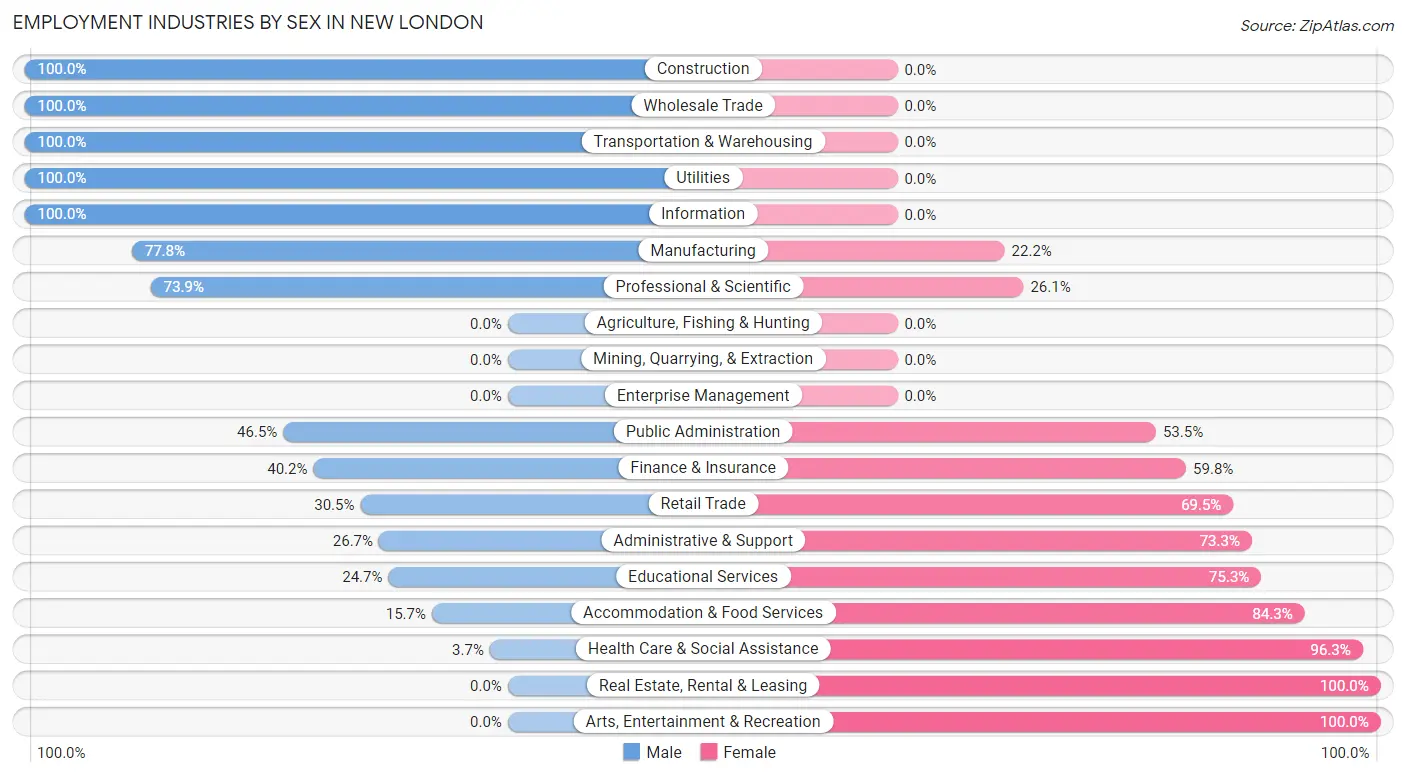
Employment Industries by Sex in New London
The New London industries that see more men than women are Construction (100.0%), Wholesale Trade (100.0%), and Transportation & Warehousing (100.0%), whereas the industries that tend to have a higher number of women are Real Estate, Rental & Leasing (100.0%), Arts, Entertainment & Recreation (100.0%), and Health Care & Social Assistance (96.3%).
| Industry | Male | Female |
| Agriculture, Fishing & Hunting | 0 (0.0%) | 0 (0.0%) |
| Mining, Quarrying, & Extraction | 0 (0.0%) | 0 (0.0%) |
| Construction | 60 (100.0%) | 0 (0.0%) |
| Manufacturing | 925 (77.8%) | 264 (22.2%) |
| Wholesale Trade | 131 (100.0%) | 0 (0.0%) |
| Retail Trade | 126 (30.5%) | 287 (69.5%) |
| Transportation & Warehousing | 126 (100.0%) | 0 (0.0%) |
| Utilities | 21 (100.0%) | 0 (0.0%) |
| Information | 16 (100.0%) | 0 (0.0%) |
| Finance & Insurance | 68 (40.2%) | 101 (59.8%) |
| Real Estate, Rental & Leasing | 0 (0.0%) | 61 (100.0%) |
| Professional & Scientific | 34 (73.9%) | 12 (26.1%) |
| Enterprise Management | 0 (0.0%) | 0 (0.0%) |
| Administrative & Support | 20 (26.7%) | 55 (73.3%) |
| Educational Services | 44 (24.7%) | 134 (75.3%) |
| Health Care & Social Assistance | 15 (3.7%) | 388 (96.3%) |
| Arts, Entertainment & Recreation | 0 (0.0%) | 17 (100.0%) |
| Accommodation & Food Services | 47 (15.7%) | 252 (84.3%) |
| Public Administration | 33 (46.5%) | 38 (53.5%) |
| Total | 1,792 (51.7%) | 1,672 (48.3%) |
Education in New London
School Enrollment in New London
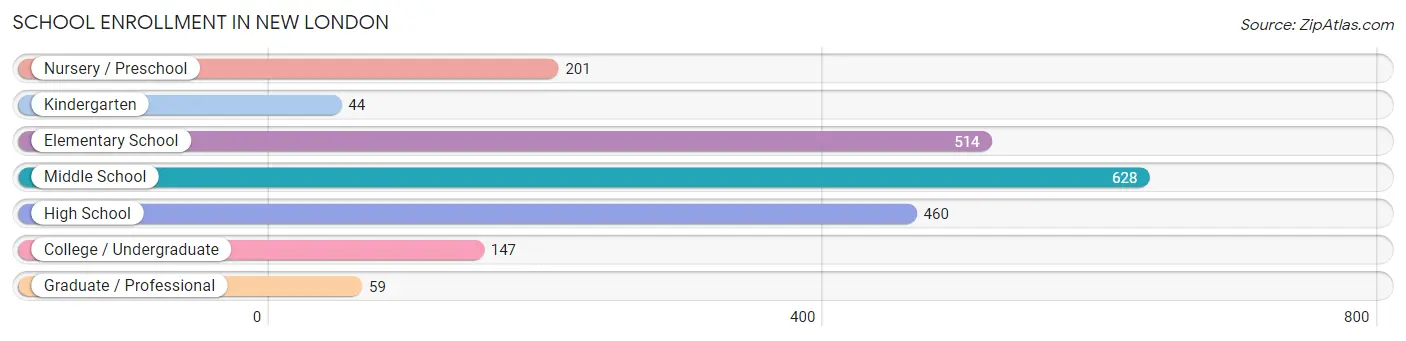
The most common levels of schooling among the 2,053 students in New London are middle school (628 | 30.6%), elementary school (514 | 25.0%), and high school (460 | 22.4%).
| School Level | # Students | % Students |
| Nursery / Preschool | 201 | 9.8% |
| Kindergarten | 44 | 2.1% |
| Elementary School | 514 | 25.0% |
| Middle School | 628 | 30.6% |
| High School | 460 | 22.4% |
| College / Undergraduate | 147 | 7.2% |
| Graduate / Professional | 59 | 2.9% |
| Total | 2,053 | 100.0% |
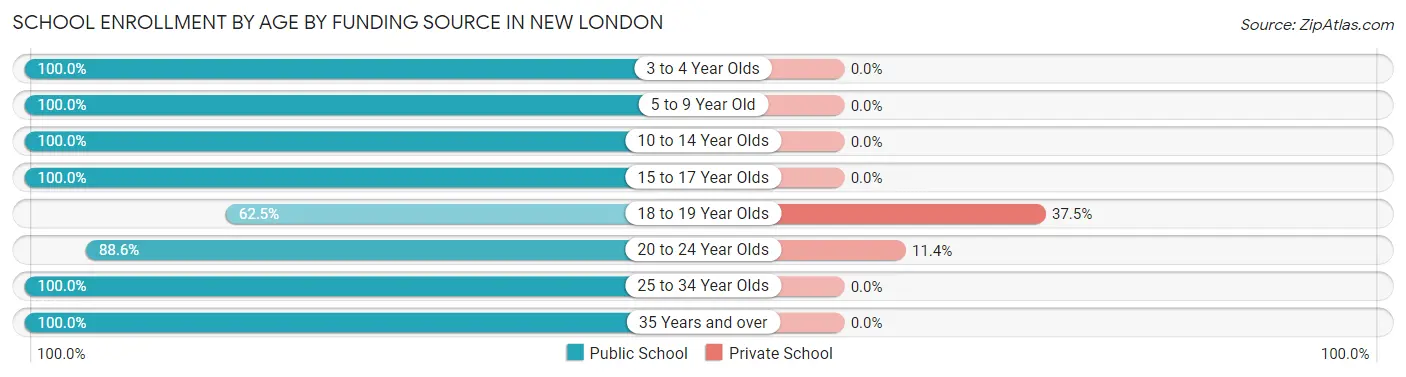
School Enrollment by Age by Funding Source in New London
Out of a total of 2,053 students who are enrolled in schools in New London, 25 (1.2%) attend a private institution, while the remaining 2,028 (98.8%) are enrolled in public schools. The age group of 18 to 19 year olds has the highest likelihood of being enrolled in private schools, with 12 (37.5% in the age bracket) enrolled. Conversely, the age group of 3 to 4 year olds has the lowest likelihood of being enrolled in a private school, with 125 (100.0% in the age bracket) attending a public institution.
| Age Bracket | Public School | Private School |
| 3 to 4 Year Olds | 125 (100.0%) | 0 (0.0%) |
| 5 to 9 Year Old | 577 (100.0%) | 0 (0.0%) |
| 10 to 14 Year Olds | 695 (100.0%) | 0 (0.0%) |
| 15 to 17 Year Olds | 403 (100.0%) | 0 (0.0%) |
| 18 to 19 Year Olds | 20 (62.5%) | 12 (37.5%) |
| 20 to 24 Year Olds | 93 (88.6%) | 12 (11.4%) |
| 25 to 34 Year Olds | 100 (100.0%) | 0 (0.0%) |
| 35 Years and over | 16 (100.0%) | 0 (0.0%) |
| Total | 2,028 (98.8%) | 25 (1.2%) |
Educational Attainment by Field of Study in New London
Education (173 | 18.3%), arts & humanities (146 | 15.4%), business (136 | 14.4%), computers & mathematics (110 | 11.6%), and bio, nature & agricultural (87 | 9.2%) are the most common fields of study among 947 individuals in New London who have obtained a bachelor's degree or higher.
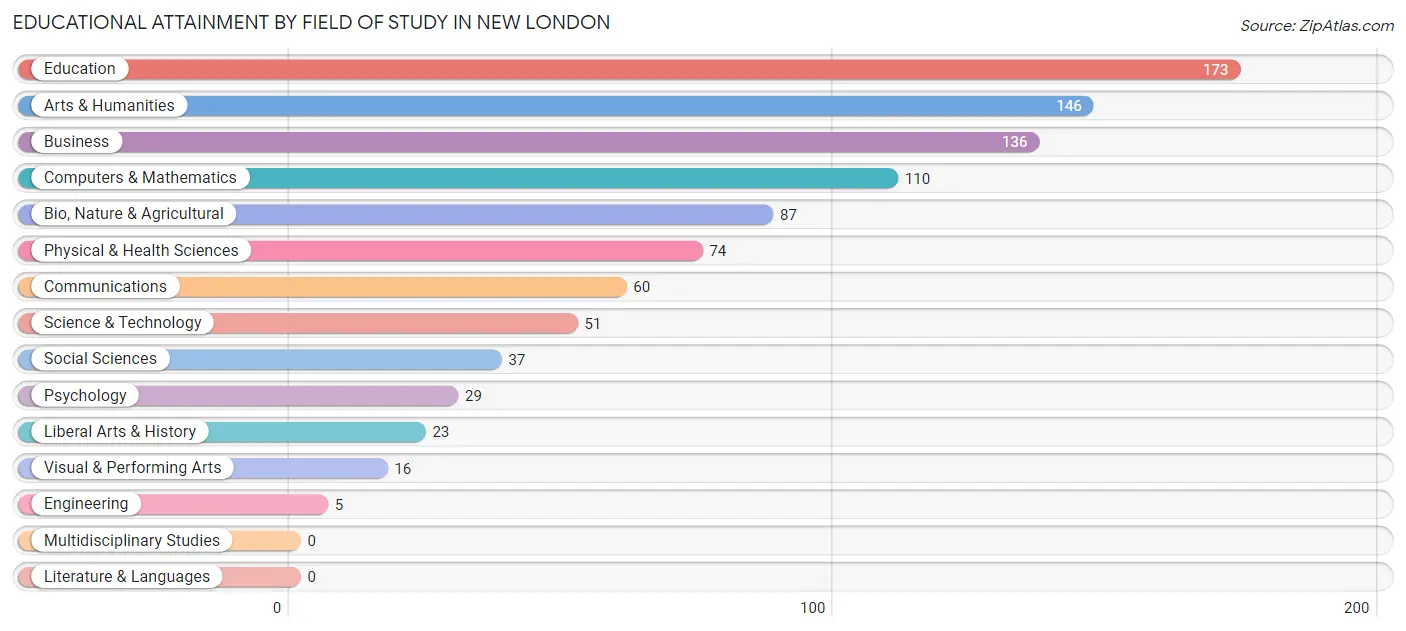
| Field of Study | # Graduates | % Graduates |
| Computers & Mathematics | 110 | 11.6% |
| Bio, Nature & Agricultural | 87 | 9.2% |
| Physical & Health Sciences | 74 | 7.8% |
| Psychology | 29 | 3.1% |
| Social Sciences | 37 | 3.9% |
| Engineering | 5 | 0.5% |
| Multidisciplinary Studies | 0 | 0.0% |
| Science & Technology | 51 | 5.4% |
| Business | 136 | 14.4% |
| Education | 173 | 18.3% |
| Literature & Languages | 0 | 0.0% |
| Liberal Arts & History | 23 | 2.4% |
| Visual & Performing Arts | 16 | 1.7% |
| Communications | 60 | 6.3% |
| Arts & Humanities | 146 | 15.4% |
| Total | 947 | 100.0% |
Transportation & Commute in New London
Vehicle Availability by Sex in New London
The most prevalent vehicle ownership categories in New London are males with 2 vehicles (711, accounting for 40.5%) and females with 2 vehicles (479, making up 44.8%).
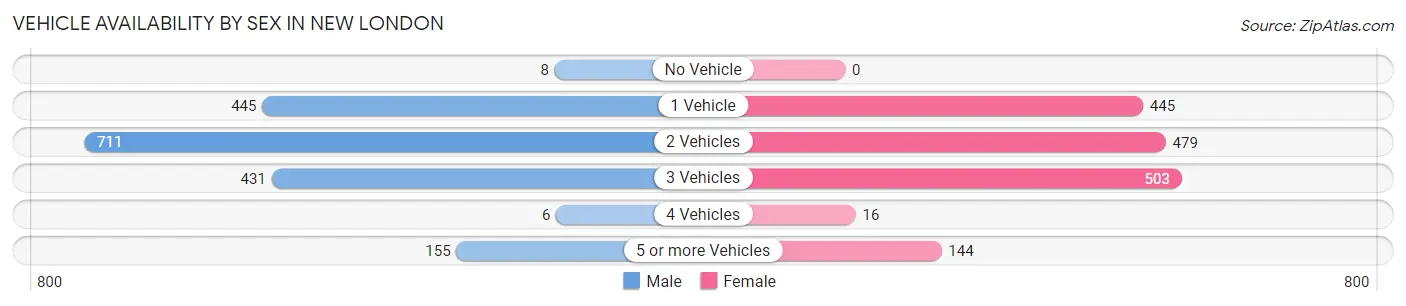
| Vehicles Available | Male | Female |
| No Vehicle | 8 (0.5%) | 0 (0.0%) |
| 1 Vehicle | 445 (25.3%) | 445 (28.0%) |
| 2 Vehicles | 711 (40.5%) | 479 (30.2%) |
| 3 Vehicles | 431 (24.5%) | 503 (31.7%) |
| 4 Vehicles | 6 (0.3%) | 16 (1.0%) |
| 5 or more Vehicles | 155 (8.8%) | 144 (9.1%) |
| Total | 1,756 (100.0%) | 1,587 (100.0%) |
Commute Time in New London
The most frequently occuring commute durations in New London are 30 to 34 minutes (693 commuters, 21.7%), 5 to 9 minutes (449 commuters, 14.0%), and 35 to 39 minutes (389 commuters, 12.2%).
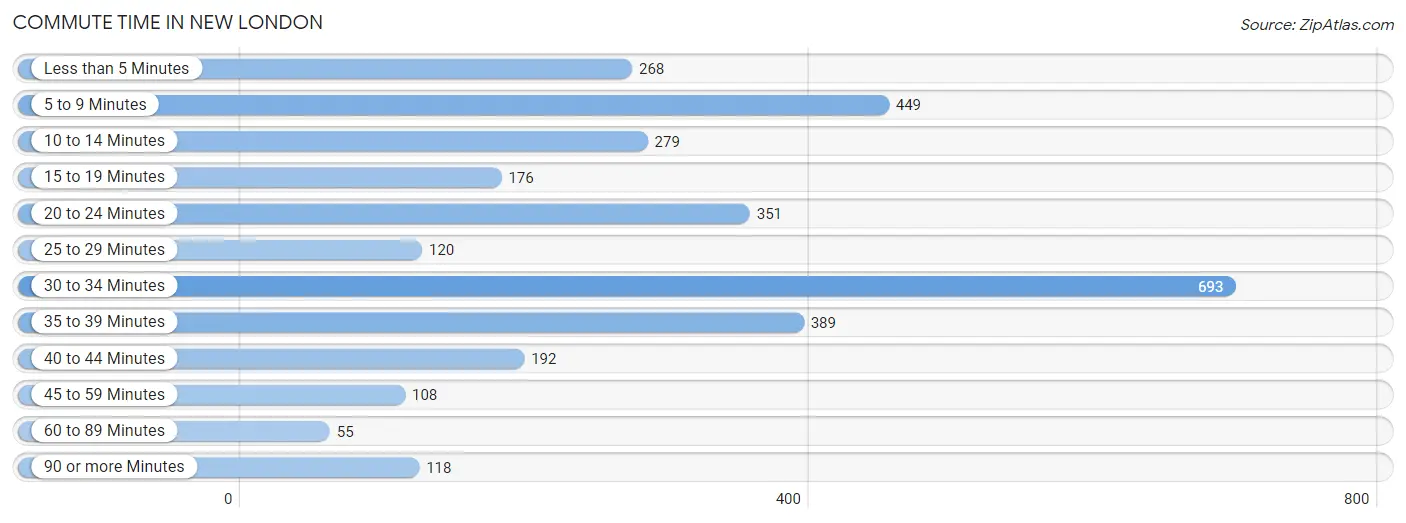
| Commute Time | # Commuters | % Commuters |
| Less than 5 Minutes | 268 | 8.4% |
| 5 to 9 Minutes | 449 | 14.0% |
| 10 to 14 Minutes | 279 | 8.7% |
| 15 to 19 Minutes | 176 | 5.5% |
| 20 to 24 Minutes | 351 | 11.0% |
| 25 to 29 Minutes | 120 | 3.7% |
| 30 to 34 Minutes | 693 | 21.7% |
| 35 to 39 Minutes | 389 | 12.2% |
| 40 to 44 Minutes | 192 | 6.0% |
| 45 to 59 Minutes | 108 | 3.4% |
| 60 to 89 Minutes | 55 | 1.7% |
| 90 or more Minutes | 118 | 3.7% |
Commute Time by Sex in New London
The most common commute times in New London are 30 to 34 minutes (332 commuters, 19.2%) for males and 30 to 34 minutes (361 commuters, 24.6%) for females.
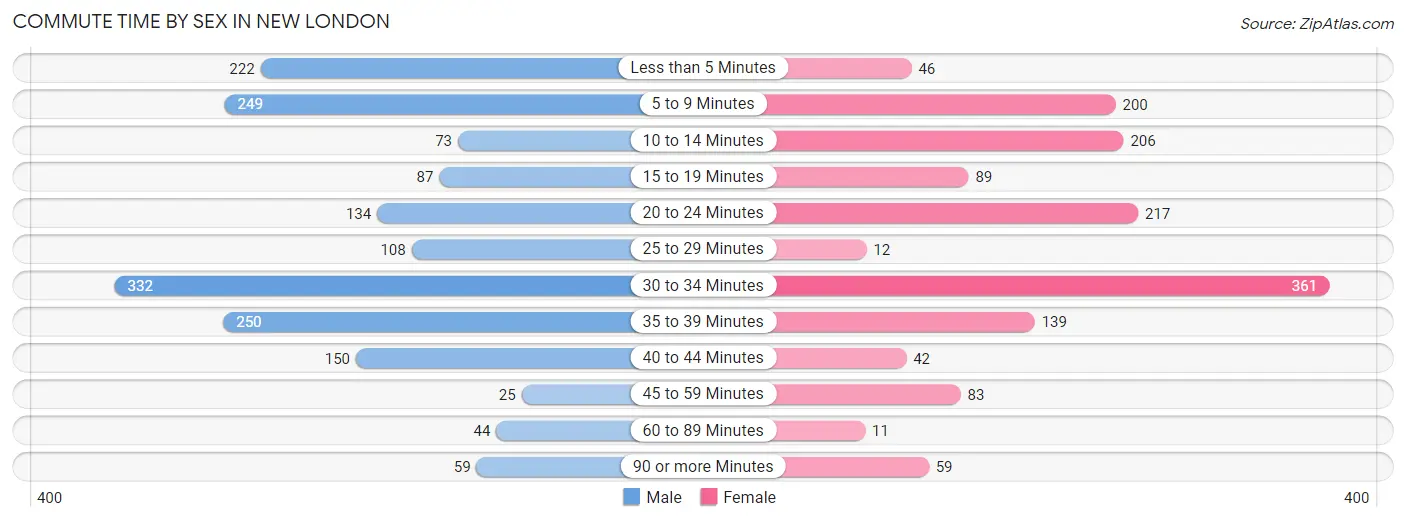
| Commute Time | Male | Female |
| Less than 5 Minutes | 222 (12.8%) | 46 (3.1%) |
| 5 to 9 Minutes | 249 (14.4%) | 200 (13.7%) |
| 10 to 14 Minutes | 73 (4.2%) | 206 (14.1%) |
| 15 to 19 Minutes | 87 (5.0%) | 89 (6.1%) |
| 20 to 24 Minutes | 134 (7.7%) | 217 (14.8%) |
| 25 to 29 Minutes | 108 (6.2%) | 12 (0.8%) |
| 30 to 34 Minutes | 332 (19.2%) | 361 (24.6%) |
| 35 to 39 Minutes | 250 (14.4%) | 139 (9.5%) |
| 40 to 44 Minutes | 150 (8.7%) | 42 (2.9%) |
| 45 to 59 Minutes | 25 (1.4%) | 83 (5.7%) |
| 60 to 89 Minutes | 44 (2.5%) | 11 (0.7%) |
| 90 or more Minutes | 59 (3.4%) | 59 (4.0%) |
Time of Departure to Work by Sex in New London
The most frequent times of departure to work in New London are 4:00 PM to 11:59 PM (332, 19.2%) for males and 7:00 AM to 7:29 AM (279, 19.0%) for females.
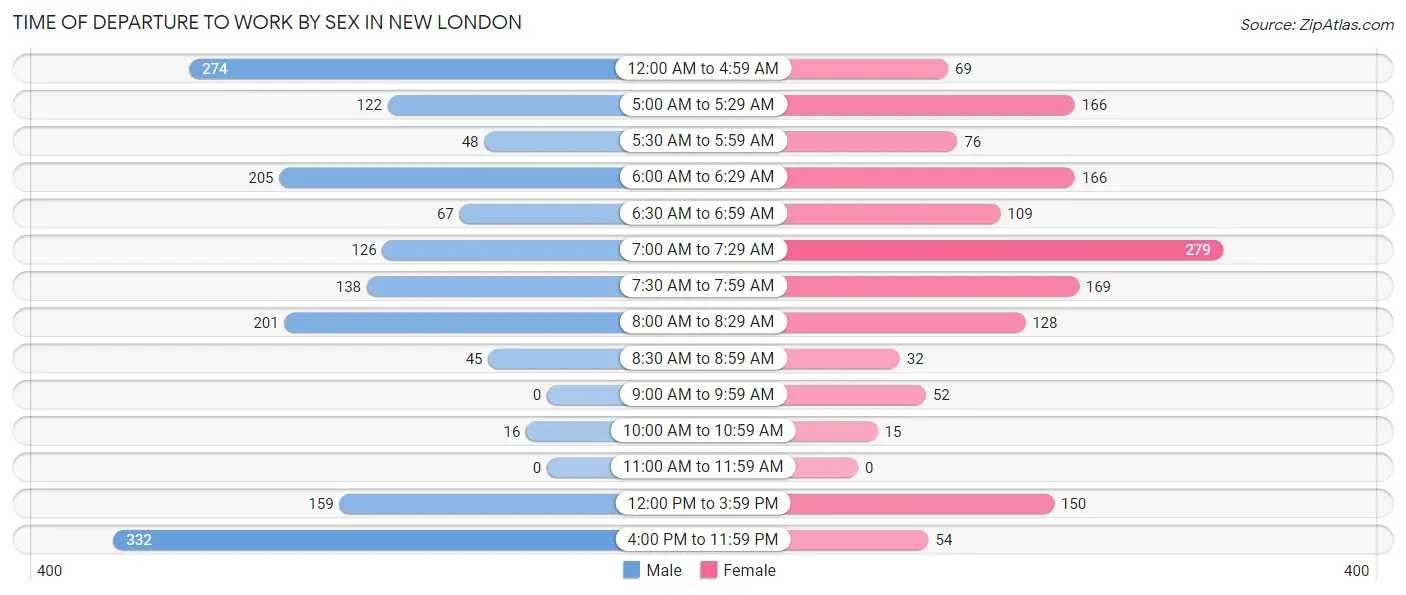
| Time of Departure | Male | Female |
| 12:00 AM to 4:59 AM | 274 (15.8%) | 69 (4.7%) |
| 5:00 AM to 5:29 AM | 122 (7.0%) | 166 (11.3%) |
| 5:30 AM to 5:59 AM | 48 (2.8%) | 76 (5.2%) |
| 6:00 AM to 6:29 AM | 205 (11.8%) | 166 (11.3%) |
| 6:30 AM to 6:59 AM | 67 (3.9%) | 109 (7.4%) |
| 7:00 AM to 7:29 AM | 126 (7.3%) | 279 (19.0%) |
| 7:30 AM to 7:59 AM | 138 (8.0%) | 169 (11.5%) |
| 8:00 AM to 8:29 AM | 201 (11.6%) | 128 (8.7%) |
| 8:30 AM to 8:59 AM | 45 (2.6%) | 32 (2.2%) |
| 9:00 AM to 9:59 AM | 0 (0.0%) | 52 (3.5%) |
| 10:00 AM to 10:59 AM | 16 (0.9%) | 15 (1.0%) |
| 11:00 AM to 11:59 AM | 0 (0.0%) | 0 (0.0%) |
| 12:00 PM to 3:59 PM | 159 (9.2%) | 150 (10.2%) |
| 4:00 PM to 11:59 PM | 332 (19.2%) | 54 (3.7%) |
| Total | 1,733 (100.0%) | 1,465 (100.0%) |
Housing Occupancy in New London
Occupancy by Ownership in New London
Of the total 3,163 dwellings in New London, owner-occupied units account for 1,618 (51.1%), while renter-occupied units make up 1,545 (48.8%).
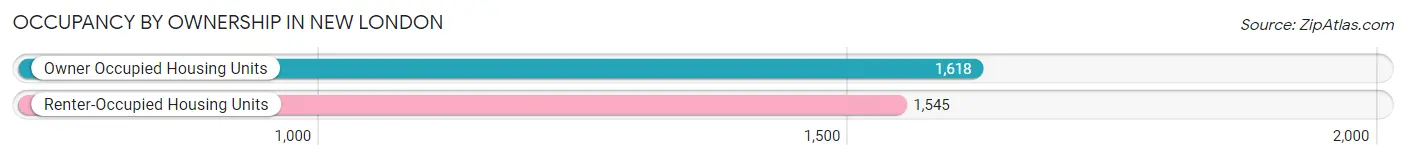
| Occupancy | # Housing Units | % Housing Units |
| Owner Occupied Housing Units | 1,618 | 51.1% |
| Renter-Occupied Housing Units | 1,545 | 48.8% |
| Total Occupied Housing Units | 3,163 | 100.0% |
Occupancy by Household Size in New London
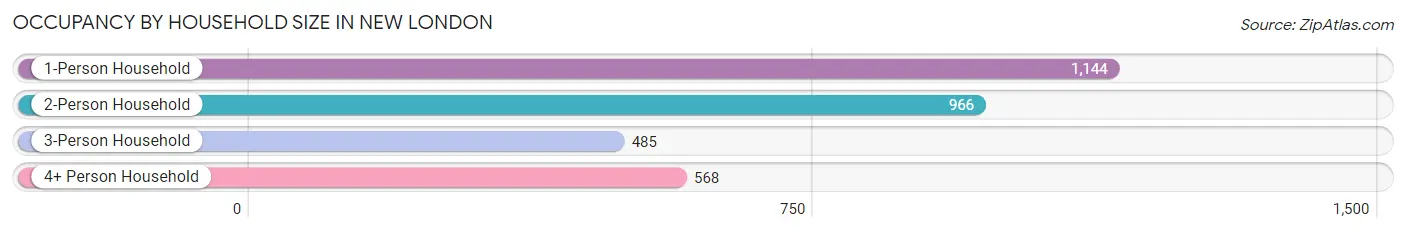
| Household Size | # Housing Units | % Housing Units |
| 1-Person Household | 1,144 | 36.2% |
| 2-Person Household | 966 | 30.5% |
| 3-Person Household | 485 | 15.3% |
| 4+ Person Household | 568 | 18.0% |
| Total Housing Units | 3,163 | 100.0% |
Occupancy by Ownership by Household Size in New London
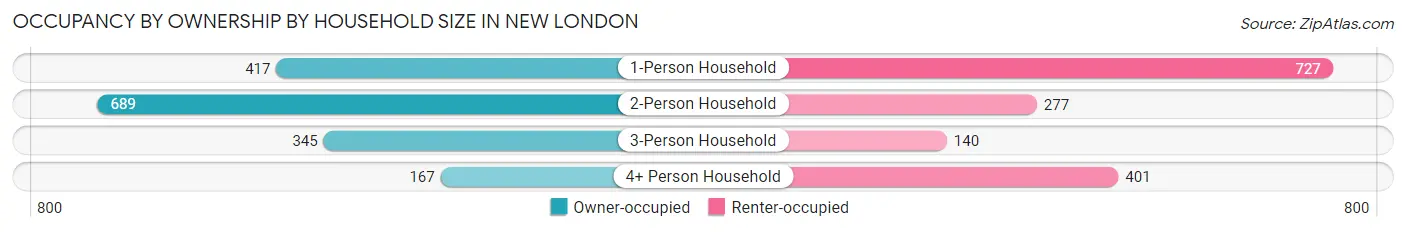
| Household Size | Owner-occupied | Renter-occupied |
| 1-Person Household | 417 (36.4%) | 727 (63.5%) |
| 2-Person Household | 689 (71.3%) | 277 (28.7%) |
| 3-Person Household | 345 (71.1%) | 140 (28.9%) |
| 4+ Person Household | 167 (29.4%) | 401 (70.6%) |
| Total Housing Units | 1,618 (51.1%) | 1,545 (48.8%) |
Occupancy by Educational Attainment in New London
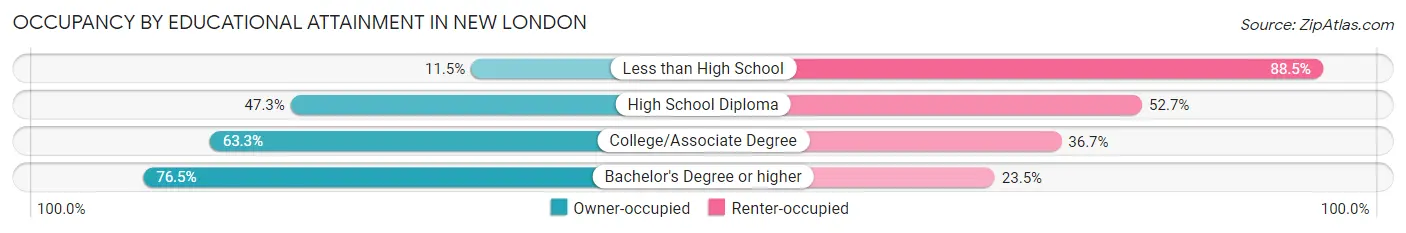
| Household Size | Owner-occupied | Renter-occupied |
| Less than High School | 37 (11.5%) | 285 (88.5%) |
| High School Diploma | 793 (47.3%) | 885 (52.7%) |
| College/Associate Degree | 486 (63.3%) | 282 (36.7%) |
| Bachelor's Degree or higher | 302 (76.5%) | 93 (23.5%) |
Occupancy by Age of Householder in New London
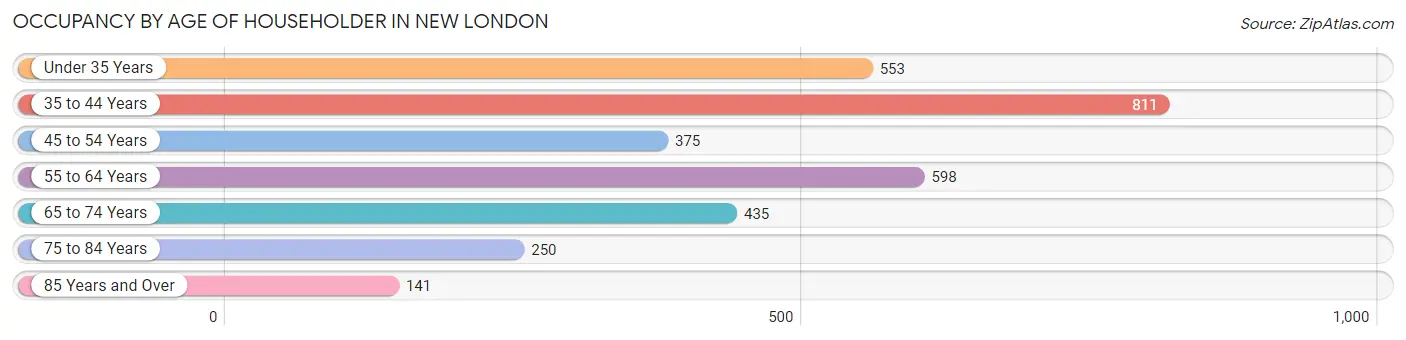
| Age Bracket | # Households | % Households |
| Under 35 Years | 553 | 17.5% |
| 35 to 44 Years | 811 | 25.6% |
| 45 to 54 Years | 375 | 11.9% |
| 55 to 64 Years | 598 | 18.9% |
| 65 to 74 Years | 435 | 13.8% |
| 75 to 84 Years | 250 | 7.9% |
| 85 Years and Over | 141 | 4.5% |
| Total | 3,163 | 100.0% |
Housing Finances in New London
Median Income by Occupancy in New London
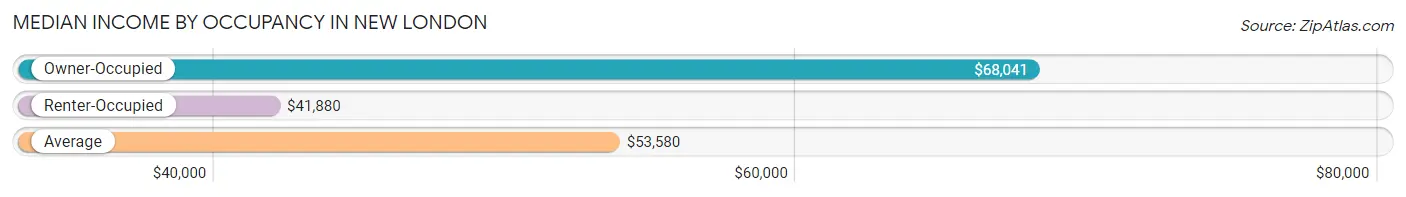
| Occupancy Type | # Households | Median Income |
| Owner-Occupied | 1,618 (51.1%) | $68,041 |
| Renter-Occupied | 1,545 (48.8%) | $41,880 |
| Average | 3,163 (100.0%) | $53,580 |
Occupancy by Householder Income Bracket in New London
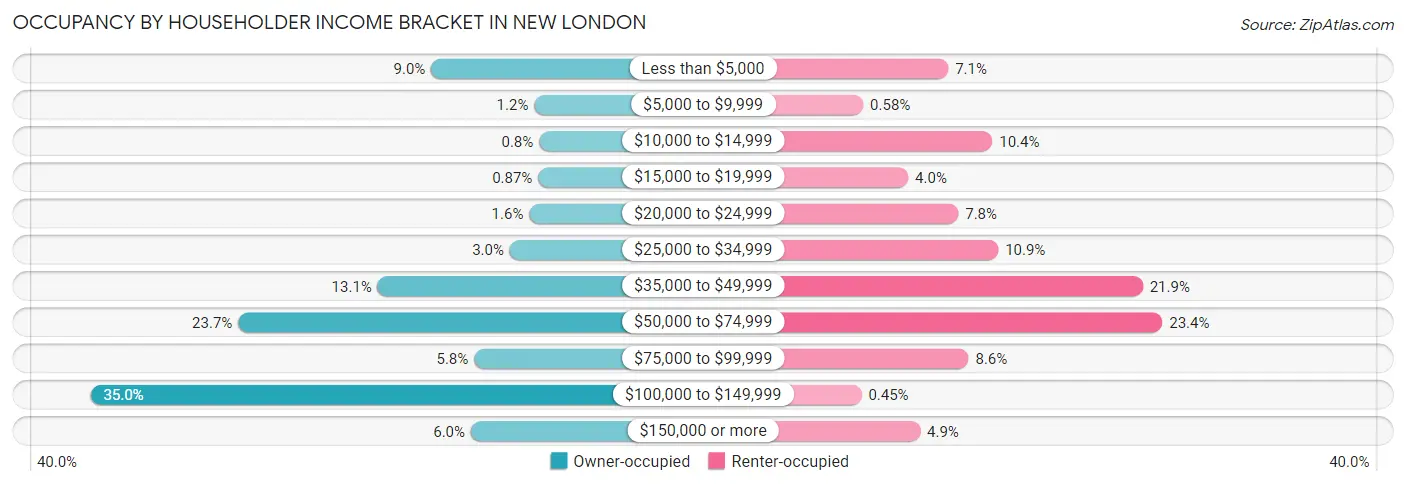
| Income Bracket | Owner-occupied | Renter-occupied |
| Less than $5,000 | 146 (9.0%) | 109 (7.1%) |
| $5,000 to $9,999 | 19 (1.2%) | 9 (0.6%) |
| $10,000 to $14,999 | 13 (0.8%) | 161 (10.4%) |
| $15,000 to $19,999 | 14 (0.9%) | 62 (4.0%) |
| $20,000 to $24,999 | 25 (1.5%) | 121 (7.8%) |
| $25,000 to $34,999 | 49 (3.0%) | 168 (10.9%) |
| $35,000 to $49,999 | 212 (13.1%) | 338 (21.9%) |
| $50,000 to $74,999 | 384 (23.7%) | 361 (23.4%) |
| $75,000 to $99,999 | 93 (5.8%) | 133 (8.6%) |
| $100,000 to $149,999 | 566 (35.0%) | 7 (0.4%) |
| $150,000 or more | 97 (6.0%) | 76 (4.9%) |
| Total | 1,618 (100.0%) | 1,545 (100.0%) |
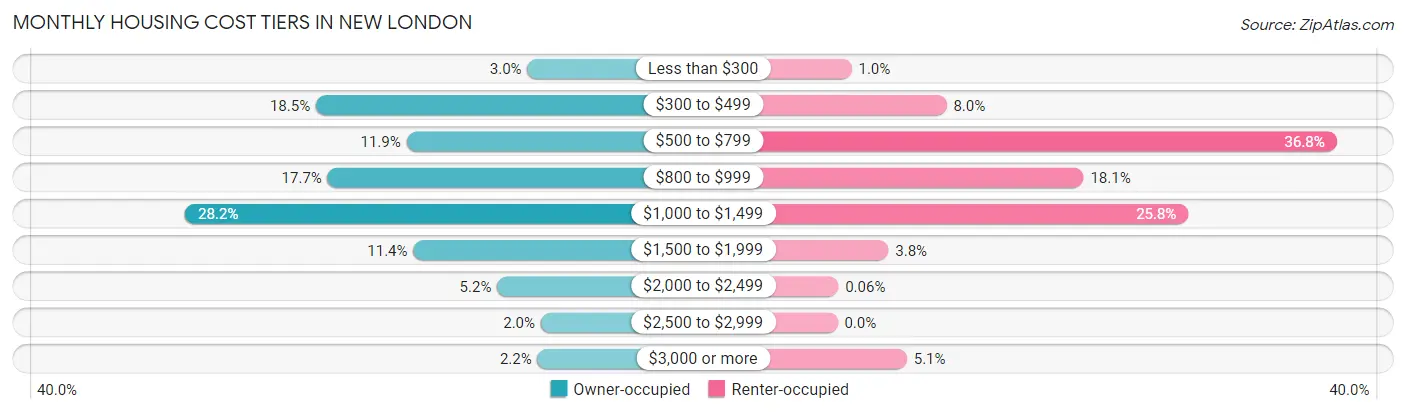
Monthly Housing Cost Tiers in New London
| Monthly Cost | Owner-occupied | Renter-occupied |
| Less than $300 | 48 (3.0%) | 16 (1.0%) |
| $300 to $499 | 300 (18.5%) | 124 (8.0%) |
| $500 to $799 | 192 (11.9%) | 568 (36.8%) |
| $800 to $999 | 286 (17.7%) | 280 (18.1%) |
| $1,000 to $1,499 | 456 (28.2%) | 399 (25.8%) |
| $1,500 to $1,999 | 184 (11.4%) | 58 (3.7%) |
| $2,000 to $2,499 | 84 (5.2%) | 1 (0.1%) |
| $2,500 to $2,999 | 32 (2.0%) | 0 (0.0%) |
| $3,000 or more | 36 (2.2%) | 79 (5.1%) |
| Total | 1,618 (100.0%) | 1,545 (100.0%) |
Physical Housing Characteristics in New London
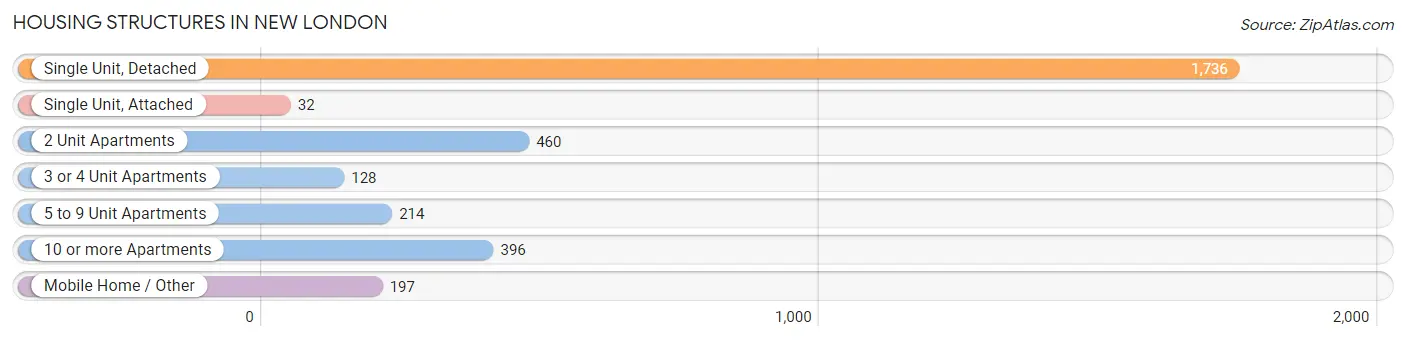
Housing Structures in New London
| Structure Type | # Housing Units | % Housing Units |
| Single Unit, Detached | 1,736 | 54.9% |
| Single Unit, Attached | 32 | 1.0% |
| 2 Unit Apartments | 460 | 14.5% |
| 3 or 4 Unit Apartments | 128 | 4.1% |
| 5 to 9 Unit Apartments | 214 | 6.8% |
| 10 or more Apartments | 396 | 12.5% |
| Mobile Home / Other | 197 | 6.2% |
| Total | 3,163 | 100.0% |
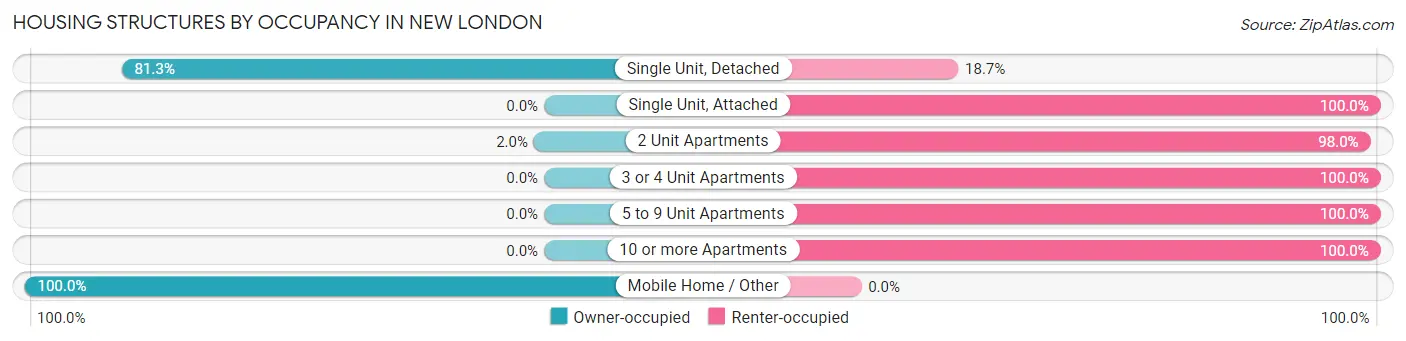
Housing Structures by Occupancy in New London
| Structure Type | Owner-occupied | Renter-occupied |
| Single Unit, Detached | 1,412 (81.3%) | 324 (18.7%) |
| Single Unit, Attached | 0 (0.0%) | 32 (100.0%) |
| 2 Unit Apartments | 9 (2.0%) | 451 (98.0%) |
| 3 or 4 Unit Apartments | 0 (0.0%) | 128 (100.0%) |
| 5 to 9 Unit Apartments | 0 (0.0%) | 214 (100.0%) |
| 10 or more Apartments | 0 (0.0%) | 396 (100.0%) |
| Mobile Home / Other | 197 (100.0%) | 0 (0.0%) |
| Total | 1,618 (51.1%) | 1,545 (48.8%) |
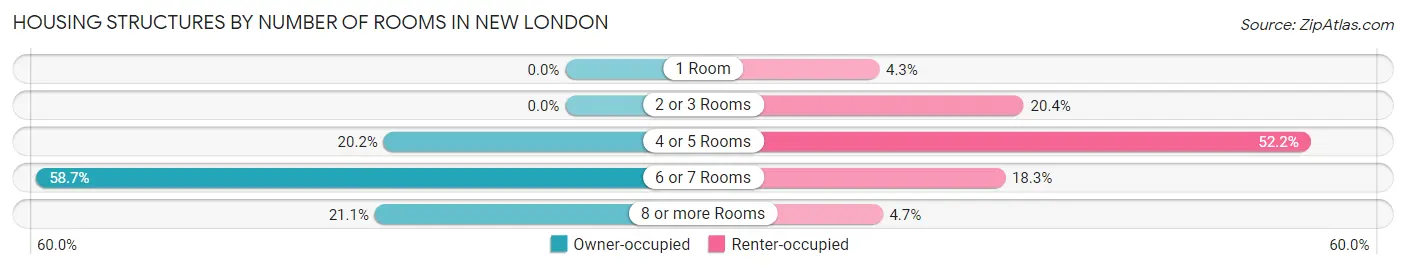
Housing Structures by Number of Rooms in New London
| Number of Rooms | Owner-occupied | Renter-occupied |
| 1 Room | 0 (0.0%) | 67 (4.3%) |
| 2 or 3 Rooms | 0 (0.0%) | 315 (20.4%) |
| 4 or 5 Rooms | 326 (20.2%) | 807 (52.2%) |
| 6 or 7 Rooms | 950 (58.7%) | 283 (18.3%) |
| 8 or more Rooms | 342 (21.1%) | 73 (4.7%) |
| Total | 1,618 (100.0%) | 1,545 (100.0%) |
Housing Structure by Heating Type in New London
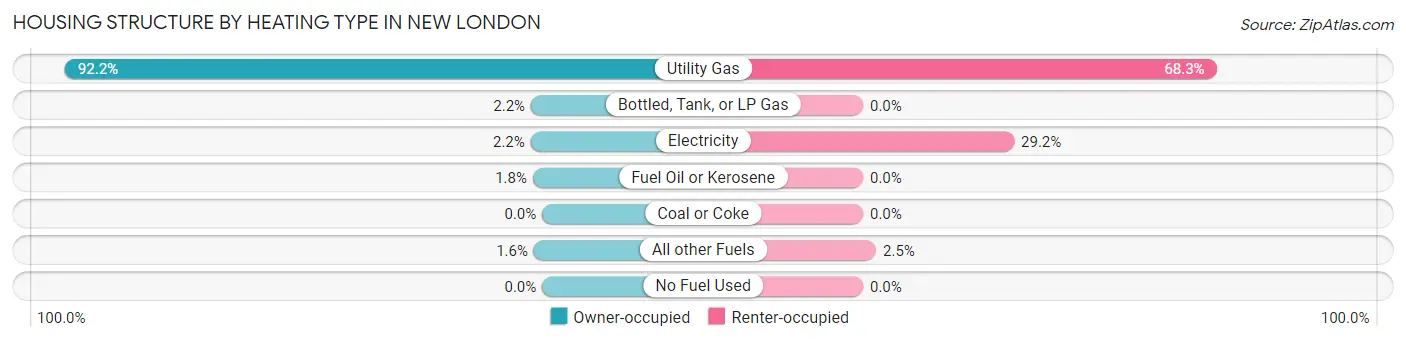
| Heating Type | Owner-occupied | Renter-occupied |
| Utility Gas | 1,492 (92.2%) | 1,055 (68.3%) |
| Bottled, Tank, or LP Gas | 35 (2.2%) | 0 (0.0%) |
| Electricity | 36 (2.2%) | 451 (29.2%) |
| Fuel Oil or Kerosene | 29 (1.8%) | 0 (0.0%) |
| Coal or Coke | 0 (0.0%) | 0 (0.0%) |
| All other Fuels | 26 (1.6%) | 39 (2.5%) |
| No Fuel Used | 0 (0.0%) | 0 (0.0%) |
| Total | 1,618 (100.0%) | 1,545 (100.0%) |
Household Vehicle Usage in New London
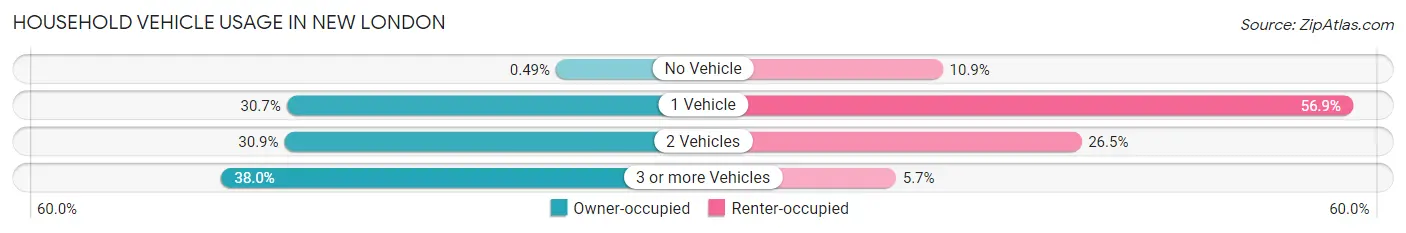
| Vehicles per Household | Owner-occupied | Renter-occupied |
| No Vehicle | 8 (0.5%) | 169 (10.9%) |
| 1 Vehicle | 496 (30.7%) | 879 (56.9%) |
| 2 Vehicles | 500 (30.9%) | 409 (26.5%) |
| 3 or more Vehicles | 614 (38.0%) | 88 (5.7%) |
| Total | 1,618 (100.0%) | 1,545 (100.0%) |
Real Estate & Mortgages in New London
Real Estate and Mortgage Overview in New London
| Characteristic | Without Mortgage | With Mortgage |
| Housing Units | 610 | 1,008 |
| Median Property Value | $108,300 | $173,700 |
| Median Household Income | $41,145 | $80 |
| Monthly Housing Costs | $483 | $36 |
| Real Estate Taxes | $2,559 | $0 |
Property Value by Mortgage Status in New London
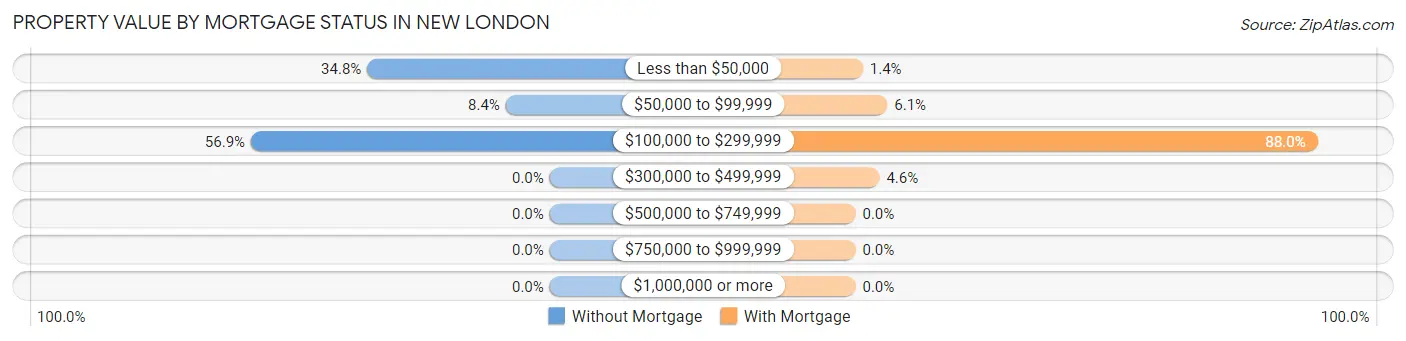
| Property Value | Without Mortgage | With Mortgage |
| Less than $50,000 | 212 (34.7%) | 14 (1.4%) |
| $50,000 to $99,999 | 51 (8.4%) | 61 (6.0%) |
| $100,000 to $299,999 | 347 (56.9%) | 887 (88.0%) |
| $300,000 to $499,999 | 0 (0.0%) | 46 (4.6%) |
| $500,000 to $749,999 | 0 (0.0%) | 0 (0.0%) |
| $750,000 to $999,999 | 0 (0.0%) | 0 (0.0%) |
| $1,000,000 or more | 0 (0.0%) | 0 (0.0%) |
| Total | 610 (100.0%) | 1,008 (100.0%) |
Household Income by Mortgage Status in New London
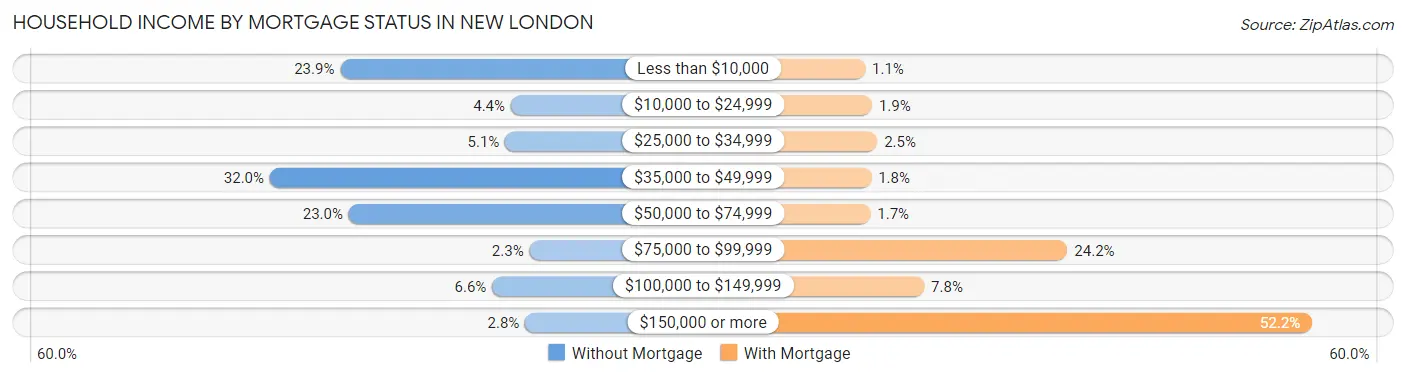
| Household Income | Without Mortgage | With Mortgage |
| Less than $10,000 | 146 (23.9%) | 11 (1.1%) |
| $10,000 to $24,999 | 27 (4.4%) | 19 (1.9%) |
| $25,000 to $34,999 | 31 (5.1%) | 25 (2.5%) |
| $35,000 to $49,999 | 195 (32.0%) | 18 (1.8%) |
| $50,000 to $74,999 | 140 (23.0%) | 17 (1.7%) |
| $75,000 to $99,999 | 14 (2.3%) | 244 (24.2%) |
| $100,000 to $149,999 | 40 (6.6%) | 79 (7.8%) |
| $150,000 or more | 17 (2.8%) | 526 (52.2%) |
| Total | 610 (100.0%) | 1,008 (100.0%) |
Property Value to Household Income Ratio in New London
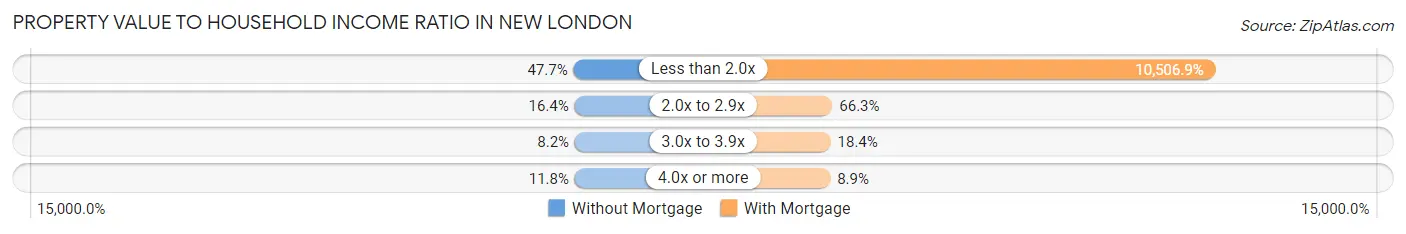
| Value-to-Income Ratio | Without Mortgage | With Mortgage |
| Less than 2.0x | 291 (47.7%) | 105,909 (10,506.9%) |
| 2.0x to 2.9x | 100 (16.4%) | 668 (66.3%) |
| 3.0x to 3.9x | 50 (8.2%) | 185 (18.3%) |
| 4.0x or more | 72 (11.8%) | 90 (8.9%) |
| Total | 610 (100.0%) | 1,008 (100.0%) |
Real Estate Taxes by Mortgage Status in New London
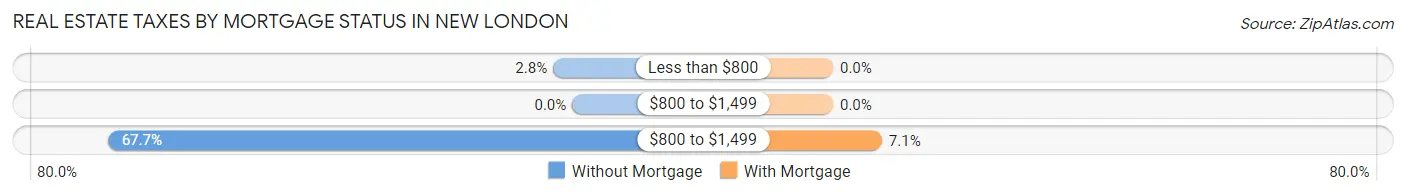
| Property Taxes | Without Mortgage | With Mortgage |
| Less than $800 | 17 (2.8%) | 0 (0.0%) |
| $800 to $1,499 | 0 (0.0%) | 0 (0.0%) |
| $800 to $1,499 | 413 (67.7%) | 72 (7.1%) |
| Total | 610 (100.0%) | 1,008 (100.0%) |
Health & Disability in New London
Health Insurance Coverage by Age in New London
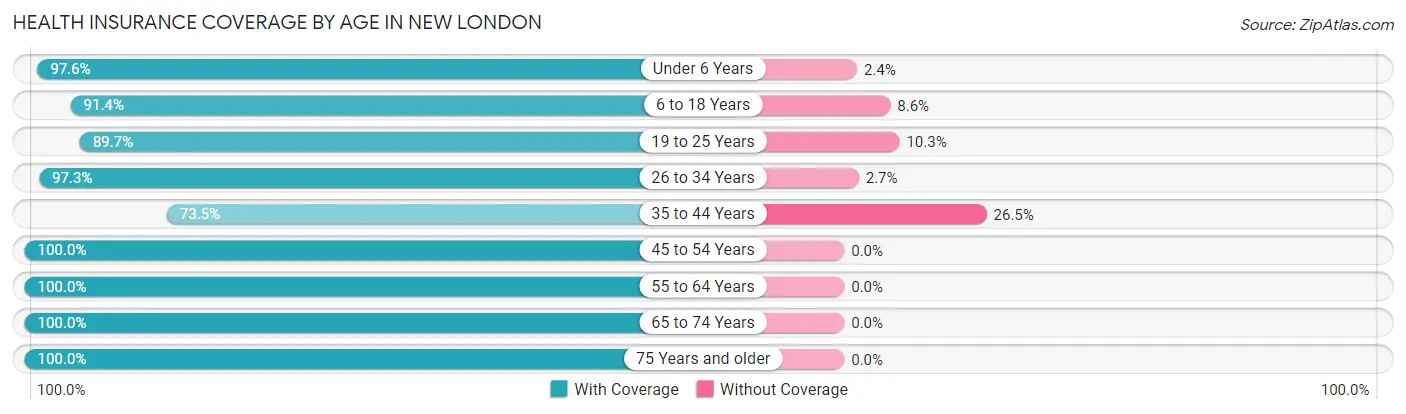
| Age Bracket | With Coverage | Without Coverage |
| Under 6 Years | 495 (97.6%) | 12 (2.4%) |
| 6 to 18 Years | 1,480 (91.4%) | 139 (8.6%) |
| 19 to 25 Years | 471 (89.7%) | 54 (10.3%) |
| 26 to 34 Years | 758 (97.3%) | 21 (2.7%) |
| 35 to 44 Years | 836 (73.5%) | 302 (26.5%) |
| 45 to 54 Years | 663 (100.0%) | 0 (0.0%) |
| 55 to 64 Years | 947 (100.0%) | 0 (0.0%) |
| 65 to 74 Years | 557 (100.0%) | 0 (0.0%) |
| 75 Years and older | 530 (100.0%) | 0 (0.0%) |
| Total | 6,737 (92.7%) | 528 (7.3%) |
Health Insurance Coverage by Citizenship Status in New London
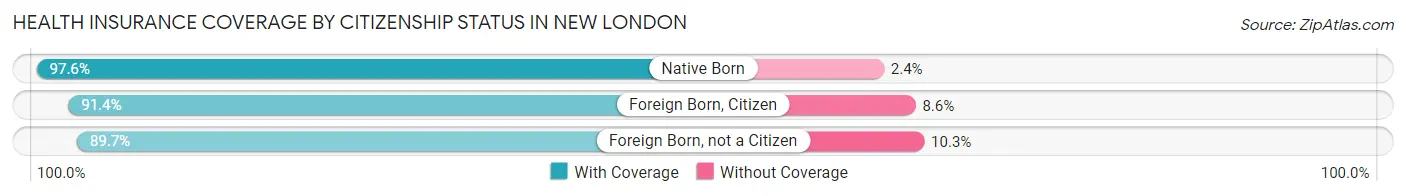
| Citizenship Status | With Coverage | Without Coverage |
| Native Born | 495 (97.6%) | 12 (2.4%) |
| Foreign Born, Citizen | 1,480 (91.4%) | 139 (8.6%) |
| Foreign Born, not a Citizen | 471 (89.7%) | 54 (10.3%) |
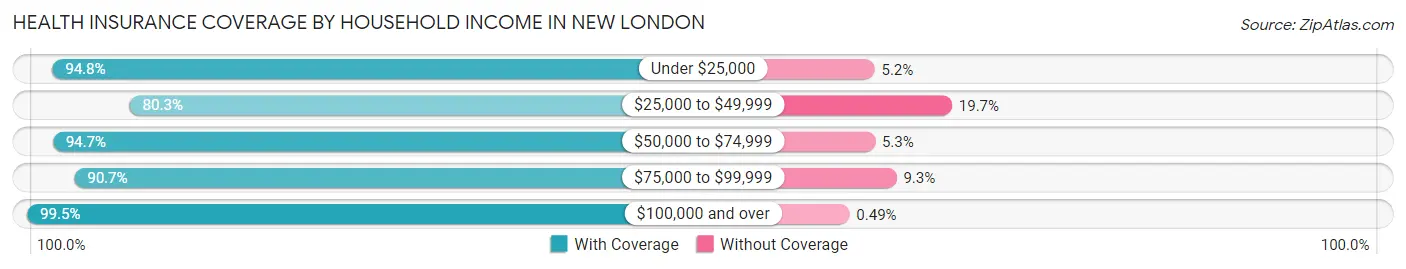
Health Insurance Coverage by Household Income in New London
| Household Income | With Coverage | Without Coverage |
| Under $25,000 | 875 (94.8%) | 48 (5.2%) |
| $25,000 to $49,999 | 1,224 (80.3%) | 300 (19.7%) |
| $50,000 to $74,999 | 1,617 (94.7%) | 90 (5.3%) |
| $75,000 to $99,999 | 770 (90.7%) | 79 (9.3%) |
| $100,000 and over | 2,213 (99.5%) | 11 (0.5%) |
Public vs Private Health Insurance Coverage by Age in New London
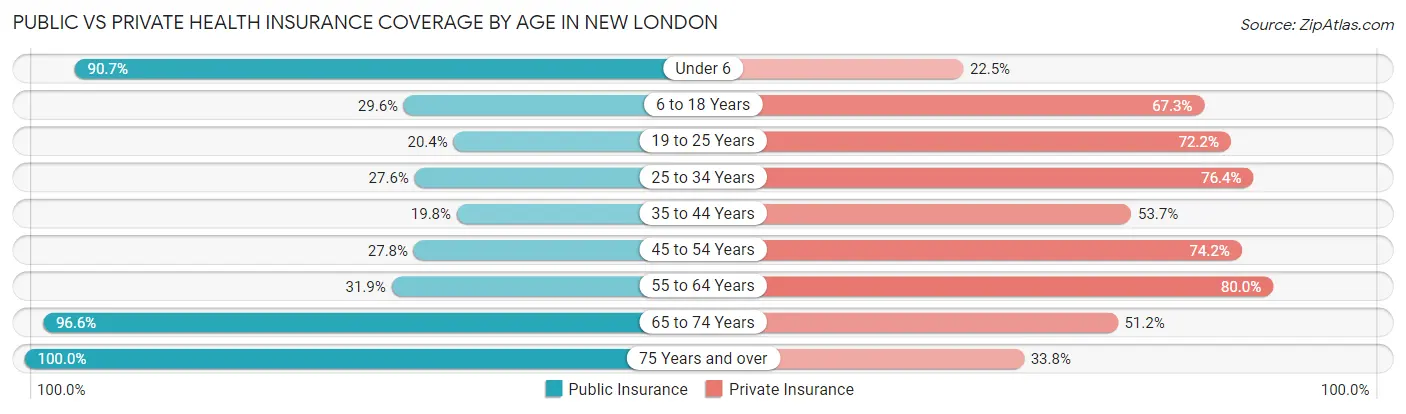
| Age Bracket | Public Insurance | Private Insurance |
| Under 6 | 460 (90.7%) | 114 (22.5%) |
| 6 to 18 Years | 479 (29.6%) | 1,089 (67.3%) |
| 19 to 25 Years | 107 (20.4%) | 379 (72.2%) |
| 25 to 34 Years | 215 (27.6%) | 595 (76.4%) |
| 35 to 44 Years | 225 (19.8%) | 611 (53.7%) |
| 45 to 54 Years | 184 (27.8%) | 492 (74.2%) |
| 55 to 64 Years | 302 (31.9%) | 758 (80.0%) |
| 65 to 74 Years | 538 (96.6%) | 285 (51.2%) |
| 75 Years and over | 530 (100.0%) | 179 (33.8%) |
| Total | 3,040 (41.8%) | 4,502 (62.0%) |
Disability Status by Sex by Age in New London
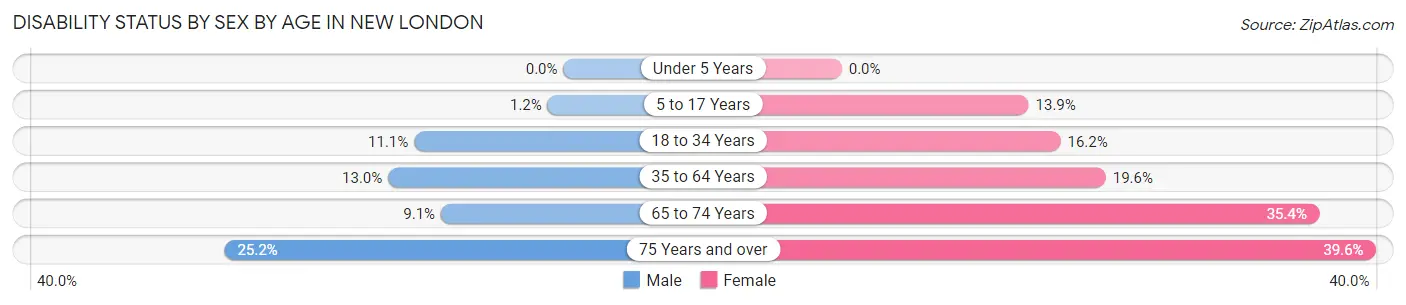
| Age Bracket | Male | Female |
| Under 5 Years | 0 (0.0%) | 0 (0.0%) |
| 5 to 17 Years | 10 (1.2%) | 114 (13.9%) |
| 18 to 34 Years | 75 (11.1%) | 107 (16.2%) |
| 35 to 64 Years | 169 (13.0%) | 284 (19.6%) |
| 65 to 74 Years | 17 (9.1%) | 131 (35.4%) |
| 75 Years and over | 40 (25.2%) | 147 (39.6%) |
Disability Class by Sex by Age in New London
Disability Class: Hearing Difficulty
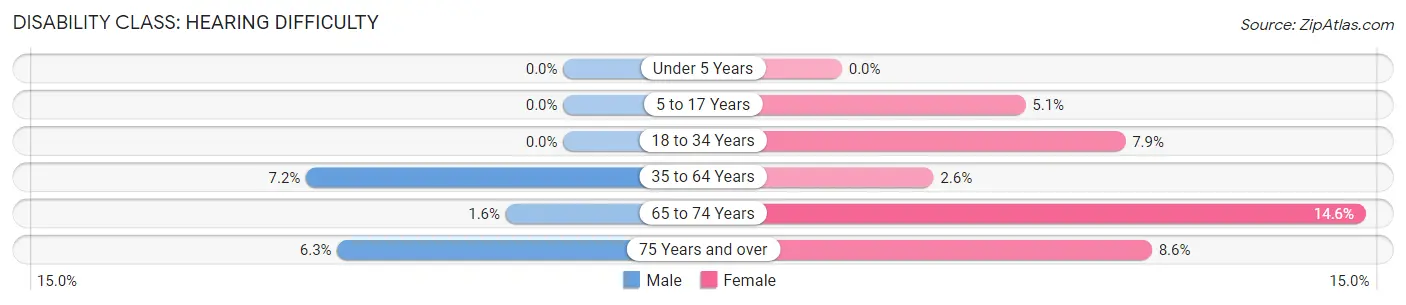
| Age Bracket | Male | Female |
| Under 5 Years | 0 (0.0%) | 0 (0.0%) |
| 5 to 17 Years | 0 (0.0%) | 42 (5.1%) |
| 18 to 34 Years | 0 (0.0%) | 52 (7.9%) |
| 35 to 64 Years | 93 (7.2%) | 37 (2.5%) |
| 65 to 74 Years | 3 (1.6%) | 54 (14.6%) |
| 75 Years and over | 10 (6.3%) | 32 (8.6%) |
Disability Class: Vision Difficulty
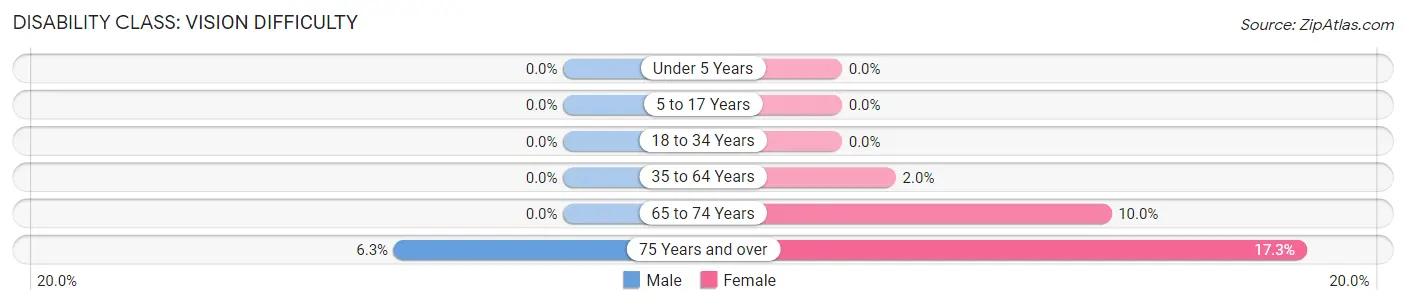
| Age Bracket | Male | Female |
| Under 5 Years | 0 (0.0%) | 0 (0.0%) |
| 5 to 17 Years | 0 (0.0%) | 0 (0.0%) |
| 18 to 34 Years | 0 (0.0%) | 0 (0.0%) |
| 35 to 64 Years | 0 (0.0%) | 29 (2.0%) |
| 65 to 74 Years | 0 (0.0%) | 37 (10.0%) |
| 75 Years and over | 10 (6.3%) | 64 (17.2%) |
Disability Class: Cognitive Difficulty
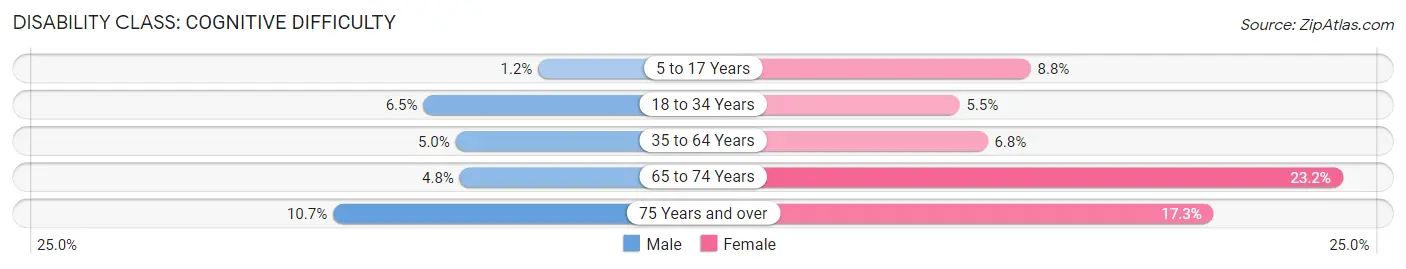
| Age Bracket | Male | Female |
| 5 to 17 Years | 10 (1.2%) | 72 (8.8%) |
| 18 to 34 Years | 44 (6.5%) | 36 (5.5%) |
| 35 to 64 Years | 65 (5.0%) | 98 (6.8%) |
| 65 to 74 Years | 9 (4.8%) | 86 (23.2%) |
| 75 Years and over | 17 (10.7%) | 64 (17.2%) |
Disability Class: Ambulatory Difficulty
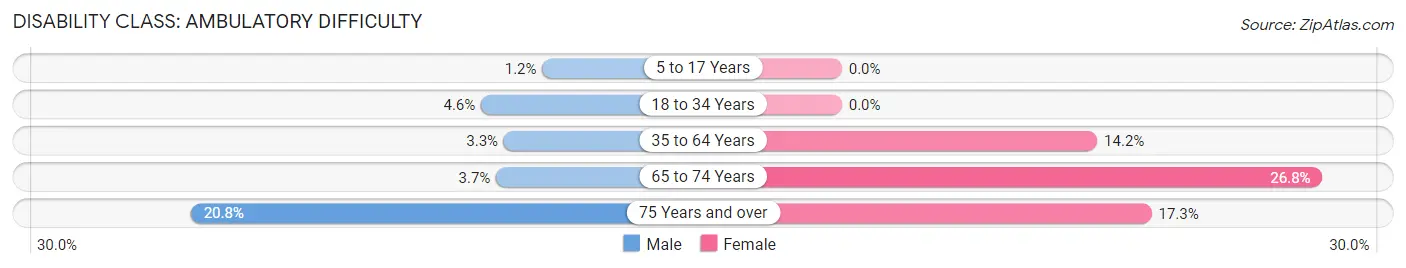
| Age Bracket | Male | Female |
| 5 to 17 Years | 10 (1.2%) | 0 (0.0%) |
| 18 to 34 Years | 31 (4.6%) | 0 (0.0%) |
| 35 to 64 Years | 43 (3.3%) | 206 (14.2%) |
| 65 to 74 Years | 7 (3.7%) | 99 (26.8%) |
| 75 Years and over | 33 (20.7%) | 64 (17.2%) |
Disability Class: Self-Care Difficulty
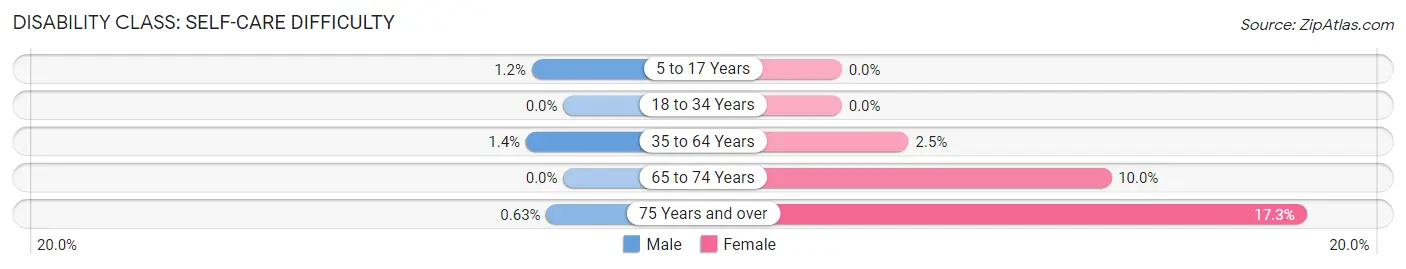
| Age Bracket | Male | Female |
| 5 to 17 Years | 10 (1.2%) | 0 (0.0%) |
| 18 to 34 Years | 0 (0.0%) | 0 (0.0%) |
| 35 to 64 Years | 18 (1.4%) | 36 (2.5%) |
| 65 to 74 Years | 0 (0.0%) | 37 (10.0%) |
| 75 Years and over | 1 (0.6%) | 64 (17.2%) |
Technology Access in New London
Computing Device Access in New London
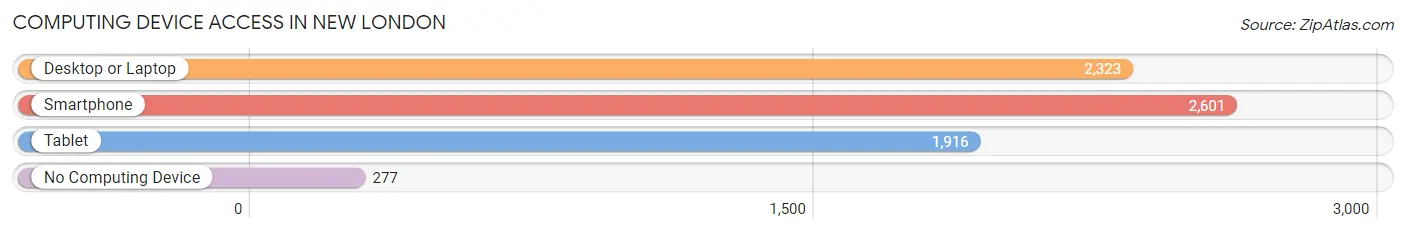
| Device Type | # Households | % Households |
| Desktop or Laptop | 2,323 | 73.4% |
| Smartphone | 2,601 | 82.2% |
| Tablet | 1,916 | 60.6% |
| No Computing Device | 277 | 8.8% |
| Total | 3,163 | 100.0% |
Internet Access in New London
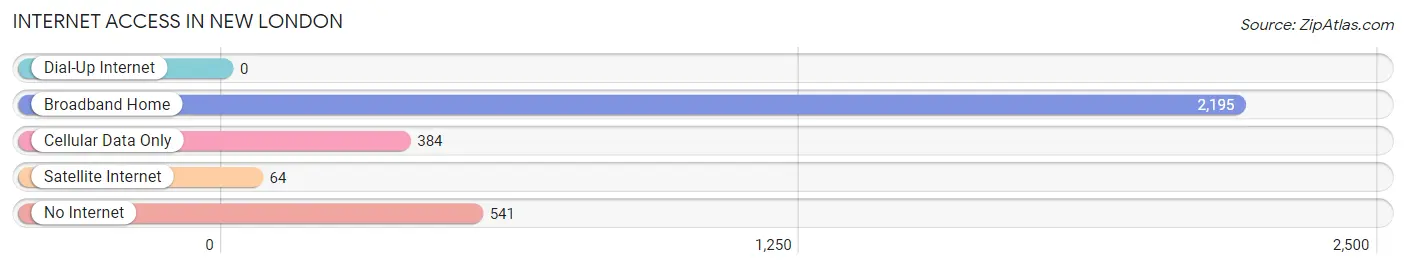
| Internet Type | # Households | % Households |
| Dial-Up Internet | 0 | 0.0% |
| Broadband Home | 2,195 | 69.4% |
| Cellular Data Only | 384 | 12.1% |
| Satellite Internet | 64 | 2.0% |
| No Internet | 541 | 17.1% |
| Total | 3,163 | 100.0% |
New London Summary
New London, Wisconsin is a city located in Waupaca County, Wisconsin, United States. The population was 7,295 at the 2010 census. It is the county seat of Waupaca County.
History
New London was founded in 1851 by a group of settlers from New England. The city was named after the city of London, England. The first settlers were attracted to the area by the abundance of timber and the potential for farming. The first post office was established in 1853 and the first school was built in 1854.
In 1856, the first newspaper, the New London Times, was established. The first railroad line was built in 1871, connecting New London to the rest of the state. The city was incorporated in 1875.
In the late 19th century, New London was a major center for the lumber industry. The city was home to several sawmills and lumber yards. The city also had a thriving brick-making industry.
Geography
New London is located at 44°25′N 88°45′W (44.4133, -88.7500). According to the United States Census Bureau, the city has a total area of 5.45 square miles (14.12 km2), of which, 5.44 square miles (14.09 km2) is land and 0.01 square miles (0.03 km2) is water.
Economy
New London’s economy is largely based on agriculture and manufacturing. The city is home to several large employers, including the New London Plastics Company, the New London Foundry, and the New London Paper Company. The city also has a thriving retail sector, with several large stores and restaurants.
Demographics
As of the census of 2010, there were 7,295 people, 2,945 households, and 1,845 families residing in the city. The population density was 1,339.2 people per square mile (517.7/km2). There were 3,093 housing units at an average density of 567.2 per square mile (219.3/km2). The racial makeup of the city was 95.2% White, 0.7% African American, 0.4% Native American, 0.7% Asian, 0.1% Pacific Islander, 1.7% from other races, and 1.2% from two or more races. Hispanic or Latino of any race were 4.2% of the population.
There were 2,945 households, out of which 30.2% had children under the age of 18 living with them, 46.2% were married couples living together, 11.7% had a female householder with no husband present, and 37.2% were non-families. 32.2% of all households were made up of individuals, and 14.2% had someone living alone who was 65 years of age or older. The average household size was 2.37 and the average family size was 2.97.
In the city, the population was spread out, with 24.2% under the age of 18, 8.2% from 18 to 24, 28.2% from 25 to 44, 21.7% from 45 to 64, and 17.7% who were 65 years of age or older. The median age was 38 years. For every 100 females, there were 92.2 males. For every 100 females age 18 and over, there were 88.7 males.
The median income for a household in the city was $37,917, and the median income for a family was $45,938. Males had a median income of $32,917 versus $22,917 for females. The per capita income for the city was $18,917. About 6.2% of families and 8.7% of the population were below the poverty line, including 10.2% of those under age 18 and 8.2% of those age 65 or over.
Common Questions
What is Per Capita Income in New London?
Per Capita income in New London is $28,076.
What is the Median Family Income in New London?
Median Family Income in New London is $60,617.
What is the Median Household income in New London?
Median Household Income in New London is $53,580.
What is Income or Wage Gap in New London?
Income or Wage Gap in New London is 45.1%.
Women in New London earn 54.9 cents for every dollar earned by a man.
What is Inequality or Gini Index in New London?
Inequality or Gini Index in New London is 0.41.
What is the Total Population of New London?
Total Population of New London is 7,342.
What is the Total Male Population of New London?
Total Male Population of New London is 3,480.
What is the Total Female Population of New London?
Total Female Population of New London is 3,862.
What is the Ratio of Males per 100 Females in New London?
There are 90.11 Males per 100 Females in New London.
What is the Ratio of Females per 100 Males in New London?
There are 110.98 Females per 100 Males in New London.
What is the Median Population Age in New London?
Median Population Age in New London is 36.5 Years.
What is the Average Family Size in New London
Average Family Size in New London is 3.0 People.
What is the Average Household Size in New London
Average Household Size in New London is 2.3 People.
How Large is the Labor Force in New London?
There are 3,498 People in the Labor Forcein in New London.
What is the Percentage of People in the Labor Force in New London?
62.8% of People are in the Labor Force in New London.
What is the Unemployment Rate in New London?
Unemployment Rate in New London is 1.0%.