Neopit, WI Map & Demographics
Neopit Map
Neopit Overview
$15,424
PER CAPITA INCOME
$61,250
AVG FAMILY INCOME
$53,281
AVG HOUSEHOLD INCOME
0.43
INEQUALITY / GINI INDEX
685
TOTAL POPULATION
318
MALE POPULATION
367
FEMALE POPULATION
86.65
MALES / 100 FEMALES
115.41
FEMALES / 100 MALES
26.3
MEDIAN AGE
4.1
AVG FAMILY SIZE
3.5
AVG HOUSEHOLD SIZE
216
LABOR FORCE [ PEOPLE ]
48.2%
PERCENT IN LABOR FORCE
8.8%
UNEMPLOYMENT RATE
Neopit Zip Codes
Neopit Area Codes
Income in Neopit
Income Overview in Neopit
Per Capita Income in Neopit is $15,424, while median incomes of families and households are $61,250 and $53,281 respectively.
| Characteristic | Number | Measure |
| Per Capita Income | 685 | $15,424 |
| Median Family Income | 148 | $61,250 |
| Mean Family Income | 148 | $85,333 |
| Median Household Income | 185 | $53,281 |
| Mean Household Income | 185 | $74,916 |
| Income Deficit | 148 | $0 |
| Wage / Income Gap (%) | 685 | 0.00% |
| Wage / Income Gap ($) | 685 | 100.00¢ per $1 |
| Gini / Inequality Index | 685 | 0.43 |
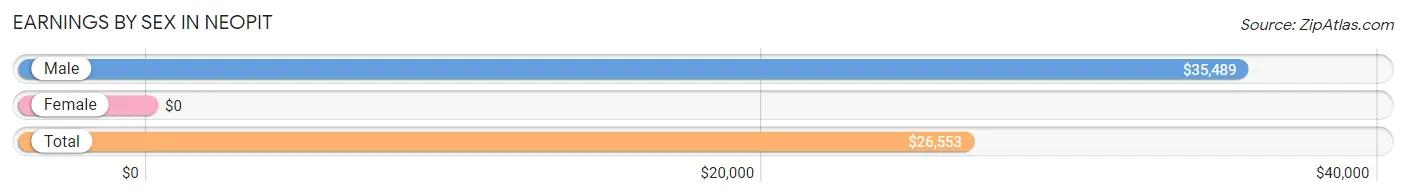
Earnings by Sex in Neopit
| Sex | Number | Average Earnings |
| Male | 103 (41.7%) | $35,489 |
| Female | 144 (58.3%) | $0 |
| Total | 247 (100.0%) | $26,553 |
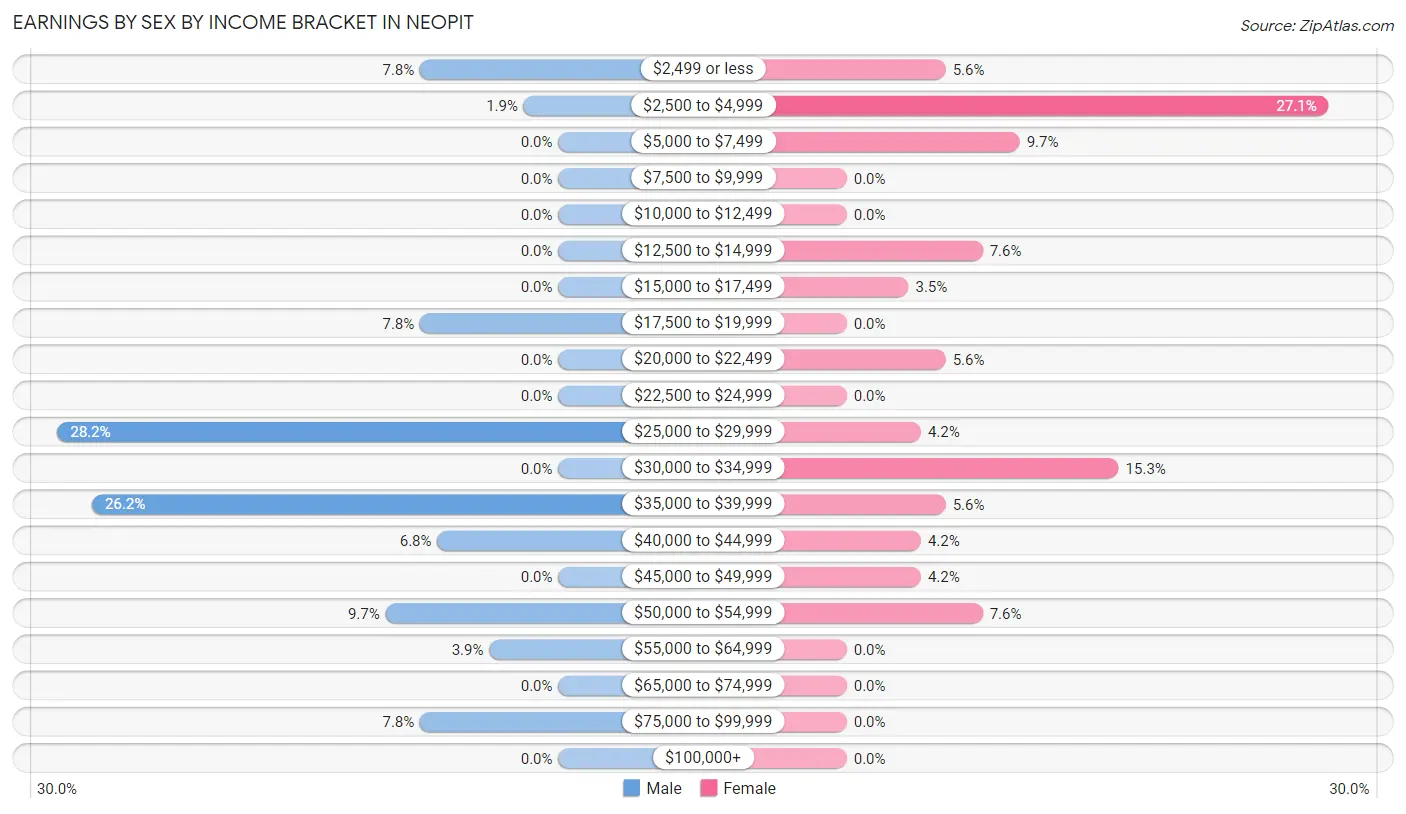
Earnings by Sex by Income Bracket in Neopit
The most common earnings brackets in Neopit are $25,000 to $29,999 for men (29 | 28.2%) and $2,500 to $4,999 for women (39 | 27.1%).
| Income | Male | Female |
| $2,499 or less | 8 (7.8%) | 8 (5.6%) |
| $2,500 to $4,999 | 2 (1.9%) | 39 (27.1%) |
| $5,000 to $7,499 | 0 (0.0%) | 14 (9.7%) |
| $7,500 to $9,999 | 0 (0.0%) | 0 (0.0%) |
| $10,000 to $12,499 | 0 (0.0%) | 0 (0.0%) |
| $12,500 to $14,999 | 0 (0.0%) | 11 (7.6%) |
| $15,000 to $17,499 | 0 (0.0%) | 5 (3.5%) |
| $17,500 to $19,999 | 8 (7.8%) | 0 (0.0%) |
| $20,000 to $22,499 | 0 (0.0%) | 8 (5.6%) |
| $22,500 to $24,999 | 0 (0.0%) | 0 (0.0%) |
| $25,000 to $29,999 | 29 (28.2%) | 6 (4.2%) |
| $30,000 to $34,999 | 0 (0.0%) | 22 (15.3%) |
| $35,000 to $39,999 | 27 (26.2%) | 8 (5.6%) |
| $40,000 to $44,999 | 7 (6.8%) | 6 (4.2%) |
| $45,000 to $49,999 | 0 (0.0%) | 6 (4.2%) |
| $50,000 to $54,999 | 10 (9.7%) | 11 (7.6%) |
| $55,000 to $64,999 | 4 (3.9%) | 0 (0.0%) |
| $65,000 to $74,999 | 0 (0.0%) | 0 (0.0%) |
| $75,000 to $99,999 | 8 (7.8%) | 0 (0.0%) |
| $100,000+ | 0 (0.0%) | 0 (0.0%) |
| Total | 103 (100.0%) | 144 (100.0%) |
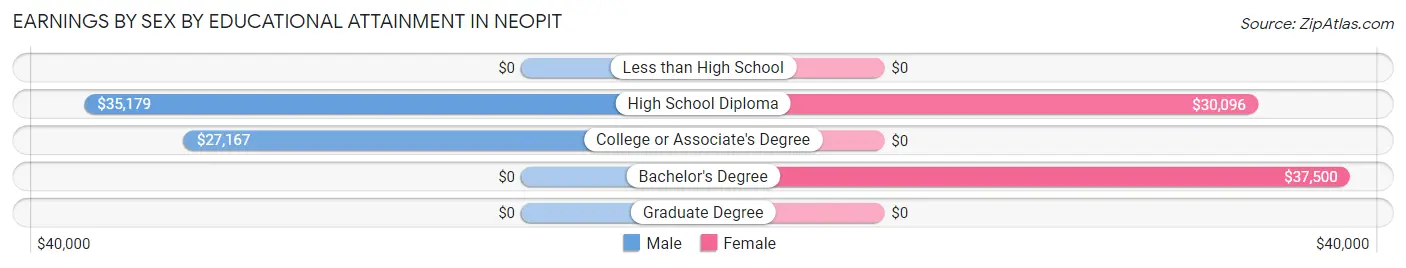
Earnings by Sex by Educational Attainment in Neopit
Average earnings in Neopit are $35,156 for men and $26,875 for women, a difference of 23.6%. Men with an educational attainment of high school diploma enjoy the highest average annual earnings of $35,179, while those with college or associate's degree education earn the least with $27,167. Women with an educational attainment of bachelor's degree earn the most with the average annual earnings of $37,500, while those with high school diploma education have the smallest earnings of $30,096.
| Educational Attainment | Male Income | Female Income |
| Less than High School | - | - |
| High School Diploma | $35,179 | $30,096 |
| College or Associate's Degree | $27,167 | $0 |
| Bachelor's Degree | - | - |
| Graduate Degree | - | - |
| Total | $35,156 | $26,875 |
Family Income in Neopit
Family Income Brackets in Neopit
According to the Neopit family income data, there are 38 families falling into the $150,000 to $199,999 income range, which is the most common income bracket and makes up 25.7% of all families.
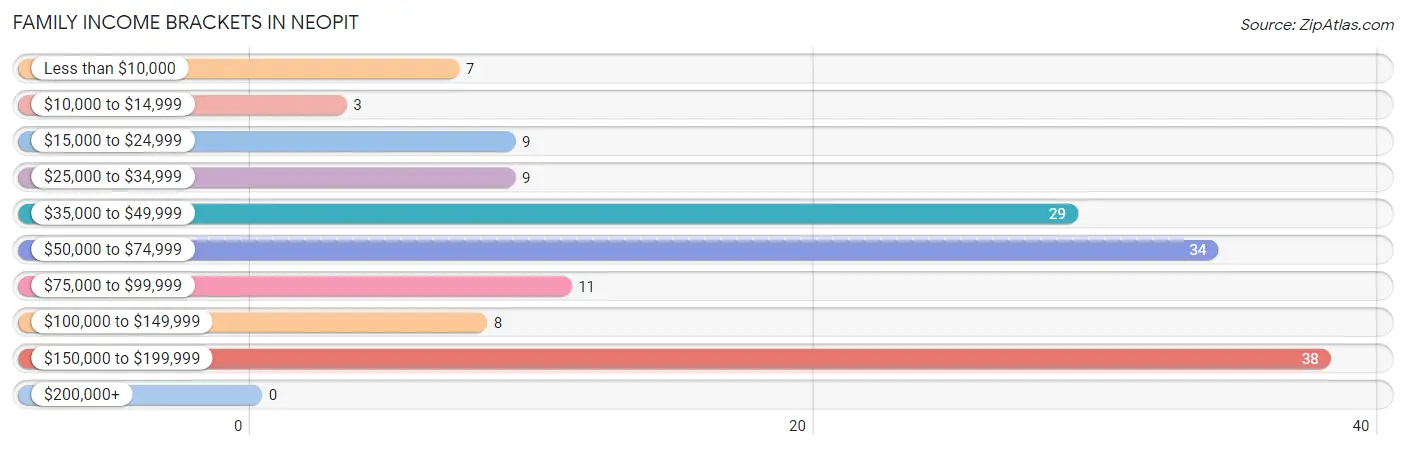
| Income Bracket | # Families | % Families |
| Less than $10,000 | 7 | 4.7% |
| $10,000 to $14,999 | 3 | 2.0% |
| $15,000 to $24,999 | 9 | 6.1% |
| $25,000 to $34,999 | 9 | 6.1% |
| $35,000 to $49,999 | 29 | 19.6% |
| $50,000 to $74,999 | 34 | 23.0% |
| $75,000 to $99,999 | 11 | 7.4% |
| $100,000 to $149,999 | 8 | 5.4% |
| $150,000 to $199,999 | 38 | 25.7% |
| $200,000+ | 0 | 0.0% |
Family Income by Famaliy Size in Neopit
2-person families (36 | 24.3%) account for the highest median family income in Neopit with $85,357 per family, while 2-person families (36 | 24.3%) have the highest median income of $42,678 per family member.
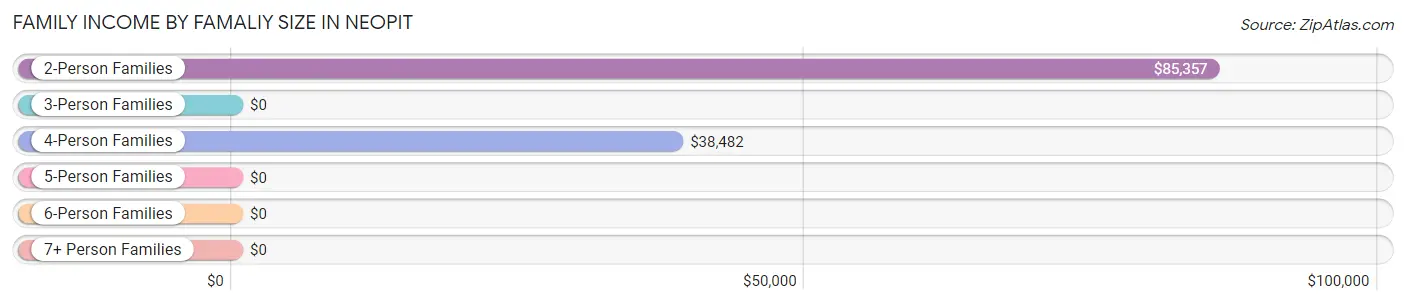
| Income Bracket | # Families | Median Income |
| 2-Person Families | 36 (24.3%) | $85,357 |
| 3-Person Families | 15 (10.1%) | $0 |
| 4-Person Families | 25 (16.9%) | $38,482 |
| 5-Person Families | 26 (17.6%) | $0 |
| 6-Person Families | 16 (10.8%) | $0 |
| 7+ Person Families | 30 (20.3%) | $0 |
| Total | 148 (100.0%) | $61,250 |
Family Income by Number of Earners in Neopit
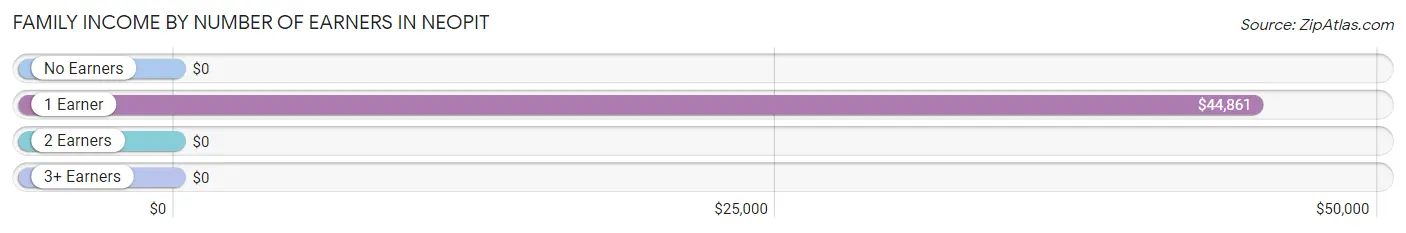
| Number of Earners | # Families | Median Income |
| No Earners | 18 (12.2%) | $0 |
| 1 Earner | 45 (30.4%) | $44,861 |
| 2 Earners | 73 (49.3%) | $0 |
| 3+ Earners | 12 (8.1%) | $0 |
| Total | 148 (100.0%) | $61,250 |
Household Income in Neopit
Household Income Brackets in Neopit
With 38 households falling in the category, the $150,000 to $199,999 income range is the most frequent in Neopit, accounting for 20.5% of all households.
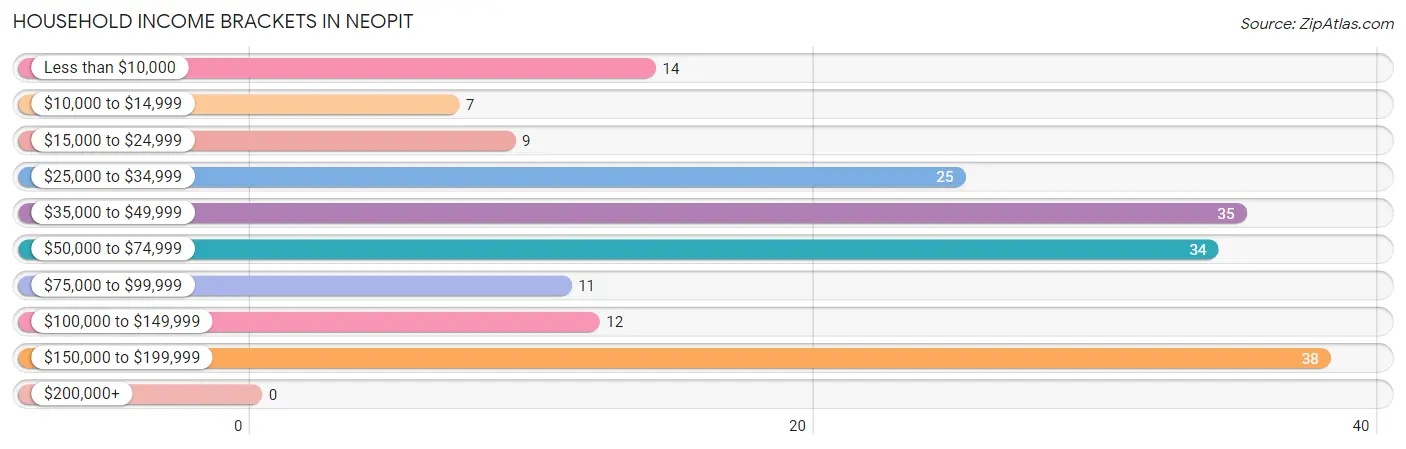
| Income Bracket | # Households | % Households |
| Less than $10,000 | 14 | 7.6% |
| $10,000 to $14,999 | 7 | 3.8% |
| $15,000 to $24,999 | 9 | 4.9% |
| $25,000 to $34,999 | 25 | 13.5% |
| $35,000 to $49,999 | 35 | 18.9% |
| $50,000 to $74,999 | 34 | 18.4% |
| $75,000 to $99,999 | 11 | 5.9% |
| $100,000 to $149,999 | 12 | 6.5% |
| $150,000 to $199,999 | 38 | 20.5% |
| $200,000+ | 0 | 0.0% |
Household Income by Householder Age in Neopit
The median household income in Neopit is $53,281, with the highest median household income of $43,750 found in the 65+ years age bracket for the primary householder. A total of 33 households (17.8%) fall into this category.
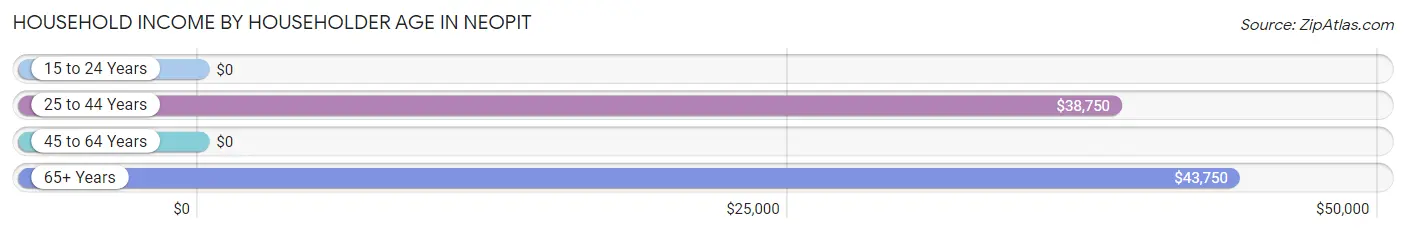
| Income Bracket | # Households | Median Income |
| 15 to 24 Years | 0 (0.0%) | $0 |
| 25 to 44 Years | 46 (24.9%) | $38,750 |
| 45 to 64 Years | 106 (57.3%) | $0 |
| 65+ Years | 33 (17.8%) | $43,750 |
| Total | 185 (100.0%) | $53,281 |
Poverty in Neopit
Income Below Poverty by Sex and Age in Neopit
With 14.2% poverty level for males and 19.6% for females among the residents of Neopit, 5 year old males and under 5 year old females are the most vulnerable to poverty, with 9 males (100.0%) and 27 females (51.9%) in their respective age groups living below the poverty level.
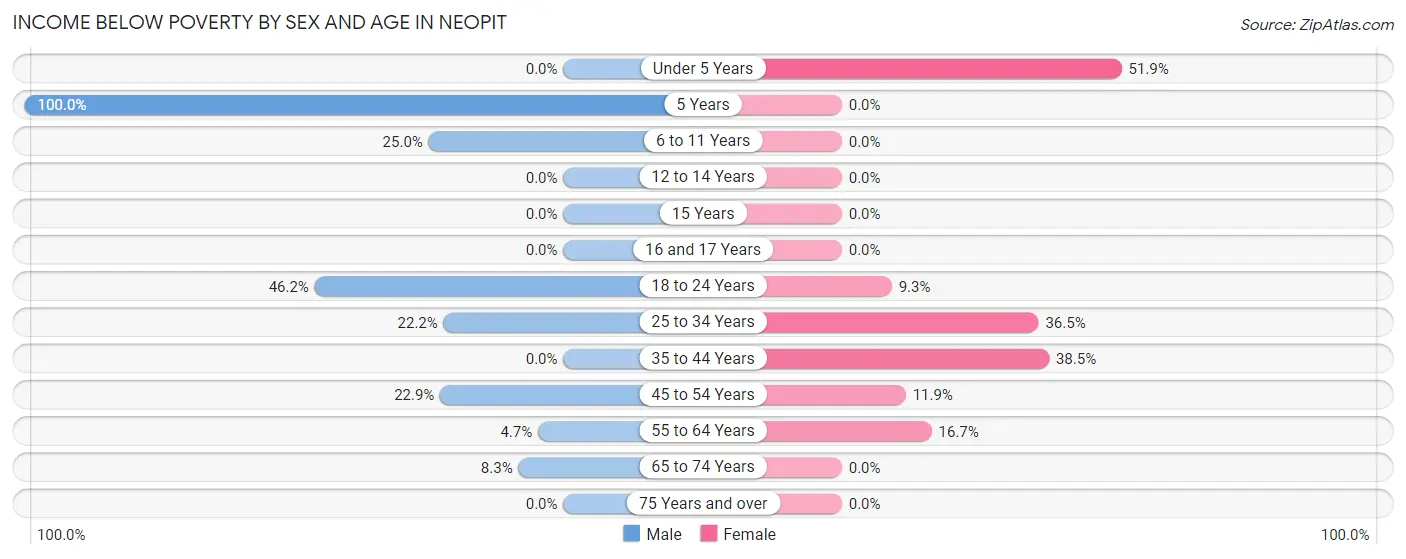
| Age Bracket | Male | Female |
| Under 5 Years | 0 (0.0%) | 27 (51.9%) |
| 5 Years | 9 (100.0%) | 0 (0.0%) |
| 6 to 11 Years | 9 (25.0%) | 0 (0.0%) |
| 12 to 14 Years | 0 (0.0%) | 0 (0.0%) |
| 15 Years | 0 (0.0%) | 0 (0.0%) |
| 16 and 17 Years | 0 (0.0%) | 0 (0.0%) |
| 18 to 24 Years | 6 (46.2%) | 5 (9.3%) |
| 25 to 34 Years | 8 (22.2%) | 23 (36.5%) |
| 35 to 44 Years | 0 (0.0%) | 5 (38.5%) |
| 45 to 54 Years | 8 (22.9%) | 7 (11.9%) |
| 55 to 64 Years | 3 (4.7%) | 4 (16.7%) |
| 65 to 74 Years | 2 (8.3%) | 0 (0.0%) |
| 75 Years and over | 0 (0.0%) | 0 (0.0%) |
| Total | 45 (14.2%) | 71 (19.6%) |
Income Above Poverty by Sex and Age in Neopit
According to the poverty statistics in Neopit, males aged under 5 years and females aged 5 years are the age groups that are most secure financially, with 100.0% of males and 100.0% of females in these age groups living above the poverty line.
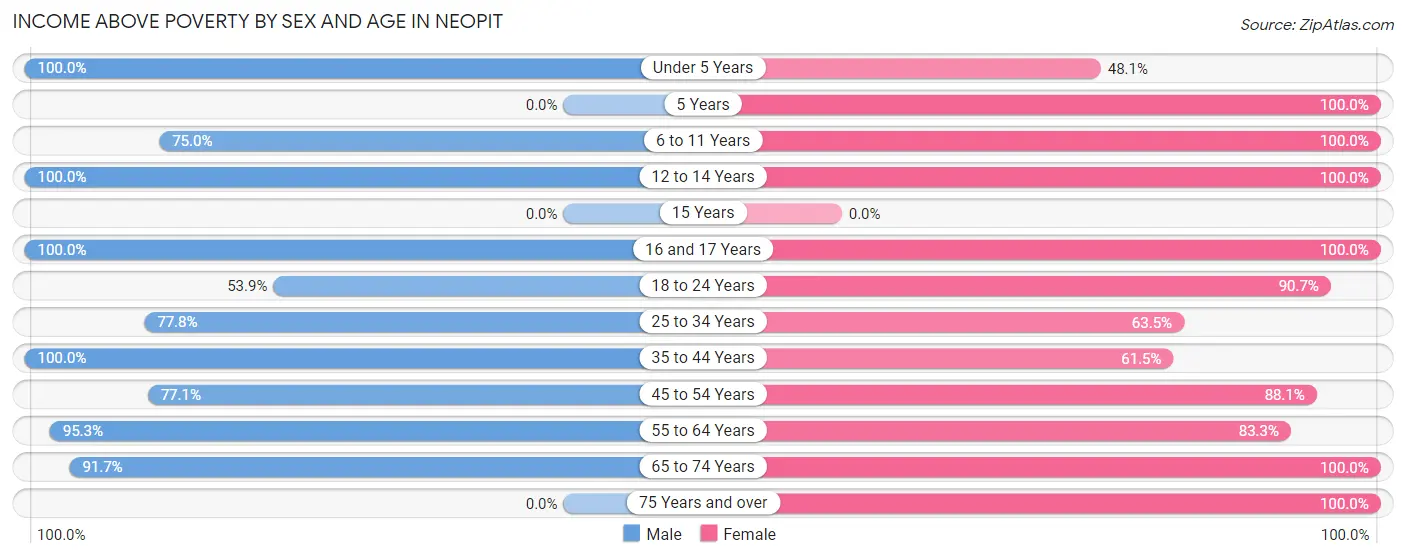
| Age Bracket | Male | Female |
| Under 5 Years | 56 (100.0%) | 25 (48.1%) |
| 5 Years | 0 (0.0%) | 10 (100.0%) |
| 6 to 11 Years | 27 (75.0%) | 39 (100.0%) |
| 12 to 14 Years | 8 (100.0%) | 21 (100.0%) |
| 15 Years | 0 (0.0%) | 0 (0.0%) |
| 16 and 17 Years | 13 (100.0%) | 4 (100.0%) |
| 18 to 24 Years | 7 (53.8%) | 49 (90.7%) |
| 25 to 34 Years | 28 (77.8%) | 40 (63.5%) |
| 35 to 44 Years | 22 (100.0%) | 8 (61.5%) |
| 45 to 54 Years | 27 (77.1%) | 52 (88.1%) |
| 55 to 64 Years | 61 (95.3%) | 20 (83.3%) |
| 65 to 74 Years | 22 (91.7%) | 20 (100.0%) |
| 75 Years and over | 0 (0.0%) | 4 (100.0%) |
| Total | 271 (85.8%) | 292 (80.4%) |
Income Below Poverty Among Married-Couple Families in Neopit
The poverty statistics for married-couple families in Neopit show that 2.9% or 3 of the total 105 families live below the poverty line. Families with no children have the highest poverty rate of 10.0%, comprising of 3 families. On the other hand, families with 1 or 2 children have the lowest poverty rate of 0.0%, which includes 0 families.
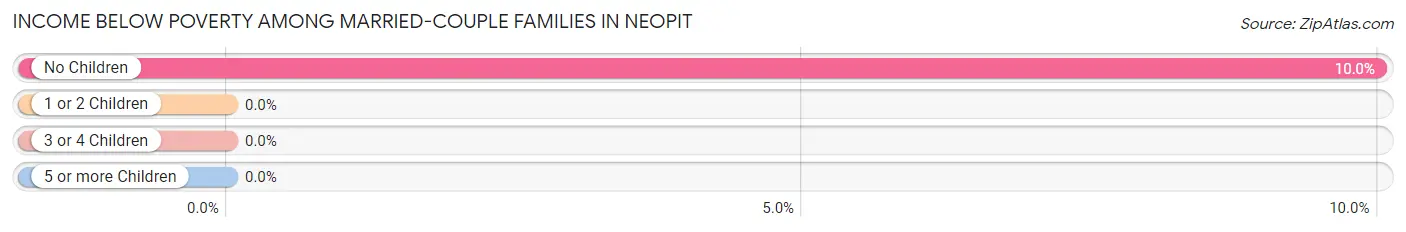
| Children | Above Poverty | Below Poverty |
| No Children | 27 (90.0%) | 3 (10.0%) |
| 1 or 2 Children | 37 (100.0%) | 0 (0.0%) |
| 3 or 4 Children | 8 (100.0%) | 0 (0.0%) |
| 5 or more Children | 30 (100.0%) | 0 (0.0%) |
| Total | 102 (97.1%) | 3 (2.9%) |
Income Below Poverty Among Single-Parent Households in Neopit
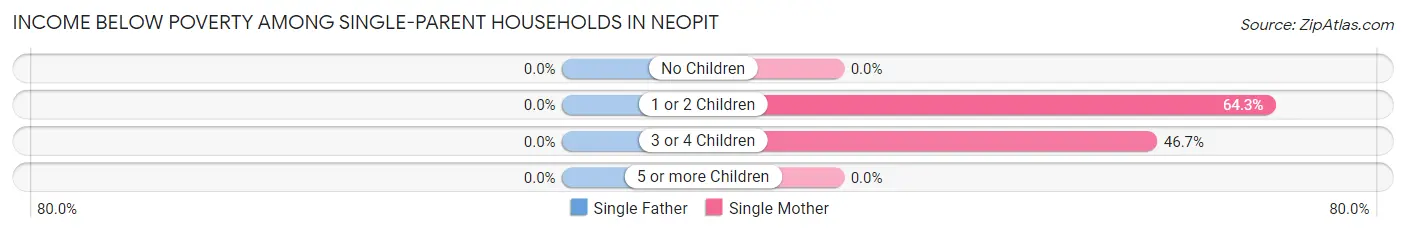
| Children | Single Father | Single Mother |
| No Children | 0 (0.0%) | 0 (0.0%) |
| 1 or 2 Children | 0 (0.0%) | 9 (64.3%) |
| 3 or 4 Children | 0 (0.0%) | 7 (46.7%) |
| 5 or more Children | 0 (0.0%) | 0 (0.0%) |
| Total | 0 (0.0%) | 16 (37.2%) |
Income Below Poverty Among Married-Couple vs Single-Parent Households in Neopit
The poverty data for Neopit shows that 3 of the married-couple family households (2.9%) and 16 of the single-parent households (37.2%) are living below the poverty level. Within the married-couple family households, those with no children have the highest poverty rate, with 3 households (10.0%) falling below the poverty line. Among the single-parent households, those with 1 or 2 children have the highest poverty rate, with 9 household (64.3%) living below poverty.
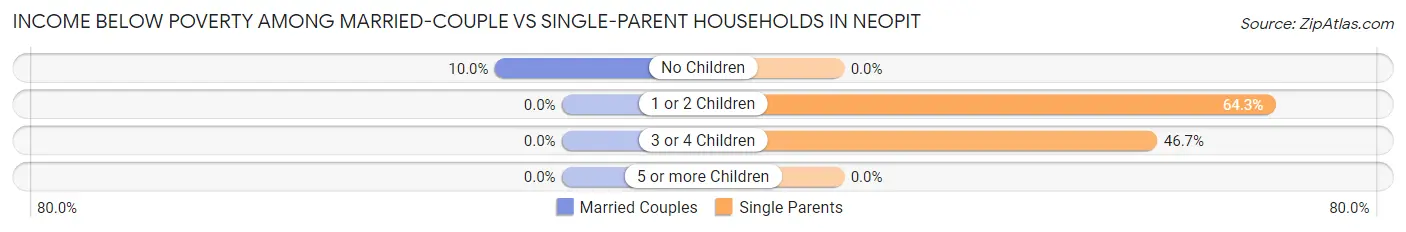
| Children | Married-Couple Families | Single-Parent Households |
| No Children | 3 (10.0%) | 0 (0.0%) |
| 1 or 2 Children | 0 (0.0%) | 9 (64.3%) |
| 3 or 4 Children | 0 (0.0%) | 7 (46.7%) |
| 5 or more Children | 0 (0.0%) | 0 (0.0%) |
| Total | 3 (2.9%) | 16 (37.2%) |
Race in Neopit
The most populous races in Neopit are Native / Alaskan (656 | 95.8%), White / Caucasian (16 | 2.3%), and Hispanic or Latino (11 | 1.6%).
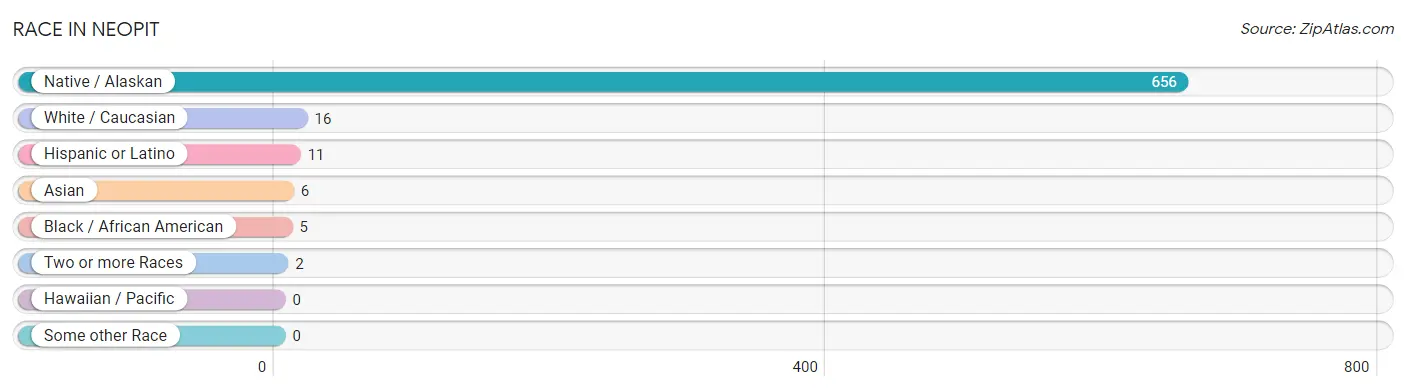
| Race | # Population | % Population |
| Asian | 6 | 0.9% |
| Black / African American | 5 | 0.7% |
| Hawaiian / Pacific | 0 | 0.0% |
| Hispanic or Latino | 11 | 1.6% |
| Native / Alaskan | 656 | 95.8% |
| White / Caucasian | 16 | 2.3% |
| Two or more Races | 2 | 0.3% |
| Some other Race | 0 | 0.0% |
| Total | 685 | 100.0% |
Ancestry in Neopit
The most populous ancestries reported in Neopit are Menominee (550 | 80.3%), and Korean (6 | 0.9%), together accounting for 81.2% of all Neopit residents.
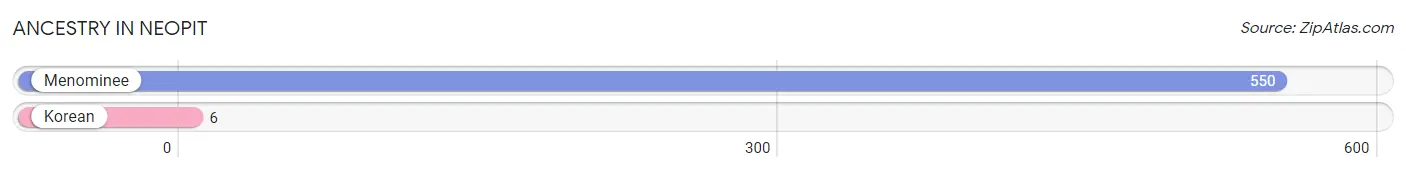
| Ancestry | # Population | % Population |
| Korean | 6 | 0.9% |
| Menominee | 550 | 80.3% | View All 2 Rows |
Immigrants in Neopit
The most numerous immigrant groups reported in Neopit came from Asia (6 | 0.9%), Philippines (6 | 0.9%), and South Eastern Asia (6 | 0.9%), together accounting for 2.6% of all Neopit residents.
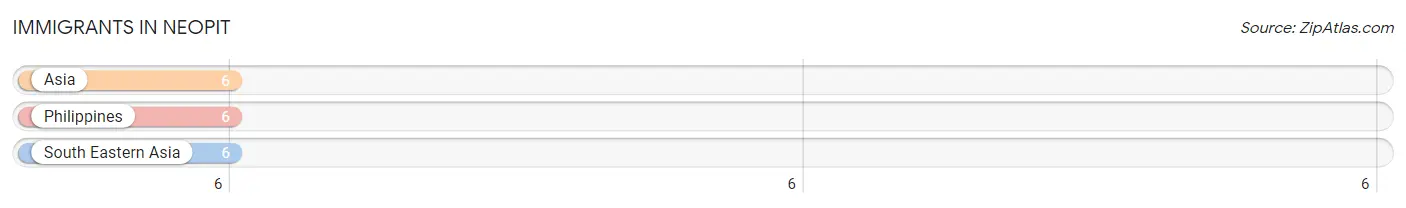
| Immigration Origin | # Population | % Population |
| Asia | 6 | 0.9% |
| Philippines | 6 | 0.9% |
| South Eastern Asia | 6 | 0.9% | View All 3 Rows |
Sex and Age in Neopit
Sex and Age in Neopit
The most populous age groups in Neopit are Under 5 Years (56 | 17.6%) for men and Under 5 Years (56 | 15.3%) for women.
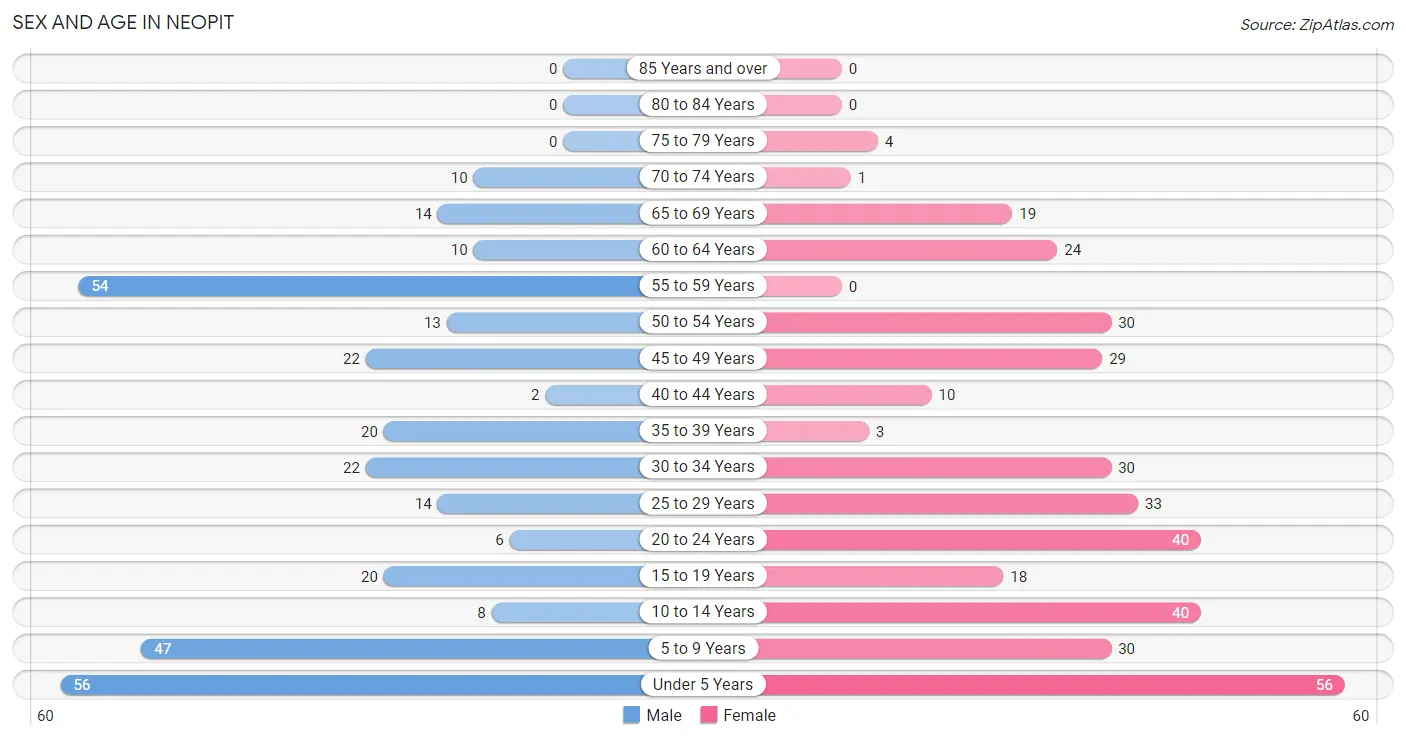
| Age Bracket | Male | Female |
| Under 5 Years | 56 (17.6%) | 56 (15.3%) |
| 5 to 9 Years | 47 (14.8%) | 30 (8.2%) |
| 10 to 14 Years | 8 (2.5%) | 40 (10.9%) |
| 15 to 19 Years | 20 (6.3%) | 18 (4.9%) |
| 20 to 24 Years | 6 (1.9%) | 40 (10.9%) |
| 25 to 29 Years | 14 (4.4%) | 33 (9.0%) |
| 30 to 34 Years | 22 (6.9%) | 30 (8.2%) |
| 35 to 39 Years | 20 (6.3%) | 3 (0.8%) |
| 40 to 44 Years | 2 (0.6%) | 10 (2.7%) |
| 45 to 49 Years | 22 (6.9%) | 29 (7.9%) |
| 50 to 54 Years | 13 (4.1%) | 30 (8.2%) |
| 55 to 59 Years | 54 (17.0%) | 0 (0.0%) |
| 60 to 64 Years | 10 (3.1%) | 24 (6.5%) |
| 65 to 69 Years | 14 (4.4%) | 19 (5.2%) |
| 70 to 74 Years | 10 (3.1%) | 1 (0.3%) |
| 75 to 79 Years | 0 (0.0%) | 4 (1.1%) |
| 80 to 84 Years | 0 (0.0%) | 0 (0.0%) |
| 85 Years and over | 0 (0.0%) | 0 (0.0%) |
| Total | 318 (100.0%) | 367 (100.0%) |
Families and Households in Neopit
Median Family Size in Neopit
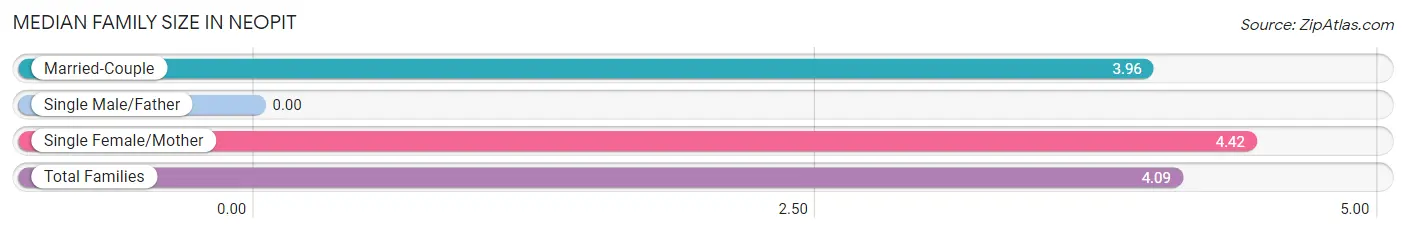
| Family Type | # Families | Family Size |
| Married-Couple | 105 (71.0%) | 3.96 |
| Single Male/Father | 0 (0.0%) | - |
| Single Female/Mother | 43 (29.0%) | 4.42 |
| Total Families | 148 (100.0%) | 4.09 |
Median Household Size in Neopit
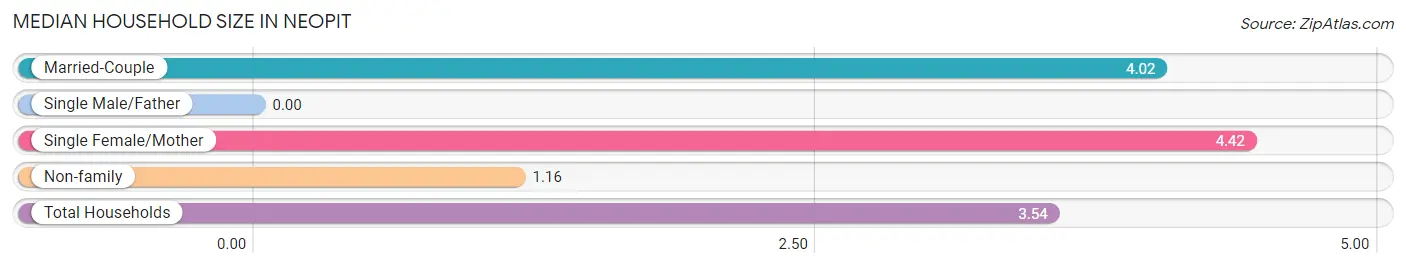
| Household Type | # Households | Household Size |
| Married-Couple | 105 (56.8%) | 4.02 |
| Single Male/Father | 0 (0.0%) | - |
| Single Female/Mother | 43 (23.2%) | 4.42 |
| Non-family | 37 (20.0%) | 1.16 |
| Total Households | 185 (100.0%) | 3.54 |
Household Size by Marriage Status in Neopit
Out of a total of 185 households in Neopit, 148 (80.0%) are family households, while 37 (20.0%) are nonfamily households. The most numerous type of family households are 2-person households, comprising 36, and the most common type of nonfamily households are 1-person households, comprising 33.
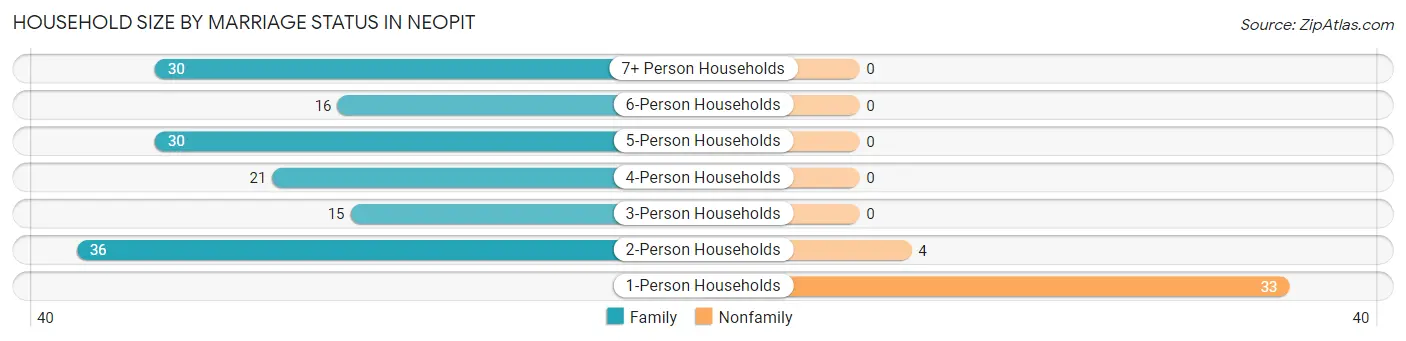
| Household Size | Family Households | Nonfamily Households |
| 1-Person Households | - | 33 (17.8%) |
| 2-Person Households | 36 (19.5%) | 4 (2.2%) |
| 3-Person Households | 15 (8.1%) | 0 (0.0%) |
| 4-Person Households | 21 (11.4%) | 0 (0.0%) |
| 5-Person Households | 30 (16.2%) | 0 (0.0%) |
| 6-Person Households | 16 (8.6%) | 0 (0.0%) |
| 7+ Person Households | 30 (16.2%) | 0 (0.0%) |
| Total | 148 (80.0%) | 37 (20.0%) |
Female Fertility in Neopit
Fertility by Age in Neopit
Average fertility rate in Neopit is 325.0 births per 1,000 women. Women in the age bracket of 20 to 34 years have the highest fertility rate with 515.0 births per 1,000 women. Women in the age bracket of 20 to 34 years acount for 100.0% of all women with births.
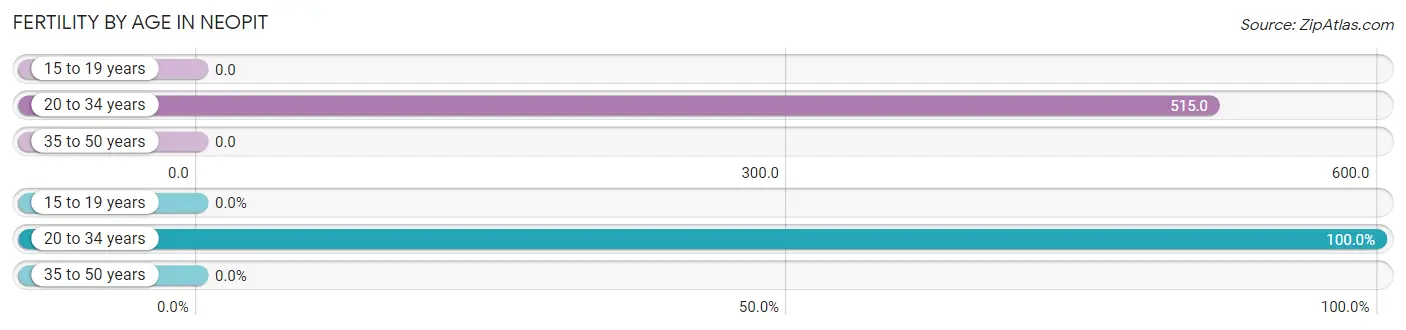
| Age Bracket | Women with Births | Births / 1,000 Women |
| 15 to 19 years | 0 (0.0%) | 0.0 |
| 20 to 34 years | 53 (100.0%) | 515.0 |
| 35 to 50 years | 0 (0.0%) | 0.0 |
| Total | 53 (100.0%) | 325.0 |
Fertility by Age by Marriage Status in Neopit
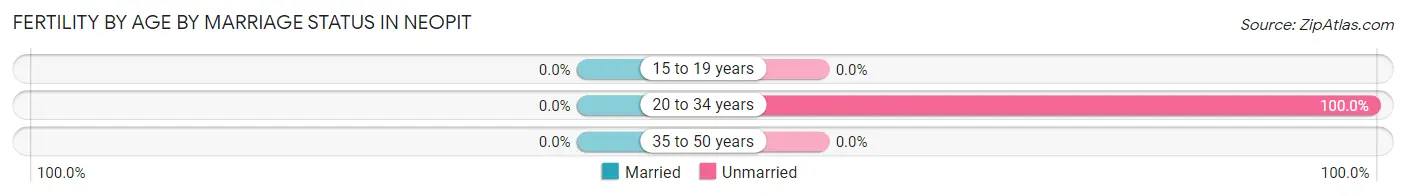
| Age Bracket | Married | Unmarried |
| 15 to 19 years | 0 (0.0%) | 0 (0.0%) |
| 20 to 34 years | 0 (0.0%) | 53 (100.0%) |
| 35 to 50 years | 0 (0.0%) | 0 (0.0%) |
| Total | 0 (0.0%) | 53 (100.0%) |
Fertility by Education in Neopit
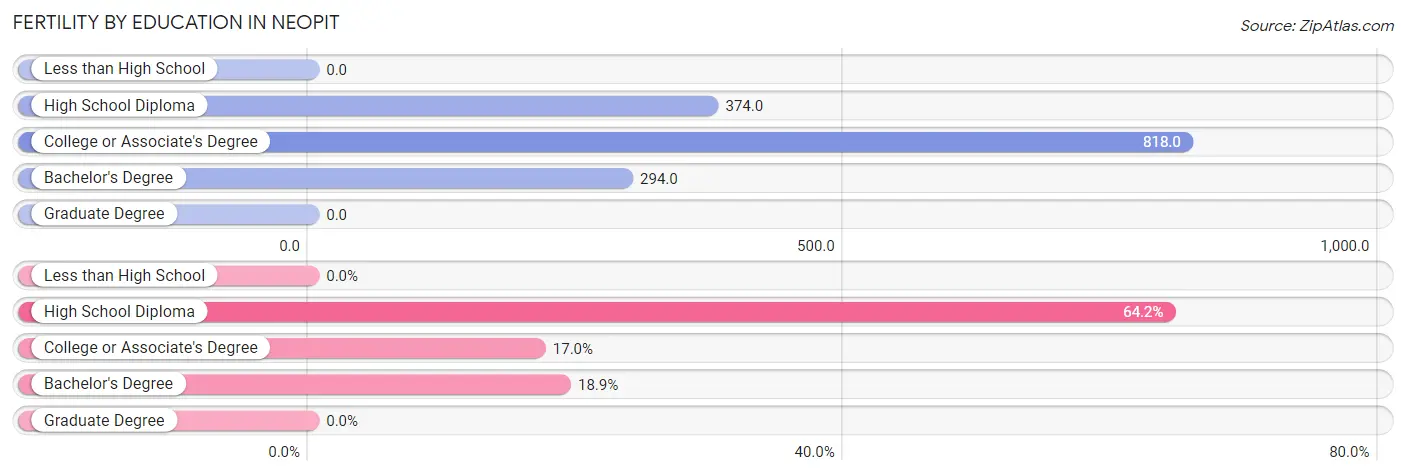
| Educational Attainment | Women with Births | Births / 1,000 Women |
| Less than High School | 0 (0.0%) | 0.0 |
| High School Diploma | 34 (64.1%) | 374.0 |
| College or Associate's Degree | 9 (17.0%) | 818.0 |
| Bachelor's Degree | 10 (18.9%) | 294.0 |
| Graduate Degree | 0 (0.0%) | 0.0 |
| Total | 53 (100.0%) | 325.0 |
Fertility by Education by Marriage Status in Neopit
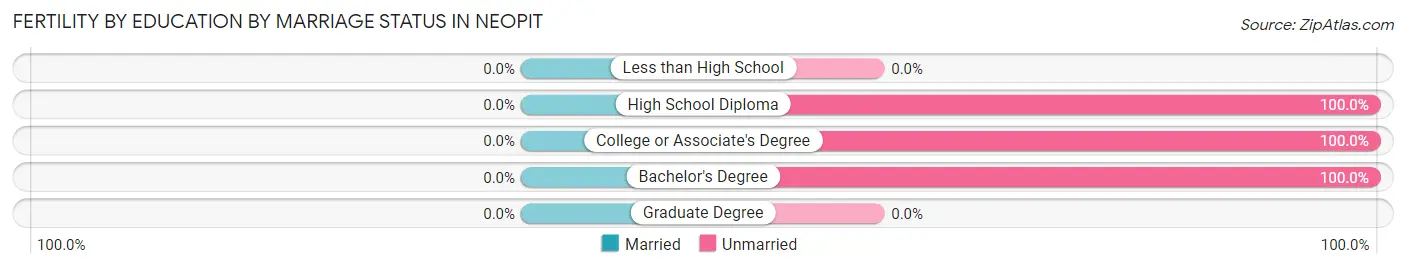
| Educational Attainment | Married | Unmarried |
| Less than High School | 0 (0.0%) | 0 (0.0%) |
| High School Diploma | 0 (0.0%) | 34 (100.0%) |
| College or Associate's Degree | 0 (0.0%) | 9 (100.0%) |
| Bachelor's Degree | 0 (0.0%) | 10 (100.0%) |
| Graduate Degree | 0 (0.0%) | 0 (0.0%) |
| Total | 0 (0.0%) | 53 (100.0%) |
Employment Characteristics in Neopit
Employment by Class of Employer in Neopit
Among the 197 employed individuals in Neopit, private company employees (119 | 60.4%), local government employees (57 | 28.9%), and state government employees (8 | 4.1%) make up the most common classes of employment.
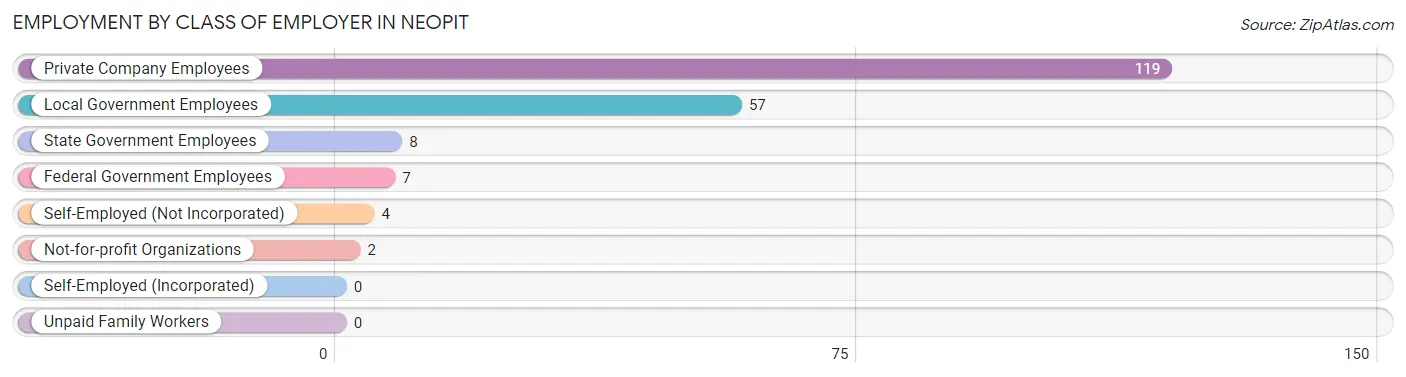
| Employer Class | # Employees | % Employees |
| Private Company Employees | 119 | 60.4% |
| Self-Employed (Incorporated) | 0 | 0.0% |
| Self-Employed (Not Incorporated) | 4 | 2.0% |
| Not-for-profit Organizations | 2 | 1.0% |
| Local Government Employees | 57 | 28.9% |
| State Government Employees | 8 | 4.1% |
| Federal Government Employees | 7 | 3.5% |
| Unpaid Family Workers | 0 | 0.0% |
| Total | 197 | 100.0% |
Employment Status by Age in Neopit
According to the labor force statistics for Neopit, out of the total population over 16 years of age (448), 48.2% or 216 individuals are in the labor force, with 8.8% or 19 of them unemployed. The age group with the highest labor force participation rate is 60 to 64 years, with 88.2% or 30 individuals in the labor force. Within the labor force, the 45 to 54 years age range has the highest percentage of unemployed individuals, with 25.0% or 8 of them being unemployed.
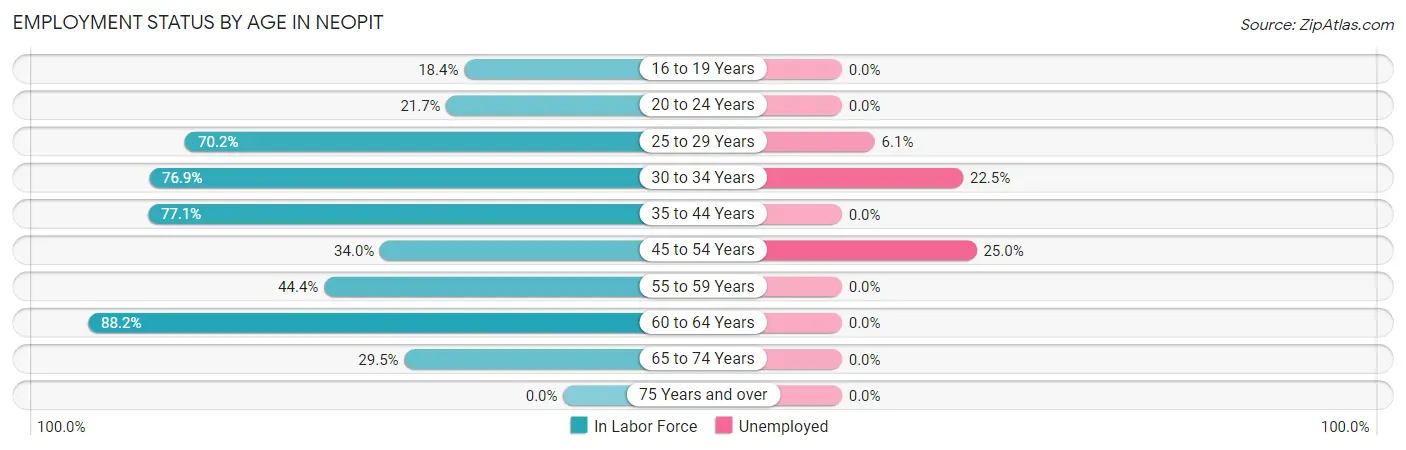
| Age Bracket | In Labor Force | Unemployed |
| 16 to 19 Years | 7 (18.4%) | 0 (0.0%) |
| 20 to 24 Years | 10 (21.7%) | 0 (0.0%) |
| 25 to 29 Years | 33 (70.2%) | 2 (6.1%) |
| 30 to 34 Years | 40 (76.9%) | 9 (22.5%) |
| 35 to 44 Years | 27 (77.1%) | 0 (0.0%) |
| 45 to 54 Years | 32 (34.0%) | 8 (25.0%) |
| 55 to 59 Years | 24 (44.4%) | 0 (0.0%) |
| 60 to 64 Years | 30 (88.2%) | 0 (0.0%) |
| 65 to 74 Years | 13 (29.5%) | 0 (0.0%) |
| 75 Years and over | 0 (0.0%) | 0 (0.0%) |
| Total | 216 (48.2%) | 19 (8.8%) |
Employment Status by Educational Attainment in Neopit
According to labor force statistics for Neopit, 58.9% of individuals (186) out of the total population between 25 and 64 years of age (316) are in the labor force, with 10.2% or 19 of them being unemployed. The group with the highest labor force participation rate are those with the educational attainment of college / associate degree, with 73.1% or 57 individuals in the labor force. Within the labor force, individuals with college / associate degree education have the highest percentage of unemployment, with 14.0% or 8 of them being unemployed.
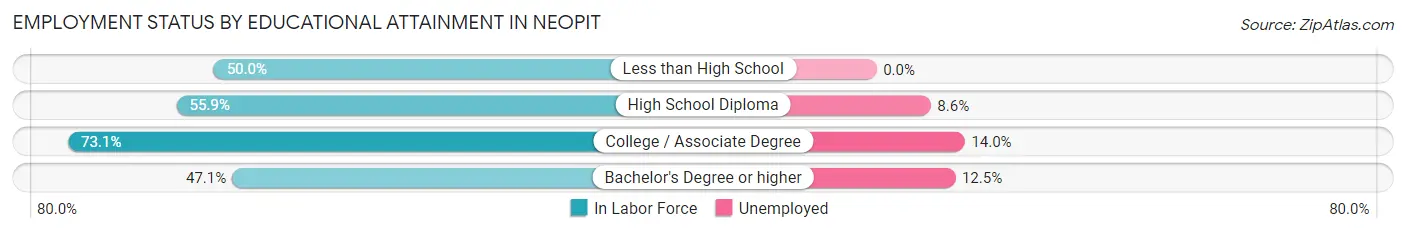
| Educational Attainment | In Labor Force | Unemployed |
| Less than High School | 8 (50.0%) | 0 (0.0%) |
| High School Diploma | 105 (55.9%) | 16 (8.6%) |
| College / Associate Degree | 57 (73.1%) | 11 (14.0%) |
| Bachelor's Degree or higher | 16 (47.1%) | 4 (12.5%) |
| Total | 186 (58.9%) | 32 (10.2%) |
Employment Occupations by Sex in Neopit
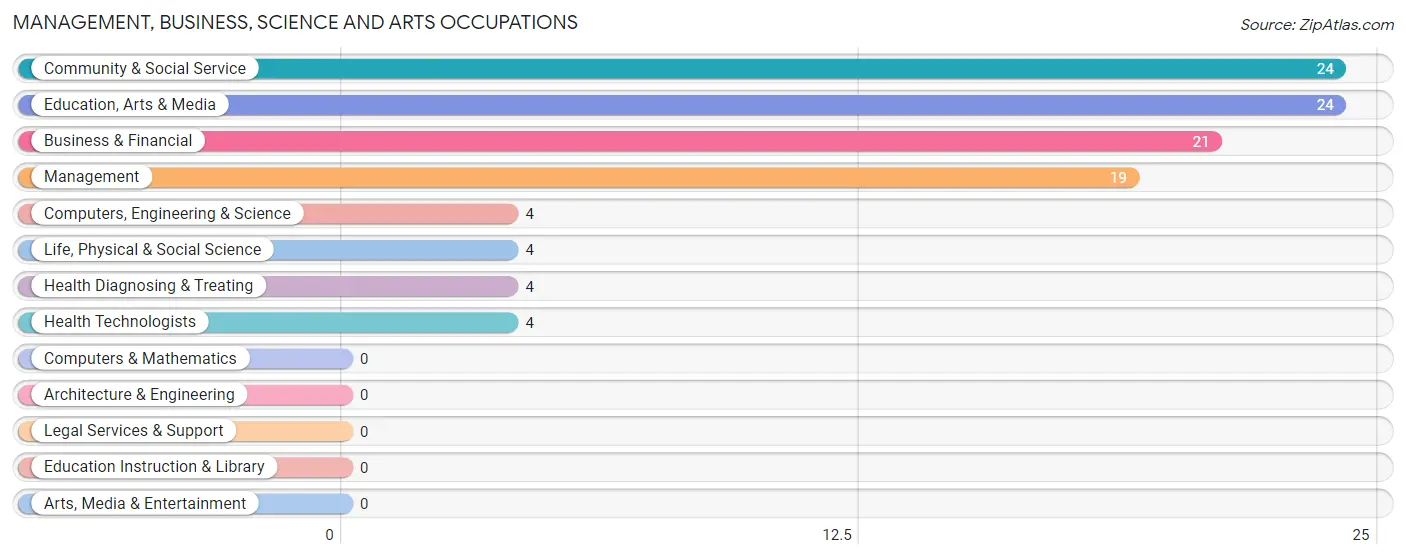
Management, Business, Science and Arts Occupations
The most common Management, Business, Science and Arts occupations in Neopit are Community & Social Service (24 | 12.2%), Education, Arts & Media (24 | 12.2%), Business & Financial (21 | 10.7%), Management (19 | 9.6%), and Computers, Engineering & Science (4 | 2.0%).
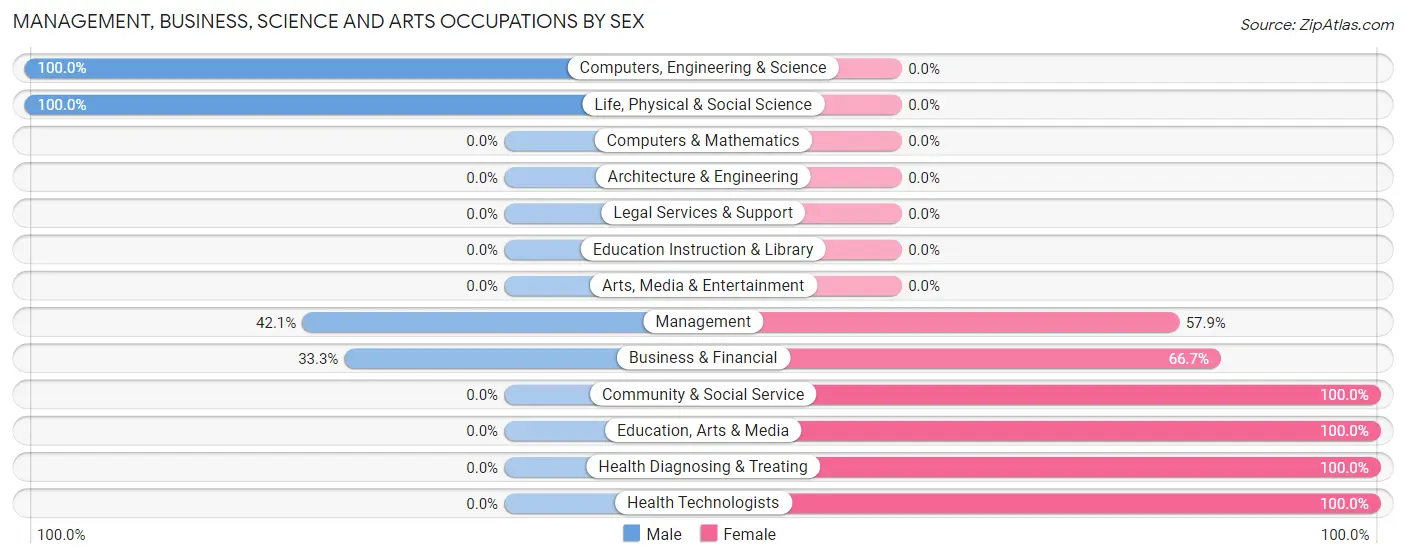
Management, Business, Science and Arts Occupations by Sex
Within the Management, Business, Science and Arts occupations in Neopit, the most male-oriented occupations are Computers, Engineering & Science (100.0%), Life, Physical & Social Science (100.0%), and Management (42.1%), while the most female-oriented occupations are Community & Social Service (100.0%), Education, Arts & Media (100.0%), and Health Diagnosing & Treating (100.0%).
| Occupation | Male | Female |
| Management | 8 (42.1%) | 11 (57.9%) |
| Business & Financial | 7 (33.3%) | 14 (66.7%) |
| Computers, Engineering & Science | 4 (100.0%) | 0 (0.0%) |
| Computers & Mathematics | 0 (0.0%) | 0 (0.0%) |
| Architecture & Engineering | 0 (0.0%) | 0 (0.0%) |
| Life, Physical & Social Science | 4 (100.0%) | 0 (0.0%) |
| Community & Social Service | 0 (0.0%) | 24 (100.0%) |
| Education, Arts & Media | 0 (0.0%) | 24 (100.0%) |
| Legal Services & Support | 0 (0.0%) | 0 (0.0%) |
| Education Instruction & Library | 0 (0.0%) | 0 (0.0%) |
| Arts, Media & Entertainment | 0 (0.0%) | 0 (0.0%) |
| Health Diagnosing & Treating | 0 (0.0%) | 4 (100.0%) |
| Health Technologists | 0 (0.0%) | 4 (100.0%) |
| Total (Category) | 19 (26.4%) | 53 (73.6%) |
| Total (Overall) | 95 (48.2%) | 102 (51.8%) |
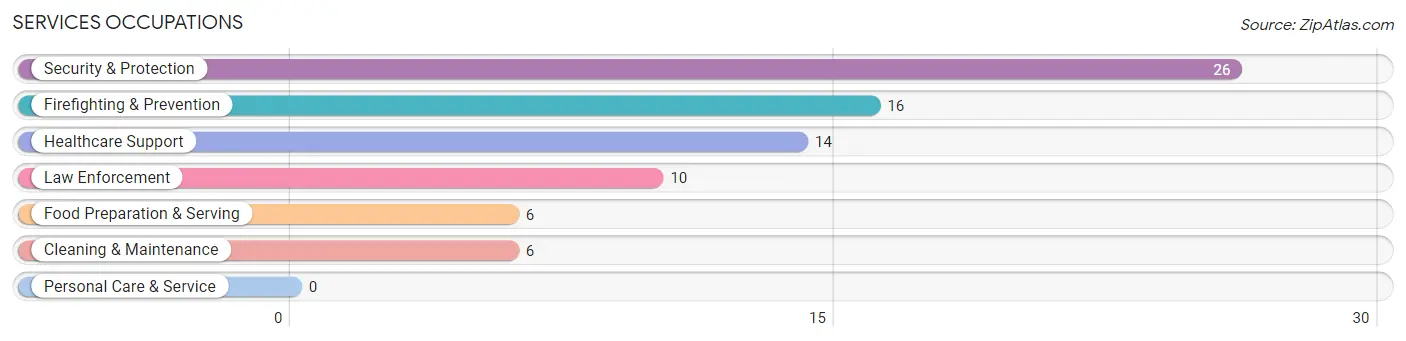
Services Occupations
The most common Services occupations in Neopit are Security & Protection (26 | 13.2%), Firefighting & Prevention (16 | 8.1%), Healthcare Support (14 | 7.1%), Law Enforcement (10 | 5.1%), and Food Preparation & Serving (6 | 3.0%).
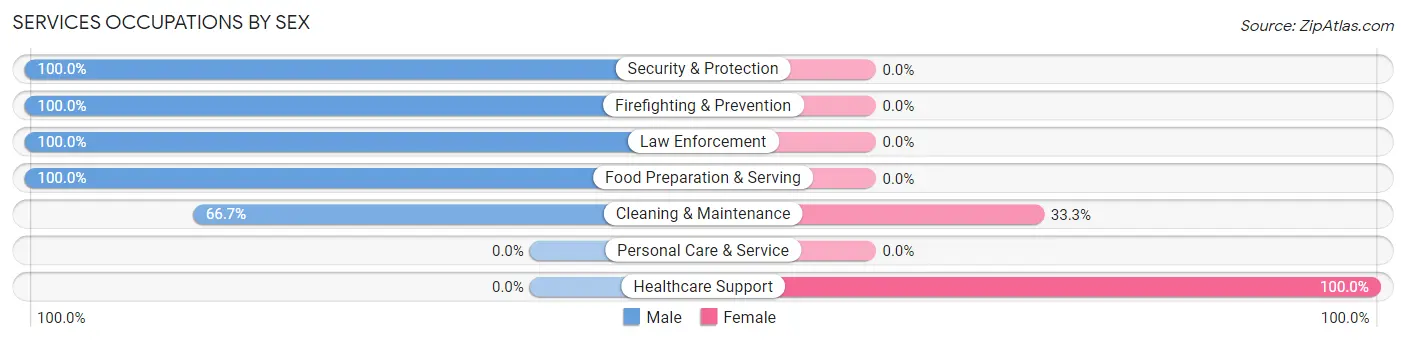
Services Occupations by Sex
Within the Services occupations in Neopit, the most male-oriented occupations are Security & Protection (100.0%), Firefighting & Prevention (100.0%), and Law Enforcement (100.0%), while the most female-oriented occupations are Healthcare Support (100.0%), and Cleaning & Maintenance (33.3%).
| Occupation | Male | Female |
| Healthcare Support | 0 (0.0%) | 14 (100.0%) |
| Security & Protection | 26 (100.0%) | 0 (0.0%) |
| Firefighting & Prevention | 16 (100.0%) | 0 (0.0%) |
| Law Enforcement | 10 (100.0%) | 0 (0.0%) |
| Food Preparation & Serving | 6 (100.0%) | 0 (0.0%) |
| Cleaning & Maintenance | 4 (66.7%) | 2 (33.3%) |
| Personal Care & Service | 0 (0.0%) | 0 (0.0%) |
| Total (Category) | 36 (69.2%) | 16 (30.8%) |
| Total (Overall) | 95 (48.2%) | 102 (51.8%) |
Sales and Office Occupations
The most common Sales and Office occupations in Neopit are Office & Administration (10 | 5.1%), and Sales & Related (5 | 2.5%).
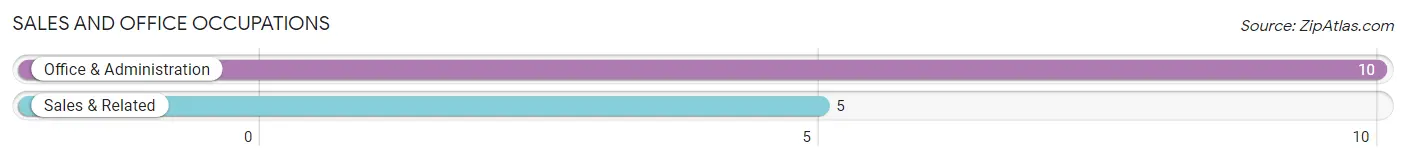
Sales and Office Occupations by Sex

| Occupation | Male | Female |
| Sales & Related | 5 (100.0%) | 0 (0.0%) |
| Office & Administration | 0 (0.0%) | 10 (100.0%) |
| Total (Category) | 5 (33.3%) | 10 (66.7%) |
| Total (Overall) | 95 (48.2%) | 102 (51.8%) |
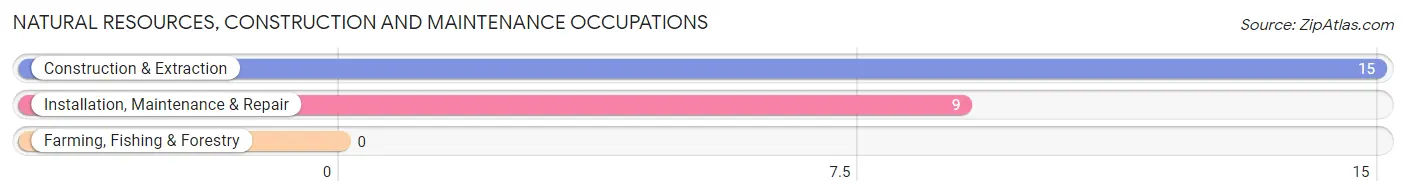
Natural Resources, Construction and Maintenance Occupations
The most common Natural Resources, Construction and Maintenance occupations in Neopit are Construction & Extraction (15 | 7.6%), and Installation, Maintenance & Repair (9 | 4.6%).
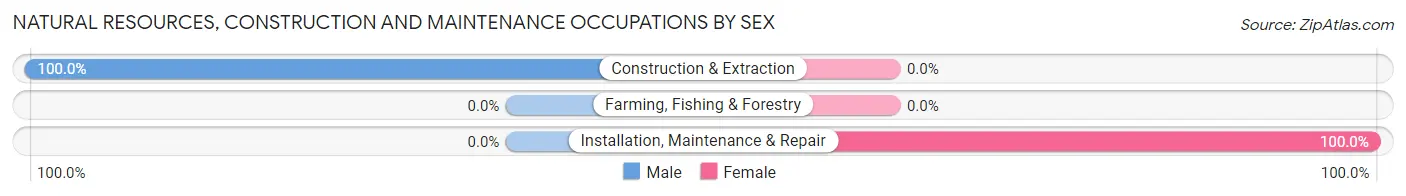
Natural Resources, Construction and Maintenance Occupations by Sex
| Occupation | Male | Female |
| Farming, Fishing & Forestry | 0 (0.0%) | 0 (0.0%) |
| Construction & Extraction | 15 (100.0%) | 0 (0.0%) |
| Installation, Maintenance & Repair | 0 (0.0%) | 9 (100.0%) |
| Total (Category) | 15 (62.5%) | 9 (37.5%) |
| Total (Overall) | 95 (48.2%) | 102 (51.8%) |
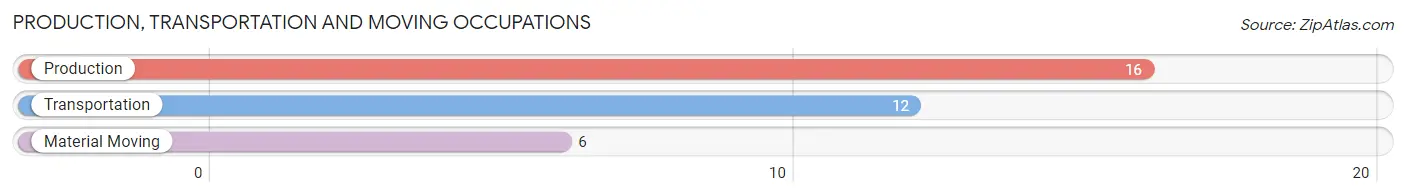
Production, Transportation and Moving Occupations
The most common Production, Transportation and Moving occupations in Neopit are Production (16 | 8.1%), Transportation (12 | 6.1%), and Material Moving (6 | 3.0%).
Production, Transportation and Moving Occupations by Sex
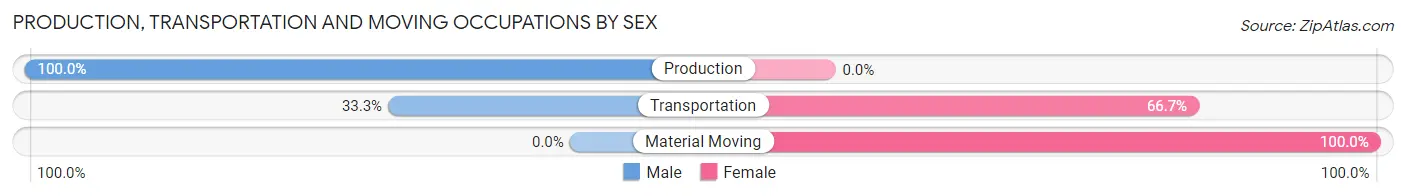
| Occupation | Male | Female |
| Production | 16 (100.0%) | 0 (0.0%) |
| Transportation | 4 (33.3%) | 8 (66.7%) |
| Material Moving | 0 (0.0%) | 6 (100.0%) |
| Total (Category) | 20 (58.8%) | 14 (41.2%) |
| Total (Overall) | 95 (48.2%) | 102 (51.8%) |
Employment Industries by Sex in Neopit
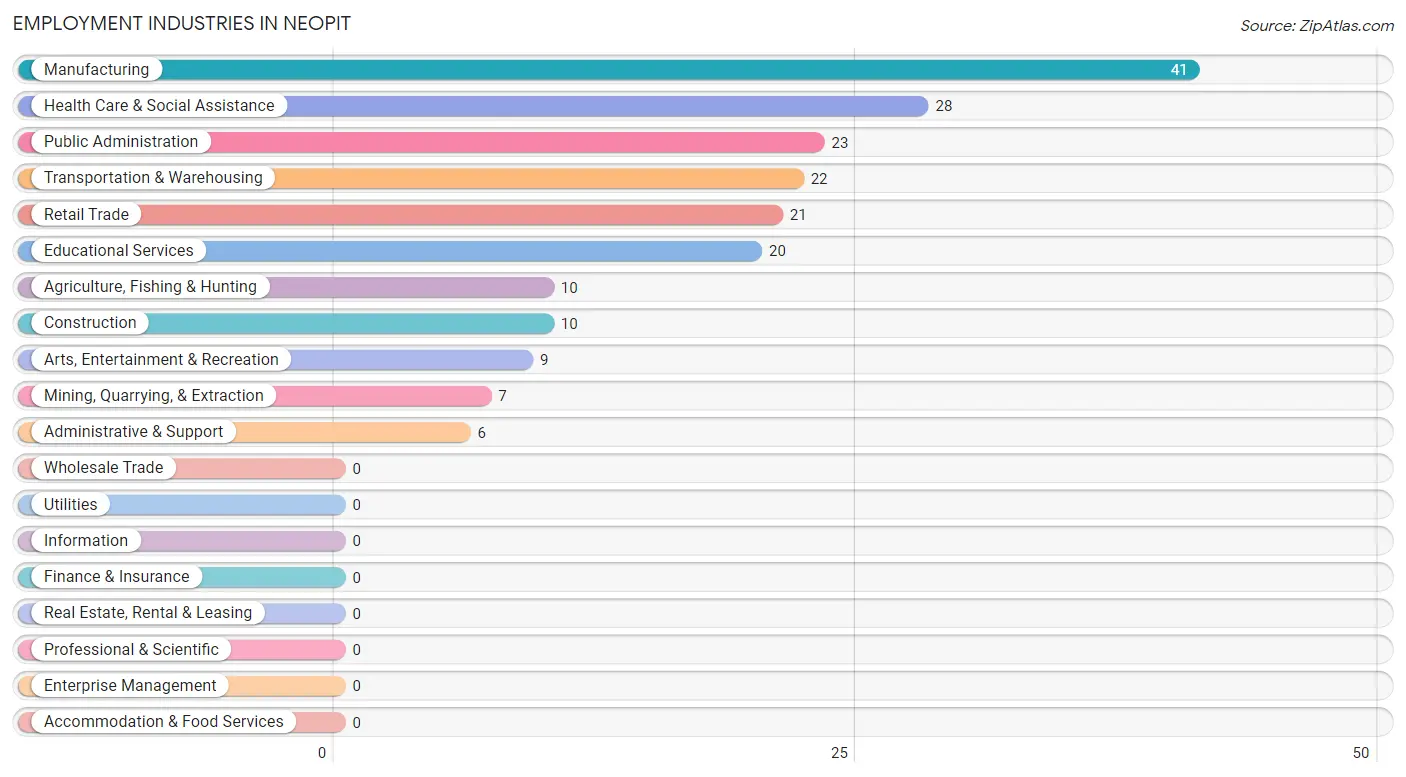
Employment Industries in Neopit
The major employment industries in Neopit include Manufacturing (41 | 20.8%), Health Care & Social Assistance (28 | 14.2%), Public Administration (23 | 11.7%), Transportation & Warehousing (22 | 11.2%), and Retail Trade (21 | 10.7%).
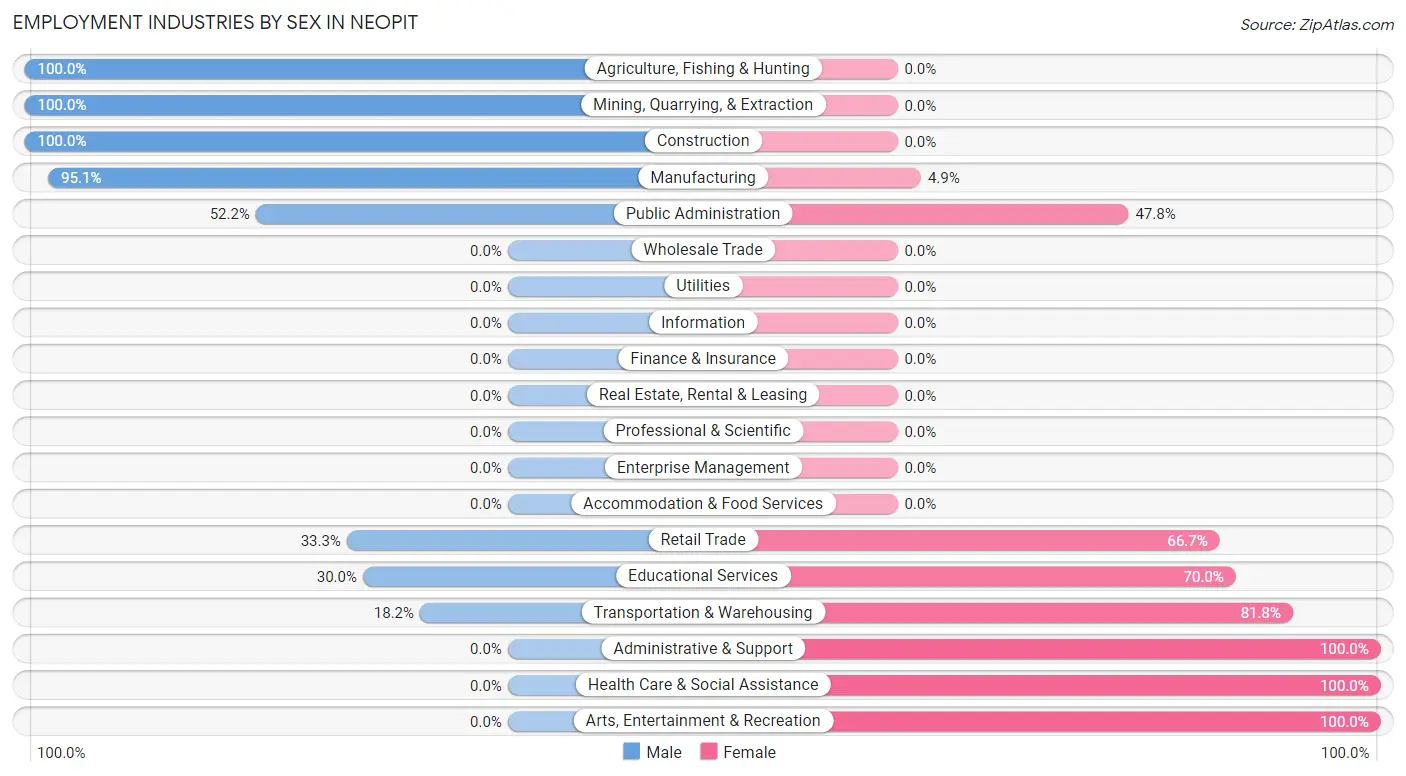
Employment Industries by Sex in Neopit
The Neopit industries that see more men than women are Agriculture, Fishing & Hunting (100.0%), Mining, Quarrying, & Extraction (100.0%), and Construction (100.0%), whereas the industries that tend to have a higher number of women are Administrative & Support (100.0%), Health Care & Social Assistance (100.0%), and Arts, Entertainment & Recreation (100.0%).
| Industry | Male | Female |
| Agriculture, Fishing & Hunting | 10 (100.0%) | 0 (0.0%) |
| Mining, Quarrying, & Extraction | 7 (100.0%) | 0 (0.0%) |
| Construction | 10 (100.0%) | 0 (0.0%) |
| Manufacturing | 39 (95.1%) | 2 (4.9%) |
| Wholesale Trade | 0 (0.0%) | 0 (0.0%) |
| Retail Trade | 7 (33.3%) | 14 (66.7%) |
| Transportation & Warehousing | 4 (18.2%) | 18 (81.8%) |
| Utilities | 0 (0.0%) | 0 (0.0%) |
| Information | 0 (0.0%) | 0 (0.0%) |
| Finance & Insurance | 0 (0.0%) | 0 (0.0%) |
| Real Estate, Rental & Leasing | 0 (0.0%) | 0 (0.0%) |
| Professional & Scientific | 0 (0.0%) | 0 (0.0%) |
| Enterprise Management | 0 (0.0%) | 0 (0.0%) |
| Administrative & Support | 0 (0.0%) | 6 (100.0%) |
| Educational Services | 6 (30.0%) | 14 (70.0%) |
| Health Care & Social Assistance | 0 (0.0%) | 28 (100.0%) |
| Arts, Entertainment & Recreation | 0 (0.0%) | 9 (100.0%) |
| Accommodation & Food Services | 0 (0.0%) | 0 (0.0%) |
| Public Administration | 12 (52.2%) | 11 (47.8%) |
| Total | 95 (48.2%) | 102 (51.8%) |
Education in Neopit
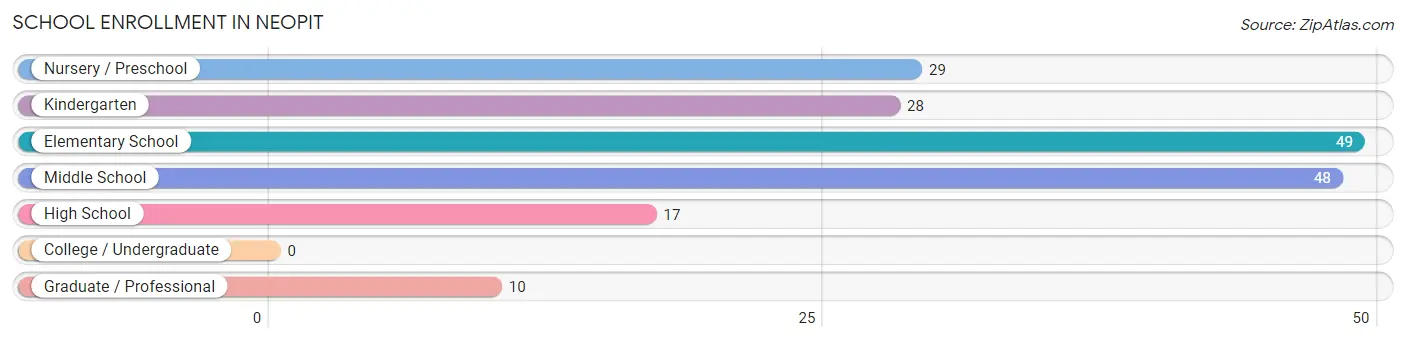
School Enrollment in Neopit
The most common levels of schooling among the 181 students in Neopit are elementary school (49 | 27.1%), middle school (48 | 26.5%), and nursery / preschool (29 | 16.0%).
| School Level | # Students | % Students |
| Nursery / Preschool | 29 | 16.0% |
| Kindergarten | 28 | 15.5% |
| Elementary School | 49 | 27.1% |
| Middle School | 48 | 26.5% |
| High School | 17 | 9.4% |
| College / Undergraduate | 0 | 0.0% |
| Graduate / Professional | 10 | 5.5% |
| Total | 181 | 100.0% |
School Enrollment by Age by Funding Source in Neopit
Out of a total of 181 students who are enrolled in schools in Neopit, 38 (21.0%) attend a private institution, while the remaining 143 (79.0%) are enrolled in public schools. The age group of 5 to 9 year old has the highest likelihood of being enrolled in private schools, with 38 (49.3% in the age bracket) enrolled. Conversely, the age group of 3 to 4 year olds has the lowest likelihood of being enrolled in a private school, with 29 (100.0% in the age bracket) attending a public institution.
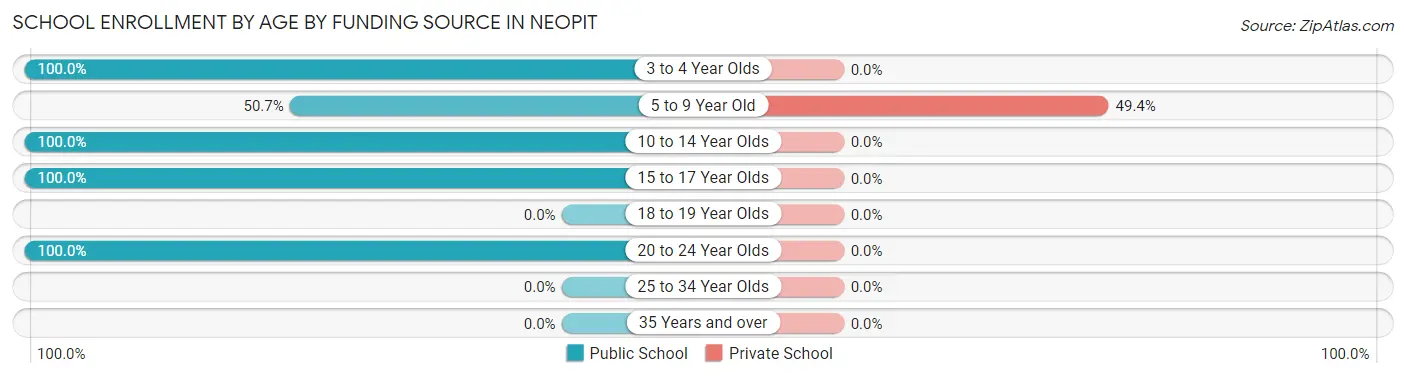
| Age Bracket | Public School | Private School |
| 3 to 4 Year Olds | 29 (100.0%) | 0 (0.0%) |
| 5 to 9 Year Old | 39 (50.6%) | 38 (49.3%) |
| 10 to 14 Year Olds | 48 (100.0%) | 0 (0.0%) |
| 15 to 17 Year Olds | 17 (100.0%) | 0 (0.0%) |
| 18 to 19 Year Olds | 0 (0.0%) | 0 (0.0%) |
| 20 to 24 Year Olds | 10 (100.0%) | 0 (0.0%) |
| 25 to 34 Year Olds | 0 (0.0%) | 0 (0.0%) |
| 35 Years and over | 0 (0.0%) | 0 (0.0%) |
| Total | 143 (79.0%) | 38 (21.0%) |
Educational Attainment by Field of Study in Neopit
Science & technology (17 | 40.5%), education (10 | 23.8%), arts & humanities (8 | 19.1%), business (4 | 9.5%), and physical & health sciences (2 | 4.8%) are the most common fields of study among 42 individuals in Neopit who have obtained a bachelor's degree or higher.
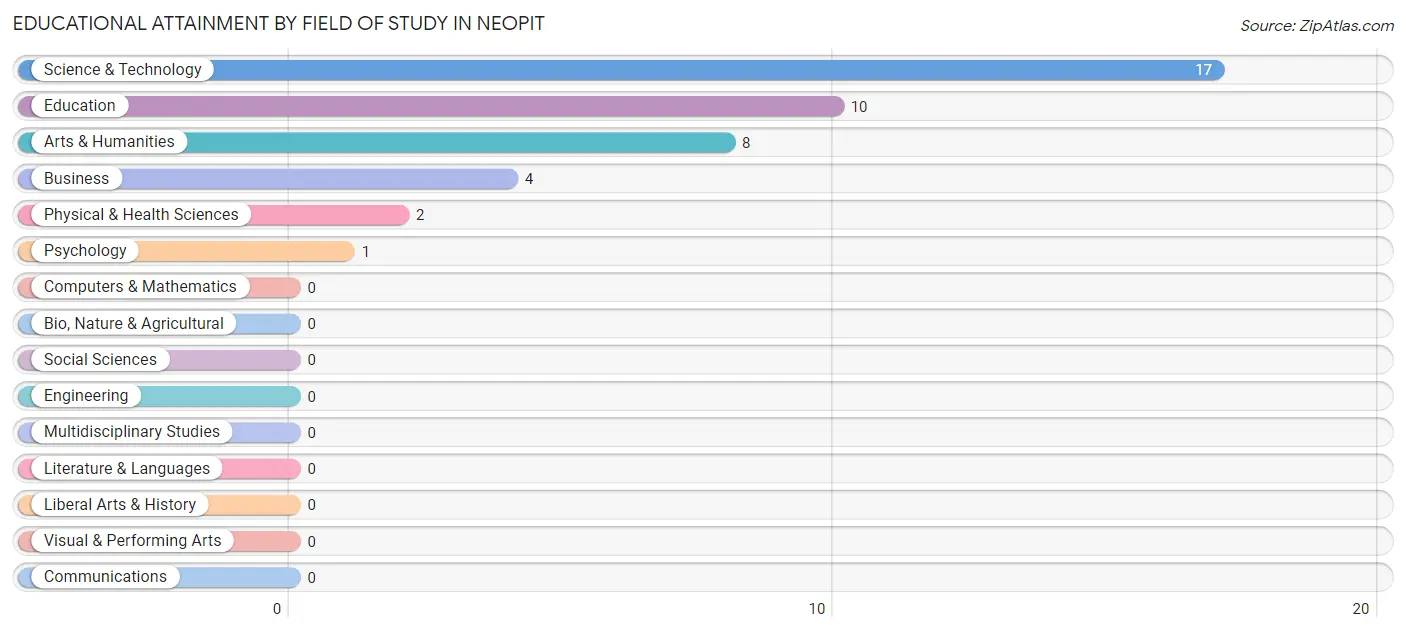
| Field of Study | # Graduates | % Graduates |
| Computers & Mathematics | 0 | 0.0% |
| Bio, Nature & Agricultural | 0 | 0.0% |
| Physical & Health Sciences | 2 | 4.8% |
| Psychology | 1 | 2.4% |
| Social Sciences | 0 | 0.0% |
| Engineering | 0 | 0.0% |
| Multidisciplinary Studies | 0 | 0.0% |
| Science & Technology | 17 | 40.5% |
| Business | 4 | 9.5% |
| Education | 10 | 23.8% |
| Literature & Languages | 0 | 0.0% |
| Liberal Arts & History | 0 | 0.0% |
| Visual & Performing Arts | 0 | 0.0% |
| Communications | 0 | 0.0% |
| Arts & Humanities | 8 | 19.1% |
| Total | 42 | 100.0% |
Transportation & Commute in Neopit
Vehicle Availability by Sex in Neopit
The most prevalent vehicle ownership categories in Neopit are males with 2 vehicles (39, accounting for 43.8%) and females with 2 vehicles (47, making up 39.0%).
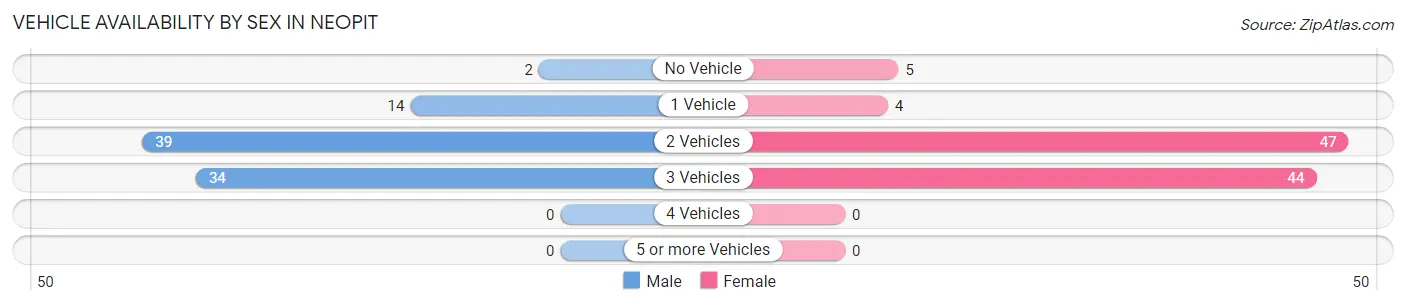
| Vehicles Available | Male | Female |
| No Vehicle | 2 (2.2%) | 5 (5.0%) |
| 1 Vehicle | 14 (15.7%) | 4 (4.0%) |
| 2 Vehicles | 39 (43.8%) | 47 (47.0%) |
| 3 Vehicles | 34 (38.2%) | 44 (44.0%) |
| 4 Vehicles | 0 (0.0%) | 0 (0.0%) |
| 5 or more Vehicles | 0 (0.0%) | 0 (0.0%) |
| Total | 89 (100.0%) | 100 (100.0%) |
Commute Time in Neopit
The most frequently occuring commute durations in Neopit are 30 to 34 minutes (59 commuters, 31.4%), 20 to 24 minutes (52 commuters, 27.7%), and less than 5 minutes (25 commuters, 13.3%).
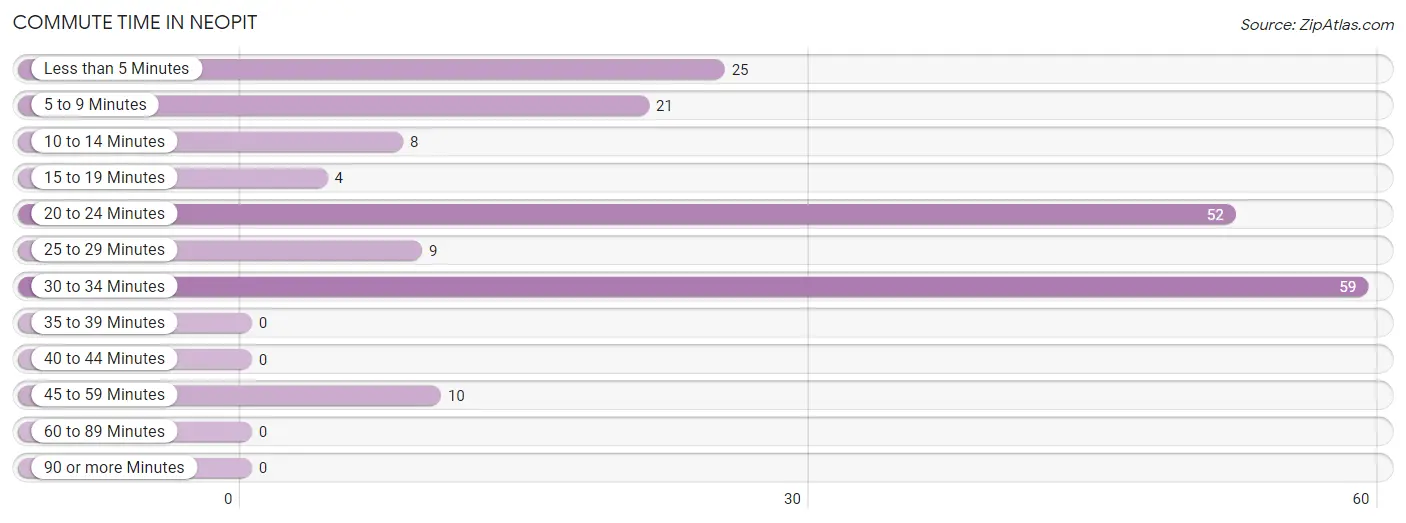
| Commute Time | # Commuters | % Commuters |
| Less than 5 Minutes | 25 | 13.3% |
| 5 to 9 Minutes | 21 | 11.2% |
| 10 to 14 Minutes | 8 | 4.3% |
| 15 to 19 Minutes | 4 | 2.1% |
| 20 to 24 Minutes | 52 | 27.7% |
| 25 to 29 Minutes | 9 | 4.8% |
| 30 to 34 Minutes | 59 | 31.4% |
| 35 to 39 Minutes | 0 | 0.0% |
| 40 to 44 Minutes | 0 | 0.0% |
| 45 to 59 Minutes | 10 | 5.3% |
| 60 to 89 Minutes | 0 | 0.0% |
| 90 or more Minutes | 0 | 0.0% |
Commute Time by Sex in Neopit
The most common commute times in Neopit are 30 to 34 minutes (37 commuters, 39.0%) for males and 20 to 24 minutes (45 commuters, 48.4%) for females.
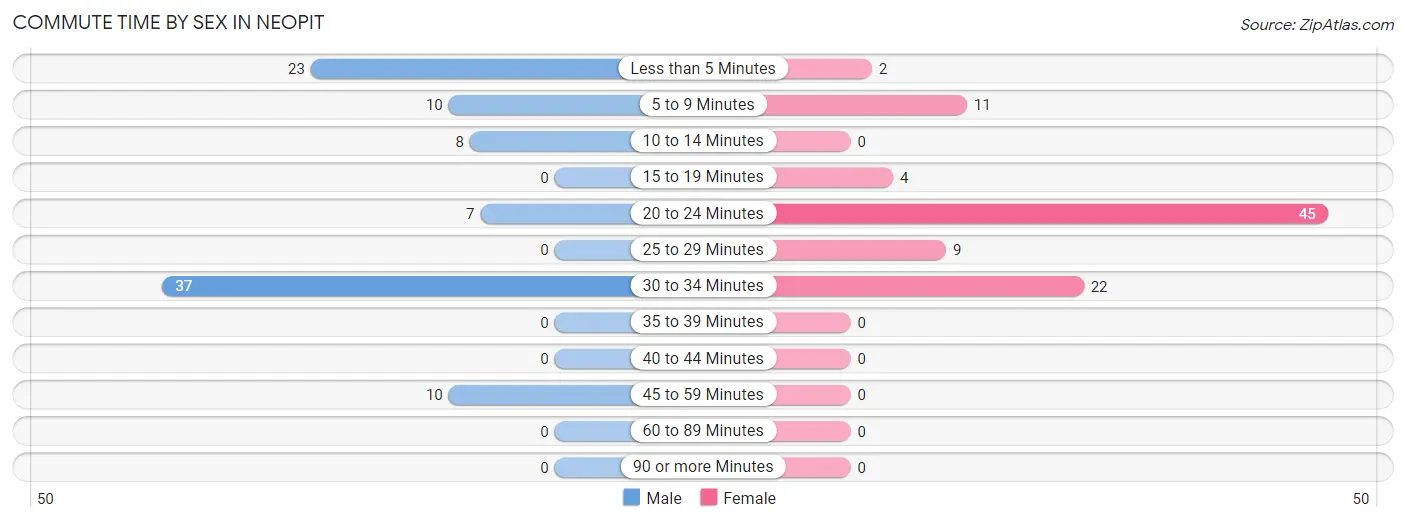
| Commute Time | Male | Female |
| Less than 5 Minutes | 23 (24.2%) | 2 (2.1%) |
| 5 to 9 Minutes | 10 (10.5%) | 11 (11.8%) |
| 10 to 14 Minutes | 8 (8.4%) | 0 (0.0%) |
| 15 to 19 Minutes | 0 (0.0%) | 4 (4.3%) |
| 20 to 24 Minutes | 7 (7.4%) | 45 (48.4%) |
| 25 to 29 Minutes | 0 (0.0%) | 9 (9.7%) |
| 30 to 34 Minutes | 37 (39.0%) | 22 (23.7%) |
| 35 to 39 Minutes | 0 (0.0%) | 0 (0.0%) |
| 40 to 44 Minutes | 0 (0.0%) | 0 (0.0%) |
| 45 to 59 Minutes | 10 (10.5%) | 0 (0.0%) |
| 60 to 89 Minutes | 0 (0.0%) | 0 (0.0%) |
| 90 or more Minutes | 0 (0.0%) | 0 (0.0%) |
Time of Departure to Work by Sex in Neopit
The most frequent times of departure to work in Neopit are 5:00 AM to 5:29 AM (37, 39.0%) for males and 7:30 AM to 7:59 AM (31, 33.3%) for females.
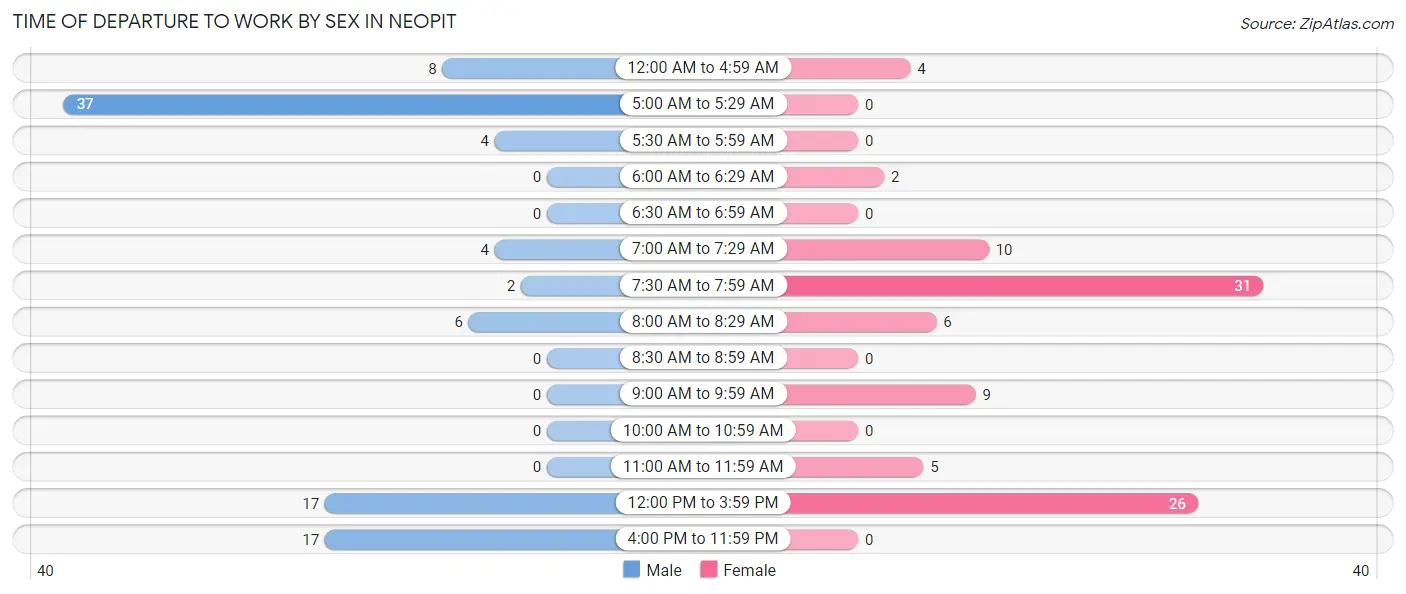
| Time of Departure | Male | Female |
| 12:00 AM to 4:59 AM | 8 (8.4%) | 4 (4.3%) |
| 5:00 AM to 5:29 AM | 37 (39.0%) | 0 (0.0%) |
| 5:30 AM to 5:59 AM | 4 (4.2%) | 0 (0.0%) |
| 6:00 AM to 6:29 AM | 0 (0.0%) | 2 (2.1%) |
| 6:30 AM to 6:59 AM | 0 (0.0%) | 0 (0.0%) |
| 7:00 AM to 7:29 AM | 4 (4.2%) | 10 (10.7%) |
| 7:30 AM to 7:59 AM | 2 (2.1%) | 31 (33.3%) |
| 8:00 AM to 8:29 AM | 6 (6.3%) | 6 (6.5%) |
| 8:30 AM to 8:59 AM | 0 (0.0%) | 0 (0.0%) |
| 9:00 AM to 9:59 AM | 0 (0.0%) | 9 (9.7%) |
| 10:00 AM to 10:59 AM | 0 (0.0%) | 0 (0.0%) |
| 11:00 AM to 11:59 AM | 0 (0.0%) | 5 (5.4%) |
| 12:00 PM to 3:59 PM | 17 (17.9%) | 26 (28.0%) |
| 4:00 PM to 11:59 PM | 17 (17.9%) | 0 (0.0%) |
| Total | 95 (100.0%) | 93 (100.0%) |
Housing Occupancy in Neopit
Occupancy by Ownership in Neopit
Of the total 185 dwellings in Neopit, owner-occupied units account for 123 (66.5%), while renter-occupied units make up 62 (33.5%).
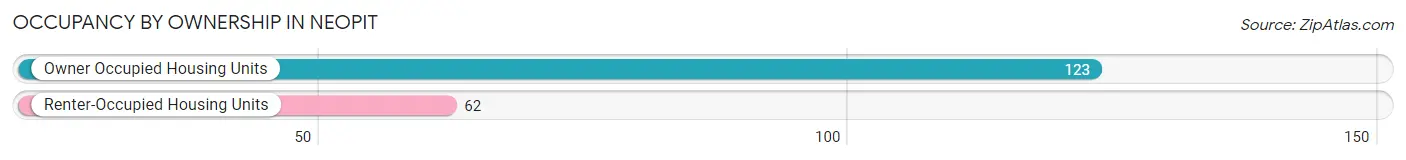
| Occupancy | # Housing Units | % Housing Units |
| Owner Occupied Housing Units | 123 | 66.5% |
| Renter-Occupied Housing Units | 62 | 33.5% |
| Total Occupied Housing Units | 185 | 100.0% |
Occupancy by Household Size in Neopit
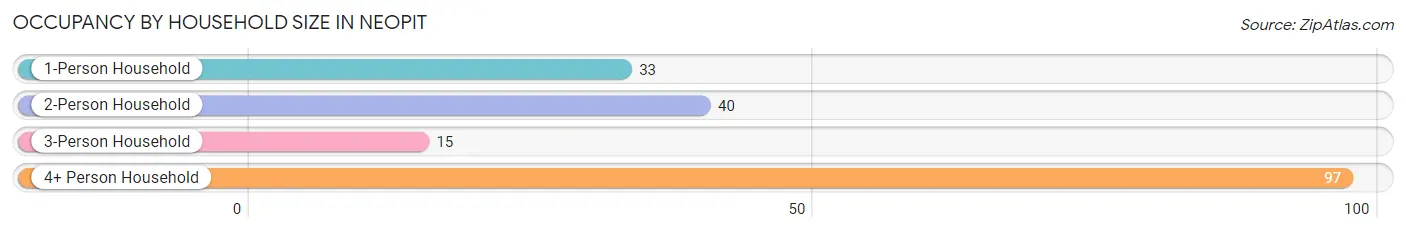
| Household Size | # Housing Units | % Housing Units |
| 1-Person Household | 33 | 17.8% |
| 2-Person Household | 40 | 21.6% |
| 3-Person Household | 15 | 8.1% |
| 4+ Person Household | 97 | 52.4% |
| Total Housing Units | 185 | 100.0% |
Occupancy by Ownership by Household Size in Neopit
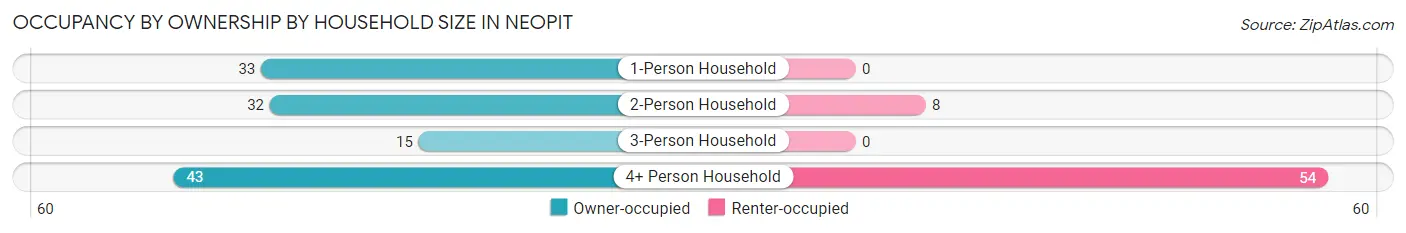
| Household Size | Owner-occupied | Renter-occupied |
| 1-Person Household | 33 (100.0%) | 0 (0.0%) |
| 2-Person Household | 32 (80.0%) | 8 (20.0%) |
| 3-Person Household | 15 (100.0%) | 0 (0.0%) |
| 4+ Person Household | 43 (44.3%) | 54 (55.7%) |
| Total Housing Units | 123 (66.5%) | 62 (33.5%) |
Occupancy by Educational Attainment in Neopit
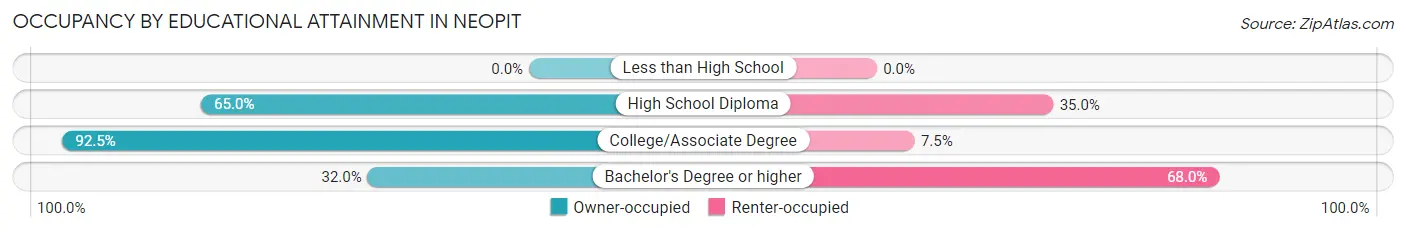
| Household Size | Owner-occupied | Renter-occupied |
| Less than High School | 0 (0.0%) | 0 (0.0%) |
| High School Diploma | 78 (65.0%) | 42 (35.0%) |
| College/Associate Degree | 37 (92.5%) | 3 (7.5%) |
| Bachelor's Degree or higher | 8 (32.0%) | 17 (68.0%) |
Occupancy by Age of Householder in Neopit
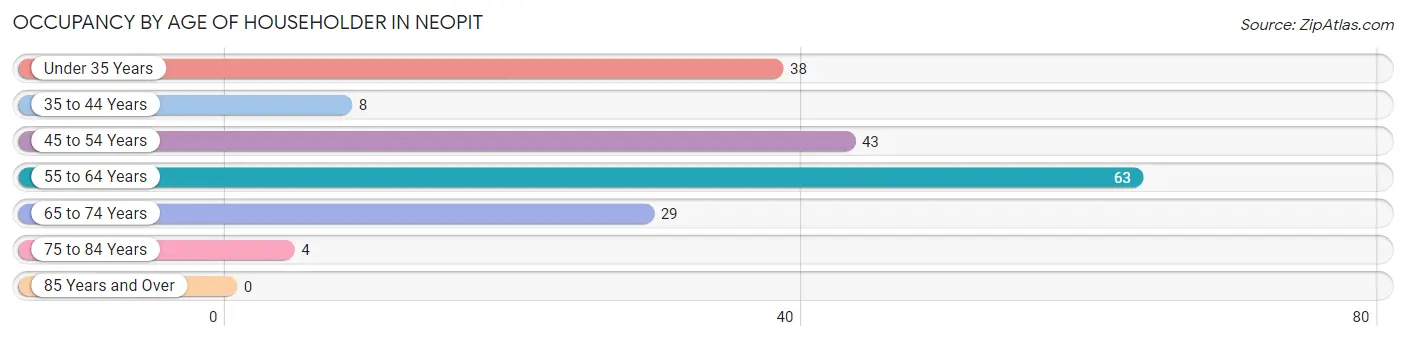
| Age Bracket | # Households | % Households |
| Under 35 Years | 38 | 20.5% |
| 35 to 44 Years | 8 | 4.3% |
| 45 to 54 Years | 43 | 23.2% |
| 55 to 64 Years | 63 | 34.1% |
| 65 to 74 Years | 29 | 15.7% |
| 75 to 84 Years | 4 | 2.2% |
| 85 Years and Over | 0 | 0.0% |
| Total | 185 | 100.0% |
Housing Finances in Neopit
Median Income by Occupancy in Neopit
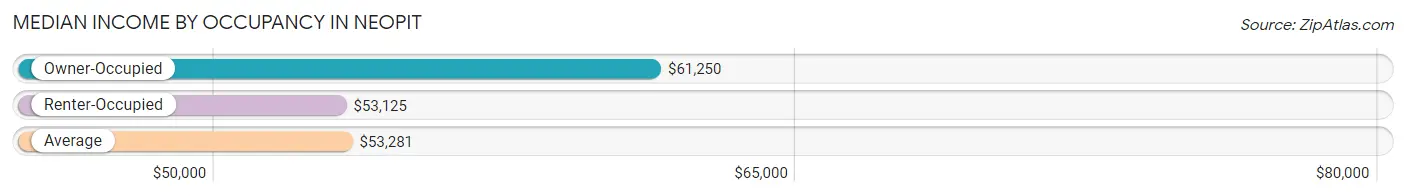
| Occupancy Type | # Households | Median Income |
| Owner-Occupied | 123 (66.5%) | $61,250 |
| Renter-Occupied | 62 (33.5%) | $53,125 |
| Average | 185 (100.0%) | $53,281 |
Occupancy by Householder Income Bracket in Neopit
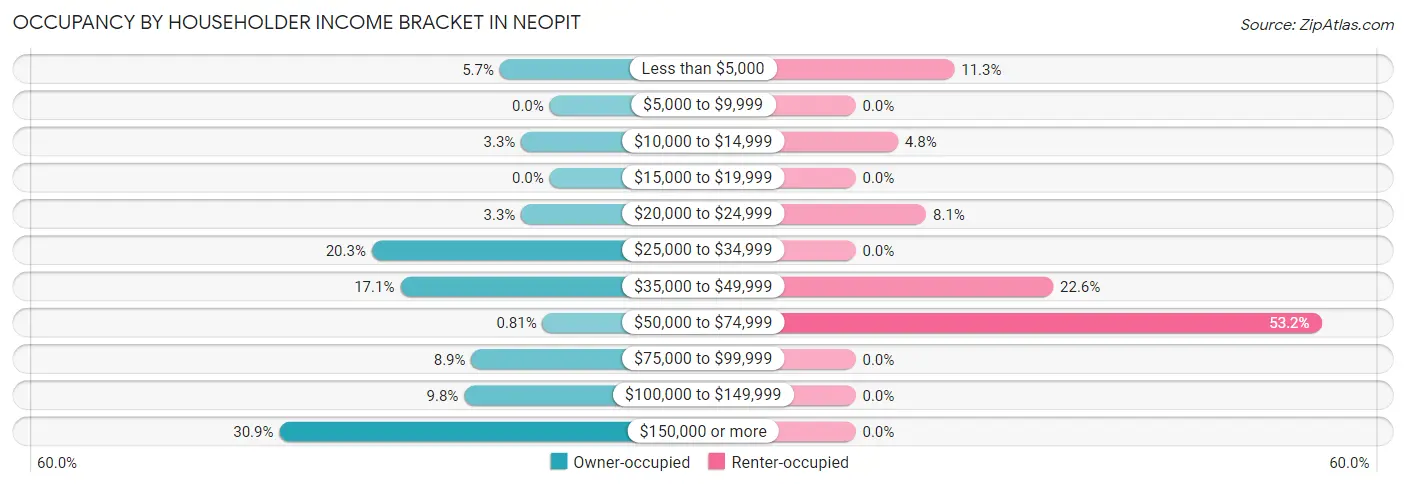
| Income Bracket | Owner-occupied | Renter-occupied |
| Less than $5,000 | 7 (5.7%) | 7 (11.3%) |
| $5,000 to $9,999 | 0 (0.0%) | 0 (0.0%) |
| $10,000 to $14,999 | 4 (3.3%) | 3 (4.8%) |
| $15,000 to $19,999 | 0 (0.0%) | 0 (0.0%) |
| $20,000 to $24,999 | 4 (3.3%) | 5 (8.1%) |
| $25,000 to $34,999 | 25 (20.3%) | 0 (0.0%) |
| $35,000 to $49,999 | 21 (17.1%) | 14 (22.6%) |
| $50,000 to $74,999 | 1 (0.8%) | 33 (53.2%) |
| $75,000 to $99,999 | 11 (8.9%) | 0 (0.0%) |
| $100,000 to $149,999 | 12 (9.8%) | 0 (0.0%) |
| $150,000 or more | 38 (30.9%) | 0 (0.0%) |
| Total | 123 (100.0%) | 62 (100.0%) |
Monthly Housing Cost Tiers in Neopit
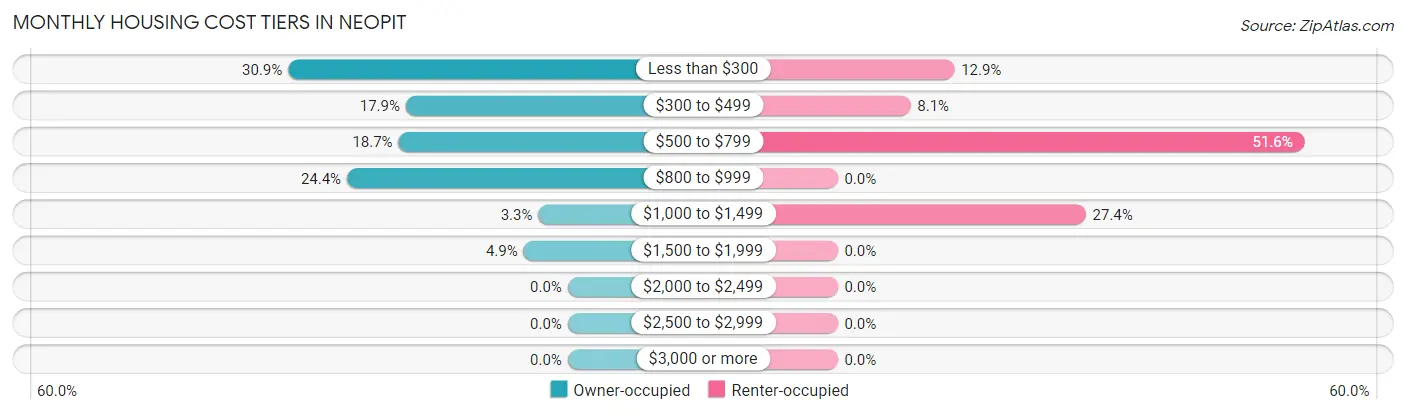
| Monthly Cost | Owner-occupied | Renter-occupied |
| Less than $300 | 38 (30.9%) | 8 (12.9%) |
| $300 to $499 | 22 (17.9%) | 5 (8.1%) |
| $500 to $799 | 23 (18.7%) | 32 (51.6%) |
| $800 to $999 | 30 (24.4%) | 0 (0.0%) |
| $1,000 to $1,499 | 4 (3.3%) | 17 (27.4%) |
| $1,500 to $1,999 | 6 (4.9%) | 0 (0.0%) |
| $2,000 to $2,499 | 0 (0.0%) | 0 (0.0%) |
| $2,500 to $2,999 | 0 (0.0%) | 0 (0.0%) |
| $3,000 or more | 0 (0.0%) | 0 (0.0%) |
| Total | 123 (100.0%) | 62 (100.0%) |
Physical Housing Characteristics in Neopit
Housing Structures in Neopit
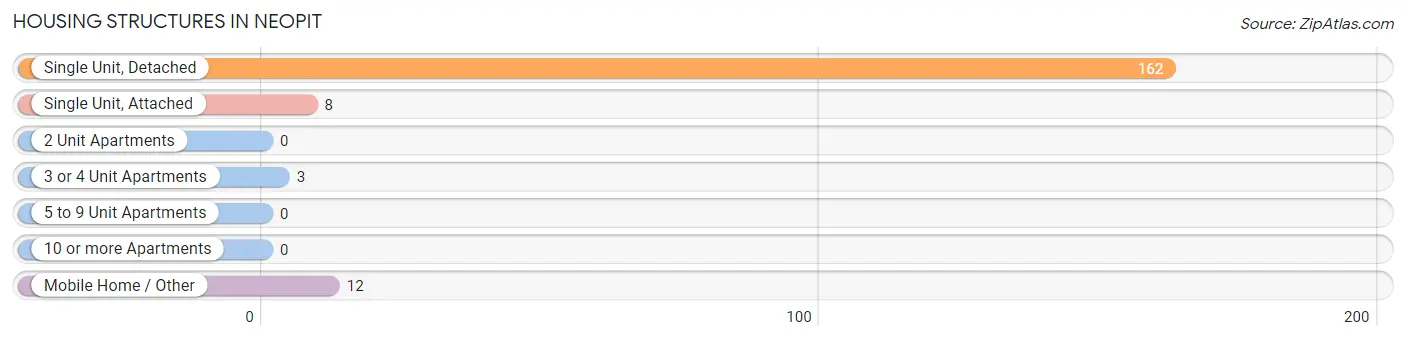
| Structure Type | # Housing Units | % Housing Units |
| Single Unit, Detached | 162 | 87.6% |
| Single Unit, Attached | 8 | 4.3% |
| 2 Unit Apartments | 0 | 0.0% |
| 3 or 4 Unit Apartments | 3 | 1.6% |
| 5 to 9 Unit Apartments | 0 | 0.0% |
| 10 or more Apartments | 0 | 0.0% |
| Mobile Home / Other | 12 | 6.5% |
| Total | 185 | 100.0% |
Housing Structures by Occupancy in Neopit
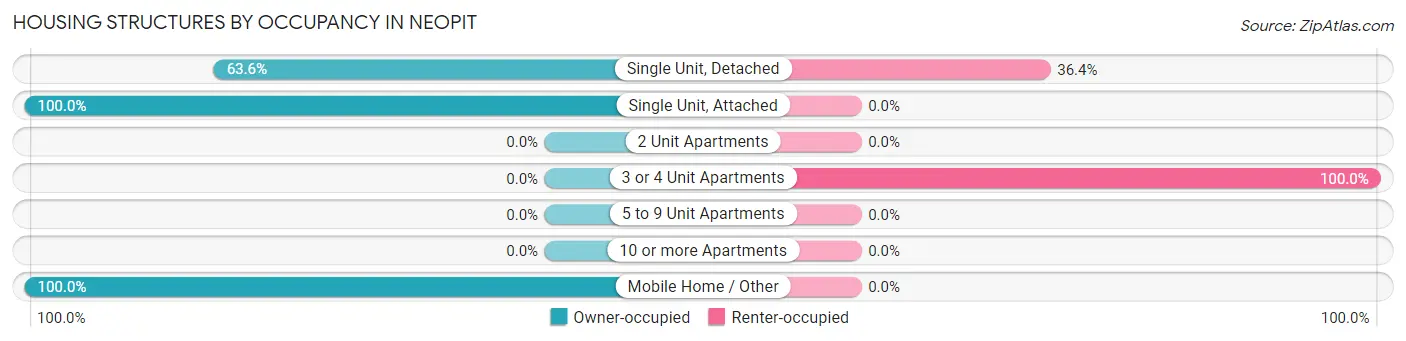
| Structure Type | Owner-occupied | Renter-occupied |
| Single Unit, Detached | 103 (63.6%) | 59 (36.4%) |
| Single Unit, Attached | 8 (100.0%) | 0 (0.0%) |
| 2 Unit Apartments | 0 (0.0%) | 0 (0.0%) |
| 3 or 4 Unit Apartments | 0 (0.0%) | 3 (100.0%) |
| 5 to 9 Unit Apartments | 0 (0.0%) | 0 (0.0%) |
| 10 or more Apartments | 0 (0.0%) | 0 (0.0%) |
| Mobile Home / Other | 12 (100.0%) | 0 (0.0%) |
| Total | 123 (66.5%) | 62 (33.5%) |
Housing Structures by Number of Rooms in Neopit
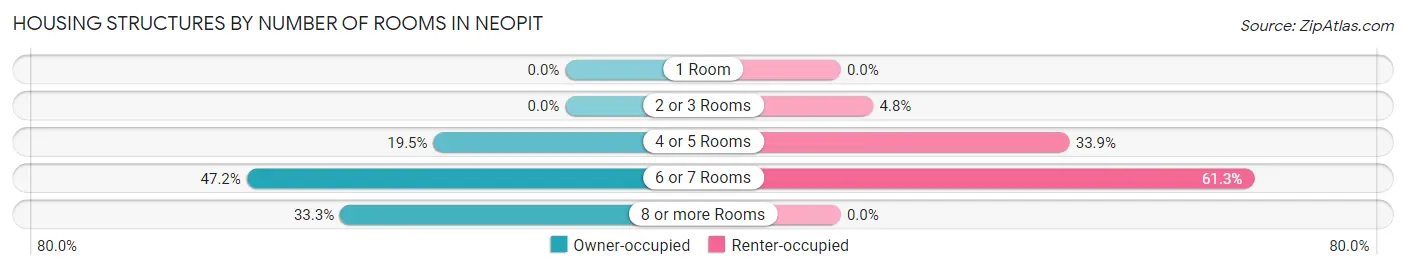
| Number of Rooms | Owner-occupied | Renter-occupied |
| 1 Room | 0 (0.0%) | 0 (0.0%) |
| 2 or 3 Rooms | 0 (0.0%) | 3 (4.8%) |
| 4 or 5 Rooms | 24 (19.5%) | 21 (33.9%) |
| 6 or 7 Rooms | 58 (47.1%) | 38 (61.3%) |
| 8 or more Rooms | 41 (33.3%) | 0 (0.0%) |
| Total | 123 (100.0%) | 62 (100.0%) |
Housing Structure by Heating Type in Neopit
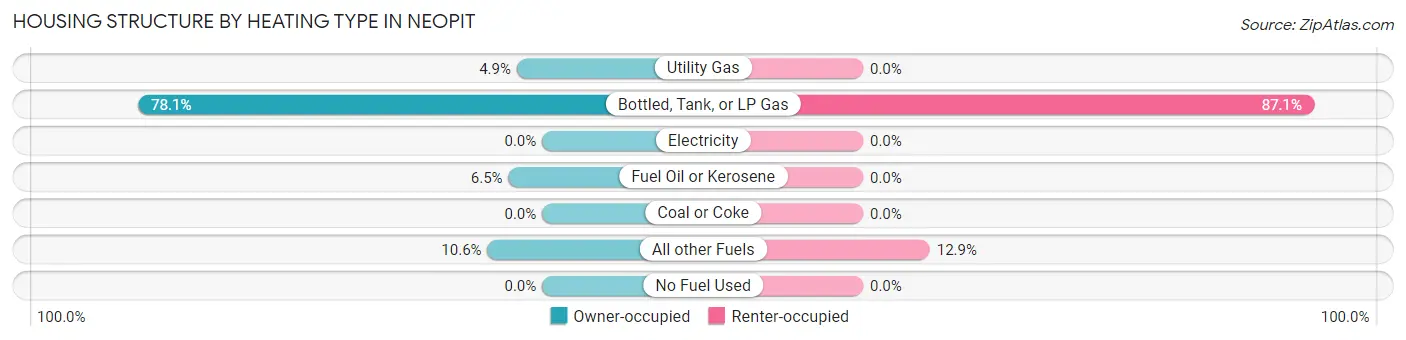
| Heating Type | Owner-occupied | Renter-occupied |
| Utility Gas | 6 (4.9%) | 0 (0.0%) |
| Bottled, Tank, or LP Gas | 96 (78.0%) | 54 (87.1%) |
| Electricity | 0 (0.0%) | 0 (0.0%) |
| Fuel Oil or Kerosene | 8 (6.5%) | 0 (0.0%) |
| Coal or Coke | 0 (0.0%) | 0 (0.0%) |
| All other Fuels | 13 (10.6%) | 8 (12.9%) |
| No Fuel Used | 0 (0.0%) | 0 (0.0%) |
| Total | 123 (100.0%) | 62 (100.0%) |
Household Vehicle Usage in Neopit
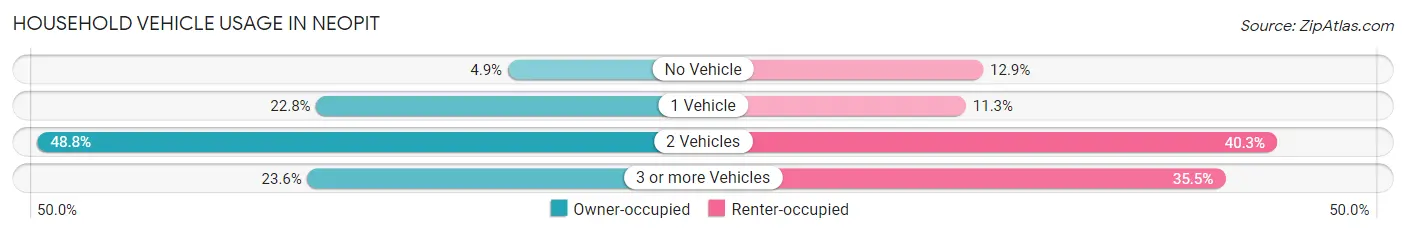
| Vehicles per Household | Owner-occupied | Renter-occupied |
| No Vehicle | 6 (4.9%) | 8 (12.9%) |
| 1 Vehicle | 28 (22.8%) | 7 (11.3%) |
| 2 Vehicles | 60 (48.8%) | 25 (40.3%) |
| 3 or more Vehicles | 29 (23.6%) | 22 (35.5%) |
| Total | 123 (100.0%) | 62 (100.0%) |
Real Estate & Mortgages in Neopit
Real Estate and Mortgage Overview in Neopit
| Characteristic | Without Mortgage | With Mortgage |
| Housing Units | 113 | 10 |
| Median Property Value | - | - |
| Median Household Income | - | - |
| Monthly Housing Costs | - | - |
| Real Estate Taxes | - | - |
Property Value by Mortgage Status in Neopit
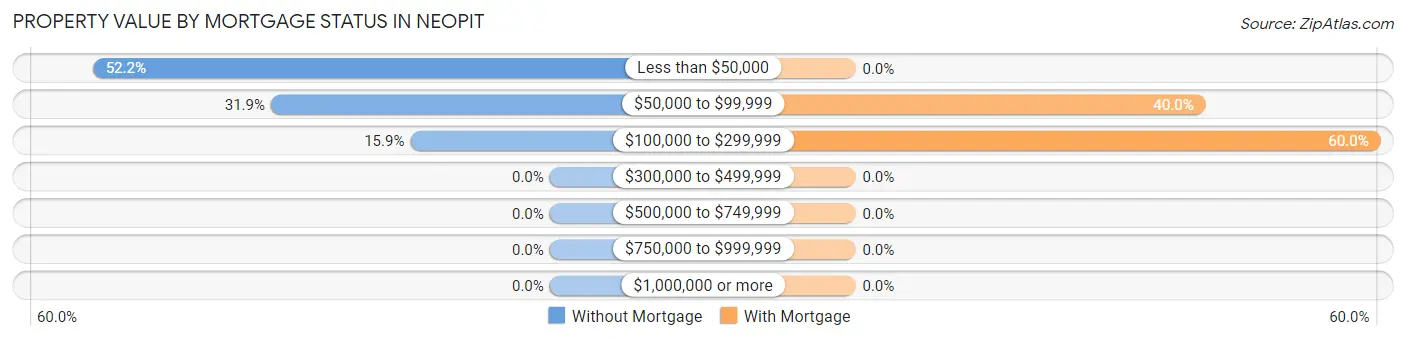
| Property Value | Without Mortgage | With Mortgage |
| Less than $50,000 | 59 (52.2%) | 0 (0.0%) |
| $50,000 to $99,999 | 36 (31.9%) | 4 (40.0%) |
| $100,000 to $299,999 | 18 (15.9%) | 6 (60.0%) |
| $300,000 to $499,999 | 0 (0.0%) | 0 (0.0%) |
| $500,000 to $749,999 | 0 (0.0%) | 0 (0.0%) |
| $750,000 to $999,999 | 0 (0.0%) | 0 (0.0%) |
| $1,000,000 or more | 0 (0.0%) | 0 (0.0%) |
| Total | 113 (100.0%) | 10 (100.0%) |
Household Income by Mortgage Status in Neopit
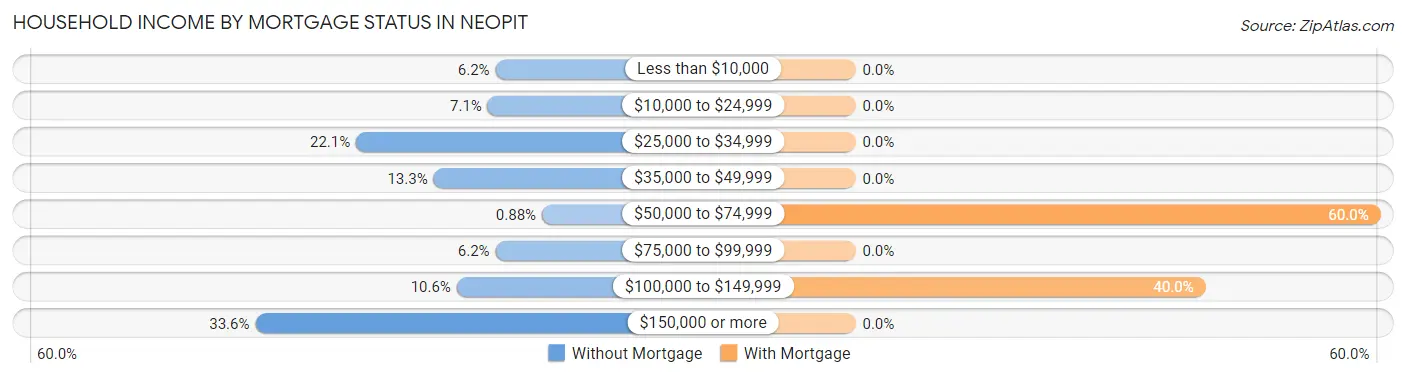
| Household Income | Without Mortgage | With Mortgage |
| Less than $10,000 | 7 (6.2%) | 0 (0.0%) |
| $10,000 to $24,999 | 8 (7.1%) | 0 (0.0%) |
| $25,000 to $34,999 | 25 (22.1%) | 0 (0.0%) |
| $35,000 to $49,999 | 15 (13.3%) | 0 (0.0%) |
| $50,000 to $74,999 | 1 (0.9%) | 6 (60.0%) |
| $75,000 to $99,999 | 7 (6.2%) | 0 (0.0%) |
| $100,000 to $149,999 | 12 (10.6%) | 4 (40.0%) |
| $150,000 or more | 38 (33.6%) | 0 (0.0%) |
| Total | 113 (100.0%) | 10 (100.0%) |
Property Value to Household Income Ratio in Neopit
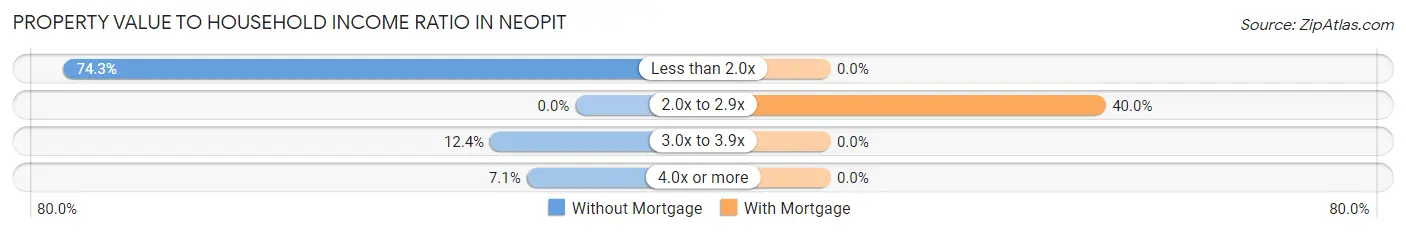
| Value-to-Income Ratio | Without Mortgage | With Mortgage |
| Less than 2.0x | 84 (74.3%) | 0 (0.0%) |
| 2.0x to 2.9x | 0 (0.0%) | 4 (40.0%) |
| 3.0x to 3.9x | 14 (12.4%) | 0 (0.0%) |
| 4.0x or more | 8 (7.1%) | 0 (0.0%) |
| Total | 113 (100.0%) | 10 (100.0%) |
Real Estate Taxes by Mortgage Status in Neopit
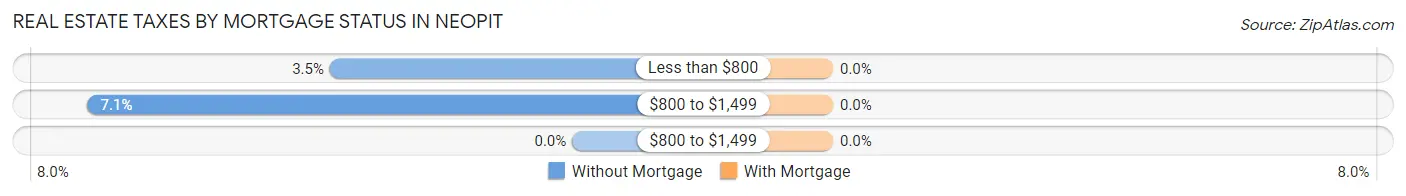
| Property Taxes | Without Mortgage | With Mortgage |
| Less than $800 | 4 (3.5%) | 0 (0.0%) |
| $800 to $1,499 | 8 (7.1%) | 0 (0.0%) |
| $800 to $1,499 | 0 (0.0%) | 0 (0.0%) |
| Total | 113 (100.0%) | 10 (100.0%) |
Health & Disability in Neopit
Health Insurance Coverage by Age in Neopit
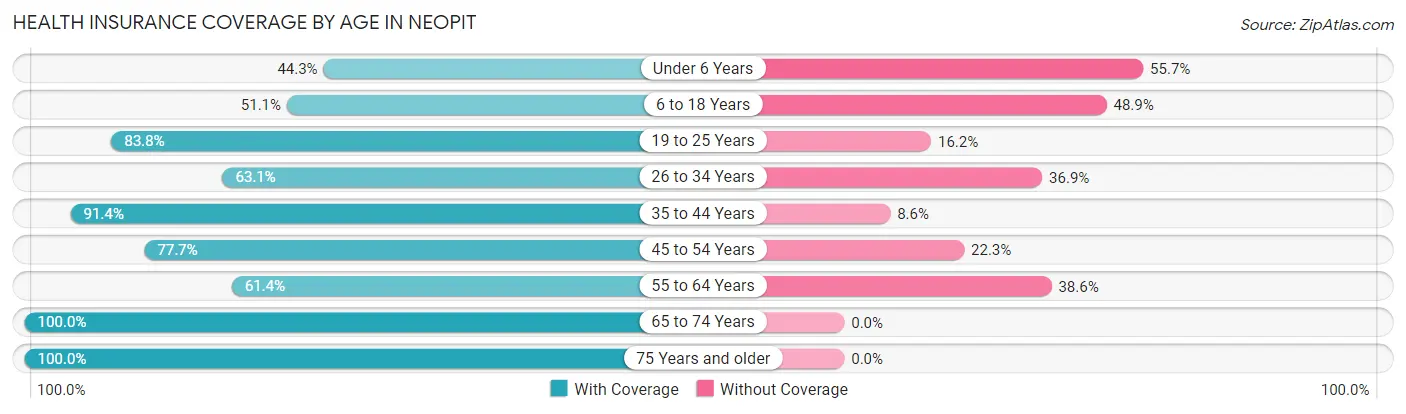
| Age Bracket | With Coverage | Without Coverage |
| Under 6 Years | 58 (44.3%) | 73 (55.7%) |
| 6 to 18 Years | 70 (51.1%) | 67 (48.9%) |
| 19 to 25 Years | 57 (83.8%) | 11 (16.2%) |
| 26 to 34 Years | 53 (63.1%) | 31 (36.9%) |
| 35 to 44 Years | 32 (91.4%) | 3 (8.6%) |
| 45 to 54 Years | 73 (77.7%) | 21 (22.3%) |
| 55 to 64 Years | 54 (61.4%) | 34 (38.6%) |
| 65 to 74 Years | 44 (100.0%) | 0 (0.0%) |
| 75 Years and older | 4 (100.0%) | 0 (0.0%) |
| Total | 445 (65.0%) | 240 (35.0%) |
Health Insurance Coverage by Citizenship Status in Neopit
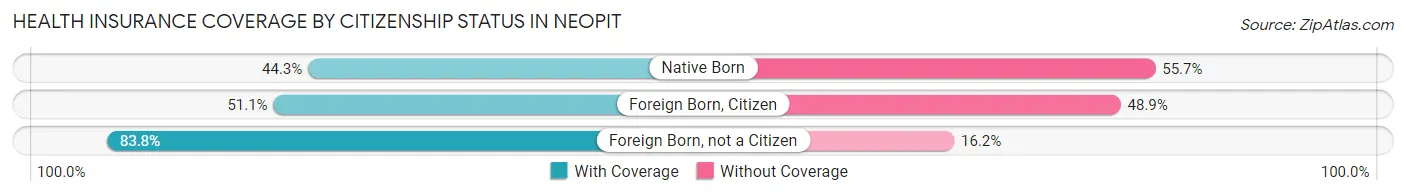
| Citizenship Status | With Coverage | Without Coverage |
| Native Born | 58 (44.3%) | 73 (55.7%) |
| Foreign Born, Citizen | 70 (51.1%) | 67 (48.9%) |
| Foreign Born, not a Citizen | 57 (83.8%) | 11 (16.2%) |
Health Insurance Coverage by Household Income in Neopit
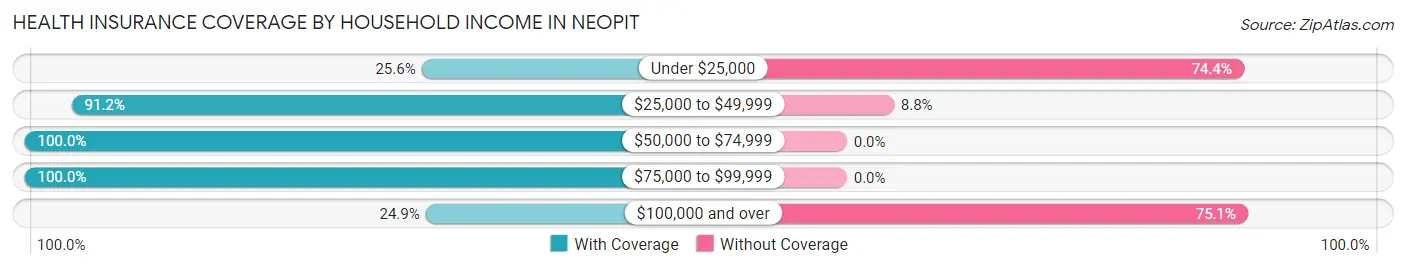
| Household Income | With Coverage | Without Coverage |
| Under $25,000 | 20 (25.6%) | 58 (74.4%) |
| $25,000 to $49,999 | 145 (91.2%) | 14 (8.8%) |
| $50,000 to $74,999 | 185 (100.0%) | 0 (0.0%) |
| $75,000 to $99,999 | 24 (100.0%) | 0 (0.0%) |
| $100,000 and over | 52 (24.9%) | 157 (75.1%) |
Public vs Private Health Insurance Coverage by Age in Neopit
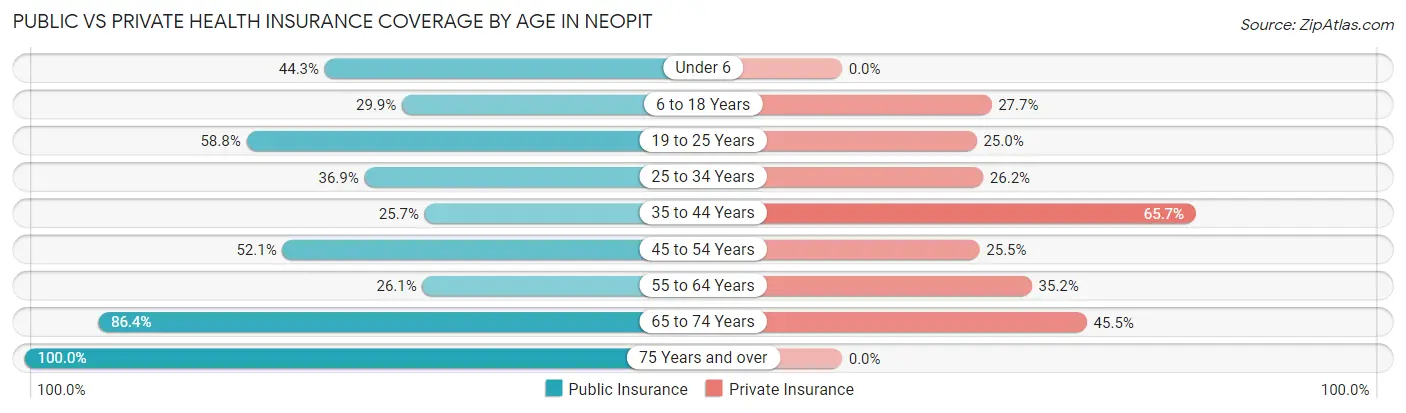
| Age Bracket | Public Insurance | Private Insurance |
| Under 6 | 58 (44.3%) | 0 (0.0%) |
| 6 to 18 Years | 41 (29.9%) | 38 (27.7%) |
| 19 to 25 Years | 40 (58.8%) | 17 (25.0%) |
| 25 to 34 Years | 31 (36.9%) | 22 (26.2%) |
| 35 to 44 Years | 9 (25.7%) | 23 (65.7%) |
| 45 to 54 Years | 49 (52.1%) | 24 (25.5%) |
| 55 to 64 Years | 23 (26.1%) | 31 (35.2%) |
| 65 to 74 Years | 38 (86.4%) | 20 (45.5%) |
| 75 Years and over | 4 (100.0%) | 0 (0.0%) |
| Total | 293 (42.8%) | 175 (25.6%) |
Disability Status by Sex by Age in Neopit
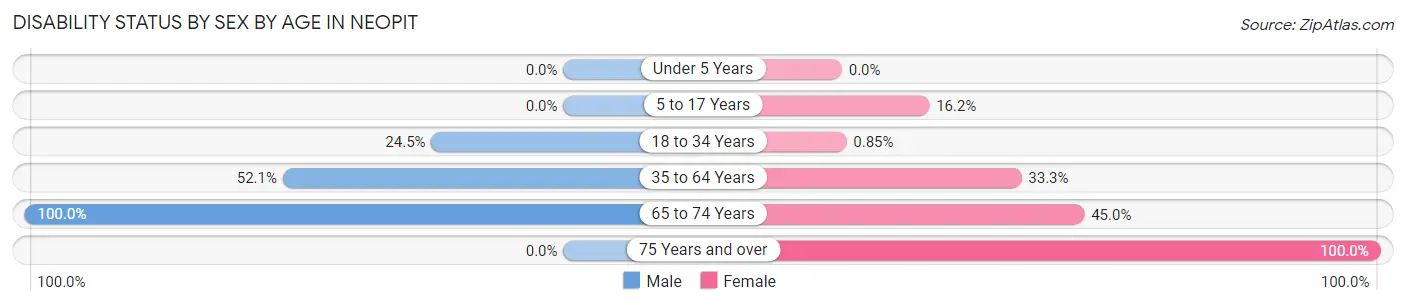
| Age Bracket | Male | Female |
| Under 5 Years | 0 (0.0%) | 0 (0.0%) |
| 5 to 17 Years | 0 (0.0%) | 12 (16.2%) |
| 18 to 34 Years | 12 (24.5%) | 1 (0.9%) |
| 35 to 64 Years | 63 (52.1%) | 32 (33.3%) |
| 65 to 74 Years | 24 (100.0%) | 9 (45.0%) |
| 75 Years and over | 0 (0.0%) | 4 (100.0%) |
Disability Class by Sex by Age in Neopit
Disability Class: Hearing Difficulty
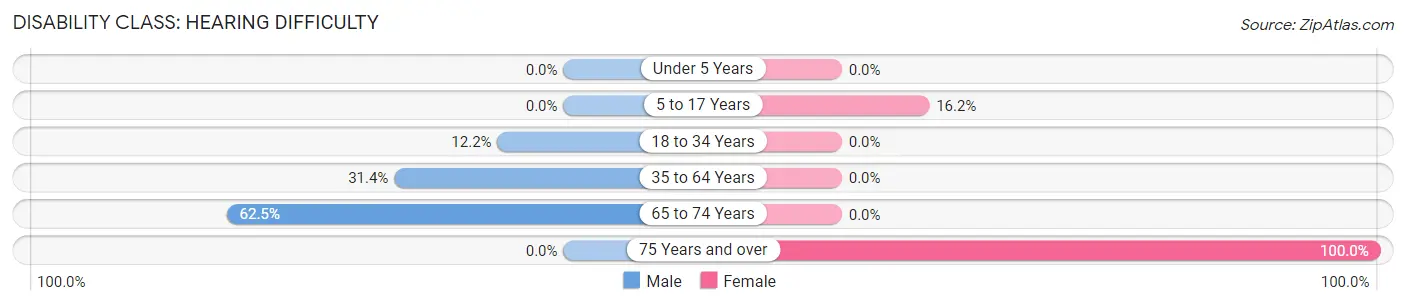
| Age Bracket | Male | Female |
| Under 5 Years | 0 (0.0%) | 0 (0.0%) |
| 5 to 17 Years | 0 (0.0%) | 12 (16.2%) |
| 18 to 34 Years | 6 (12.2%) | 0 (0.0%) |
| 35 to 64 Years | 38 (31.4%) | 0 (0.0%) |
| 65 to 74 Years | 15 (62.5%) | 0 (0.0%) |
| 75 Years and over | 0 (0.0%) | 4 (100.0%) |
Disability Class: Vision Difficulty
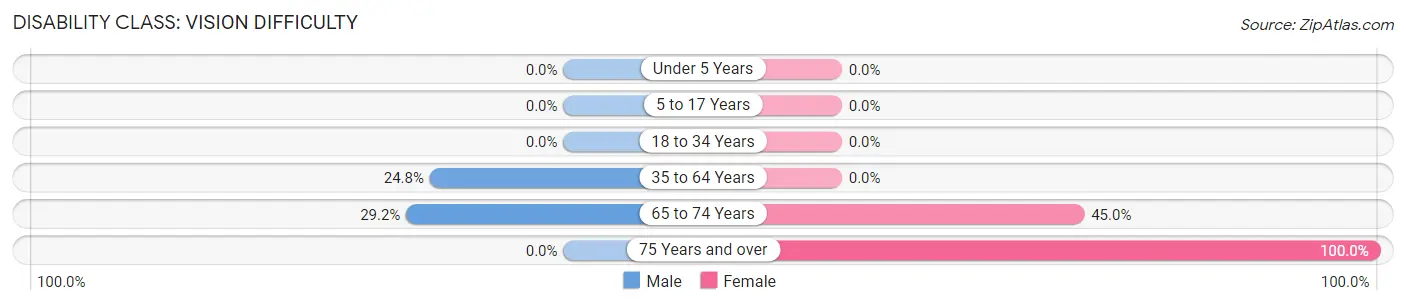
| Age Bracket | Male | Female |
| Under 5 Years | 0 (0.0%) | 0 (0.0%) |
| 5 to 17 Years | 0 (0.0%) | 0 (0.0%) |
| 18 to 34 Years | 0 (0.0%) | 0 (0.0%) |
| 35 to 64 Years | 30 (24.8%) | 0 (0.0%) |
| 65 to 74 Years | 7 (29.2%) | 9 (45.0%) |
| 75 Years and over | 0 (0.0%) | 4 (100.0%) |
Disability Class: Cognitive Difficulty
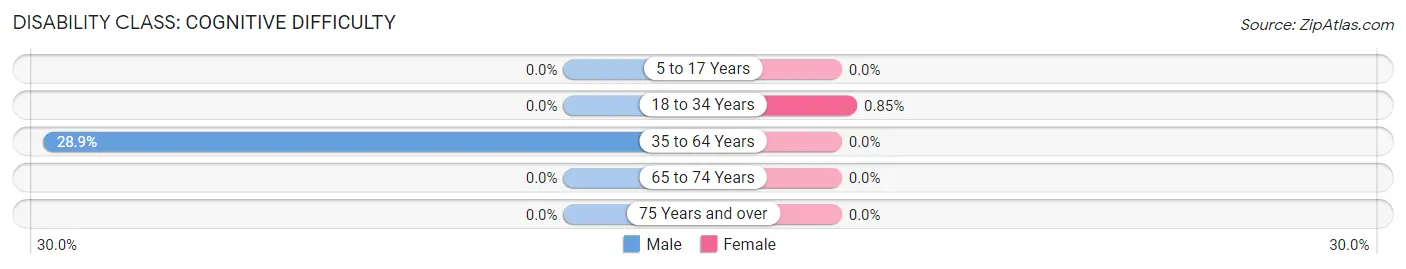
| Age Bracket | Male | Female |
| 5 to 17 Years | 0 (0.0%) | 0 (0.0%) |
| 18 to 34 Years | 0 (0.0%) | 1 (0.9%) |
| 35 to 64 Years | 35 (28.9%) | 0 (0.0%) |
| 65 to 74 Years | 0 (0.0%) | 0 (0.0%) |
| 75 Years and over | 0 (0.0%) | 0 (0.0%) |
Disability Class: Ambulatory Difficulty
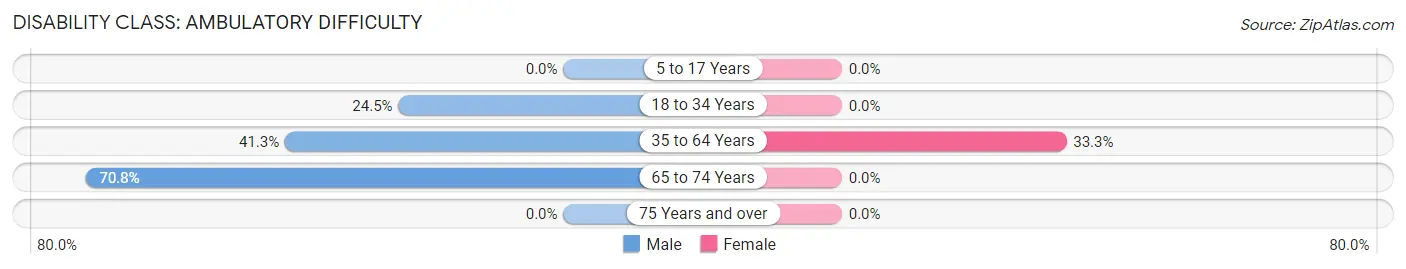
| Age Bracket | Male | Female |
| 5 to 17 Years | 0 (0.0%) | 0 (0.0%) |
| 18 to 34 Years | 12 (24.5%) | 0 (0.0%) |
| 35 to 64 Years | 50 (41.3%) | 32 (33.3%) |
| 65 to 74 Years | 17 (70.8%) | 0 (0.0%) |
| 75 Years and over | 0 (0.0%) | 0 (0.0%) |
Disability Class: Self-Care Difficulty
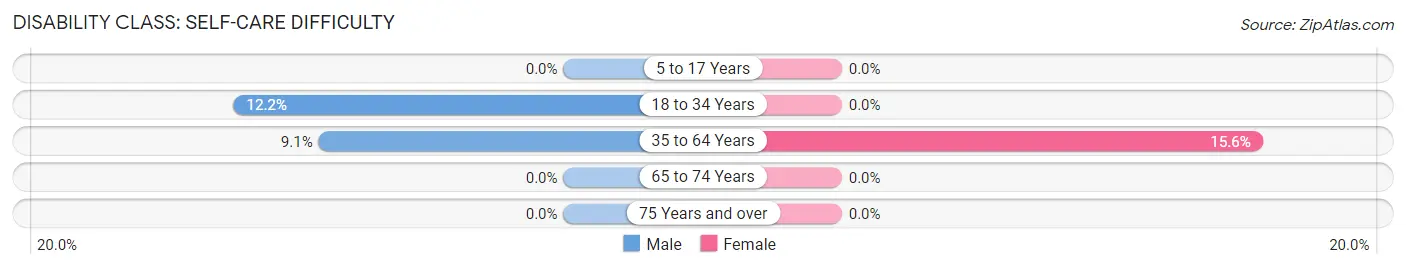
| Age Bracket | Male | Female |
| 5 to 17 Years | 0 (0.0%) | 0 (0.0%) |
| 18 to 34 Years | 6 (12.2%) | 0 (0.0%) |
| 35 to 64 Years | 11 (9.1%) | 15 (15.6%) |
| 65 to 74 Years | 0 (0.0%) | 0 (0.0%) |
| 75 Years and over | 0 (0.0%) | 0 (0.0%) |
Technology Access in Neopit
Computing Device Access in Neopit
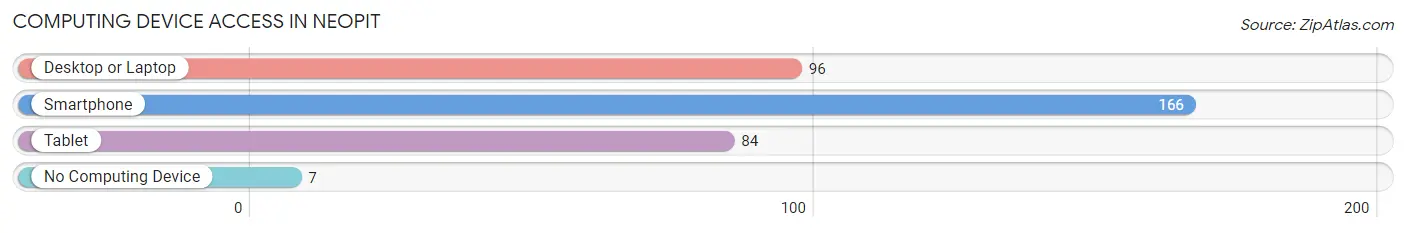
| Device Type | # Households | % Households |
| Desktop or Laptop | 96 | 51.9% |
| Smartphone | 166 | 89.7% |
| Tablet | 84 | 45.4% |
| No Computing Device | 7 | 3.8% |
| Total | 185 | 100.0% |
Internet Access in Neopit
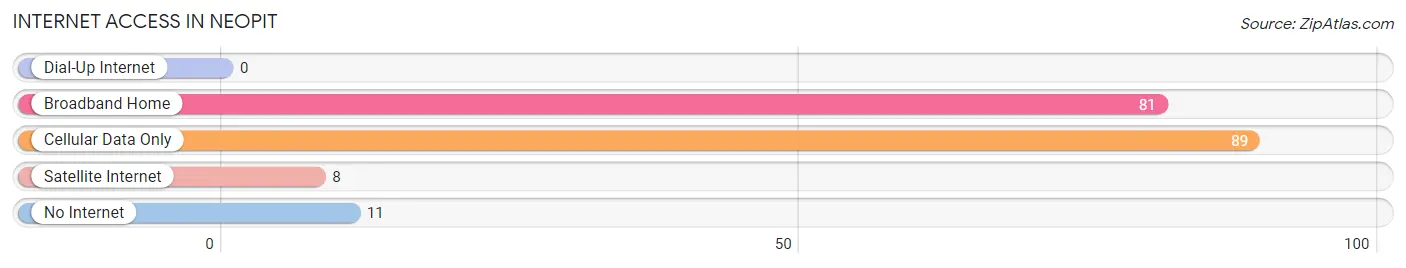
| Internet Type | # Households | % Households |
| Dial-Up Internet | 0 | 0.0% |
| Broadband Home | 81 | 43.8% |
| Cellular Data Only | 89 | 48.1% |
| Satellite Internet | 8 | 4.3% |
| No Internet | 11 | 5.9% |
| Total | 185 | 100.0% |
Neopit Summary
Neopit is a small unincorporated community located in Menominee County, Wisconsin, United States. It is situated on the banks of the Wolf River, near the border with the Menominee Indian Reservation. The population of Neopit was estimated to be around 200 people in 2000.
History
Neopit was first settled in the late 19th century by a group of Menominee Indians. The name Neopit is derived from the Menominee word for “place of the pines”. The community was originally a trading post and a lumber camp. In the early 20th century, Neopit became a popular destination for tourists and hunters.
Geography
Neopit is located in the Wolf River Valley, which is part of the Central Plain region of Wisconsin. The terrain is mostly flat, with some rolling hills. The Wolf River runs through the valley, and is a popular destination for fishing and canoeing. The area is heavily forested, with a mix of hardwood and coniferous trees.
Economy
The economy of Neopit is largely based on tourism and forestry. The area is popular with hunters and fishermen, and there are several resorts and campgrounds in the area. The Wolf River is also a popular destination for canoeing and kayaking. The forestry industry is also important to the local economy, with several sawmills and logging companies operating in the area.
Demographics
As of the 2000 census, the population of Neopit was estimated to be around 200 people. The racial makeup of the town was 97.5% Native American, 0.5% White, and 2.0% from other races. The median household income was $20,000, and the median family income was $25,000. The per capita income was $10,000.
Conclusion
Neopit is a small unincorporated community located in Menominee County, Wisconsin. It is situated on the banks of the Wolf River, near the border with the Menominee Indian Reservation. The population of Neopit was estimated to be around 200 people in 2000. The economy of Neopit is largely based on tourism and forestry, and the area is popular with hunters and fishermen. The racial makeup of the town was 97.5% Native American, 0.5% White, and 2.0% from other races. The median household income was $20,000, and the median family income was $25,000.
Common Questions
What is Per Capita Income in Neopit?
Per Capita income in Neopit is $15,424.
What is the Median Family Income in Neopit?
Median Family Income in Neopit is $61,250.
What is the Median Household income in Neopit?
Median Household Income in Neopit is $53,281.
What is Inequality or Gini Index in Neopit?
Inequality or Gini Index in Neopit is 0.43.
What is the Total Population of Neopit?
Total Population of Neopit is 685.
What is the Total Male Population of Neopit?
Total Male Population of Neopit is 318.
What is the Total Female Population of Neopit?
Total Female Population of Neopit is 367.
What is the Ratio of Males per 100 Females in Neopit?
There are 86.65 Males per 100 Females in Neopit.
What is the Ratio of Females per 100 Males in Neopit?
There are 115.41 Females per 100 Males in Neopit.
What is the Median Population Age in Neopit?
Median Population Age in Neopit is 26.3 Years.
What is the Average Family Size in Neopit
Average Family Size in Neopit is 4.1 People.
What is the Average Household Size in Neopit
Average Household Size in Neopit is 3.5 People.
How Large is the Labor Force in Neopit?
There are 216 People in the Labor Forcein in Neopit.
What is the Percentage of People in the Labor Force in Neopit?
48.2% of People are in the Labor Force in Neopit.
What is the Unemployment Rate in Neopit?
Unemployment Rate in Neopit is 8.8%.