Nelson, WI Map & Demographics
Nelson Map
Nelson Overview
$31,166
PER CAPITA INCOME
$68,333
AVG FAMILY INCOME
$64,375
AVG HOUSEHOLD INCOME
36.1%
WAGE / INCOME GAP [ % ]
63.9¢/ $1
WAGE / INCOME GAP [ $ ]
$7,750
FAMILY INCOME DEFICIT
0.34
INEQUALITY / GINI INDEX
341
TOTAL POPULATION
165
MALE POPULATION
176
FEMALE POPULATION
93.75
MALES / 100 FEMALES
106.67
FEMALES / 100 MALES
45.9
MEDIAN AGE
2.8
AVG FAMILY SIZE
2.2
AVG HOUSEHOLD SIZE
154
LABOR FORCE [ PEOPLE ]
57.0%
PERCENT IN LABOR FORCE
Nelson Zip Codes
Nelson Area Codes
Income in Nelson
Income Overview in Nelson
Per Capita Income in Nelson is $31,166, while median incomes of families and households are $68,333 and $64,375 respectively.
| Characteristic | Number | Measure |
| Per Capita Income | 341 | $31,166 |
| Median Family Income | 82 | $68,333 |
| Mean Family Income | 82 | $73,034 |
| Median Household Income | 158 | $64,375 |
| Mean Household Income | 158 | $64,035 |
| Income Deficit | 82 | $7,750 |
| Wage / Income Gap (%) | 341 | 36.11% |
| Wage / Income Gap ($) | 341 | 63.89¢ per $1 |
| Gini / Inequality Index | 341 | 0.34 |
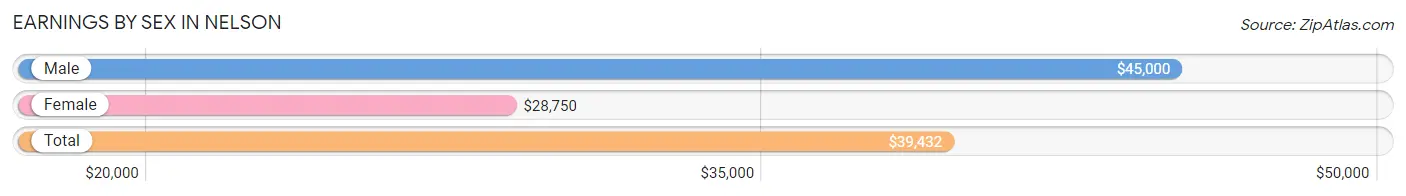
Earnings by Sex in Nelson
Average Earnings in Nelson are $39,432, $45,000 for men and $28,750 for women, a difference of 36.1%.
| Sex | Number | Average Earnings |
| Male | 90 (53.9%) | $45,000 |
| Female | 77 (46.1%) | $28,750 |
| Total | 167 (100.0%) | $39,432 |
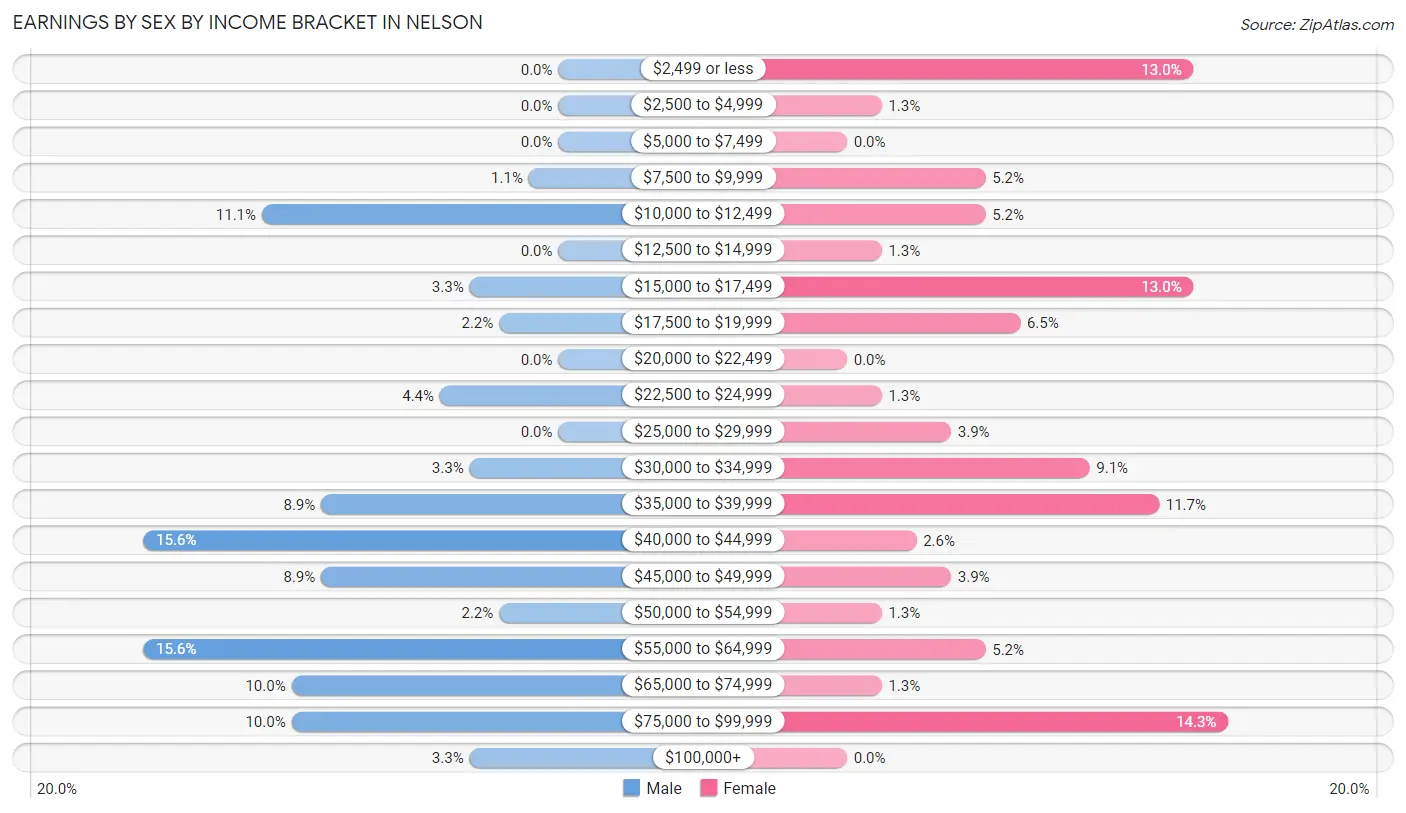
Earnings by Sex by Income Bracket in Nelson
The most common earnings brackets in Nelson are $40,000 to $44,999 for men (14 | 15.6%) and $75,000 to $99,999 for women (11 | 14.3%).
| Income | Male | Female |
| $2,499 or less | 0 (0.0%) | 10 (13.0%) |
| $2,500 to $4,999 | 0 (0.0%) | 1 (1.3%) |
| $5,000 to $7,499 | 0 (0.0%) | 0 (0.0%) |
| $7,500 to $9,999 | 1 (1.1%) | 4 (5.2%) |
| $10,000 to $12,499 | 10 (11.1%) | 4 (5.2%) |
| $12,500 to $14,999 | 0 (0.0%) | 1 (1.3%) |
| $15,000 to $17,499 | 3 (3.3%) | 10 (13.0%) |
| $17,500 to $19,999 | 2 (2.2%) | 5 (6.5%) |
| $20,000 to $22,499 | 0 (0.0%) | 0 (0.0%) |
| $22,500 to $24,999 | 4 (4.4%) | 1 (1.3%) |
| $25,000 to $29,999 | 0 (0.0%) | 3 (3.9%) |
| $30,000 to $34,999 | 3 (3.3%) | 7 (9.1%) |
| $35,000 to $39,999 | 8 (8.9%) | 9 (11.7%) |
| $40,000 to $44,999 | 14 (15.6%) | 2 (2.6%) |
| $45,000 to $49,999 | 8 (8.9%) | 3 (3.9%) |
| $50,000 to $54,999 | 2 (2.2%) | 1 (1.3%) |
| $55,000 to $64,999 | 14 (15.6%) | 4 (5.2%) |
| $65,000 to $74,999 | 9 (10.0%) | 1 (1.3%) |
| $75,000 to $99,999 | 9 (10.0%) | 11 (14.3%) |
| $100,000+ | 3 (3.3%) | 0 (0.0%) |
| Total | 90 (100.0%) | 77 (100.0%) |
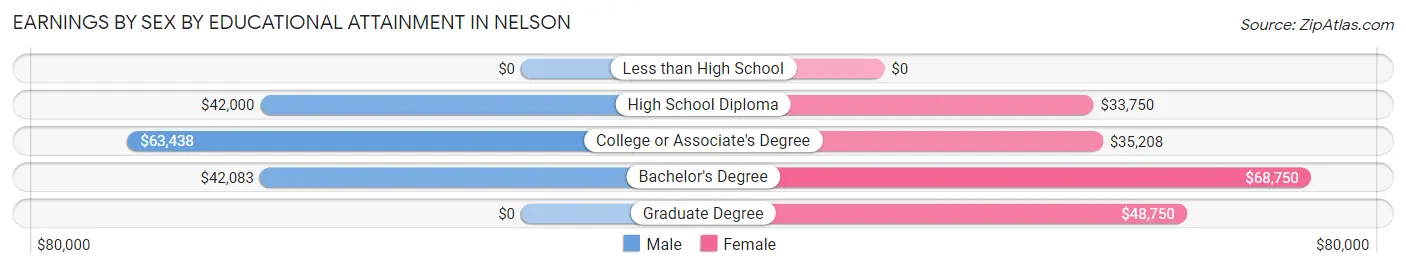
Earnings by Sex by Educational Attainment in Nelson
Average earnings in Nelson are $47,188 for men and $37,292 for women, a difference of 21.0%. Men with an educational attainment of college or associate's degree enjoy the highest average annual earnings of $63,438, while those with high school diploma education earn the least with $42,000. Women with an educational attainment of bachelor's degree earn the most with the average annual earnings of $68,750, while those with high school diploma education have the smallest earnings of $33,750.
| Educational Attainment | Male Income | Female Income |
| Less than High School | - | - |
| High School Diploma | $42,000 | $33,750 |
| College or Associate's Degree | $63,438 | $35,208 |
| Bachelor's Degree | $42,083 | $68,750 |
| Graduate Degree | - | - |
| Total | $47,188 | $37,292 |
Family Income in Nelson
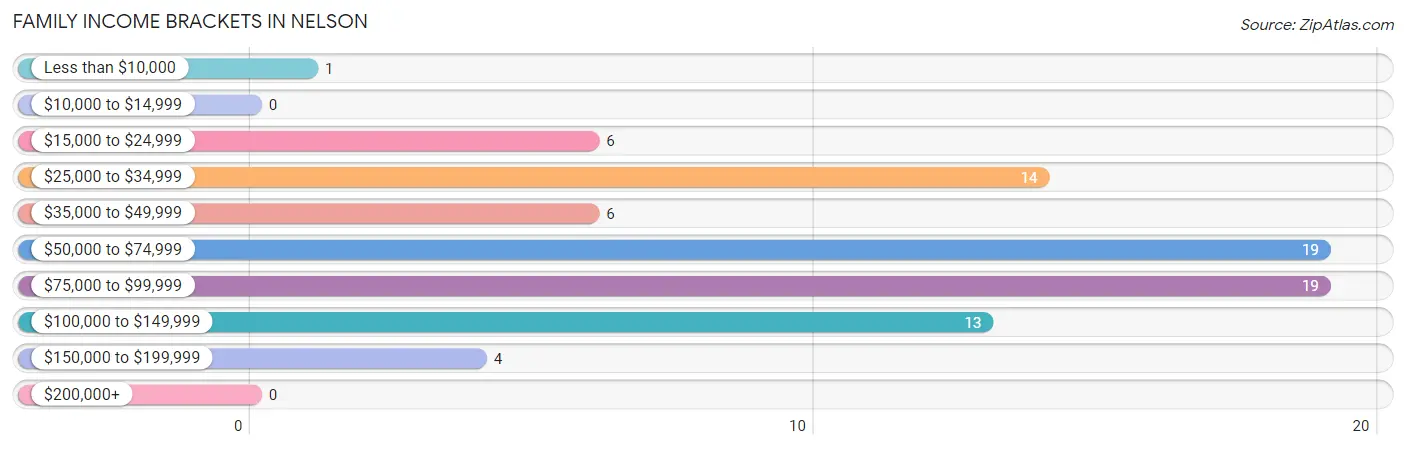
Family Income Brackets in Nelson
According to the Nelson family income data, there are 19 families falling into the $50,000 to $74,999 income range, which is the most common income bracket and makes up 23.2% of all families.
| Income Bracket | # Families | % Families |
| Less than $10,000 | 1 | 1.2% |
| $10,000 to $14,999 | 0 | 0.0% |
| $15,000 to $24,999 | 6 | 7.3% |
| $25,000 to $34,999 | 14 | 17.1% |
| $35,000 to $49,999 | 6 | 7.3% |
| $50,000 to $74,999 | 19 | 23.2% |
| $75,000 to $99,999 | 19 | 23.2% |
| $100,000 to $149,999 | 13 | 15.9% |
| $150,000 to $199,999 | 4 | 4.9% |
| $200,000+ | 0 | 0.0% |
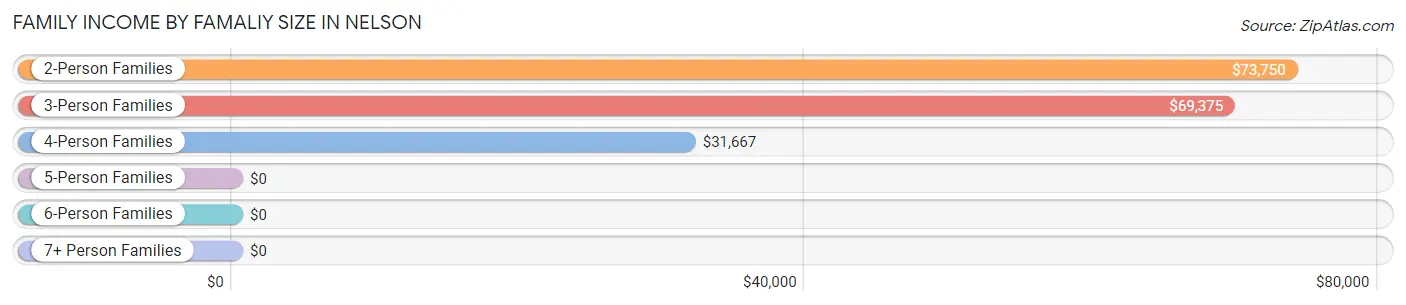
Family Income by Famaliy Size in Nelson
2-person families (46 | 56.1%) account for the highest median family income in Nelson with $73,750 per family, while 2-person families (46 | 56.1%) have the highest median income of $36,875 per family member.
| Income Bracket | # Families | Median Income |
| 2-Person Families | 46 (56.1%) | $73,750 |
| 3-Person Families | 22 (26.8%) | $69,375 |
| 4-Person Families | 10 (12.2%) | $31,667 |
| 5-Person Families | 3 (3.7%) | $0 |
| 6-Person Families | 1 (1.2%) | $0 |
| 7+ Person Families | 0 (0.0%) | $0 |
| Total | 82 (100.0%) | $68,333 |
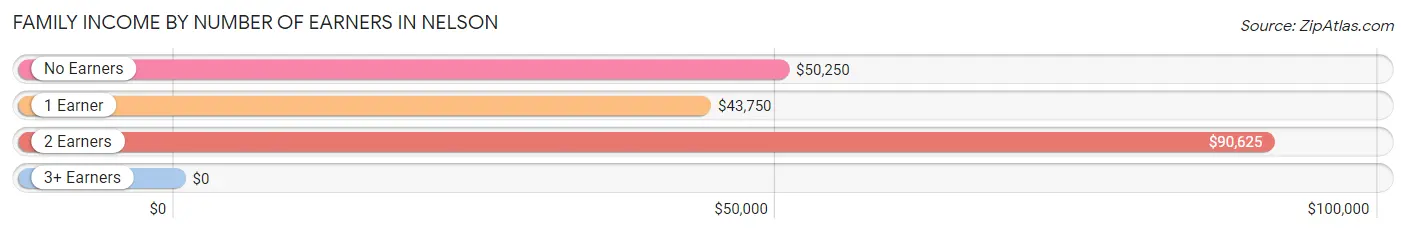
Family Income by Number of Earners in Nelson
| Number of Earners | # Families | Median Income |
| No Earners | 21 (25.6%) | $50,250 |
| 1 Earner | 29 (35.4%) | $43,750 |
| 2 Earners | 25 (30.5%) | $90,625 |
| 3+ Earners | 7 (8.5%) | $0 |
| Total | 82 (100.0%) | $68,333 |
Household Income in Nelson
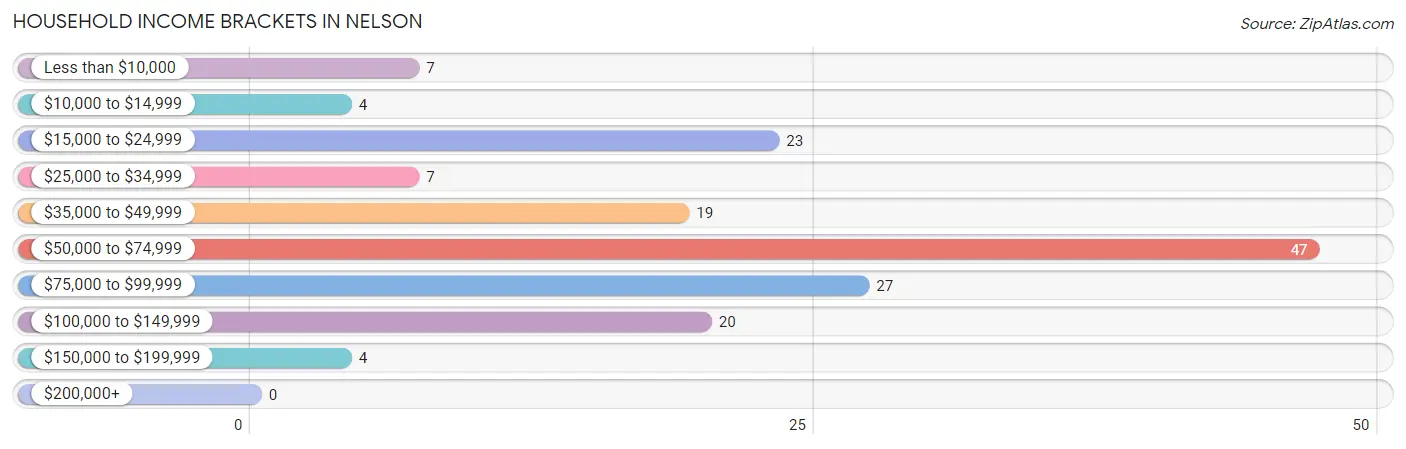
Household Income Brackets in Nelson
With 47 households falling in the category, the $50,000 to $74,999 income range is the most frequent in Nelson, accounting for 29.7% of all households.
| Income Bracket | # Households | % Households |
| Less than $10,000 | 7 | 4.4% |
| $10,000 to $14,999 | 4 | 2.5% |
| $15,000 to $24,999 | 23 | 14.6% |
| $25,000 to $34,999 | 7 | 4.4% |
| $35,000 to $49,999 | 19 | 12.0% |
| $50,000 to $74,999 | 47 | 29.7% |
| $75,000 to $99,999 | 27 | 17.1% |
| $100,000 to $149,999 | 20 | 12.7% |
| $150,000 to $199,999 | 4 | 2.5% |
| $200,000+ | 0 | 0.0% |
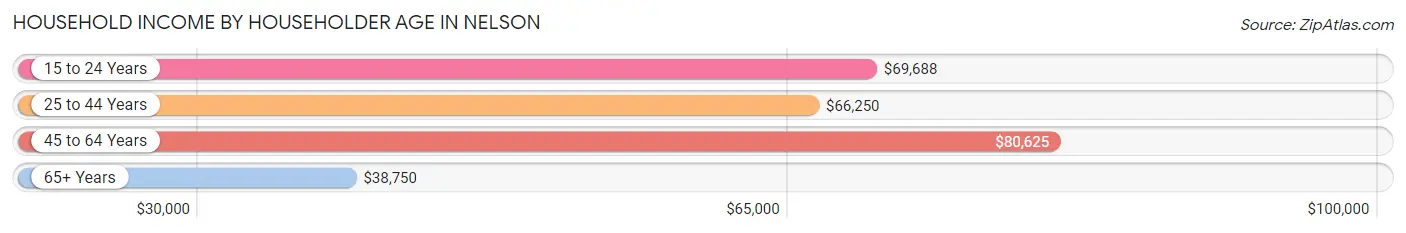
Household Income by Householder Age in Nelson
The median household income in Nelson is $64,375, with the highest median household income of $80,625 found in the 45 to 64 years age bracket for the primary householder. A total of 49 households (31.0%) fall into this category. Meanwhile, the 65+ years age bracket for the primary householder has the lowest median household income of $38,750, with 63 households (39.9%) in this group.
| Income Bracket | # Households | Median Income |
| 15 to 24 Years | 13 (8.2%) | $69,688 |
| 25 to 44 Years | 33 (20.9%) | $66,250 |
| 45 to 64 Years | 49 (31.0%) | $80,625 |
| 65+ Years | 63 (39.9%) | $38,750 |
| Total | 158 (100.0%) | $64,375 |
Poverty in Nelson
Income Below Poverty by Sex and Age in Nelson
With 4.3% poverty level for males and 11.6% for females among the residents of Nelson, 12 to 14 year old males and 75 year old and over females are the most vulnerable to poverty, with 1 males (20.0%) and 7 females (30.4%) in their respective age groups living below the poverty level.
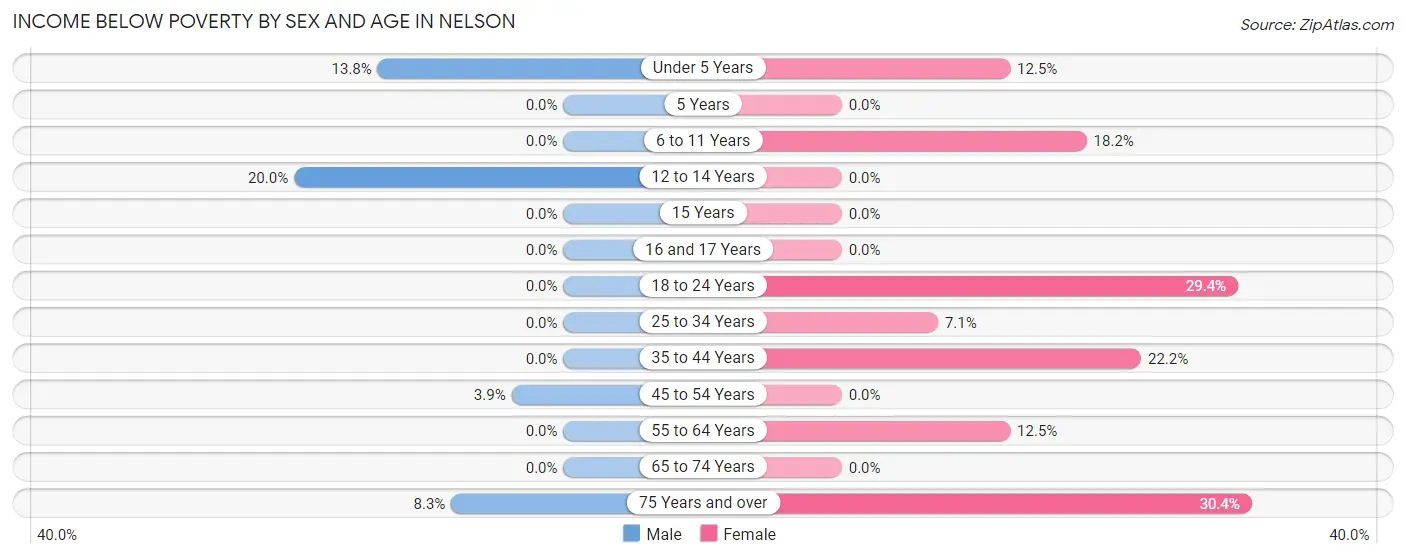
| Age Bracket | Male | Female |
| Under 5 Years | 4 (13.8%) | 1 (12.5%) |
| 5 Years | 0 (0.0%) | 0 (0.0%) |
| 6 to 11 Years | 0 (0.0%) | 2 (18.2%) |
| 12 to 14 Years | 1 (20.0%) | 0 (0.0%) |
| 15 Years | 0 (0.0%) | 0 (0.0%) |
| 16 and 17 Years | 0 (0.0%) | 0 (0.0%) |
| 18 to 24 Years | 0 (0.0%) | 5 (29.4%) |
| 25 to 34 Years | 0 (0.0%) | 1 (7.1%) |
| 35 to 44 Years | 0 (0.0%) | 2 (22.2%) |
| 45 to 54 Years | 1 (3.8%) | 0 (0.0%) |
| 55 to 64 Years | 0 (0.0%) | 2 (12.5%) |
| 65 to 74 Years | 0 (0.0%) | 0 (0.0%) |
| 75 Years and over | 1 (8.3%) | 7 (30.4%) |
| Total | 7 (4.3%) | 20 (11.6%) |
Income Above Poverty by Sex and Age in Nelson
According to the poverty statistics in Nelson, males aged 5 years and females aged 5 years are the age groups that are most secure financially, with 100.0% of males and 100.0% of females in these age groups living above the poverty line.
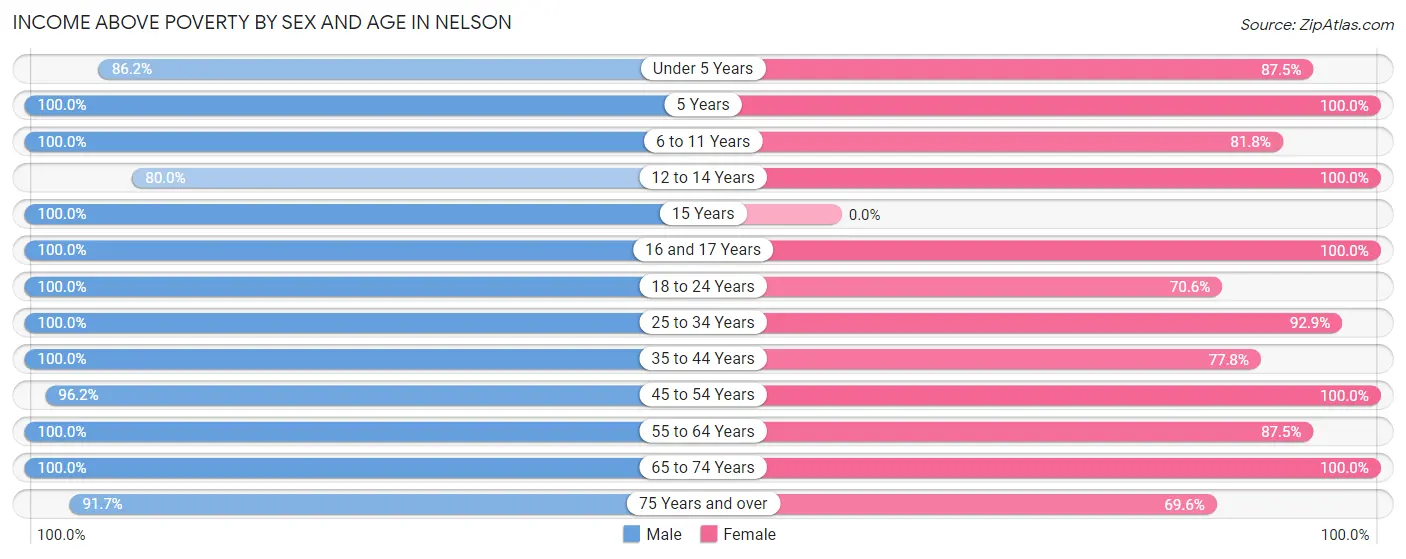
| Age Bracket | Male | Female |
| Under 5 Years | 25 (86.2%) | 7 (87.5%) |
| 5 Years | 1 (100.0%) | 3 (100.0%) |
| 6 to 11 Years | 5 (100.0%) | 9 (81.8%) |
| 12 to 14 Years | 4 (80.0%) | 3 (100.0%) |
| 15 Years | 2 (100.0%) | 0 (0.0%) |
| 16 and 17 Years | 9 (100.0%) | 9 (100.0%) |
| 18 to 24 Years | 2 (100.0%) | 12 (70.6%) |
| 25 to 34 Years | 24 (100.0%) | 13 (92.9%) |
| 35 to 44 Years | 12 (100.0%) | 7 (77.8%) |
| 45 to 54 Years | 25 (96.2%) | 20 (100.0%) |
| 55 to 64 Years | 17 (100.0%) | 14 (87.5%) |
| 65 to 74 Years | 20 (100.0%) | 40 (100.0%) |
| 75 Years and over | 11 (91.7%) | 16 (69.6%) |
| Total | 157 (95.7%) | 153 (88.4%) |
Income Below Poverty Among Married-Couple Families in Nelson
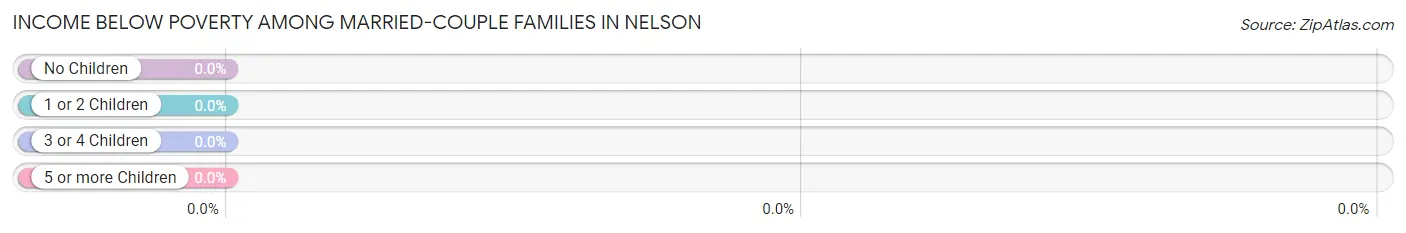
| Children | Above Poverty | Below Poverty |
| No Children | 40 (100.0%) | 0 (0.0%) |
| 1 or 2 Children | 12 (100.0%) | 0 (0.0%) |
| 3 or 4 Children | 4 (100.0%) | 0 (0.0%) |
| 5 or more Children | 0 (0.0%) | 0 (0.0%) |
| Total | 56 (100.0%) | 0 (0.0%) |
Income Below Poverty Among Single-Parent Households in Nelson
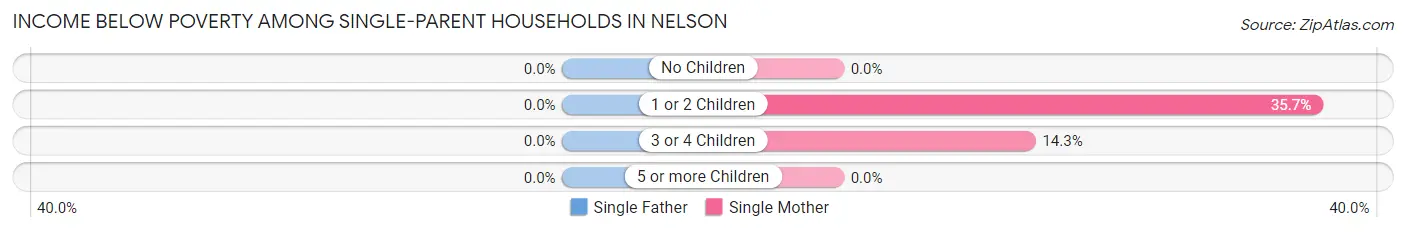
| Children | Single Father | Single Mother |
| No Children | 0 (0.0%) | 0 (0.0%) |
| 1 or 2 Children | 0 (0.0%) | 5 (35.7%) |
| 3 or 4 Children | 0 (0.0%) | 1 (14.3%) |
| 5 or more Children | 0 (0.0%) | 0 (0.0%) |
| Total | 0 (0.0%) | 6 (27.3%) |
Income Below Poverty Among Married-Couple vs Single-Parent Households in Nelson
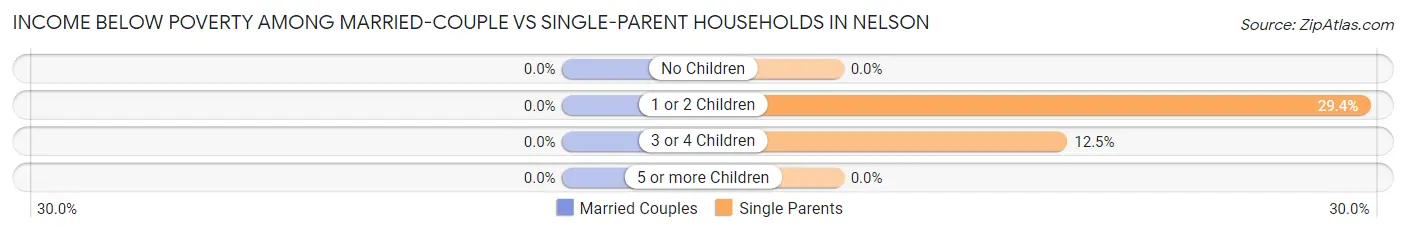
| Children | Married-Couple Families | Single-Parent Households |
| No Children | 0 (0.0%) | 0 (0.0%) |
| 1 or 2 Children | 0 (0.0%) | 5 (29.4%) |
| 3 or 4 Children | 0 (0.0%) | 1 (12.5%) |
| 5 or more Children | 0 (0.0%) | 0 (0.0%) |
| Total | 0 (0.0%) | 6 (23.1%) |
Race in Nelson
The most populous races in Nelson are White / Caucasian (328 | 96.2%), Hispanic or Latino (10 | 2.9%), and Some other Race (10 | 2.9%).
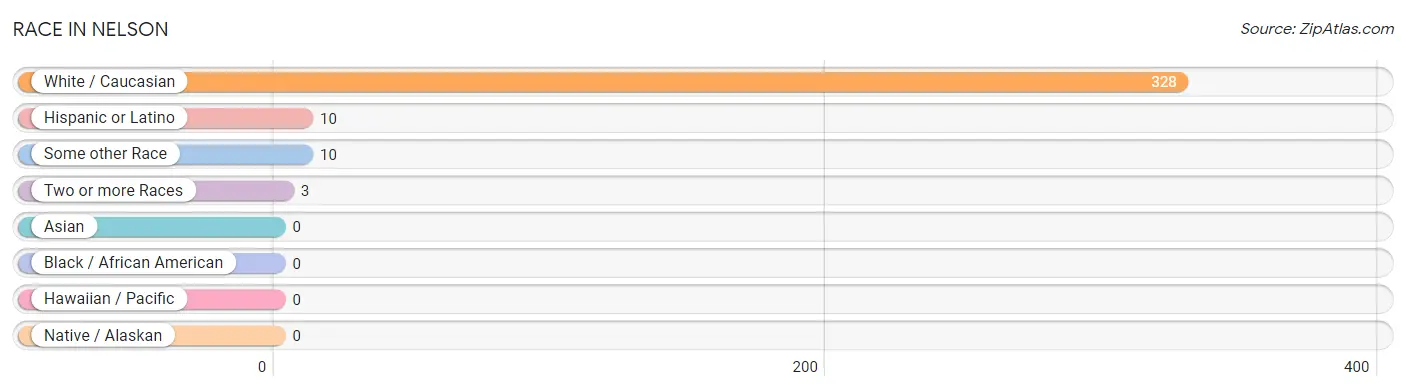
| Race | # Population | % Population |
| Asian | 0 | 0.0% |
| Black / African American | 0 | 0.0% |
| Hawaiian / Pacific | 0 | 0.0% |
| Hispanic or Latino | 10 | 2.9% |
| Native / Alaskan | 0 | 0.0% |
| White / Caucasian | 328 | 96.2% |
| Two or more Races | 3 | 0.9% |
| Some other Race | 10 | 2.9% |
| Total | 341 | 100.0% |
Ancestry in Nelson
The most populous ancestries reported in Nelson are German (169 | 49.6%), Norwegian (71 | 20.8%), Irish (53 | 15.5%), English (22 | 6.5%), and Polish (10 | 2.9%), together accounting for 95.3% of all Nelson residents.
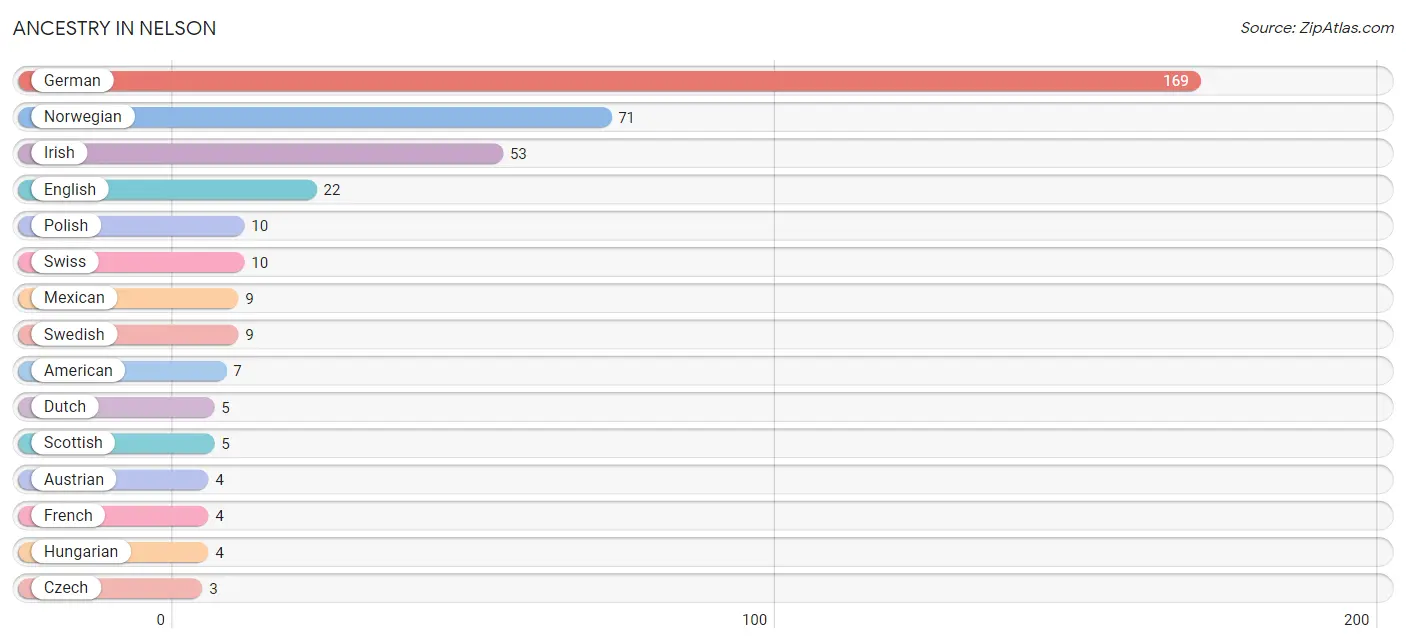
| Ancestry | # Population | % Population |
| American | 7 | 2.1% |
| Austrian | 4 | 1.2% |
| British | 1 | 0.3% |
| Czech | 3 | 0.9% |
| Danish | 2 | 0.6% |
| Dutch | 5 | 1.5% |
| English | 22 | 6.5% |
| European | 3 | 0.9% |
| Finnish | 1 | 0.3% |
| French | 4 | 1.2% |
| French Canadian | 1 | 0.3% |
| German | 169 | 49.6% |
| Hungarian | 4 | 1.2% |
| Irish | 53 | 15.5% |
| Mexican | 9 | 2.6% |
| Norwegian | 71 | 20.8% |
| Polish | 10 | 2.9% |
| Russian | 2 | 0.6% |
| Scottish | 5 | 1.5% |
| Sioux | 1 | 0.3% |
| Swedish | 9 | 2.6% |
| Swiss | 10 | 2.9% | View All 22 Rows |
Immigrants in Nelson
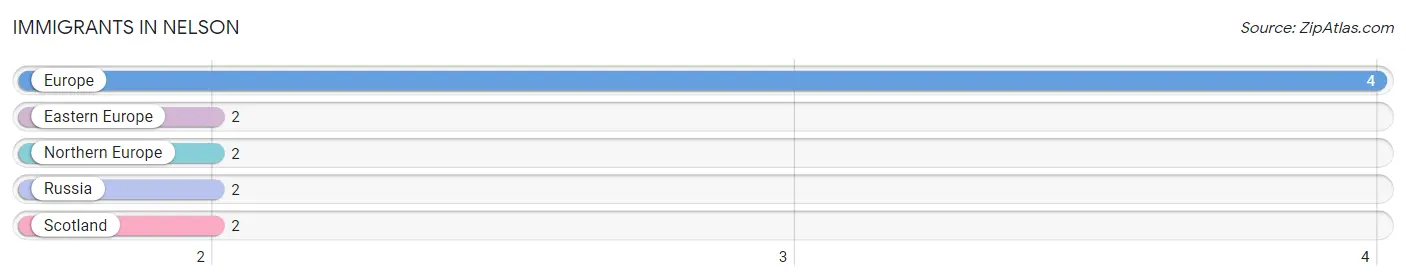
The most numerous immigrant groups reported in Nelson came from Europe (4 | 1.2%), Eastern Europe (2 | 0.6%), Northern Europe (2 | 0.6%), Russia (2 | 0.6%), and Scotland (2 | 0.6%), together accounting for 3.5% of all Nelson residents.
| Immigration Origin | # Population | % Population |
| Eastern Europe | 2 | 0.6% |
| Europe | 4 | 1.2% |
| Northern Europe | 2 | 0.6% |
| Russia | 2 | 0.6% |
| Scotland | 2 | 0.6% | View All 5 Rows |
Sex and Age in Nelson
Sex and Age in Nelson
The most populous age groups in Nelson are Under 5 Years (29 | 17.6%) for men and 65 to 69 Years (23 | 13.1%) for women.
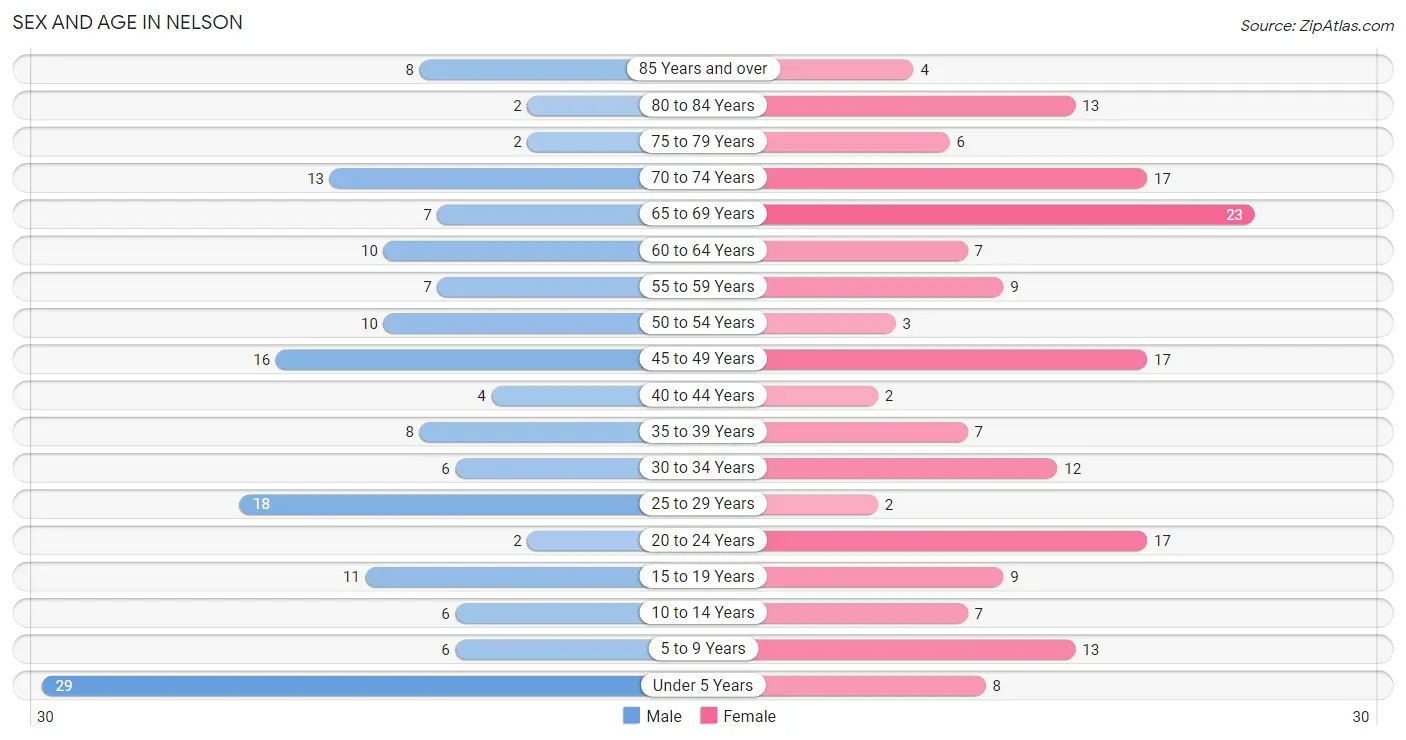
| Age Bracket | Male | Female |
| Under 5 Years | 29 (17.6%) | 8 (4.5%) |
| 5 to 9 Years | 6 (3.6%) | 13 (7.4%) |
| 10 to 14 Years | 6 (3.6%) | 7 (4.0%) |
| 15 to 19 Years | 11 (6.7%) | 9 (5.1%) |
| 20 to 24 Years | 2 (1.2%) | 17 (9.7%) |
| 25 to 29 Years | 18 (10.9%) | 2 (1.1%) |
| 30 to 34 Years | 6 (3.6%) | 12 (6.8%) |
| 35 to 39 Years | 8 (4.9%) | 7 (4.0%) |
| 40 to 44 Years | 4 (2.4%) | 2 (1.1%) |
| 45 to 49 Years | 16 (9.7%) | 17 (9.7%) |
| 50 to 54 Years | 10 (6.1%) | 3 (1.7%) |
| 55 to 59 Years | 7 (4.2%) | 9 (5.1%) |
| 60 to 64 Years | 10 (6.1%) | 7 (4.0%) |
| 65 to 69 Years | 7 (4.2%) | 23 (13.1%) |
| 70 to 74 Years | 13 (7.9%) | 17 (9.7%) |
| 75 to 79 Years | 2 (1.2%) | 6 (3.4%) |
| 80 to 84 Years | 2 (1.2%) | 13 (7.4%) |
| 85 Years and over | 8 (4.9%) | 4 (2.3%) |
| Total | 165 (100.0%) | 176 (100.0%) |
Families and Households in Nelson
Median Family Size in Nelson
The median family size in Nelson is 2.84 persons per family, with single female/mother families (22 | 26.8%) accounting for the largest median family size of 3.36 persons per family. On the other hand, married-couple families (56 | 68.3%) represent the smallest median family size with 2.63 persons per family.
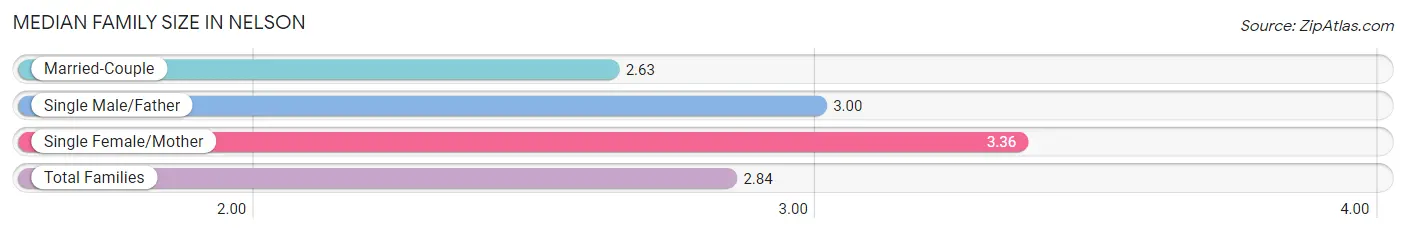
| Family Type | # Families | Family Size |
| Married-Couple | 56 (68.3%) | 2.63 |
| Single Male/Father | 4 (4.9%) | 3.00 |
| Single Female/Mother | 22 (26.8%) | 3.36 |
| Total Families | 82 (100.0%) | 2.84 |
Median Household Size in Nelson
The median household size in Nelson is 2.16 persons per household, with single female/mother households (22 | 13.9%) accounting for the largest median household size of 4.09 persons per household. non-family households (76 | 48.1%) represent the smallest median household size with 1.17 persons per household.
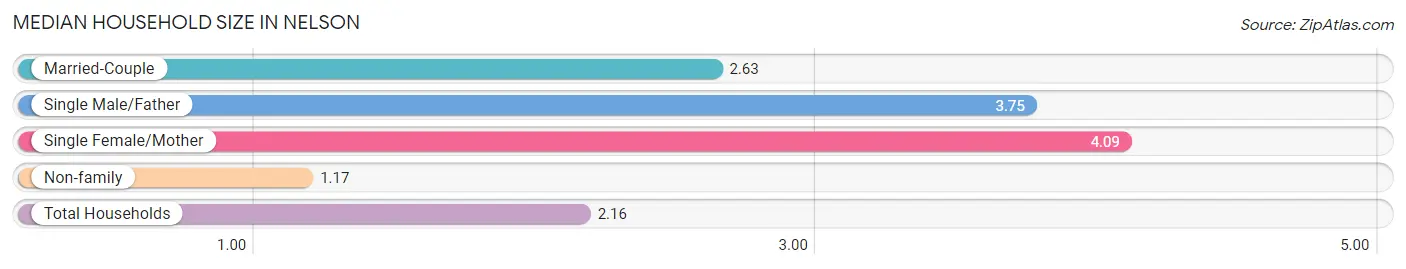
| Household Type | # Households | Household Size |
| Married-Couple | 56 (35.4%) | 2.63 |
| Single Male/Father | 4 (2.5%) | 3.75 |
| Single Female/Mother | 22 (13.9%) | 4.09 |
| Non-family | 76 (48.1%) | 1.17 |
| Total Households | 158 (100.0%) | 2.16 |
Household Size by Marriage Status in Nelson
Out of a total of 158 households in Nelson, 82 (51.9%) are family households, while 76 (48.1%) are nonfamily households. The most numerous type of family households are 2-person households, comprising 40, and the most common type of nonfamily households are 1-person households, comprising 61.
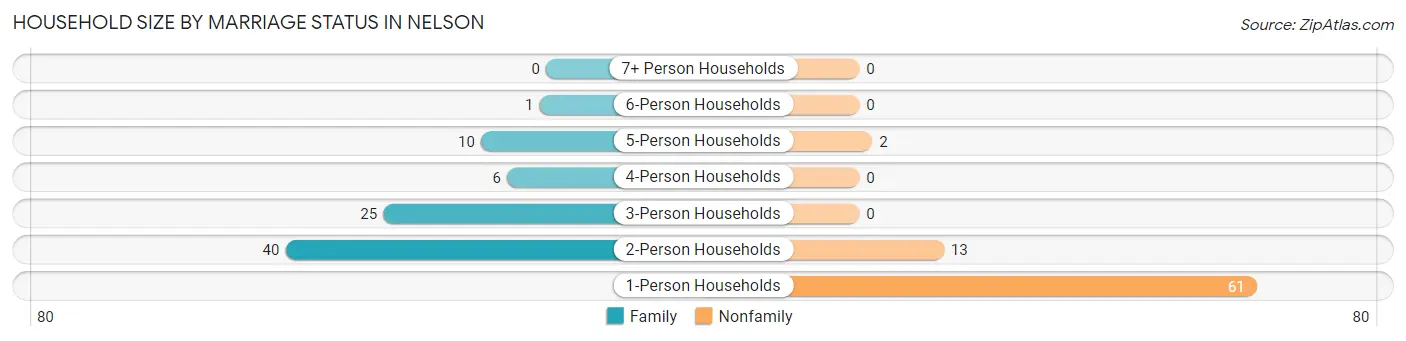
| Household Size | Family Households | Nonfamily Households |
| 1-Person Households | - | 61 (38.6%) |
| 2-Person Households | 40 (25.3%) | 13 (8.2%) |
| 3-Person Households | 25 (15.8%) | 0 (0.0%) |
| 4-Person Households | 6 (3.8%) | 0 (0.0%) |
| 5-Person Households | 10 (6.3%) | 2 (1.3%) |
| 6-Person Households | 1 (0.6%) | 0 (0.0%) |
| 7+ Person Households | 0 (0.0%) | 0 (0.0%) |
| Total | 82 (51.9%) | 76 (48.1%) |
Female Fertility in Nelson
Fertility by Age in Nelson
Average fertility rate in Nelson is 167.0 births per 1,000 women. Women in the age bracket of 20 to 34 years have the highest fertility rate with 355.0 births per 1,000 women. Women in the age bracket of 20 to 34 years acount for 100.0% of all women with births.
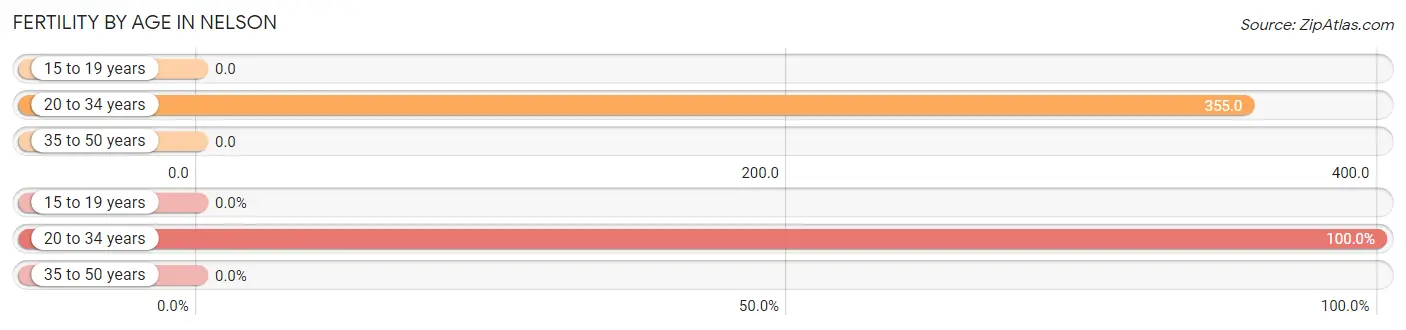
| Age Bracket | Women with Births | Births / 1,000 Women |
| 15 to 19 years | 0 (0.0%) | 0.0 |
| 20 to 34 years | 11 (100.0%) | 355.0 |
| 35 to 50 years | 0 (0.0%) | 0.0 |
| Total | 11 (100.0%) | 167.0 |
Fertility by Age by Marriage Status in Nelson
9.1% of women with births (11) in Nelson are married. The highest percentage of unmarried women with births falls into 20 to 34 years age bracket with 90.9% of them unmarried at the time of birth, while the lowest percentage of unmarried women with births belong to 20 to 34 years age bracket with 90.9% of them unmarried.
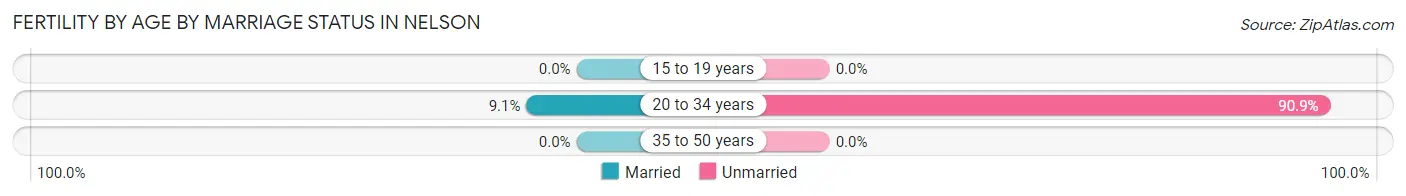
| Age Bracket | Married | Unmarried |
| 15 to 19 years | 0 (0.0%) | 0 (0.0%) |
| 20 to 34 years | 1 (9.1%) | 10 (90.9%) |
| 35 to 50 years | 0 (0.0%) | 0 (0.0%) |
| Total | 1 (9.1%) | 10 (90.9%) |
Fertility by Education in Nelson
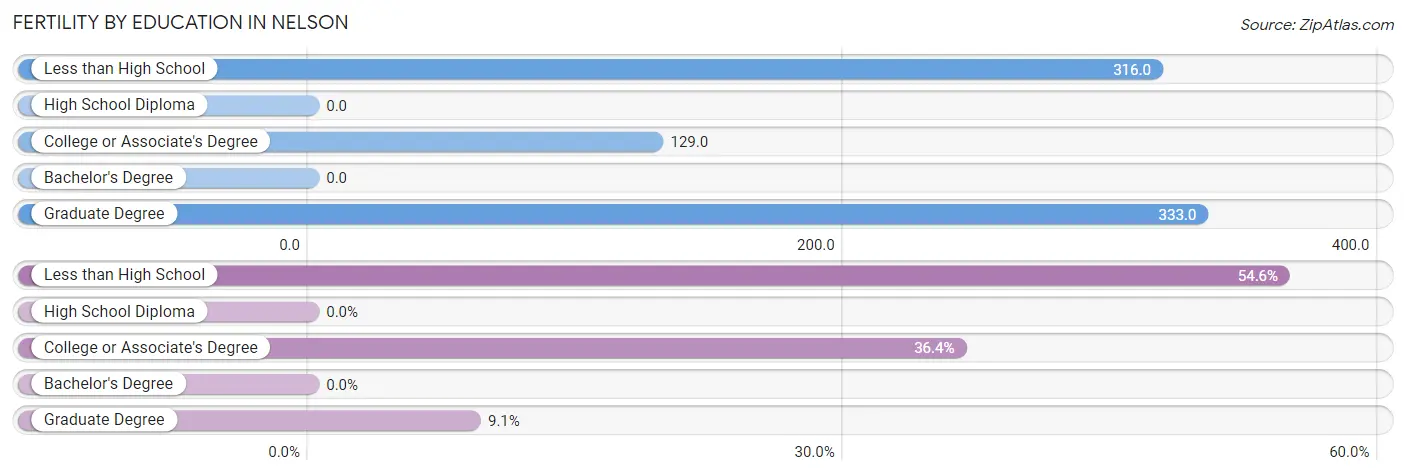
| Educational Attainment | Women with Births | Births / 1,000 Women |
| Less than High School | 6 (54.5%) | 316.0 |
| High School Diploma | 0 (0.0%) | 0.0 |
| College or Associate's Degree | 4 (36.4%) | 129.0 |
| Bachelor's Degree | 0 (0.0%) | 0.0 |
| Graduate Degree | 1 (9.1%) | 333.0 |
| Total | 11 (100.0%) | 167.0 |
Fertility by Education by Marriage Status in Nelson
90.9% of women with births in Nelson are unmarried. Women with the educational attainment of graduate degree are most likely to be married with 100.0% of them married at childbirth, while women with the educational attainment of less than high school are least likely to be married with 100.0% of them unmarried at childbirth.
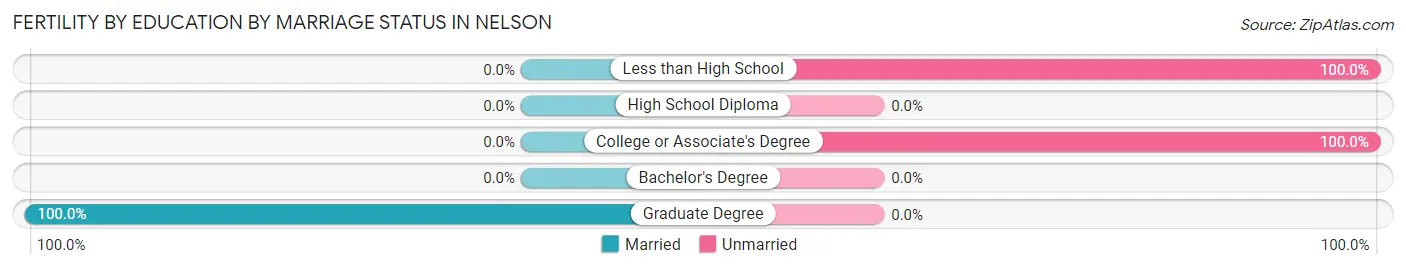
| Educational Attainment | Married | Unmarried |
| Less than High School | 0 (0.0%) | 6 (100.0%) |
| High School Diploma | 0 (0.0%) | 0 (0.0%) |
| College or Associate's Degree | 0 (0.0%) | 4 (100.0%) |
| Bachelor's Degree | 0 (0.0%) | 0 (0.0%) |
| Graduate Degree | 1 (100.0%) | 0 (0.0%) |
| Total | 1 (9.1%) | 10 (90.9%) |
Employment Characteristics in Nelson
Employment by Class of Employer in Nelson
Among the 153 employed individuals in Nelson, private company employees (106 | 69.3%), local government employees (13 | 8.5%), and self-employed (not incorporated) (10 | 6.5%) make up the most common classes of employment.
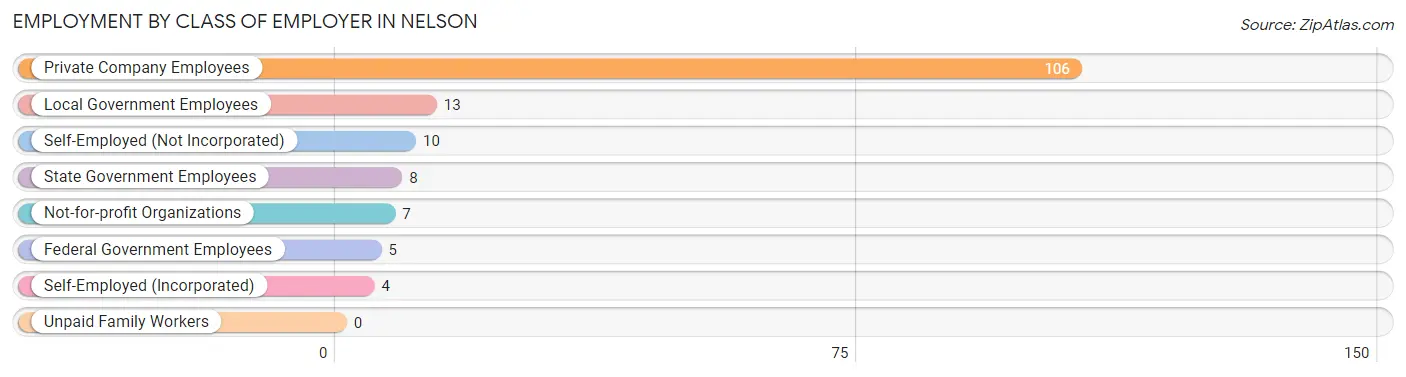
| Employer Class | # Employees | % Employees |
| Private Company Employees | 106 | 69.3% |
| Self-Employed (Incorporated) | 4 | 2.6% |
| Self-Employed (Not Incorporated) | 10 | 6.5% |
| Not-for-profit Organizations | 7 | 4.6% |
| Local Government Employees | 13 | 8.5% |
| State Government Employees | 8 | 5.2% |
| Federal Government Employees | 5 | 3.3% |
| Unpaid Family Workers | 0 | 0.0% |
| Total | 153 | 100.0% |
Employment Status by Age in Nelson
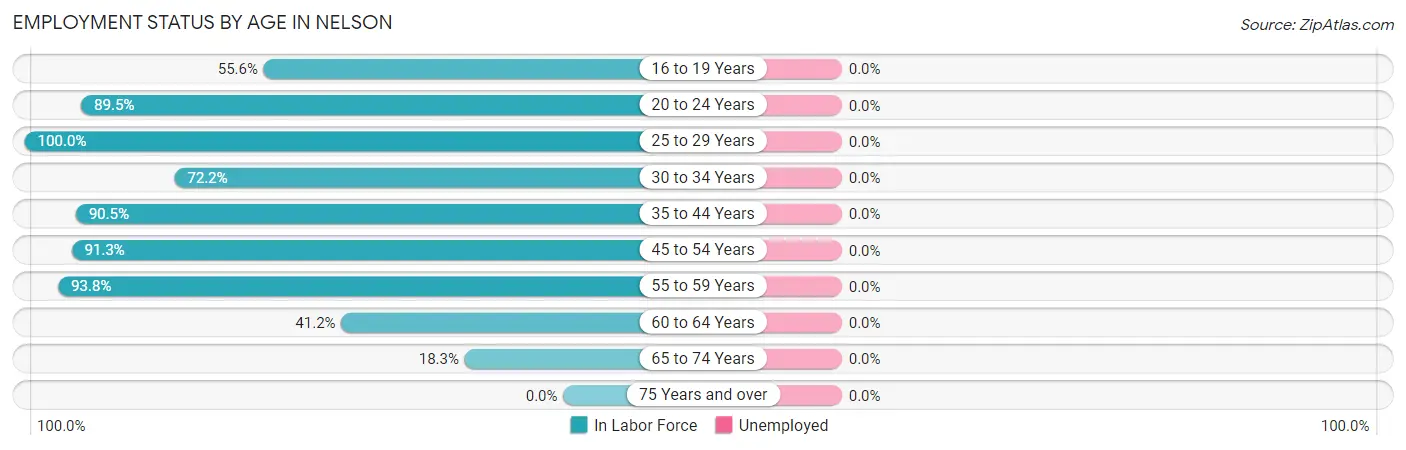
| Age Bracket | In Labor Force | Unemployed |
| 16 to 19 Years | 10 (55.6%) | 0 (0.0%) |
| 20 to 24 Years | 17 (89.5%) | 0 (0.0%) |
| 25 to 29 Years | 20 (100.0%) | 0 (0.0%) |
| 30 to 34 Years | 13 (72.2%) | 0 (0.0%) |
| 35 to 44 Years | 19 (90.5%) | 0 (0.0%) |
| 45 to 54 Years | 42 (91.3%) | 0 (0.0%) |
| 55 to 59 Years | 15 (93.8%) | 0 (0.0%) |
| 60 to 64 Years | 7 (41.2%) | 0 (0.0%) |
| 65 to 74 Years | 11 (18.3%) | 0 (0.0%) |
| 75 Years and over | 0 (0.0%) | 0 (0.0%) |
| Total | 154 (57.0%) | 0 (0.0%) |
Employment Status by Educational Attainment in Nelson
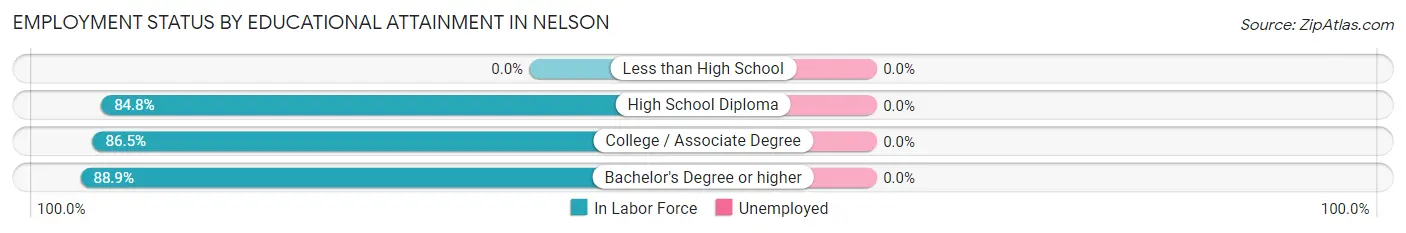
| Educational Attainment | In Labor Force | Unemployed |
| Less than High School | 0 (0.0%) | 0 (0.0%) |
| High School Diploma | 39 (84.8%) | 0 (0.0%) |
| College / Associate Degree | 45 (86.5%) | 0 (0.0%) |
| Bachelor's Degree or higher | 32 (88.9%) | 0 (0.0%) |
| Total | 116 (84.1%) | 0 (0.0%) |
Employment Occupations by Sex in Nelson
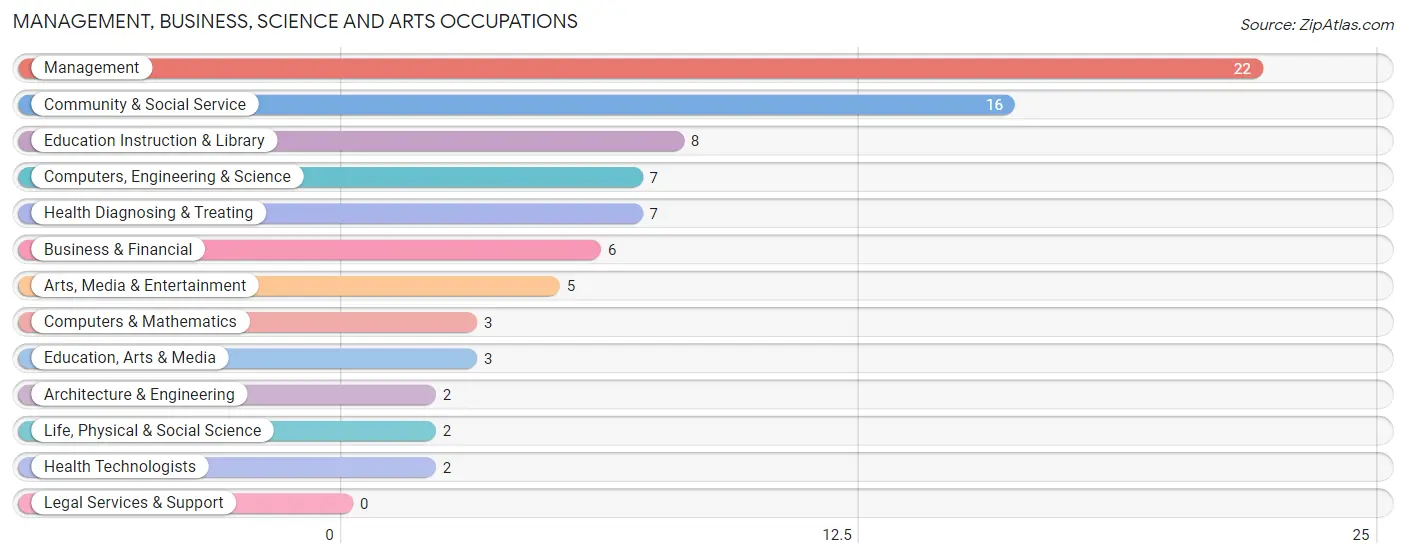
Management, Business, Science and Arts Occupations
The most common Management, Business, Science and Arts occupations in Nelson are Management (22 | 14.3%), Community & Social Service (16 | 10.4%), Education Instruction & Library (8 | 5.2%), Computers, Engineering & Science (7 | 4.5%), and Health Diagnosing & Treating (7 | 4.5%).
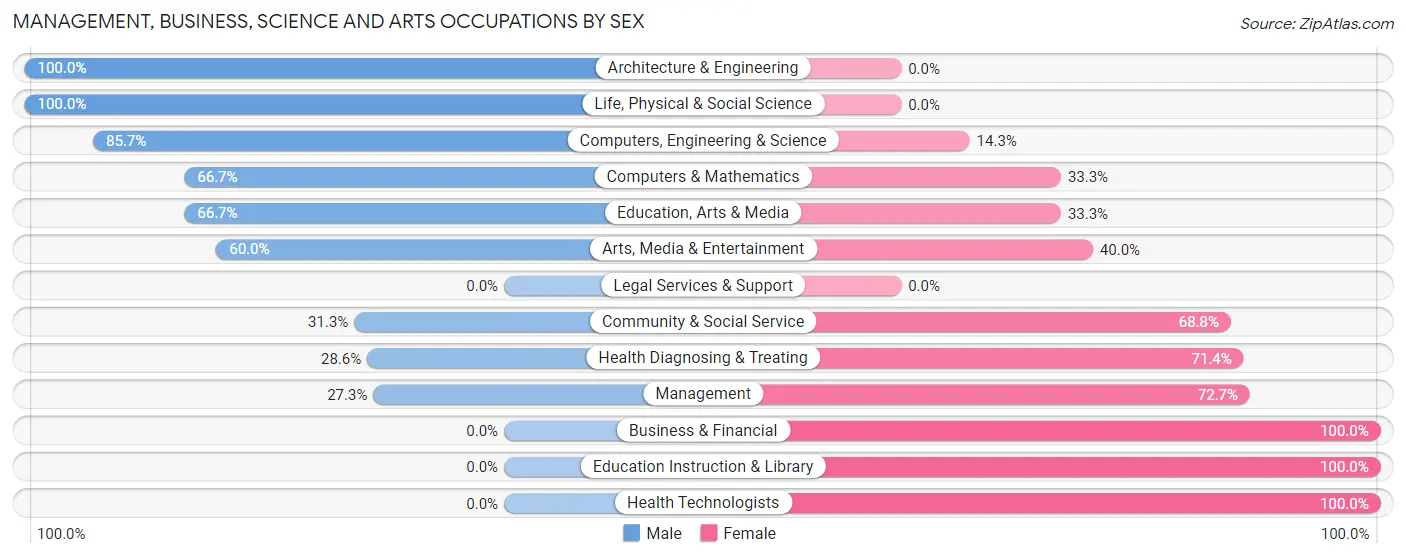
Management, Business, Science and Arts Occupations by Sex
Within the Management, Business, Science and Arts occupations in Nelson, the most male-oriented occupations are Architecture & Engineering (100.0%), Life, Physical & Social Science (100.0%), and Computers, Engineering & Science (85.7%), while the most female-oriented occupations are Business & Financial (100.0%), Education Instruction & Library (100.0%), and Health Technologists (100.0%).
| Occupation | Male | Female |
| Management | 6 (27.3%) | 16 (72.7%) |
| Business & Financial | 0 (0.0%) | 6 (100.0%) |
| Computers, Engineering & Science | 6 (85.7%) | 1 (14.3%) |
| Computers & Mathematics | 2 (66.7%) | 1 (33.3%) |
| Architecture & Engineering | 2 (100.0%) | 0 (0.0%) |
| Life, Physical & Social Science | 2 (100.0%) | 0 (0.0%) |
| Community & Social Service | 5 (31.2%) | 11 (68.8%) |
| Education, Arts & Media | 2 (66.7%) | 1 (33.3%) |
| Legal Services & Support | 0 (0.0%) | 0 (0.0%) |
| Education Instruction & Library | 0 (0.0%) | 8 (100.0%) |
| Arts, Media & Entertainment | 3 (60.0%) | 2 (40.0%) |
| Health Diagnosing & Treating | 2 (28.6%) | 5 (71.4%) |
| Health Technologists | 0 (0.0%) | 2 (100.0%) |
| Total (Category) | 19 (32.8%) | 39 (67.2%) |
| Total (Overall) | 88 (57.1%) | 66 (42.9%) |
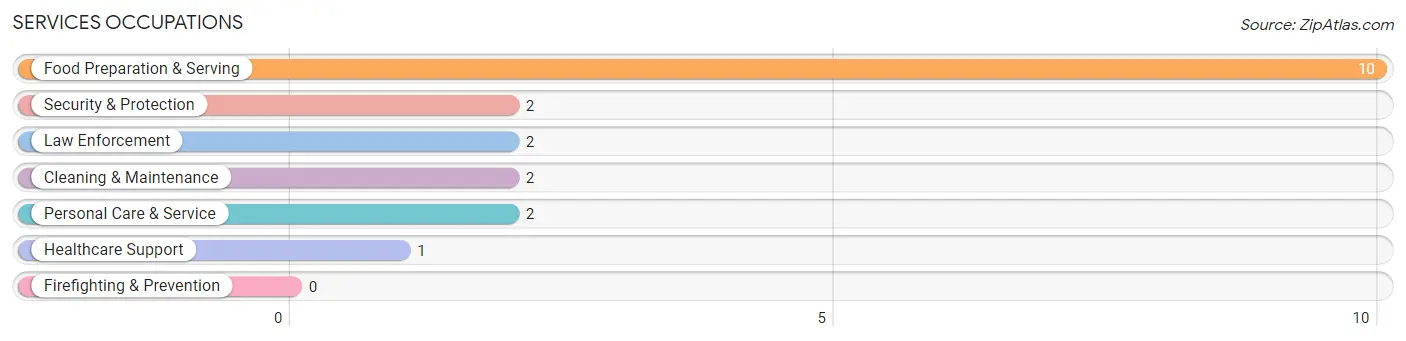
Services Occupations
The most common Services occupations in Nelson are Food Preparation & Serving (10 | 6.5%), Security & Protection (2 | 1.3%), Law Enforcement (2 | 1.3%), Cleaning & Maintenance (2 | 1.3%), and Personal Care & Service (2 | 1.3%).
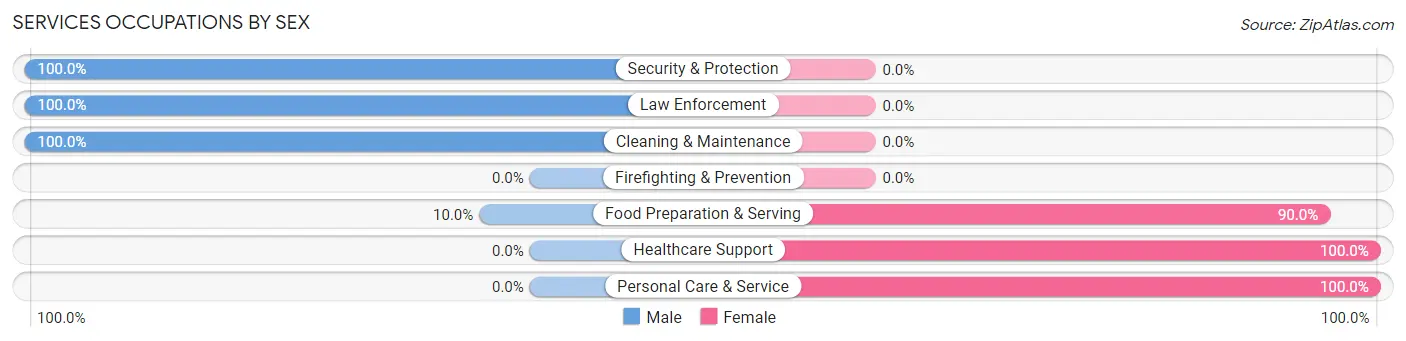
Services Occupations by Sex
Within the Services occupations in Nelson, the most male-oriented occupations are Security & Protection (100.0%), Law Enforcement (100.0%), and Cleaning & Maintenance (100.0%), while the most female-oriented occupations are Healthcare Support (100.0%), Personal Care & Service (100.0%), and Food Preparation & Serving (90.0%).
| Occupation | Male | Female |
| Healthcare Support | 0 (0.0%) | 1 (100.0%) |
| Security & Protection | 2 (100.0%) | 0 (0.0%) |
| Firefighting & Prevention | 0 (0.0%) | 0 (0.0%) |
| Law Enforcement | 2 (100.0%) | 0 (0.0%) |
| Food Preparation & Serving | 1 (10.0%) | 9 (90.0%) |
| Cleaning & Maintenance | 2 (100.0%) | 0 (0.0%) |
| Personal Care & Service | 0 (0.0%) | 2 (100.0%) |
| Total (Category) | 5 (29.4%) | 12 (70.6%) |
| Total (Overall) | 88 (57.1%) | 66 (42.9%) |
Sales and Office Occupations
The most common Sales and Office occupations in Nelson are Sales & Related (14 | 9.1%), and Office & Administration (13 | 8.4%).
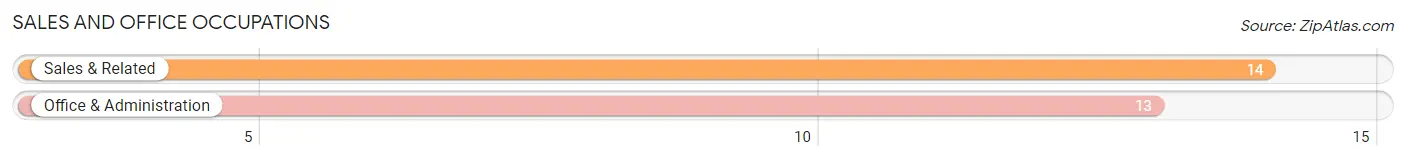
Sales and Office Occupations by Sex
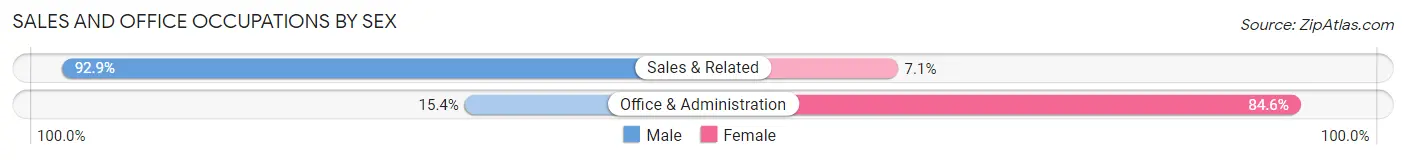
| Occupation | Male | Female |
| Sales & Related | 13 (92.9%) | 1 (7.1%) |
| Office & Administration | 2 (15.4%) | 11 (84.6%) |
| Total (Category) | 15 (55.6%) | 12 (44.4%) |
| Total (Overall) | 88 (57.1%) | 66 (42.9%) |
Natural Resources, Construction and Maintenance Occupations
The most common Natural Resources, Construction and Maintenance occupations in Nelson are Installation, Maintenance & Repair (7 | 4.5%), Construction & Extraction (3 | 1.9%), and Farming, Fishing & Forestry (2 | 1.3%).
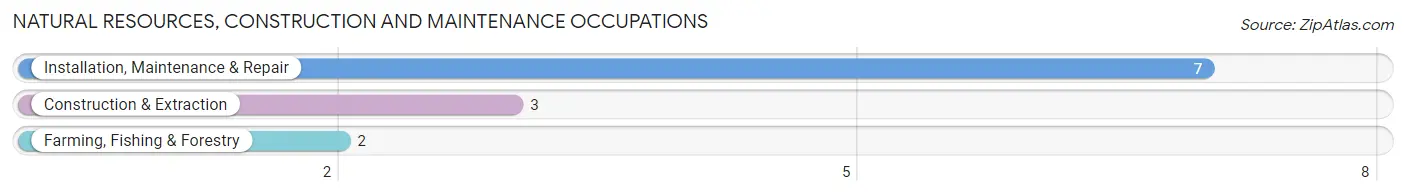
Natural Resources, Construction and Maintenance Occupations by Sex
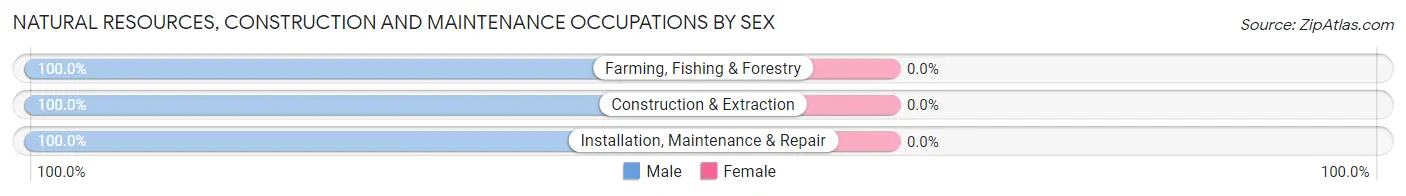
| Occupation | Male | Female |
| Farming, Fishing & Forestry | 2 (100.0%) | 0 (0.0%) |
| Construction & Extraction | 3 (100.0%) | 0 (0.0%) |
| Installation, Maintenance & Repair | 7 (100.0%) | 0 (0.0%) |
| Total (Category) | 12 (100.0%) | 0 (0.0%) |
| Total (Overall) | 88 (57.1%) | 66 (42.9%) |
Production, Transportation and Moving Occupations
The most common Production, Transportation and Moving occupations in Nelson are Production (15 | 9.7%), Material Moving (15 | 9.7%), and Transportation (10 | 6.5%).
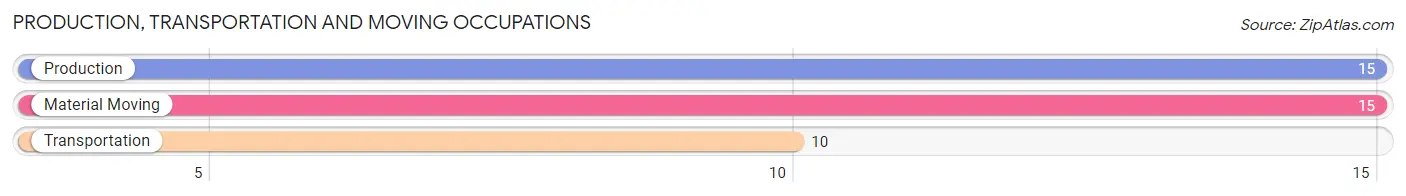
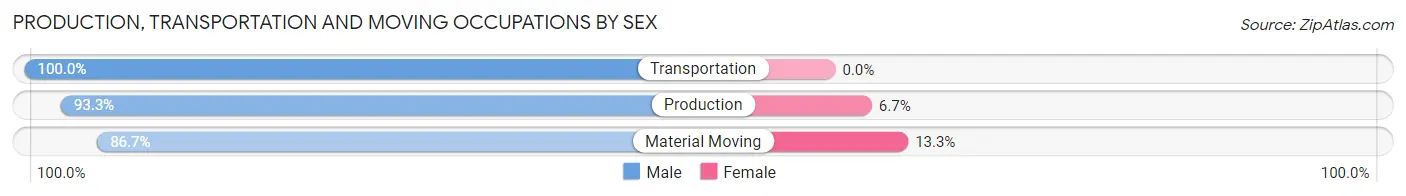
Production, Transportation and Moving Occupations by Sex
| Occupation | Male | Female |
| Production | 14 (93.3%) | 1 (6.7%) |
| Transportation | 10 (100.0%) | 0 (0.0%) |
| Material Moving | 13 (86.7%) | 2 (13.3%) |
| Total (Category) | 37 (92.5%) | 3 (7.5%) |
| Total (Overall) | 88 (57.1%) | 66 (42.9%) |
Employment Industries by Sex in Nelson
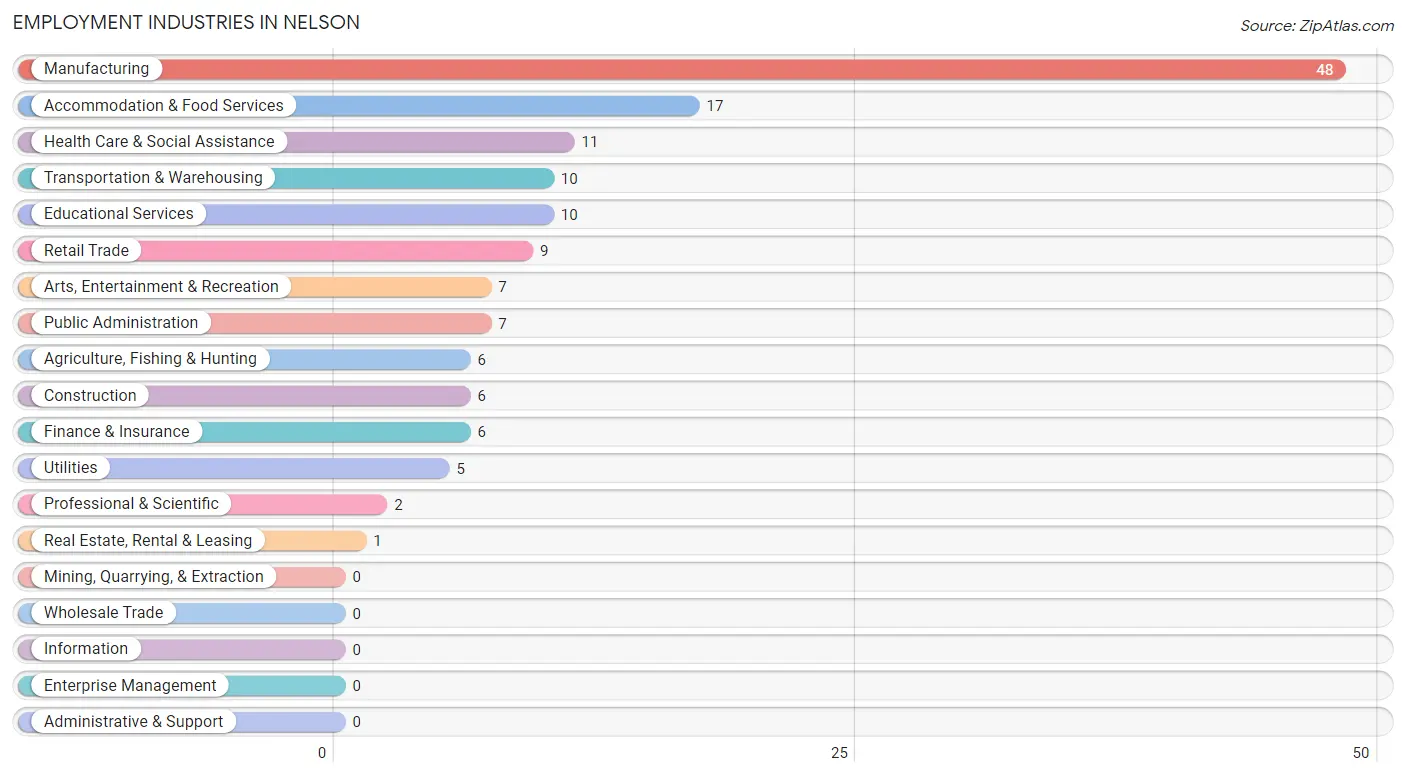
Employment Industries in Nelson
The major employment industries in Nelson include Manufacturing (48 | 31.2%), Accommodation & Food Services (17 | 11.0%), Health Care & Social Assistance (11 | 7.1%), Transportation & Warehousing (10 | 6.5%), and Educational Services (10 | 6.5%).
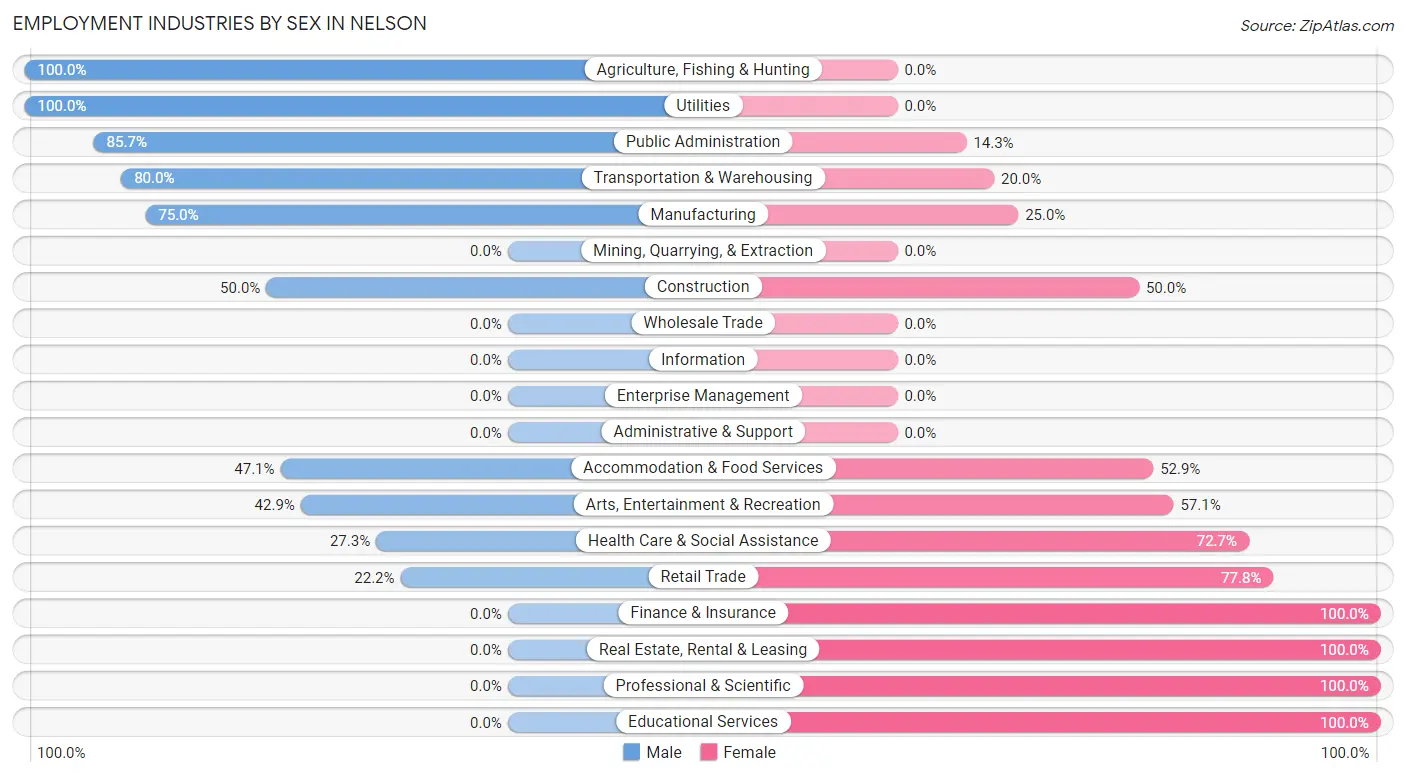
Employment Industries by Sex in Nelson
The Nelson industries that see more men than women are Agriculture, Fishing & Hunting (100.0%), Utilities (100.0%), and Public Administration (85.7%), whereas the industries that tend to have a higher number of women are Finance & Insurance (100.0%), Real Estate, Rental & Leasing (100.0%), and Professional & Scientific (100.0%).
| Industry | Male | Female |
| Agriculture, Fishing & Hunting | 6 (100.0%) | 0 (0.0%) |
| Mining, Quarrying, & Extraction | 0 (0.0%) | 0 (0.0%) |
| Construction | 3 (50.0%) | 3 (50.0%) |
| Manufacturing | 36 (75.0%) | 12 (25.0%) |
| Wholesale Trade | 0 (0.0%) | 0 (0.0%) |
| Retail Trade | 2 (22.2%) | 7 (77.8%) |
| Transportation & Warehousing | 8 (80.0%) | 2 (20.0%) |
| Utilities | 5 (100.0%) | 0 (0.0%) |
| Information | 0 (0.0%) | 0 (0.0%) |
| Finance & Insurance | 0 (0.0%) | 6 (100.0%) |
| Real Estate, Rental & Leasing | 0 (0.0%) | 1 (100.0%) |
| Professional & Scientific | 0 (0.0%) | 2 (100.0%) |
| Enterprise Management | 0 (0.0%) | 0 (0.0%) |
| Administrative & Support | 0 (0.0%) | 0 (0.0%) |
| Educational Services | 0 (0.0%) | 10 (100.0%) |
| Health Care & Social Assistance | 3 (27.3%) | 8 (72.7%) |
| Arts, Entertainment & Recreation | 3 (42.9%) | 4 (57.1%) |
| Accommodation & Food Services | 8 (47.1%) | 9 (52.9%) |
| Public Administration | 6 (85.7%) | 1 (14.3%) |
| Total | 88 (57.1%) | 66 (42.9%) |
Education in Nelson
School Enrollment in Nelson
The most common levels of schooling among the 60 students in Nelson are high school (21 | 35.0%), elementary school (16 | 26.7%), and middle school (11 | 18.3%).
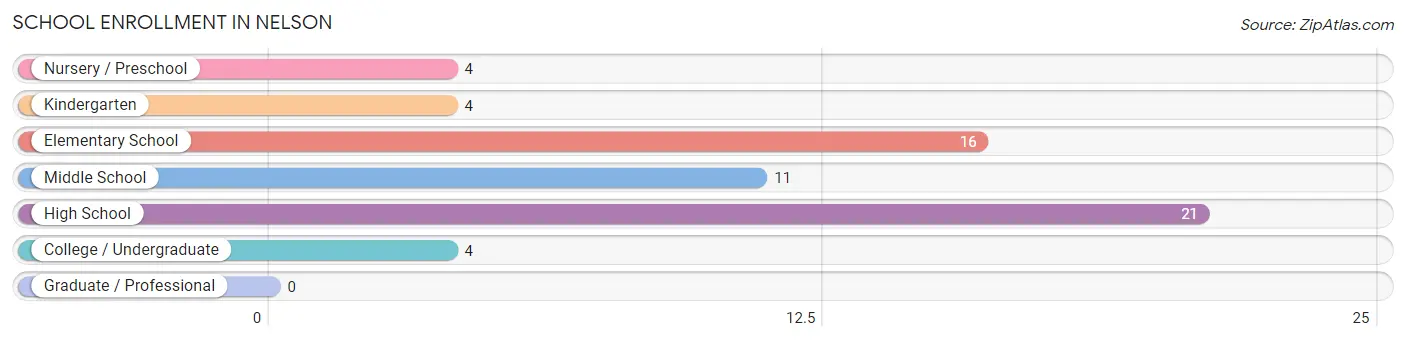
| School Level | # Students | % Students |
| Nursery / Preschool | 4 | 6.7% |
| Kindergarten | 4 | 6.7% |
| Elementary School | 16 | 26.7% |
| Middle School | 11 | 18.3% |
| High School | 21 | 35.0% |
| College / Undergraduate | 4 | 6.7% |
| Graduate / Professional | 0 | 0.0% |
| Total | 60 | 100.0% |
School Enrollment by Age by Funding Source in Nelson
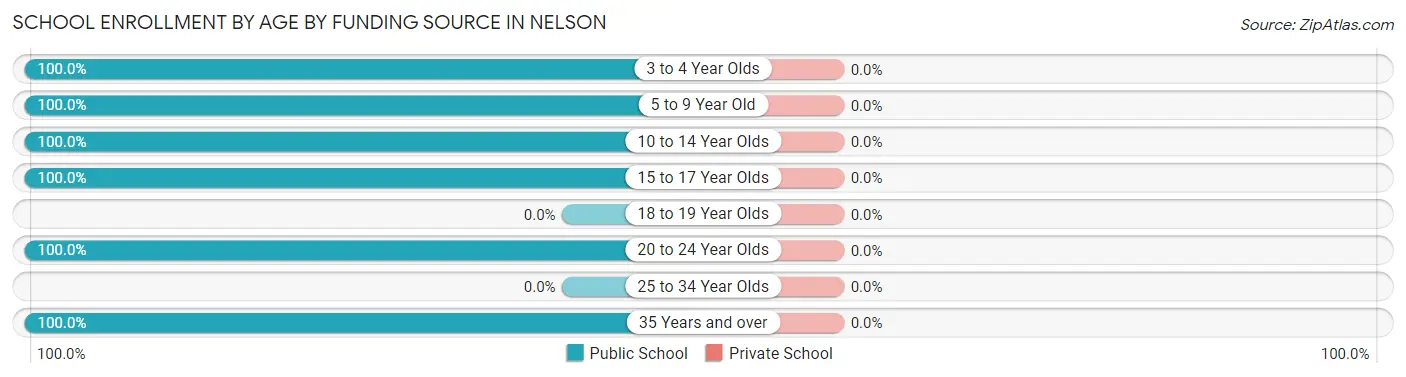
| Age Bracket | Public School | Private School |
| 3 to 4 Year Olds | 4 (100.0%) | 0 (0.0%) |
| 5 to 9 Year Old | 19 (100.0%) | 0 (0.0%) |
| 10 to 14 Year Olds | 13 (100.0%) | 0 (0.0%) |
| 15 to 17 Year Olds | 20 (100.0%) | 0 (0.0%) |
| 18 to 19 Year Olds | 0 (0.0%) | 0 (0.0%) |
| 20 to 24 Year Olds | 2 (100.0%) | 0 (0.0%) |
| 25 to 34 Year Olds | 0 (0.0%) | 0 (0.0%) |
| 35 Years and over | 2 (100.0%) | 0 (0.0%) |
| Total | 60 (100.0%) | 0 (0.0%) |
Educational Attainment by Field of Study in Nelson
Education (23 | 33.3%), bio, nature & agricultural (12 | 17.4%), science & technology (9 | 13.0%), visual & performing arts (7 | 10.1%), and business (5 | 7.2%) are the most common fields of study among 69 individuals in Nelson who have obtained a bachelor's degree or higher.
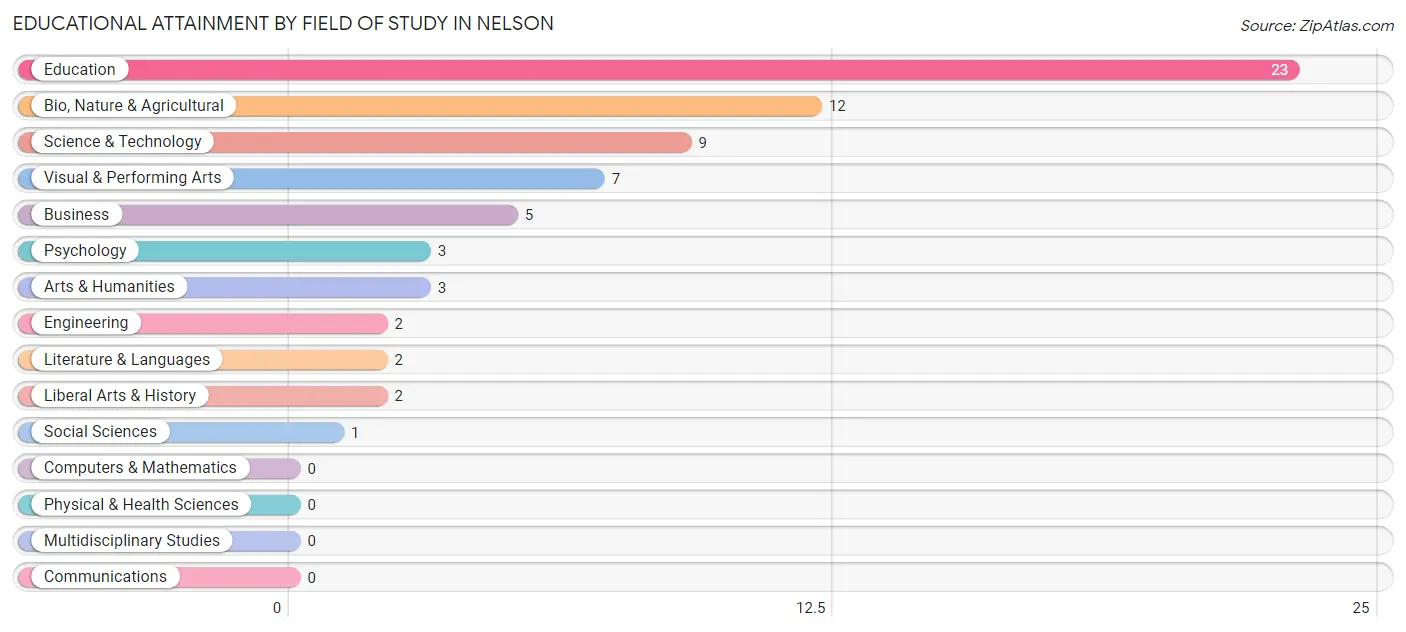
| Field of Study | # Graduates | % Graduates |
| Computers & Mathematics | 0 | 0.0% |
| Bio, Nature & Agricultural | 12 | 17.4% |
| Physical & Health Sciences | 0 | 0.0% |
| Psychology | 3 | 4.3% |
| Social Sciences | 1 | 1.5% |
| Engineering | 2 | 2.9% |
| Multidisciplinary Studies | 0 | 0.0% |
| Science & Technology | 9 | 13.0% |
| Business | 5 | 7.2% |
| Education | 23 | 33.3% |
| Literature & Languages | 2 | 2.9% |
| Liberal Arts & History | 2 | 2.9% |
| Visual & Performing Arts | 7 | 10.1% |
| Communications | 0 | 0.0% |
| Arts & Humanities | 3 | 4.3% |
| Total | 69 | 100.0% |
Transportation & Commute in Nelson
Vehicle Availability by Sex in Nelson
The most prevalent vehicle ownership categories in Nelson are males with 3 vehicles (33, accounting for 37.5%) and females with 3 vehicles (20, making up 50.8%).
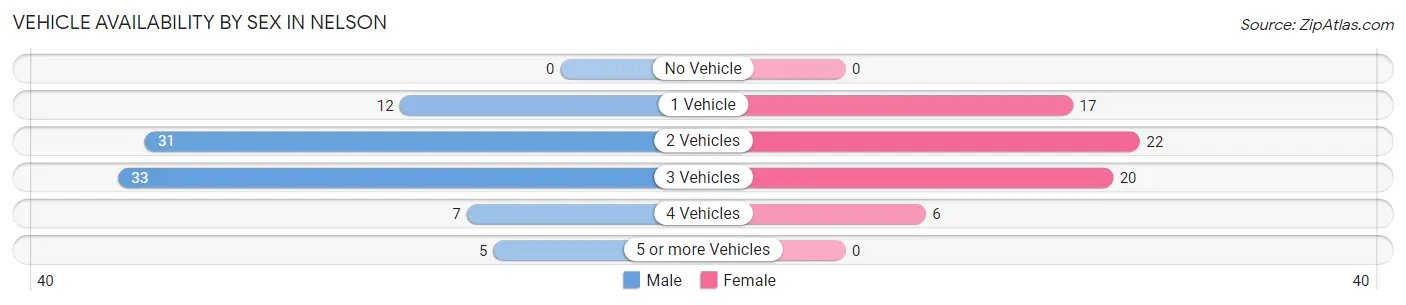
| Vehicles Available | Male | Female |
| No Vehicle | 0 (0.0%) | 0 (0.0%) |
| 1 Vehicle | 12 (13.6%) | 17 (26.2%) |
| 2 Vehicles | 31 (35.2%) | 22 (33.9%) |
| 3 Vehicles | 33 (37.5%) | 20 (30.8%) |
| 4 Vehicles | 7 (8.0%) | 6 (9.2%) |
| 5 or more Vehicles | 5 (5.7%) | 0 (0.0%) |
| Total | 88 (100.0%) | 65 (100.0%) |
Commute Time in Nelson
The most frequently occuring commute durations in Nelson are 20 to 24 minutes (26 commuters, 17.2%), 5 to 9 minutes (25 commuters, 16.6%), and 10 to 14 minutes (18 commuters, 11.9%).
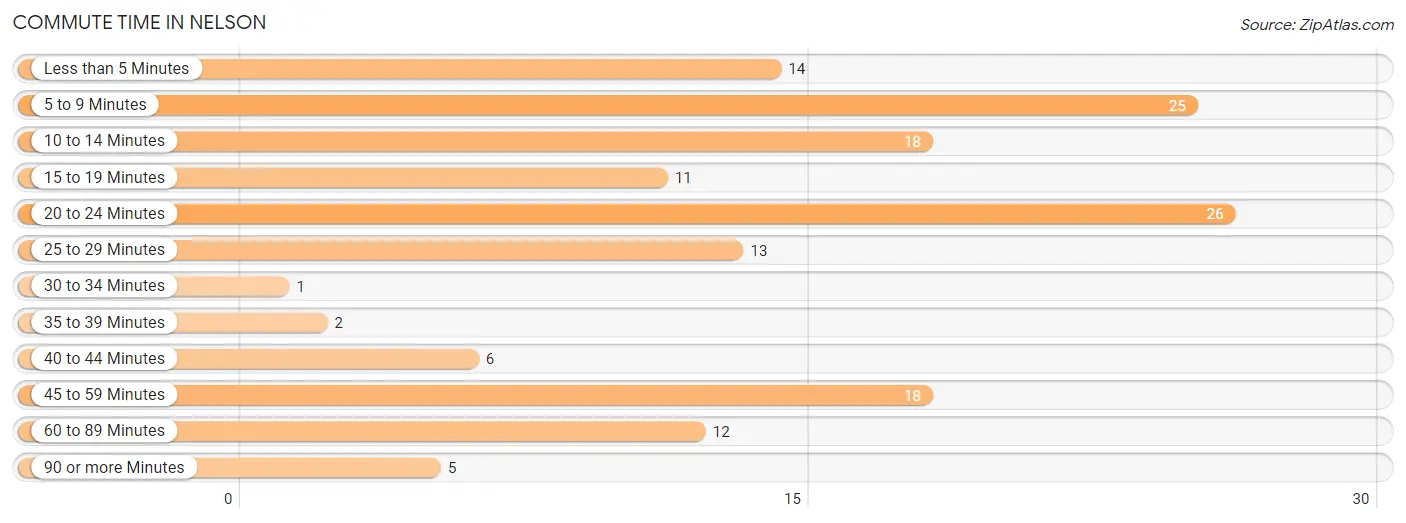
| Commute Time | # Commuters | % Commuters |
| Less than 5 Minutes | 14 | 9.3% |
| 5 to 9 Minutes | 25 | 16.6% |
| 10 to 14 Minutes | 18 | 11.9% |
| 15 to 19 Minutes | 11 | 7.3% |
| 20 to 24 Minutes | 26 | 17.2% |
| 25 to 29 Minutes | 13 | 8.6% |
| 30 to 34 Minutes | 1 | 0.7% |
| 35 to 39 Minutes | 2 | 1.3% |
| 40 to 44 Minutes | 6 | 4.0% |
| 45 to 59 Minutes | 18 | 11.9% |
| 60 to 89 Minutes | 12 | 8.0% |
| 90 or more Minutes | 5 | 3.3% |
Commute Time by Sex in Nelson
The most common commute times in Nelson are 20 to 24 minutes (20 commuters, 23.3%) for males and 5 to 9 minutes (12 commuters, 18.5%) for females.
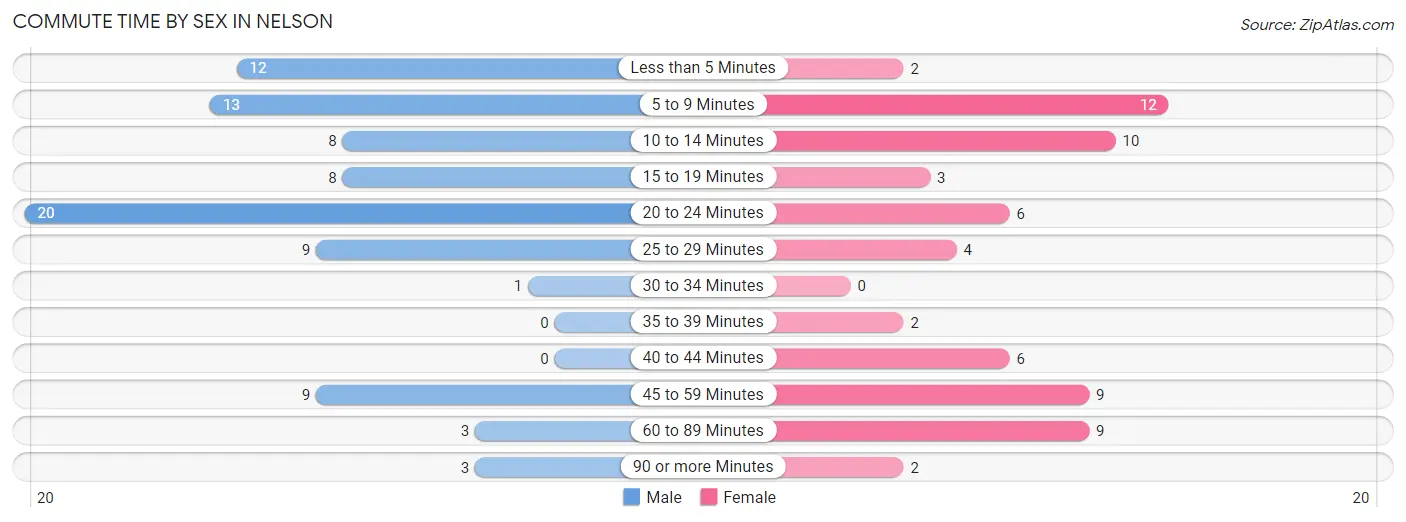
| Commute Time | Male | Female |
| Less than 5 Minutes | 12 (14.0%) | 2 (3.1%) |
| 5 to 9 Minutes | 13 (15.1%) | 12 (18.5%) |
| 10 to 14 Minutes | 8 (9.3%) | 10 (15.4%) |
| 15 to 19 Minutes | 8 (9.3%) | 3 (4.6%) |
| 20 to 24 Minutes | 20 (23.3%) | 6 (9.2%) |
| 25 to 29 Minutes | 9 (10.5%) | 4 (6.1%) |
| 30 to 34 Minutes | 1 (1.2%) | 0 (0.0%) |
| 35 to 39 Minutes | 0 (0.0%) | 2 (3.1%) |
| 40 to 44 Minutes | 0 (0.0%) | 6 (9.2%) |
| 45 to 59 Minutes | 9 (10.5%) | 9 (13.9%) |
| 60 to 89 Minutes | 3 (3.5%) | 9 (13.9%) |
| 90 or more Minutes | 3 (3.5%) | 2 (3.1%) |
Time of Departure to Work by Sex in Nelson
The most frequent times of departure to work in Nelson are 6:00 AM to 6:29 AM (30, 34.9%) for males and 7:30 AM to 7:59 AM (15, 23.1%) for females.
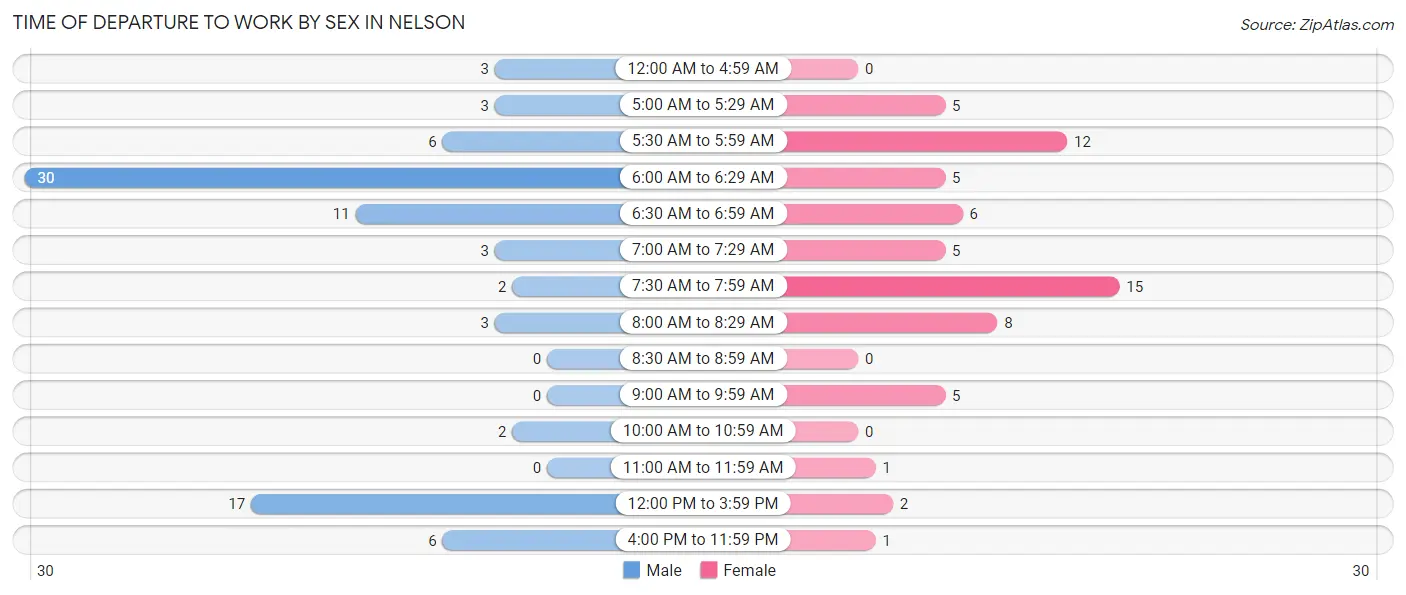
| Time of Departure | Male | Female |
| 12:00 AM to 4:59 AM | 3 (3.5%) | 0 (0.0%) |
| 5:00 AM to 5:29 AM | 3 (3.5%) | 5 (7.7%) |
| 5:30 AM to 5:59 AM | 6 (7.0%) | 12 (18.5%) |
| 6:00 AM to 6:29 AM | 30 (34.9%) | 5 (7.7%) |
| 6:30 AM to 6:59 AM | 11 (12.8%) | 6 (9.2%) |
| 7:00 AM to 7:29 AM | 3 (3.5%) | 5 (7.7%) |
| 7:30 AM to 7:59 AM | 2 (2.3%) | 15 (23.1%) |
| 8:00 AM to 8:29 AM | 3 (3.5%) | 8 (12.3%) |
| 8:30 AM to 8:59 AM | 0 (0.0%) | 0 (0.0%) |
| 9:00 AM to 9:59 AM | 0 (0.0%) | 5 (7.7%) |
| 10:00 AM to 10:59 AM | 2 (2.3%) | 0 (0.0%) |
| 11:00 AM to 11:59 AM | 0 (0.0%) | 1 (1.5%) |
| 12:00 PM to 3:59 PM | 17 (19.8%) | 2 (3.1%) |
| 4:00 PM to 11:59 PM | 6 (7.0%) | 1 (1.5%) |
| Total | 86 (100.0%) | 65 (100.0%) |
Housing Occupancy in Nelson
Occupancy by Ownership in Nelson
Of the total 158 dwellings in Nelson, owner-occupied units account for 101 (63.9%), while renter-occupied units make up 57 (36.1%).
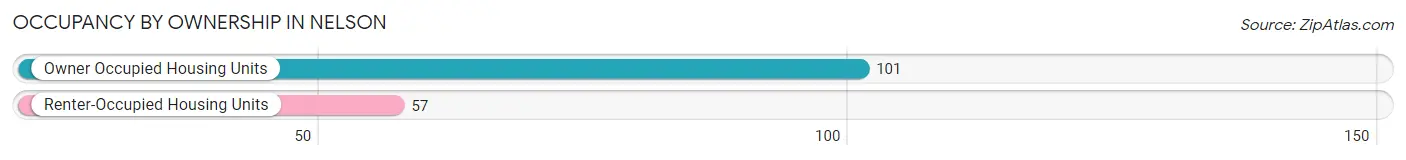
| Occupancy | # Housing Units | % Housing Units |
| Owner Occupied Housing Units | 101 | 63.9% |
| Renter-Occupied Housing Units | 57 | 36.1% |
| Total Occupied Housing Units | 158 | 100.0% |
Occupancy by Household Size in Nelson
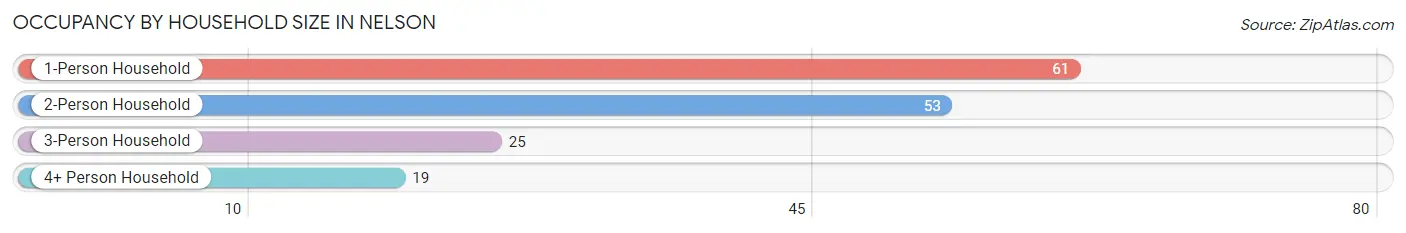
| Household Size | # Housing Units | % Housing Units |
| 1-Person Household | 61 | 38.6% |
| 2-Person Household | 53 | 33.5% |
| 3-Person Household | 25 | 15.8% |
| 4+ Person Household | 19 | 12.0% |
| Total Housing Units | 158 | 100.0% |
Occupancy by Ownership by Household Size in Nelson
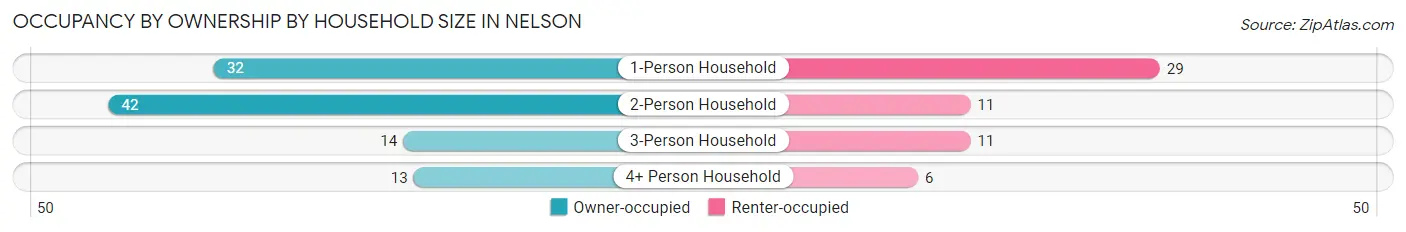
| Household Size | Owner-occupied | Renter-occupied |
| 1-Person Household | 32 (52.5%) | 29 (47.5%) |
| 2-Person Household | 42 (79.2%) | 11 (20.7%) |
| 3-Person Household | 14 (56.0%) | 11 (44.0%) |
| 4+ Person Household | 13 (68.4%) | 6 (31.6%) |
| Total Housing Units | 101 (63.9%) | 57 (36.1%) |
Occupancy by Educational Attainment in Nelson
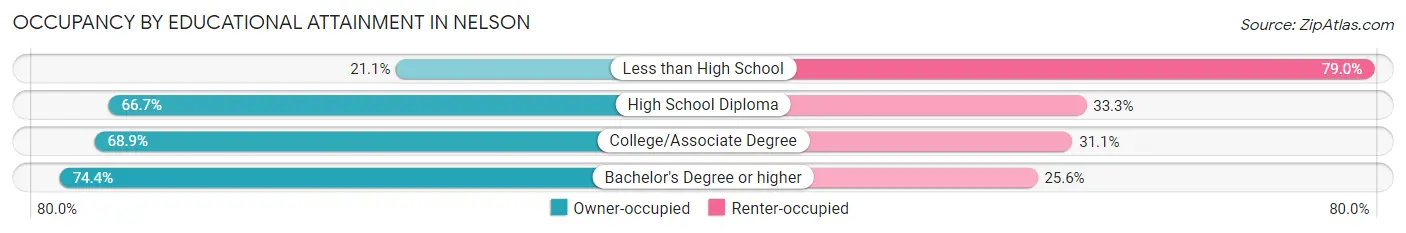
| Household Size | Owner-occupied | Renter-occupied |
| Less than High School | 4 (21.0%) | 15 (78.9%) |
| High School Diploma | 34 (66.7%) | 17 (33.3%) |
| College/Associate Degree | 31 (68.9%) | 14 (31.1%) |
| Bachelor's Degree or higher | 32 (74.4%) | 11 (25.6%) |
Occupancy by Age of Householder in Nelson
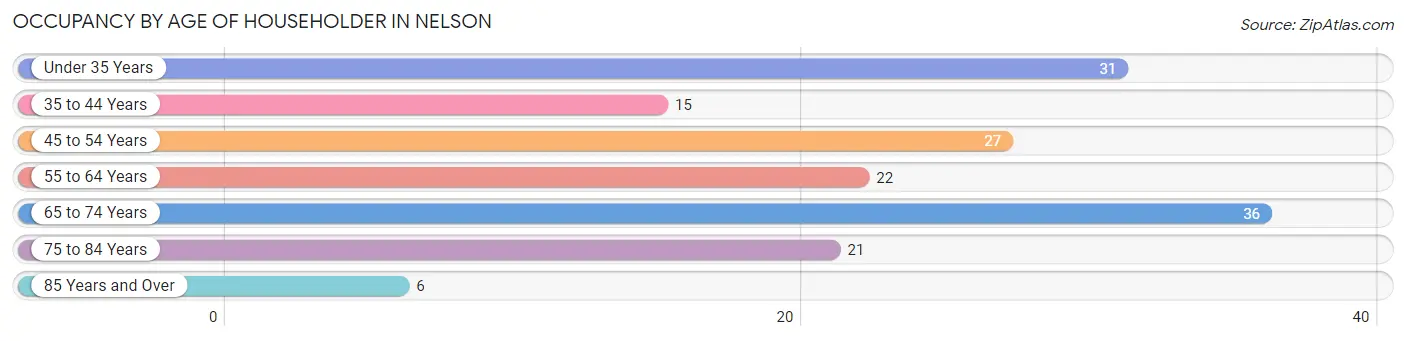
| Age Bracket | # Households | % Households |
| Under 35 Years | 31 | 19.6% |
| 35 to 44 Years | 15 | 9.5% |
| 45 to 54 Years | 27 | 17.1% |
| 55 to 64 Years | 22 | 13.9% |
| 65 to 74 Years | 36 | 22.8% |
| 75 to 84 Years | 21 | 13.3% |
| 85 Years and Over | 6 | 3.8% |
| Total | 158 | 100.0% |
Housing Finances in Nelson
Median Income by Occupancy in Nelson
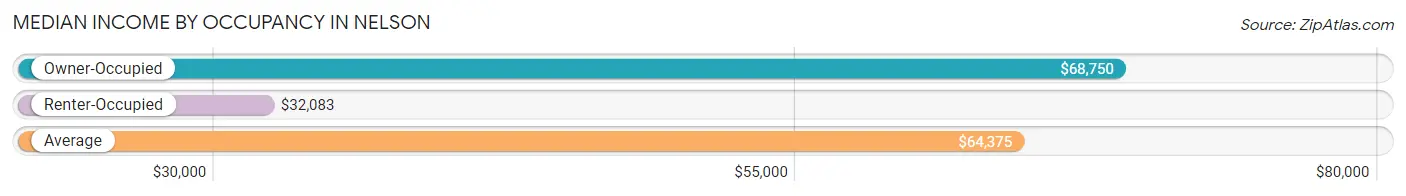
| Occupancy Type | # Households | Median Income |
| Owner-Occupied | 101 (63.9%) | $68,750 |
| Renter-Occupied | 57 (36.1%) | $32,083 |
| Average | 158 (100.0%) | $64,375 |
Occupancy by Householder Income Bracket in Nelson
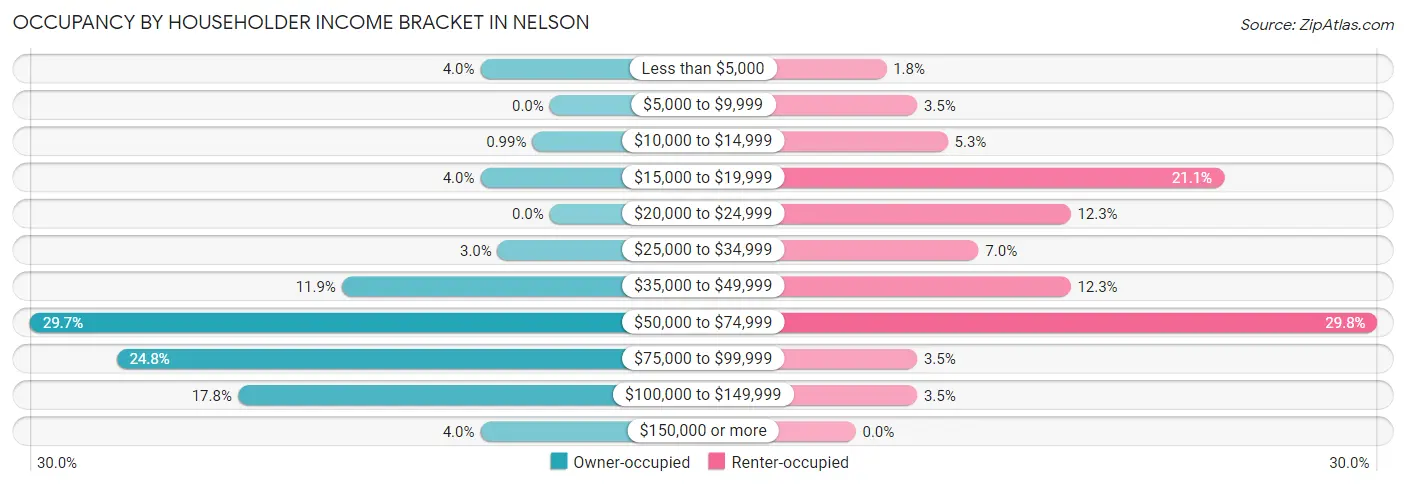
| Income Bracket | Owner-occupied | Renter-occupied |
| Less than $5,000 | 4 (4.0%) | 1 (1.8%) |
| $5,000 to $9,999 | 0 (0.0%) | 2 (3.5%) |
| $10,000 to $14,999 | 1 (1.0%) | 3 (5.3%) |
| $15,000 to $19,999 | 4 (4.0%) | 12 (21.0%) |
| $20,000 to $24,999 | 0 (0.0%) | 7 (12.3%) |
| $25,000 to $34,999 | 3 (3.0%) | 4 (7.0%) |
| $35,000 to $49,999 | 12 (11.9%) | 7 (12.3%) |
| $50,000 to $74,999 | 30 (29.7%) | 17 (29.8%) |
| $75,000 to $99,999 | 25 (24.7%) | 2 (3.5%) |
| $100,000 to $149,999 | 18 (17.8%) | 2 (3.5%) |
| $150,000 or more | 4 (4.0%) | 0 (0.0%) |
| Total | 101 (100.0%) | 57 (100.0%) |
Monthly Housing Cost Tiers in Nelson
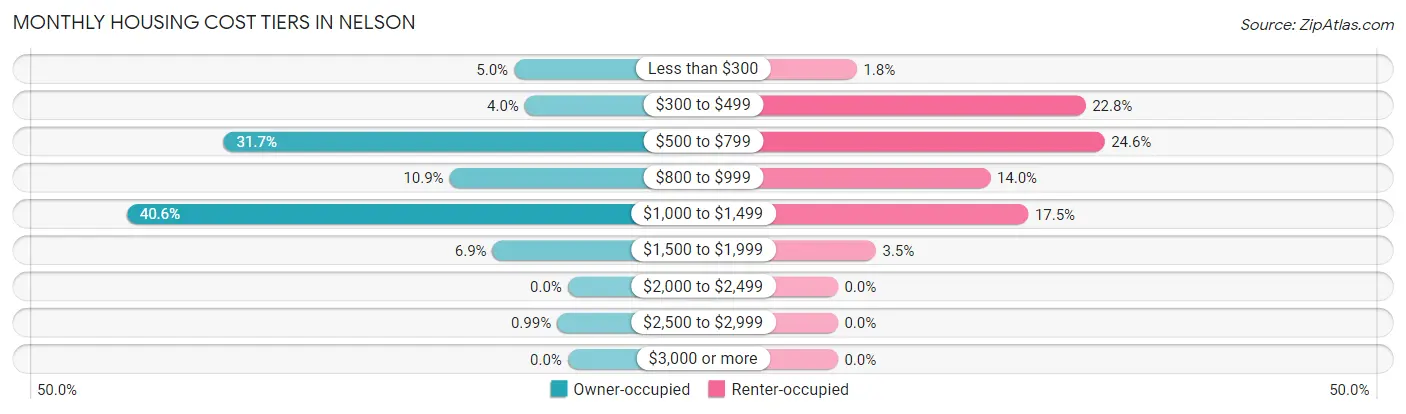
| Monthly Cost | Owner-occupied | Renter-occupied |
| Less than $300 | 5 (5.0%) | 1 (1.8%) |
| $300 to $499 | 4 (4.0%) | 13 (22.8%) |
| $500 to $799 | 32 (31.7%) | 14 (24.6%) |
| $800 to $999 | 11 (10.9%) | 8 (14.0%) |
| $1,000 to $1,499 | 41 (40.6%) | 10 (17.5%) |
| $1,500 to $1,999 | 7 (6.9%) | 2 (3.5%) |
| $2,000 to $2,499 | 0 (0.0%) | 0 (0.0%) |
| $2,500 to $2,999 | 1 (1.0%) | 0 (0.0%) |
| $3,000 or more | 0 (0.0%) | 0 (0.0%) |
| Total | 101 (100.0%) | 57 (100.0%) |
Physical Housing Characteristics in Nelson
Housing Structures in Nelson
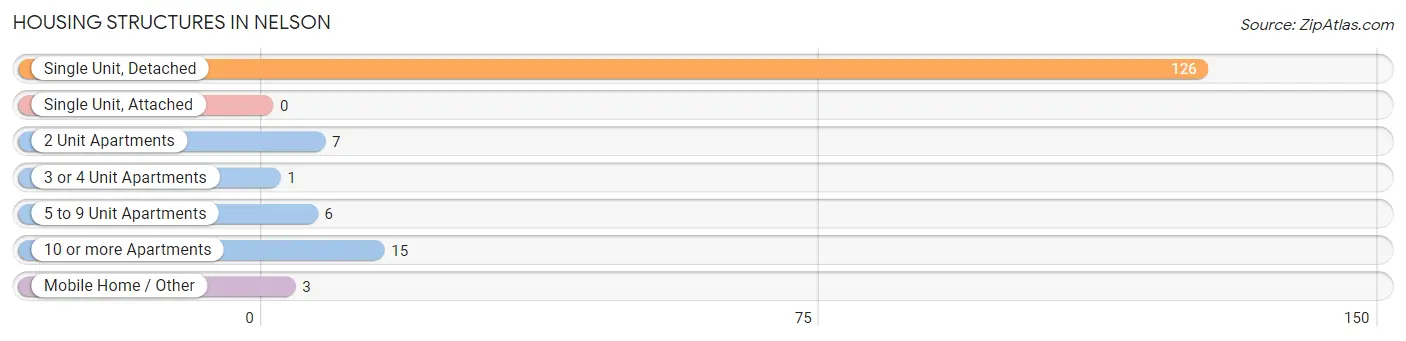
| Structure Type | # Housing Units | % Housing Units |
| Single Unit, Detached | 126 | 79.7% |
| Single Unit, Attached | 0 | 0.0% |
| 2 Unit Apartments | 7 | 4.4% |
| 3 or 4 Unit Apartments | 1 | 0.6% |
| 5 to 9 Unit Apartments | 6 | 3.8% |
| 10 or more Apartments | 15 | 9.5% |
| Mobile Home / Other | 3 | 1.9% |
| Total | 158 | 100.0% |
Housing Structures by Occupancy in Nelson
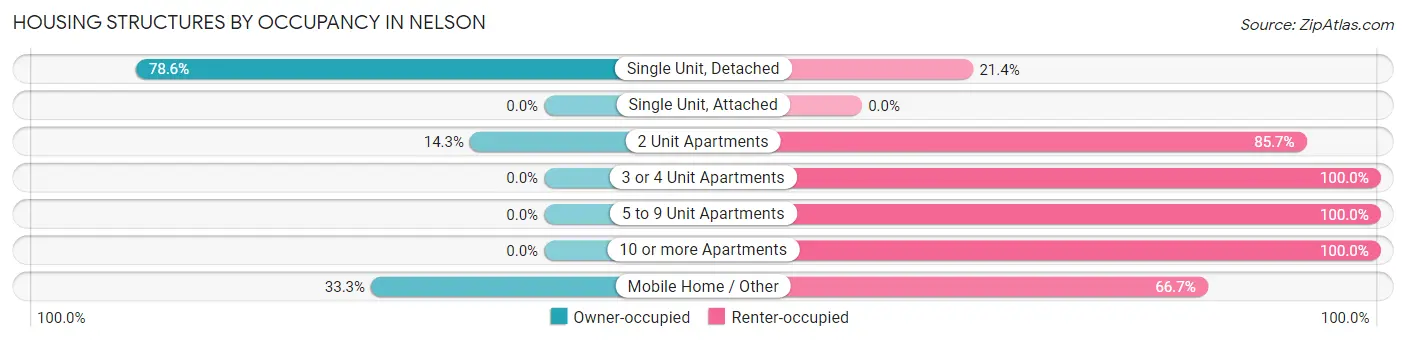
| Structure Type | Owner-occupied | Renter-occupied |
| Single Unit, Detached | 99 (78.6%) | 27 (21.4%) |
| Single Unit, Attached | 0 (0.0%) | 0 (0.0%) |
| 2 Unit Apartments | 1 (14.3%) | 6 (85.7%) |
| 3 or 4 Unit Apartments | 0 (0.0%) | 1 (100.0%) |
| 5 to 9 Unit Apartments | 0 (0.0%) | 6 (100.0%) |
| 10 or more Apartments | 0 (0.0%) | 15 (100.0%) |
| Mobile Home / Other | 1 (33.3%) | 2 (66.7%) |
| Total | 101 (63.9%) | 57 (36.1%) |
Housing Structures by Number of Rooms in Nelson
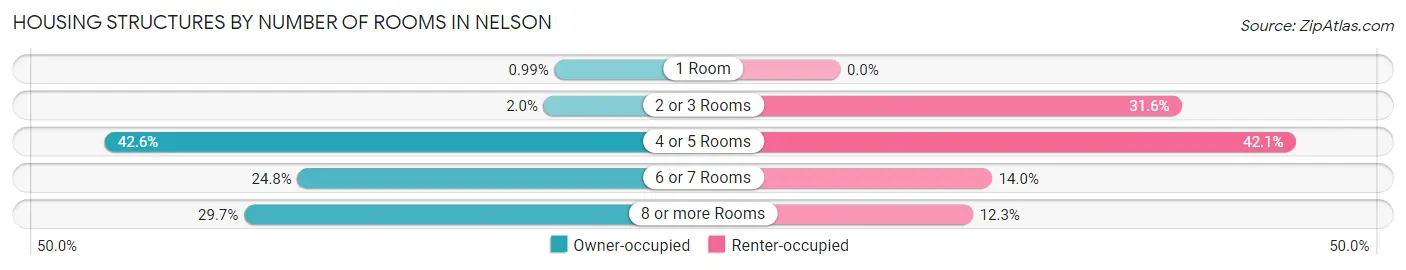
| Number of Rooms | Owner-occupied | Renter-occupied |
| 1 Room | 1 (1.0%) | 0 (0.0%) |
| 2 or 3 Rooms | 2 (2.0%) | 18 (31.6%) |
| 4 or 5 Rooms | 43 (42.6%) | 24 (42.1%) |
| 6 or 7 Rooms | 25 (24.7%) | 8 (14.0%) |
| 8 or more Rooms | 30 (29.7%) | 7 (12.3%) |
| Total | 101 (100.0%) | 57 (100.0%) |
Housing Structure by Heating Type in Nelson
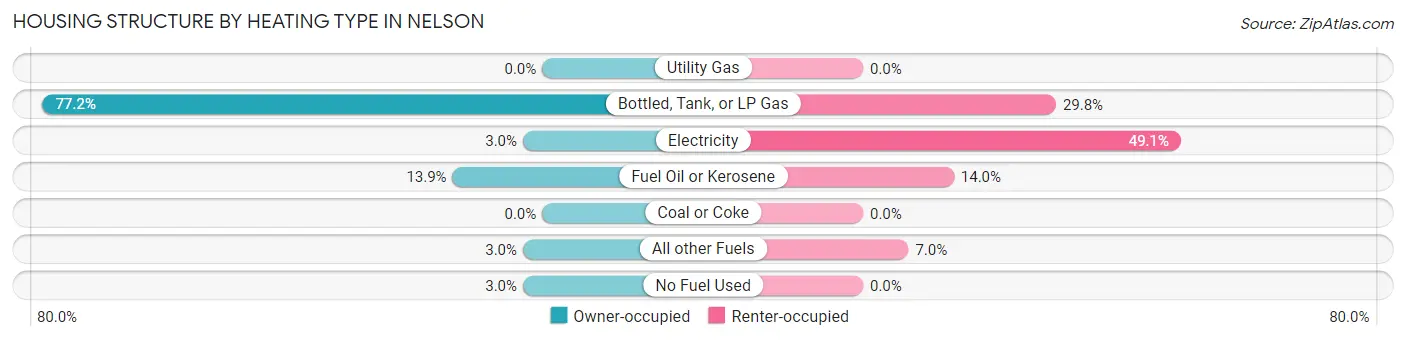
| Heating Type | Owner-occupied | Renter-occupied |
| Utility Gas | 0 (0.0%) | 0 (0.0%) |
| Bottled, Tank, or LP Gas | 78 (77.2%) | 17 (29.8%) |
| Electricity | 3 (3.0%) | 28 (49.1%) |
| Fuel Oil or Kerosene | 14 (13.9%) | 8 (14.0%) |
| Coal or Coke | 0 (0.0%) | 0 (0.0%) |
| All other Fuels | 3 (3.0%) | 4 (7.0%) |
| No Fuel Used | 3 (3.0%) | 0 (0.0%) |
| Total | 101 (100.0%) | 57 (100.0%) |
Household Vehicle Usage in Nelson
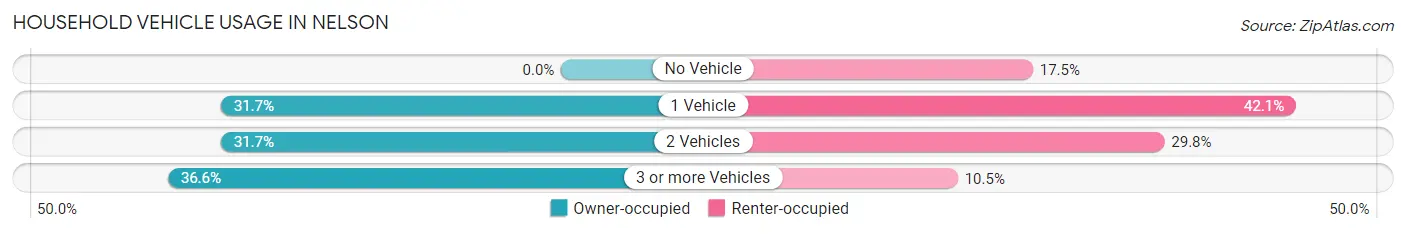
| Vehicles per Household | Owner-occupied | Renter-occupied |
| No Vehicle | 0 (0.0%) | 10 (17.5%) |
| 1 Vehicle | 32 (31.7%) | 24 (42.1%) |
| 2 Vehicles | 32 (31.7%) | 17 (29.8%) |
| 3 or more Vehicles | 37 (36.6%) | 6 (10.5%) |
| Total | 101 (100.0%) | 57 (100.0%) |
Real Estate & Mortgages in Nelson
Real Estate and Mortgage Overview in Nelson
| Characteristic | Without Mortgage | With Mortgage |
| Housing Units | 47 | 54 |
| Median Property Value | $146,300 | $146,900 |
| Median Household Income | $66,250 | $0 |
| Monthly Housing Costs | $608 | $0 |
| Real Estate Taxes | $2,595 | $0 |
Property Value by Mortgage Status in Nelson
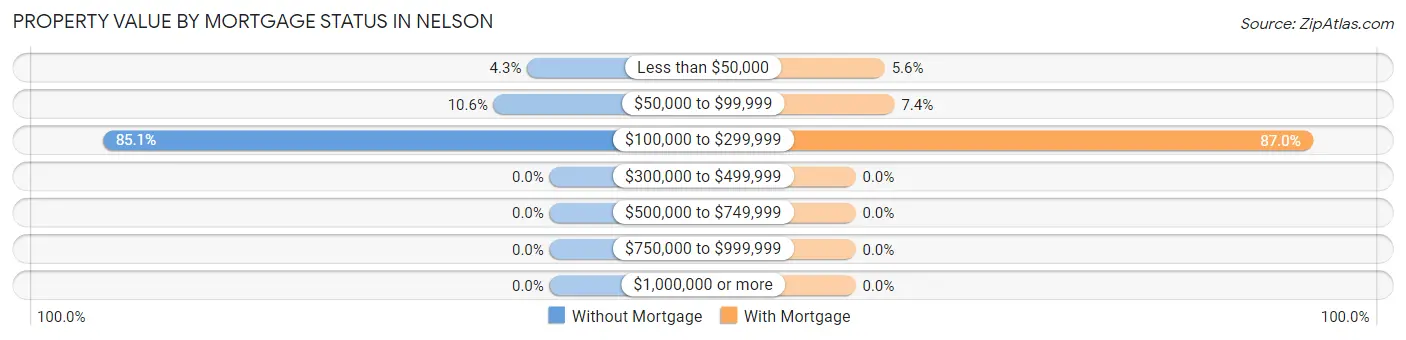
| Property Value | Without Mortgage | With Mortgage |
| Less than $50,000 | 2 (4.3%) | 3 (5.6%) |
| $50,000 to $99,999 | 5 (10.6%) | 4 (7.4%) |
| $100,000 to $299,999 | 40 (85.1%) | 47 (87.0%) |
| $300,000 to $499,999 | 0 (0.0%) | 0 (0.0%) |
| $500,000 to $749,999 | 0 (0.0%) | 0 (0.0%) |
| $750,000 to $999,999 | 0 (0.0%) | 0 (0.0%) |
| $1,000,000 or more | 0 (0.0%) | 0 (0.0%) |
| Total | 47 (100.0%) | 54 (100.0%) |
Household Income by Mortgage Status in Nelson
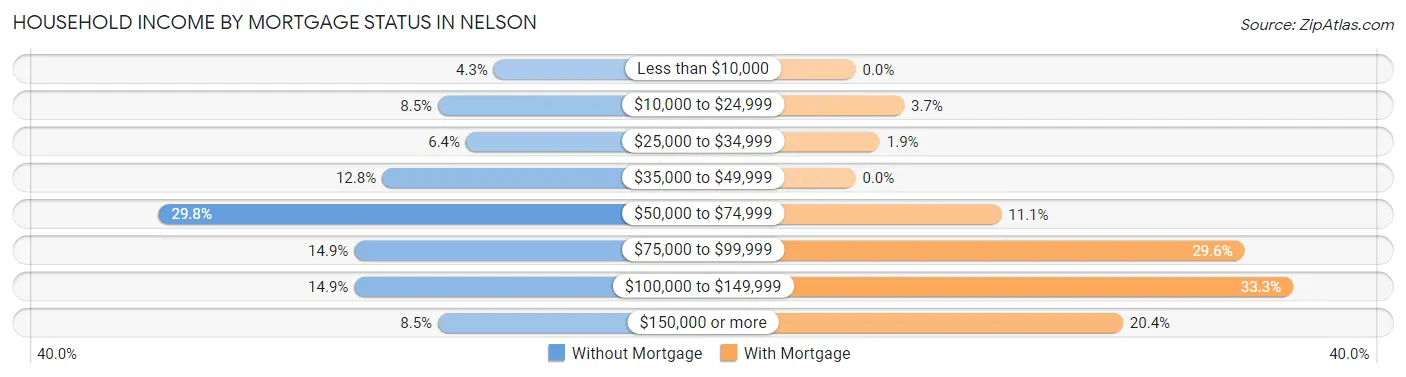
| Household Income | Without Mortgage | With Mortgage |
| Less than $10,000 | 2 (4.3%) | 0 (0.0%) |
| $10,000 to $24,999 | 4 (8.5%) | 2 (3.7%) |
| $25,000 to $34,999 | 3 (6.4%) | 1 (1.8%) |
| $35,000 to $49,999 | 6 (12.8%) | 0 (0.0%) |
| $50,000 to $74,999 | 14 (29.8%) | 6 (11.1%) |
| $75,000 to $99,999 | 7 (14.9%) | 16 (29.6%) |
| $100,000 to $149,999 | 7 (14.9%) | 18 (33.3%) |
| $150,000 or more | 4 (8.5%) | 11 (20.4%) |
| Total | 47 (100.0%) | 54 (100.0%) |
Property Value to Household Income Ratio in Nelson
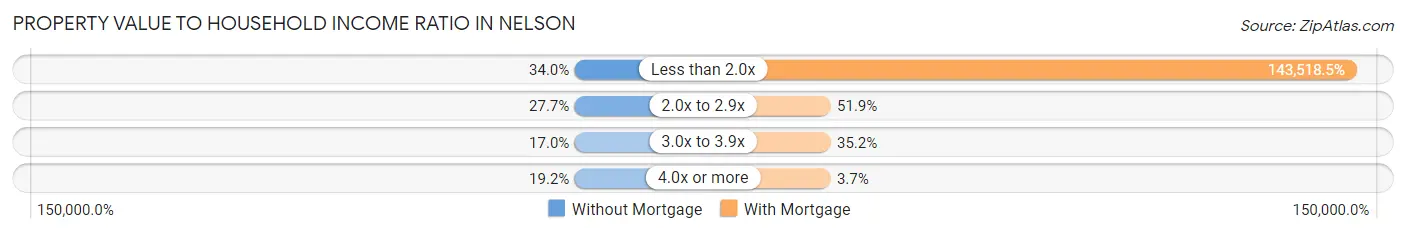
| Value-to-Income Ratio | Without Mortgage | With Mortgage |
| Less than 2.0x | 16 (34.0%) | 77,500 (143,518.5%) |
| 2.0x to 2.9x | 13 (27.7%) | 28 (51.8%) |
| 3.0x to 3.9x | 8 (17.0%) | 19 (35.2%) |
| 4.0x or more | 9 (19.2%) | 2 (3.7%) |
| Total | 47 (100.0%) | 54 (100.0%) |
Real Estate Taxes by Mortgage Status in Nelson
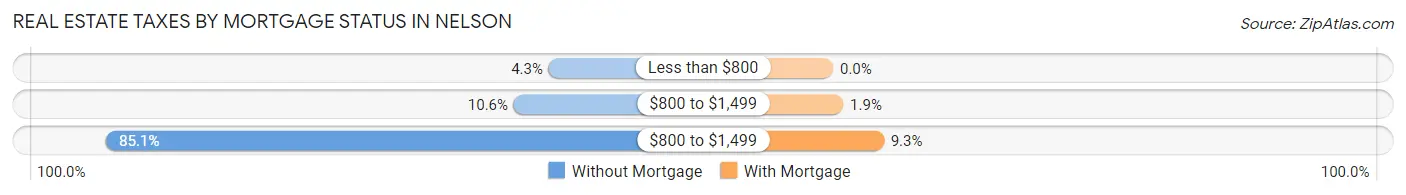
| Property Taxes | Without Mortgage | With Mortgage |
| Less than $800 | 2 (4.3%) | 0 (0.0%) |
| $800 to $1,499 | 5 (10.6%) | 1 (1.8%) |
| $800 to $1,499 | 40 (85.1%) | 5 (9.3%) |
| Total | 47 (100.0%) | 54 (100.0%) |
Health & Disability in Nelson
Health Insurance Coverage by Age in Nelson
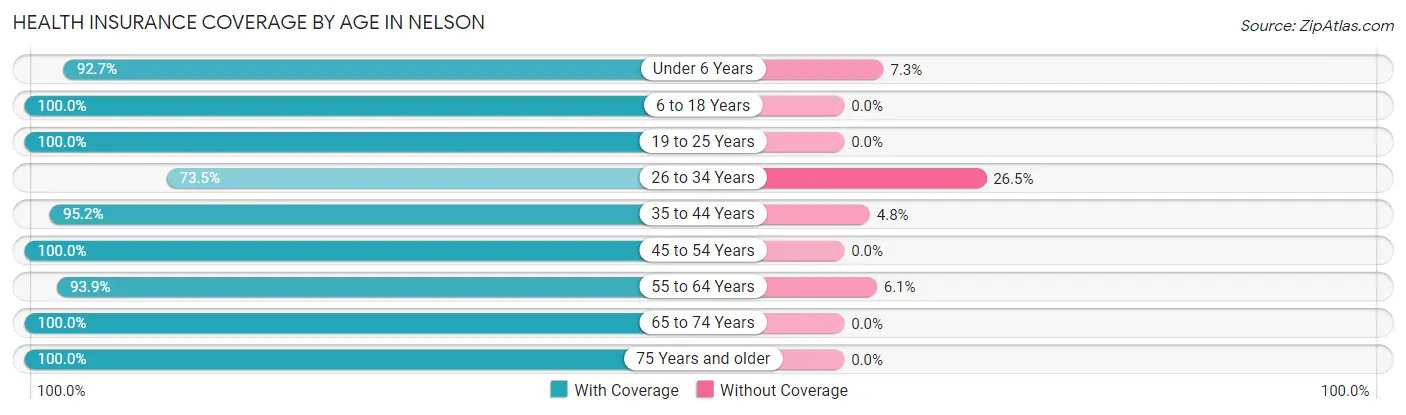
| Age Bracket | With Coverage | Without Coverage |
| Under 6 Years | 38 (92.7%) | 3 (7.3%) |
| 6 to 18 Years | 48 (100.0%) | 0 (0.0%) |
| 19 to 25 Years | 23 (100.0%) | 0 (0.0%) |
| 26 to 34 Years | 25 (73.5%) | 9 (26.5%) |
| 35 to 44 Years | 20 (95.2%) | 1 (4.8%) |
| 45 to 54 Years | 46 (100.0%) | 0 (0.0%) |
| 55 to 64 Years | 31 (93.9%) | 2 (6.1%) |
| 65 to 74 Years | 60 (100.0%) | 0 (0.0%) |
| 75 Years and older | 35 (100.0%) | 0 (0.0%) |
| Total | 326 (95.6%) | 15 (4.4%) |
Health Insurance Coverage by Citizenship Status in Nelson
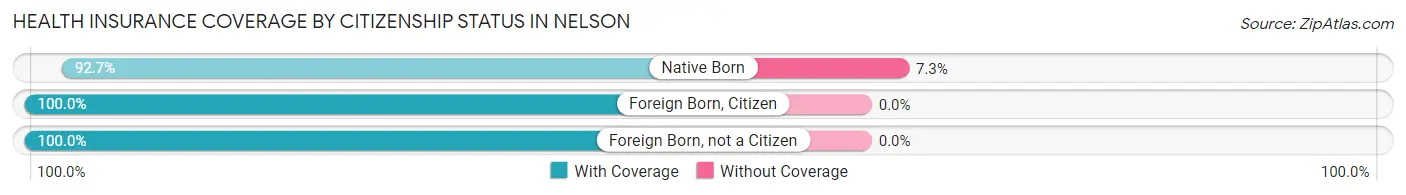
| Citizenship Status | With Coverage | Without Coverage |
| Native Born | 38 (92.7%) | 3 (7.3%) |
| Foreign Born, Citizen | 48 (100.0%) | 0 (0.0%) |
| Foreign Born, not a Citizen | 23 (100.0%) | 0 (0.0%) |
Health Insurance Coverage by Household Income in Nelson
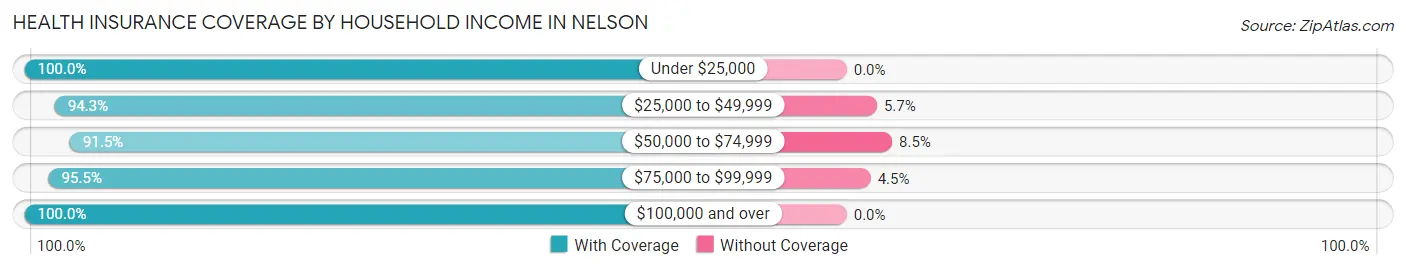
| Household Income | With Coverage | Without Coverage |
| Under $25,000 | 40 (100.0%) | 0 (0.0%) |
| $25,000 to $49,999 | 50 (94.3%) | 3 (5.7%) |
| $50,000 to $74,999 | 97 (91.5%) | 9 (8.5%) |
| $75,000 to $99,999 | 64 (95.5%) | 3 (4.5%) |
| $100,000 and over | 75 (100.0%) | 0 (0.0%) |
Public vs Private Health Insurance Coverage by Age in Nelson
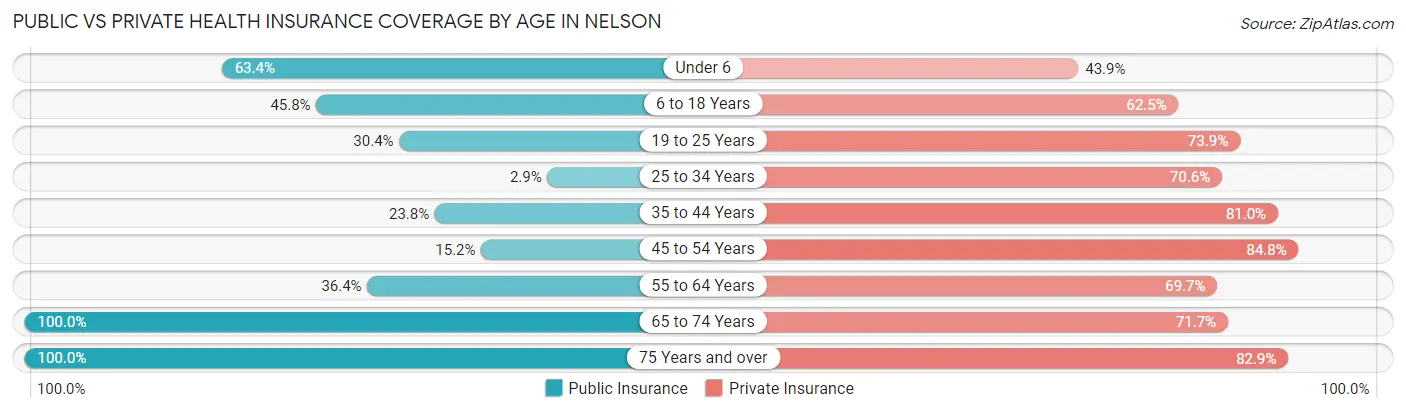
| Age Bracket | Public Insurance | Private Insurance |
| Under 6 | 26 (63.4%) | 18 (43.9%) |
| 6 to 18 Years | 22 (45.8%) | 30 (62.5%) |
| 19 to 25 Years | 7 (30.4%) | 17 (73.9%) |
| 25 to 34 Years | 1 (2.9%) | 24 (70.6%) |
| 35 to 44 Years | 5 (23.8%) | 17 (80.9%) |
| 45 to 54 Years | 7 (15.2%) | 39 (84.8%) |
| 55 to 64 Years | 12 (36.4%) | 23 (69.7%) |
| 65 to 74 Years | 60 (100.0%) | 43 (71.7%) |
| 75 Years and over | 35 (100.0%) | 29 (82.9%) |
| Total | 175 (51.3%) | 240 (70.4%) |
Disability Status by Sex by Age in Nelson
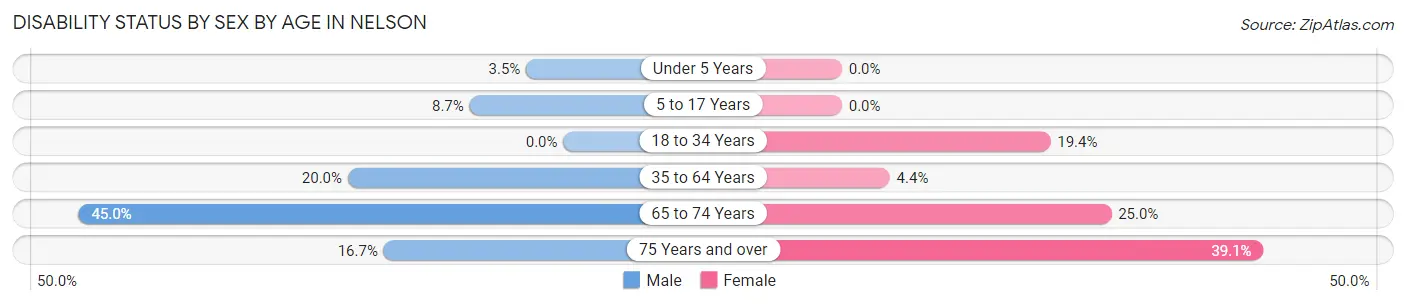
| Age Bracket | Male | Female |
| Under 5 Years | 1 (3.5%) | 0 (0.0%) |
| 5 to 17 Years | 2 (8.7%) | 0 (0.0%) |
| 18 to 34 Years | 0 (0.0%) | 6 (19.4%) |
| 35 to 64 Years | 11 (20.0%) | 2 (4.4%) |
| 65 to 74 Years | 9 (45.0%) | 10 (25.0%) |
| 75 Years and over | 2 (16.7%) | 9 (39.1%) |
Disability Class by Sex by Age in Nelson
Disability Class: Hearing Difficulty
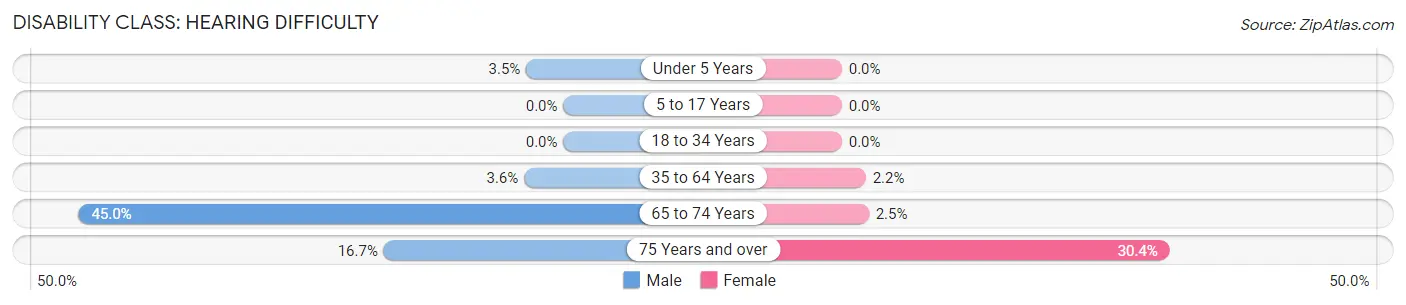
| Age Bracket | Male | Female |
| Under 5 Years | 1 (3.5%) | 0 (0.0%) |
| 5 to 17 Years | 0 (0.0%) | 0 (0.0%) |
| 18 to 34 Years | 0 (0.0%) | 0 (0.0%) |
| 35 to 64 Years | 2 (3.6%) | 1 (2.2%) |
| 65 to 74 Years | 9 (45.0%) | 1 (2.5%) |
| 75 Years and over | 2 (16.7%) | 7 (30.4%) |
Disability Class: Vision Difficulty
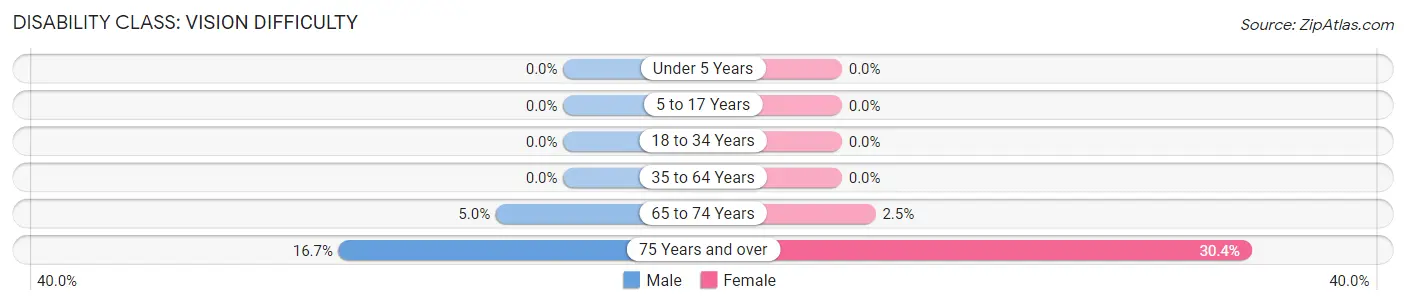
| Age Bracket | Male | Female |
| Under 5 Years | 0 (0.0%) | 0 (0.0%) |
| 5 to 17 Years | 0 (0.0%) | 0 (0.0%) |
| 18 to 34 Years | 0 (0.0%) | 0 (0.0%) |
| 35 to 64 Years | 0 (0.0%) | 0 (0.0%) |
| 65 to 74 Years | 1 (5.0%) | 1 (2.5%) |
| 75 Years and over | 2 (16.7%) | 7 (30.4%) |
Disability Class: Cognitive Difficulty
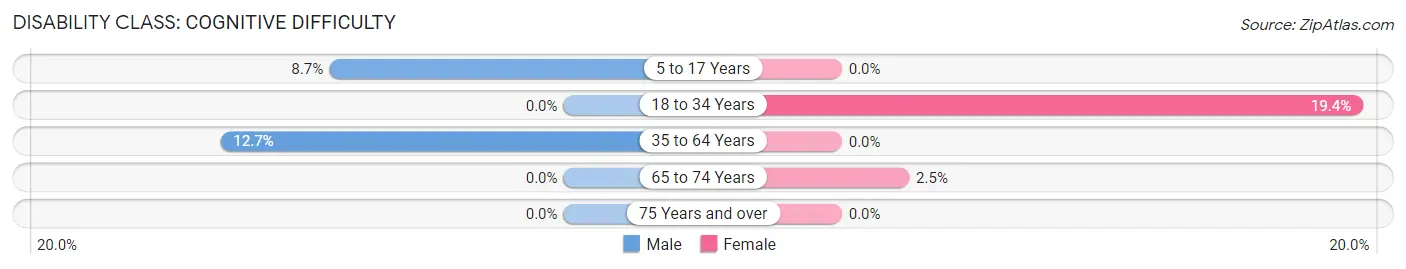
| Age Bracket | Male | Female |
| 5 to 17 Years | 2 (8.7%) | 0 (0.0%) |
| 18 to 34 Years | 0 (0.0%) | 6 (19.4%) |
| 35 to 64 Years | 7 (12.7%) | 0 (0.0%) |
| 65 to 74 Years | 0 (0.0%) | 1 (2.5%) |
| 75 Years and over | 0 (0.0%) | 0 (0.0%) |
Disability Class: Ambulatory Difficulty
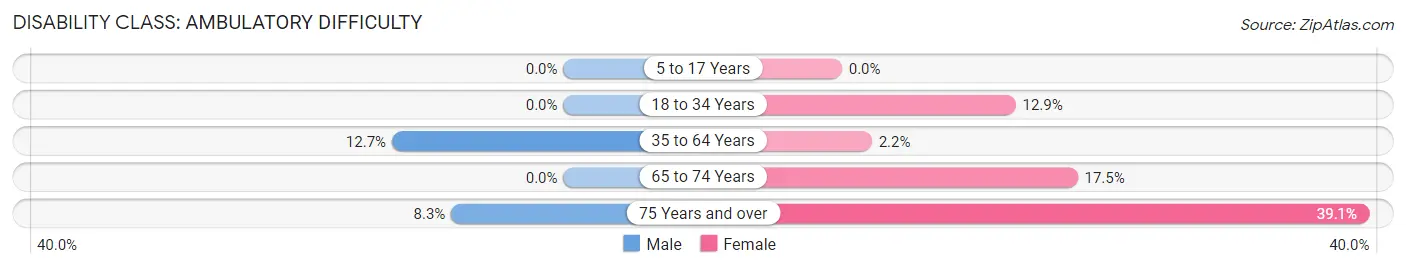
| Age Bracket | Male | Female |
| 5 to 17 Years | 0 (0.0%) | 0 (0.0%) |
| 18 to 34 Years | 0 (0.0%) | 4 (12.9%) |
| 35 to 64 Years | 7 (12.7%) | 1 (2.2%) |
| 65 to 74 Years | 0 (0.0%) | 7 (17.5%) |
| 75 Years and over | 1 (8.3%) | 9 (39.1%) |
Disability Class: Self-Care Difficulty
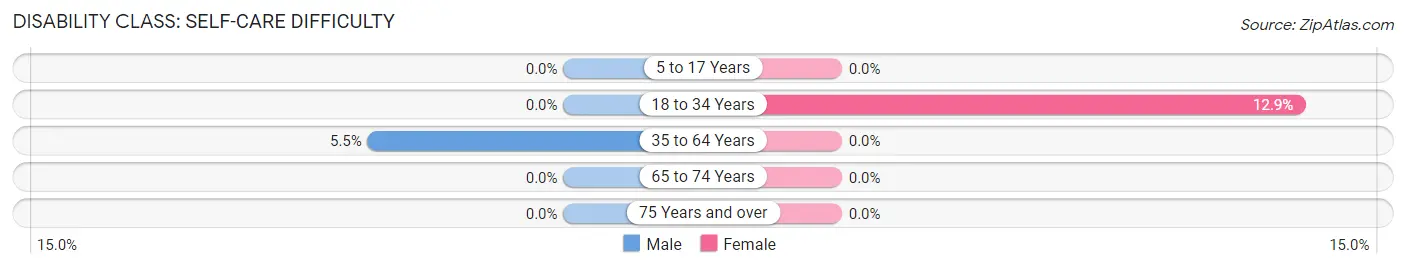
| Age Bracket | Male | Female |
| 5 to 17 Years | 0 (0.0%) | 0 (0.0%) |
| 18 to 34 Years | 0 (0.0%) | 4 (12.9%) |
| 35 to 64 Years | 3 (5.4%) | 0 (0.0%) |
| 65 to 74 Years | 0 (0.0%) | 0 (0.0%) |
| 75 Years and over | 0 (0.0%) | 0 (0.0%) |
Technology Access in Nelson
Computing Device Access in Nelson
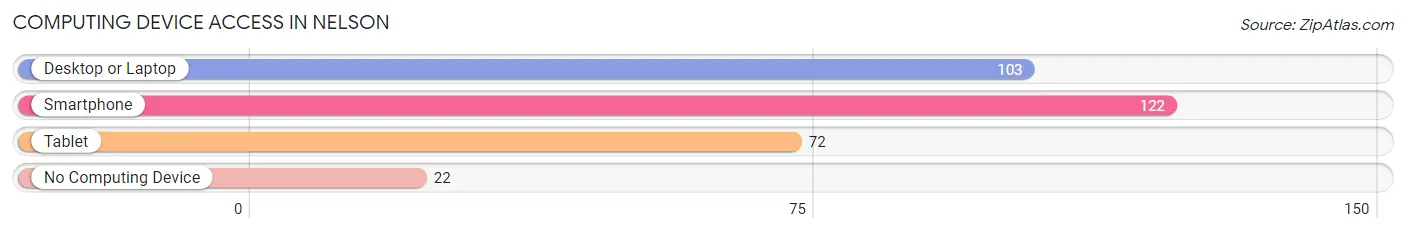
| Device Type | # Households | % Households |
| Desktop or Laptop | 103 | 65.2% |
| Smartphone | 122 | 77.2% |
| Tablet | 72 | 45.6% |
| No Computing Device | 22 | 13.9% |
| Total | 158 | 100.0% |
Internet Access in Nelson
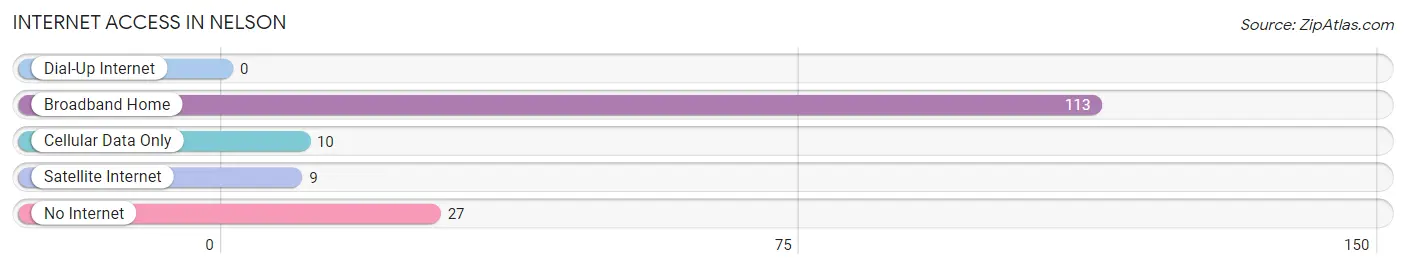
| Internet Type | # Households | % Households |
| Dial-Up Internet | 0 | 0.0% |
| Broadband Home | 113 | 71.5% |
| Cellular Data Only | 10 | 6.3% |
| Satellite Internet | 9 | 5.7% |
| No Internet | 27 | 17.1% |
| Total | 158 | 100.0% |
Nelson Summary
Nelson is a small village located in the western part of Wisconsin, in the county of Buffalo. It is situated on the banks of the Chippewa River, and is surrounded by rolling hills and lush forests. The village has a population of just over 500 people, and is a popular destination for outdoor recreation.
History
Nelson was first settled in the late 1800s by a group of Norwegian immigrants. The village was named after the Norwegian town of Nelson, which was the birthplace of the first settlers. The settlers were attracted to the area due to its abundance of natural resources, including timber and fish. The village quickly grew, and by the early 1900s, it had become a thriving community.
In the early 1900s, Nelson was a major hub for the lumber industry. The village was home to several sawmills, and the surrounding forests provided an abundance of timber for the mills. The lumber industry provided employment for many of the villagers, and the village prospered.
In the mid-1900s, the lumber industry began to decline, and the village began to suffer economically. In the late 1900s, the village began to focus on tourism as a way to revive the economy. The village is now a popular destination for outdoor recreation, and is home to several campgrounds, fishing spots, and hiking trails.
Geography
Nelson is located in the western part of Wisconsin, in the county of Buffalo. The village is situated on the banks of the Chippewa River, and is surrounded by rolling hills and lush forests. The village is located approximately 30 miles from the city of Eau Claire, and is accessible by car or bus.
The climate in Nelson is typical of the Midwest, with cold winters and warm summers. The average temperature in the winter is around 20 degrees Fahrenheit, and the average temperature in the summer is around 70 degrees Fahrenheit. The village receives an average of 40 inches of precipitation per year, with most of it falling in the form of snow.
Economy
Nelson’s economy is largely based on tourism. The village is a popular destination for outdoor recreation, and is home to several campgrounds, fishing spots, and hiking trails. The village also has several restaurants, bars, and shops, which cater to tourists and locals alike.
The village also has a small manufacturing sector, which produces a variety of products, including furniture, clothing, and wood products. The village also has a small agricultural sector, which produces a variety of crops, including corn, soybeans, and hay.
Demographics
As of the 2010 census, the population of Nelson was 514 people. The village is predominantly white, with 94.3% of the population identifying as white. The remaining 5.7% of the population is made up of African Americans, Native Americans, Asians, and other races.
The median household income in Nelson is $45,000, and the median age is 44. The village has a high rate of homeownership, with over 80% of the population owning their own homes. The village also has a high rate of educational attainment, with over 90% of the population having at least a high school diploma.
Common Questions
What is Per Capita Income in Nelson?
Per Capita income in Nelson is $31,166.
What is the Median Family Income in Nelson?
Median Family Income in Nelson is $68,333.
What is the Median Household income in Nelson?
Median Household Income in Nelson is $64,375.
What is Income or Wage Gap in Nelson?
Income or Wage Gap in Nelson is 36.1%.
Women in Nelson earn 63.9 cents for every dollar earned by a man.
What is Family Income Deficit in Nelson?
Family Income Deficit in Nelson is $7,750.
Families that are below poverty line in Nelson earn $7,750 less on average than the poverty threshold level.
What is Inequality or Gini Index in Nelson?
Inequality or Gini Index in Nelson is 0.34.
What is the Total Population of Nelson?
Total Population of Nelson is 341.
What is the Total Male Population of Nelson?
Total Male Population of Nelson is 165.
What is the Total Female Population of Nelson?
Total Female Population of Nelson is 176.
What is the Ratio of Males per 100 Females in Nelson?
There are 93.75 Males per 100 Females in Nelson.
What is the Ratio of Females per 100 Males in Nelson?
There are 106.67 Females per 100 Males in Nelson.
What is the Median Population Age in Nelson?
Median Population Age in Nelson is 45.9 Years.
What is the Average Family Size in Nelson
Average Family Size in Nelson is 2.8 People.
What is the Average Household Size in Nelson
Average Household Size in Nelson is 2.2 People.
How Large is the Labor Force in Nelson?
There are 154 People in the Labor Forcein in Nelson.
What is the Percentage of People in the Labor Force in Nelson?
57.0% of People are in the Labor Force in Nelson.