Neillsville, WI Map & Demographics
Neillsville Map
Neillsville Overview
$31,365
PER CAPITA INCOME
$77,955
AVG FAMILY INCOME
$57,400
AVG HOUSEHOLD INCOME
50.4%
WAGE / INCOME GAP [ % ]
49.6¢/ $1
WAGE / INCOME GAP [ $ ]
0.41
INEQUALITY / GINI INDEX
2,311
TOTAL POPULATION
1,171
MALE POPULATION
1,140
FEMALE POPULATION
102.72
MALES / 100 FEMALES
97.35
FEMALES / 100 MALES
40.3
MEDIAN AGE
3.1
AVG FAMILY SIZE
2.1
AVG HOUSEHOLD SIZE
1,111
LABOR FORCE [ PEOPLE ]
59.7%
PERCENT IN LABOR FORCE
3.6%
UNEMPLOYMENT RATE
Neillsville Zip Codes
Neillsville Area Codes
Income in Neillsville
Income Overview in Neillsville
Per Capita Income in Neillsville is $31,365, while median incomes of families and households are $77,955 and $57,400 respectively.
| Characteristic | Number | Measure |
| Per Capita Income | 2,311 | $31,365 |
| Median Family Income | 510 | $77,955 |
| Mean Family Income | 510 | $88,086 |
| Median Household Income | 1,044 | $57,400 |
| Mean Household Income | 1,044 | $67,112 |
| Income Deficit | 510 | $0 |
| Wage / Income Gap (%) | 2,311 | 50.37% |
| Wage / Income Gap ($) | 2,311 | 49.63¢ per $1 |
| Gini / Inequality Index | 2,311 | 0.41 |
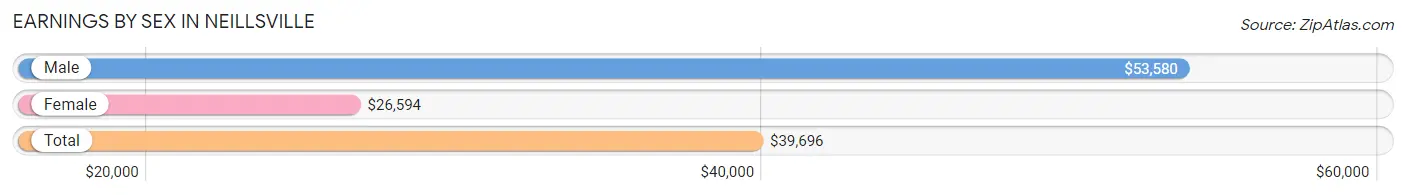
Earnings by Sex in Neillsville
Average Earnings in Neillsville are $39,696, $53,580 for men and $26,594 for women, a difference of 50.4%.
| Sex | Number | Average Earnings |
| Male | 622 (51.0%) | $53,580 |
| Female | 597 (49.0%) | $26,594 |
| Total | 1,219 (100.0%) | $39,696 |
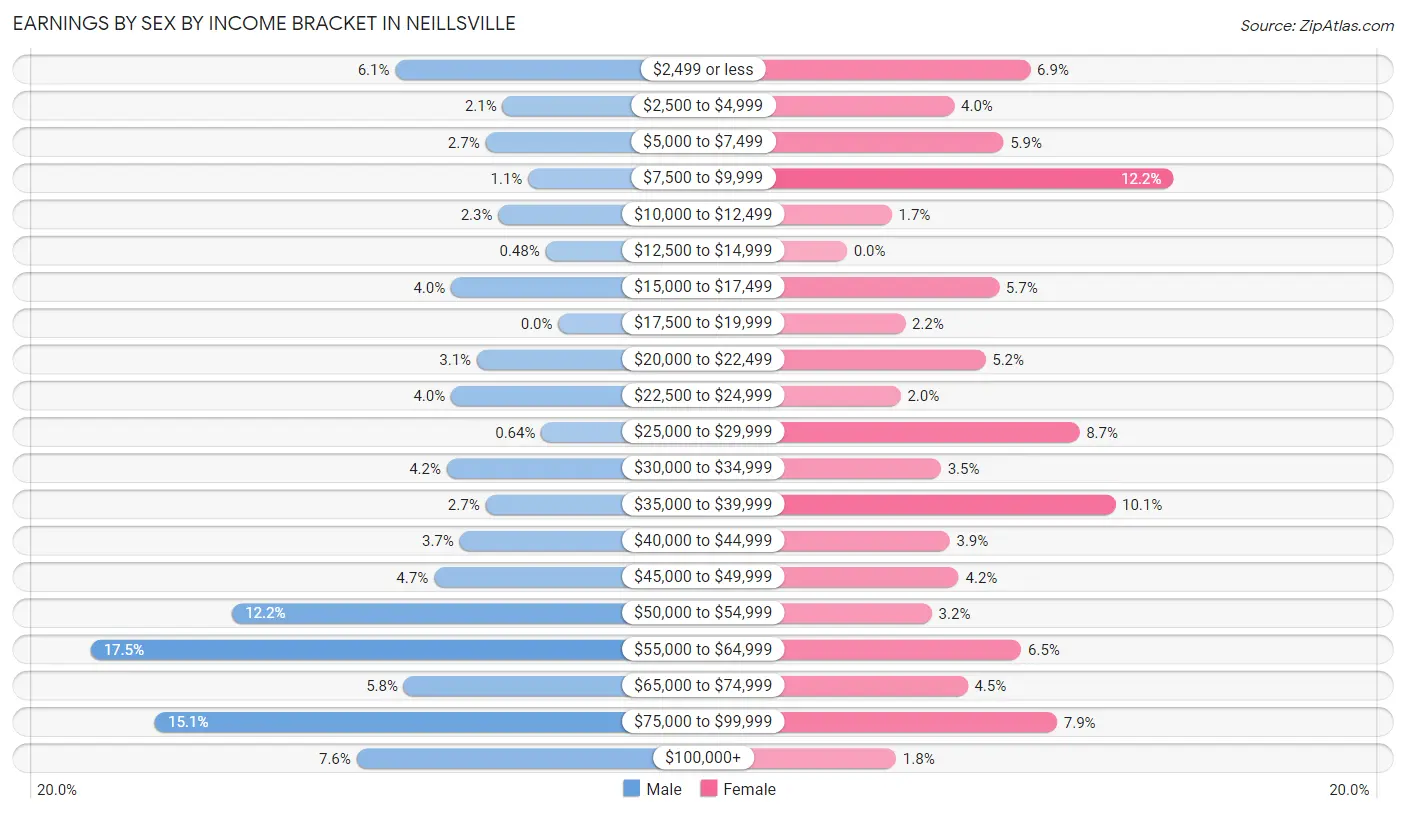
Earnings by Sex by Income Bracket in Neillsville
The most common earnings brackets in Neillsville are $55,000 to $64,999 for men (109 | 17.5%) and $7,500 to $9,999 for women (73 | 12.2%).
| Income | Male | Female |
| $2,499 or less | 38 (6.1%) | 41 (6.9%) |
| $2,500 to $4,999 | 13 (2.1%) | 24 (4.0%) |
| $5,000 to $7,499 | 17 (2.7%) | 35 (5.9%) |
| $7,500 to $9,999 | 7 (1.1%) | 73 (12.2%) |
| $10,000 to $12,499 | 14 (2.2%) | 10 (1.7%) |
| $12,500 to $14,999 | 3 (0.5%) | 0 (0.0%) |
| $15,000 to $17,499 | 25 (4.0%) | 34 (5.7%) |
| $17,500 to $19,999 | 0 (0.0%) | 13 (2.2%) |
| $20,000 to $22,499 | 19 (3.0%) | 31 (5.2%) |
| $22,500 to $24,999 | 25 (4.0%) | 12 (2.0%) |
| $25,000 to $29,999 | 4 (0.6%) | 52 (8.7%) |
| $30,000 to $34,999 | 26 (4.2%) | 21 (3.5%) |
| $35,000 to $39,999 | 17 (2.7%) | 60 (10.1%) |
| $40,000 to $44,999 | 23 (3.7%) | 23 (3.8%) |
| $45,000 to $49,999 | 29 (4.7%) | 25 (4.2%) |
| $50,000 to $54,999 | 76 (12.2%) | 19 (3.2%) |
| $55,000 to $64,999 | 109 (17.5%) | 39 (6.5%) |
| $65,000 to $74,999 | 36 (5.8%) | 27 (4.5%) |
| $75,000 to $99,999 | 94 (15.1%) | 47 (7.9%) |
| $100,000+ | 47 (7.6%) | 11 (1.8%) |
| Total | 622 (100.0%) | 597 (100.0%) |
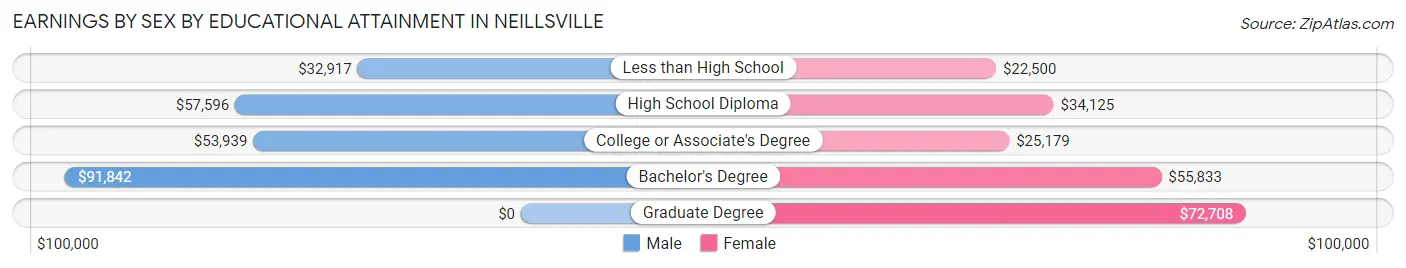
Earnings by Sex by Educational Attainment in Neillsville
Average earnings in Neillsville are $56,250 for men and $34,265 for women, a difference of 39.1%. Men with an educational attainment of bachelor's degree enjoy the highest average annual earnings of $91,842, while those with less than high school education earn the least with $32,917. Women with an educational attainment of graduate degree earn the most with the average annual earnings of $72,708, while those with less than high school education have the smallest earnings of $22,500.
| Educational Attainment | Male Income | Female Income |
| Less than High School | $32,917 | $22,500 |
| High School Diploma | $57,596 | $34,125 |
| College or Associate's Degree | $53,939 | $25,179 |
| Bachelor's Degree | $91,842 | $55,833 |
| Graduate Degree | - | - |
| Total | $56,250 | $34,265 |
Family Income in Neillsville
Family Income Brackets in Neillsville
According to the Neillsville family income data, there are 147 families falling into the $100,000 to $149,999 income range, which is the most common income bracket and makes up 28.8% of all families. Conversely, the $10,000 to $14,999 income bracket is the least frequent group with only 5 families (1.0%) belonging to this category.
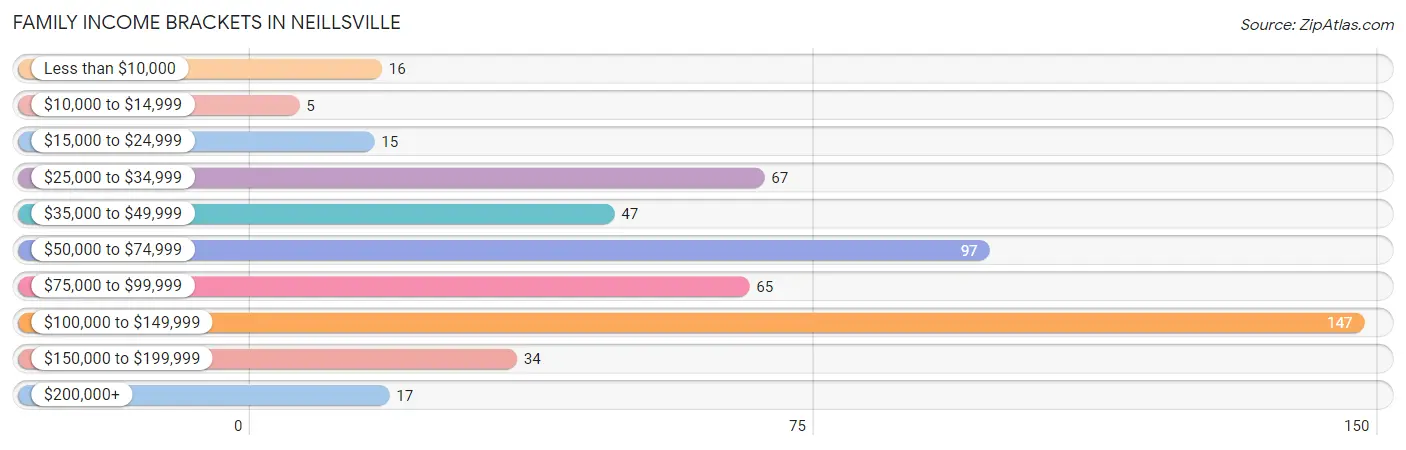
| Income Bracket | # Families | % Families |
| Less than $10,000 | 16 | 3.1% |
| $10,000 to $14,999 | 5 | 1.0% |
| $15,000 to $24,999 | 15 | 2.9% |
| $25,000 to $34,999 | 67 | 13.1% |
| $35,000 to $49,999 | 47 | 9.2% |
| $50,000 to $74,999 | 97 | 19.0% |
| $75,000 to $99,999 | 65 | 12.7% |
| $100,000 to $149,999 | 147 | 28.8% |
| $150,000 to $199,999 | 34 | 6.7% |
| $200,000+ | 17 | 3.3% |
Family Income by Famaliy Size in Neillsville
4-person families (95 | 18.6%) account for the highest median family income in Neillsville with $108,164 per family, while 3-person families (150 | 29.4%) have the highest median income of $35,175 per family member.
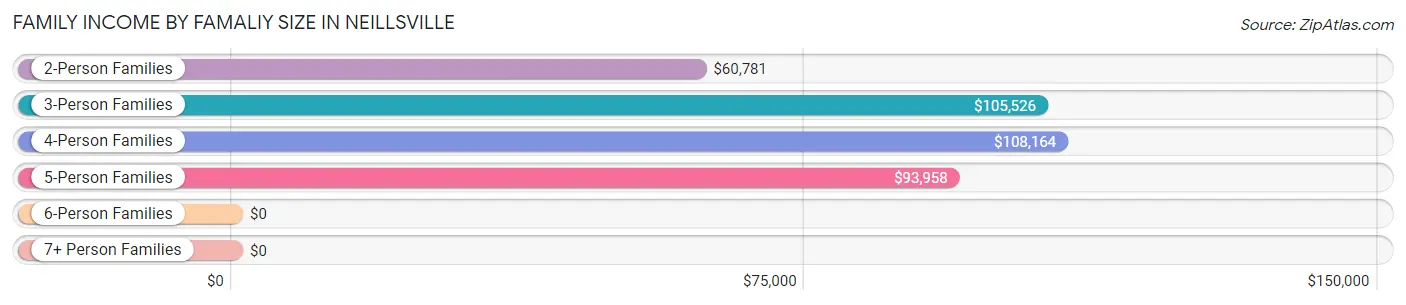
| Income Bracket | # Families | Median Income |
| 2-Person Families | 210 (41.2%) | $60,781 |
| 3-Person Families | 150 (29.4%) | $105,526 |
| 4-Person Families | 95 (18.6%) | $108,164 |
| 5-Person Families | 23 (4.5%) | $93,958 |
| 6-Person Families | 0 (0.0%) | $0 |
| 7+ Person Families | 32 (6.3%) | $0 |
| Total | 510 (100.0%) | $77,955 |
Family Income by Number of Earners in Neillsville
The median family income in Neillsville is $77,955, with families comprising 3+ earners (101) having the highest median family income of $123,125, while families with no earners (90) have the lowest median family income of $34,167, accounting for 19.8% and 17.6% of families, respectively.
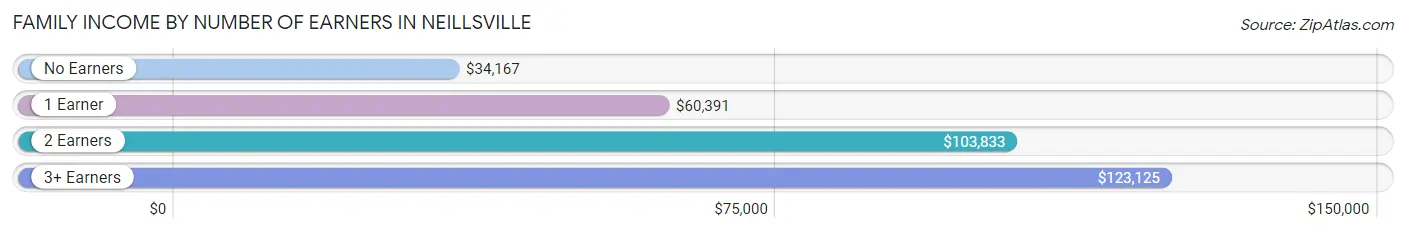
| Number of Earners | # Families | Median Income |
| No Earners | 90 (17.6%) | $34,167 |
| 1 Earner | 151 (29.6%) | $60,391 |
| 2 Earners | 168 (32.9%) | $103,833 |
| 3+ Earners | 101 (19.8%) | $123,125 |
| Total | 510 (100.0%) | $77,955 |
Household Income in Neillsville
Household Income Brackets in Neillsville
With 203 households falling in the category, the $50,000 to $74,999 income range is the most frequent in Neillsville, accounting for 19.4% of all households. In contrast, only 23 households (2.2%) fall into the $200,000+ income bracket, making it the least populous group.
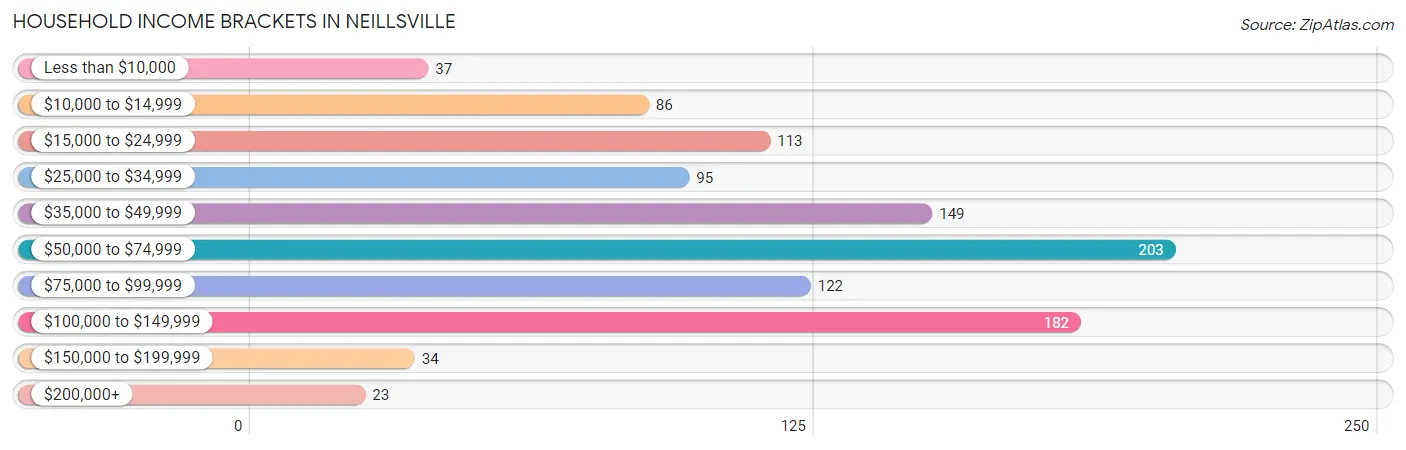
| Income Bracket | # Households | % Households |
| Less than $10,000 | 37 | 3.5% |
| $10,000 to $14,999 | 86 | 8.2% |
| $15,000 to $24,999 | 113 | 10.8% |
| $25,000 to $34,999 | 95 | 9.1% |
| $35,000 to $49,999 | 149 | 14.3% |
| $50,000 to $74,999 | 203 | 19.4% |
| $75,000 to $99,999 | 122 | 11.7% |
| $100,000 to $149,999 | 182 | 17.4% |
| $150,000 to $199,999 | 34 | 3.3% |
| $200,000+ | 23 | 2.2% |
Household Income by Householder Age in Neillsville
The median household income in Neillsville is $57,400, with the highest median household income of $69,073 found in the 25 to 44 years age bracket for the primary householder. A total of 281 households (26.9%) fall into this category. Meanwhile, the 65+ years age bracket for the primary householder has the lowest median household income of $34,792, with 356 households (34.1%) in this group.
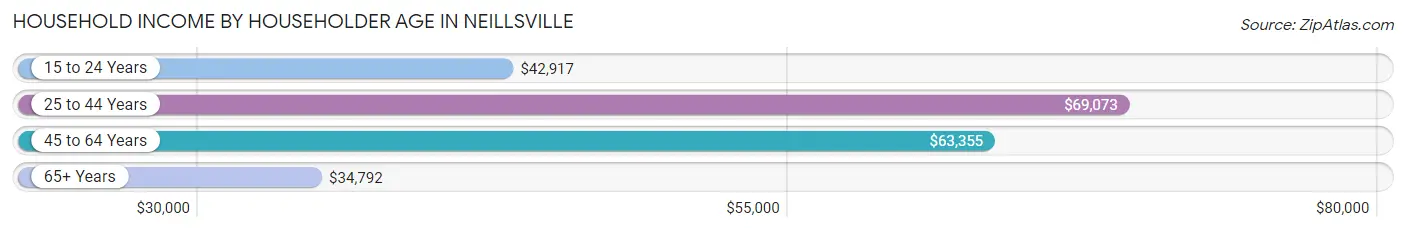
| Income Bracket | # Households | Median Income |
| 15 to 24 Years | 58 (5.6%) | $42,917 |
| 25 to 44 Years | 281 (26.9%) | $69,073 |
| 45 to 64 Years | 349 (33.4%) | $63,355 |
| 65+ Years | 356 (34.1%) | $34,792 |
| Total | 1,044 (100.0%) | $57,400 |
Poverty in Neillsville
Income Below Poverty by Sex and Age in Neillsville
With 8.4% poverty level for males and 16.4% for females among the residents of Neillsville, 5 year old males and under 5 year old females are the most vulnerable to poverty, with 4 males (28.6%) and 35 females (46.1%) in their respective age groups living below the poverty level.
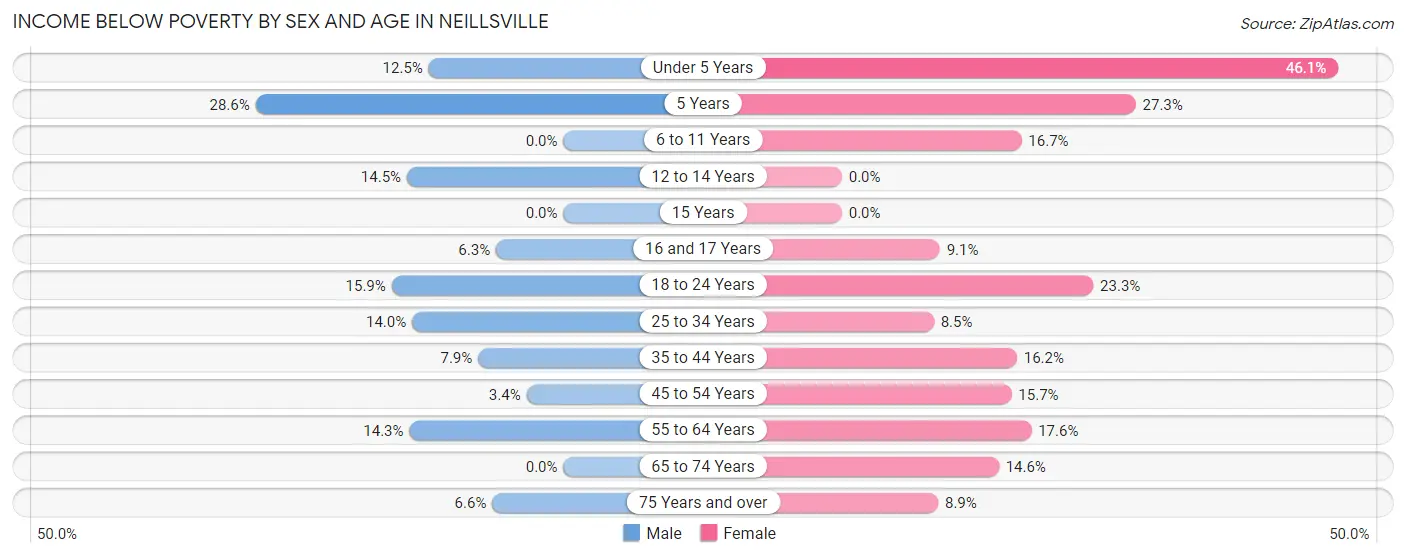
| Age Bracket | Male | Female |
| Under 5 Years | 9 (12.5%) | 35 (46.1%) |
| 5 Years | 4 (28.6%) | 6 (27.3%) |
| 6 to 11 Years | 0 (0.0%) | 7 (16.7%) |
| 12 to 14 Years | 9 (14.5%) | 0 (0.0%) |
| 15 Years | 0 (0.0%) | 0 (0.0%) |
| 16 and 17 Years | 4 (6.2%) | 4 (9.1%) |
| 18 to 24 Years | 11 (15.9%) | 21 (23.3%) |
| 25 to 34 Years | 16 (14.0%) | 11 (8.5%) |
| 35 to 44 Years | 11 (7.9%) | 19 (16.2%) |
| 45 to 54 Years | 4 (3.4%) | 17 (15.7%) |
| 55 to 64 Years | 17 (14.3%) | 32 (17.6%) |
| 65 to 74 Years | 0 (0.0%) | 15 (14.6%) |
| 75 Years and over | 7 (6.6%) | 15 (8.9%) |
| Total | 92 (8.4%) | 182 (16.4%) |
Income Above Poverty by Sex and Age in Neillsville
According to the poverty statistics in Neillsville, males aged 6 to 11 years and females aged 12 to 14 years are the age groups that are most secure financially, with 100.0% of males and 100.0% of females in these age groups living above the poverty line.
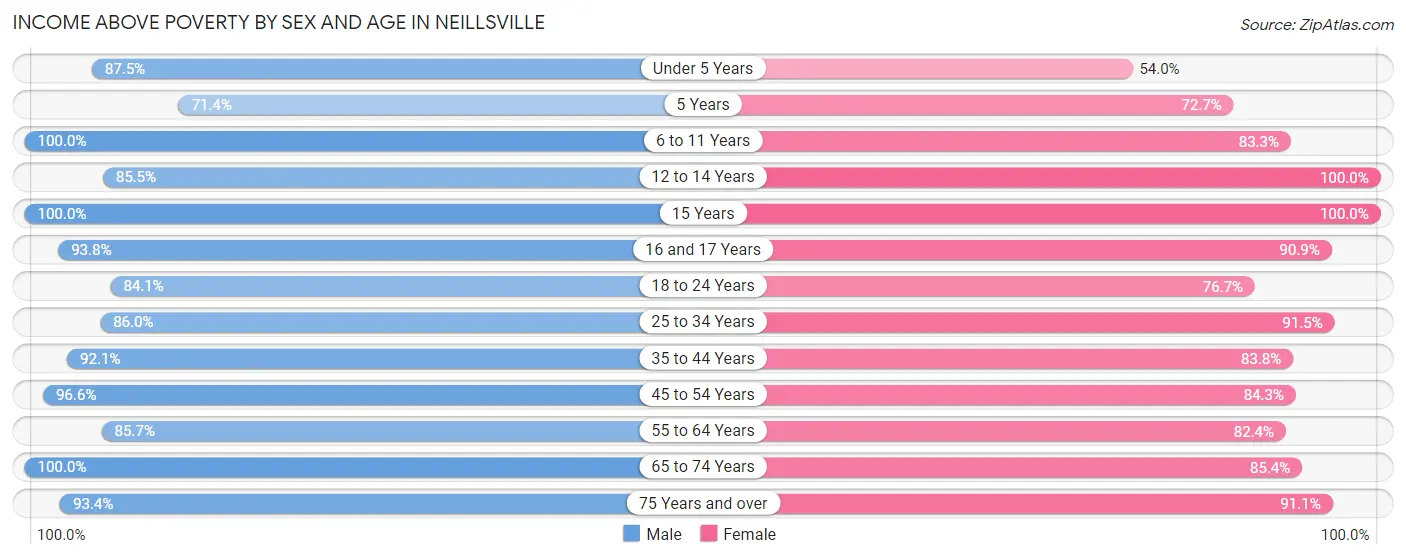
| Age Bracket | Male | Female |
| Under 5 Years | 63 (87.5%) | 41 (53.9%) |
| 5 Years | 10 (71.4%) | 16 (72.7%) |
| 6 to 11 Years | 105 (100.0%) | 35 (83.3%) |
| 12 to 14 Years | 53 (85.5%) | 24 (100.0%) |
| 15 Years | 21 (100.0%) | 7 (100.0%) |
| 16 and 17 Years | 60 (93.8%) | 40 (90.9%) |
| 18 to 24 Years | 58 (84.1%) | 69 (76.7%) |
| 25 to 34 Years | 98 (86.0%) | 118 (91.5%) |
| 35 to 44 Years | 128 (92.1%) | 98 (83.8%) |
| 45 to 54 Years | 113 (96.6%) | 91 (84.3%) |
| 55 to 64 Years | 102 (85.7%) | 150 (82.4%) |
| 65 to 74 Years | 98 (100.0%) | 88 (85.4%) |
| 75 Years and over | 99 (93.4%) | 153 (91.1%) |
| Total | 1,008 (91.6%) | 930 (83.6%) |
Income Below Poverty Among Married-Couple Families in Neillsville
The poverty statistics for married-couple families in Neillsville show that 3.0% or 12 of the total 395 families live below the poverty line. Families with 5 or more children have the highest poverty rate of 100.0%, comprising of 7 families. On the other hand, families with 1 or 2 children have the lowest poverty rate of 0.0%, which includes 0 families.
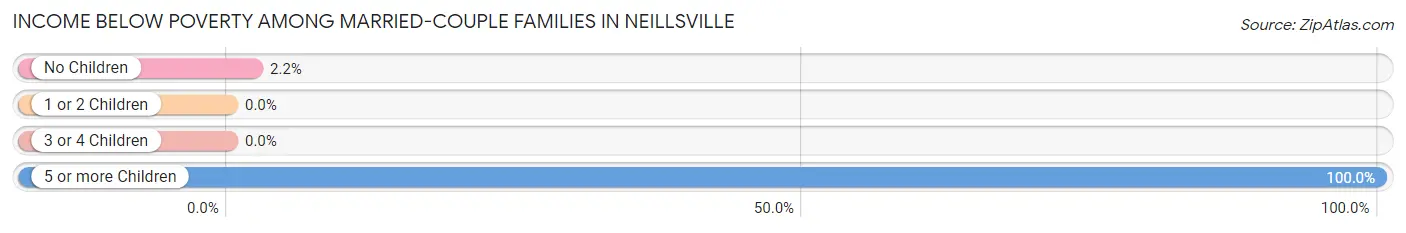
| Children | Above Poverty | Below Poverty |
| No Children | 224 (97.8%) | 5 (2.2%) |
| 1 or 2 Children | 124 (100.0%) | 0 (0.0%) |
| 3 or 4 Children | 35 (100.0%) | 0 (0.0%) |
| 5 or more Children | 0 (0.0%) | 7 (100.0%) |
| Total | 383 (97.0%) | 12 (3.0%) |
Income Below Poverty Among Single-Parent Households in Neillsville
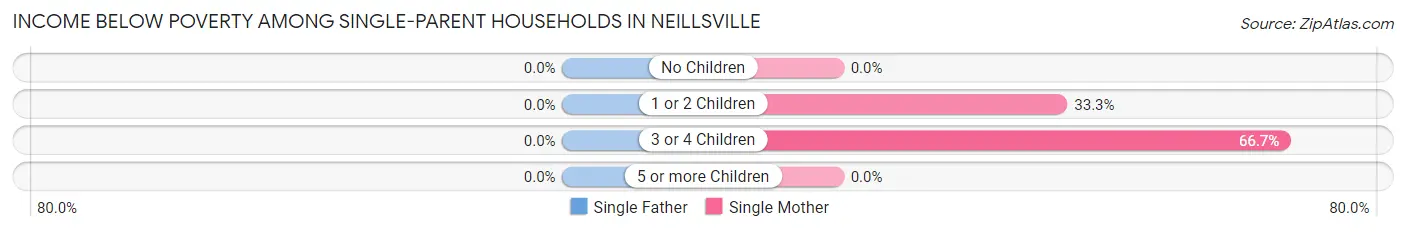
| Children | Single Father | Single Mother |
| No Children | 0 (0.0%) | 0 (0.0%) |
| 1 or 2 Children | 0 (0.0%) | 17 (33.3%) |
| 3 or 4 Children | 0 (0.0%) | 10 (66.7%) |
| 5 or more Children | 0 (0.0%) | 0 (0.0%) |
| Total | 0 (0.0%) | 27 (32.9%) |
Income Below Poverty Among Married-Couple vs Single-Parent Households in Neillsville
The poverty data for Neillsville shows that 12 of the married-couple family households (3.0%) and 27 of the single-parent households (23.5%) are living below the poverty level. Within the married-couple family households, those with 5 or more children have the highest poverty rate, with 7 households (100.0%) falling below the poverty line. Among the single-parent households, those with 3 or 4 children have the highest poverty rate, with 10 household (66.7%) living below poverty.
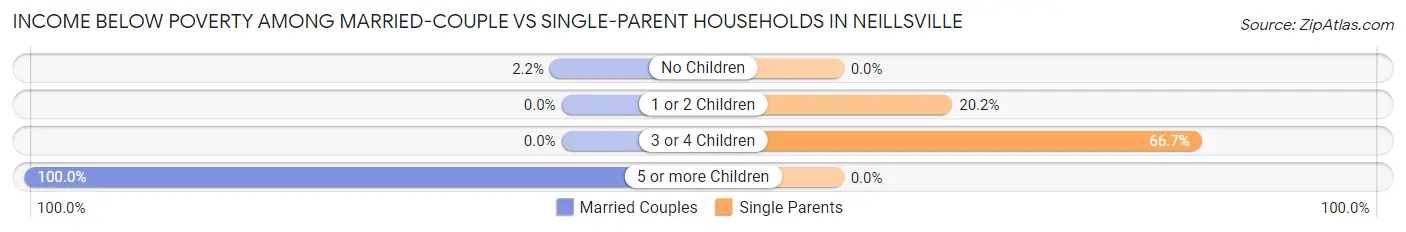
| Children | Married-Couple Families | Single-Parent Households |
| No Children | 5 (2.2%) | 0 (0.0%) |
| 1 or 2 Children | 0 (0.0%) | 17 (20.2%) |
| 3 or 4 Children | 0 (0.0%) | 10 (66.7%) |
| 5 or more Children | 7 (100.0%) | 0 (0.0%) |
| Total | 12 (3.0%) | 27 (23.5%) |
Race in Neillsville
The most populous races in Neillsville are White / Caucasian (2,147 | 92.9%), Two or more Races (72 | 3.1%), and Some other Race (53 | 2.3%).
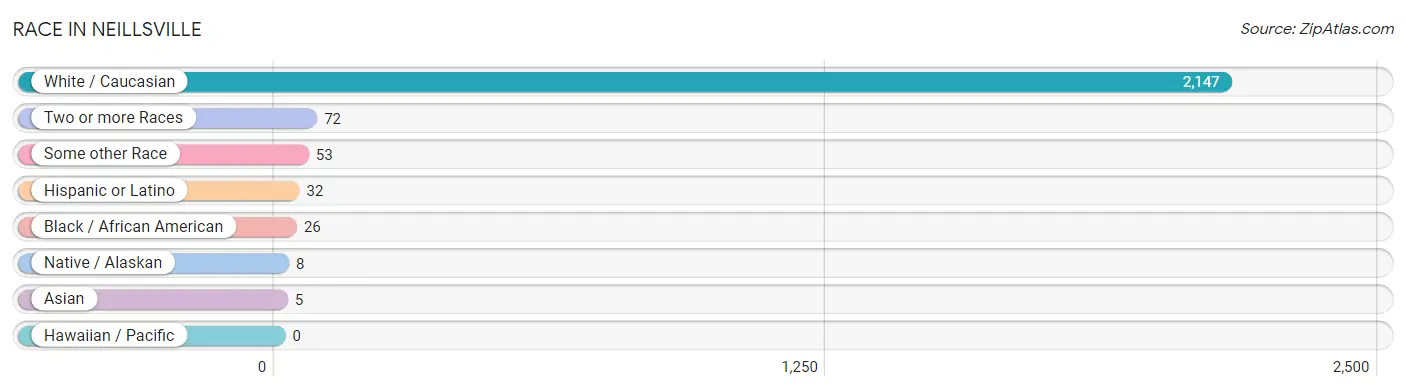
| Race | # Population | % Population |
| Asian | 5 | 0.2% |
| Black / African American | 26 | 1.1% |
| Hawaiian / Pacific | 0 | 0.0% |
| Hispanic or Latino | 32 | 1.4% |
| Native / Alaskan | 8 | 0.4% |
| White / Caucasian | 2,147 | 92.9% |
| Two or more Races | 72 | 3.1% |
| Some other Race | 53 | 2.3% |
| Total | 2,311 | 100.0% |
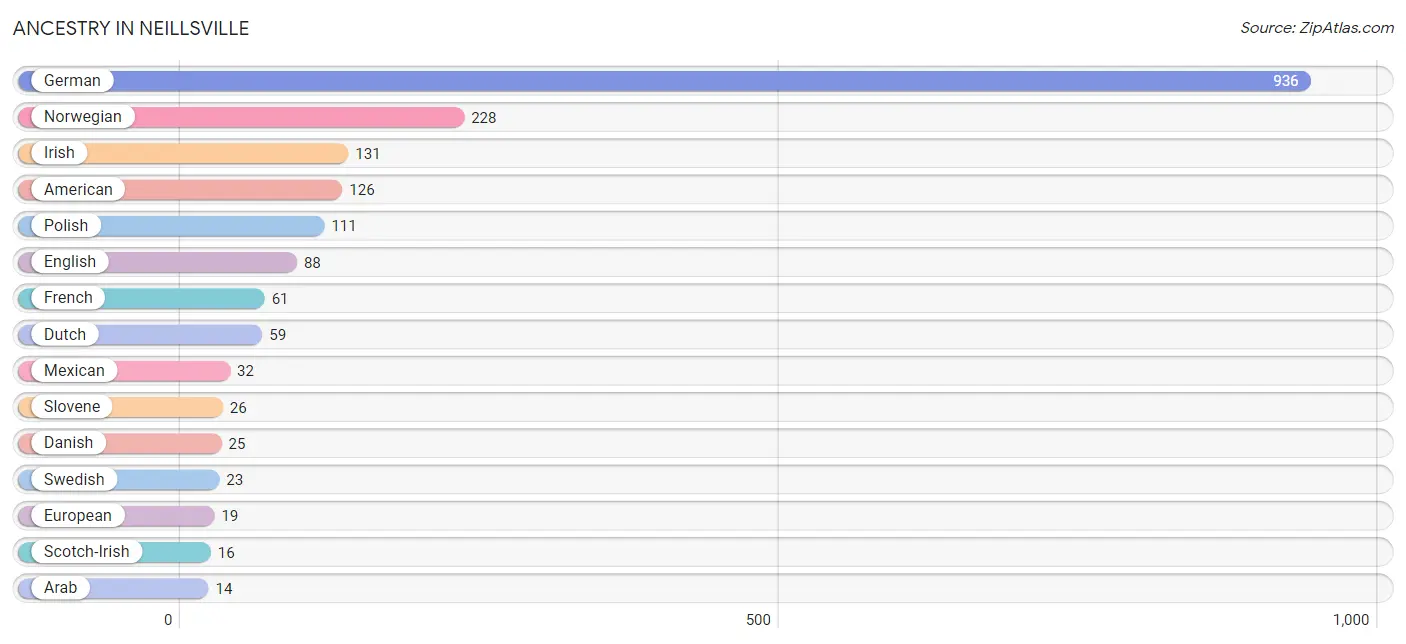
Ancestry in Neillsville
The most populous ancestries reported in Neillsville are German (936 | 40.5%), Norwegian (228 | 9.9%), Irish (131 | 5.7%), American (126 | 5.4%), and Polish (111 | 4.8%), together accounting for 66.3% of all Neillsville residents.
| Ancestry | # Population | % Population |
| Alsatian | 6 | 0.3% |
| American | 126 | 5.4% |
| Arab | 14 | 0.6% |
| Austrian | 10 | 0.4% |
| Czech | 14 | 0.6% |
| Danish | 25 | 1.1% |
| Dutch | 59 | 2.5% |
| English | 88 | 3.8% |
| European | 19 | 0.8% |
| Finnish | 1 | 0.0% |
| French | 61 | 2.6% |
| German | 936 | 40.5% |
| Greek | 5 | 0.2% |
| Irish | 131 | 5.7% |
| Italian | 12 | 0.5% |
| Korean | 5 | 0.2% |
| Menominee | 3 | 0.1% |
| Mexican | 32 | 1.4% |
| Norwegian | 228 | 9.9% |
| Polish | 111 | 4.8% |
| Russian | 10 | 0.4% |
| Scandinavian | 10 | 0.4% |
| Scotch-Irish | 16 | 0.7% |
| Scottish | 11 | 0.5% |
| Slovene | 26 | 1.1% |
| Swedish | 23 | 1.0% |
| Swiss | 9 | 0.4% |
| Syrian | 14 | 0.6% |
| Ukrainian | 8 | 0.4% |
| Welsh | 5 | 0.2% |
| Yugoslavian | 4 | 0.2% | View All 31 Rows |
Immigrants in Neillsville
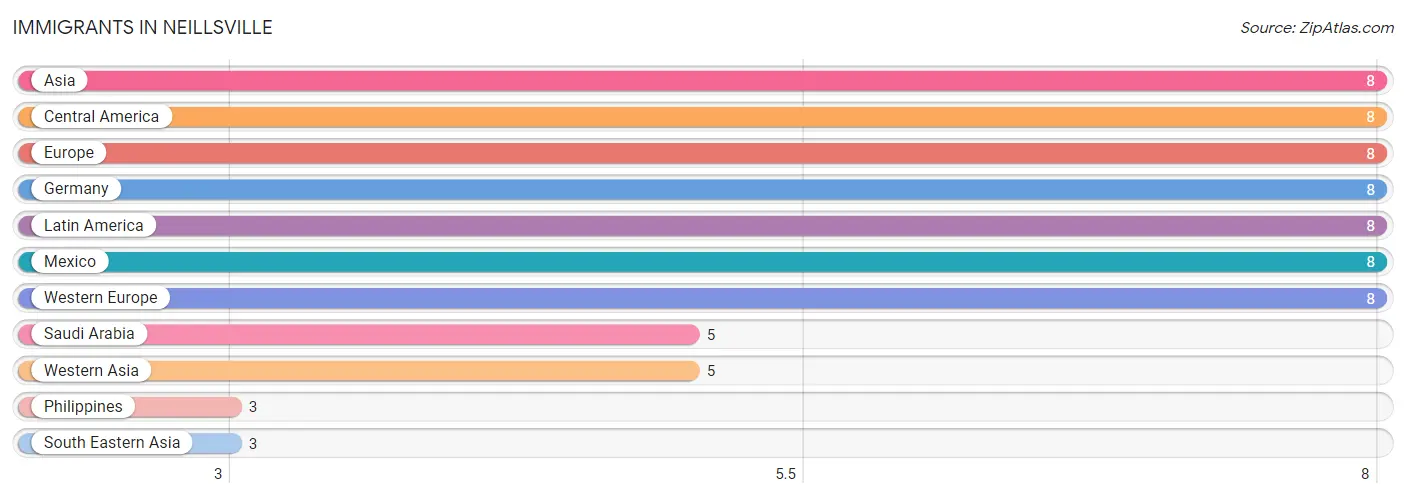
The most numerous immigrant groups reported in Neillsville came from Asia (8 | 0.4%), Central America (8 | 0.4%), Europe (8 | 0.4%), Germany (8 | 0.4%), and Latin America (8 | 0.4%), together accounting for 1.8% of all Neillsville residents.
| Immigration Origin | # Population | % Population |
| Asia | 8 | 0.4% |
| Central America | 8 | 0.4% |
| Europe | 8 | 0.4% |
| Germany | 8 | 0.4% |
| Latin America | 8 | 0.4% |
| Mexico | 8 | 0.4% |
| Philippines | 3 | 0.1% |
| Saudi Arabia | 5 | 0.2% |
| South Eastern Asia | 3 | 0.1% |
| Western Asia | 5 | 0.2% |
| Western Europe | 8 | 0.4% | View All 11 Rows |
Sex and Age in Neillsville
Sex and Age in Neillsville
The most populous age groups in Neillsville are 15 to 19 Years (128 | 10.9%) for men and 60 to 64 Years (102 | 8.9%) for women.
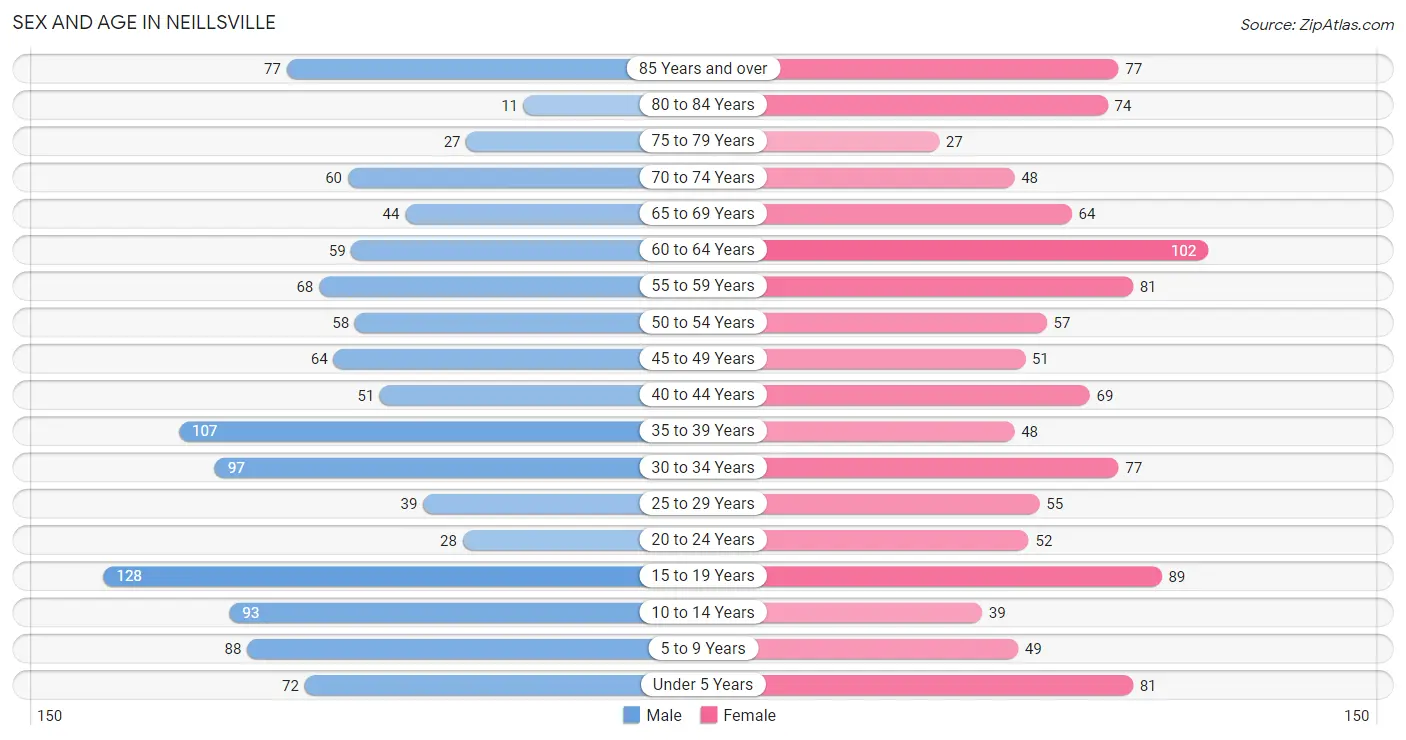
| Age Bracket | Male | Female |
| Under 5 Years | 72 (6.1%) | 81 (7.1%) |
| 5 to 9 Years | 88 (7.5%) | 49 (4.3%) |
| 10 to 14 Years | 93 (7.9%) | 39 (3.4%) |
| 15 to 19 Years | 128 (10.9%) | 89 (7.8%) |
| 20 to 24 Years | 28 (2.4%) | 52 (4.6%) |
| 25 to 29 Years | 39 (3.3%) | 55 (4.8%) |
| 30 to 34 Years | 97 (8.3%) | 77 (6.8%) |
| 35 to 39 Years | 107 (9.1%) | 48 (4.2%) |
| 40 to 44 Years | 51 (4.4%) | 69 (6.0%) |
| 45 to 49 Years | 64 (5.5%) | 51 (4.5%) |
| 50 to 54 Years | 58 (5.0%) | 57 (5.0%) |
| 55 to 59 Years | 68 (5.8%) | 81 (7.1%) |
| 60 to 64 Years | 59 (5.0%) | 102 (8.9%) |
| 65 to 69 Years | 44 (3.8%) | 64 (5.6%) |
| 70 to 74 Years | 60 (5.1%) | 48 (4.2%) |
| 75 to 79 Years | 27 (2.3%) | 27 (2.4%) |
| 80 to 84 Years | 11 (0.9%) | 74 (6.5%) |
| 85 Years and over | 77 (6.6%) | 77 (6.8%) |
| Total | 1,171 (100.0%) | 1,140 (100.0%) |
Families and Households in Neillsville
Median Family Size in Neillsville
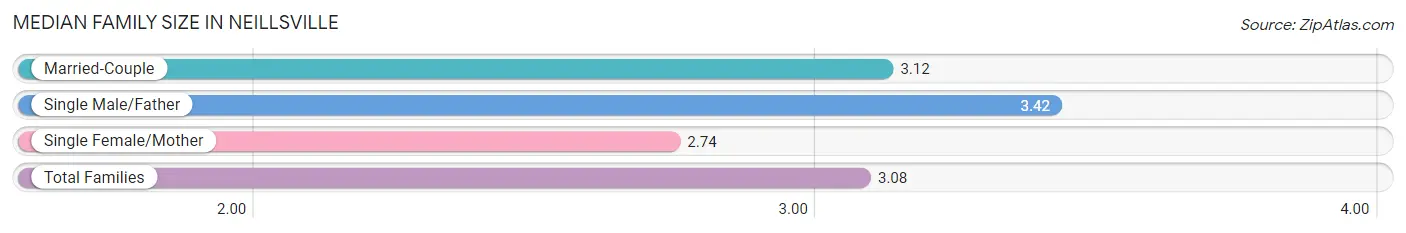
The median family size in Neillsville is 3.08 persons per family, with single male/father families (33 | 6.5%) accounting for the largest median family size of 3.42 persons per family. On the other hand, single female/mother families (82 | 16.1%) represent the smallest median family size with 2.74 persons per family.
| Family Type | # Families | Family Size |
| Married-Couple | 395 (77.4%) | 3.12 |
| Single Male/Father | 33 (6.5%) | 3.42 |
| Single Female/Mother | 82 (16.1%) | 2.74 |
| Total Families | 510 (100.0%) | 3.08 |
Median Household Size in Neillsville
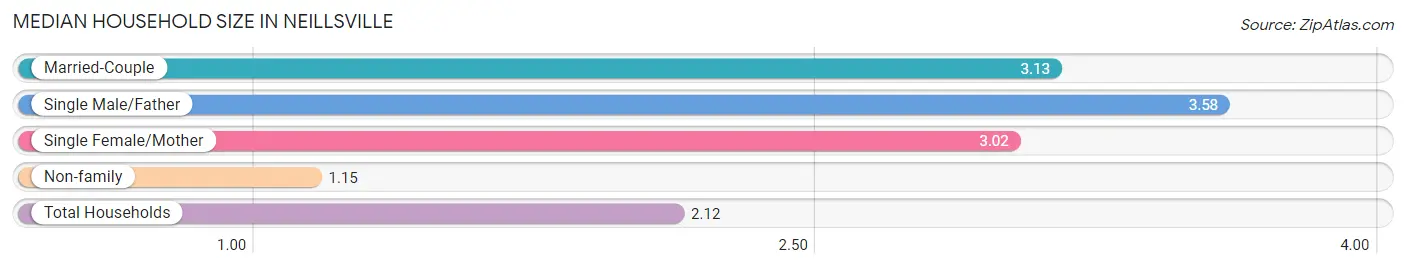
The median household size in Neillsville is 2.12 persons per household, with single male/father households (33 | 3.2%) accounting for the largest median household size of 3.58 persons per household. non-family households (534 | 51.1%) represent the smallest median household size with 1.15 persons per household.
| Household Type | # Households | Household Size |
| Married-Couple | 395 (37.8%) | 3.13 |
| Single Male/Father | 33 (3.2%) | 3.58 |
| Single Female/Mother | 82 (7.9%) | 3.02 |
| Non-family | 534 (51.1%) | 1.15 |
| Total Households | 1,044 (100.0%) | 2.12 |
Household Size by Marriage Status in Neillsville
Out of a total of 1,044 households in Neillsville, 510 (48.8%) are family households, while 534 (51.1%) are nonfamily households. The most numerous type of family households are 2-person households, comprising 199, and the most common type of nonfamily households are 1-person households, comprising 474.
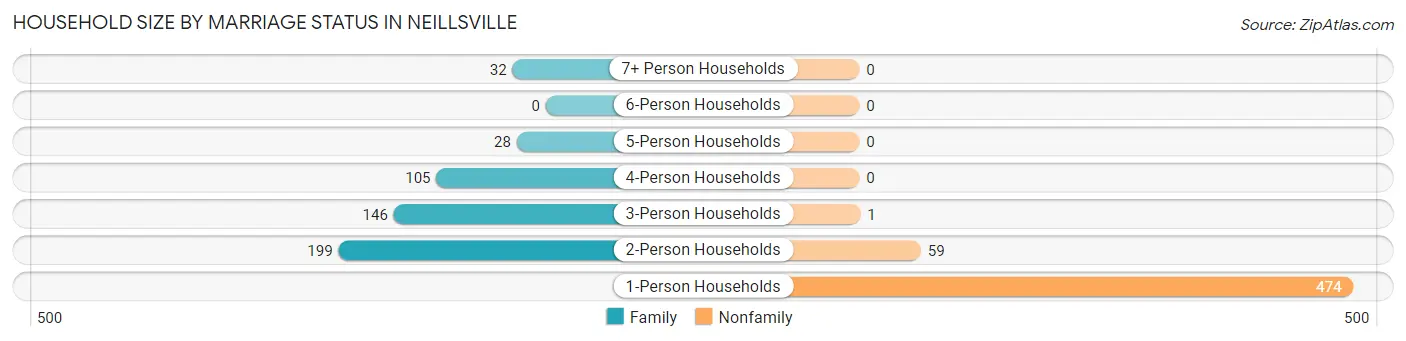
| Household Size | Family Households | Nonfamily Households |
| 1-Person Households | - | 474 (45.4%) |
| 2-Person Households | 199 (19.1%) | 59 (5.7%) |
| 3-Person Households | 146 (14.0%) | 1 (0.1%) |
| 4-Person Households | 105 (10.1%) | 0 (0.0%) |
| 5-Person Households | 28 (2.7%) | 0 (0.0%) |
| 6-Person Households | 0 (0.0%) | 0 (0.0%) |
| 7+ Person Households | 32 (3.1%) | 0 (0.0%) |
| Total | 510 (48.8%) | 534 (51.1%) |
Female Fertility in Neillsville
Fertility by Age in Neillsville
Average fertility rate in Neillsville is 89.0 births per 1,000 women. Women in the age bracket of 20 to 34 years have the highest fertility rate with 179.0 births per 1,000 women. Women in the age bracket of 20 to 34 years acount for 82.5% of all women with births.
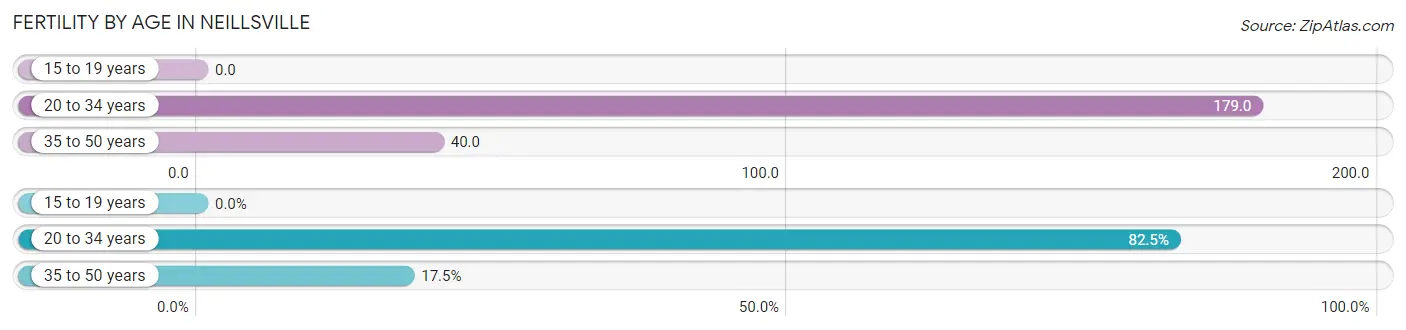
| Age Bracket | Women with Births | Births / 1,000 Women |
| 15 to 19 years | 0 (0.0%) | 0.0 |
| 20 to 34 years | 33 (82.5%) | 179.0 |
| 35 to 50 years | 7 (17.5%) | 40.0 |
| Total | 40 (100.0%) | 89.0 |
Fertility by Age by Marriage Status in Neillsville
57.5% of women with births (40) in Neillsville are married. The highest percentage of unmarried women with births falls into 20 to 34 years age bracket with 51.5% of them unmarried at the time of birth, while the lowest percentage of unmarried women with births belong to 35 to 50 years age bracket with 0.0% of them unmarried.
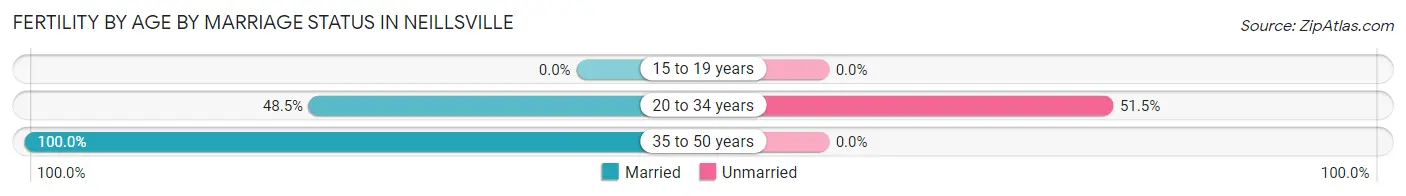
| Age Bracket | Married | Unmarried |
| 15 to 19 years | 0 (0.0%) | 0 (0.0%) |
| 20 to 34 years | 16 (48.5%) | 17 (51.5%) |
| 35 to 50 years | 7 (100.0%) | 0 (0.0%) |
| Total | 23 (57.5%) | 17 (42.5%) |
Fertility by Education in Neillsville
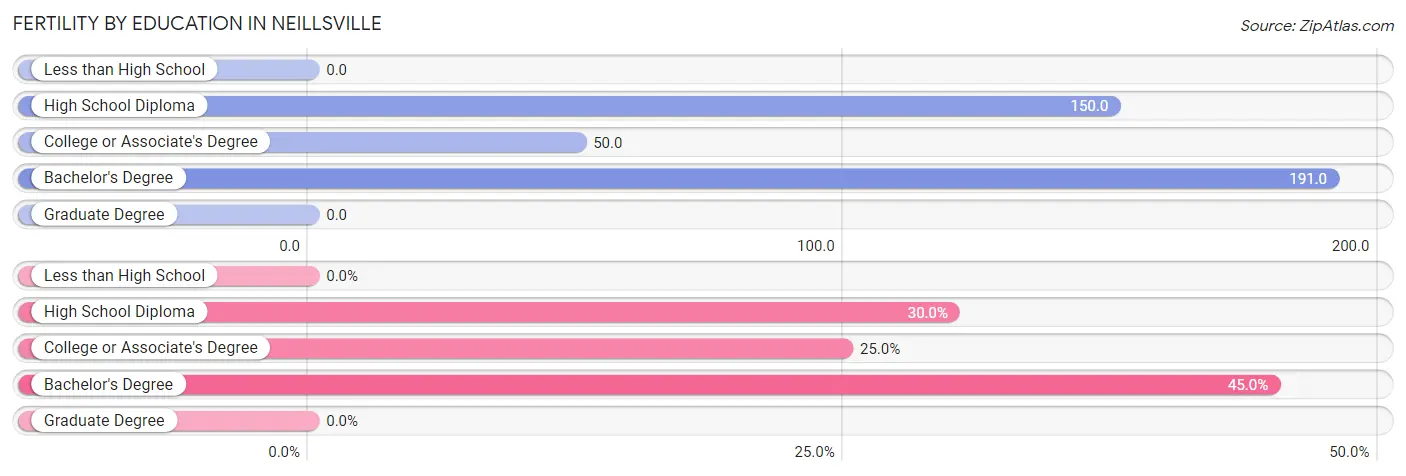
| Educational Attainment | Women with Births | Births / 1,000 Women |
| Less than High School | 0 (0.0%) | 0.0 |
| High School Diploma | 12 (30.0%) | 150.0 |
| College or Associate's Degree | 10 (25.0%) | 50.0 |
| Bachelor's Degree | 18 (45.0%) | 191.0 |
| Graduate Degree | 0 (0.0%) | 0.0 |
| Total | 40 (100.0%) | 89.0 |
Fertility by Education by Marriage Status in Neillsville
42.5% of women with births in Neillsville are unmarried. Women with the educational attainment of bachelor's degree are most likely to be married with 100.0% of them married at childbirth, while women with the educational attainment of high school diploma are least likely to be married with 91.7% of them unmarried at childbirth.
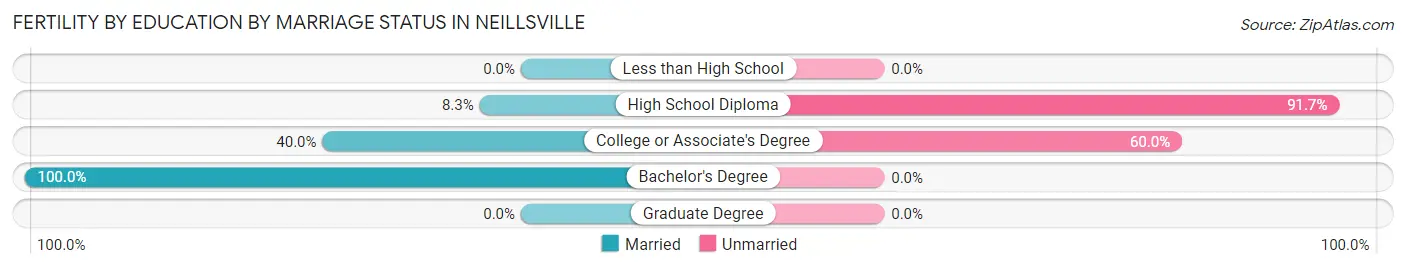
| Educational Attainment | Married | Unmarried |
| Less than High School | 0 (0.0%) | 0 (0.0%) |
| High School Diploma | 1 (8.3%) | 11 (91.7%) |
| College or Associate's Degree | 4 (40.0%) | 6 (60.0%) |
| Bachelor's Degree | 18 (100.0%) | 0 (0.0%) |
| Graduate Degree | 0 (0.0%) | 0 (0.0%) |
| Total | 23 (57.5%) | 17 (42.5%) |
Employment Characteristics in Neillsville
Employment by Class of Employer in Neillsville
Among the 1,063 employed individuals in Neillsville, private company employees (716 | 67.4%), state government employees (94 | 8.8%), and local government employees (90 | 8.5%) make up the most common classes of employment.
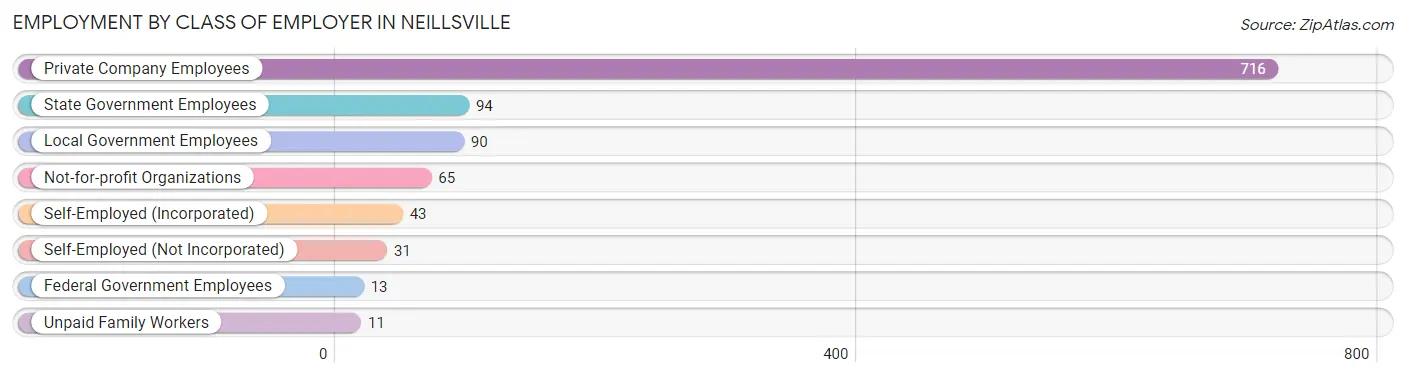
| Employer Class | # Employees | % Employees |
| Private Company Employees | 716 | 67.4% |
| Self-Employed (Incorporated) | 43 | 4.1% |
| Self-Employed (Not Incorporated) | 31 | 2.9% |
| Not-for-profit Organizations | 65 | 6.1% |
| Local Government Employees | 90 | 8.5% |
| State Government Employees | 94 | 8.8% |
| Federal Government Employees | 13 | 1.2% |
| Unpaid Family Workers | 11 | 1.0% |
| Total | 1,063 | 100.0% |
Employment Status by Age in Neillsville
According to the labor force statistics for Neillsville, out of the total population over 16 years of age (1,861), 59.7% or 1,111 individuals are in the labor force, with 3.6% or 40 of them unemployed. The age group with the highest labor force participation rate is 20 to 24 years, with 88.8% or 71 individuals in the labor force. Within the labor force, the 16 to 19 years age range has the highest percentage of unemployed individuals, with 16.4% or 20 of them being unemployed.
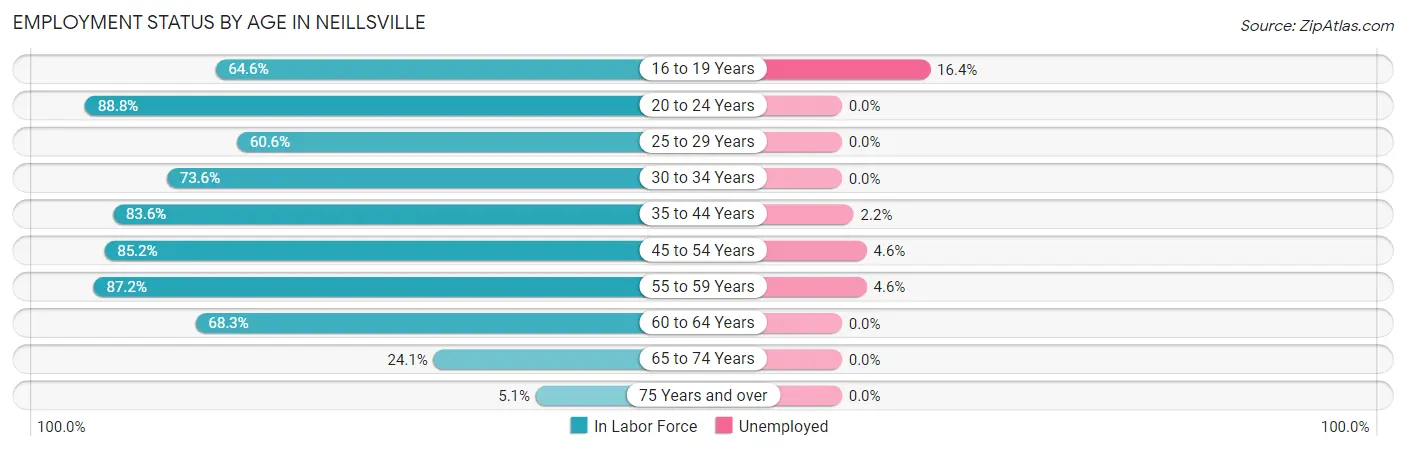
| Age Bracket | In Labor Force | Unemployed |
| 16 to 19 Years | 122 (64.6%) | 20 (16.4%) |
| 20 to 24 Years | 71 (88.8%) | 0 (0.0%) |
| 25 to 29 Years | 57 (60.6%) | 0 (0.0%) |
| 30 to 34 Years | 128 (73.6%) | 0 (0.0%) |
| 35 to 44 Years | 230 (83.6%) | 5 (2.2%) |
| 45 to 54 Years | 196 (85.2%) | 9 (4.6%) |
| 55 to 59 Years | 130 (87.2%) | 6 (4.6%) |
| 60 to 64 Years | 110 (68.3%) | 0 (0.0%) |
| 65 to 74 Years | 52 (24.1%) | 0 (0.0%) |
| 75 Years and over | 15 (5.1%) | 0 (0.0%) |
| Total | 1,111 (59.7%) | 40 (3.6%) |
Employment Status by Educational Attainment in Neillsville
According to labor force statistics for Neillsville, 78.6% of individuals (851) out of the total population between 25 and 64 years of age (1,083) are in the labor force, with 2.4% or 20 of them being unemployed. The group with the highest labor force participation rate are those with the educational attainment of bachelor's degree or higher, with 87.2% or 211 individuals in the labor force. Within the labor force, individuals with high school diploma education have the highest percentage of unemployment, with 4.5% or 11 of them being unemployed.
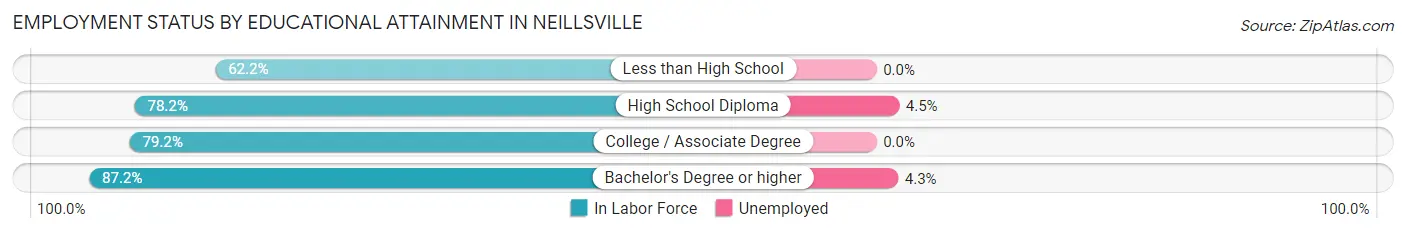
| Educational Attainment | In Labor Force | Unemployed |
| Less than High School | 84 (62.2%) | 0 (0.0%) |
| High School Diploma | 244 (78.2%) | 14 (4.5%) |
| College / Associate Degree | 312 (79.2%) | 0 (0.0%) |
| Bachelor's Degree or higher | 211 (87.2%) | 10 (4.3%) |
| Total | 851 (78.6%) | 26 (2.4%) |
Employment Occupations by Sex in Neillsville
Management, Business, Science and Arts Occupations
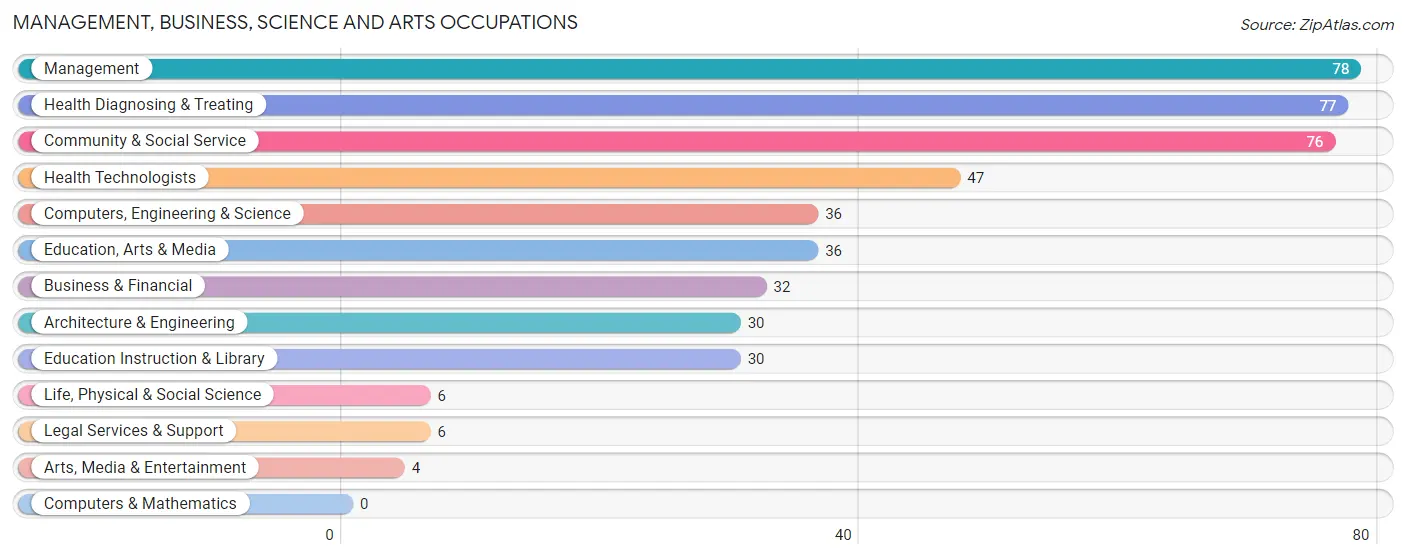
The most common Management, Business, Science and Arts occupations in Neillsville are Management (78 | 7.3%), Health Diagnosing & Treating (77 | 7.2%), Community & Social Service (76 | 7.1%), Health Technologists (47 | 4.4%), and Computers, Engineering & Science (36 | 3.4%).
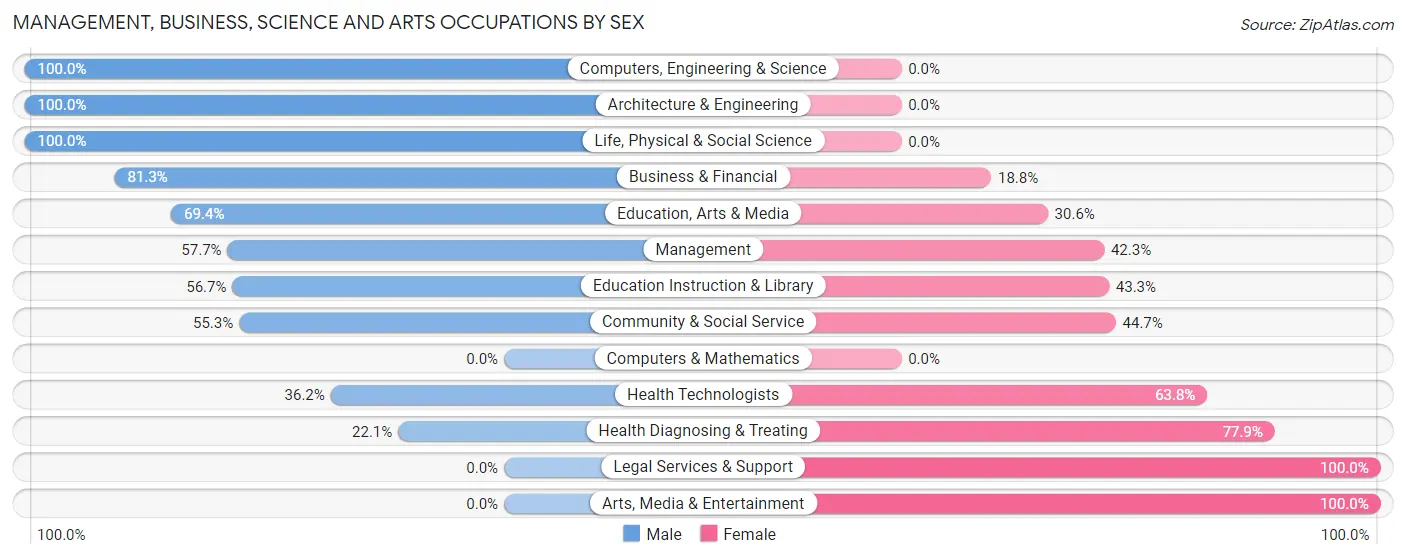
Management, Business, Science and Arts Occupations by Sex
Within the Management, Business, Science and Arts occupations in Neillsville, the most male-oriented occupations are Computers, Engineering & Science (100.0%), Architecture & Engineering (100.0%), and Life, Physical & Social Science (100.0%), while the most female-oriented occupations are Legal Services & Support (100.0%), Arts, Media & Entertainment (100.0%), and Health Diagnosing & Treating (77.9%).
| Occupation | Male | Female |
| Management | 45 (57.7%) | 33 (42.3%) |
| Business & Financial | 26 (81.2%) | 6 (18.8%) |
| Computers, Engineering & Science | 36 (100.0%) | 0 (0.0%) |
| Computers & Mathematics | 0 (0.0%) | 0 (0.0%) |
| Architecture & Engineering | 30 (100.0%) | 0 (0.0%) |
| Life, Physical & Social Science | 6 (100.0%) | 0 (0.0%) |
| Community & Social Service | 42 (55.3%) | 34 (44.7%) |
| Education, Arts & Media | 25 (69.4%) | 11 (30.6%) |
| Legal Services & Support | 0 (0.0%) | 6 (100.0%) |
| Education Instruction & Library | 17 (56.7%) | 13 (43.3%) |
| Arts, Media & Entertainment | 0 (0.0%) | 4 (100.0%) |
| Health Diagnosing & Treating | 17 (22.1%) | 60 (77.9%) |
| Health Technologists | 17 (36.2%) | 30 (63.8%) |
| Total (Category) | 166 (55.5%) | 133 (44.5%) |
| Total (Overall) | 564 (52.7%) | 507 (47.3%) |
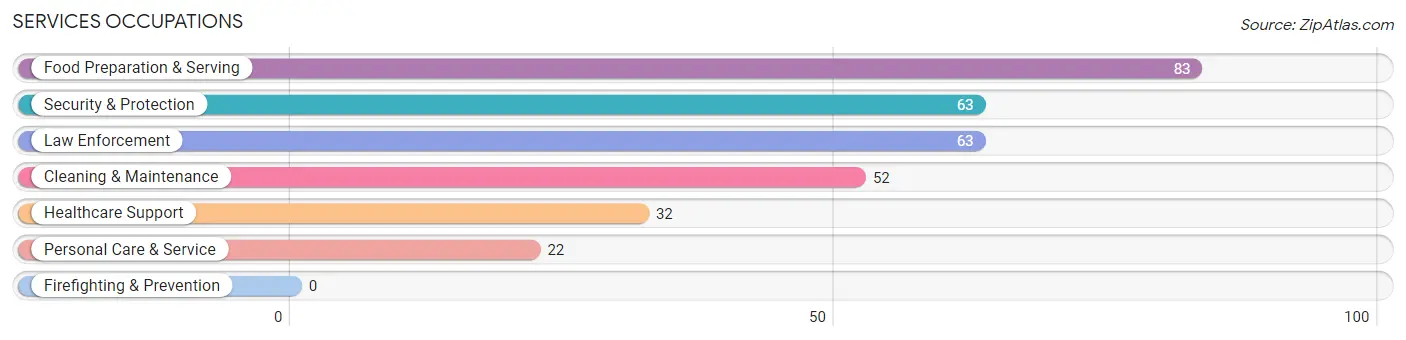
Services Occupations
The most common Services occupations in Neillsville are Food Preparation & Serving (83 | 7.7%), Security & Protection (63 | 5.9%), Law Enforcement (63 | 5.9%), Cleaning & Maintenance (52 | 4.9%), and Healthcare Support (32 | 3.0%).
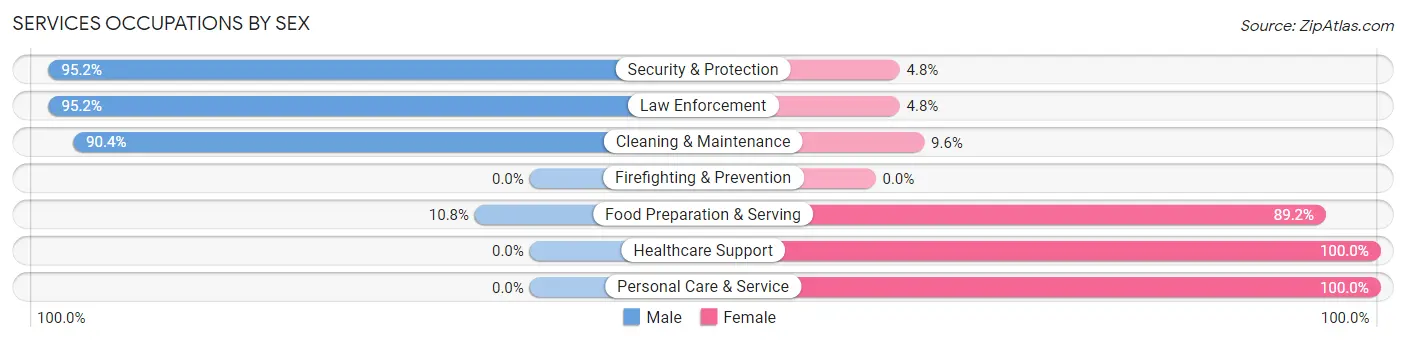
Services Occupations by Sex
Within the Services occupations in Neillsville, the most male-oriented occupations are Security & Protection (95.2%), Law Enforcement (95.2%), and Cleaning & Maintenance (90.4%), while the most female-oriented occupations are Healthcare Support (100.0%), Personal Care & Service (100.0%), and Food Preparation & Serving (89.2%).
| Occupation | Male | Female |
| Healthcare Support | 0 (0.0%) | 32 (100.0%) |
| Security & Protection | 60 (95.2%) | 3 (4.8%) |
| Firefighting & Prevention | 0 (0.0%) | 0 (0.0%) |
| Law Enforcement | 60 (95.2%) | 3 (4.8%) |
| Food Preparation & Serving | 9 (10.8%) | 74 (89.2%) |
| Cleaning & Maintenance | 47 (90.4%) | 5 (9.6%) |
| Personal Care & Service | 0 (0.0%) | 22 (100.0%) |
| Total (Category) | 116 (46.0%) | 136 (54.0%) |
| Total (Overall) | 564 (52.7%) | 507 (47.3%) |
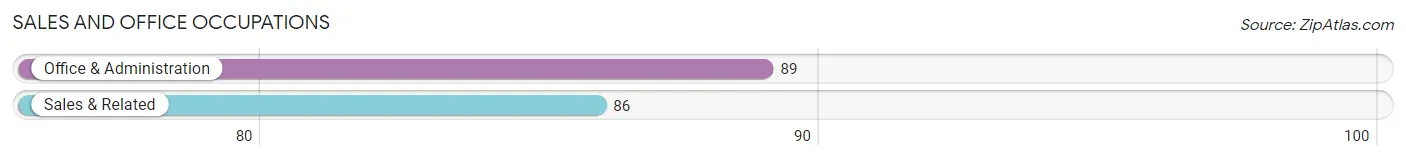
Sales and Office Occupations
The most common Sales and Office occupations in Neillsville are Office & Administration (89 | 8.3%), and Sales & Related (86 | 8.0%).
Sales and Office Occupations by Sex

| Occupation | Male | Female |
| Sales & Related | 45 (52.3%) | 41 (47.7%) |
| Office & Administration | 14 (15.7%) | 75 (84.3%) |
| Total (Category) | 59 (33.7%) | 116 (66.3%) |
| Total (Overall) | 564 (52.7%) | 507 (47.3%) |
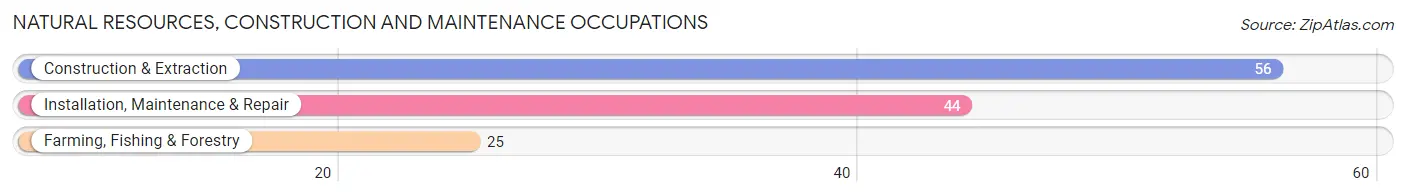
Natural Resources, Construction and Maintenance Occupations
The most common Natural Resources, Construction and Maintenance occupations in Neillsville are Construction & Extraction (56 | 5.2%), Installation, Maintenance & Repair (44 | 4.1%), and Farming, Fishing & Forestry (25 | 2.3%).
Natural Resources, Construction and Maintenance Occupations by Sex
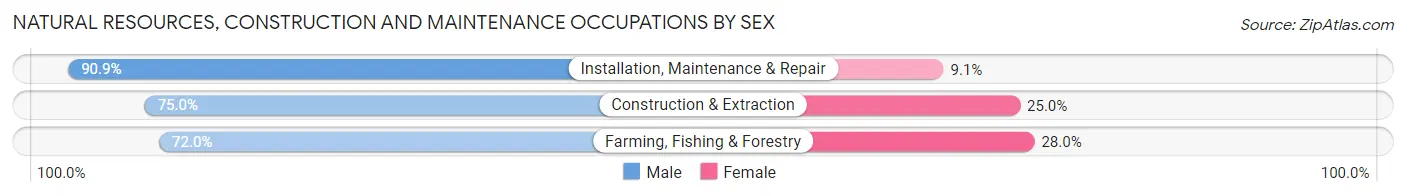
| Occupation | Male | Female |
| Farming, Fishing & Forestry | 18 (72.0%) | 7 (28.0%) |
| Construction & Extraction | 42 (75.0%) | 14 (25.0%) |
| Installation, Maintenance & Repair | 40 (90.9%) | 4 (9.1%) |
| Total (Category) | 100 (80.0%) | 25 (20.0%) |
| Total (Overall) | 564 (52.7%) | 507 (47.3%) |
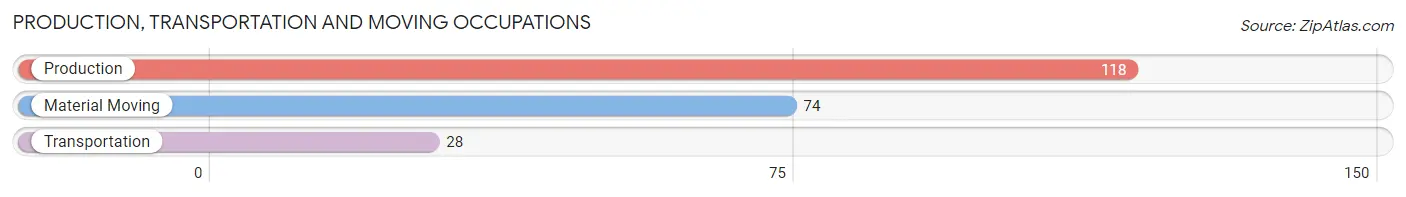
Production, Transportation and Moving Occupations
The most common Production, Transportation and Moving occupations in Neillsville are Production (118 | 11.0%), Material Moving (74 | 6.9%), and Transportation (28 | 2.6%).
Production, Transportation and Moving Occupations by Sex
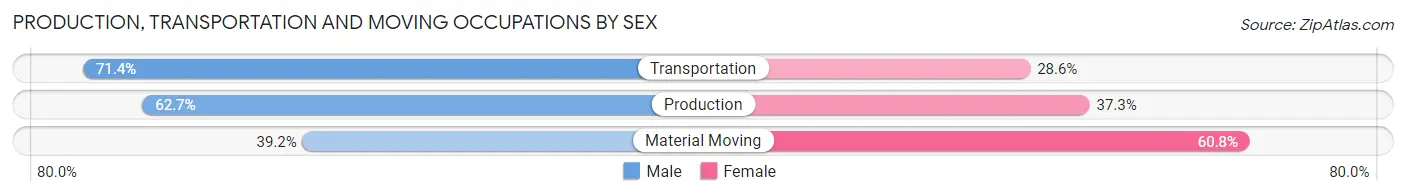
| Occupation | Male | Female |
| Production | 74 (62.7%) | 44 (37.3%) |
| Transportation | 20 (71.4%) | 8 (28.6%) |
| Material Moving | 29 (39.2%) | 45 (60.8%) |
| Total (Category) | 123 (55.9%) | 97 (44.1%) |
| Total (Overall) | 564 (52.7%) | 507 (47.3%) |
Employment Industries by Sex in Neillsville
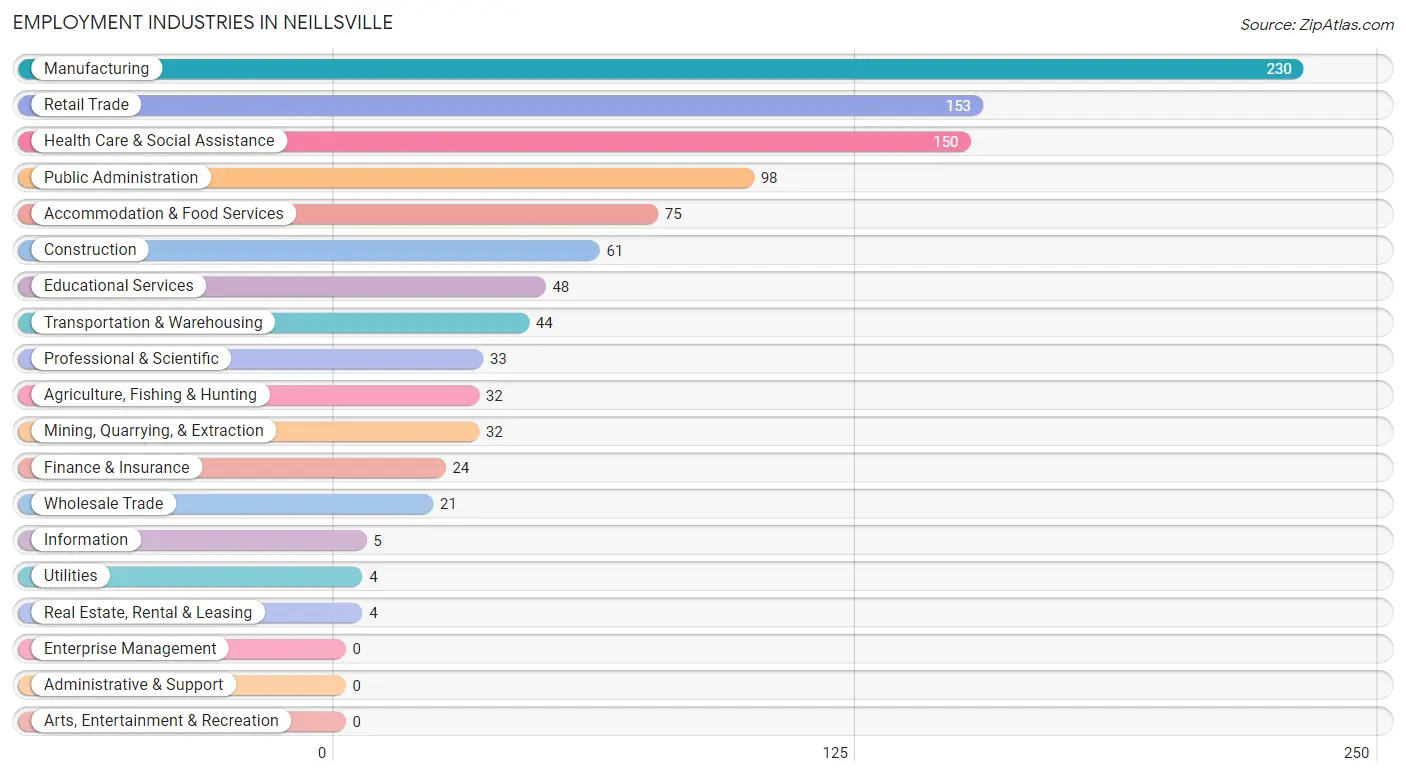
Employment Industries in Neillsville
The major employment industries in Neillsville include Manufacturing (230 | 21.5%), Retail Trade (153 | 14.3%), Health Care & Social Assistance (150 | 14.0%), Public Administration (98 | 9.1%), and Accommodation & Food Services (75 | 7.0%).
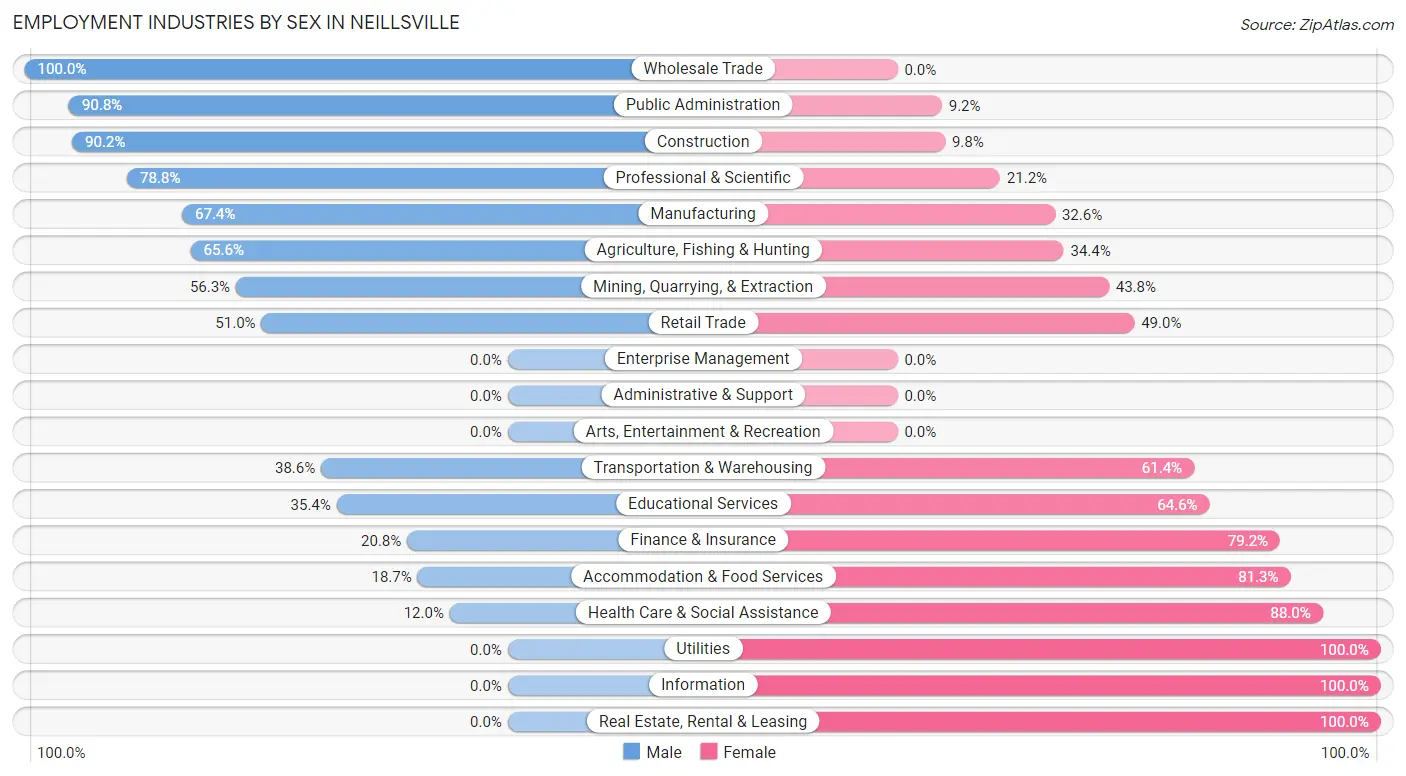
Employment Industries by Sex in Neillsville
The Neillsville industries that see more men than women are Wholesale Trade (100.0%), Public Administration (90.8%), and Construction (90.2%), whereas the industries that tend to have a higher number of women are Utilities (100.0%), Information (100.0%), and Real Estate, Rental & Leasing (100.0%).
| Industry | Male | Female |
| Agriculture, Fishing & Hunting | 21 (65.6%) | 11 (34.4%) |
| Mining, Quarrying, & Extraction | 18 (56.2%) | 14 (43.8%) |
| Construction | 55 (90.2%) | 6 (9.8%) |
| Manufacturing | 155 (67.4%) | 75 (32.6%) |
| Wholesale Trade | 21 (100.0%) | 0 (0.0%) |
| Retail Trade | 78 (51.0%) | 75 (49.0%) |
| Transportation & Warehousing | 17 (38.6%) | 27 (61.4%) |
| Utilities | 0 (0.0%) | 4 (100.0%) |
| Information | 0 (0.0%) | 5 (100.0%) |
| Finance & Insurance | 5 (20.8%) | 19 (79.2%) |
| Real Estate, Rental & Leasing | 0 (0.0%) | 4 (100.0%) |
| Professional & Scientific | 26 (78.8%) | 7 (21.2%) |
| Enterprise Management | 0 (0.0%) | 0 (0.0%) |
| Administrative & Support | 0 (0.0%) | 0 (0.0%) |
| Educational Services | 17 (35.4%) | 31 (64.6%) |
| Health Care & Social Assistance | 18 (12.0%) | 132 (88.0%) |
| Arts, Entertainment & Recreation | 0 (0.0%) | 0 (0.0%) |
| Accommodation & Food Services | 14 (18.7%) | 61 (81.3%) |
| Public Administration | 89 (90.8%) | 9 (9.2%) |
| Total | 564 (52.7%) | 507 (47.3%) |
Education in Neillsville
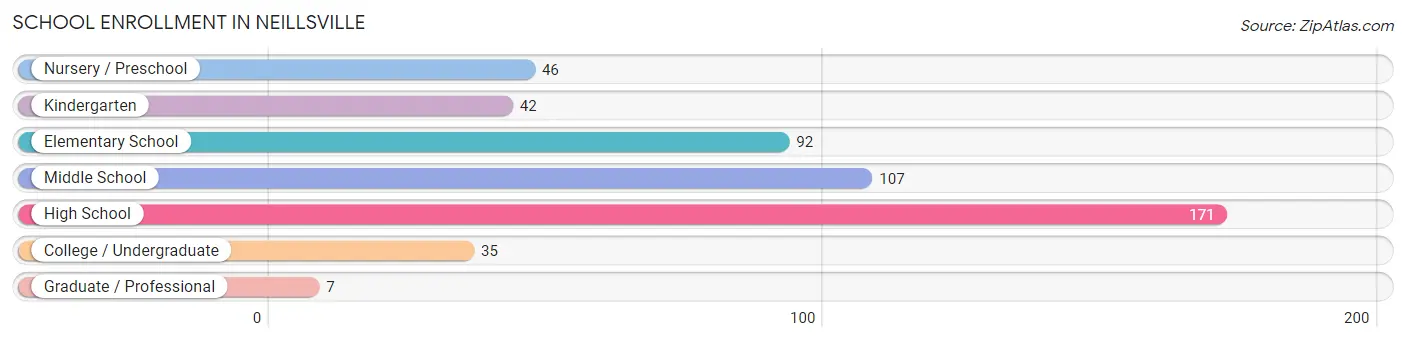
School Enrollment in Neillsville
The most common levels of schooling among the 500 students in Neillsville are high school (171 | 34.2%), middle school (107 | 21.4%), and elementary school (92 | 18.4%).
| School Level | # Students | % Students |
| Nursery / Preschool | 46 | 9.2% |
| Kindergarten | 42 | 8.4% |
| Elementary School | 92 | 18.4% |
| Middle School | 107 | 21.4% |
| High School | 171 | 34.2% |
| College / Undergraduate | 35 | 7.0% |
| Graduate / Professional | 7 | 1.4% |
| Total | 500 | 100.0% |
School Enrollment by Age by Funding Source in Neillsville
Out of a total of 500 students who are enrolled in schools in Neillsville, 66 (13.2%) attend a private institution, while the remaining 434 (86.8%) are enrolled in public schools. The age group of 3 to 4 year olds has the highest likelihood of being enrolled in private schools, with 21 (70.0% in the age bracket) enrolled. Conversely, the age group of 15 to 17 year olds has the lowest likelihood of being enrolled in a private school, with 136 (100.0% in the age bracket) attending a public institution.
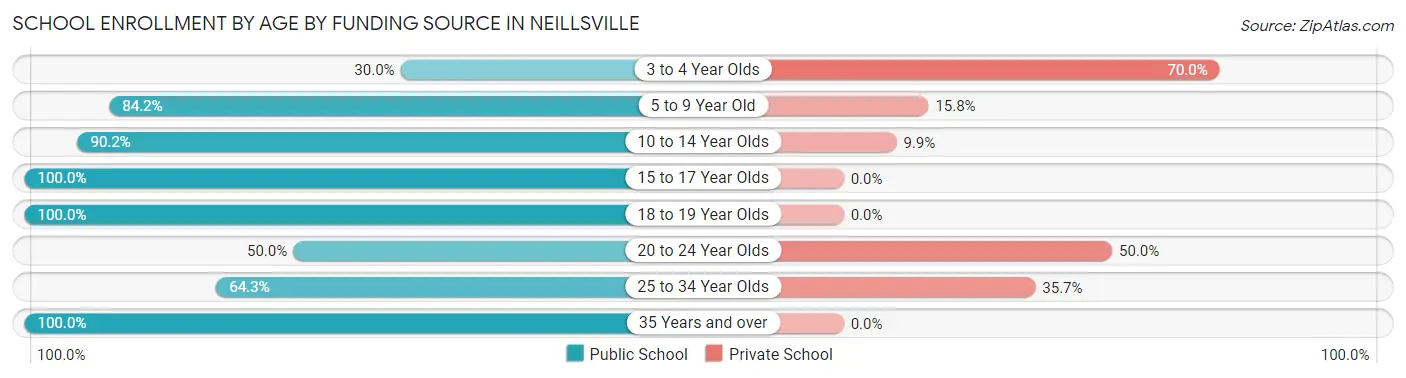
| Age Bracket | Public School | Private School |
| 3 to 4 Year Olds | 9 (30.0%) | 21 (70.0%) |
| 5 to 9 Year Old | 112 (84.2%) | 21 (15.8%) |
| 10 to 14 Year Olds | 119 (90.1%) | 13 (9.9%) |
| 15 to 17 Year Olds | 136 (100.0%) | 0 (0.0%) |
| 18 to 19 Year Olds | 34 (100.0%) | 0 (0.0%) |
| 20 to 24 Year Olds | 6 (50.0%) | 6 (50.0%) |
| 25 to 34 Year Olds | 9 (64.3%) | 5 (35.7%) |
| 35 Years and over | 9 (100.0%) | 0 (0.0%) |
| Total | 434 (86.8%) | 66 (13.2%) |
Educational Attainment by Field of Study in Neillsville
Business (58 | 17.3%), science & technology (51 | 15.2%), education (43 | 12.8%), arts & humanities (36 | 10.7%), and psychology (27 | 8.1%) are the most common fields of study among 335 individuals in Neillsville who have obtained a bachelor's degree or higher.
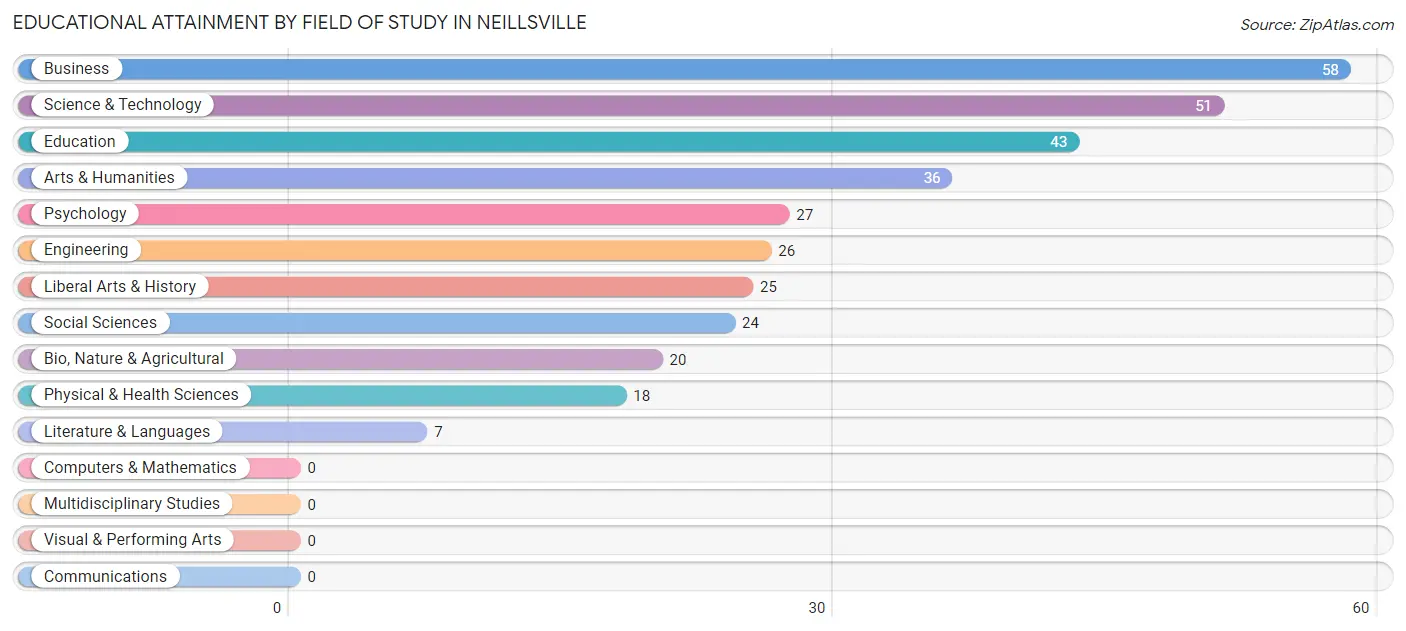
| Field of Study | # Graduates | % Graduates |
| Computers & Mathematics | 0 | 0.0% |
| Bio, Nature & Agricultural | 20 | 6.0% |
| Physical & Health Sciences | 18 | 5.4% |
| Psychology | 27 | 8.1% |
| Social Sciences | 24 | 7.2% |
| Engineering | 26 | 7.8% |
| Multidisciplinary Studies | 0 | 0.0% |
| Science & Technology | 51 | 15.2% |
| Business | 58 | 17.3% |
| Education | 43 | 12.8% |
| Literature & Languages | 7 | 2.1% |
| Liberal Arts & History | 25 | 7.5% |
| Visual & Performing Arts | 0 | 0.0% |
| Communications | 0 | 0.0% |
| Arts & Humanities | 36 | 10.7% |
| Total | 335 | 100.0% |
Transportation & Commute in Neillsville
Vehicle Availability by Sex in Neillsville
The most prevalent vehicle ownership categories in Neillsville are males with 2 vehicles (205, accounting for 36.9%) and females with 2 vehicles (157, making up 40.6%).
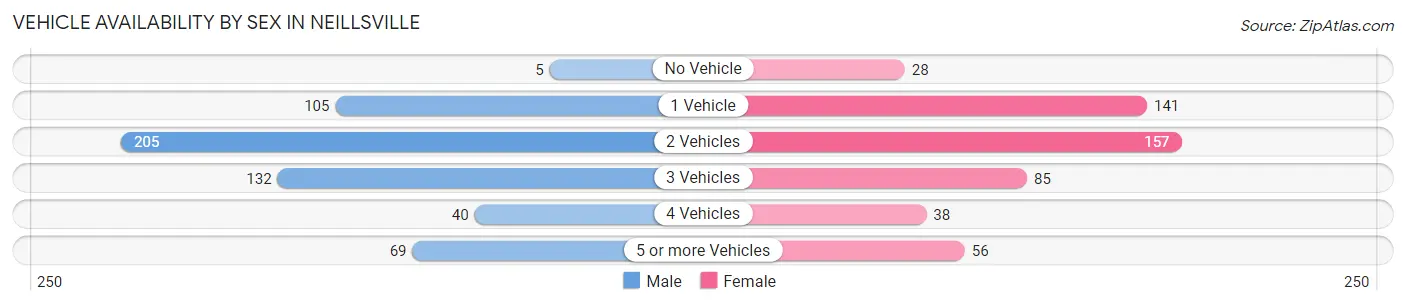
| Vehicles Available | Male | Female |
| No Vehicle | 5 (0.9%) | 28 (5.5%) |
| 1 Vehicle | 105 (18.9%) | 141 (27.9%) |
| 2 Vehicles | 205 (36.9%) | 157 (31.1%) |
| 3 Vehicles | 132 (23.7%) | 85 (16.8%) |
| 4 Vehicles | 40 (7.2%) | 38 (7.5%) |
| 5 or more Vehicles | 69 (12.4%) | 56 (11.1%) |
| Total | 556 (100.0%) | 505 (100.0%) |
Commute Time in Neillsville
The most frequently occuring commute durations in Neillsville are 5 to 9 minutes (248 commuters, 24.4%), less than 5 minutes (169 commuters, 16.6%), and 10 to 14 minutes (99 commuters, 9.7%).
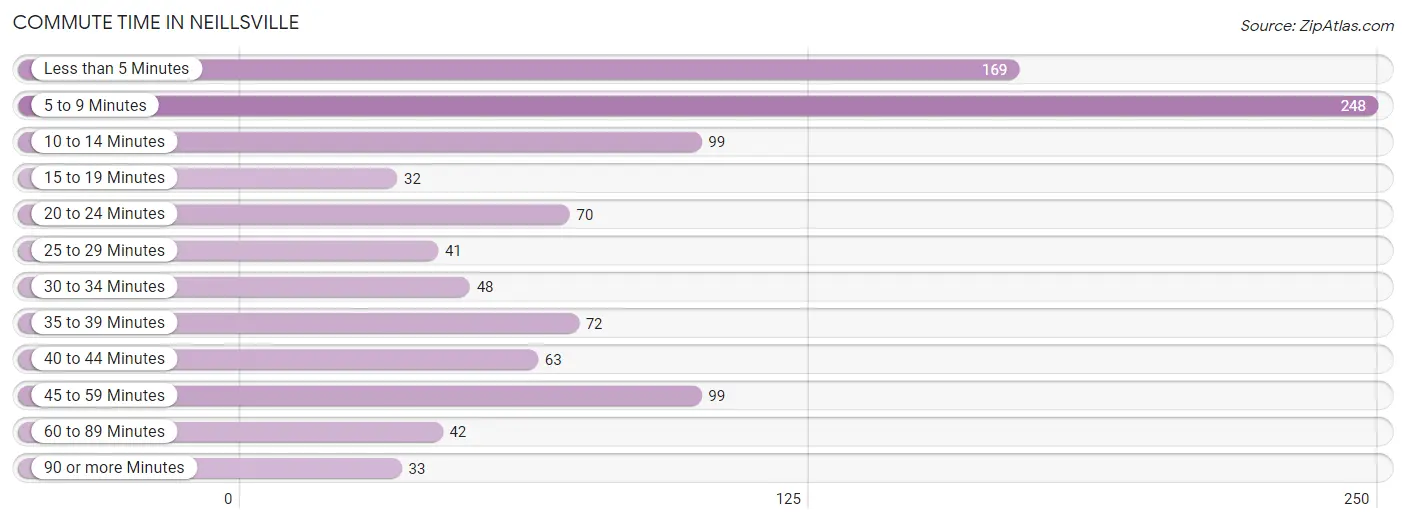
| Commute Time | # Commuters | % Commuters |
| Less than 5 Minutes | 169 | 16.6% |
| 5 to 9 Minutes | 248 | 24.4% |
| 10 to 14 Minutes | 99 | 9.7% |
| 15 to 19 Minutes | 32 | 3.2% |
| 20 to 24 Minutes | 70 | 6.9% |
| 25 to 29 Minutes | 41 | 4.0% |
| 30 to 34 Minutes | 48 | 4.7% |
| 35 to 39 Minutes | 72 | 7.1% |
| 40 to 44 Minutes | 63 | 6.2% |
| 45 to 59 Minutes | 99 | 9.7% |
| 60 to 89 Minutes | 42 | 4.1% |
| 90 or more Minutes | 33 | 3.3% |
Commute Time by Sex in Neillsville
The most common commute times in Neillsville are 5 to 9 minutes (113 commuters, 21.2%) for males and 5 to 9 minutes (135 commuters, 28.0%) for females.
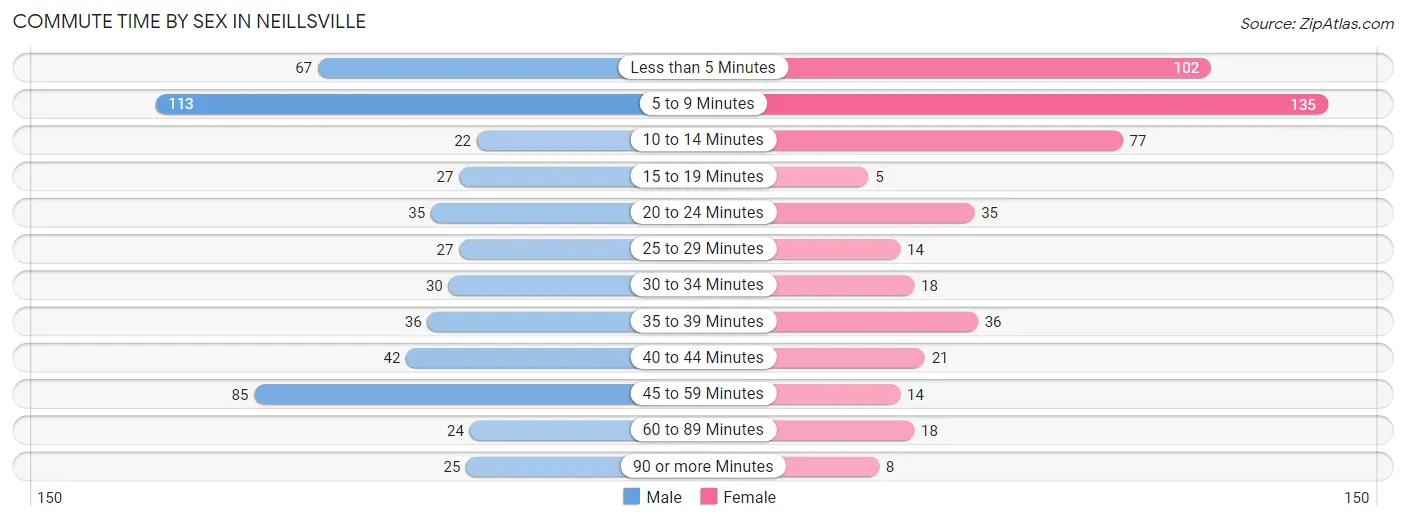
| Commute Time | Male | Female |
| Less than 5 Minutes | 67 (12.6%) | 102 (21.1%) |
| 5 to 9 Minutes | 113 (21.2%) | 135 (28.0%) |
| 10 to 14 Minutes | 22 (4.1%) | 77 (15.9%) |
| 15 to 19 Minutes | 27 (5.1%) | 5 (1.0%) |
| 20 to 24 Minutes | 35 (6.6%) | 35 (7.2%) |
| 25 to 29 Minutes | 27 (5.1%) | 14 (2.9%) |
| 30 to 34 Minutes | 30 (5.6%) | 18 (3.7%) |
| 35 to 39 Minutes | 36 (6.8%) | 36 (7.4%) |
| 40 to 44 Minutes | 42 (7.9%) | 21 (4.3%) |
| 45 to 59 Minutes | 85 (16.0%) | 14 (2.9%) |
| 60 to 89 Minutes | 24 (4.5%) | 18 (3.7%) |
| 90 or more Minutes | 25 (4.7%) | 8 (1.7%) |
Time of Departure to Work by Sex in Neillsville
The most frequent times of departure to work in Neillsville are 5:30 AM to 5:59 AM (142, 26.6%) for males and 7:30 AM to 7:59 AM (91, 18.8%) for females.
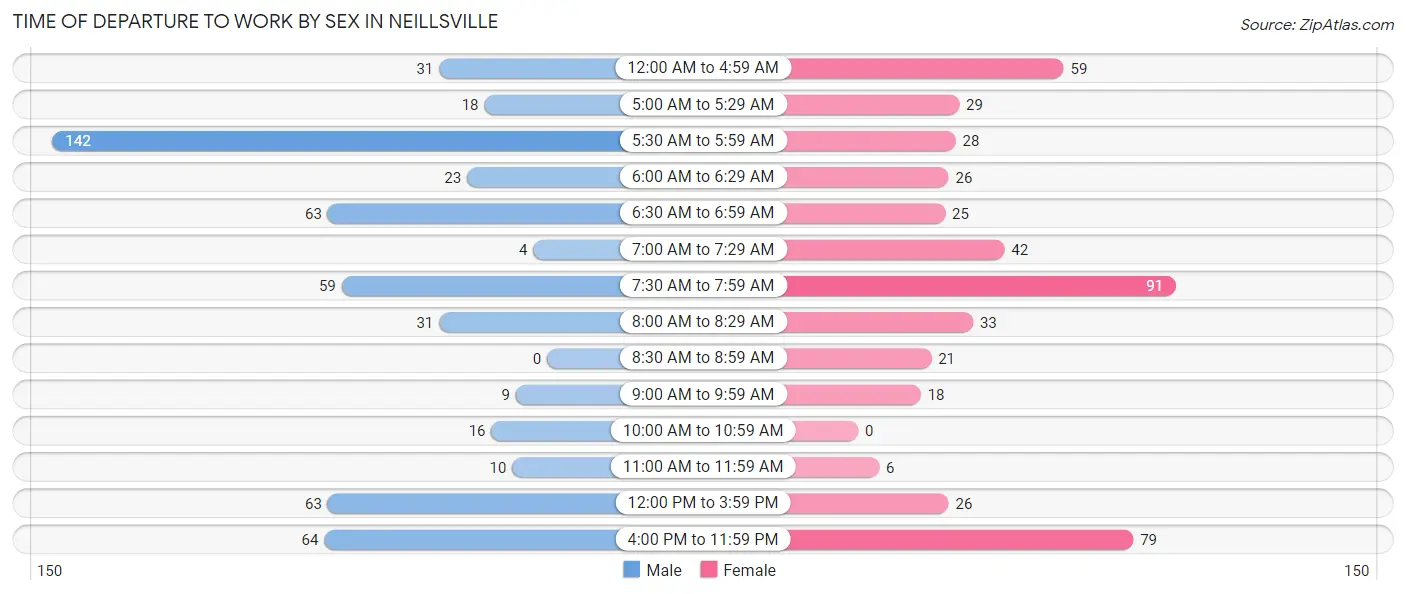
| Time of Departure | Male | Female |
| 12:00 AM to 4:59 AM | 31 (5.8%) | 59 (12.2%) |
| 5:00 AM to 5:29 AM | 18 (3.4%) | 29 (6.0%) |
| 5:30 AM to 5:59 AM | 142 (26.6%) | 28 (5.8%) |
| 6:00 AM to 6:29 AM | 23 (4.3%) | 26 (5.4%) |
| 6:30 AM to 6:59 AM | 63 (11.8%) | 25 (5.2%) |
| 7:00 AM to 7:29 AM | 4 (0.7%) | 42 (8.7%) |
| 7:30 AM to 7:59 AM | 59 (11.1%) | 91 (18.8%) |
| 8:00 AM to 8:29 AM | 31 (5.8%) | 33 (6.8%) |
| 8:30 AM to 8:59 AM | 0 (0.0%) | 21 (4.3%) |
| 9:00 AM to 9:59 AM | 9 (1.7%) | 18 (3.7%) |
| 10:00 AM to 10:59 AM | 16 (3.0%) | 0 (0.0%) |
| 11:00 AM to 11:59 AM | 10 (1.9%) | 6 (1.2%) |
| 12:00 PM to 3:59 PM | 63 (11.8%) | 26 (5.4%) |
| 4:00 PM to 11:59 PM | 64 (12.0%) | 79 (16.4%) |
| Total | 533 (100.0%) | 483 (100.0%) |
Housing Occupancy in Neillsville
Occupancy by Ownership in Neillsville
Of the total 1,044 dwellings in Neillsville, owner-occupied units account for 705 (67.5%), while renter-occupied units make up 339 (32.5%).
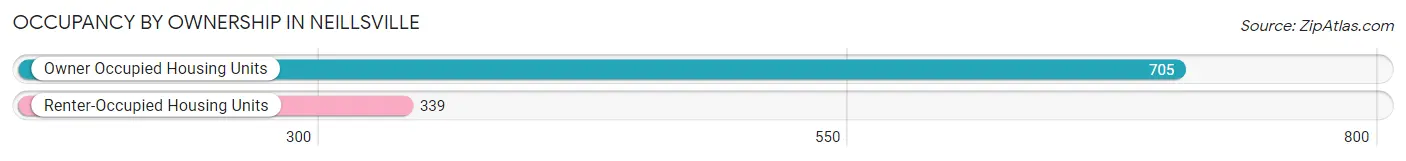
| Occupancy | # Housing Units | % Housing Units |
| Owner Occupied Housing Units | 705 | 67.5% |
| Renter-Occupied Housing Units | 339 | 32.5% |
| Total Occupied Housing Units | 1,044 | 100.0% |
Occupancy by Household Size in Neillsville
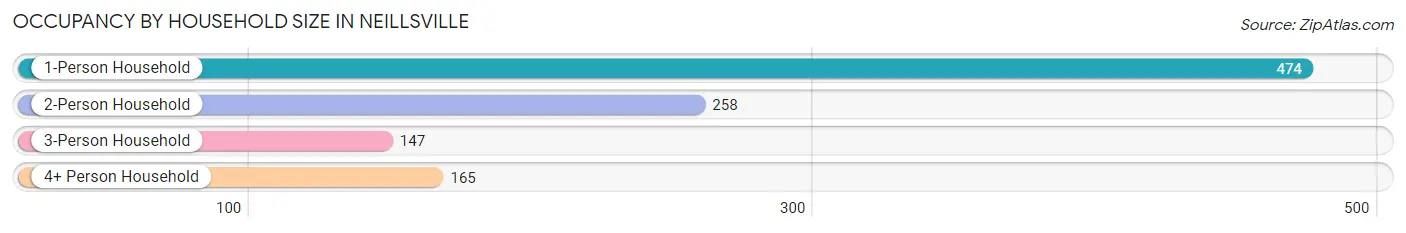
| Household Size | # Housing Units | % Housing Units |
| 1-Person Household | 474 | 45.4% |
| 2-Person Household | 258 | 24.7% |
| 3-Person Household | 147 | 14.1% |
| 4+ Person Household | 165 | 15.8% |
| Total Housing Units | 1,044 | 100.0% |
Occupancy by Ownership by Household Size in Neillsville
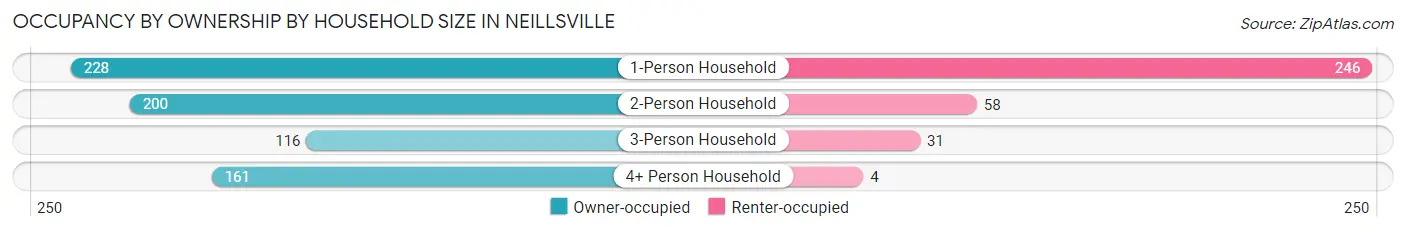
| Household Size | Owner-occupied | Renter-occupied |
| 1-Person Household | 228 (48.1%) | 246 (51.9%) |
| 2-Person Household | 200 (77.5%) | 58 (22.5%) |
| 3-Person Household | 116 (78.9%) | 31 (21.1%) |
| 4+ Person Household | 161 (97.6%) | 4 (2.4%) |
| Total Housing Units | 705 (67.5%) | 339 (32.5%) |
Occupancy by Educational Attainment in Neillsville
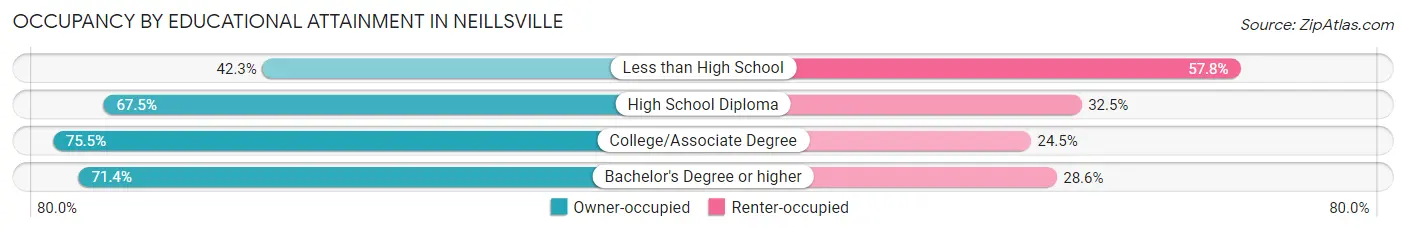
| Household Size | Owner-occupied | Renter-occupied |
| Less than High School | 60 (42.2%) | 82 (57.8%) |
| High School Diploma | 222 (67.5%) | 107 (32.5%) |
| College/Associate Degree | 253 (75.5%) | 82 (24.5%) |
| Bachelor's Degree or higher | 170 (71.4%) | 68 (28.6%) |
Occupancy by Age of Householder in Neillsville
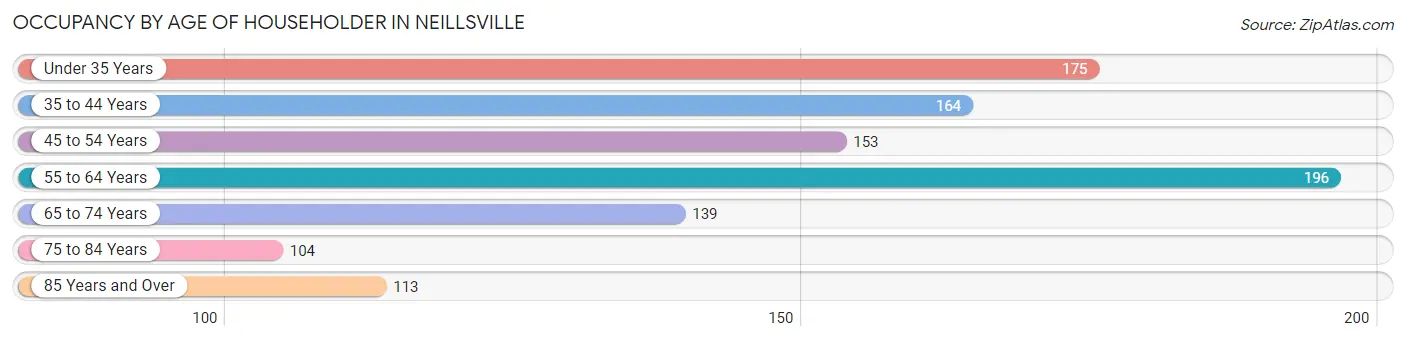
| Age Bracket | # Households | % Households |
| Under 35 Years | 175 | 16.8% |
| 35 to 44 Years | 164 | 15.7% |
| 45 to 54 Years | 153 | 14.7% |
| 55 to 64 Years | 196 | 18.8% |
| 65 to 74 Years | 139 | 13.3% |
| 75 to 84 Years | 104 | 10.0% |
| 85 Years and Over | 113 | 10.8% |
| Total | 1,044 | 100.0% |
Housing Finances in Neillsville
Median Income by Occupancy in Neillsville
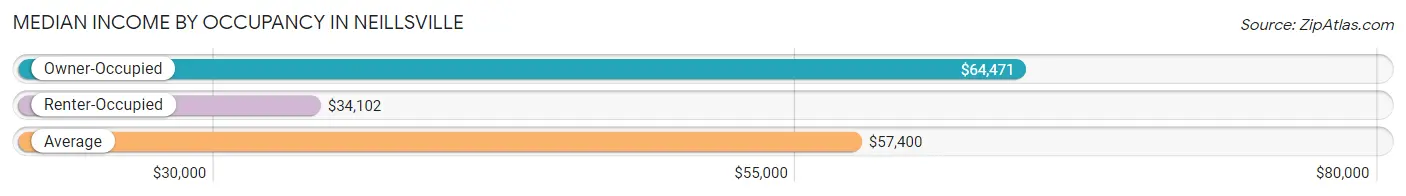
| Occupancy Type | # Households | Median Income |
| Owner-Occupied | 705 (67.5%) | $64,471 |
| Renter-Occupied | 339 (32.5%) | $34,102 |
| Average | 1,044 (100.0%) | $57,400 |
Occupancy by Householder Income Bracket in Neillsville
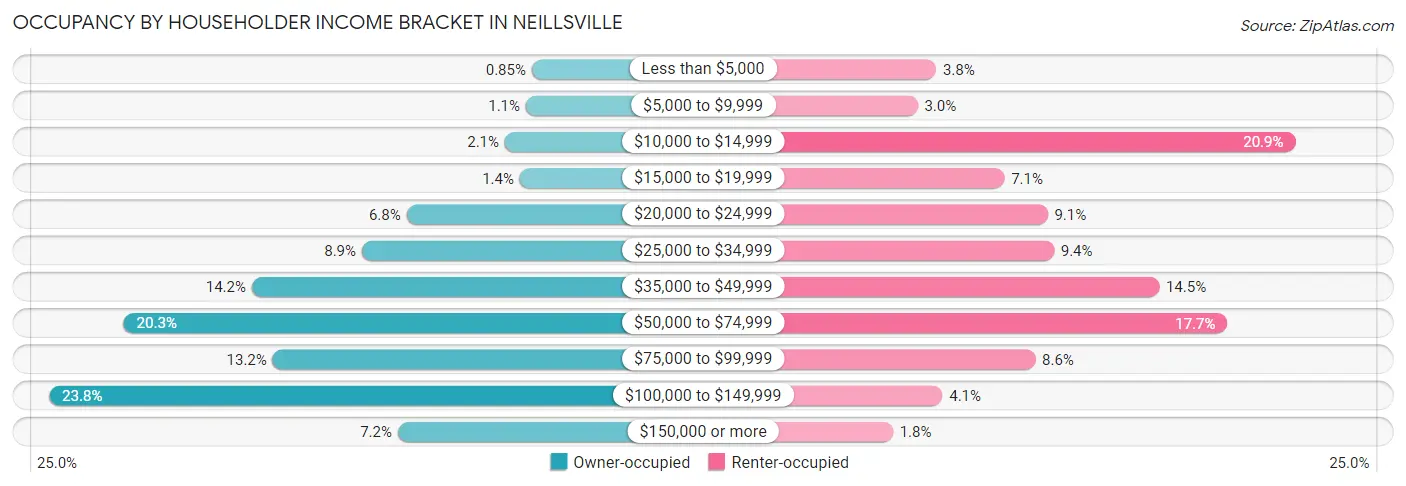
| Income Bracket | Owner-occupied | Renter-occupied |
| Less than $5,000 | 6 (0.9%) | 13 (3.8%) |
| $5,000 to $9,999 | 8 (1.1%) | 10 (2.9%) |
| $10,000 to $14,999 | 15 (2.1%) | 71 (20.9%) |
| $15,000 to $19,999 | 10 (1.4%) | 24 (7.1%) |
| $20,000 to $24,999 | 48 (6.8%) | 31 (9.1%) |
| $25,000 to $34,999 | 63 (8.9%) | 32 (9.4%) |
| $35,000 to $49,999 | 100 (14.2%) | 49 (14.4%) |
| $50,000 to $74,999 | 143 (20.3%) | 60 (17.7%) |
| $75,000 to $99,999 | 93 (13.2%) | 29 (8.6%) |
| $100,000 to $149,999 | 168 (23.8%) | 14 (4.1%) |
| $150,000 or more | 51 (7.2%) | 6 (1.8%) |
| Total | 705 (100.0%) | 339 (100.0%) |
Monthly Housing Cost Tiers in Neillsville
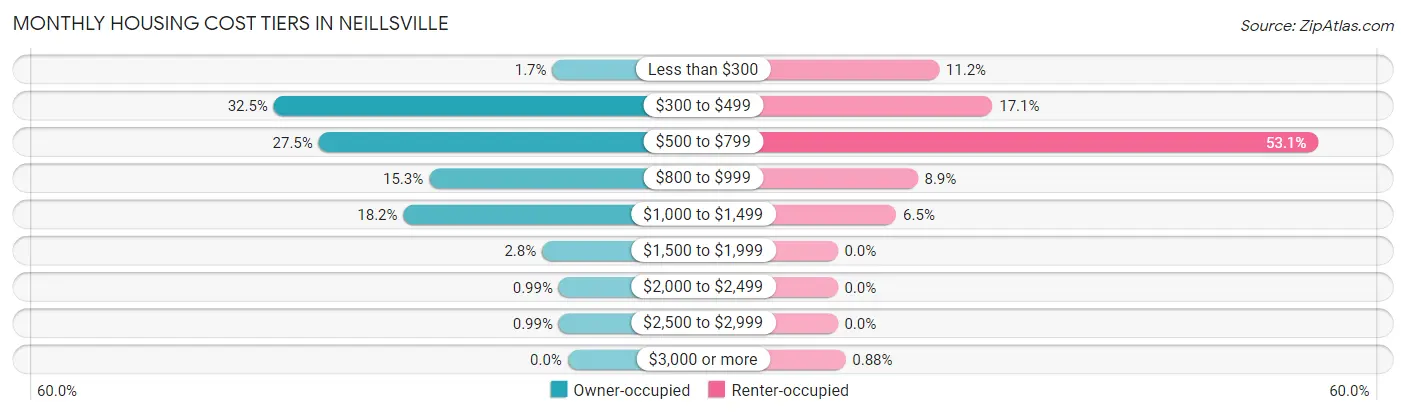
| Monthly Cost | Owner-occupied | Renter-occupied |
| Less than $300 | 12 (1.7%) | 38 (11.2%) |
| $300 to $499 | 229 (32.5%) | 58 (17.1%) |
| $500 to $799 | 194 (27.5%) | 180 (53.1%) |
| $800 to $999 | 108 (15.3%) | 30 (8.8%) |
| $1,000 to $1,499 | 128 (18.2%) | 22 (6.5%) |
| $1,500 to $1,999 | 20 (2.8%) | 0 (0.0%) |
| $2,000 to $2,499 | 7 (1.0%) | 0 (0.0%) |
| $2,500 to $2,999 | 7 (1.0%) | 0 (0.0%) |
| $3,000 or more | 0 (0.0%) | 3 (0.9%) |
| Total | 705 (100.0%) | 339 (100.0%) |
Physical Housing Characteristics in Neillsville
Housing Structures in Neillsville
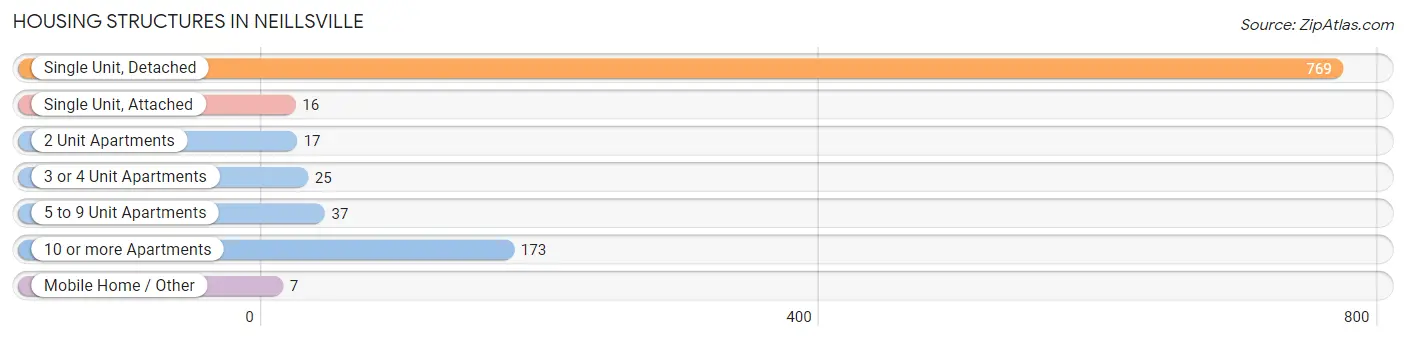
| Structure Type | # Housing Units | % Housing Units |
| Single Unit, Detached | 769 | 73.7% |
| Single Unit, Attached | 16 | 1.5% |
| 2 Unit Apartments | 17 | 1.6% |
| 3 or 4 Unit Apartments | 25 | 2.4% |
| 5 to 9 Unit Apartments | 37 | 3.5% |
| 10 or more Apartments | 173 | 16.6% |
| Mobile Home / Other | 7 | 0.7% |
| Total | 1,044 | 100.0% |
Housing Structures by Occupancy in Neillsville
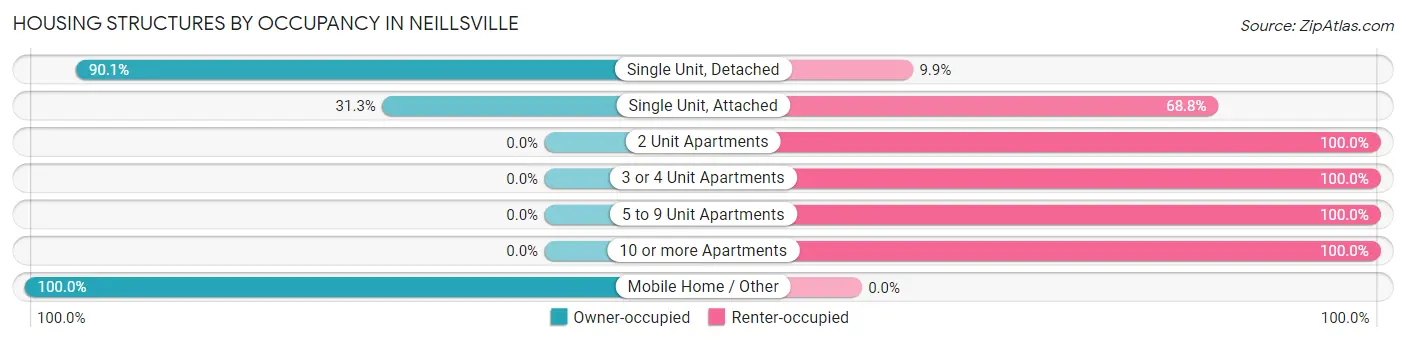
| Structure Type | Owner-occupied | Renter-occupied |
| Single Unit, Detached | 693 (90.1%) | 76 (9.9%) |
| Single Unit, Attached | 5 (31.2%) | 11 (68.8%) |
| 2 Unit Apartments | 0 (0.0%) | 17 (100.0%) |
| 3 or 4 Unit Apartments | 0 (0.0%) | 25 (100.0%) |
| 5 to 9 Unit Apartments | 0 (0.0%) | 37 (100.0%) |
| 10 or more Apartments | 0 (0.0%) | 173 (100.0%) |
| Mobile Home / Other | 7 (100.0%) | 0 (0.0%) |
| Total | 705 (67.5%) | 339 (32.5%) |
Housing Structures by Number of Rooms in Neillsville
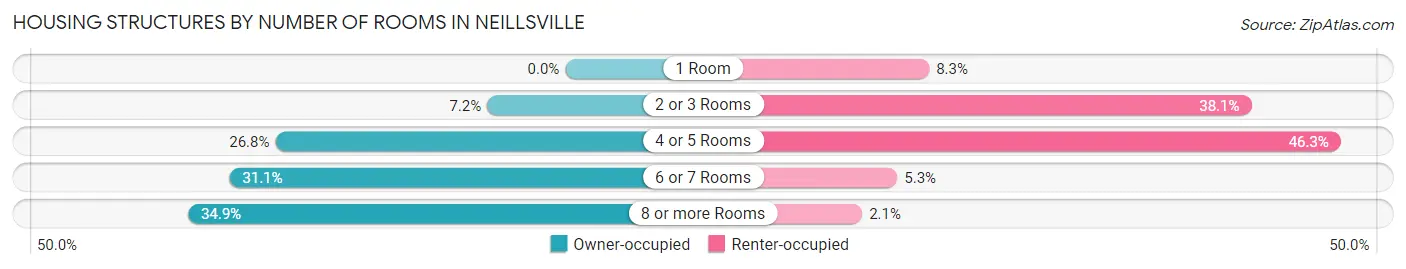
| Number of Rooms | Owner-occupied | Renter-occupied |
| 1 Room | 0 (0.0%) | 28 (8.3%) |
| 2 or 3 Rooms | 51 (7.2%) | 129 (38.1%) |
| 4 or 5 Rooms | 189 (26.8%) | 157 (46.3%) |
| 6 or 7 Rooms | 219 (31.1%) | 18 (5.3%) |
| 8 or more Rooms | 246 (34.9%) | 7 (2.1%) |
| Total | 705 (100.0%) | 339 (100.0%) |
Housing Structure by Heating Type in Neillsville
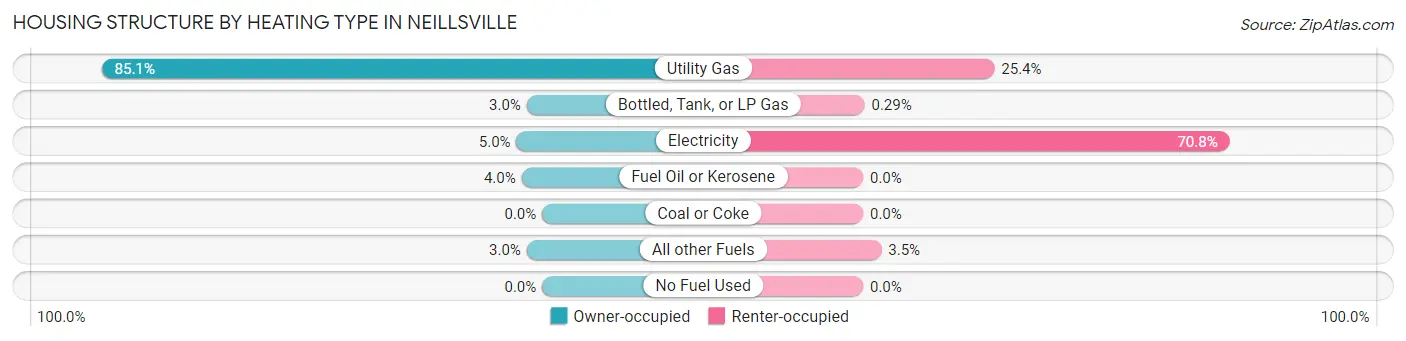
| Heating Type | Owner-occupied | Renter-occupied |
| Utility Gas | 600 (85.1%) | 86 (25.4%) |
| Bottled, Tank, or LP Gas | 21 (3.0%) | 1 (0.3%) |
| Electricity | 35 (5.0%) | 240 (70.8%) |
| Fuel Oil or Kerosene | 28 (4.0%) | 0 (0.0%) |
| Coal or Coke | 0 (0.0%) | 0 (0.0%) |
| All other Fuels | 21 (3.0%) | 12 (3.5%) |
| No Fuel Used | 0 (0.0%) | 0 (0.0%) |
| Total | 705 (100.0%) | 339 (100.0%) |
Household Vehicle Usage in Neillsville
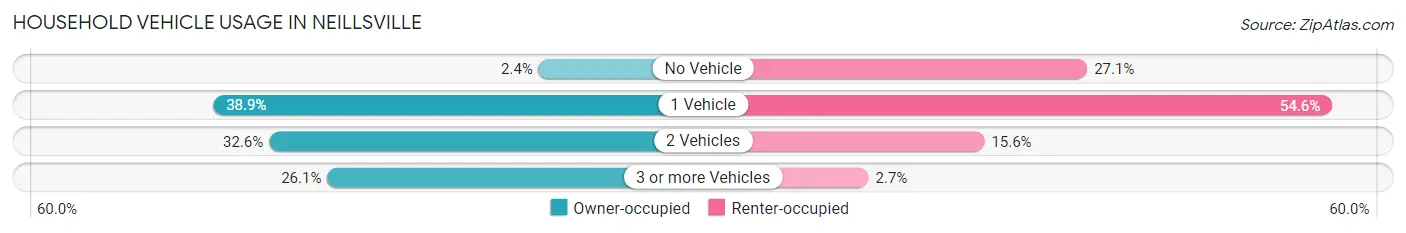
| Vehicles per Household | Owner-occupied | Renter-occupied |
| No Vehicle | 17 (2.4%) | 92 (27.1%) |
| 1 Vehicle | 274 (38.9%) | 185 (54.6%) |
| 2 Vehicles | 230 (32.6%) | 53 (15.6%) |
| 3 or more Vehicles | 184 (26.1%) | 9 (2.6%) |
| Total | 705 (100.0%) | 339 (100.0%) |
Real Estate & Mortgages in Neillsville
Real Estate and Mortgage Overview in Neillsville
| Characteristic | Without Mortgage | With Mortgage |
| Housing Units | 363 | 342 |
| Median Property Value | $101,700 | $104,400 |
| Median Household Income | $50,313 | $36 |
| Monthly Housing Costs | $456 | $0 |
| Real Estate Taxes | $1,975 | $0 |
Property Value by Mortgage Status in Neillsville
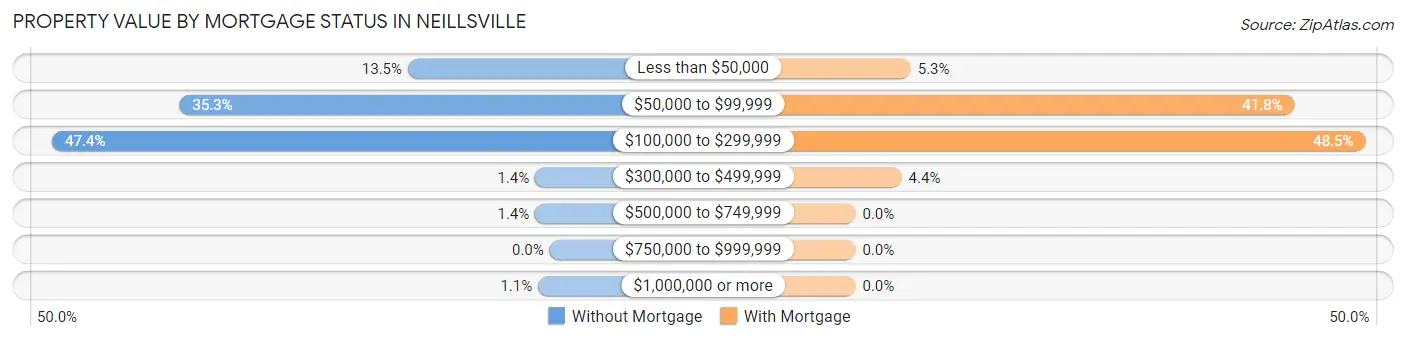
| Property Value | Without Mortgage | With Mortgage |
| Less than $50,000 | 49 (13.5%) | 18 (5.3%) |
| $50,000 to $99,999 | 128 (35.3%) | 143 (41.8%) |
| $100,000 to $299,999 | 172 (47.4%) | 166 (48.5%) |
| $300,000 to $499,999 | 5 (1.4%) | 15 (4.4%) |
| $500,000 to $749,999 | 5 (1.4%) | 0 (0.0%) |
| $750,000 to $999,999 | 0 (0.0%) | 0 (0.0%) |
| $1,000,000 or more | 4 (1.1%) | 0 (0.0%) |
| Total | 363 (100.0%) | 342 (100.0%) |
Household Income by Mortgage Status in Neillsville
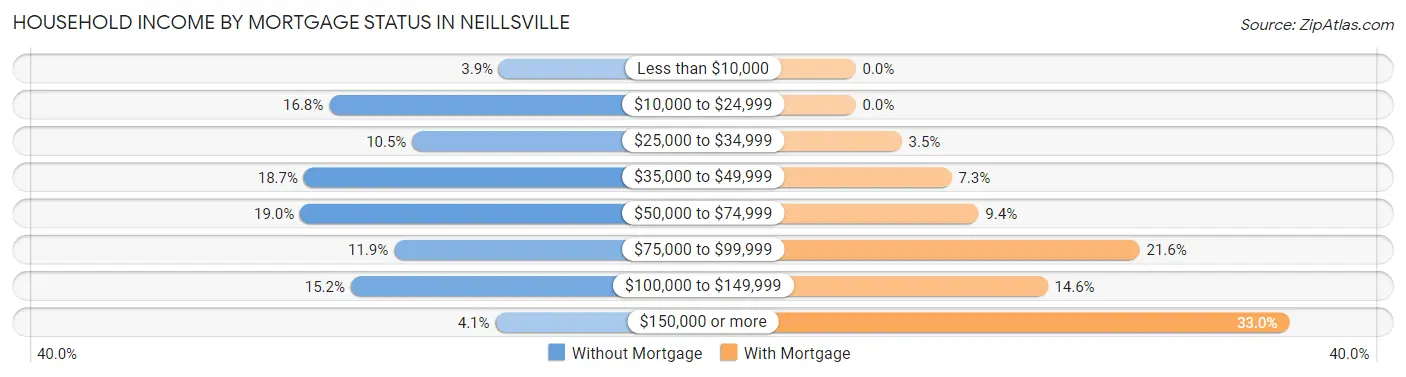
| Household Income | Without Mortgage | With Mortgage |
| Less than $10,000 | 14 (3.9%) | 0 (0.0%) |
| $10,000 to $24,999 | 61 (16.8%) | 0 (0.0%) |
| $25,000 to $34,999 | 38 (10.5%) | 12 (3.5%) |
| $35,000 to $49,999 | 68 (18.7%) | 25 (7.3%) |
| $50,000 to $74,999 | 69 (19.0%) | 32 (9.4%) |
| $75,000 to $99,999 | 43 (11.8%) | 74 (21.6%) |
| $100,000 to $149,999 | 55 (15.1%) | 50 (14.6%) |
| $150,000 or more | 15 (4.1%) | 113 (33.0%) |
| Total | 363 (100.0%) | 342 (100.0%) |
Property Value to Household Income Ratio in Neillsville
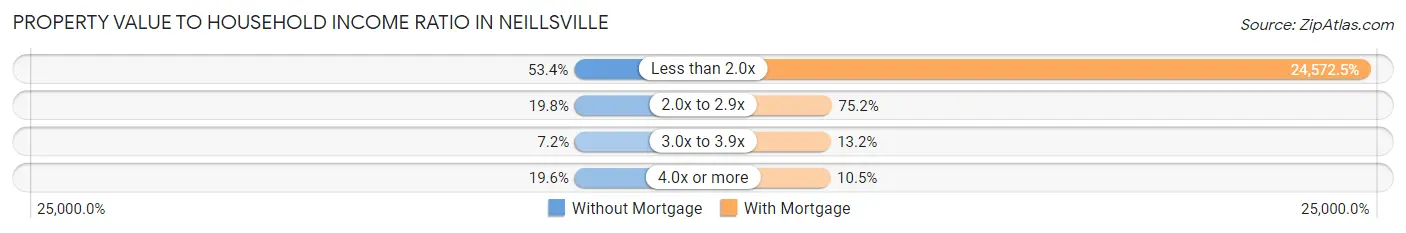
| Value-to-Income Ratio | Without Mortgage | With Mortgage |
| Less than 2.0x | 194 (53.4%) | 84,038 (24,572.5%) |
| 2.0x to 2.9x | 72 (19.8%) | 257 (75.1%) |
| 3.0x to 3.9x | 26 (7.2%) | 45 (13.2%) |
| 4.0x or more | 71 (19.6%) | 36 (10.5%) |
| Total | 363 (100.0%) | 342 (100.0%) |
Real Estate Taxes by Mortgage Status in Neillsville
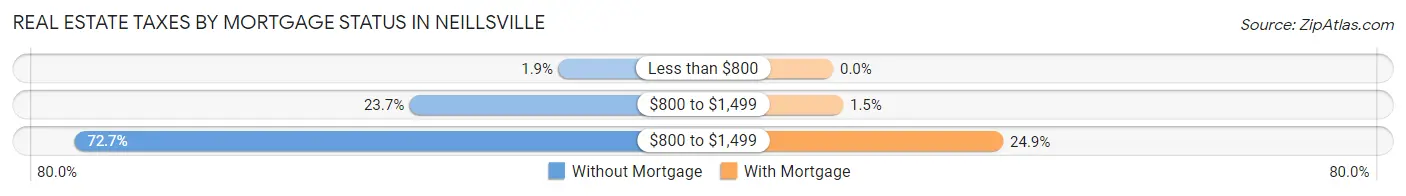
| Property Taxes | Without Mortgage | With Mortgage |
| Less than $800 | 7 (1.9%) | 0 (0.0%) |
| $800 to $1,499 | 86 (23.7%) | 5 (1.5%) |
| $800 to $1,499 | 264 (72.7%) | 85 (24.8%) |
| Total | 363 (100.0%) | 342 (100.0%) |
Health & Disability in Neillsville
Health Insurance Coverage by Age in Neillsville
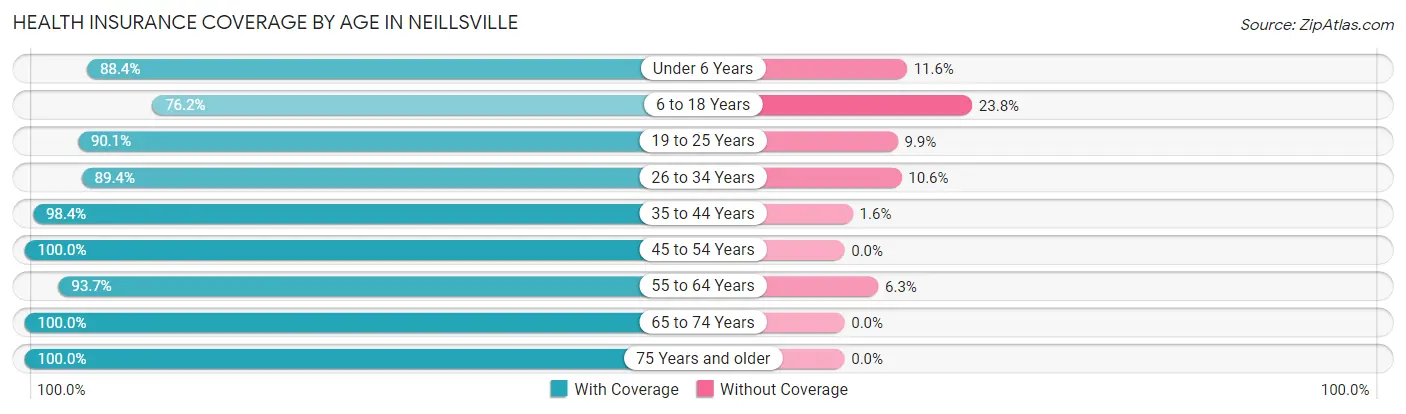
| Age Bracket | With Coverage | Without Coverage |
| Under 6 Years | 167 (88.4%) | 22 (11.6%) |
| 6 to 18 Years | 301 (76.2%) | 94 (23.8%) |
| 19 to 25 Years | 127 (90.1%) | 14 (9.9%) |
| 26 to 34 Years | 210 (89.4%) | 25 (10.6%) |
| 35 to 44 Years | 252 (98.4%) | 4 (1.6%) |
| 45 to 54 Years | 225 (100.0%) | 0 (0.0%) |
| 55 to 64 Years | 282 (93.7%) | 19 (6.3%) |
| 65 to 74 Years | 201 (100.0%) | 0 (0.0%) |
| 75 Years and older | 274 (100.0%) | 0 (0.0%) |
| Total | 2,039 (92.0%) | 178 (8.0%) |
Health Insurance Coverage by Citizenship Status in Neillsville
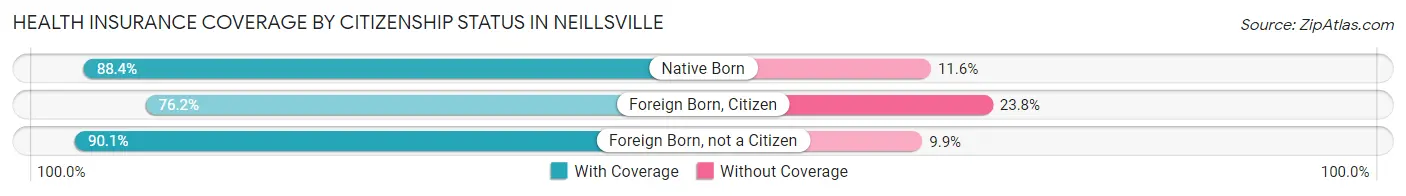
| Citizenship Status | With Coverage | Without Coverage |
| Native Born | 167 (88.4%) | 22 (11.6%) |
| Foreign Born, Citizen | 301 (76.2%) | 94 (23.8%) |
| Foreign Born, not a Citizen | 127 (90.1%) | 14 (9.9%) |
Health Insurance Coverage by Household Income in Neillsville
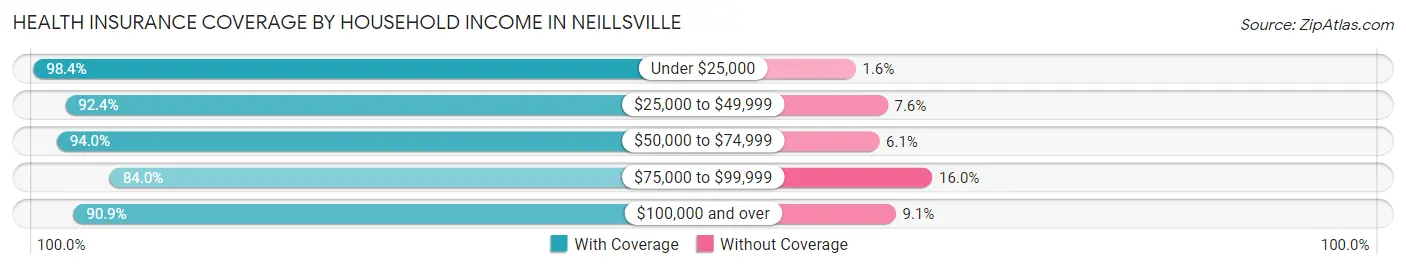
| Household Income | With Coverage | Without Coverage |
| Under $25,000 | 299 (98.4%) | 5 (1.6%) |
| $25,000 to $49,999 | 436 (92.4%) | 36 (7.6%) |
| $50,000 to $74,999 | 388 (94.0%) | 25 (6.0%) |
| $75,000 to $99,999 | 226 (84.0%) | 43 (16.0%) |
| $100,000 and over | 686 (90.9%) | 69 (9.1%) |
Public vs Private Health Insurance Coverage by Age in Neillsville
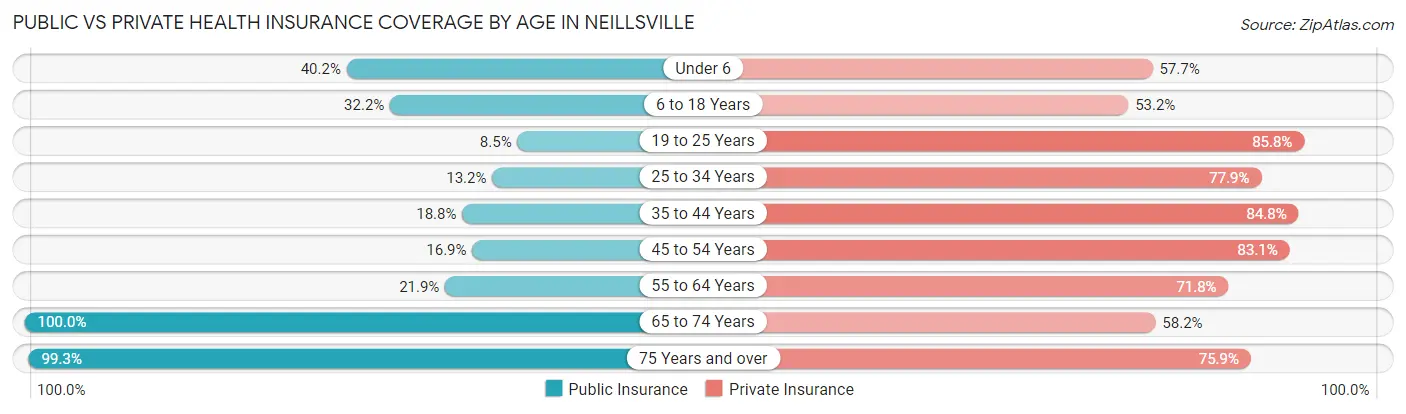
| Age Bracket | Public Insurance | Private Insurance |
| Under 6 | 76 (40.2%) | 109 (57.7%) |
| 6 to 18 Years | 127 (32.2%) | 210 (53.2%) |
| 19 to 25 Years | 12 (8.5%) | 121 (85.8%) |
| 25 to 34 Years | 31 (13.2%) | 183 (77.9%) |
| 35 to 44 Years | 48 (18.8%) | 217 (84.8%) |
| 45 to 54 Years | 38 (16.9%) | 187 (83.1%) |
| 55 to 64 Years | 66 (21.9%) | 216 (71.8%) |
| 65 to 74 Years | 201 (100.0%) | 117 (58.2%) |
| 75 Years and over | 272 (99.3%) | 208 (75.9%) |
| Total | 871 (39.3%) | 1,568 (70.7%) |
Disability Status by Sex by Age in Neillsville
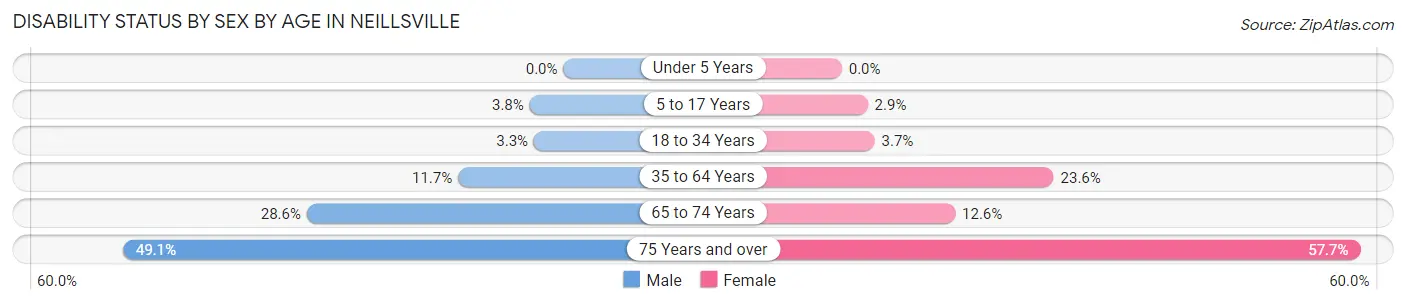
| Age Bracket | Male | Female |
| Under 5 Years | 0 (0.0%) | 0 (0.0%) |
| 5 to 17 Years | 10 (3.8%) | 4 (2.9%) |
| 18 to 34 Years | 6 (3.3%) | 8 (3.6%) |
| 35 to 64 Years | 44 (11.7%) | 96 (23.6%) |
| 65 to 74 Years | 28 (28.6%) | 13 (12.6%) |
| 75 Years and over | 52 (49.1%) | 97 (57.7%) |
Disability Class by Sex by Age in Neillsville
Disability Class: Hearing Difficulty
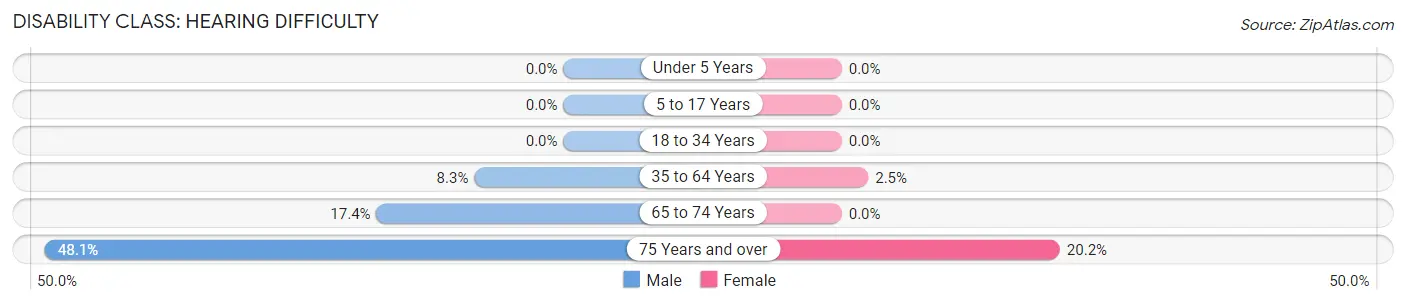
| Age Bracket | Male | Female |
| Under 5 Years | 0 (0.0%) | 0 (0.0%) |
| 5 to 17 Years | 0 (0.0%) | 0 (0.0%) |
| 18 to 34 Years | 0 (0.0%) | 0 (0.0%) |
| 35 to 64 Years | 31 (8.3%) | 10 (2.5%) |
| 65 to 74 Years | 17 (17.3%) | 0 (0.0%) |
| 75 Years and over | 51 (48.1%) | 34 (20.2%) |
Disability Class: Vision Difficulty
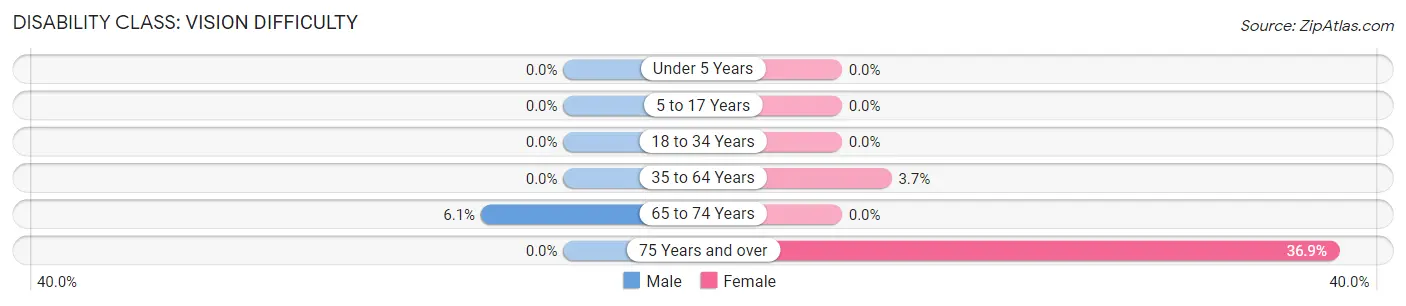
| Age Bracket | Male | Female |
| Under 5 Years | 0 (0.0%) | 0 (0.0%) |
| 5 to 17 Years | 0 (0.0%) | 0 (0.0%) |
| 18 to 34 Years | 0 (0.0%) | 0 (0.0%) |
| 35 to 64 Years | 0 (0.0%) | 15 (3.7%) |
| 65 to 74 Years | 6 (6.1%) | 0 (0.0%) |
| 75 Years and over | 0 (0.0%) | 62 (36.9%) |
Disability Class: Cognitive Difficulty
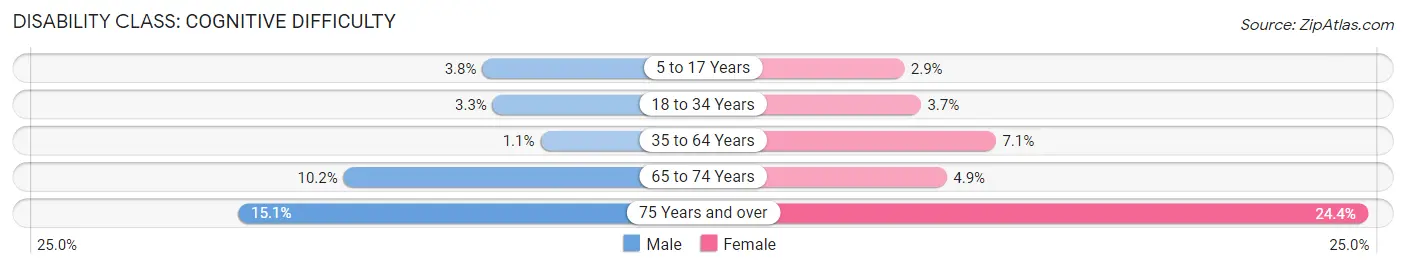
| Age Bracket | Male | Female |
| 5 to 17 Years | 10 (3.8%) | 4 (2.9%) |
| 18 to 34 Years | 6 (3.3%) | 8 (3.6%) |
| 35 to 64 Years | 4 (1.1%) | 29 (7.1%) |
| 65 to 74 Years | 10 (10.2%) | 5 (4.9%) |
| 75 Years and over | 16 (15.1%) | 41 (24.4%) |
Disability Class: Ambulatory Difficulty
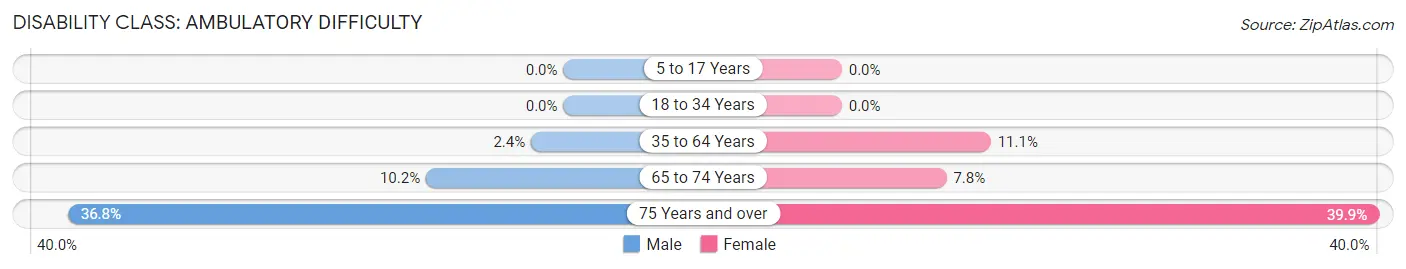
| Age Bracket | Male | Female |
| 5 to 17 Years | 0 (0.0%) | 0 (0.0%) |
| 18 to 34 Years | 0 (0.0%) | 0 (0.0%) |
| 35 to 64 Years | 9 (2.4%) | 45 (11.1%) |
| 65 to 74 Years | 10 (10.2%) | 8 (7.8%) |
| 75 Years and over | 39 (36.8%) | 67 (39.9%) |
Disability Class: Self-Care Difficulty
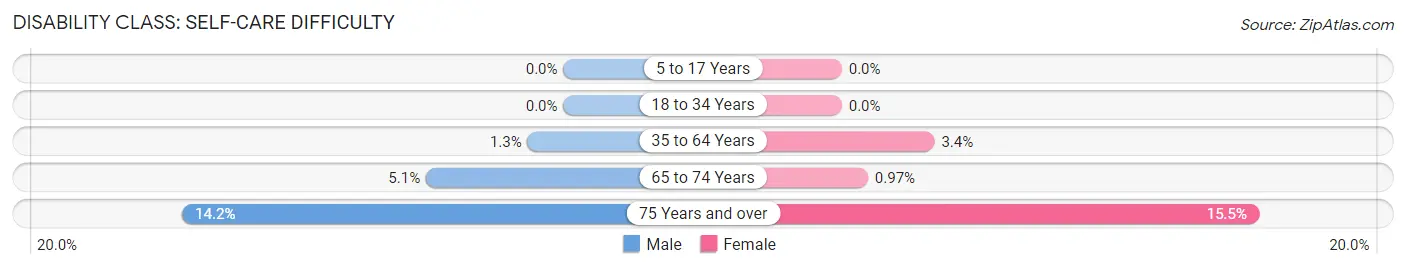
| Age Bracket | Male | Female |
| 5 to 17 Years | 0 (0.0%) | 0 (0.0%) |
| 18 to 34 Years | 0 (0.0%) | 0 (0.0%) |
| 35 to 64 Years | 5 (1.3%) | 14 (3.4%) |
| 65 to 74 Years | 5 (5.1%) | 1 (1.0%) |
| 75 Years and over | 15 (14.1%) | 26 (15.5%) |
Technology Access in Neillsville
Computing Device Access in Neillsville
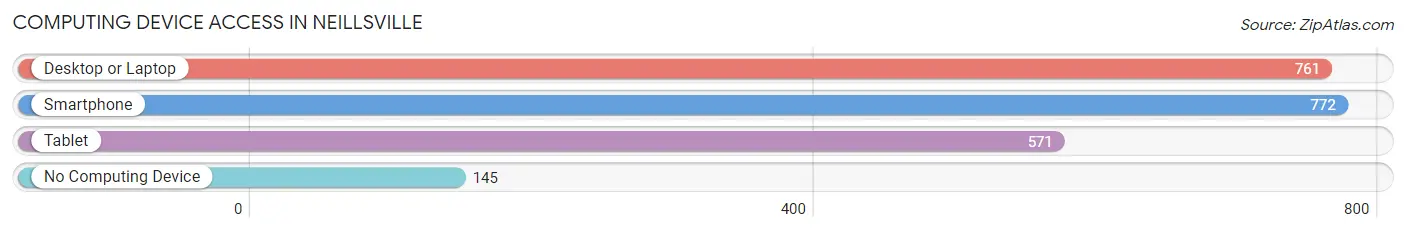
| Device Type | # Households | % Households |
| Desktop or Laptop | 761 | 72.9% |
| Smartphone | 772 | 74.0% |
| Tablet | 571 | 54.7% |
| No Computing Device | 145 | 13.9% |
| Total | 1,044 | 100.0% |
Internet Access in Neillsville
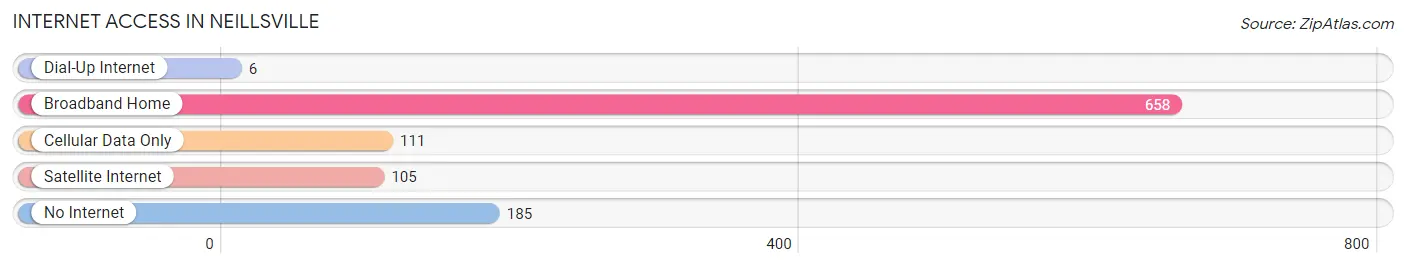
| Internet Type | # Households | % Households |
| Dial-Up Internet | 6 | 0.6% |
| Broadband Home | 658 | 63.0% |
| Cellular Data Only | 111 | 10.6% |
| Satellite Internet | 105 | 10.1% |
| No Internet | 185 | 17.7% |
| Total | 1,044 | 100.0% |
Neillsville Summary
Neillsville, Wisconsin is a small city located in Clark County, Wisconsin. It is the county seat of Clark County and is located in the central part of the state. The city has a population of 2,637 as of the 2010 census.
Geography
Neillsville is located at 44°31′N 90°37′W (44.5167, -90.6167). It is situated in the Black River Valley, which is part of the Central Plain region of Wisconsin. The city is located on the Black River, which is a tributary of the Chippewa River. The city is surrounded by rolling hills and forests. The nearest major city is Eau Claire, which is located about 40 miles to the north.
History
Neillsville was founded in 1845 by Charles Neill, who was a surveyor and land speculator. He named the city after himself. The city was incorporated in 1874 and was designated as the county seat of Clark County in 1877.
The city was an important center for the lumber industry in the late 19th and early 20th centuries. The city was also home to a number of manufacturing companies, including a furniture factory, a canning factory, and a brickyard.
In the late 20th century, the city experienced a period of economic decline. The lumber industry declined and many of the manufacturing companies closed. The city has since experienced a resurgence in recent years, with a number of new businesses opening in the downtown area.
Economy
The economy of Neillsville is largely based on agriculture and tourism. The city is home to a number of dairy farms and other agricultural operations. The city is also a popular tourist destination, with a number of attractions, including the Neillsville Historical Museum, the Neillsville Public Library, and the Neillsville Country Club.
The city is also home to a number of small businesses, including restaurants, retail stores, and service providers. The city is also home to a number of manufacturing companies, including a furniture factory, a canning factory, and a brickyard.
Demographics
As of the 2010 census, the population of Neillsville was 2,637. The racial makeup of the city was 97.2% White, 0.4% African American, 0.3% Native American, 0.3% Asian, 0.2% from other races, and 1.6% from two or more races. Hispanic or Latino of any race were 1.2% of the population.
The median household income in Neillsville was $37,917, and the median family income was $45,938. The per capita income for the city was $19,945. About 11.2% of families and 14.2% of the population were below the poverty line, including 19.2% of those under age 18 and 8.2% of those age 65 or over.
Conclusion
Neillsville, Wisconsin is a small city located in Clark County, Wisconsin. It is the county seat of Clark County and is located in the central part of the state. The city has a population of 2,637 as of the 2010 census. The economy of Neillsville is largely based on agriculture and tourism. The city is home to a number of small businesses, including restaurants, retail stores, and service providers. The city is also home to a number of manufacturing companies, including a furniture factory, a canning factory, and a brickyard. The racial makeup of the city was 97.2% White, 0.4% African American, 0.3% Native American, 0.3% Asian, 0.2% from other races, and 1.6% from two or more races. The median household income in Neillsville was $37,917, and the median family income was $45,938. The per capita income for the city was $19,945. Neillsville is a small city with a rich history and a vibrant economy.
Common Questions
What is Per Capita Income in Neillsville?
Per Capita income in Neillsville is $31,365.
What is the Median Family Income in Neillsville?
Median Family Income in Neillsville is $77,955.
What is the Median Household income in Neillsville?
Median Household Income in Neillsville is $57,400.
What is Income or Wage Gap in Neillsville?
Income or Wage Gap in Neillsville is 50.4%.
Women in Neillsville earn 49.6 cents for every dollar earned by a man.
What is Inequality or Gini Index in Neillsville?
Inequality or Gini Index in Neillsville is 0.41.
What is the Total Population of Neillsville?
Total Population of Neillsville is 2,311.
What is the Total Male Population of Neillsville?
Total Male Population of Neillsville is 1,171.
What is the Total Female Population of Neillsville?
Total Female Population of Neillsville is 1,140.
What is the Ratio of Males per 100 Females in Neillsville?
There are 102.72 Males per 100 Females in Neillsville.
What is the Ratio of Females per 100 Males in Neillsville?
There are 97.35 Females per 100 Males in Neillsville.
What is the Median Population Age in Neillsville?
Median Population Age in Neillsville is 40.3 Years.
What is the Average Family Size in Neillsville
Average Family Size in Neillsville is 3.1 People.
What is the Average Household Size in Neillsville
Average Household Size in Neillsville is 2.1 People.
How Large is the Labor Force in Neillsville?
There are 1,111 People in the Labor Forcein in Neillsville.
What is the Percentage of People in the Labor Force in Neillsville?
59.7% of People are in the Labor Force in Neillsville.
What is the Unemployment Rate in Neillsville?
Unemployment Rate in Neillsville is 3.6%.