Muscoda, WI Map & Demographics
Muscoda Map
Muscoda Overview
$28,438
PER CAPITA INCOME
$62,273
AVG FAMILY INCOME
$51,016
AVG HOUSEHOLD INCOME
32.9%
WAGE / INCOME GAP [ % ]
67.1¢/ $1
WAGE / INCOME GAP [ $ ]
0.38
INEQUALITY / GINI INDEX
1,194
TOTAL POPULATION
628
MALE POPULATION
566
FEMALE POPULATION
110.95
MALES / 100 FEMALES
90.13
FEMALES / 100 MALES
36.8
MEDIAN AGE
2.8
AVG FAMILY SIZE
2.2
AVG HOUSEHOLD SIZE
637
LABOR FORCE [ PEOPLE ]
64.3%
PERCENT IN LABOR FORCE
5.7%
UNEMPLOYMENT RATE
Muscoda Zip Codes
Muscoda Area Codes
Income in Muscoda
Income Overview in Muscoda
Per Capita Income in Muscoda is $28,438, while median incomes of families and households are $62,273 and $51,016 respectively.
| Characteristic | Number | Measure |
| Per Capita Income | 1,194 | $28,438 |
| Median Family Income | 288 | $62,273 |
| Mean Family Income | 288 | $78,587 |
| Median Household Income | 529 | $51,016 |
| Mean Household Income | 529 | $64,132 |
| Income Deficit | 288 | $0 |
| Wage / Income Gap (%) | 1,194 | 32.91% |
| Wage / Income Gap ($) | 1,194 | 67.09¢ per $1 |
| Gini / Inequality Index | 1,194 | 0.38 |
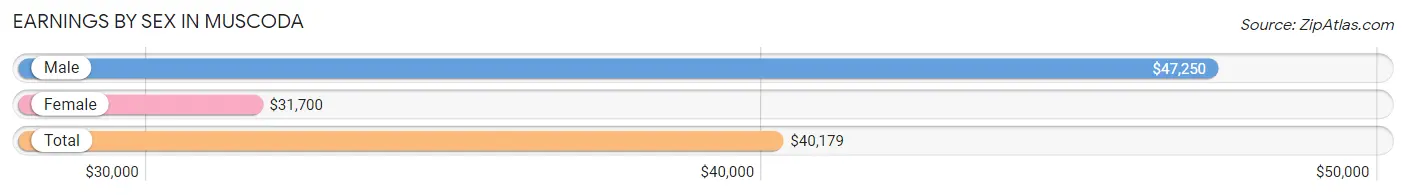
Earnings by Sex in Muscoda
Average Earnings in Muscoda are $40,179, $47,250 for men and $31,700 for women, a difference of 32.9%.
| Sex | Number | Average Earnings |
| Male | 379 (57.2%) | $47,250 |
| Female | 284 (42.8%) | $31,700 |
| Total | 663 (100.0%) | $40,179 |
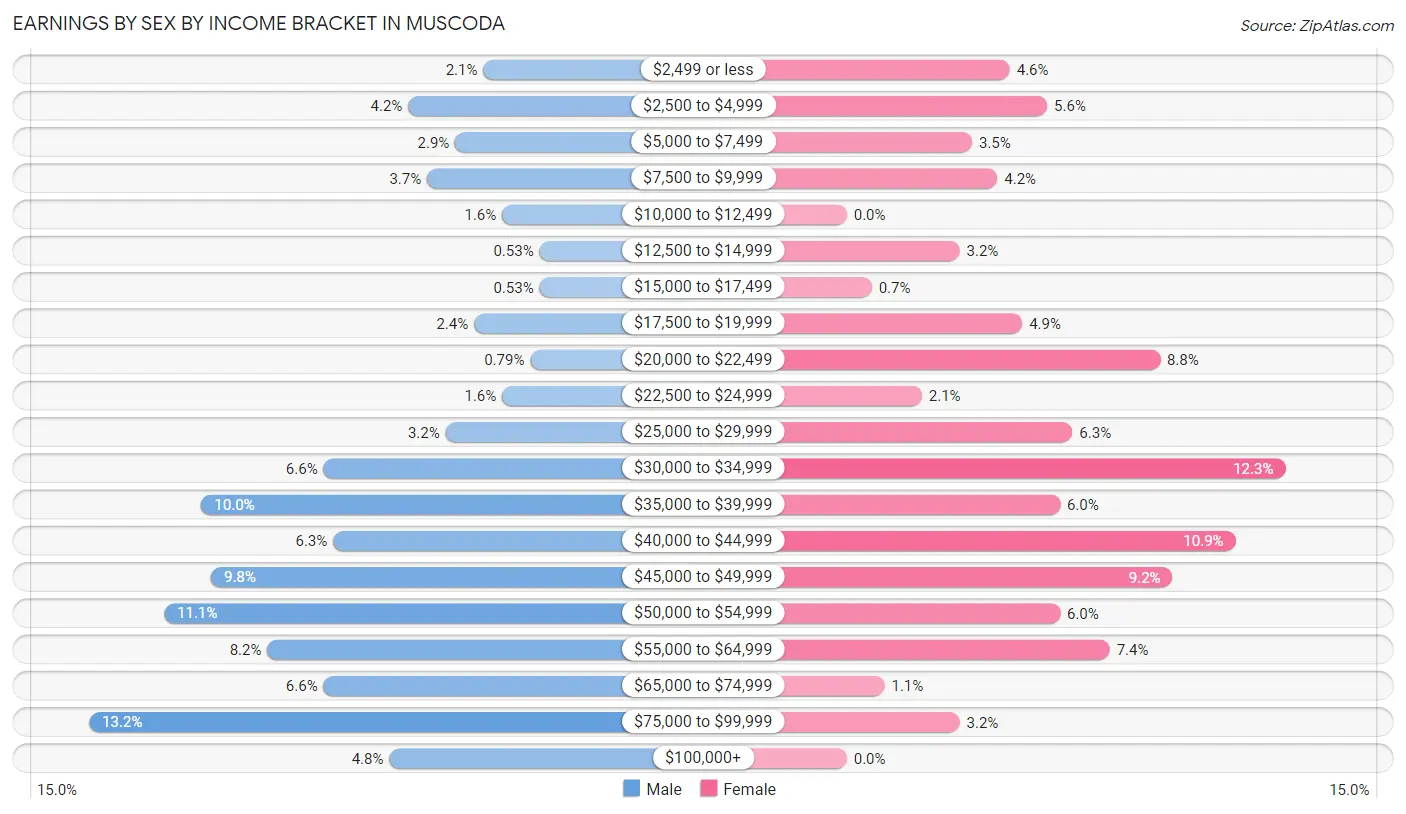
Earnings by Sex by Income Bracket in Muscoda
The most common earnings brackets in Muscoda are $75,000 to $99,999 for men (50 | 13.2%) and $30,000 to $34,999 for women (35 | 12.3%).
| Income | Male | Female |
| $2,499 or less | 8 (2.1%) | 13 (4.6%) |
| $2,500 to $4,999 | 16 (4.2%) | 16 (5.6%) |
| $5,000 to $7,499 | 11 (2.9%) | 10 (3.5%) |
| $7,500 to $9,999 | 14 (3.7%) | 12 (4.2%) |
| $10,000 to $12,499 | 6 (1.6%) | 0 (0.0%) |
| $12,500 to $14,999 | 2 (0.5%) | 9 (3.2%) |
| $15,000 to $17,499 | 2 (0.5%) | 2 (0.7%) |
| $17,500 to $19,999 | 9 (2.4%) | 14 (4.9%) |
| $20,000 to $22,499 | 3 (0.8%) | 25 (8.8%) |
| $22,500 to $24,999 | 6 (1.6%) | 6 (2.1%) |
| $25,000 to $29,999 | 12 (3.2%) | 18 (6.3%) |
| $30,000 to $34,999 | 25 (6.6%) | 35 (12.3%) |
| $35,000 to $39,999 | 38 (10.0%) | 17 (6.0%) |
| $40,000 to $44,999 | 24 (6.3%) | 31 (10.9%) |
| $45,000 to $49,999 | 37 (9.8%) | 26 (9.1%) |
| $50,000 to $54,999 | 42 (11.1%) | 17 (6.0%) |
| $55,000 to $64,999 | 31 (8.2%) | 21 (7.4%) |
| $65,000 to $74,999 | 25 (6.6%) | 3 (1.1%) |
| $75,000 to $99,999 | 50 (13.2%) | 9 (3.2%) |
| $100,000+ | 18 (4.8%) | 0 (0.0%) |
| Total | 379 (100.0%) | 284 (100.0%) |
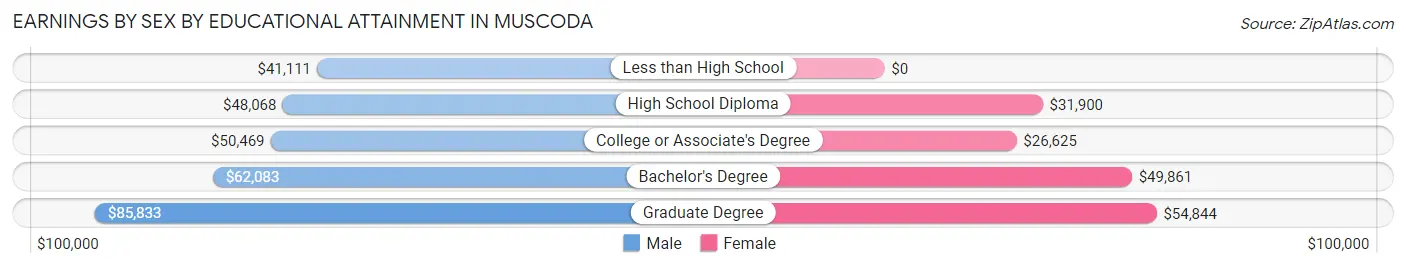
Earnings by Sex by Educational Attainment in Muscoda
Average earnings in Muscoda are $48,864 for men and $34,750 for women, a difference of 28.9%. Men with an educational attainment of graduate degree enjoy the highest average annual earnings of $85,833, while those with less than high school education earn the least with $41,111. Women with an educational attainment of graduate degree earn the most with the average annual earnings of $54,844, while those with college or associate's degree education have the smallest earnings of $26,625.
| Educational Attainment | Male Income | Female Income |
| Less than High School | $41,111 | $0 |
| High School Diploma | $48,068 | $31,900 |
| College or Associate's Degree | $50,469 | $26,625 |
| Bachelor's Degree | $62,083 | $49,861 |
| Graduate Degree | $85,833 | $54,844 |
| Total | $48,864 | $34,750 |
Family Income in Muscoda
Family Income Brackets in Muscoda
According to the Muscoda family income data, there are 79 families falling into the $50,000 to $74,999 income range, which is the most common income bracket and makes up 27.4% of all families.
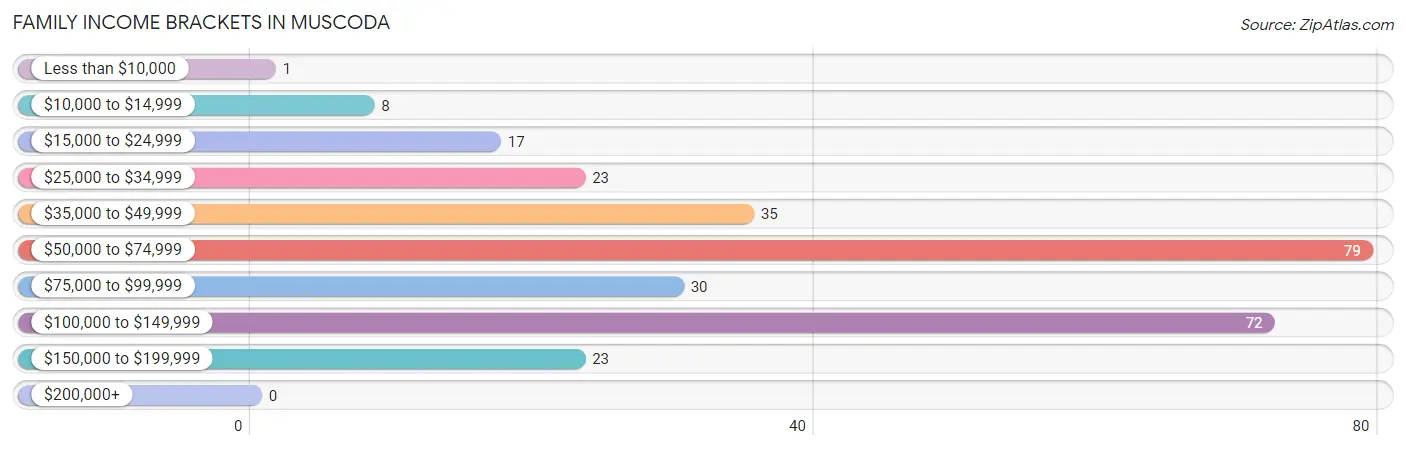
| Income Bracket | # Families | % Families |
| Less than $10,000 | 1 | 0.3% |
| $10,000 to $14,999 | 8 | 2.8% |
| $15,000 to $24,999 | 17 | 5.9% |
| $25,000 to $34,999 | 23 | 8.0% |
| $35,000 to $49,999 | 35 | 12.2% |
| $50,000 to $74,999 | 79 | 27.4% |
| $75,000 to $99,999 | 30 | 10.4% |
| $100,000 to $149,999 | 72 | 25.0% |
| $150,000 to $199,999 | 23 | 8.0% |
| $200,000+ | 0 | 0.0% |
Family Income by Famaliy Size in Muscoda
4-person families (48 | 16.7%) account for the highest median family income in Muscoda with $98,750 per family, while 2-person families (145 | 50.3%) have the highest median income of $29,952 per family member.
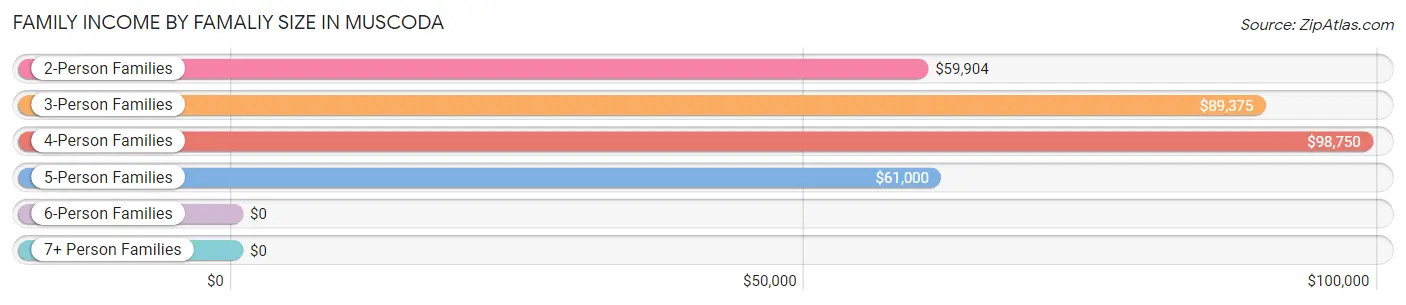
| Income Bracket | # Families | Median Income |
| 2-Person Families | 145 (50.3%) | $59,904 |
| 3-Person Families | 57 (19.8%) | $89,375 |
| 4-Person Families | 48 (16.7%) | $98,750 |
| 5-Person Families | 38 (13.2%) | $61,000 |
| 6-Person Families | 0 (0.0%) | $0 |
| 7+ Person Families | 0 (0.0%) | $0 |
| Total | 288 (100.0%) | $62,273 |
Family Income by Number of Earners in Muscoda
The median family income in Muscoda is $62,273, with families comprising 3+ earners (35) having the highest median family income of $130,938, while families with 1 earner (101) have the lowest median family income of $51,146, accounting for 12.1% and 35.1% of families, respectively.
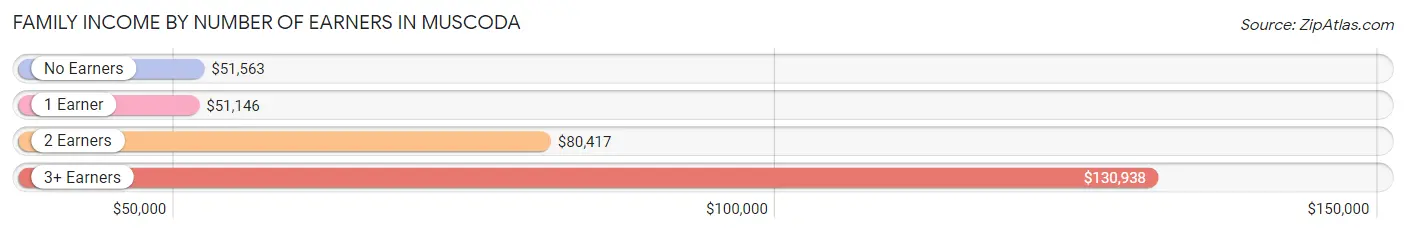
| Number of Earners | # Families | Median Income |
| No Earners | 19 (6.6%) | $51,563 |
| 1 Earner | 101 (35.1%) | $51,146 |
| 2 Earners | 133 (46.2%) | $80,417 |
| 3+ Earners | 35 (12.1%) | $130,938 |
| Total | 288 (100.0%) | $62,273 |
Household Income in Muscoda
Household Income Brackets in Muscoda
With 109 households falling in the category, the $50,000 to $74,999 income range is the most frequent in Muscoda, accounting for 20.6% of all households.
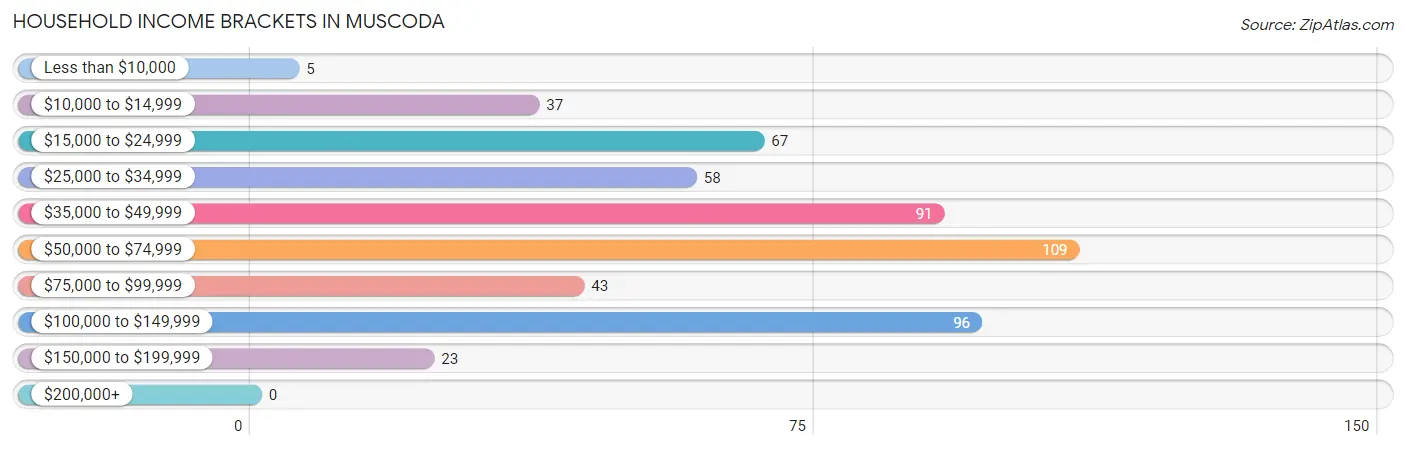
| Income Bracket | # Households | % Households |
| Less than $10,000 | 5 | 0.9% |
| $10,000 to $14,999 | 37 | 7.0% |
| $15,000 to $24,999 | 67 | 12.7% |
| $25,000 to $34,999 | 58 | 11.0% |
| $35,000 to $49,999 | 91 | 17.2% |
| $50,000 to $74,999 | 109 | 20.6% |
| $75,000 to $99,999 | 43 | 8.1% |
| $100,000 to $149,999 | 96 | 18.1% |
| $150,000 to $199,999 | 23 | 4.3% |
| $200,000+ | 0 | 0.0% |
Household Income by Householder Age in Muscoda
The median household income in Muscoda is $51,016, with the highest median household income of $83,750 found in the 25 to 44 years age bracket for the primary householder. A total of 193 households (36.5%) fall into this category. Meanwhile, the 65+ years age bracket for the primary householder has the lowest median household income of $24,250, with 120 households (22.7%) in this group.
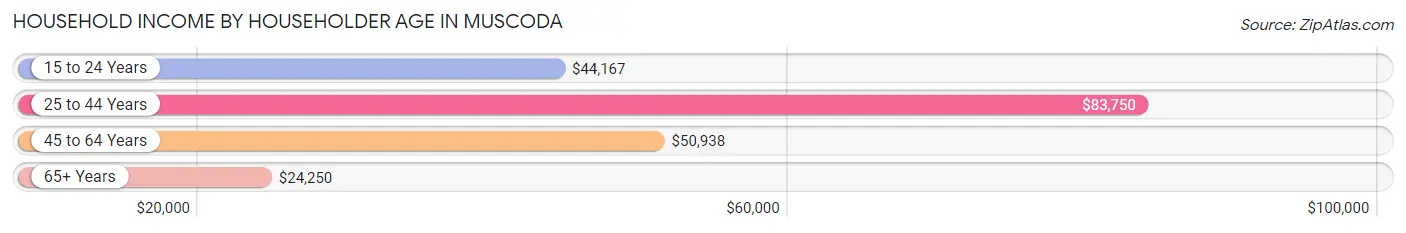
| Income Bracket | # Households | Median Income |
| 15 to 24 Years | 28 (5.3%) | $44,167 |
| 25 to 44 Years | 193 (36.5%) | $83,750 |
| 45 to 64 Years | 188 (35.5%) | $50,938 |
| 65+ Years | 120 (22.7%) | $24,250 |
| Total | 529 (100.0%) | $51,016 |
Poverty in Muscoda
Income Below Poverty by Sex and Age in Muscoda
With 10.4% poverty level for males and 13.1% for females among the residents of Muscoda, 5 year old males and under 5 year old females are the most vulnerable to poverty, with 2 males (100.0%) and 11 females (30.6%) in their respective age groups living below the poverty level.
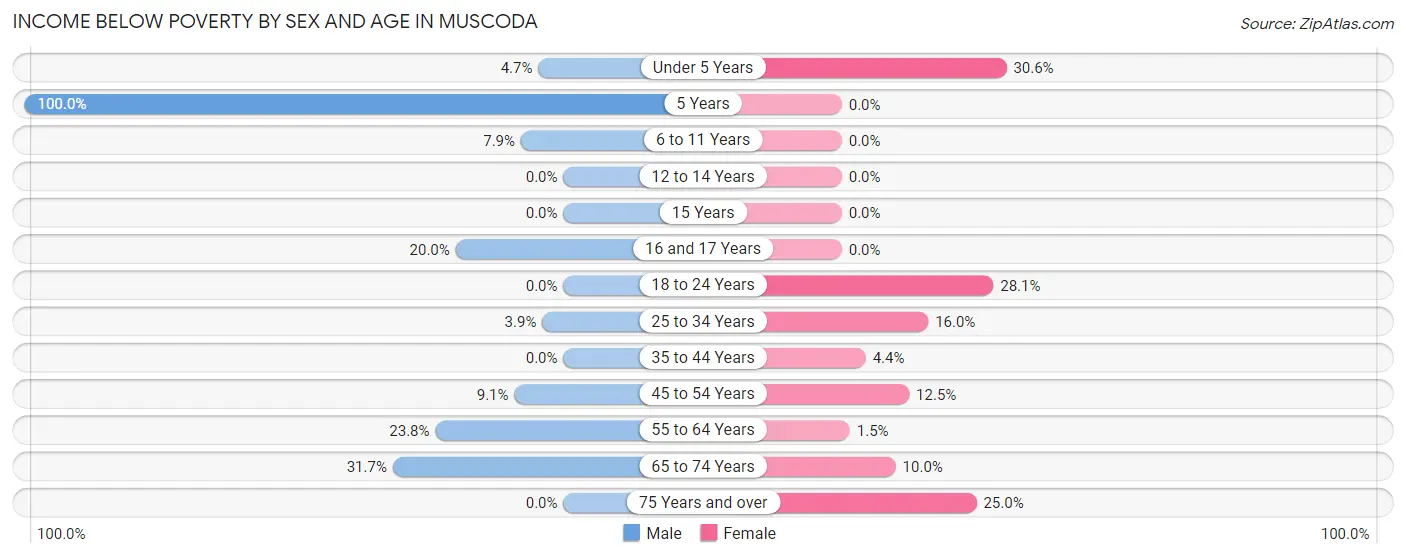
| Age Bracket | Male | Female |
| Under 5 Years | 2 (4.6%) | 11 (30.6%) |
| 5 Years | 2 (100.0%) | 0 (0.0%) |
| 6 to 11 Years | 3 (7.9%) | 0 (0.0%) |
| 12 to 14 Years | 0 (0.0%) | 0 (0.0%) |
| 15 Years | 0 (0.0%) | 0 (0.0%) |
| 16 and 17 Years | 2 (20.0%) | 0 (0.0%) |
| 18 to 24 Years | 0 (0.0%) | 18 (28.1%) |
| 25 to 34 Years | 4 (3.9%) | 17 (16.0%) |
| 35 to 44 Years | 0 (0.0%) | 2 (4.4%) |
| 45 to 54 Years | 6 (9.1%) | 6 (12.5%) |
| 55 to 64 Years | 24 (23.8%) | 1 (1.5%) |
| 65 to 74 Years | 19 (31.7%) | 5 (10.0%) |
| 75 Years and over | 0 (0.0%) | 12 (25.0%) |
| Total | 62 (10.4%) | 72 (13.1%) |
Income Above Poverty by Sex and Age in Muscoda
According to the poverty statistics in Muscoda, males aged 12 to 14 years and females aged 5 years are the age groups that are most secure financially, with 100.0% of males and 100.0% of females in these age groups living above the poverty line.
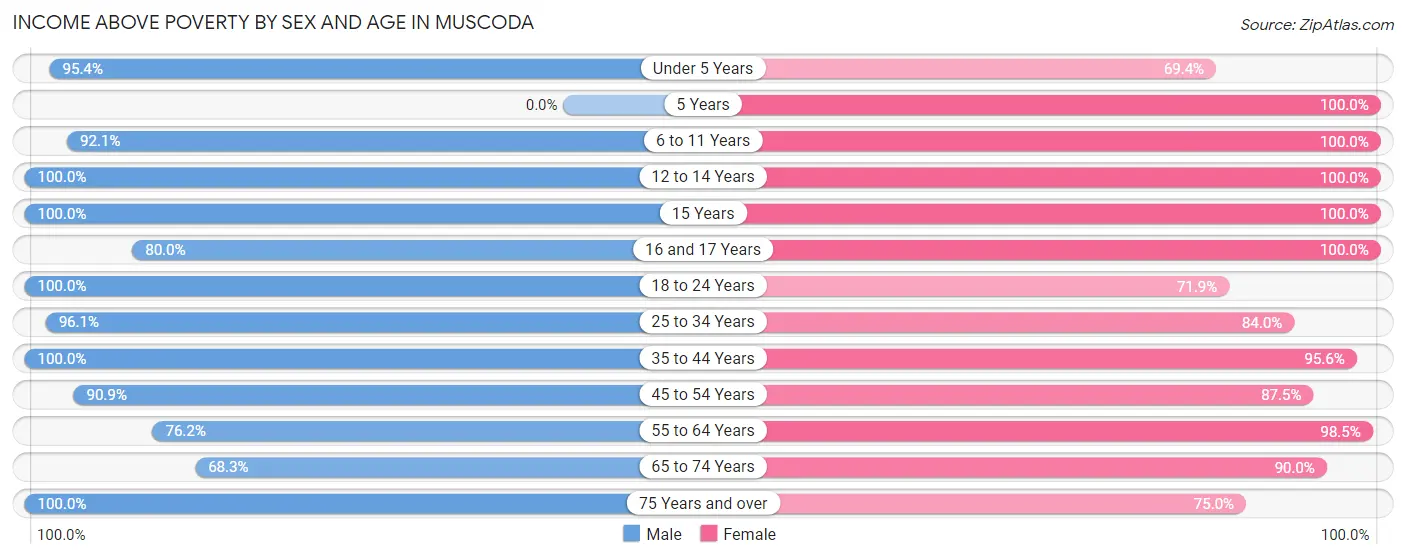
| Age Bracket | Male | Female |
| Under 5 Years | 41 (95.4%) | 25 (69.4%) |
| 5 Years | 0 (0.0%) | 2 (100.0%) |
| 6 to 11 Years | 35 (92.1%) | 41 (100.0%) |
| 12 to 14 Years | 15 (100.0%) | 19 (100.0%) |
| 15 Years | 2 (100.0%) | 2 (100.0%) |
| 16 and 17 Years | 8 (80.0%) | 20 (100.0%) |
| 18 to 24 Years | 58 (100.0%) | 46 (71.9%) |
| 25 to 34 Years | 98 (96.1%) | 89 (84.0%) |
| 35 to 44 Years | 87 (100.0%) | 43 (95.6%) |
| 45 to 54 Years | 60 (90.9%) | 42 (87.5%) |
| 55 to 64 Years | 77 (76.2%) | 66 (98.5%) |
| 65 to 74 Years | 41 (68.3%) | 45 (90.0%) |
| 75 Years and over | 13 (100.0%) | 36 (75.0%) |
| Total | 535 (89.6%) | 476 (86.9%) |
Income Below Poverty Among Married-Couple Families in Muscoda
The poverty statistics for married-couple families in Muscoda show that 5.9% or 12 of the total 204 families live below the poverty line. Families with 3 or 4 children have the highest poverty rate of 50.0%, comprising of 9 families. On the other hand, families with 1 or 2 children have the lowest poverty rate of 0.0%, which includes 0 families.
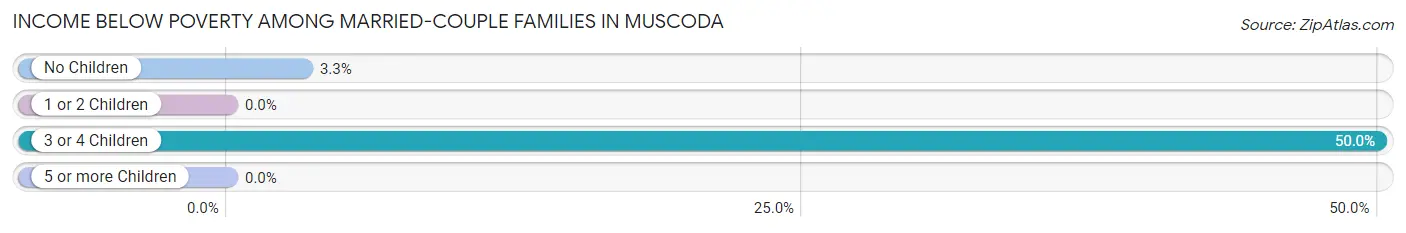
| Children | Above Poverty | Below Poverty |
| No Children | 89 (96.7%) | 3 (3.3%) |
| 1 or 2 Children | 94 (100.0%) | 0 (0.0%) |
| 3 or 4 Children | 9 (50.0%) | 9 (50.0%) |
| 5 or more Children | 0 (0.0%) | 0 (0.0%) |
| Total | 192 (94.1%) | 12 (5.9%) |
Income Below Poverty Among Single-Parent Households in Muscoda
According to the poverty data in Muscoda, 10.7% or 3 single-father households and 16.1% or 9 single-mother households are living below the poverty line. Among single-father households, those with no children have the highest poverty rate, with 3 households (50.0%) experiencing poverty. Likewise, among single-mother households, those with 1 or 2 children have the highest poverty rate, with 8 households (21.0%) falling below the poverty line.
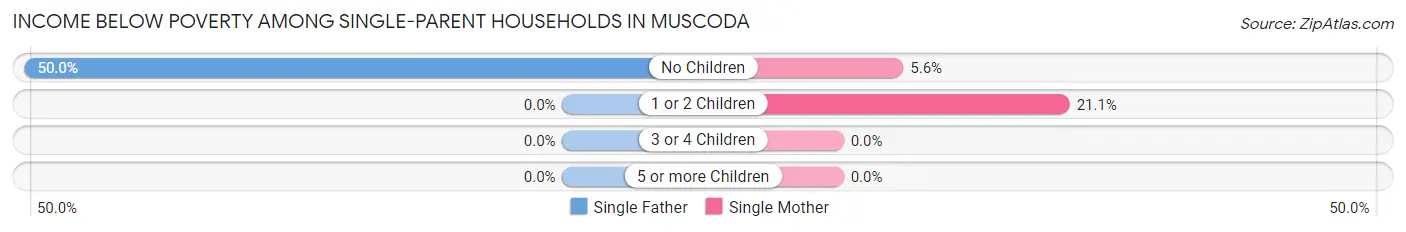
| Children | Single Father | Single Mother |
| No Children | 3 (50.0%) | 1 (5.6%) |
| 1 or 2 Children | 0 (0.0%) | 8 (21.0%) |
| 3 or 4 Children | 0 (0.0%) | 0 (0.0%) |
| 5 or more Children | 0 (0.0%) | 0 (0.0%) |
| Total | 3 (10.7%) | 9 (16.1%) |
Income Below Poverty Among Married-Couple vs Single-Parent Households in Muscoda
The poverty data for Muscoda shows that 12 of the married-couple family households (5.9%) and 12 of the single-parent households (14.3%) are living below the poverty level. Within the married-couple family households, those with 3 or 4 children have the highest poverty rate, with 9 households (50.0%) falling below the poverty line. Among the single-parent households, those with no children have the highest poverty rate, with 4 household (16.7%) living below poverty.
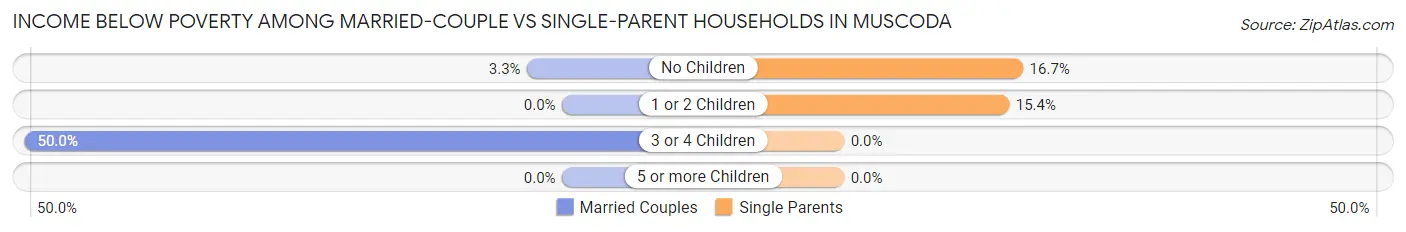
| Children | Married-Couple Families | Single-Parent Households |
| No Children | 3 (3.3%) | 4 (16.7%) |
| 1 or 2 Children | 0 (0.0%) | 8 (15.4%) |
| 3 or 4 Children | 9 (50.0%) | 0 (0.0%) |
| 5 or more Children | 0 (0.0%) | 0 (0.0%) |
| Total | 12 (5.9%) | 12 (14.3%) |
Race in Muscoda
The most populous races in Muscoda are White / Caucasian (1,180 | 98.8%), Two or more Races (10 | 0.8%), and Black / African American (4 | 0.3%).
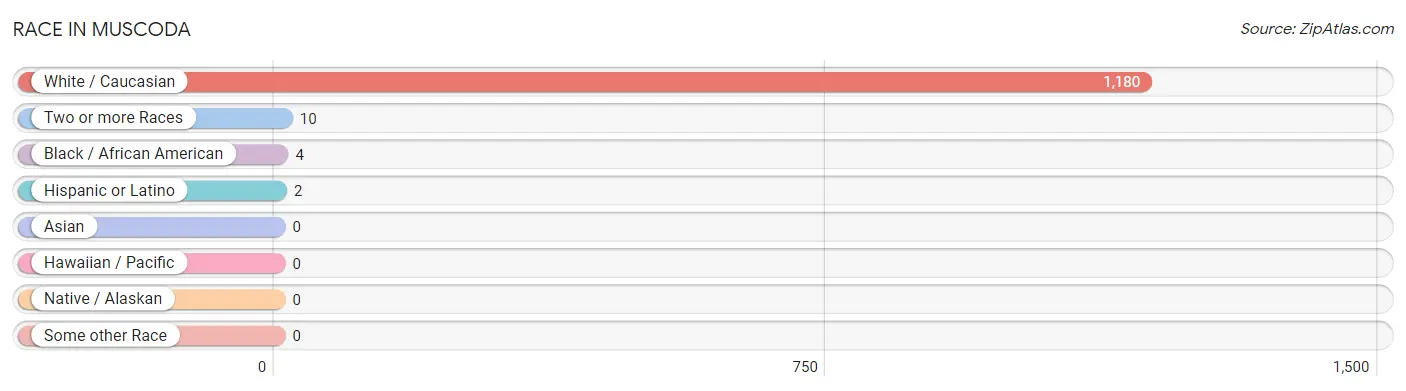
| Race | # Population | % Population |
| Asian | 0 | 0.0% |
| Black / African American | 4 | 0.3% |
| Hawaiian / Pacific | 0 | 0.0% |
| Hispanic or Latino | 2 | 0.2% |
| Native / Alaskan | 0 | 0.0% |
| White / Caucasian | 1,180 | 98.8% |
| Two or more Races | 10 | 0.8% |
| Some other Race | 0 | 0.0% |
| Total | 1,194 | 100.0% |
Ancestry in Muscoda
The most populous ancestries reported in Muscoda are German (382 | 32.0%), Irish (247 | 20.7%), Norwegian (119 | 10.0%), English (88 | 7.4%), and Czech (81 | 6.8%), together accounting for 76.8% of all Muscoda residents.
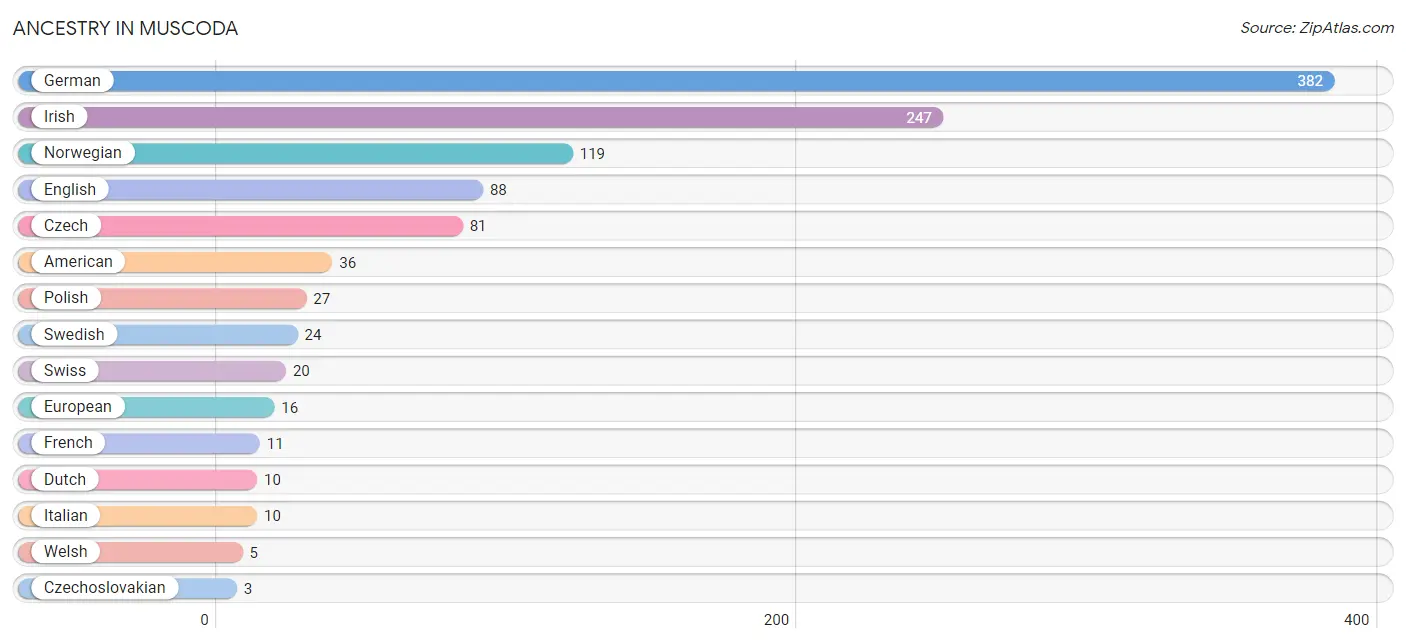
| Ancestry | # Population | % Population |
| American | 36 | 3.0% |
| Czech | 81 | 6.8% |
| Czechoslovakian | 3 | 0.3% |
| Dutch | 10 | 0.8% |
| English | 88 | 7.4% |
| European | 16 | 1.3% |
| French | 11 | 0.9% |
| German | 382 | 32.0% |
| Hungarian | 3 | 0.3% |
| Irish | 247 | 20.7% |
| Italian | 10 | 0.8% |
| Mexican | 2 | 0.2% |
| Norwegian | 119 | 10.0% |
| Polish | 27 | 2.3% |
| Scottish | 3 | 0.3% |
| Swedish | 24 | 2.0% |
| Swiss | 20 | 1.7% |
| Welsh | 5 | 0.4% | View All 18 Rows |
Immigrants in Muscoda
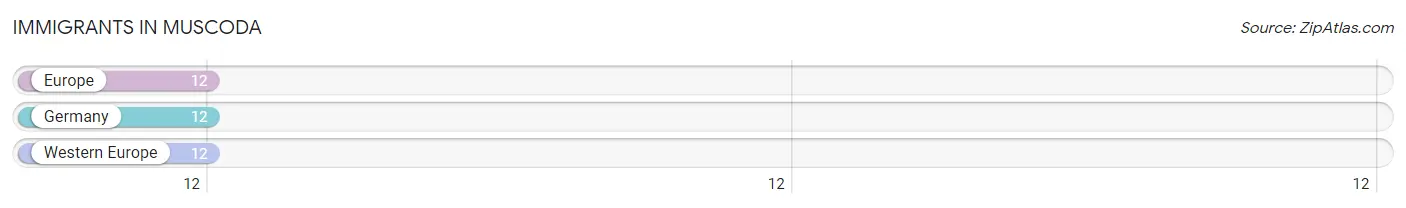
The most numerous immigrant groups reported in Muscoda came from Europe (12 | 1.0%), Germany (12 | 1.0%), and Western Europe (12 | 1.0%), together accounting for 3.0% of all Muscoda residents.
| Immigration Origin | # Population | % Population |
| Europe | 12 | 1.0% |
| Germany | 12 | 1.0% |
| Western Europe | 12 | 1.0% | View All 3 Rows |
Sex and Age in Muscoda
Sex and Age in Muscoda
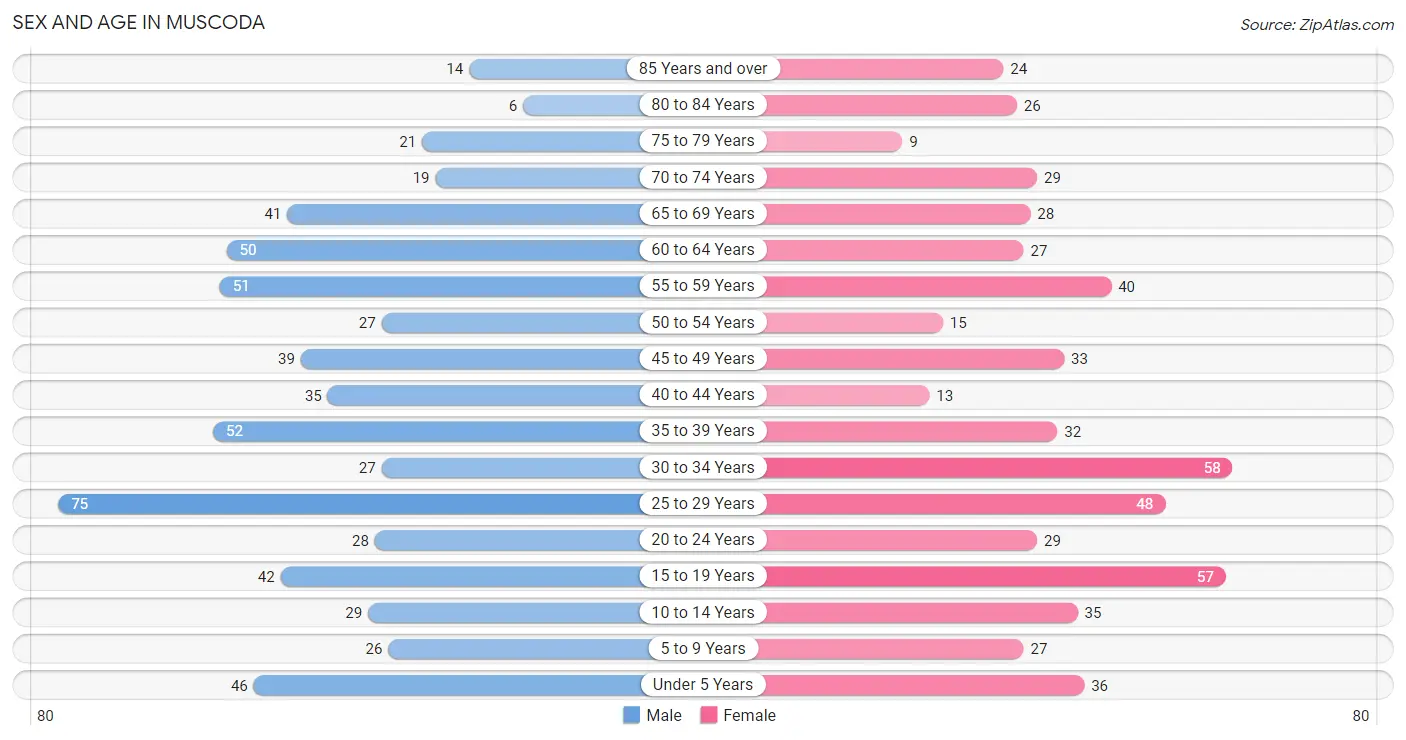
The most populous age groups in Muscoda are 25 to 29 Years (75 | 11.9%) for men and 30 to 34 Years (58 | 10.2%) for women.
| Age Bracket | Male | Female |
| Under 5 Years | 46 (7.3%) | 36 (6.4%) |
| 5 to 9 Years | 26 (4.1%) | 27 (4.8%) |
| 10 to 14 Years | 29 (4.6%) | 35 (6.2%) |
| 15 to 19 Years | 42 (6.7%) | 57 (10.1%) |
| 20 to 24 Years | 28 (4.5%) | 29 (5.1%) |
| 25 to 29 Years | 75 (11.9%) | 48 (8.5%) |
| 30 to 34 Years | 27 (4.3%) | 58 (10.2%) |
| 35 to 39 Years | 52 (8.3%) | 32 (5.7%) |
| 40 to 44 Years | 35 (5.6%) | 13 (2.3%) |
| 45 to 49 Years | 39 (6.2%) | 33 (5.8%) |
| 50 to 54 Years | 27 (4.3%) | 15 (2.6%) |
| 55 to 59 Years | 51 (8.1%) | 40 (7.1%) |
| 60 to 64 Years | 50 (8.0%) | 27 (4.8%) |
| 65 to 69 Years | 41 (6.5%) | 28 (5.0%) |
| 70 to 74 Years | 19 (3.0%) | 29 (5.1%) |
| 75 to 79 Years | 21 (3.3%) | 9 (1.6%) |
| 80 to 84 Years | 6 (1.0%) | 26 (4.6%) |
| 85 Years and over | 14 (2.2%) | 24 (4.2%) |
| Total | 628 (100.0%) | 566 (100.0%) |
Families and Households in Muscoda
Median Family Size in Muscoda
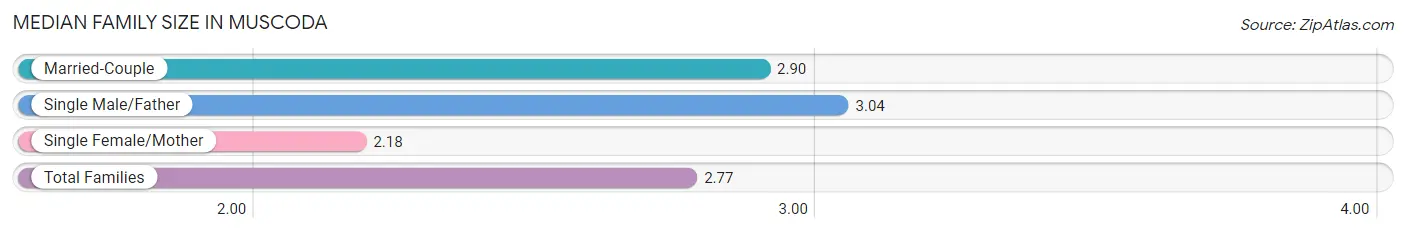
The median family size in Muscoda is 2.77 persons per family, with single male/father families (28 | 9.7%) accounting for the largest median family size of 3.04 persons per family. On the other hand, single female/mother families (56 | 19.4%) represent the smallest median family size with 2.18 persons per family.
| Family Type | # Families | Family Size |
| Married-Couple | 204 (70.8%) | 2.90 |
| Single Male/Father | 28 (9.7%) | 3.04 |
| Single Female/Mother | 56 (19.4%) | 2.18 |
| Total Families | 288 (100.0%) | 2.77 |
Median Household Size in Muscoda
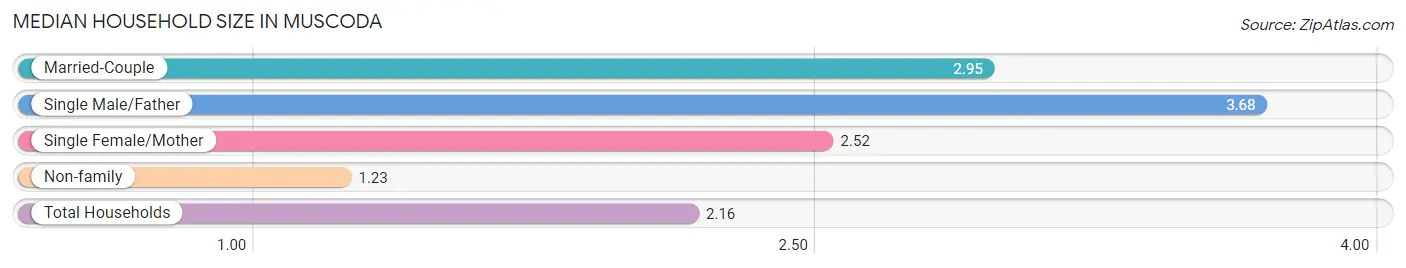
The median household size in Muscoda is 2.16 persons per household, with single male/father households (28 | 5.3%) accounting for the largest median household size of 3.68 persons per household. non-family households (241 | 45.6%) represent the smallest median household size with 1.23 persons per household.
| Household Type | # Households | Household Size |
| Married-Couple | 204 (38.6%) | 2.95 |
| Single Male/Father | 28 (5.3%) | 3.68 |
| Single Female/Mother | 56 (10.6%) | 2.52 |
| Non-family | 241 (45.6%) | 1.23 |
| Total Households | 529 (100.0%) | 2.16 |
Household Size by Marriage Status in Muscoda
Out of a total of 529 households in Muscoda, 288 (54.4%) are family households, while 241 (45.6%) are nonfamily households. The most numerous type of family households are 2-person households, comprising 127, and the most common type of nonfamily households are 1-person households, comprising 203.
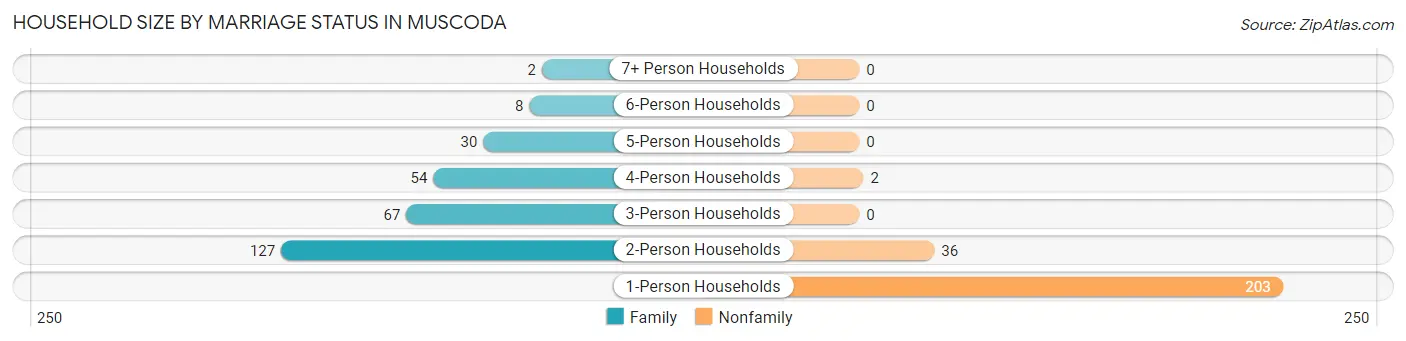
| Household Size | Family Households | Nonfamily Households |
| 1-Person Households | - | 203 (38.4%) |
| 2-Person Households | 127 (24.0%) | 36 (6.8%) |
| 3-Person Households | 67 (12.7%) | 0 (0.0%) |
| 4-Person Households | 54 (10.2%) | 2 (0.4%) |
| 5-Person Households | 30 (5.7%) | 0 (0.0%) |
| 6-Person Households | 8 (1.5%) | 0 (0.0%) |
| 7+ Person Households | 2 (0.4%) | 0 (0.0%) |
| Total | 288 (54.4%) | 241 (45.6%) |
Female Fertility in Muscoda
Fertility by Age in Muscoda
Average fertility rate in Muscoda is 95.0 births per 1,000 women. Women in the age bracket of 20 to 34 years have the highest fertility rate with 193.0 births per 1,000 women. Women in the age bracket of 20 to 34 years acount for 100.0% of all women with births.
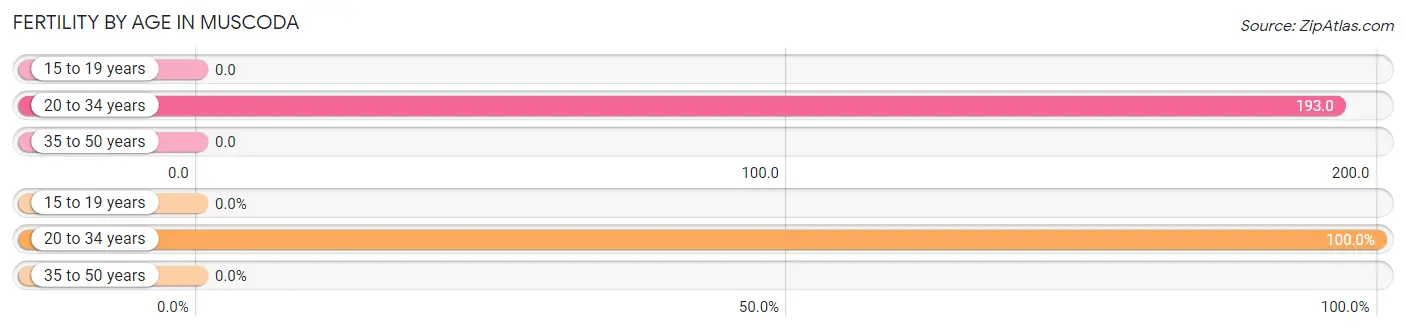
| Age Bracket | Women with Births | Births / 1,000 Women |
| 15 to 19 years | 0 (0.0%) | 0.0 |
| 20 to 34 years | 26 (100.0%) | 193.0 |
| 35 to 50 years | 0 (0.0%) | 0.0 |
| Total | 26 (100.0%) | 95.0 |
Fertility by Age by Marriage Status in Muscoda
65.4% of women with births (26) in Muscoda are married. The highest percentage of unmarried women with births falls into 20 to 34 years age bracket with 34.6% of them unmarried at the time of birth, while the lowest percentage of unmarried women with births belong to 20 to 34 years age bracket with 34.6% of them unmarried.
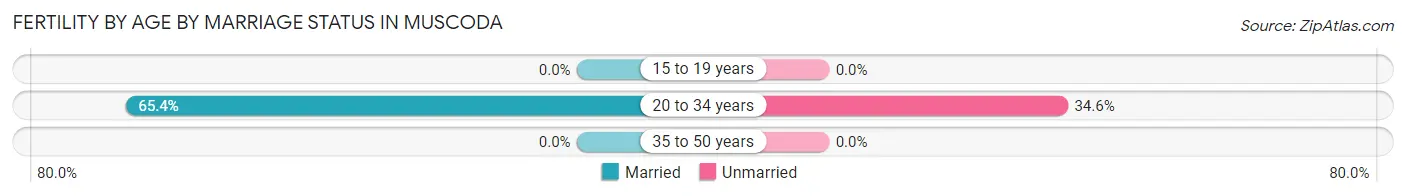
| Age Bracket | Married | Unmarried |
| 15 to 19 years | 0 (0.0%) | 0 (0.0%) |
| 20 to 34 years | 17 (65.4%) | 9 (34.6%) |
| 35 to 50 years | 0 (0.0%) | 0 (0.0%) |
| Total | 17 (65.4%) | 9 (34.6%) |
Fertility by Education in Muscoda
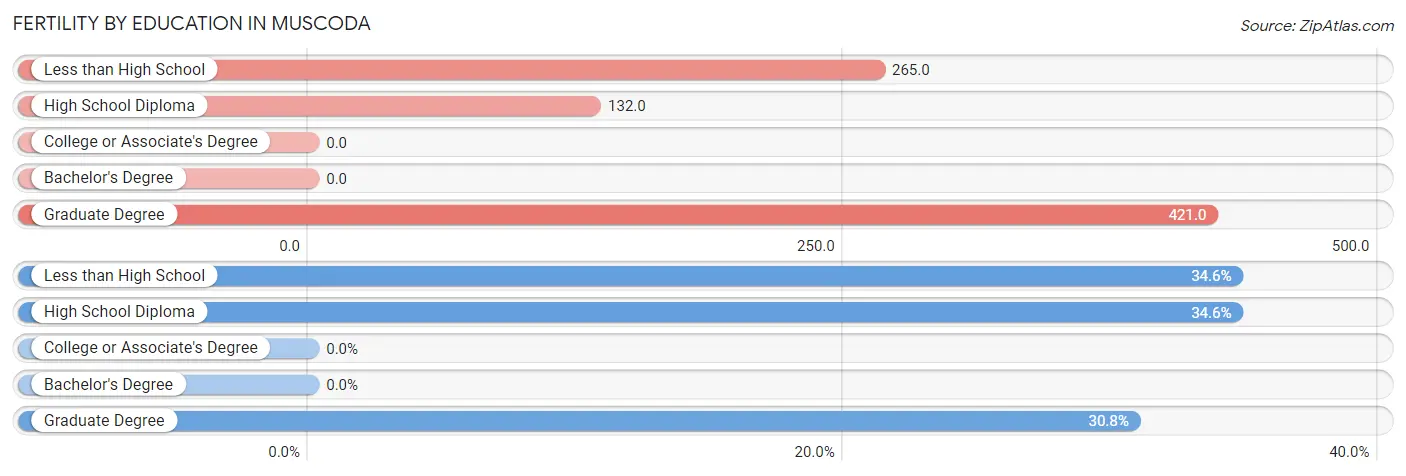
| Educational Attainment | Women with Births | Births / 1,000 Women |
| Less than High School | 9 (34.6%) | 265.0 |
| High School Diploma | 9 (34.6%) | 132.0 |
| College or Associate's Degree | 0 (0.0%) | 0.0 |
| Bachelor's Degree | 0 (0.0%) | 0.0 |
| Graduate Degree | 8 (30.8%) | 421.0 |
| Total | 26 (100.0%) | 95.0 |
Fertility by Education by Marriage Status in Muscoda
34.6% of women with births in Muscoda are unmarried. Women with the educational attainment of less than high school are most likely to be married with 100.0% of them married at childbirth, while women with the educational attainment of high school diploma are least likely to be married with 100.0% of them unmarried at childbirth.
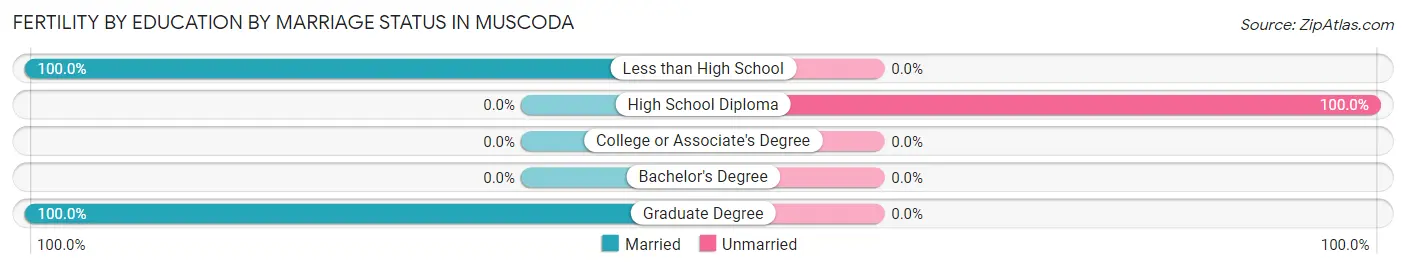
| Educational Attainment | Married | Unmarried |
| Less than High School | 9 (100.0%) | 0 (0.0%) |
| High School Diploma | 0 (0.0%) | 9 (100.0%) |
| College or Associate's Degree | 0 (0.0%) | 0 (0.0%) |
| Bachelor's Degree | 0 (0.0%) | 0 (0.0%) |
| Graduate Degree | 8 (100.0%) | 0 (0.0%) |
| Total | 17 (65.4%) | 9 (34.6%) |
Employment Characteristics in Muscoda
Employment by Class of Employer in Muscoda
Among the 599 employed individuals in Muscoda, private company employees (402 | 67.1%), self-employed (not incorporated) (53 | 8.8%), and local government employees (47 | 7.9%) make up the most common classes of employment.
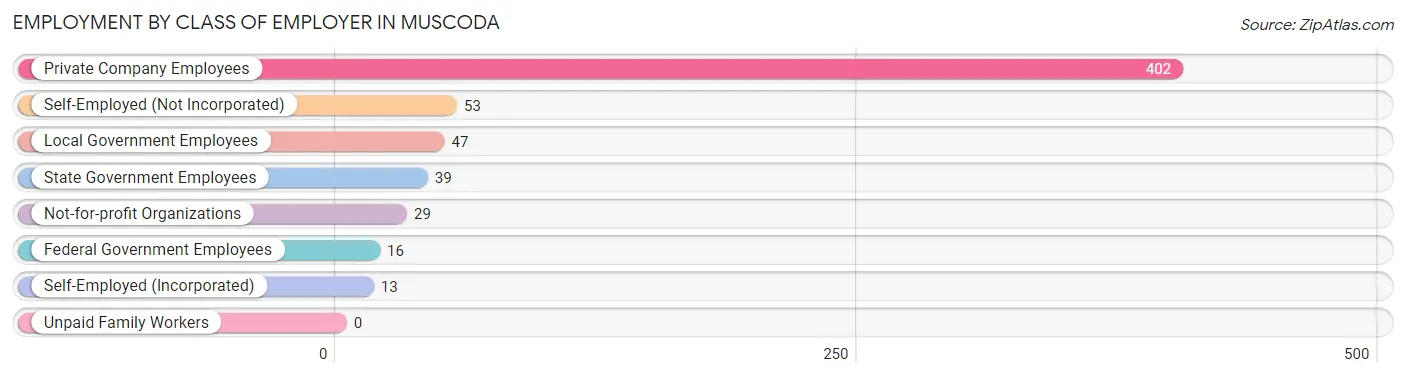
| Employer Class | # Employees | % Employees |
| Private Company Employees | 402 | 67.1% |
| Self-Employed (Incorporated) | 13 | 2.2% |
| Self-Employed (Not Incorporated) | 53 | 8.8% |
| Not-for-profit Organizations | 29 | 4.8% |
| Local Government Employees | 47 | 7.9% |
| State Government Employees | 39 | 6.5% |
| Federal Government Employees | 16 | 2.7% |
| Unpaid Family Workers | 0 | 0.0% |
| Total | 599 | 100.0% |
Employment Status by Age in Muscoda
According to the labor force statistics for Muscoda, out of the total population over 16 years of age (991), 64.3% or 637 individuals are in the labor force, with 5.7% or 36 of them unemployed. The age group with the highest labor force participation rate is 30 to 34 years, with 100.0% or 85 individuals in the labor force. Within the labor force, the 16 to 19 years age range has the highest percentage of unemployed individuals, with 34.3% or 12 of them being unemployed.
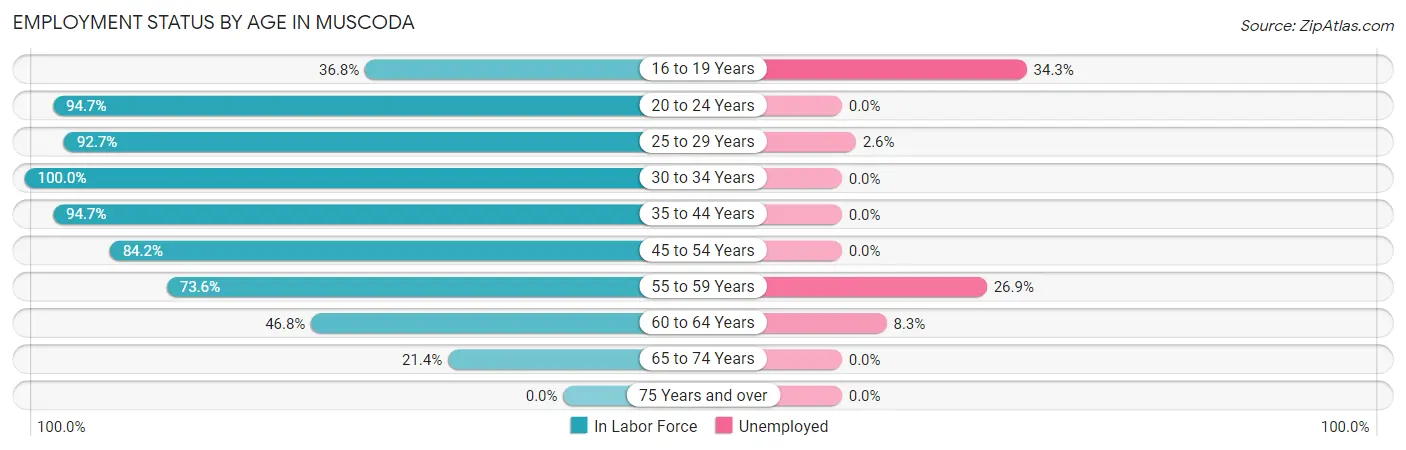
| Age Bracket | In Labor Force | Unemployed |
| 16 to 19 Years | 35 (36.8%) | 12 (34.3%) |
| 20 to 24 Years | 54 (94.7%) | 0 (0.0%) |
| 25 to 29 Years | 114 (92.7%) | 3 (2.6%) |
| 30 to 34 Years | 85 (100.0%) | 0 (0.0%) |
| 35 to 44 Years | 125 (94.7%) | 0 (0.0%) |
| 45 to 54 Years | 96 (84.2%) | 0 (0.0%) |
| 55 to 59 Years | 67 (73.6%) | 18 (26.9%) |
| 60 to 64 Years | 36 (46.8%) | 3 (8.3%) |
| 65 to 74 Years | 25 (21.4%) | 0 (0.0%) |
| 75 Years and over | 0 (0.0%) | 0 (0.0%) |
| Total | 637 (64.3%) | 36 (5.7%) |
Employment Status by Educational Attainment in Muscoda
According to labor force statistics for Muscoda, 84.1% of individuals (523) out of the total population between 25 and 64 years of age (622) are in the labor force, with 4.6% or 24 of them being unemployed. The group with the highest labor force participation rate are those with the educational attainment of bachelor's degree or higher, with 99.0% or 99 individuals in the labor force. Within the labor force, individuals with less than high school education have the highest percentage of unemployment, with 60.0% or 9 of them being unemployed.
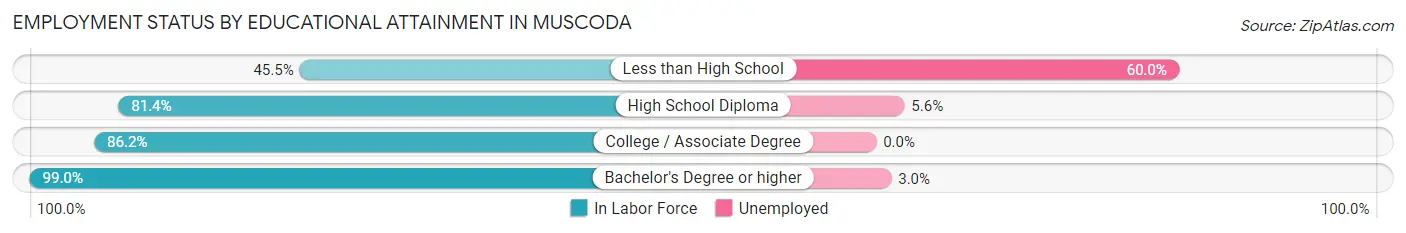
| Educational Attainment | In Labor Force | Unemployed |
| Less than High School | 15 (45.5%) | 20 (60.0%) |
| High School Diploma | 215 (81.4%) | 15 (5.6%) |
| College / Associate Degree | 194 (86.2%) | 0 (0.0%) |
| Bachelor's Degree or higher | 99 (99.0%) | 3 (3.0%) |
| Total | 523 (84.1%) | 29 (4.6%) |
Employment Occupations by Sex in Muscoda
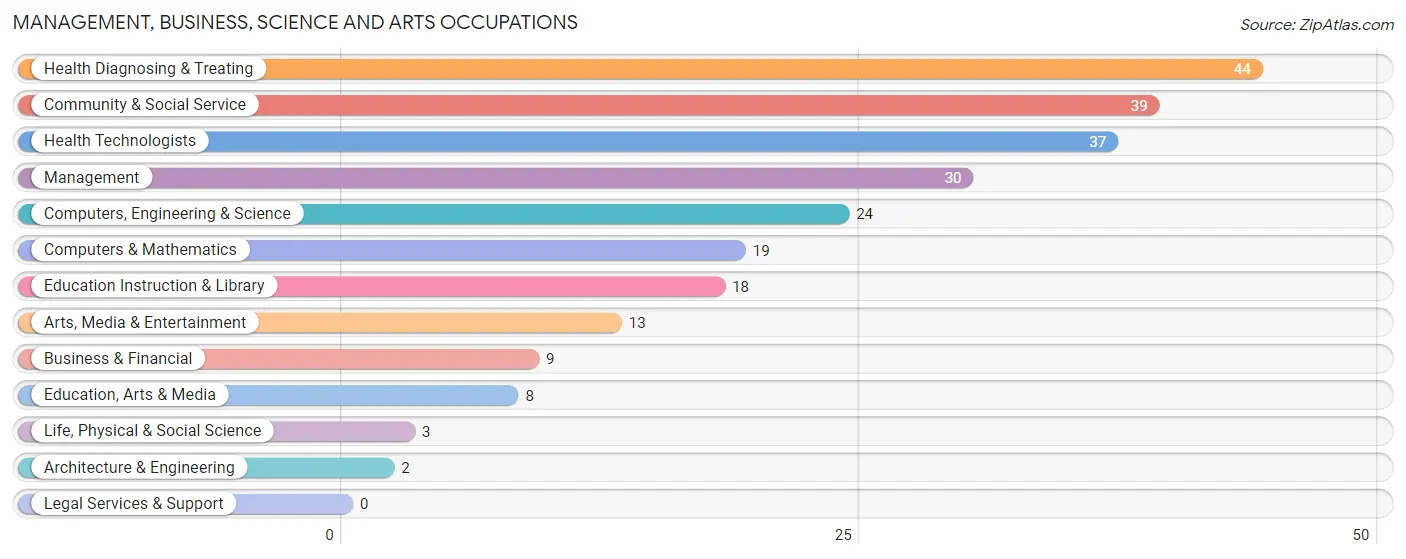
Management, Business, Science and Arts Occupations
The most common Management, Business, Science and Arts occupations in Muscoda are Health Diagnosing & Treating (44 | 7.3%), Community & Social Service (39 | 6.5%), Health Technologists (37 | 6.2%), Management (30 | 5.0%), and Computers, Engineering & Science (24 | 4.0%).
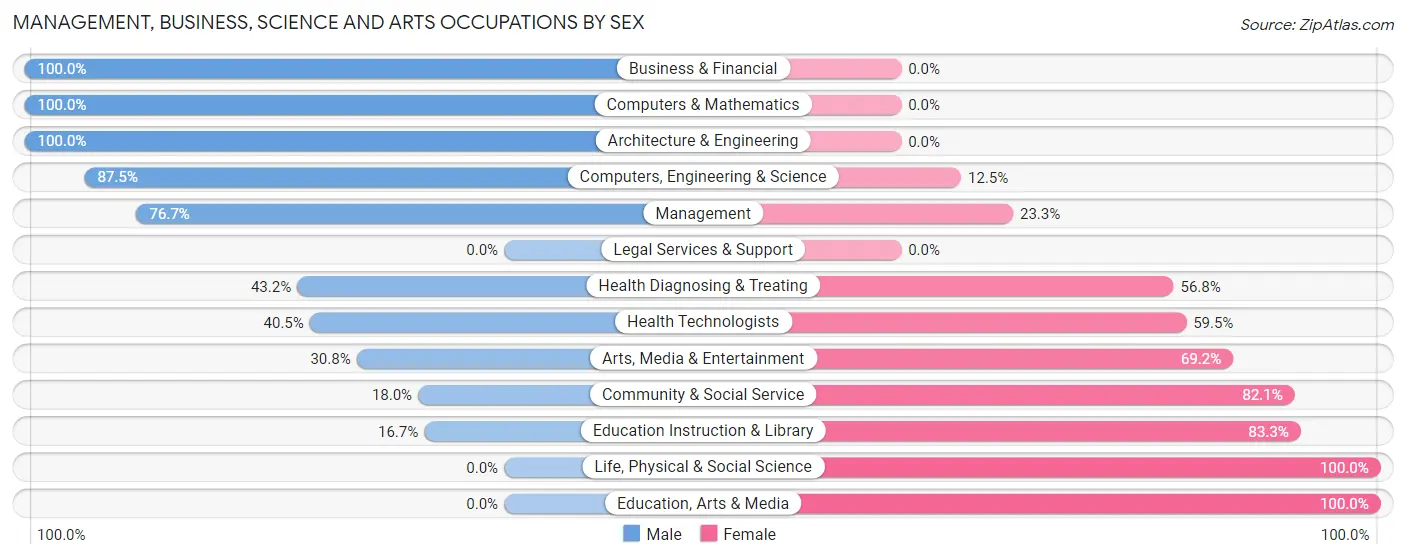
Management, Business, Science and Arts Occupations by Sex
Within the Management, Business, Science and Arts occupations in Muscoda, the most male-oriented occupations are Business & Financial (100.0%), Computers & Mathematics (100.0%), and Architecture & Engineering (100.0%), while the most female-oriented occupations are Life, Physical & Social Science (100.0%), Education, Arts & Media (100.0%), and Education Instruction & Library (83.3%).
| Occupation | Male | Female |
| Management | 23 (76.7%) | 7 (23.3%) |
| Business & Financial | 9 (100.0%) | 0 (0.0%) |
| Computers, Engineering & Science | 21 (87.5%) | 3 (12.5%) |
| Computers & Mathematics | 19 (100.0%) | 0 (0.0%) |
| Architecture & Engineering | 2 (100.0%) | 0 (0.0%) |
| Life, Physical & Social Science | 0 (0.0%) | 3 (100.0%) |
| Community & Social Service | 7 (17.9%) | 32 (82.1%) |
| Education, Arts & Media | 0 (0.0%) | 8 (100.0%) |
| Legal Services & Support | 0 (0.0%) | 0 (0.0%) |
| Education Instruction & Library | 3 (16.7%) | 15 (83.3%) |
| Arts, Media & Entertainment | 4 (30.8%) | 9 (69.2%) |
| Health Diagnosing & Treating | 19 (43.2%) | 25 (56.8%) |
| Health Technologists | 15 (40.5%) | 22 (59.5%) |
| Total (Category) | 79 (54.1%) | 67 (45.9%) |
| Total (Overall) | 344 (57.2%) | 257 (42.8%) |
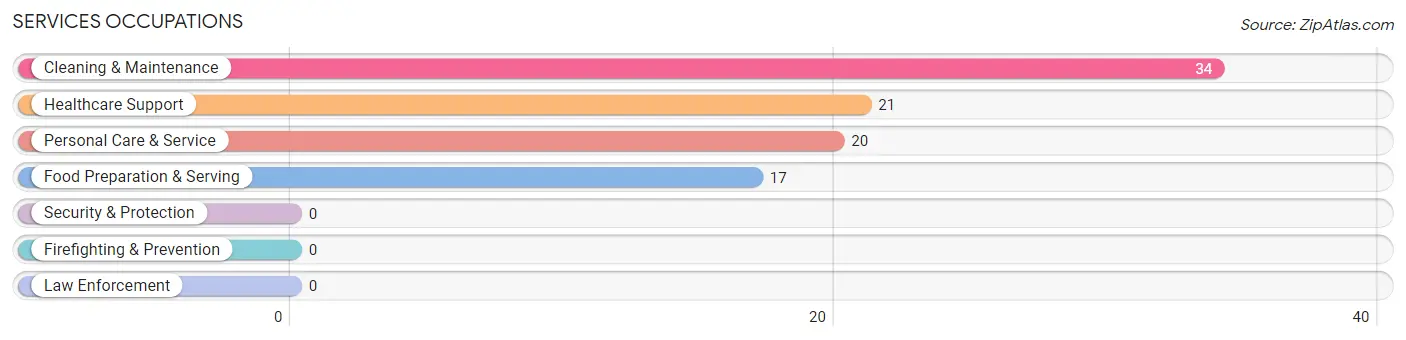
Services Occupations
The most common Services occupations in Muscoda are Cleaning & Maintenance (34 | 5.7%), Healthcare Support (21 | 3.5%), Personal Care & Service (20 | 3.3%), and Food Preparation & Serving (17 | 2.8%).
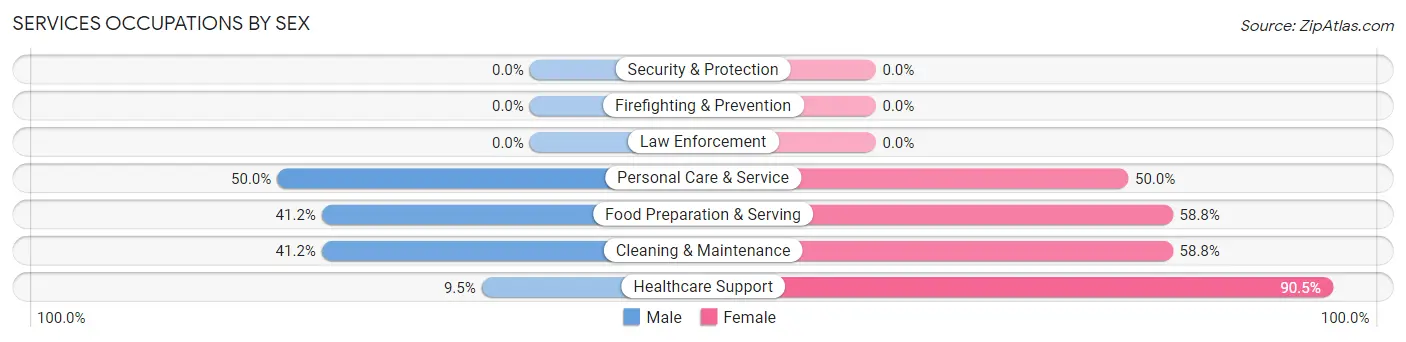
Services Occupations by Sex
Within the Services occupations in Muscoda, the most male-oriented occupations are Personal Care & Service (50.0%), Food Preparation & Serving (41.2%), and Cleaning & Maintenance (41.2%), while the most female-oriented occupations are Healthcare Support (90.5%), Food Preparation & Serving (58.8%), and Cleaning & Maintenance (58.8%).
| Occupation | Male | Female |
| Healthcare Support | 2 (9.5%) | 19 (90.5%) |
| Security & Protection | 0 (0.0%) | 0 (0.0%) |
| Firefighting & Prevention | 0 (0.0%) | 0 (0.0%) |
| Law Enforcement | 0 (0.0%) | 0 (0.0%) |
| Food Preparation & Serving | 7 (41.2%) | 10 (58.8%) |
| Cleaning & Maintenance | 14 (41.2%) | 20 (58.8%) |
| Personal Care & Service | 10 (50.0%) | 10 (50.0%) |
| Total (Category) | 33 (35.9%) | 59 (64.1%) |
| Total (Overall) | 344 (57.2%) | 257 (42.8%) |
Sales and Office Occupations
The most common Sales and Office occupations in Muscoda are Sales & Related (71 | 11.8%), and Office & Administration (31 | 5.2%).

Sales and Office Occupations by Sex

| Occupation | Male | Female |
| Sales & Related | 23 (32.4%) | 48 (67.6%) |
| Office & Administration | 6 (19.4%) | 25 (80.6%) |
| Total (Category) | 29 (28.4%) | 73 (71.6%) |
| Total (Overall) | 344 (57.2%) | 257 (42.8%) |
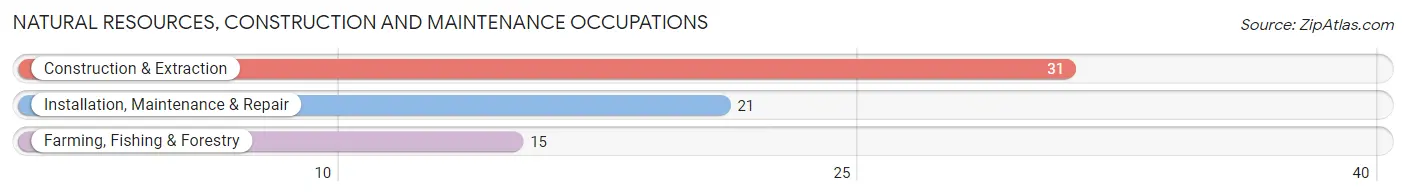
Natural Resources, Construction and Maintenance Occupations
The most common Natural Resources, Construction and Maintenance occupations in Muscoda are Construction & Extraction (31 | 5.2%), Installation, Maintenance & Repair (21 | 3.5%), and Farming, Fishing & Forestry (15 | 2.5%).
Natural Resources, Construction and Maintenance Occupations by Sex
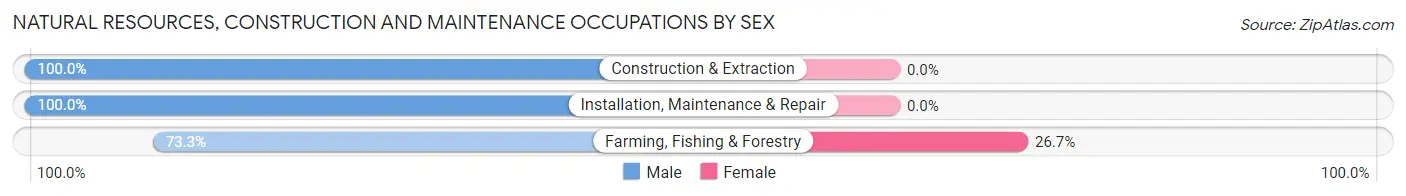
| Occupation | Male | Female |
| Farming, Fishing & Forestry | 11 (73.3%) | 4 (26.7%) |
| Construction & Extraction | 31 (100.0%) | 0 (0.0%) |
| Installation, Maintenance & Repair | 21 (100.0%) | 0 (0.0%) |
| Total (Category) | 63 (94.0%) | 4 (6.0%) |
| Total (Overall) | 344 (57.2%) | 257 (42.8%) |
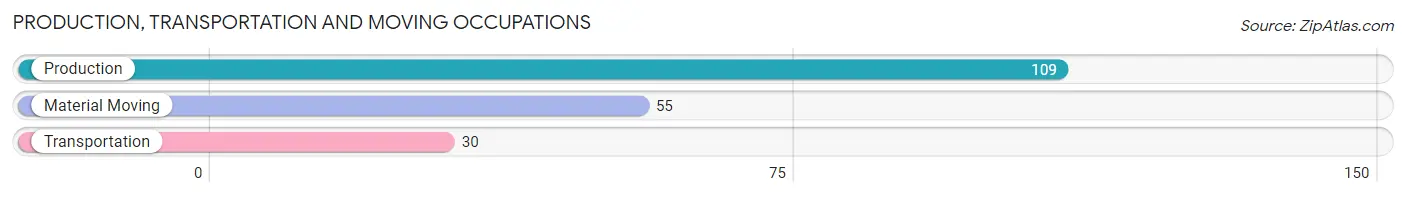
Production, Transportation and Moving Occupations
The most common Production, Transportation and Moving occupations in Muscoda are Production (109 | 18.1%), Material Moving (55 | 9.1%), and Transportation (30 | 5.0%).
Production, Transportation and Moving Occupations by Sex
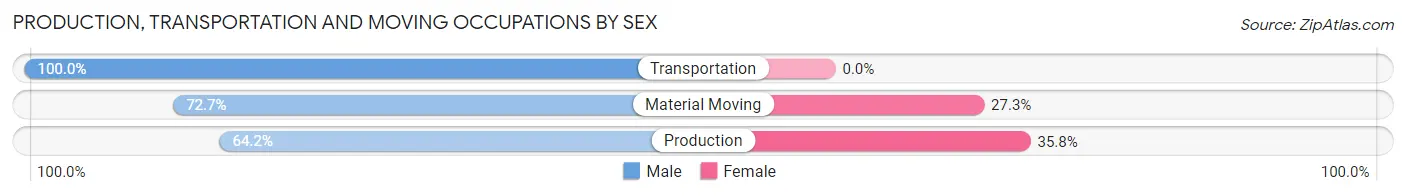
| Occupation | Male | Female |
| Production | 70 (64.2%) | 39 (35.8%) |
| Transportation | 30 (100.0%) | 0 (0.0%) |
| Material Moving | 40 (72.7%) | 15 (27.3%) |
| Total (Category) | 140 (72.2%) | 54 (27.8%) |
| Total (Overall) | 344 (57.2%) | 257 (42.8%) |
Employment Industries by Sex in Muscoda
Employment Industries in Muscoda
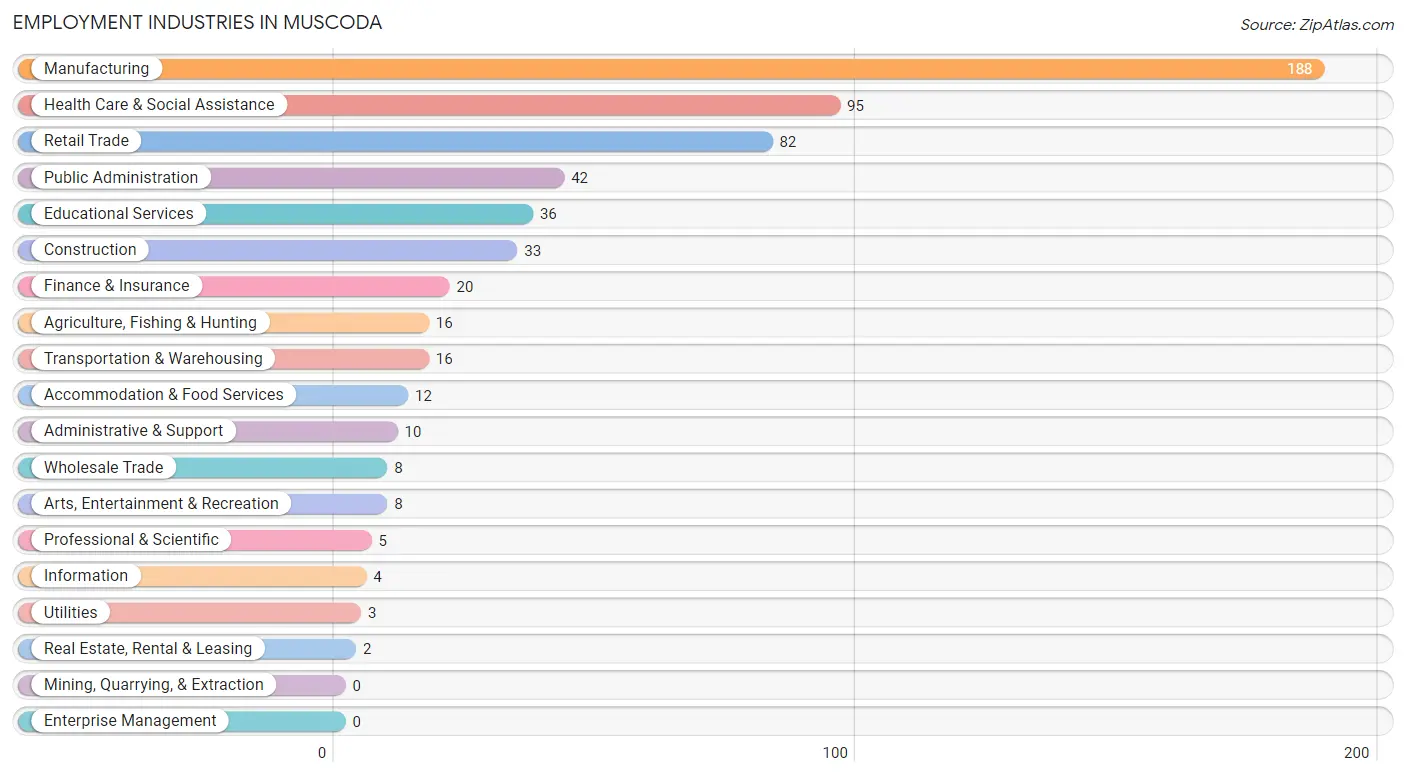
The major employment industries in Muscoda include Manufacturing (188 | 31.3%), Health Care & Social Assistance (95 | 15.8%), Retail Trade (82 | 13.6%), Public Administration (42 | 7.0%), and Educational Services (36 | 6.0%).
Employment Industries by Sex in Muscoda
The Muscoda industries that see more men than women are Construction (100.0%), Utilities (100.0%), and Information (100.0%), whereas the industries that tend to have a higher number of women are Wholesale Trade (100.0%), Real Estate, Rental & Leasing (100.0%), and Educational Services (86.1%).
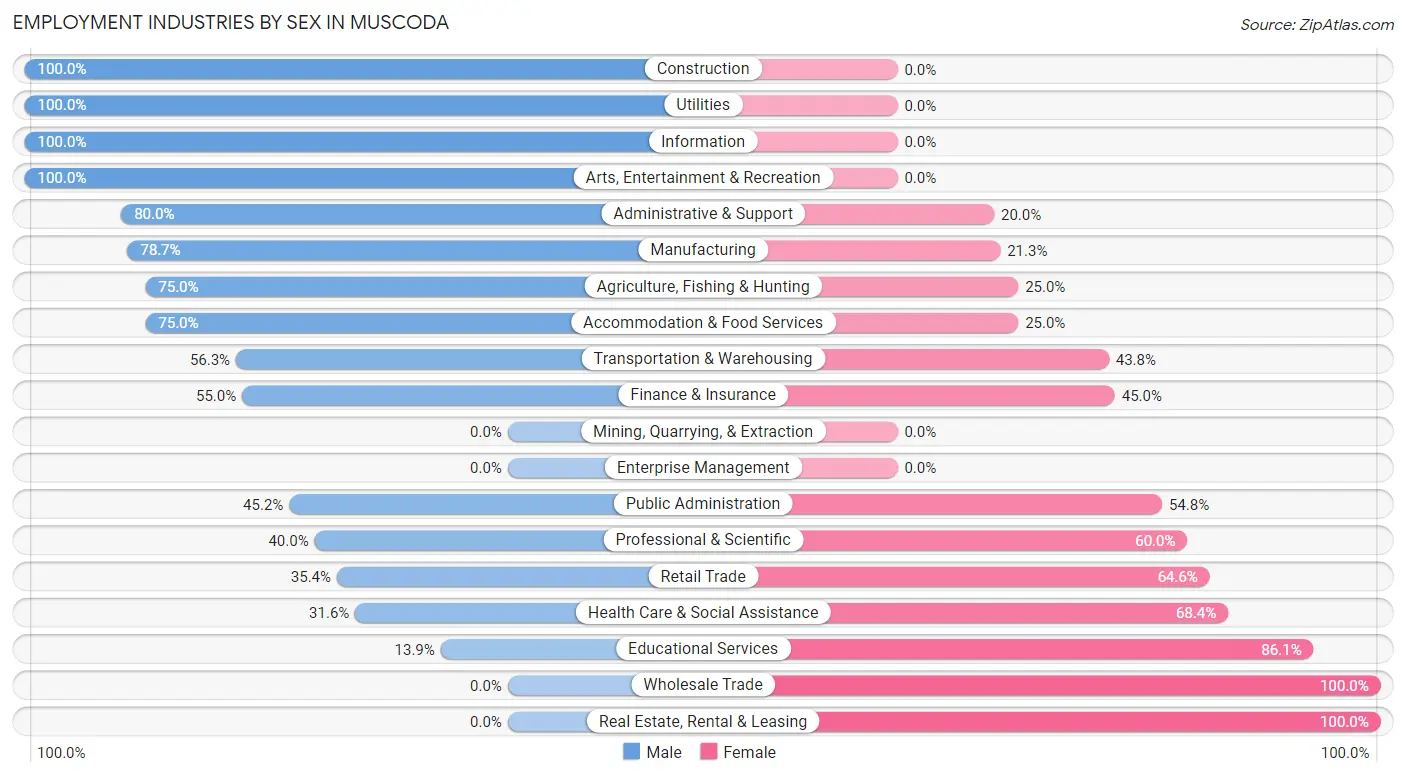
| Industry | Male | Female |
| Agriculture, Fishing & Hunting | 12 (75.0%) | 4 (25.0%) |
| Mining, Quarrying, & Extraction | 0 (0.0%) | 0 (0.0%) |
| Construction | 33 (100.0%) | 0 (0.0%) |
| Manufacturing | 148 (78.7%) | 40 (21.3%) |
| Wholesale Trade | 0 (0.0%) | 8 (100.0%) |
| Retail Trade | 29 (35.4%) | 53 (64.6%) |
| Transportation & Warehousing | 9 (56.2%) | 7 (43.8%) |
| Utilities | 3 (100.0%) | 0 (0.0%) |
| Information | 4 (100.0%) | 0 (0.0%) |
| Finance & Insurance | 11 (55.0%) | 9 (45.0%) |
| Real Estate, Rental & Leasing | 0 (0.0%) | 2 (100.0%) |
| Professional & Scientific | 2 (40.0%) | 3 (60.0%) |
| Enterprise Management | 0 (0.0%) | 0 (0.0%) |
| Administrative & Support | 8 (80.0%) | 2 (20.0%) |
| Educational Services | 5 (13.9%) | 31 (86.1%) |
| Health Care & Social Assistance | 30 (31.6%) | 65 (68.4%) |
| Arts, Entertainment & Recreation | 8 (100.0%) | 0 (0.0%) |
| Accommodation & Food Services | 9 (75.0%) | 3 (25.0%) |
| Public Administration | 19 (45.2%) | 23 (54.8%) |
| Total | 344 (57.2%) | 257 (42.8%) |
Education in Muscoda
School Enrollment in Muscoda
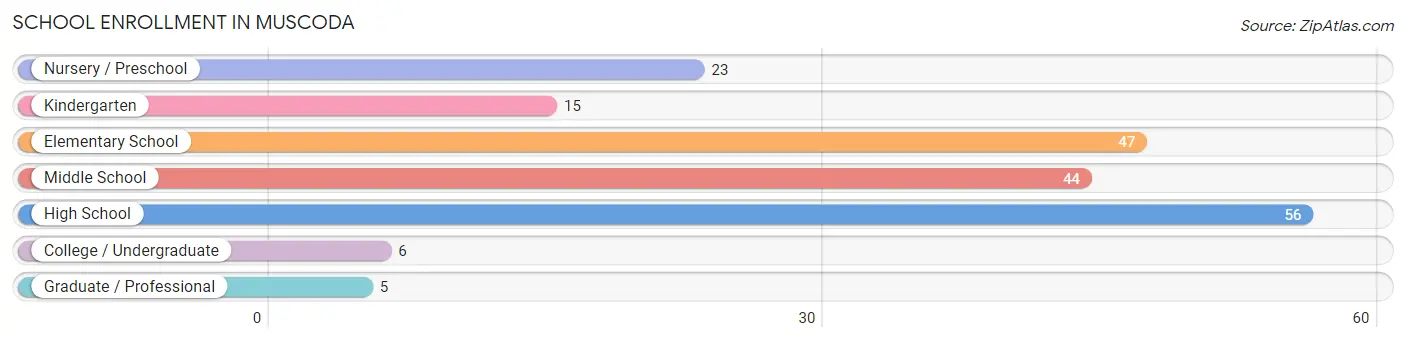
The most common levels of schooling among the 196 students in Muscoda are high school (56 | 28.6%), elementary school (47 | 24.0%), and middle school (44 | 22.5%).
| School Level | # Students | % Students |
| Nursery / Preschool | 23 | 11.7% |
| Kindergarten | 15 | 7.6% |
| Elementary School | 47 | 24.0% |
| Middle School | 44 | 22.5% |
| High School | 56 | 28.6% |
| College / Undergraduate | 6 | 3.1% |
| Graduate / Professional | 5 | 2.5% |
| Total | 196 | 100.0% |
School Enrollment by Age by Funding Source in Muscoda
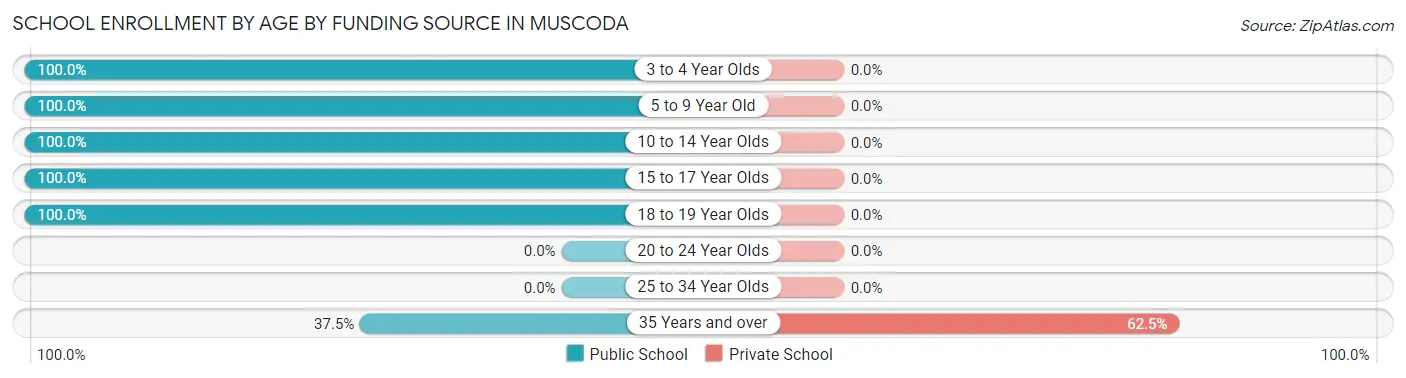
Out of a total of 196 students who are enrolled in schools in Muscoda, 5 (2.6%) attend a private institution, while the remaining 191 (97.4%) are enrolled in public schools. The age group of 35 years and over has the highest likelihood of being enrolled in private schools, with 5 (62.5% in the age bracket) enrolled. Conversely, the age group of 3 to 4 year olds has the lowest likelihood of being enrolled in a private school, with 26 (100.0% in the age bracket) attending a public institution.
| Age Bracket | Public School | Private School |
| 3 to 4 Year Olds | 26 (100.0%) | 0 (0.0%) |
| 5 to 9 Year Old | 46 (100.0%) | 0 (0.0%) |
| 10 to 14 Year Olds | 64 (100.0%) | 0 (0.0%) |
| 15 to 17 Year Olds | 34 (100.0%) | 0 (0.0%) |
| 18 to 19 Year Olds | 18 (100.0%) | 0 (0.0%) |
| 20 to 24 Year Olds | 0 (0.0%) | 0 (0.0%) |
| 25 to 34 Year Olds | 0 (0.0%) | 0 (0.0%) |
| 35 Years and over | 3 (37.5%) | 5 (62.5%) |
| Total | 191 (97.4%) | 5 (2.6%) |
Educational Attainment by Field of Study in Muscoda
Education (34 | 25.0%), bio, nature & agricultural (24 | 17.6%), science & technology (23 | 16.9%), engineering (15 | 11.0%), and business (14 | 10.3%) are the most common fields of study among 136 individuals in Muscoda who have obtained a bachelor's degree or higher.
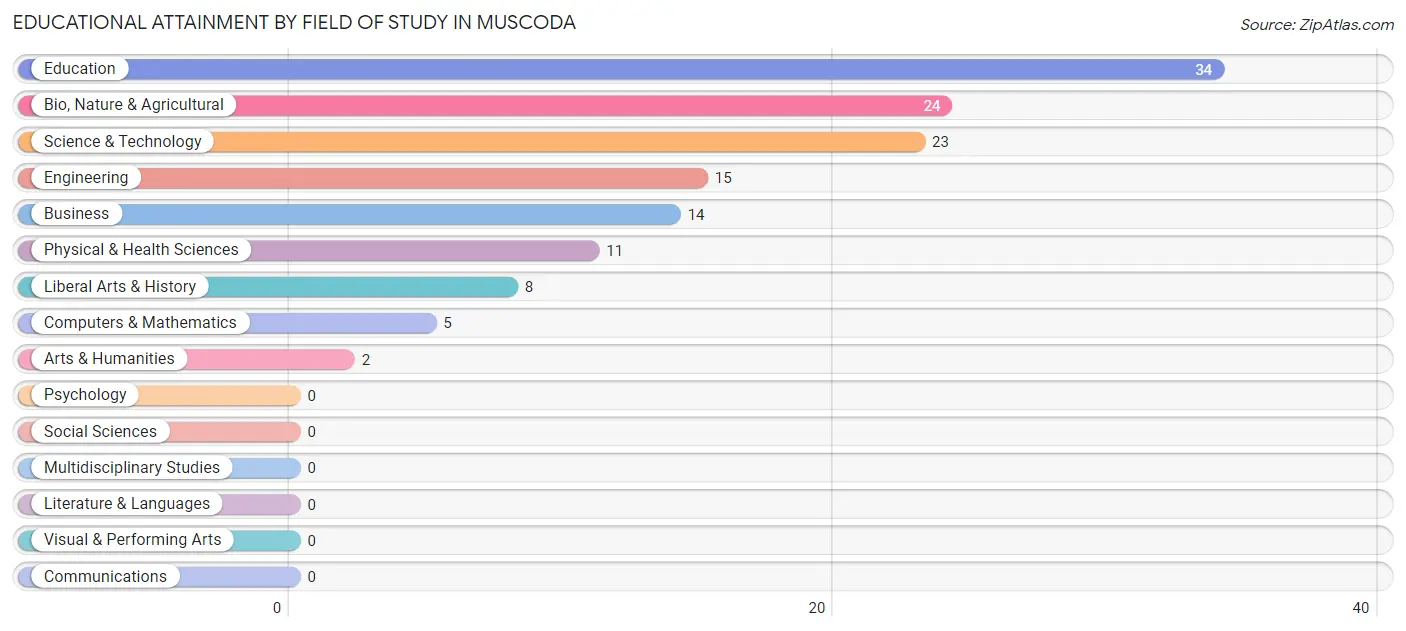
| Field of Study | # Graduates | % Graduates |
| Computers & Mathematics | 5 | 3.7% |
| Bio, Nature & Agricultural | 24 | 17.6% |
| Physical & Health Sciences | 11 | 8.1% |
| Psychology | 0 | 0.0% |
| Social Sciences | 0 | 0.0% |
| Engineering | 15 | 11.0% |
| Multidisciplinary Studies | 0 | 0.0% |
| Science & Technology | 23 | 16.9% |
| Business | 14 | 10.3% |
| Education | 34 | 25.0% |
| Literature & Languages | 0 | 0.0% |
| Liberal Arts & History | 8 | 5.9% |
| Visual & Performing Arts | 0 | 0.0% |
| Communications | 0 | 0.0% |
| Arts & Humanities | 2 | 1.5% |
| Total | 136 | 100.0% |
Transportation & Commute in Muscoda
Vehicle Availability by Sex in Muscoda
The most prevalent vehicle ownership categories in Muscoda are males with 2 vehicles (131, accounting for 39.1%) and females with 2 vehicles (108, making up 51.0%).
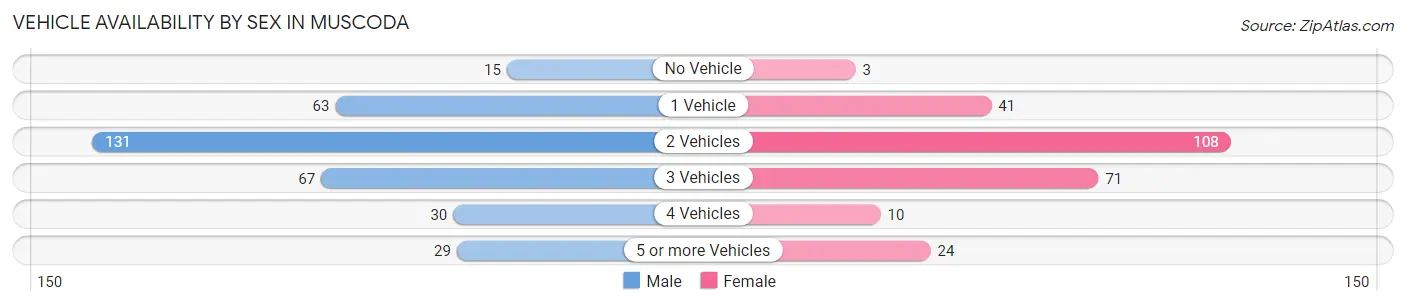
| Vehicles Available | Male | Female |
| No Vehicle | 15 (4.5%) | 3 (1.2%) |
| 1 Vehicle | 63 (18.8%) | 41 (16.0%) |
| 2 Vehicles | 131 (39.1%) | 108 (42.0%) |
| 3 Vehicles | 67 (20.0%) | 71 (27.6%) |
| 4 Vehicles | 30 (9.0%) | 10 (3.9%) |
| 5 or more Vehicles | 29 (8.7%) | 24 (9.3%) |
| Total | 335 (100.0%) | 257 (100.0%) |
Commute Time in Muscoda
The most frequently occuring commute durations in Muscoda are 20 to 24 minutes (85 commuters, 15.0%), less than 5 minutes (77 commuters, 13.6%), and 15 to 19 minutes (75 commuters, 13.3%).
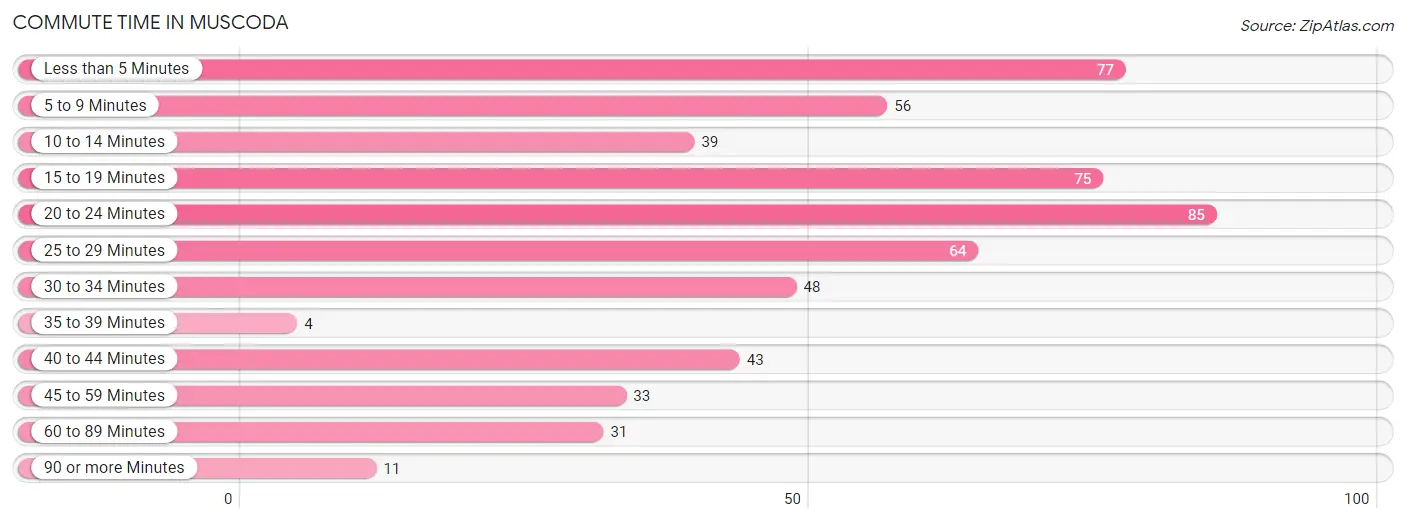
| Commute Time | # Commuters | % Commuters |
| Less than 5 Minutes | 77 | 13.6% |
| 5 to 9 Minutes | 56 | 9.9% |
| 10 to 14 Minutes | 39 | 6.9% |
| 15 to 19 Minutes | 75 | 13.3% |
| 20 to 24 Minutes | 85 | 15.0% |
| 25 to 29 Minutes | 64 | 11.3% |
| 30 to 34 Minutes | 48 | 8.5% |
| 35 to 39 Minutes | 4 | 0.7% |
| 40 to 44 Minutes | 43 | 7.6% |
| 45 to 59 Minutes | 33 | 5.8% |
| 60 to 89 Minutes | 31 | 5.5% |
| 90 or more Minutes | 11 | 1.9% |
Commute Time by Sex in Muscoda
The most common commute times in Muscoda are less than 5 minutes (52 commuters, 16.4%) for males and 20 to 24 minutes (51 commuters, 20.5%) for females.
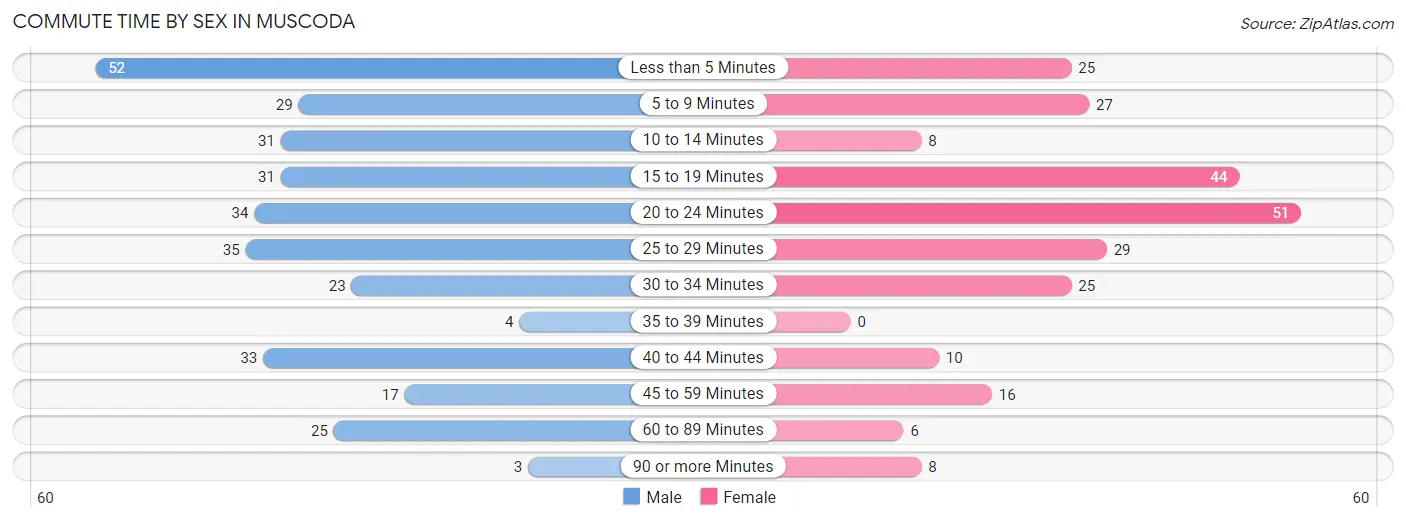
| Commute Time | Male | Female |
| Less than 5 Minutes | 52 (16.4%) | 25 (10.0%) |
| 5 to 9 Minutes | 29 (9.1%) | 27 (10.8%) |
| 10 to 14 Minutes | 31 (9.8%) | 8 (3.2%) |
| 15 to 19 Minutes | 31 (9.8%) | 44 (17.7%) |
| 20 to 24 Minutes | 34 (10.7%) | 51 (20.5%) |
| 25 to 29 Minutes | 35 (11.0%) | 29 (11.7%) |
| 30 to 34 Minutes | 23 (7.3%) | 25 (10.0%) |
| 35 to 39 Minutes | 4 (1.3%) | 0 (0.0%) |
| 40 to 44 Minutes | 33 (10.4%) | 10 (4.0%) |
| 45 to 59 Minutes | 17 (5.4%) | 16 (6.4%) |
| 60 to 89 Minutes | 25 (7.9%) | 6 (2.4%) |
| 90 or more Minutes | 3 (0.9%) | 8 (3.2%) |
Time of Departure to Work by Sex in Muscoda
The most frequent times of departure to work in Muscoda are 12:00 AM to 4:59 AM (61, 19.2%) for males and 6:30 AM to 6:59 AM (58, 23.3%) for females.
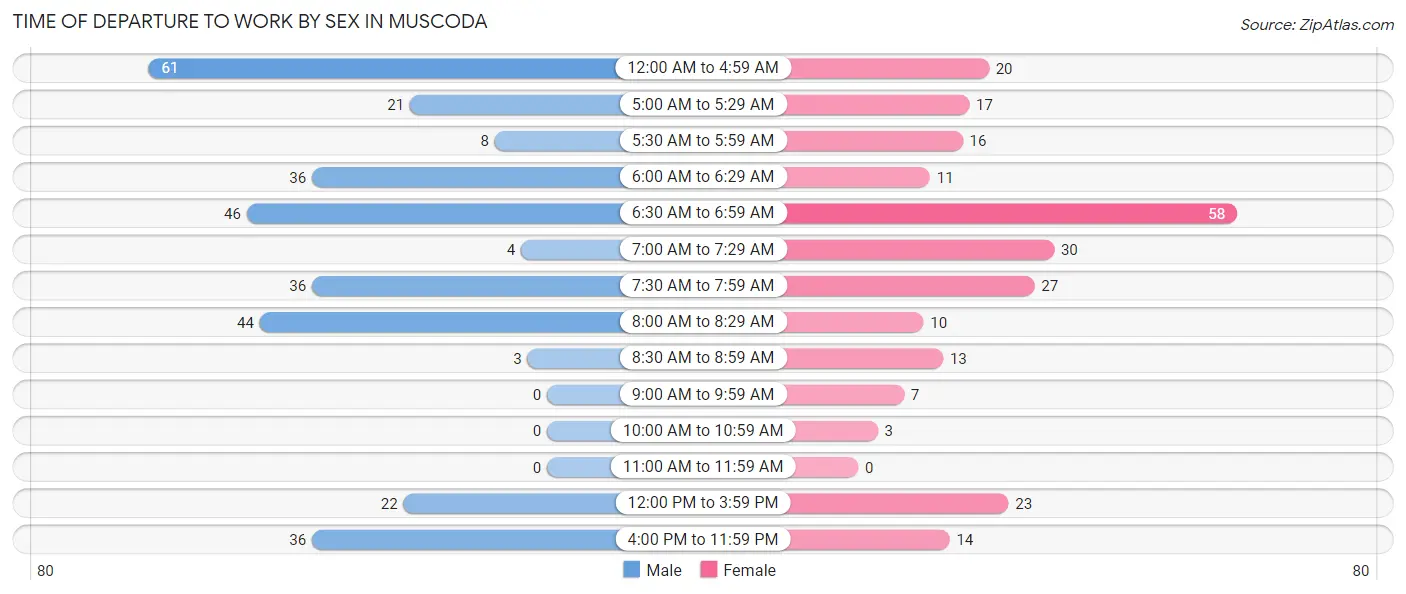
| Time of Departure | Male | Female |
| 12:00 AM to 4:59 AM | 61 (19.2%) | 20 (8.0%) |
| 5:00 AM to 5:29 AM | 21 (6.6%) | 17 (6.8%) |
| 5:30 AM to 5:59 AM | 8 (2.5%) | 16 (6.4%) |
| 6:00 AM to 6:29 AM | 36 (11.4%) | 11 (4.4%) |
| 6:30 AM to 6:59 AM | 46 (14.5%) | 58 (23.3%) |
| 7:00 AM to 7:29 AM | 4 (1.3%) | 30 (12.0%) |
| 7:30 AM to 7:59 AM | 36 (11.4%) | 27 (10.8%) |
| 8:00 AM to 8:29 AM | 44 (13.9%) | 10 (4.0%) |
| 8:30 AM to 8:59 AM | 3 (0.9%) | 13 (5.2%) |
| 9:00 AM to 9:59 AM | 0 (0.0%) | 7 (2.8%) |
| 10:00 AM to 10:59 AM | 0 (0.0%) | 3 (1.2%) |
| 11:00 AM to 11:59 AM | 0 (0.0%) | 0 (0.0%) |
| 12:00 PM to 3:59 PM | 22 (6.9%) | 23 (9.2%) |
| 4:00 PM to 11:59 PM | 36 (11.4%) | 14 (5.6%) |
| Total | 317 (100.0%) | 249 (100.0%) |
Housing Occupancy in Muscoda
Occupancy by Ownership in Muscoda
Of the total 529 dwellings in Muscoda, owner-occupied units account for 380 (71.8%), while renter-occupied units make up 149 (28.2%).
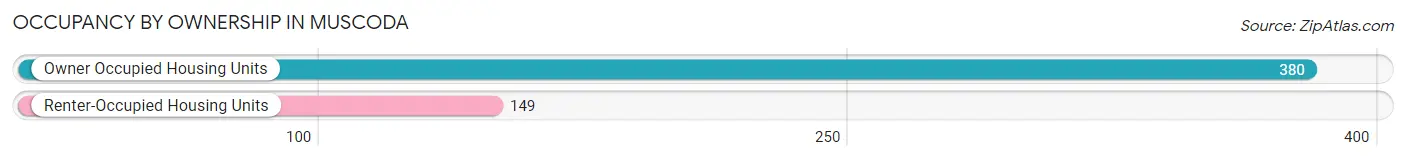
| Occupancy | # Housing Units | % Housing Units |
| Owner Occupied Housing Units | 380 | 71.8% |
| Renter-Occupied Housing Units | 149 | 28.2% |
| Total Occupied Housing Units | 529 | 100.0% |
Occupancy by Household Size in Muscoda
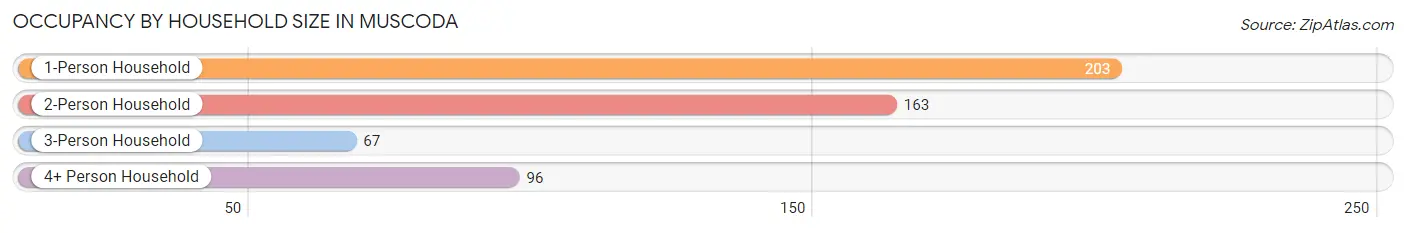
| Household Size | # Housing Units | % Housing Units |
| 1-Person Household | 203 | 38.4% |
| 2-Person Household | 163 | 30.8% |
| 3-Person Household | 67 | 12.7% |
| 4+ Person Household | 96 | 18.1% |
| Total Housing Units | 529 | 100.0% |
Occupancy by Ownership by Household Size in Muscoda
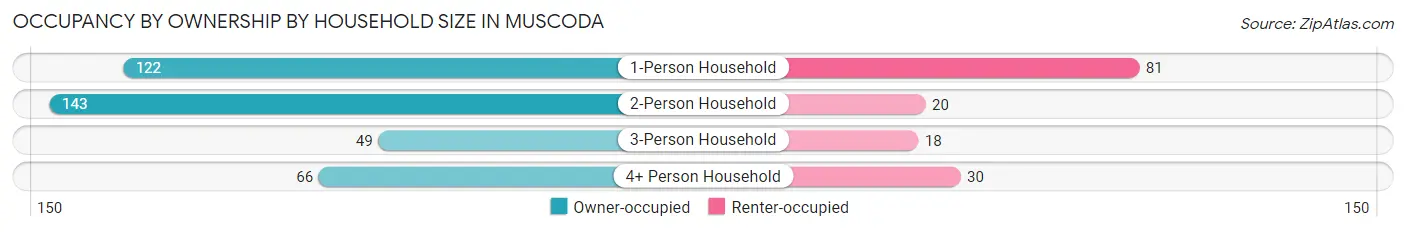
| Household Size | Owner-occupied | Renter-occupied |
| 1-Person Household | 122 (60.1%) | 81 (39.9%) |
| 2-Person Household | 143 (87.7%) | 20 (12.3%) |
| 3-Person Household | 49 (73.1%) | 18 (26.9%) |
| 4+ Person Household | 66 (68.8%) | 30 (31.2%) |
| Total Housing Units | 380 (71.8%) | 149 (28.2%) |
Occupancy by Educational Attainment in Muscoda
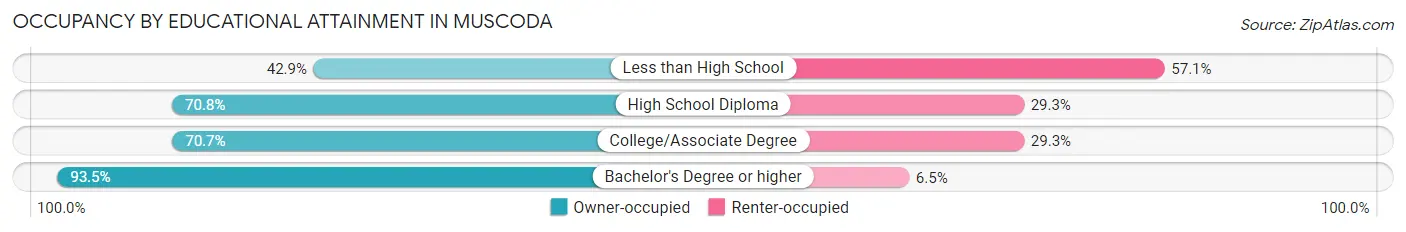
| Household Size | Owner-occupied | Renter-occupied |
| Less than High School | 18 (42.9%) | 24 (57.1%) |
| High School Diploma | 150 (70.8%) | 62 (29.2%) |
| College/Associate Degree | 140 (70.7%) | 58 (29.3%) |
| Bachelor's Degree or higher | 72 (93.5%) | 5 (6.5%) |
Occupancy by Age of Householder in Muscoda
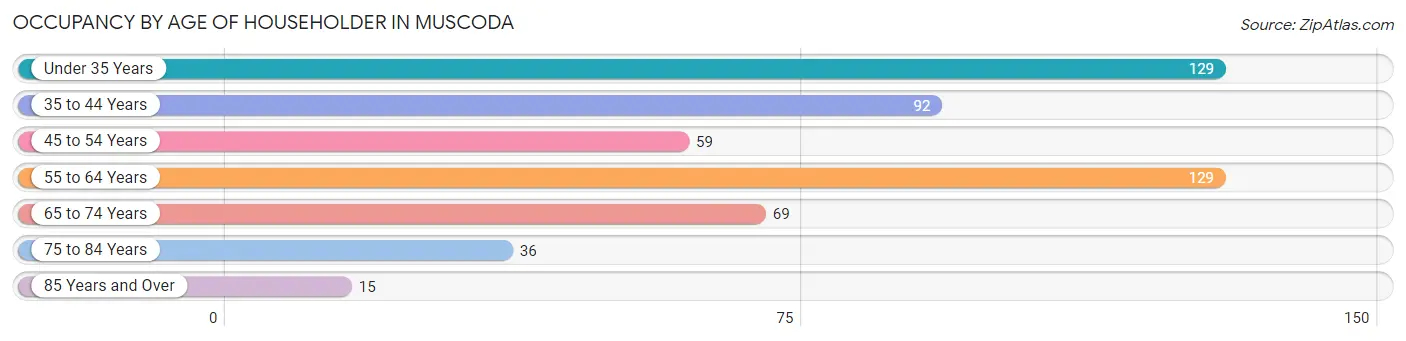
| Age Bracket | # Households | % Households |
| Under 35 Years | 129 | 24.4% |
| 35 to 44 Years | 92 | 17.4% |
| 45 to 54 Years | 59 | 11.2% |
| 55 to 64 Years | 129 | 24.4% |
| 65 to 74 Years | 69 | 13.0% |
| 75 to 84 Years | 36 | 6.8% |
| 85 Years and Over | 15 | 2.8% |
| Total | 529 | 100.0% |
Housing Finances in Muscoda
Median Income by Occupancy in Muscoda
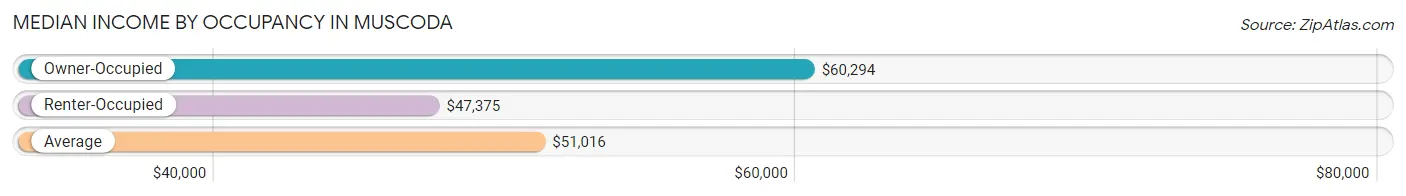
| Occupancy Type | # Households | Median Income |
| Owner-Occupied | 380 (71.8%) | $60,294 |
| Renter-Occupied | 149 (28.2%) | $47,375 |
| Average | 529 (100.0%) | $51,016 |
Occupancy by Householder Income Bracket in Muscoda
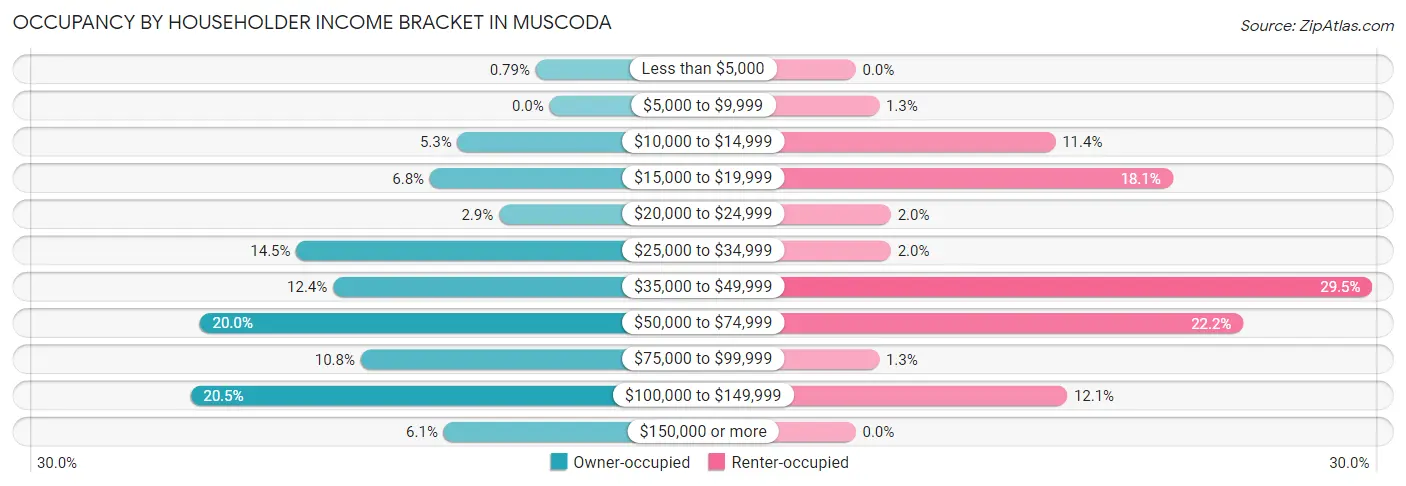
| Income Bracket | Owner-occupied | Renter-occupied |
| Less than $5,000 | 3 (0.8%) | 0 (0.0%) |
| $5,000 to $9,999 | 0 (0.0%) | 2 (1.3%) |
| $10,000 to $14,999 | 20 (5.3%) | 17 (11.4%) |
| $15,000 to $19,999 | 26 (6.8%) | 27 (18.1%) |
| $20,000 to $24,999 | 11 (2.9%) | 3 (2.0%) |
| $25,000 to $34,999 | 55 (14.5%) | 3 (2.0%) |
| $35,000 to $49,999 | 47 (12.4%) | 44 (29.5%) |
| $50,000 to $74,999 | 76 (20.0%) | 33 (22.2%) |
| $75,000 to $99,999 | 41 (10.8%) | 2 (1.3%) |
| $100,000 to $149,999 | 78 (20.5%) | 18 (12.1%) |
| $150,000 or more | 23 (6.0%) | 0 (0.0%) |
| Total | 380 (100.0%) | 149 (100.0%) |
Monthly Housing Cost Tiers in Muscoda
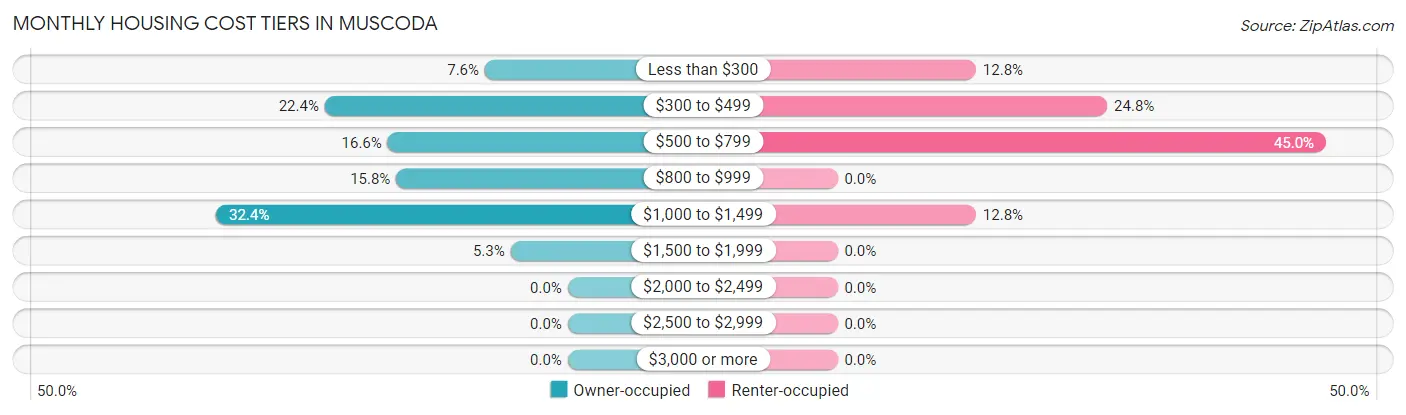
| Monthly Cost | Owner-occupied | Renter-occupied |
| Less than $300 | 29 (7.6%) | 19 (12.8%) |
| $300 to $499 | 85 (22.4%) | 37 (24.8%) |
| $500 to $799 | 63 (16.6%) | 67 (45.0%) |
| $800 to $999 | 60 (15.8%) | 0 (0.0%) |
| $1,000 to $1,499 | 123 (32.4%) | 19 (12.8%) |
| $1,500 to $1,999 | 20 (5.3%) | 0 (0.0%) |
| $2,000 to $2,499 | 0 (0.0%) | 0 (0.0%) |
| $2,500 to $2,999 | 0 (0.0%) | 0 (0.0%) |
| $3,000 or more | 0 (0.0%) | 0 (0.0%) |
| Total | 380 (100.0%) | 149 (100.0%) |
Physical Housing Characteristics in Muscoda
Housing Structures in Muscoda
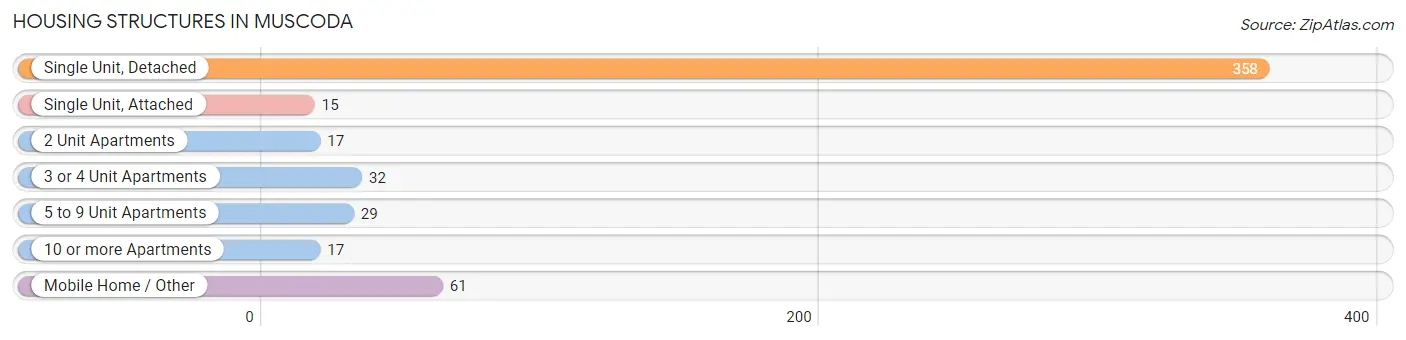
| Structure Type | # Housing Units | % Housing Units |
| Single Unit, Detached | 358 | 67.7% |
| Single Unit, Attached | 15 | 2.8% |
| 2 Unit Apartments | 17 | 3.2% |
| 3 or 4 Unit Apartments | 32 | 6.0% |
| 5 to 9 Unit Apartments | 29 | 5.5% |
| 10 or more Apartments | 17 | 3.2% |
| Mobile Home / Other | 61 | 11.5% |
| Total | 529 | 100.0% |
Housing Structures by Occupancy in Muscoda
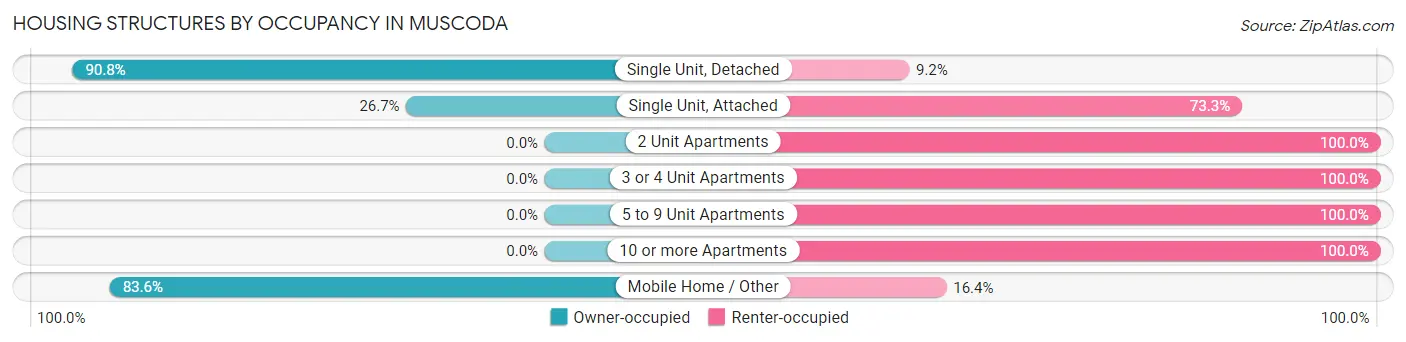
| Structure Type | Owner-occupied | Renter-occupied |
| Single Unit, Detached | 325 (90.8%) | 33 (9.2%) |
| Single Unit, Attached | 4 (26.7%) | 11 (73.3%) |
| 2 Unit Apartments | 0 (0.0%) | 17 (100.0%) |
| 3 or 4 Unit Apartments | 0 (0.0%) | 32 (100.0%) |
| 5 to 9 Unit Apartments | 0 (0.0%) | 29 (100.0%) |
| 10 or more Apartments | 0 (0.0%) | 17 (100.0%) |
| Mobile Home / Other | 51 (83.6%) | 10 (16.4%) |
| Total | 380 (71.8%) | 149 (28.2%) |
Housing Structures by Number of Rooms in Muscoda
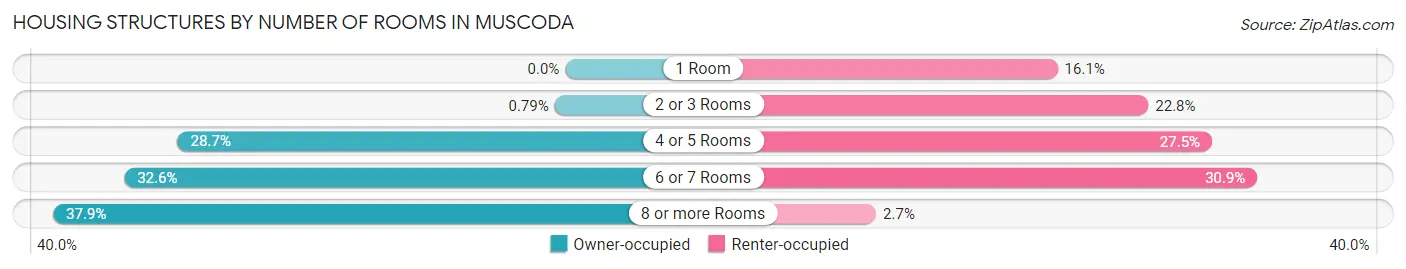
| Number of Rooms | Owner-occupied | Renter-occupied |
| 1 Room | 0 (0.0%) | 24 (16.1%) |
| 2 or 3 Rooms | 3 (0.8%) | 34 (22.8%) |
| 4 or 5 Rooms | 109 (28.7%) | 41 (27.5%) |
| 6 or 7 Rooms | 124 (32.6%) | 46 (30.9%) |
| 8 or more Rooms | 144 (37.9%) | 4 (2.7%) |
| Total | 380 (100.0%) | 149 (100.0%) |
Housing Structure by Heating Type in Muscoda
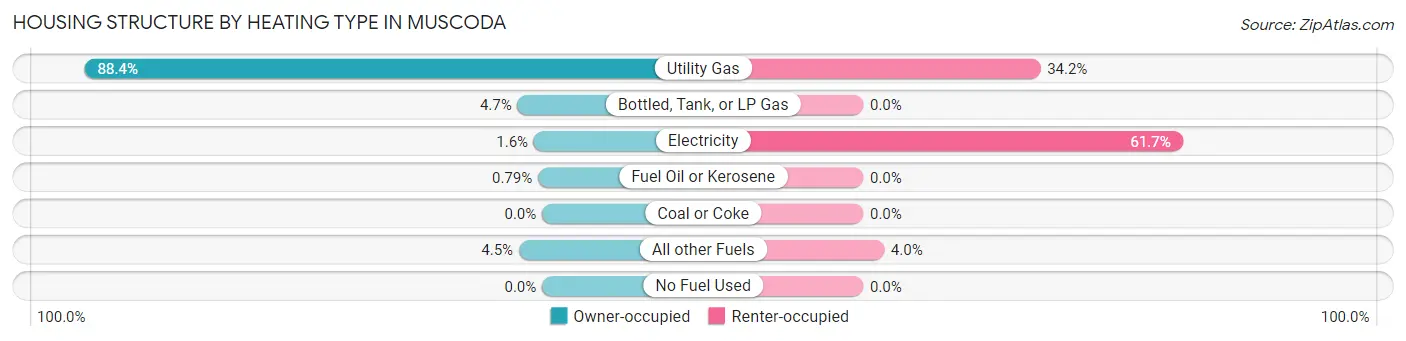
| Heating Type | Owner-occupied | Renter-occupied |
| Utility Gas | 336 (88.4%) | 51 (34.2%) |
| Bottled, Tank, or LP Gas | 18 (4.7%) | 0 (0.0%) |
| Electricity | 6 (1.6%) | 92 (61.7%) |
| Fuel Oil or Kerosene | 3 (0.8%) | 0 (0.0%) |
| Coal or Coke | 0 (0.0%) | 0 (0.0%) |
| All other Fuels | 17 (4.5%) | 6 (4.0%) |
| No Fuel Used | 0 (0.0%) | 0 (0.0%) |
| Total | 380 (100.0%) | 149 (100.0%) |
Household Vehicle Usage in Muscoda
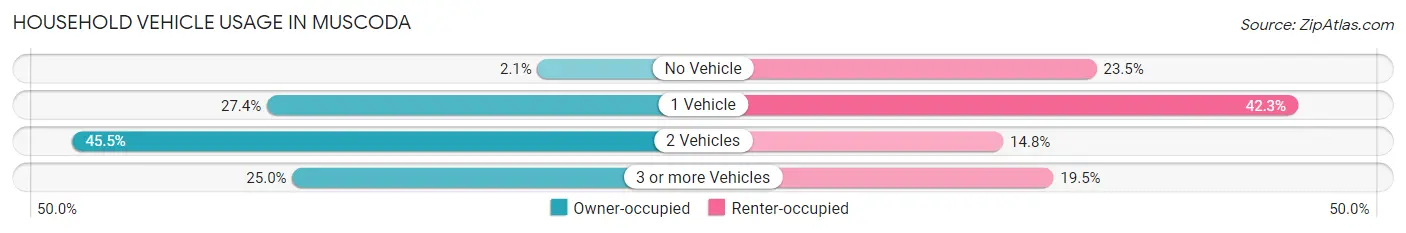
| Vehicles per Household | Owner-occupied | Renter-occupied |
| No Vehicle | 8 (2.1%) | 35 (23.5%) |
| 1 Vehicle | 104 (27.4%) | 63 (42.3%) |
| 2 Vehicles | 173 (45.5%) | 22 (14.8%) |
| 3 or more Vehicles | 95 (25.0%) | 29 (19.5%) |
| Total | 380 (100.0%) | 149 (100.0%) |
Real Estate & Mortgages in Muscoda
Real Estate and Mortgage Overview in Muscoda
| Characteristic | Without Mortgage | With Mortgage |
| Housing Units | 160 | 220 |
| Median Property Value | $97,600 | $119,700 |
| Median Household Income | $34,773 | $10 |
| Monthly Housing Costs | $427 | $0 |
| Real Estate Taxes | $2,102 | $0 |
Property Value by Mortgage Status in Muscoda
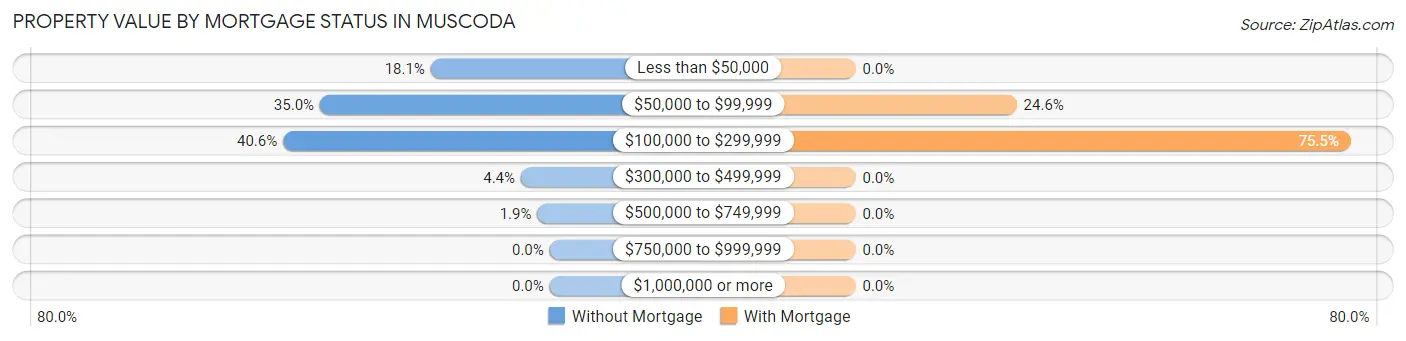
| Property Value | Without Mortgage | With Mortgage |
| Less than $50,000 | 29 (18.1%) | 0 (0.0%) |
| $50,000 to $99,999 | 56 (35.0%) | 54 (24.5%) |
| $100,000 to $299,999 | 65 (40.6%) | 166 (75.4%) |
| $300,000 to $499,999 | 7 (4.4%) | 0 (0.0%) |
| $500,000 to $749,999 | 3 (1.9%) | 0 (0.0%) |
| $750,000 to $999,999 | 0 (0.0%) | 0 (0.0%) |
| $1,000,000 or more | 0 (0.0%) | 0 (0.0%) |
| Total | 160 (100.0%) | 220 (100.0%) |
Household Income by Mortgage Status in Muscoda
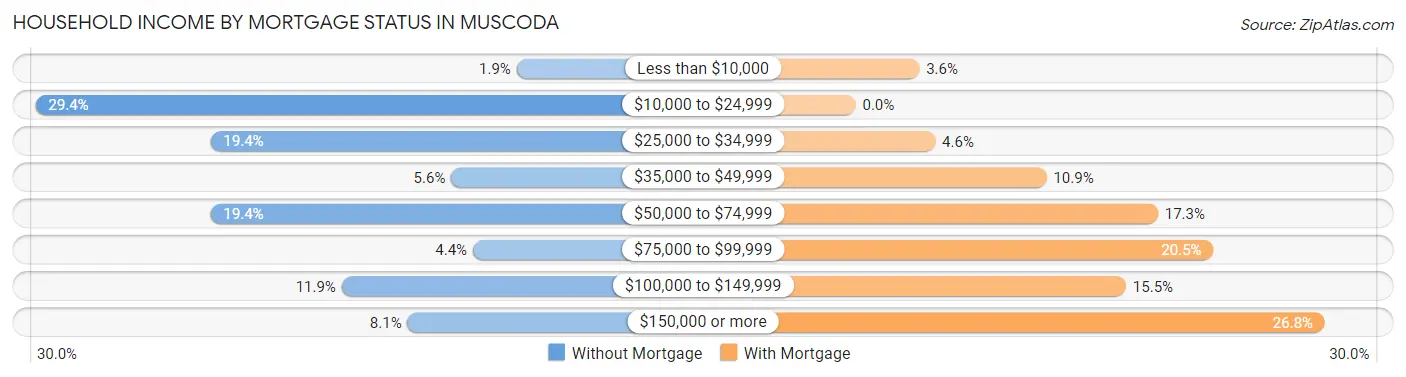
| Household Income | Without Mortgage | With Mortgage |
| Less than $10,000 | 3 (1.9%) | 8 (3.6%) |
| $10,000 to $24,999 | 47 (29.4%) | 0 (0.0%) |
| $25,000 to $34,999 | 31 (19.4%) | 10 (4.5%) |
| $35,000 to $49,999 | 9 (5.6%) | 24 (10.9%) |
| $50,000 to $74,999 | 31 (19.4%) | 38 (17.3%) |
| $75,000 to $99,999 | 7 (4.4%) | 45 (20.4%) |
| $100,000 to $149,999 | 19 (11.9%) | 34 (15.4%) |
| $150,000 or more | 13 (8.1%) | 59 (26.8%) |
| Total | 160 (100.0%) | 220 (100.0%) |
Property Value to Household Income Ratio in Muscoda
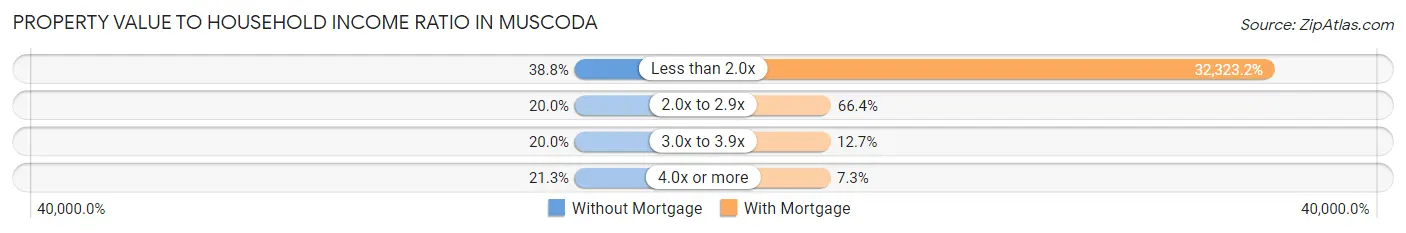
| Value-to-Income Ratio | Without Mortgage | With Mortgage |
| Less than 2.0x | 62 (38.8%) | 71,111 (32,323.2%) |
| 2.0x to 2.9x | 32 (20.0%) | 146 (66.4%) |
| 3.0x to 3.9x | 32 (20.0%) | 28 (12.7%) |
| 4.0x or more | 34 (21.2%) | 16 (7.3%) |
| Total | 160 (100.0%) | 220 (100.0%) |
Real Estate Taxes by Mortgage Status in Muscoda
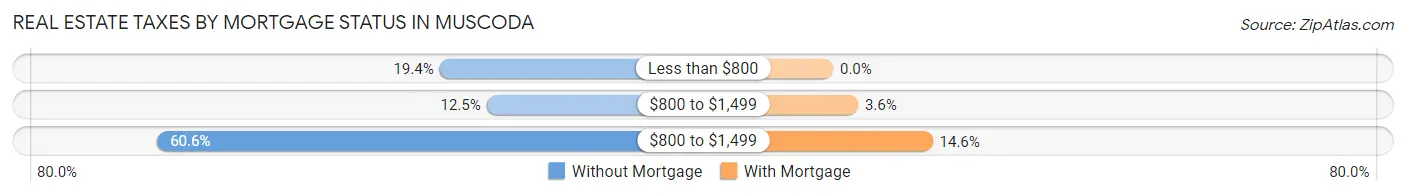
| Property Taxes | Without Mortgage | With Mortgage |
| Less than $800 | 31 (19.4%) | 0 (0.0%) |
| $800 to $1,499 | 20 (12.5%) | 8 (3.6%) |
| $800 to $1,499 | 97 (60.6%) | 32 (14.5%) |
| Total | 160 (100.0%) | 220 (100.0%) |
Health & Disability in Muscoda
Health Insurance Coverage by Age in Muscoda
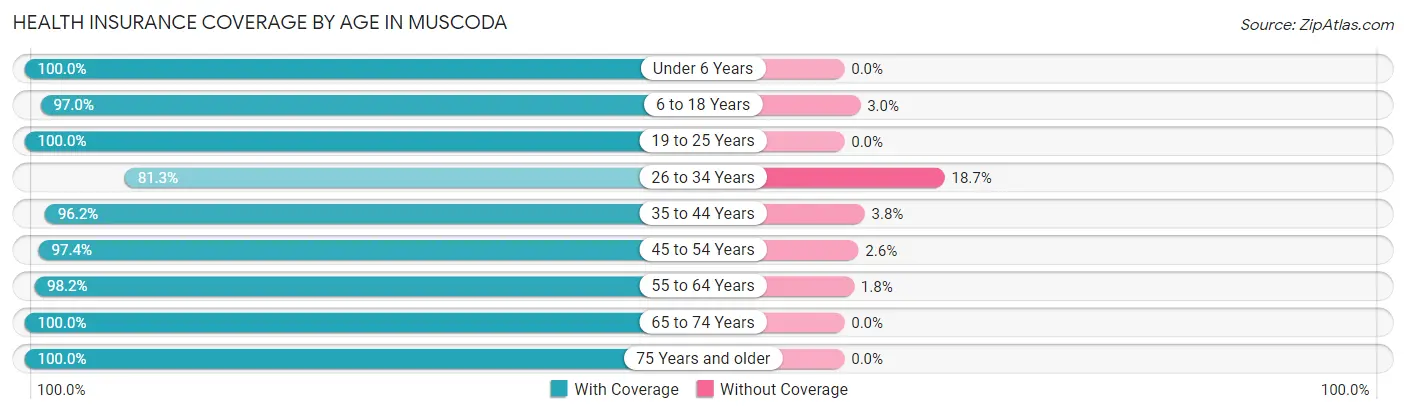
| Age Bracket | With Coverage | Without Coverage |
| Under 6 Years | 86 (100.0%) | 0 (0.0%) |
| 6 to 18 Years | 196 (97.0%) | 6 (3.0%) |
| 19 to 25 Years | 77 (100.0%) | 0 (0.0%) |
| 26 to 34 Years | 161 (81.3%) | 37 (18.7%) |
| 35 to 44 Years | 127 (96.2%) | 5 (3.8%) |
| 45 to 54 Years | 111 (97.4%) | 3 (2.6%) |
| 55 to 64 Years | 165 (98.2%) | 3 (1.8%) |
| 65 to 74 Years | 110 (100.0%) | 0 (0.0%) |
| 75 Years and older | 61 (100.0%) | 0 (0.0%) |
| Total | 1,094 (95.3%) | 54 (4.7%) |
Health Insurance Coverage by Citizenship Status in Muscoda

| Citizenship Status | With Coverage | Without Coverage |
| Native Born | 86 (100.0%) | 0 (0.0%) |
| Foreign Born, Citizen | 196 (97.0%) | 6 (3.0%) |
| Foreign Born, not a Citizen | 77 (100.0%) | 0 (0.0%) |
Health Insurance Coverage by Household Income in Muscoda
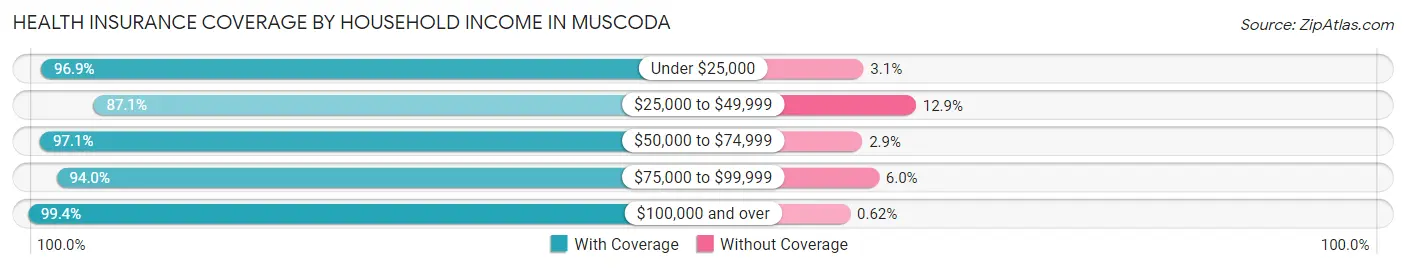
| Household Income | With Coverage | Without Coverage |
| Under $25,000 | 156 (96.9%) | 5 (3.1%) |
| $25,000 to $49,999 | 202 (87.1%) | 30 (12.9%) |
| $50,000 to $74,999 | 269 (97.1%) | 8 (2.9%) |
| $75,000 to $99,999 | 141 (94.0%) | 9 (6.0%) |
| $100,000 and over | 319 (99.4%) | 2 (0.6%) |
Public vs Private Health Insurance Coverage by Age in Muscoda
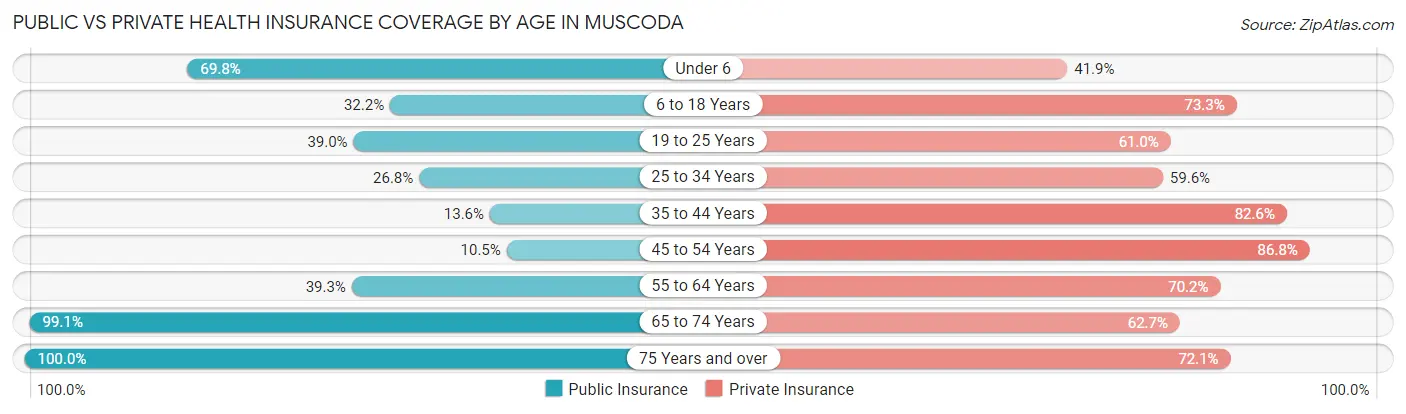
| Age Bracket | Public Insurance | Private Insurance |
| Under 6 | 60 (69.8%) | 36 (41.9%) |
| 6 to 18 Years | 65 (32.2%) | 148 (73.3%) |
| 19 to 25 Years | 30 (39.0%) | 47 (61.0%) |
| 25 to 34 Years | 53 (26.8%) | 118 (59.6%) |
| 35 to 44 Years | 18 (13.6%) | 109 (82.6%) |
| 45 to 54 Years | 12 (10.5%) | 99 (86.8%) |
| 55 to 64 Years | 66 (39.3%) | 118 (70.2%) |
| 65 to 74 Years | 109 (99.1%) | 69 (62.7%) |
| 75 Years and over | 61 (100.0%) | 44 (72.1%) |
| Total | 474 (41.3%) | 788 (68.6%) |
Disability Status by Sex by Age in Muscoda
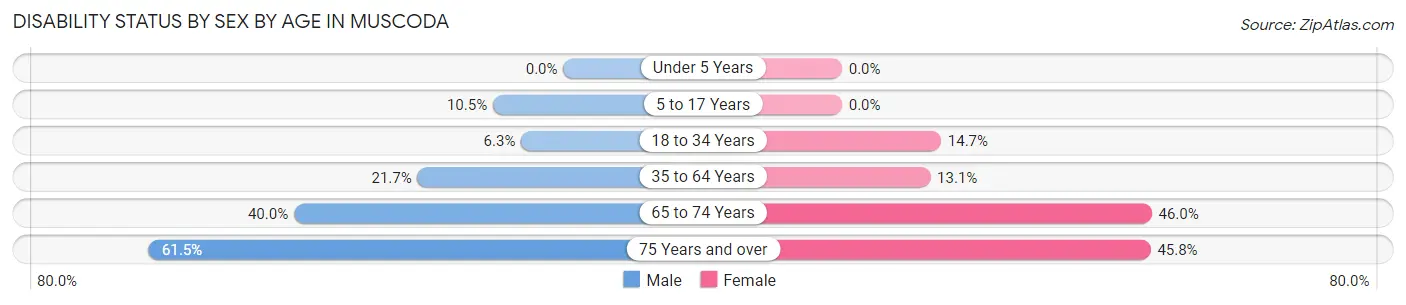
| Age Bracket | Male | Female |
| Under 5 Years | 0 (0.0%) | 0 (0.0%) |
| 5 to 17 Years | 7 (10.4%) | 0 (0.0%) |
| 18 to 34 Years | 10 (6.2%) | 25 (14.7%) |
| 35 to 64 Years | 55 (21.6%) | 21 (13.1%) |
| 65 to 74 Years | 24 (40.0%) | 23 (46.0%) |
| 75 Years and over | 8 (61.5%) | 22 (45.8%) |
Disability Class by Sex by Age in Muscoda
Disability Class: Hearing Difficulty
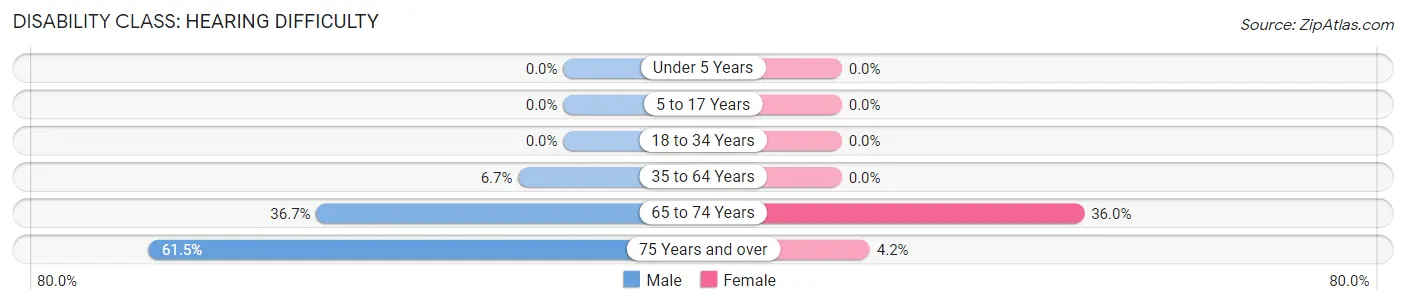
| Age Bracket | Male | Female |
| Under 5 Years | 0 (0.0%) | 0 (0.0%) |
| 5 to 17 Years | 0 (0.0%) | 0 (0.0%) |
| 18 to 34 Years | 0 (0.0%) | 0 (0.0%) |
| 35 to 64 Years | 17 (6.7%) | 0 (0.0%) |
| 65 to 74 Years | 22 (36.7%) | 18 (36.0%) |
| 75 Years and over | 8 (61.5%) | 2 (4.2%) |
Disability Class: Vision Difficulty
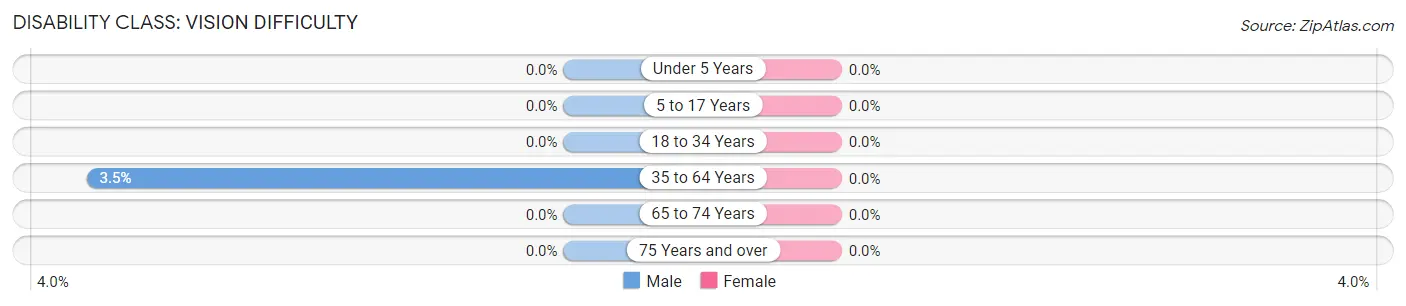
| Age Bracket | Male | Female |
| Under 5 Years | 0 (0.0%) | 0 (0.0%) |
| 5 to 17 Years | 0 (0.0%) | 0 (0.0%) |
| 18 to 34 Years | 0 (0.0%) | 0 (0.0%) |
| 35 to 64 Years | 9 (3.5%) | 0 (0.0%) |
| 65 to 74 Years | 0 (0.0%) | 0 (0.0%) |
| 75 Years and over | 0 (0.0%) | 0 (0.0%) |
Disability Class: Cognitive Difficulty
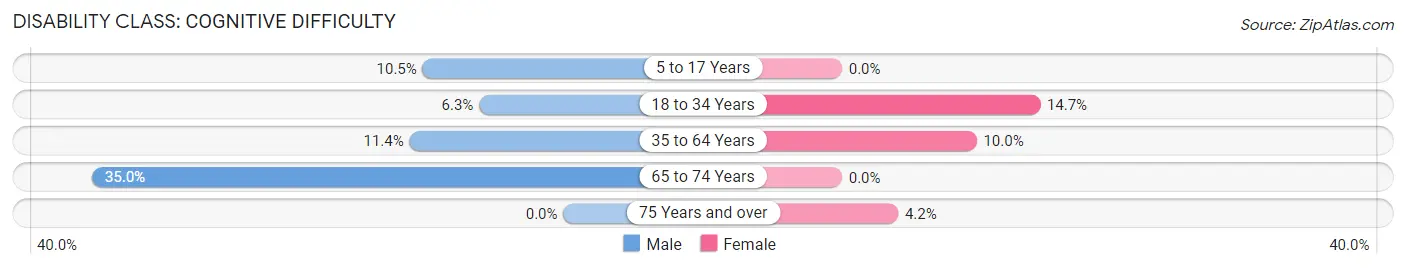
| Age Bracket | Male | Female |
| 5 to 17 Years | 7 (10.4%) | 0 (0.0%) |
| 18 to 34 Years | 10 (6.2%) | 25 (14.7%) |
| 35 to 64 Years | 29 (11.4%) | 16 (10.0%) |
| 65 to 74 Years | 21 (35.0%) | 0 (0.0%) |
| 75 Years and over | 0 (0.0%) | 2 (4.2%) |
Disability Class: Ambulatory Difficulty
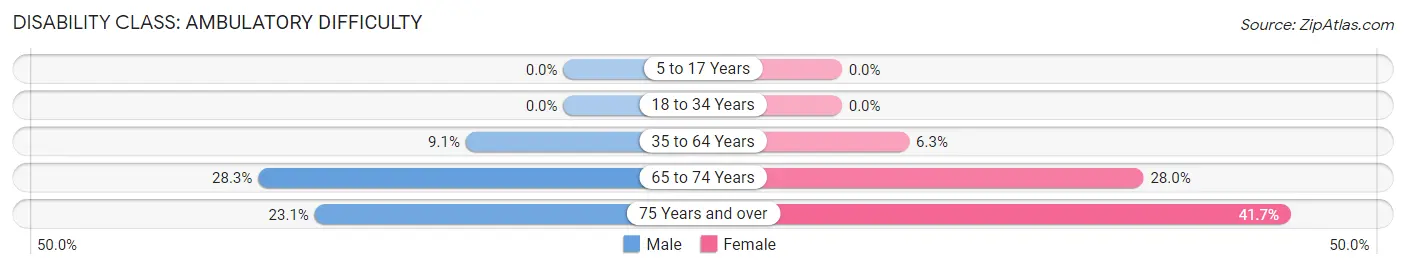
| Age Bracket | Male | Female |
| 5 to 17 Years | 0 (0.0%) | 0 (0.0%) |
| 18 to 34 Years | 0 (0.0%) | 0 (0.0%) |
| 35 to 64 Years | 23 (9.1%) | 10 (6.2%) |
| 65 to 74 Years | 17 (28.3%) | 14 (28.0%) |
| 75 Years and over | 3 (23.1%) | 20 (41.7%) |
Disability Class: Self-Care Difficulty
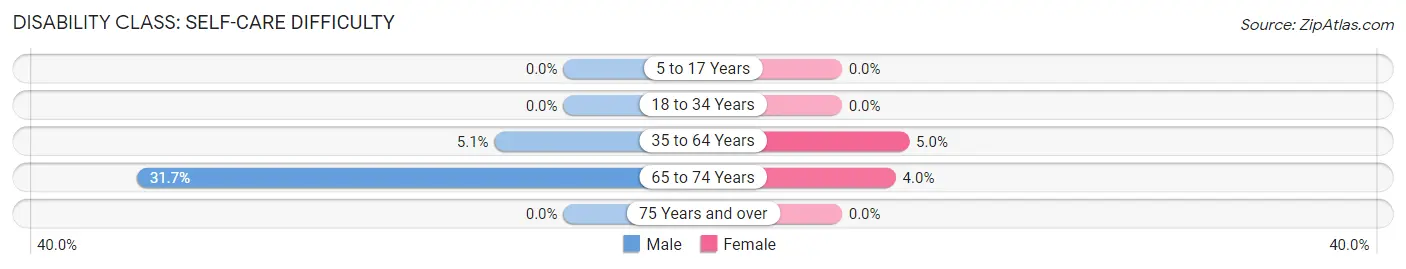
| Age Bracket | Male | Female |
| 5 to 17 Years | 0 (0.0%) | 0 (0.0%) |
| 18 to 34 Years | 0 (0.0%) | 0 (0.0%) |
| 35 to 64 Years | 13 (5.1%) | 8 (5.0%) |
| 65 to 74 Years | 19 (31.7%) | 2 (4.0%) |
| 75 Years and over | 0 (0.0%) | 0 (0.0%) |
Technology Access in Muscoda
Computing Device Access in Muscoda
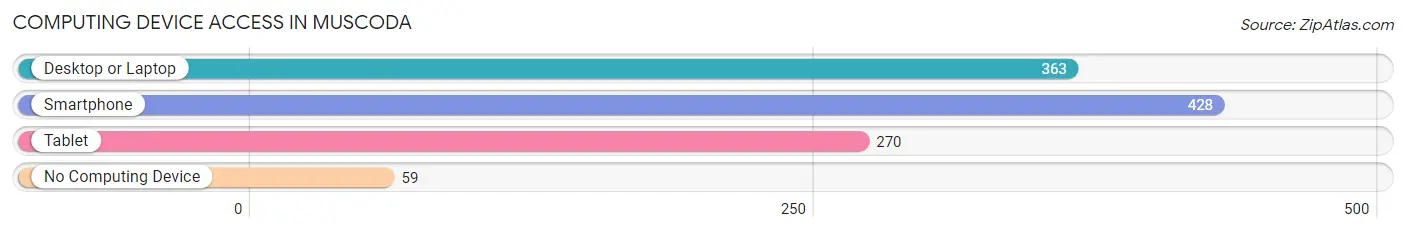
| Device Type | # Households | % Households |
| Desktop or Laptop | 363 | 68.6% |
| Smartphone | 428 | 80.9% |
| Tablet | 270 | 51.0% |
| No Computing Device | 59 | 11.2% |
| Total | 529 | 100.0% |
Internet Access in Muscoda
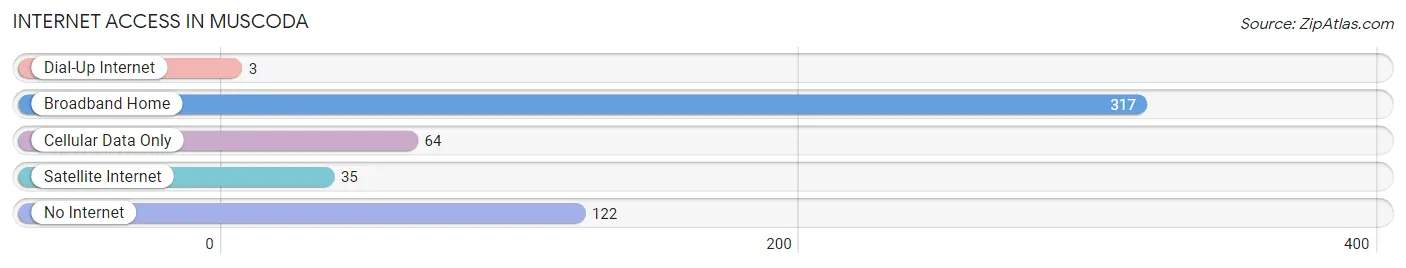
| Internet Type | # Households | % Households |
| Dial-Up Internet | 3 | 0.6% |
| Broadband Home | 317 | 59.9% |
| Cellular Data Only | 64 | 12.1% |
| Satellite Internet | 35 | 6.6% |
| No Internet | 122 | 23.1% |
| Total | 529 | 100.0% |
Muscoda Summary
Muscoda, Wisconsin is a small village located in Grant County, Wisconsin. It is situated on the banks of the Wisconsin River, and is part of the larger Wisconsin Dells metropolitan area. The village has a population of 1,092 as of the 2010 census, and is the county seat of Grant County.
History
The area that is now Muscoda was first settled in the early 1830s by a group of settlers from New York. The village was originally known as “Muscoda Settlement”, and was officially incorporated in 1856. The name “Muscoda” is derived from the Ho-Chunk (Winnebago) word “Meskoda”, which means “red earth”.
The village was an important stop on the Wisconsin Central Railroad, which ran through the area in the late 19th century. The railroad brought increased economic activity to the area, and the village grew rapidly. By the early 20th century, Muscoda had become a major center for the lumber industry, and the village was home to several sawmills and other wood-related businesses.
Geography
Muscoda is located in southwestern Wisconsin, in Grant County. It is situated on the banks of the Wisconsin River, and is part of the larger Wisconsin Dells metropolitan area. The village is located approximately 25 miles south of Madison, and is about a two-hour drive from Milwaukee.
The village has a total area of 1.2 square miles, all of which is land. The terrain is mostly flat, with some rolling hills in the surrounding area. The climate is humid continental, with cold winters and hot, humid summers.
Economy
The economy of Muscoda is largely based on agriculture and tourism. The village is home to several farms, and the surrounding area is known for its dairy production. The village is also a popular tourist destination, and is home to several resorts and attractions.
The village is also home to several small businesses, including restaurants, retail stores, and service providers. The village is also home to a branch of the Grant County Bank, which serves the local community.
Demographics
As of the 2010 census, the population of Muscoda was 1,092. The racial makeup of the village was 97.2% White, 0.7% African American, 0.2% Native American, 0.2% Asian, 0.1% Pacific Islander, 0.7% from other races, and 0.9% from two or more races. Hispanic or Latino of any race were 1.7% of the population.
The median household income in Muscoda was $37,917, and the median family income was $45,000. The per capita income for the village was $19,845. About 11.2% of families and 14.2% of the population were below the poverty line, including 18.2% of those under age 18 and 8.3% of those age 65 or over.
Common Questions
What is Per Capita Income in Muscoda?
Per Capita income in Muscoda is $28,438.
What is the Median Family Income in Muscoda?
Median Family Income in Muscoda is $62,273.
What is the Median Household income in Muscoda?
Median Household Income in Muscoda is $51,016.
What is Income or Wage Gap in Muscoda?
Income or Wage Gap in Muscoda is 32.9%.
Women in Muscoda earn 67.1 cents for every dollar earned by a man.
What is Inequality or Gini Index in Muscoda?
Inequality or Gini Index in Muscoda is 0.38.
What is the Total Population of Muscoda?
Total Population of Muscoda is 1,194.
What is the Total Male Population of Muscoda?
Total Male Population of Muscoda is 628.
What is the Total Female Population of Muscoda?
Total Female Population of Muscoda is 566.
What is the Ratio of Males per 100 Females in Muscoda?
There are 110.95 Males per 100 Females in Muscoda.
What is the Ratio of Females per 100 Males in Muscoda?
There are 90.13 Females per 100 Males in Muscoda.
What is the Median Population Age in Muscoda?
Median Population Age in Muscoda is 36.8 Years.
What is the Average Family Size in Muscoda
Average Family Size in Muscoda is 2.8 People.
What is the Average Household Size in Muscoda
Average Household Size in Muscoda is 2.2 People.
How Large is the Labor Force in Muscoda?
There are 637 People in the Labor Forcein in Muscoda.
What is the Percentage of People in the Labor Force in Muscoda?
64.3% of People are in the Labor Force in Muscoda.
What is the Unemployment Rate in Muscoda?
Unemployment Rate in Muscoda is 5.7%.