Mountain, WI Map & Demographics
Mountain Map
Mountain Overview
$29,048
PER CAPITA INCOME
$45,625
AVG FAMILY INCOME
$46,875
AVG HOUSEHOLD INCOME
0.6%
WAGE / INCOME GAP [ % ]
99.4¢/ $1
WAGE / INCOME GAP [ $ ]
0.43
INEQUALITY / GINI INDEX
262
TOTAL POPULATION
147
MALE POPULATION
115
FEMALE POPULATION
127.83
MALES / 100 FEMALES
78.23
FEMALES / 100 MALES
58.3
MEDIAN AGE
2.4
AVG FAMILY SIZE
2.1
AVG HOUSEHOLD SIZE
116
LABOR FORCE [ PEOPLE ]
50.7%
PERCENT IN LABOR FORCE
0.9%
UNEMPLOYMENT RATE
Mountain Zip Codes
Income in Mountain
Income Overview in Mountain
Per Capita Income in Mountain is $29,048, while median incomes of families and households are $45,625 and $46,875 respectively.
| Characteristic | Number | Measure |
| Per Capita Income | 262 | $29,048 |
| Median Family Income | 69 | $45,625 |
| Mean Family Income | 69 | $63,410 |
| Median Household Income | 127 | $46,875 |
| Mean Household Income | 127 | $57,759 |
| Income Deficit | 69 | $0 |
| Wage / Income Gap (%) | 262 | 0.57% |
| Wage / Income Gap ($) | 262 | 99.43¢ per $1 |
| Gini / Inequality Index | 262 | 0.43 |
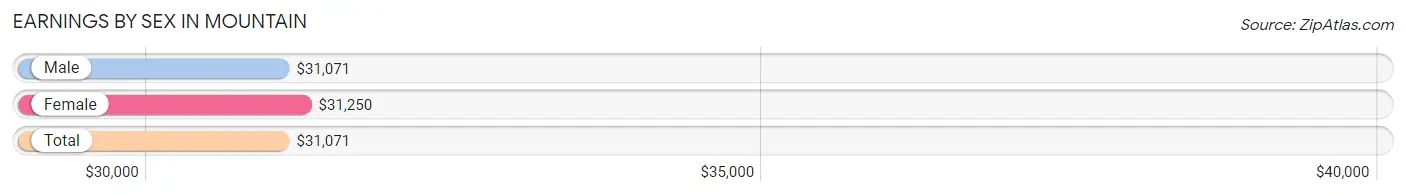
Earnings by Sex in Mountain
Average Earnings in Mountain are $31,071, $31,071 for men and $31,250 for women, a difference of 0.6%.
| Sex | Number | Average Earnings |
| Male | 76 (58.5%) | $31,071 |
| Female | 54 (41.5%) | $31,250 |
| Total | 130 (100.0%) | $31,071 |
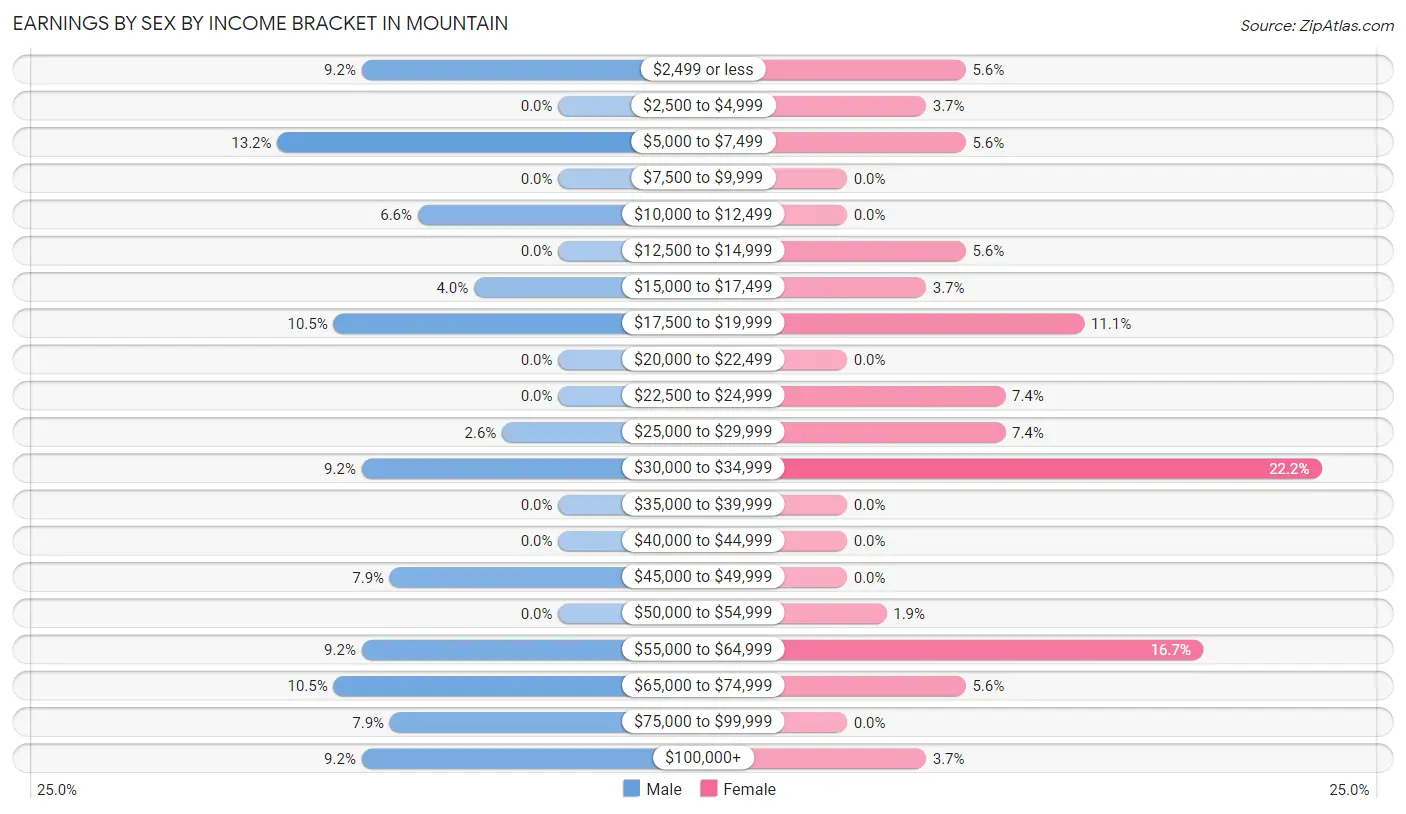
Earnings by Sex by Income Bracket in Mountain
The most common earnings brackets in Mountain are $5,000 to $7,499 for men (10 | 13.2%) and $30,000 to $34,999 for women (12 | 22.2%).
| Income | Male | Female |
| $2,499 or less | 7 (9.2%) | 3 (5.6%) |
| $2,500 to $4,999 | 0 (0.0%) | 2 (3.7%) |
| $5,000 to $7,499 | 10 (13.2%) | 3 (5.6%) |
| $7,500 to $9,999 | 0 (0.0%) | 0 (0.0%) |
| $10,000 to $12,499 | 5 (6.6%) | 0 (0.0%) |
| $12,500 to $14,999 | 0 (0.0%) | 3 (5.6%) |
| $15,000 to $17,499 | 3 (4.0%) | 2 (3.7%) |
| $17,500 to $19,999 | 8 (10.5%) | 6 (11.1%) |
| $20,000 to $22,499 | 0 (0.0%) | 0 (0.0%) |
| $22,500 to $24,999 | 0 (0.0%) | 4 (7.4%) |
| $25,000 to $29,999 | 2 (2.6%) | 4 (7.4%) |
| $30,000 to $34,999 | 7 (9.2%) | 12 (22.2%) |
| $35,000 to $39,999 | 0 (0.0%) | 0 (0.0%) |
| $40,000 to $44,999 | 0 (0.0%) | 0 (0.0%) |
| $45,000 to $49,999 | 6 (7.9%) | 0 (0.0%) |
| $50,000 to $54,999 | 0 (0.0%) | 1 (1.8%) |
| $55,000 to $64,999 | 7 (9.2%) | 9 (16.7%) |
| $65,000 to $74,999 | 8 (10.5%) | 3 (5.6%) |
| $75,000 to $99,999 | 6 (7.9%) | 0 (0.0%) |
| $100,000+ | 7 (9.2%) | 2 (3.7%) |
| Total | 76 (100.0%) | 54 (100.0%) |
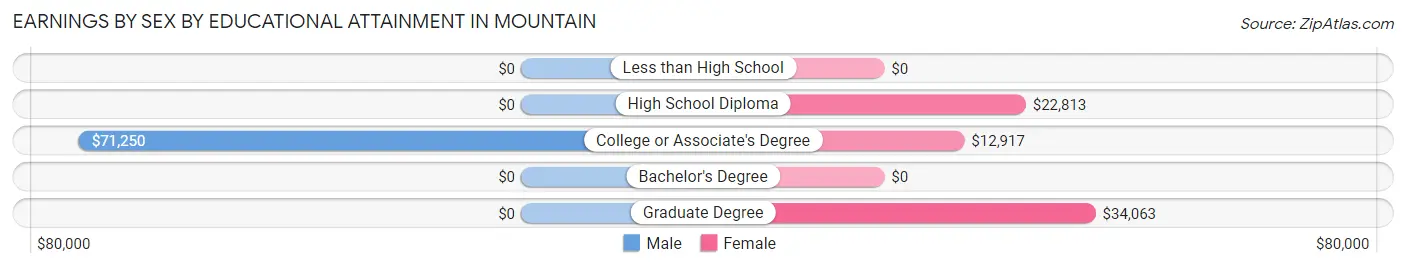
Earnings by Sex by Educational Attainment in Mountain
Average earnings in Mountain are $31,071 for men and $31,250 for women, a difference of 0.6%. Men with an educational attainment of college or associate's degree enjoy the highest average annual earnings of $71,250, while those with college or associate's degree education earn the least with $71,250. Women with an educational attainment of graduate degree earn the most with the average annual earnings of $34,063, while those with college or associate's degree education have the smallest earnings of $12,917.
| Educational Attainment | Male Income | Female Income |
| Less than High School | - | - |
| High School Diploma | - | - |
| College or Associate's Degree | $71,250 | $12,917 |
| Bachelor's Degree | - | - |
| Graduate Degree | - | - |
| Total | $31,071 | $31,250 |
Family Income in Mountain
Family Income Brackets in Mountain
According to the Mountain family income data, there are 14 families falling into the $25,000 to $34,999 income range, which is the most common income bracket and makes up 20.3% of all families.
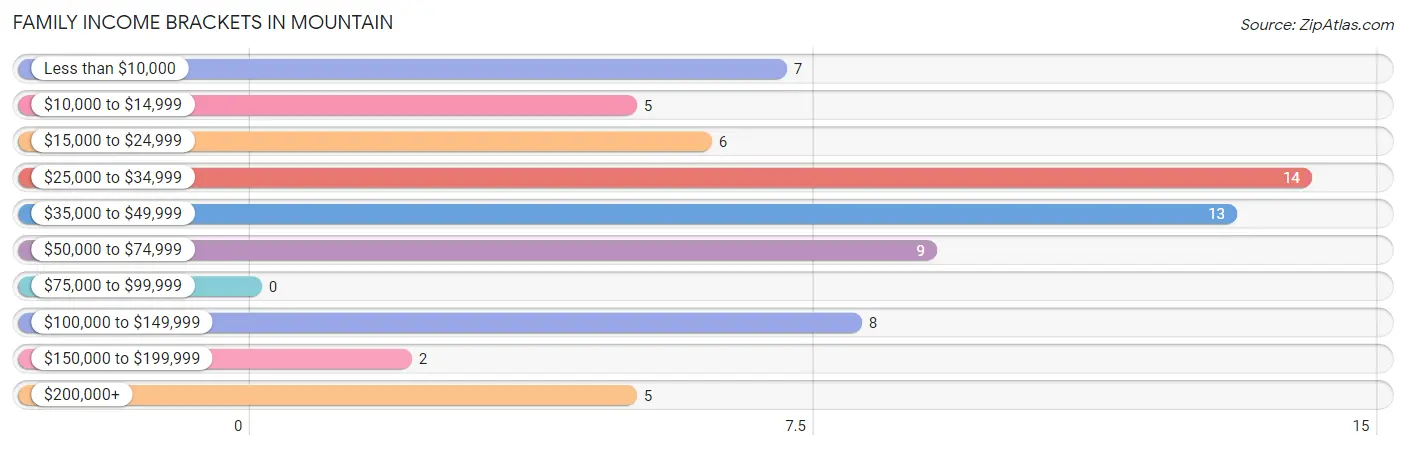
| Income Bracket | # Families | % Families |
| Less than $10,000 | 7 | 10.1% |
| $10,000 to $14,999 | 5 | 7.2% |
| $15,000 to $24,999 | 6 | 8.7% |
| $25,000 to $34,999 | 14 | 20.3% |
| $35,000 to $49,999 | 13 | 18.8% |
| $50,000 to $74,999 | 9 | 13.0% |
| $75,000 to $99,999 | 0 | 0.0% |
| $100,000 to $149,999 | 8 | 11.6% |
| $150,000 to $199,999 | 2 | 2.9% |
| $200,000+ | 5 | 7.2% |
Family Income by Famaliy Size in Mountain
3-person families (10 | 14.5%) account for the highest median family income in Mountain with $56,250 per family, while 3-person families (10 | 14.5%) have the highest median income of $18,750 per family member.
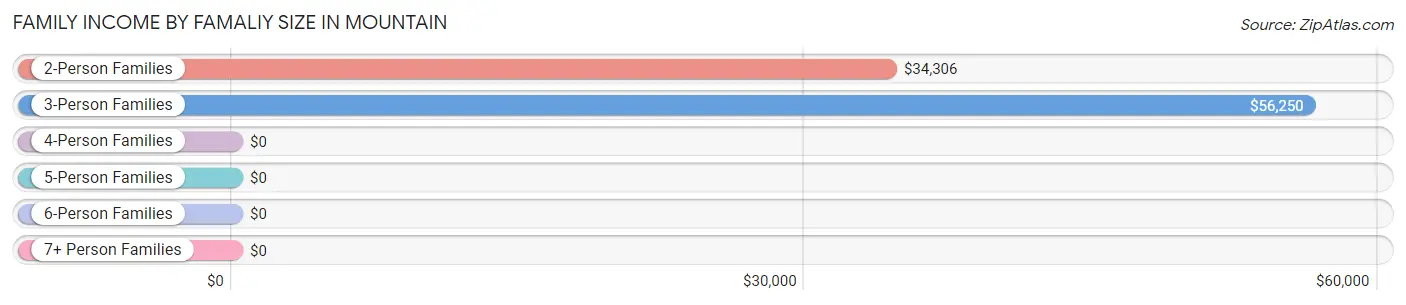
| Income Bracket | # Families | Median Income |
| 2-Person Families | 53 (76.8%) | $34,306 |
| 3-Person Families | 10 (14.5%) | $56,250 |
| 4-Person Families | 4 (5.8%) | $0 |
| 5-Person Families | 2 (2.9%) | $0 |
| 6-Person Families | 0 (0.0%) | $0 |
| 7+ Person Families | 0 (0.0%) | $0 |
| Total | 69 (100.0%) | $45,625 |
Family Income by Number of Earners in Mountain
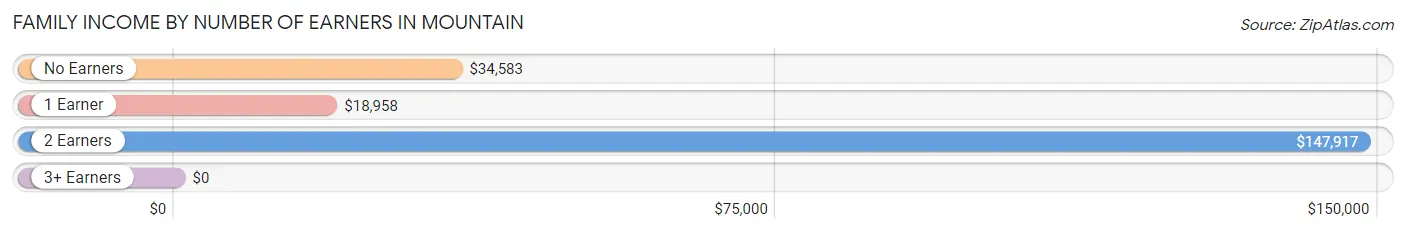
| Number of Earners | # Families | Median Income |
| No Earners | 28 (40.6%) | $34,583 |
| 1 Earner | 17 (24.6%) | $18,958 |
| 2 Earners | 19 (27.5%) | $147,917 |
| 3+ Earners | 5 (7.2%) | $0 |
| Total | 69 (100.0%) | $45,625 |
Household Income in Mountain
Household Income Brackets in Mountain
With 39 households falling in the category, the $35,000 to $49,999 income range is the most frequent in Mountain, accounting for 30.7% of all households. In contrast, only 2 households (1.6%) fall into the $150,000 to $199,999 income bracket, making it the least populous group.
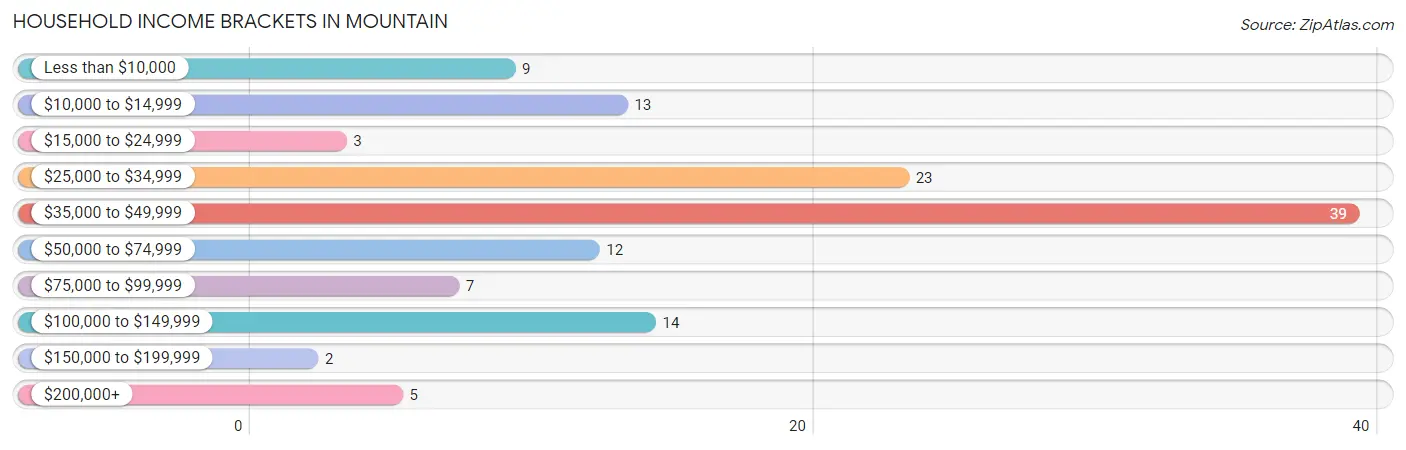
| Income Bracket | # Households | % Households |
| Less than $10,000 | 9 | 7.1% |
| $10,000 to $14,999 | 13 | 10.2% |
| $15,000 to $24,999 | 3 | 2.4% |
| $25,000 to $34,999 | 23 | 18.1% |
| $35,000 to $49,999 | 39 | 30.7% |
| $50,000 to $74,999 | 12 | 9.4% |
| $75,000 to $99,999 | 7 | 5.5% |
| $100,000 to $149,999 | 14 | 11.0% |
| $150,000 to $199,999 | 2 | 1.6% |
| $200,000+ | 5 | 3.9% |
Household Income by Householder Age in Mountain
The median household income in Mountain is $46,875, with the highest median household income of $48,125 found in the 45 to 64 years age bracket for the primary householder. A total of 59 households (46.5%) fall into this category.
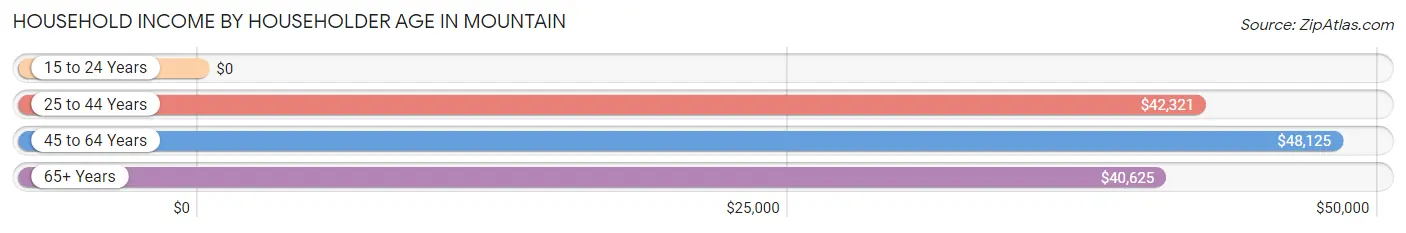
| Income Bracket | # Households | Median Income |
| 15 to 24 Years | 0 (0.0%) | $0 |
| 25 to 44 Years | 19 (15.0%) | $42,321 |
| 45 to 64 Years | 59 (46.5%) | $48,125 |
| 65+ Years | 49 (38.6%) | $40,625 |
| Total | 127 (100.0%) | $46,875 |
Poverty in Mountain
Income Below Poverty by Sex and Age in Mountain
With 22.9% poverty level for males and 20.5% for females among the residents of Mountain, 25 to 34 year old males and 12 to 14 year old females are the most vulnerable to poverty, with 7 males (50.0%) and 2 females (100.0%) in their respective age groups living below the poverty level.
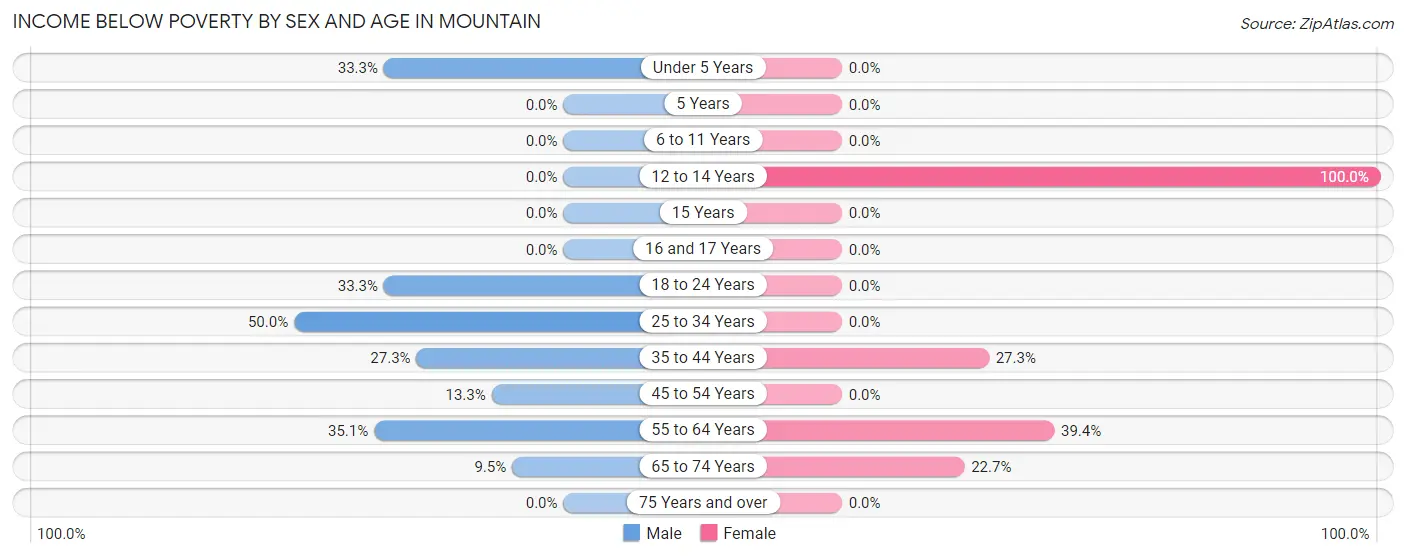
| Age Bracket | Male | Female |
| Under 5 Years | 3 (33.3%) | 0 (0.0%) |
| 5 Years | 0 (0.0%) | 0 (0.0%) |
| 6 to 11 Years | 0 (0.0%) | 0 (0.0%) |
| 12 to 14 Years | 0 (0.0%) | 2 (100.0%) |
| 15 Years | 0 (0.0%) | 0 (0.0%) |
| 16 and 17 Years | 0 (0.0%) | 0 (0.0%) |
| 18 to 24 Years | 1 (33.3%) | 0 (0.0%) |
| 25 to 34 Years | 7 (50.0%) | 0 (0.0%) |
| 35 to 44 Years | 3 (27.3%) | 3 (27.3%) |
| 45 to 54 Years | 2 (13.3%) | 0 (0.0%) |
| 55 to 64 Years | 13 (35.1%) | 13 (39.4%) |
| 65 to 74 Years | 4 (9.5%) | 5 (22.7%) |
| 75 Years and over | 0 (0.0%) | 0 (0.0%) |
| Total | 33 (22.9%) | 23 (20.5%) |
Income Above Poverty by Sex and Age in Mountain
According to the poverty statistics in Mountain, males aged 5 years and females aged 6 to 11 years are the age groups that are most secure financially, with 100.0% of males and 100.0% of females in these age groups living above the poverty line.
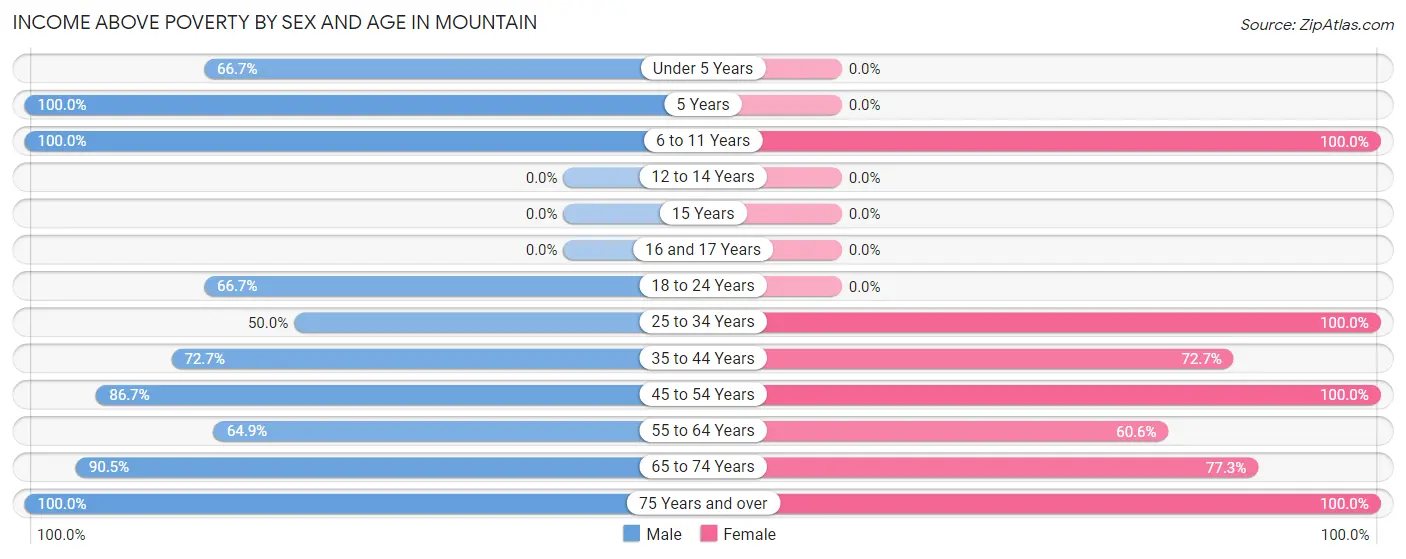
| Age Bracket | Male | Female |
| Under 5 Years | 6 (66.7%) | 0 (0.0%) |
| 5 Years | 3 (100.0%) | 0 (0.0%) |
| 6 to 11 Years | 8 (100.0%) | 5 (100.0%) |
| 12 to 14 Years | 0 (0.0%) | 0 (0.0%) |
| 15 Years | 0 (0.0%) | 0 (0.0%) |
| 16 and 17 Years | 0 (0.0%) | 0 (0.0%) |
| 18 to 24 Years | 2 (66.7%) | 0 (0.0%) |
| 25 to 34 Years | 7 (50.0%) | 16 (100.0%) |
| 35 to 44 Years | 8 (72.7%) | 8 (72.7%) |
| 45 to 54 Years | 13 (86.7%) | 10 (100.0%) |
| 55 to 64 Years | 24 (64.9%) | 20 (60.6%) |
| 65 to 74 Years | 38 (90.5%) | 17 (77.3%) |
| 75 Years and over | 2 (100.0%) | 13 (100.0%) |
| Total | 111 (77.1%) | 89 (79.5%) |
Income Below Poverty Among Married-Couple Families in Mountain
The poverty statistics for married-couple families in Mountain show that 18.9% or 10 of the total 53 families live below the poverty line. Families with no children have the highest poverty rate of 21.3%, comprising of 10 families. On the other hand, families with 1 or 2 children have the lowest poverty rate of 0.0%, which includes 0 families.
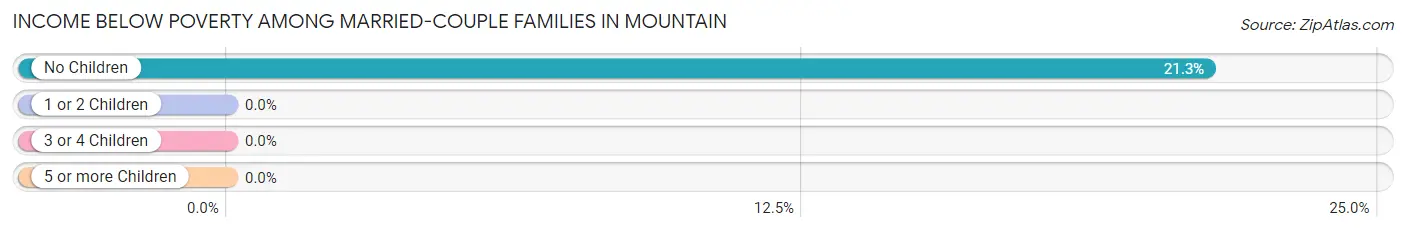
| Children | Above Poverty | Below Poverty |
| No Children | 37 (78.7%) | 10 (21.3%) |
| 1 or 2 Children | 6 (100.0%) | 0 (0.0%) |
| 3 or 4 Children | 0 (0.0%) | 0 (0.0%) |
| 5 or more Children | 0 (0.0%) | 0 (0.0%) |
| Total | 43 (81.1%) | 10 (18.9%) |
Income Below Poverty Among Single-Parent Households in Mountain
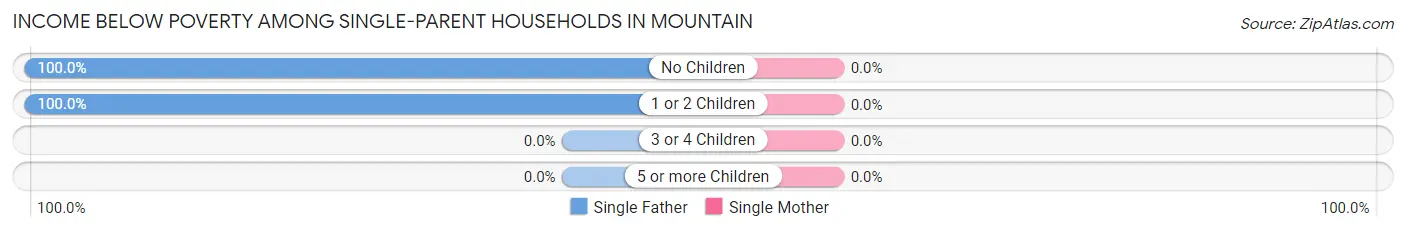
| Children | Single Father | Single Mother |
| No Children | 2 (100.0%) | 0 (0.0%) |
| 1 or 2 Children | 3 (100.0%) | 0 (0.0%) |
| 3 or 4 Children | 0 (0.0%) | 0 (0.0%) |
| 5 or more Children | 0 (0.0%) | 0 (0.0%) |
| Total | 5 (100.0%) | 0 (0.0%) |
Income Below Poverty Among Married-Couple vs Single-Parent Households in Mountain
The poverty data for Mountain shows that 10 of the married-couple family households (18.9%) and 5 of the single-parent households (31.2%) are living below the poverty level. Within the married-couple family households, those with no children have the highest poverty rate, with 10 households (21.3%) falling below the poverty line. Among the single-parent households, those with 1 or 2 children have the highest poverty rate, with 3 household (33.3%) living below poverty.
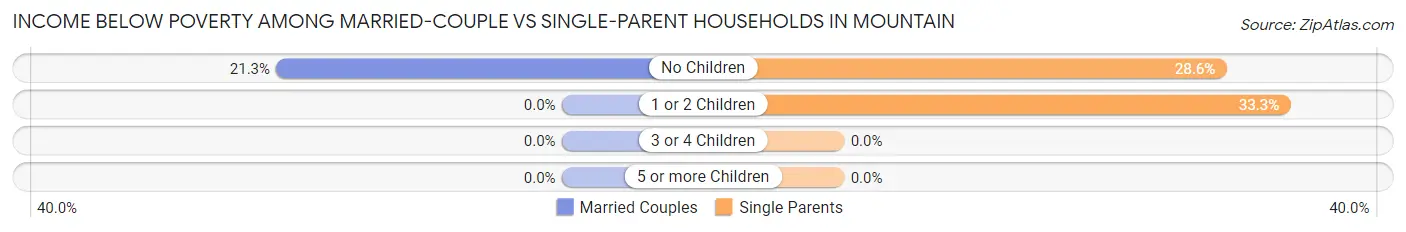
| Children | Married-Couple Families | Single-Parent Households |
| No Children | 10 (21.3%) | 2 (28.6%) |
| 1 or 2 Children | 0 (0.0%) | 3 (33.3%) |
| 3 or 4 Children | 0 (0.0%) | 0 (0.0%) |
| 5 or more Children | 0 (0.0%) | 0 (0.0%) |
| Total | 10 (18.9%) | 5 (31.2%) |
Race in Mountain
The most populous races in Mountain are White / Caucasian (234 | 89.3%), Asian (19 | 7.2%), and Hispanic or Latino (7 | 2.7%).
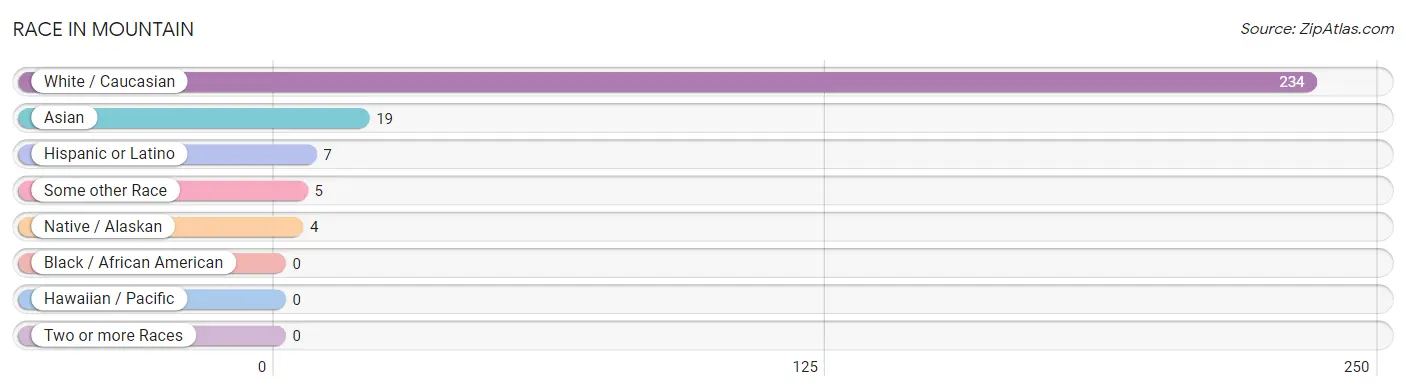
| Race | # Population | % Population |
| Asian | 19 | 7.2% |
| Black / African American | 0 | 0.0% |
| Hawaiian / Pacific | 0 | 0.0% |
| Hispanic or Latino | 7 | 2.7% |
| Native / Alaskan | 4 | 1.5% |
| White / Caucasian | 234 | 89.3% |
| Two or more Races | 0 | 0.0% |
| Some other Race | 5 | 1.9% |
| Total | 262 | 100.0% |
Ancestry in Mountain
The most populous ancestries reported in Mountain are German (106 | 40.5%), American (56 | 21.4%), Irish (23 | 8.8%), Polish (23 | 8.8%), and Dutch (19 | 7.2%), together accounting for 86.6% of all Mountain residents.
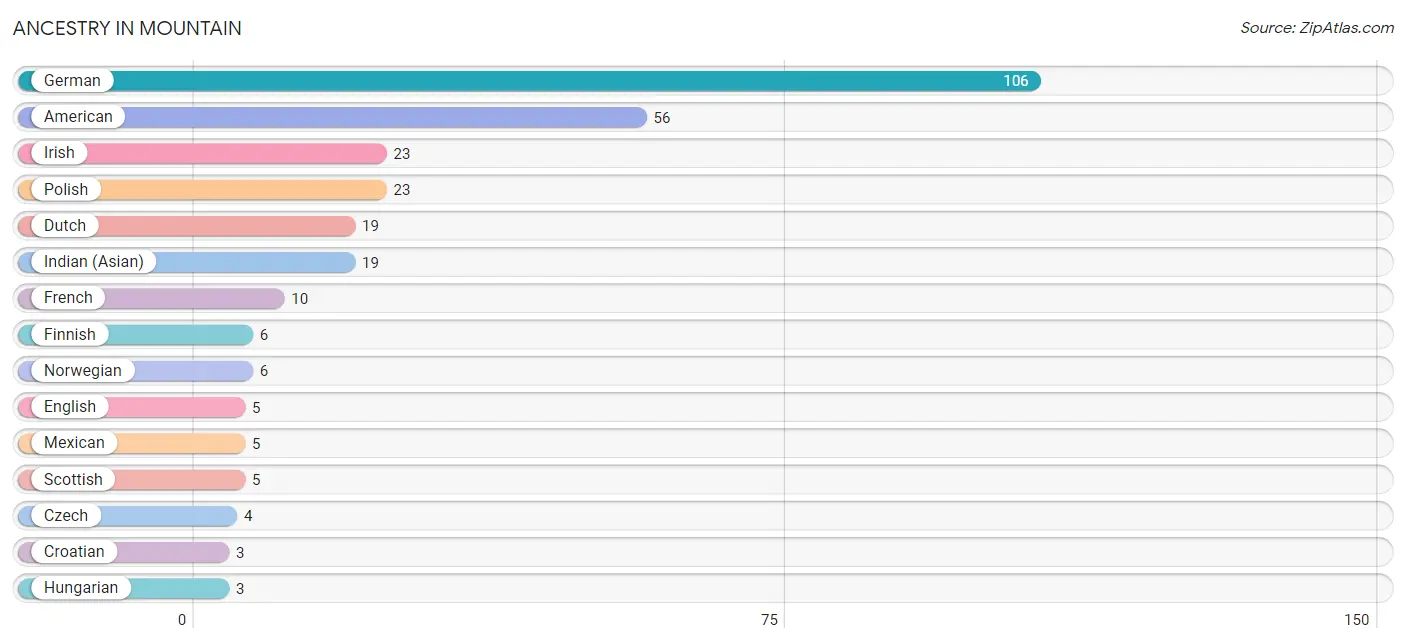
| Ancestry | # Population | % Population |
| American | 56 | 21.4% |
| Croatian | 3 | 1.1% |
| Czech | 4 | 1.5% |
| Dutch | 19 | 7.2% |
| English | 5 | 1.9% |
| Finnish | 6 | 2.3% |
| French | 10 | 3.8% |
| French Canadian | 2 | 0.8% |
| German | 106 | 40.5% |
| Hungarian | 3 | 1.1% |
| Indian (Asian) | 19 | 7.2% |
| Irish | 23 | 8.8% |
| Mexican | 5 | 1.9% |
| Norwegian | 6 | 2.3% |
| Polish | 23 | 8.8% |
| Puerto Rican | 2 | 0.8% |
| Russian | 3 | 1.1% |
| Scottish | 5 | 1.9% |
| Swedish | 3 | 1.1% | View All 19 Rows |
Immigrants in Mountain
The most numerous immigrant groups reported in Mountain came from Asia (19 | 7.2%), China (19 | 7.2%), and Eastern Asia (19 | 7.2%), together accounting for 21.7% of all Mountain residents.
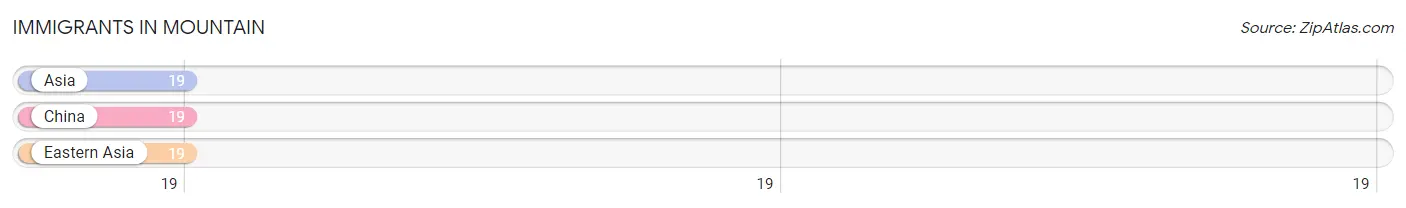
| Immigration Origin | # Population | % Population |
| Asia | 19 | 7.2% |
| China | 19 | 7.2% |
| Eastern Asia | 19 | 7.2% | View All 3 Rows |
Sex and Age in Mountain
Sex and Age in Mountain
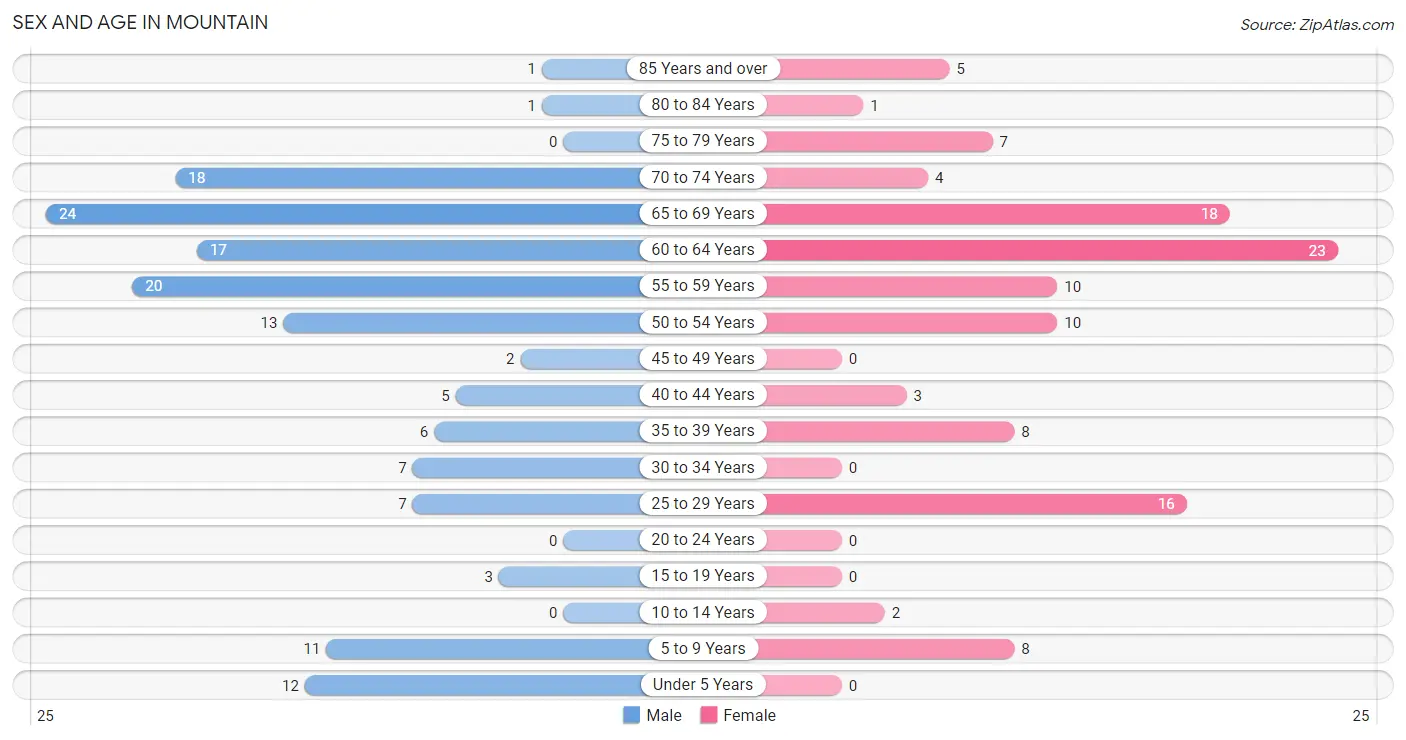
The most populous age groups in Mountain are 65 to 69 Years (24 | 16.3%) for men and 60 to 64 Years (23 | 20.0%) for women.
| Age Bracket | Male | Female |
| Under 5 Years | 12 (8.2%) | 0 (0.0%) |
| 5 to 9 Years | 11 (7.5%) | 8 (7.0%) |
| 10 to 14 Years | 0 (0.0%) | 2 (1.7%) |
| 15 to 19 Years | 3 (2.0%) | 0 (0.0%) |
| 20 to 24 Years | 0 (0.0%) | 0 (0.0%) |
| 25 to 29 Years | 7 (4.8%) | 16 (13.9%) |
| 30 to 34 Years | 7 (4.8%) | 0 (0.0%) |
| 35 to 39 Years | 6 (4.1%) | 8 (7.0%) |
| 40 to 44 Years | 5 (3.4%) | 3 (2.6%) |
| 45 to 49 Years | 2 (1.4%) | 0 (0.0%) |
| 50 to 54 Years | 13 (8.8%) | 10 (8.7%) |
| 55 to 59 Years | 20 (13.6%) | 10 (8.7%) |
| 60 to 64 Years | 17 (11.6%) | 23 (20.0%) |
| 65 to 69 Years | 24 (16.3%) | 18 (15.7%) |
| 70 to 74 Years | 18 (12.2%) | 4 (3.5%) |
| 75 to 79 Years | 0 (0.0%) | 7 (6.1%) |
| 80 to 84 Years | 1 (0.7%) | 1 (0.9%) |
| 85 Years and over | 1 (0.7%) | 5 (4.3%) |
| Total | 147 (100.0%) | 115 (100.0%) |
Families and Households in Mountain
Median Family Size in Mountain
The median family size in Mountain is 2.39 persons per family, with married-couple families (53 | 76.8%) accounting for the largest median family size of 2.49 persons per family. On the other hand, single female/mother families (11 | 15.9%) represent the smallest median family size with 2.00 persons per family.
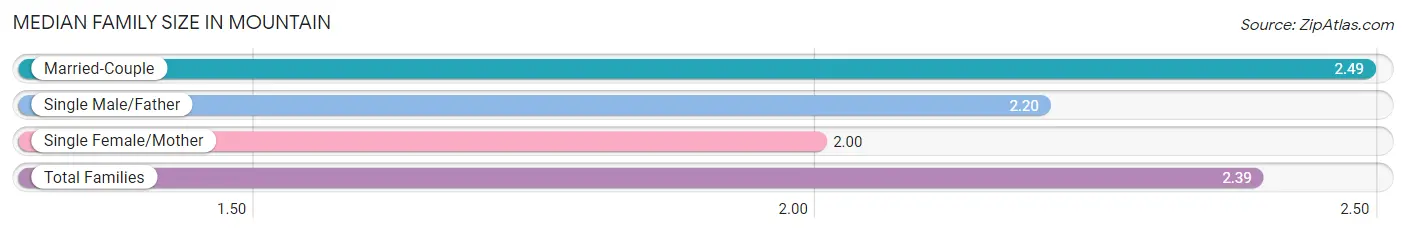
| Family Type | # Families | Family Size |
| Married-Couple | 53 (76.8%) | 2.49 |
| Single Male/Father | 5 (7.2%) | 2.20 |
| Single Female/Mother | 11 (15.9%) | 2.00 |
| Total Families | 69 (100.0%) | 2.39 |
Median Household Size in Mountain
The median household size in Mountain is 2.06 persons per household, with single male/father households (5 | 3.9%) accounting for the largest median household size of 3.4 persons per household. non-family households (58 | 45.7%) represent the smallest median household size with 1.52 persons per household.
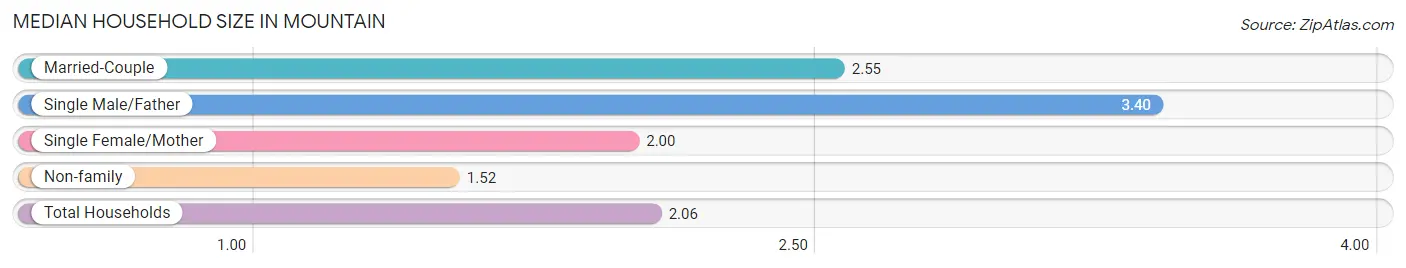
| Household Type | # Households | Household Size |
| Married-Couple | 53 (41.7%) | 2.55 |
| Single Male/Father | 5 (3.9%) | 3.40 |
| Single Female/Mother | 11 (8.7%) | 2.00 |
| Non-family | 58 (45.7%) | 1.52 |
| Total Households | 127 (100.0%) | 2.06 |
Household Size by Marriage Status in Mountain
Out of a total of 127 households in Mountain, 69 (54.3%) are family households, while 58 (45.7%) are nonfamily households. The most numerous type of family households are 2-person households, comprising 50, and the most common type of nonfamily households are 1-person households, comprising 31.
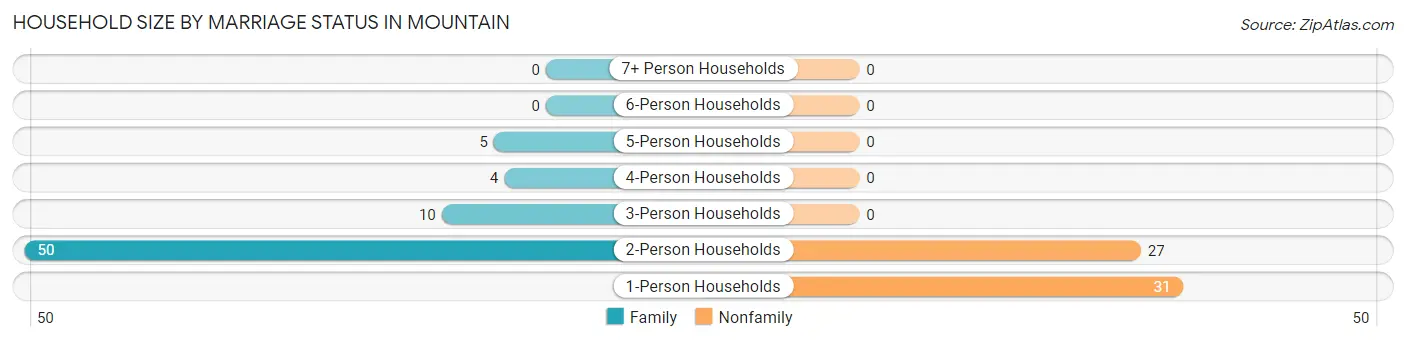
| Household Size | Family Households | Nonfamily Households |
| 1-Person Households | - | 31 (24.4%) |
| 2-Person Households | 50 (39.4%) | 27 (21.3%) |
| 3-Person Households | 10 (7.9%) | 0 (0.0%) |
| 4-Person Households | 4 (3.2%) | 0 (0.0%) |
| 5-Person Households | 5 (3.9%) | 0 (0.0%) |
| 6-Person Households | 0 (0.0%) | 0 (0.0%) |
| 7+ Person Households | 0 (0.0%) | 0 (0.0%) |
| Total | 69 (54.3%) | 58 (45.7%) |
Female Fertility in Mountain
Fertility by Age in Mountain
| Age Bracket | Women with Births | Births / 1,000 Women |
| 15 to 19 years | 0 (0.0%) | 0.0 |
| 20 to 34 years | 0 (0.0%) | 0.0 |
| 35 to 50 years | 0 (0.0%) | 0.0 |
| Total | 0 (0.0%) | 0.0 |
Fertility by Age by Marriage Status in Mountain
| Age Bracket | Married | Unmarried |
| 15 to 19 years | 0 (0.0%) | 0 (0.0%) |
| 20 to 34 years | 0 (0.0%) | 0 (0.0%) |
| 35 to 50 years | 0 (0.0%) | 0 (0.0%) |
| Total | 0 (0.0%) | 0 (0.0%) |
Fertility by Education in Mountain
| Educational Attainment | Women with Births | Births / 1,000 Women |
| Less than High School | 0 (0.0%) | 0.0 |
| High School Diploma | 0 (0.0%) | 0.0 |
| College or Associate's Degree | 0 (0.0%) | 0.0 |
| Bachelor's Degree | 0 (0.0%) | 0.0 |
| Graduate Degree | 0 (0.0%) | 0.0 |
| Total | 0 (0.0%) | 0.0 |
Fertility by Education by Marriage Status in Mountain
| Educational Attainment | Married | Unmarried |
| Less than High School | 0 (0.0%) | 0 (0.0%) |
| High School Diploma | 0 (0.0%) | 0 (0.0%) |
| College or Associate's Degree | 0 (0.0%) | 0 (0.0%) |
| Bachelor's Degree | 0 (0.0%) | 0 (0.0%) |
| Graduate Degree | 0 (0.0%) | 0 (0.0%) |
| Total | 0 (0.0%) | 0 (0.0%) |
Employment Characteristics in Mountain
Employment by Class of Employer in Mountain
Among the 110 employed individuals in Mountain, private company employees (77 | 70.0%), state government employees (12 | 10.9%), and self-employed (not incorporated) (9 | 8.2%) make up the most common classes of employment.
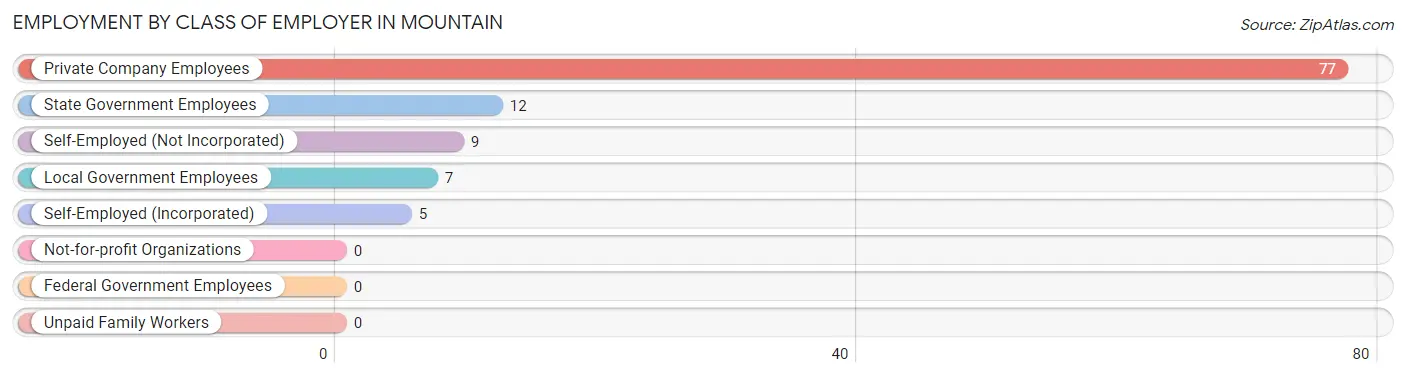
| Employer Class | # Employees | % Employees |
| Private Company Employees | 77 | 70.0% |
| Self-Employed (Incorporated) | 5 | 4.5% |
| Self-Employed (Not Incorporated) | 9 | 8.2% |
| Not-for-profit Organizations | 0 | 0.0% |
| Local Government Employees | 7 | 6.4% |
| State Government Employees | 12 | 10.9% |
| Federal Government Employees | 0 | 0.0% |
| Unpaid Family Workers | 0 | 0.0% |
| Total | 110 | 100.0% |
Employment Status by Age in Mountain
According to the labor force statistics for Mountain, out of the total population over 16 years of age (229), 50.7% or 116 individuals are in the labor force, with 0.9% or 1 of them unemployed. The age group with the highest labor force participation rate is 25 to 29 years, with 100.0% or 23 individuals in the labor force. Within the labor force, the 16 to 19 years age range has the highest percentage of unemployed individuals, with 100.0% or 1 of them being unemployed.
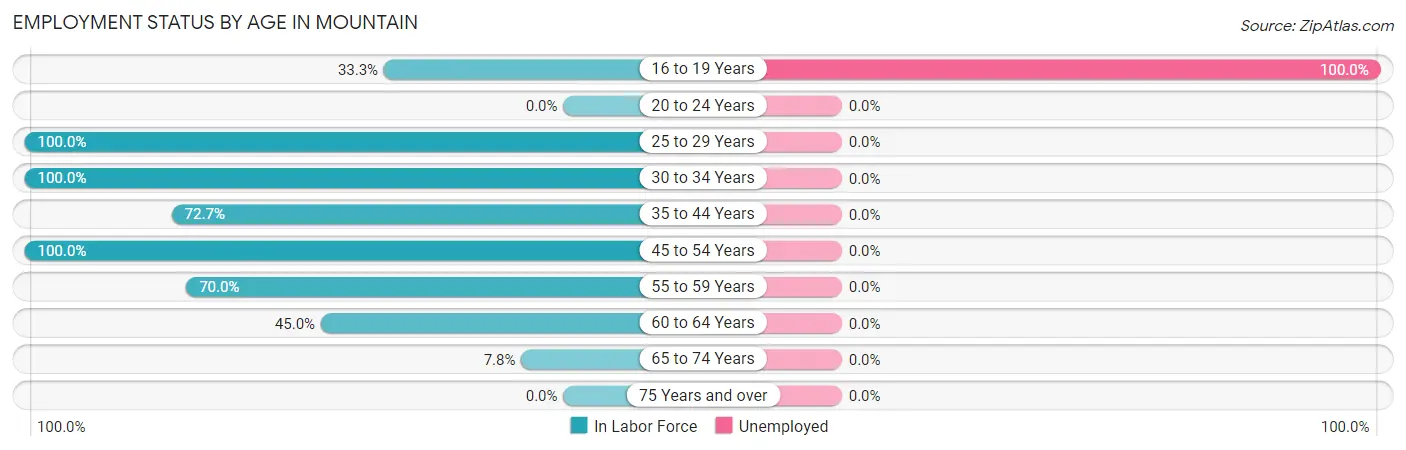
| Age Bracket | In Labor Force | Unemployed |
| 16 to 19 Years | 1 (33.3%) | 1 (100.0%) |
| 20 to 24 Years | 0 (0.0%) | 0 (0.0%) |
| 25 to 29 Years | 23 (100.0%) | 0 (0.0%) |
| 30 to 34 Years | 7 (100.0%) | 0 (0.0%) |
| 35 to 44 Years | 16 (72.7%) | 0 (0.0%) |
| 45 to 54 Years | 25 (100.0%) | 0 (0.0%) |
| 55 to 59 Years | 21 (70.0%) | 0 (0.0%) |
| 60 to 64 Years | 18 (45.0%) | 0 (0.0%) |
| 65 to 74 Years | 5 (7.8%) | 0 (0.0%) |
| 75 Years and over | 0 (0.0%) | 0 (0.0%) |
| Total | 116 (50.7%) | 1 (0.9%) |
Employment Status by Educational Attainment in Mountain
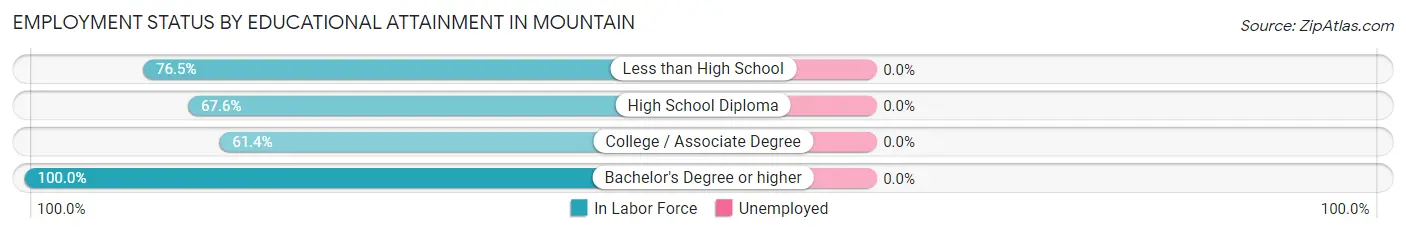
| Educational Attainment | In Labor Force | Unemployed |
| Less than High School | 26 (76.5%) | 0 (0.0%) |
| High School Diploma | 25 (67.6%) | 0 (0.0%) |
| College / Associate Degree | 27 (61.4%) | 0 (0.0%) |
| Bachelor's Degree or higher | 32 (100.0%) | 0 (0.0%) |
| Total | 110 (74.8%) | 0 (0.0%) |
Employment Occupations by Sex in Mountain
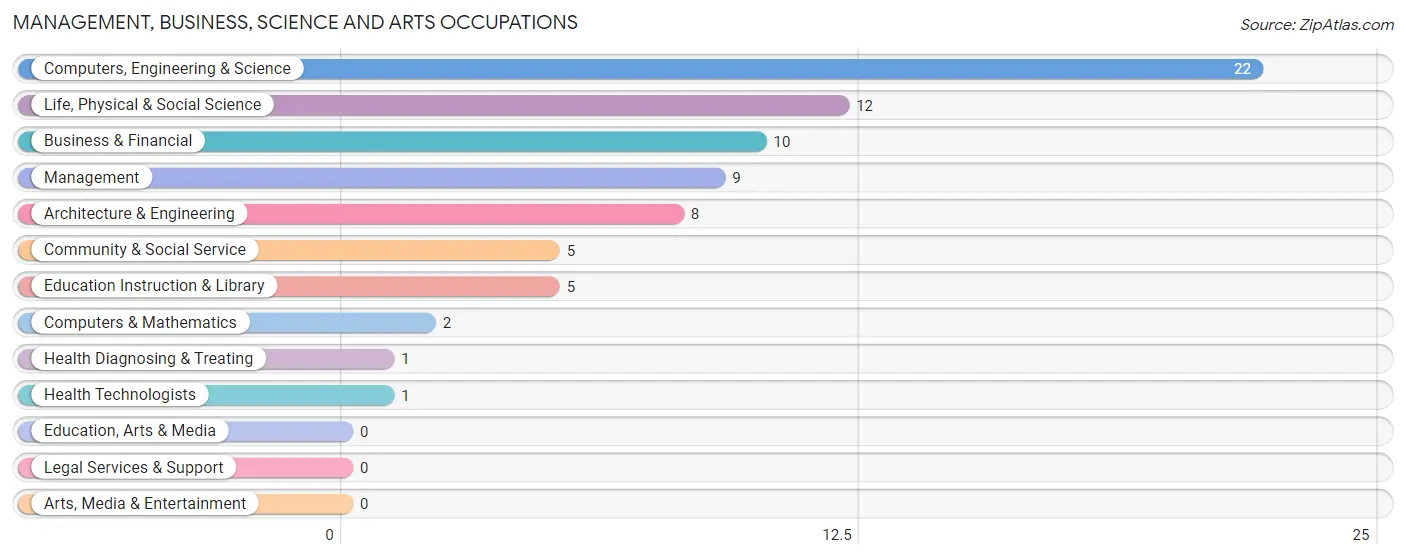
Management, Business, Science and Arts Occupations
The most common Management, Business, Science and Arts occupations in Mountain are Computers, Engineering & Science (22 | 19.1%), Life, Physical & Social Science (12 | 10.4%), Business & Financial (10 | 8.7%), Management (9 | 7.8%), and Architecture & Engineering (8 | 7.0%).
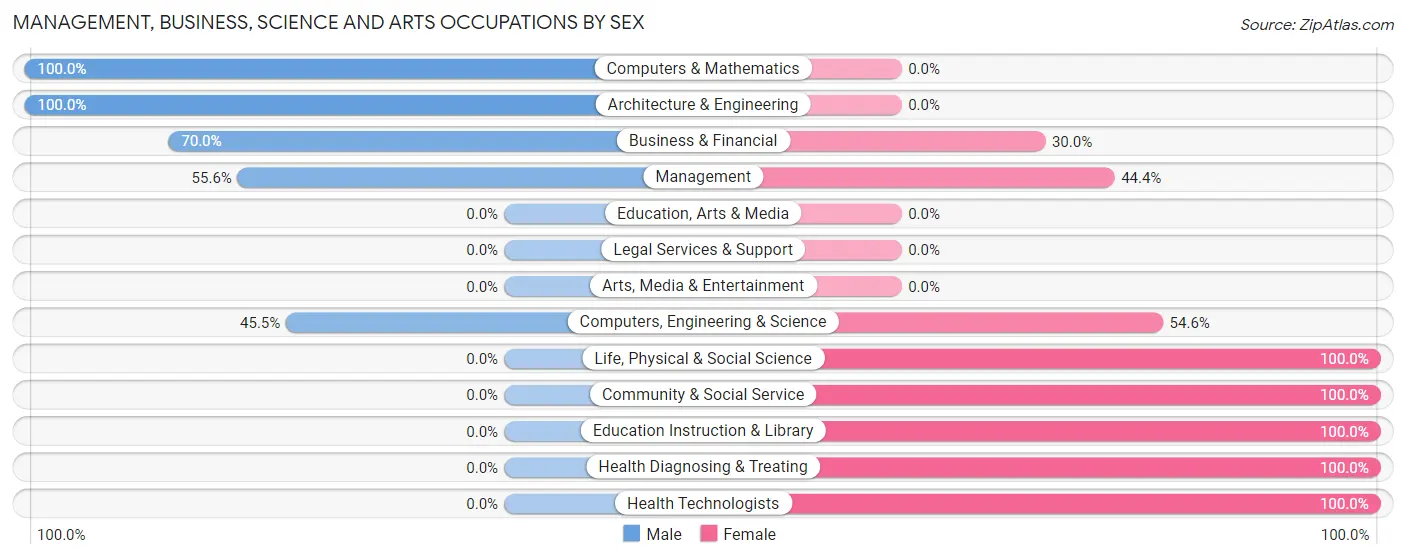
Management, Business, Science and Arts Occupations by Sex
Within the Management, Business, Science and Arts occupations in Mountain, the most male-oriented occupations are Computers & Mathematics (100.0%), Architecture & Engineering (100.0%), and Business & Financial (70.0%), while the most female-oriented occupations are Life, Physical & Social Science (100.0%), Community & Social Service (100.0%), and Education Instruction & Library (100.0%).
| Occupation | Male | Female |
| Management | 5 (55.6%) | 4 (44.4%) |
| Business & Financial | 7 (70.0%) | 3 (30.0%) |
| Computers, Engineering & Science | 10 (45.5%) | 12 (54.5%) |
| Computers & Mathematics | 2 (100.0%) | 0 (0.0%) |
| Architecture & Engineering | 8 (100.0%) | 0 (0.0%) |
| Life, Physical & Social Science | 0 (0.0%) | 12 (100.0%) |
| Community & Social Service | 0 (0.0%) | 5 (100.0%) |
| Education, Arts & Media | 0 (0.0%) | 0 (0.0%) |
| Legal Services & Support | 0 (0.0%) | 0 (0.0%) |
| Education Instruction & Library | 0 (0.0%) | 5 (100.0%) |
| Arts, Media & Entertainment | 0 (0.0%) | 0 (0.0%) |
| Health Diagnosing & Treating | 0 (0.0%) | 1 (100.0%) |
| Health Technologists | 0 (0.0%) | 1 (100.0%) |
| Total (Category) | 22 (46.8%) | 25 (53.2%) |
| Total (Overall) | 67 (58.3%) | 48 (41.7%) |
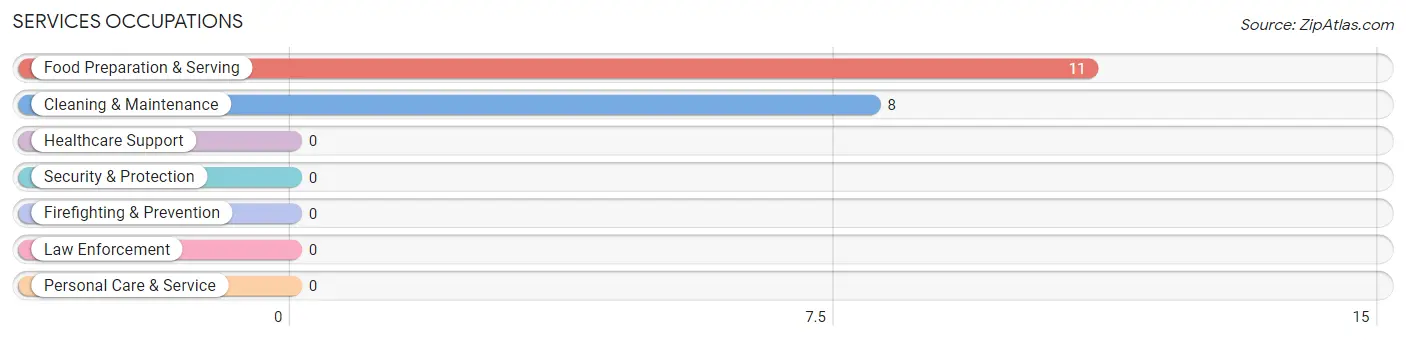
Services Occupations
The most common Services occupations in Mountain are Food Preparation & Serving (11 | 9.6%), and Cleaning & Maintenance (8 | 7.0%).
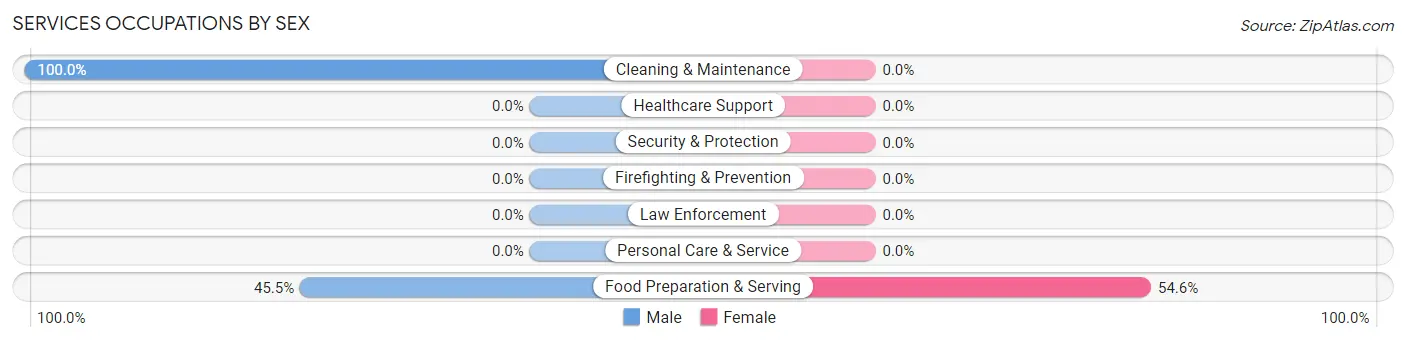
Services Occupations by Sex
| Occupation | Male | Female |
| Healthcare Support | 0 (0.0%) | 0 (0.0%) |
| Security & Protection | 0 (0.0%) | 0 (0.0%) |
| Firefighting & Prevention | 0 (0.0%) | 0 (0.0%) |
| Law Enforcement | 0 (0.0%) | 0 (0.0%) |
| Food Preparation & Serving | 5 (45.5%) | 6 (54.5%) |
| Cleaning & Maintenance | 8 (100.0%) | 0 (0.0%) |
| Personal Care & Service | 0 (0.0%) | 0 (0.0%) |
| Total (Category) | 13 (68.4%) | 6 (31.6%) |
| Total (Overall) | 67 (58.3%) | 48 (41.7%) |
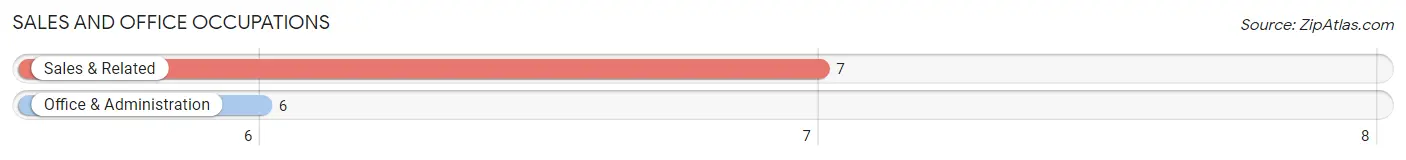
Sales and Office Occupations
The most common Sales and Office occupations in Mountain are Sales & Related (7 | 6.1%), and Office & Administration (6 | 5.2%).
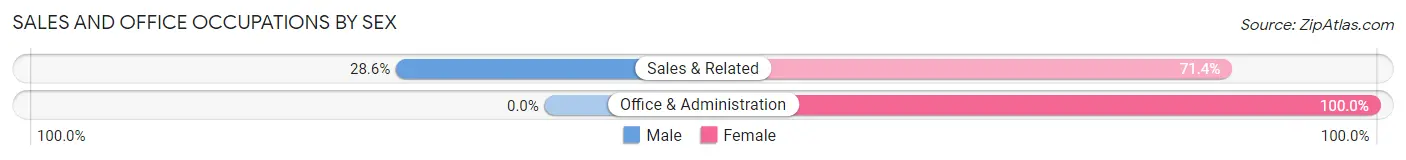
Sales and Office Occupations by Sex
| Occupation | Male | Female |
| Sales & Related | 2 (28.6%) | 5 (71.4%) |
| Office & Administration | 0 (0.0%) | 6 (100.0%) |
| Total (Category) | 2 (15.4%) | 11 (84.6%) |
| Total (Overall) | 67 (58.3%) | 48 (41.7%) |
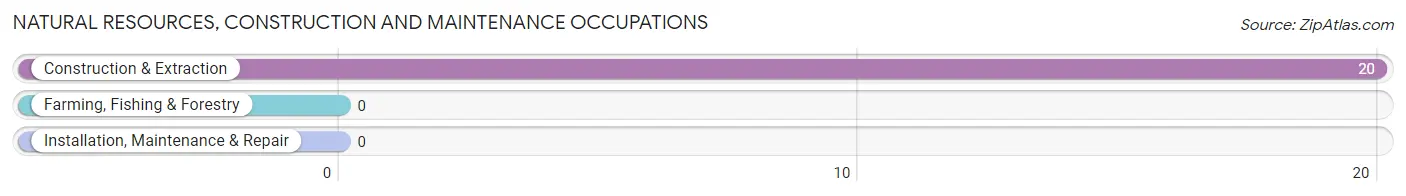
Natural Resources, Construction and Maintenance Occupations
The most common Natural Resources, Construction and Maintenance occupations in Mountain are , and Construction & Extraction (20 | 17.4%).
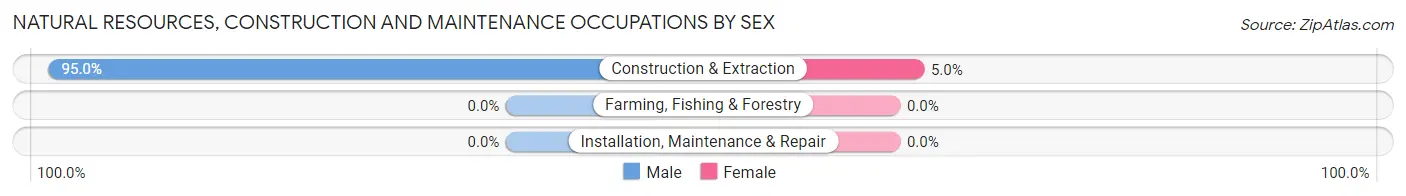
Natural Resources, Construction and Maintenance Occupations by Sex
| Occupation | Male | Female |
| Farming, Fishing & Forestry | 0 (0.0%) | 0 (0.0%) |
| Construction & Extraction | 19 (95.0%) | 1 (5.0%) |
| Installation, Maintenance & Repair | 0 (0.0%) | 0 (0.0%) |
| Total (Category) | 19 (95.0%) | 1 (5.0%) |
| Total (Overall) | 67 (58.3%) | 48 (41.7%) |
Production, Transportation and Moving Occupations
The most common Production, Transportation and Moving occupations in Mountain are Transportation (7 | 6.1%), Production (6 | 5.2%), and Material Moving (3 | 2.6%).
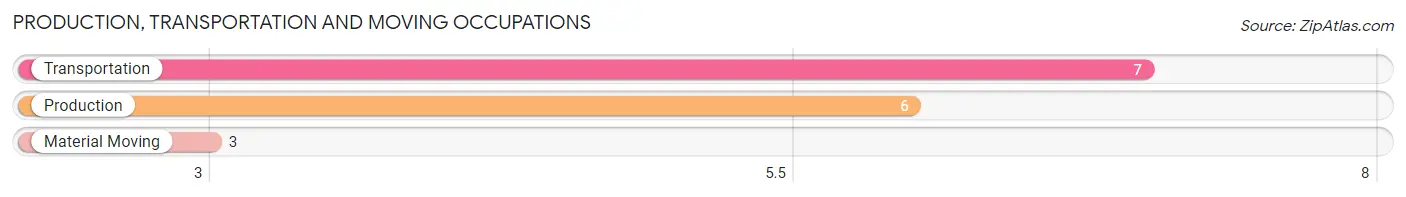
Production, Transportation and Moving Occupations by Sex
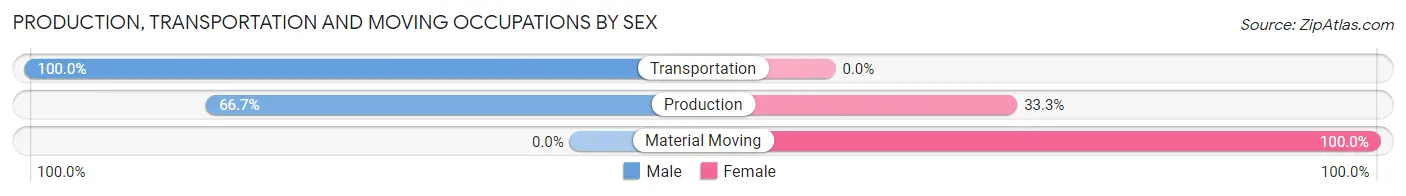
| Occupation | Male | Female |
| Production | 4 (66.7%) | 2 (33.3%) |
| Transportation | 7 (100.0%) | 0 (0.0%) |
| Material Moving | 0 (0.0%) | 3 (100.0%) |
| Total (Category) | 11 (68.8%) | 5 (31.2%) |
| Total (Overall) | 67 (58.3%) | 48 (41.7%) |
Employment Industries by Sex in Mountain
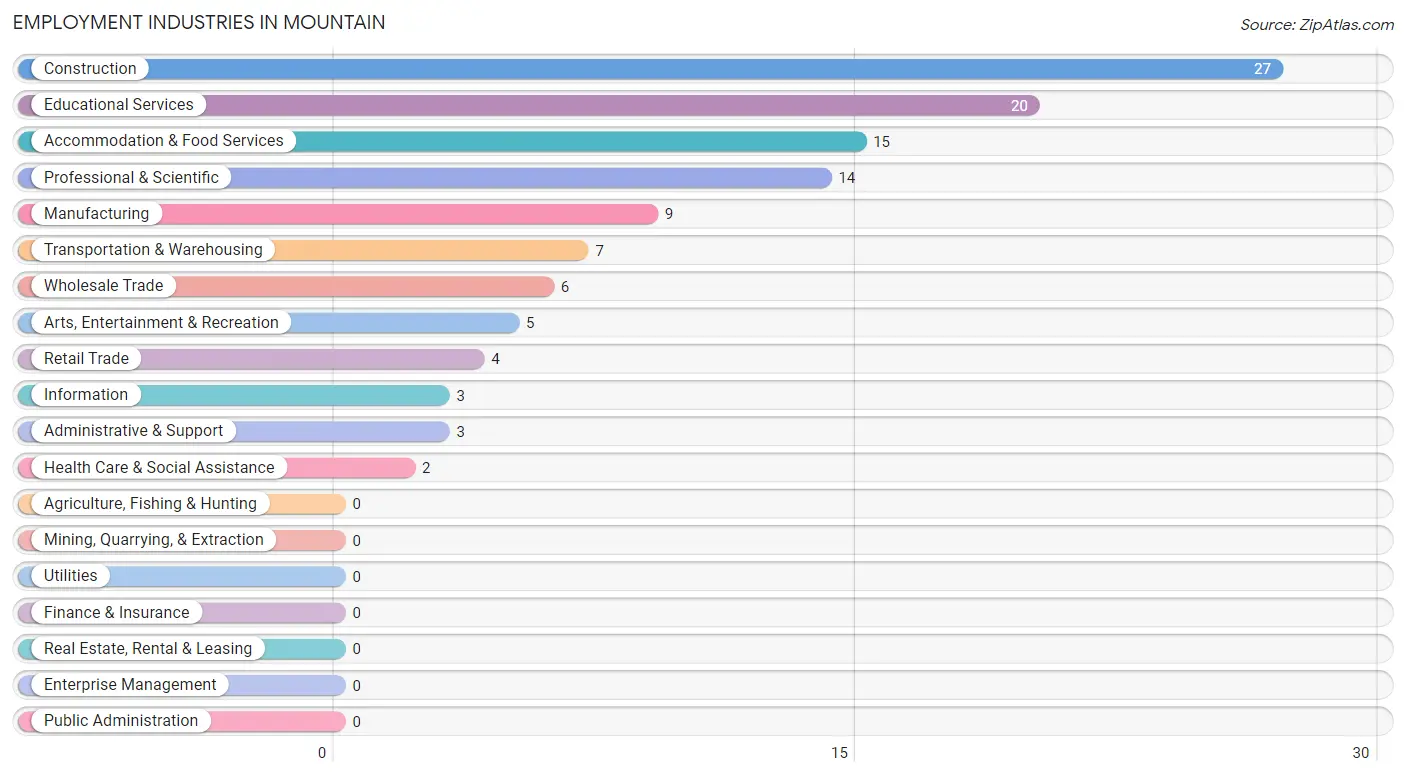
Employment Industries in Mountain
The major employment industries in Mountain include Construction (27 | 23.5%), Educational Services (20 | 17.4%), Accommodation & Food Services (15 | 13.0%), Professional & Scientific (14 | 12.2%), and Manufacturing (9 | 7.8%).
Employment Industries by Sex in Mountain
The Mountain industries that see more men than women are Transportation & Warehousing (100.0%), Information (100.0%), and Administrative & Support (100.0%), whereas the industries that tend to have a higher number of women are Wholesale Trade (100.0%), Retail Trade (100.0%), and Educational Services (100.0%).
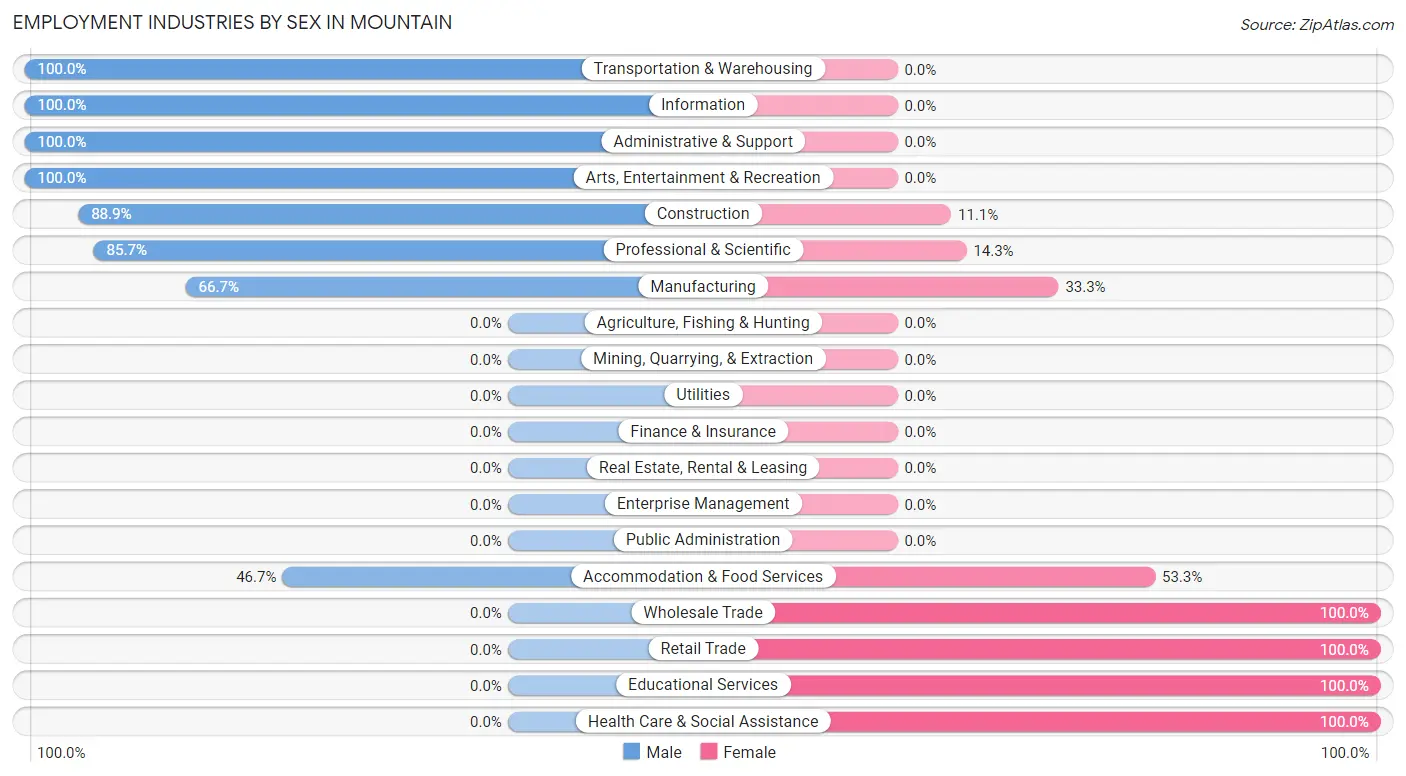
| Industry | Male | Female |
| Agriculture, Fishing & Hunting | 0 (0.0%) | 0 (0.0%) |
| Mining, Quarrying, & Extraction | 0 (0.0%) | 0 (0.0%) |
| Construction | 24 (88.9%) | 3 (11.1%) |
| Manufacturing | 6 (66.7%) | 3 (33.3%) |
| Wholesale Trade | 0 (0.0%) | 6 (100.0%) |
| Retail Trade | 0 (0.0%) | 4 (100.0%) |
| Transportation & Warehousing | 7 (100.0%) | 0 (0.0%) |
| Utilities | 0 (0.0%) | 0 (0.0%) |
| Information | 3 (100.0%) | 0 (0.0%) |
| Finance & Insurance | 0 (0.0%) | 0 (0.0%) |
| Real Estate, Rental & Leasing | 0 (0.0%) | 0 (0.0%) |
| Professional & Scientific | 12 (85.7%) | 2 (14.3%) |
| Enterprise Management | 0 (0.0%) | 0 (0.0%) |
| Administrative & Support | 3 (100.0%) | 0 (0.0%) |
| Educational Services | 0 (0.0%) | 20 (100.0%) |
| Health Care & Social Assistance | 0 (0.0%) | 2 (100.0%) |
| Arts, Entertainment & Recreation | 5 (100.0%) | 0 (0.0%) |
| Accommodation & Food Services | 7 (46.7%) | 8 (53.3%) |
| Public Administration | 0 (0.0%) | 0 (0.0%) |
| Total | 67 (58.3%) | 48 (41.7%) |
Education in Mountain
School Enrollment in Mountain
The most common levels of schooling among the 37 students in Mountain are graduate / professional (12 | 32.4%), elementary school (11 | 29.7%), and kindergarten (8 | 21.6%).
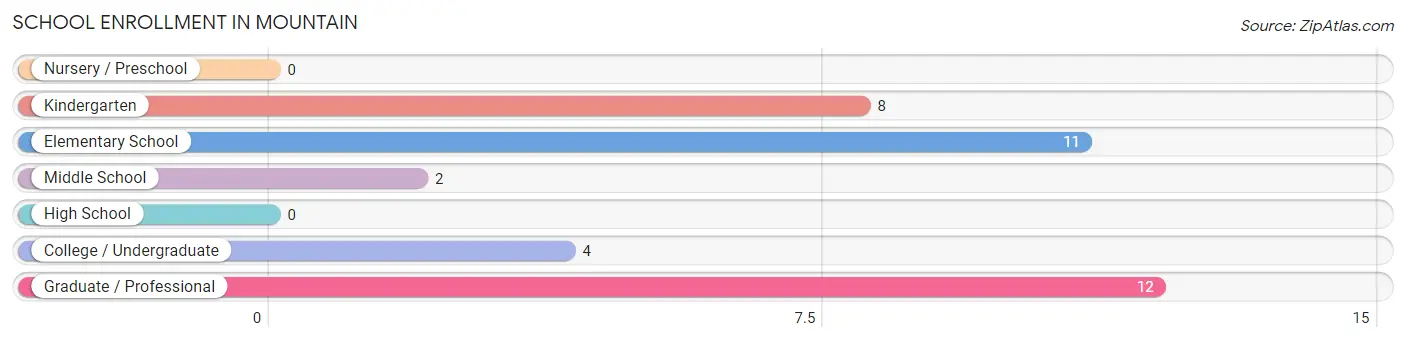
| School Level | # Students | % Students |
| Nursery / Preschool | 0 | 0.0% |
| Kindergarten | 8 | 21.6% |
| Elementary School | 11 | 29.7% |
| Middle School | 2 | 5.4% |
| High School | 0 | 0.0% |
| College / Undergraduate | 4 | 10.8% |
| Graduate / Professional | 12 | 32.4% |
| Total | 37 | 100.0% |
School Enrollment by Age by Funding Source in Mountain
Out of a total of 37 students who are enrolled in schools in Mountain, 12 (32.4%) attend a private institution, while the remaining 25 (67.6%) are enrolled in public schools. The age group of 25 to 34 year olds has the highest likelihood of being enrolled in private schools, with 12 (100.0% in the age bracket) enrolled. Conversely, the age group of 5 to 9 year old has the lowest likelihood of being enrolled in a private school, with 19 (100.0% in the age bracket) attending a public institution.
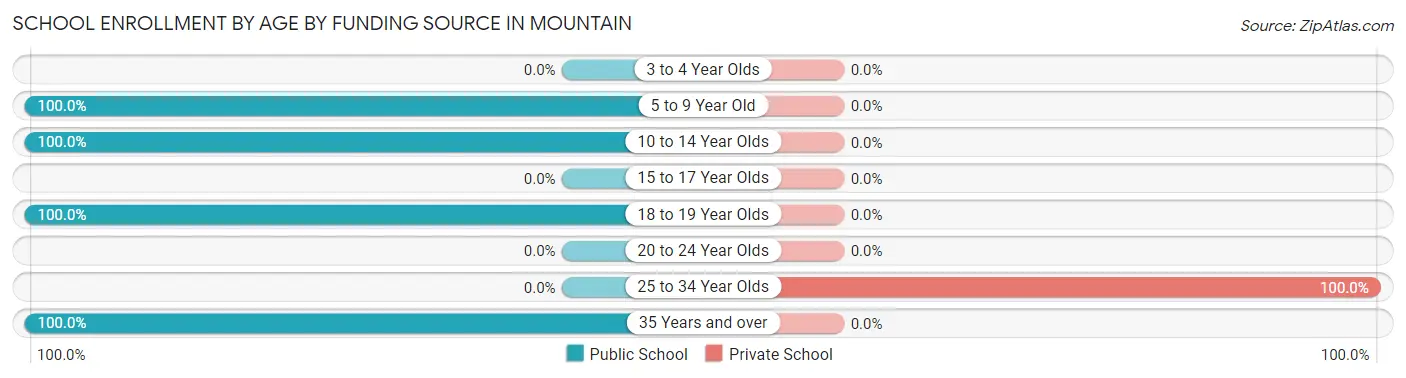
| Age Bracket | Public School | Private School |
| 3 to 4 Year Olds | 0 (0.0%) | 0 (0.0%) |
| 5 to 9 Year Old | 19 (100.0%) | 0 (0.0%) |
| 10 to 14 Year Olds | 2 (100.0%) | 0 (0.0%) |
| 15 to 17 Year Olds | 0 (0.0%) | 0 (0.0%) |
| 18 to 19 Year Olds | 2 (100.0%) | 0 (0.0%) |
| 20 to 24 Year Olds | 0 (0.0%) | 0 (0.0%) |
| 25 to 34 Year Olds | 0 (0.0%) | 12 (100.0%) |
| 35 Years and over | 2 (100.0%) | 0 (0.0%) |
| Total | 25 (67.6%) | 12 (32.4%) |
Educational Attainment by Field of Study in Mountain
Business (17 | 32.7%), education (13 | 25.0%), computers & mathematics (12 | 23.1%), liberal arts & history (7 | 13.5%), and bio, nature & agricultural (2 | 3.8%) are the most common fields of study among 52 individuals in Mountain who have obtained a bachelor's degree or higher.
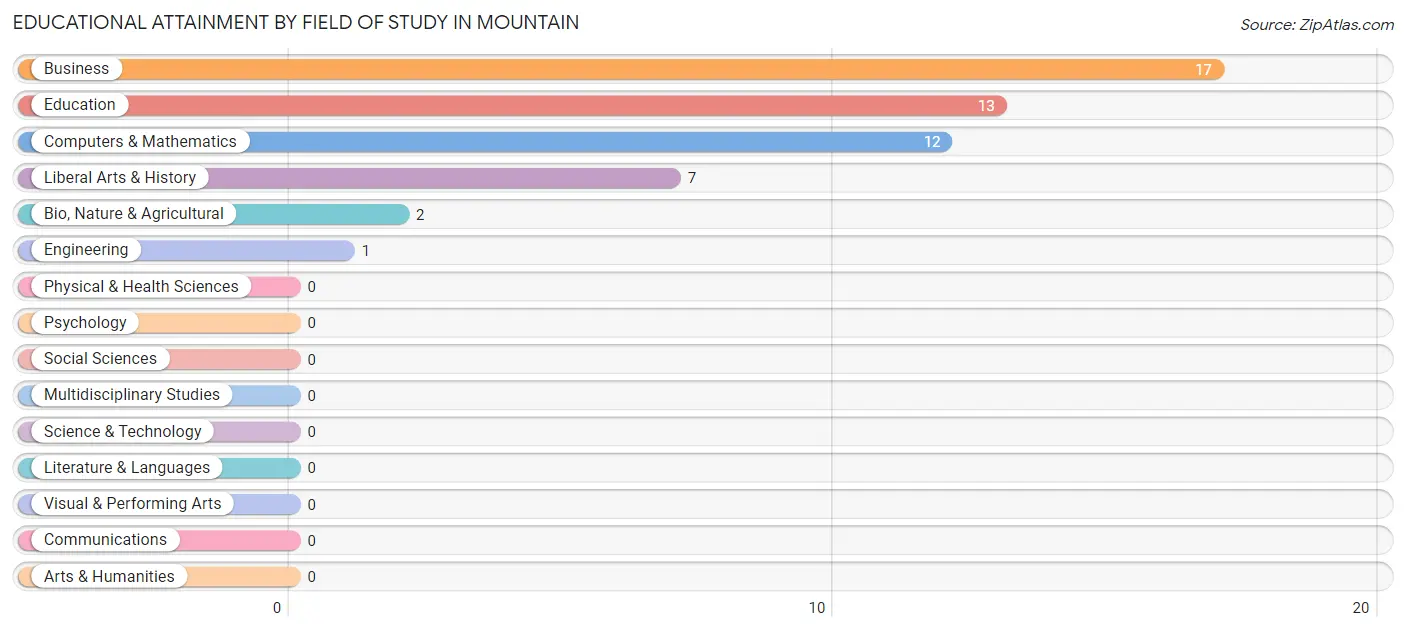
| Field of Study | # Graduates | % Graduates |
| Computers & Mathematics | 12 | 23.1% |
| Bio, Nature & Agricultural | 2 | 3.8% |
| Physical & Health Sciences | 0 | 0.0% |
| Psychology | 0 | 0.0% |
| Social Sciences | 0 | 0.0% |
| Engineering | 1 | 1.9% |
| Multidisciplinary Studies | 0 | 0.0% |
| Science & Technology | 0 | 0.0% |
| Business | 17 | 32.7% |
| Education | 13 | 25.0% |
| Literature & Languages | 0 | 0.0% |
| Liberal Arts & History | 7 | 13.5% |
| Visual & Performing Arts | 0 | 0.0% |
| Communications | 0 | 0.0% |
| Arts & Humanities | 0 | 0.0% |
| Total | 52 | 100.0% |
Transportation & Commute in Mountain
Vehicle Availability by Sex in Mountain
The most prevalent vehicle ownership categories in Mountain are males with 1 vehicle (20, accounting for 29.8%) and females with 1 vehicle (5, making up 46.5%).
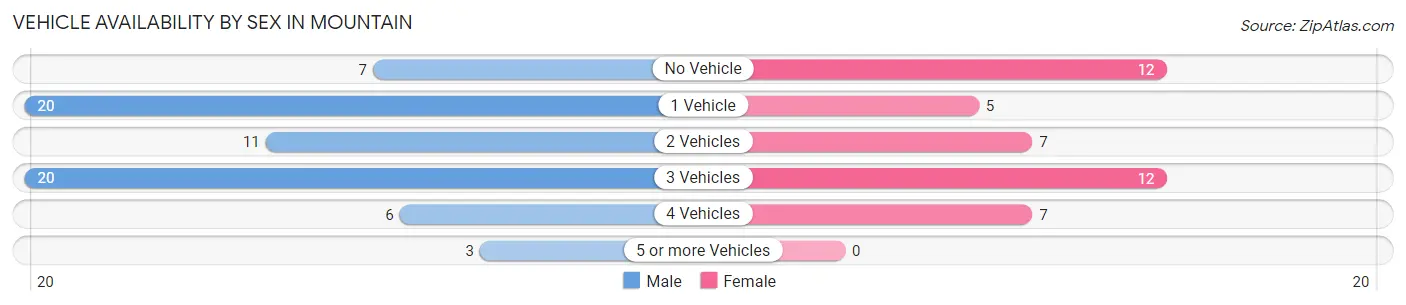
| Vehicles Available | Male | Female |
| No Vehicle | 7 (10.4%) | 12 (27.9%) |
| 1 Vehicle | 20 (29.8%) | 5 (11.6%) |
| 2 Vehicles | 11 (16.4%) | 7 (16.3%) |
| 3 Vehicles | 20 (29.8%) | 12 (27.9%) |
| 4 Vehicles | 6 (9.0%) | 7 (16.3%) |
| 5 or more Vehicles | 3 (4.5%) | 0 (0.0%) |
| Total | 67 (100.0%) | 43 (100.0%) |
Commute Time in Mountain
The most frequently occuring commute durations in Mountain are 10 to 14 minutes (16 commuters, 16.8%), 5 to 9 minutes (15 commuters, 15.8%), and 60 to 89 minutes (14 commuters, 14.7%).
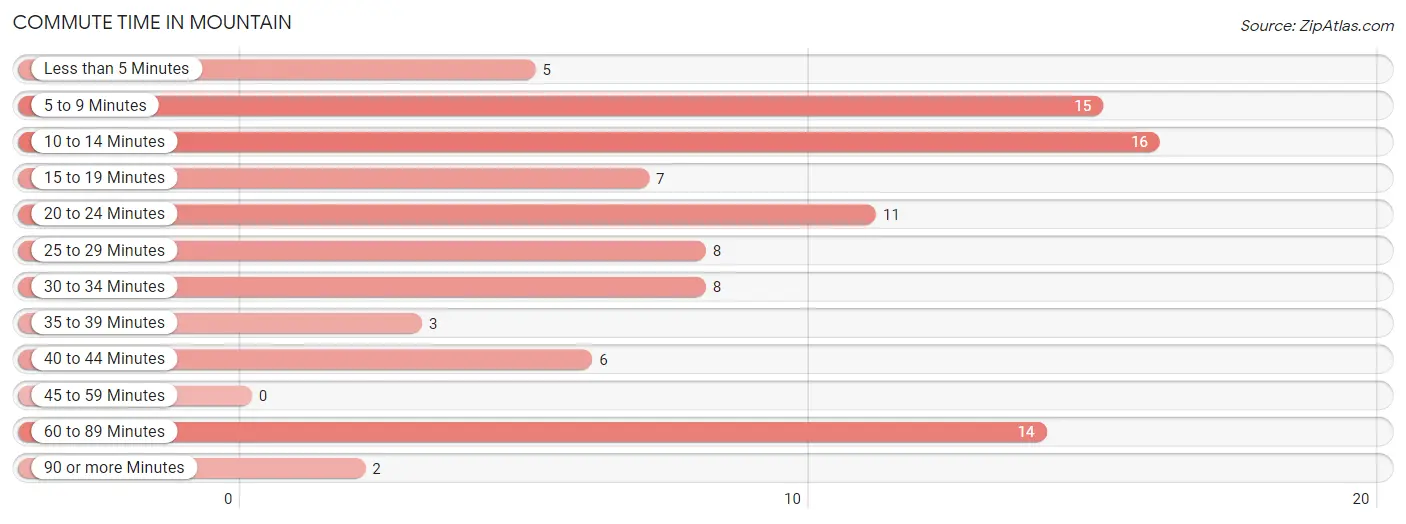
| Commute Time | # Commuters | % Commuters |
| Less than 5 Minutes | 5 | 5.3% |
| 5 to 9 Minutes | 15 | 15.8% |
| 10 to 14 Minutes | 16 | 16.8% |
| 15 to 19 Minutes | 7 | 7.4% |
| 20 to 24 Minutes | 11 | 11.6% |
| 25 to 29 Minutes | 8 | 8.4% |
| 30 to 34 Minutes | 8 | 8.4% |
| 35 to 39 Minutes | 3 | 3.2% |
| 40 to 44 Minutes | 6 | 6.3% |
| 45 to 59 Minutes | 0 | 0.0% |
| 60 to 89 Minutes | 14 | 14.7% |
| 90 or more Minutes | 2 | 2.1% |
Commute Time by Sex in Mountain
The most common commute times in Mountain are 60 to 89 minutes (13 commuters, 23.6%) for males and 10 to 14 minutes (16 commuters, 40.0%) for females.
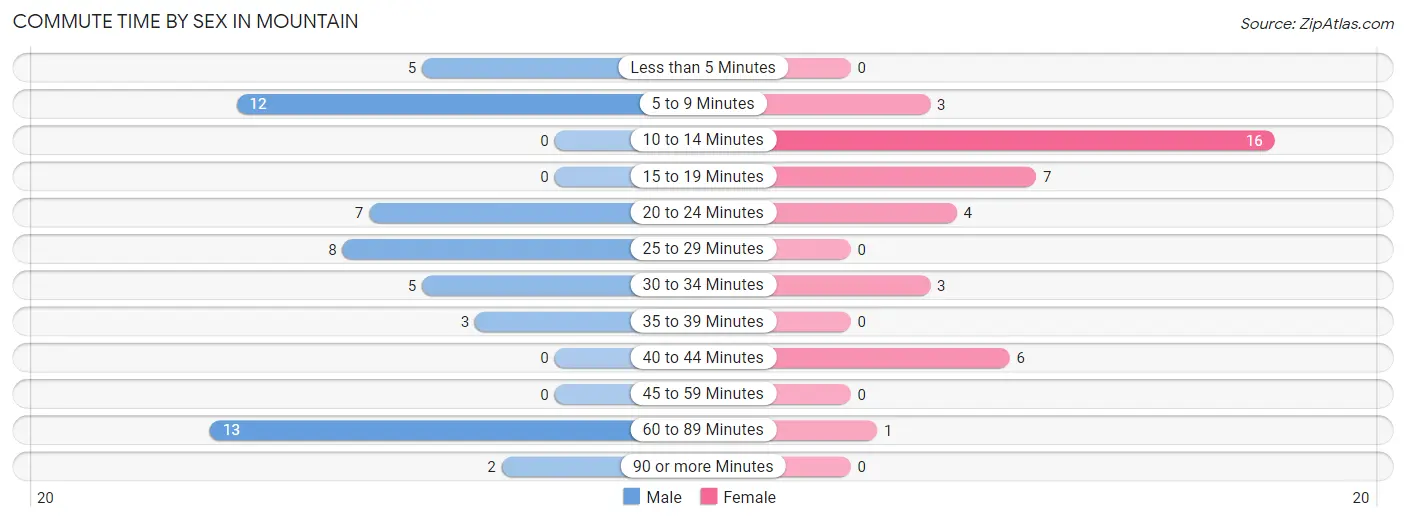
| Commute Time | Male | Female |
| Less than 5 Minutes | 5 (9.1%) | 0 (0.0%) |
| 5 to 9 Minutes | 12 (21.8%) | 3 (7.5%) |
| 10 to 14 Minutes | 0 (0.0%) | 16 (40.0%) |
| 15 to 19 Minutes | 0 (0.0%) | 7 (17.5%) |
| 20 to 24 Minutes | 7 (12.7%) | 4 (10.0%) |
| 25 to 29 Minutes | 8 (14.5%) | 0 (0.0%) |
| 30 to 34 Minutes | 5 (9.1%) | 3 (7.5%) |
| 35 to 39 Minutes | 3 (5.4%) | 0 (0.0%) |
| 40 to 44 Minutes | 0 (0.0%) | 6 (15.0%) |
| 45 to 59 Minutes | 0 (0.0%) | 0 (0.0%) |
| 60 to 89 Minutes | 13 (23.6%) | 1 (2.5%) |
| 90 or more Minutes | 2 (3.6%) | 0 (0.0%) |
Time of Departure to Work by Sex in Mountain
The most frequent times of departure to work in Mountain are 5:00 AM to 5:29 AM (12, 21.8%) for males and 5:30 AM to 5:59 AM (12, 30.0%) for females.
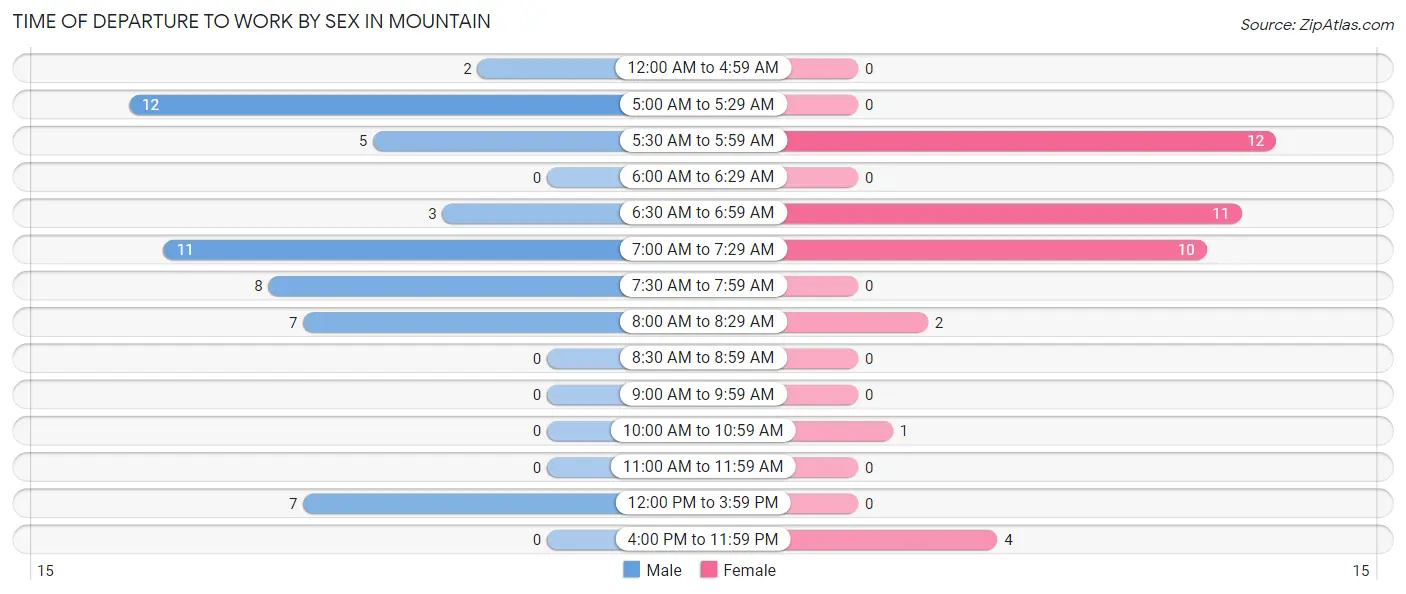
| Time of Departure | Male | Female |
| 12:00 AM to 4:59 AM | 2 (3.6%) | 0 (0.0%) |
| 5:00 AM to 5:29 AM | 12 (21.8%) | 0 (0.0%) |
| 5:30 AM to 5:59 AM | 5 (9.1%) | 12 (30.0%) |
| 6:00 AM to 6:29 AM | 0 (0.0%) | 0 (0.0%) |
| 6:30 AM to 6:59 AM | 3 (5.4%) | 11 (27.5%) |
| 7:00 AM to 7:29 AM | 11 (20.0%) | 10 (25.0%) |
| 7:30 AM to 7:59 AM | 8 (14.5%) | 0 (0.0%) |
| 8:00 AM to 8:29 AM | 7 (12.7%) | 2 (5.0%) |
| 8:30 AM to 8:59 AM | 0 (0.0%) | 0 (0.0%) |
| 9:00 AM to 9:59 AM | 0 (0.0%) | 0 (0.0%) |
| 10:00 AM to 10:59 AM | 0 (0.0%) | 1 (2.5%) |
| 11:00 AM to 11:59 AM | 0 (0.0%) | 0 (0.0%) |
| 12:00 PM to 3:59 PM | 7 (12.7%) | 0 (0.0%) |
| 4:00 PM to 11:59 PM | 0 (0.0%) | 4 (10.0%) |
| Total | 55 (100.0%) | 40 (100.0%) |
Housing Occupancy in Mountain
Occupancy by Ownership in Mountain
Of the total 127 dwellings in Mountain, owner-occupied units account for 120 (94.5%), while renter-occupied units make up 7 (5.5%).
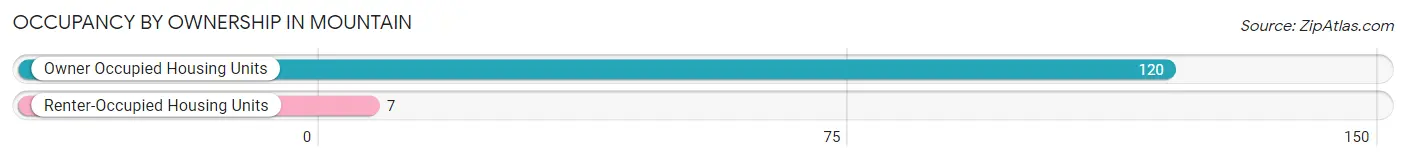
| Occupancy | # Housing Units | % Housing Units |
| Owner Occupied Housing Units | 120 | 94.5% |
| Renter-Occupied Housing Units | 7 | 5.5% |
| Total Occupied Housing Units | 127 | 100.0% |
Occupancy by Household Size in Mountain
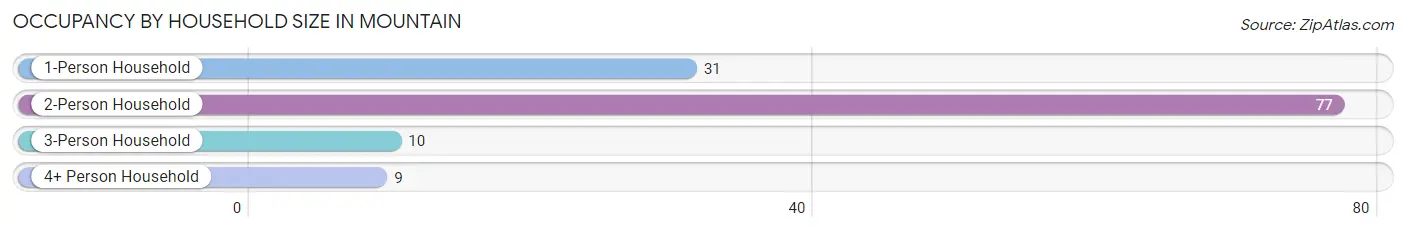
| Household Size | # Housing Units | % Housing Units |
| 1-Person Household | 31 | 24.4% |
| 2-Person Household | 77 | 60.6% |
| 3-Person Household | 10 | 7.9% |
| 4+ Person Household | 9 | 7.1% |
| Total Housing Units | 127 | 100.0% |
Occupancy by Ownership by Household Size in Mountain
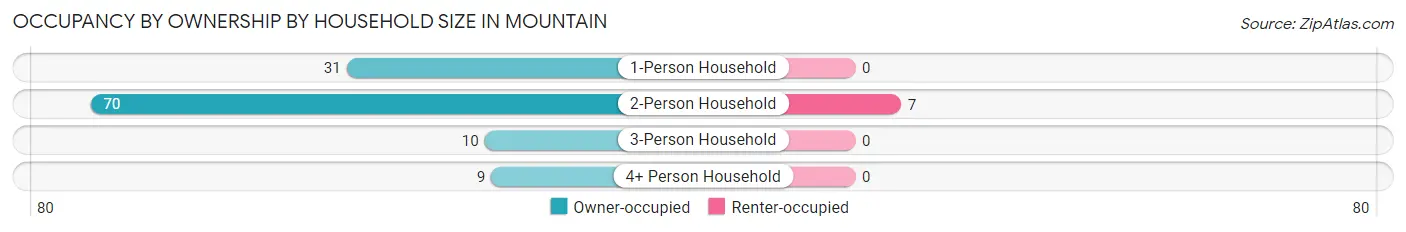
| Household Size | Owner-occupied | Renter-occupied |
| 1-Person Household | 31 (100.0%) | 0 (0.0%) |
| 2-Person Household | 70 (90.9%) | 7 (9.1%) |
| 3-Person Household | 10 (100.0%) | 0 (0.0%) |
| 4+ Person Household | 9 (100.0%) | 0 (0.0%) |
| Total Housing Units | 120 (94.5%) | 7 (5.5%) |
Occupancy by Educational Attainment in Mountain
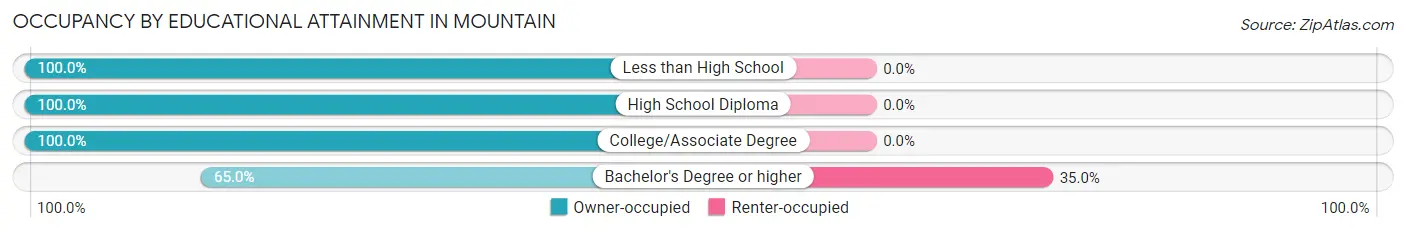
| Household Size | Owner-occupied | Renter-occupied |
| Less than High School | 16 (100.0%) | 0 (0.0%) |
| High School Diploma | 44 (100.0%) | 0 (0.0%) |
| College/Associate Degree | 47 (100.0%) | 0 (0.0%) |
| Bachelor's Degree or higher | 13 (65.0%) | 7 (35.0%) |
Occupancy by Age of Householder in Mountain
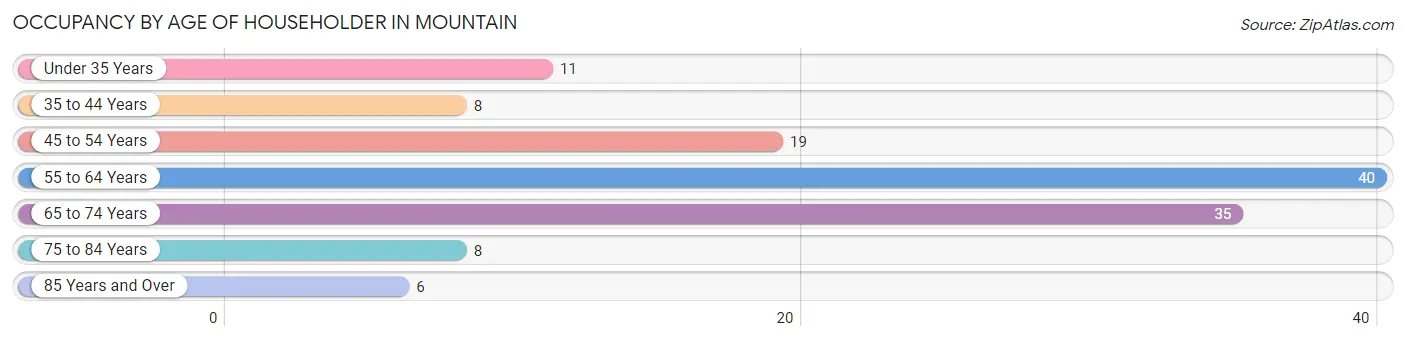
| Age Bracket | # Households | % Households |
| Under 35 Years | 11 | 8.7% |
| 35 to 44 Years | 8 | 6.3% |
| 45 to 54 Years | 19 | 15.0% |
| 55 to 64 Years | 40 | 31.5% |
| 65 to 74 Years | 35 | 27.6% |
| 75 to 84 Years | 8 | 6.3% |
| 85 Years and Over | 6 | 4.7% |
| Total | 127 | 100.0% |
Housing Finances in Mountain
Median Income by Occupancy in Mountain
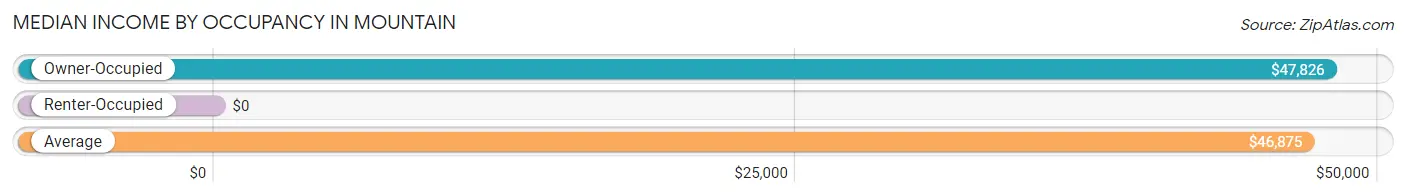
| Occupancy Type | # Households | Median Income |
| Owner-Occupied | 120 (94.5%) | $47,826 |
| Renter-Occupied | 7 (5.5%) | $0 |
| Average | 127 (100.0%) | $46,875 |
Occupancy by Householder Income Bracket in Mountain
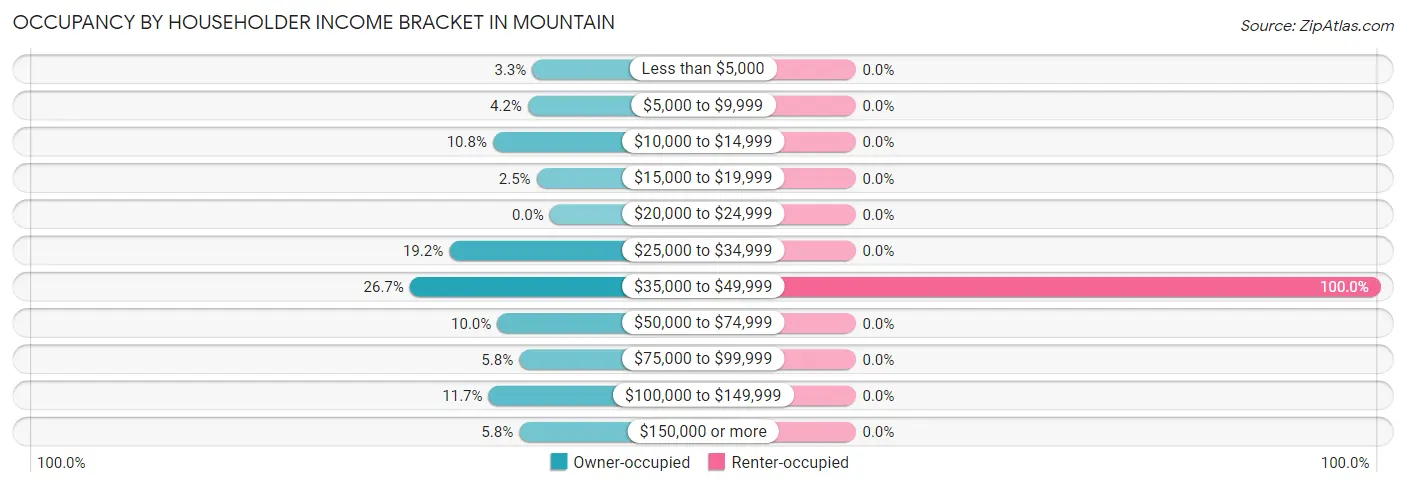
| Income Bracket | Owner-occupied | Renter-occupied |
| Less than $5,000 | 4 (3.3%) | 0 (0.0%) |
| $5,000 to $9,999 | 5 (4.2%) | 0 (0.0%) |
| $10,000 to $14,999 | 13 (10.8%) | 0 (0.0%) |
| $15,000 to $19,999 | 3 (2.5%) | 0 (0.0%) |
| $20,000 to $24,999 | 0 (0.0%) | 0 (0.0%) |
| $25,000 to $34,999 | 23 (19.2%) | 0 (0.0%) |
| $35,000 to $49,999 | 32 (26.7%) | 7 (100.0%) |
| $50,000 to $74,999 | 12 (10.0%) | 0 (0.0%) |
| $75,000 to $99,999 | 7 (5.8%) | 0 (0.0%) |
| $100,000 to $149,999 | 14 (11.7%) | 0 (0.0%) |
| $150,000 or more | 7 (5.8%) | 0 (0.0%) |
| Total | 120 (100.0%) | 7 (100.0%) |
Monthly Housing Cost Tiers in Mountain
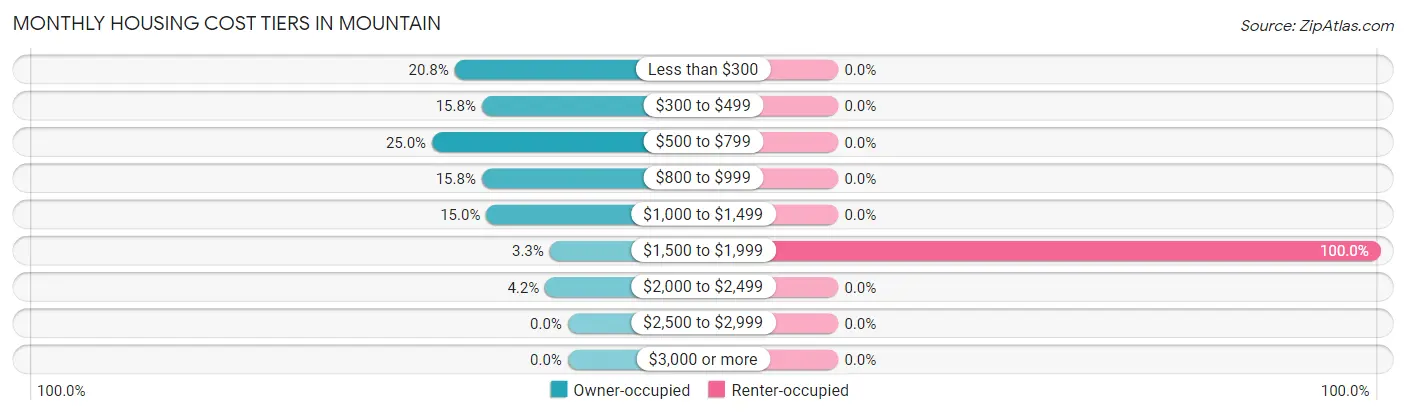
| Monthly Cost | Owner-occupied | Renter-occupied |
| Less than $300 | 25 (20.8%) | 0 (0.0%) |
| $300 to $499 | 19 (15.8%) | 0 (0.0%) |
| $500 to $799 | 30 (25.0%) | 0 (0.0%) |
| $800 to $999 | 19 (15.8%) | 0 (0.0%) |
| $1,000 to $1,499 | 18 (15.0%) | 0 (0.0%) |
| $1,500 to $1,999 | 4 (3.3%) | 7 (100.0%) |
| $2,000 to $2,499 | 5 (4.2%) | 0 (0.0%) |
| $2,500 to $2,999 | 0 (0.0%) | 0 (0.0%) |
| $3,000 or more | 0 (0.0%) | 0 (0.0%) |
| Total | 120 (100.0%) | 7 (100.0%) |
Physical Housing Characteristics in Mountain
Housing Structures in Mountain
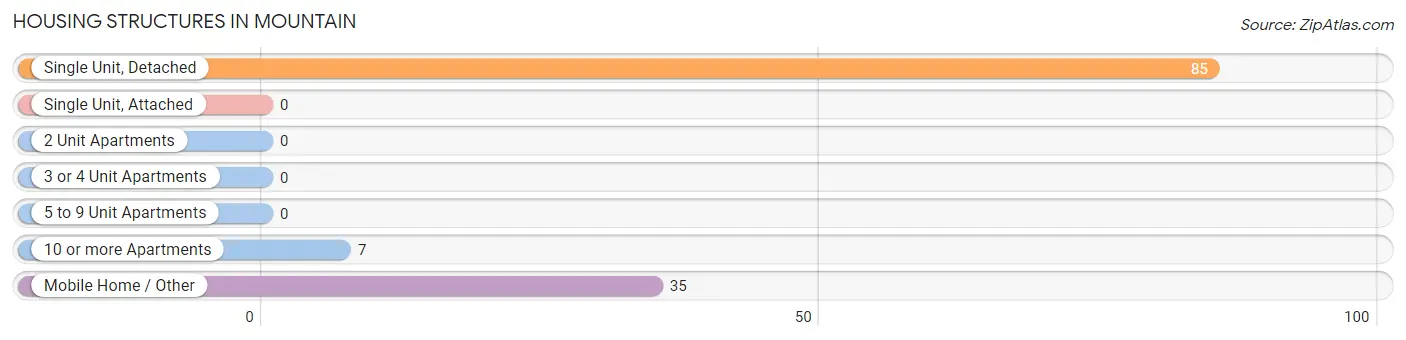
| Structure Type | # Housing Units | % Housing Units |
| Single Unit, Detached | 85 | 66.9% |
| Single Unit, Attached | 0 | 0.0% |
| 2 Unit Apartments | 0 | 0.0% |
| 3 or 4 Unit Apartments | 0 | 0.0% |
| 5 to 9 Unit Apartments | 0 | 0.0% |
| 10 or more Apartments | 7 | 5.5% |
| Mobile Home / Other | 35 | 27.6% |
| Total | 127 | 100.0% |
Housing Structures by Occupancy in Mountain
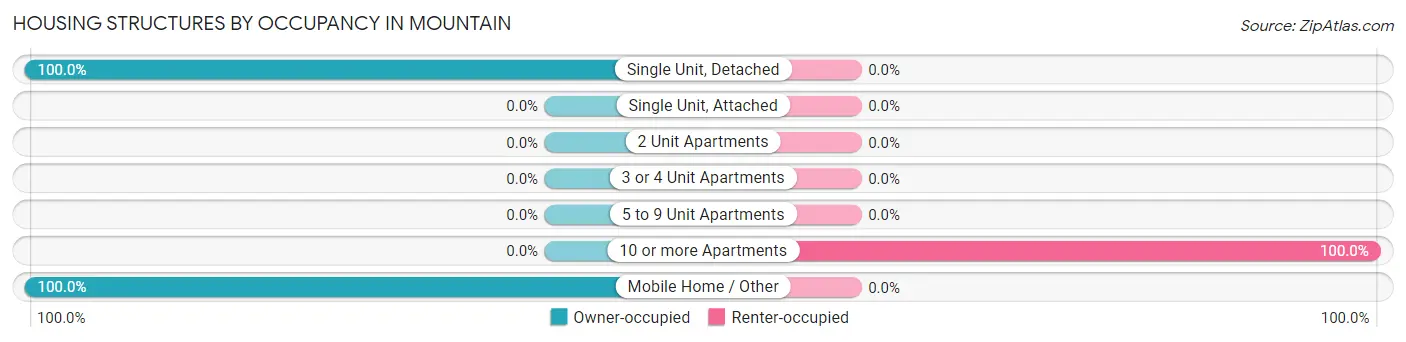
| Structure Type | Owner-occupied | Renter-occupied |
| Single Unit, Detached | 85 (100.0%) | 0 (0.0%) |
| Single Unit, Attached | 0 (0.0%) | 0 (0.0%) |
| 2 Unit Apartments | 0 (0.0%) | 0 (0.0%) |
| 3 or 4 Unit Apartments | 0 (0.0%) | 0 (0.0%) |
| 5 to 9 Unit Apartments | 0 (0.0%) | 0 (0.0%) |
| 10 or more Apartments | 0 (0.0%) | 7 (100.0%) |
| Mobile Home / Other | 35 (100.0%) | 0 (0.0%) |
| Total | 120 (94.5%) | 7 (5.5%) |
Housing Structures by Number of Rooms in Mountain
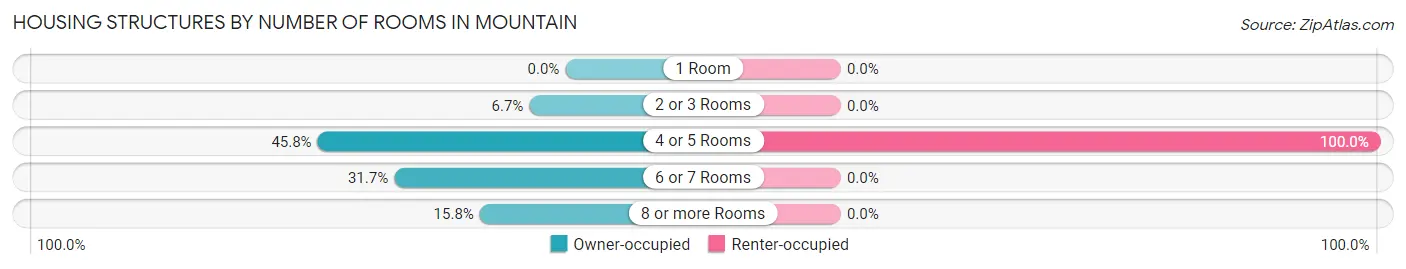
| Number of Rooms | Owner-occupied | Renter-occupied |
| 1 Room | 0 (0.0%) | 0 (0.0%) |
| 2 or 3 Rooms | 8 (6.7%) | 0 (0.0%) |
| 4 or 5 Rooms | 55 (45.8%) | 7 (100.0%) |
| 6 or 7 Rooms | 38 (31.7%) | 0 (0.0%) |
| 8 or more Rooms | 19 (15.8%) | 0 (0.0%) |
| Total | 120 (100.0%) | 7 (100.0%) |
Housing Structure by Heating Type in Mountain
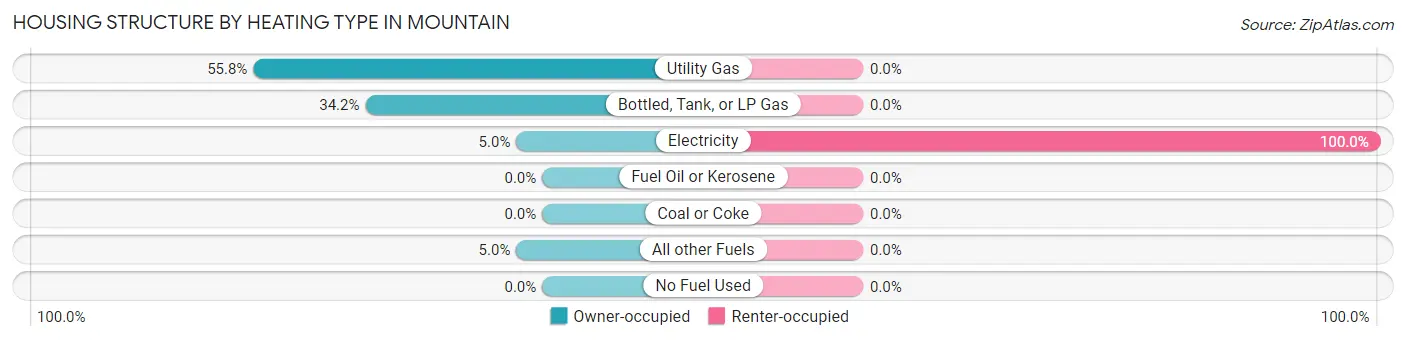
| Heating Type | Owner-occupied | Renter-occupied |
| Utility Gas | 67 (55.8%) | 0 (0.0%) |
| Bottled, Tank, or LP Gas | 41 (34.2%) | 0 (0.0%) |
| Electricity | 6 (5.0%) | 7 (100.0%) |
| Fuel Oil or Kerosene | 0 (0.0%) | 0 (0.0%) |
| Coal or Coke | 0 (0.0%) | 0 (0.0%) |
| All other Fuels | 6 (5.0%) | 0 (0.0%) |
| No Fuel Used | 0 (0.0%) | 0 (0.0%) |
| Total | 120 (100.0%) | 7 (100.0%) |
Household Vehicle Usage in Mountain
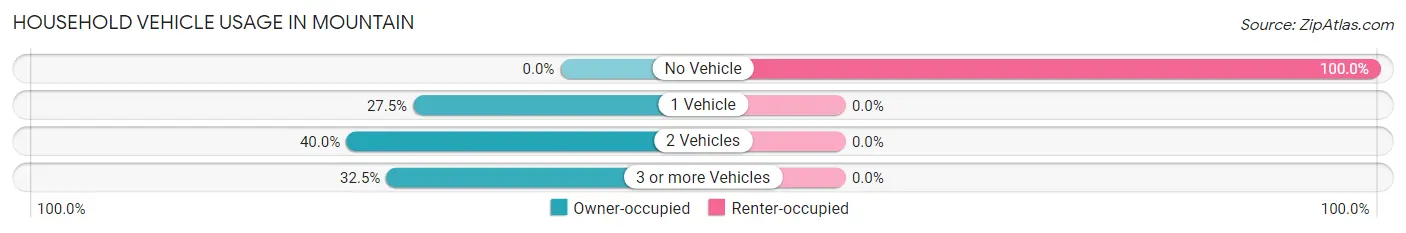
| Vehicles per Household | Owner-occupied | Renter-occupied |
| No Vehicle | 0 (0.0%) | 7 (100.0%) |
| 1 Vehicle | 33 (27.5%) | 0 (0.0%) |
| 2 Vehicles | 48 (40.0%) | 0 (0.0%) |
| 3 or more Vehicles | 39 (32.5%) | 0 (0.0%) |
| Total | 120 (100.0%) | 7 (100.0%) |
Real Estate & Mortgages in Mountain
Real Estate and Mortgage Overview in Mountain
| Characteristic | Without Mortgage | With Mortgage |
| Housing Units | 67 | 53 |
| Median Property Value | $110,400 | $109,400 |
| Median Household Income | $41,563 | $5 |
| Monthly Housing Costs | $434 | $0 |
| Real Estate Taxes | $1,236 | $0 |
Property Value by Mortgage Status in Mountain
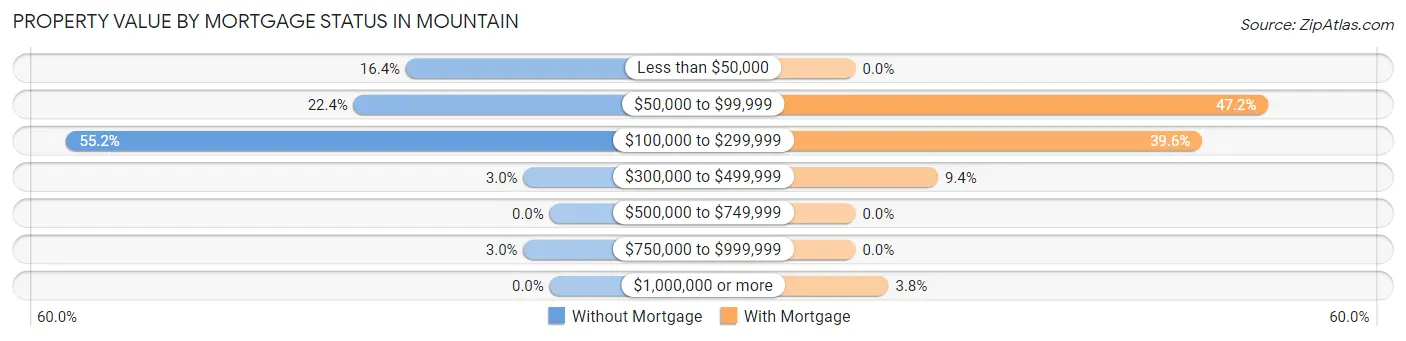
| Property Value | Without Mortgage | With Mortgage |
| Less than $50,000 | 11 (16.4%) | 0 (0.0%) |
| $50,000 to $99,999 | 15 (22.4%) | 25 (47.2%) |
| $100,000 to $299,999 | 37 (55.2%) | 21 (39.6%) |
| $300,000 to $499,999 | 2 (3.0%) | 5 (9.4%) |
| $500,000 to $749,999 | 0 (0.0%) | 0 (0.0%) |
| $750,000 to $999,999 | 2 (3.0%) | 0 (0.0%) |
| $1,000,000 or more | 0 (0.0%) | 2 (3.8%) |
| Total | 67 (100.0%) | 53 (100.0%) |
Household Income by Mortgage Status in Mountain
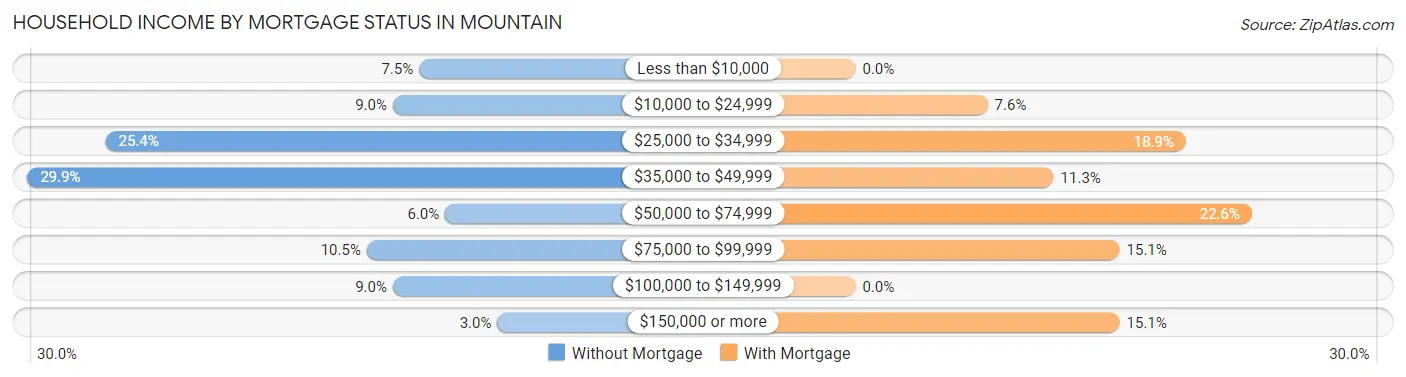
| Household Income | Without Mortgage | With Mortgage |
| Less than $10,000 | 5 (7.5%) | 0 (0.0%) |
| $10,000 to $24,999 | 6 (9.0%) | 4 (7.5%) |
| $25,000 to $34,999 | 17 (25.4%) | 10 (18.9%) |
| $35,000 to $49,999 | 20 (29.8%) | 6 (11.3%) |
| $50,000 to $74,999 | 4 (6.0%) | 12 (22.6%) |
| $75,000 to $99,999 | 7 (10.4%) | 8 (15.1%) |
| $100,000 to $149,999 | 6 (9.0%) | 0 (0.0%) |
| $150,000 or more | 2 (3.0%) | 8 (15.1%) |
| Total | 67 (100.0%) | 53 (100.0%) |
Property Value to Household Income Ratio in Mountain
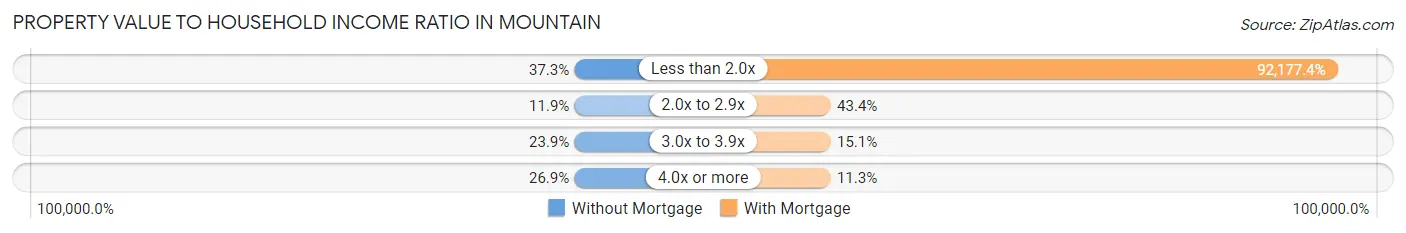
| Value-to-Income Ratio | Without Mortgage | With Mortgage |
| Less than 2.0x | 25 (37.3%) | 48,854 (92,177.4%) |
| 2.0x to 2.9x | 8 (11.9%) | 23 (43.4%) |
| 3.0x to 3.9x | 16 (23.9%) | 8 (15.1%) |
| 4.0x or more | 18 (26.9%) | 6 (11.3%) |
| Total | 67 (100.0%) | 53 (100.0%) |
Real Estate Taxes by Mortgage Status in Mountain
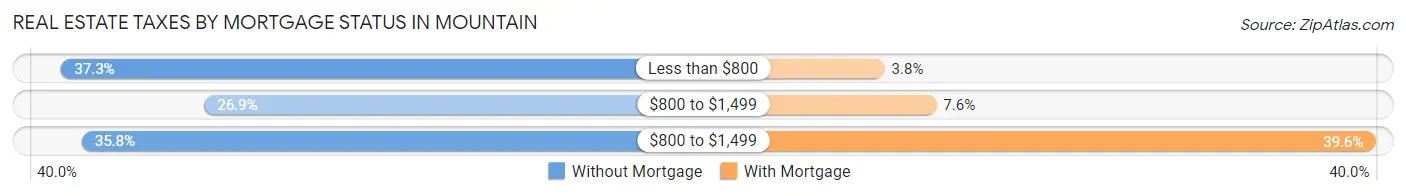
| Property Taxes | Without Mortgage | With Mortgage |
| Less than $800 | 25 (37.3%) | 2 (3.8%) |
| $800 to $1,499 | 18 (26.9%) | 4 (7.5%) |
| $800 to $1,499 | 24 (35.8%) | 21 (39.6%) |
| Total | 67 (100.0%) | 53 (100.0%) |
Health & Disability in Mountain
Health Insurance Coverage by Age in Mountain
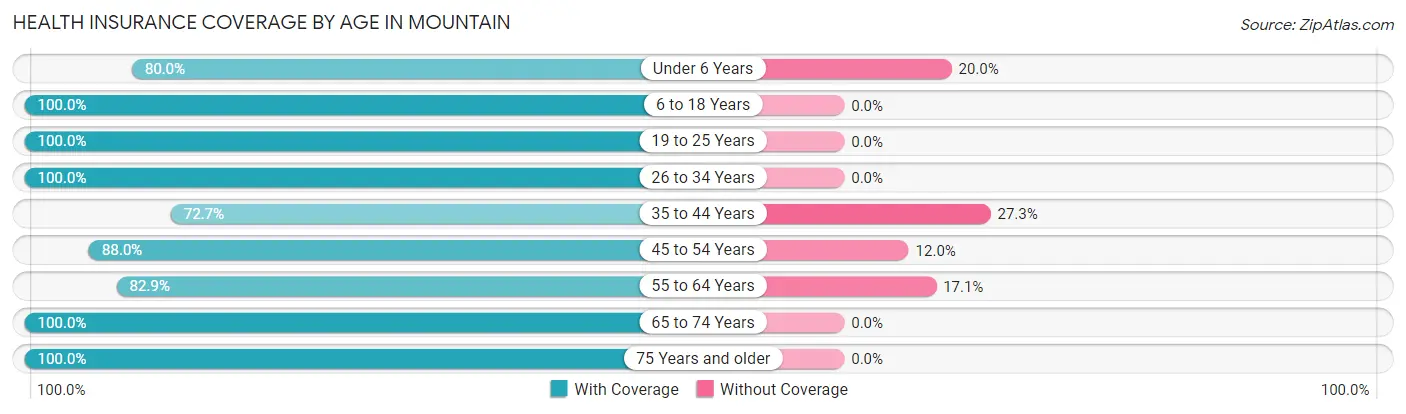
| Age Bracket | With Coverage | Without Coverage |
| Under 6 Years | 12 (80.0%) | 3 (20.0%) |
| 6 to 18 Years | 18 (100.0%) | 0 (0.0%) |
| 19 to 25 Years | 15 (100.0%) | 0 (0.0%) |
| 26 to 34 Years | 18 (100.0%) | 0 (0.0%) |
| 35 to 44 Years | 16 (72.7%) | 6 (27.3%) |
| 45 to 54 Years | 22 (88.0%) | 3 (12.0%) |
| 55 to 64 Years | 58 (82.9%) | 12 (17.1%) |
| 65 to 74 Years | 64 (100.0%) | 0 (0.0%) |
| 75 Years and older | 15 (100.0%) | 0 (0.0%) |
| Total | 238 (90.8%) | 24 (9.2%) |
Health Insurance Coverage by Citizenship Status in Mountain
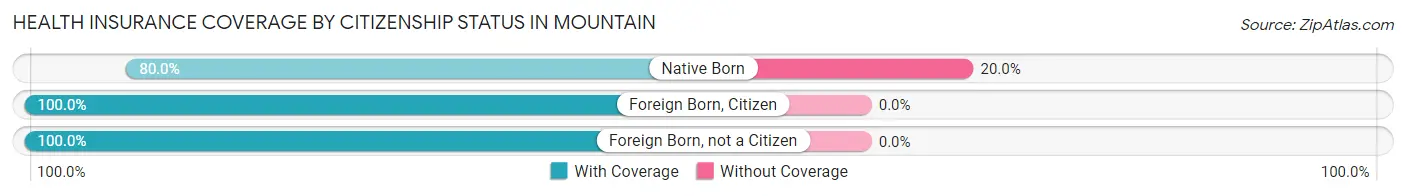
| Citizenship Status | With Coverage | Without Coverage |
| Native Born | 12 (80.0%) | 3 (20.0%) |
| Foreign Born, Citizen | 18 (100.0%) | 0 (0.0%) |
| Foreign Born, not a Citizen | 15 (100.0%) | 0 (0.0%) |
Health Insurance Coverage by Household Income in Mountain
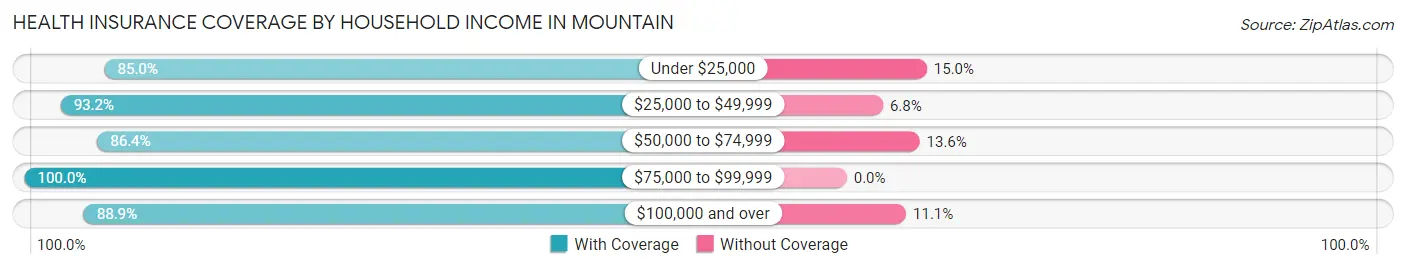
| Household Income | With Coverage | Without Coverage |
| Under $25,000 | 34 (85.0%) | 6 (15.0%) |
| $25,000 to $49,999 | 124 (93.2%) | 9 (6.8%) |
| $50,000 to $74,999 | 19 (86.4%) | 3 (13.6%) |
| $75,000 to $99,999 | 13 (100.0%) | 0 (0.0%) |
| $100,000 and over | 48 (88.9%) | 6 (11.1%) |
Public vs Private Health Insurance Coverage by Age in Mountain
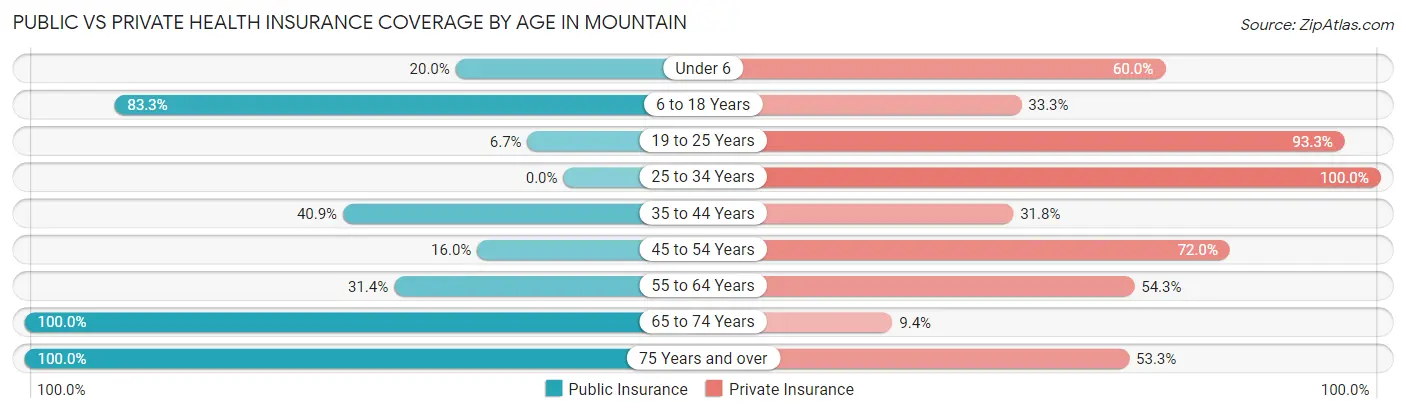
| Age Bracket | Public Insurance | Private Insurance |
| Under 6 | 3 (20.0%) | 9 (60.0%) |
| 6 to 18 Years | 15 (83.3%) | 6 (33.3%) |
| 19 to 25 Years | 1 (6.7%) | 14 (93.3%) |
| 25 to 34 Years | 0 (0.0%) | 18 (100.0%) |
| 35 to 44 Years | 9 (40.9%) | 7 (31.8%) |
| 45 to 54 Years | 4 (16.0%) | 18 (72.0%) |
| 55 to 64 Years | 22 (31.4%) | 38 (54.3%) |
| 65 to 74 Years | 64 (100.0%) | 6 (9.4%) |
| 75 Years and over | 15 (100.0%) | 8 (53.3%) |
| Total | 133 (50.8%) | 124 (47.3%) |
Disability Status by Sex by Age in Mountain
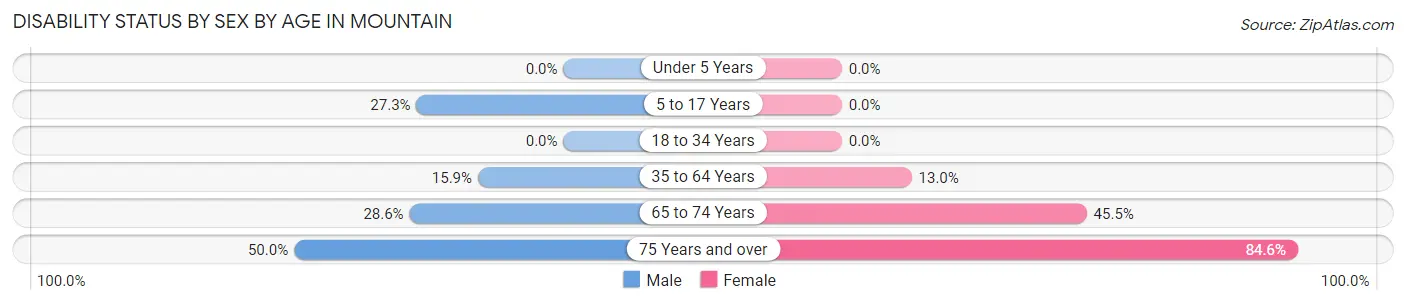
| Age Bracket | Male | Female |
| Under 5 Years | 0 (0.0%) | 0 (0.0%) |
| 5 to 17 Years | 3 (27.3%) | 0 (0.0%) |
| 18 to 34 Years | 0 (0.0%) | 0 (0.0%) |
| 35 to 64 Years | 10 (15.9%) | 7 (13.0%) |
| 65 to 74 Years | 12 (28.6%) | 10 (45.5%) |
| 75 Years and over | 1 (50.0%) | 11 (84.6%) |
Disability Class by Sex by Age in Mountain
Disability Class: Hearing Difficulty
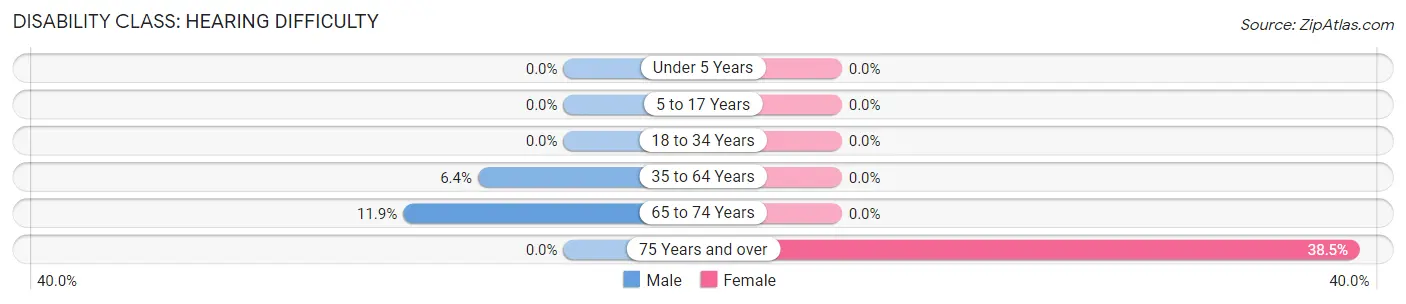
| Age Bracket | Male | Female |
| Under 5 Years | 0 (0.0%) | 0 (0.0%) |
| 5 to 17 Years | 0 (0.0%) | 0 (0.0%) |
| 18 to 34 Years | 0 (0.0%) | 0 (0.0%) |
| 35 to 64 Years | 4 (6.4%) | 0 (0.0%) |
| 65 to 74 Years | 5 (11.9%) | 0 (0.0%) |
| 75 Years and over | 0 (0.0%) | 5 (38.5%) |
Disability Class: Vision Difficulty
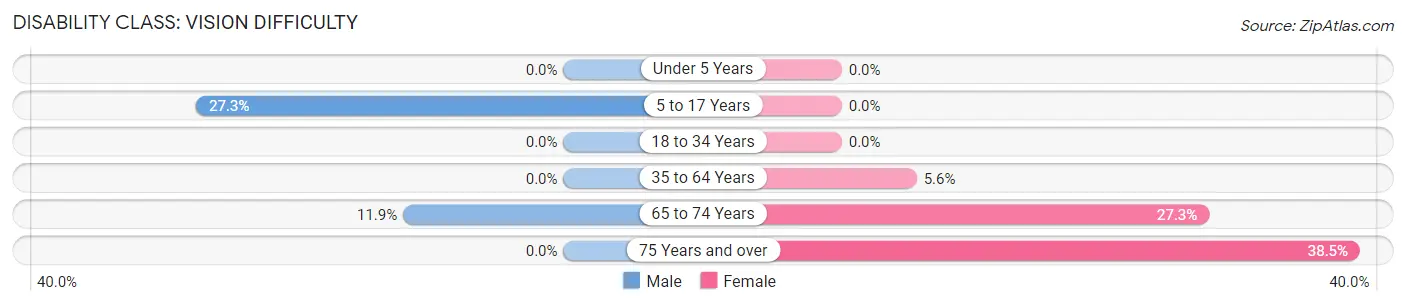
| Age Bracket | Male | Female |
| Under 5 Years | 0 (0.0%) | 0 (0.0%) |
| 5 to 17 Years | 3 (27.3%) | 0 (0.0%) |
| 18 to 34 Years | 0 (0.0%) | 0 (0.0%) |
| 35 to 64 Years | 0 (0.0%) | 3 (5.6%) |
| 65 to 74 Years | 5 (11.9%) | 6 (27.3%) |
| 75 Years and over | 0 (0.0%) | 5 (38.5%) |
Disability Class: Cognitive Difficulty
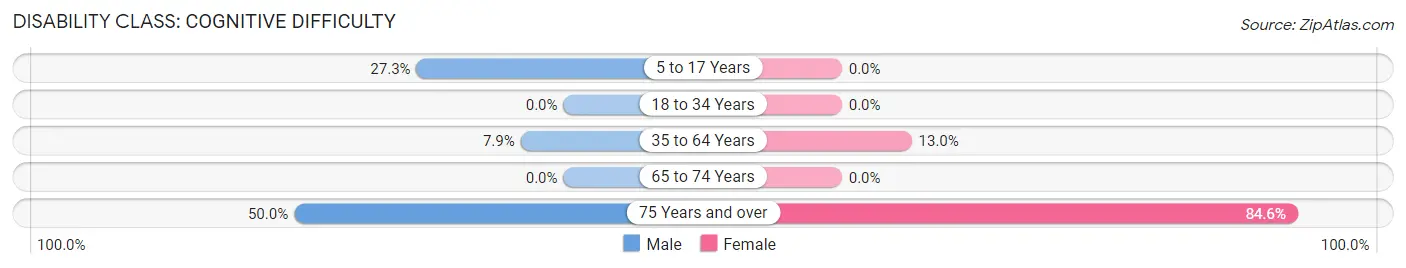
| Age Bracket | Male | Female |
| 5 to 17 Years | 3 (27.3%) | 0 (0.0%) |
| 18 to 34 Years | 0 (0.0%) | 0 (0.0%) |
| 35 to 64 Years | 5 (7.9%) | 7 (13.0%) |
| 65 to 74 Years | 0 (0.0%) | 0 (0.0%) |
| 75 Years and over | 1 (50.0%) | 11 (84.6%) |
Disability Class: Ambulatory Difficulty
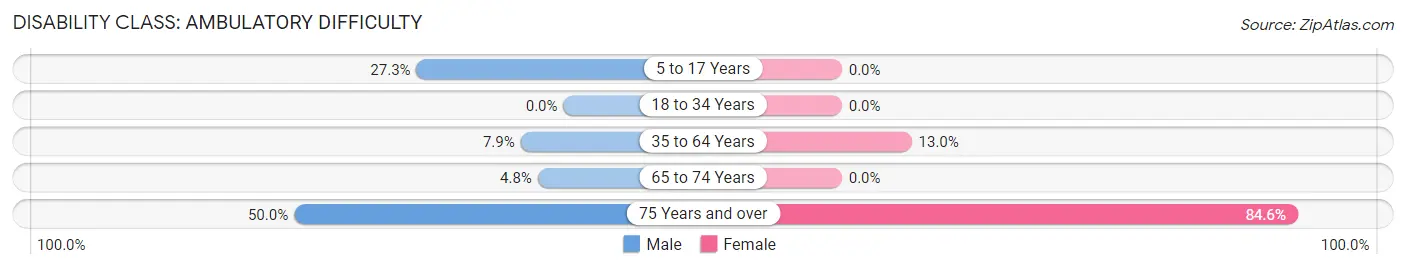
| Age Bracket | Male | Female |
| 5 to 17 Years | 3 (27.3%) | 0 (0.0%) |
| 18 to 34 Years | 0 (0.0%) | 0 (0.0%) |
| 35 to 64 Years | 5 (7.9%) | 7 (13.0%) |
| 65 to 74 Years | 2 (4.8%) | 0 (0.0%) |
| 75 Years and over | 1 (50.0%) | 11 (84.6%) |
Disability Class: Self-Care Difficulty
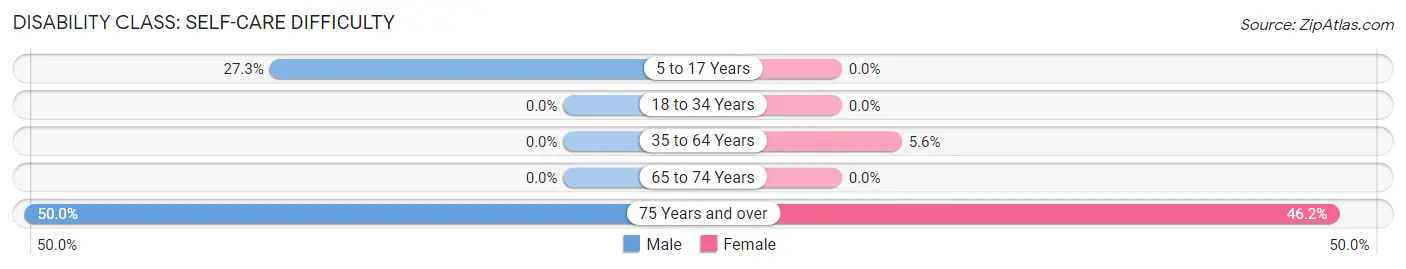
| Age Bracket | Male | Female |
| 5 to 17 Years | 3 (27.3%) | 0 (0.0%) |
| 18 to 34 Years | 0 (0.0%) | 0 (0.0%) |
| 35 to 64 Years | 0 (0.0%) | 3 (5.6%) |
| 65 to 74 Years | 0 (0.0%) | 0 (0.0%) |
| 75 Years and over | 1 (50.0%) | 6 (46.2%) |
Technology Access in Mountain
Computing Device Access in Mountain
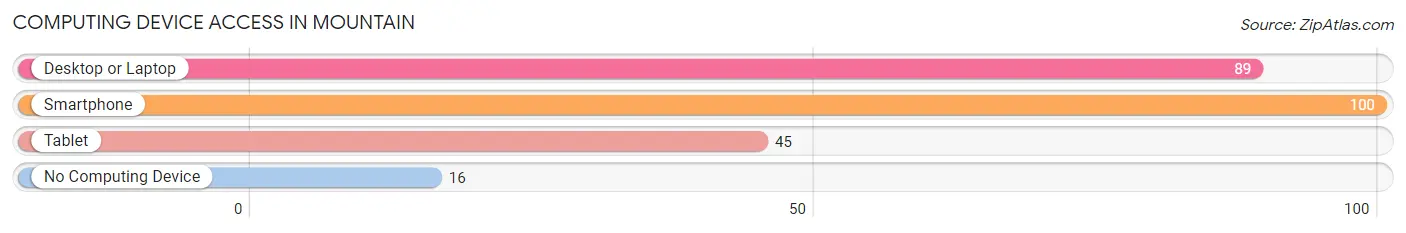
| Device Type | # Households | % Households |
| Desktop or Laptop | 89 | 70.1% |
| Smartphone | 100 | 78.7% |
| Tablet | 45 | 35.4% |
| No Computing Device | 16 | 12.6% |
| Total | 127 | 100.0% |
Internet Access in Mountain
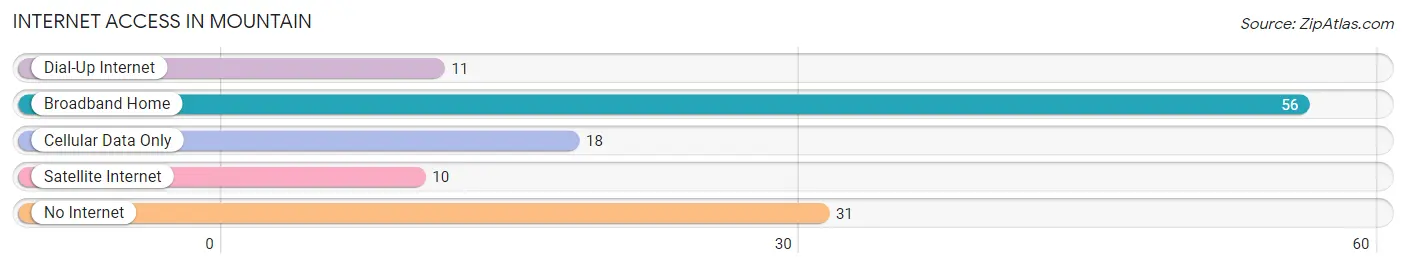
| Internet Type | # Households | % Households |
| Dial-Up Internet | 11 | 8.7% |
| Broadband Home | 56 | 44.1% |
| Cellular Data Only | 18 | 14.2% |
| Satellite Internet | 10 | 7.9% |
| No Internet | 31 | 24.4% |
| Total | 127 | 100.0% |
Mountain Summary
Mountain, Wisconsin is a small town located in Oconto County, Wisconsin. It is situated on the banks of the Oconto River, and is surrounded by rolling hills and forests. The town has a population of approximately 1,000 people, and is known for its rural charm and friendly atmosphere.
History
Mountain was first settled in the late 1800s by a group of German immigrants. The town was originally called “Mountainville”, but the name was changed to “Mountain” in 1891. The town was incorporated in 1895, and the first mayor was elected in 1896.
The town grew slowly over the years, and by the early 1900s, it had become a popular destination for tourists and outdoor enthusiasts. The town was known for its beautiful scenery and outdoor activities, such as fishing, hunting, and camping.
In the 1950s, the town began to experience a period of growth and development. The population increased, and new businesses began to open. The town also saw the construction of a new school, a library, and a post office.
Geography
Mountain is located in the northern part of Oconto County, Wisconsin. It is situated on the banks of the Oconto River, and is surrounded by rolling hills and forests. The town is located approximately 30 miles north of Green Bay, and is about an hour and a half drive from Milwaukee.
The town has a total area of 1.2 square miles, and is located at an elevation of 890 feet above sea level. The climate in Mountain is classified as humid continental, with cold winters and warm summers.
Economy
Mountain’s economy is largely based on tourism and outdoor recreation. The town is home to several popular tourist attractions, such as the Oconto River State Park, the Mountain Historical Society Museum, and the Mountain Nature Center.
The town also has a number of small businesses, including restaurants, shops, and lodging. The town is also home to a number of small manufacturing companies, such as a furniture factory and a woodworking shop.
Demographics
As of the 2010 census, the population of Mountain was 1,000 people. The racial makeup of the town was 97.2% White, 0.7% African American, 0.2% Native American, 0.2% Asian, 0.2% from other races, and 1.7% from two or more races.
The median household income in Mountain was $41,250, and the median family income was $50,000. The per capita income in the town was $20,000. The town’s poverty rate was 8.3%.
Mountain is a small, rural town with a friendly atmosphere and a strong sense of community. The town is known for its beautiful scenery and outdoor activities, and is a popular destination for tourists and outdoor enthusiasts. The town’s economy is largely based on tourism and outdoor recreation, and the town is home to a number of small businesses and manufacturing companies. The town has a population of approximately 1,000 people, and the racial makeup of the town is predominantly White. The median household income in Mountain is $41,250, and the median family income is $50,000. The town’s poverty rate is 8.3%.
Common Questions
What is Per Capita Income in Mountain?
Per Capita income in Mountain is $29,048.
What is the Median Family Income in Mountain?
Median Family Income in Mountain is $45,625.
What is the Median Household income in Mountain?
Median Household Income in Mountain is $46,875.
What is Income or Wage Gap in Mountain?
Income or Wage Gap in Mountain is 0.6%.
Women in Mountain earn 99.4 cents for every dollar earned by a man.
What is Inequality or Gini Index in Mountain?
Inequality or Gini Index in Mountain is 0.43.
What is the Total Population of Mountain?
Total Population of Mountain is 262.
What is the Total Male Population of Mountain?
Total Male Population of Mountain is 147.
What is the Total Female Population of Mountain?
Total Female Population of Mountain is 115.
What is the Ratio of Males per 100 Females in Mountain?
There are 127.83 Males per 100 Females in Mountain.
What is the Ratio of Females per 100 Males in Mountain?
There are 78.23 Females per 100 Males in Mountain.
What is the Median Population Age in Mountain?
Median Population Age in Mountain is 58.3 Years.
What is the Average Family Size in Mountain
Average Family Size in Mountain is 2.4 People.
What is the Average Household Size in Mountain
Average Household Size in Mountain is 2.1 People.
How Large is the Labor Force in Mountain?
There are 116 People in the Labor Forcein in Mountain.
What is the Percentage of People in the Labor Force in Mountain?
50.7% of People are in the Labor Force in Mountain.
What is the Unemployment Rate in Mountain?
Unemployment Rate in Mountain is 0.9%.