Mount Horeb, WI Map & Demographics
Mount Horeb Map
Mount Horeb Overview
$44,336
PER CAPITA INCOME
$105,104
AVG FAMILY INCOME
$96,915
AVG HOUSEHOLD INCOME
49.2%
WAGE / INCOME GAP [ % ]
50.8¢/ $1
WAGE / INCOME GAP [ $ ]
0.45
INEQUALITY / GINI INDEX
7,717
TOTAL POPULATION
3,544
MALE POPULATION
4,173
FEMALE POPULATION
84.93
MALES / 100 FEMALES
117.75
FEMALES / 100 MALES
36.2
MEDIAN AGE
3.4
AVG FAMILY SIZE
2.8
AVG HOUSEHOLD SIZE
4,354
LABOR FORCE [ PEOPLE ]
79.4%
PERCENT IN LABOR FORCE
2.0%
UNEMPLOYMENT RATE
Mount Horeb Zip Codes
Mount Horeb Area Codes
Income in Mount Horeb
Income Overview in Mount Horeb
Per Capita Income in Mount Horeb is $44,336, while median incomes of families and households are $105,104 and $96,915 respectively.
| Characteristic | Number | Measure |
| Per Capita Income | 7,717 | $44,336 |
| Median Family Income | 1,880 | $105,104 |
| Mean Family Income | 1,880 | $143,464 |
| Median Household Income | 2,714 | $96,915 |
| Mean Household Income | 2,714 | $121,356 |
| Income Deficit | 1,880 | $0 |
| Wage / Income Gap (%) | 7,717 | 49.16% |
| Wage / Income Gap ($) | 7,717 | 50.84¢ per $1 |
| Gini / Inequality Index | 7,717 | 0.45 |
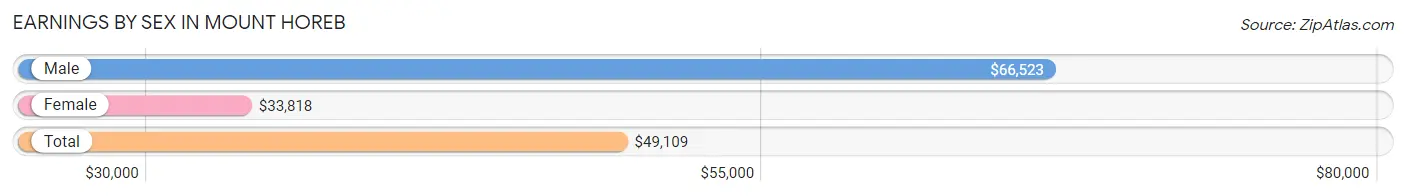
Earnings by Sex in Mount Horeb
Average Earnings in Mount Horeb are $49,109, $66,523 for men and $33,818 for women, a difference of 49.2%.
| Sex | Number | Average Earnings |
| Male | 2,276 (51.2%) | $66,523 |
| Female | 2,172 (48.8%) | $33,818 |
| Total | 4,448 (100.0%) | $49,109 |
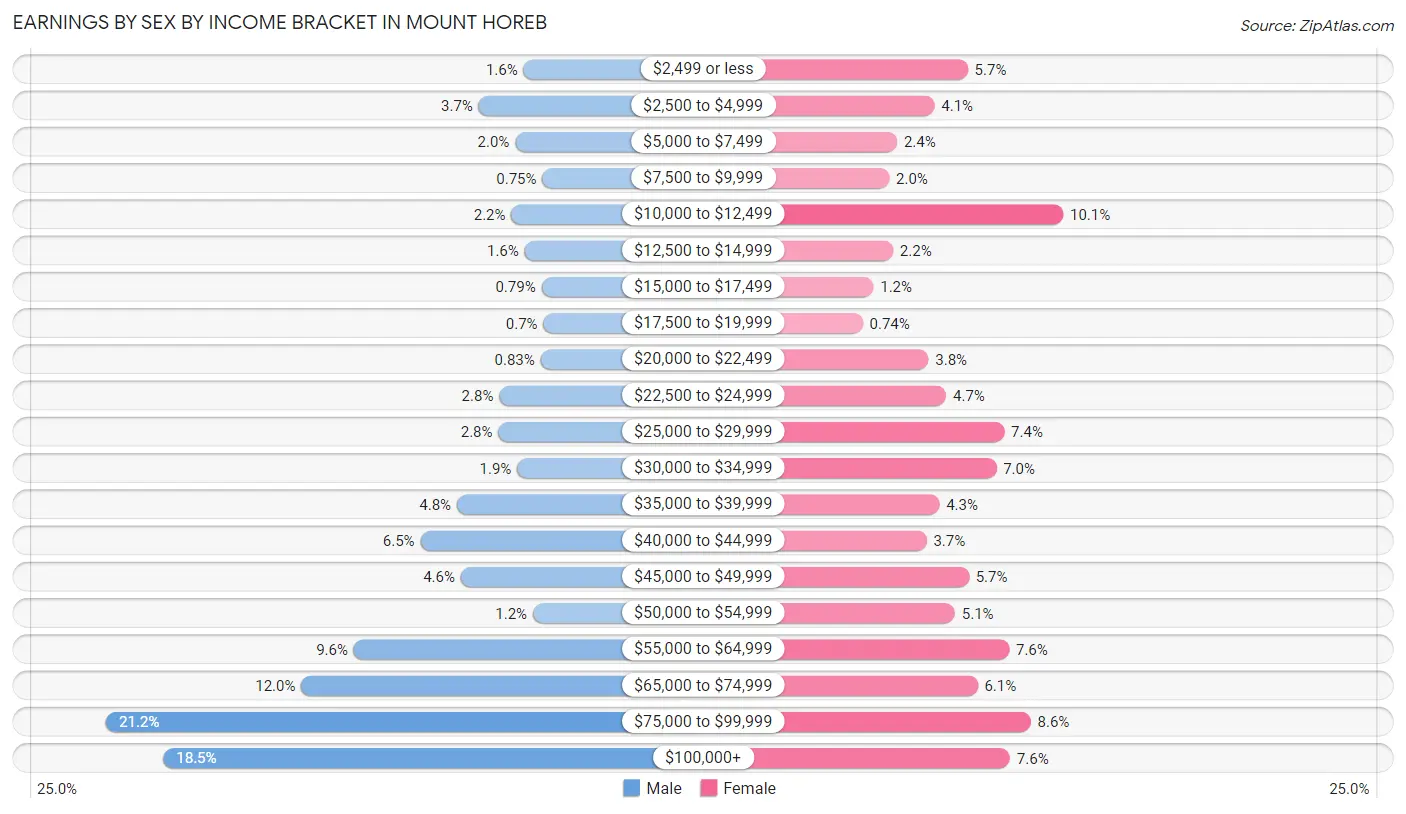
Earnings by Sex by Income Bracket in Mount Horeb
The most common earnings brackets in Mount Horeb are $75,000 to $99,999 for men (482 | 21.2%) and $10,000 to $12,499 for women (220 | 10.1%).
| Income | Male | Female |
| $2,499 or less | 37 (1.6%) | 123 (5.7%) |
| $2,500 to $4,999 | 85 (3.7%) | 89 (4.1%) |
| $5,000 to $7,499 | 46 (2.0%) | 51 (2.4%) |
| $7,500 to $9,999 | 17 (0.7%) | 43 (2.0%) |
| $10,000 to $12,499 | 50 (2.2%) | 220 (10.1%) |
| $12,500 to $14,999 | 36 (1.6%) | 47 (2.2%) |
| $15,000 to $17,499 | 18 (0.8%) | 27 (1.2%) |
| $17,500 to $19,999 | 16 (0.7%) | 16 (0.7%) |
| $20,000 to $22,499 | 19 (0.8%) | 83 (3.8%) |
| $22,500 to $24,999 | 63 (2.8%) | 101 (4.6%) |
| $25,000 to $29,999 | 64 (2.8%) | 160 (7.4%) |
| $30,000 to $34,999 | 44 (1.9%) | 152 (7.0%) |
| $35,000 to $39,999 | 108 (4.8%) | 94 (4.3%) |
| $40,000 to $44,999 | 147 (6.5%) | 81 (3.7%) |
| $45,000 to $49,999 | 104 (4.6%) | 124 (5.7%) |
| $50,000 to $54,999 | 27 (1.2%) | 110 (5.1%) |
| $55,000 to $64,999 | 218 (9.6%) | 165 (7.6%) |
| $65,000 to $74,999 | 274 (12.0%) | 133 (6.1%) |
| $75,000 to $99,999 | 482 (21.2%) | 187 (8.6%) |
| $100,000+ | 421 (18.5%) | 166 (7.6%) |
| Total | 2,276 (100.0%) | 2,172 (100.0%) |
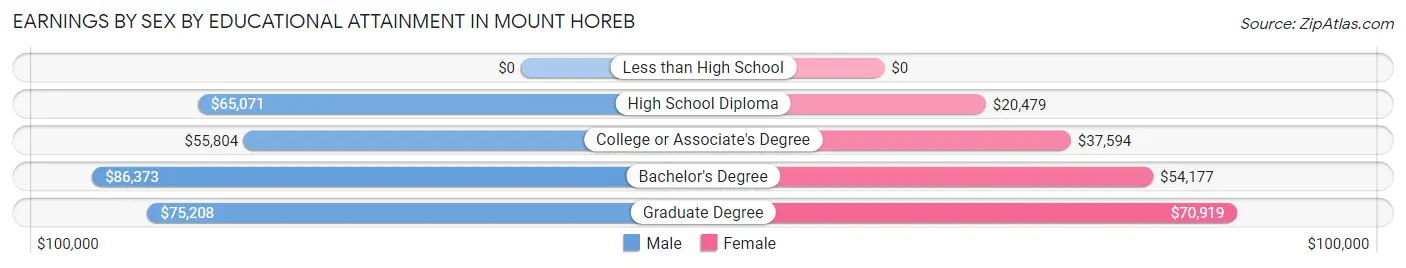
Earnings by Sex by Educational Attainment in Mount Horeb
Average earnings in Mount Horeb are $71,011 for men and $38,618 for women, a difference of 45.6%. Men with an educational attainment of bachelor's degree enjoy the highest average annual earnings of $86,373, while those with college or associate's degree education earn the least with $55,804. Women with an educational attainment of graduate degree earn the most with the average annual earnings of $70,919, while those with high school diploma education have the smallest earnings of $20,479.
| Educational Attainment | Male Income | Female Income |
| Less than High School | - | - |
| High School Diploma | $65,071 | $20,479 |
| College or Associate's Degree | $55,804 | $37,594 |
| Bachelor's Degree | $86,373 | $54,177 |
| Graduate Degree | $75,208 | $70,919 |
| Total | $71,011 | $38,618 |
Family Income in Mount Horeb
Family Income Brackets in Mount Horeb
According to the Mount Horeb family income data, there are 716 families falling into the $100,000 to $149,999 income range, which is the most common income bracket and makes up 38.1% of all families.
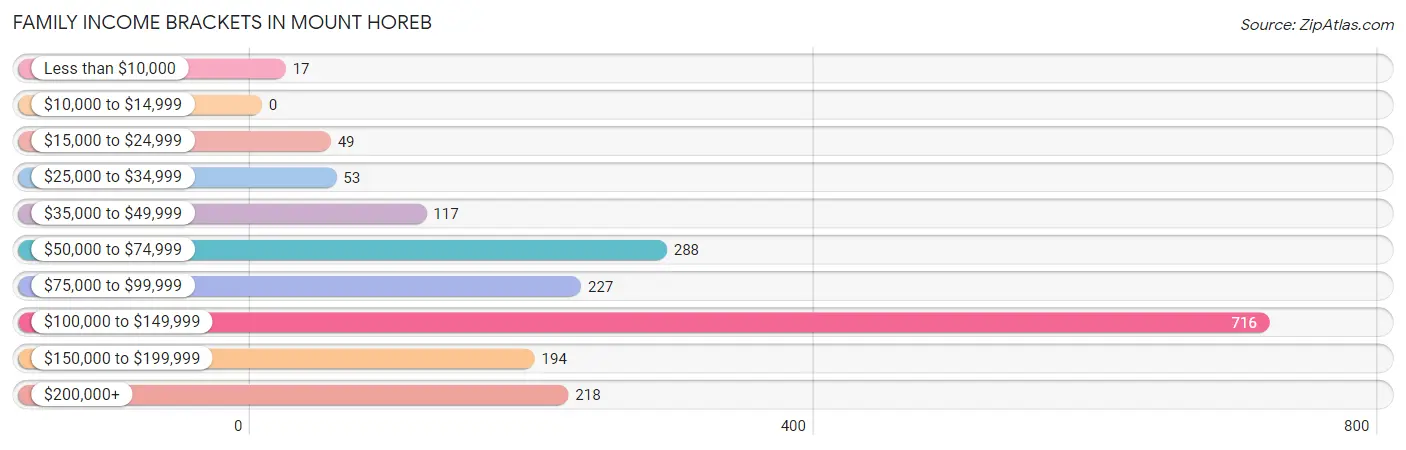
| Income Bracket | # Families | % Families |
| Less than $10,000 | 17 | 0.9% |
| $10,000 to $14,999 | 0 | 0.0% |
| $15,000 to $24,999 | 49 | 2.6% |
| $25,000 to $34,999 | 53 | 2.8% |
| $35,000 to $49,999 | 117 | 6.2% |
| $50,000 to $74,999 | 288 | 15.3% |
| $75,000 to $99,999 | 227 | 12.1% |
| $100,000 to $149,999 | 716 | 38.1% |
| $150,000 to $199,999 | 194 | 10.3% |
| $200,000+ | 218 | 11.6% |
Family Income by Famaliy Size in Mount Horeb
5-person families (157 | 8.4%) account for the highest median family income in Mount Horeb with $156,932 per family, while 2-person families (730 | 38.8%) have the highest median income of $45,334 per family member.
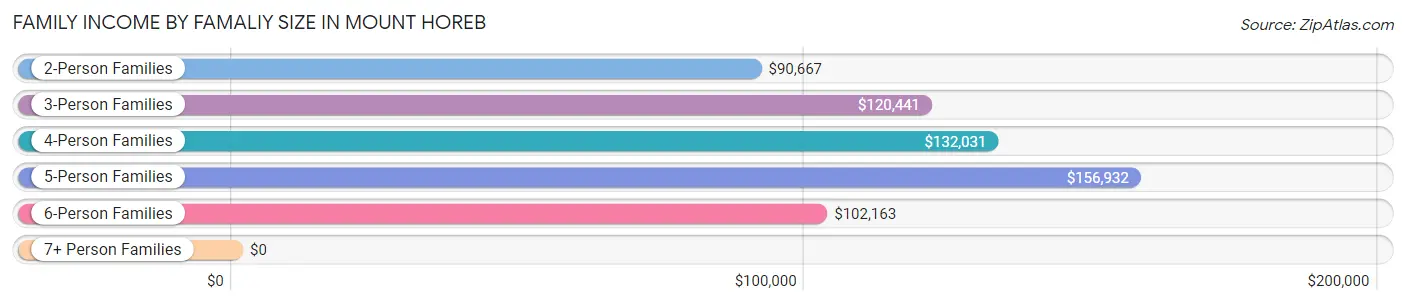
| Income Bracket | # Families | Median Income |
| 2-Person Families | 730 (38.8%) | $90,667 |
| 3-Person Families | 428 (22.8%) | $120,441 |
| 4-Person Families | 345 (18.3%) | $132,031 |
| 5-Person Families | 157 (8.4%) | $156,932 |
| 6-Person Families | 207 (11.0%) | $102,163 |
| 7+ Person Families | 13 (0.7%) | $0 |
| Total | 1,880 (100.0%) | $105,104 |
Family Income by Number of Earners in Mount Horeb
The median family income in Mount Horeb is $105,104, with families comprising 3+ earners (212) having the highest median family income of $142,500, while families with no earners (131) have the lowest median family income of $36,473, accounting for 11.3% and 7.0% of families, respectively.
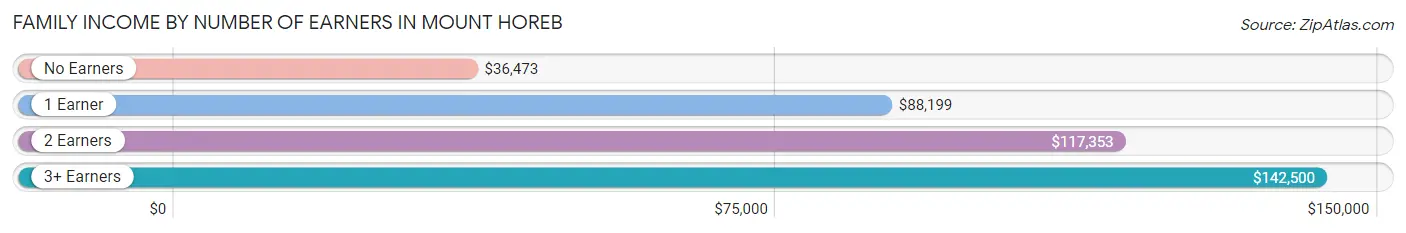
| Number of Earners | # Families | Median Income |
| No Earners | 131 (7.0%) | $36,473 |
| 1 Earner | 393 (20.9%) | $88,199 |
| 2 Earners | 1,144 (60.9%) | $117,353 |
| 3+ Earners | 212 (11.3%) | $142,500 |
| Total | 1,880 (100.0%) | $105,104 |
Household Income in Mount Horeb
Household Income Brackets in Mount Horeb
With 801 households falling in the category, the $100,000 to $149,999 income range is the most frequent in Mount Horeb, accounting for 29.5% of all households. In contrast, only 57 households (2.1%) fall into the less than $10,000 income bracket, making it the least populous group.
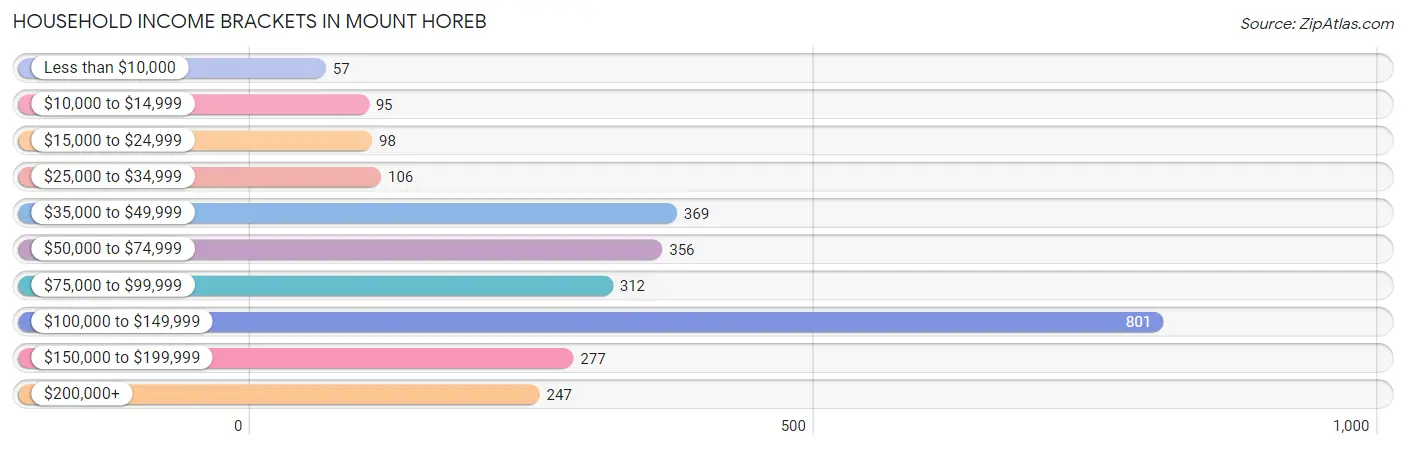
| Income Bracket | # Households | % Households |
| Less than $10,000 | 57 | 2.1% |
| $10,000 to $14,999 | 95 | 3.5% |
| $15,000 to $24,999 | 98 | 3.6% |
| $25,000 to $34,999 | 106 | 3.9% |
| $35,000 to $49,999 | 369 | 13.6% |
| $50,000 to $74,999 | 356 | 13.1% |
| $75,000 to $99,999 | 312 | 11.5% |
| $100,000 to $149,999 | 801 | 29.5% |
| $150,000 to $199,999 | 277 | 10.2% |
| $200,000+ | 247 | 9.1% |
Household Income by Householder Age in Mount Horeb
The median household income in Mount Horeb is $96,915, with the highest median household income of $110,455 found in the 25 to 44 years age bracket for the primary householder. A total of 1,076 households (39.7%) fall into this category. Meanwhile, the 15 to 24 years age bracket for the primary householder has the lowest median household income of $0, with 24 households (0.9%) in this group.
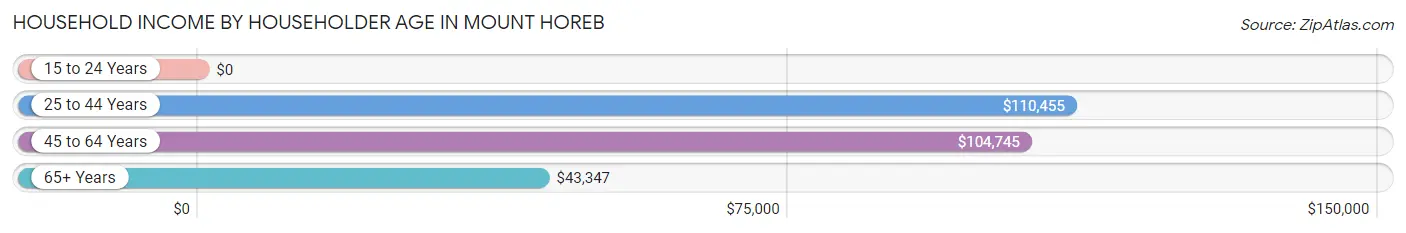
| Income Bracket | # Households | Median Income |
| 15 to 24 Years | 24 (0.9%) | $0 |
| 25 to 44 Years | 1,076 (39.7%) | $110,455 |
| 45 to 64 Years | 978 (36.0%) | $104,745 |
| 65+ Years | 636 (23.4%) | $43,347 |
| Total | 2,714 (100.0%) | $96,915 |
Poverty in Mount Horeb
Income Below Poverty by Sex and Age in Mount Horeb
With 2.9% poverty level for males and 4.2% for females among the residents of Mount Horeb, 16 and 17 year old males and 65 to 74 year old females are the most vulnerable to poverty, with 27 males (19.3%) and 40 females (15.3%) in their respective age groups living below the poverty level.
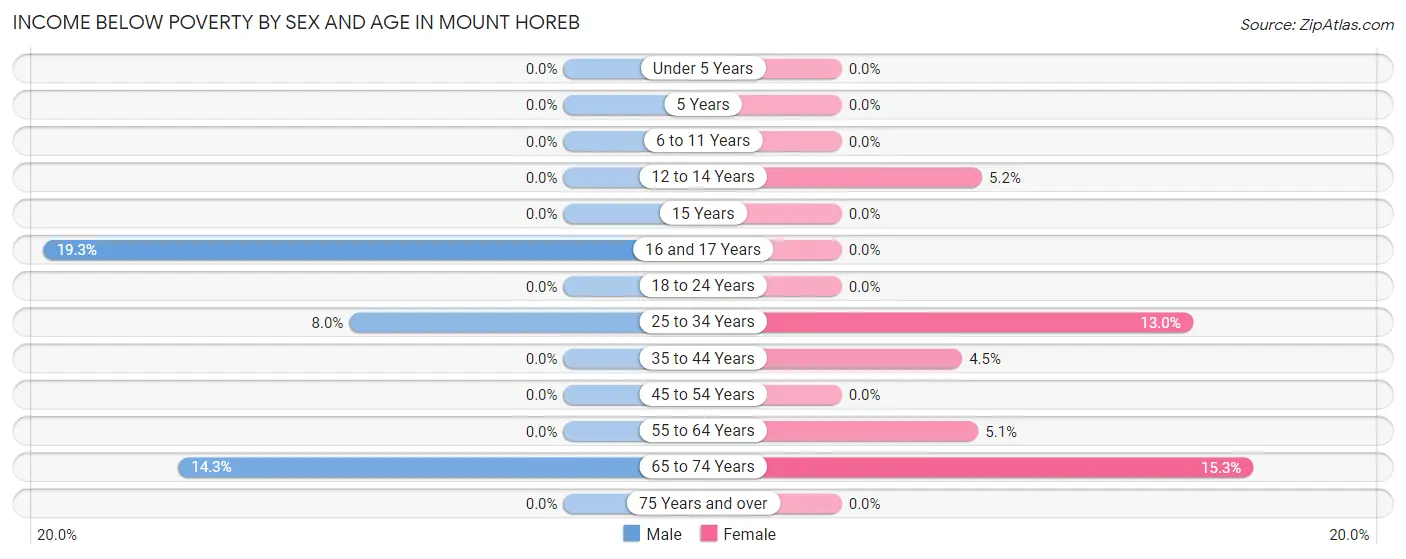
| Age Bracket | Male | Female |
| Under 5 Years | 0 (0.0%) | 0 (0.0%) |
| 5 Years | 0 (0.0%) | 0 (0.0%) |
| 6 to 11 Years | 0 (0.0%) | 0 (0.0%) |
| 12 to 14 Years | 0 (0.0%) | 20 (5.2%) |
| 15 Years | 0 (0.0%) | 0 (0.0%) |
| 16 and 17 Years | 27 (19.3%) | 0 (0.0%) |
| 18 to 24 Years | 0 (0.0%) | 0 (0.0%) |
| 25 to 34 Years | 38 (8.0%) | 59 (13.0%) |
| 35 to 44 Years | 0 (0.0%) | 32 (4.5%) |
| 45 to 54 Years | 0 (0.0%) | 0 (0.0%) |
| 55 to 64 Years | 0 (0.0%) | 21 (5.1%) |
| 65 to 74 Years | 38 (14.3%) | 40 (15.3%) |
| 75 Years and over | 0 (0.0%) | 0 (0.0%) |
| Total | 103 (2.9%) | 172 (4.2%) |
Income Above Poverty by Sex and Age in Mount Horeb
According to the poverty statistics in Mount Horeb, males aged under 5 years and females aged under 5 years are the age groups that are most secure financially, with 100.0% of males and 100.0% of females in these age groups living above the poverty line.
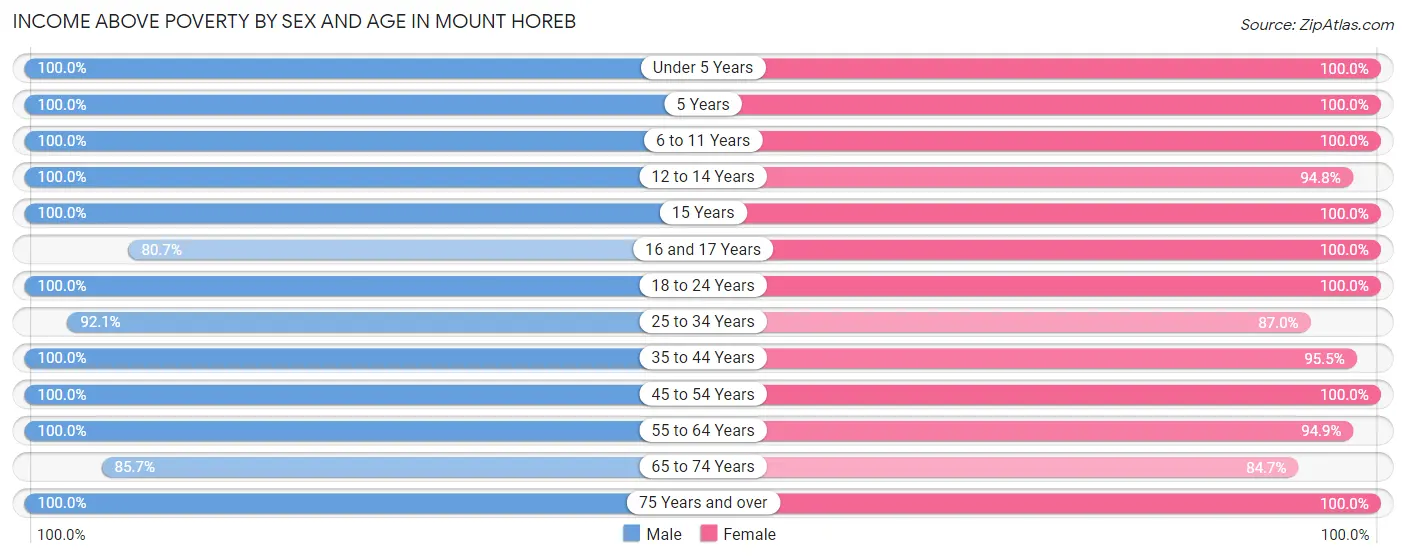
| Age Bracket | Male | Female |
| Under 5 Years | 281 (100.0%) | 209 (100.0%) |
| 5 Years | 30 (100.0%) | 49 (100.0%) |
| 6 to 11 Years | 288 (100.0%) | 563 (100.0%) |
| 12 to 14 Years | 319 (100.0%) | 364 (94.8%) |
| 15 Years | 38 (100.0%) | 73 (100.0%) |
| 16 and 17 Years | 113 (80.7%) | 135 (100.0%) |
| 18 to 24 Years | 139 (100.0%) | 100 (100.0%) |
| 25 to 34 Years | 440 (92.0%) | 394 (87.0%) |
| 35 to 44 Years | 626 (100.0%) | 684 (95.5%) |
| 45 to 54 Years | 416 (100.0%) | 480 (100.0%) |
| 55 to 64 Years | 414 (100.0%) | 393 (94.9%) |
| 65 to 74 Years | 228 (85.7%) | 222 (84.7%) |
| 75 Years and over | 77 (100.0%) | 296 (100.0%) |
| Total | 3,409 (97.1%) | 3,962 (95.8%) |
Income Below Poverty Among Married-Couple Families in Mount Horeb
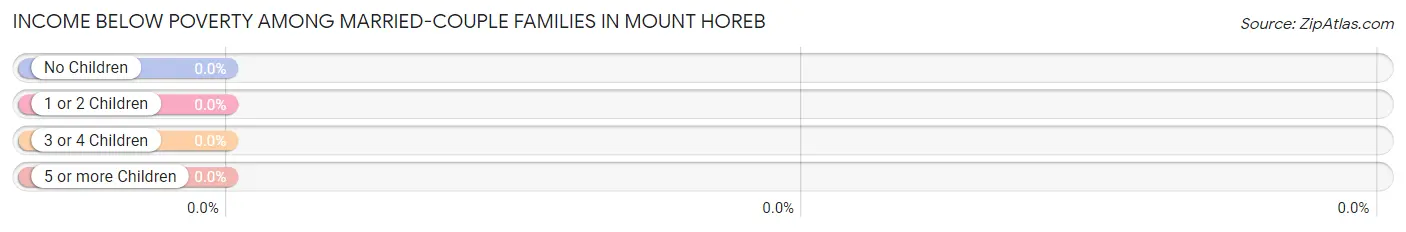
| Children | Above Poverty | Below Poverty |
| No Children | 671 (100.0%) | 0 (0.0%) |
| 1 or 2 Children | 522 (100.0%) | 0 (0.0%) |
| 3 or 4 Children | 358 (100.0%) | 0 (0.0%) |
| 5 or more Children | 13 (100.0%) | 0 (0.0%) |
| Total | 1,564 (100.0%) | 0 (0.0%) |
Income Below Poverty Among Single-Parent Households in Mount Horeb
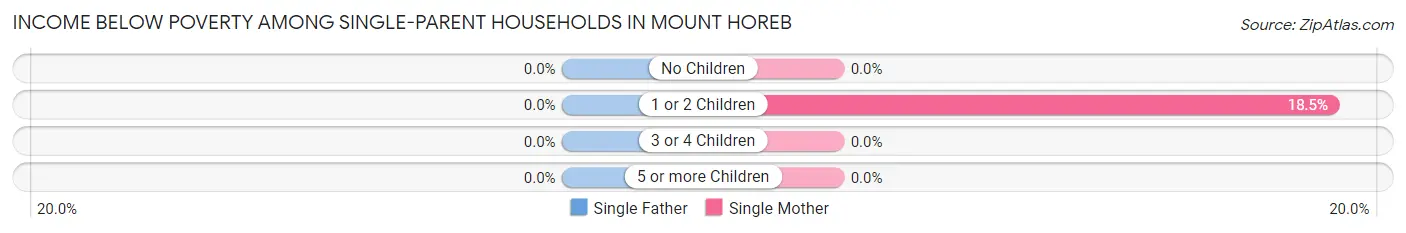
| Children | Single Father | Single Mother |
| No Children | 0 (0.0%) | 0 (0.0%) |
| 1 or 2 Children | 0 (0.0%) | 17 (18.5%) |
| 3 or 4 Children | 0 (0.0%) | 0 (0.0%) |
| 5 or more Children | 0 (0.0%) | 0 (0.0%) |
| Total | 0 (0.0%) | 17 (8.1%) |
Income Below Poverty Among Married-Couple vs Single-Parent Households in Mount Horeb
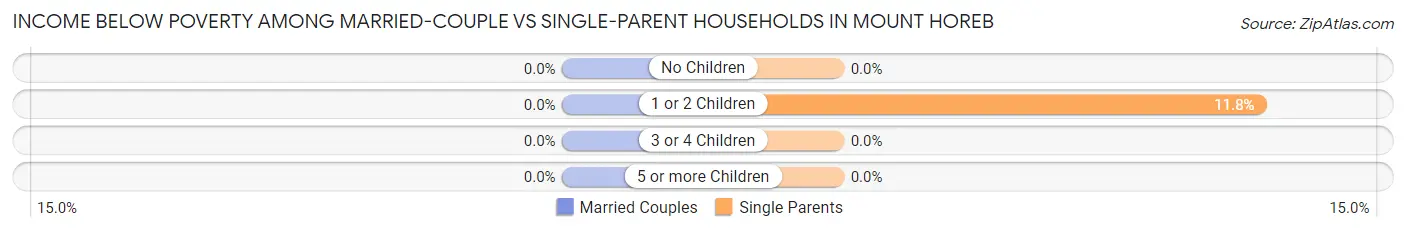
| Children | Married-Couple Families | Single-Parent Households |
| No Children | 0 (0.0%) | 0 (0.0%) |
| 1 or 2 Children | 0 (0.0%) | 17 (11.8%) |
| 3 or 4 Children | 0 (0.0%) | 0 (0.0%) |
| 5 or more Children | 0 (0.0%) | 0 (0.0%) |
| Total | 0 (0.0%) | 17 (5.4%) |
Race in Mount Horeb
The most populous races in Mount Horeb are White / Caucasian (7,205 | 93.4%), Two or more Races (344 | 4.5%), and Hispanic or Latino (172 | 2.2%).
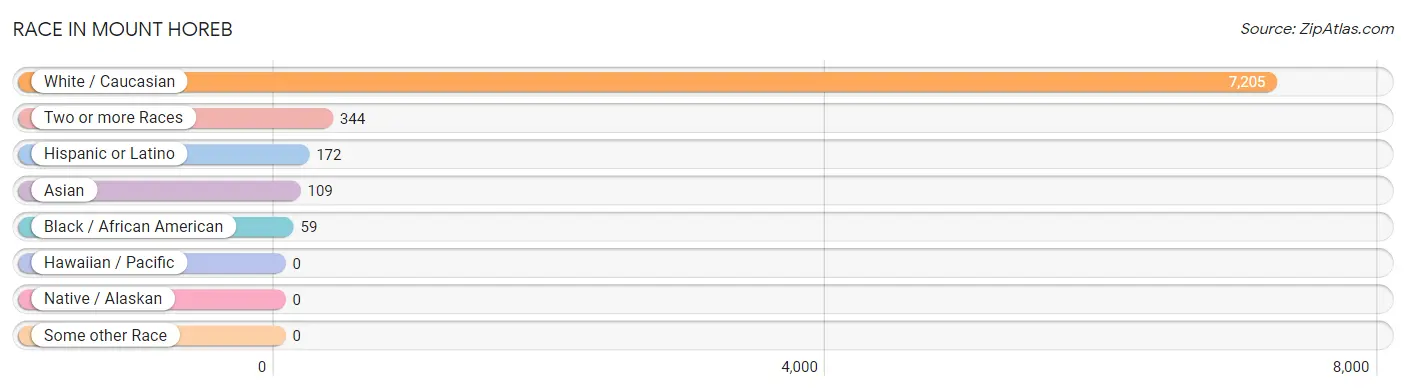
| Race | # Population | % Population |
| Asian | 109 | 1.4% |
| Black / African American | 59 | 0.8% |
| Hawaiian / Pacific | 0 | 0.0% |
| Hispanic or Latino | 172 | 2.2% |
| Native / Alaskan | 0 | 0.0% |
| White / Caucasian | 7,205 | 93.4% |
| Two or more Races | 344 | 4.5% |
| Some other Race | 0 | 0.0% |
| Total | 7,717 | 100.0% |
Ancestry in Mount Horeb
The most populous ancestries reported in Mount Horeb are German (3,105 | 40.2%), Irish (1,289 | 16.7%), Norwegian (1,115 | 14.4%), English (875 | 11.3%), and French (488 | 6.3%), together accounting for 89.0% of all Mount Horeb residents.
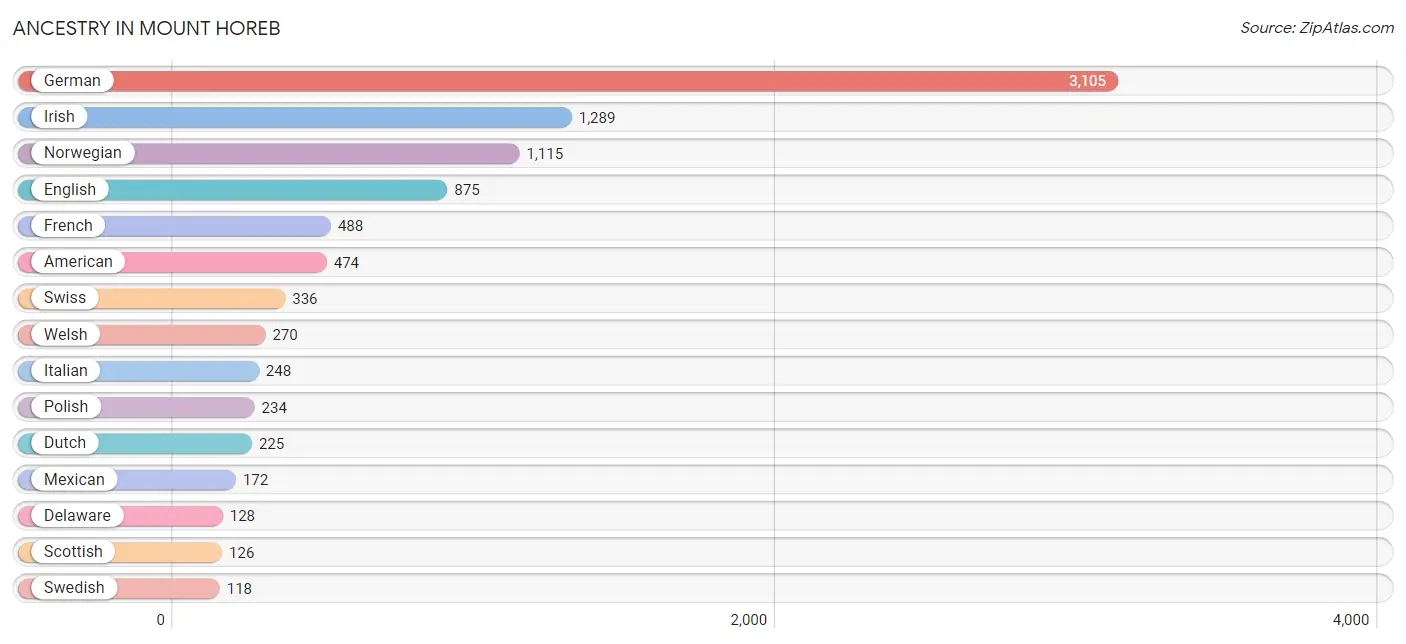
| Ancestry | # Population | % Population |
| American | 474 | 6.1% |
| Austrian | 2 | 0.0% |
| Burmese | 12 | 0.2% |
| Celtic | 18 | 0.2% |
| Cherokee | 9 | 0.1% |
| Croatian | 32 | 0.4% |
| Danish | 34 | 0.4% |
| Delaware | 128 | 1.7% |
| Dutch | 225 | 2.9% |
| English | 875 | 11.3% |
| European | 95 | 1.2% |
| Finnish | 81 | 1.1% |
| French | 488 | 6.3% |
| German | 3,105 | 40.2% |
| Greek | 12 | 0.2% |
| Indian (Asian) | 13 | 0.2% |
| Irish | 1,289 | 16.7% |
| Italian | 248 | 3.2% |
| Korean | 8 | 0.1% |
| Mexican | 172 | 2.2% |
| Northern European | 19 | 0.3% |
| Norwegian | 1,115 | 14.4% |
| Polish | 234 | 3.0% |
| Russian | 38 | 0.5% |
| Scottish | 126 | 1.6% |
| Senegalese | 42 | 0.5% |
| Slovak | 16 | 0.2% |
| Subsaharan African | 42 | 0.5% |
| Swedish | 118 | 1.5% |
| Swiss | 336 | 4.3% |
| Thai | 84 | 1.1% |
| Welsh | 270 | 3.5% | View All 32 Rows |
Immigrants in Mount Horeb
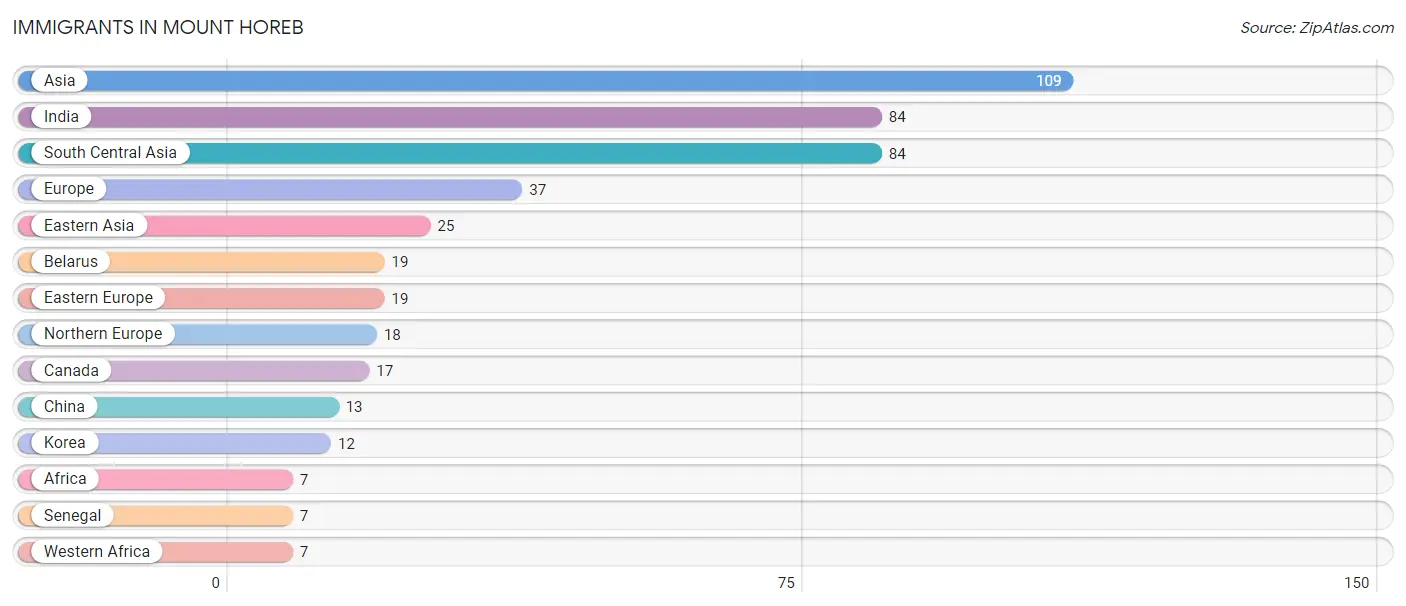
The most numerous immigrant groups reported in Mount Horeb came from Asia (109 | 1.4%), India (84 | 1.1%), South Central Asia (84 | 1.1%), Europe (37 | 0.5%), and Eastern Asia (25 | 0.3%), together accounting for 4.4% of all Mount Horeb residents.
| Immigration Origin | # Population | % Population |
| Africa | 7 | 0.1% |
| Asia | 109 | 1.4% |
| Belarus | 19 | 0.3% |
| Canada | 17 | 0.2% |
| China | 13 | 0.2% |
| Eastern Asia | 25 | 0.3% |
| Eastern Europe | 19 | 0.3% |
| Europe | 37 | 0.5% |
| India | 84 | 1.1% |
| Korea | 12 | 0.2% |
| Northern Europe | 18 | 0.2% |
| Senegal | 7 | 0.1% |
| South Central Asia | 84 | 1.1% |
| Western Africa | 7 | 0.1% | View All 14 Rows |
Sex and Age in Mount Horeb
Sex and Age in Mount Horeb
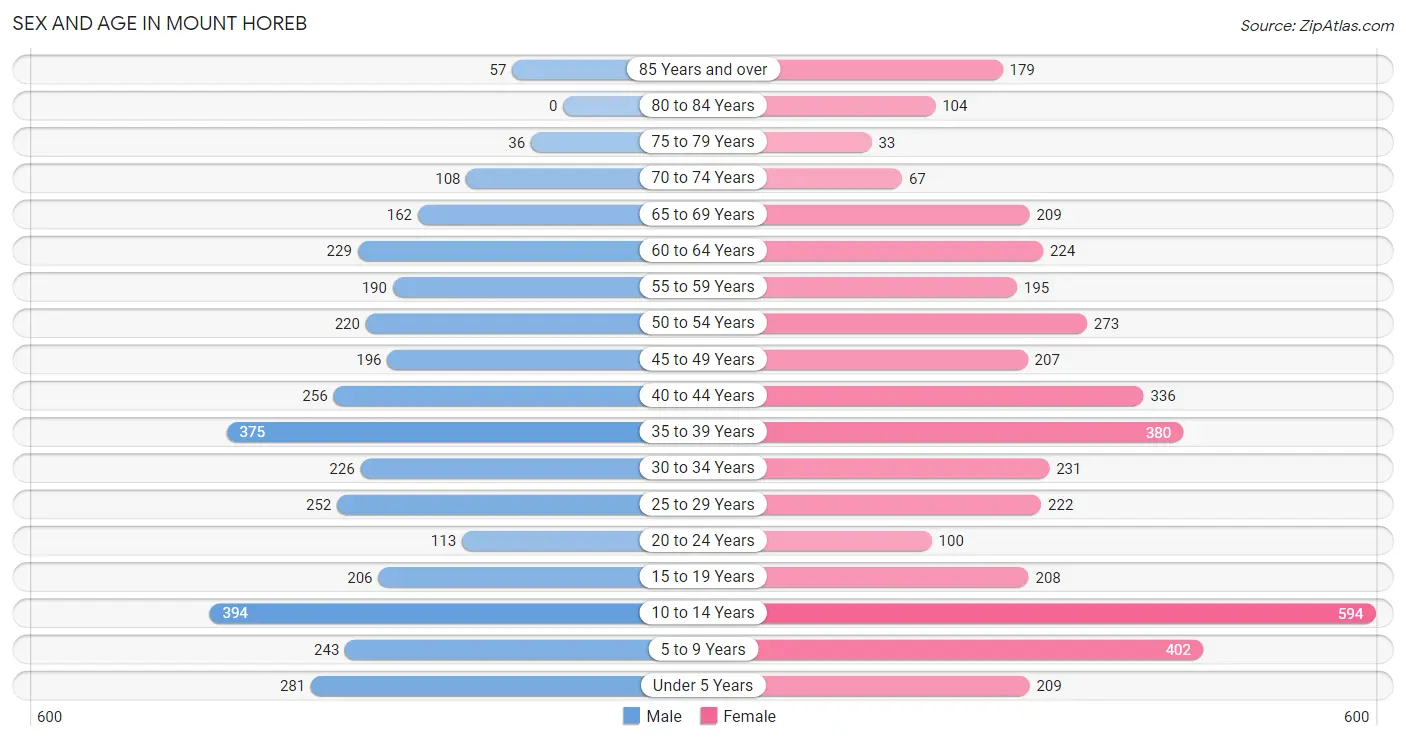
The most populous age groups in Mount Horeb are 10 to 14 Years (394 | 11.1%) for men and 10 to 14 Years (594 | 14.2%) for women.
| Age Bracket | Male | Female |
| Under 5 Years | 281 (7.9%) | 209 (5.0%) |
| 5 to 9 Years | 243 (6.9%) | 402 (9.6%) |
| 10 to 14 Years | 394 (11.1%) | 594 (14.2%) |
| 15 to 19 Years | 206 (5.8%) | 208 (5.0%) |
| 20 to 24 Years | 113 (3.2%) | 100 (2.4%) |
| 25 to 29 Years | 252 (7.1%) | 222 (5.3%) |
| 30 to 34 Years | 226 (6.4%) | 231 (5.5%) |
| 35 to 39 Years | 375 (10.6%) | 380 (9.1%) |
| 40 to 44 Years | 256 (7.2%) | 336 (8.1%) |
| 45 to 49 Years | 196 (5.5%) | 207 (5.0%) |
| 50 to 54 Years | 220 (6.2%) | 273 (6.5%) |
| 55 to 59 Years | 190 (5.4%) | 195 (4.7%) |
| 60 to 64 Years | 229 (6.5%) | 224 (5.4%) |
| 65 to 69 Years | 162 (4.6%) | 209 (5.0%) |
| 70 to 74 Years | 108 (3.0%) | 67 (1.6%) |
| 75 to 79 Years | 36 (1.0%) | 33 (0.8%) |
| 80 to 84 Years | 0 (0.0%) | 104 (2.5%) |
| 85 Years and over | 57 (1.6%) | 179 (4.3%) |
| Total | 3,544 (100.0%) | 4,173 (100.0%) |
Families and Households in Mount Horeb
Median Family Size in Mount Horeb
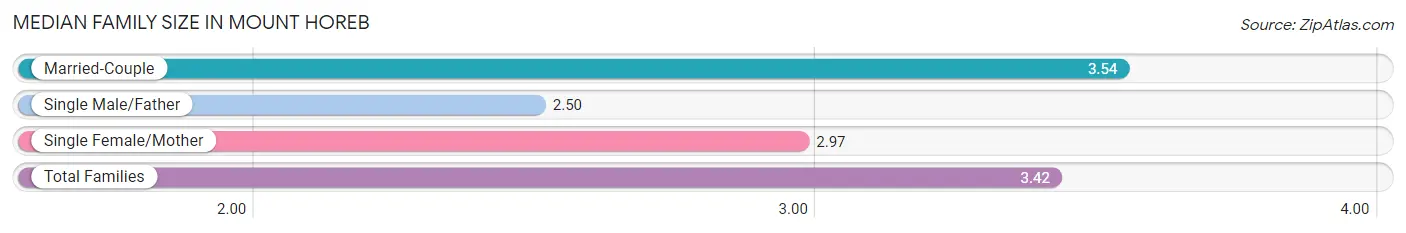
The median family size in Mount Horeb is 3.42 persons per family, with married-couple families (1,564 | 83.2%) accounting for the largest median family size of 3.54 persons per family. On the other hand, single male/father families (107 | 5.7%) represent the smallest median family size with 2.50 persons per family.
| Family Type | # Families | Family Size |
| Married-Couple | 1,564 (83.2%) | 3.54 |
| Single Male/Father | 107 (5.7%) | 2.50 |
| Single Female/Mother | 209 (11.1%) | 2.97 |
| Total Families | 1,880 (100.0%) | 3.42 |
Median Household Size in Mount Horeb
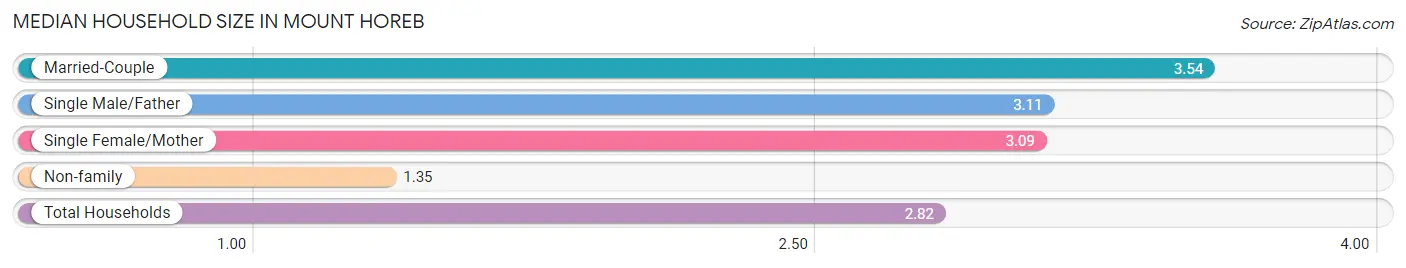
The median household size in Mount Horeb is 2.82 persons per household, with married-couple households (1,564 | 57.6%) accounting for the largest median household size of 3.54 persons per household. non-family households (834 | 30.7%) represent the smallest median household size with 1.35 persons per household.
| Household Type | # Households | Household Size |
| Married-Couple | 1,564 (57.6%) | 3.54 |
| Single Male/Father | 107 (3.9%) | 3.11 |
| Single Female/Mother | 209 (7.7%) | 3.09 |
| Non-family | 834 (30.7%) | 1.35 |
| Total Households | 2,714 (100.0%) | 2.82 |
Household Size by Marriage Status in Mount Horeb
Out of a total of 2,714 households in Mount Horeb, 1,880 (69.3%) are family households, while 834 (30.7%) are nonfamily households. The most numerous type of family households are 2-person households, comprising 674, and the most common type of nonfamily households are 1-person households, comprising 598.
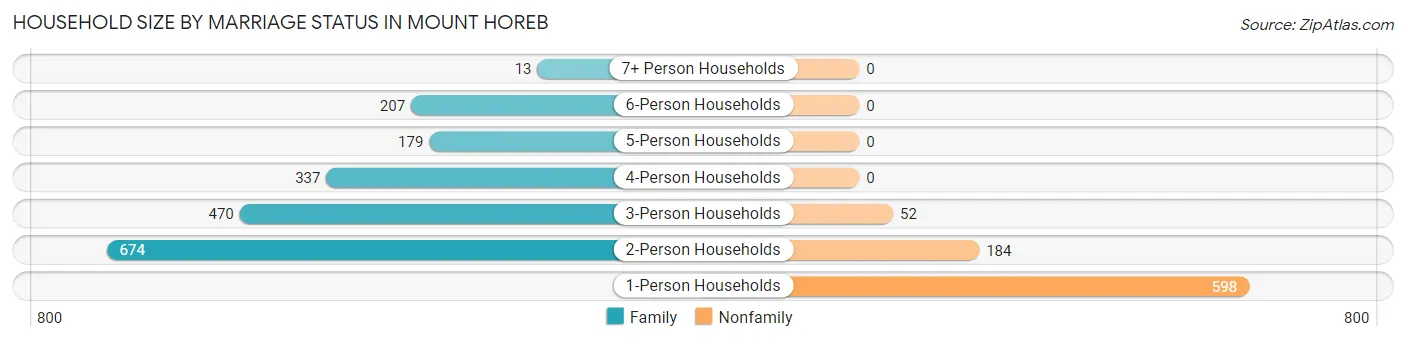
| Household Size | Family Households | Nonfamily Households |
| 1-Person Households | - | 598 (22.0%) |
| 2-Person Households | 674 (24.8%) | 184 (6.8%) |
| 3-Person Households | 470 (17.3%) | 52 (1.9%) |
| 4-Person Households | 337 (12.4%) | 0 (0.0%) |
| 5-Person Households | 179 (6.6%) | 0 (0.0%) |
| 6-Person Households | 207 (7.6%) | 0 (0.0%) |
| 7+ Person Households | 13 (0.5%) | 0 (0.0%) |
| Total | 1,880 (69.3%) | 834 (30.7%) |
Female Fertility in Mount Horeb
Fertility by Age in Mount Horeb
Average fertility rate in Mount Horeb is 56.0 births per 1,000 women. Women in the age bracket of 20 to 34 years have the highest fertility rate with 118.0 births per 1,000 women. Women in the age bracket of 20 to 34 years acount for 67.7% of all women with births.
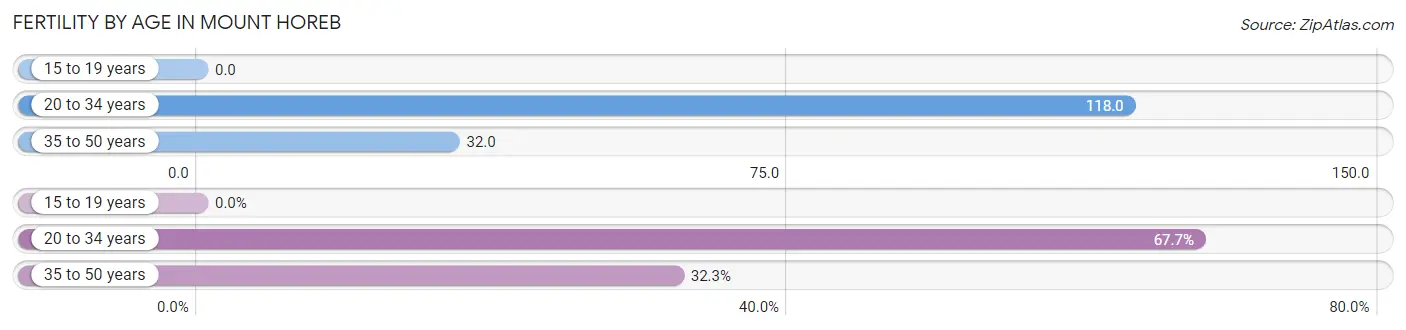
| Age Bracket | Women with Births | Births / 1,000 Women |
| 15 to 19 years | 0 (0.0%) | 0.0 |
| 20 to 34 years | 65 (67.7%) | 118.0 |
| 35 to 50 years | 31 (32.3%) | 32.0 |
| Total | 96 (100.0%) | 56.0 |
Fertility by Age by Marriage Status in Mount Horeb
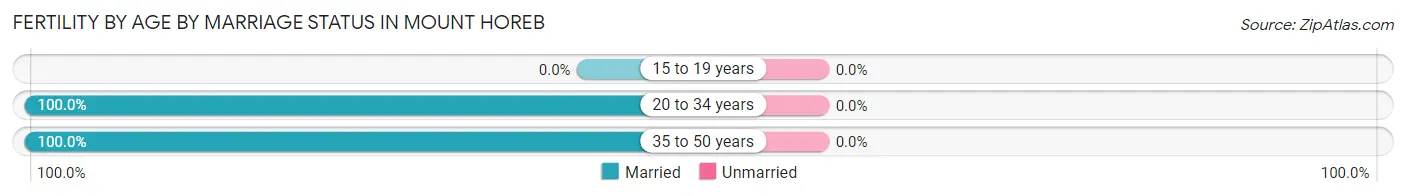
| Age Bracket | Married | Unmarried |
| 15 to 19 years | 0 (0.0%) | 0 (0.0%) |
| 20 to 34 years | 65 (100.0%) | 0 (0.0%) |
| 35 to 50 years | 31 (100.0%) | 0 (0.0%) |
| Total | 96 (100.0%) | 0 (0.0%) |
Fertility by Education in Mount Horeb
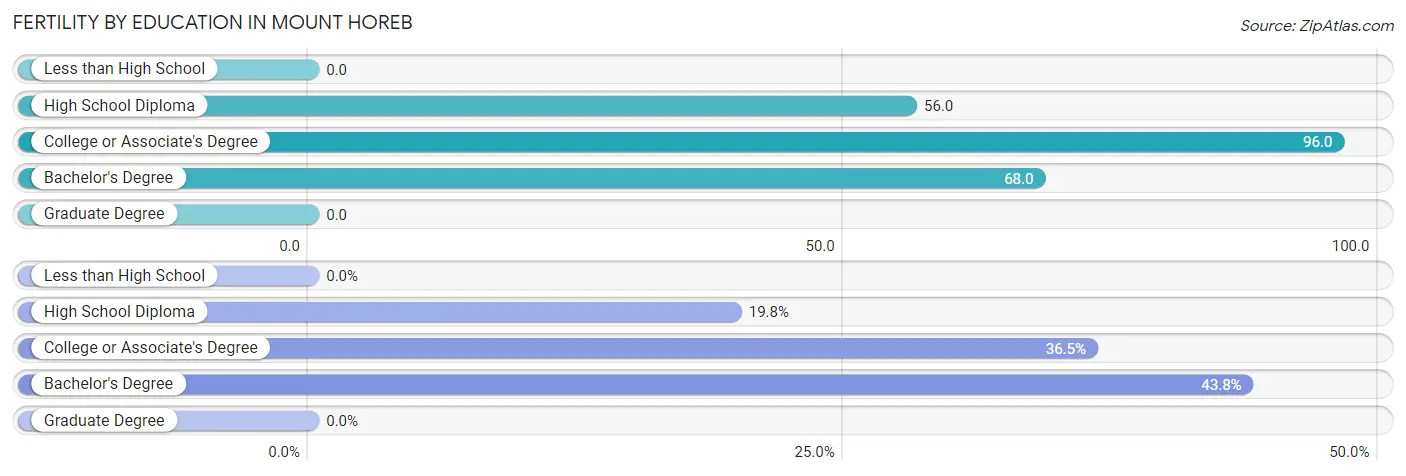
| Educational Attainment | Women with Births | Births / 1,000 Women |
| Less than High School | 0 (0.0%) | 0.0 |
| High School Diploma | 19 (19.8%) | 56.0 |
| College or Associate's Degree | 35 (36.5%) | 96.0 |
| Bachelor's Degree | 42 (43.8%) | 68.0 |
| Graduate Degree | 0 (0.0%) | 0.0 |
| Total | 96 (100.0%) | 56.0 |
Fertility by Education by Marriage Status in Mount Horeb
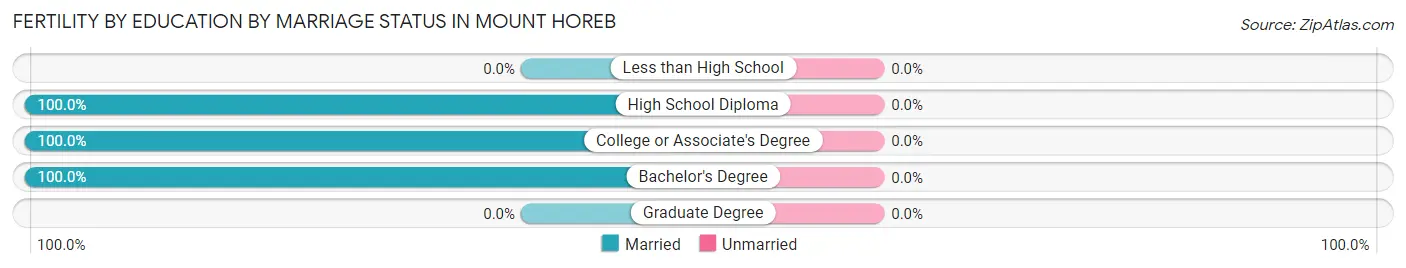
| Educational Attainment | Married | Unmarried |
| Less than High School | 0 (0.0%) | 0 (0.0%) |
| High School Diploma | 19 (100.0%) | 0 (0.0%) |
| College or Associate's Degree | 35 (100.0%) | 0 (0.0%) |
| Bachelor's Degree | 42 (100.0%) | 0 (0.0%) |
| Graduate Degree | 0 (0.0%) | 0 (0.0%) |
| Total | 96 (100.0%) | 0 (0.0%) |
Employment Characteristics in Mount Horeb
Employment by Class of Employer in Mount Horeb
Among the 4,183 employed individuals in Mount Horeb, private company employees (2,777 | 66.4%), local government employees (423 | 10.1%), and state government employees (335 | 8.0%) make up the most common classes of employment.
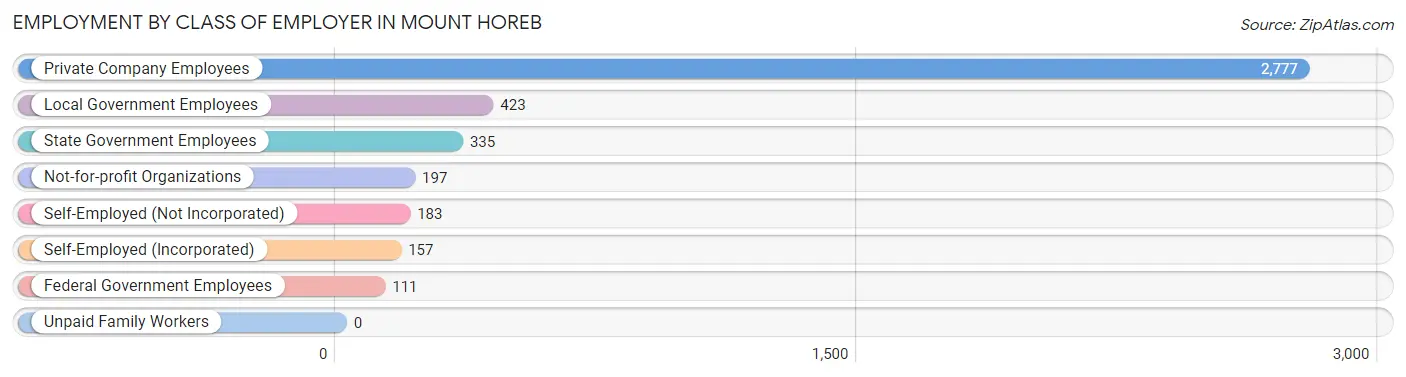
| Employer Class | # Employees | % Employees |
| Private Company Employees | 2,777 | 66.4% |
| Self-Employed (Incorporated) | 157 | 3.7% |
| Self-Employed (Not Incorporated) | 183 | 4.4% |
| Not-for-profit Organizations | 197 | 4.7% |
| Local Government Employees | 423 | 10.1% |
| State Government Employees | 335 | 8.0% |
| Federal Government Employees | 111 | 2.6% |
| Unpaid Family Workers | 0 | 0.0% |
| Total | 4,183 | 100.0% |
Employment Status by Age in Mount Horeb
According to the labor force statistics for Mount Horeb, out of the total population over 16 years of age (5,483), 79.4% or 4,354 individuals are in the labor force, with 2.0% or 87 of them unemployed. The age group with the highest labor force participation rate is 20 to 24 years, with 100.0% or 213 individuals in the labor force. Within the labor force, the 16 to 19 years age range has the highest percentage of unemployed individuals, with 15.8% or 31 of them being unemployed.
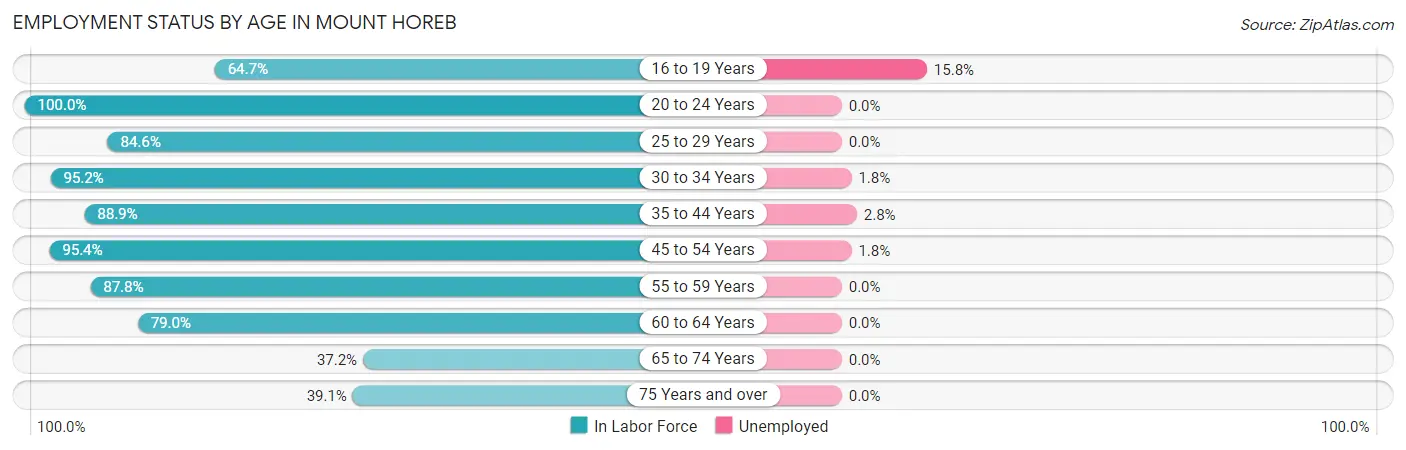
| Age Bracket | In Labor Force | Unemployed |
| 16 to 19 Years | 196 (64.7%) | 31 (15.8%) |
| 20 to 24 Years | 213 (100.0%) | 0 (0.0%) |
| 25 to 29 Years | 401 (84.6%) | 0 (0.0%) |
| 30 to 34 Years | 435 (95.2%) | 8 (1.8%) |
| 35 to 44 Years | 1,197 (88.9%) | 34 (2.8%) |
| 45 to 54 Years | 855 (95.4%) | 15 (1.8%) |
| 55 to 59 Years | 338 (87.8%) | 0 (0.0%) |
| 60 to 64 Years | 358 (79.0%) | 0 (0.0%) |
| 65 to 74 Years | 203 (37.2%) | 0 (0.0%) |
| 75 Years and over | 160 (39.1%) | 0 (0.0%) |
| Total | 4,354 (79.4%) | 87 (2.0%) |
Employment Status by Educational Attainment in Mount Horeb
According to labor force statistics for Mount Horeb, 89.3% of individuals (3,583) out of the total population between 25 and 64 years of age (4,012) are in the labor force, with 1.6% or 57 of them being unemployed. The group with the highest labor force participation rate are those with the educational attainment of less than high school, with 100.0% or 37 individuals in the labor force. Within the labor force, individuals with bachelor's degree or higher education have the highest percentage of unemployment, with 2.0% or 38 of them being unemployed.
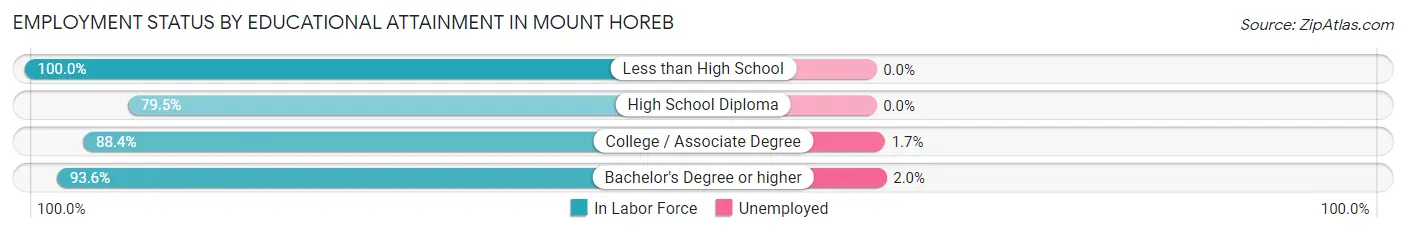
| Educational Attainment | In Labor Force | Unemployed |
| Less than High School | 37 (100.0%) | 0 (0.0%) |
| High School Diploma | 651 (79.5%) | 0 (0.0%) |
| College / Associate Degree | 987 (88.4%) | 19 (1.7%) |
| Bachelor's Degree or higher | 1,909 (93.6%) | 41 (2.0%) |
| Total | 3,583 (89.3%) | 64 (1.6%) |
Employment Occupations by Sex in Mount Horeb
Management, Business, Science and Arts Occupations
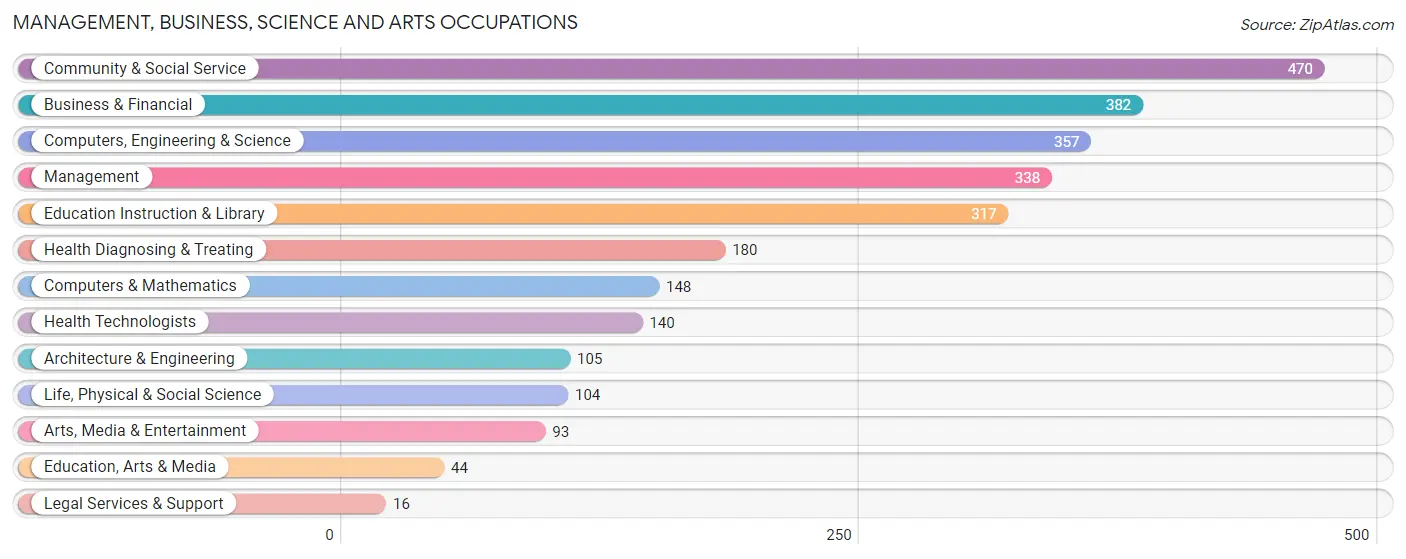
The most common Management, Business, Science and Arts occupations in Mount Horeb are Community & Social Service (470 | 11.1%), Business & Financial (382 | 9.0%), Computers, Engineering & Science (357 | 8.4%), Management (338 | 8.0%), and Education Instruction & Library (317 | 7.5%).
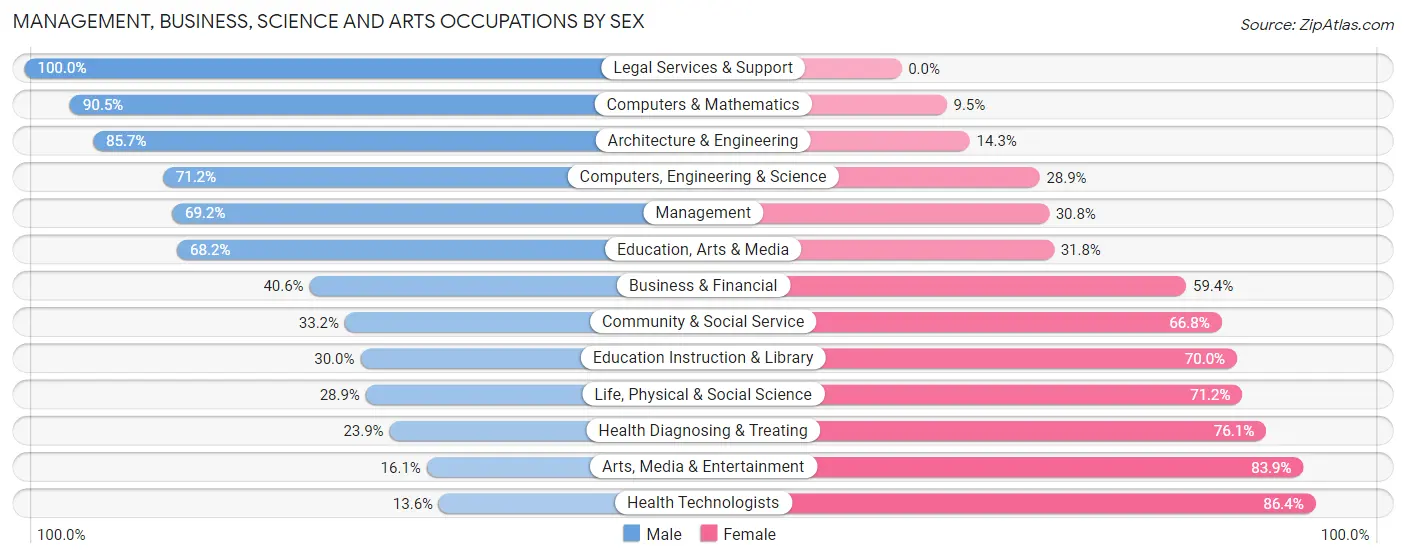
Management, Business, Science and Arts Occupations by Sex
Within the Management, Business, Science and Arts occupations in Mount Horeb, the most male-oriented occupations are Legal Services & Support (100.0%), Computers & Mathematics (90.5%), and Architecture & Engineering (85.7%), while the most female-oriented occupations are Health Technologists (86.4%), Arts, Media & Entertainment (83.9%), and Health Diagnosing & Treating (76.1%).
| Occupation | Male | Female |
| Management | 234 (69.2%) | 104 (30.8%) |
| Business & Financial | 155 (40.6%) | 227 (59.4%) |
| Computers, Engineering & Science | 254 (71.2%) | 103 (28.8%) |
| Computers & Mathematics | 134 (90.5%) | 14 (9.5%) |
| Architecture & Engineering | 90 (85.7%) | 15 (14.3%) |
| Life, Physical & Social Science | 30 (28.8%) | 74 (71.2%) |
| Community & Social Service | 156 (33.2%) | 314 (66.8%) |
| Education, Arts & Media | 30 (68.2%) | 14 (31.8%) |
| Legal Services & Support | 16 (100.0%) | 0 (0.0%) |
| Education Instruction & Library | 95 (30.0%) | 222 (70.0%) |
| Arts, Media & Entertainment | 15 (16.1%) | 78 (83.9%) |
| Health Diagnosing & Treating | 43 (23.9%) | 137 (76.1%) |
| Health Technologists | 19 (13.6%) | 121 (86.4%) |
| Total (Category) | 842 (48.8%) | 885 (51.2%) |
| Total (Overall) | 2,229 (52.4%) | 2,021 (47.5%) |
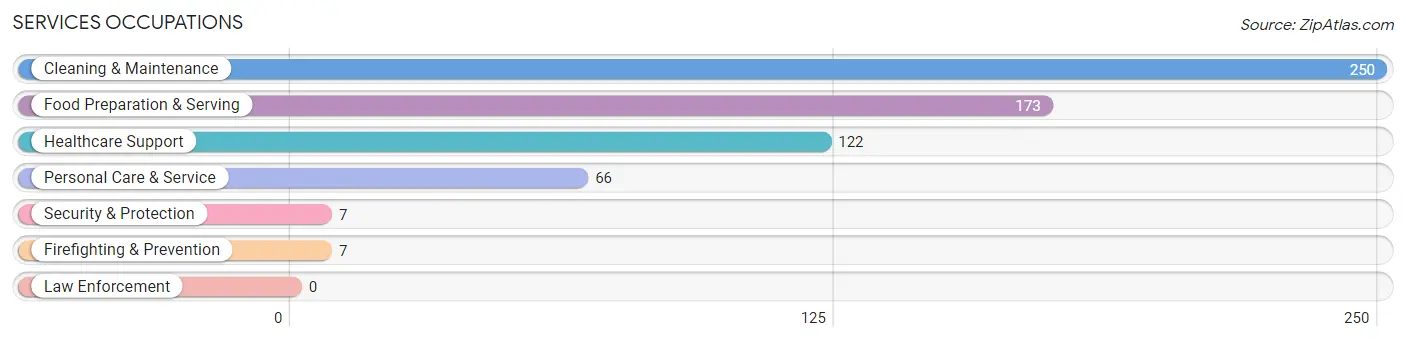
Services Occupations
The most common Services occupations in Mount Horeb are Cleaning & Maintenance (250 | 5.9%), Food Preparation & Serving (173 | 4.1%), Healthcare Support (122 | 2.9%), Personal Care & Service (66 | 1.5%), and Security & Protection (7 | 0.2%).
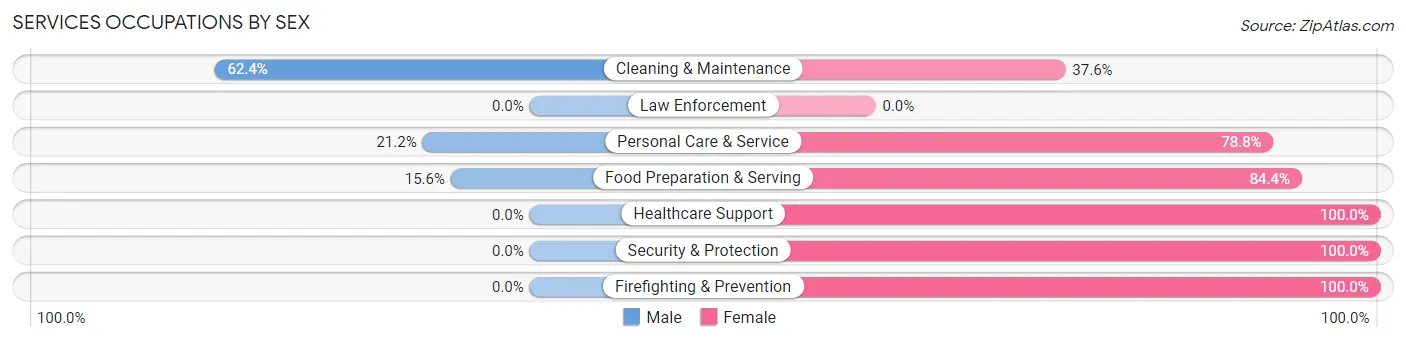
Services Occupations by Sex
Within the Services occupations in Mount Horeb, the most male-oriented occupations are Cleaning & Maintenance (62.4%), Personal Care & Service (21.2%), and Food Preparation & Serving (15.6%), while the most female-oriented occupations are Healthcare Support (100.0%), Security & Protection (100.0%), and Firefighting & Prevention (100.0%).
| Occupation | Male | Female |
| Healthcare Support | 0 (0.0%) | 122 (100.0%) |
| Security & Protection | 0 (0.0%) | 7 (100.0%) |
| Firefighting & Prevention | 0 (0.0%) | 7 (100.0%) |
| Law Enforcement | 0 (0.0%) | 0 (0.0%) |
| Food Preparation & Serving | 27 (15.6%) | 146 (84.4%) |
| Cleaning & Maintenance | 156 (62.4%) | 94 (37.6%) |
| Personal Care & Service | 14 (21.2%) | 52 (78.8%) |
| Total (Category) | 197 (31.9%) | 421 (68.1%) |
| Total (Overall) | 2,229 (52.4%) | 2,021 (47.5%) |
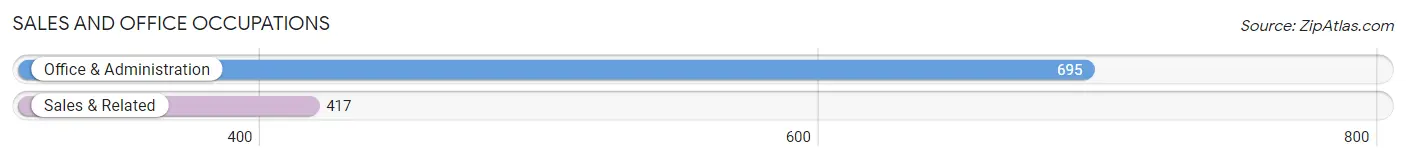
Sales and Office Occupations
The most common Sales and Office occupations in Mount Horeb are Office & Administration (695 | 16.4%), and Sales & Related (417 | 9.8%).
Sales and Office Occupations by Sex
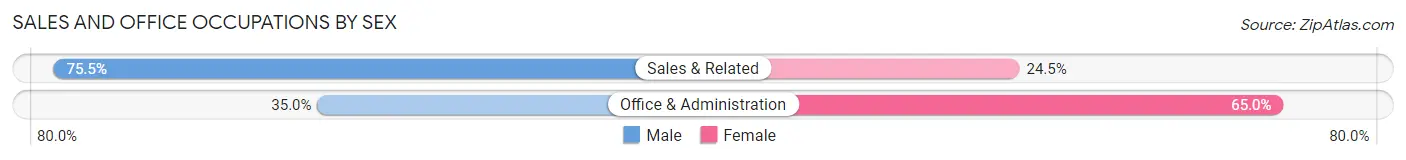
| Occupation | Male | Female |
| Sales & Related | 315 (75.5%) | 102 (24.5%) |
| Office & Administration | 243 (35.0%) | 452 (65.0%) |
| Total (Category) | 558 (50.2%) | 554 (49.8%) |
| Total (Overall) | 2,229 (52.4%) | 2,021 (47.5%) |
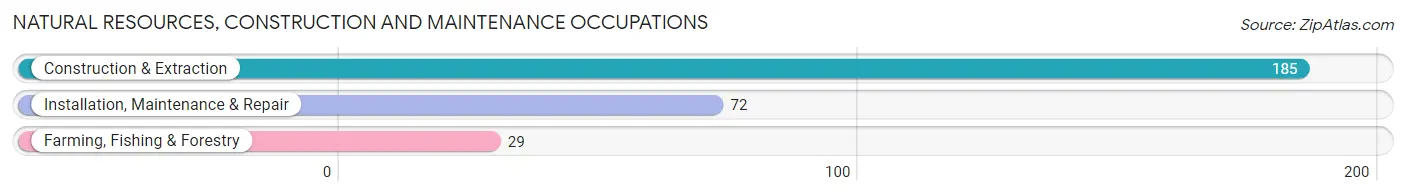
Natural Resources, Construction and Maintenance Occupations
The most common Natural Resources, Construction and Maintenance occupations in Mount Horeb are Construction & Extraction (185 | 4.3%), Installation, Maintenance & Repair (72 | 1.7%), and Farming, Fishing & Forestry (29 | 0.7%).
Natural Resources, Construction and Maintenance Occupations by Sex
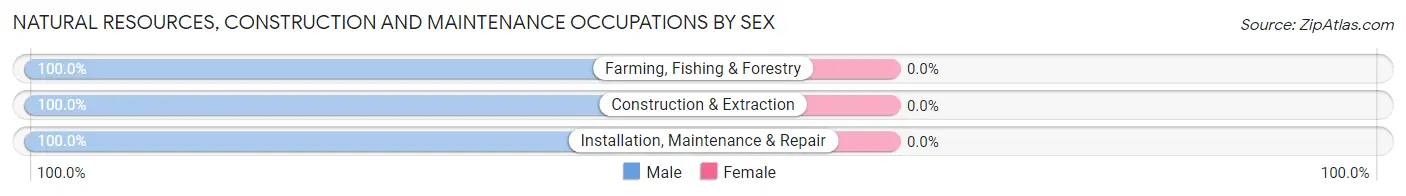
| Occupation | Male | Female |
| Farming, Fishing & Forestry | 29 (100.0%) | 0 (0.0%) |
| Construction & Extraction | 185 (100.0%) | 0 (0.0%) |
| Installation, Maintenance & Repair | 72 (100.0%) | 0 (0.0%) |
| Total (Category) | 286 (100.0%) | 0 (0.0%) |
| Total (Overall) | 2,229 (52.4%) | 2,021 (47.5%) |
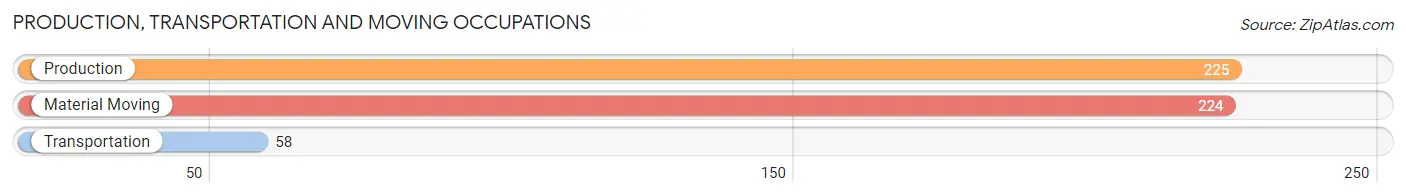
Production, Transportation and Moving Occupations
The most common Production, Transportation and Moving occupations in Mount Horeb are Production (225 | 5.3%), Material Moving (224 | 5.3%), and Transportation (58 | 1.4%).
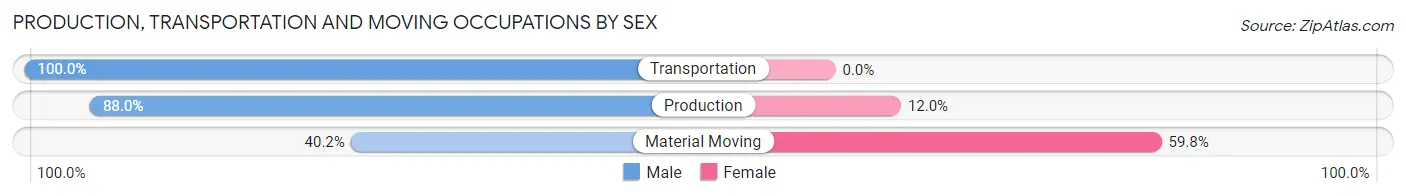
Production, Transportation and Moving Occupations by Sex
| Occupation | Male | Female |
| Production | 198 (88.0%) | 27 (12.0%) |
| Transportation | 58 (100.0%) | 0 (0.0%) |
| Material Moving | 90 (40.2%) | 134 (59.8%) |
| Total (Category) | 346 (68.2%) | 161 (31.8%) |
| Total (Overall) | 2,229 (52.4%) | 2,021 (47.5%) |
Employment Industries by Sex in Mount Horeb
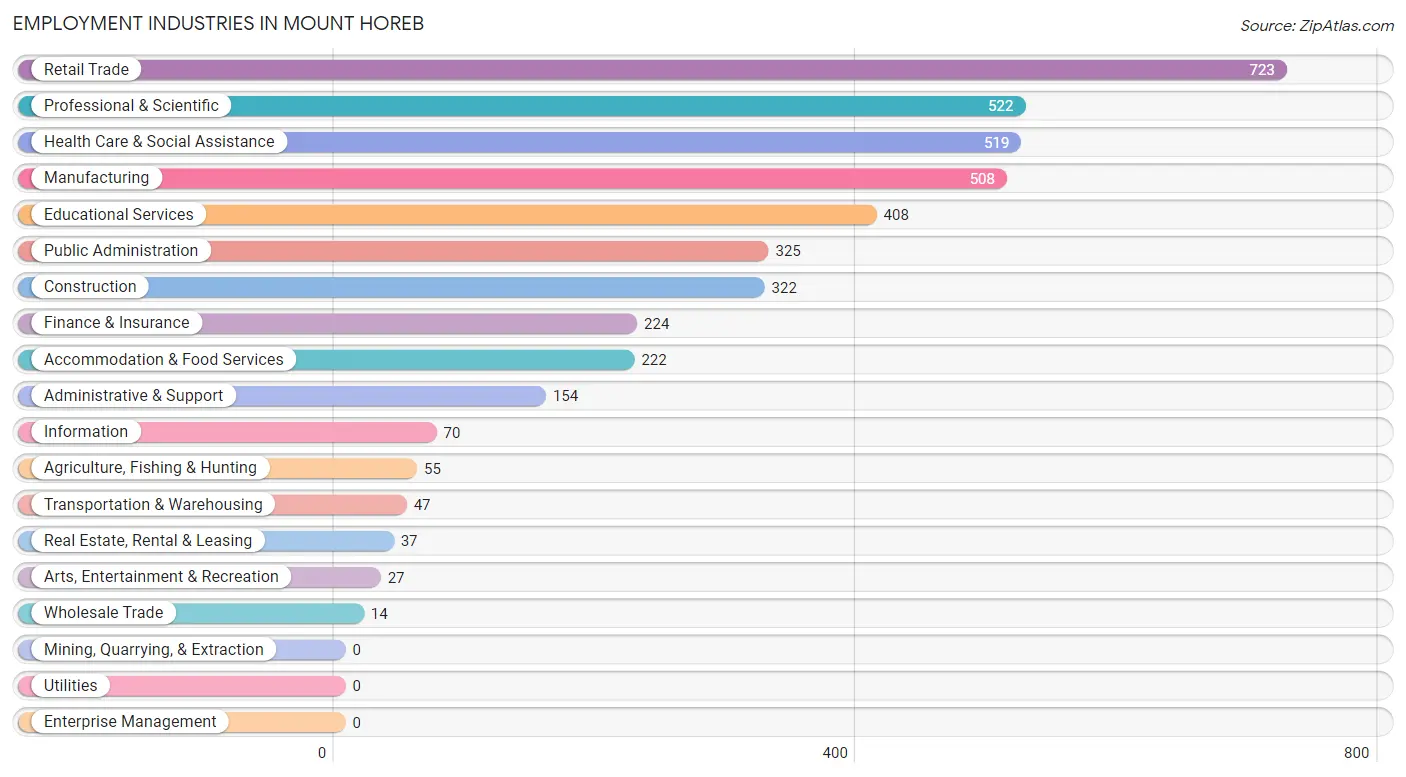
Employment Industries in Mount Horeb
The major employment industries in Mount Horeb include Retail Trade (723 | 17.0%), Professional & Scientific (522 | 12.3%), Health Care & Social Assistance (519 | 12.2%), Manufacturing (508 | 11.9%), and Educational Services (408 | 9.6%).
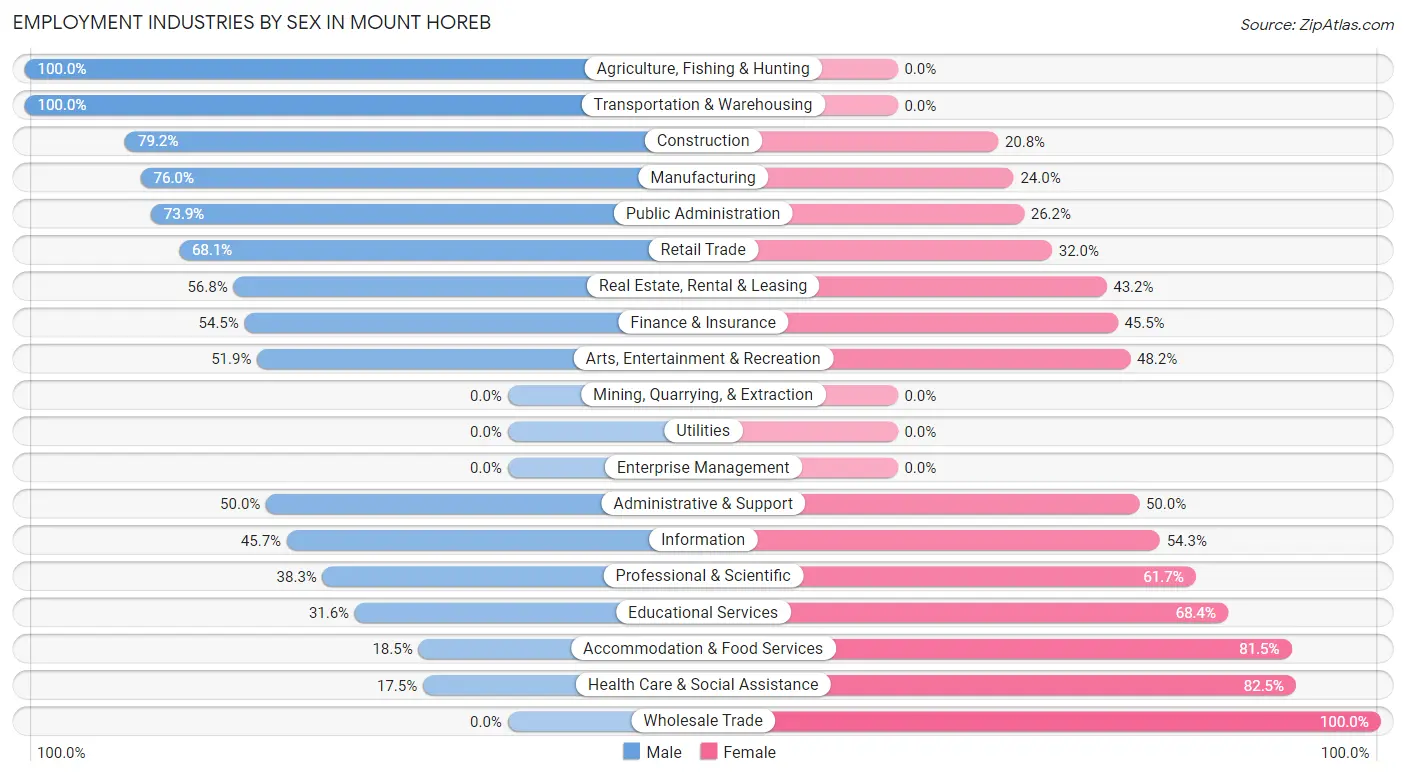
Employment Industries by Sex in Mount Horeb
The Mount Horeb industries that see more men than women are Agriculture, Fishing & Hunting (100.0%), Transportation & Warehousing (100.0%), and Construction (79.2%), whereas the industries that tend to have a higher number of women are Wholesale Trade (100.0%), Health Care & Social Assistance (82.5%), and Accommodation & Food Services (81.5%).
| Industry | Male | Female |
| Agriculture, Fishing & Hunting | 55 (100.0%) | 0 (0.0%) |
| Mining, Quarrying, & Extraction | 0 (0.0%) | 0 (0.0%) |
| Construction | 255 (79.2%) | 67 (20.8%) |
| Manufacturing | 386 (76.0%) | 122 (24.0%) |
| Wholesale Trade | 0 (0.0%) | 14 (100.0%) |
| Retail Trade | 492 (68.0%) | 231 (32.0%) |
| Transportation & Warehousing | 47 (100.0%) | 0 (0.0%) |
| Utilities | 0 (0.0%) | 0 (0.0%) |
| Information | 32 (45.7%) | 38 (54.3%) |
| Finance & Insurance | 122 (54.5%) | 102 (45.5%) |
| Real Estate, Rental & Leasing | 21 (56.8%) | 16 (43.2%) |
| Professional & Scientific | 200 (38.3%) | 322 (61.7%) |
| Enterprise Management | 0 (0.0%) | 0 (0.0%) |
| Administrative & Support | 77 (50.0%) | 77 (50.0%) |
| Educational Services | 129 (31.6%) | 279 (68.4%) |
| Health Care & Social Assistance | 91 (17.5%) | 428 (82.5%) |
| Arts, Entertainment & Recreation | 14 (51.8%) | 13 (48.1%) |
| Accommodation & Food Services | 41 (18.5%) | 181 (81.5%) |
| Public Administration | 240 (73.9%) | 85 (26.2%) |
| Total | 2,229 (52.4%) | 2,021 (47.5%) |
Education in Mount Horeb
School Enrollment in Mount Horeb
The most common levels of schooling among the 2,206 students in Mount Horeb are middle school (865 | 39.2%), elementary school (529 | 24.0%), and high school (343 | 15.5%).
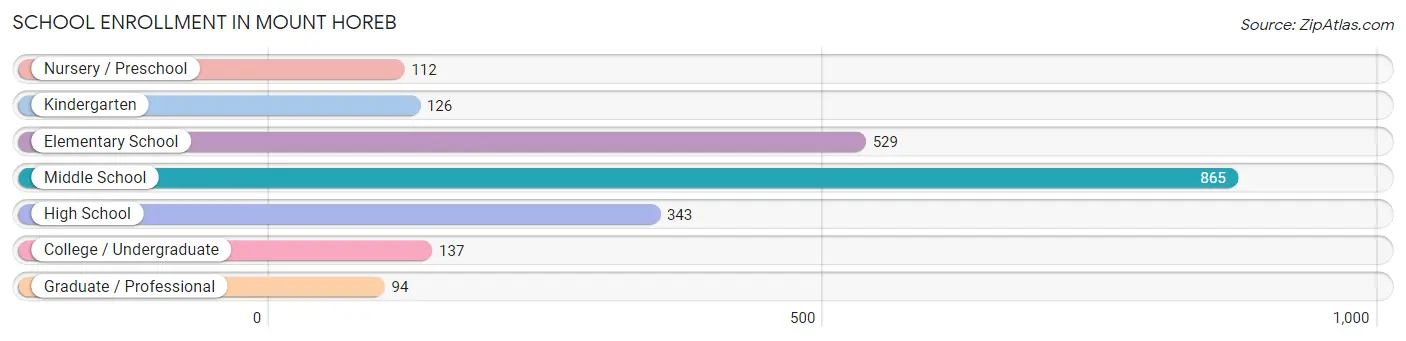
| School Level | # Students | % Students |
| Nursery / Preschool | 112 | 5.1% |
| Kindergarten | 126 | 5.7% |
| Elementary School | 529 | 24.0% |
| Middle School | 865 | 39.2% |
| High School | 343 | 15.5% |
| College / Undergraduate | 137 | 6.2% |
| Graduate / Professional | 94 | 4.3% |
| Total | 2,206 | 100.0% |
School Enrollment by Age by Funding Source in Mount Horeb
Out of a total of 2,206 students who are enrolled in schools in Mount Horeb, 113 (5.1%) attend a private institution, while the remaining 2,093 (94.9%) are enrolled in public schools. The age group of 25 to 34 year olds has the highest likelihood of being enrolled in private schools, with 23 (23.5% in the age bracket) enrolled. Conversely, the age group of 18 to 19 year olds has the lowest likelihood of being enrolled in a private school, with 14 (100.0% in the age bracket) attending a public institution.
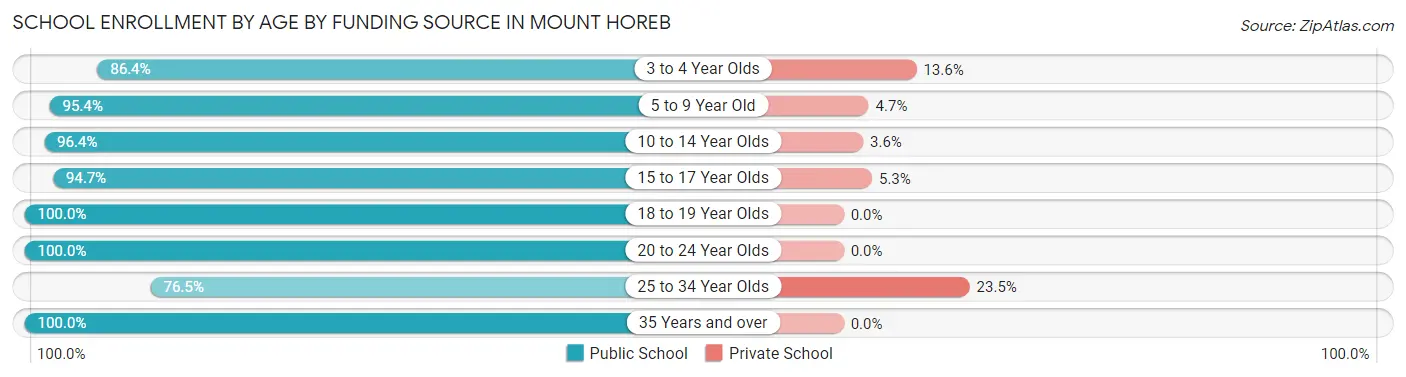
| Age Bracket | Public School | Private School |
| 3 to 4 Year Olds | 51 (86.4%) | 8 (13.6%) |
| 5 to 9 Year Old | 615 (95.4%) | 30 (4.6%) |
| 10 to 14 Year Olds | 933 (96.4%) | 35 (3.6%) |
| 15 to 17 Year Olds | 287 (94.7%) | 16 (5.3%) |
| 18 to 19 Year Olds | 14 (100.0%) | 0 (0.0%) |
| 20 to 24 Year Olds | 18 (100.0%) | 0 (0.0%) |
| 25 to 34 Year Olds | 75 (76.5%) | 23 (23.5%) |
| 35 Years and over | 101 (100.0%) | 0 (0.0%) |
| Total | 2,093 (94.9%) | 113 (5.1%) |
Educational Attainment by Field of Study in Mount Horeb
Business (676 | 27.6%), education (311 | 12.7%), bio, nature & agricultural (274 | 11.2%), social sciences (238 | 9.7%), and science & technology (205 | 8.4%) are the most common fields of study among 2,446 individuals in Mount Horeb who have obtained a bachelor's degree or higher.
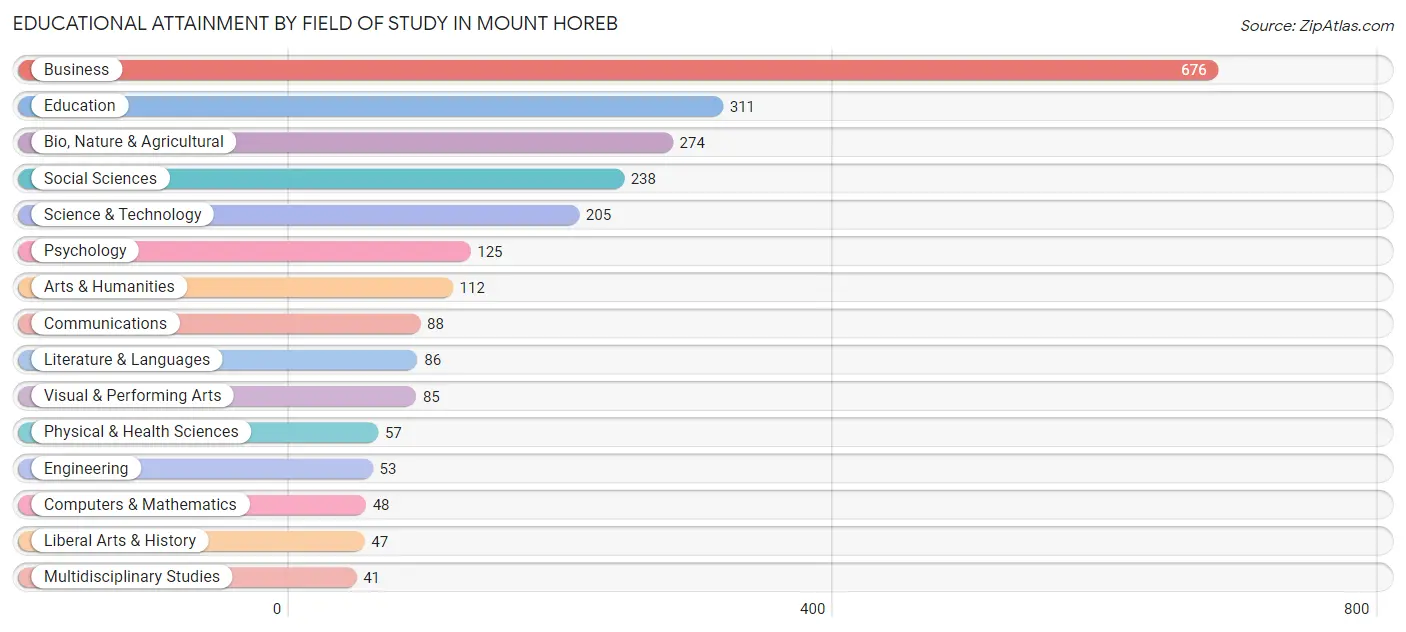
| Field of Study | # Graduates | % Graduates |
| Computers & Mathematics | 48 | 2.0% |
| Bio, Nature & Agricultural | 274 | 11.2% |
| Physical & Health Sciences | 57 | 2.3% |
| Psychology | 125 | 5.1% |
| Social Sciences | 238 | 9.7% |
| Engineering | 53 | 2.2% |
| Multidisciplinary Studies | 41 | 1.7% |
| Science & Technology | 205 | 8.4% |
| Business | 676 | 27.6% |
| Education | 311 | 12.7% |
| Literature & Languages | 86 | 3.5% |
| Liberal Arts & History | 47 | 1.9% |
| Visual & Performing Arts | 85 | 3.5% |
| Communications | 88 | 3.6% |
| Arts & Humanities | 112 | 4.6% |
| Total | 2,446 | 100.0% |
Transportation & Commute in Mount Horeb
Vehicle Availability by Sex in Mount Horeb
The most prevalent vehicle ownership categories in Mount Horeb are males with 2 vehicles (1,130, accounting for 51.4%) and females with 2 vehicles (914, making up 56.9%).
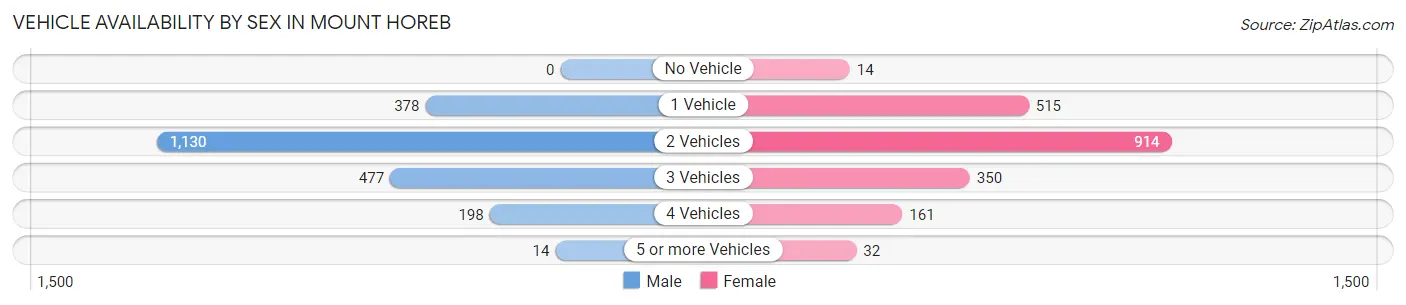
| Vehicles Available | Male | Female |
| No Vehicle | 0 (0.0%) | 14 (0.7%) |
| 1 Vehicle | 378 (17.2%) | 515 (25.9%) |
| 2 Vehicles | 1,130 (51.4%) | 914 (46.0%) |
| 3 Vehicles | 477 (21.7%) | 350 (17.6%) |
| 4 Vehicles | 198 (9.0%) | 161 (8.1%) |
| 5 or more Vehicles | 14 (0.6%) | 32 (1.6%) |
| Total | 2,197 (100.0%) | 1,986 (100.0%) |
Commute Time in Mount Horeb
The most frequently occuring commute durations in Mount Horeb are 5 to 9 minutes (599 commuters, 16.2%), 30 to 34 minutes (555 commuters, 15.0%), and 20 to 24 minutes (550 commuters, 14.8%).
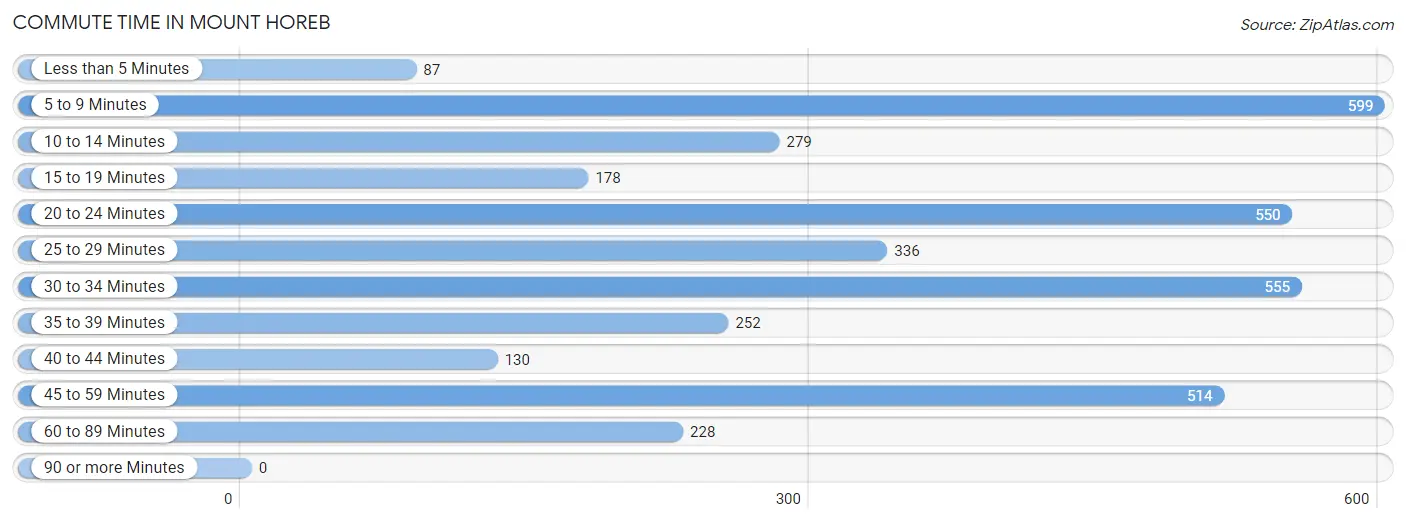
| Commute Time | # Commuters | % Commuters |
| Less than 5 Minutes | 87 | 2.4% |
| 5 to 9 Minutes | 599 | 16.2% |
| 10 to 14 Minutes | 279 | 7.5% |
| 15 to 19 Minutes | 178 | 4.8% |
| 20 to 24 Minutes | 550 | 14.8% |
| 25 to 29 Minutes | 336 | 9.1% |
| 30 to 34 Minutes | 555 | 15.0% |
| 35 to 39 Minutes | 252 | 6.8% |
| 40 to 44 Minutes | 130 | 3.5% |
| 45 to 59 Minutes | 514 | 13.9% |
| 60 to 89 Minutes | 228 | 6.1% |
| 90 or more Minutes | 0 | 0.0% |
Commute Time by Sex in Mount Horeb
The most common commute times in Mount Horeb are 20 to 24 minutes (381 commuters, 19.1%) for males and 5 to 9 minutes (451 commuters, 26.4%) for females.
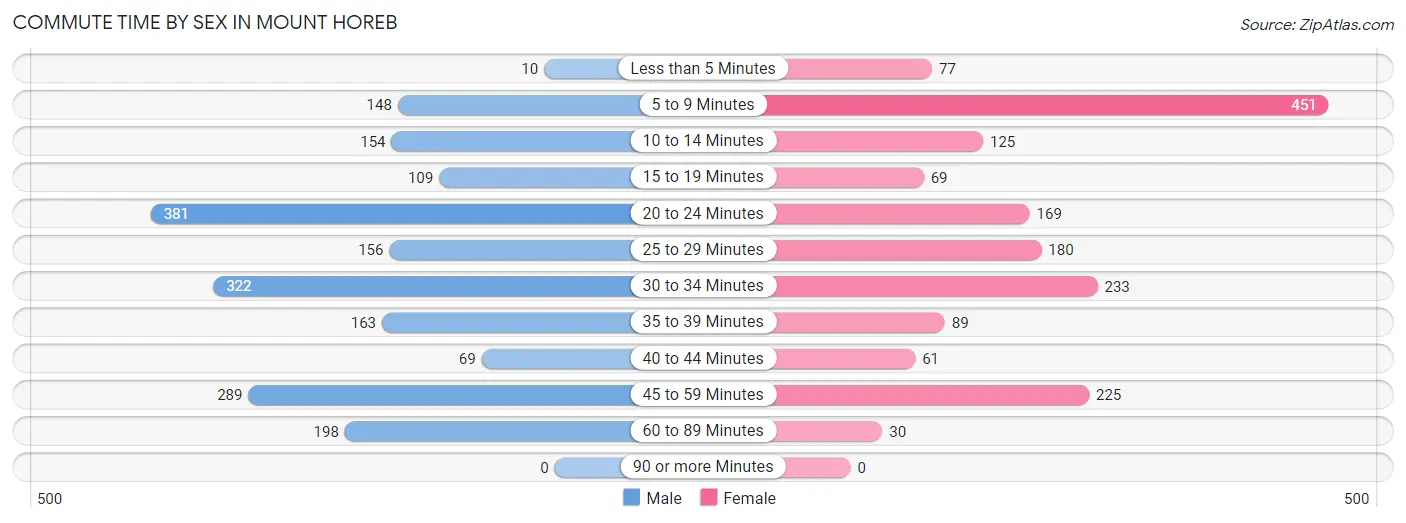
| Commute Time | Male | Female |
| Less than 5 Minutes | 10 (0.5%) | 77 (4.5%) |
| 5 to 9 Minutes | 148 (7.4%) | 451 (26.4%) |
| 10 to 14 Minutes | 154 (7.7%) | 125 (7.3%) |
| 15 to 19 Minutes | 109 (5.4%) | 69 (4.0%) |
| 20 to 24 Minutes | 381 (19.1%) | 169 (9.9%) |
| 25 to 29 Minutes | 156 (7.8%) | 180 (10.5%) |
| 30 to 34 Minutes | 322 (16.1%) | 233 (13.6%) |
| 35 to 39 Minutes | 163 (8.2%) | 89 (5.2%) |
| 40 to 44 Minutes | 69 (3.5%) | 61 (3.6%) |
| 45 to 59 Minutes | 289 (14.5%) | 225 (13.2%) |
| 60 to 89 Minutes | 198 (9.9%) | 30 (1.8%) |
| 90 or more Minutes | 0 (0.0%) | 0 (0.0%) |
Time of Departure to Work by Sex in Mount Horeb
The most frequent times of departure to work in Mount Horeb are 7:30 AM to 7:59 AM (526, 26.3%) for males and 7:30 AM to 7:59 AM (359, 21.0%) for females.
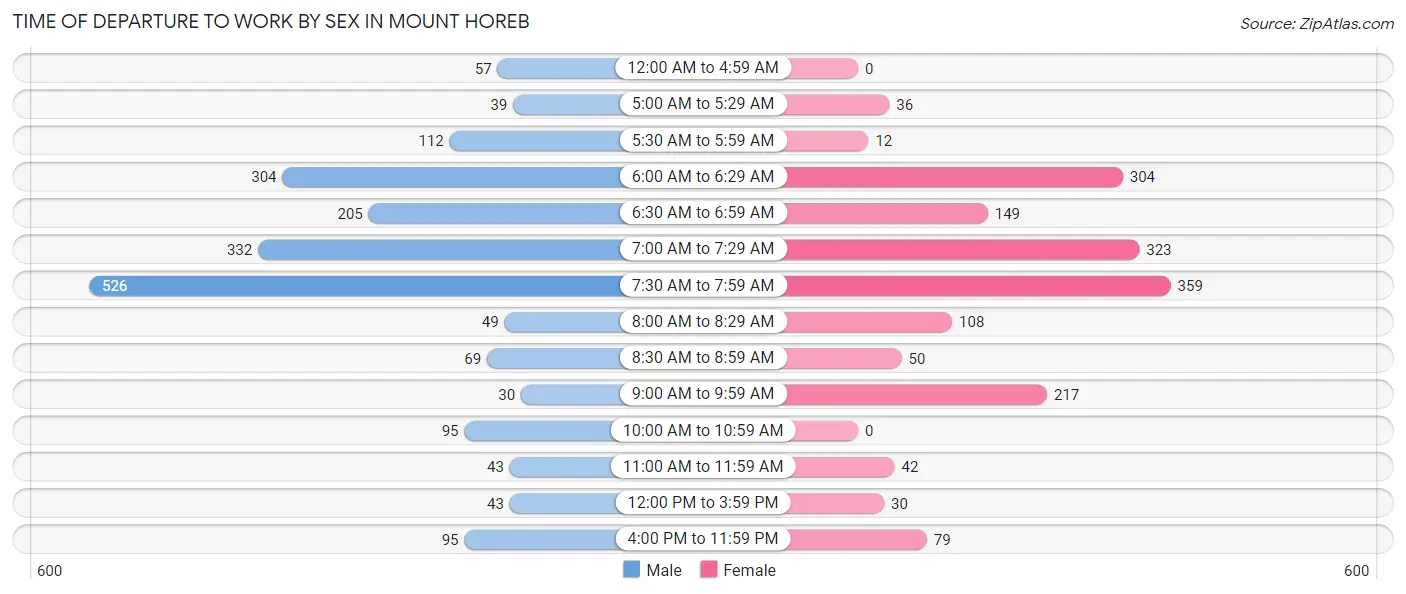
| Time of Departure | Male | Female |
| 12:00 AM to 4:59 AM | 57 (2.9%) | 0 (0.0%) |
| 5:00 AM to 5:29 AM | 39 (1.9%) | 36 (2.1%) |
| 5:30 AM to 5:59 AM | 112 (5.6%) | 12 (0.7%) |
| 6:00 AM to 6:29 AM | 304 (15.2%) | 304 (17.8%) |
| 6:30 AM to 6:59 AM | 205 (10.3%) | 149 (8.7%) |
| 7:00 AM to 7:29 AM | 332 (16.6%) | 323 (18.9%) |
| 7:30 AM to 7:59 AM | 526 (26.3%) | 359 (21.0%) |
| 8:00 AM to 8:29 AM | 49 (2.5%) | 108 (6.3%) |
| 8:30 AM to 8:59 AM | 69 (3.5%) | 50 (2.9%) |
| 9:00 AM to 9:59 AM | 30 (1.5%) | 217 (12.7%) |
| 10:00 AM to 10:59 AM | 95 (4.8%) | 0 (0.0%) |
| 11:00 AM to 11:59 AM | 43 (2.1%) | 42 (2.5%) |
| 12:00 PM to 3:59 PM | 43 (2.1%) | 30 (1.8%) |
| 4:00 PM to 11:59 PM | 95 (4.8%) | 79 (4.6%) |
| Total | 1,999 (100.0%) | 1,709 (100.0%) |
Housing Occupancy in Mount Horeb
Occupancy by Ownership in Mount Horeb
Of the total 2,714 dwellings in Mount Horeb, owner-occupied units account for 1,890 (69.6%), while renter-occupied units make up 824 (30.4%).
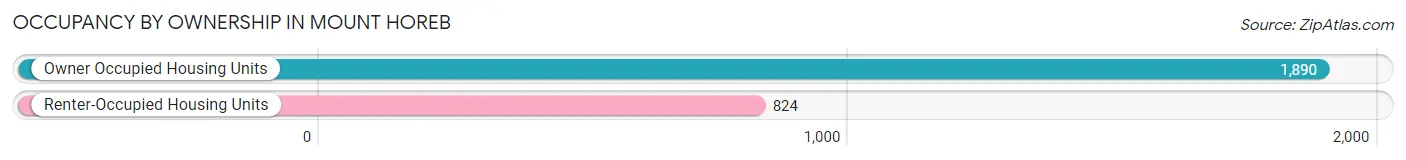
| Occupancy | # Housing Units | % Housing Units |
| Owner Occupied Housing Units | 1,890 | 69.6% |
| Renter-Occupied Housing Units | 824 | 30.4% |
| Total Occupied Housing Units | 2,714 | 100.0% |
Occupancy by Household Size in Mount Horeb
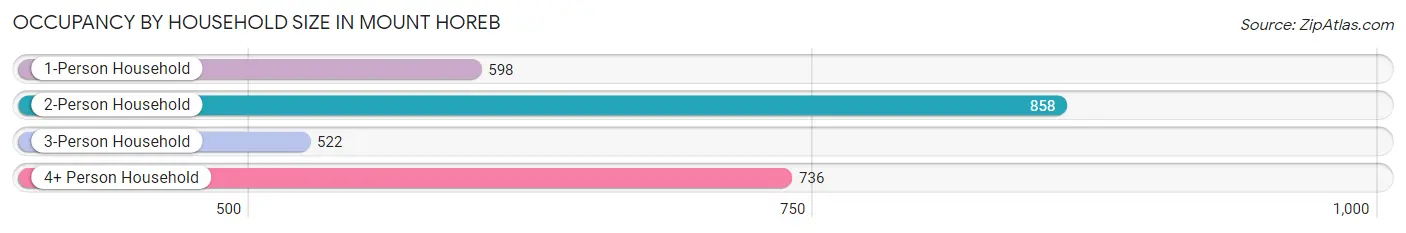
| Household Size | # Housing Units | % Housing Units |
| 1-Person Household | 598 | 22.0% |
| 2-Person Household | 858 | 31.6% |
| 3-Person Household | 522 | 19.2% |
| 4+ Person Household | 736 | 27.1% |
| Total Housing Units | 2,714 | 100.0% |
Occupancy by Ownership by Household Size in Mount Horeb
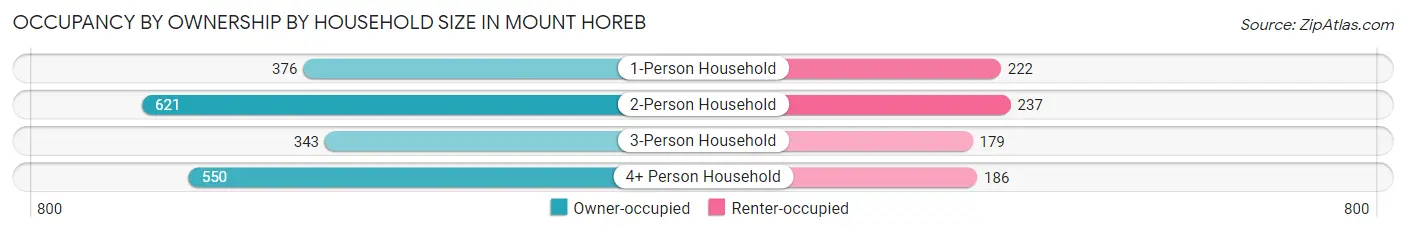
| Household Size | Owner-occupied | Renter-occupied |
| 1-Person Household | 376 (62.9%) | 222 (37.1%) |
| 2-Person Household | 621 (72.4%) | 237 (27.6%) |
| 3-Person Household | 343 (65.7%) | 179 (34.3%) |
| 4+ Person Household | 550 (74.7%) | 186 (25.3%) |
| Total Housing Units | 1,890 (69.6%) | 824 (30.4%) |
Occupancy by Educational Attainment in Mount Horeb
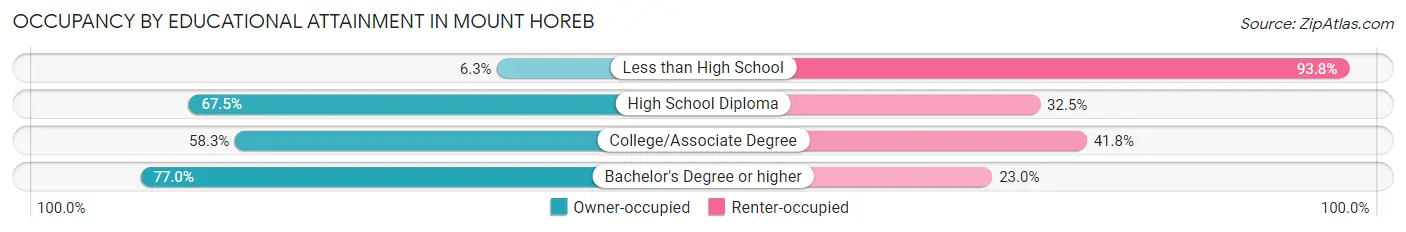
| Household Size | Owner-occupied | Renter-occupied |
| Less than High School | 1 (6.2%) | 15 (93.8%) |
| High School Diploma | 546 (67.5%) | 263 (32.5%) |
| College/Associate Degree | 346 (58.3%) | 248 (41.7%) |
| Bachelor's Degree or higher | 997 (77.0%) | 298 (23.0%) |
Occupancy by Age of Householder in Mount Horeb
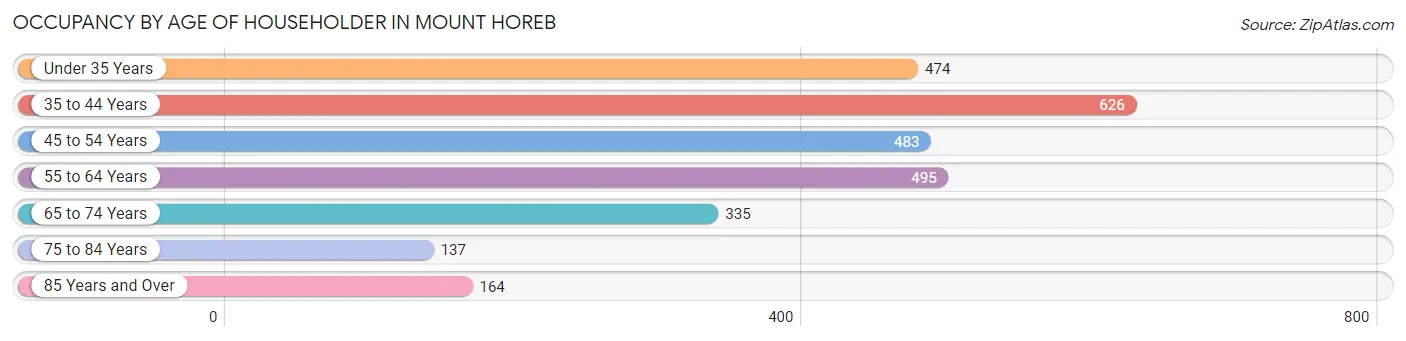
| Age Bracket | # Households | % Households |
| Under 35 Years | 474 | 17.5% |
| 35 to 44 Years | 626 | 23.1% |
| 45 to 54 Years | 483 | 17.8% |
| 55 to 64 Years | 495 | 18.2% |
| 65 to 74 Years | 335 | 12.3% |
| 75 to 84 Years | 137 | 5.1% |
| 85 Years and Over | 164 | 6.0% |
| Total | 2,714 | 100.0% |
Housing Finances in Mount Horeb
Median Income by Occupancy in Mount Horeb
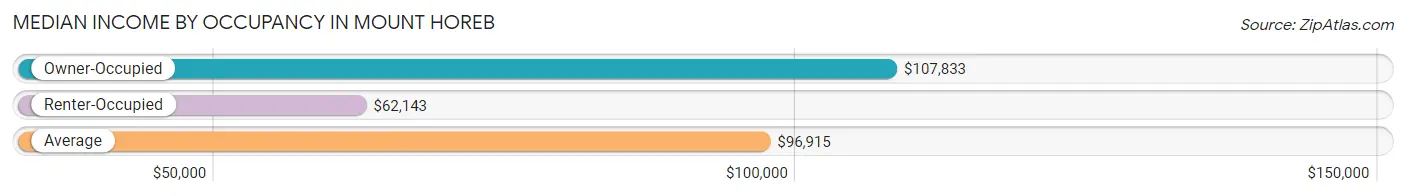
| Occupancy Type | # Households | Median Income |
| Owner-Occupied | 1,890 (69.6%) | $107,833 |
| Renter-Occupied | 824 (30.4%) | $62,143 |
| Average | 2,714 (100.0%) | $96,915 |
Occupancy by Householder Income Bracket in Mount Horeb
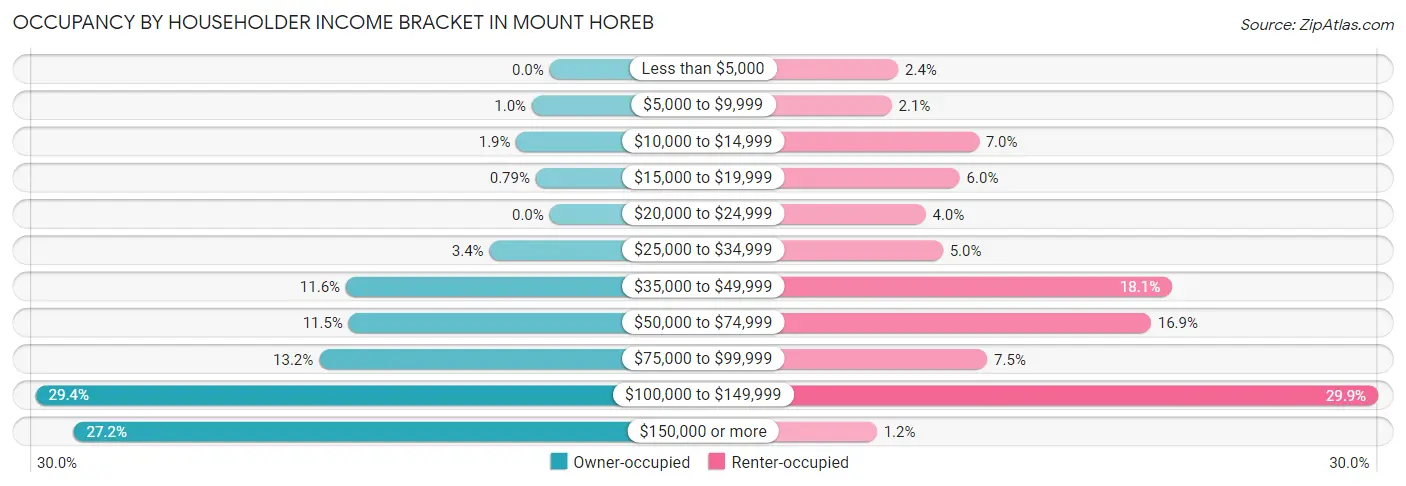
| Income Bracket | Owner-occupied | Renter-occupied |
| Less than $5,000 | 0 (0.0%) | 20 (2.4%) |
| $5,000 to $9,999 | 19 (1.0%) | 17 (2.1%) |
| $10,000 to $14,999 | 36 (1.9%) | 58 (7.0%) |
| $15,000 to $19,999 | 15 (0.8%) | 49 (5.9%) |
| $20,000 to $24,999 | 0 (0.0%) | 33 (4.0%) |
| $25,000 to $34,999 | 65 (3.4%) | 41 (5.0%) |
| $35,000 to $49,999 | 220 (11.6%) | 149 (18.1%) |
| $50,000 to $74,999 | 217 (11.5%) | 139 (16.9%) |
| $75,000 to $99,999 | 249 (13.2%) | 62 (7.5%) |
| $100,000 to $149,999 | 555 (29.4%) | 246 (29.8%) |
| $150,000 or more | 514 (27.2%) | 10 (1.2%) |
| Total | 1,890 (100.0%) | 824 (100.0%) |
Monthly Housing Cost Tiers in Mount Horeb
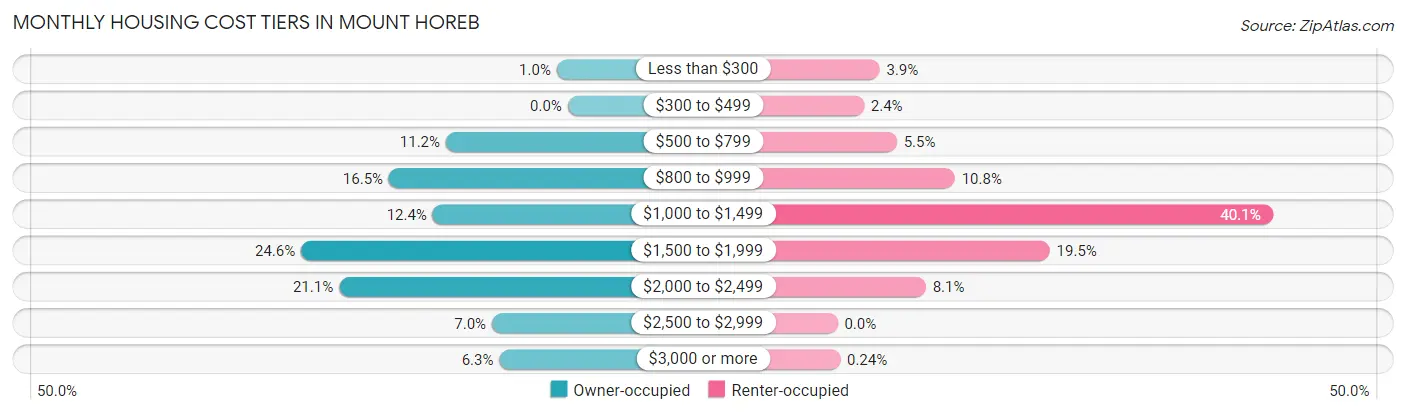
| Monthly Cost | Owner-occupied | Renter-occupied |
| Less than $300 | 19 (1.0%) | 32 (3.9%) |
| $300 to $499 | 0 (0.0%) | 20 (2.4%) |
| $500 to $799 | 212 (11.2%) | 45 (5.5%) |
| $800 to $999 | 311 (16.5%) | 89 (10.8%) |
| $1,000 to $1,499 | 235 (12.4%) | 330 (40.1%) |
| $1,500 to $1,999 | 464 (24.5%) | 161 (19.5%) |
| $2,000 to $2,499 | 398 (21.1%) | 67 (8.1%) |
| $2,500 to $2,999 | 132 (7.0%) | 0 (0.0%) |
| $3,000 or more | 119 (6.3%) | 2 (0.2%) |
| Total | 1,890 (100.0%) | 824 (100.0%) |
Physical Housing Characteristics in Mount Horeb
Housing Structures in Mount Horeb
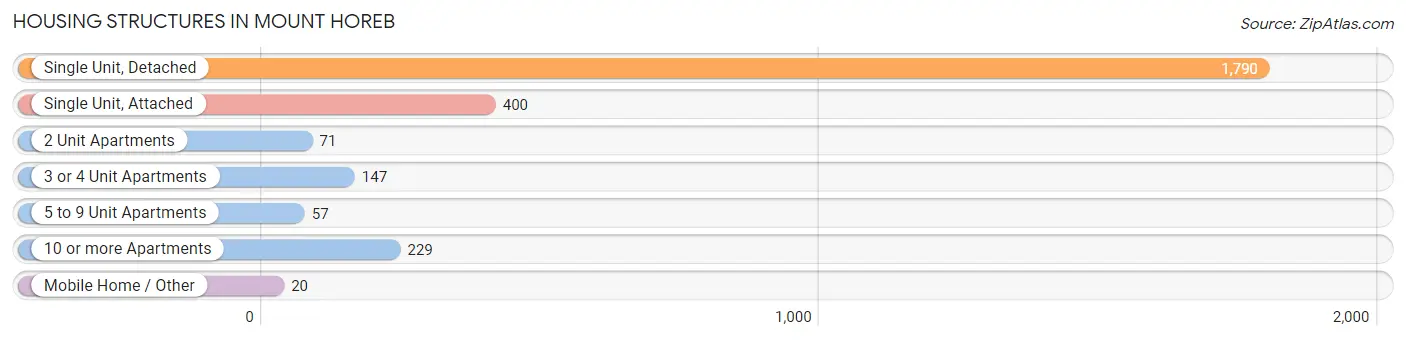
| Structure Type | # Housing Units | % Housing Units |
| Single Unit, Detached | 1,790 | 65.9% |
| Single Unit, Attached | 400 | 14.7% |
| 2 Unit Apartments | 71 | 2.6% |
| 3 or 4 Unit Apartments | 147 | 5.4% |
| 5 to 9 Unit Apartments | 57 | 2.1% |
| 10 or more Apartments | 229 | 8.4% |
| Mobile Home / Other | 20 | 0.7% |
| Total | 2,714 | 100.0% |
Housing Structures by Occupancy in Mount Horeb
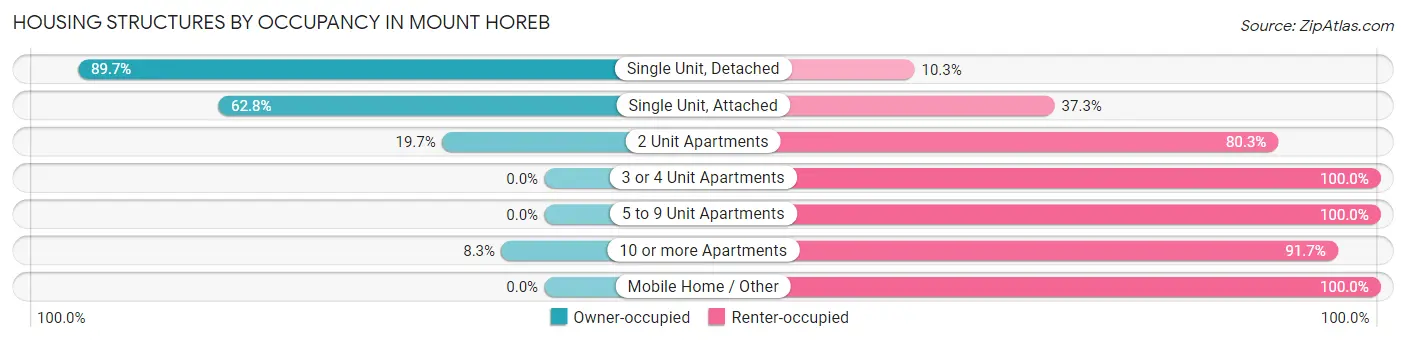
| Structure Type | Owner-occupied | Renter-occupied |
| Single Unit, Detached | 1,606 (89.7%) | 184 (10.3%) |
| Single Unit, Attached | 251 (62.7%) | 149 (37.2%) |
| 2 Unit Apartments | 14 (19.7%) | 57 (80.3%) |
| 3 or 4 Unit Apartments | 0 (0.0%) | 147 (100.0%) |
| 5 to 9 Unit Apartments | 0 (0.0%) | 57 (100.0%) |
| 10 or more Apartments | 19 (8.3%) | 210 (91.7%) |
| Mobile Home / Other | 0 (0.0%) | 20 (100.0%) |
| Total | 1,890 (69.6%) | 824 (30.4%) |
Housing Structures by Number of Rooms in Mount Horeb
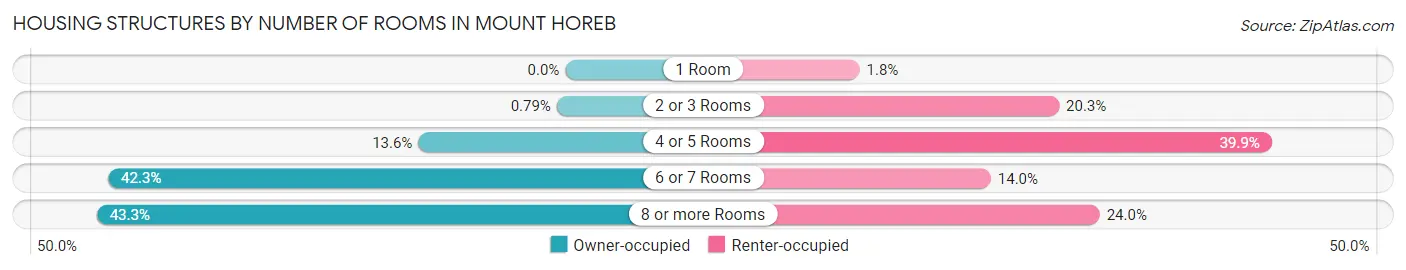
| Number of Rooms | Owner-occupied | Renter-occupied |
| 1 Room | 0 (0.0%) | 15 (1.8%) |
| 2 or 3 Rooms | 15 (0.8%) | 167 (20.3%) |
| 4 or 5 Rooms | 257 (13.6%) | 329 (39.9%) |
| 6 or 7 Rooms | 799 (42.3%) | 115 (14.0%) |
| 8 or more Rooms | 819 (43.3%) | 198 (24.0%) |
| Total | 1,890 (100.0%) | 824 (100.0%) |
Housing Structure by Heating Type in Mount Horeb
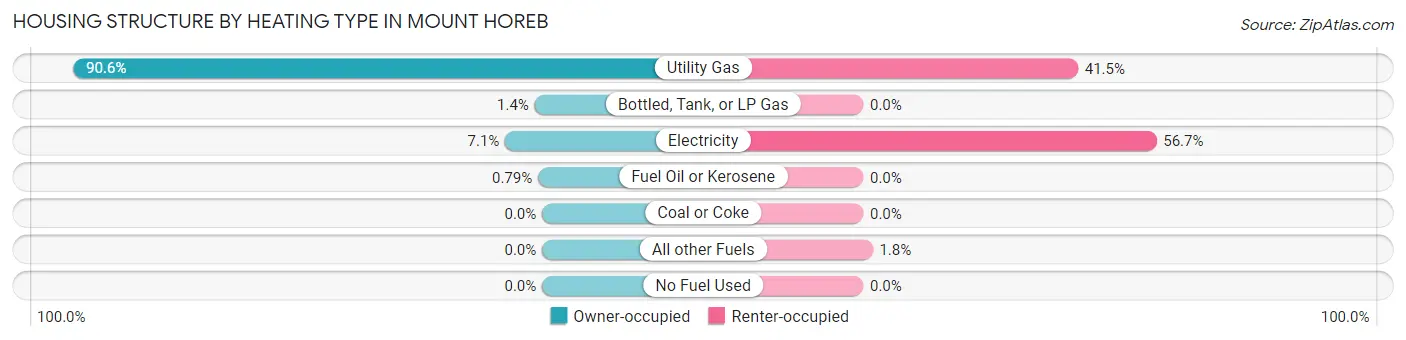
| Heating Type | Owner-occupied | Renter-occupied |
| Utility Gas | 1,713 (90.6%) | 342 (41.5%) |
| Bottled, Tank, or LP Gas | 27 (1.4%) | 0 (0.0%) |
| Electricity | 135 (7.1%) | 467 (56.7%) |
| Fuel Oil or Kerosene | 15 (0.8%) | 0 (0.0%) |
| Coal or Coke | 0 (0.0%) | 0 (0.0%) |
| All other Fuels | 0 (0.0%) | 15 (1.8%) |
| No Fuel Used | 0 (0.0%) | 0 (0.0%) |
| Total | 1,890 (100.0%) | 824 (100.0%) |
Household Vehicle Usage in Mount Horeb
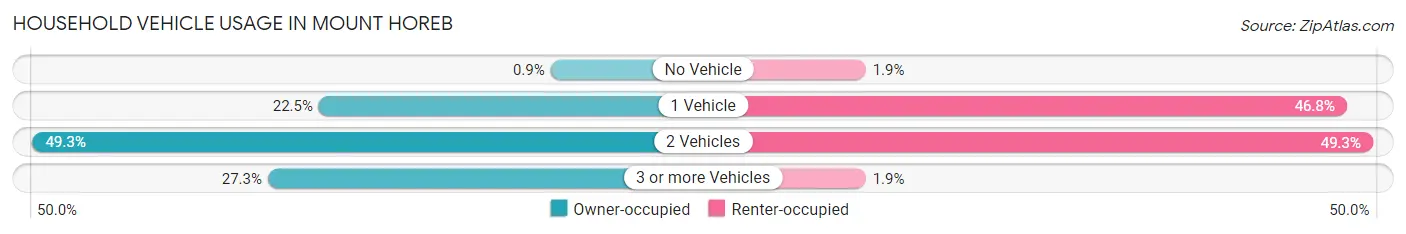
| Vehicles per Household | Owner-occupied | Renter-occupied |
| No Vehicle | 17 (0.9%) | 16 (1.9%) |
| 1 Vehicle | 426 (22.5%) | 386 (46.8%) |
| 2 Vehicles | 931 (49.3%) | 406 (49.3%) |
| 3 or more Vehicles | 516 (27.3%) | 16 (1.9%) |
| Total | 1,890 (100.0%) | 824 (100.0%) |
Real Estate & Mortgages in Mount Horeb
Real Estate and Mortgage Overview in Mount Horeb
| Characteristic | Without Mortgage | With Mortgage |
| Housing Units | 529 | 1,361 |
| Median Property Value | $303,700 | $343,300 |
| Median Household Income | $44,836 | $438 |
| Monthly Housing Costs | $814 | $119 |
| Real Estate Taxes | $5,313 | $15 |
Property Value by Mortgage Status in Mount Horeb
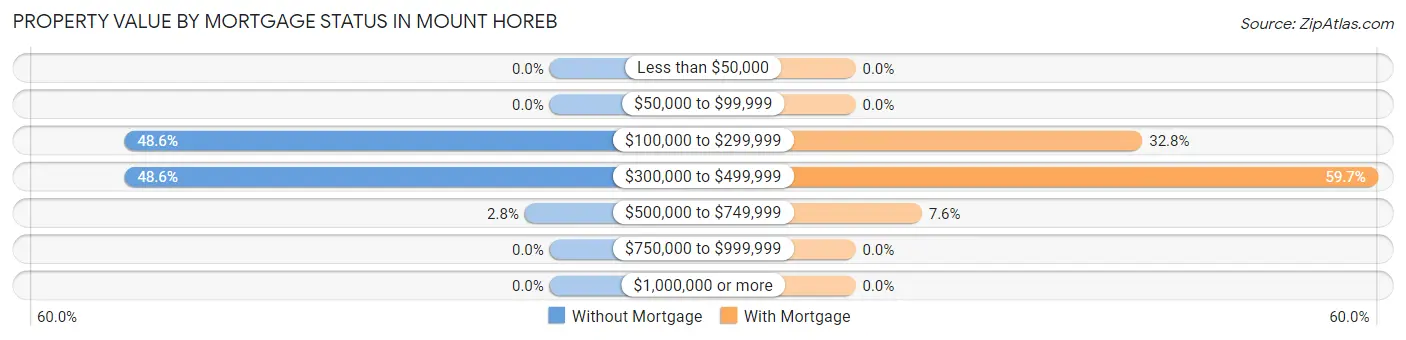
| Property Value | Without Mortgage | With Mortgage |
| Less than $50,000 | 0 (0.0%) | 0 (0.0%) |
| $50,000 to $99,999 | 0 (0.0%) | 0 (0.0%) |
| $100,000 to $299,999 | 257 (48.6%) | 446 (32.8%) |
| $300,000 to $499,999 | 257 (48.6%) | 812 (59.7%) |
| $500,000 to $749,999 | 15 (2.8%) | 103 (7.6%) |
| $750,000 to $999,999 | 0 (0.0%) | 0 (0.0%) |
| $1,000,000 or more | 0 (0.0%) | 0 (0.0%) |
| Total | 529 (100.0%) | 1,361 (100.0%) |
Household Income by Mortgage Status in Mount Horeb
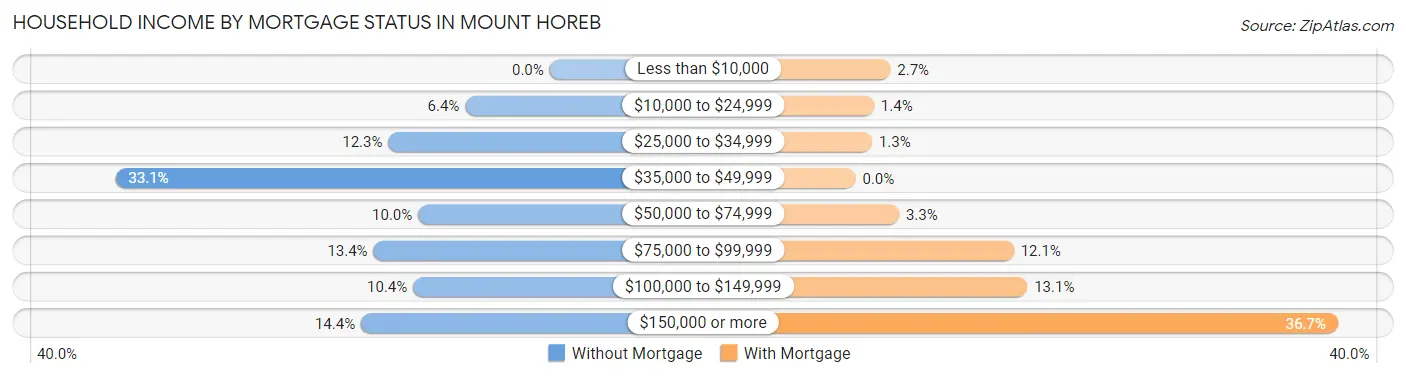
| Household Income | Without Mortgage | With Mortgage |
| Less than $10,000 | 0 (0.0%) | 36 (2.6%) |
| $10,000 to $24,999 | 34 (6.4%) | 19 (1.4%) |
| $25,000 to $34,999 | 65 (12.3%) | 17 (1.3%) |
| $35,000 to $49,999 | 175 (33.1%) | 0 (0.0%) |
| $50,000 to $74,999 | 53 (10.0%) | 45 (3.3%) |
| $75,000 to $99,999 | 71 (13.4%) | 164 (12.0%) |
| $100,000 to $149,999 | 55 (10.4%) | 178 (13.1%) |
| $150,000 or more | 76 (14.4%) | 500 (36.7%) |
| Total | 529 (100.0%) | 1,361 (100.0%) |
Property Value to Household Income Ratio in Mount Horeb
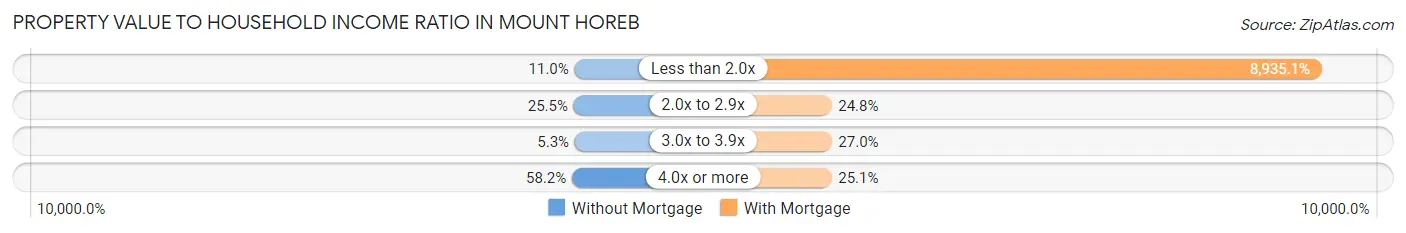
| Value-to-Income Ratio | Without Mortgage | With Mortgage |
| Less than 2.0x | 58 (11.0%) | 121,607 (8,935.1%) |
| 2.0x to 2.9x | 135 (25.5%) | 338 (24.8%) |
| 3.0x to 3.9x | 28 (5.3%) | 368 (27.0%) |
| 4.0x or more | 308 (58.2%) | 341 (25.1%) |
| Total | 529 (100.0%) | 1,361 (100.0%) |
Real Estate Taxes by Mortgage Status in Mount Horeb
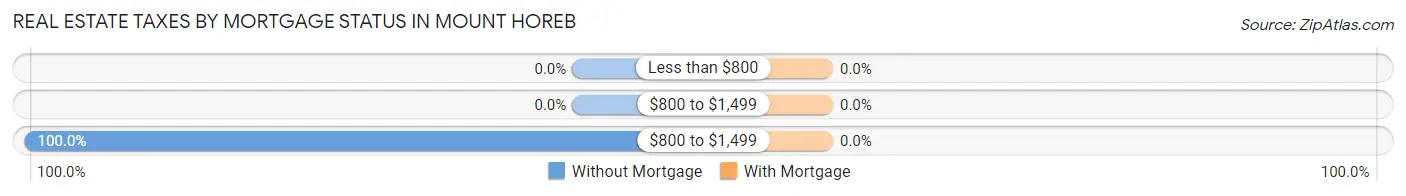
| Property Taxes | Without Mortgage | With Mortgage |
| Less than $800 | 0 (0.0%) | 0 (0.0%) |
| $800 to $1,499 | 0 (0.0%) | 0 (0.0%) |
| $800 to $1,499 | 529 (100.0%) | 0 (0.0%) |
| Total | 529 (100.0%) | 1,361 (100.0%) |
Health & Disability in Mount Horeb
Health Insurance Coverage by Age in Mount Horeb
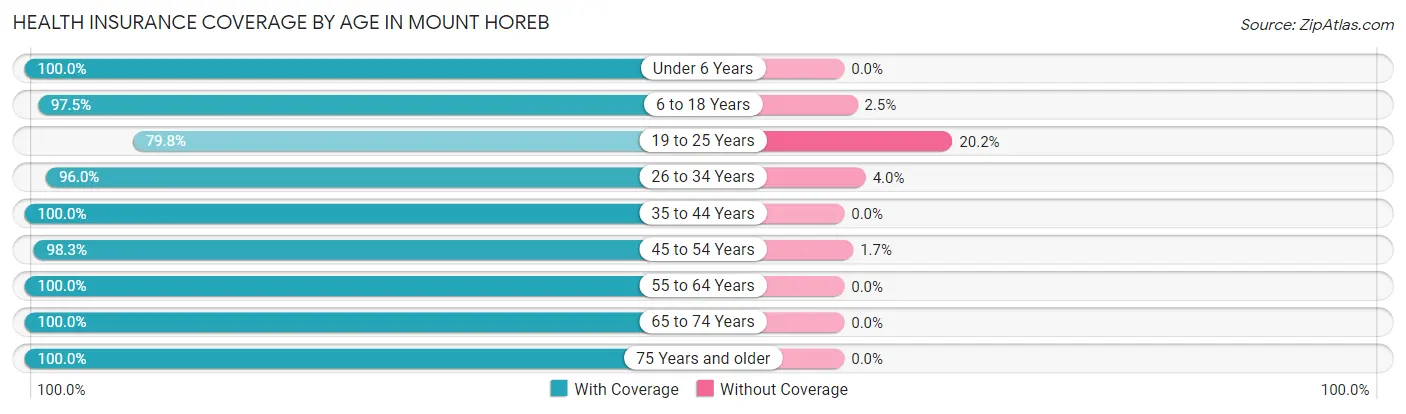
| Age Bracket | With Coverage | Without Coverage |
| Under 6 Years | 569 (100.0%) | 0 (0.0%) |
| 6 to 18 Years | 1,894 (97.5%) | 48 (2.5%) |
| 19 to 25 Years | 198 (79.8%) | 50 (20.2%) |
| 26 to 34 Years | 867 (96.0%) | 36 (4.0%) |
| 35 to 44 Years | 1,342 (100.0%) | 0 (0.0%) |
| 45 to 54 Years | 881 (98.3%) | 15 (1.7%) |
| 55 to 64 Years | 828 (100.0%) | 0 (0.0%) |
| 65 to 74 Years | 528 (100.0%) | 0 (0.0%) |
| 75 Years and older | 373 (100.0%) | 0 (0.0%) |
| Total | 7,480 (98.1%) | 149 (1.9%) |
Health Insurance Coverage by Citizenship Status in Mount Horeb
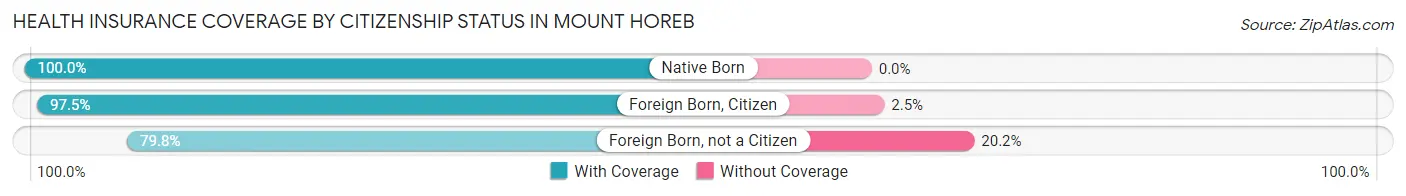
| Citizenship Status | With Coverage | Without Coverage |
| Native Born | 569 (100.0%) | 0 (0.0%) |
| Foreign Born, Citizen | 1,894 (97.5%) | 48 (2.5%) |
| Foreign Born, not a Citizen | 198 (79.8%) | 50 (20.2%) |
Health Insurance Coverage by Household Income in Mount Horeb
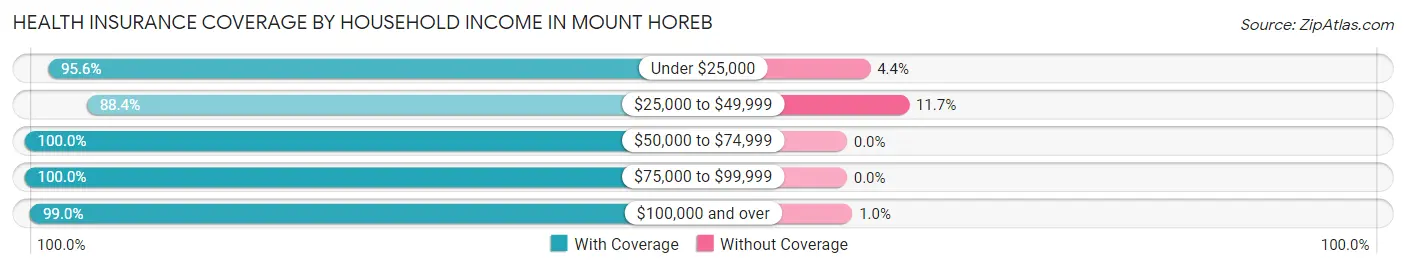
| Household Income | With Coverage | Without Coverage |
| Under $25,000 | 327 (95.6%) | 15 (4.4%) |
| $25,000 to $49,999 | 652 (88.3%) | 86 (11.7%) |
| $50,000 to $74,999 | 1,025 (100.0%) | 0 (0.0%) |
| $75,000 to $99,999 | 819 (100.0%) | 0 (0.0%) |
| $100,000 and over | 4,650 (99.0%) | 48 (1.0%) |
Public vs Private Health Insurance Coverage by Age in Mount Horeb
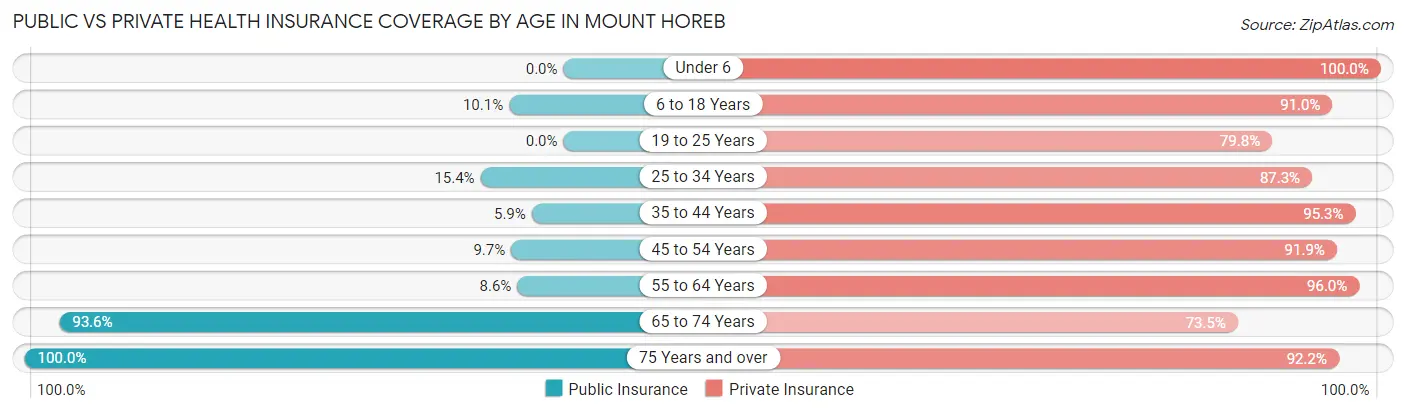
| Age Bracket | Public Insurance | Private Insurance |
| Under 6 | 0 (0.0%) | 569 (100.0%) |
| 6 to 18 Years | 196 (10.1%) | 1,768 (91.0%) |
| 19 to 25 Years | 0 (0.0%) | 198 (79.8%) |
| 25 to 34 Years | 139 (15.4%) | 788 (87.3%) |
| 35 to 44 Years | 79 (5.9%) | 1,279 (95.3%) |
| 45 to 54 Years | 87 (9.7%) | 823 (91.8%) |
| 55 to 64 Years | 71 (8.6%) | 795 (96.0%) |
| 65 to 74 Years | 494 (93.6%) | 388 (73.5%) |
| 75 Years and over | 373 (100.0%) | 344 (92.2%) |
| Total | 1,439 (18.9%) | 6,952 (91.1%) |
Disability Status by Sex by Age in Mount Horeb
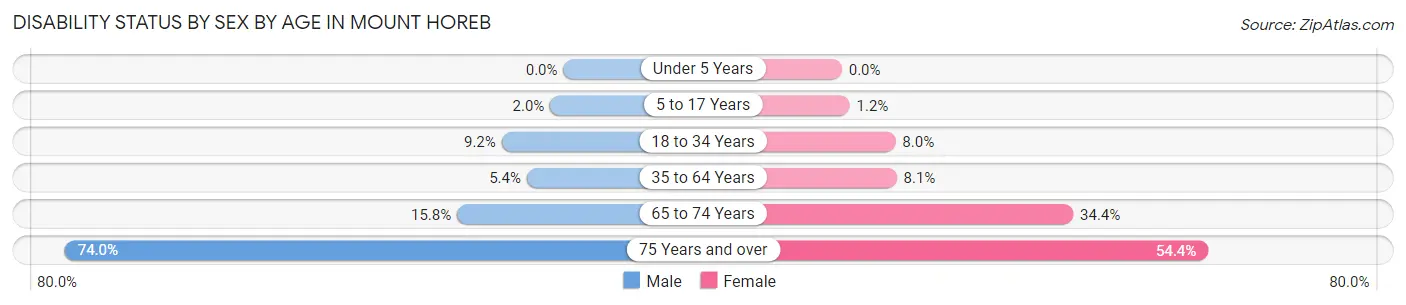
| Age Bracket | Male | Female |
| Under 5 Years | 0 (0.0%) | 0 (0.0%) |
| 5 to 17 Years | 16 (2.0%) | 14 (1.2%) |
| 18 to 34 Years | 55 (9.2%) | 44 (8.0%) |
| 35 to 64 Years | 79 (5.4%) | 131 (8.1%) |
| 65 to 74 Years | 42 (15.8%) | 90 (34.4%) |
| 75 Years and over | 57 (74.0%) | 161 (54.4%) |
Disability Class by Sex by Age in Mount Horeb
Disability Class: Hearing Difficulty
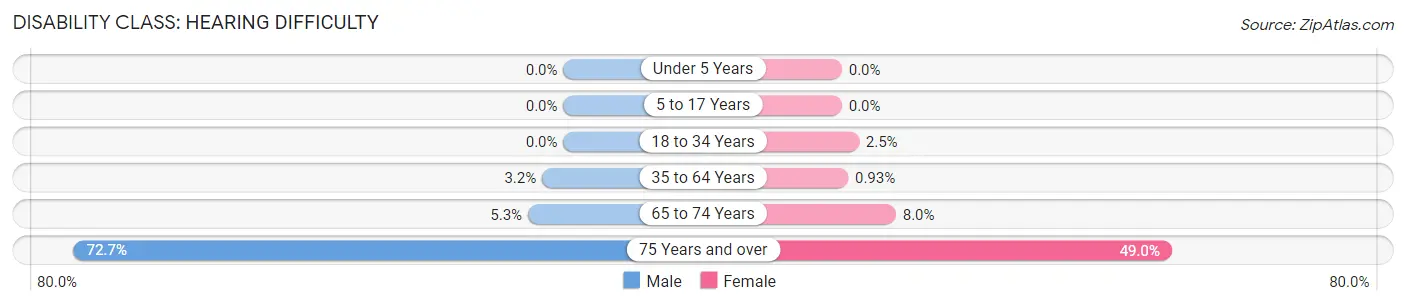
| Age Bracket | Male | Female |
| Under 5 Years | 0 (0.0%) | 0 (0.0%) |
| 5 to 17 Years | 0 (0.0%) | 0 (0.0%) |
| 18 to 34 Years | 0 (0.0%) | 14 (2.5%) |
| 35 to 64 Years | 46 (3.2%) | 15 (0.9%) |
| 65 to 74 Years | 14 (5.3%) | 21 (8.0%) |
| 75 Years and over | 56 (72.7%) | 145 (49.0%) |
Disability Class: Vision Difficulty
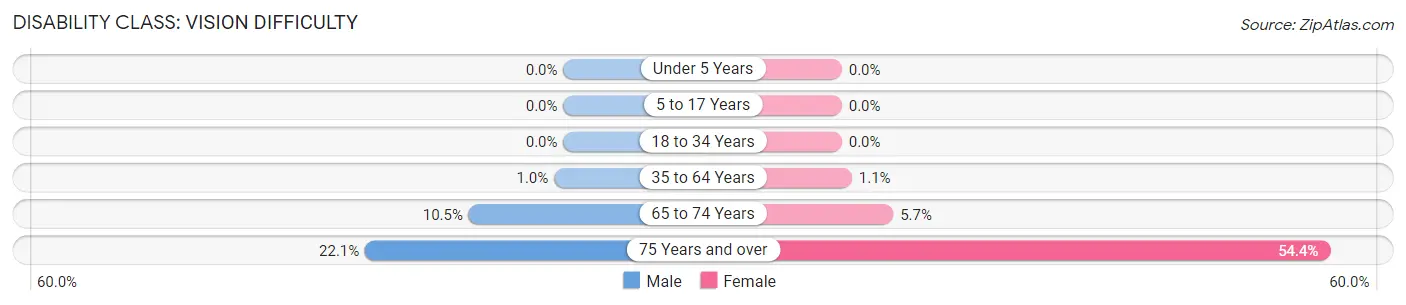
| Age Bracket | Male | Female |
| Under 5 Years | 0 (0.0%) | 0 (0.0%) |
| 5 to 17 Years | 0 (0.0%) | 0 (0.0%) |
| 18 to 34 Years | 0 (0.0%) | 0 (0.0%) |
| 35 to 64 Years | 15 (1.0%) | 18 (1.1%) |
| 65 to 74 Years | 28 (10.5%) | 15 (5.7%) |
| 75 Years and over | 17 (22.1%) | 161 (54.4%) |
Disability Class: Cognitive Difficulty
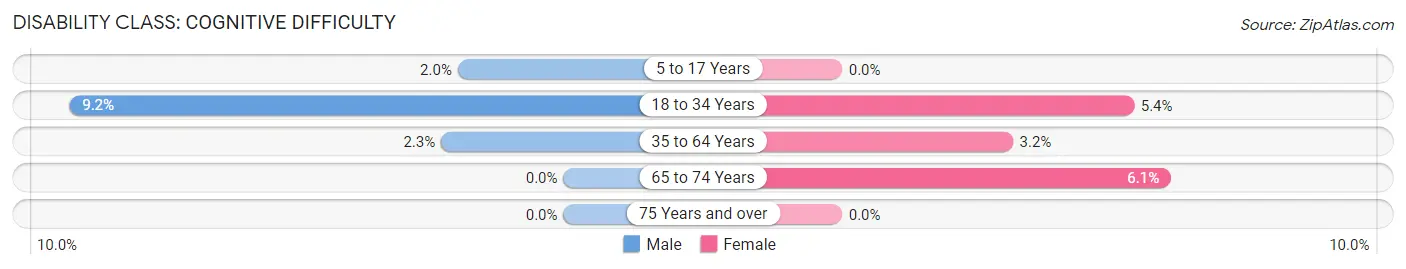
| Age Bracket | Male | Female |
| 5 to 17 Years | 16 (2.0%) | 0 (0.0%) |
| 18 to 34 Years | 55 (9.2%) | 30 (5.4%) |
| 35 to 64 Years | 33 (2.3%) | 51 (3.2%) |
| 65 to 74 Years | 0 (0.0%) | 16 (6.1%) |
| 75 Years and over | 0 (0.0%) | 0 (0.0%) |
Disability Class: Ambulatory Difficulty
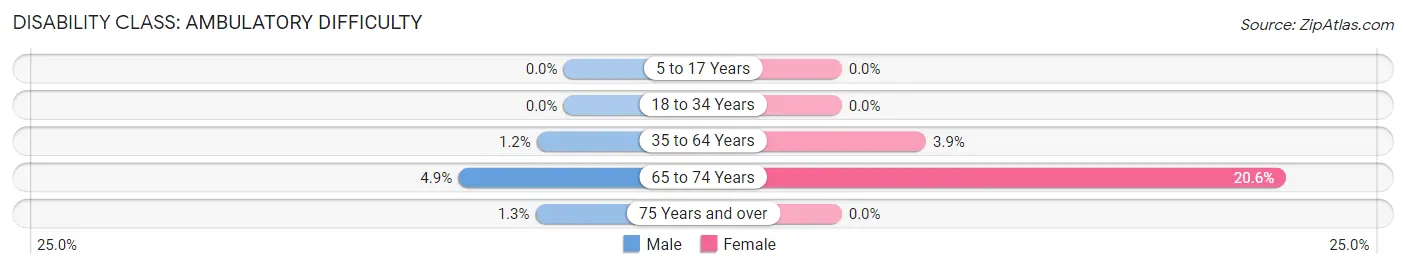
| Age Bracket | Male | Female |
| 5 to 17 Years | 0 (0.0%) | 0 (0.0%) |
| 18 to 34 Years | 0 (0.0%) | 0 (0.0%) |
| 35 to 64 Years | 18 (1.2%) | 63 (3.9%) |
| 65 to 74 Years | 13 (4.9%) | 54 (20.6%) |
| 75 Years and over | 1 (1.3%) | 0 (0.0%) |
Disability Class: Self-Care Difficulty
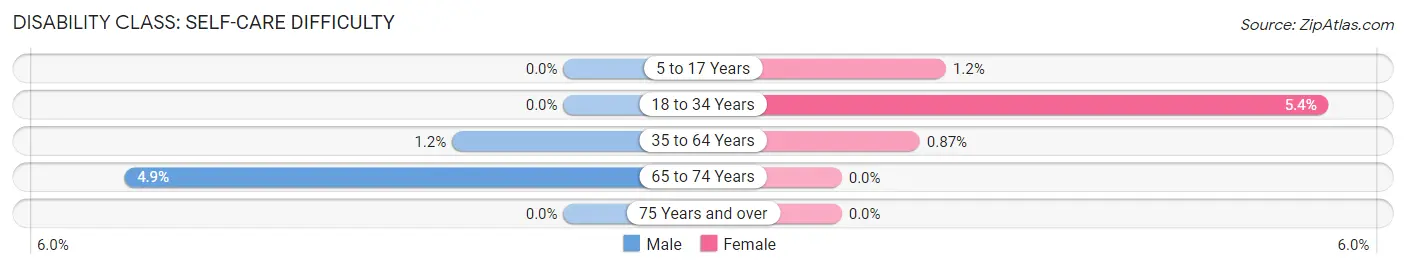
| Age Bracket | Male | Female |
| 5 to 17 Years | 0 (0.0%) | 14 (1.2%) |
| 18 to 34 Years | 0 (0.0%) | 30 (5.4%) |
| 35 to 64 Years | 18 (1.2%) | 14 (0.9%) |
| 65 to 74 Years | 13 (4.9%) | 0 (0.0%) |
| 75 Years and over | 0 (0.0%) | 0 (0.0%) |
Technology Access in Mount Horeb
Computing Device Access in Mount Horeb
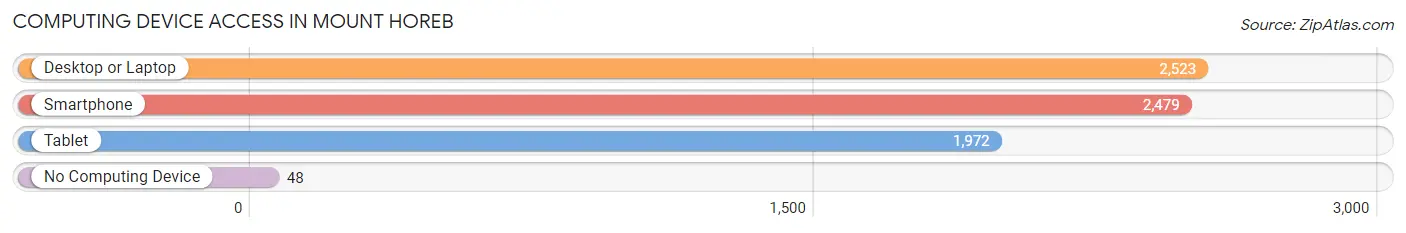
| Device Type | # Households | % Households |
| Desktop or Laptop | 2,523 | 93.0% |
| Smartphone | 2,479 | 91.3% |
| Tablet | 1,972 | 72.7% |
| No Computing Device | 48 | 1.8% |
| Total | 2,714 | 100.0% |
Internet Access in Mount Horeb
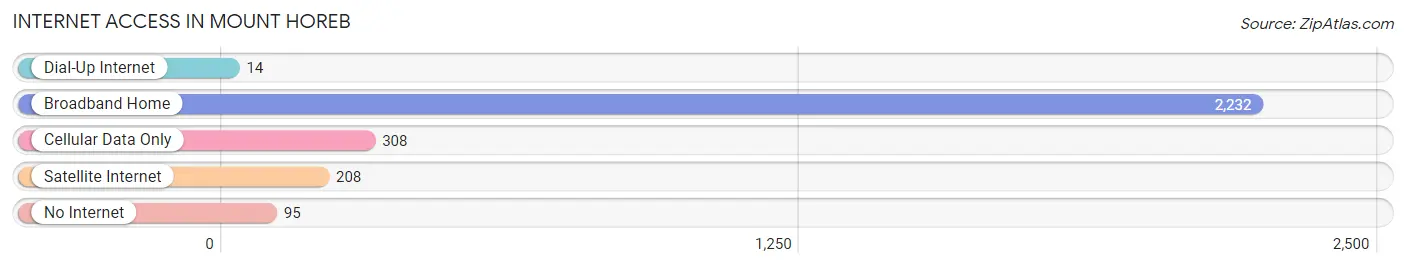
| Internet Type | # Households | % Households |
| Dial-Up Internet | 14 | 0.5% |
| Broadband Home | 2,232 | 82.2% |
| Cellular Data Only | 308 | 11.4% |
| Satellite Internet | 208 | 7.7% |
| No Internet | 95 | 3.5% |
| Total | 2,714 | 100.0% |
Mount Horeb Summary
Mount Horeb, Wisconsin is a small village located in Dane County, Wisconsin. It is situated in the southwestern part of the state, about 20 miles west of Madison. The village is home to a population of approximately 7,000 people, and is known for its quaint downtown area, which is lined with unique shops and restaurants.
History
Mount Horeb was first settled in 1845 by a group of Norwegian immigrants. The village was named after the biblical Mount Horeb, which is mentioned in the Old Testament. The settlers were attracted to the area due to its fertile soil and abundant natural resources. The village quickly grew and by the late 19th century, it had become a thriving agricultural community.
In the early 20th century, the village began to diversify its economy. The first cheese factory was established in 1906, and the first creamery opened in 1910. These businesses helped to spur the growth of the village, and by the 1950s, Mount Horeb had become a popular tourist destination.
Geography
Mount Horeb is located in southwestern Wisconsin, about 20 miles west of Madison. The village is situated in the Driftless Area, which is characterized by its rolling hills and valleys. The village is surrounded by the Baraboo Range to the north, the Wisconsin River to the east, and the Sugar River to the south.
The village is located at an elevation of 890 feet above sea level. The climate is generally mild, with average temperatures ranging from the low 30s in the winter to the mid-80s in the summer.
Economy
The economy of Mount Horeb is largely based on agriculture and tourism. The village is home to several dairy farms, as well as a number of small businesses. The village is also home to several wineries, which attract tourists from all over the state.
In addition to agriculture and tourism, the village is also home to a number of manufacturing companies. These companies produce a variety of products, including furniture, medical equipment, and automotive parts.
Demographics
As of the 2010 census, the population of Mount Horeb was 7,009. The racial makeup of the village was 94.3% White, 0.7% African American, 0.3% Native American, 1.2% Asian, 0.1% Pacific Islander, 1.7% from other races, and 1.9% from two or more races. Hispanic or Latino of any race were 3.3% of the population.
The median household income in Mount Horeb was $54,917, and the median family income was $63,917. The per capita income was $25,917. About 4.3% of families and 5.7% of the population were below the poverty line.
Mount Horeb is a small village with a rich history and a vibrant economy. The village is home to a diverse population, and is known for its unique shops and restaurants. The village is also home to several wineries, which attract tourists from all over the state. Mount Horeb is a great place to live, work, and visit.
Common Questions
What is Per Capita Income in Mount Horeb?
Per Capita income in Mount Horeb is $44,336.
What is the Median Family Income in Mount Horeb?
Median Family Income in Mount Horeb is $105,104.
What is the Median Household income in Mount Horeb?
Median Household Income in Mount Horeb is $96,915.
What is Income or Wage Gap in Mount Horeb?
Income or Wage Gap in Mount Horeb is 49.2%.
Women in Mount Horeb earn 50.8 cents for every dollar earned by a man.
What is Inequality or Gini Index in Mount Horeb?
Inequality or Gini Index in Mount Horeb is 0.45.
What is the Total Population of Mount Horeb?
Total Population of Mount Horeb is 7,717.
What is the Total Male Population of Mount Horeb?
Total Male Population of Mount Horeb is 3,544.
What is the Total Female Population of Mount Horeb?
Total Female Population of Mount Horeb is 4,173.
What is the Ratio of Males per 100 Females in Mount Horeb?
There are 84.93 Males per 100 Females in Mount Horeb.
What is the Ratio of Females per 100 Males in Mount Horeb?
There are 117.75 Females per 100 Males in Mount Horeb.
What is the Median Population Age in Mount Horeb?
Median Population Age in Mount Horeb is 36.2 Years.
What is the Average Family Size in Mount Horeb
Average Family Size in Mount Horeb is 3.4 People.
What is the Average Household Size in Mount Horeb
Average Household Size in Mount Horeb is 2.8 People.
How Large is the Labor Force in Mount Horeb?
There are 4,354 People in the Labor Forcein in Mount Horeb.
What is the Percentage of People in the Labor Force in Mount Horeb?
79.4% of People are in the Labor Force in Mount Horeb.
What is the Unemployment Rate in Mount Horeb?
Unemployment Rate in Mount Horeb is 2.0%.