Mondovi, WI Map & Demographics
Mondovi Map
Mondovi Overview
$27,315
PER CAPITA INCOME
$58,047
AVG FAMILY INCOME
$48,526
AVG HOUSEHOLD INCOME
50.6%
WAGE / INCOME GAP [ % ]
49.4¢/ $1
WAGE / INCOME GAP [ $ ]
$4,028
FAMILY INCOME DEFICIT
0.39
INEQUALITY / GINI INDEX
2,832
TOTAL POPULATION
1,284
MALE POPULATION
1,548
FEMALE POPULATION
82.95
MALES / 100 FEMALES
120.56
FEMALES / 100 MALES
39.2
MEDIAN AGE
2.7
AVG FAMILY SIZE
2.2
AVG HOUSEHOLD SIZE
1,416
LABOR FORCE [ PEOPLE ]
62.6%
PERCENT IN LABOR FORCE
2.5%
UNEMPLOYMENT RATE
Mondovi Zip Codes
Mondovi Area Codes
Income in Mondovi
Income Overview in Mondovi
Per Capita Income in Mondovi is $27,315, while median incomes of families and households are $58,047 and $48,526 respectively.
| Characteristic | Number | Measure |
| Per Capita Income | 2,832 | $27,315 |
| Median Family Income | 817 | $58,047 |
| Mean Family Income | 817 | $66,640 |
| Median Household Income | 1,262 | $48,526 |
| Mean Household Income | 1,262 | $55,612 |
| Income Deficit | 817 | $4,028 |
| Wage / Income Gap (%) | 2,832 | 50.65% |
| Wage / Income Gap ($) | 2,832 | 49.35¢ per $1 |
| Gini / Inequality Index | 2,832 | 0.39 |
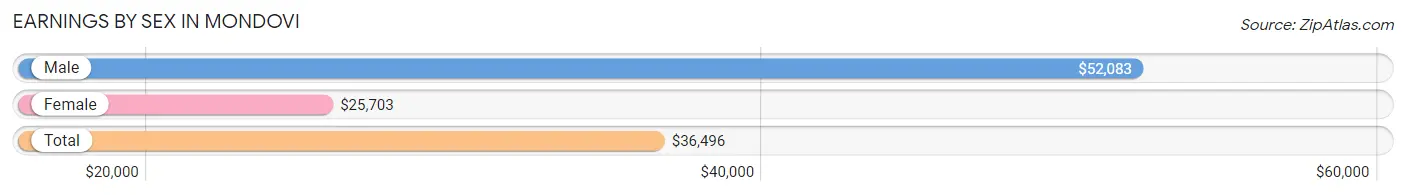
Earnings by Sex in Mondovi
Average Earnings in Mondovi are $36,496, $52,083 for men and $25,703 for women, a difference of 50.6%.
| Sex | Number | Average Earnings |
| Male | 701 (49.0%) | $52,083 |
| Female | 730 (51.0%) | $25,703 |
| Total | 1,431 (100.0%) | $36,496 |
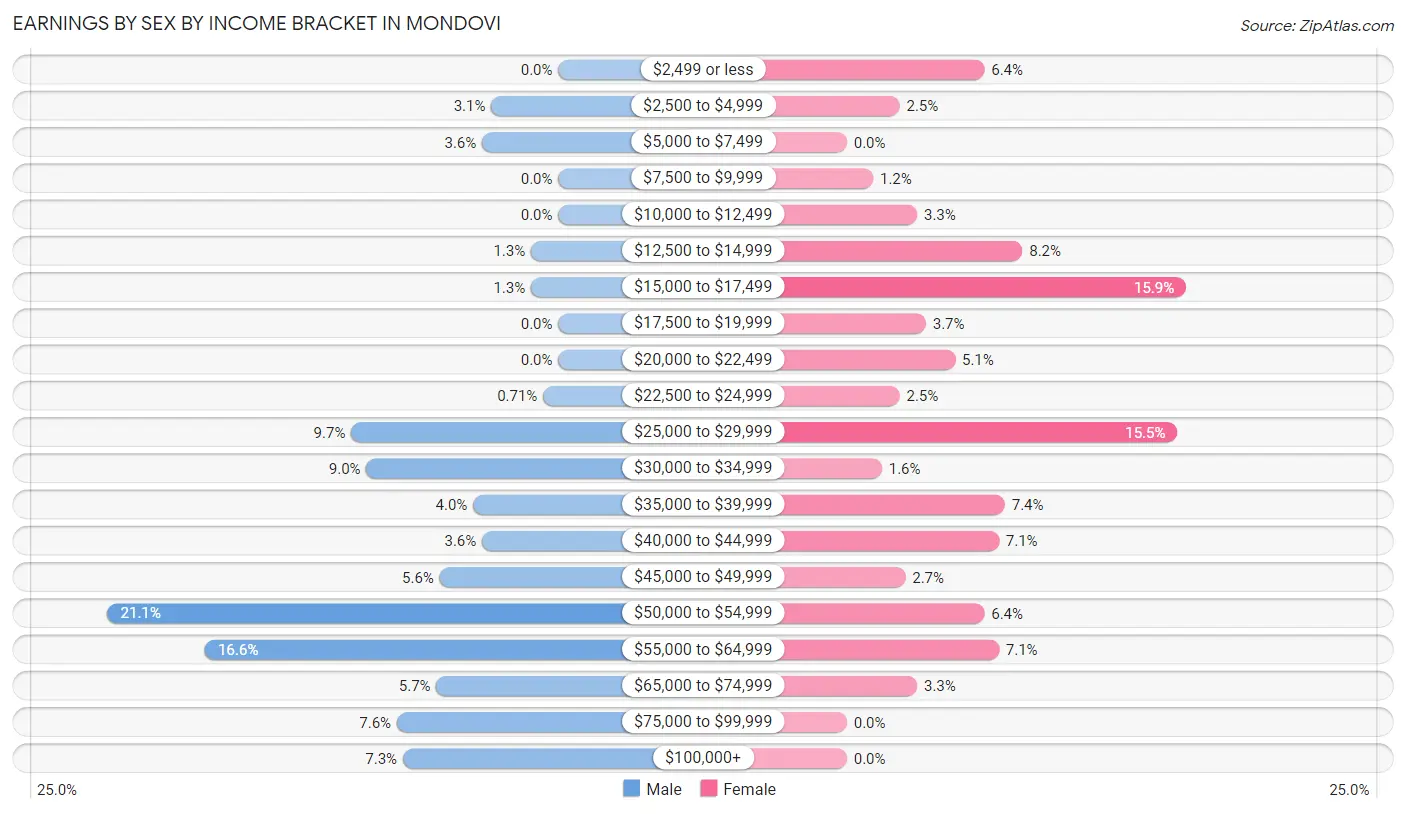
Earnings by Sex by Income Bracket in Mondovi
The most common earnings brackets in Mondovi are $50,000 to $54,999 for men (148 | 21.1%) and $15,000 to $17,499 for women (116 | 15.9%).
| Income | Male | Female |
| $2,499 or less | 0 (0.0%) | 47 (6.4%) |
| $2,500 to $4,999 | 22 (3.1%) | 18 (2.5%) |
| $5,000 to $7,499 | 25 (3.6%) | 0 (0.0%) |
| $7,500 to $9,999 | 0 (0.0%) | 9 (1.2%) |
| $10,000 to $12,499 | 0 (0.0%) | 24 (3.3%) |
| $12,500 to $14,999 | 9 (1.3%) | 60 (8.2%) |
| $15,000 to $17,499 | 9 (1.3%) | 116 (15.9%) |
| $17,500 to $19,999 | 0 (0.0%) | 27 (3.7%) |
| $20,000 to $22,499 | 0 (0.0%) | 37 (5.1%) |
| $22,500 to $24,999 | 5 (0.7%) | 18 (2.5%) |
| $25,000 to $29,999 | 68 (9.7%) | 113 (15.5%) |
| $30,000 to $34,999 | 63 (9.0%) | 12 (1.6%) |
| $35,000 to $39,999 | 28 (4.0%) | 54 (7.4%) |
| $40,000 to $44,999 | 25 (3.6%) | 52 (7.1%) |
| $45,000 to $49,999 | 39 (5.6%) | 20 (2.7%) |
| $50,000 to $54,999 | 148 (21.1%) | 47 (6.4%) |
| $55,000 to $64,999 | 116 (16.6%) | 52 (7.1%) |
| $65,000 to $74,999 | 40 (5.7%) | 24 (3.3%) |
| $75,000 to $99,999 | 53 (7.6%) | 0 (0.0%) |
| $100,000+ | 51 (7.3%) | 0 (0.0%) |
| Total | 701 (100.0%) | 730 (100.0%) |
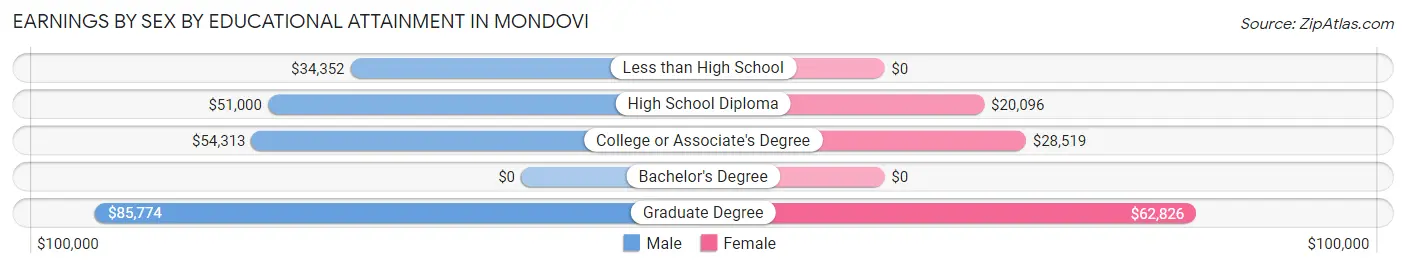
Earnings by Sex by Educational Attainment in Mondovi
Average earnings in Mondovi are $52,532 for men and $26,719 for women, a difference of 49.1%. Men with an educational attainment of graduate degree enjoy the highest average annual earnings of $85,774, while those with less than high school education earn the least with $34,352. Women with an educational attainment of graduate degree earn the most with the average annual earnings of $62,826, while those with high school diploma education have the smallest earnings of $20,096.
| Educational Attainment | Male Income | Female Income |
| Less than High School | $34,352 | $0 |
| High School Diploma | $51,000 | $20,096 |
| College or Associate's Degree | $54,313 | $28,519 |
| Bachelor's Degree | - | - |
| Graduate Degree | $85,774 | $62,826 |
| Total | $52,532 | $26,719 |
Family Income in Mondovi
Family Income Brackets in Mondovi
According to the Mondovi family income data, there are 213 families falling into the $50,000 to $74,999 income range, which is the most common income bracket and makes up 26.1% of all families.
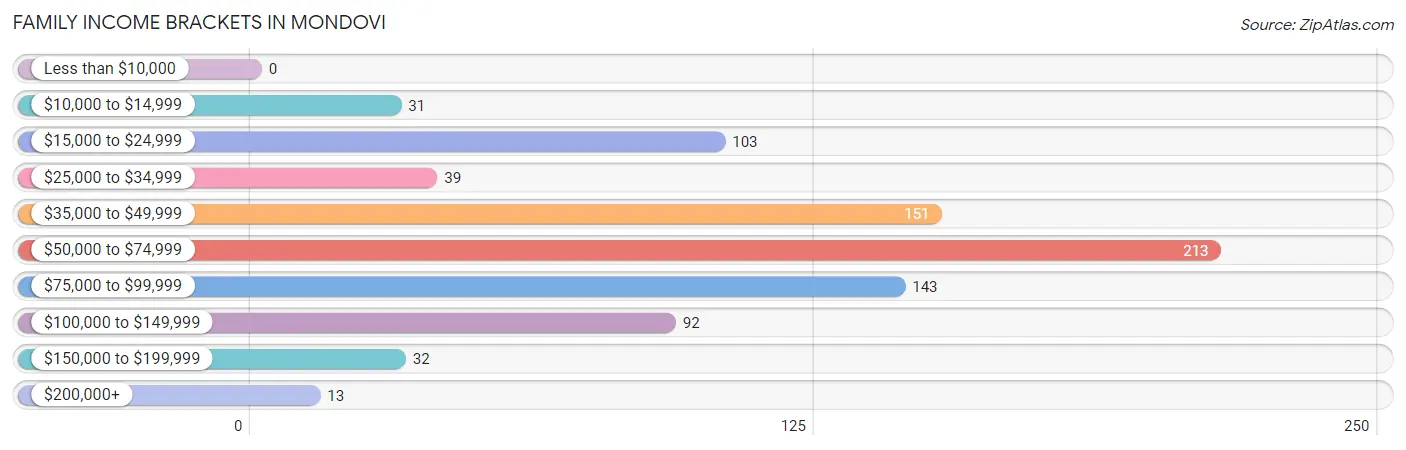
| Income Bracket | # Families | % Families |
| Less than $10,000 | 0 | 0.0% |
| $10,000 to $14,999 | 31 | 3.8% |
| $15,000 to $24,999 | 103 | 12.6% |
| $25,000 to $34,999 | 39 | 4.8% |
| $35,000 to $49,999 | 151 | 18.5% |
| $50,000 to $74,999 | 213 | 26.1% |
| $75,000 to $99,999 | 143 | 17.5% |
| $100,000 to $149,999 | 92 | 11.3% |
| $150,000 to $199,999 | 32 | 3.9% |
| $200,000+ | 13 | 1.6% |
Family Income by Famaliy Size in Mondovi
5-person families (42 | 5.1%) account for the highest median family income in Mondovi with $99,167 per family, while 3-person families (145 | 17.7%) have the highest median income of $27,981 per family member.
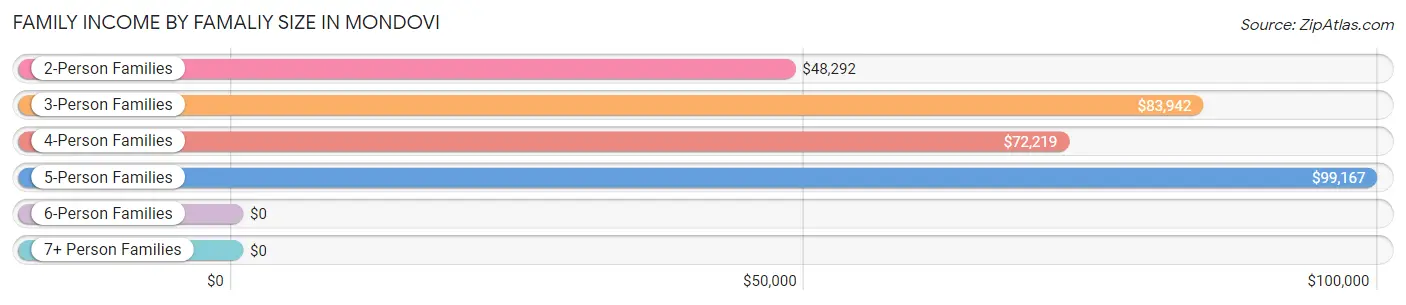
| Income Bracket | # Families | Median Income |
| 2-Person Families | 507 (62.1%) | $48,292 |
| 3-Person Families | 145 (17.7%) | $83,942 |
| 4-Person Families | 123 (15.1%) | $72,219 |
| 5-Person Families | 42 (5.1%) | $99,167 |
| 6-Person Families | 0 (0.0%) | $0 |
| 7+ Person Families | 0 (0.0%) | $0 |
| Total | 817 (100.0%) | $58,047 |
Family Income by Number of Earners in Mondovi
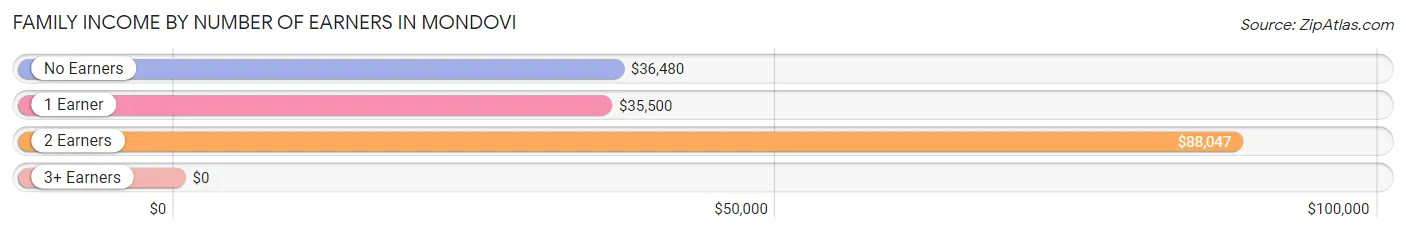
| Number of Earners | # Families | Median Income |
| No Earners | 198 (24.2%) | $36,480 |
| 1 Earner | 212 (26.0%) | $35,500 |
| 2 Earners | 376 (46.0%) | $88,047 |
| 3+ Earners | 31 (3.8%) | $0 |
| Total | 817 (100.0%) | $58,047 |
Household Income in Mondovi
Household Income Brackets in Mondovi
With 310 households falling in the category, the $50,000 to $74,999 income range is the most frequent in Mondovi, accounting for 24.6% of all households. In contrast, only 13 households (1.0%) fall into the $200,000+ income bracket, making it the least populous group.
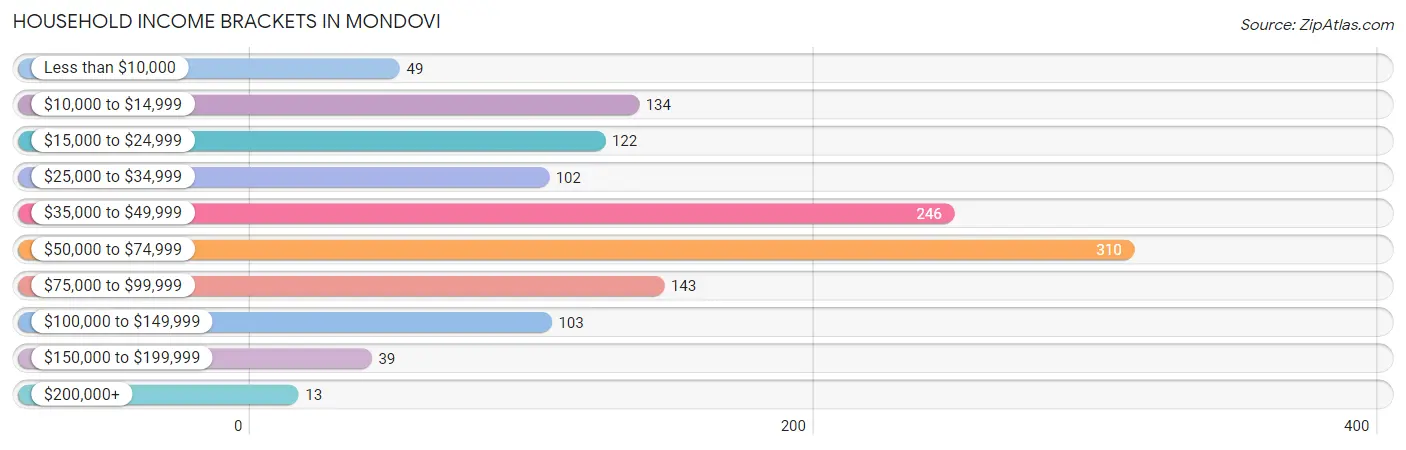
| Income Bracket | # Households | % Households |
| Less than $10,000 | 49 | 3.9% |
| $10,000 to $14,999 | 134 | 10.6% |
| $15,000 to $24,999 | 122 | 9.7% |
| $25,000 to $34,999 | 102 | 8.1% |
| $35,000 to $49,999 | 246 | 19.5% |
| $50,000 to $74,999 | 310 | 24.6% |
| $75,000 to $99,999 | 143 | 11.3% |
| $100,000 to $149,999 | 103 | 8.2% |
| $150,000 to $199,999 | 39 | 3.1% |
| $200,000+ | 13 | 1.0% |
Household Income by Householder Age in Mondovi
The median household income in Mondovi is $48,526, with the highest median household income of $70,510 found in the 25 to 44 years age bracket for the primary householder. A total of 402 households (31.9%) fall into this category. Meanwhile, the 15 to 24 years age bracket for the primary householder has the lowest median household income of $0, with 27 households (2.1%) in this group.
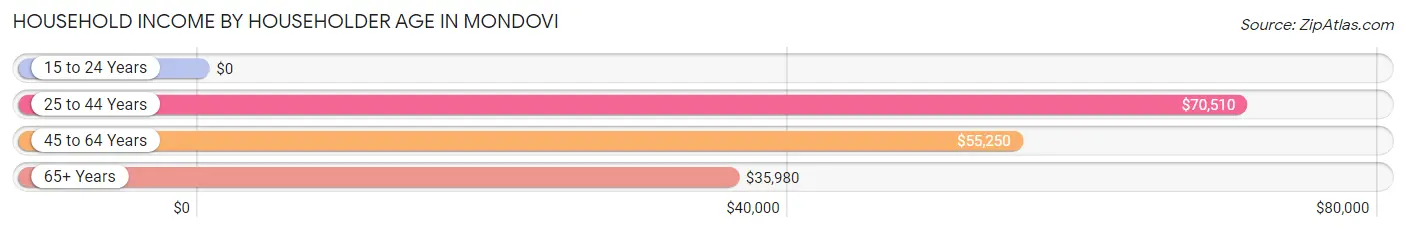
| Income Bracket | # Households | Median Income |
| 15 to 24 Years | 27 (2.1%) | $0 |
| 25 to 44 Years | 402 (31.9%) | $70,510 |
| 45 to 64 Years | 390 (30.9%) | $55,250 |
| 65+ Years | 443 (35.1%) | $35,980 |
| Total | 1,262 (100.0%) | $48,526 |
Poverty in Mondovi
Income Below Poverty by Sex and Age in Mondovi
With 10.0% poverty level for males and 21.2% for females among the residents of Mondovi, 16 and 17 year old males and 12 to 14 year old females are the most vulnerable to poverty, with 11 males (44.0%) and 31 females (56.4%) in their respective age groups living below the poverty level.
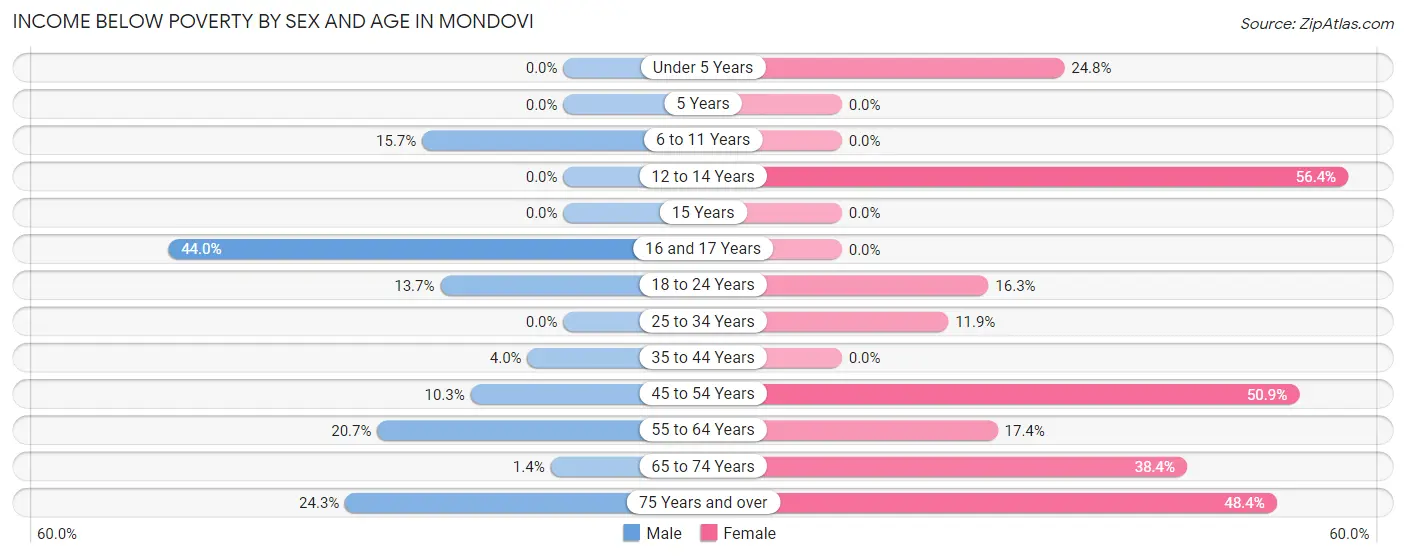
| Age Bracket | Male | Female |
| Under 5 Years | 0 (0.0%) | 28 (24.8%) |
| 5 Years | 0 (0.0%) | 0 (0.0%) |
| 6 to 11 Years | 14 (15.7%) | 0 (0.0%) |
| 12 to 14 Years | 0 (0.0%) | 31 (56.4%) |
| 15 Years | 0 (0.0%) | 0 (0.0%) |
| 16 and 17 Years | 11 (44.0%) | 0 (0.0%) |
| 18 to 24 Years | 10 (13.7%) | 16 (16.3%) |
| 25 to 34 Years | 0 (0.0%) | 16 (11.8%) |
| 35 to 44 Years | 9 (4.0%) | 0 (0.0%) |
| 45 to 54 Years | 9 (10.3%) | 56 (50.9%) |
| 55 to 64 Years | 46 (20.7%) | 38 (17.3%) |
| 65 to 74 Years | 2 (1.4%) | 78 (38.4%) |
| 75 Years and over | 26 (24.3%) | 61 (48.4%) |
| Total | 127 (10.0%) | 324 (21.2%) |
Income Above Poverty by Sex and Age in Mondovi
According to the poverty statistics in Mondovi, males aged under 5 years and females aged 5 years are the age groups that are most secure financially, with 100.0% of males and 100.0% of females in these age groups living above the poverty line.
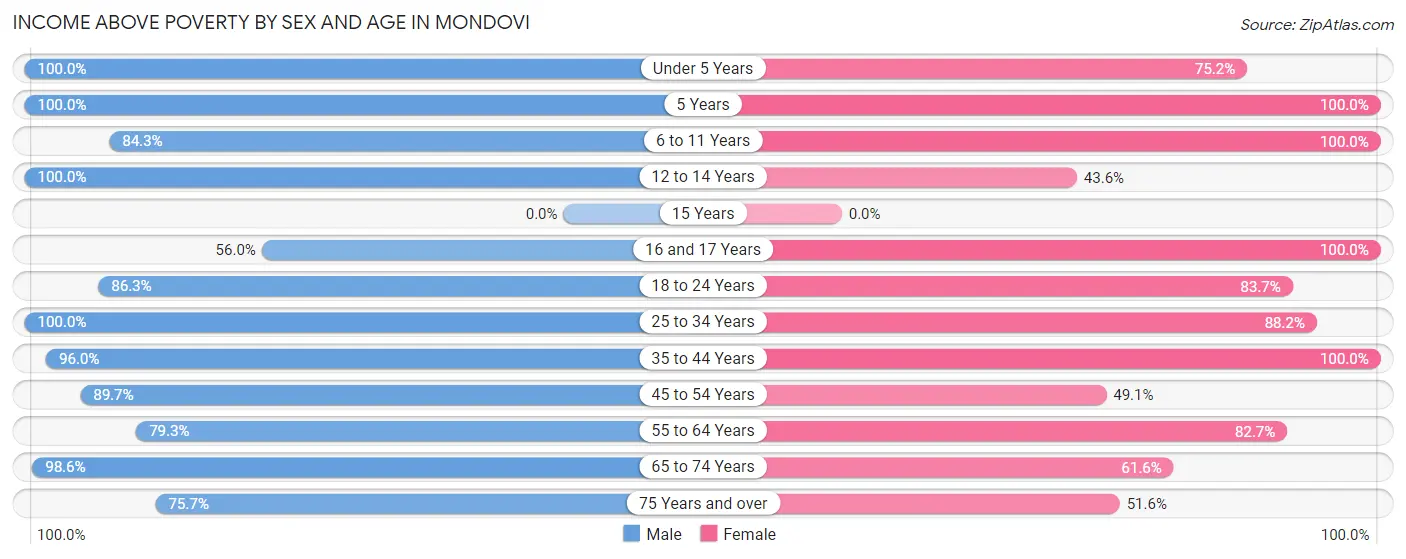
| Age Bracket | Male | Female |
| Under 5 Years | 59 (100.0%) | 85 (75.2%) |
| 5 Years | 11 (100.0%) | 53 (100.0%) |
| 6 to 11 Years | 75 (84.3%) | 128 (100.0%) |
| 12 to 14 Years | 62 (100.0%) | 24 (43.6%) |
| 15 Years | 0 (0.0%) | 0 (0.0%) |
| 16 and 17 Years | 14 (56.0%) | 47 (100.0%) |
| 18 to 24 Years | 63 (86.3%) | 82 (83.7%) |
| 25 to 34 Years | 168 (100.0%) | 119 (88.1%) |
| 35 to 44 Years | 216 (96.0%) | 241 (100.0%) |
| 45 to 54 Years | 78 (89.7%) | 54 (49.1%) |
| 55 to 64 Years | 176 (79.3%) | 181 (82.7%) |
| 65 to 74 Years | 138 (98.6%) | 125 (61.6%) |
| 75 Years and over | 81 (75.7%) | 65 (51.6%) |
| Total | 1,141 (90.0%) | 1,204 (78.8%) |
Income Below Poverty Among Married-Couple Families in Mondovi
The poverty statistics for married-couple families in Mondovi show that 10.1% or 60 of the total 593 families live below the poverty line. Families with no children have the highest poverty rate of 14.7%, comprising of 51 families. On the other hand, families with 3 or 4 children have the lowest poverty rate of 0.0%, which includes 0 families.
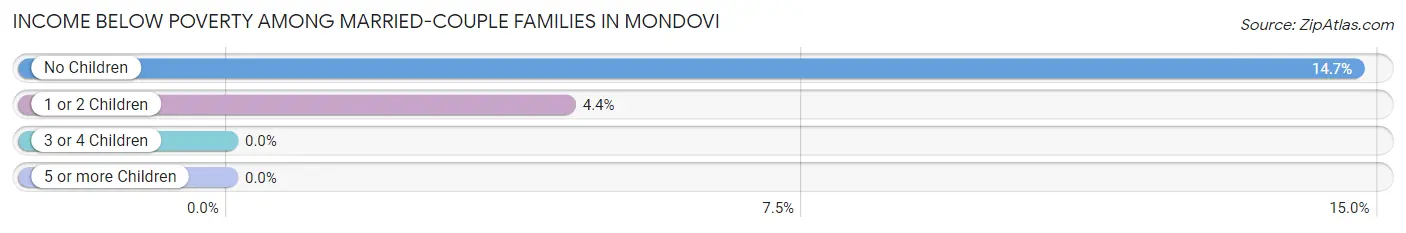
| Children | Above Poverty | Below Poverty |
| No Children | 296 (85.3%) | 51 (14.7%) |
| 1 or 2 Children | 195 (95.6%) | 9 (4.4%) |
| 3 or 4 Children | 42 (100.0%) | 0 (0.0%) |
| 5 or more Children | 0 (0.0%) | 0 (0.0%) |
| Total | 533 (89.9%) | 60 (10.1%) |
Income Below Poverty Among Single-Parent Households in Mondovi
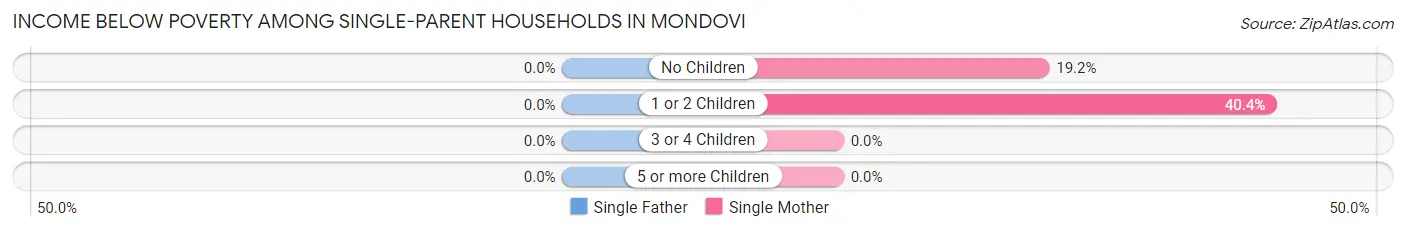
| Children | Single Father | Single Mother |
| No Children | 0 (0.0%) | 9 (19.2%) |
| 1 or 2 Children | 0 (0.0%) | 65 (40.4%) |
| 3 or 4 Children | 0 (0.0%) | 0 (0.0%) |
| 5 or more Children | 0 (0.0%) | 0 (0.0%) |
| Total | 0 (0.0%) | 74 (35.6%) |
Income Below Poverty Among Married-Couple vs Single-Parent Households in Mondovi
The poverty data for Mondovi shows that 60 of the married-couple family households (10.1%) and 74 of the single-parent households (33.0%) are living below the poverty level. Within the married-couple family households, those with no children have the highest poverty rate, with 51 households (14.7%) falling below the poverty line. Among the single-parent households, those with 1 or 2 children have the highest poverty rate, with 65 household (40.4%) living below poverty.
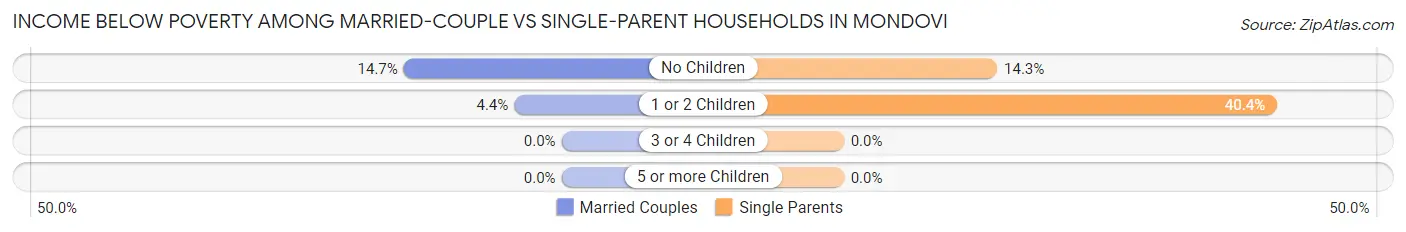
| Children | Married-Couple Families | Single-Parent Households |
| No Children | 51 (14.7%) | 9 (14.3%) |
| 1 or 2 Children | 9 (4.4%) | 65 (40.4%) |
| 3 or 4 Children | 0 (0.0%) | 0 (0.0%) |
| 5 or more Children | 0 (0.0%) | 0 (0.0%) |
| Total | 60 (10.1%) | 74 (33.0%) |
Race in Mondovi
The most populous races in Mondovi are White / Caucasian (2,765 | 97.6%), Hispanic or Latino (85 | 3.0%), and Two or more Races (38 | 1.3%).
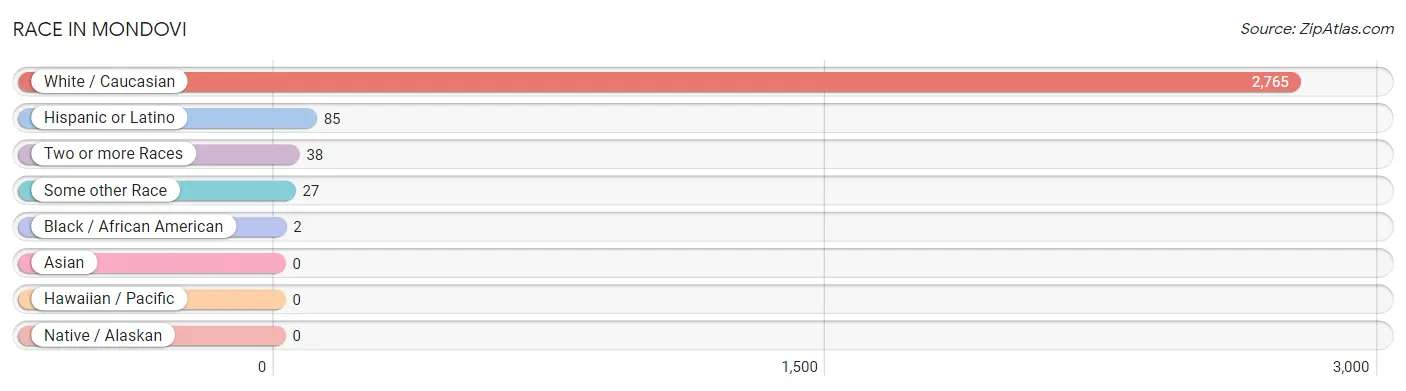
| Race | # Population | % Population |
| Asian | 0 | 0.0% |
| Black / African American | 2 | 0.1% |
| Hawaiian / Pacific | 0 | 0.0% |
| Hispanic or Latino | 85 | 3.0% |
| Native / Alaskan | 0 | 0.0% |
| White / Caucasian | 2,765 | 97.6% |
| Two or more Races | 38 | 1.3% |
| Some other Race | 27 | 0.9% |
| Total | 2,832 | 100.0% |
Ancestry in Mondovi
The most populous ancestries reported in Mondovi are German (1,125 | 39.7%), Norwegian (942 | 33.3%), English (242 | 8.6%), Irish (182 | 6.4%), and Polish (171 | 6.0%), together accounting for 94.0% of all Mondovi residents.
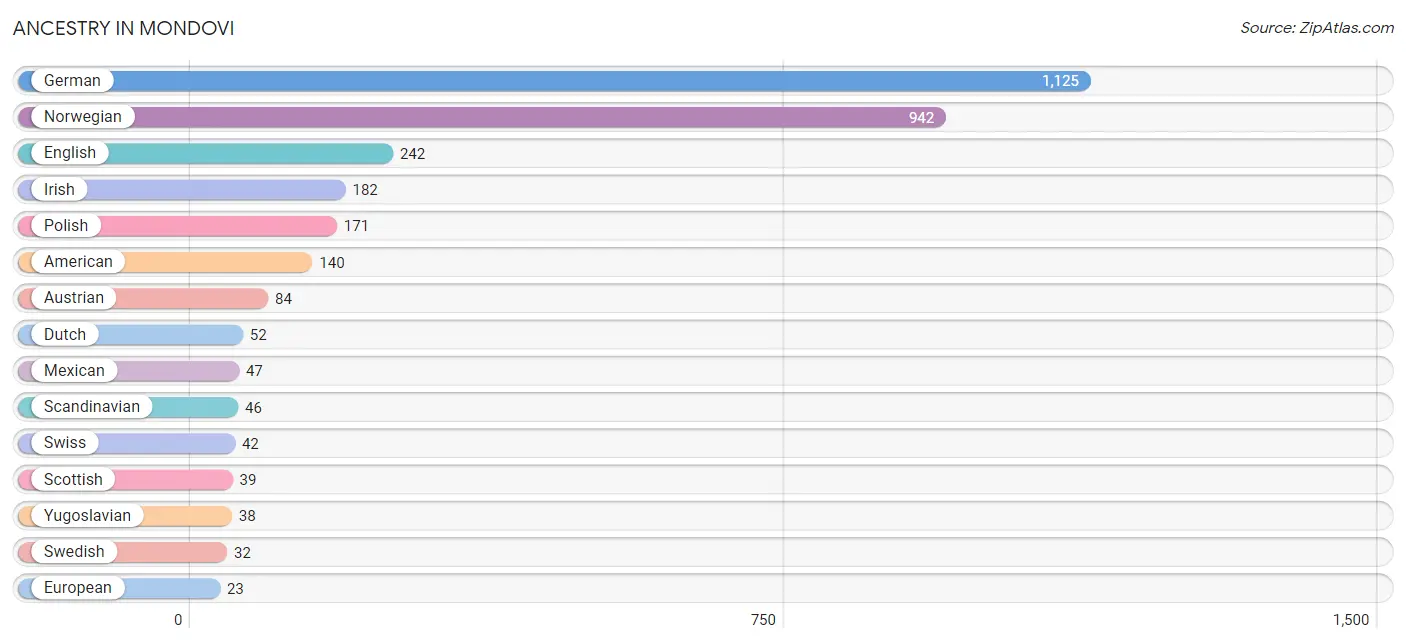
| Ancestry | # Population | % Population |
| American | 140 | 4.9% |
| Austrian | 84 | 3.0% |
| British | 18 | 0.6% |
| Danish | 13 | 0.5% |
| Dutch | 52 | 1.8% |
| English | 242 | 8.6% |
| European | 23 | 0.8% |
| French | 11 | 0.4% |
| French Canadian | 16 | 0.6% |
| German | 1,125 | 39.7% |
| Irish | 182 | 6.4% |
| Italian | 20 | 0.7% |
| Mexican | 47 | 1.7% |
| Norwegian | 942 | 33.3% |
| Peruvian | 23 | 0.8% |
| Polish | 171 | 6.0% |
| Scandinavian | 46 | 1.6% |
| Scottish | 39 | 1.4% |
| South American | 23 | 0.8% |
| Swedish | 32 | 1.1% |
| Swiss | 42 | 1.5% |
| Yugoslavian | 38 | 1.3% | View All 22 Rows |
Immigrants in Mondovi
The most numerous immigrant groups reported in Mondovi came from Central America (14 | 0.5%), Latin America (14 | 0.5%), and Mexico (14 | 0.5%), together accounting for 1.5% of all Mondovi residents.
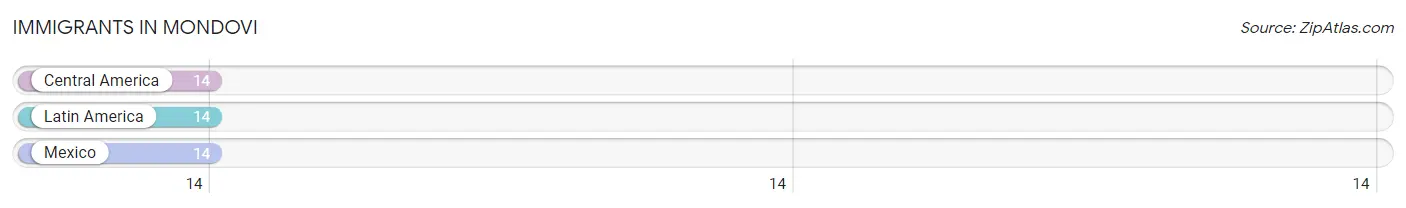
| Immigration Origin | # Population | % Population |
| Central America | 14 | 0.5% |
| Latin America | 14 | 0.5% |
| Mexico | 14 | 0.5% | View All 3 Rows |
Sex and Age in Mondovi
Sex and Age in Mondovi
The most populous age groups in Mondovi are 35 to 39 Years (178 | 13.9%) for men and 35 to 39 Years (164 | 10.6%) for women.
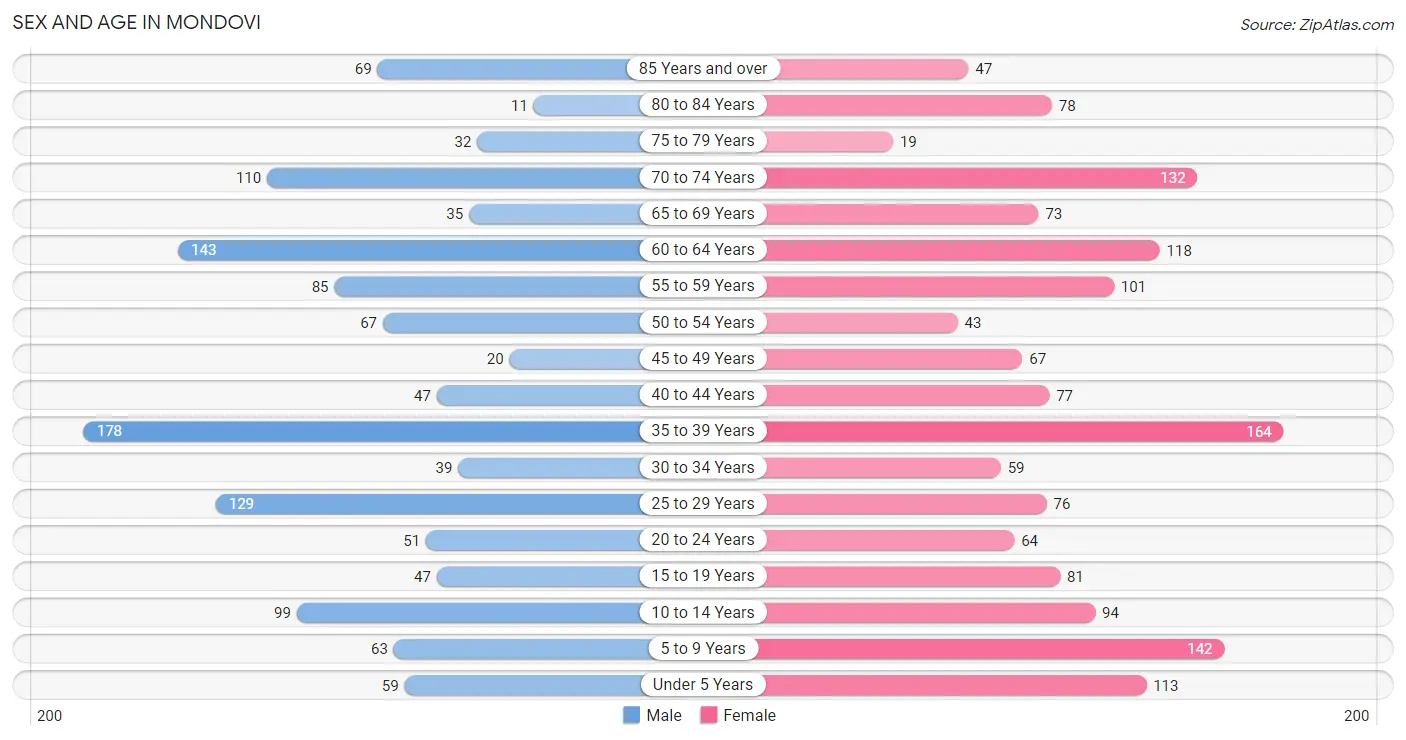
| Age Bracket | Male | Female |
| Under 5 Years | 59 (4.6%) | 113 (7.3%) |
| 5 to 9 Years | 63 (4.9%) | 142 (9.2%) |
| 10 to 14 Years | 99 (7.7%) | 94 (6.1%) |
| 15 to 19 Years | 47 (3.7%) | 81 (5.2%) |
| 20 to 24 Years | 51 (4.0%) | 64 (4.1%) |
| 25 to 29 Years | 129 (10.1%) | 76 (4.9%) |
| 30 to 34 Years | 39 (3.0%) | 59 (3.8%) |
| 35 to 39 Years | 178 (13.9%) | 164 (10.6%) |
| 40 to 44 Years | 47 (3.7%) | 77 (5.0%) |
| 45 to 49 Years | 20 (1.6%) | 67 (4.3%) |
| 50 to 54 Years | 67 (5.2%) | 43 (2.8%) |
| 55 to 59 Years | 85 (6.6%) | 101 (6.5%) |
| 60 to 64 Years | 143 (11.1%) | 118 (7.6%) |
| 65 to 69 Years | 35 (2.7%) | 73 (4.7%) |
| 70 to 74 Years | 110 (8.6%) | 132 (8.5%) |
| 75 to 79 Years | 32 (2.5%) | 19 (1.2%) |
| 80 to 84 Years | 11 (0.9%) | 78 (5.0%) |
| 85 Years and over | 69 (5.4%) | 47 (3.0%) |
| Total | 1,284 (100.0%) | 1,548 (100.0%) |
Families and Households in Mondovi
Median Family Size in Mondovi
The median family size in Mondovi is 2.71 persons per family, with married-couple families (593 | 72.6%) accounting for the largest median family size of 2.85 persons per family. On the other hand, single female/mother families (208 | 25.5%) represent the smallest median family size with 2.34 persons per family.
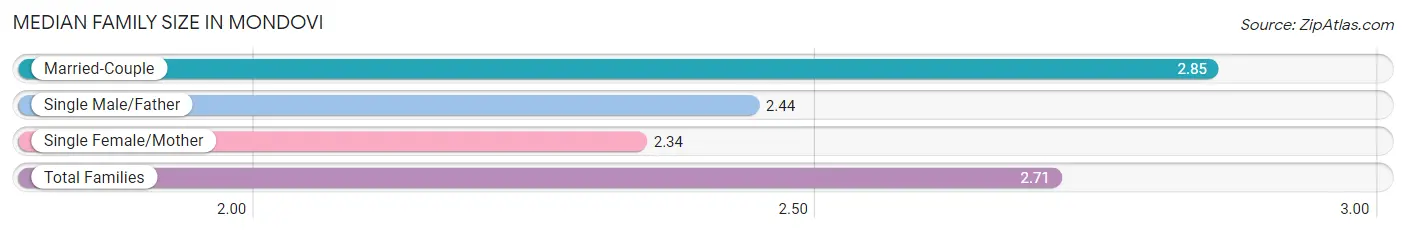
| Family Type | # Families | Family Size |
| Married-Couple | 593 (72.6%) | 2.85 |
| Single Male/Father | 16 (2.0%) | 2.44 |
| Single Female/Mother | 208 (25.5%) | 2.34 |
| Total Families | 817 (100.0%) | 2.71 |
Median Household Size in Mondovi
The median household size in Mondovi is 2.18 persons per household, with single male/father households (16 | 1.3%) accounting for the largest median household size of 4.06 persons per household. non-family households (445 | 35.3%) represent the smallest median household size with 1.04 persons per household.
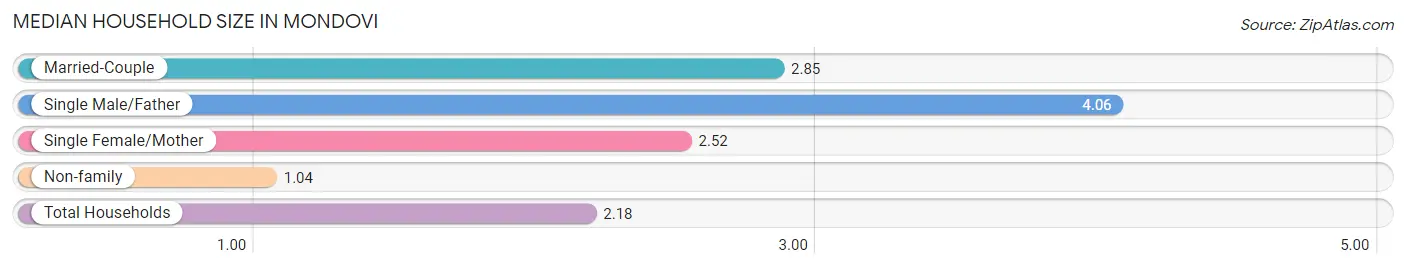
| Household Type | # Households | Household Size |
| Married-Couple | 593 (47.0%) | 2.85 |
| Single Male/Father | 16 (1.3%) | 4.06 |
| Single Female/Mother | 208 (16.5%) | 2.52 |
| Non-family | 445 (35.3%) | 1.04 |
| Total Households | 1,262 (100.0%) | 2.18 |
Household Size by Marriage Status in Mondovi
Out of a total of 1,262 households in Mondovi, 817 (64.7%) are family households, while 445 (35.3%) are nonfamily households. The most numerous type of family households are 2-person households, comprising 500, and the most common type of nonfamily households are 1-person households, comprising 422.
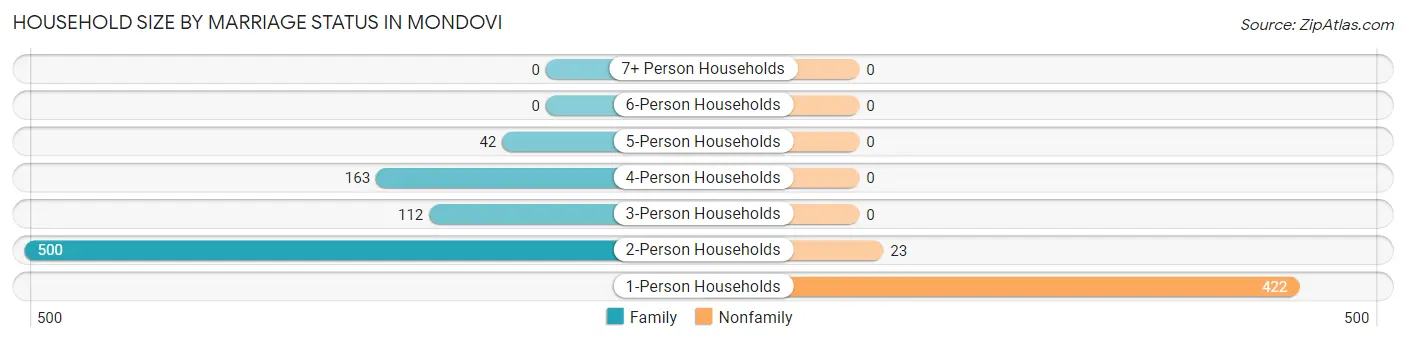
| Household Size | Family Households | Nonfamily Households |
| 1-Person Households | - | 422 (33.4%) |
| 2-Person Households | 500 (39.6%) | 23 (1.8%) |
| 3-Person Households | 112 (8.9%) | 0 (0.0%) |
| 4-Person Households | 163 (12.9%) | 0 (0.0%) |
| 5-Person Households | 42 (3.3%) | 0 (0.0%) |
| 6-Person Households | 0 (0.0%) | 0 (0.0%) |
| 7+ Person Households | 0 (0.0%) | 0 (0.0%) |
| Total | 817 (64.7%) | 445 (35.3%) |
Female Fertility in Mondovi
Fertility by Age in Mondovi
Average fertility rate in Mondovi is 30.0 births per 1,000 women. Women in the age bracket of 20 to 34 years have the highest fertility rate with 60.0 births per 1,000 women. Women in the age bracket of 20 to 34 years acount for 66.7% of all women with births.
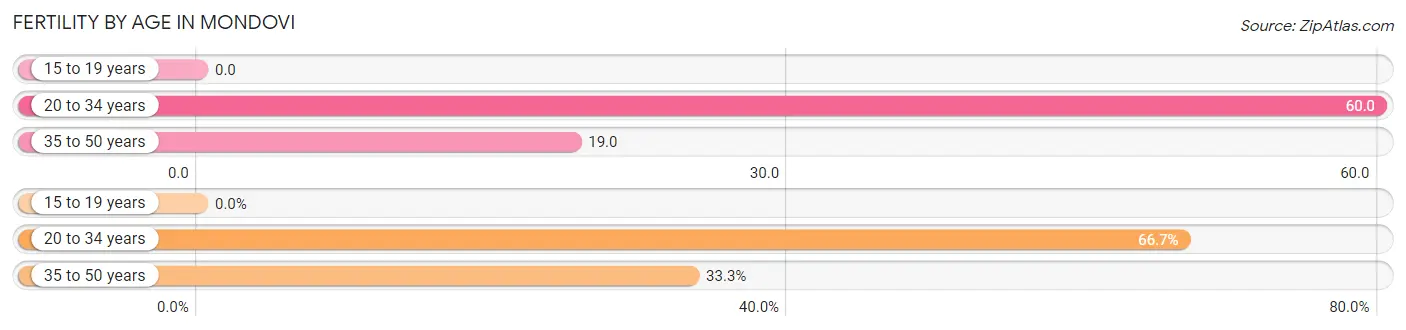
| Age Bracket | Women with Births | Births / 1,000 Women |
| 15 to 19 years | 0 (0.0%) | 0.0 |
| 20 to 34 years | 12 (66.7%) | 60.0 |
| 35 to 50 years | 6 (33.3%) | 19.0 |
| Total | 18 (100.0%) | 30.0 |
Fertility by Age by Marriage Status in Mondovi
66.7% of women with births (18) in Mondovi are married. The highest percentage of unmarried women with births falls into 35 to 50 years age bracket with 100.0% of them unmarried at the time of birth, while the lowest percentage of unmarried women with births belong to 20 to 34 years age bracket with 0.0% of them unmarried.
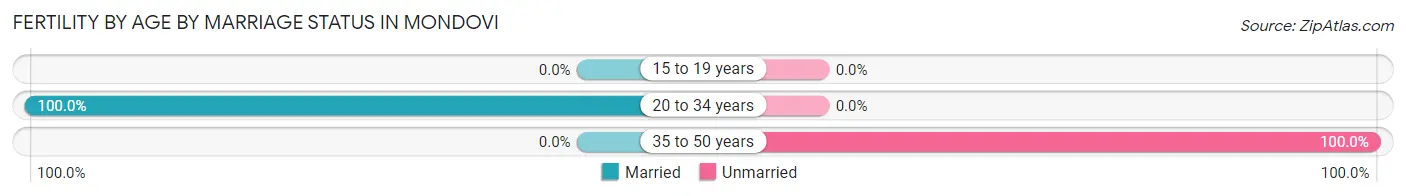
| Age Bracket | Married | Unmarried |
| 15 to 19 years | 0 (0.0%) | 0 (0.0%) |
| 20 to 34 years | 12 (100.0%) | 0 (0.0%) |
| 35 to 50 years | 0 (0.0%) | 6 (100.0%) |
| Total | 12 (66.7%) | 6 (33.3%) |
Fertility by Education in Mondovi
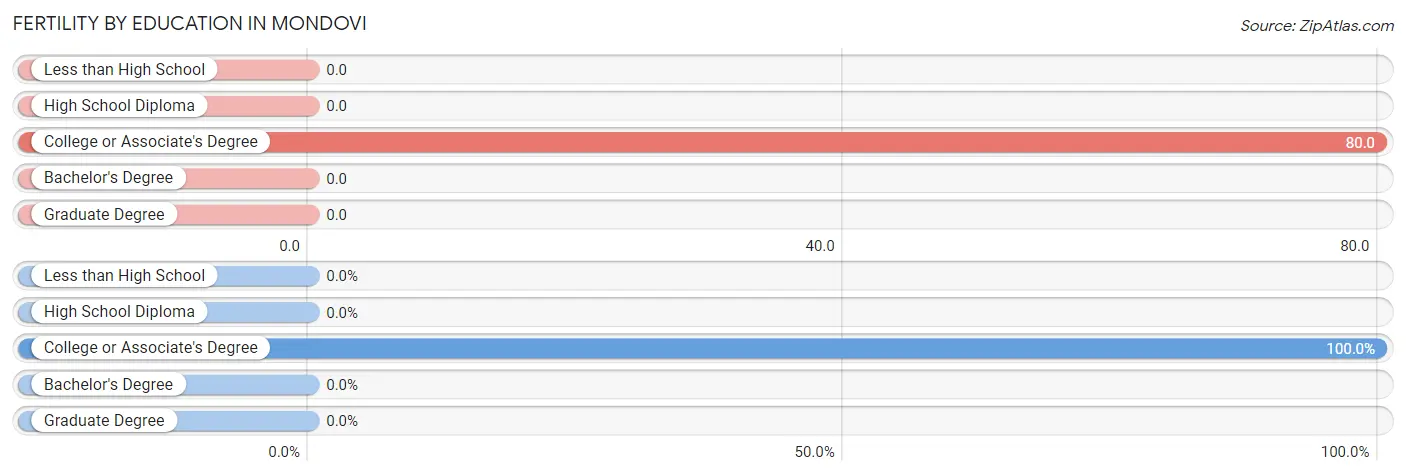
| Educational Attainment | Women with Births | Births / 1,000 Women |
| Less than High School | 0 (0.0%) | 0.0 |
| High School Diploma | 0 (0.0%) | 0.0 |
| College or Associate's Degree | 18 (100.0%) | 80.0 |
| Bachelor's Degree | 0 (0.0%) | 0.0 |
| Graduate Degree | 0 (0.0%) | 0.0 |
| Total | 18 (100.0%) | 30.0 |
Fertility by Education by Marriage Status in Mondovi
33.3% of women with births in Mondovi are unmarried. Women with the educational attainment of college or associate's degree are most likely to be married with 66.7% of them married at childbirth, while women with the educational attainment of college or associate's degree are least likely to be married with 33.3% of them unmarried at childbirth.
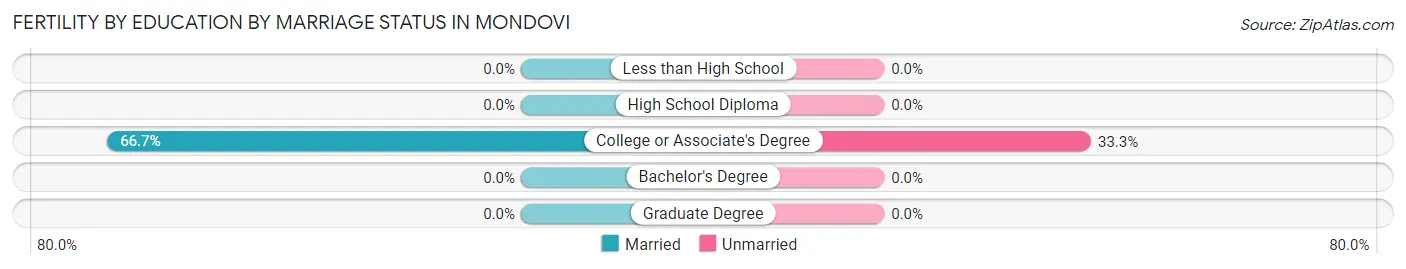
| Educational Attainment | Married | Unmarried |
| Less than High School | 0 (0.0%) | 0 (0.0%) |
| High School Diploma | 0 (0.0%) | 0 (0.0%) |
| College or Associate's Degree | 12 (66.7%) | 6 (33.3%) |
| Bachelor's Degree | 0 (0.0%) | 0 (0.0%) |
| Graduate Degree | 0 (0.0%) | 0 (0.0%) |
| Total | 12 (66.7%) | 6 (33.3%) |
Employment Characteristics in Mondovi
Employment by Class of Employer in Mondovi
Among the 1,333 employed individuals in Mondovi, private company employees (1,008 | 75.6%), not-for-profit organizations (119 | 8.9%), and local government employees (76 | 5.7%) make up the most common classes of employment.
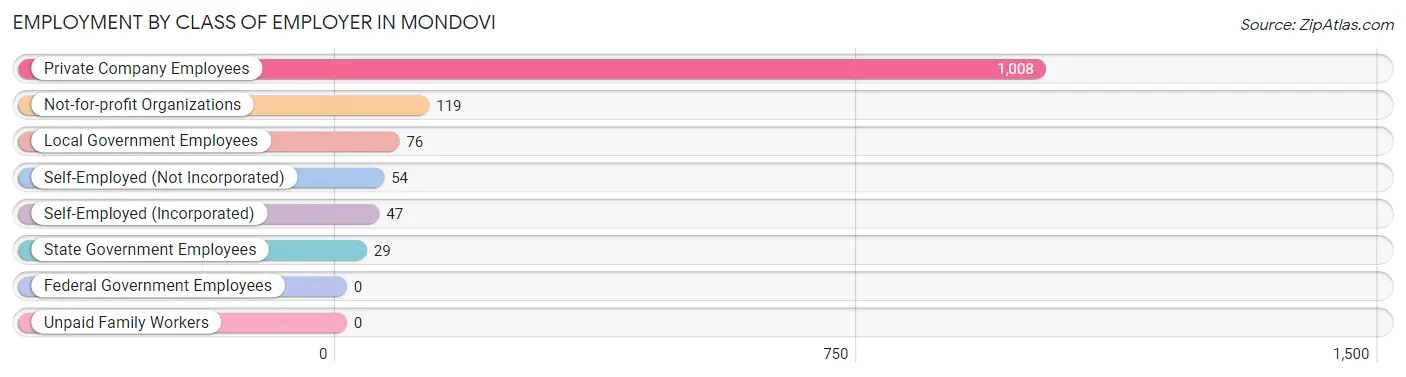
| Employer Class | # Employees | % Employees |
| Private Company Employees | 1,008 | 75.6% |
| Self-Employed (Incorporated) | 47 | 3.5% |
| Self-Employed (Not Incorporated) | 54 | 4.1% |
| Not-for-profit Organizations | 119 | 8.9% |
| Local Government Employees | 76 | 5.7% |
| State Government Employees | 29 | 2.2% |
| Federal Government Employees | 0 | 0.0% |
| Unpaid Family Workers | 0 | 0.0% |
| Total | 1,333 | 100.0% |
Employment Status by Age in Mondovi
According to the labor force statistics for Mondovi, out of the total population over 16 years of age (2,262), 62.6% or 1,416 individuals are in the labor force, with 2.5% or 35 of them unemployed. The age group with the highest labor force participation rate is 20 to 24 years, with 100.0% or 115 individuals in the labor force. Within the labor force, the 16 to 19 years age range has the highest percentage of unemployed individuals, with 45.5% or 30 of them being unemployed.
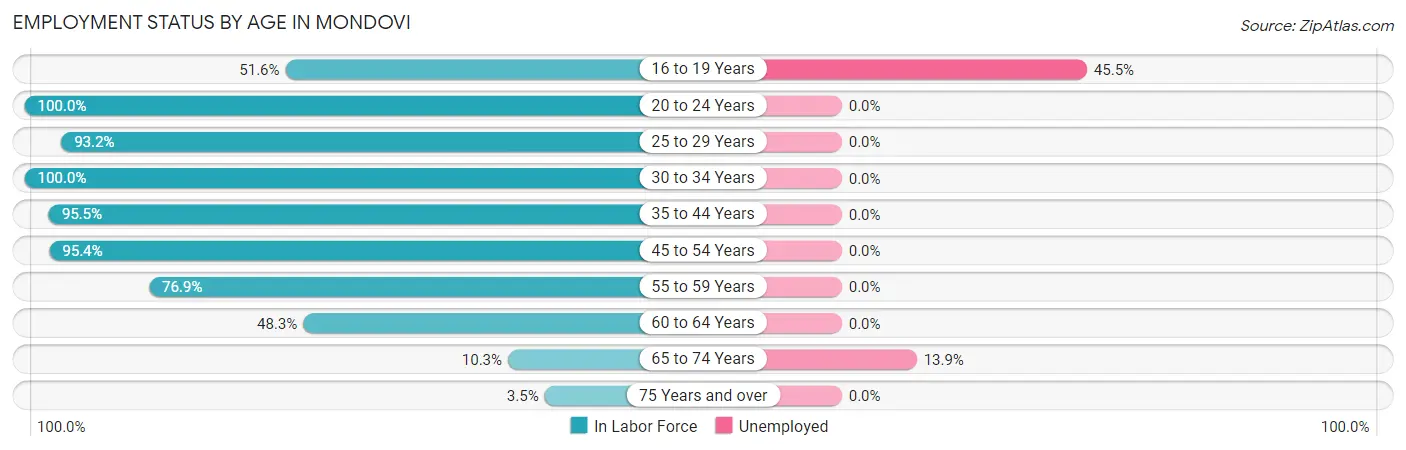
| Age Bracket | In Labor Force | Unemployed |
| 16 to 19 Years | 66 (51.6%) | 30 (45.5%) |
| 20 to 24 Years | 115 (100.0%) | 0 (0.0%) |
| 25 to 29 Years | 191 (93.2%) | 0 (0.0%) |
| 30 to 34 Years | 98 (100.0%) | 0 (0.0%) |
| 35 to 44 Years | 445 (95.5%) | 0 (0.0%) |
| 45 to 54 Years | 188 (95.4%) | 0 (0.0%) |
| 55 to 59 Years | 143 (76.9%) | 0 (0.0%) |
| 60 to 64 Years | 126 (48.3%) | 0 (0.0%) |
| 65 to 74 Years | 36 (10.3%) | 5 (13.9%) |
| 75 Years and over | 9 (3.5%) | 0 (0.0%) |
| Total | 1,416 (62.6%) | 35 (2.5%) |
Employment Status by Educational Attainment in Mondovi
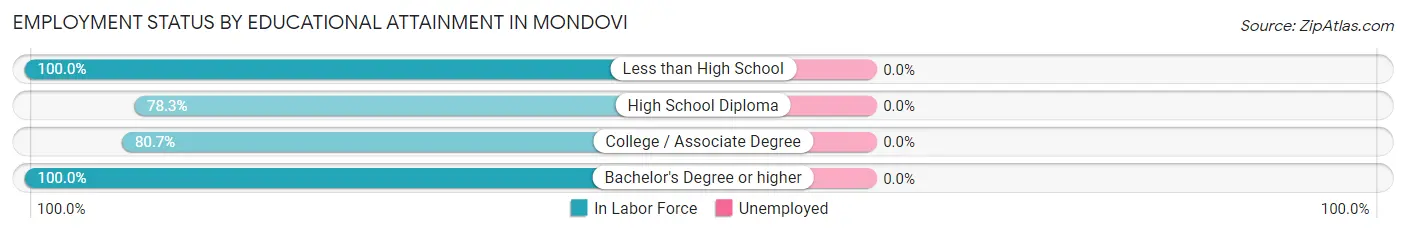
| Educational Attainment | In Labor Force | Unemployed |
| Less than High School | 118 (100.0%) | 0 (0.0%) |
| High School Diploma | 537 (78.3%) | 0 (0.0%) |
| College / Associate Degree | 305 (80.7%) | 0 (0.0%) |
| Bachelor's Degree or higher | 231 (100.0%) | 0 (0.0%) |
| Total | 1,191 (84.3%) | 0 (0.0%) |
Employment Occupations by Sex in Mondovi
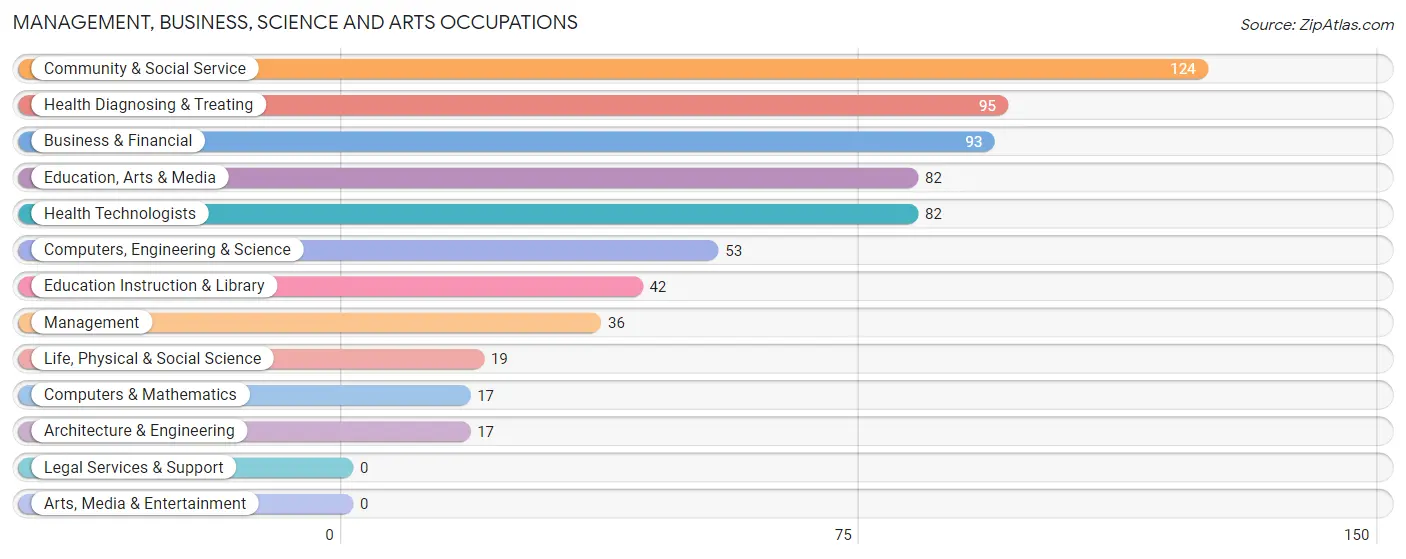
Management, Business, Science and Arts Occupations
The most common Management, Business, Science and Arts occupations in Mondovi are Community & Social Service (124 | 9.0%), Health Diagnosing & Treating (95 | 6.9%), Business & Financial (93 | 6.7%), Education, Arts & Media (82 | 5.9%), and Health Technologists (82 | 5.9%).
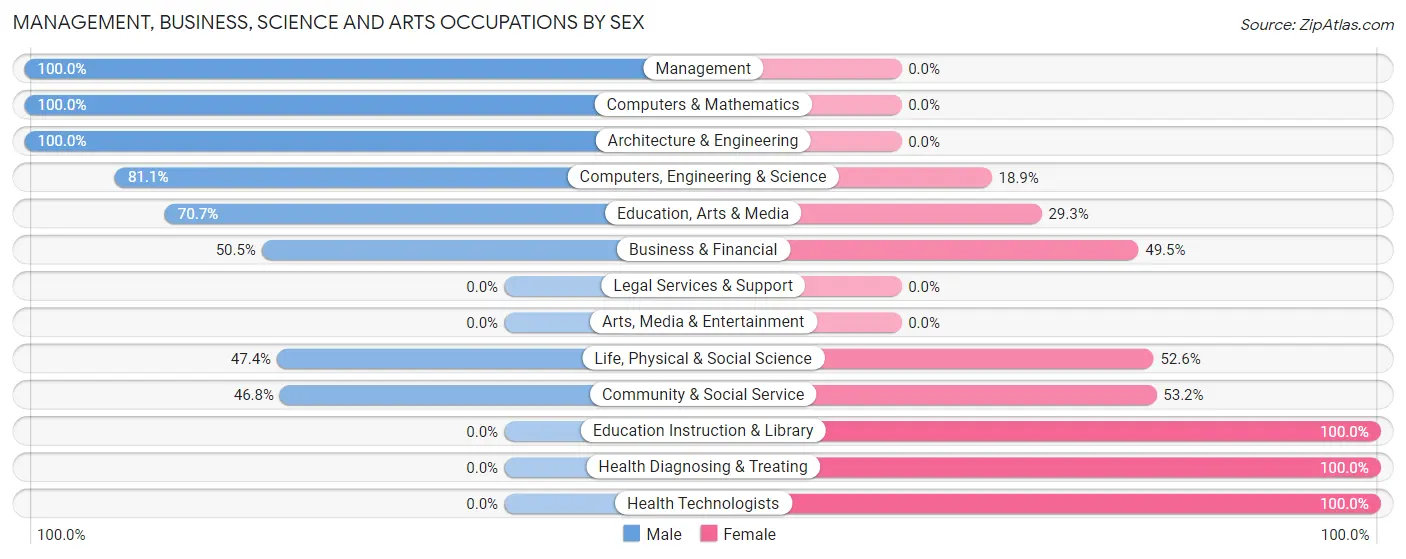
Management, Business, Science and Arts Occupations by Sex
Within the Management, Business, Science and Arts occupations in Mondovi, the most male-oriented occupations are Management (100.0%), Computers & Mathematics (100.0%), and Architecture & Engineering (100.0%), while the most female-oriented occupations are Education Instruction & Library (100.0%), Health Diagnosing & Treating (100.0%), and Health Technologists (100.0%).
| Occupation | Male | Female |
| Management | 36 (100.0%) | 0 (0.0%) |
| Business & Financial | 47 (50.5%) | 46 (49.5%) |
| Computers, Engineering & Science | 43 (81.1%) | 10 (18.9%) |
| Computers & Mathematics | 17 (100.0%) | 0 (0.0%) |
| Architecture & Engineering | 17 (100.0%) | 0 (0.0%) |
| Life, Physical & Social Science | 9 (47.4%) | 10 (52.6%) |
| Community & Social Service | 58 (46.8%) | 66 (53.2%) |
| Education, Arts & Media | 58 (70.7%) | 24 (29.3%) |
| Legal Services & Support | 0 (0.0%) | 0 (0.0%) |
| Education Instruction & Library | 0 (0.0%) | 42 (100.0%) |
| Arts, Media & Entertainment | 0 (0.0%) | 0 (0.0%) |
| Health Diagnosing & Treating | 0 (0.0%) | 95 (100.0%) |
| Health Technologists | 0 (0.0%) | 82 (100.0%) |
| Total (Category) | 184 (45.9%) | 217 (54.1%) |
| Total (Overall) | 681 (49.3%) | 701 (50.7%) |
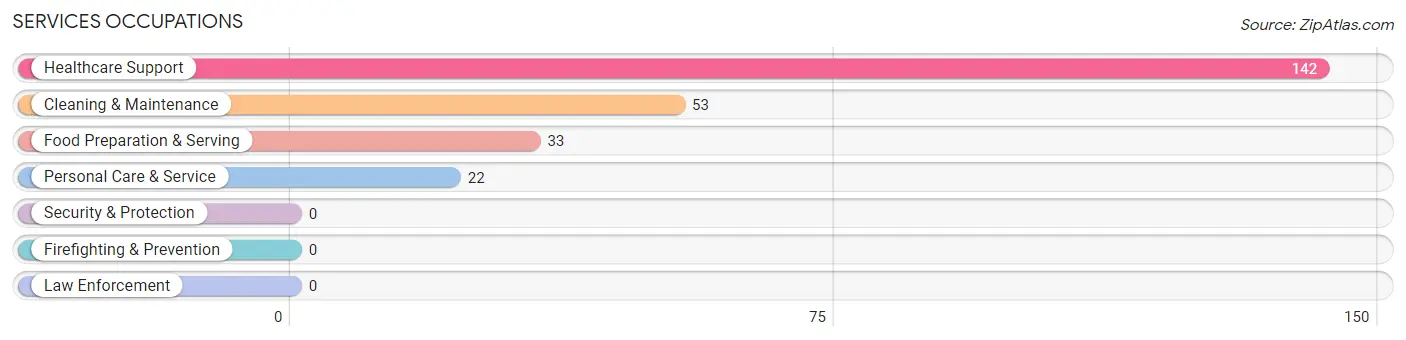
Services Occupations
The most common Services occupations in Mondovi are Healthcare Support (142 | 10.3%), Cleaning & Maintenance (53 | 3.8%), Food Preparation & Serving (33 | 2.4%), and Personal Care & Service (22 | 1.6%).
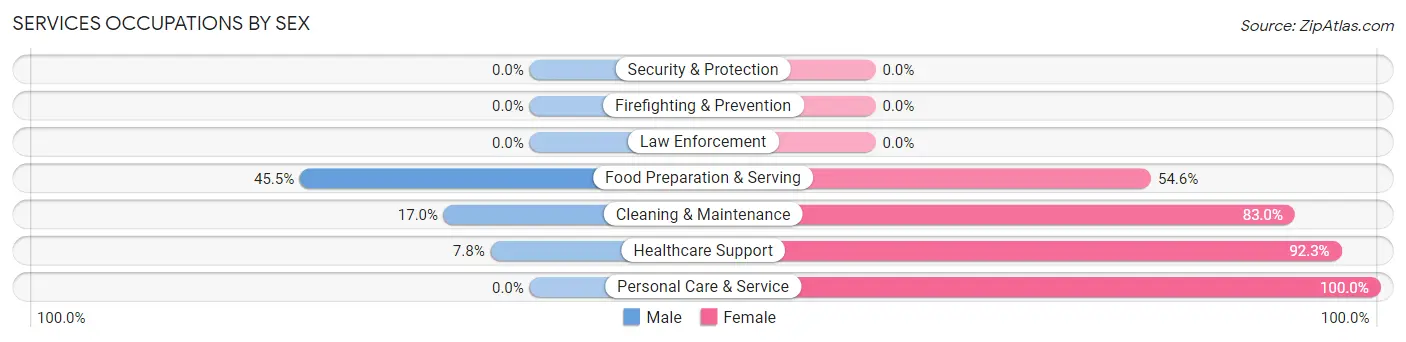
Services Occupations by Sex
Within the Services occupations in Mondovi, the most male-oriented occupations are Food Preparation & Serving (45.5%), Cleaning & Maintenance (17.0%), and Healthcare Support (7.7%), while the most female-oriented occupations are Personal Care & Service (100.0%), Healthcare Support (92.2%), and Cleaning & Maintenance (83.0%).
| Occupation | Male | Female |
| Healthcare Support | 11 (7.7%) | 131 (92.2%) |
| Security & Protection | 0 (0.0%) | 0 (0.0%) |
| Firefighting & Prevention | 0 (0.0%) | 0 (0.0%) |
| Law Enforcement | 0 (0.0%) | 0 (0.0%) |
| Food Preparation & Serving | 15 (45.5%) | 18 (54.5%) |
| Cleaning & Maintenance | 9 (17.0%) | 44 (83.0%) |
| Personal Care & Service | 0 (0.0%) | 22 (100.0%) |
| Total (Category) | 35 (14.0%) | 215 (86.0%) |
| Total (Overall) | 681 (49.3%) | 701 (50.7%) |
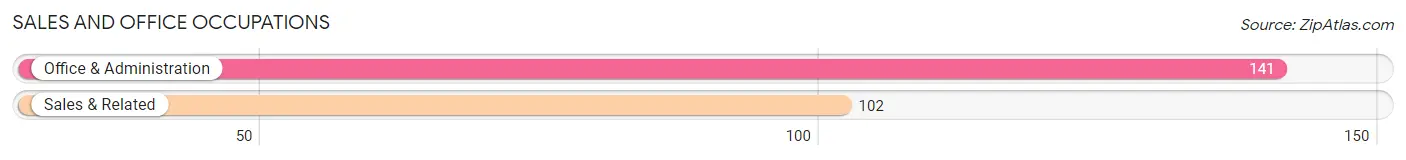
Sales and Office Occupations
The most common Sales and Office occupations in Mondovi are Office & Administration (141 | 10.2%), and Sales & Related (102 | 7.4%).
Sales and Office Occupations by Sex
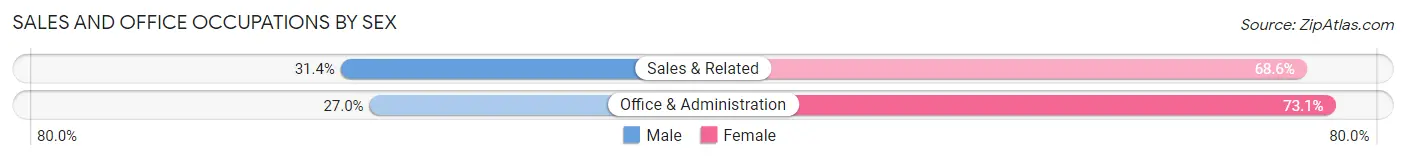
| Occupation | Male | Female |
| Sales & Related | 32 (31.4%) | 70 (68.6%) |
| Office & Administration | 38 (27.0%) | 103 (73.1%) |
| Total (Category) | 70 (28.8%) | 173 (71.2%) |
| Total (Overall) | 681 (49.3%) | 701 (50.7%) |
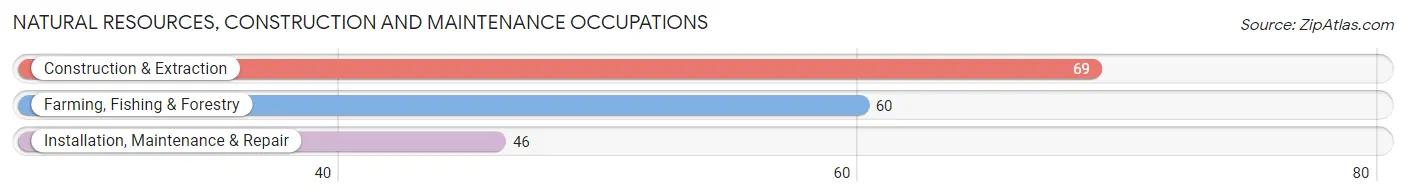
Natural Resources, Construction and Maintenance Occupations
The most common Natural Resources, Construction and Maintenance occupations in Mondovi are Construction & Extraction (69 | 5.0%), Farming, Fishing & Forestry (60 | 4.3%), and Installation, Maintenance & Repair (46 | 3.3%).
Natural Resources, Construction and Maintenance Occupations by Sex
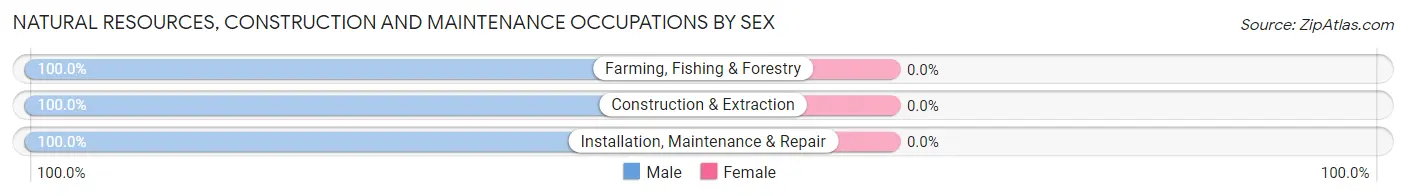
| Occupation | Male | Female |
| Farming, Fishing & Forestry | 60 (100.0%) | 0 (0.0%) |
| Construction & Extraction | 69 (100.0%) | 0 (0.0%) |
| Installation, Maintenance & Repair | 46 (100.0%) | 0 (0.0%) |
| Total (Category) | 175 (100.0%) | 0 (0.0%) |
| Total (Overall) | 681 (49.3%) | 701 (50.7%) |
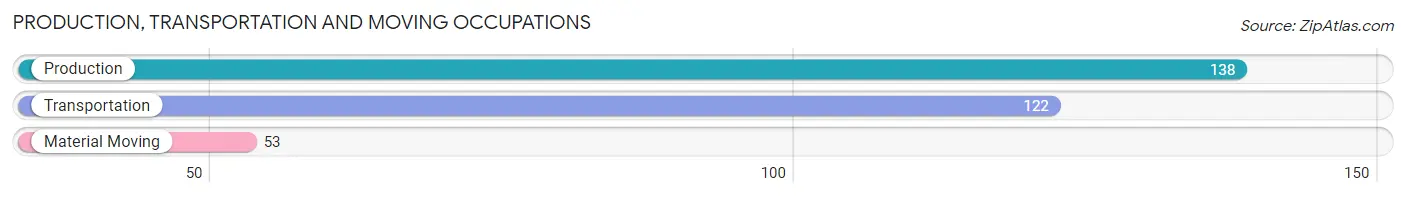
Production, Transportation and Moving Occupations
The most common Production, Transportation and Moving occupations in Mondovi are Production (138 | 10.0%), Transportation (122 | 8.8%), and Material Moving (53 | 3.8%).
Production, Transportation and Moving Occupations by Sex
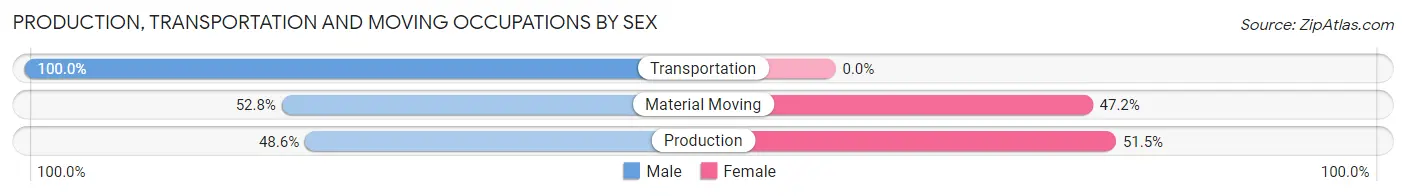
| Occupation | Male | Female |
| Production | 67 (48.5%) | 71 (51.4%) |
| Transportation | 122 (100.0%) | 0 (0.0%) |
| Material Moving | 28 (52.8%) | 25 (47.2%) |
| Total (Category) | 217 (69.3%) | 96 (30.7%) |
| Total (Overall) | 681 (49.3%) | 701 (50.7%) |
Employment Industries by Sex in Mondovi
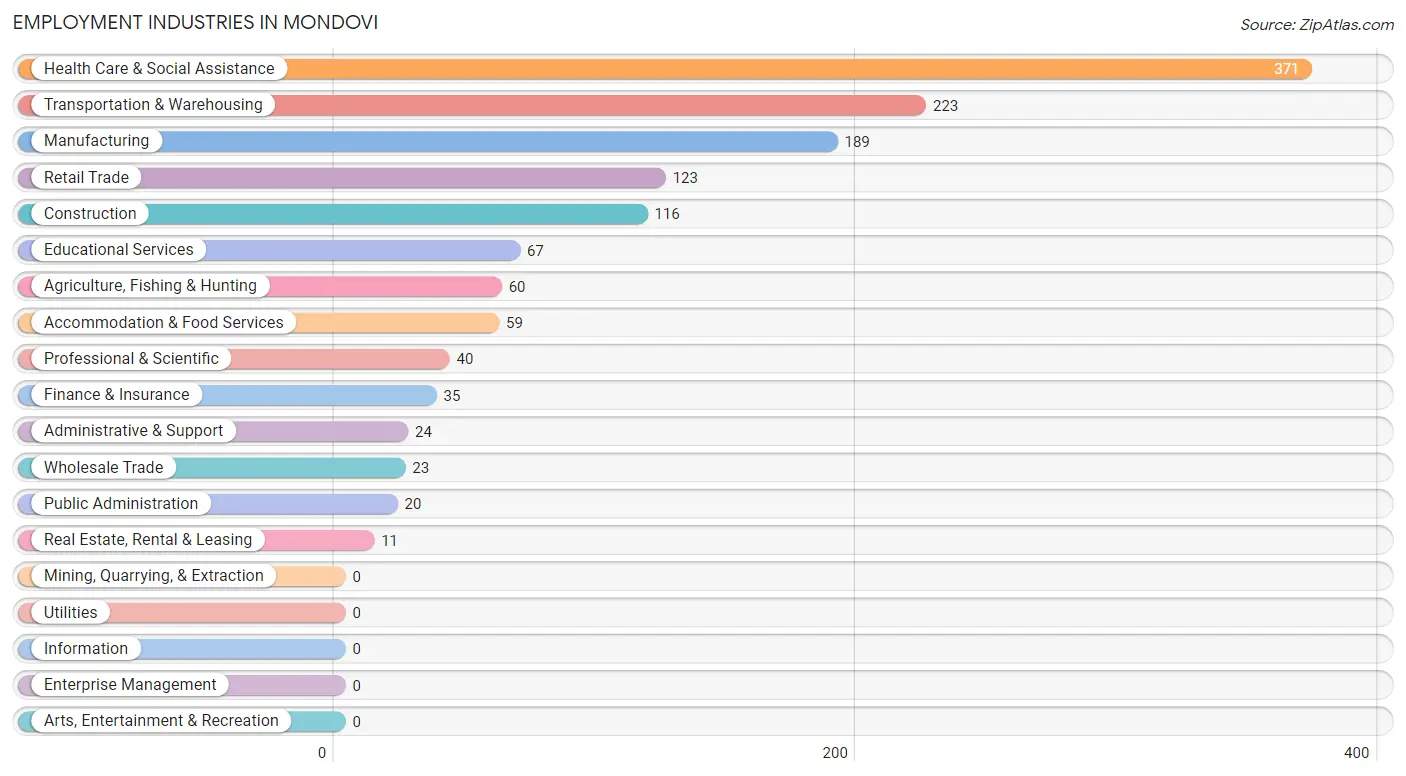
Employment Industries in Mondovi
The major employment industries in Mondovi include Health Care & Social Assistance (371 | 26.9%), Transportation & Warehousing (223 | 16.1%), Manufacturing (189 | 13.7%), Retail Trade (123 | 8.9%), and Construction (116 | 8.4%).
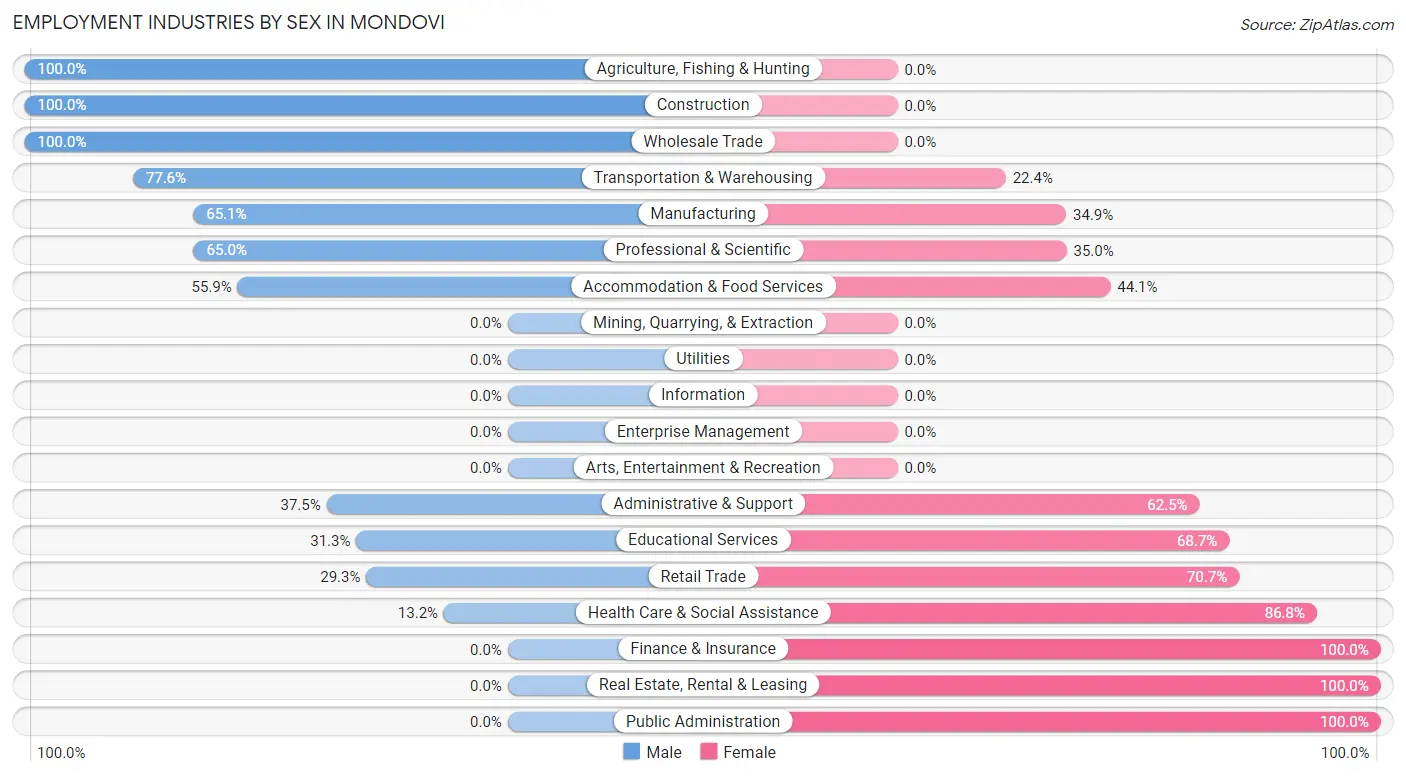
Employment Industries by Sex in Mondovi
The Mondovi industries that see more men than women are Agriculture, Fishing & Hunting (100.0%), Construction (100.0%), and Wholesale Trade (100.0%), whereas the industries that tend to have a higher number of women are Finance & Insurance (100.0%), Real Estate, Rental & Leasing (100.0%), and Public Administration (100.0%).
| Industry | Male | Female |
| Agriculture, Fishing & Hunting | 60 (100.0%) | 0 (0.0%) |
| Mining, Quarrying, & Extraction | 0 (0.0%) | 0 (0.0%) |
| Construction | 116 (100.0%) | 0 (0.0%) |
| Manufacturing | 123 (65.1%) | 66 (34.9%) |
| Wholesale Trade | 23 (100.0%) | 0 (0.0%) |
| Retail Trade | 36 (29.3%) | 87 (70.7%) |
| Transportation & Warehousing | 173 (77.6%) | 50 (22.4%) |
| Utilities | 0 (0.0%) | 0 (0.0%) |
| Information | 0 (0.0%) | 0 (0.0%) |
| Finance & Insurance | 0 (0.0%) | 35 (100.0%) |
| Real Estate, Rental & Leasing | 0 (0.0%) | 11 (100.0%) |
| Professional & Scientific | 26 (65.0%) | 14 (35.0%) |
| Enterprise Management | 0 (0.0%) | 0 (0.0%) |
| Administrative & Support | 9 (37.5%) | 15 (62.5%) |
| Educational Services | 21 (31.3%) | 46 (68.7%) |
| Health Care & Social Assistance | 49 (13.2%) | 322 (86.8%) |
| Arts, Entertainment & Recreation | 0 (0.0%) | 0 (0.0%) |
| Accommodation & Food Services | 33 (55.9%) | 26 (44.1%) |
| Public Administration | 0 (0.0%) | 20 (100.0%) |
| Total | 681 (49.3%) | 701 (50.7%) |
Education in Mondovi
School Enrollment in Mondovi
The most common levels of schooling among the 622 students in Mondovi are middle school (182 | 29.3%), elementary school (141 | 22.7%), and college / undergraduate (103 | 16.6%).
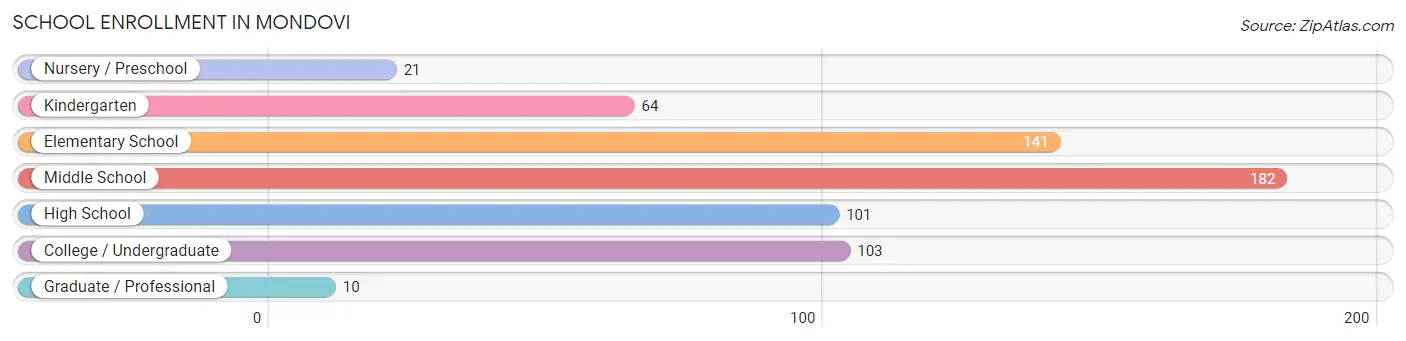
| School Level | # Students | % Students |
| Nursery / Preschool | 21 | 3.4% |
| Kindergarten | 64 | 10.3% |
| Elementary School | 141 | 22.7% |
| Middle School | 182 | 29.3% |
| High School | 101 | 16.2% |
| College / Undergraduate | 103 | 16.6% |
| Graduate / Professional | 10 | 1.6% |
| Total | 622 | 100.0% |
School Enrollment by Age by Funding Source in Mondovi
Out of a total of 622 students who are enrolled in schools in Mondovi, 25 (4.0%) attend a private institution, while the remaining 597 (96.0%) are enrolled in public schools. The age group of 35 years and over has the highest likelihood of being enrolled in private schools, with 8 (100.0% in the age bracket) enrolled. Conversely, the age group of 3 to 4 year olds has the lowest likelihood of being enrolled in a private school, with 21 (100.0% in the age bracket) attending a public institution.
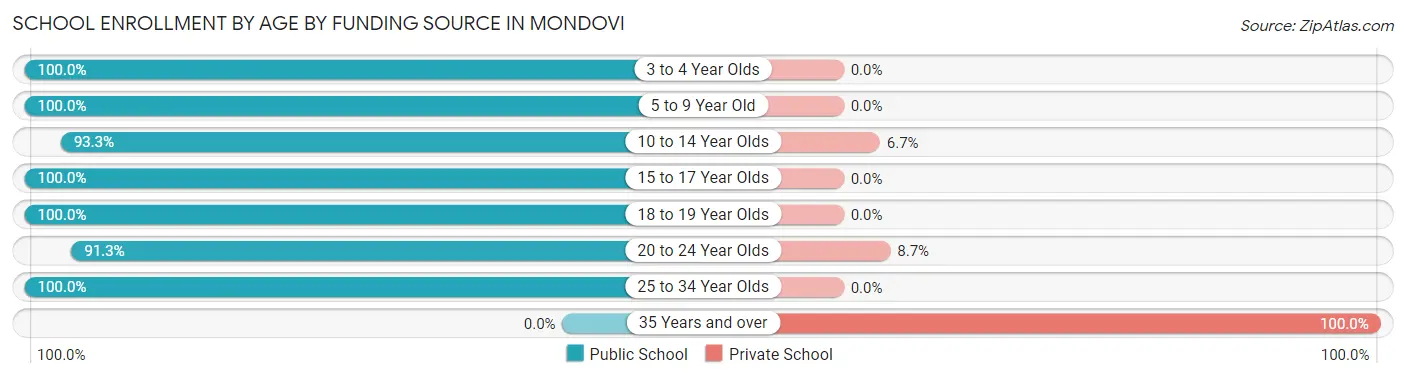
| Age Bracket | Public School | Private School |
| 3 to 4 Year Olds | 21 (100.0%) | 0 (0.0%) |
| 5 to 9 Year Old | 205 (100.0%) | 0 (0.0%) |
| 10 to 14 Year Olds | 180 (93.3%) | 13 (6.7%) |
| 15 to 17 Year Olds | 62 (100.0%) | 0 (0.0%) |
| 18 to 19 Year Olds | 46 (100.0%) | 0 (0.0%) |
| 20 to 24 Year Olds | 42 (91.3%) | 4 (8.7%) |
| 25 to 34 Year Olds | 41 (100.0%) | 0 (0.0%) |
| 35 Years and over | 0 (0.0%) | 8 (100.0%) |
| Total | 597 (96.0%) | 25 (4.0%) |
Educational Attainment by Field of Study in Mondovi
Education (116 | 32.8%), science & technology (90 | 25.4%), business (40 | 11.3%), social sciences (32 | 9.0%), and liberal arts & history (27 | 7.6%) are the most common fields of study among 354 individuals in Mondovi who have obtained a bachelor's degree or higher.
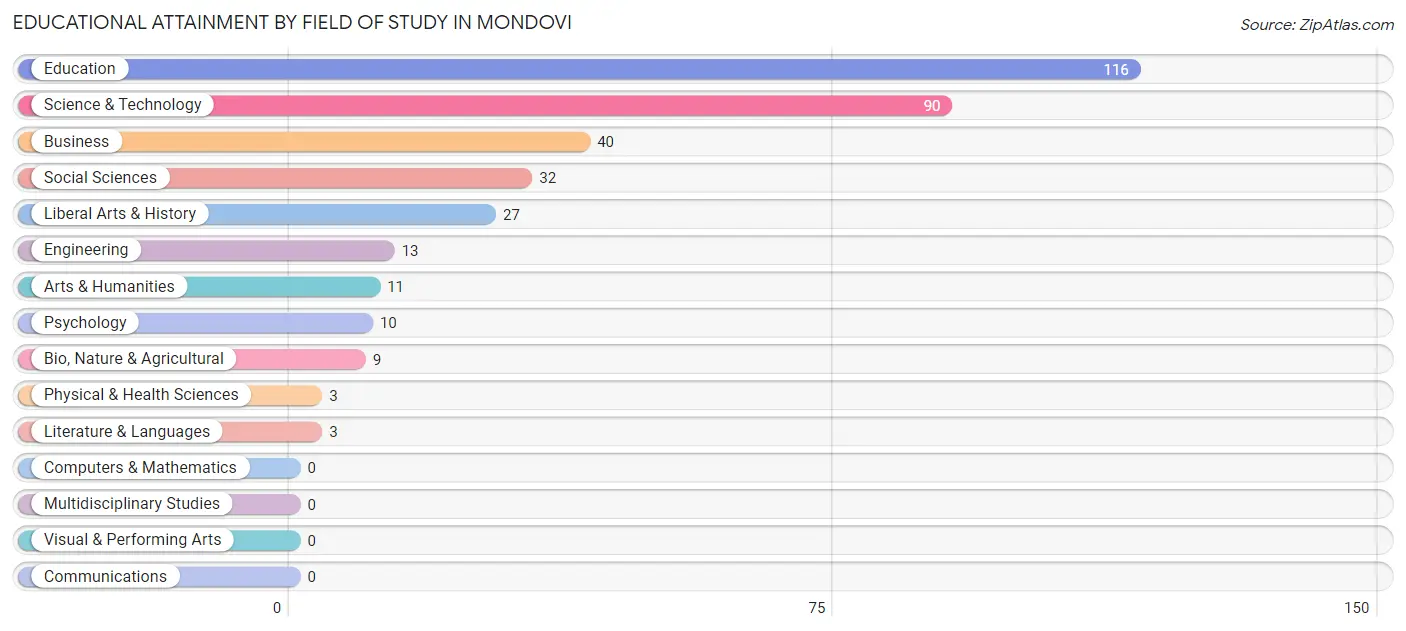
| Field of Study | # Graduates | % Graduates |
| Computers & Mathematics | 0 | 0.0% |
| Bio, Nature & Agricultural | 9 | 2.5% |
| Physical & Health Sciences | 3 | 0.9% |
| Psychology | 10 | 2.8% |
| Social Sciences | 32 | 9.0% |
| Engineering | 13 | 3.7% |
| Multidisciplinary Studies | 0 | 0.0% |
| Science & Technology | 90 | 25.4% |
| Business | 40 | 11.3% |
| Education | 116 | 32.8% |
| Literature & Languages | 3 | 0.9% |
| Liberal Arts & History | 27 | 7.6% |
| Visual & Performing Arts | 0 | 0.0% |
| Communications | 0 | 0.0% |
| Arts & Humanities | 11 | 3.1% |
| Total | 354 | 100.0% |
Transportation & Commute in Mondovi
Vehicle Availability by Sex in Mondovi
The most prevalent vehicle ownership categories in Mondovi are males with 2 vehicles (304, accounting for 47.5%) and females with 2 vehicles (225, making up 45.7%).
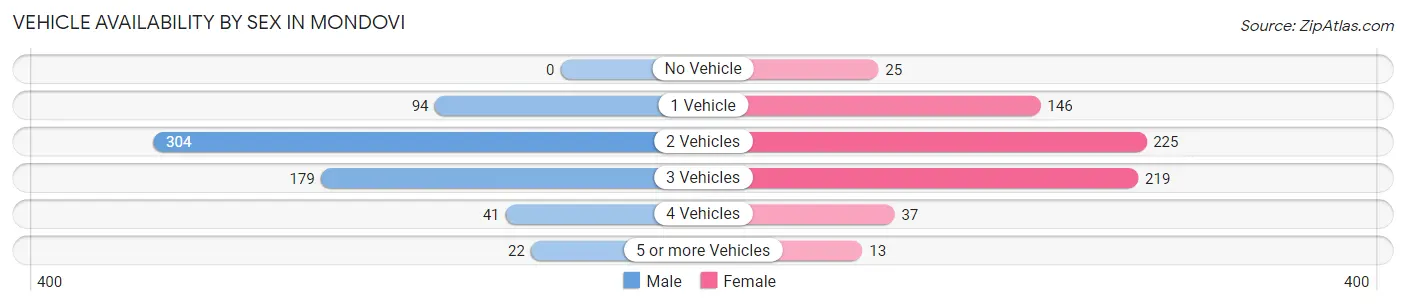
| Vehicles Available | Male | Female |
| No Vehicle | 0 (0.0%) | 25 (3.8%) |
| 1 Vehicle | 94 (14.7%) | 146 (22.0%) |
| 2 Vehicles | 304 (47.5%) | 225 (33.8%) |
| 3 Vehicles | 179 (28.0%) | 219 (32.9%) |
| 4 Vehicles | 41 (6.4%) | 37 (5.6%) |
| 5 or more Vehicles | 22 (3.4%) | 13 (1.9%) |
| Total | 640 (100.0%) | 665 (100.0%) |
Commute Time in Mondovi
The most frequently occuring commute durations in Mondovi are less than 5 minutes (336 commuters, 26.7%), 45 to 59 minutes (169 commuters, 13.4%), and 5 to 9 minutes (124 commuters, 9.8%).
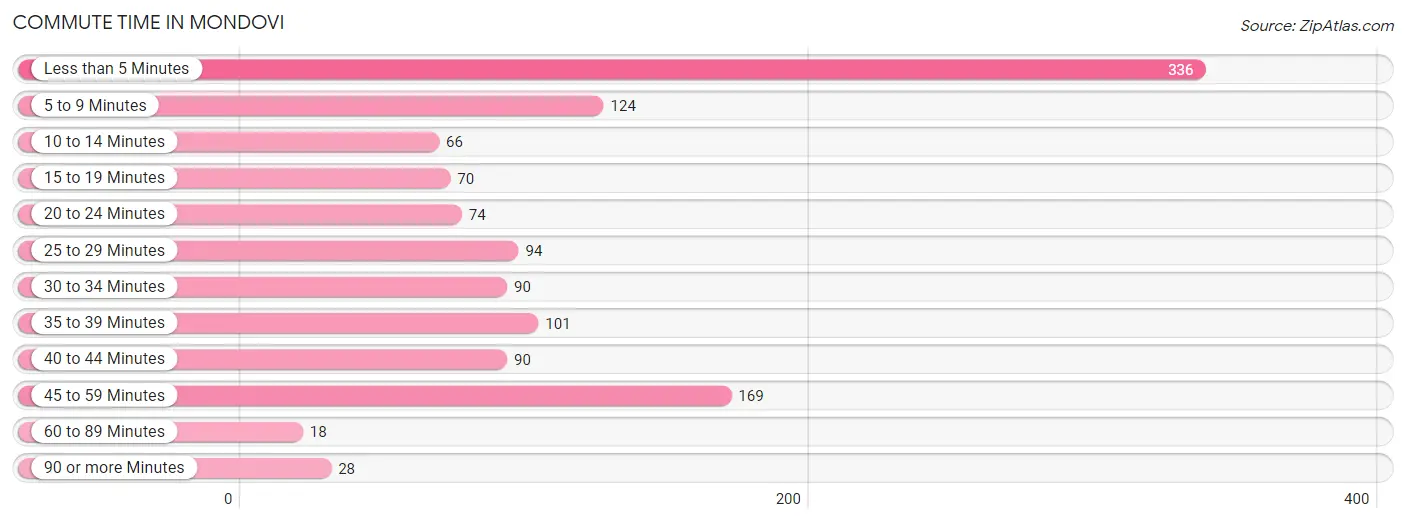
| Commute Time | # Commuters | % Commuters |
| Less than 5 Minutes | 336 | 26.7% |
| 5 to 9 Minutes | 124 | 9.8% |
| 10 to 14 Minutes | 66 | 5.2% |
| 15 to 19 Minutes | 70 | 5.6% |
| 20 to 24 Minutes | 74 | 5.9% |
| 25 to 29 Minutes | 94 | 7.5% |
| 30 to 34 Minutes | 90 | 7.1% |
| 35 to 39 Minutes | 101 | 8.0% |
| 40 to 44 Minutes | 90 | 7.1% |
| 45 to 59 Minutes | 169 | 13.4% |
| 60 to 89 Minutes | 18 | 1.4% |
| 90 or more Minutes | 28 | 2.2% |
Commute Time by Sex in Mondovi
The most common commute times in Mondovi are less than 5 minutes (177 commuters, 27.7%) for males and less than 5 minutes (159 commuters, 25.7%) for females.
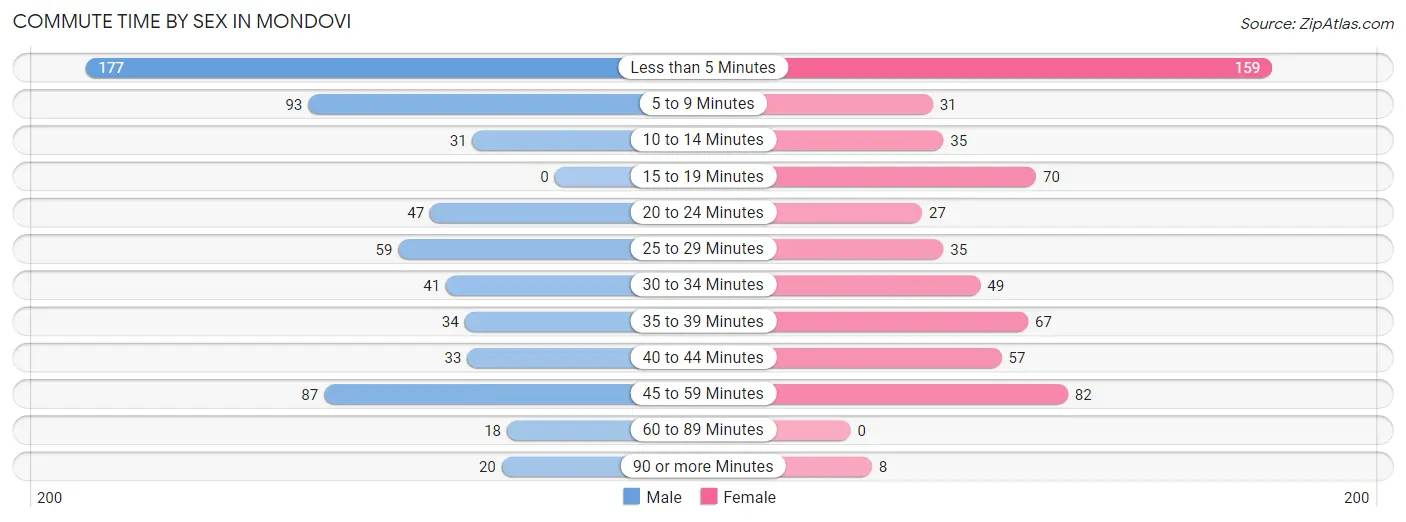
| Commute Time | Male | Female |
| Less than 5 Minutes | 177 (27.7%) | 159 (25.7%) |
| 5 to 9 Minutes | 93 (14.5%) | 31 (5.0%) |
| 10 to 14 Minutes | 31 (4.8%) | 35 (5.7%) |
| 15 to 19 Minutes | 0 (0.0%) | 70 (11.3%) |
| 20 to 24 Minutes | 47 (7.3%) | 27 (4.3%) |
| 25 to 29 Minutes | 59 (9.2%) | 35 (5.7%) |
| 30 to 34 Minutes | 41 (6.4%) | 49 (7.9%) |
| 35 to 39 Minutes | 34 (5.3%) | 67 (10.8%) |
| 40 to 44 Minutes | 33 (5.2%) | 57 (9.2%) |
| 45 to 59 Minutes | 87 (13.6%) | 82 (13.2%) |
| 60 to 89 Minutes | 18 (2.8%) | 0 (0.0%) |
| 90 or more Minutes | 20 (3.1%) | 8 (1.3%) |
Time of Departure to Work by Sex in Mondovi
The most frequent times of departure to work in Mondovi are 7:30 AM to 7:59 AM (152, 23.7%) for males and 12:00 PM to 3:59 PM (104, 16.8%) for females.
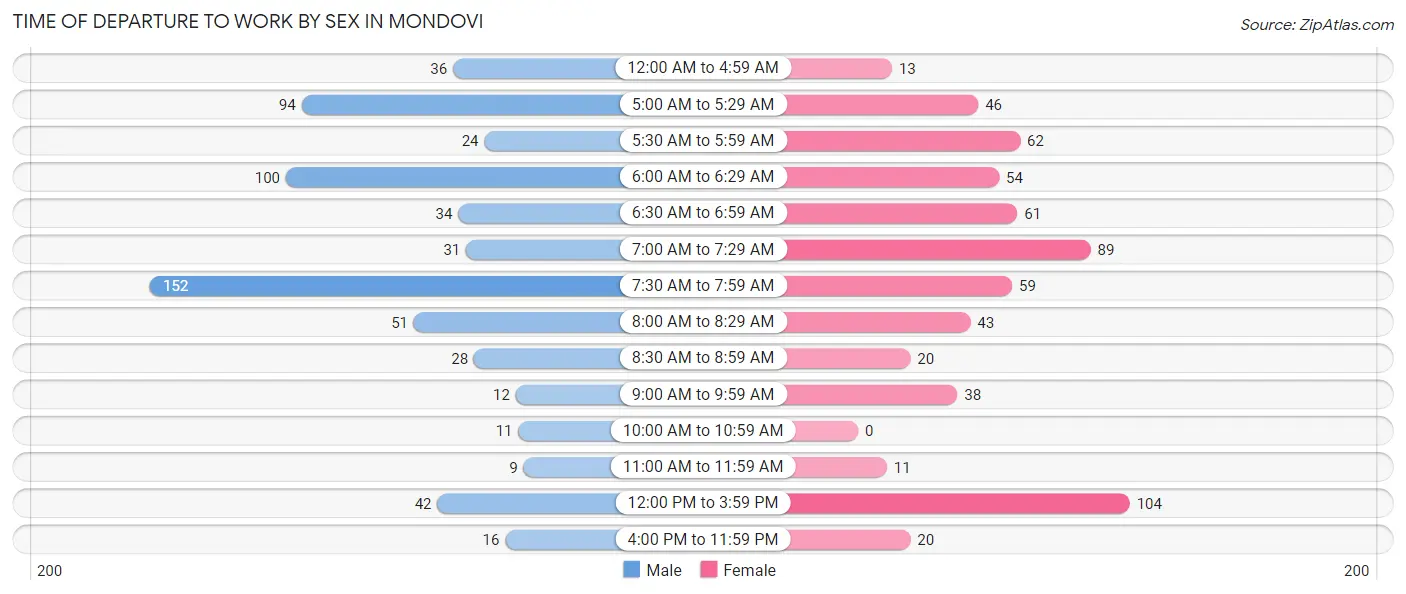
| Time of Departure | Male | Female |
| 12:00 AM to 4:59 AM | 36 (5.6%) | 13 (2.1%) |
| 5:00 AM to 5:29 AM | 94 (14.7%) | 46 (7.4%) |
| 5:30 AM to 5:59 AM | 24 (3.7%) | 62 (10.0%) |
| 6:00 AM to 6:29 AM | 100 (15.6%) | 54 (8.7%) |
| 6:30 AM to 6:59 AM | 34 (5.3%) | 61 (9.8%) |
| 7:00 AM to 7:29 AM | 31 (4.8%) | 89 (14.3%) |
| 7:30 AM to 7:59 AM | 152 (23.7%) | 59 (9.5%) |
| 8:00 AM to 8:29 AM | 51 (8.0%) | 43 (6.9%) |
| 8:30 AM to 8:59 AM | 28 (4.4%) | 20 (3.2%) |
| 9:00 AM to 9:59 AM | 12 (1.9%) | 38 (6.1%) |
| 10:00 AM to 10:59 AM | 11 (1.7%) | 0 (0.0%) |
| 11:00 AM to 11:59 AM | 9 (1.4%) | 11 (1.8%) |
| 12:00 PM to 3:59 PM | 42 (6.6%) | 104 (16.8%) |
| 4:00 PM to 11:59 PM | 16 (2.5%) | 20 (3.2%) |
| Total | 640 (100.0%) | 620 (100.0%) |
Housing Occupancy in Mondovi
Occupancy by Ownership in Mondovi
Of the total 1,262 dwellings in Mondovi, owner-occupied units account for 734 (58.2%), while renter-occupied units make up 528 (41.8%).
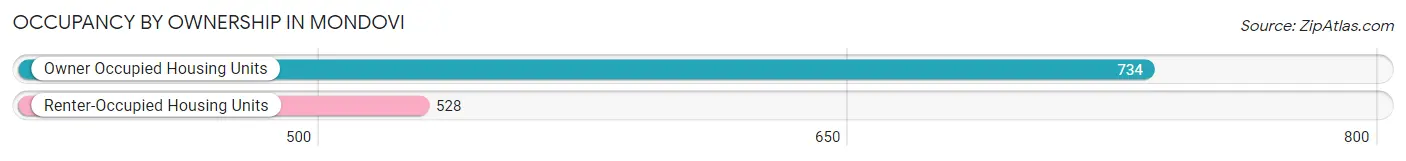
| Occupancy | # Housing Units | % Housing Units |
| Owner Occupied Housing Units | 734 | 58.2% |
| Renter-Occupied Housing Units | 528 | 41.8% |
| Total Occupied Housing Units | 1,262 | 100.0% |
Occupancy by Household Size in Mondovi
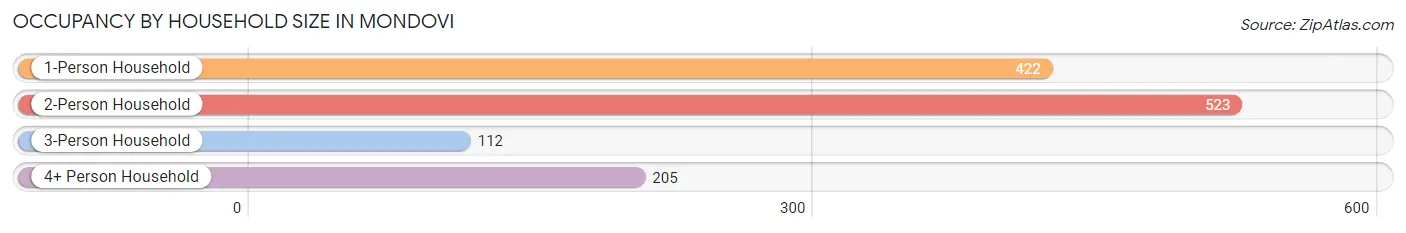
| Household Size | # Housing Units | % Housing Units |
| 1-Person Household | 422 | 33.4% |
| 2-Person Household | 523 | 41.4% |
| 3-Person Household | 112 | 8.9% |
| 4+ Person Household | 205 | 16.2% |
| Total Housing Units | 1,262 | 100.0% |
Occupancy by Ownership by Household Size in Mondovi
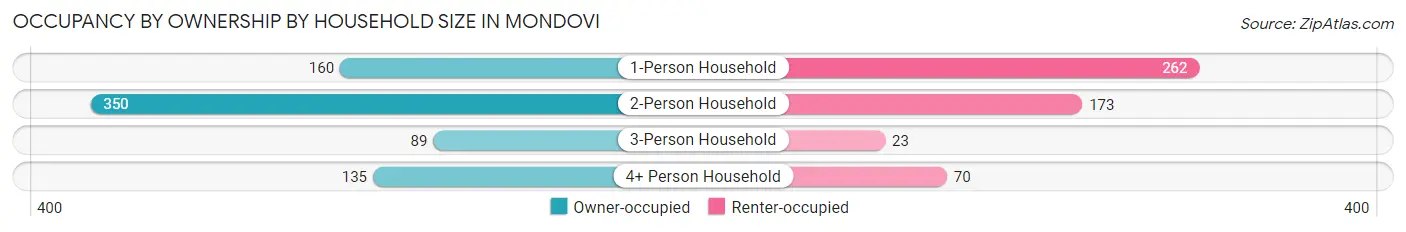
| Household Size | Owner-occupied | Renter-occupied |
| 1-Person Household | 160 (37.9%) | 262 (62.1%) |
| 2-Person Household | 350 (66.9%) | 173 (33.1%) |
| 3-Person Household | 89 (79.5%) | 23 (20.5%) |
| 4+ Person Household | 135 (65.8%) | 70 (34.2%) |
| Total Housing Units | 734 (58.2%) | 528 (41.8%) |
Occupancy by Educational Attainment in Mondovi
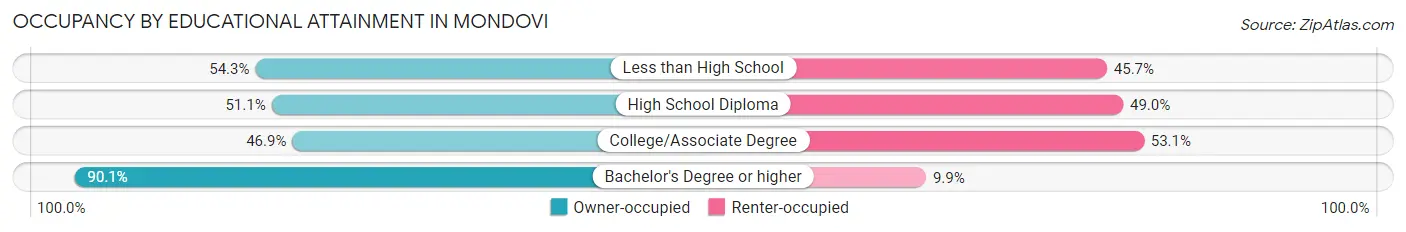
| Household Size | Owner-occupied | Renter-occupied |
| Less than High School | 51 (54.3%) | 43 (45.7%) |
| High School Diploma | 317 (51.0%) | 304 (48.9%) |
| College/Associate Degree | 138 (46.9%) | 156 (53.1%) |
| Bachelor's Degree or higher | 228 (90.1%) | 25 (9.9%) |
Occupancy by Age of Householder in Mondovi
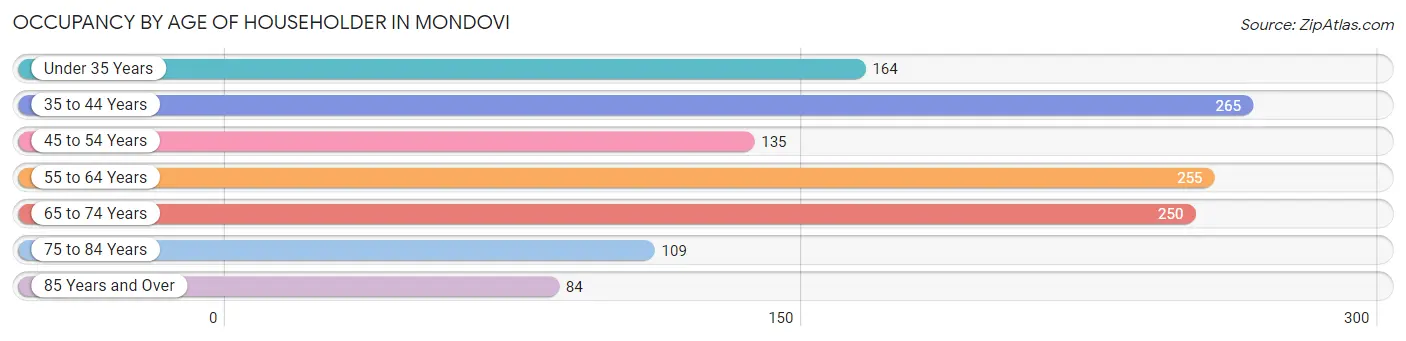
| Age Bracket | # Households | % Households |
| Under 35 Years | 164 | 13.0% |
| 35 to 44 Years | 265 | 21.0% |
| 45 to 54 Years | 135 | 10.7% |
| 55 to 64 Years | 255 | 20.2% |
| 65 to 74 Years | 250 | 19.8% |
| 75 to 84 Years | 109 | 8.6% |
| 85 Years and Over | 84 | 6.7% |
| Total | 1,262 | 100.0% |
Housing Finances in Mondovi
Median Income by Occupancy in Mondovi
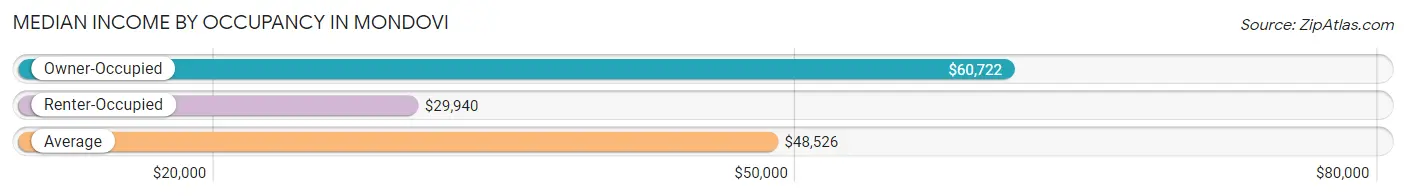
| Occupancy Type | # Households | Median Income |
| Owner-Occupied | 734 (58.2%) | $60,722 |
| Renter-Occupied | 528 (41.8%) | $29,940 |
| Average | 1,262 (100.0%) | $48,526 |
Occupancy by Householder Income Bracket in Mondovi
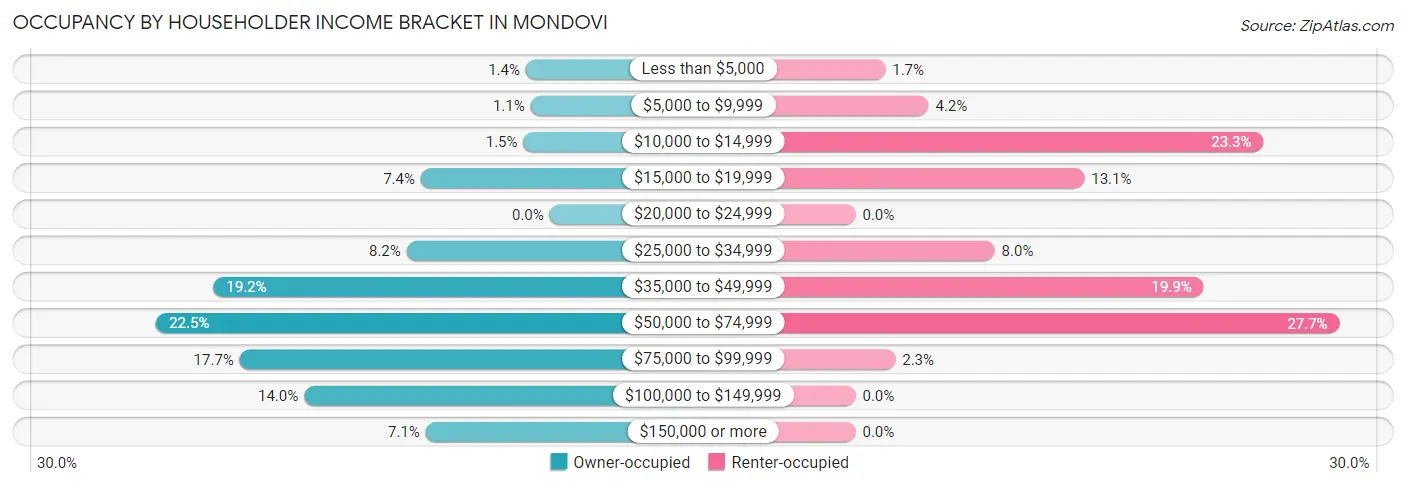
| Income Bracket | Owner-occupied | Renter-occupied |
| Less than $5,000 | 10 (1.4%) | 9 (1.7%) |
| $5,000 to $9,999 | 8 (1.1%) | 22 (4.2%) |
| $10,000 to $14,999 | 11 (1.5%) | 123 (23.3%) |
| $15,000 to $19,999 | 54 (7.4%) | 69 (13.1%) |
| $20,000 to $24,999 | 0 (0.0%) | 0 (0.0%) |
| $25,000 to $34,999 | 60 (8.2%) | 42 (8.0%) |
| $35,000 to $49,999 | 141 (19.2%) | 105 (19.9%) |
| $50,000 to $74,999 | 165 (22.5%) | 146 (27.7%) |
| $75,000 to $99,999 | 130 (17.7%) | 12 (2.3%) |
| $100,000 to $149,999 | 103 (14.0%) | 0 (0.0%) |
| $150,000 or more | 52 (7.1%) | 0 (0.0%) |
| Total | 734 (100.0%) | 528 (100.0%) |
Monthly Housing Cost Tiers in Mondovi
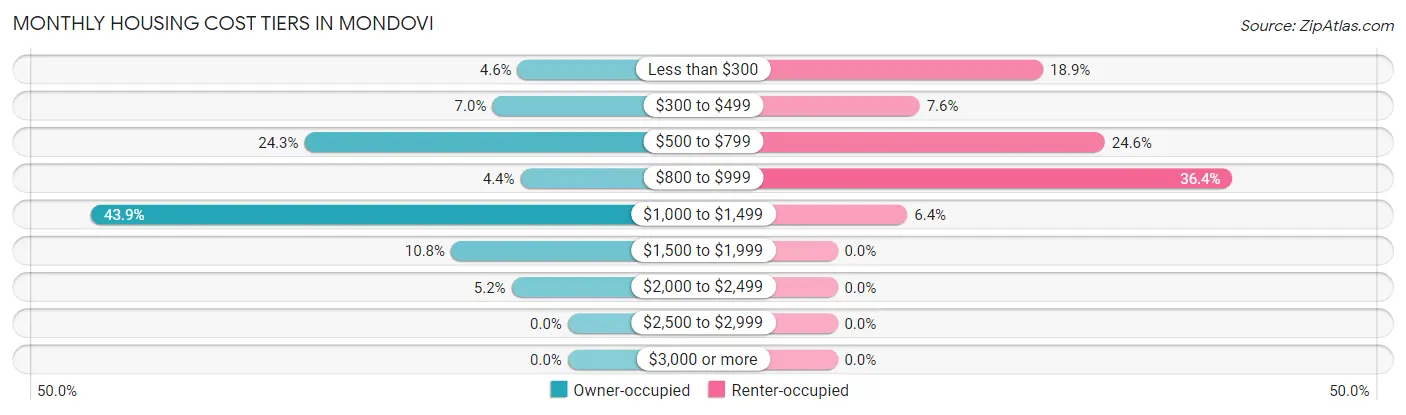
| Monthly Cost | Owner-occupied | Renter-occupied |
| Less than $300 | 34 (4.6%) | 100 (18.9%) |
| $300 to $499 | 51 (7.0%) | 40 (7.6%) |
| $500 to $799 | 178 (24.2%) | 130 (24.6%) |
| $800 to $999 | 32 (4.4%) | 192 (36.4%) |
| $1,000 to $1,499 | 322 (43.9%) | 34 (6.4%) |
| $1,500 to $1,999 | 79 (10.8%) | 0 (0.0%) |
| $2,000 to $2,499 | 38 (5.2%) | 0 (0.0%) |
| $2,500 to $2,999 | 0 (0.0%) | 0 (0.0%) |
| $3,000 or more | 0 (0.0%) | 0 (0.0%) |
| Total | 734 (100.0%) | 528 (100.0%) |
Physical Housing Characteristics in Mondovi
Housing Structures in Mondovi
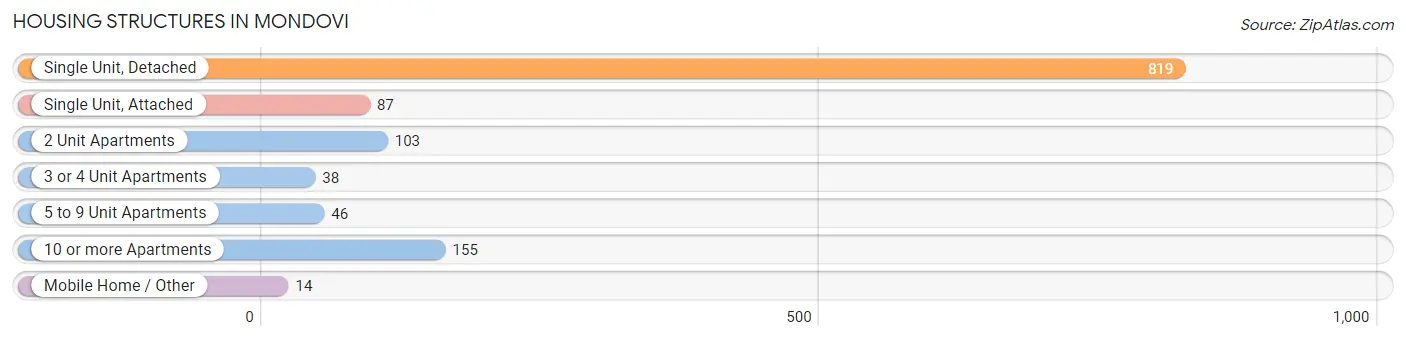
| Structure Type | # Housing Units | % Housing Units |
| Single Unit, Detached | 819 | 64.9% |
| Single Unit, Attached | 87 | 6.9% |
| 2 Unit Apartments | 103 | 8.2% |
| 3 or 4 Unit Apartments | 38 | 3.0% |
| 5 to 9 Unit Apartments | 46 | 3.6% |
| 10 or more Apartments | 155 | 12.3% |
| Mobile Home / Other | 14 | 1.1% |
| Total | 1,262 | 100.0% |
Housing Structures by Occupancy in Mondovi
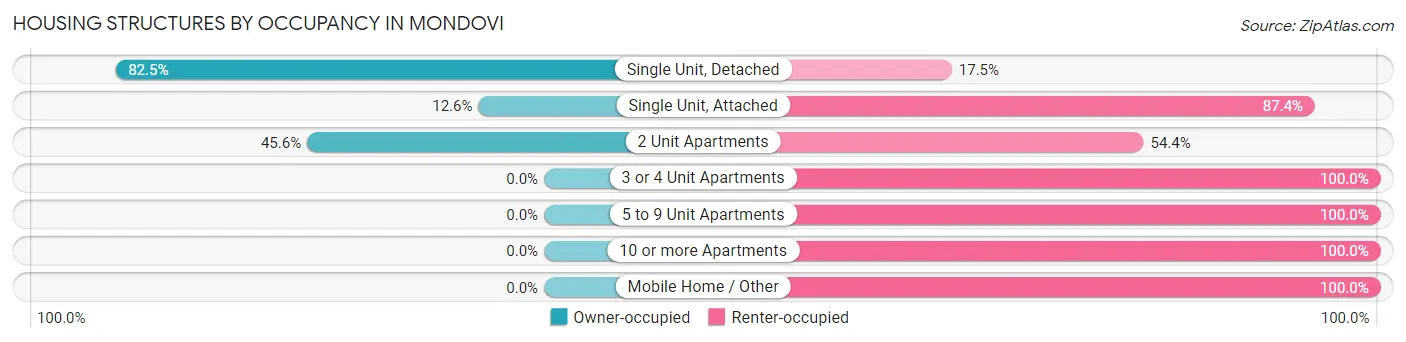
| Structure Type | Owner-occupied | Renter-occupied |
| Single Unit, Detached | 676 (82.5%) | 143 (17.5%) |
| Single Unit, Attached | 11 (12.6%) | 76 (87.4%) |
| 2 Unit Apartments | 47 (45.6%) | 56 (54.4%) |
| 3 or 4 Unit Apartments | 0 (0.0%) | 38 (100.0%) |
| 5 to 9 Unit Apartments | 0 (0.0%) | 46 (100.0%) |
| 10 or more Apartments | 0 (0.0%) | 155 (100.0%) |
| Mobile Home / Other | 0 (0.0%) | 14 (100.0%) |
| Total | 734 (58.2%) | 528 (41.8%) |
Housing Structures by Number of Rooms in Mondovi
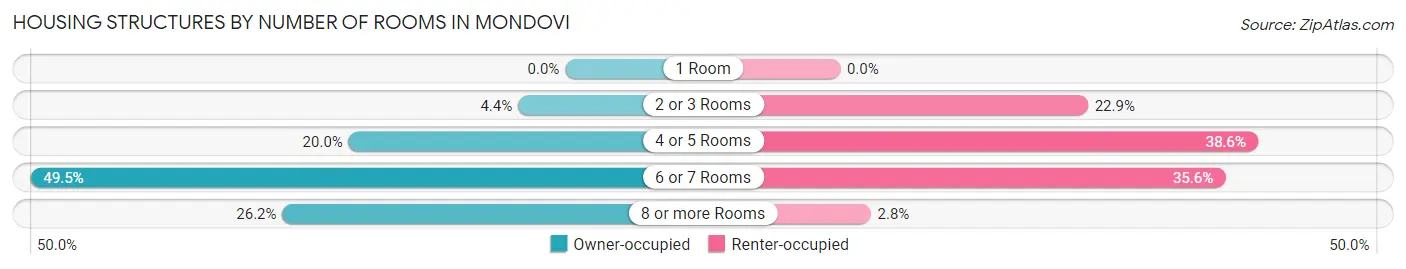
| Number of Rooms | Owner-occupied | Renter-occupied |
| 1 Room | 0 (0.0%) | 0 (0.0%) |
| 2 or 3 Rooms | 32 (4.4%) | 121 (22.9%) |
| 4 or 5 Rooms | 147 (20.0%) | 204 (38.6%) |
| 6 or 7 Rooms | 363 (49.5%) | 188 (35.6%) |
| 8 or more Rooms | 192 (26.2%) | 15 (2.8%) |
| Total | 734 (100.0%) | 528 (100.0%) |
Housing Structure by Heating Type in Mondovi
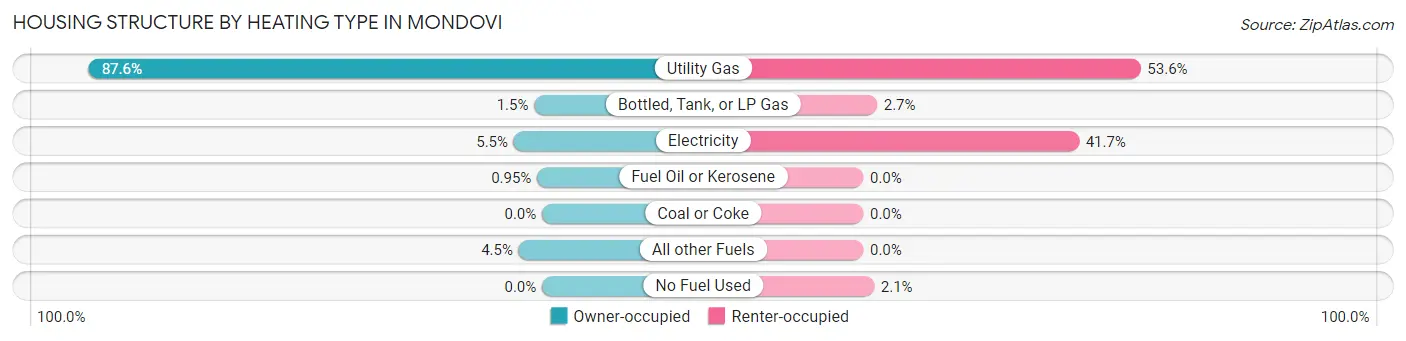
| Heating Type | Owner-occupied | Renter-occupied |
| Utility Gas | 643 (87.6%) | 283 (53.6%) |
| Bottled, Tank, or LP Gas | 11 (1.5%) | 14 (2.6%) |
| Electricity | 40 (5.4%) | 220 (41.7%) |
| Fuel Oil or Kerosene | 7 (0.9%) | 0 (0.0%) |
| Coal or Coke | 0 (0.0%) | 0 (0.0%) |
| All other Fuels | 33 (4.5%) | 0 (0.0%) |
| No Fuel Used | 0 (0.0%) | 11 (2.1%) |
| Total | 734 (100.0%) | 528 (100.0%) |
Household Vehicle Usage in Mondovi
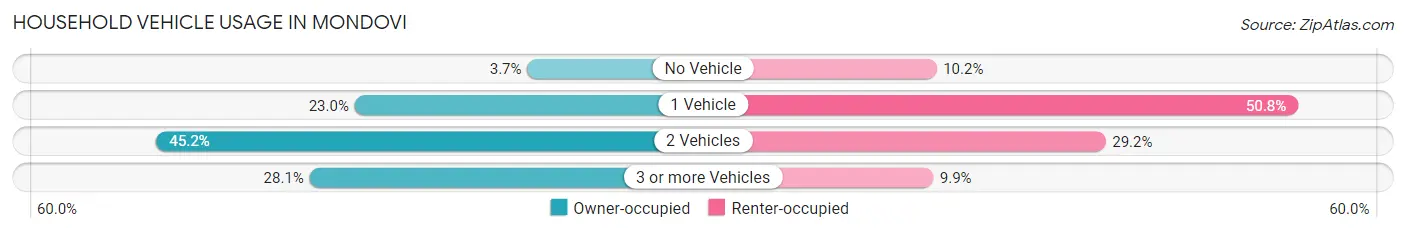
| Vehicles per Household | Owner-occupied | Renter-occupied |
| No Vehicle | 27 (3.7%) | 54 (10.2%) |
| 1 Vehicle | 169 (23.0%) | 268 (50.8%) |
| 2 Vehicles | 332 (45.2%) | 154 (29.2%) |
| 3 or more Vehicles | 206 (28.1%) | 52 (9.9%) |
| Total | 734 (100.0%) | 528 (100.0%) |
Real Estate & Mortgages in Mondovi
Real Estate and Mortgage Overview in Mondovi
| Characteristic | Without Mortgage | With Mortgage |
| Housing Units | 226 | 508 |
| Median Property Value | $123,900 | $161,700 |
| Median Household Income | $47,206 | $52 |
| Monthly Housing Costs | $538 | $0 |
| Real Estate Taxes | $2,614 | $0 |
Property Value by Mortgage Status in Mondovi
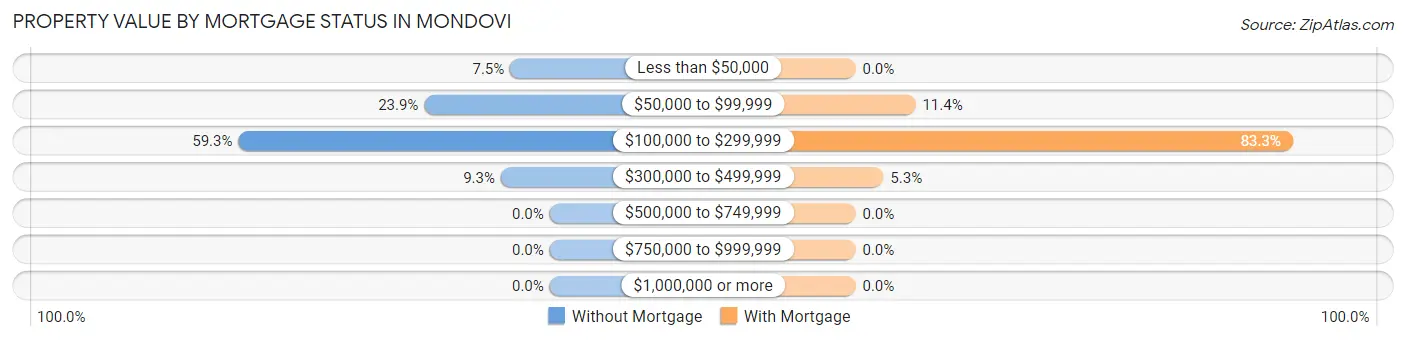
| Property Value | Without Mortgage | With Mortgage |
| Less than $50,000 | 17 (7.5%) | 0 (0.0%) |
| $50,000 to $99,999 | 54 (23.9%) | 58 (11.4%) |
| $100,000 to $299,999 | 134 (59.3%) | 423 (83.3%) |
| $300,000 to $499,999 | 21 (9.3%) | 27 (5.3%) |
| $500,000 to $749,999 | 0 (0.0%) | 0 (0.0%) |
| $750,000 to $999,999 | 0 (0.0%) | 0 (0.0%) |
| $1,000,000 or more | 0 (0.0%) | 0 (0.0%) |
| Total | 226 (100.0%) | 508 (100.0%) |
Household Income by Mortgage Status in Mondovi
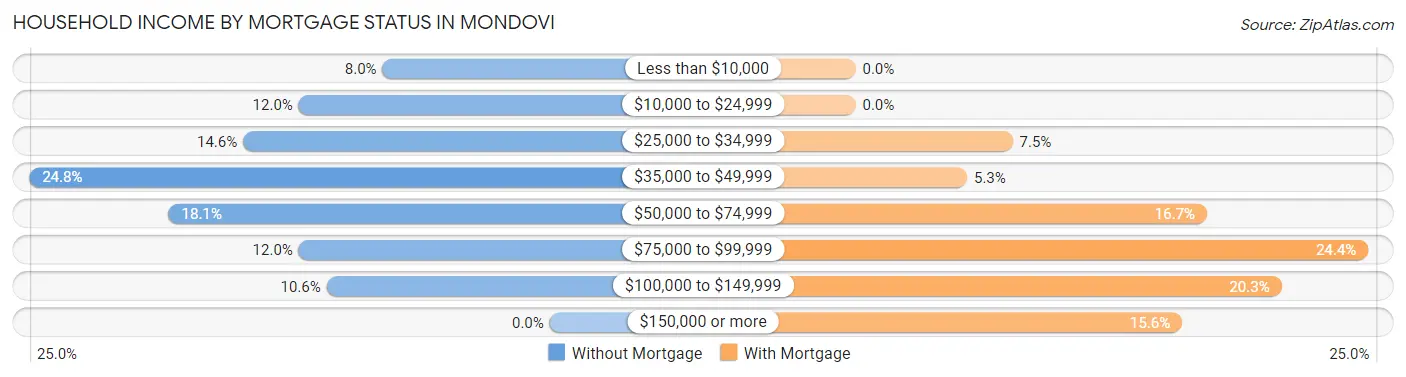
| Household Income | Without Mortgage | With Mortgage |
| Less than $10,000 | 18 (8.0%) | 0 (0.0%) |
| $10,000 to $24,999 | 27 (11.9%) | 0 (0.0%) |
| $25,000 to $34,999 | 33 (14.6%) | 38 (7.5%) |
| $35,000 to $49,999 | 56 (24.8%) | 27 (5.3%) |
| $50,000 to $74,999 | 41 (18.1%) | 85 (16.7%) |
| $75,000 to $99,999 | 27 (11.9%) | 124 (24.4%) |
| $100,000 to $149,999 | 24 (10.6%) | 103 (20.3%) |
| $150,000 or more | 0 (0.0%) | 79 (15.5%) |
| Total | 226 (100.0%) | 508 (100.0%) |
Property Value to Household Income Ratio in Mondovi
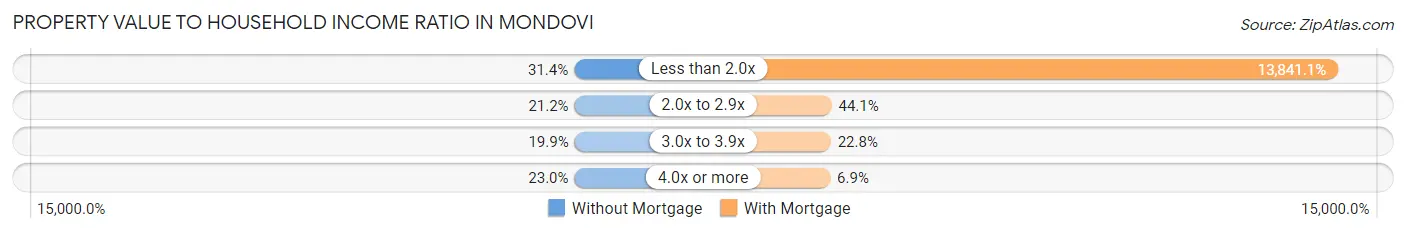
| Value-to-Income Ratio | Without Mortgage | With Mortgage |
| Less than 2.0x | 71 (31.4%) | 70,313 (13,841.1%) |
| 2.0x to 2.9x | 48 (21.2%) | 224 (44.1%) |
| 3.0x to 3.9x | 45 (19.9%) | 116 (22.8%) |
| 4.0x or more | 52 (23.0%) | 35 (6.9%) |
| Total | 226 (100.0%) | 508 (100.0%) |
Real Estate Taxes by Mortgage Status in Mondovi
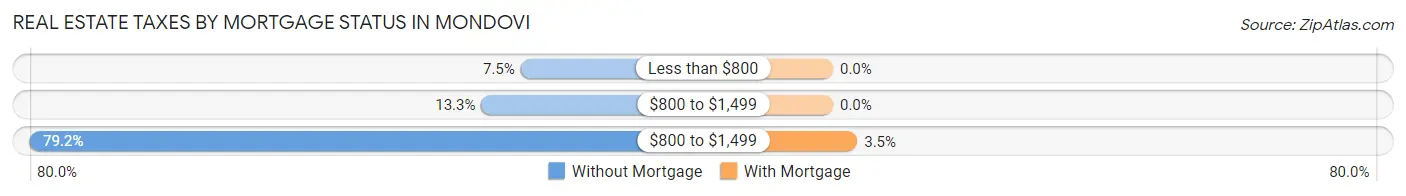
| Property Taxes | Without Mortgage | With Mortgage |
| Less than $800 | 17 (7.5%) | 0 (0.0%) |
| $800 to $1,499 | 30 (13.3%) | 0 (0.0%) |
| $800 to $1,499 | 179 (79.2%) | 18 (3.5%) |
| Total | 226 (100.0%) | 508 (100.0%) |
Health & Disability in Mondovi
Health Insurance Coverage by Age in Mondovi
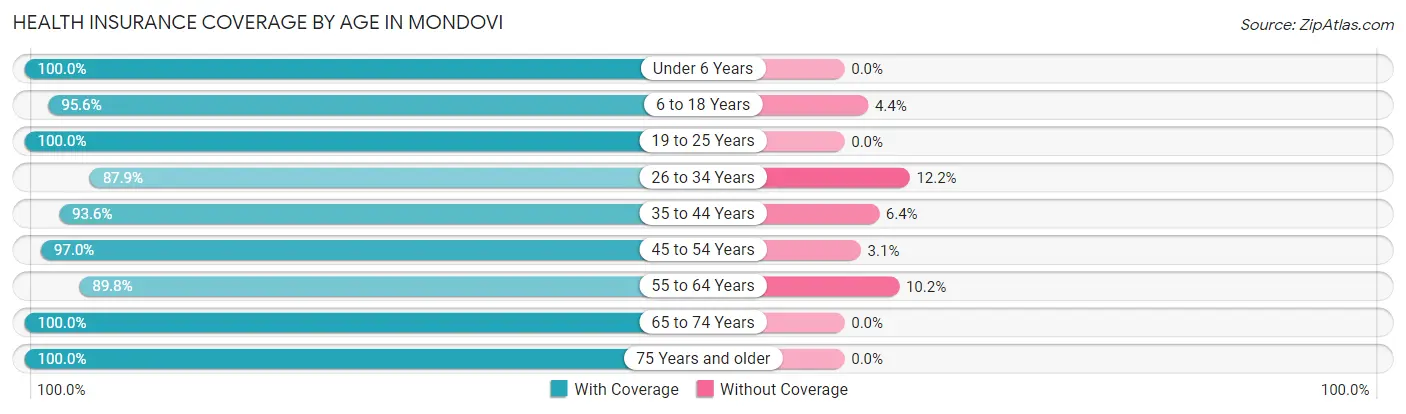
| Age Bracket | With Coverage | Without Coverage |
| Under 6 Years | 236 (100.0%) | 0 (0.0%) |
| 6 to 18 Years | 432 (95.6%) | 20 (4.4%) |
| 19 to 25 Years | 140 (100.0%) | 0 (0.0%) |
| 26 to 34 Years | 253 (87.8%) | 35 (12.1%) |
| 35 to 44 Years | 436 (93.6%) | 30 (6.4%) |
| 45 to 54 Years | 191 (97.0%) | 6 (3.0%) |
| 55 to 64 Years | 396 (89.8%) | 45 (10.2%) |
| 65 to 74 Years | 343 (100.0%) | 0 (0.0%) |
| 75 Years and older | 233 (100.0%) | 0 (0.0%) |
| Total | 2,660 (95.1%) | 136 (4.9%) |
Health Insurance Coverage by Citizenship Status in Mondovi
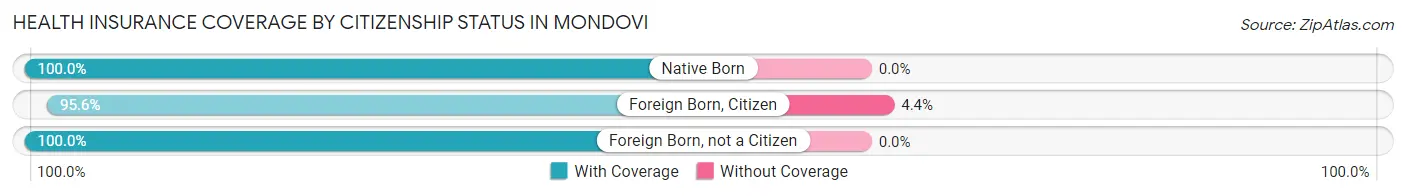
| Citizenship Status | With Coverage | Without Coverage |
| Native Born | 236 (100.0%) | 0 (0.0%) |
| Foreign Born, Citizen | 432 (95.6%) | 20 (4.4%) |
| Foreign Born, not a Citizen | 140 (100.0%) | 0 (0.0%) |
Health Insurance Coverage by Household Income in Mondovi
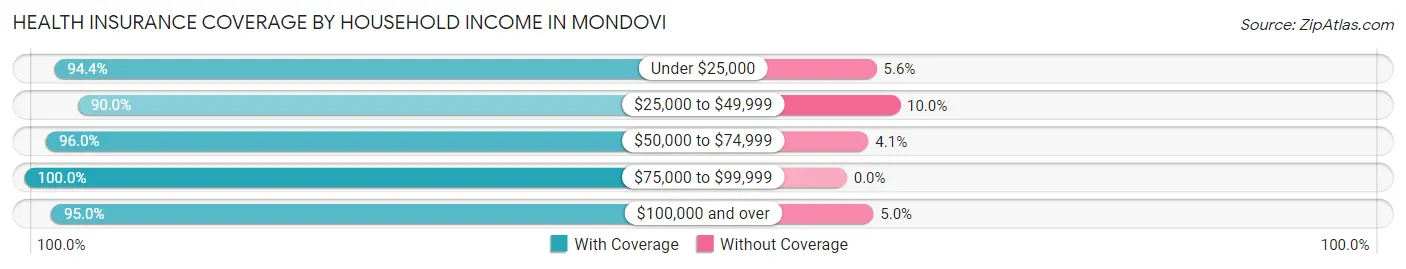
| Household Income | With Coverage | Without Coverage |
| Under $25,000 | 423 (94.4%) | 25 (5.6%) |
| $25,000 to $49,999 | 469 (90.0%) | 52 (10.0%) |
| $50,000 to $74,999 | 710 (96.0%) | 30 (4.1%) |
| $75,000 to $99,999 | 452 (100.0%) | 0 (0.0%) |
| $100,000 and over | 555 (95.0%) | 29 (5.0%) |
Public vs Private Health Insurance Coverage by Age in Mondovi
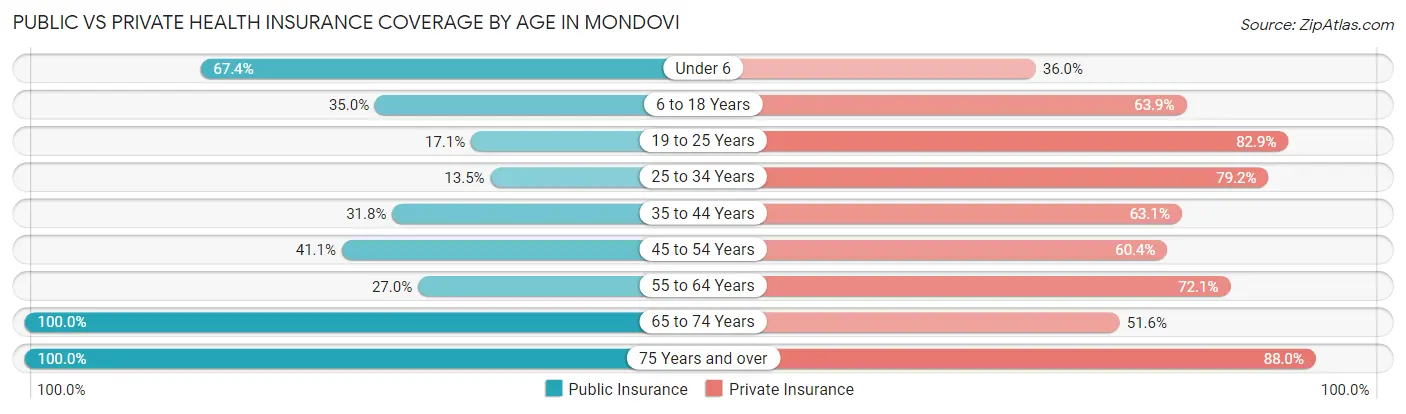
| Age Bracket | Public Insurance | Private Insurance |
| Under 6 | 159 (67.4%) | 85 (36.0%) |
| 6 to 18 Years | 158 (35.0%) | 289 (63.9%) |
| 19 to 25 Years | 24 (17.1%) | 116 (82.9%) |
| 25 to 34 Years | 39 (13.5%) | 228 (79.2%) |
| 35 to 44 Years | 148 (31.8%) | 294 (63.1%) |
| 45 to 54 Years | 81 (41.1%) | 119 (60.4%) |
| 55 to 64 Years | 119 (27.0%) | 318 (72.1%) |
| 65 to 74 Years | 343 (100.0%) | 177 (51.6%) |
| 75 Years and over | 233 (100.0%) | 205 (88.0%) |
| Total | 1,304 (46.6%) | 1,831 (65.5%) |
Disability Status by Sex by Age in Mondovi
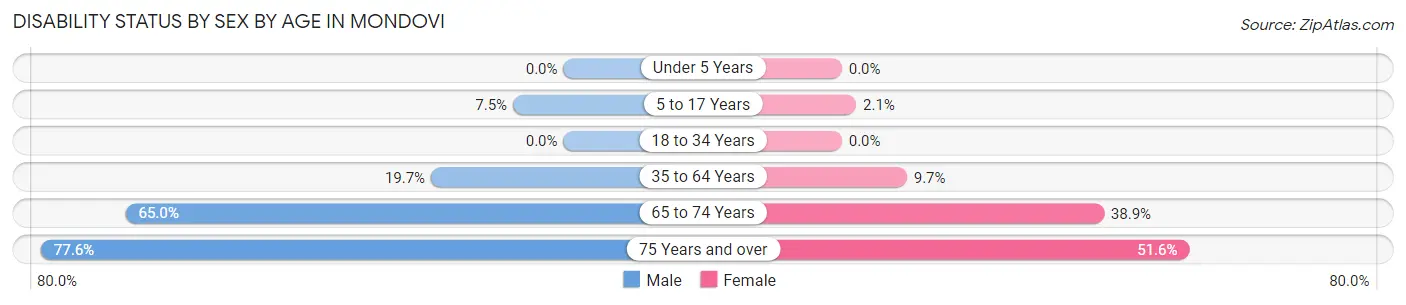
| Age Bracket | Male | Female |
| Under 5 Years | 0 (0.0%) | 0 (0.0%) |
| 5 to 17 Years | 14 (7.5%) | 6 (2.1%) |
| 18 to 34 Years | 0 (0.0%) | 0 (0.0%) |
| 35 to 64 Years | 105 (19.7%) | 55 (9.7%) |
| 65 to 74 Years | 91 (65.0%) | 79 (38.9%) |
| 75 Years and over | 83 (77.6%) | 65 (51.6%) |
Disability Class by Sex by Age in Mondovi
Disability Class: Hearing Difficulty
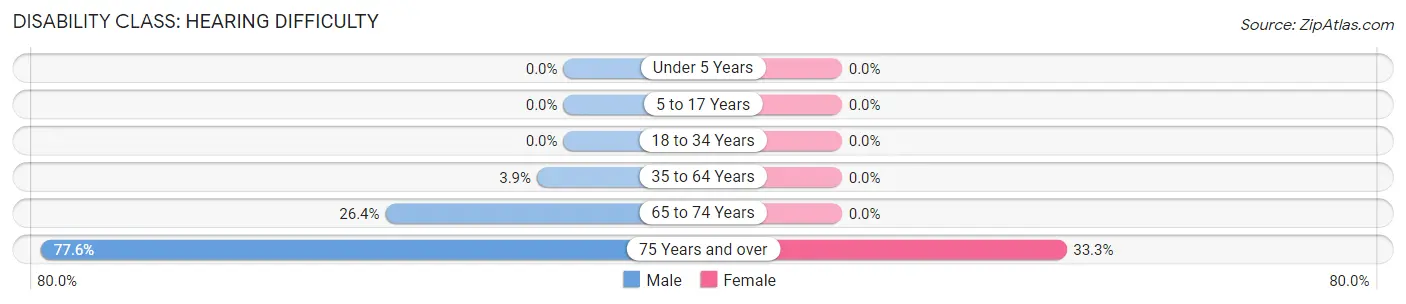
| Age Bracket | Male | Female |
| Under 5 Years | 0 (0.0%) | 0 (0.0%) |
| 5 to 17 Years | 0 (0.0%) | 0 (0.0%) |
| 18 to 34 Years | 0 (0.0%) | 0 (0.0%) |
| 35 to 64 Years | 21 (3.9%) | 0 (0.0%) |
| 65 to 74 Years | 37 (26.4%) | 0 (0.0%) |
| 75 Years and over | 83 (77.6%) | 42 (33.3%) |
Disability Class: Vision Difficulty
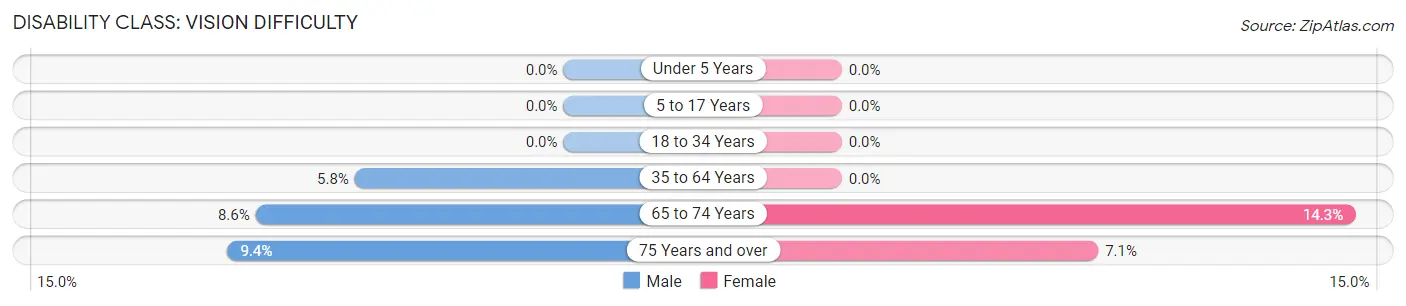
| Age Bracket | Male | Female |
| Under 5 Years | 0 (0.0%) | 0 (0.0%) |
| 5 to 17 Years | 0 (0.0%) | 0 (0.0%) |
| 18 to 34 Years | 0 (0.0%) | 0 (0.0%) |
| 35 to 64 Years | 31 (5.8%) | 0 (0.0%) |
| 65 to 74 Years | 12 (8.6%) | 29 (14.3%) |
| 75 Years and over | 10 (9.3%) | 9 (7.1%) |
Disability Class: Cognitive Difficulty
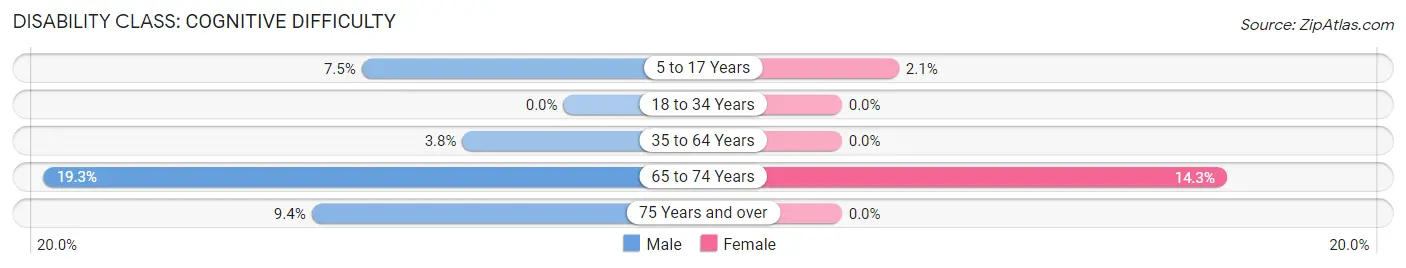
| Age Bracket | Male | Female |
| 5 to 17 Years | 14 (7.5%) | 6 (2.1%) |
| 18 to 34 Years | 0 (0.0%) | 0 (0.0%) |
| 35 to 64 Years | 20 (3.7%) | 0 (0.0%) |
| 65 to 74 Years | 27 (19.3%) | 29 (14.3%) |
| 75 Years and over | 10 (9.3%) | 0 (0.0%) |
Disability Class: Ambulatory Difficulty
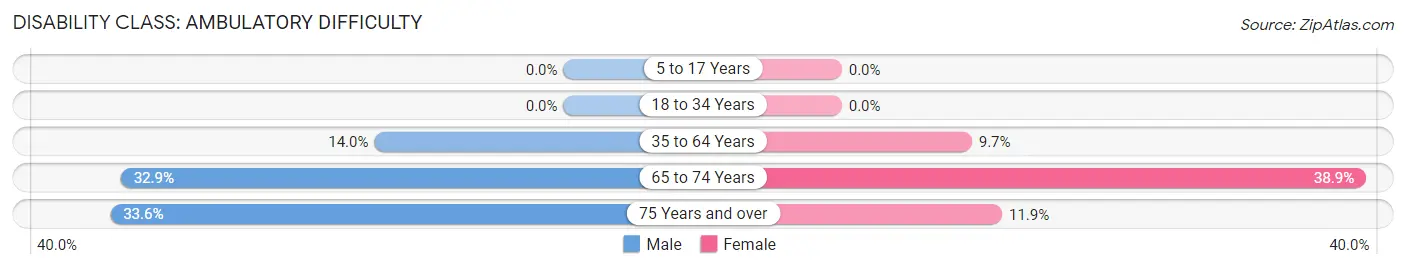
| Age Bracket | Male | Female |
| 5 to 17 Years | 0 (0.0%) | 0 (0.0%) |
| 18 to 34 Years | 0 (0.0%) | 0 (0.0%) |
| 35 to 64 Years | 75 (14.0%) | 55 (9.7%) |
| 65 to 74 Years | 46 (32.9%) | 79 (38.9%) |
| 75 Years and over | 36 (33.6%) | 15 (11.9%) |
Disability Class: Self-Care Difficulty
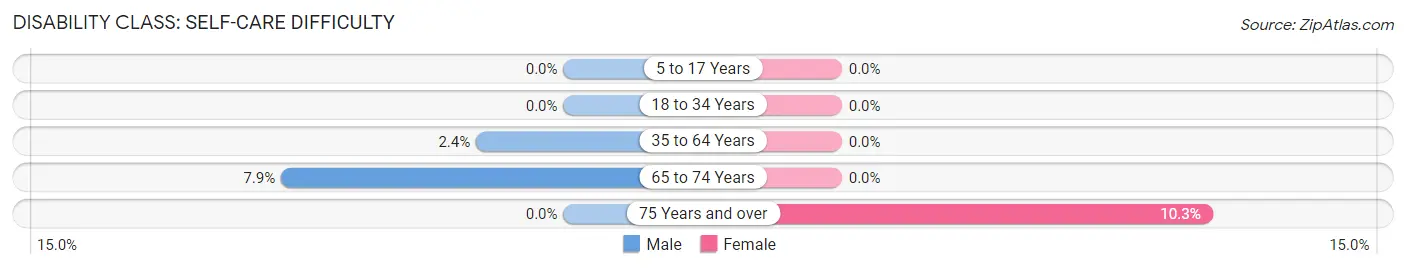
| Age Bracket | Male | Female |
| 5 to 17 Years | 0 (0.0%) | 0 (0.0%) |
| 18 to 34 Years | 0 (0.0%) | 0 (0.0%) |
| 35 to 64 Years | 13 (2.4%) | 0 (0.0%) |
| 65 to 74 Years | 11 (7.9%) | 0 (0.0%) |
| 75 Years and over | 0 (0.0%) | 13 (10.3%) |
Technology Access in Mondovi
Computing Device Access in Mondovi
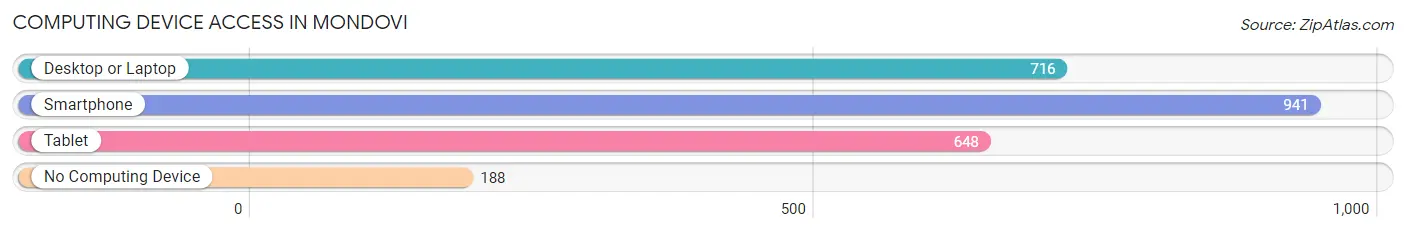
| Device Type | # Households | % Households |
| Desktop or Laptop | 716 | 56.7% |
| Smartphone | 941 | 74.6% |
| Tablet | 648 | 51.3% |
| No Computing Device | 188 | 14.9% |
| Total | 1,262 | 100.0% |
Internet Access in Mondovi
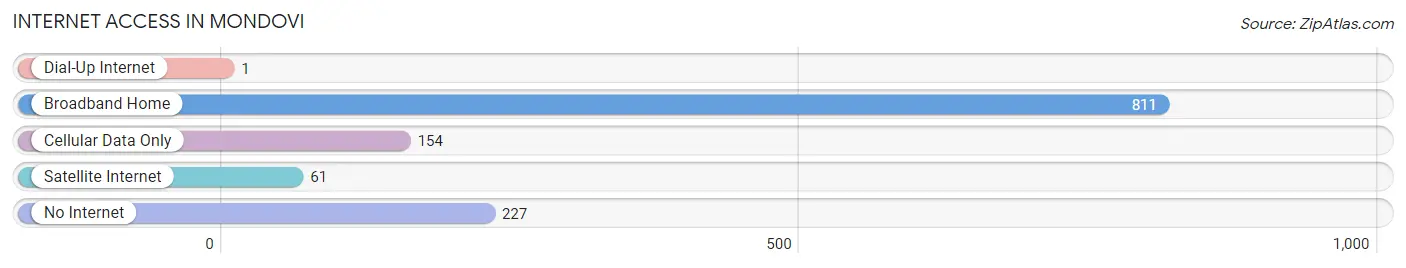
| Internet Type | # Households | % Households |
| Dial-Up Internet | 1 | 0.1% |
| Broadband Home | 811 | 64.3% |
| Cellular Data Only | 154 | 12.2% |
| Satellite Internet | 61 | 4.8% |
| No Internet | 227 | 18.0% |
| Total | 1,262 | 100.0% |
Mondovi Summary
Mondovi, Wisconsin is a small city located in Buffalo County, Wisconsin. It is situated on the banks of the Buffalo River, and is home to a population of approximately 2,000 people. The city is known for its rural charm and its strong sense of community.
History
Mondovi was founded in 1856 by a group of settlers from New York. The city was named after the Italian city of Mondovi, which was the birthplace of one of the settlers. The city was originally a farming community, and the settlers quickly established a thriving agricultural economy. The city was incorporated in 1872, and the first mayor was elected in 1873.
In the late 19th century, Mondovi began to experience a period of growth and prosperity. The city was home to several businesses, including a flour mill, a sawmill, and a brickyard. The city also had a thriving lumber industry, and the Buffalo River was used to transport logs to the city.
In the early 20th century, Mondovi experienced a period of decline. The city's economy was hurt by the Great Depression, and many of the businesses in the city closed. The city was also affected by the Dust Bowl, and many of the farmers in the area were forced to leave.
Geography
Mondovi is located in Buffalo County, Wisconsin. The city is situated on the banks of the Buffalo River, and is surrounded by rolling hills and farmland. The city is located approximately 50 miles east of the city of Eau Claire, and is about an hour and a half drive from the Twin Cities.
The city has a total area of 1.7 square miles, and has a population density of 1,092 people per square mile. The city is located at an elevation of 890 feet above sea level.
Economy
Mondovi's economy is largely based on agriculture. The city is home to several dairy farms, and the surrounding area is known for its production of corn, soybeans, and hay. The city is also home to several businesses, including a lumber mill, a feed mill, and a grain elevator.
The city is also home to several manufacturing companies, including a furniture factory, a plastics factory, and a metal fabrication plant. The city is also home to several retail stores, including a grocery store, a hardware store, and a clothing store.
Demographics
Mondovi has a population of approximately 2,000 people. The city has a median household income of $41,000, and the median age is 43. The city is predominantly white, with approximately 95% of the population identifying as Caucasian. The city also has a small Hispanic population, with approximately 4% of the population identifying as Hispanic or Latino.
Conclusion
Mondovi, Wisconsin is a small city located in Buffalo County, Wisconsin. The city is known for its rural charm and its strong sense of community. The city's economy is largely based on agriculture, and the city is home to several businesses and manufacturing companies. The city has a population of approximately 2,000 people, and the median household income is $41,000. The city is predominantly white, with approximately 95% of the population identifying as Caucasian.
Common Questions
What is Per Capita Income in Mondovi?
Per Capita income in Mondovi is $27,315.
What is the Median Family Income in Mondovi?
Median Family Income in Mondovi is $58,047.
What is the Median Household income in Mondovi?
Median Household Income in Mondovi is $48,526.
What is Income or Wage Gap in Mondovi?
Income or Wage Gap in Mondovi is 50.6%.
Women in Mondovi earn 49.4 cents for every dollar earned by a man.
What is Family Income Deficit in Mondovi?
Family Income Deficit in Mondovi is $4,028.
Families that are below poverty line in Mondovi earn $4,028 less on average than the poverty threshold level.
What is Inequality or Gini Index in Mondovi?
Inequality or Gini Index in Mondovi is 0.39.
What is the Total Population of Mondovi?
Total Population of Mondovi is 2,832.
What is the Total Male Population of Mondovi?
Total Male Population of Mondovi is 1,284.
What is the Total Female Population of Mondovi?
Total Female Population of Mondovi is 1,548.
What is the Ratio of Males per 100 Females in Mondovi?
There are 82.95 Males per 100 Females in Mondovi.
What is the Ratio of Females per 100 Males in Mondovi?
There are 120.56 Females per 100 Males in Mondovi.
What is the Median Population Age in Mondovi?
Median Population Age in Mondovi is 39.2 Years.
What is the Average Family Size in Mondovi
Average Family Size in Mondovi is 2.7 People.
What is the Average Household Size in Mondovi
Average Household Size in Mondovi is 2.2 People.
How Large is the Labor Force in Mondovi?
There are 1,416 People in the Labor Forcein in Mondovi.
What is the Percentage of People in the Labor Force in Mondovi?
62.6% of People are in the Labor Force in Mondovi.
What is the Unemployment Rate in Mondovi?
Unemployment Rate in Mondovi is 2.5%.