Melrose, WI Map & Demographics
Melrose Map
Melrose Overview
$27,501
PER CAPITA INCOME
$84,844
AVG FAMILY INCOME
$55,833
AVG HOUSEHOLD INCOME
51.9%
WAGE / INCOME GAP [ % ]
48.1¢/ $1
WAGE / INCOME GAP [ $ ]
0.41
INEQUALITY / GINI INDEX
596
TOTAL POPULATION
297
MALE POPULATION
299
FEMALE POPULATION
99.33
MALES / 100 FEMALES
100.67
FEMALES / 100 MALES
38.3
MEDIAN AGE
3.4
AVG FAMILY SIZE
2.7
AVG HOUSEHOLD SIZE
324
LABOR FORCE [ PEOPLE ]
65.3%
PERCENT IN LABOR FORCE
3.4%
UNEMPLOYMENT RATE
Melrose Zip Codes
Melrose Area Codes
Income in Melrose
Income Overview in Melrose
Per Capita Income in Melrose is $27,501, while median incomes of families and households are $84,844 and $55,833 respectively.
| Characteristic | Number | Measure |
| Per Capita Income | 596 | $27,501 |
| Median Family Income | 131 | $84,844 |
| Mean Family Income | 131 | $93,382 |
| Median Household Income | 222 | $55,833 |
| Mean Household Income | 222 | $71,032 |
| Income Deficit | 131 | $0 |
| Wage / Income Gap (%) | 596 | 51.92% |
| Wage / Income Gap ($) | 596 | 48.08¢ per $1 |
| Gini / Inequality Index | 596 | 0.41 |
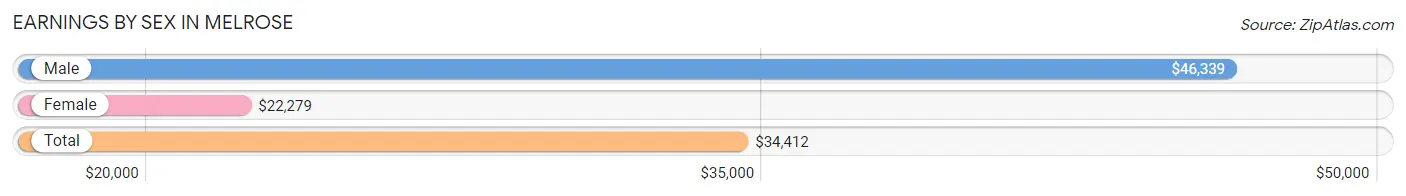
Earnings by Sex in Melrose
Average Earnings in Melrose are $34,412, $46,339 for men and $22,279 for women, a difference of 51.9%.
| Sex | Number | Average Earnings |
| Male | 181 (52.6%) | $46,339 |
| Female | 163 (47.4%) | $22,279 |
| Total | 344 (100.0%) | $34,412 |
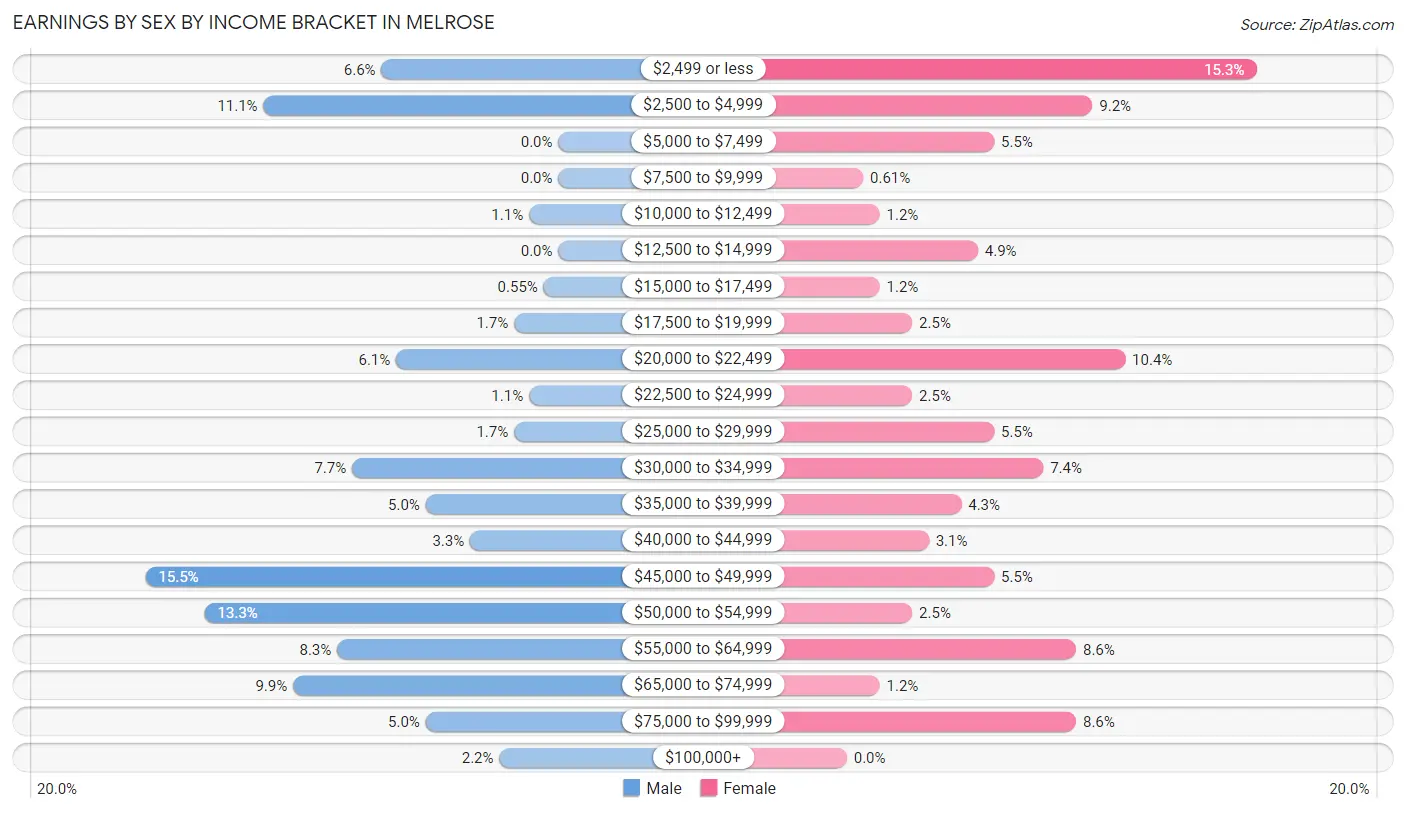
Earnings by Sex by Income Bracket in Melrose
The most common earnings brackets in Melrose are $45,000 to $49,999 for men (28 | 15.5%) and $2,499 or less for women (25 | 15.3%).
| Income | Male | Female |
| $2,499 or less | 12 (6.6%) | 25 (15.3%) |
| $2,500 to $4,999 | 20 (11.1%) | 15 (9.2%) |
| $5,000 to $7,499 | 0 (0.0%) | 9 (5.5%) |
| $7,500 to $9,999 | 0 (0.0%) | 1 (0.6%) |
| $10,000 to $12,499 | 2 (1.1%) | 2 (1.2%) |
| $12,500 to $14,999 | 0 (0.0%) | 8 (4.9%) |
| $15,000 to $17,499 | 1 (0.5%) | 2 (1.2%) |
| $17,500 to $19,999 | 3 (1.7%) | 4 (2.5%) |
| $20,000 to $22,499 | 11 (6.1%) | 17 (10.4%) |
| $22,500 to $24,999 | 2 (1.1%) | 4 (2.5%) |
| $25,000 to $29,999 | 3 (1.7%) | 9 (5.5%) |
| $30,000 to $34,999 | 14 (7.7%) | 12 (7.4%) |
| $35,000 to $39,999 | 9 (5.0%) | 7 (4.3%) |
| $40,000 to $44,999 | 6 (3.3%) | 5 (3.1%) |
| $45,000 to $49,999 | 28 (15.5%) | 9 (5.5%) |
| $50,000 to $54,999 | 24 (13.3%) | 4 (2.5%) |
| $55,000 to $64,999 | 15 (8.3%) | 14 (8.6%) |
| $65,000 to $74,999 | 18 (9.9%) | 2 (1.2%) |
| $75,000 to $99,999 | 9 (5.0%) | 14 (8.6%) |
| $100,000+ | 4 (2.2%) | 0 (0.0%) |
| Total | 181 (100.0%) | 163 (100.0%) |
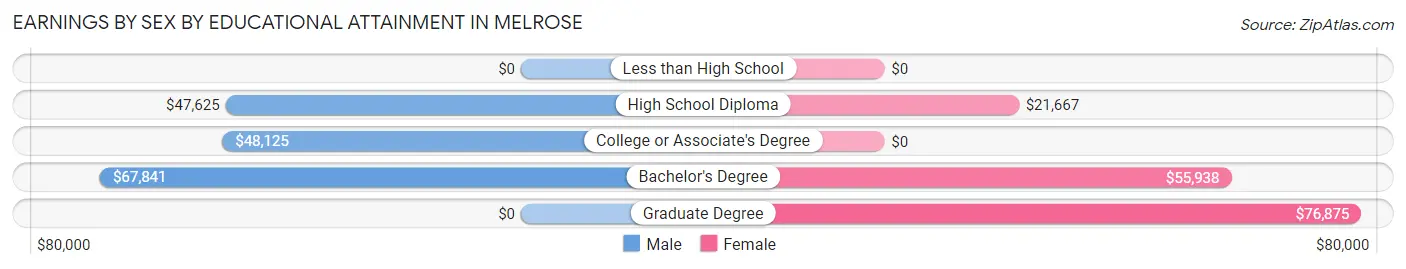
Earnings by Sex by Educational Attainment in Melrose
Average earnings in Melrose are $49,167 for men and $22,813 for women, a difference of 53.6%. Men with an educational attainment of bachelor's degree enjoy the highest average annual earnings of $67,841, while those with high school diploma education earn the least with $47,625. Women with an educational attainment of graduate degree earn the most with the average annual earnings of $76,875, while those with high school diploma education have the smallest earnings of $21,667.
| Educational Attainment | Male Income | Female Income |
| Less than High School | - | - |
| High School Diploma | $47,625 | $21,667 |
| College or Associate's Degree | $48,125 | $0 |
| Bachelor's Degree | $67,841 | $55,938 |
| Graduate Degree | - | - |
| Total | $49,167 | $22,813 |
Family Income in Melrose
Family Income Brackets in Melrose
According to the Melrose family income data, there are 33 families falling into the $100,000 to $149,999 income range, which is the most common income bracket and makes up 25.2% of all families.
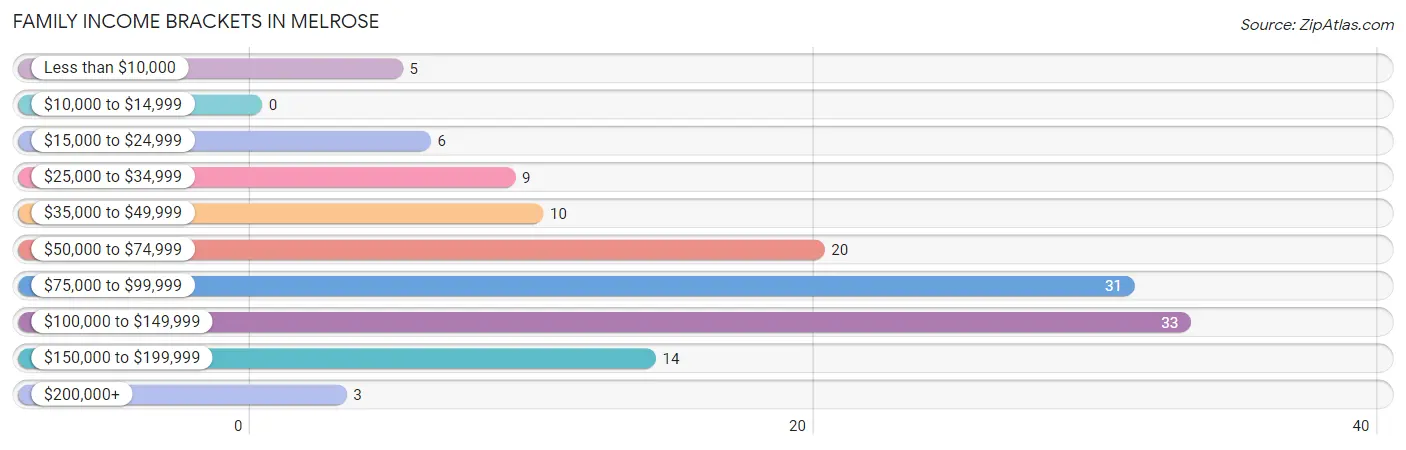
| Income Bracket | # Families | % Families |
| Less than $10,000 | 5 | 3.8% |
| $10,000 to $14,999 | 0 | 0.0% |
| $15,000 to $24,999 | 6 | 4.6% |
| $25,000 to $34,999 | 9 | 6.9% |
| $35,000 to $49,999 | 10 | 7.6% |
| $50,000 to $74,999 | 20 | 15.3% |
| $75,000 to $99,999 | 31 | 23.7% |
| $100,000 to $149,999 | 33 | 25.2% |
| $150,000 to $199,999 | 14 | 10.7% |
| $200,000+ | 3 | 2.3% |
Family Income by Famaliy Size in Melrose
4-person families (28 | 21.4%) account for the highest median family income in Melrose with $105,833 per family, while 2-person families (53 | 40.5%) have the highest median income of $38,125 per family member.
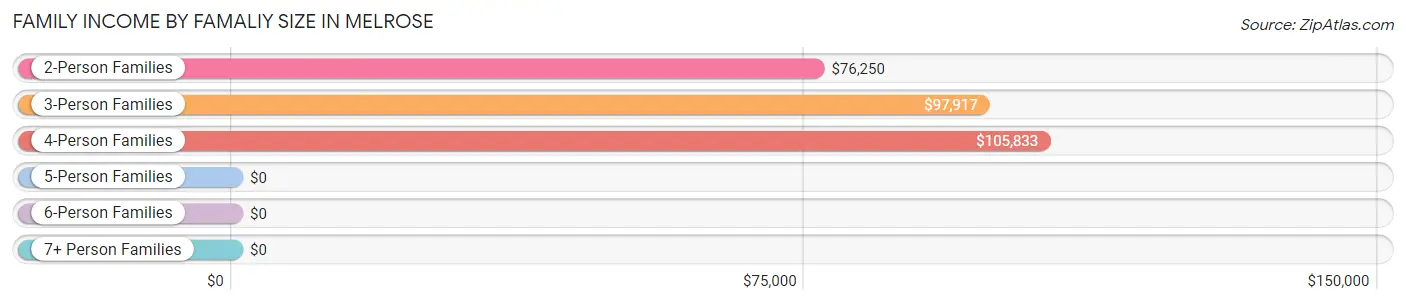
| Income Bracket | # Families | Median Income |
| 2-Person Families | 53 (40.5%) | $76,250 |
| 3-Person Families | 40 (30.5%) | $97,917 |
| 4-Person Families | 28 (21.4%) | $105,833 |
| 5-Person Families | 6 (4.6%) | $0 |
| 6-Person Families | 0 (0.0%) | $0 |
| 7+ Person Families | 4 (3.0%) | $0 |
| Total | 131 (100.0%) | $84,844 |
Family Income by Number of Earners in Melrose
The median family income in Melrose is $84,844, with families comprising 2 earners (59) having the highest median family income of $119,375, while families with 1 earner (38) have the lowest median family income of $47,083, accounting for 45.0% and 29.0% of families, respectively.
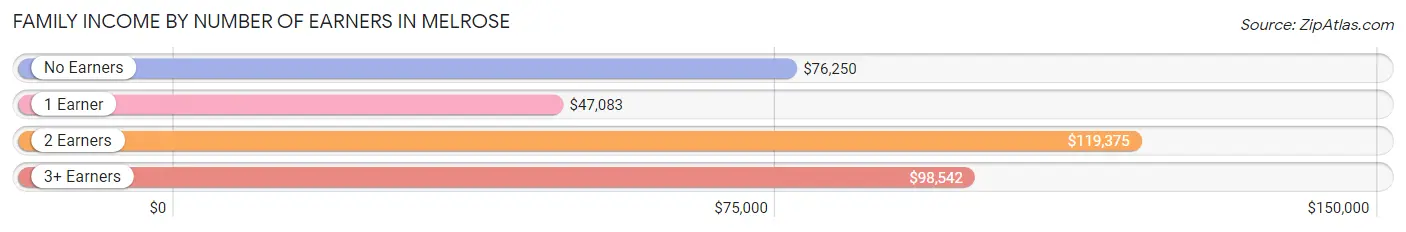
| Number of Earners | # Families | Median Income |
| No Earners | 9 (6.9%) | $76,250 |
| 1 Earner | 38 (29.0%) | $47,083 |
| 2 Earners | 59 (45.0%) | $119,375 |
| 3+ Earners | 25 (19.1%) | $98,542 |
| Total | 131 (100.0%) | $84,844 |
Household Income in Melrose
Household Income Brackets in Melrose
With 38 households falling in the category, the $100,000 to $149,999 income range is the most frequent in Melrose, accounting for 17.1% of all households. In contrast, only 3 households (1.3%) fall into the $200,000+ income bracket, making it the least populous group.
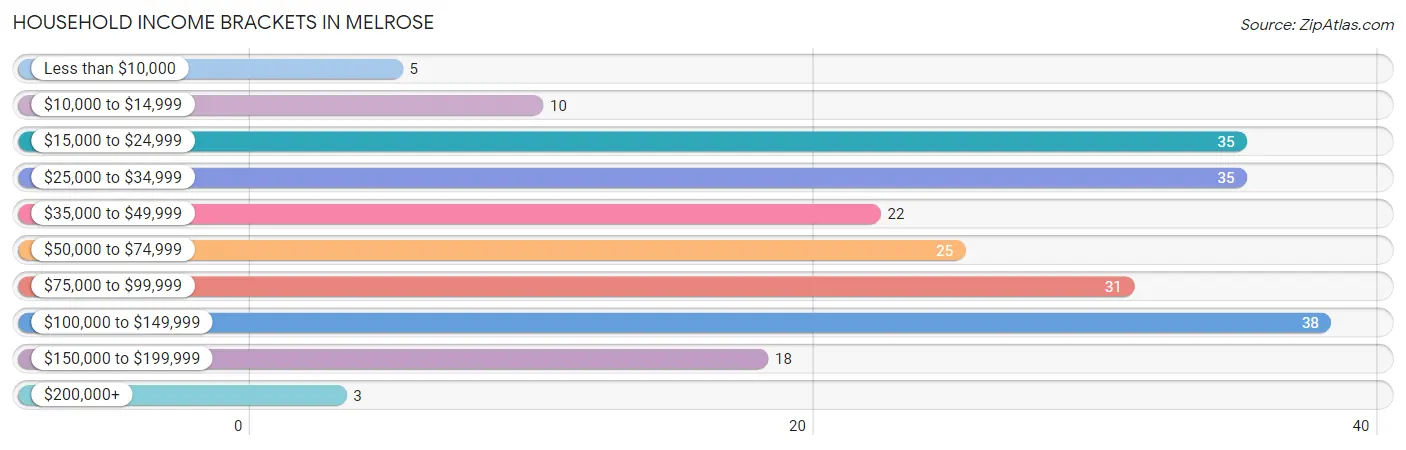
| Income Bracket | # Households | % Households |
| Less than $10,000 | 5 | 2.3% |
| $10,000 to $14,999 | 10 | 4.5% |
| $15,000 to $24,999 | 35 | 15.8% |
| $25,000 to $34,999 | 35 | 15.8% |
| $35,000 to $49,999 | 22 | 9.9% |
| $50,000 to $74,999 | 25 | 11.3% |
| $75,000 to $99,999 | 31 | 14.0% |
| $100,000 to $149,999 | 38 | 17.1% |
| $150,000 to $199,999 | 18 | 8.1% |
| $200,000+ | 3 | 1.4% |
Household Income by Householder Age in Melrose
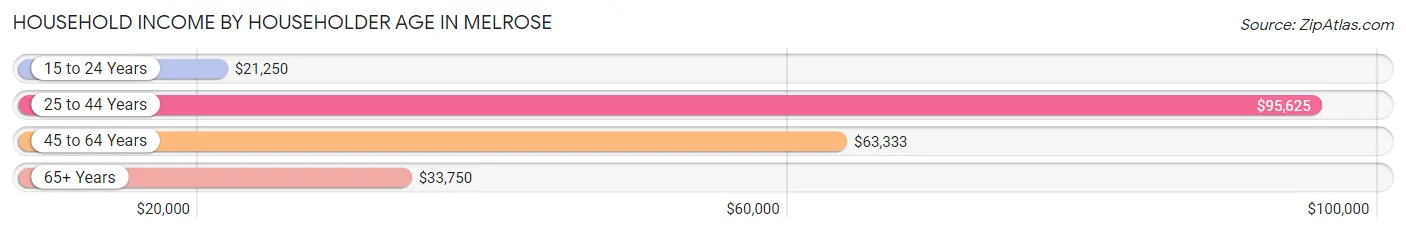
The median household income in Melrose is $55,833, with the highest median household income of $95,625 found in the 25 to 44 years age bracket for the primary householder. A total of 72 households (32.4%) fall into this category. Meanwhile, the 15 to 24 years age bracket for the primary householder has the lowest median household income of $21,250, with 18 households (8.1%) in this group.
| Income Bracket | # Households | Median Income |
| 15 to 24 Years | 18 (8.1%) | $21,250 |
| 25 to 44 Years | 72 (32.4%) | $95,625 |
| 45 to 64 Years | 82 (36.9%) | $63,333 |
| 65+ Years | 50 (22.5%) | $33,750 |
| Total | 222 (100.0%) | $55,833 |
Poverty in Melrose
Income Below Poverty by Sex and Age in Melrose
With 8.4% poverty level for males and 18.7% for females among the residents of Melrose, under 5 year old males and 45 to 54 year old females are the most vulnerable to poverty, with 14 males (60.9%) and 32 females (34.8%) in their respective age groups living below the poverty level.
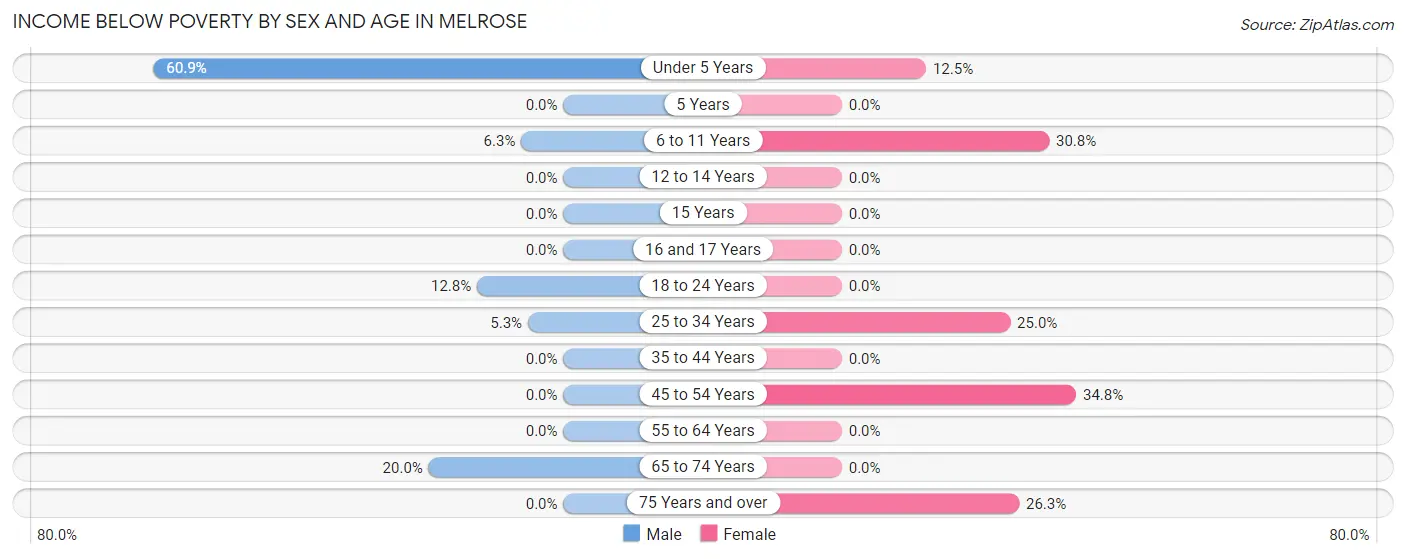
| Age Bracket | Male | Female |
| Under 5 Years | 14 (60.9%) | 1 (12.5%) |
| 5 Years | 0 (0.0%) | 0 (0.0%) |
| 6 to 11 Years | 1 (6.2%) | 8 (30.8%) |
| 12 to 14 Years | 0 (0.0%) | 0 (0.0%) |
| 15 Years | 0 (0.0%) | 0 (0.0%) |
| 16 and 17 Years | 0 (0.0%) | 0 (0.0%) |
| 18 to 24 Years | 5 (12.8%) | 0 (0.0%) |
| 25 to 34 Years | 3 (5.3%) | 10 (25.0%) |
| 35 to 44 Years | 0 (0.0%) | 0 (0.0%) |
| 45 to 54 Years | 0 (0.0%) | 32 (34.8%) |
| 55 to 64 Years | 0 (0.0%) | 0 (0.0%) |
| 65 to 74 Years | 2 (20.0%) | 0 (0.0%) |
| 75 Years and over | 0 (0.0%) | 5 (26.3%) |
| Total | 25 (8.4%) | 56 (18.7%) |
Income Above Poverty by Sex and Age in Melrose
According to the poverty statistics in Melrose, males aged 12 to 14 years and females aged 5 years are the age groups that are most secure financially, with 100.0% of males and 100.0% of females in these age groups living above the poverty line.
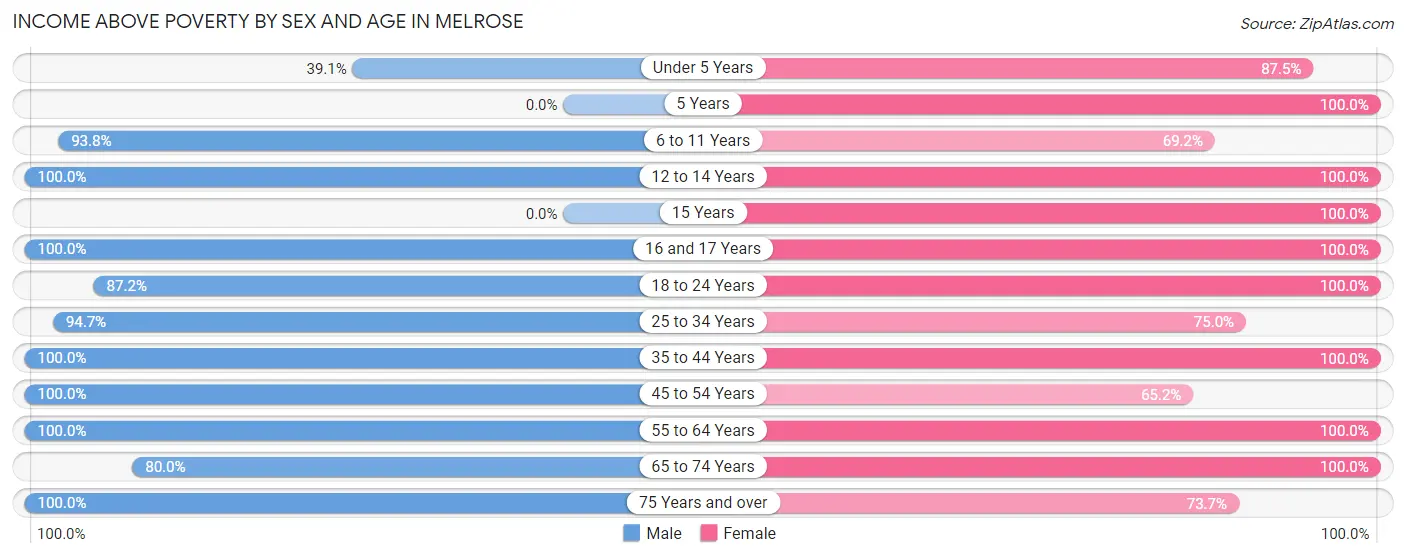
| Age Bracket | Male | Female |
| Under 5 Years | 9 (39.1%) | 7 (87.5%) |
| 5 Years | 0 (0.0%) | 2 (100.0%) |
| 6 to 11 Years | 15 (93.8%) | 18 (69.2%) |
| 12 to 14 Years | 15 (100.0%) | 6 (100.0%) |
| 15 Years | 0 (0.0%) | 4 (100.0%) |
| 16 and 17 Years | 12 (100.0%) | 2 (100.0%) |
| 18 to 24 Years | 34 (87.2%) | 27 (100.0%) |
| 25 to 34 Years | 54 (94.7%) | 30 (75.0%) |
| 35 to 44 Years | 30 (100.0%) | 23 (100.0%) |
| 45 to 54 Years | 24 (100.0%) | 60 (65.2%) |
| 55 to 64 Years | 47 (100.0%) | 31 (100.0%) |
| 65 to 74 Years | 8 (80.0%) | 19 (100.0%) |
| 75 Years and over | 24 (100.0%) | 14 (73.7%) |
| Total | 272 (91.6%) | 243 (81.3%) |
Income Below Poverty Among Married-Couple Families in Melrose
The poverty statistics for married-couple families in Melrose show that 3.7% or 4 of the total 108 families live below the poverty line. Families with 5 or more children have the highest poverty rate of 100.0%, comprising of 4 families. On the other hand, families with no children have the lowest poverty rate of 0.0%, which includes 0 families.
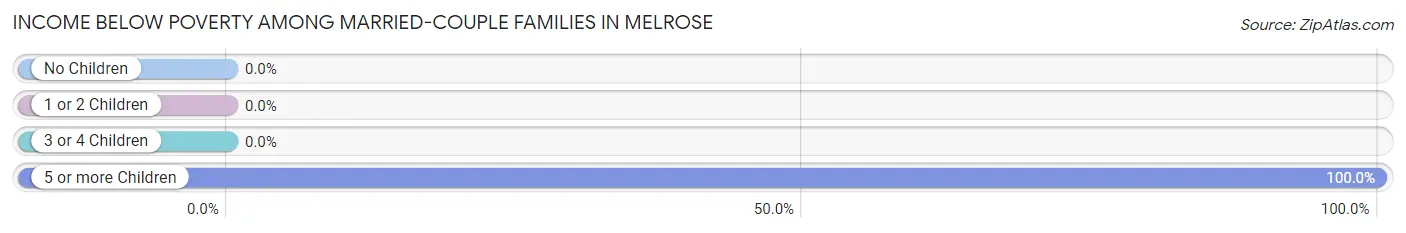
| Children | Above Poverty | Below Poverty |
| No Children | 63 (100.0%) | 0 (0.0%) |
| 1 or 2 Children | 35 (100.0%) | 0 (0.0%) |
| 3 or 4 Children | 6 (100.0%) | 0 (0.0%) |
| 5 or more Children | 0 (0.0%) | 4 (100.0%) |
| Total | 104 (96.3%) | 4 (3.7%) |
Income Below Poverty Among Single-Parent Households in Melrose
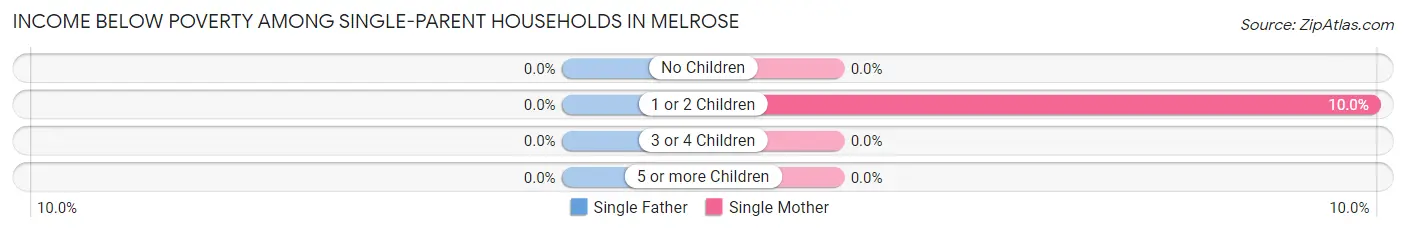
| Children | Single Father | Single Mother |
| No Children | 0 (0.0%) | 0 (0.0%) |
| 1 or 2 Children | 0 (0.0%) | 1 (10.0%) |
| 3 or 4 Children | 0 (0.0%) | 0 (0.0%) |
| 5 or more Children | 0 (0.0%) | 0 (0.0%) |
| Total | 0 (0.0%) | 1 (7.1%) |
Income Below Poverty Among Married-Couple vs Single-Parent Households in Melrose
The poverty data for Melrose shows that 4 of the married-couple family households (3.7%) and 1 of the single-parent households (4.3%) are living below the poverty level. Within the married-couple family households, those with 5 or more children have the highest poverty rate, with 4 households (100.0%) falling below the poverty line. Among the single-parent households, those with 1 or 2 children have the highest poverty rate, with 1 household (7.7%) living below poverty.
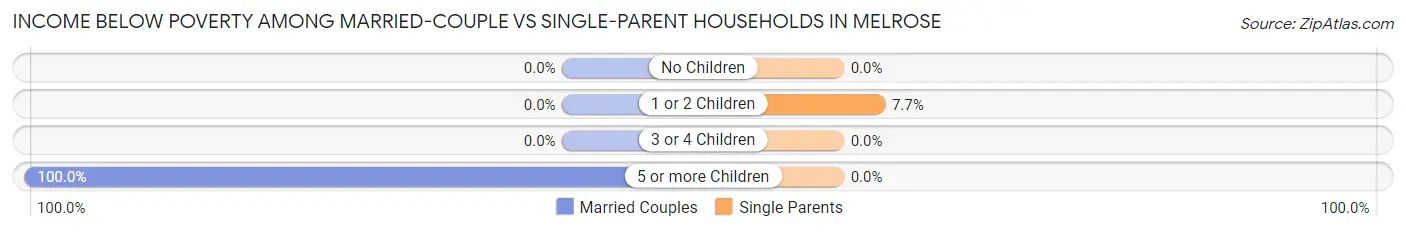
| Children | Married-Couple Families | Single-Parent Households |
| No Children | 0 (0.0%) | 0 (0.0%) |
| 1 or 2 Children | 0 (0.0%) | 1 (7.7%) |
| 3 or 4 Children | 0 (0.0%) | 0 (0.0%) |
| 5 or more Children | 4 (100.0%) | 0 (0.0%) |
| Total | 4 (3.7%) | 1 (4.3%) |
Race in Melrose
The most populous races in Melrose are White / Caucasian (539 | 90.4%), Two or more Races (51 | 8.6%), and Hispanic or Latino (46 | 7.7%).
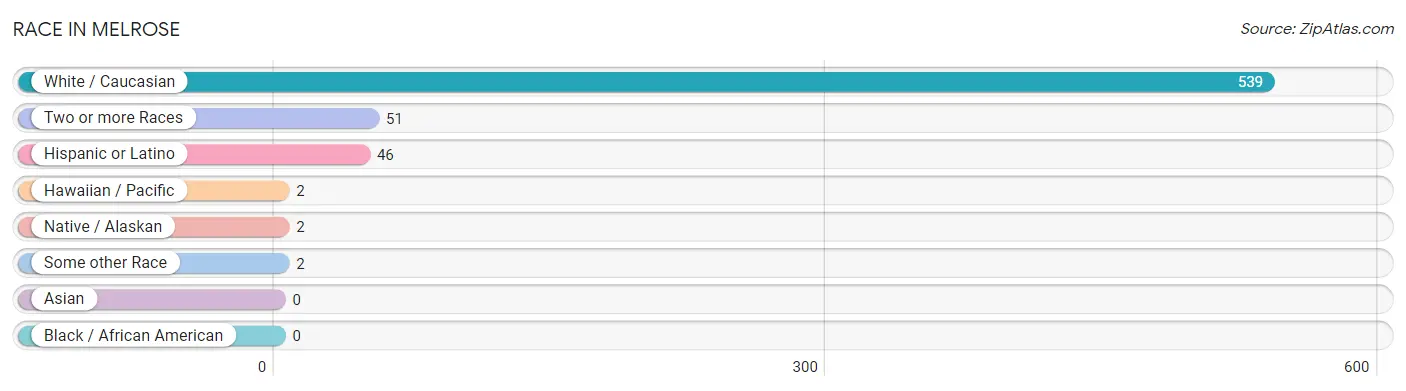
| Race | # Population | % Population |
| Asian | 0 | 0.0% |
| Black / African American | 0 | 0.0% |
| Hawaiian / Pacific | 2 | 0.3% |
| Hispanic or Latino | 46 | 7.7% |
| Native / Alaskan | 2 | 0.3% |
| White / Caucasian | 539 | 90.4% |
| Two or more Races | 51 | 8.6% |
| Some other Race | 2 | 0.3% |
| Total | 596 | 100.0% |
Ancestry in Melrose
The most populous ancestries reported in Melrose are German (219 | 36.7%), Norwegian (196 | 32.9%), Irish (97 | 16.3%), Polish (57 | 9.6%), and Mexican (40 | 6.7%), together accounting for 102.2% of all Melrose residents.
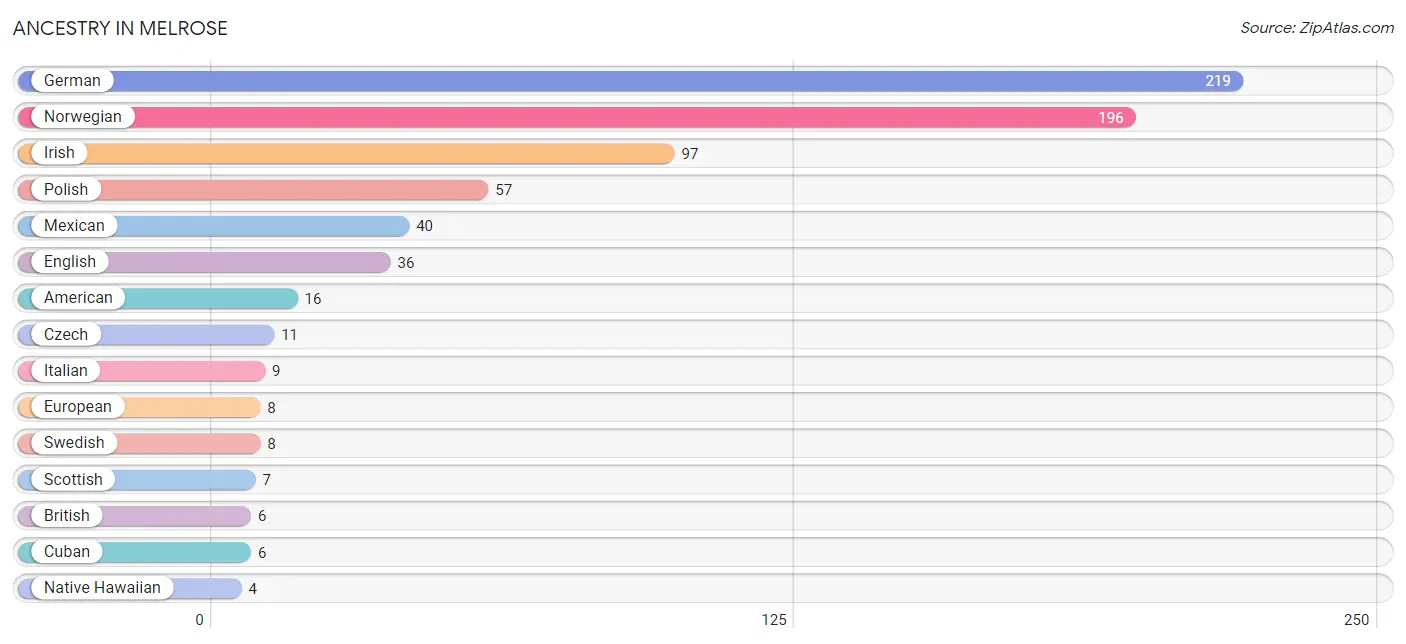
| Ancestry | # Population | % Population |
| American | 16 | 2.7% |
| British | 6 | 1.0% |
| Cuban | 6 | 1.0% |
| Czech | 11 | 1.8% |
| Czechoslovakian | 2 | 0.3% |
| Dutch | 2 | 0.3% |
| English | 36 | 6.0% |
| European | 8 | 1.3% |
| Finnish | 1 | 0.2% |
| German | 219 | 36.7% |
| Irish | 97 | 16.3% |
| Italian | 9 | 1.5% |
| Mexican | 40 | 6.7% |
| Native Hawaiian | 4 | 0.7% |
| Norwegian | 196 | 32.9% |
| Polish | 57 | 9.6% |
| Russian | 3 | 0.5% |
| Samoan | 4 | 0.7% |
| Scandinavian | 4 | 0.7% |
| Scottish | 7 | 1.2% |
| Swedish | 8 | 1.3% |
| Swiss | 3 | 0.5% | View All 22 Rows |
Immigrants in Melrose

| Immigration Origin | # Population | % Population | View All 0 Rows |
Sex and Age in Melrose
Sex and Age in Melrose
The most populous age groups in Melrose are 20 to 24 Years (37 | 12.5%) for men and 45 to 49 Years (73 | 24.4%) for women.
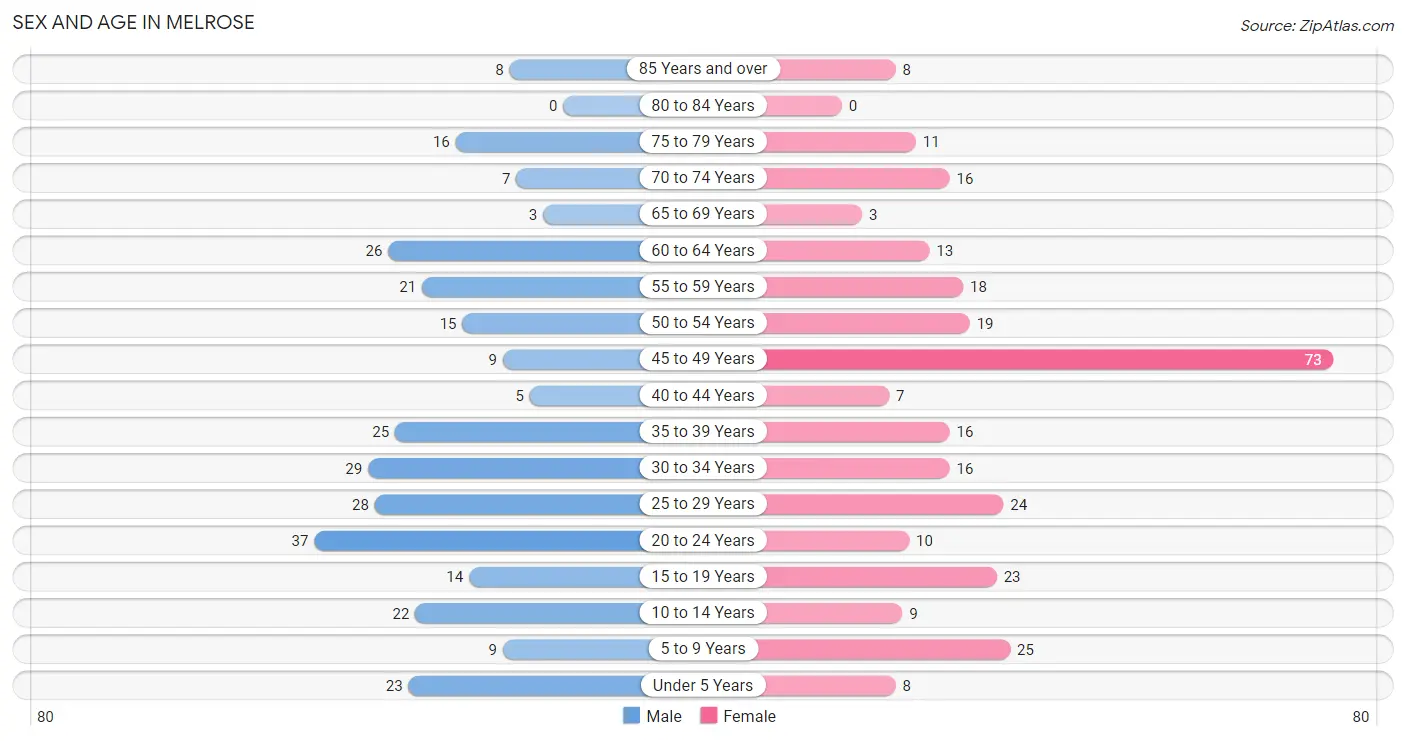
| Age Bracket | Male | Female |
| Under 5 Years | 23 (7.7%) | 8 (2.7%) |
| 5 to 9 Years | 9 (3.0%) | 25 (8.4%) |
| 10 to 14 Years | 22 (7.4%) | 9 (3.0%) |
| 15 to 19 Years | 14 (4.7%) | 23 (7.7%) |
| 20 to 24 Years | 37 (12.5%) | 10 (3.3%) |
| 25 to 29 Years | 28 (9.4%) | 24 (8.0%) |
| 30 to 34 Years | 29 (9.8%) | 16 (5.3%) |
| 35 to 39 Years | 25 (8.4%) | 16 (5.3%) |
| 40 to 44 Years | 5 (1.7%) | 7 (2.3%) |
| 45 to 49 Years | 9 (3.0%) | 73 (24.4%) |
| 50 to 54 Years | 15 (5.1%) | 19 (6.4%) |
| 55 to 59 Years | 21 (7.1%) | 18 (6.0%) |
| 60 to 64 Years | 26 (8.7%) | 13 (4.3%) |
| 65 to 69 Years | 3 (1.0%) | 3 (1.0%) |
| 70 to 74 Years | 7 (2.4%) | 16 (5.3%) |
| 75 to 79 Years | 16 (5.4%) | 11 (3.7%) |
| 80 to 84 Years | 0 (0.0%) | 0 (0.0%) |
| 85 Years and over | 8 (2.7%) | 8 (2.7%) |
| Total | 297 (100.0%) | 299 (100.0%) |
Families and Households in Melrose
Median Family Size in Melrose
The median family size in Melrose is 3.40 persons per family, with single female/mother families (14 | 10.7%) accounting for the largest median family size of 5.79 persons per family. On the other hand, married-couple families (108 | 82.4%) represent the smallest median family size with 3.09 persons per family.
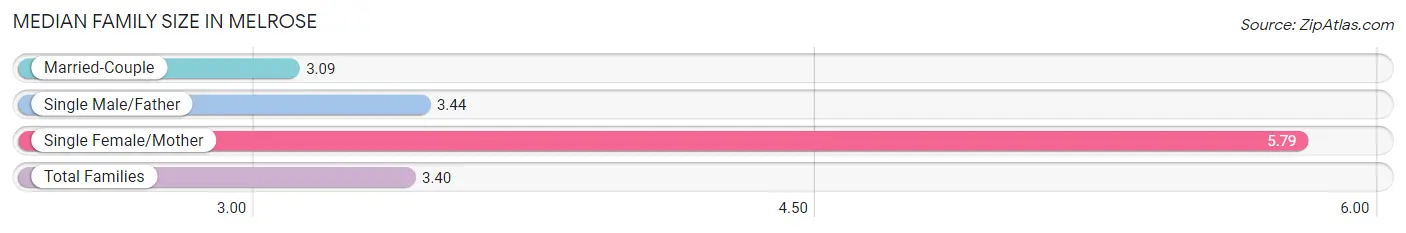
| Family Type | # Families | Family Size |
| Married-Couple | 108 (82.4%) | 3.09 |
| Single Male/Father | 9 (6.9%) | 3.44 |
| Single Female/Mother | 14 (10.7%) | 5.79 |
| Total Families | 131 (100.0%) | 3.40 |
Median Household Size in Melrose
The median household size in Melrose is 2.68 persons per household, with single female/mother households (14 | 6.3%) accounting for the largest median household size of 6.21 persons per household. non-family households (91 | 41.0%) represent the smallest median household size with 1.51 persons per household.
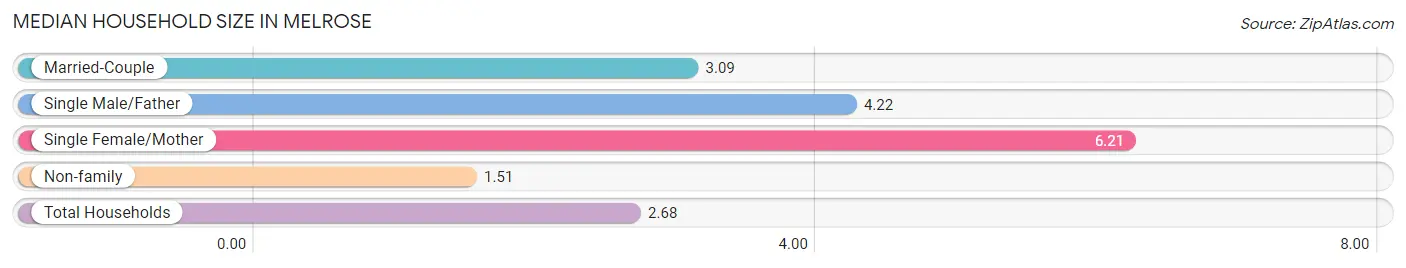
| Household Type | # Households | Household Size |
| Married-Couple | 108 (48.6%) | 3.09 |
| Single Male/Father | 9 (4.1%) | 4.22 |
| Single Female/Mother | 14 (6.3%) | 6.21 |
| Non-family | 91 (41.0%) | 1.51 |
| Total Households | 222 (100.0%) | 2.68 |
Household Size by Marriage Status in Melrose
Out of a total of 222 households in Melrose, 131 (59.0%) are family households, while 91 (41.0%) are nonfamily households. The most numerous type of family households are 2-person households, comprising 52, and the most common type of nonfamily households are 1-person households, comprising 79.
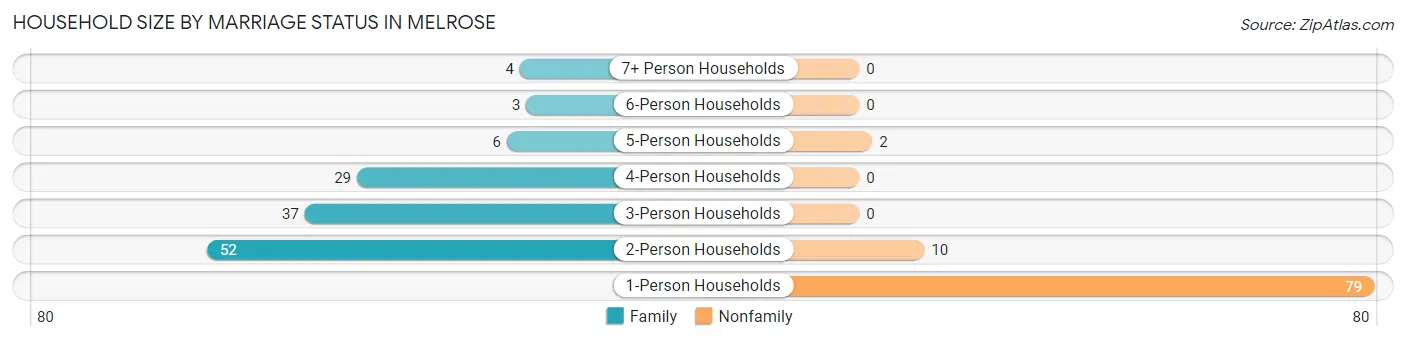
| Household Size | Family Households | Nonfamily Households |
| 1-Person Households | - | 79 (35.6%) |
| 2-Person Households | 52 (23.4%) | 10 (4.5%) |
| 3-Person Households | 37 (16.7%) | 0 (0.0%) |
| 4-Person Households | 29 (13.1%) | 0 (0.0%) |
| 5-Person Households | 6 (2.7%) | 2 (0.9%) |
| 6-Person Households | 3 (1.3%) | 0 (0.0%) |
| 7+ Person Households | 4 (1.8%) | 0 (0.0%) |
| Total | 131 (59.0%) | 91 (41.0%) |
Female Fertility in Melrose
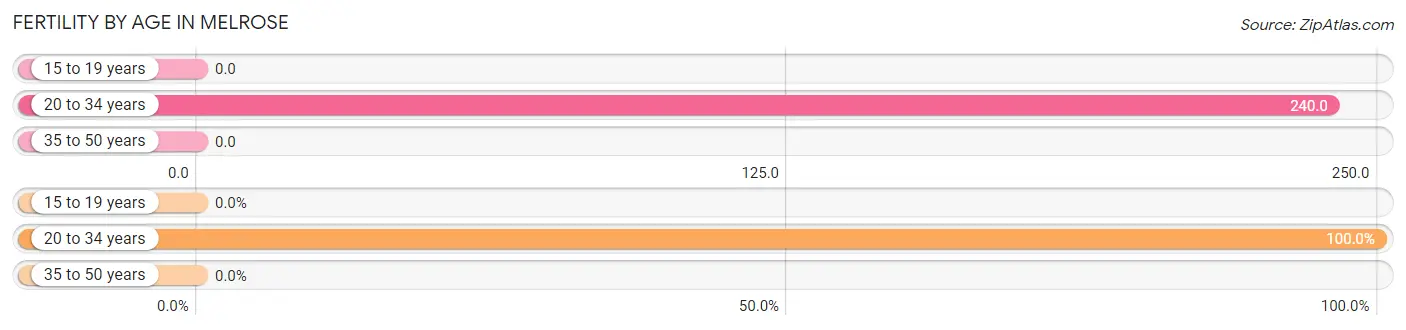
Fertility by Age in Melrose
Average fertility rate in Melrose is 66.0 births per 1,000 women. Women in the age bracket of 20 to 34 years have the highest fertility rate with 240.0 births per 1,000 women. Women in the age bracket of 20 to 34 years acount for 100.0% of all women with births.
| Age Bracket | Women with Births | Births / 1,000 Women |
| 15 to 19 years | 0 (0.0%) | 0.0 |
| 20 to 34 years | 12 (100.0%) | 240.0 |
| 35 to 50 years | 0 (0.0%) | 0.0 |
| Total | 12 (100.0%) | 66.0 |
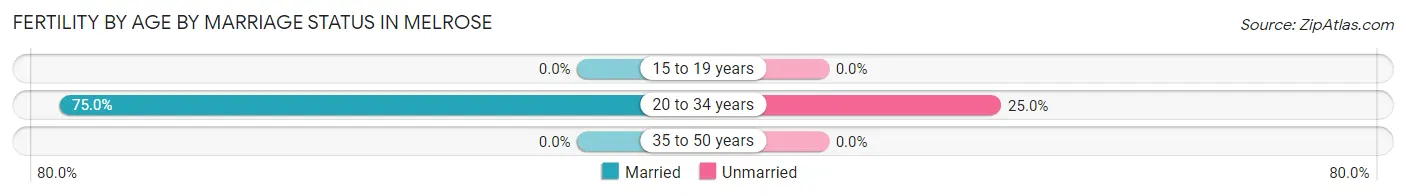
Fertility by Age by Marriage Status in Melrose
75.0% of women with births (12) in Melrose are married. The highest percentage of unmarried women with births falls into 20 to 34 years age bracket with 25.0% of them unmarried at the time of birth, while the lowest percentage of unmarried women with births belong to 20 to 34 years age bracket with 25.0% of them unmarried.
| Age Bracket | Married | Unmarried |
| 15 to 19 years | 0 (0.0%) | 0 (0.0%) |
| 20 to 34 years | 9 (75.0%) | 3 (25.0%) |
| 35 to 50 years | 0 (0.0%) | 0 (0.0%) |
| Total | 9 (75.0%) | 3 (25.0%) |
Fertility by Education in Melrose

| Educational Attainment | Women with Births | Births / 1,000 Women |
| Less than High School | 0 (0.0%) | 0.0 |
| High School Diploma | 6 (50.0%) | 118.0 |
| College or Associate's Degree | 1 (8.3%) | 14.0 |
| Bachelor's Degree | 5 (41.7%) | 357.0 |
| Graduate Degree | 0 (0.0%) | 0.0 |
| Total | 12 (100.0%) | 66.0 |
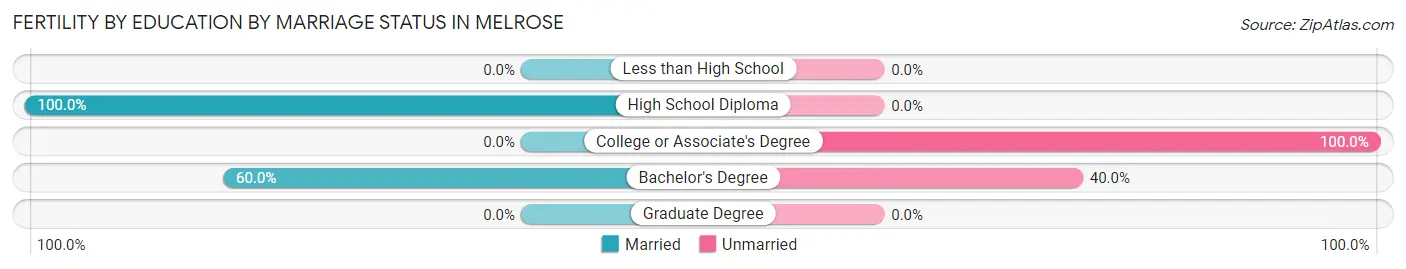
Fertility by Education by Marriage Status in Melrose
25.0% of women with births in Melrose are unmarried. Women with the educational attainment of high school diploma are most likely to be married with 100.0% of them married at childbirth, while women with the educational attainment of college or associate's degree are least likely to be married with 100.0% of them unmarried at childbirth.
| Educational Attainment | Married | Unmarried |
| Less than High School | 0 (0.0%) | 0 (0.0%) |
| High School Diploma | 6 (100.0%) | 0 (0.0%) |
| College or Associate's Degree | 0 (0.0%) | 1 (100.0%) |
| Bachelor's Degree | 3 (60.0%) | 2 (40.0%) |
| Graduate Degree | 0 (0.0%) | 0 (0.0%) |
| Total | 9 (75.0%) | 3 (25.0%) |
Employment Characteristics in Melrose
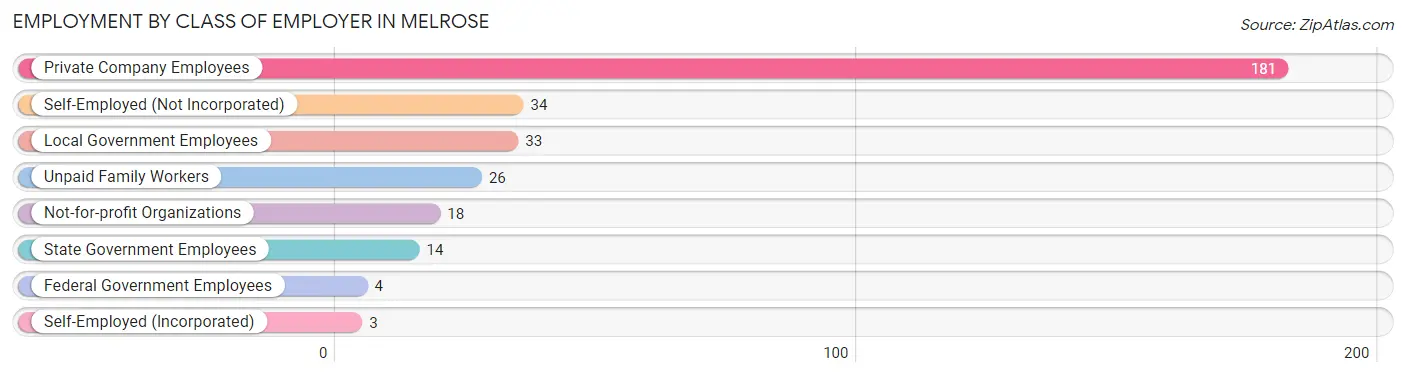
Employment by Class of Employer in Melrose
Among the 313 employed individuals in Melrose, private company employees (181 | 57.8%), self-employed (not incorporated) (34 | 10.9%), and local government employees (33 | 10.5%) make up the most common classes of employment.
| Employer Class | # Employees | % Employees |
| Private Company Employees | 181 | 57.8% |
| Self-Employed (Incorporated) | 3 | 1.0% |
| Self-Employed (Not Incorporated) | 34 | 10.9% |
| Not-for-profit Organizations | 18 | 5.8% |
| Local Government Employees | 33 | 10.5% |
| State Government Employees | 14 | 4.5% |
| Federal Government Employees | 4 | 1.3% |
| Unpaid Family Workers | 26 | 8.3% |
| Total | 313 | 100.0% |
Employment Status by Age in Melrose
According to the labor force statistics for Melrose, out of the total population over 16 years of age (496), 65.3% or 324 individuals are in the labor force, with 3.4% or 11 of them unemployed. The age group with the highest labor force participation rate is 35 to 44 years, with 96.2% or 51 individuals in the labor force. Within the labor force, the 20 to 24 years age range has the highest percentage of unemployed individuals, with 24.4% or 11 of them being unemployed.
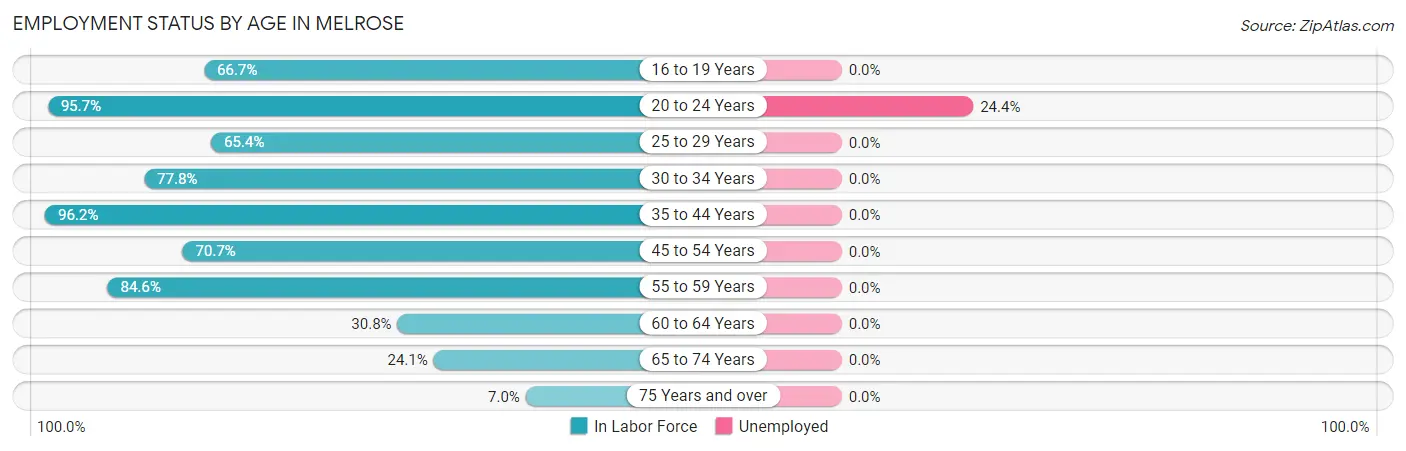
| Age Bracket | In Labor Force | Unemployed |
| 16 to 19 Years | 22 (66.7%) | 0 (0.0%) |
| 20 to 24 Years | 45 (95.7%) | 11 (24.4%) |
| 25 to 29 Years | 34 (65.4%) | 0 (0.0%) |
| 30 to 34 Years | 35 (77.8%) | 0 (0.0%) |
| 35 to 44 Years | 51 (96.2%) | 0 (0.0%) |
| 45 to 54 Years | 82 (70.7%) | 0 (0.0%) |
| 55 to 59 Years | 33 (84.6%) | 0 (0.0%) |
| 60 to 64 Years | 12 (30.8%) | 0 (0.0%) |
| 65 to 74 Years | 7 (24.1%) | 0 (0.0%) |
| 75 Years and over | 3 (7.0%) | 0 (0.0%) |
| Total | 324 (65.3%) | 11 (3.4%) |
Employment Status by Educational Attainment in Melrose
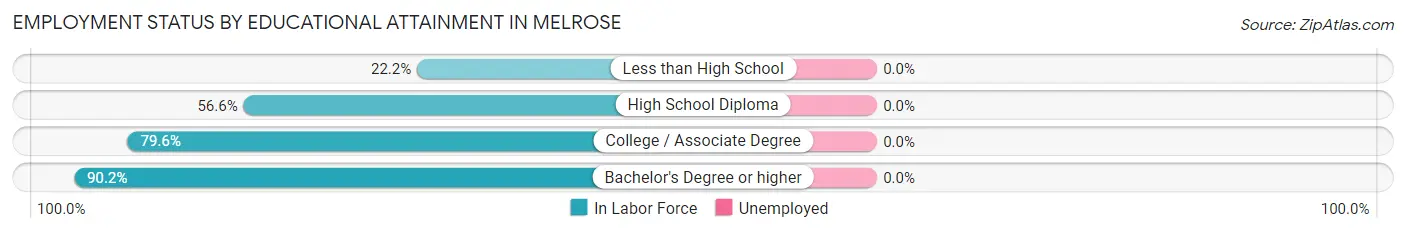
| Educational Attainment | In Labor Force | Unemployed |
| Less than High School | 2 (22.2%) | 0 (0.0%) |
| High School Diploma | 69 (56.6%) | 0 (0.0%) |
| College / Associate Degree | 121 (79.6%) | 0 (0.0%) |
| Bachelor's Degree or higher | 55 (90.2%) | 0 (0.0%) |
| Total | 247 (71.8%) | 0 (0.0%) |
Employment Occupations by Sex in Melrose
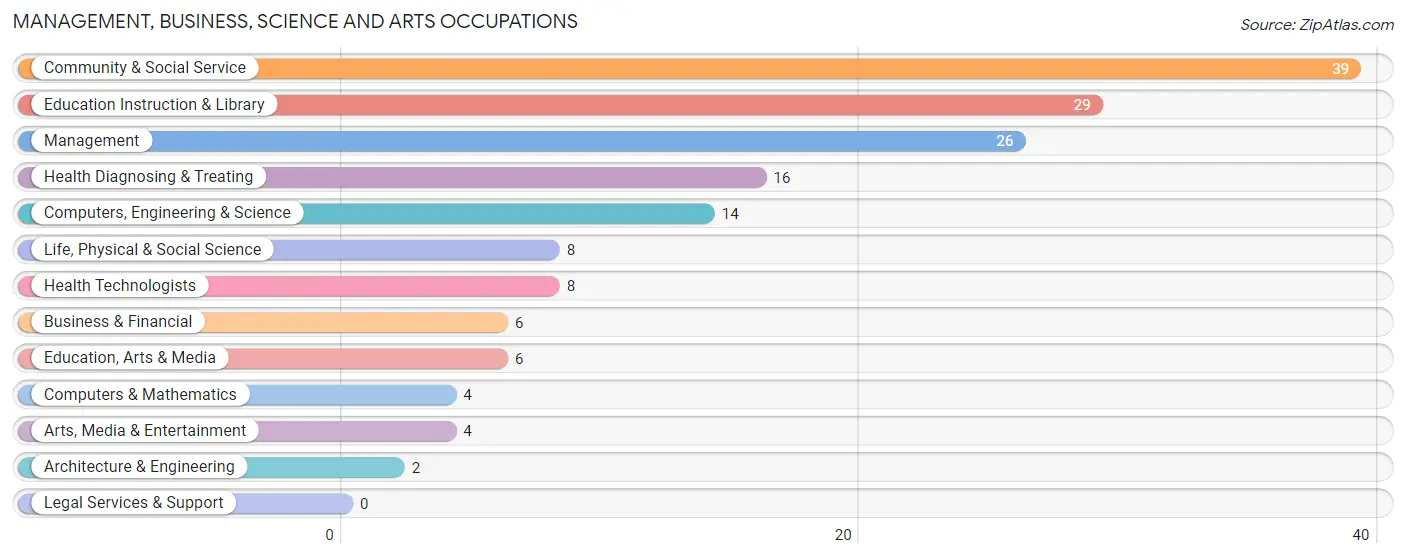
Management, Business, Science and Arts Occupations
The most common Management, Business, Science and Arts occupations in Melrose are Community & Social Service (39 | 12.5%), Education Instruction & Library (29 | 9.3%), Management (26 | 8.3%), Health Diagnosing & Treating (16 | 5.1%), and Computers, Engineering & Science (14 | 4.5%).
Management, Business, Science and Arts Occupations by Sex
Within the Management, Business, Science and Arts occupations in Melrose, the most male-oriented occupations are Business & Financial (100.0%), Life, Physical & Social Science (75.0%), and Computers, Engineering & Science (57.1%), while the most female-oriented occupations are Architecture & Engineering (100.0%), Education, Arts & Media (100.0%), and Arts, Media & Entertainment (100.0%).
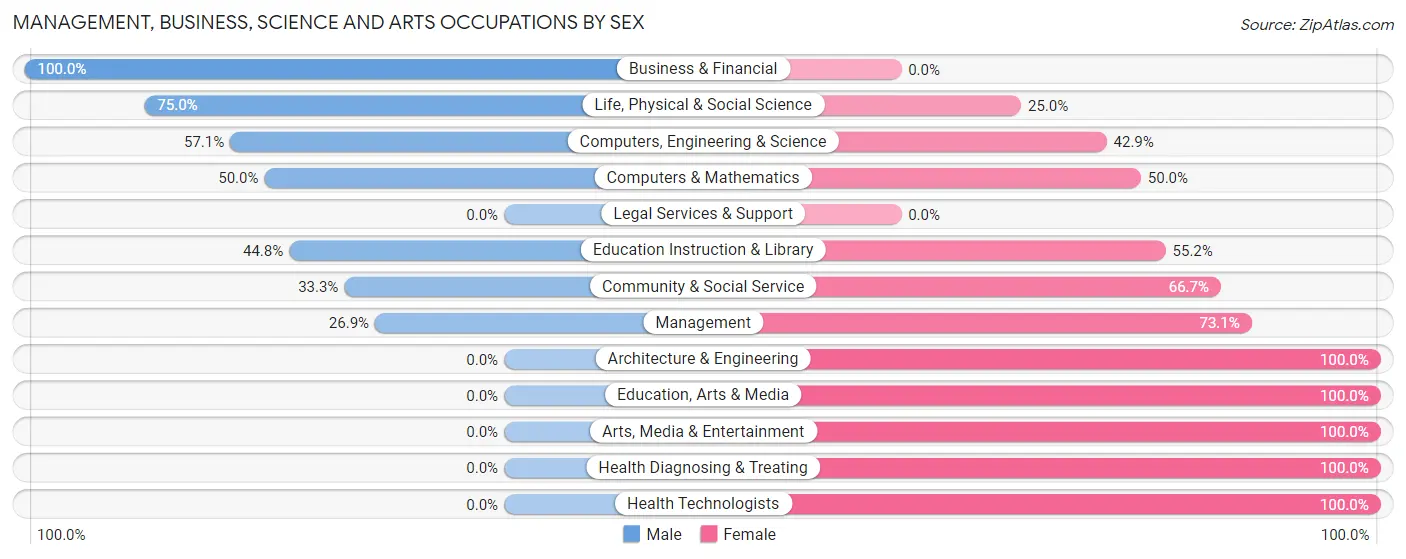
| Occupation | Male | Female |
| Management | 7 (26.9%) | 19 (73.1%) |
| Business & Financial | 6 (100.0%) | 0 (0.0%) |
| Computers, Engineering & Science | 8 (57.1%) | 6 (42.9%) |
| Computers & Mathematics | 2 (50.0%) | 2 (50.0%) |
| Architecture & Engineering | 0 (0.0%) | 2 (100.0%) |
| Life, Physical & Social Science | 6 (75.0%) | 2 (25.0%) |
| Community & Social Service | 13 (33.3%) | 26 (66.7%) |
| Education, Arts & Media | 0 (0.0%) | 6 (100.0%) |
| Legal Services & Support | 0 (0.0%) | 0 (0.0%) |
| Education Instruction & Library | 13 (44.8%) | 16 (55.2%) |
| Arts, Media & Entertainment | 0 (0.0%) | 4 (100.0%) |
| Health Diagnosing & Treating | 0 (0.0%) | 16 (100.0%) |
| Health Technologists | 0 (0.0%) | 8 (100.0%) |
| Total (Category) | 34 (33.7%) | 67 (66.3%) |
| Total (Overall) | 156 (49.8%) | 157 (50.2%) |
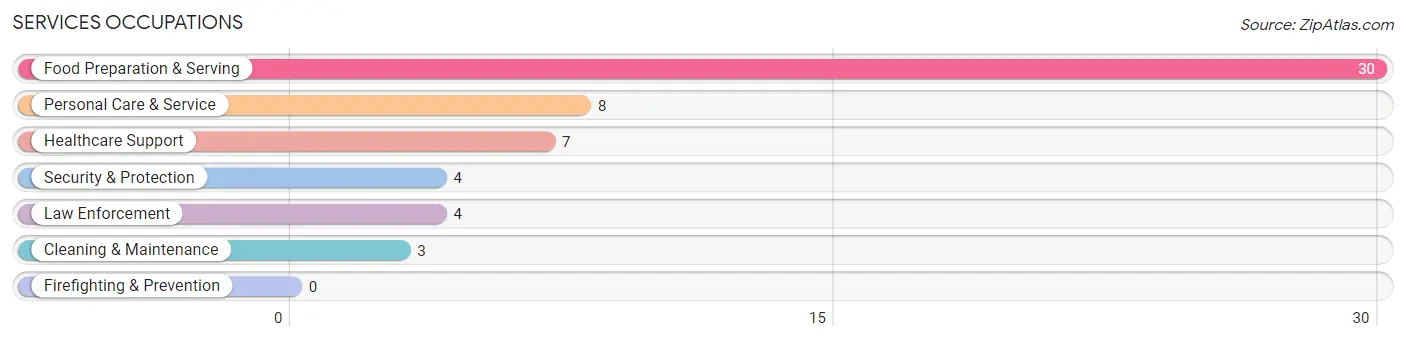
Services Occupations
The most common Services occupations in Melrose are Food Preparation & Serving (30 | 9.6%), Personal Care & Service (8 | 2.6%), Healthcare Support (7 | 2.2%), Security & Protection (4 | 1.3%), and Law Enforcement (4 | 1.3%).
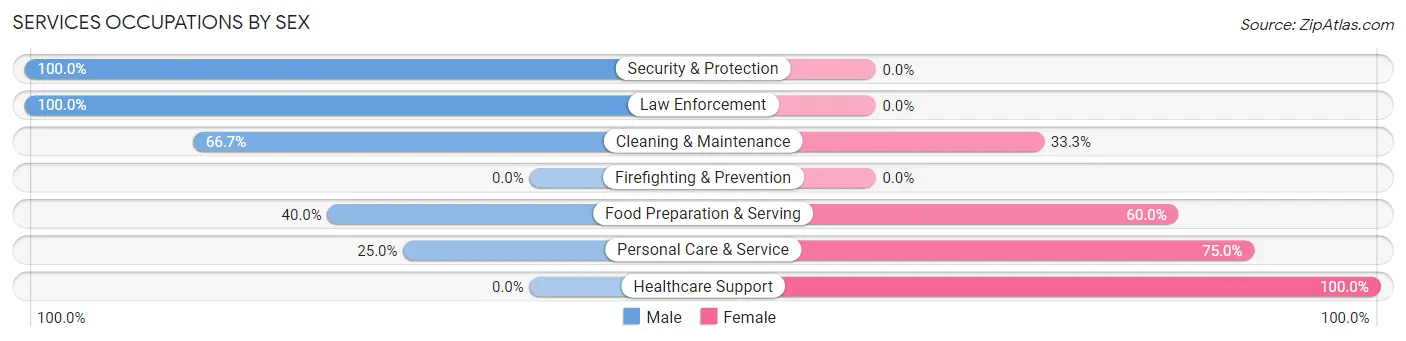
Services Occupations by Sex
Within the Services occupations in Melrose, the most male-oriented occupations are Security & Protection (100.0%), Law Enforcement (100.0%), and Cleaning & Maintenance (66.7%), while the most female-oriented occupations are Healthcare Support (100.0%), Personal Care & Service (75.0%), and Food Preparation & Serving (60.0%).
| Occupation | Male | Female |
| Healthcare Support | 0 (0.0%) | 7 (100.0%) |
| Security & Protection | 4 (100.0%) | 0 (0.0%) |
| Firefighting & Prevention | 0 (0.0%) | 0 (0.0%) |
| Law Enforcement | 4 (100.0%) | 0 (0.0%) |
| Food Preparation & Serving | 12 (40.0%) | 18 (60.0%) |
| Cleaning & Maintenance | 2 (66.7%) | 1 (33.3%) |
| Personal Care & Service | 2 (25.0%) | 6 (75.0%) |
| Total (Category) | 20 (38.5%) | 32 (61.5%) |
| Total (Overall) | 156 (49.8%) | 157 (50.2%) |
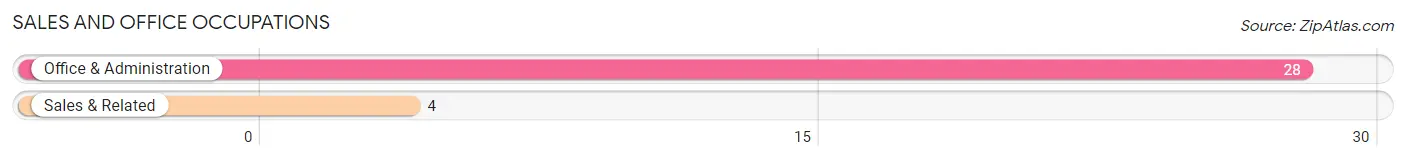
Sales and Office Occupations
The most common Sales and Office occupations in Melrose are Office & Administration (28 | 8.9%), and Sales & Related (4 | 1.3%).
Sales and Office Occupations by Sex

| Occupation | Male | Female |
| Sales & Related | 4 (100.0%) | 0 (0.0%) |
| Office & Administration | 5 (17.9%) | 23 (82.1%) |
| Total (Category) | 9 (28.1%) | 23 (71.9%) |
| Total (Overall) | 156 (49.8%) | 157 (50.2%) |
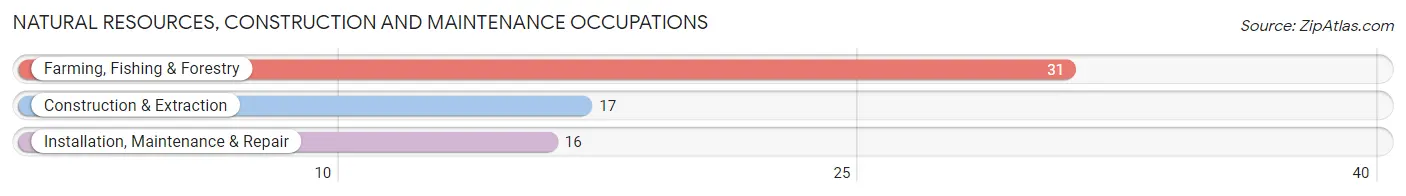
Natural Resources, Construction and Maintenance Occupations
The most common Natural Resources, Construction and Maintenance occupations in Melrose are Farming, Fishing & Forestry (31 | 9.9%), Construction & Extraction (17 | 5.4%), and Installation, Maintenance & Repair (16 | 5.1%).
Natural Resources, Construction and Maintenance Occupations by Sex

| Occupation | Male | Female |
| Farming, Fishing & Forestry | 5 (16.1%) | 26 (83.9%) |
| Construction & Extraction | 17 (100.0%) | 0 (0.0%) |
| Installation, Maintenance & Repair | 16 (100.0%) | 0 (0.0%) |
| Total (Category) | 38 (59.4%) | 26 (40.6%) |
| Total (Overall) | 156 (49.8%) | 157 (50.2%) |
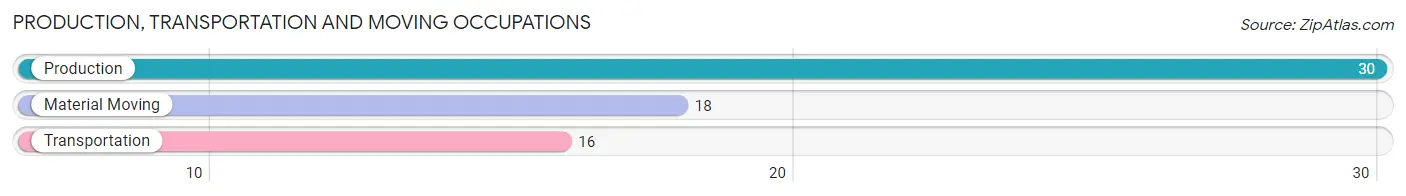
Production, Transportation and Moving Occupations
The most common Production, Transportation and Moving occupations in Melrose are Production (30 | 9.6%), Material Moving (18 | 5.8%), and Transportation (16 | 5.1%).
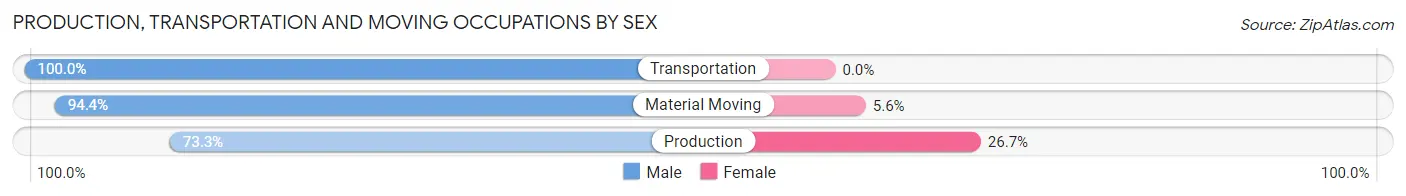
Production, Transportation and Moving Occupations by Sex
| Occupation | Male | Female |
| Production | 22 (73.3%) | 8 (26.7%) |
| Transportation | 16 (100.0%) | 0 (0.0%) |
| Material Moving | 17 (94.4%) | 1 (5.6%) |
| Total (Category) | 55 (85.9%) | 9 (14.1%) |
| Total (Overall) | 156 (49.8%) | 157 (50.2%) |
Employment Industries by Sex in Melrose
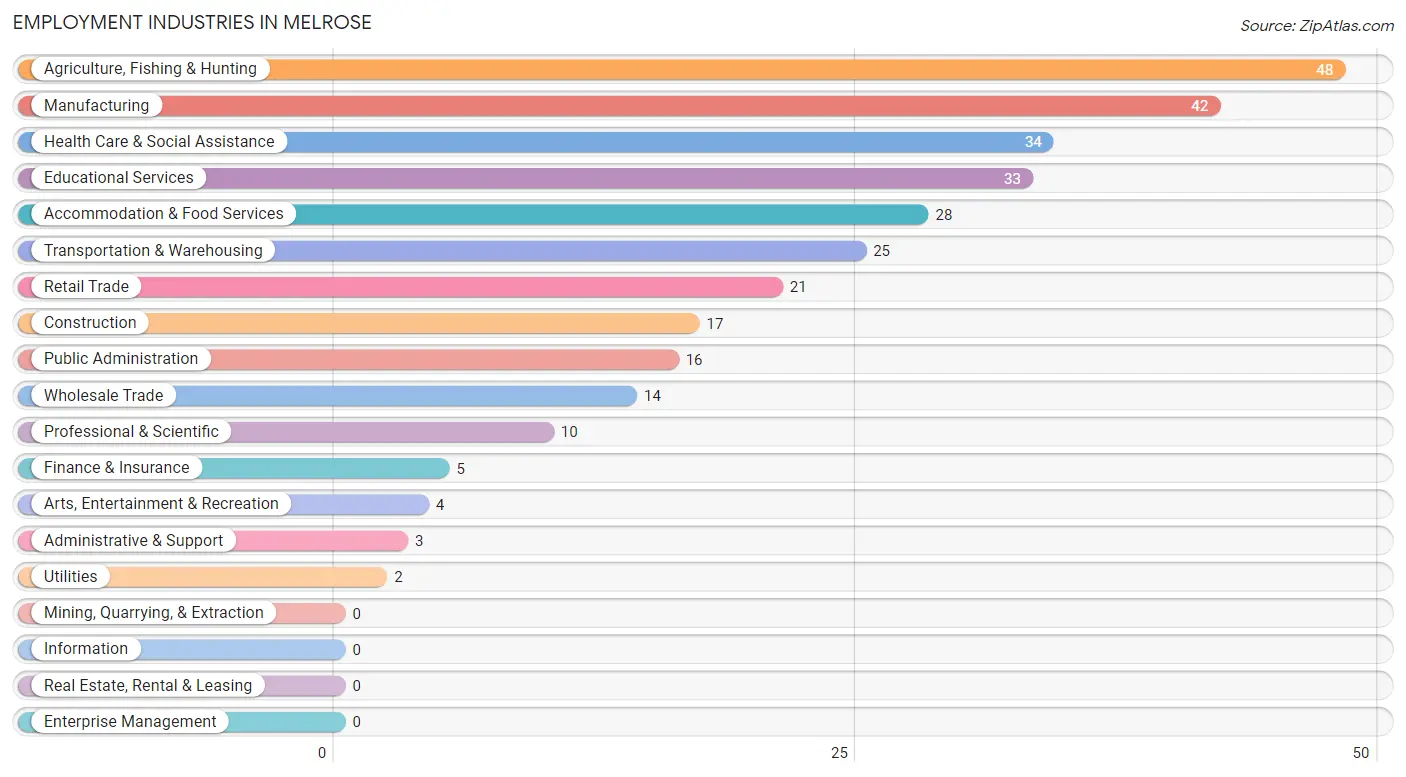
Employment Industries in Melrose
The major employment industries in Melrose include Agriculture, Fishing & Hunting (48 | 15.3%), Manufacturing (42 | 13.4%), Health Care & Social Assistance (34 | 10.9%), Educational Services (33 | 10.5%), and Accommodation & Food Services (28 | 8.9%).
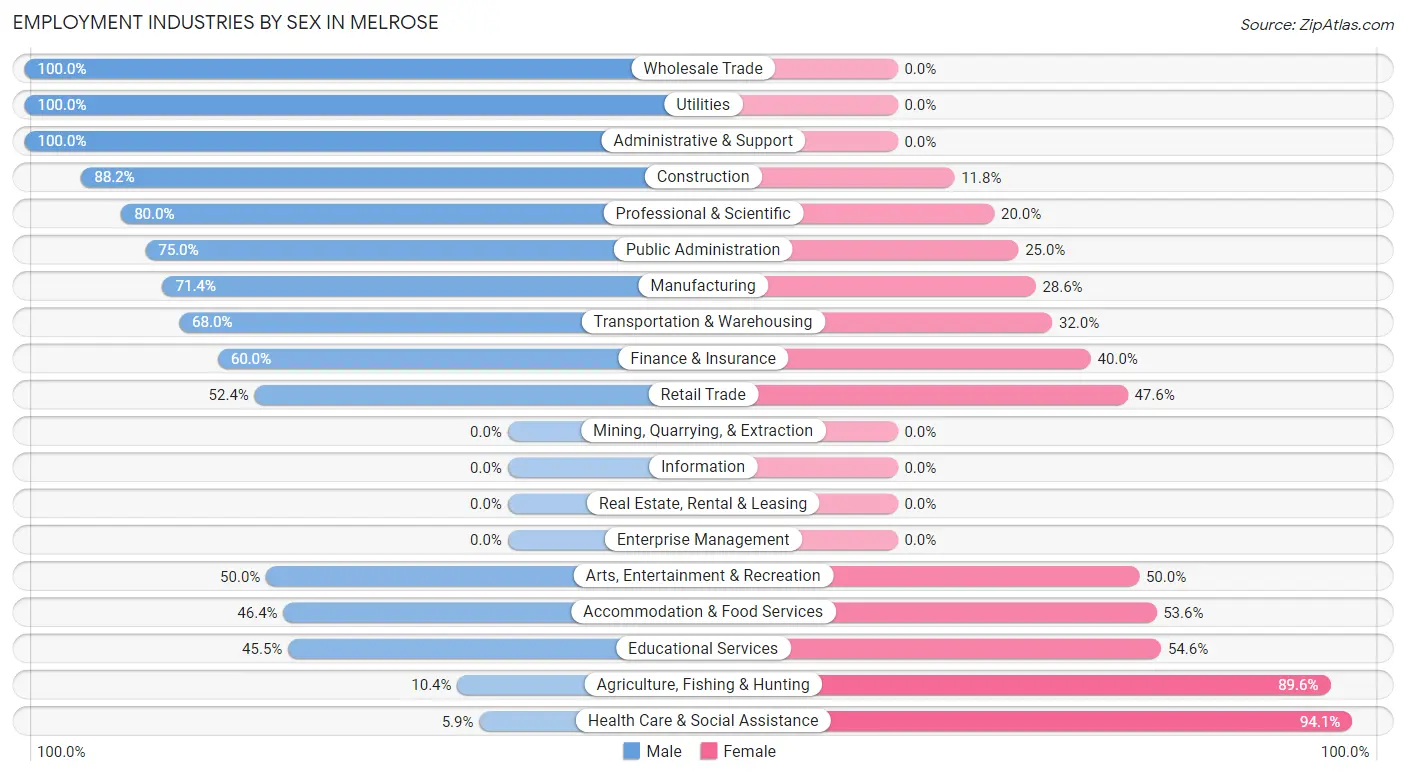
Employment Industries by Sex in Melrose
The Melrose industries that see more men than women are Wholesale Trade (100.0%), Utilities (100.0%), and Administrative & Support (100.0%), whereas the industries that tend to have a higher number of women are Health Care & Social Assistance (94.1%), Agriculture, Fishing & Hunting (89.6%), and Educational Services (54.5%).
| Industry | Male | Female |
| Agriculture, Fishing & Hunting | 5 (10.4%) | 43 (89.6%) |
| Mining, Quarrying, & Extraction | 0 (0.0%) | 0 (0.0%) |
| Construction | 15 (88.2%) | 2 (11.8%) |
| Manufacturing | 30 (71.4%) | 12 (28.6%) |
| Wholesale Trade | 14 (100.0%) | 0 (0.0%) |
| Retail Trade | 11 (52.4%) | 10 (47.6%) |
| Transportation & Warehousing | 17 (68.0%) | 8 (32.0%) |
| Utilities | 2 (100.0%) | 0 (0.0%) |
| Information | 0 (0.0%) | 0 (0.0%) |
| Finance & Insurance | 3 (60.0%) | 2 (40.0%) |
| Real Estate, Rental & Leasing | 0 (0.0%) | 0 (0.0%) |
| Professional & Scientific | 8 (80.0%) | 2 (20.0%) |
| Enterprise Management | 0 (0.0%) | 0 (0.0%) |
| Administrative & Support | 3 (100.0%) | 0 (0.0%) |
| Educational Services | 15 (45.5%) | 18 (54.5%) |
| Health Care & Social Assistance | 2 (5.9%) | 32 (94.1%) |
| Arts, Entertainment & Recreation | 2 (50.0%) | 2 (50.0%) |
| Accommodation & Food Services | 13 (46.4%) | 15 (53.6%) |
| Public Administration | 12 (75.0%) | 4 (25.0%) |
| Total | 156 (49.8%) | 157 (50.2%) |
Education in Melrose
School Enrollment in Melrose
The most common levels of schooling among the 116 students in Melrose are elementary school (29 | 25.0%), middle school (23 | 19.8%), and high school (21 | 18.1%).
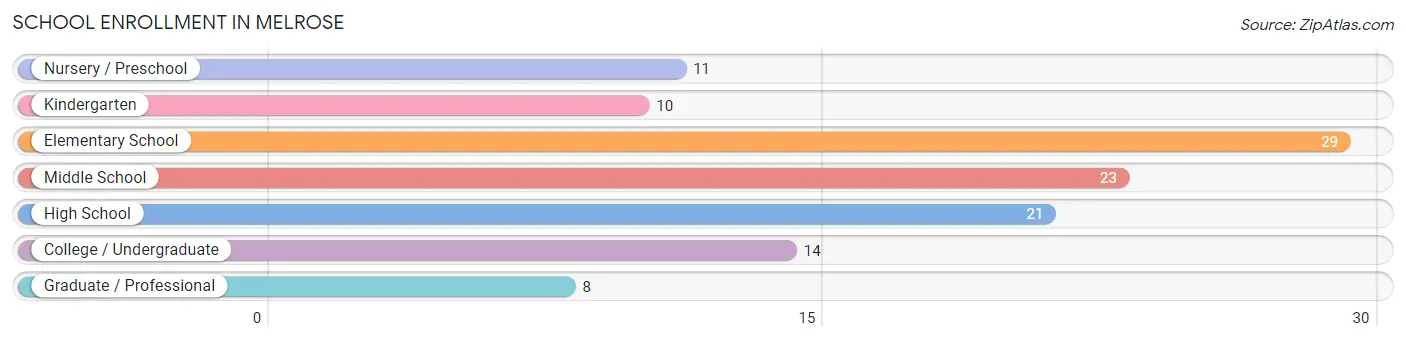
| School Level | # Students | % Students |
| Nursery / Preschool | 11 | 9.5% |
| Kindergarten | 10 | 8.6% |
| Elementary School | 29 | 25.0% |
| Middle School | 23 | 19.8% |
| High School | 21 | 18.1% |
| College / Undergraduate | 14 | 12.1% |
| Graduate / Professional | 8 | 6.9% |
| Total | 116 | 100.0% |
School Enrollment by Age by Funding Source in Melrose
Out of a total of 116 students who are enrolled in schools in Melrose, 3 (2.6%) attend a private institution, while the remaining 113 (97.4%) are enrolled in public schools. The age group of 20 to 24 year olds has the highest likelihood of being enrolled in private schools, with 3 (50.0% in the age bracket) enrolled. Conversely, the age group of 3 to 4 year olds has the lowest likelihood of being enrolled in a private school, with 9 (100.0% in the age bracket) attending a public institution.
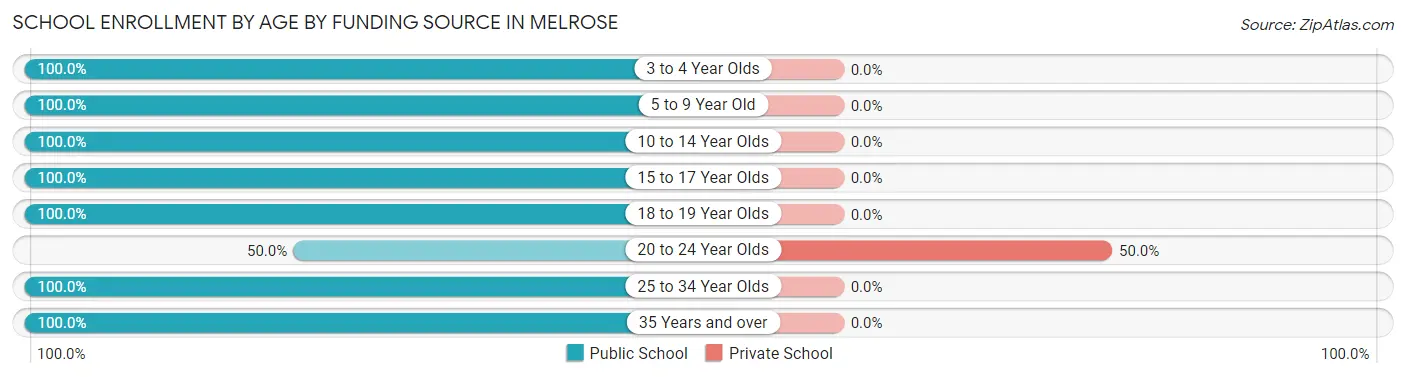
| Age Bracket | Public School | Private School |
| 3 to 4 Year Olds | 9 (100.0%) | 0 (0.0%) |
| 5 to 9 Year Old | 34 (100.0%) | 0 (0.0%) |
| 10 to 14 Year Olds | 31 (100.0%) | 0 (0.0%) |
| 15 to 17 Year Olds | 18 (100.0%) | 0 (0.0%) |
| 18 to 19 Year Olds | 2 (100.0%) | 0 (0.0%) |
| 20 to 24 Year Olds | 3 (50.0%) | 3 (50.0%) |
| 25 to 34 Year Olds | 14 (100.0%) | 0 (0.0%) |
| 35 Years and over | 2 (100.0%) | 0 (0.0%) |
| Total | 113 (97.4%) | 3 (2.6%) |
Educational Attainment by Field of Study in Melrose
Education (17 | 21.0%), science & technology (15 | 18.5%), bio, nature & agricultural (10 | 12.3%), arts & humanities (10 | 12.3%), and business (9 | 11.1%) are the most common fields of study among 81 individuals in Melrose who have obtained a bachelor's degree or higher.
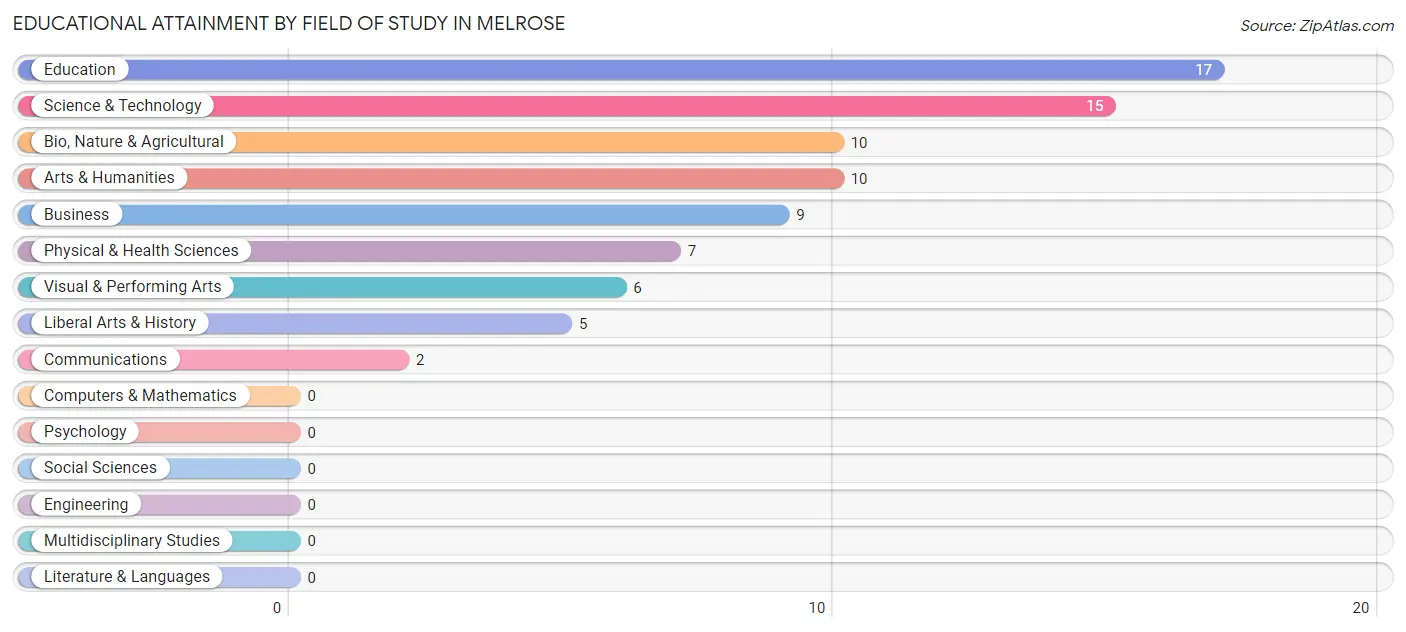
| Field of Study | # Graduates | % Graduates |
| Computers & Mathematics | 0 | 0.0% |
| Bio, Nature & Agricultural | 10 | 12.3% |
| Physical & Health Sciences | 7 | 8.6% |
| Psychology | 0 | 0.0% |
| Social Sciences | 0 | 0.0% |
| Engineering | 0 | 0.0% |
| Multidisciplinary Studies | 0 | 0.0% |
| Science & Technology | 15 | 18.5% |
| Business | 9 | 11.1% |
| Education | 17 | 21.0% |
| Literature & Languages | 0 | 0.0% |
| Liberal Arts & History | 5 | 6.2% |
| Visual & Performing Arts | 6 | 7.4% |
| Communications | 2 | 2.5% |
| Arts & Humanities | 10 | 12.3% |
| Total | 81 | 100.0% |
Transportation & Commute in Melrose
Vehicle Availability by Sex in Melrose
The most prevalent vehicle ownership categories in Melrose are males with 2 vehicles (84, accounting for 53.8%) and females with 2 vehicles (49, making up 53.5%).
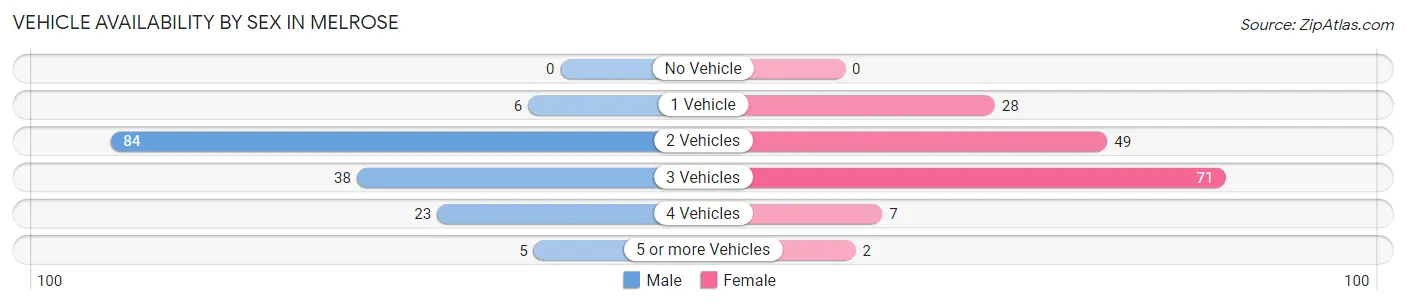
| Vehicles Available | Male | Female |
| No Vehicle | 0 (0.0%) | 0 (0.0%) |
| 1 Vehicle | 6 (3.8%) | 28 (17.8%) |
| 2 Vehicles | 84 (53.8%) | 49 (31.2%) |
| 3 Vehicles | 38 (24.4%) | 71 (45.2%) |
| 4 Vehicles | 23 (14.7%) | 7 (4.5%) |
| 5 or more Vehicles | 5 (3.2%) | 2 (1.3%) |
| Total | 156 (100.0%) | 157 (100.0%) |
Commute Time in Melrose
The most frequently occuring commute durations in Melrose are 5 to 9 minutes (67 commuters, 23.7%), 20 to 24 minutes (47 commuters, 16.6%), and 45 to 59 minutes (45 commuters, 15.9%).
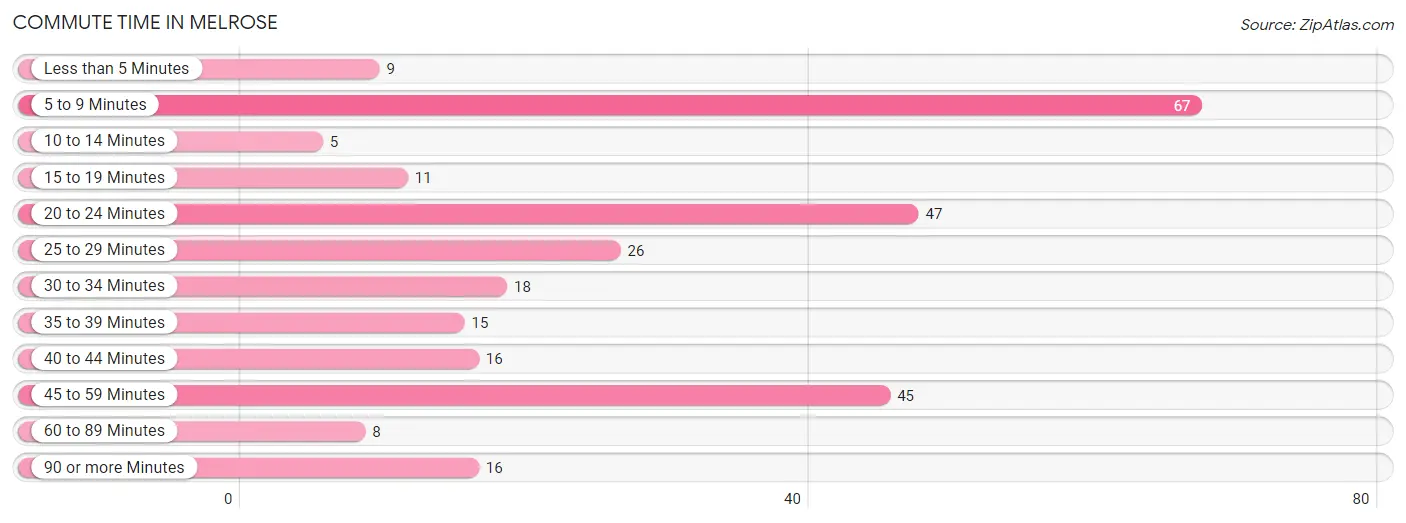
| Commute Time | # Commuters | % Commuters |
| Less than 5 Minutes | 9 | 3.2% |
| 5 to 9 Minutes | 67 | 23.7% |
| 10 to 14 Minutes | 5 | 1.8% |
| 15 to 19 Minutes | 11 | 3.9% |
| 20 to 24 Minutes | 47 | 16.6% |
| 25 to 29 Minutes | 26 | 9.2% |
| 30 to 34 Minutes | 18 | 6.4% |
| 35 to 39 Minutes | 15 | 5.3% |
| 40 to 44 Minutes | 16 | 5.7% |
| 45 to 59 Minutes | 45 | 15.9% |
| 60 to 89 Minutes | 8 | 2.8% |
| 90 or more Minutes | 16 | 5.7% |
Commute Time by Sex in Melrose
The most common commute times in Melrose are 45 to 59 minutes (28 commuters, 19.7%) for males and 5 to 9 minutes (52 commuters, 36.9%) for females.
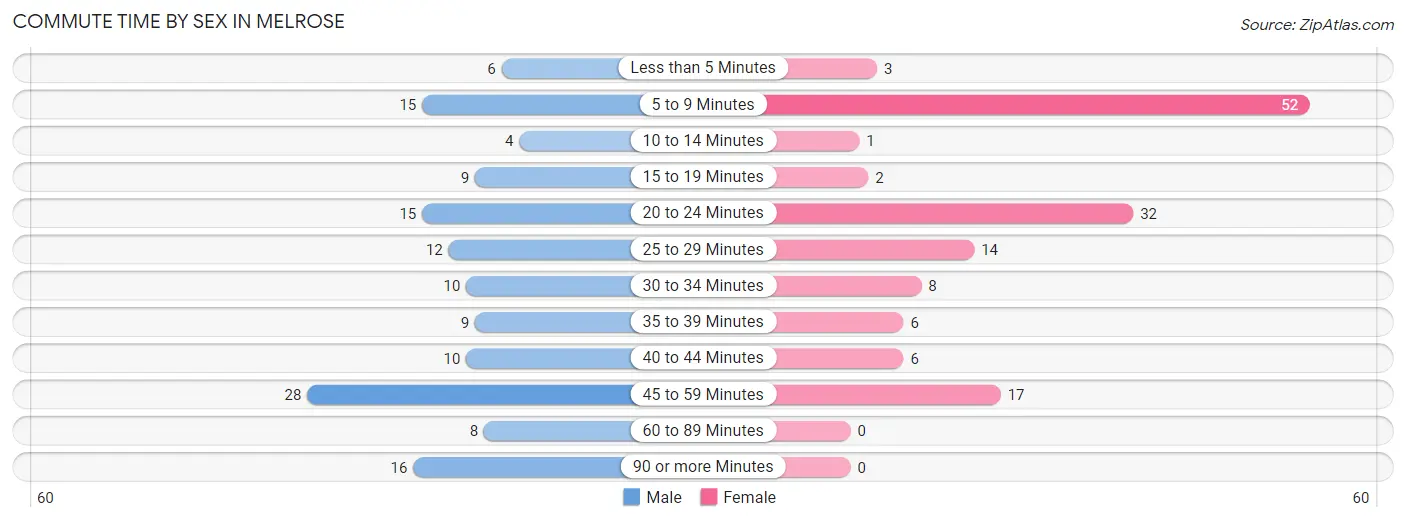
| Commute Time | Male | Female |
| Less than 5 Minutes | 6 (4.2%) | 3 (2.1%) |
| 5 to 9 Minutes | 15 (10.6%) | 52 (36.9%) |
| 10 to 14 Minutes | 4 (2.8%) | 1 (0.7%) |
| 15 to 19 Minutes | 9 (6.3%) | 2 (1.4%) |
| 20 to 24 Minutes | 15 (10.6%) | 32 (22.7%) |
| 25 to 29 Minutes | 12 (8.5%) | 14 (9.9%) |
| 30 to 34 Minutes | 10 (7.0%) | 8 (5.7%) |
| 35 to 39 Minutes | 9 (6.3%) | 6 (4.3%) |
| 40 to 44 Minutes | 10 (7.0%) | 6 (4.3%) |
| 45 to 59 Minutes | 28 (19.7%) | 17 (12.1%) |
| 60 to 89 Minutes | 8 (5.6%) | 0 (0.0%) |
| 90 or more Minutes | 16 (11.3%) | 0 (0.0%) |
Time of Departure to Work by Sex in Melrose
The most frequent times of departure to work in Melrose are 12:00 PM to 3:59 PM (24, 16.9%) for males and 7:00 AM to 7:29 AM (38, 27.0%) for females.
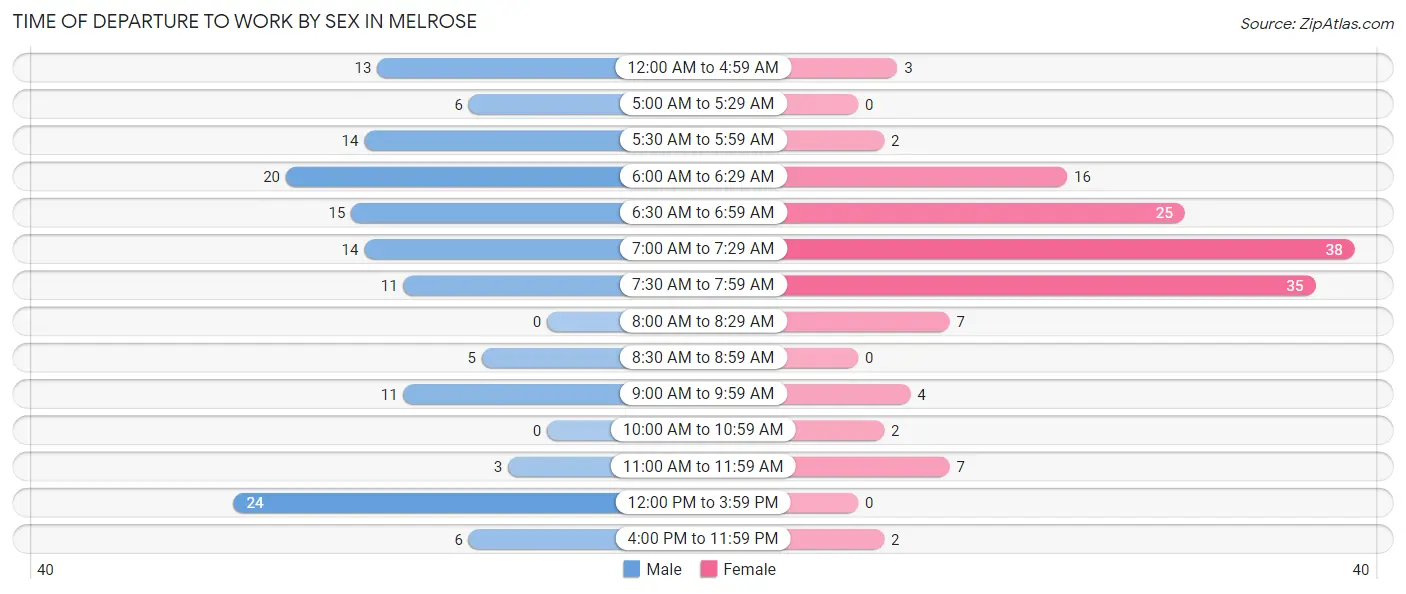
| Time of Departure | Male | Female |
| 12:00 AM to 4:59 AM | 13 (9.1%) | 3 (2.1%) |
| 5:00 AM to 5:29 AM | 6 (4.2%) | 0 (0.0%) |
| 5:30 AM to 5:59 AM | 14 (9.9%) | 2 (1.4%) |
| 6:00 AM to 6:29 AM | 20 (14.1%) | 16 (11.4%) |
| 6:30 AM to 6:59 AM | 15 (10.6%) | 25 (17.7%) |
| 7:00 AM to 7:29 AM | 14 (9.9%) | 38 (27.0%) |
| 7:30 AM to 7:59 AM | 11 (7.7%) | 35 (24.8%) |
| 8:00 AM to 8:29 AM | 0 (0.0%) | 7 (5.0%) |
| 8:30 AM to 8:59 AM | 5 (3.5%) | 0 (0.0%) |
| 9:00 AM to 9:59 AM | 11 (7.7%) | 4 (2.8%) |
| 10:00 AM to 10:59 AM | 0 (0.0%) | 2 (1.4%) |
| 11:00 AM to 11:59 AM | 3 (2.1%) | 7 (5.0%) |
| 12:00 PM to 3:59 PM | 24 (16.9%) | 0 (0.0%) |
| 4:00 PM to 11:59 PM | 6 (4.2%) | 2 (1.4%) |
| Total | 142 (100.0%) | 141 (100.0%) |
Housing Occupancy in Melrose
Occupancy by Ownership in Melrose
Of the total 222 dwellings in Melrose, owner-occupied units account for 174 (78.4%), while renter-occupied units make up 48 (21.6%).
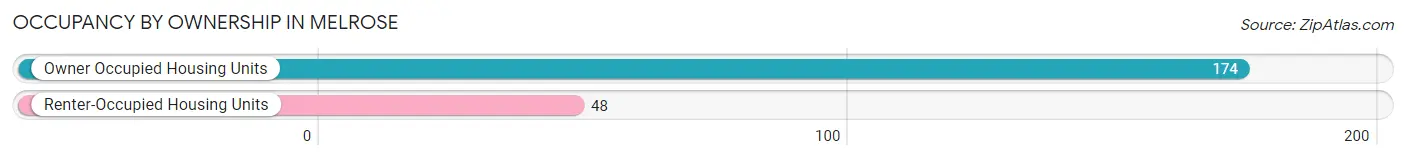
| Occupancy | # Housing Units | % Housing Units |
| Owner Occupied Housing Units | 174 | 78.4% |
| Renter-Occupied Housing Units | 48 | 21.6% |
| Total Occupied Housing Units | 222 | 100.0% |
Occupancy by Household Size in Melrose
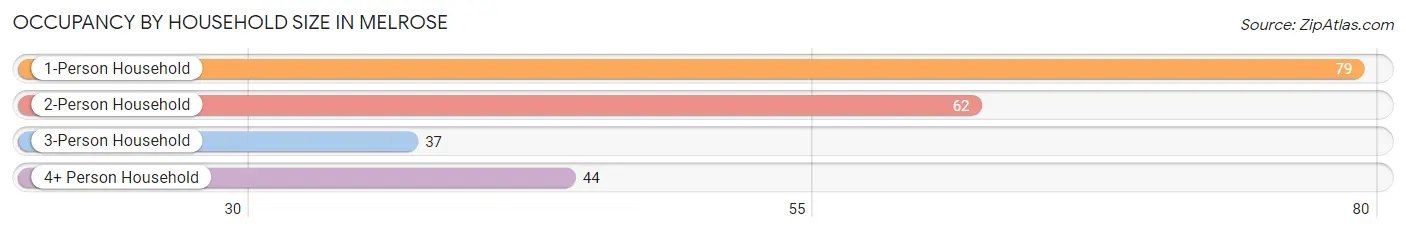
| Household Size | # Housing Units | % Housing Units |
| 1-Person Household | 79 | 35.6% |
| 2-Person Household | 62 | 27.9% |
| 3-Person Household | 37 | 16.7% |
| 4+ Person Household | 44 | 19.8% |
| Total Housing Units | 222 | 100.0% |
Occupancy by Ownership by Household Size in Melrose
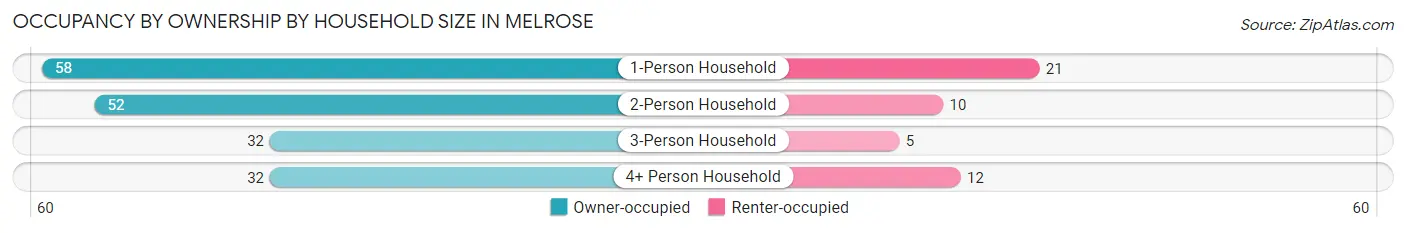
| Household Size | Owner-occupied | Renter-occupied |
| 1-Person Household | 58 (73.4%) | 21 (26.6%) |
| 2-Person Household | 52 (83.9%) | 10 (16.1%) |
| 3-Person Household | 32 (86.5%) | 5 (13.5%) |
| 4+ Person Household | 32 (72.7%) | 12 (27.3%) |
| Total Housing Units | 174 (78.4%) | 48 (21.6%) |
Occupancy by Educational Attainment in Melrose
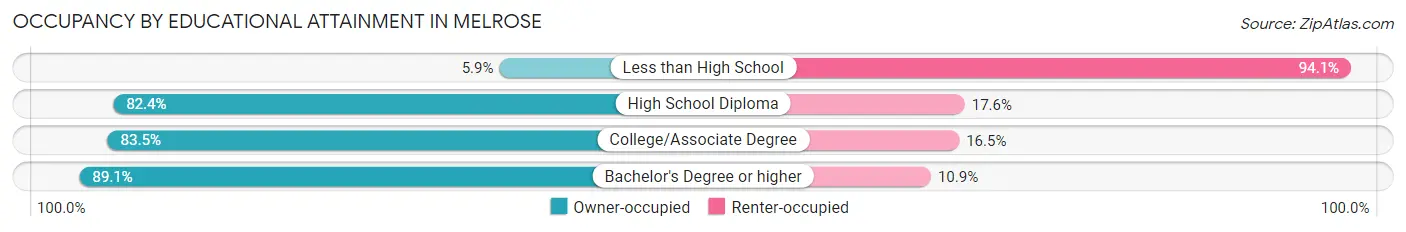
| Household Size | Owner-occupied | Renter-occupied |
| Less than High School | 1 (5.9%) | 16 (94.1%) |
| High School Diploma | 61 (82.4%) | 13 (17.6%) |
| College/Associate Degree | 71 (83.5%) | 14 (16.5%) |
| Bachelor's Degree or higher | 41 (89.1%) | 5 (10.9%) |
Occupancy by Age of Householder in Melrose
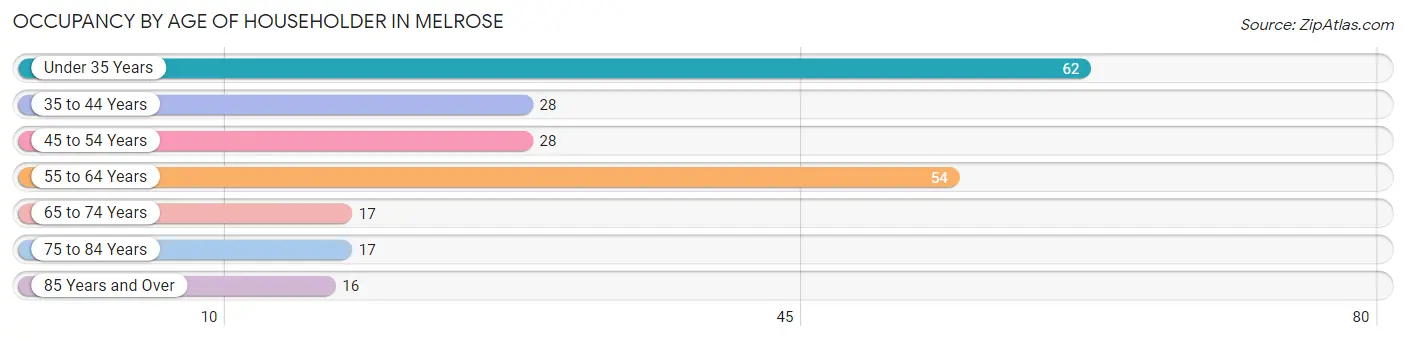
| Age Bracket | # Households | % Households |
| Under 35 Years | 62 | 27.9% |
| 35 to 44 Years | 28 | 12.6% |
| 45 to 54 Years | 28 | 12.6% |
| 55 to 64 Years | 54 | 24.3% |
| 65 to 74 Years | 17 | 7.7% |
| 75 to 84 Years | 17 | 7.7% |
| 85 Years and Over | 16 | 7.2% |
| Total | 222 | 100.0% |
Housing Finances in Melrose
Median Income by Occupancy in Melrose
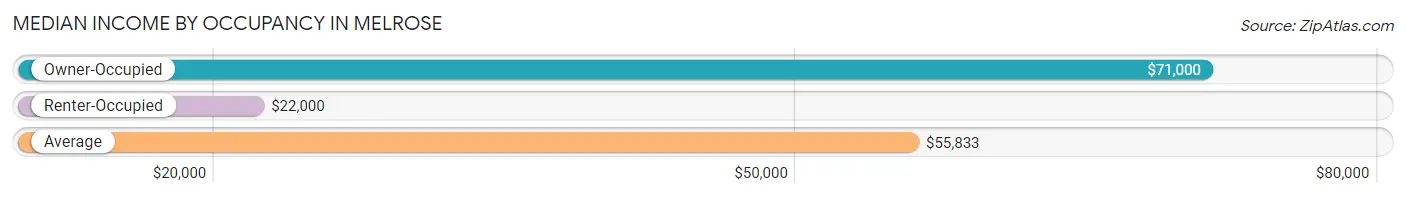
| Occupancy Type | # Households | Median Income |
| Owner-Occupied | 174 (78.4%) | $71,000 |
| Renter-Occupied | 48 (21.6%) | $22,000 |
| Average | 222 (100.0%) | $55,833 |
Occupancy by Householder Income Bracket in Melrose
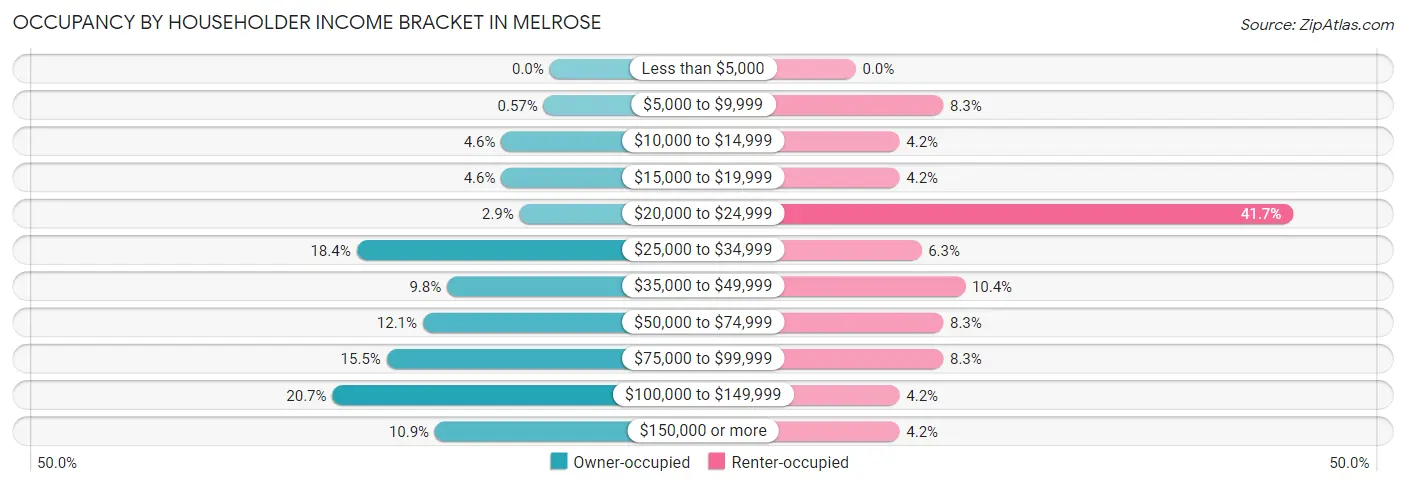
| Income Bracket | Owner-occupied | Renter-occupied |
| Less than $5,000 | 0 (0.0%) | 0 (0.0%) |
| $5,000 to $9,999 | 1 (0.6%) | 4 (8.3%) |
| $10,000 to $14,999 | 8 (4.6%) | 2 (4.2%) |
| $15,000 to $19,999 | 8 (4.6%) | 2 (4.2%) |
| $20,000 to $24,999 | 5 (2.9%) | 20 (41.7%) |
| $25,000 to $34,999 | 32 (18.4%) | 3 (6.2%) |
| $35,000 to $49,999 | 17 (9.8%) | 5 (10.4%) |
| $50,000 to $74,999 | 21 (12.1%) | 4 (8.3%) |
| $75,000 to $99,999 | 27 (15.5%) | 4 (8.3%) |
| $100,000 to $149,999 | 36 (20.7%) | 2 (4.2%) |
| $150,000 or more | 19 (10.9%) | 2 (4.2%) |
| Total | 174 (100.0%) | 48 (100.0%) |
Monthly Housing Cost Tiers in Melrose
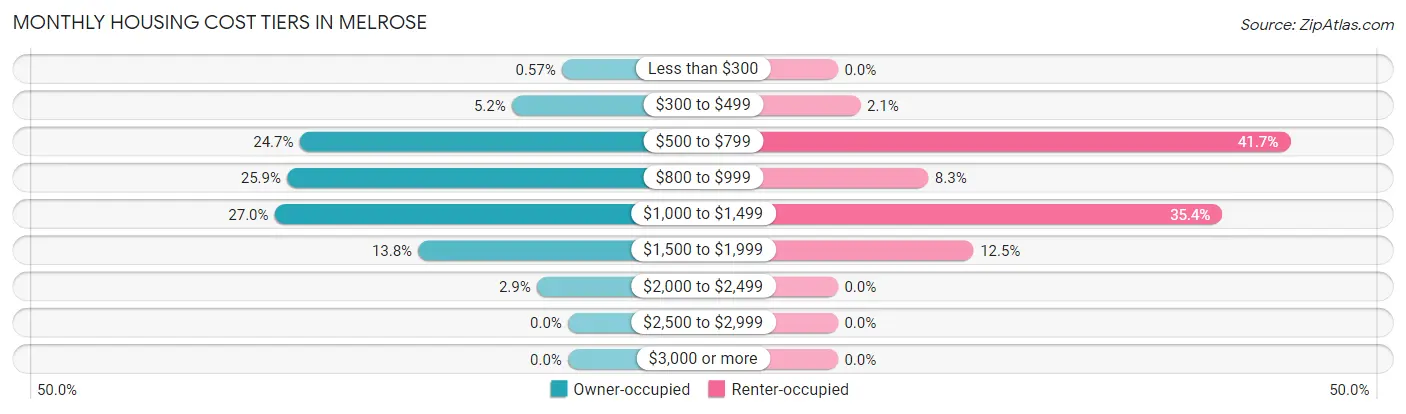
| Monthly Cost | Owner-occupied | Renter-occupied |
| Less than $300 | 1 (0.6%) | 0 (0.0%) |
| $300 to $499 | 9 (5.2%) | 1 (2.1%) |
| $500 to $799 | 43 (24.7%) | 20 (41.7%) |
| $800 to $999 | 45 (25.9%) | 4 (8.3%) |
| $1,000 to $1,499 | 47 (27.0%) | 17 (35.4%) |
| $1,500 to $1,999 | 24 (13.8%) | 6 (12.5%) |
| $2,000 to $2,499 | 5 (2.9%) | 0 (0.0%) |
| $2,500 to $2,999 | 0 (0.0%) | 0 (0.0%) |
| $3,000 or more | 0 (0.0%) | 0 (0.0%) |
| Total | 174 (100.0%) | 48 (100.0%) |
Physical Housing Characteristics in Melrose
Housing Structures in Melrose
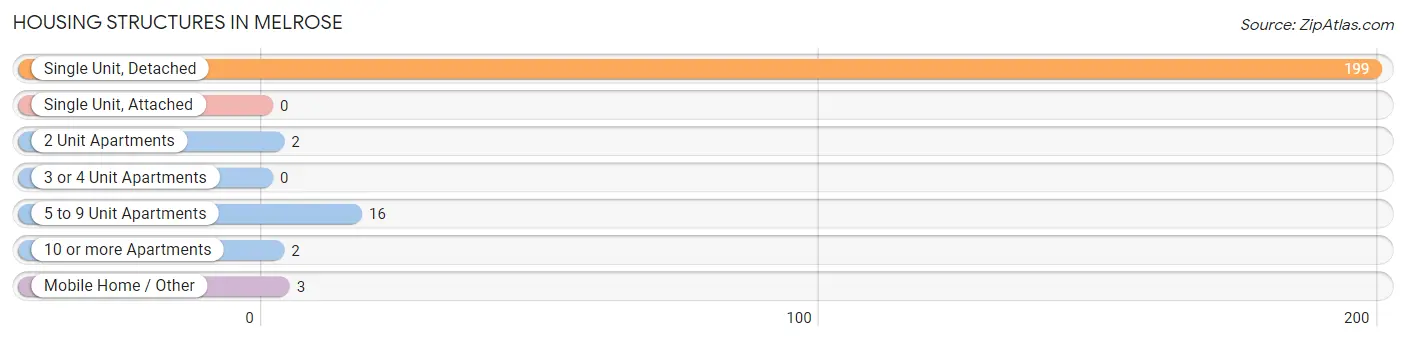
| Structure Type | # Housing Units | % Housing Units |
| Single Unit, Detached | 199 | 89.6% |
| Single Unit, Attached | 0 | 0.0% |
| 2 Unit Apartments | 2 | 0.9% |
| 3 or 4 Unit Apartments | 0 | 0.0% |
| 5 to 9 Unit Apartments | 16 | 7.2% |
| 10 or more Apartments | 2 | 0.9% |
| Mobile Home / Other | 3 | 1.3% |
| Total | 222 | 100.0% |
Housing Structures by Occupancy in Melrose
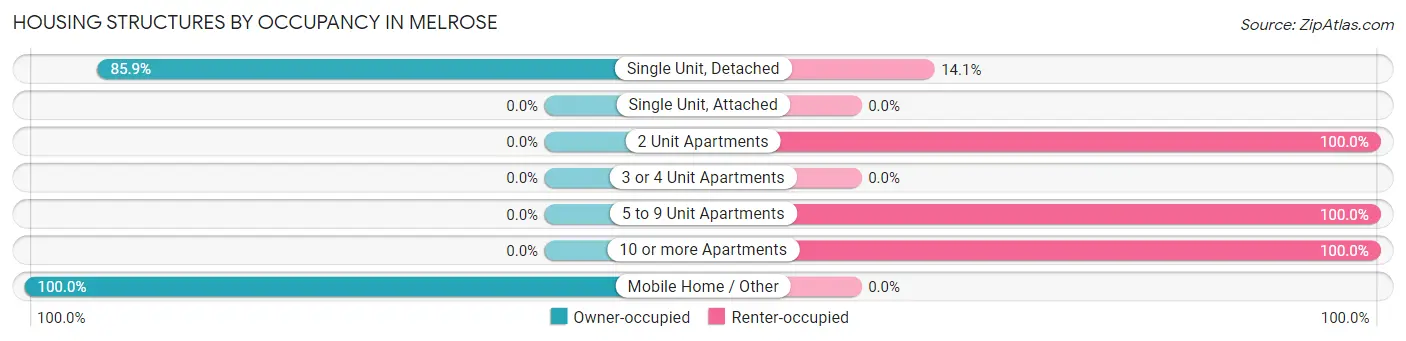
| Structure Type | Owner-occupied | Renter-occupied |
| Single Unit, Detached | 171 (85.9%) | 28 (14.1%) |
| Single Unit, Attached | 0 (0.0%) | 0 (0.0%) |
| 2 Unit Apartments | 0 (0.0%) | 2 (100.0%) |
| 3 or 4 Unit Apartments | 0 (0.0%) | 0 (0.0%) |
| 5 to 9 Unit Apartments | 0 (0.0%) | 16 (100.0%) |
| 10 or more Apartments | 0 (0.0%) | 2 (100.0%) |
| Mobile Home / Other | 3 (100.0%) | 0 (0.0%) |
| Total | 174 (78.4%) | 48 (21.6%) |
Housing Structures by Number of Rooms in Melrose
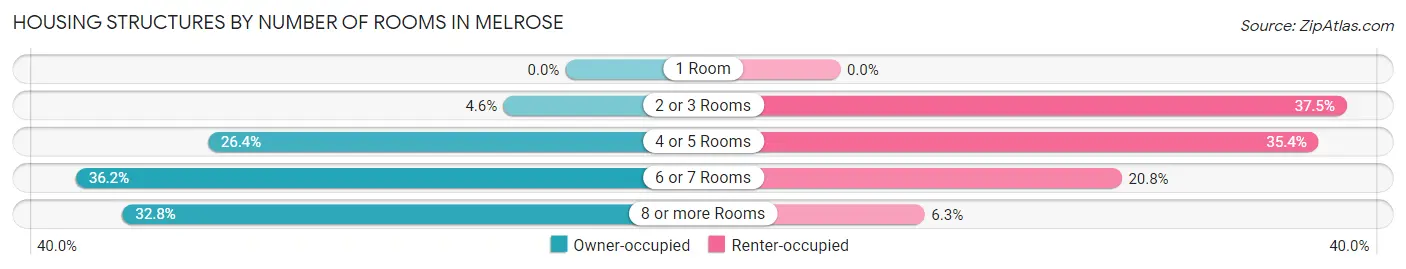
| Number of Rooms | Owner-occupied | Renter-occupied |
| 1 Room | 0 (0.0%) | 0 (0.0%) |
| 2 or 3 Rooms | 8 (4.6%) | 18 (37.5%) |
| 4 or 5 Rooms | 46 (26.4%) | 17 (35.4%) |
| 6 or 7 Rooms | 63 (36.2%) | 10 (20.8%) |
| 8 or more Rooms | 57 (32.8%) | 3 (6.2%) |
| Total | 174 (100.0%) | 48 (100.0%) |
Housing Structure by Heating Type in Melrose
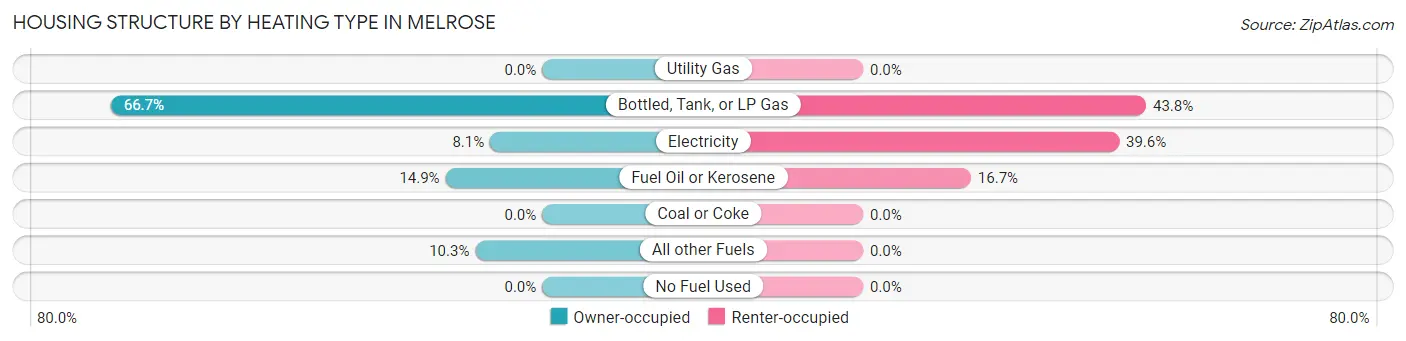
| Heating Type | Owner-occupied | Renter-occupied |
| Utility Gas | 0 (0.0%) | 0 (0.0%) |
| Bottled, Tank, or LP Gas | 116 (66.7%) | 21 (43.8%) |
| Electricity | 14 (8.1%) | 19 (39.6%) |
| Fuel Oil or Kerosene | 26 (14.9%) | 8 (16.7%) |
| Coal or Coke | 0 (0.0%) | 0 (0.0%) |
| All other Fuels | 18 (10.3%) | 0 (0.0%) |
| No Fuel Used | 0 (0.0%) | 0 (0.0%) |
| Total | 174 (100.0%) | 48 (100.0%) |
Household Vehicle Usage in Melrose
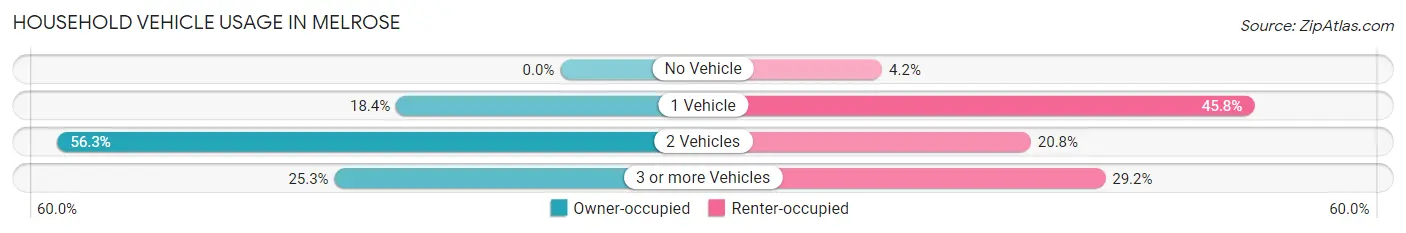
| Vehicles per Household | Owner-occupied | Renter-occupied |
| No Vehicle | 0 (0.0%) | 2 (4.2%) |
| 1 Vehicle | 32 (18.4%) | 22 (45.8%) |
| 2 Vehicles | 98 (56.3%) | 10 (20.8%) |
| 3 or more Vehicles | 44 (25.3%) | 14 (29.2%) |
| Total | 174 (100.0%) | 48 (100.0%) |
Real Estate & Mortgages in Melrose
Real Estate and Mortgage Overview in Melrose
| Characteristic | Without Mortgage | With Mortgage |
| Housing Units | 62 | 112 |
| Median Property Value | $157,600 | $129,300 |
| Median Household Income | - | - |
| Monthly Housing Costs | $714 | $0 |
| Real Estate Taxes | $2,352 | $0 |
Property Value by Mortgage Status in Melrose
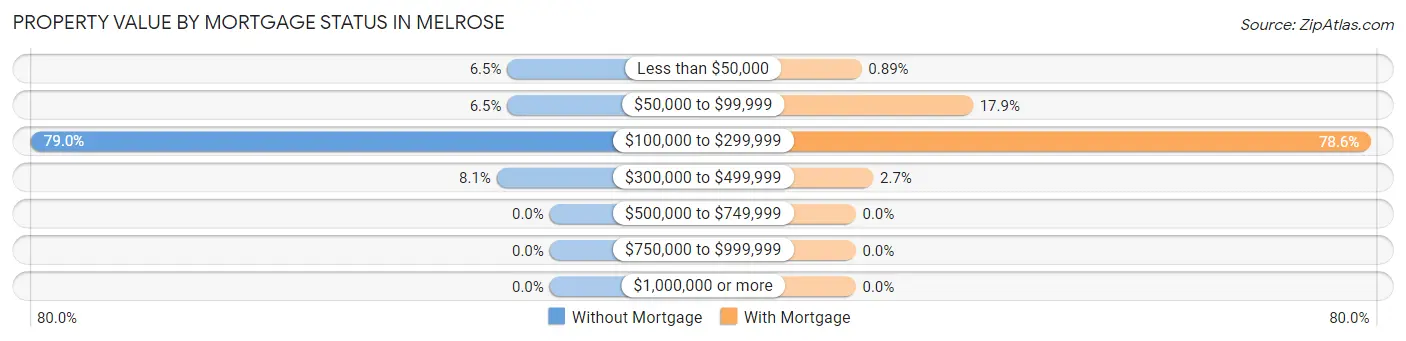
| Property Value | Without Mortgage | With Mortgage |
| Less than $50,000 | 4 (6.5%) | 1 (0.9%) |
| $50,000 to $99,999 | 4 (6.5%) | 20 (17.9%) |
| $100,000 to $299,999 | 49 (79.0%) | 88 (78.6%) |
| $300,000 to $499,999 | 5 (8.1%) | 3 (2.7%) |
| $500,000 to $749,999 | 0 (0.0%) | 0 (0.0%) |
| $750,000 to $999,999 | 0 (0.0%) | 0 (0.0%) |
| $1,000,000 or more | 0 (0.0%) | 0 (0.0%) |
| Total | 62 (100.0%) | 112 (100.0%) |
Household Income by Mortgage Status in Melrose
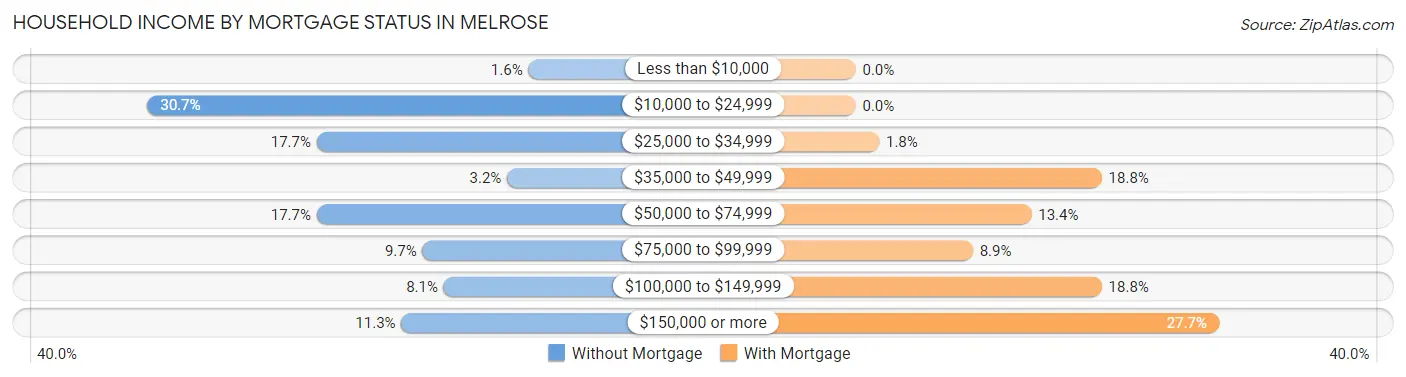
| Household Income | Without Mortgage | With Mortgage |
| Less than $10,000 | 1 (1.6%) | 0 (0.0%) |
| $10,000 to $24,999 | 19 (30.6%) | 0 (0.0%) |
| $25,000 to $34,999 | 11 (17.7%) | 2 (1.8%) |
| $35,000 to $49,999 | 2 (3.2%) | 21 (18.8%) |
| $50,000 to $74,999 | 11 (17.7%) | 15 (13.4%) |
| $75,000 to $99,999 | 6 (9.7%) | 10 (8.9%) |
| $100,000 to $149,999 | 5 (8.1%) | 21 (18.8%) |
| $150,000 or more | 7 (11.3%) | 31 (27.7%) |
| Total | 62 (100.0%) | 112 (100.0%) |
Property Value to Household Income Ratio in Melrose
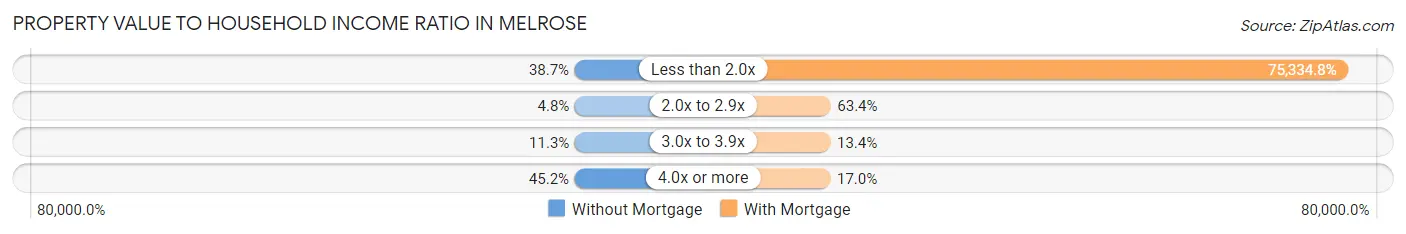
| Value-to-Income Ratio | Without Mortgage | With Mortgage |
| Less than 2.0x | 24 (38.7%) | 84,375 (75,334.8%) |
| 2.0x to 2.9x | 3 (4.8%) | 71 (63.4%) |
| 3.0x to 3.9x | 7 (11.3%) | 15 (13.4%) |
| 4.0x or more | 28 (45.2%) | 19 (17.0%) |
| Total | 62 (100.0%) | 112 (100.0%) |
Real Estate Taxes by Mortgage Status in Melrose
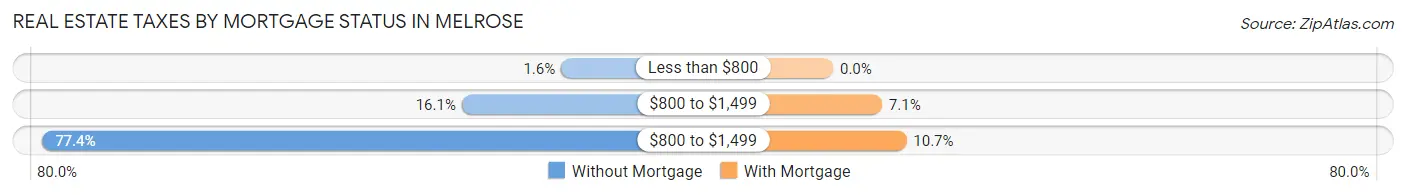
| Property Taxes | Without Mortgage | With Mortgage |
| Less than $800 | 1 (1.6%) | 0 (0.0%) |
| $800 to $1,499 | 10 (16.1%) | 8 (7.1%) |
| $800 to $1,499 | 48 (77.4%) | 12 (10.7%) |
| Total | 62 (100.0%) | 112 (100.0%) |
Health & Disability in Melrose
Health Insurance Coverage by Age in Melrose
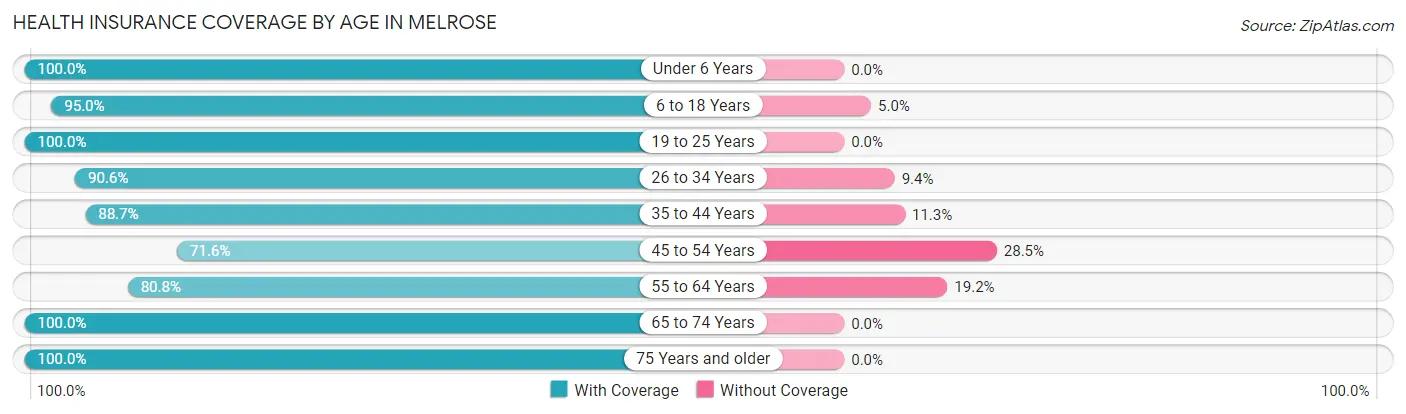
| Age Bracket | With Coverage | Without Coverage |
| Under 6 Years | 33 (100.0%) | 0 (0.0%) |
| 6 to 18 Years | 95 (95.0%) | 5 (5.0%) |
| 19 to 25 Years | 59 (100.0%) | 0 (0.0%) |
| 26 to 34 Years | 77 (90.6%) | 8 (9.4%) |
| 35 to 44 Years | 47 (88.7%) | 6 (11.3%) |
| 45 to 54 Years | 83 (71.6%) | 33 (28.4%) |
| 55 to 64 Years | 63 (80.8%) | 15 (19.2%) |
| 65 to 74 Years | 29 (100.0%) | 0 (0.0%) |
| 75 Years and older | 43 (100.0%) | 0 (0.0%) |
| Total | 529 (88.8%) | 67 (11.2%) |
Health Insurance Coverage by Citizenship Status in Melrose

| Citizenship Status | With Coverage | Without Coverage |
| Native Born | 33 (100.0%) | 0 (0.0%) |
| Foreign Born, Citizen | 95 (95.0%) | 5 (5.0%) |
| Foreign Born, not a Citizen | 59 (100.0%) | 0 (0.0%) |
Health Insurance Coverage by Household Income in Melrose
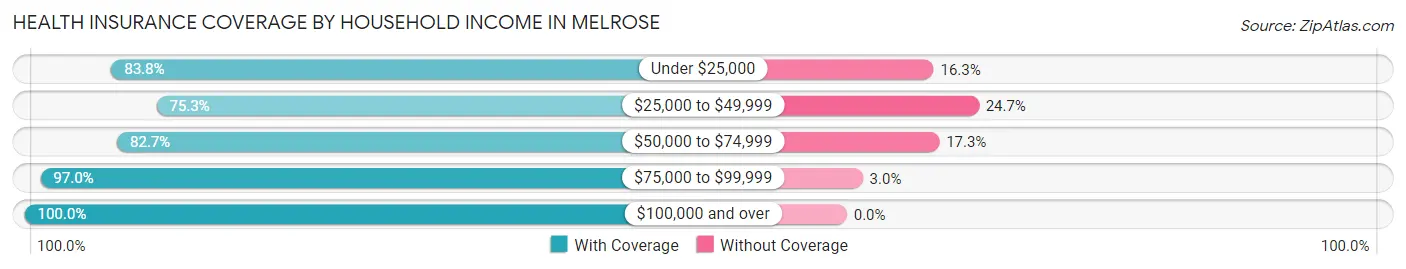
| Household Income | With Coverage | Without Coverage |
| Under $25,000 | 67 (83.8%) | 13 (16.3%) |
| $25,000 to $49,999 | 128 (75.3%) | 42 (24.7%) |
| $50,000 to $74,999 | 43 (82.7%) | 9 (17.3%) |
| $75,000 to $99,999 | 98 (97.0%) | 3 (3.0%) |
| $100,000 and over | 193 (100.0%) | 0 (0.0%) |
Public vs Private Health Insurance Coverage by Age in Melrose
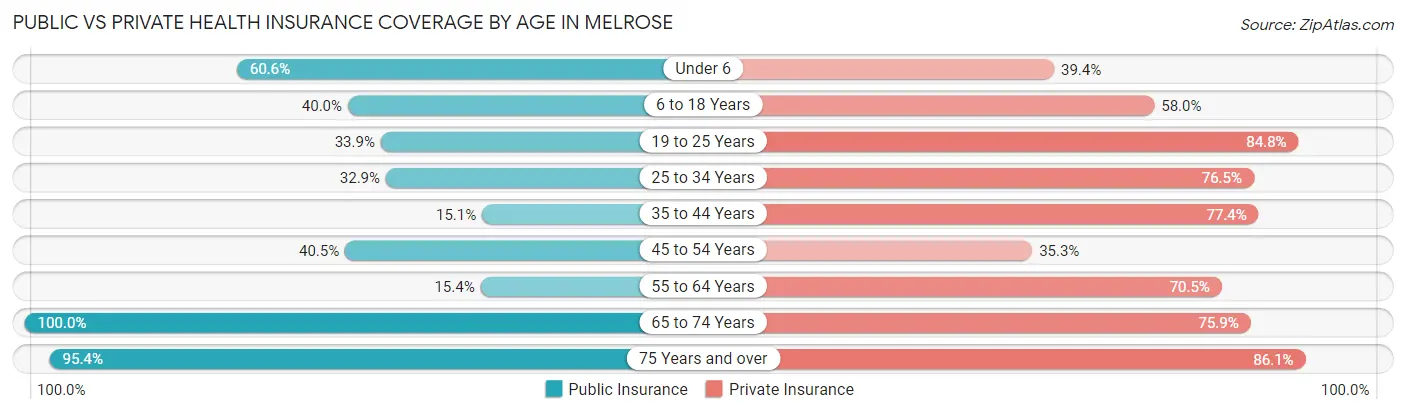
| Age Bracket | Public Insurance | Private Insurance |
| Under 6 | 20 (60.6%) | 13 (39.4%) |
| 6 to 18 Years | 40 (40.0%) | 58 (58.0%) |
| 19 to 25 Years | 20 (33.9%) | 50 (84.8%) |
| 25 to 34 Years | 28 (32.9%) | 65 (76.5%) |
| 35 to 44 Years | 8 (15.1%) | 41 (77.4%) |
| 45 to 54 Years | 47 (40.5%) | 41 (35.3%) |
| 55 to 64 Years | 12 (15.4%) | 55 (70.5%) |
| 65 to 74 Years | 29 (100.0%) | 22 (75.9%) |
| 75 Years and over | 41 (95.4%) | 37 (86.1%) |
| Total | 245 (41.1%) | 382 (64.1%) |
Disability Status by Sex by Age in Melrose
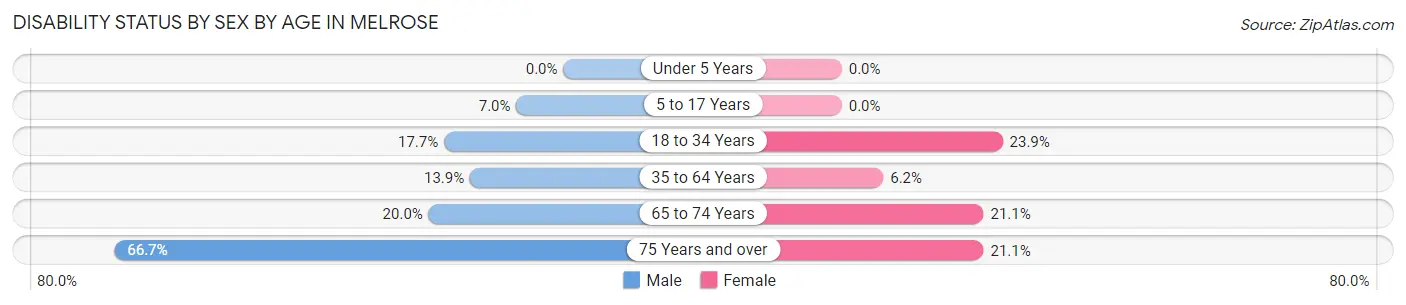
| Age Bracket | Male | Female |
| Under 5 Years | 0 (0.0%) | 0 (0.0%) |
| 5 to 17 Years | 3 (7.0%) | 0 (0.0%) |
| 18 to 34 Years | 17 (17.7%) | 16 (23.9%) |
| 35 to 64 Years | 14 (13.9%) | 9 (6.2%) |
| 65 to 74 Years | 2 (20.0%) | 4 (21.0%) |
| 75 Years and over | 16 (66.7%) | 4 (21.0%) |
Disability Class by Sex by Age in Melrose
Disability Class: Hearing Difficulty
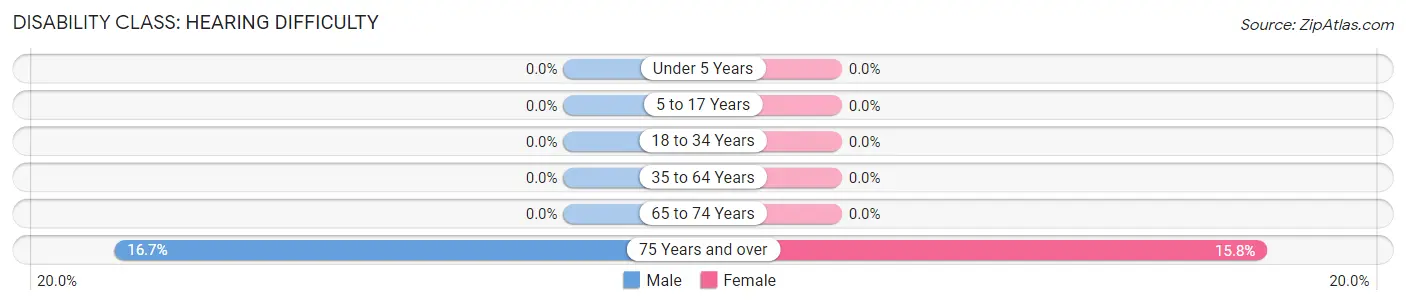
| Age Bracket | Male | Female |
| Under 5 Years | 0 (0.0%) | 0 (0.0%) |
| 5 to 17 Years | 0 (0.0%) | 0 (0.0%) |
| 18 to 34 Years | 0 (0.0%) | 0 (0.0%) |
| 35 to 64 Years | 0 (0.0%) | 0 (0.0%) |
| 65 to 74 Years | 0 (0.0%) | 0 (0.0%) |
| 75 Years and over | 4 (16.7%) | 3 (15.8%) |
Disability Class: Vision Difficulty
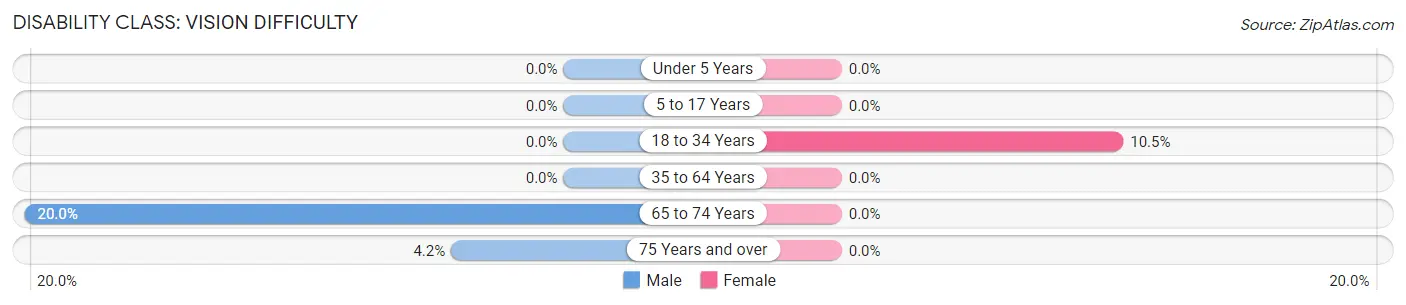
| Age Bracket | Male | Female |
| Under 5 Years | 0 (0.0%) | 0 (0.0%) |
| 5 to 17 Years | 0 (0.0%) | 0 (0.0%) |
| 18 to 34 Years | 0 (0.0%) | 7 (10.4%) |
| 35 to 64 Years | 0 (0.0%) | 0 (0.0%) |
| 65 to 74 Years | 2 (20.0%) | 0 (0.0%) |
| 75 Years and over | 1 (4.2%) | 0 (0.0%) |
Disability Class: Cognitive Difficulty
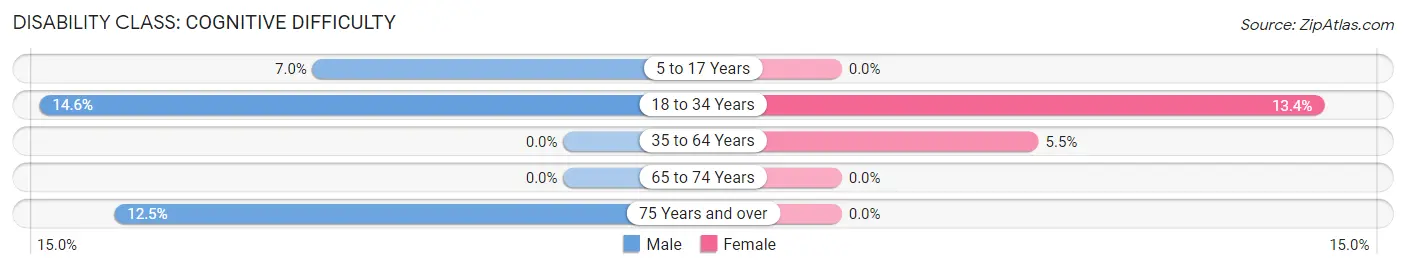
| Age Bracket | Male | Female |
| 5 to 17 Years | 3 (7.0%) | 0 (0.0%) |
| 18 to 34 Years | 14 (14.6%) | 9 (13.4%) |
| 35 to 64 Years | 0 (0.0%) | 8 (5.5%) |
| 65 to 74 Years | 0 (0.0%) | 0 (0.0%) |
| 75 Years and over | 3 (12.5%) | 0 (0.0%) |
Disability Class: Ambulatory Difficulty
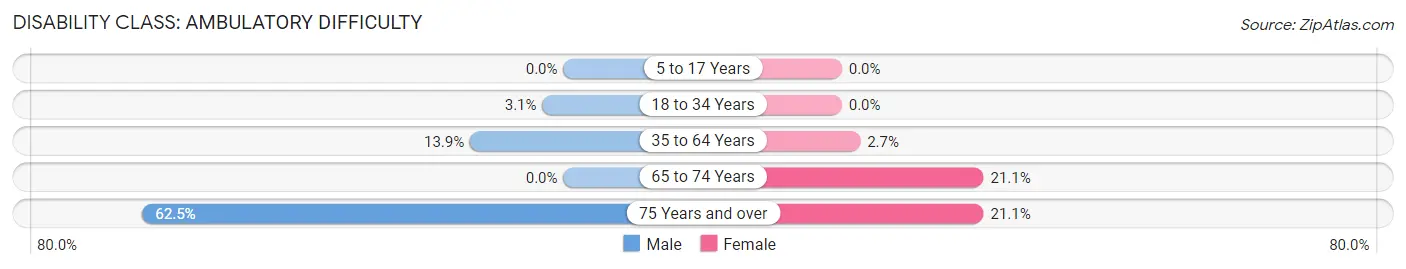
| Age Bracket | Male | Female |
| 5 to 17 Years | 0 (0.0%) | 0 (0.0%) |
| 18 to 34 Years | 3 (3.1%) | 0 (0.0%) |
| 35 to 64 Years | 14 (13.9%) | 4 (2.7%) |
| 65 to 74 Years | 0 (0.0%) | 4 (21.0%) |
| 75 Years and over | 15 (62.5%) | 4 (21.0%) |
Disability Class: Self-Care Difficulty
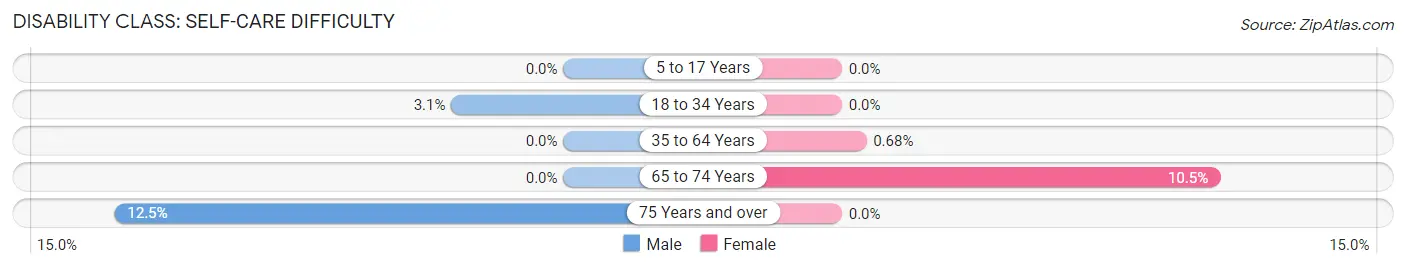
| Age Bracket | Male | Female |
| 5 to 17 Years | 0 (0.0%) | 0 (0.0%) |
| 18 to 34 Years | 3 (3.1%) | 0 (0.0%) |
| 35 to 64 Years | 0 (0.0%) | 1 (0.7%) |
| 65 to 74 Years | 0 (0.0%) | 2 (10.5%) |
| 75 Years and over | 3 (12.5%) | 0 (0.0%) |
Technology Access in Melrose
Computing Device Access in Melrose
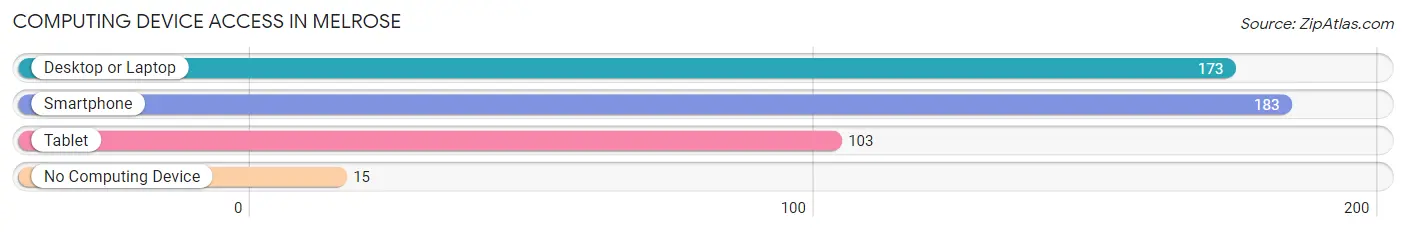
| Device Type | # Households | % Households |
| Desktop or Laptop | 173 | 77.9% |
| Smartphone | 183 | 82.4% |
| Tablet | 103 | 46.4% |
| No Computing Device | 15 | 6.8% |
| Total | 222 | 100.0% |
Internet Access in Melrose
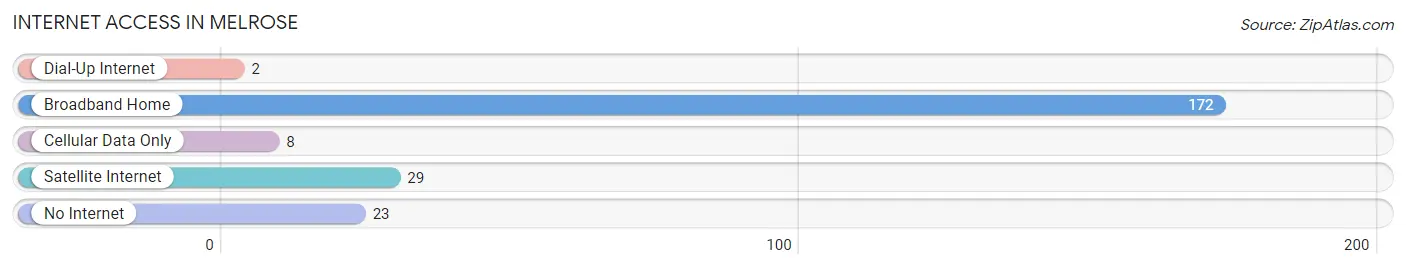
| Internet Type | # Households | % Households |
| Dial-Up Internet | 2 | 0.9% |
| Broadband Home | 172 | 77.5% |
| Cellular Data Only | 8 | 3.6% |
| Satellite Internet | 29 | 13.1% |
| No Internet | 23 | 10.4% |
| Total | 222 | 100.0% |
Melrose Summary
History
Melrose, Wisconsin is a small village located in Jackson County, Wisconsin. It is situated on the banks of the Black River and is part of the Black River Falls Micropolitan Statistical Area. The village was founded in 1856 by a group of settlers from New York and Pennsylvania. The village was named after Melrose, Massachusetts, which was the hometown of one of the settlers.
The village was originally a logging town, and the first sawmill was built in 1857. The sawmill was powered by the Black River, and it was used to cut logs for the lumber industry. The village grew rapidly, and by the late 1800s, it had become a thriving community with a variety of businesses, including a hotel, a general store, a blacksmith shop, and a post office.
In the early 1900s, the village began to decline as the logging industry moved away from the area. The sawmill closed in the 1920s, and the village was left without a major industry. However, the village was able to survive due to its proximity to the Black River, which provided a source of recreation for the residents.
Geography
Melrose is located in Jackson County, Wisconsin, on the banks of the Black River. The village is situated in a rural area, and it is surrounded by rolling hills and forests. The village is located approximately 25 miles north of La Crosse, Wisconsin, and it is about 50 miles south of Eau Claire, Wisconsin.
The village has a total area of 0.7 square miles, all of which is land. The village is located at an elevation of 845 feet above sea level. The climate in Melrose is classified as humid continental, with cold winters and warm summers.
Economy
The economy of Melrose is largely based on tourism and agriculture. The village is home to several small businesses, including a general store, a restaurant, and a gas station. The village also has a small airport, which is used for recreational flying.
The village is also home to several farms, which produce a variety of crops, including corn, soybeans, and hay. The village also has a small manufacturing sector, which produces a variety of products, including furniture and wood products.
Demographics
As of the 2010 census, the population of Melrose was 1,093. The population is predominantly white, with 95.3% of the population identifying as white. The median household income in the village is $41,250, and the median age is 44.7 years.
Conclusion
Melrose, Wisconsin is a small village located in Jackson County, Wisconsin. It is situated on the banks of the Black River and is part of the Black River Falls Micropolitan Statistical Area. The village was founded in 1856 by a group of settlers from New York and Pennsylvania, and it was originally a logging town. The village has a total area of 0.7 square miles, and the population is predominantly white. The economy of Melrose is largely based on tourism and agriculture, and the village is home to several small businesses. The median household income in the village is $41,250, and the median age is 44.7 years.
Common Questions
What is Per Capita Income in Melrose?
Per Capita income in Melrose is $27,501.
What is the Median Family Income in Melrose?
Median Family Income in Melrose is $84,844.
What is the Median Household income in Melrose?
Median Household Income in Melrose is $55,833.
What is Income or Wage Gap in Melrose?
Income or Wage Gap in Melrose is 51.9%.
Women in Melrose earn 48.1 cents for every dollar earned by a man.
What is Inequality or Gini Index in Melrose?
Inequality or Gini Index in Melrose is 0.41.
What is the Total Population of Melrose?
Total Population of Melrose is 596.
What is the Total Male Population of Melrose?
Total Male Population of Melrose is 297.
What is the Total Female Population of Melrose?
Total Female Population of Melrose is 299.
What is the Ratio of Males per 100 Females in Melrose?
There are 99.33 Males per 100 Females in Melrose.
What is the Ratio of Females per 100 Males in Melrose?
There are 100.67 Females per 100 Males in Melrose.
What is the Median Population Age in Melrose?
Median Population Age in Melrose is 38.3 Years.
What is the Average Family Size in Melrose
Average Family Size in Melrose is 3.4 People.
What is the Average Household Size in Melrose
Average Household Size in Melrose is 2.7 People.
How Large is the Labor Force in Melrose?
There are 324 People in the Labor Forcein in Melrose.
What is the Percentage of People in the Labor Force in Melrose?
65.3% of People are in the Labor Force in Melrose.
What is the Unemployment Rate in Melrose?
Unemployment Rate in Melrose is 3.4%.